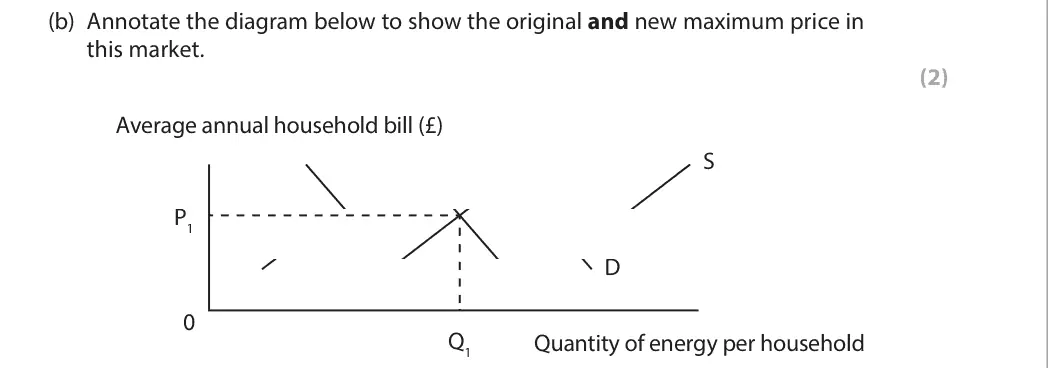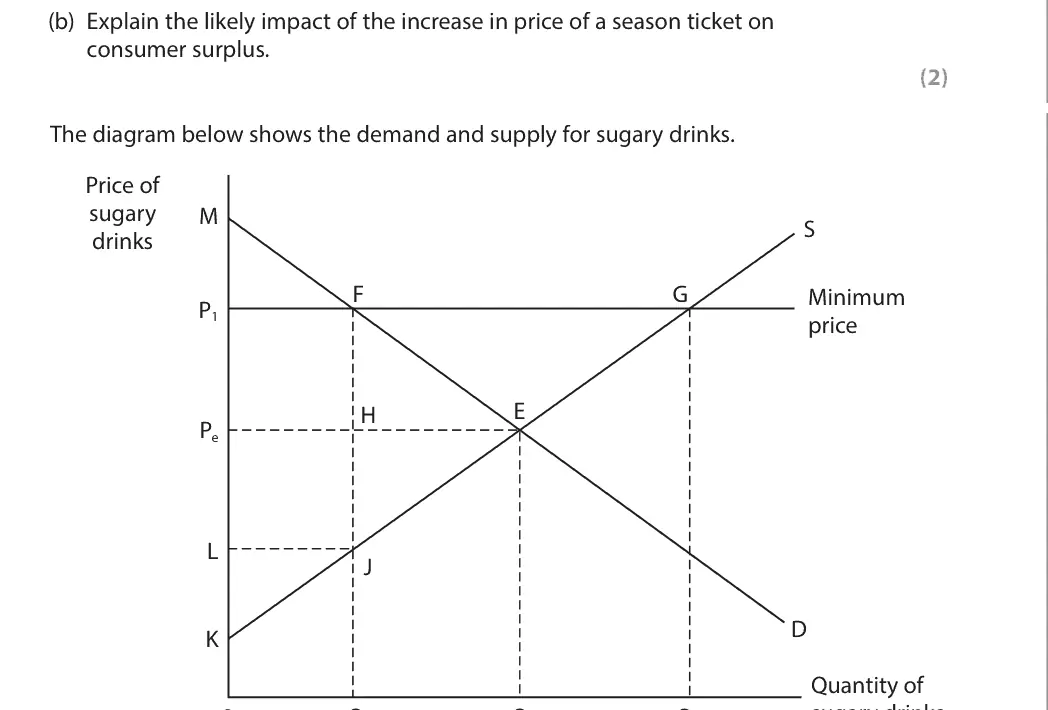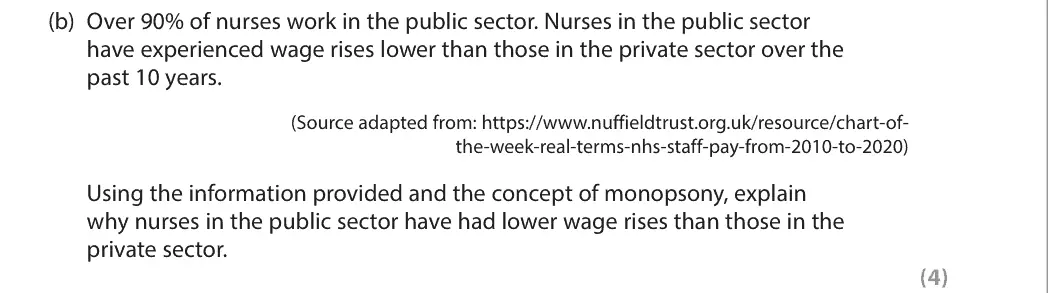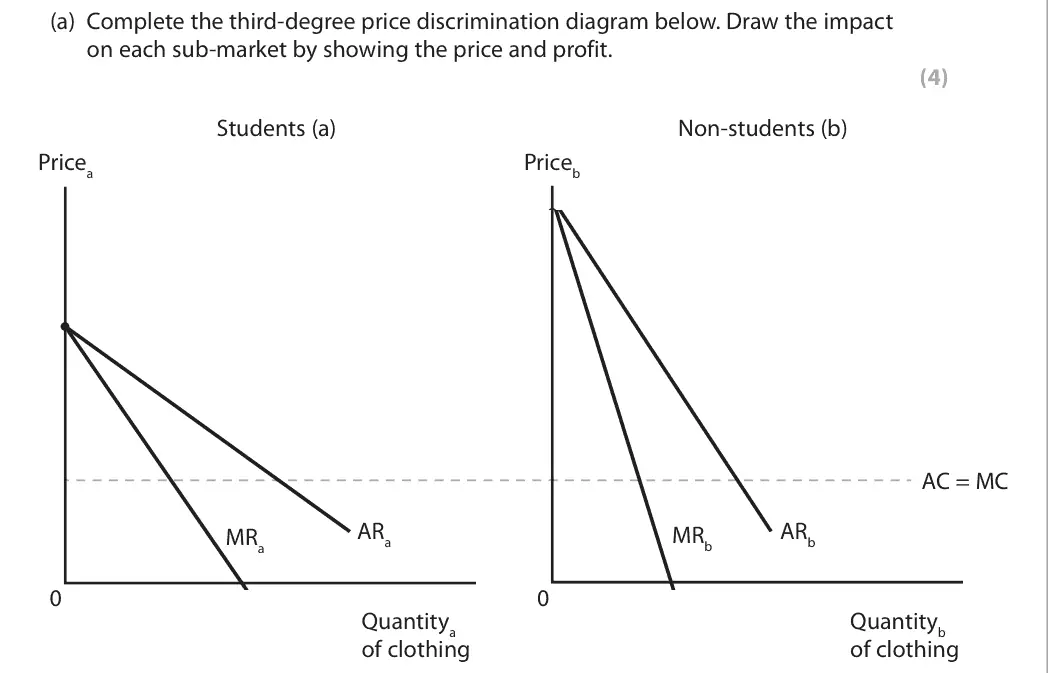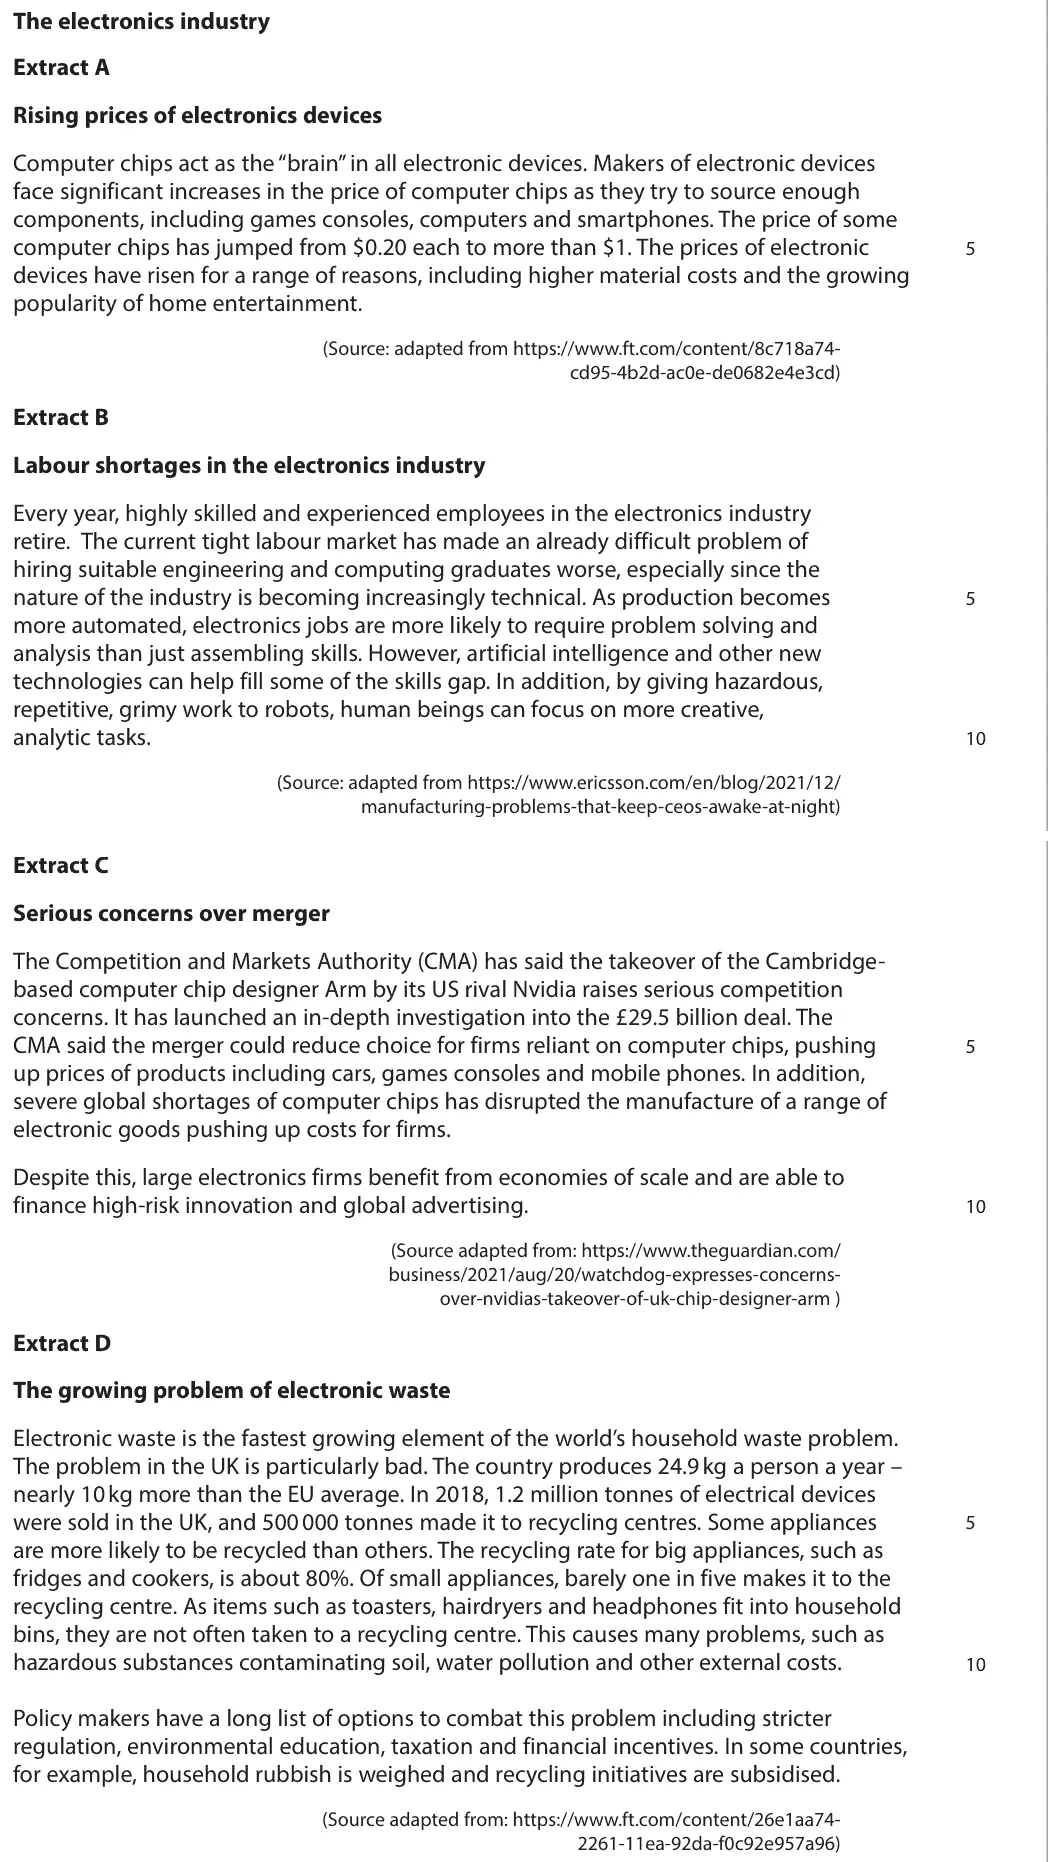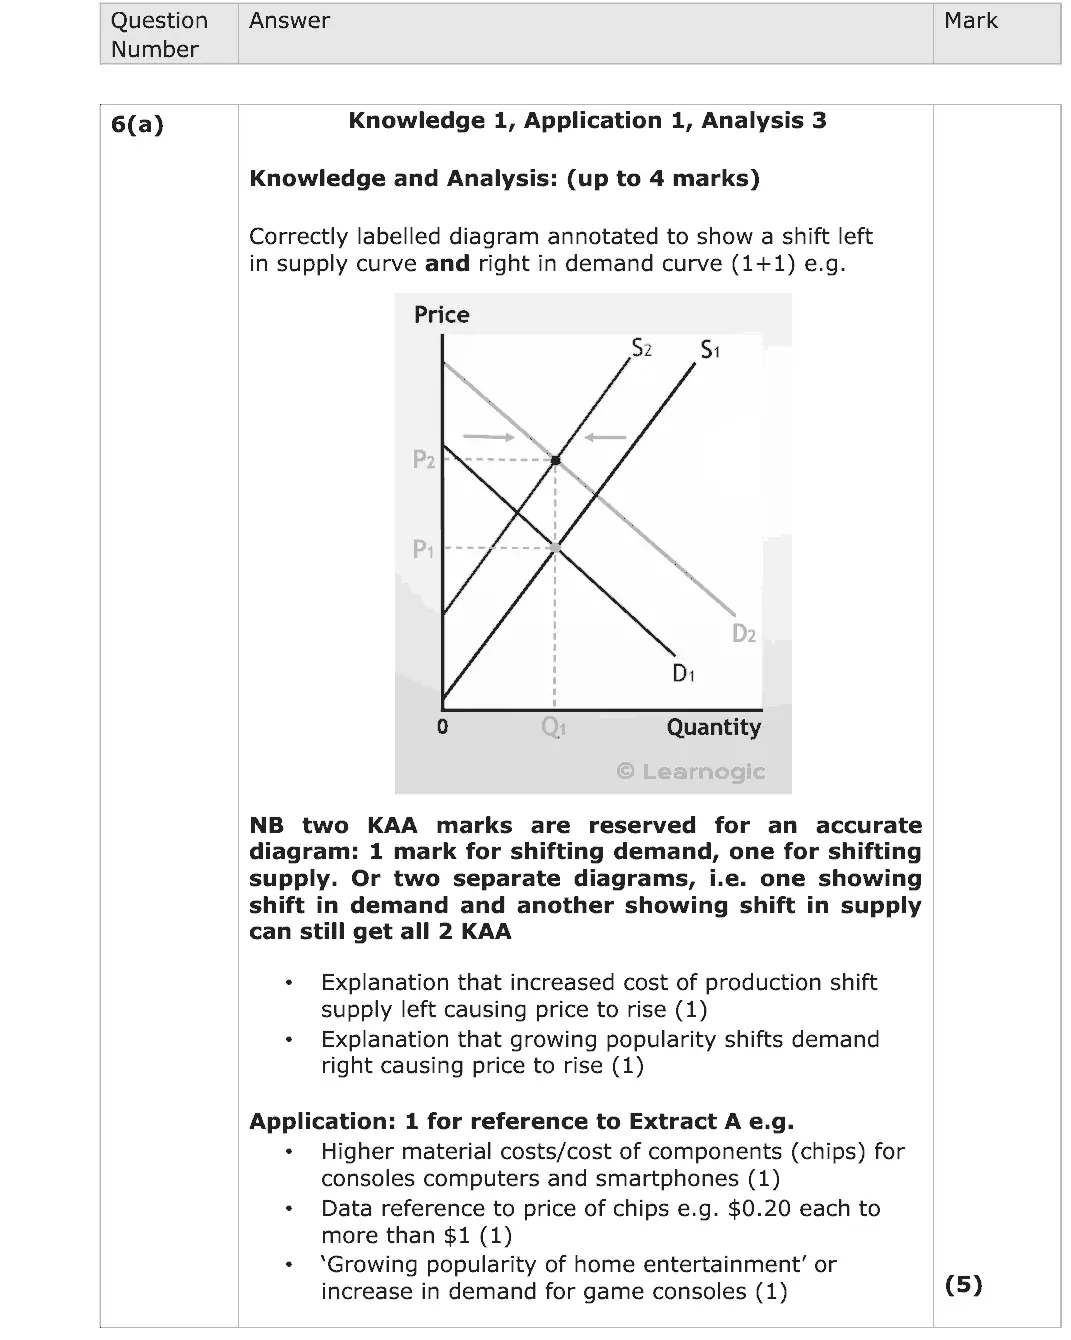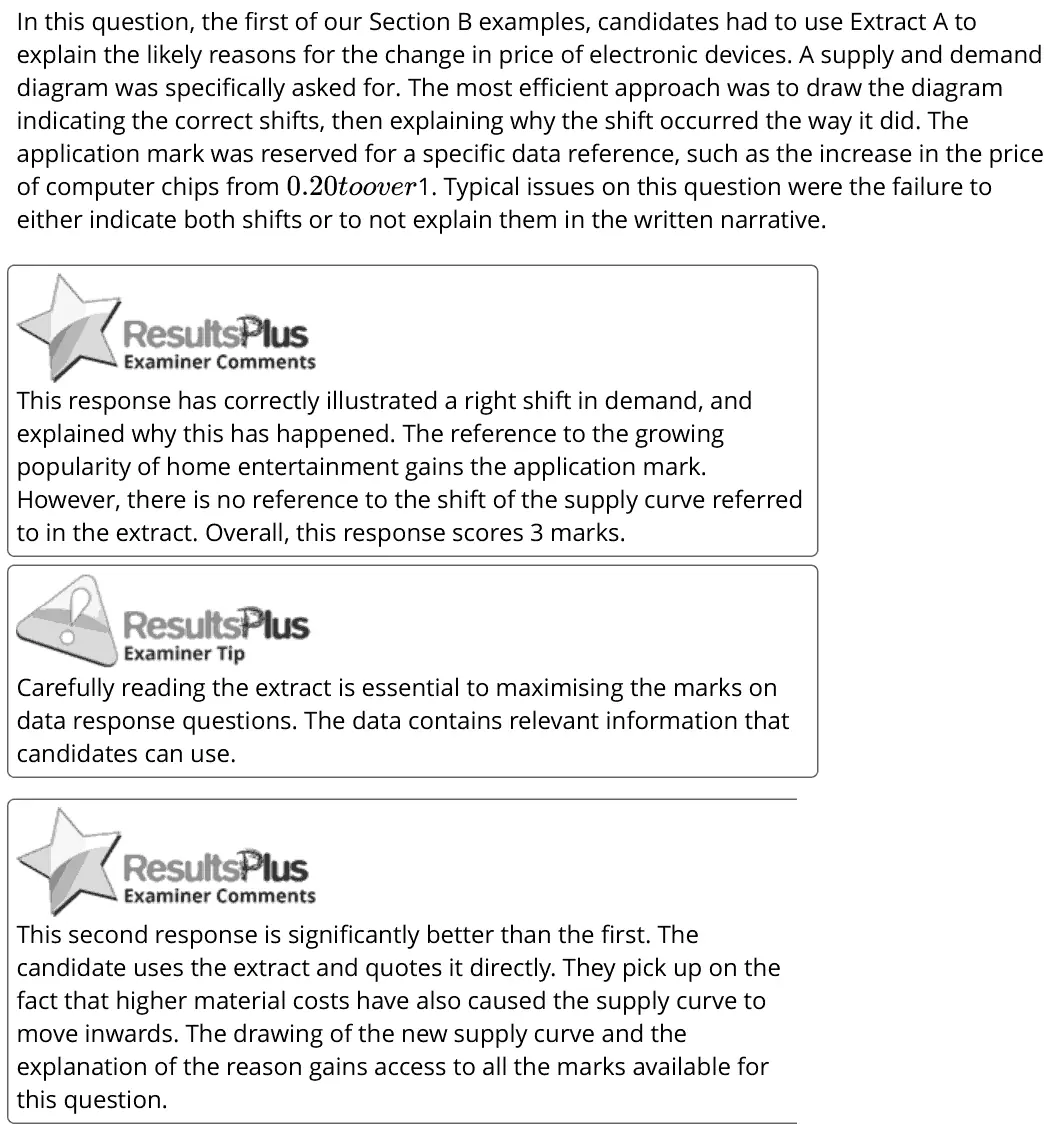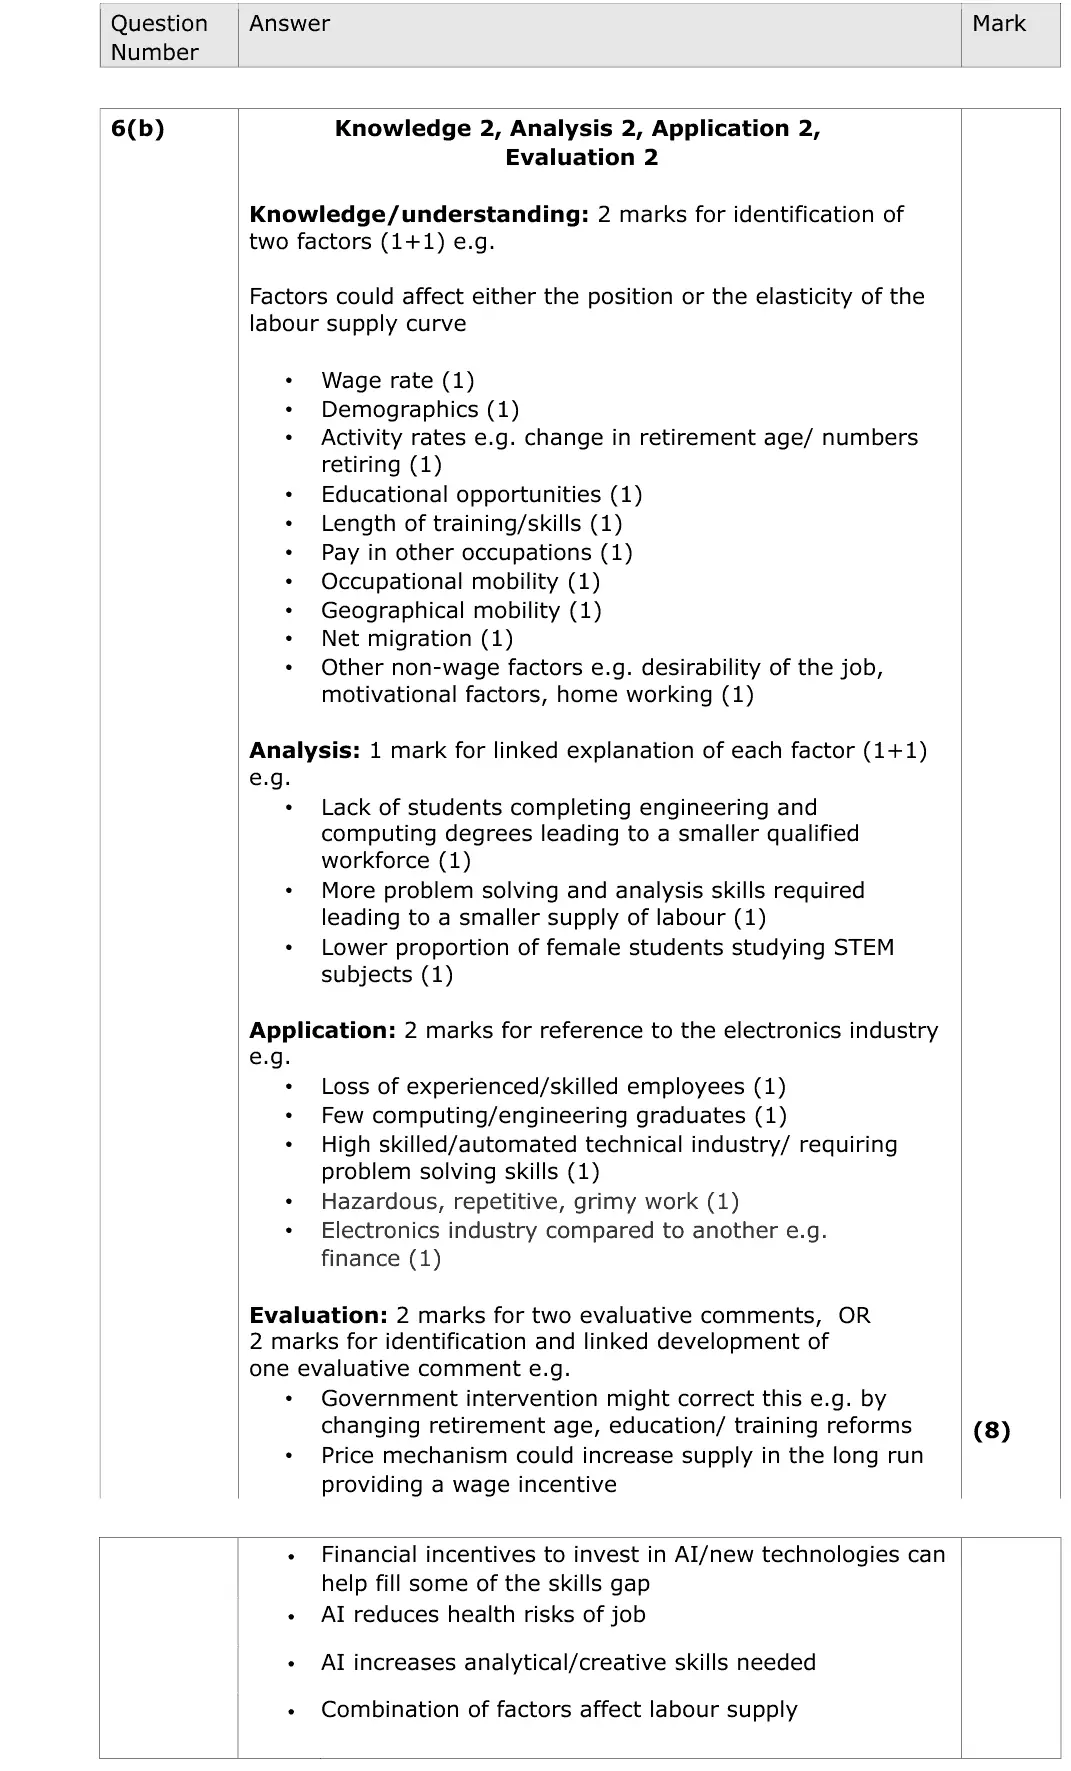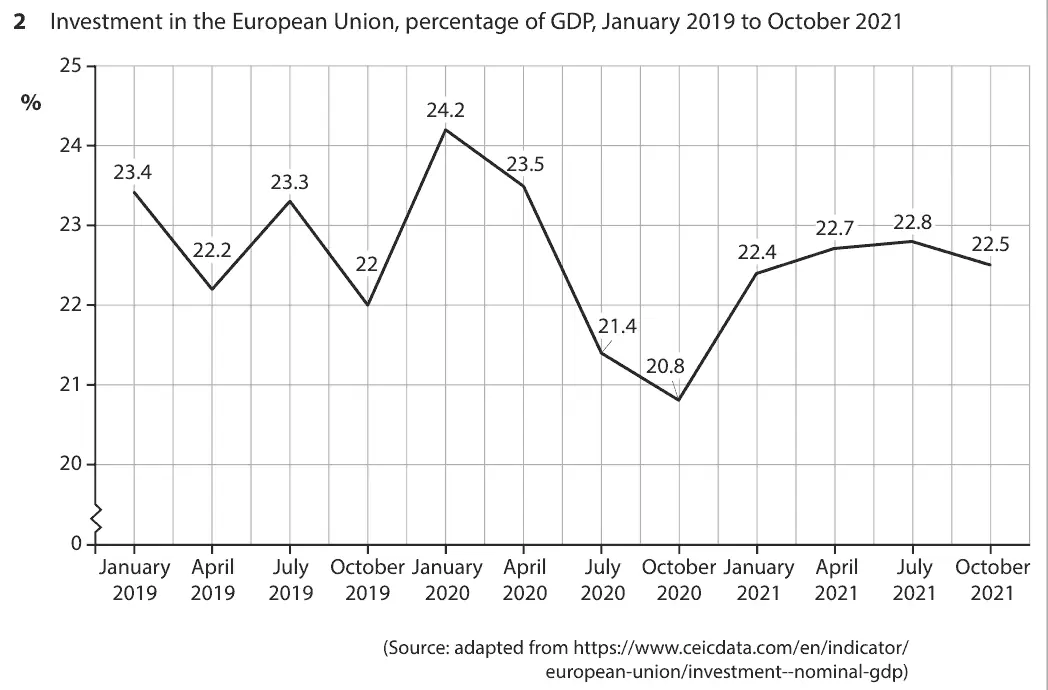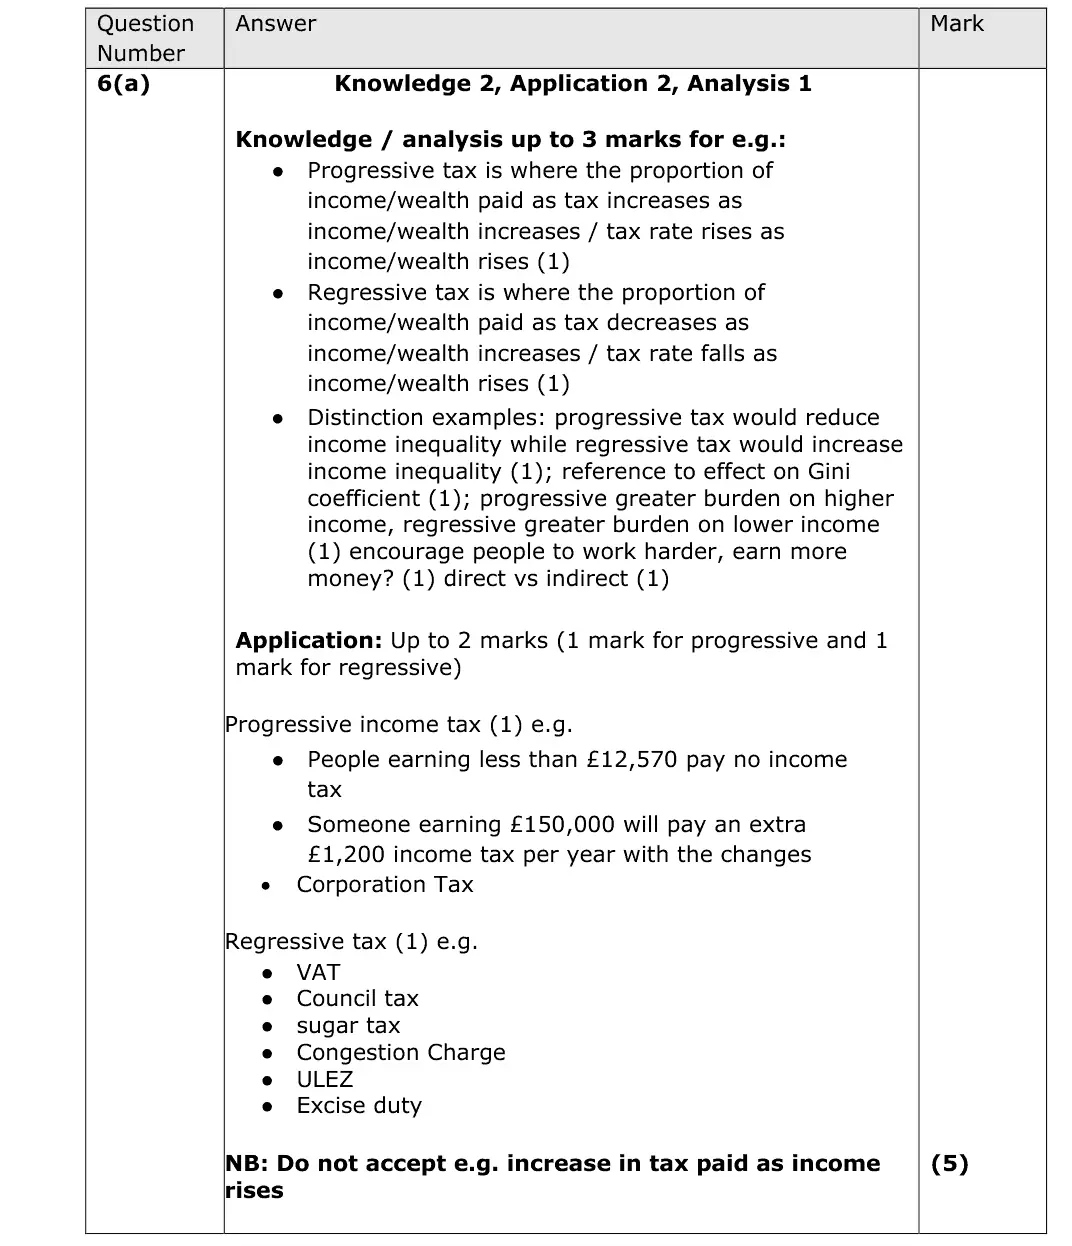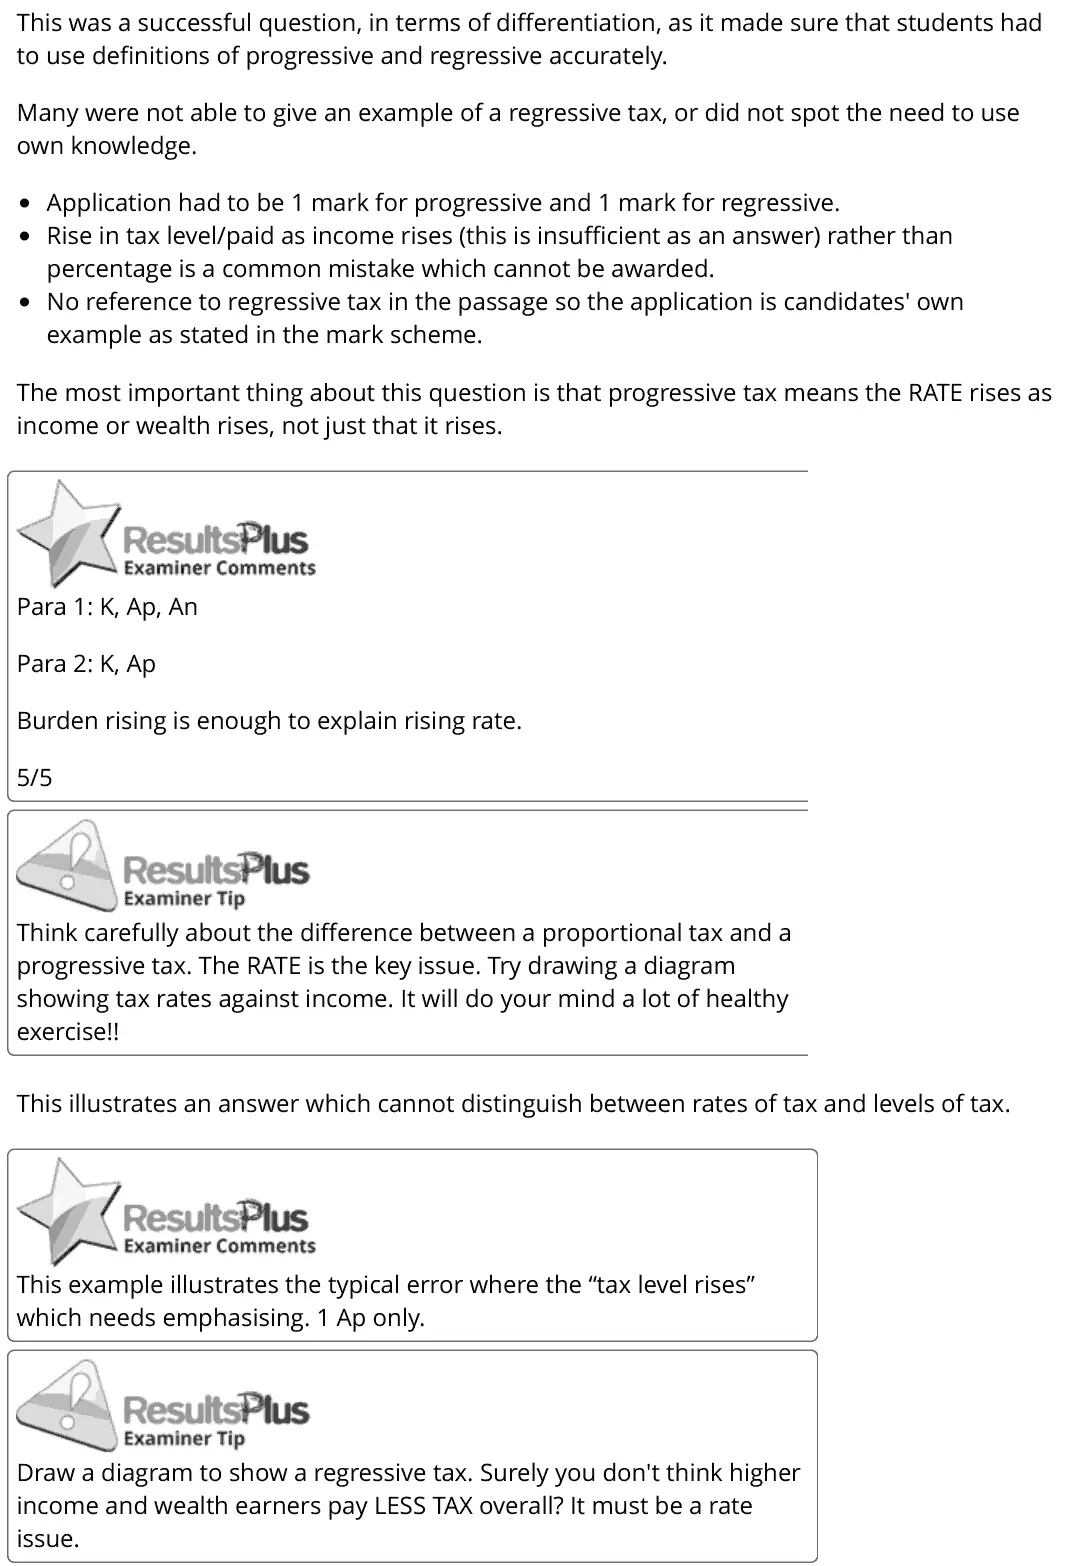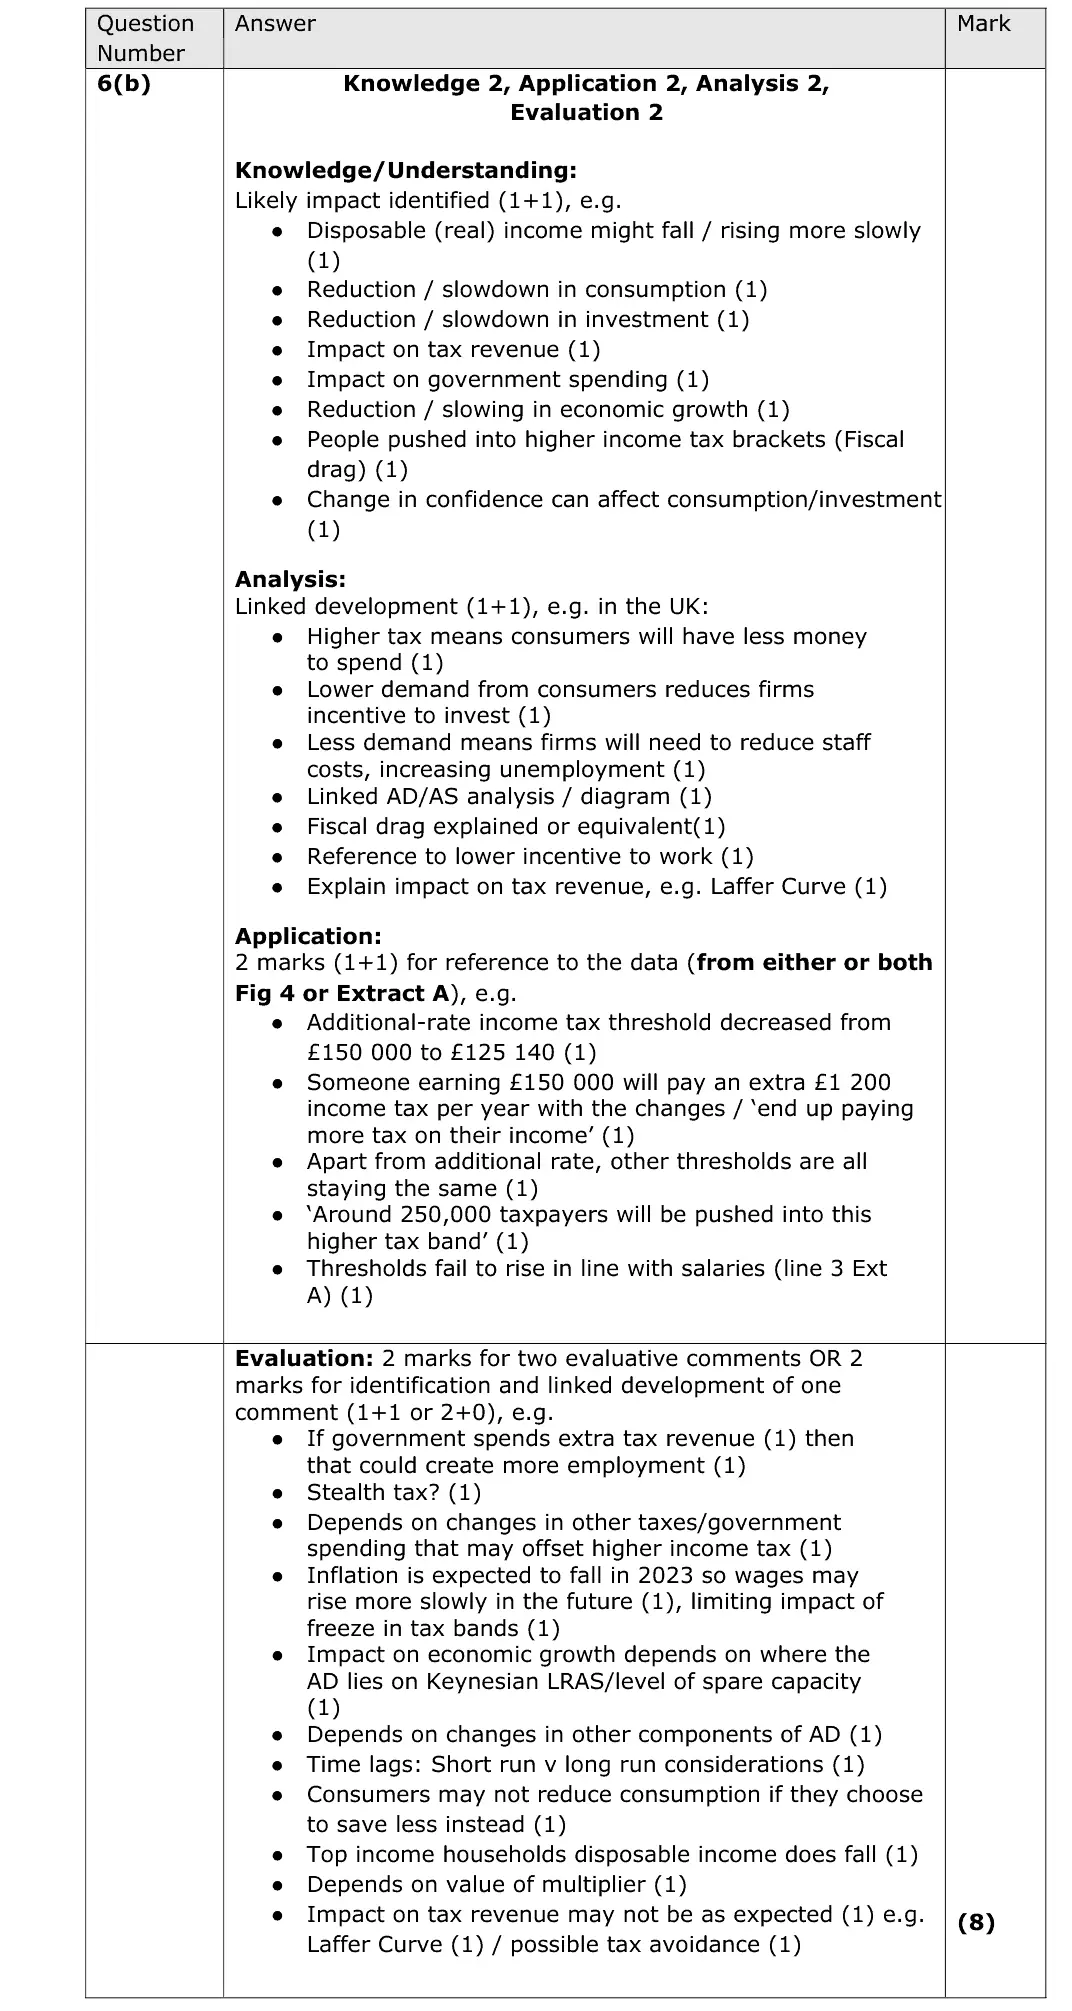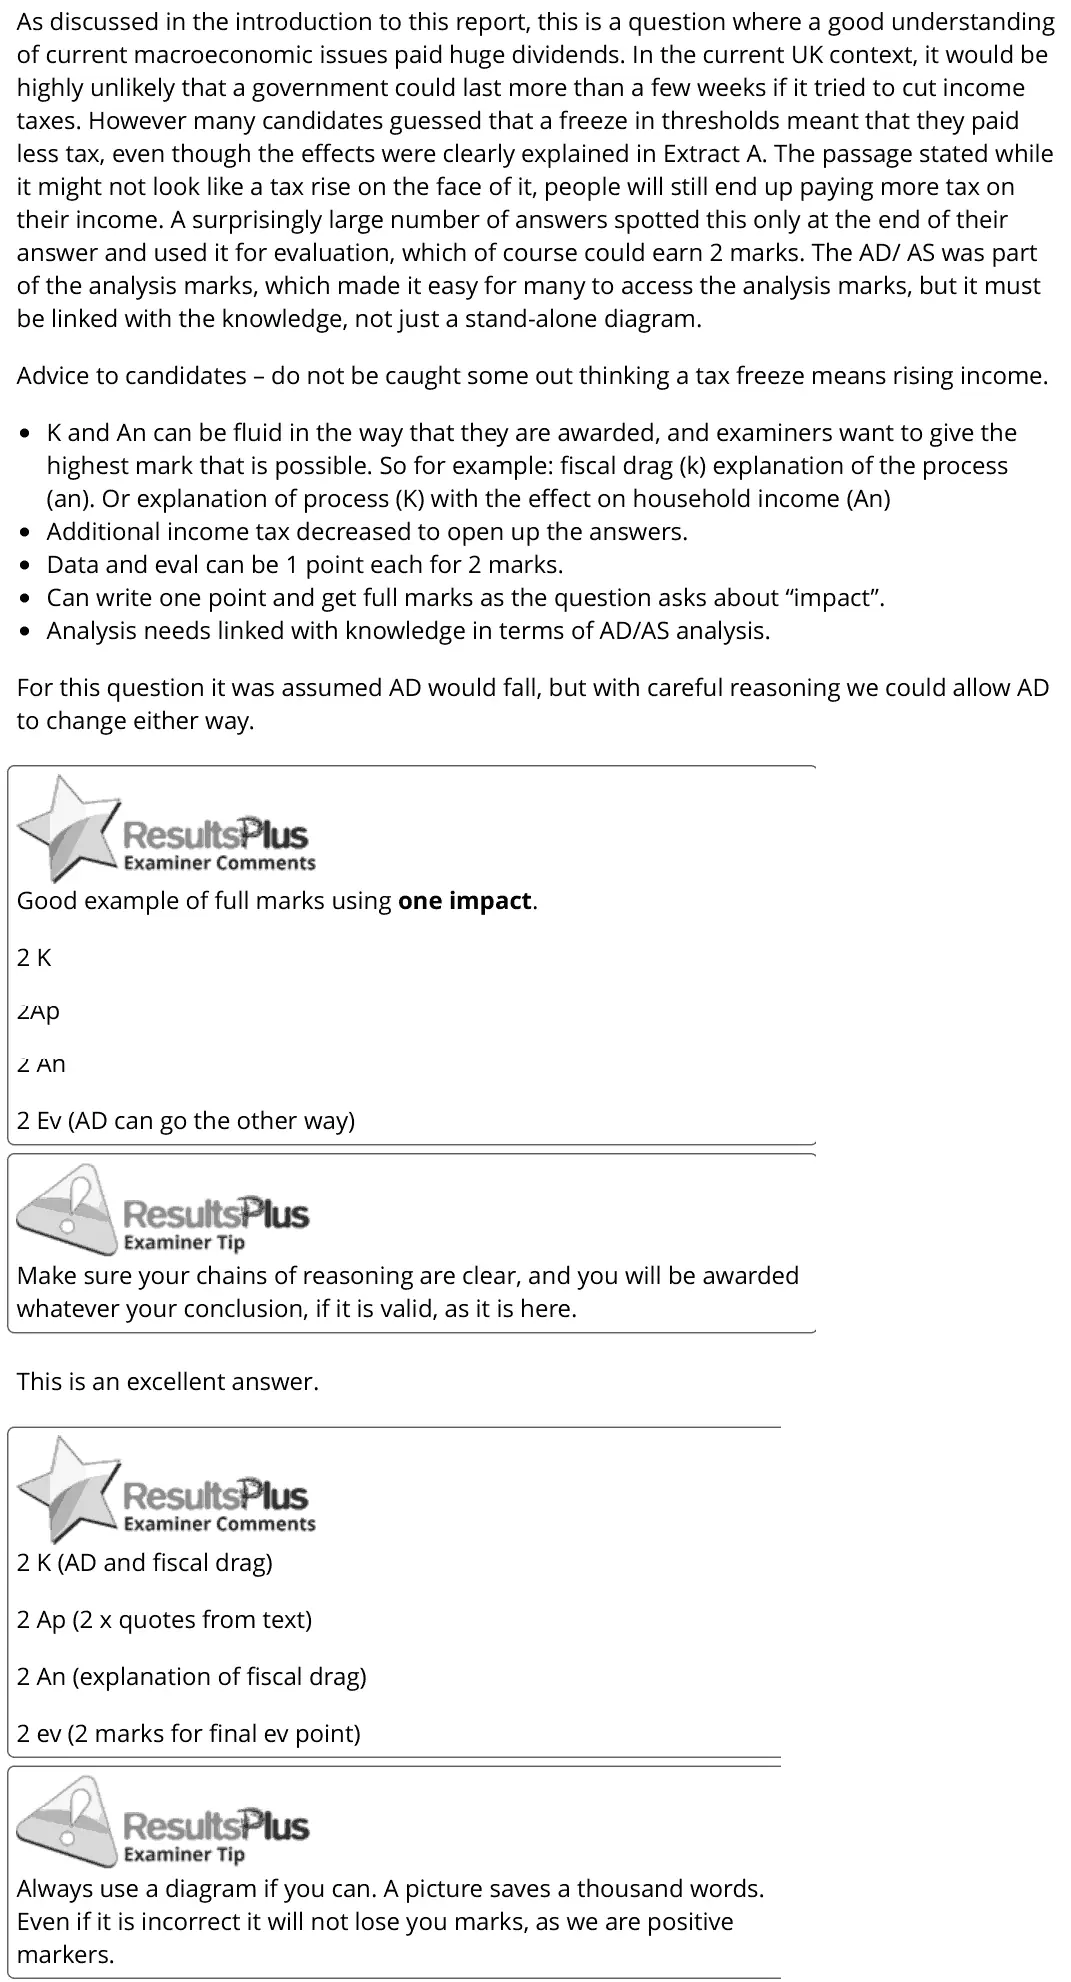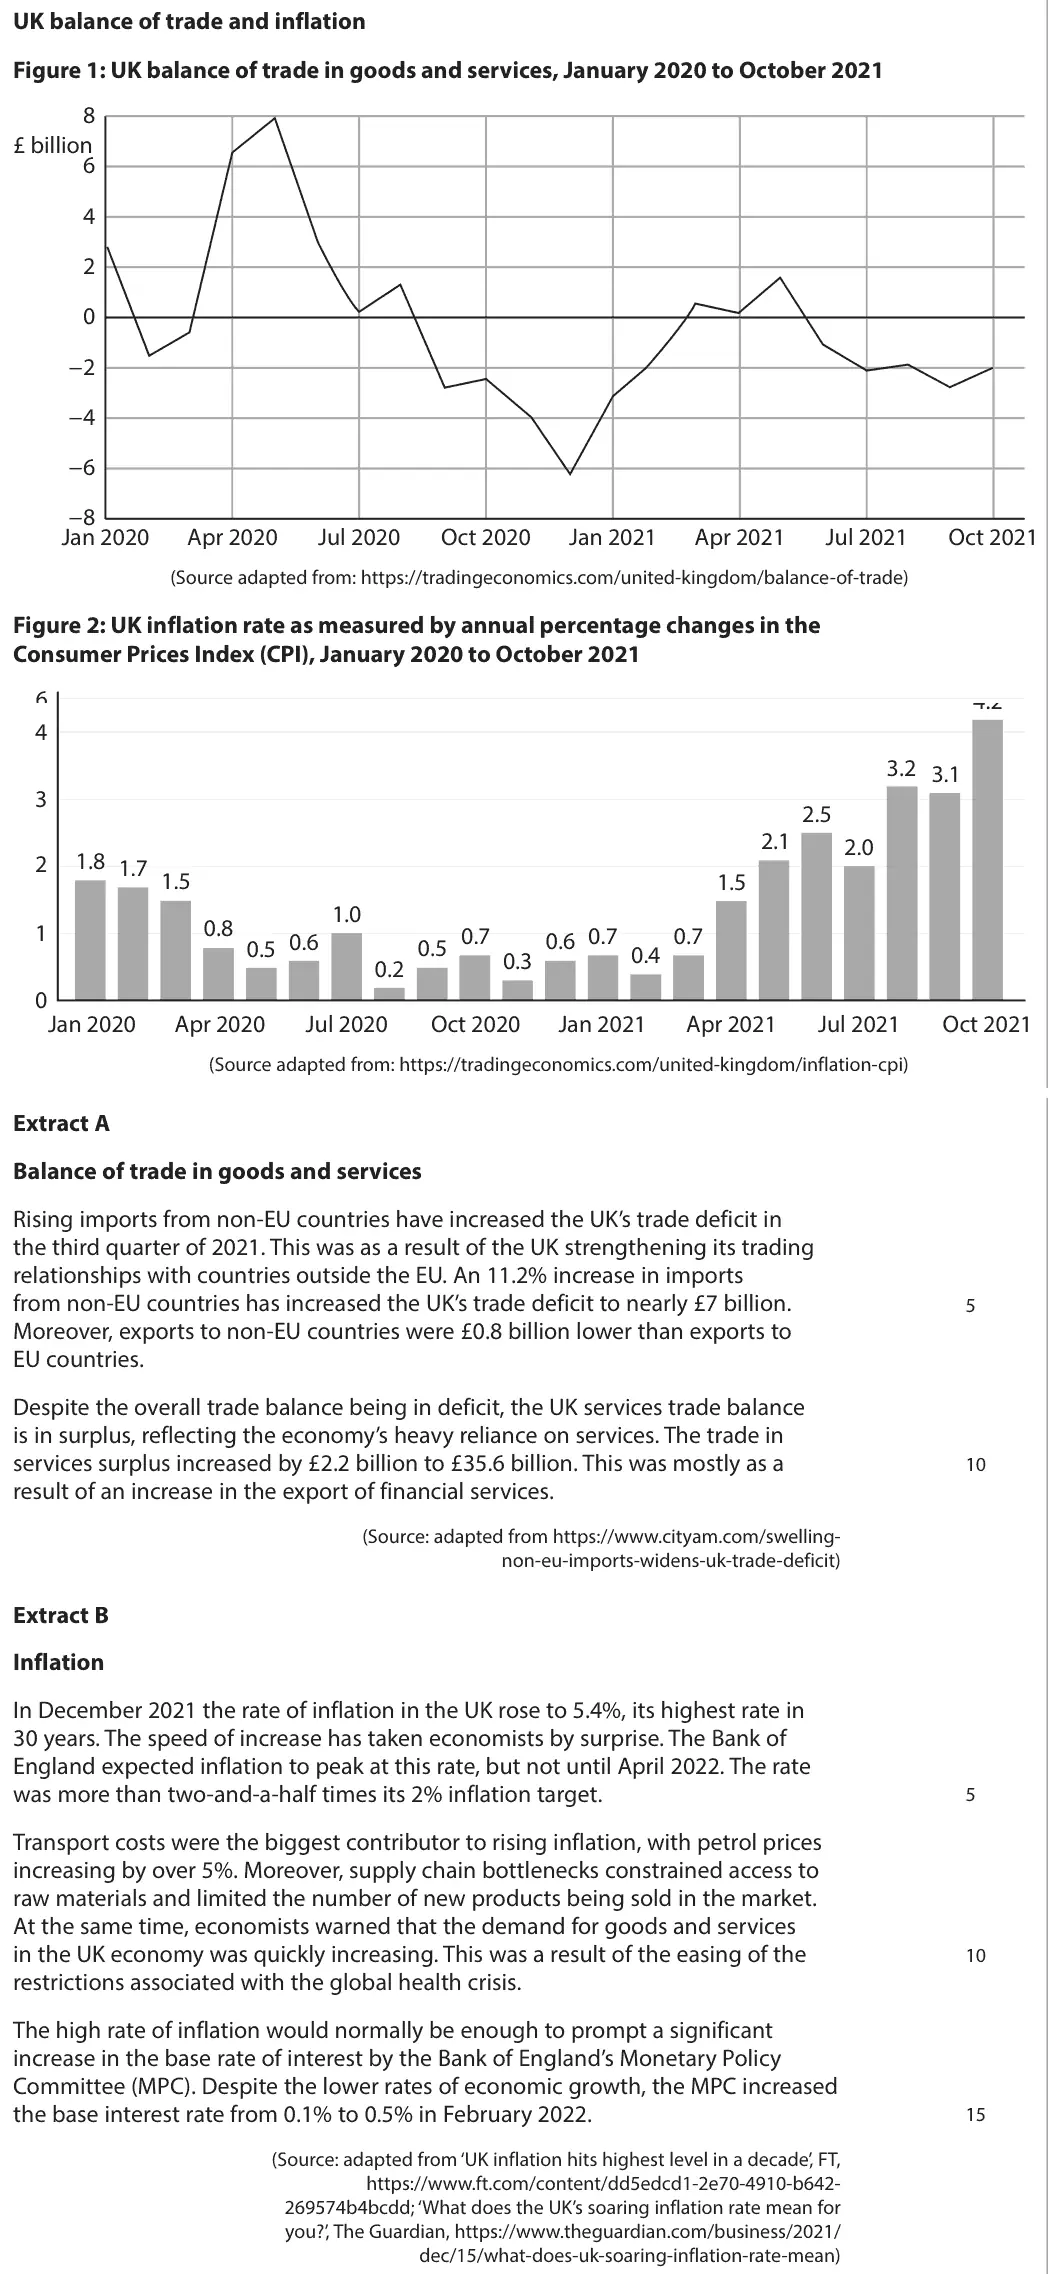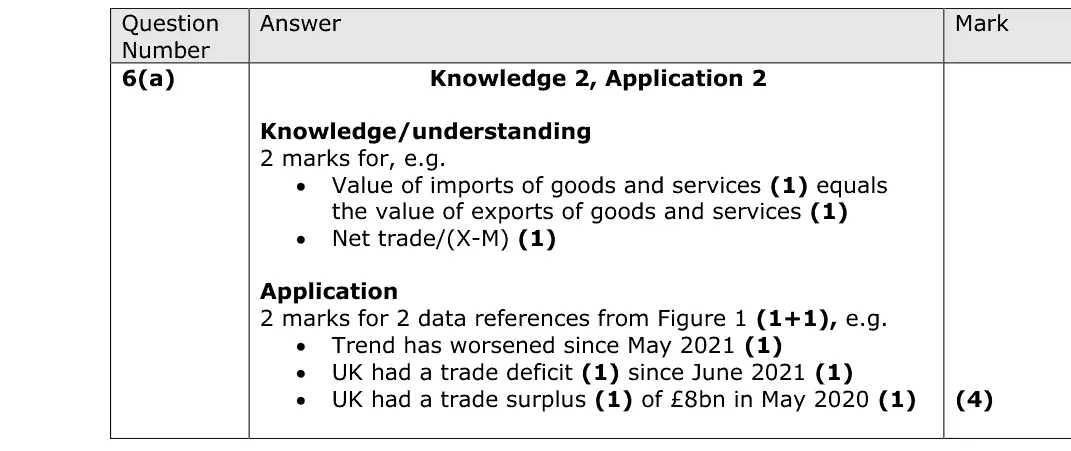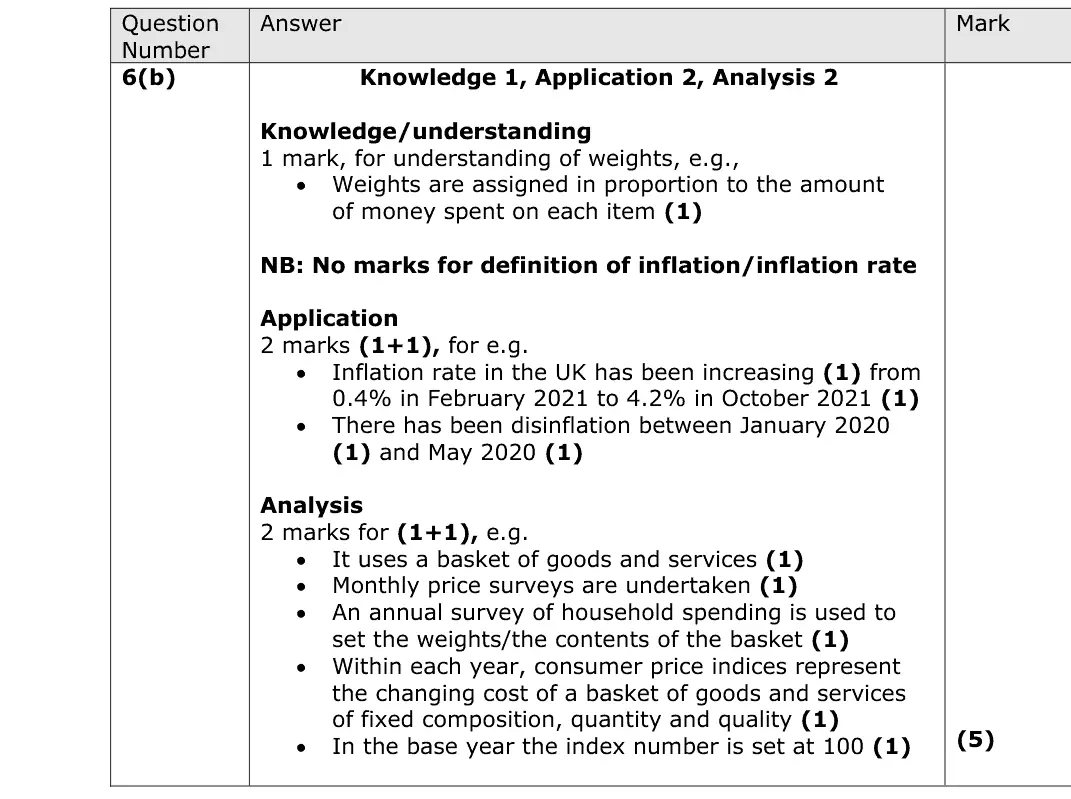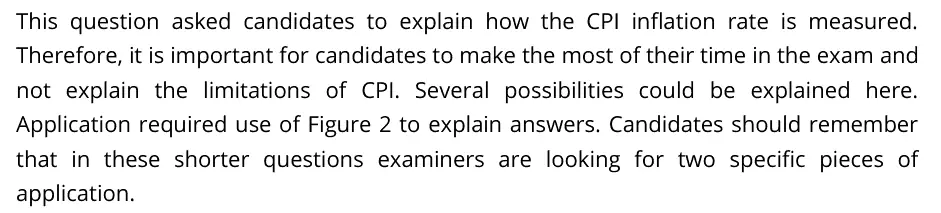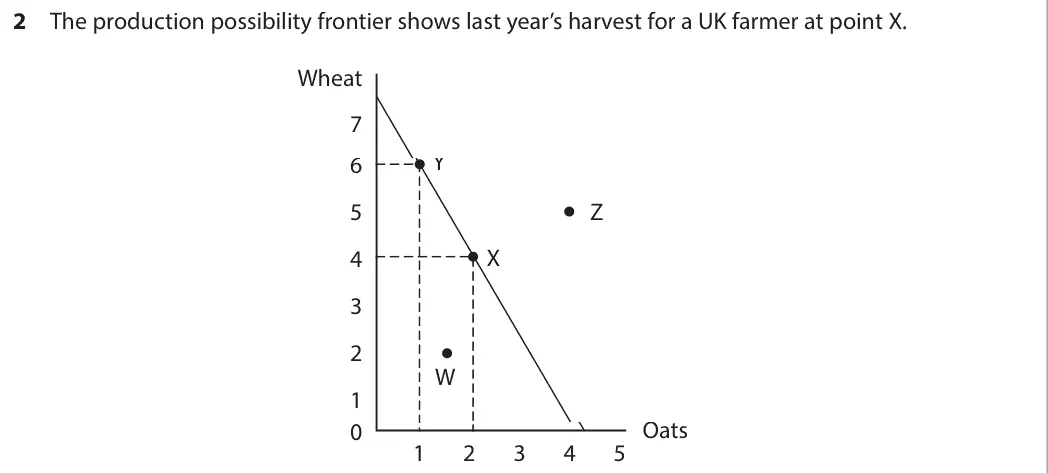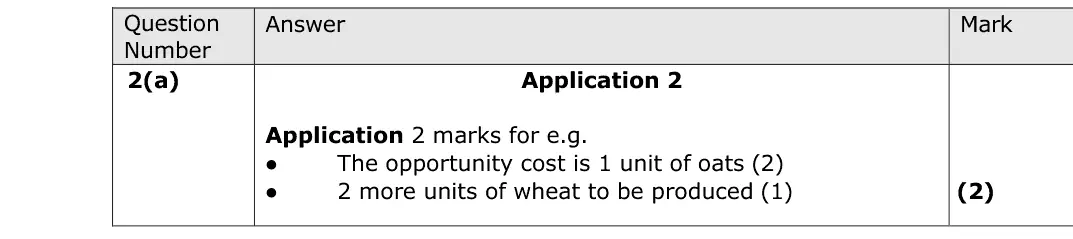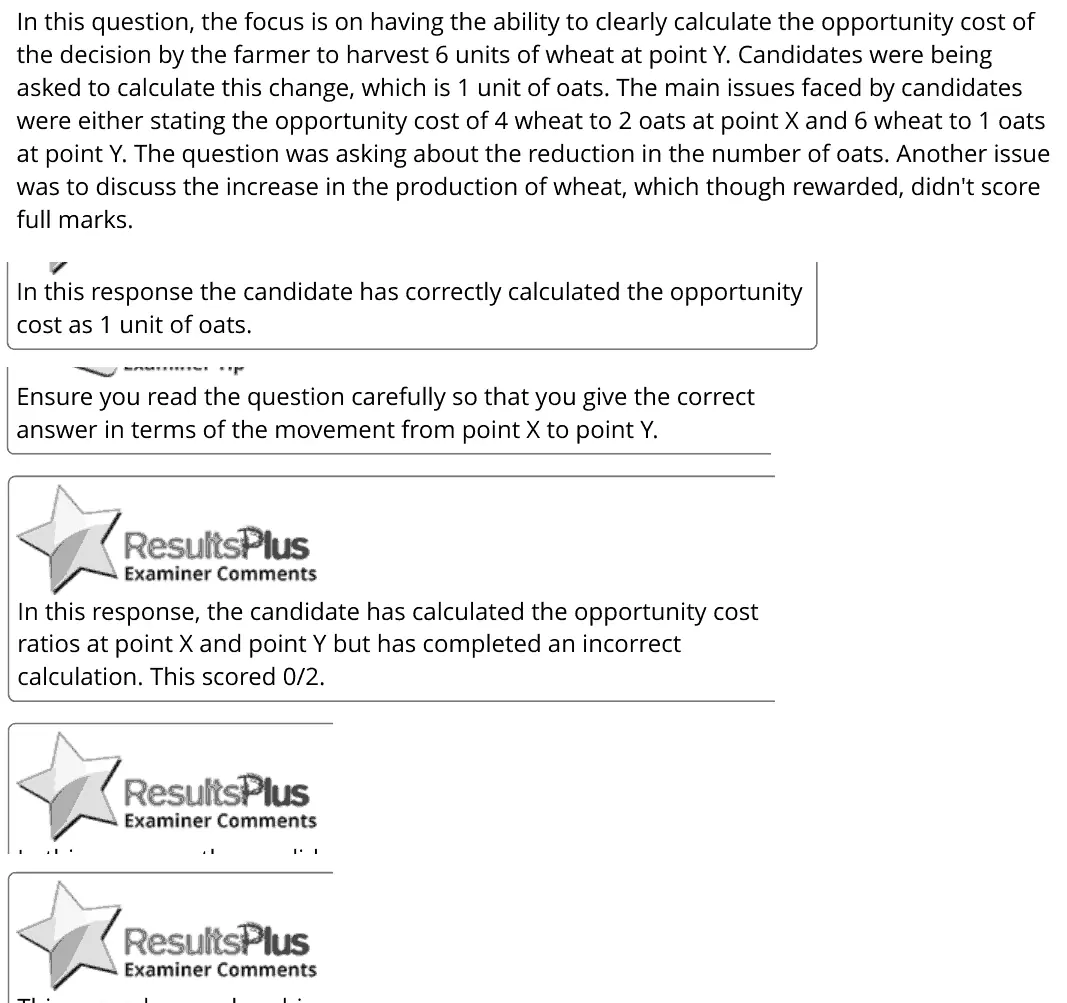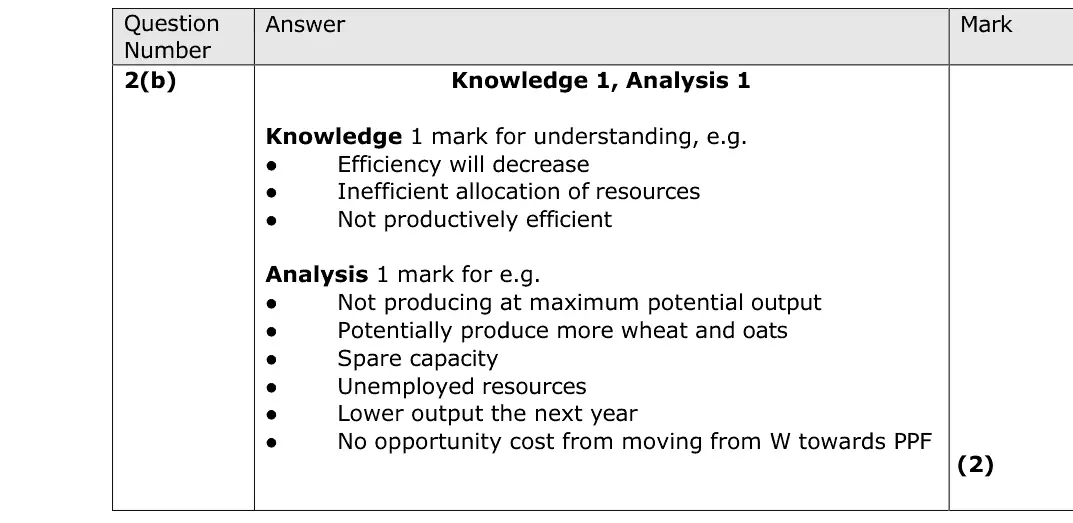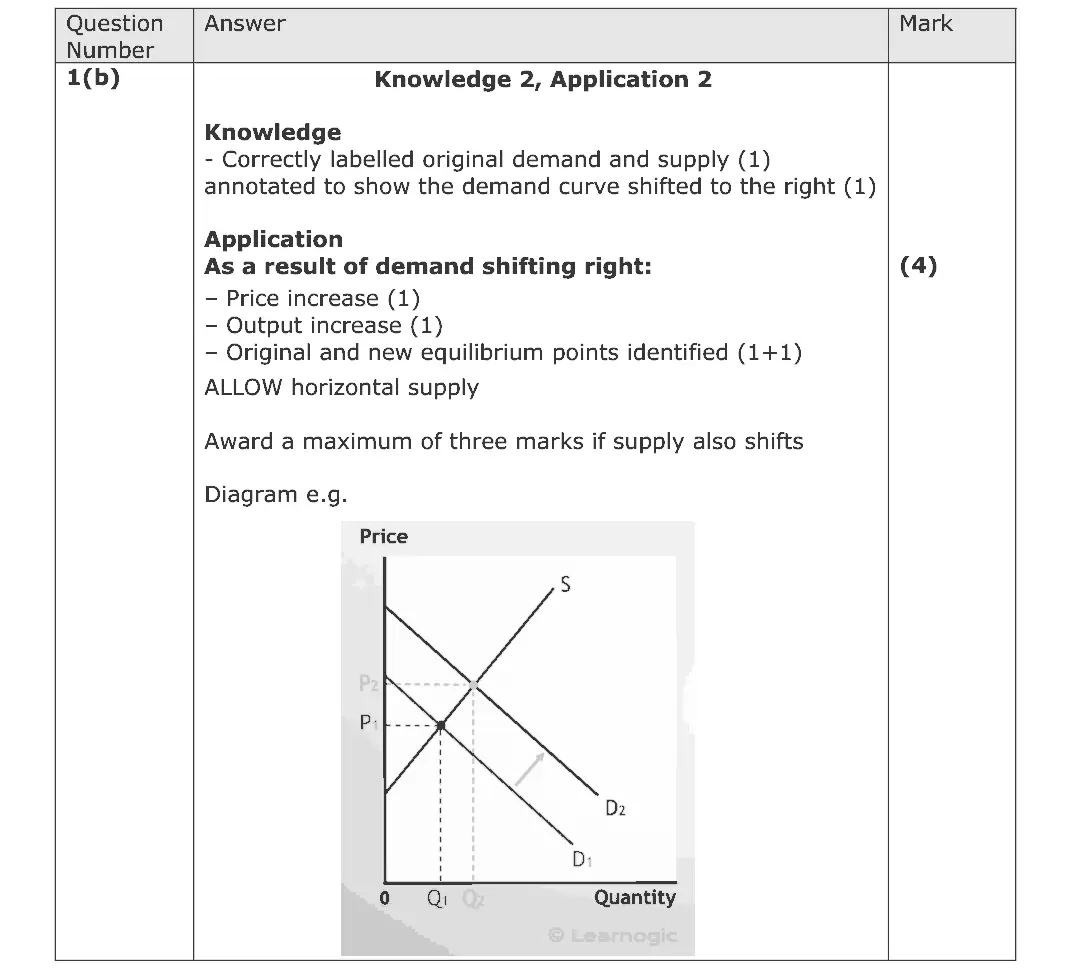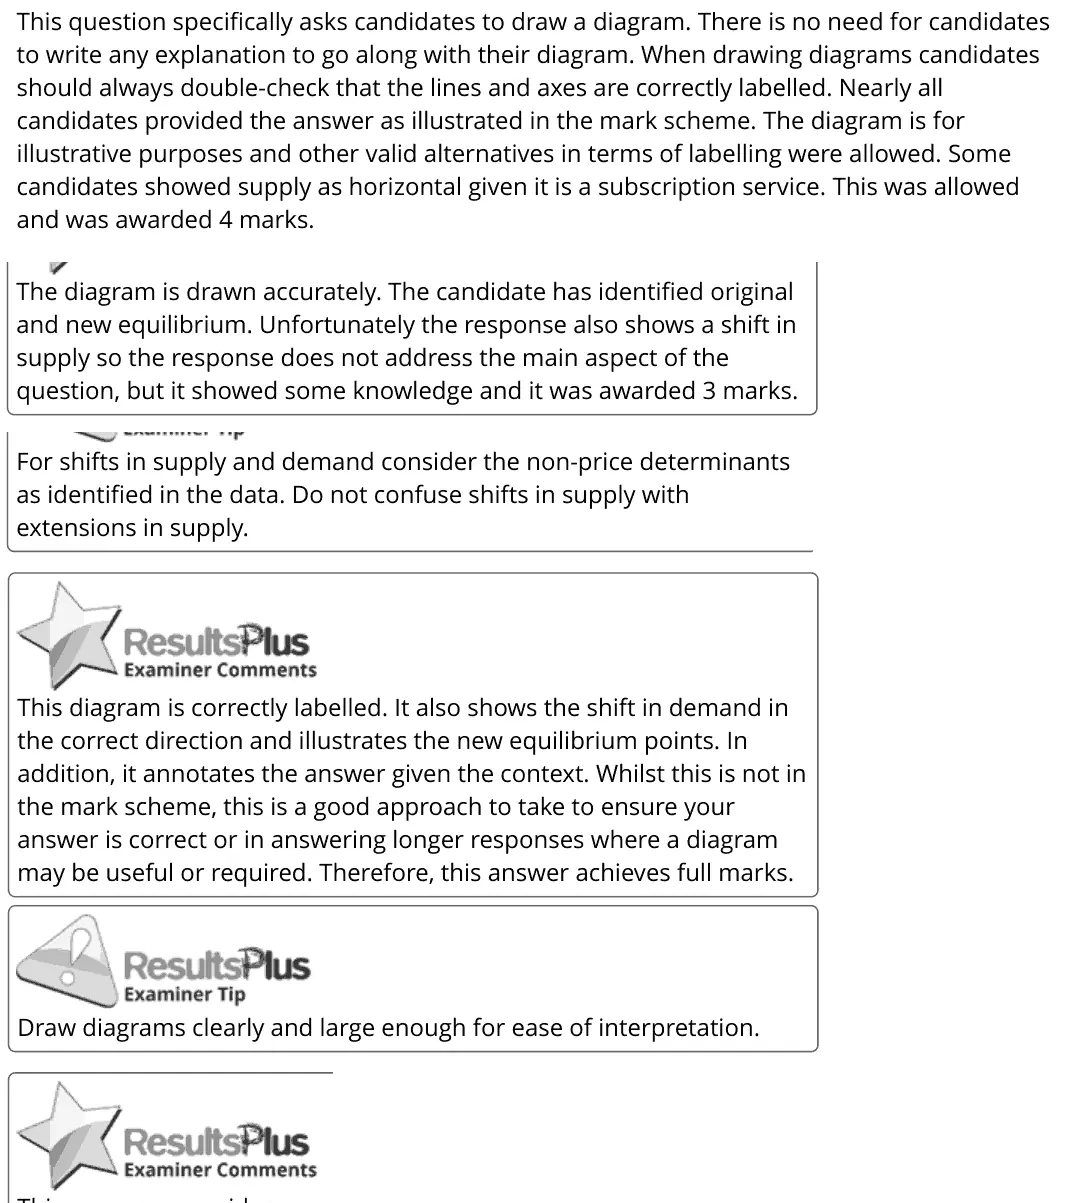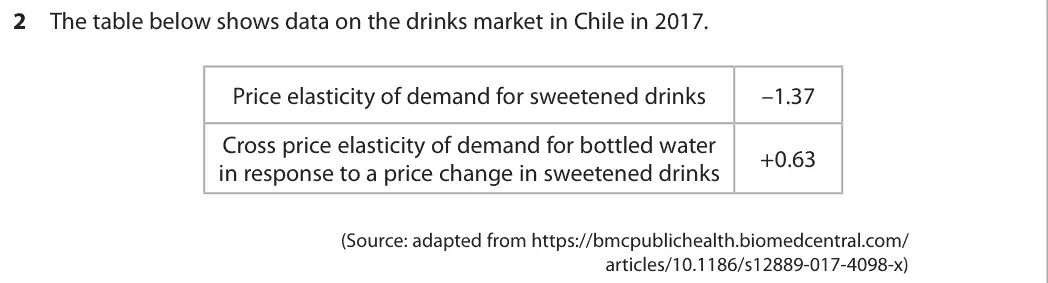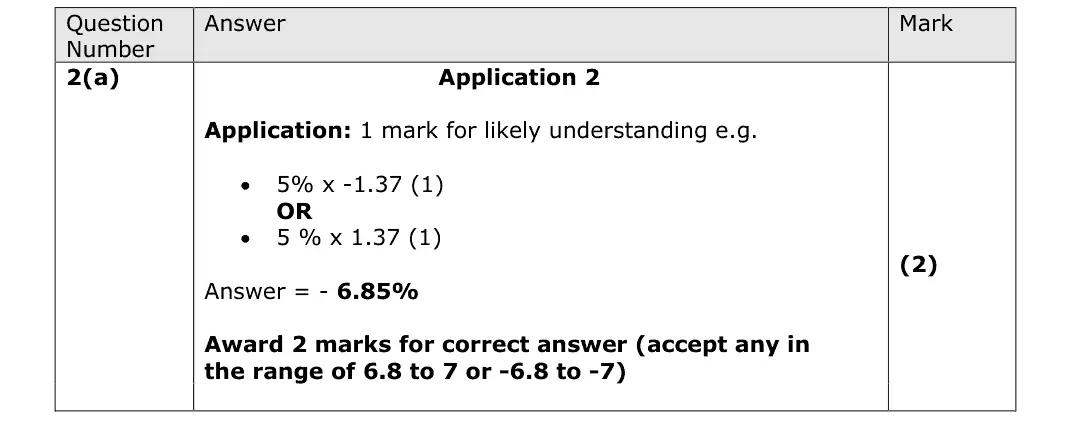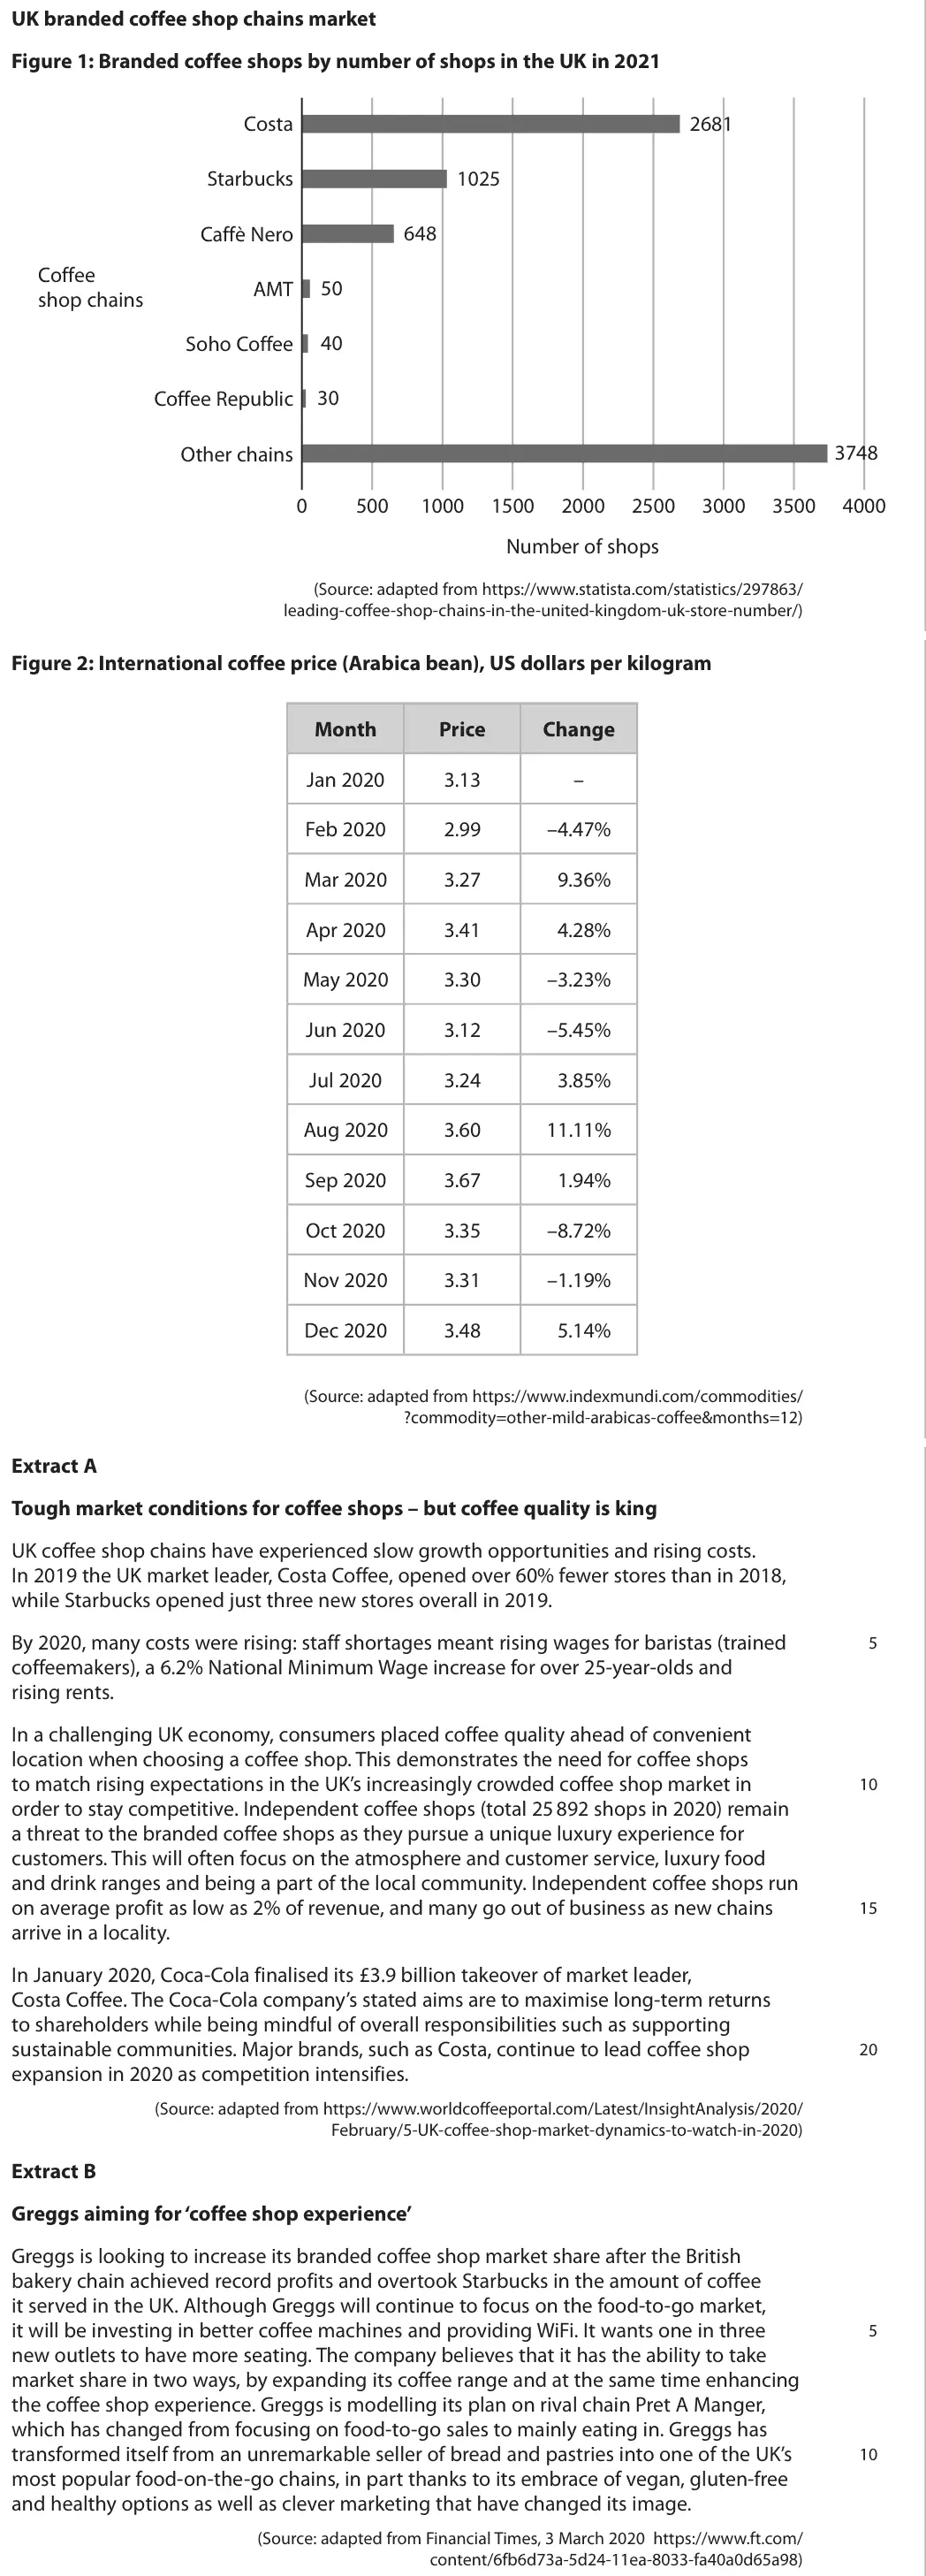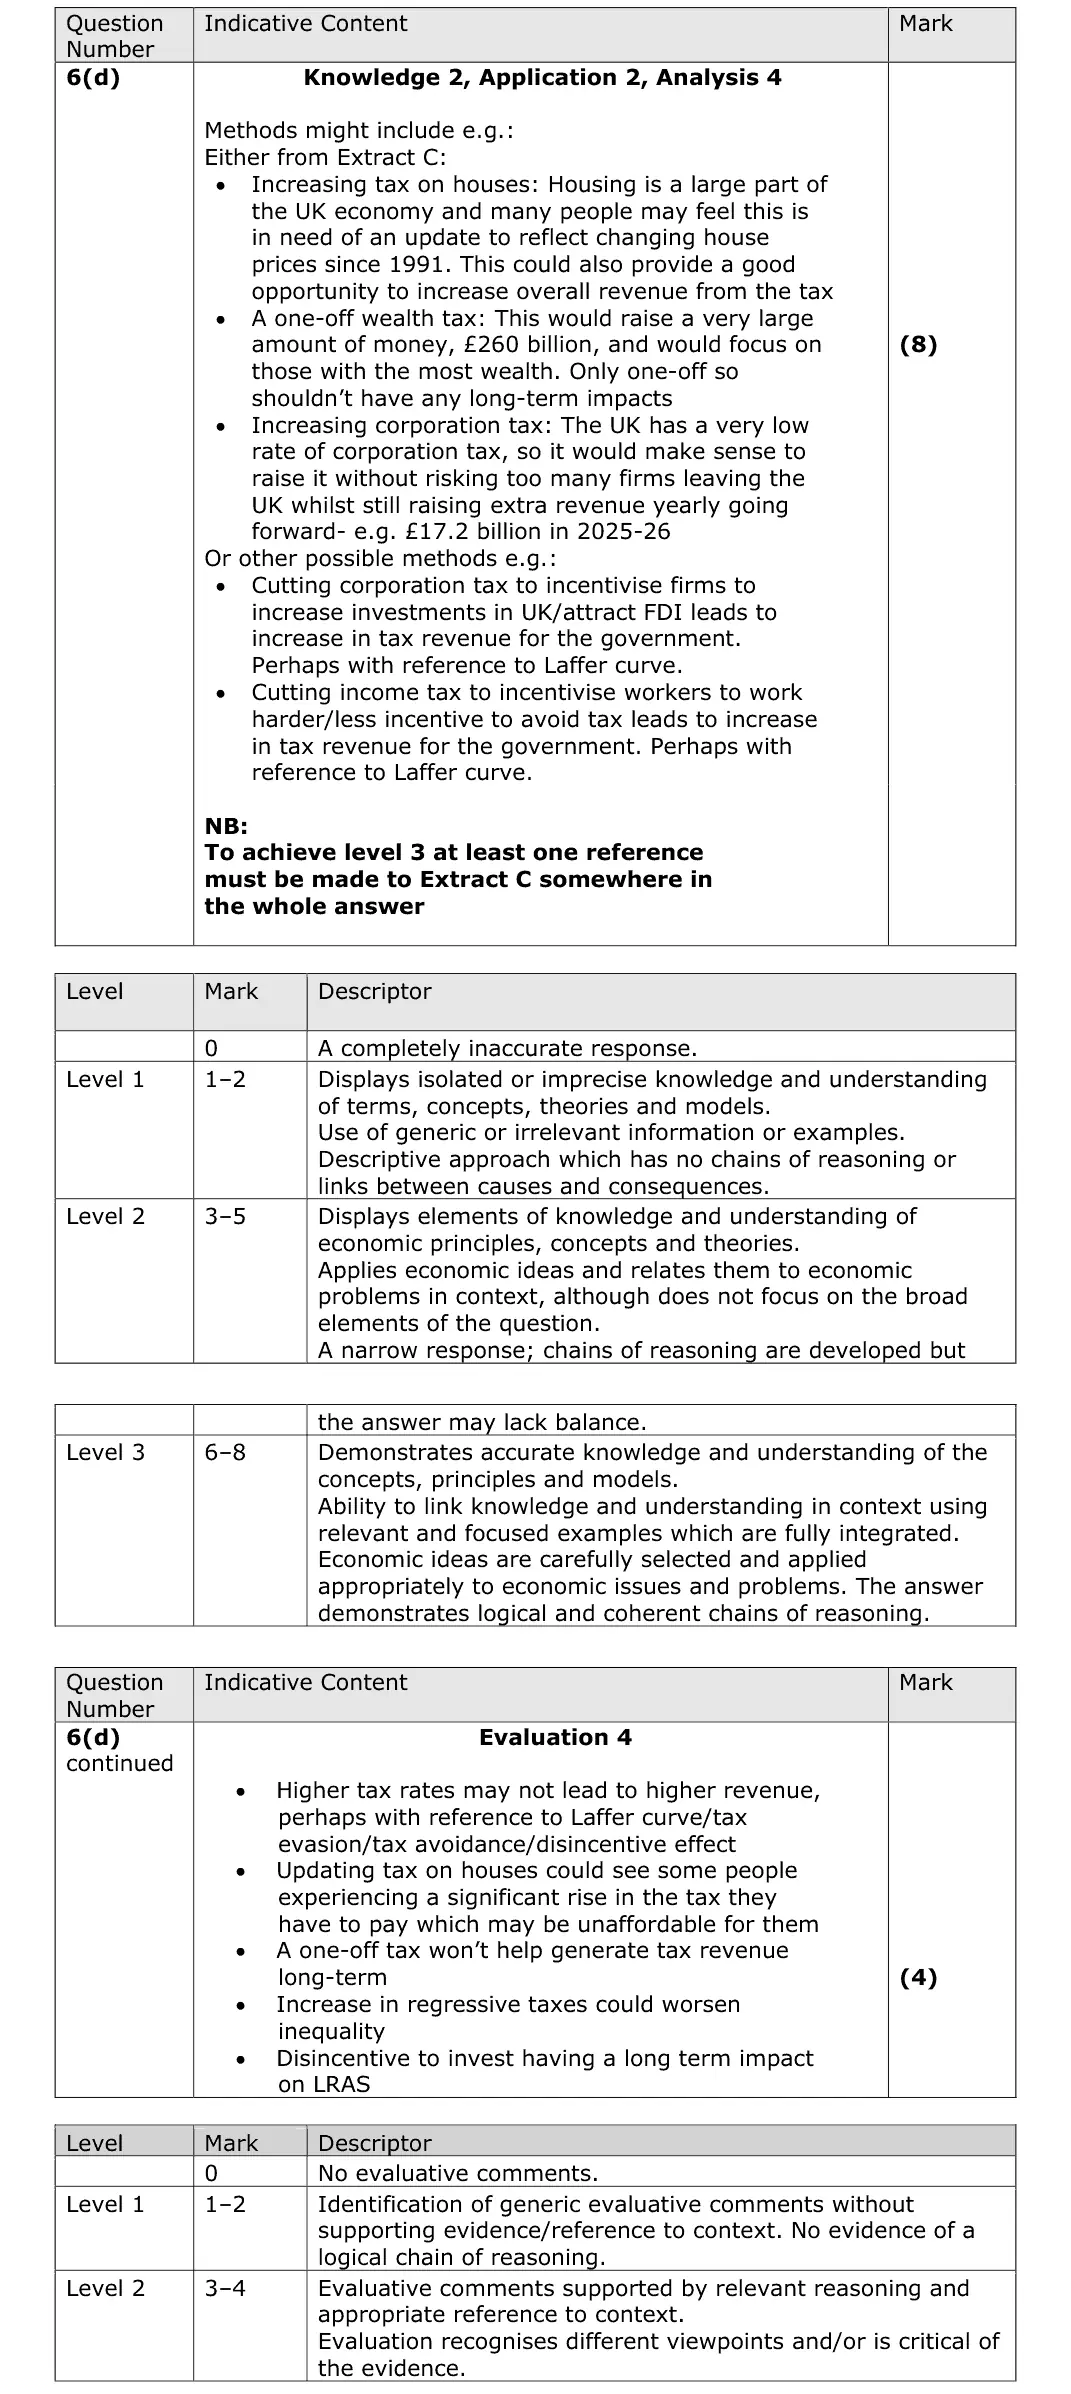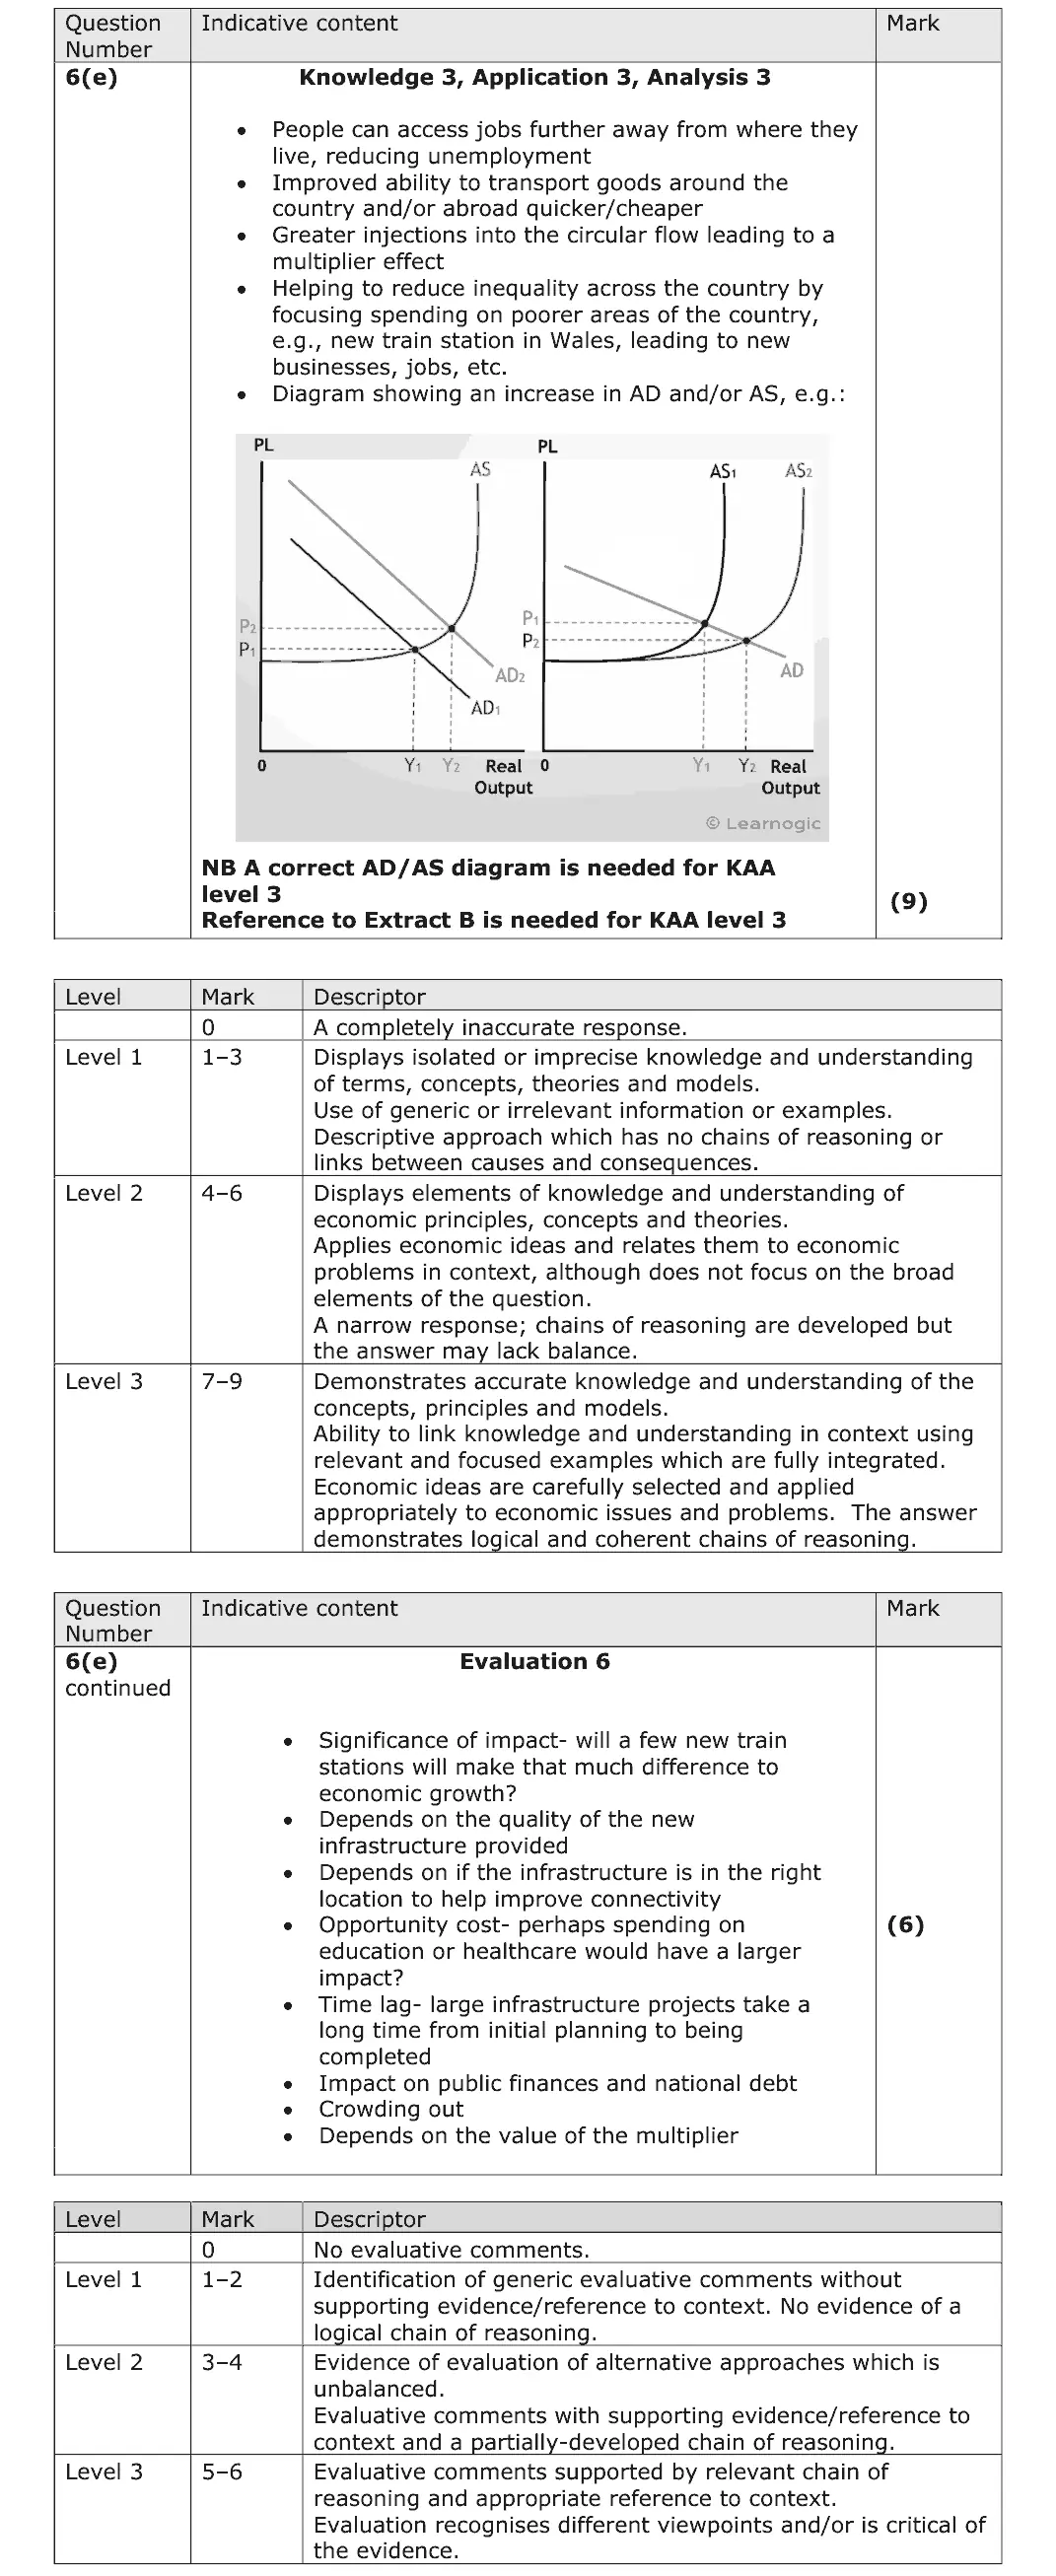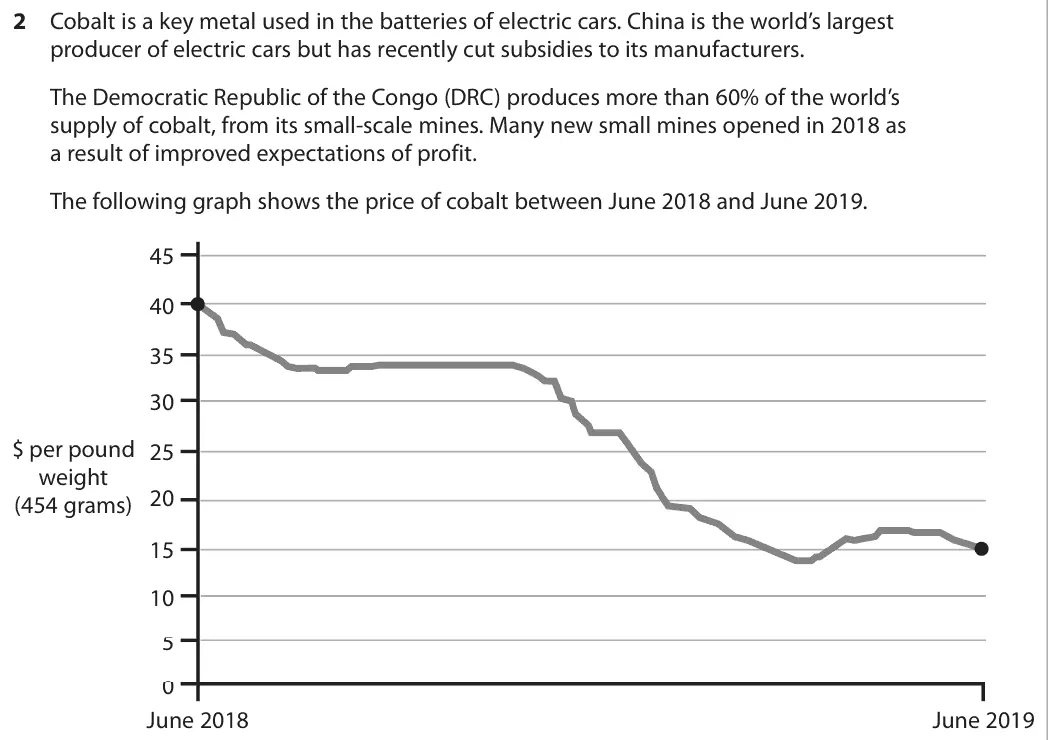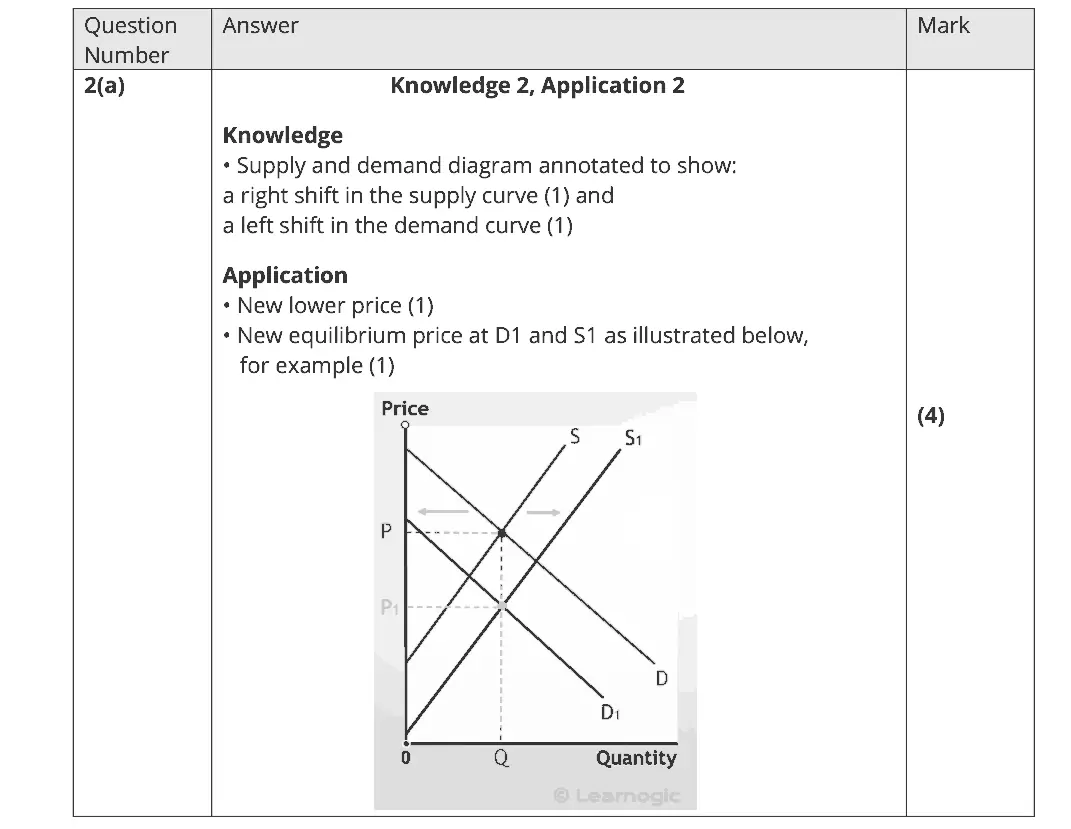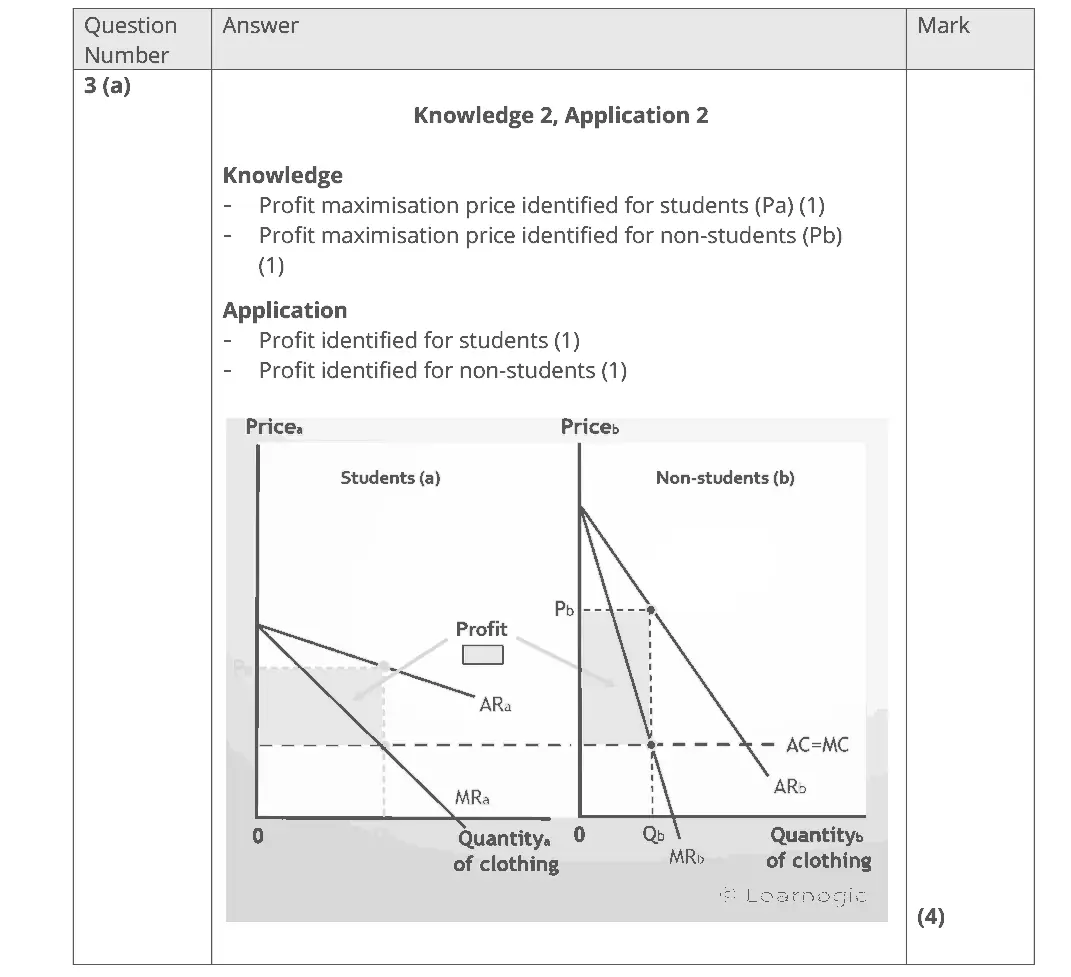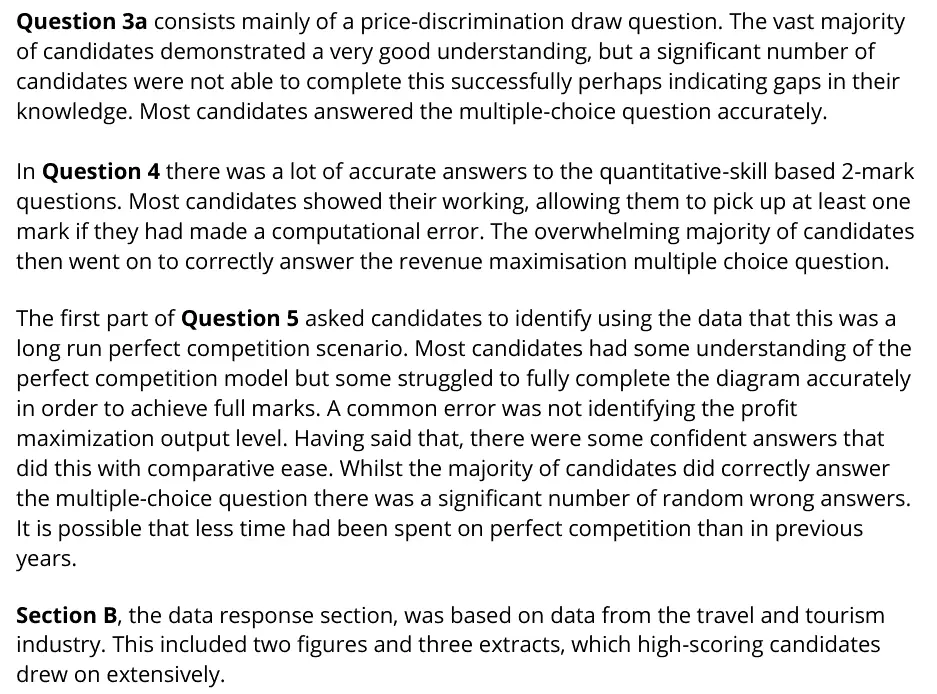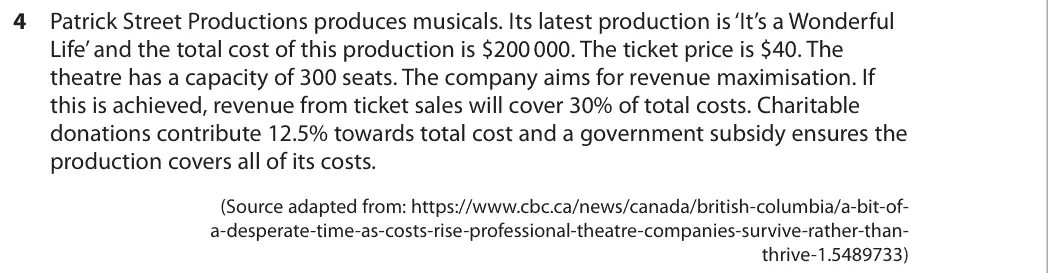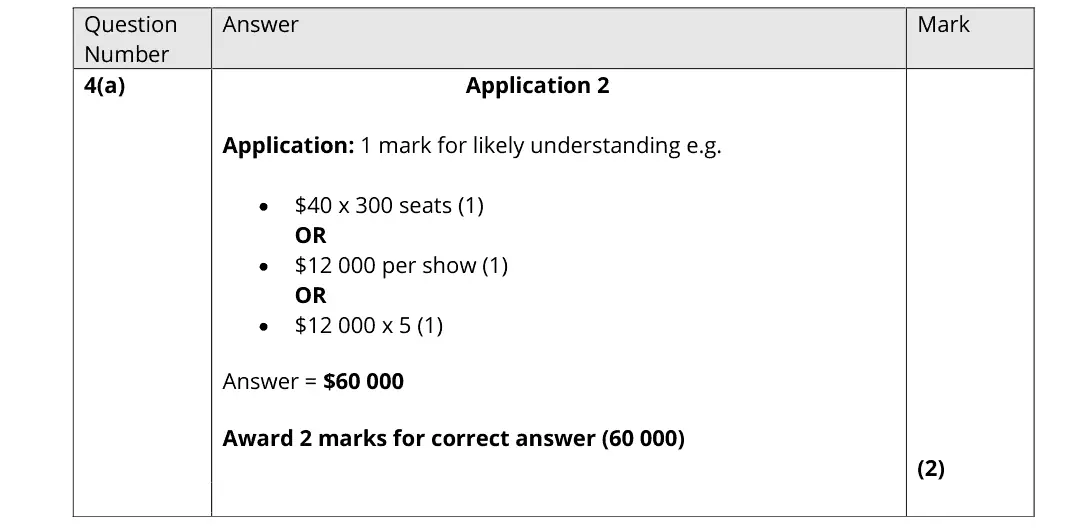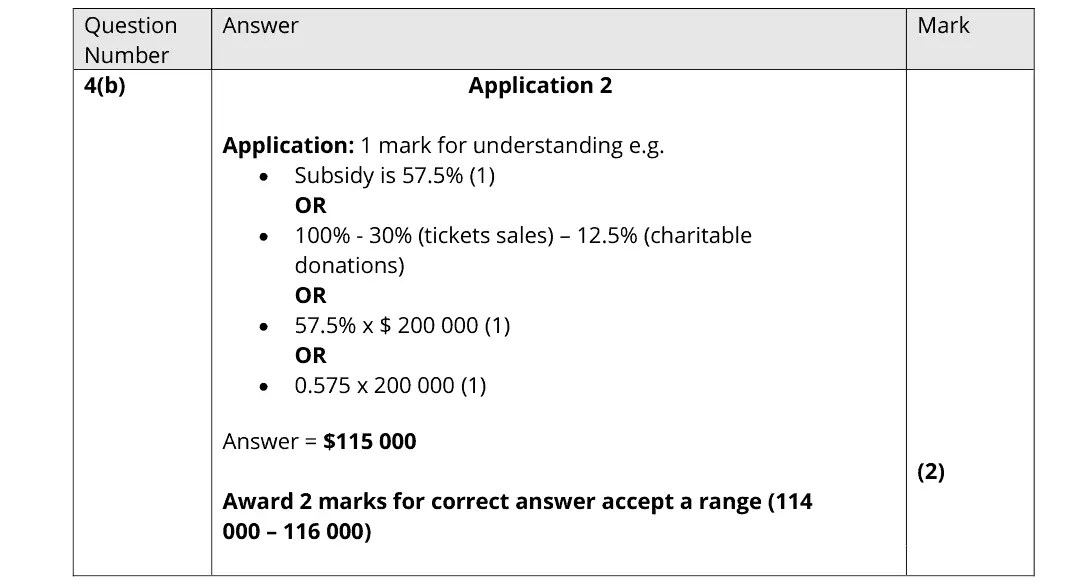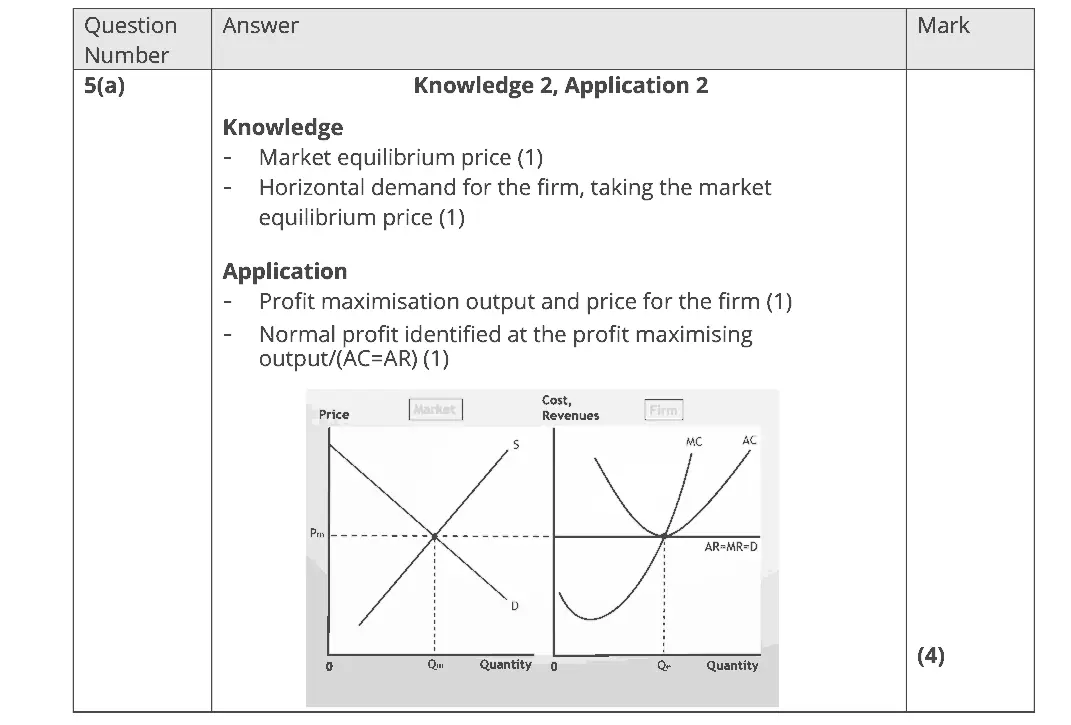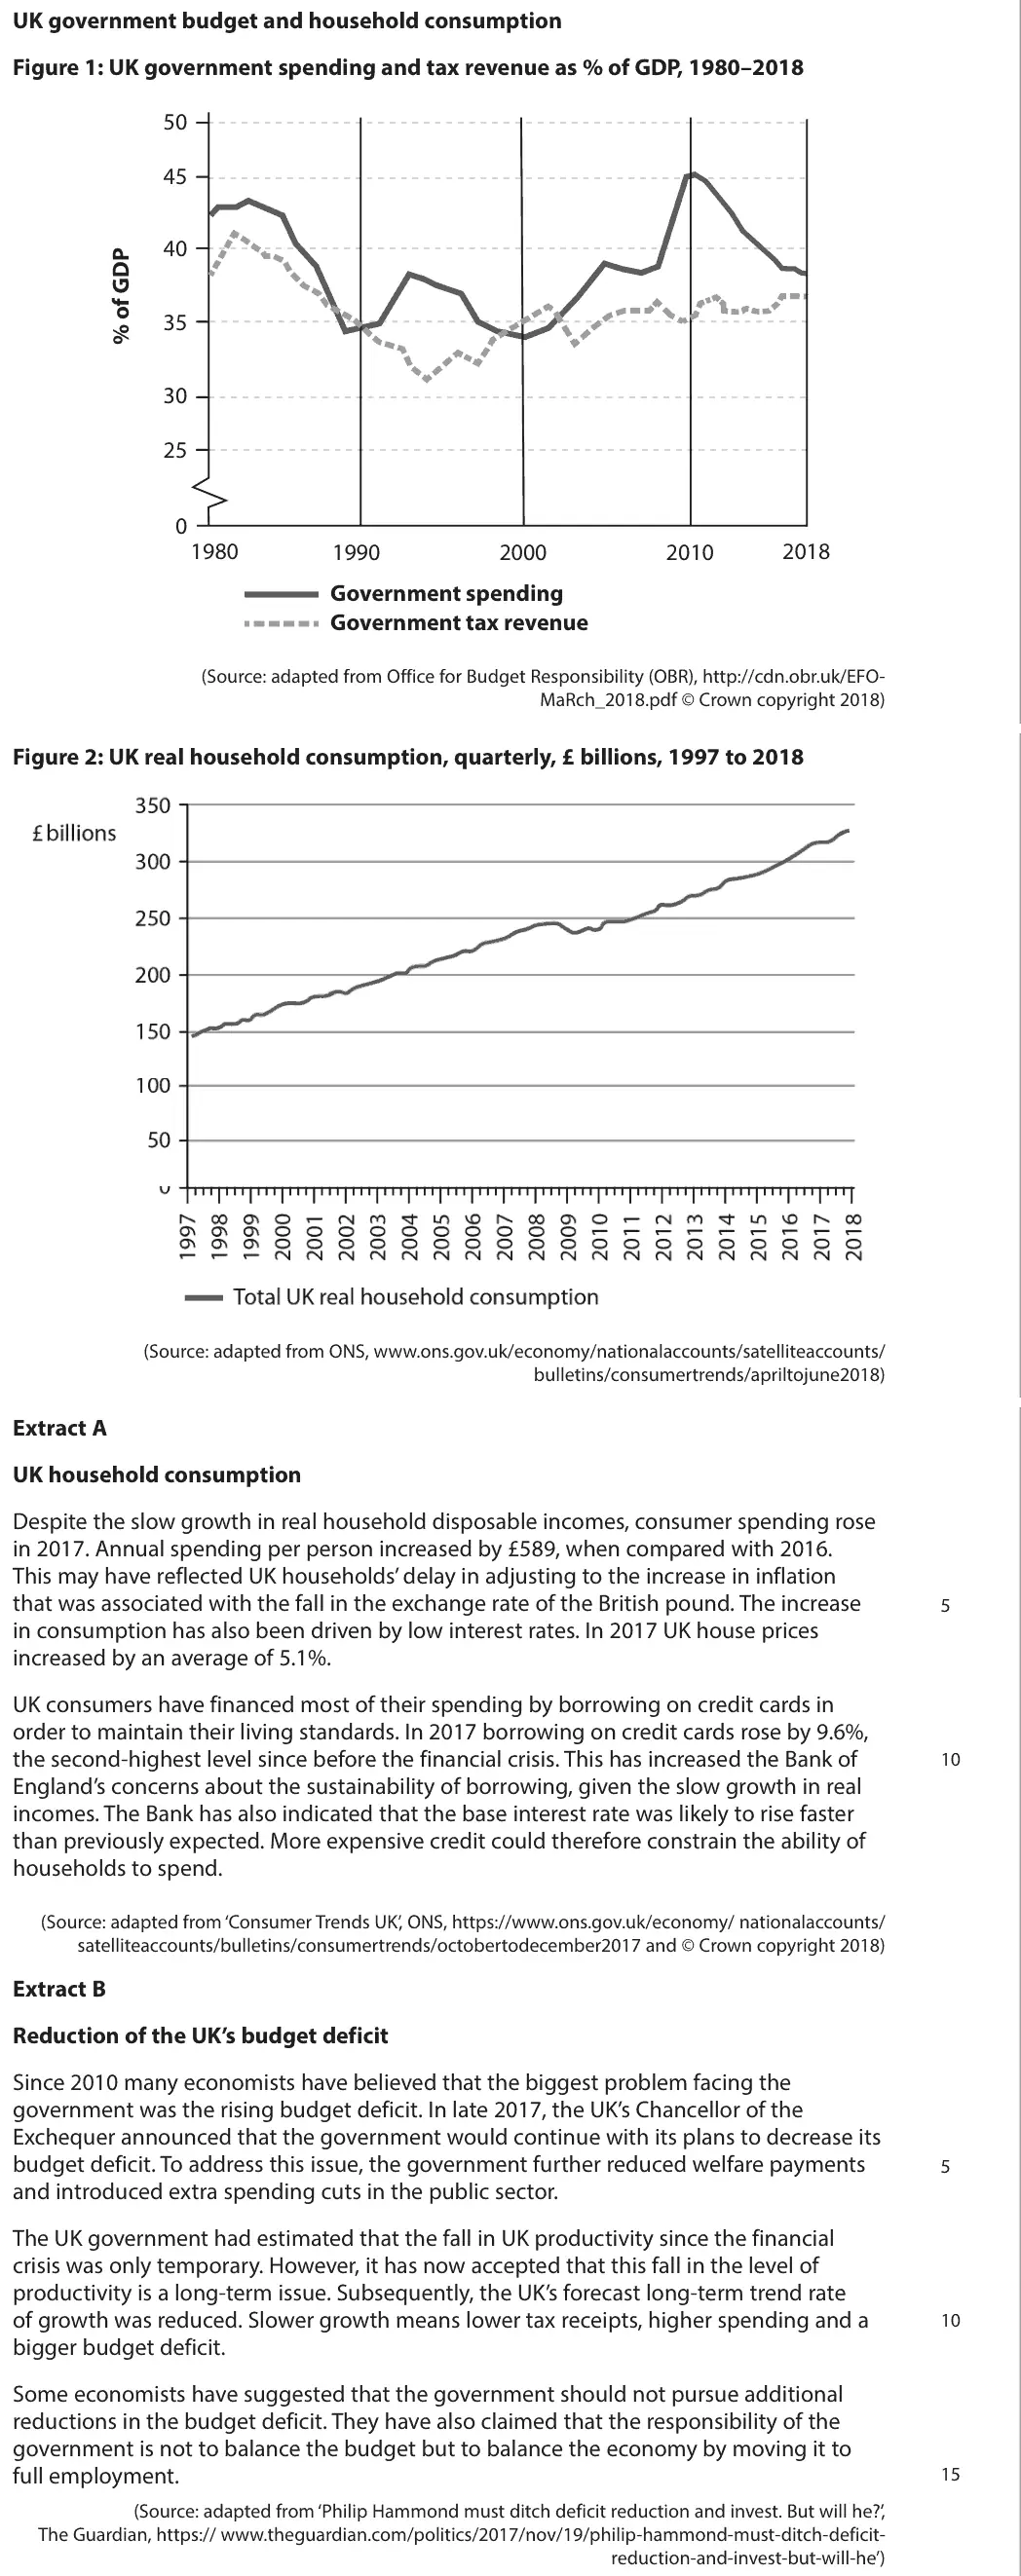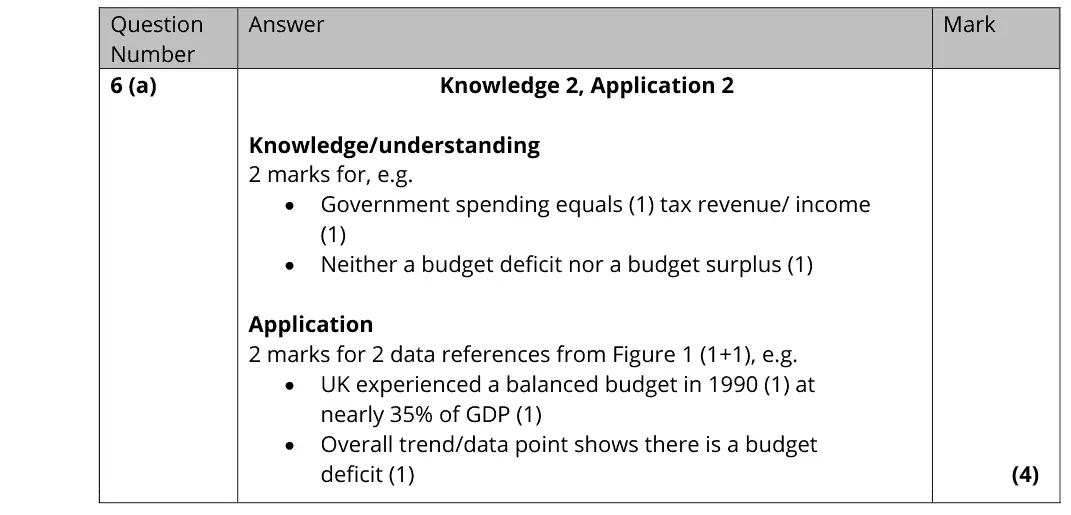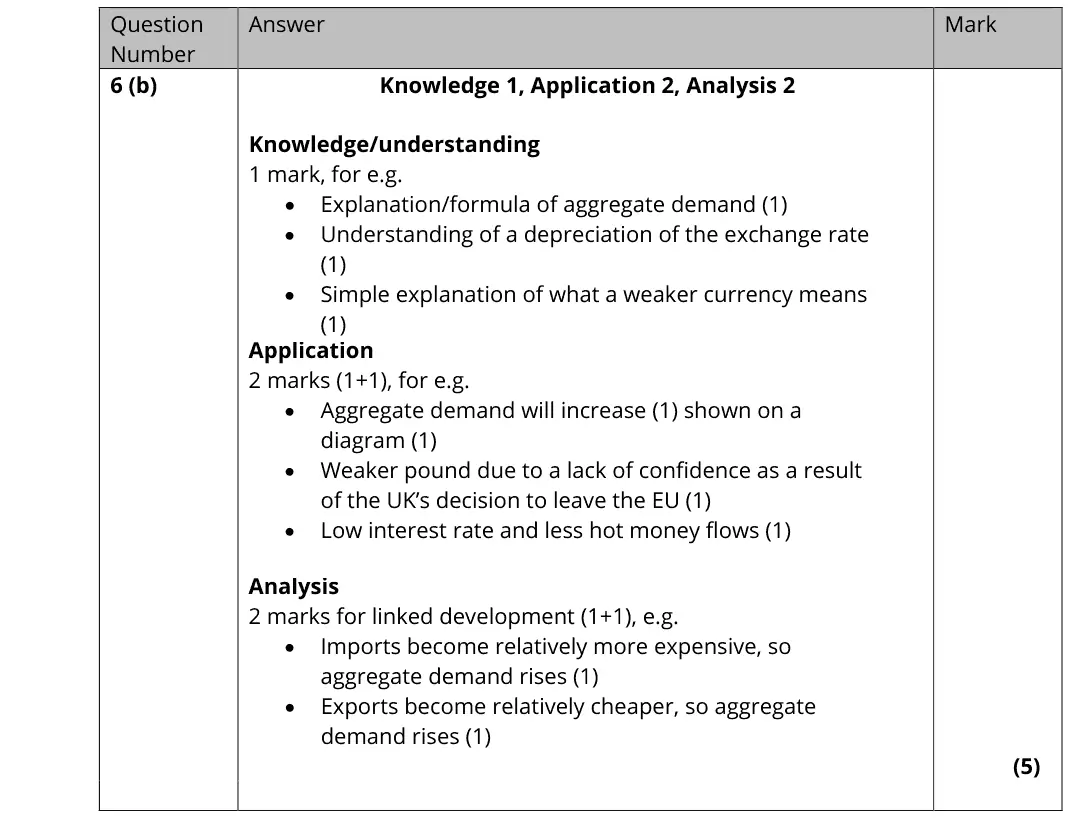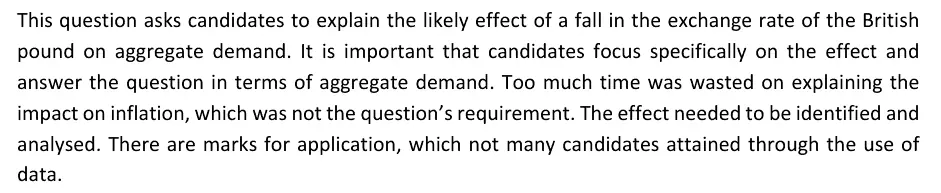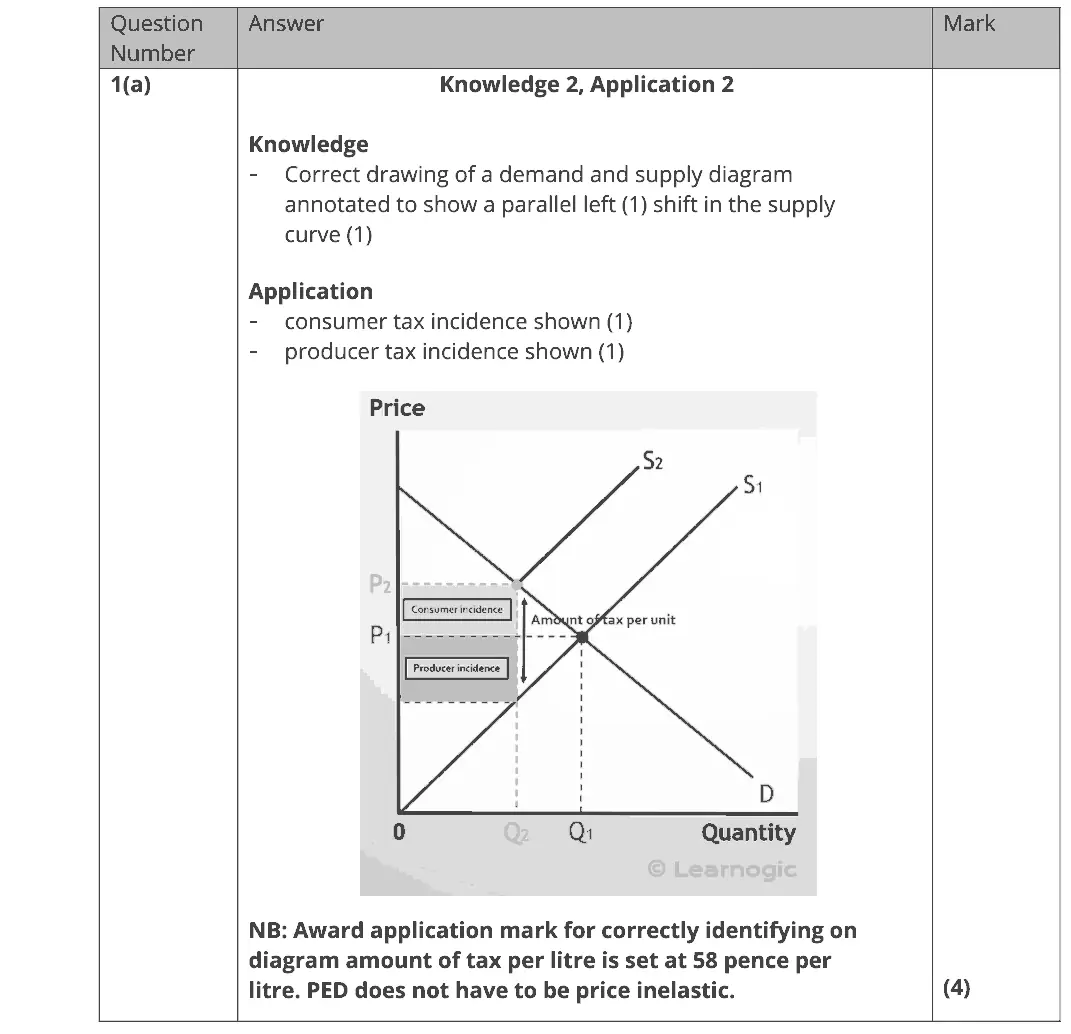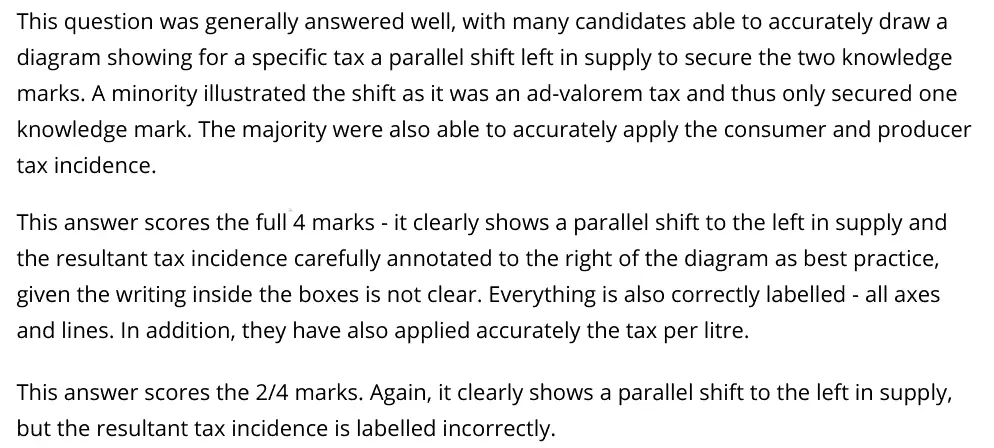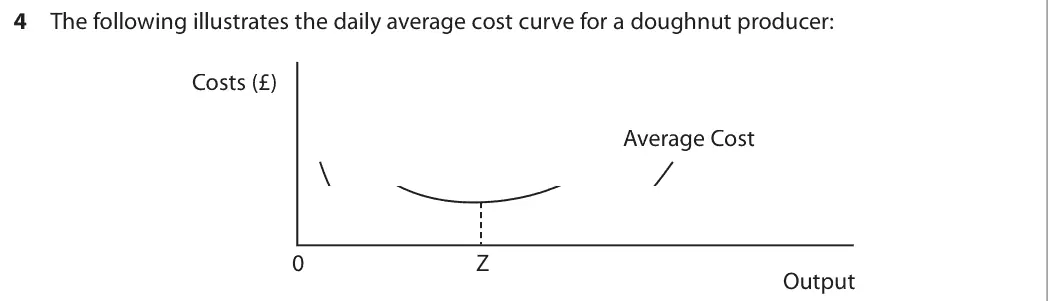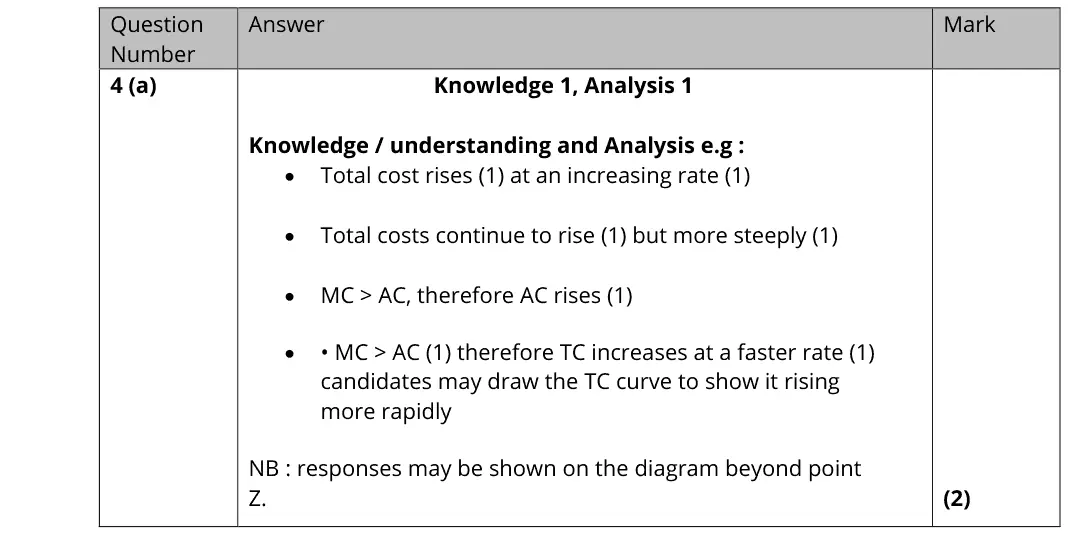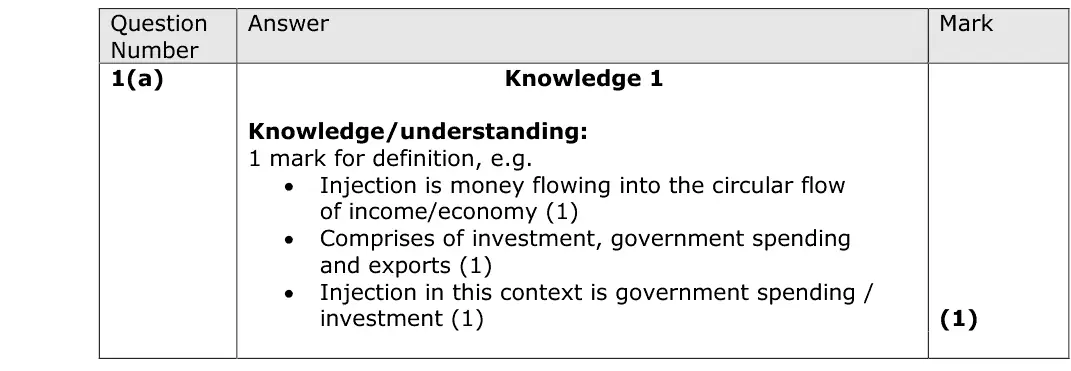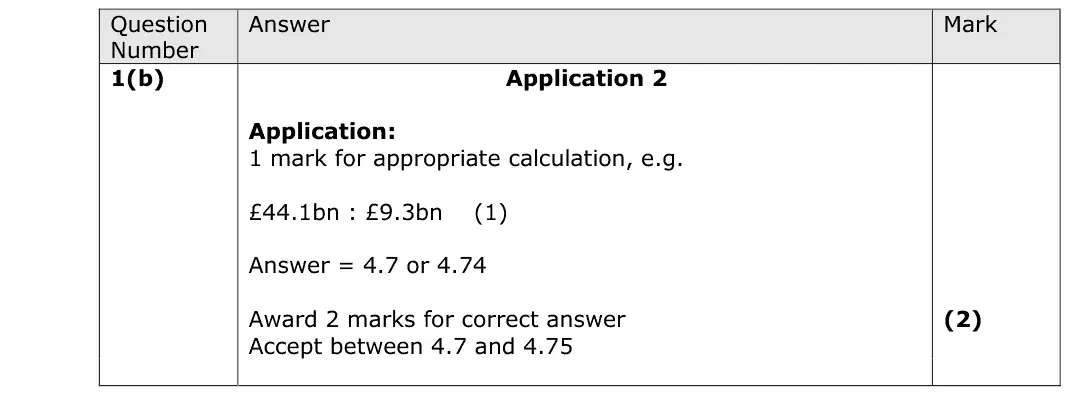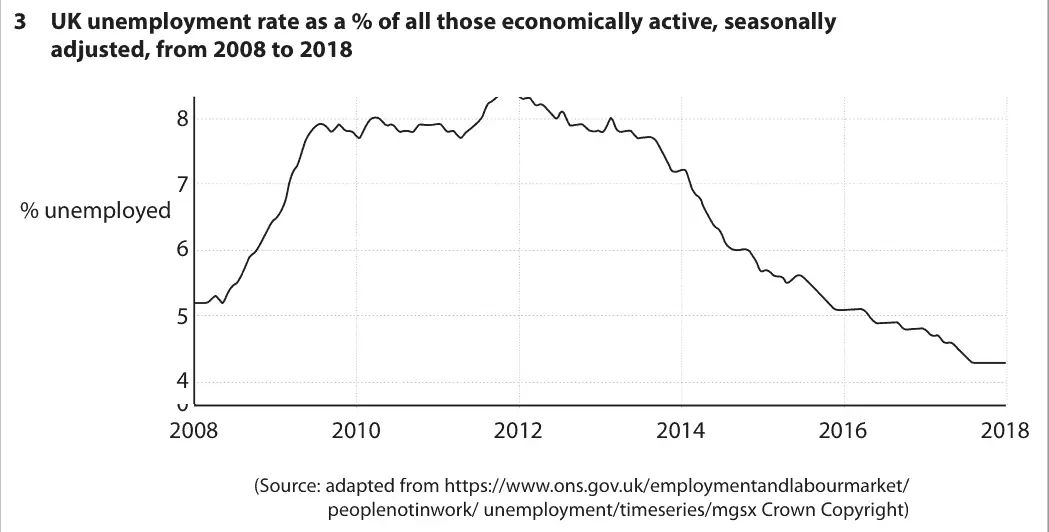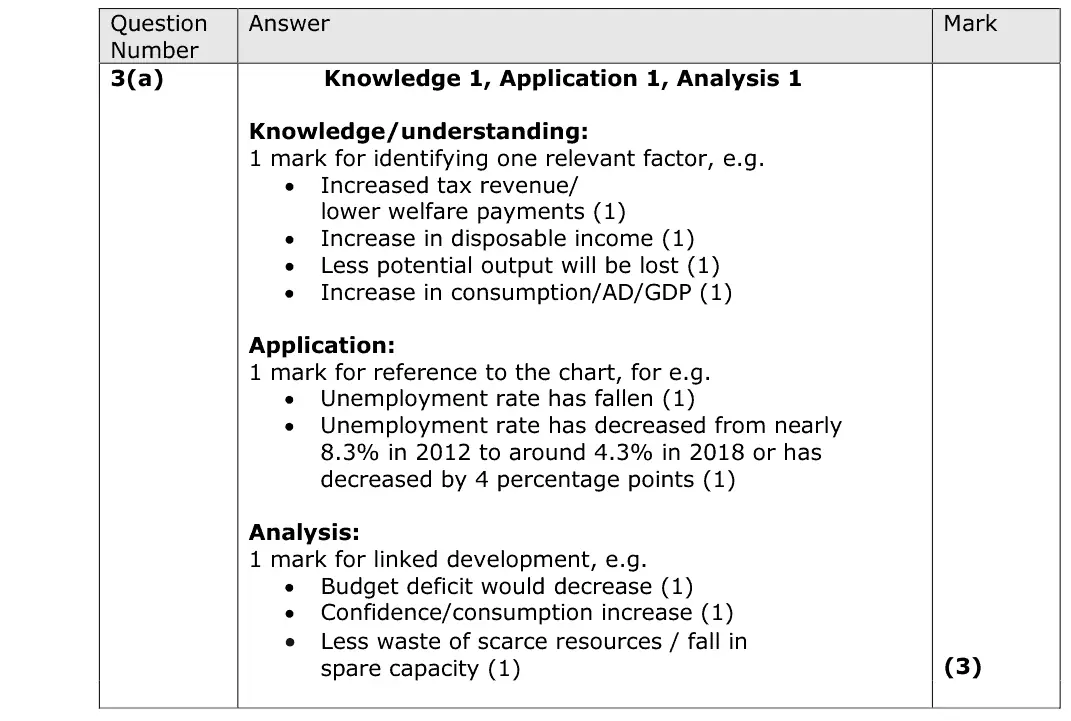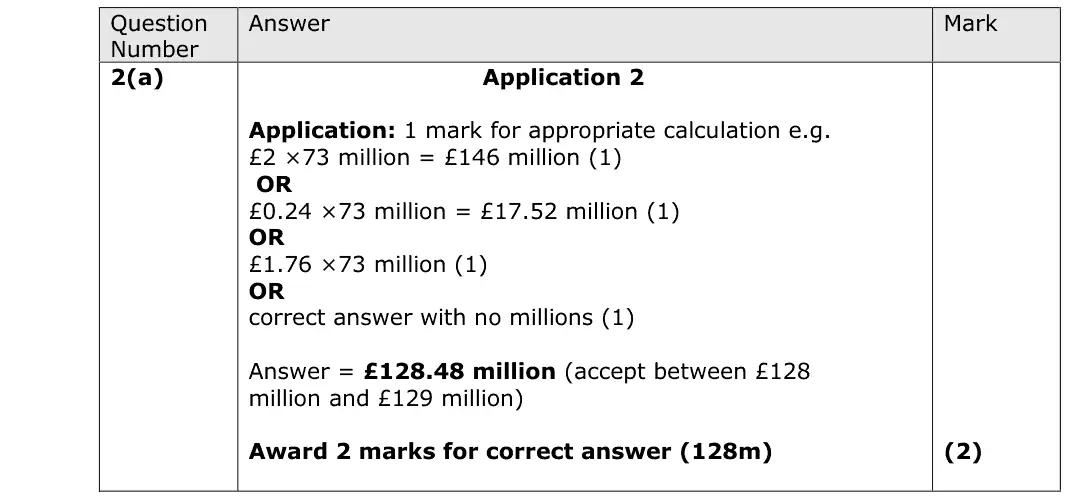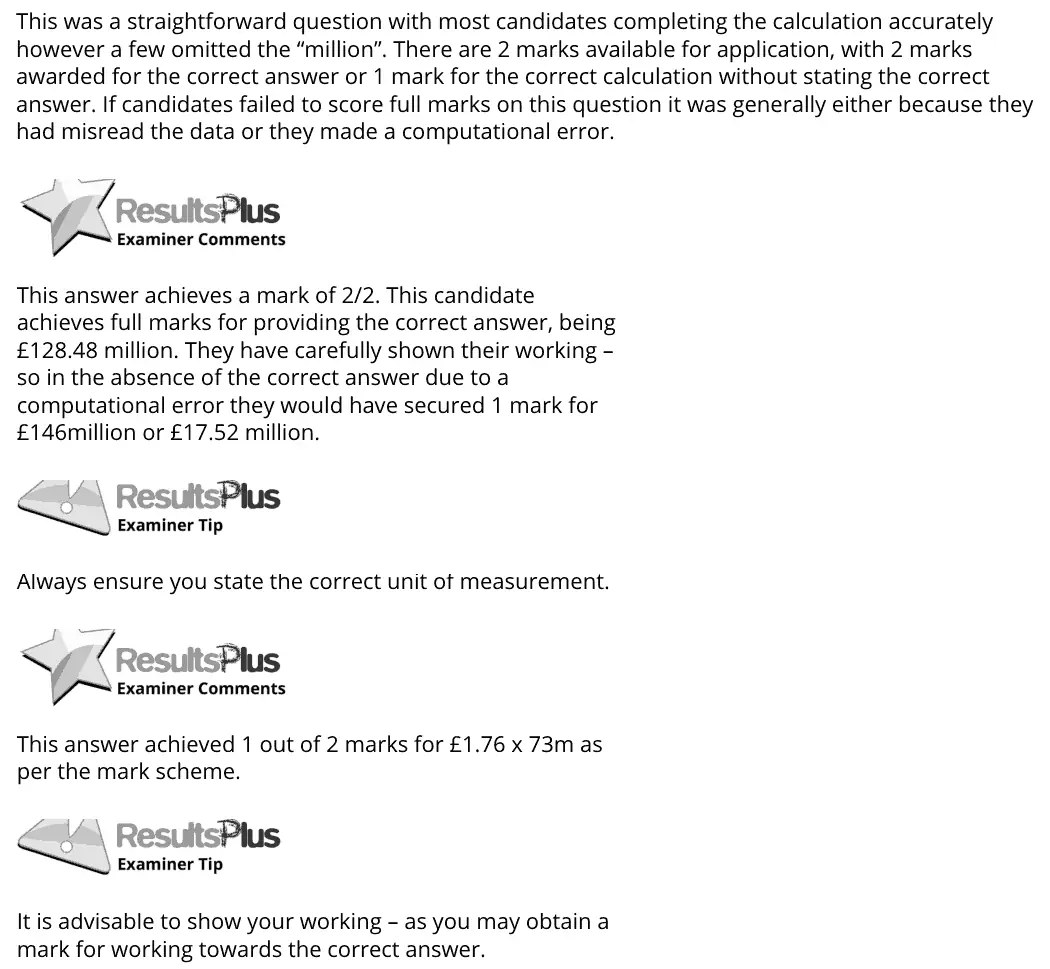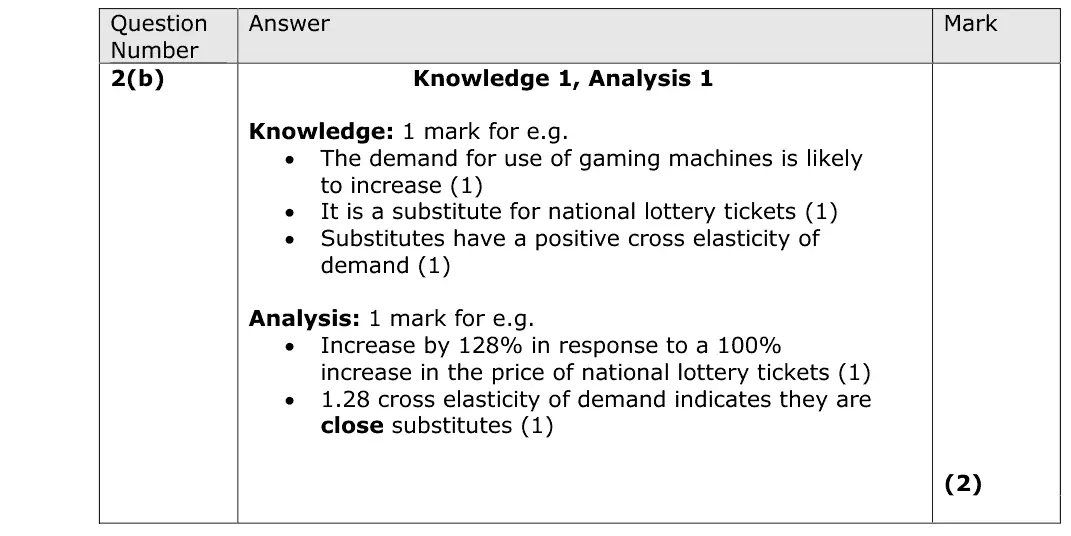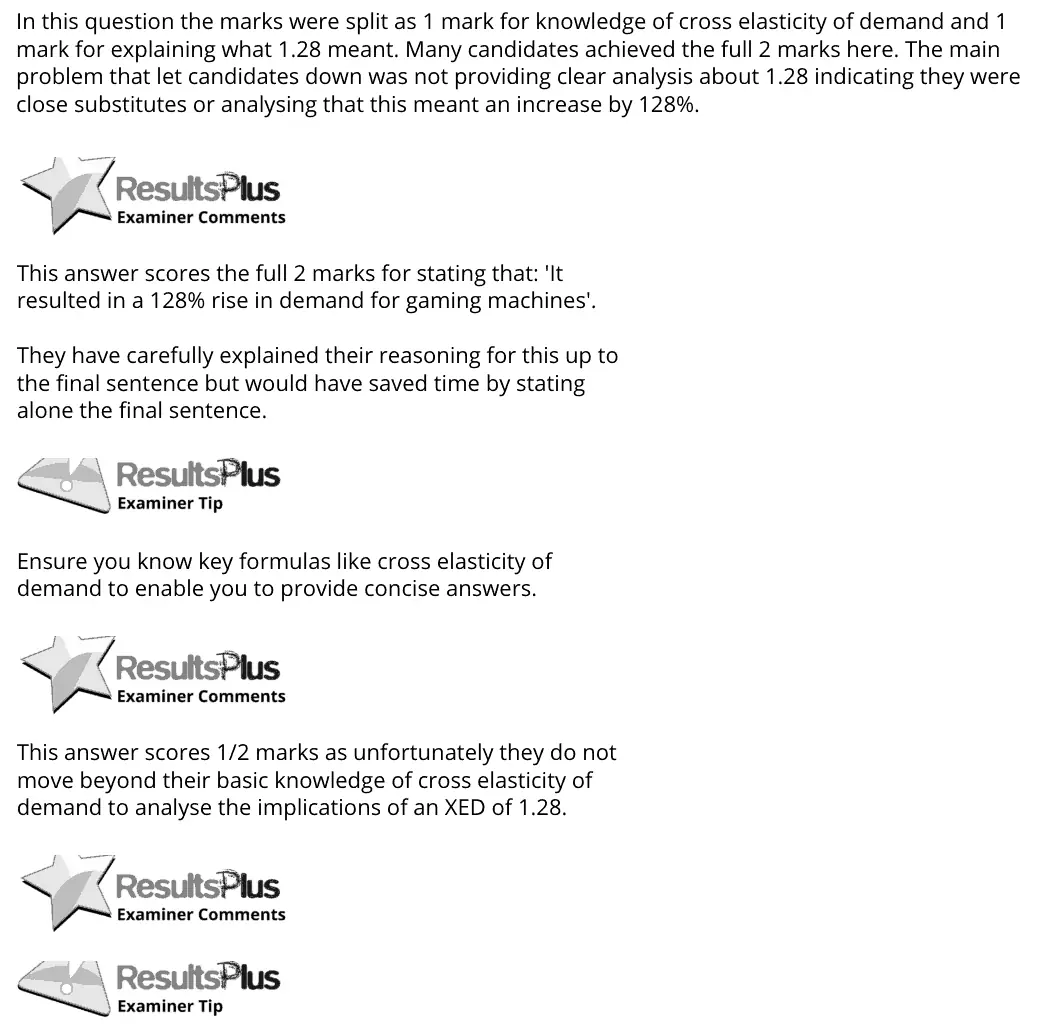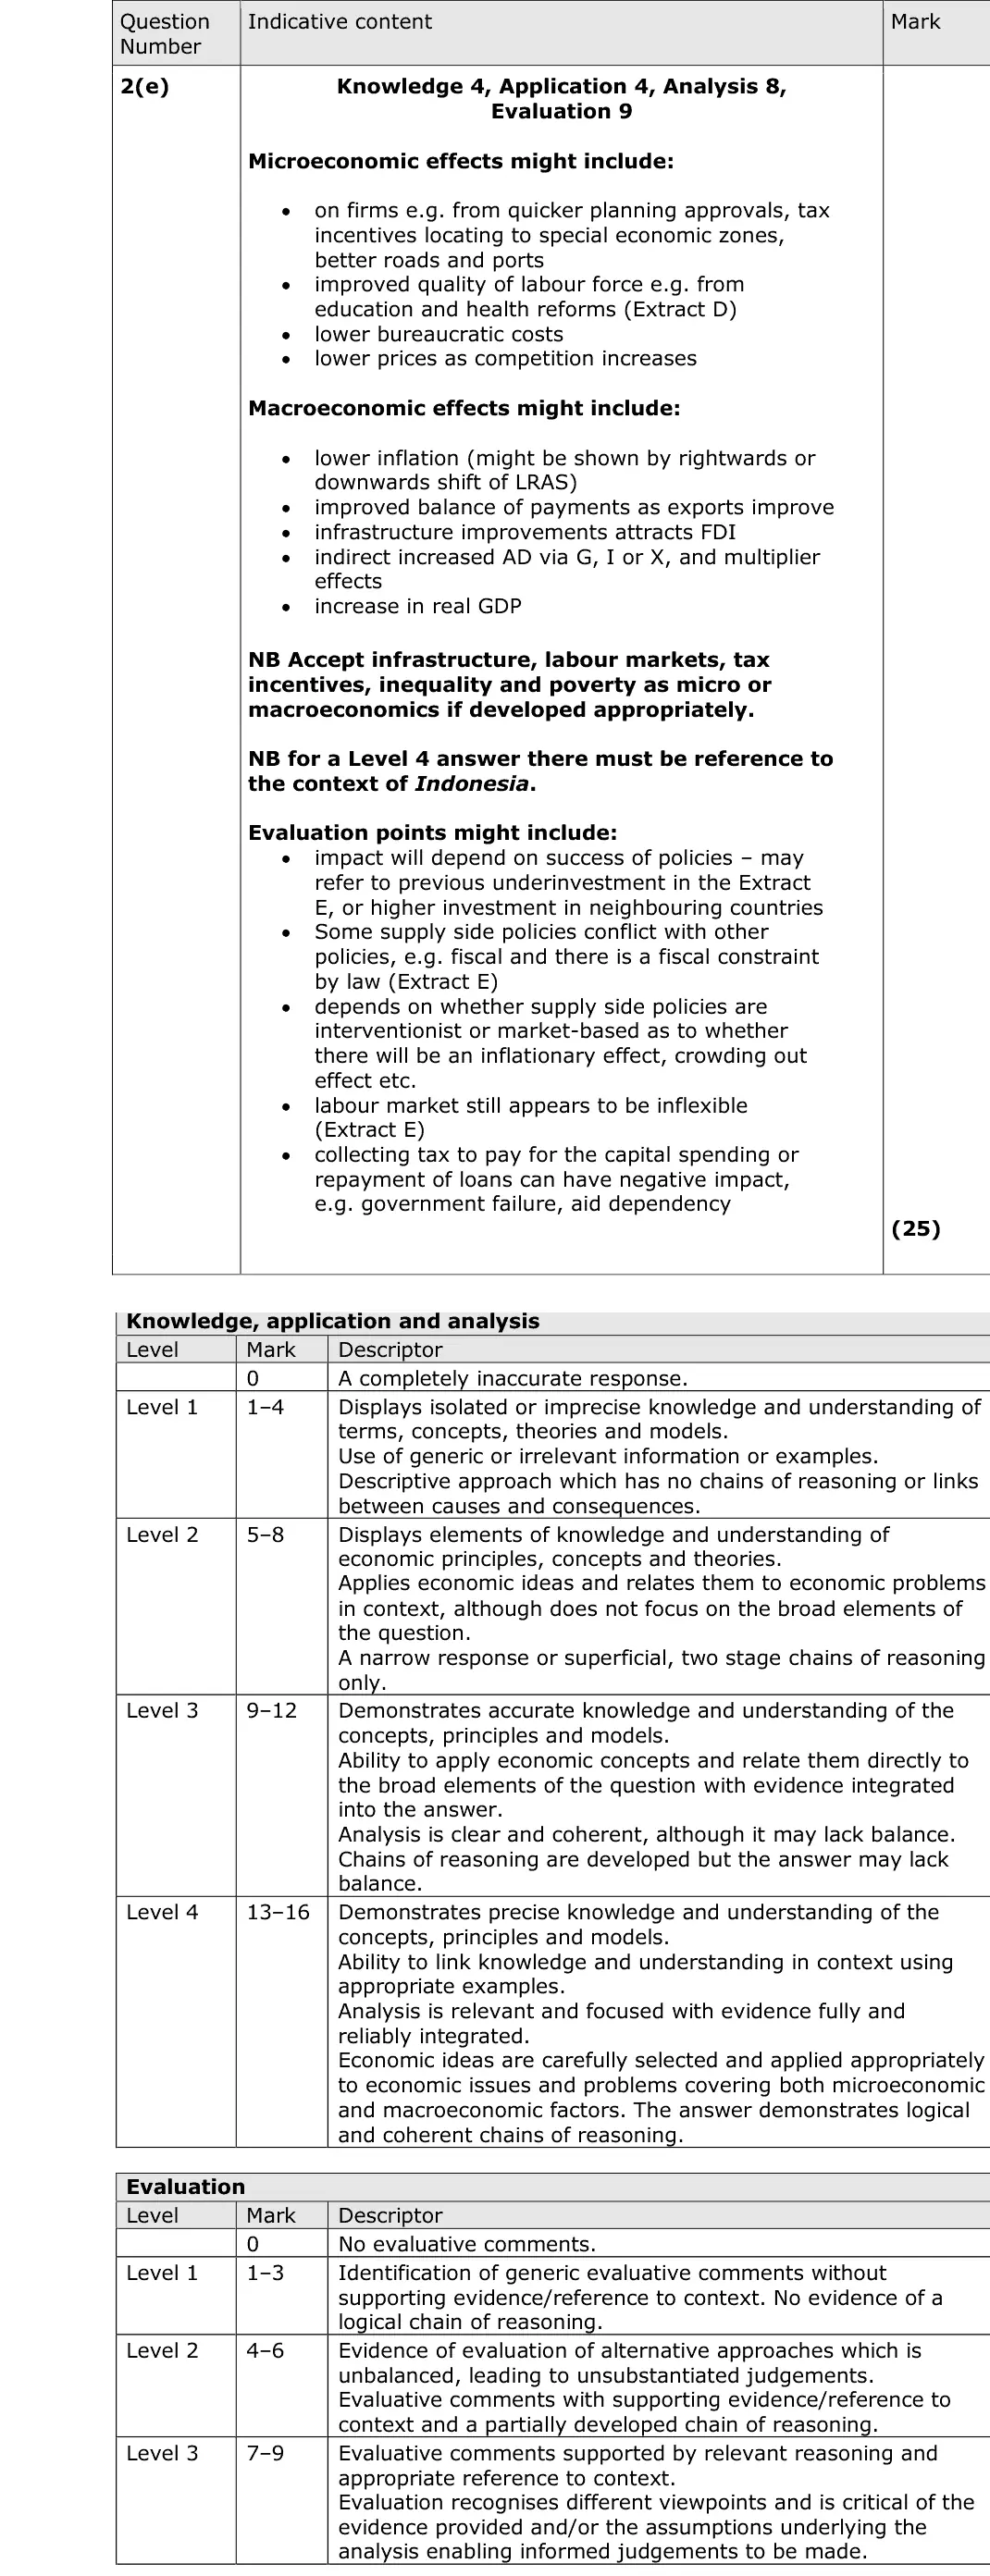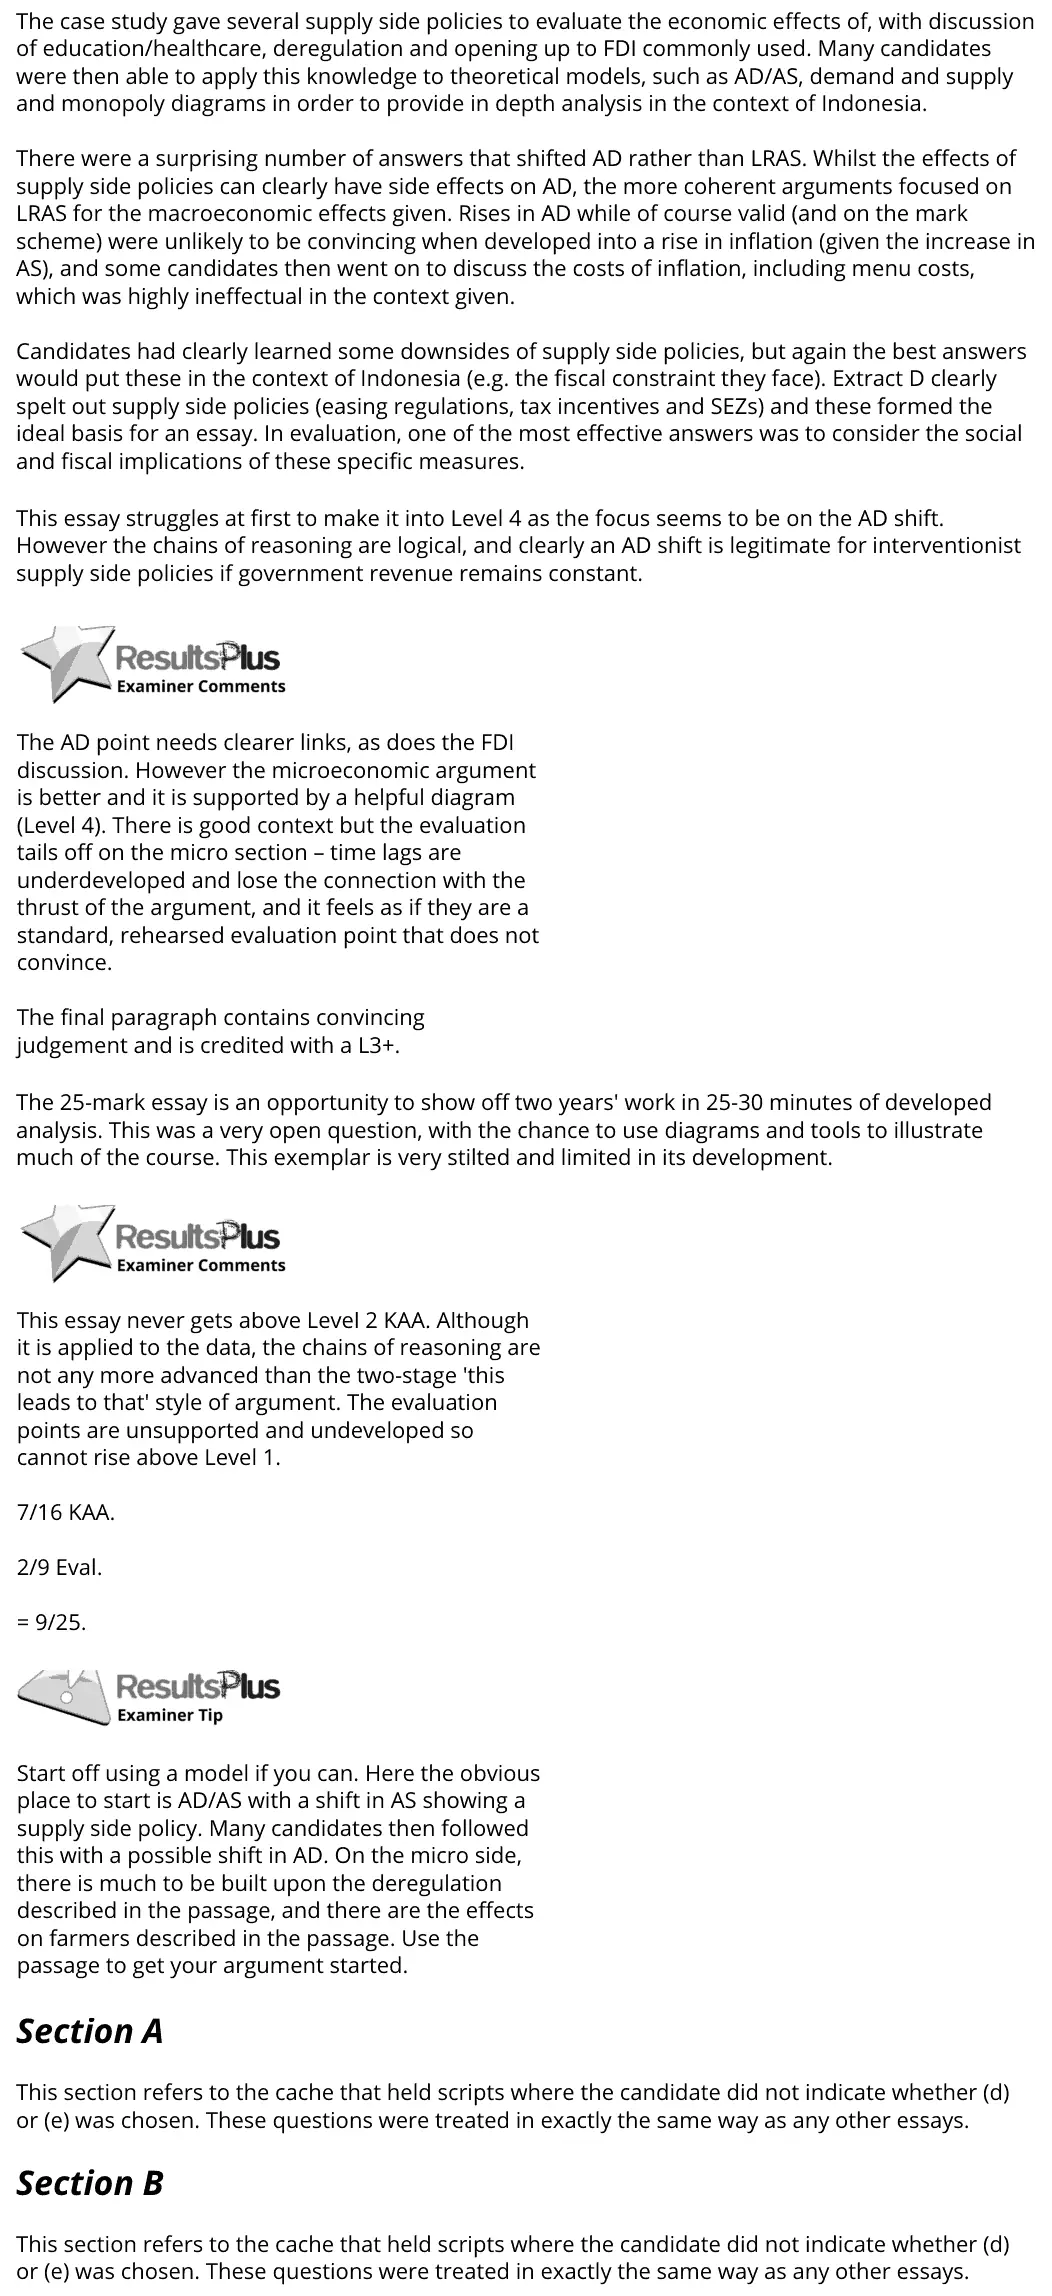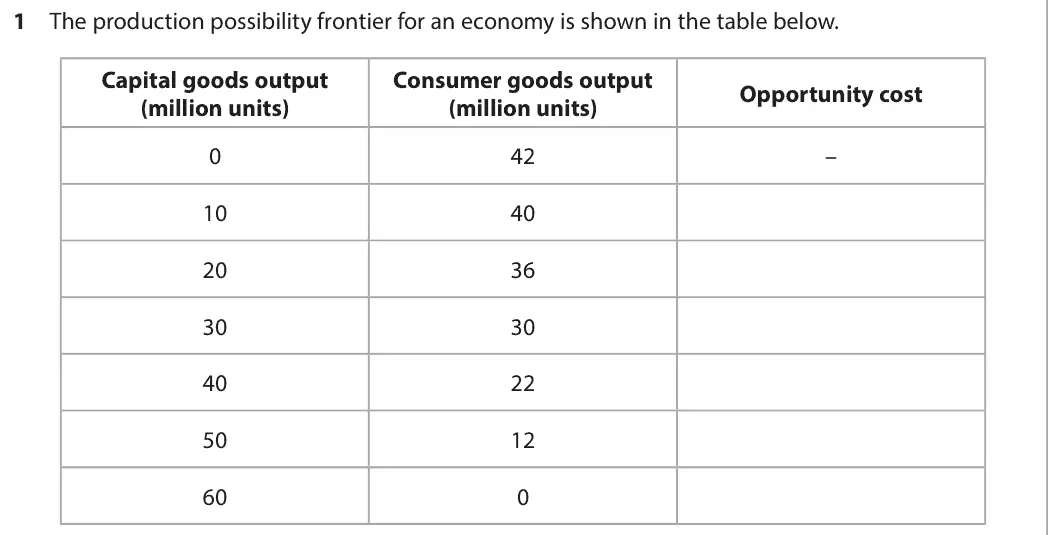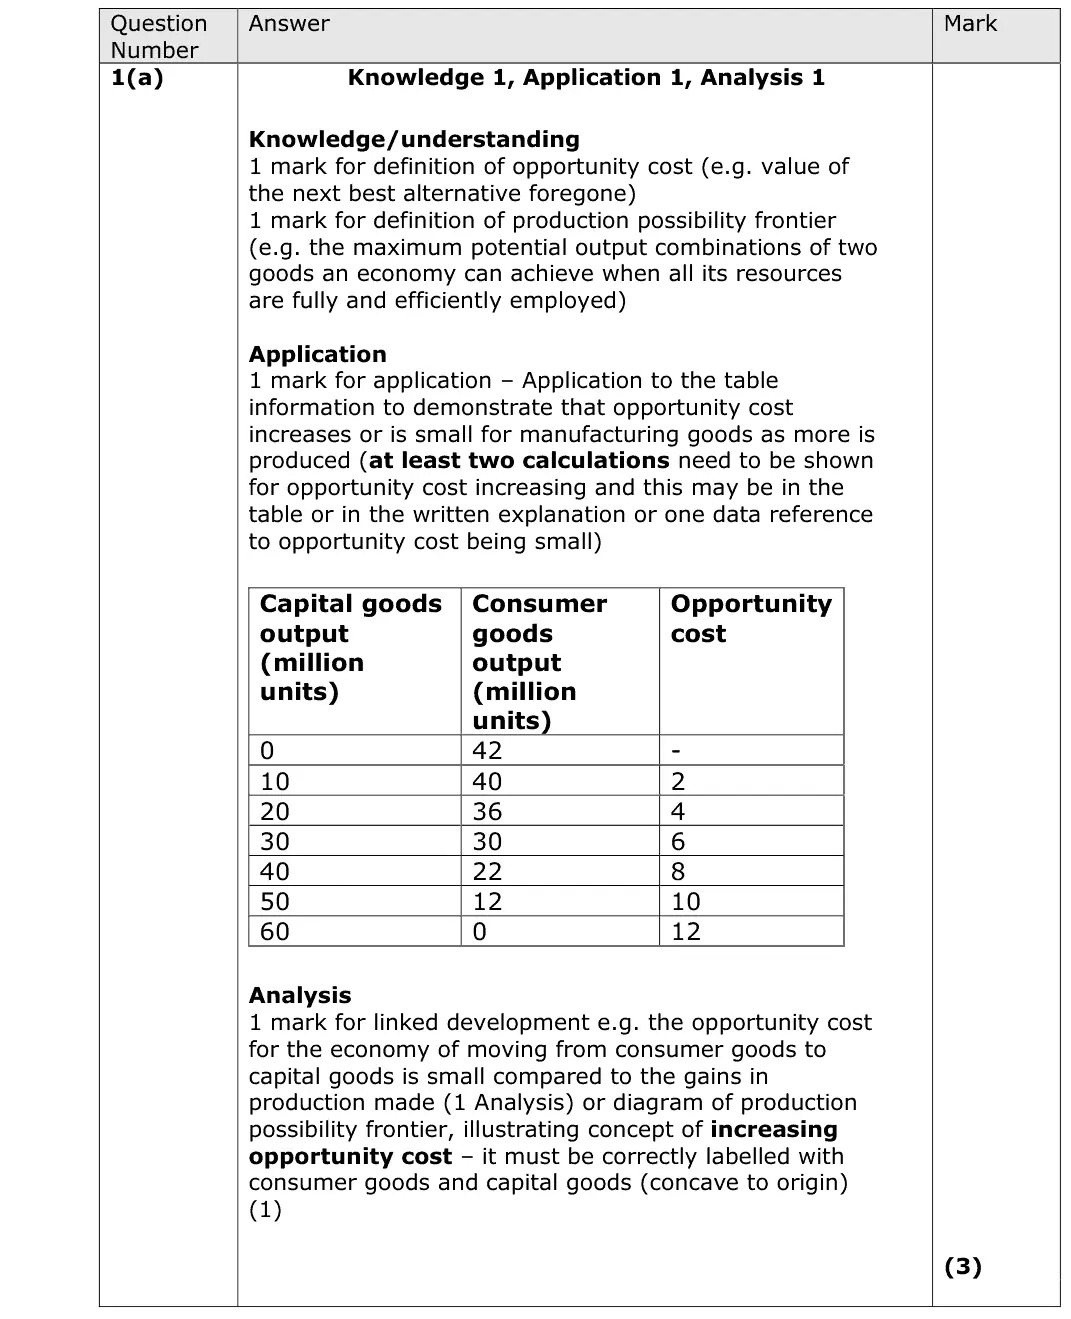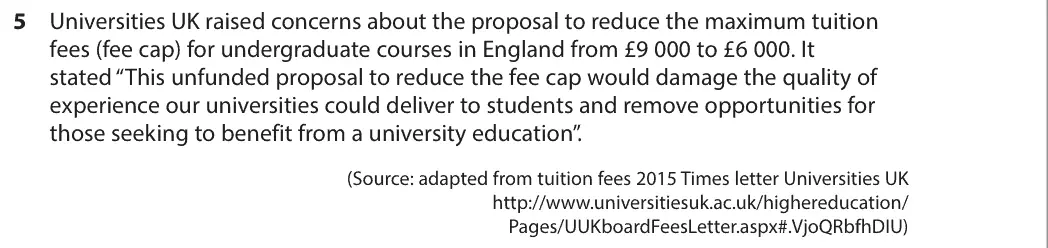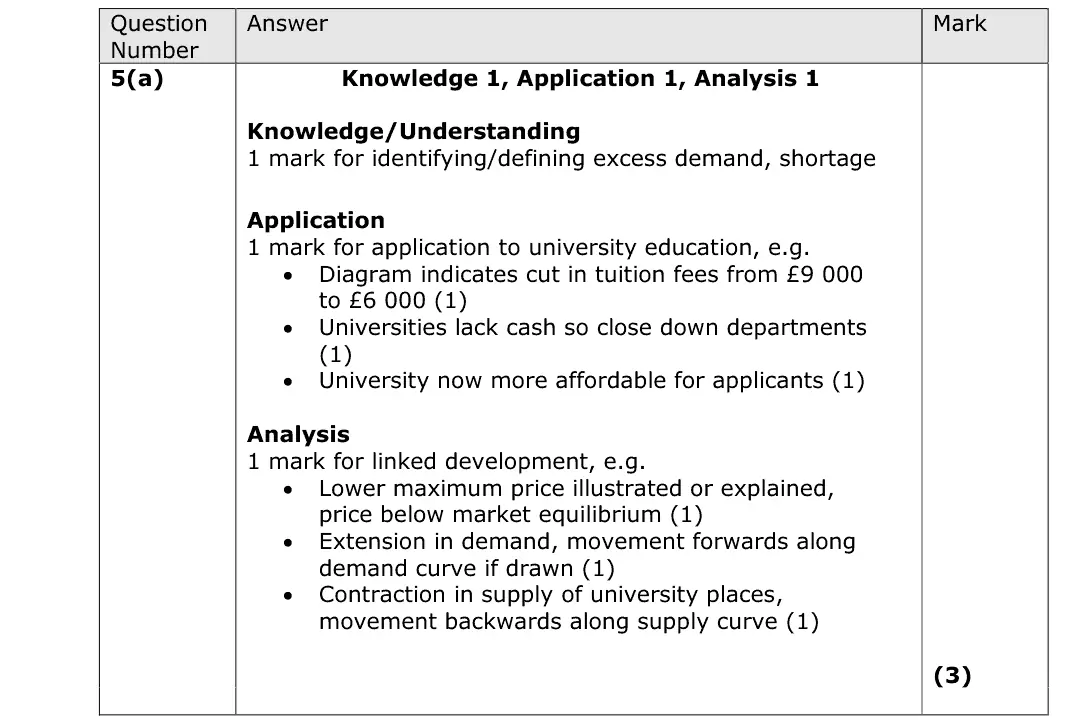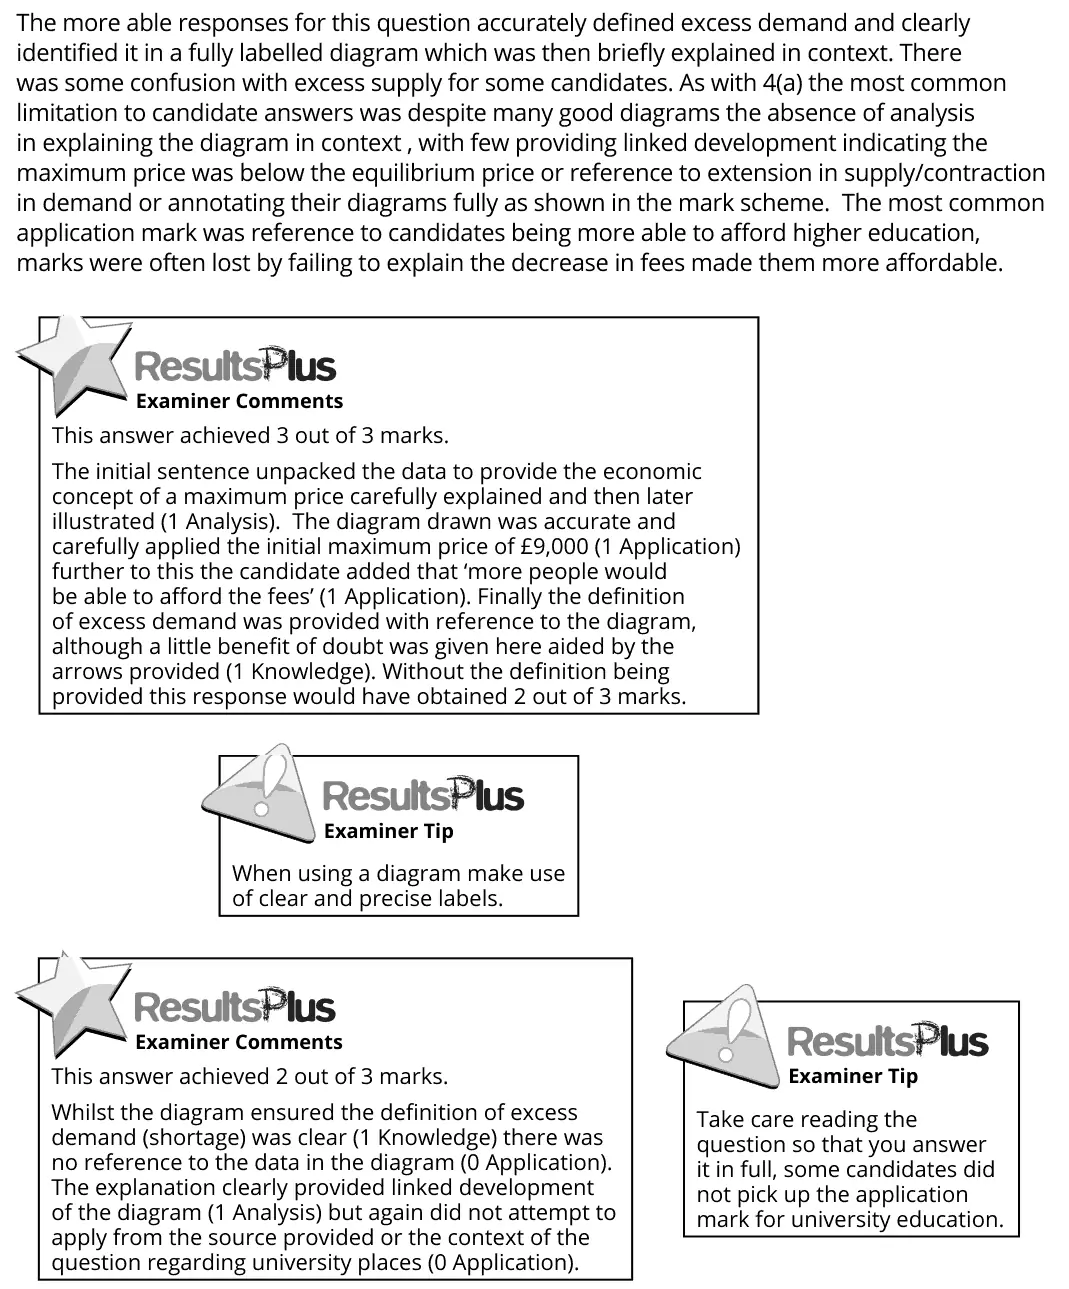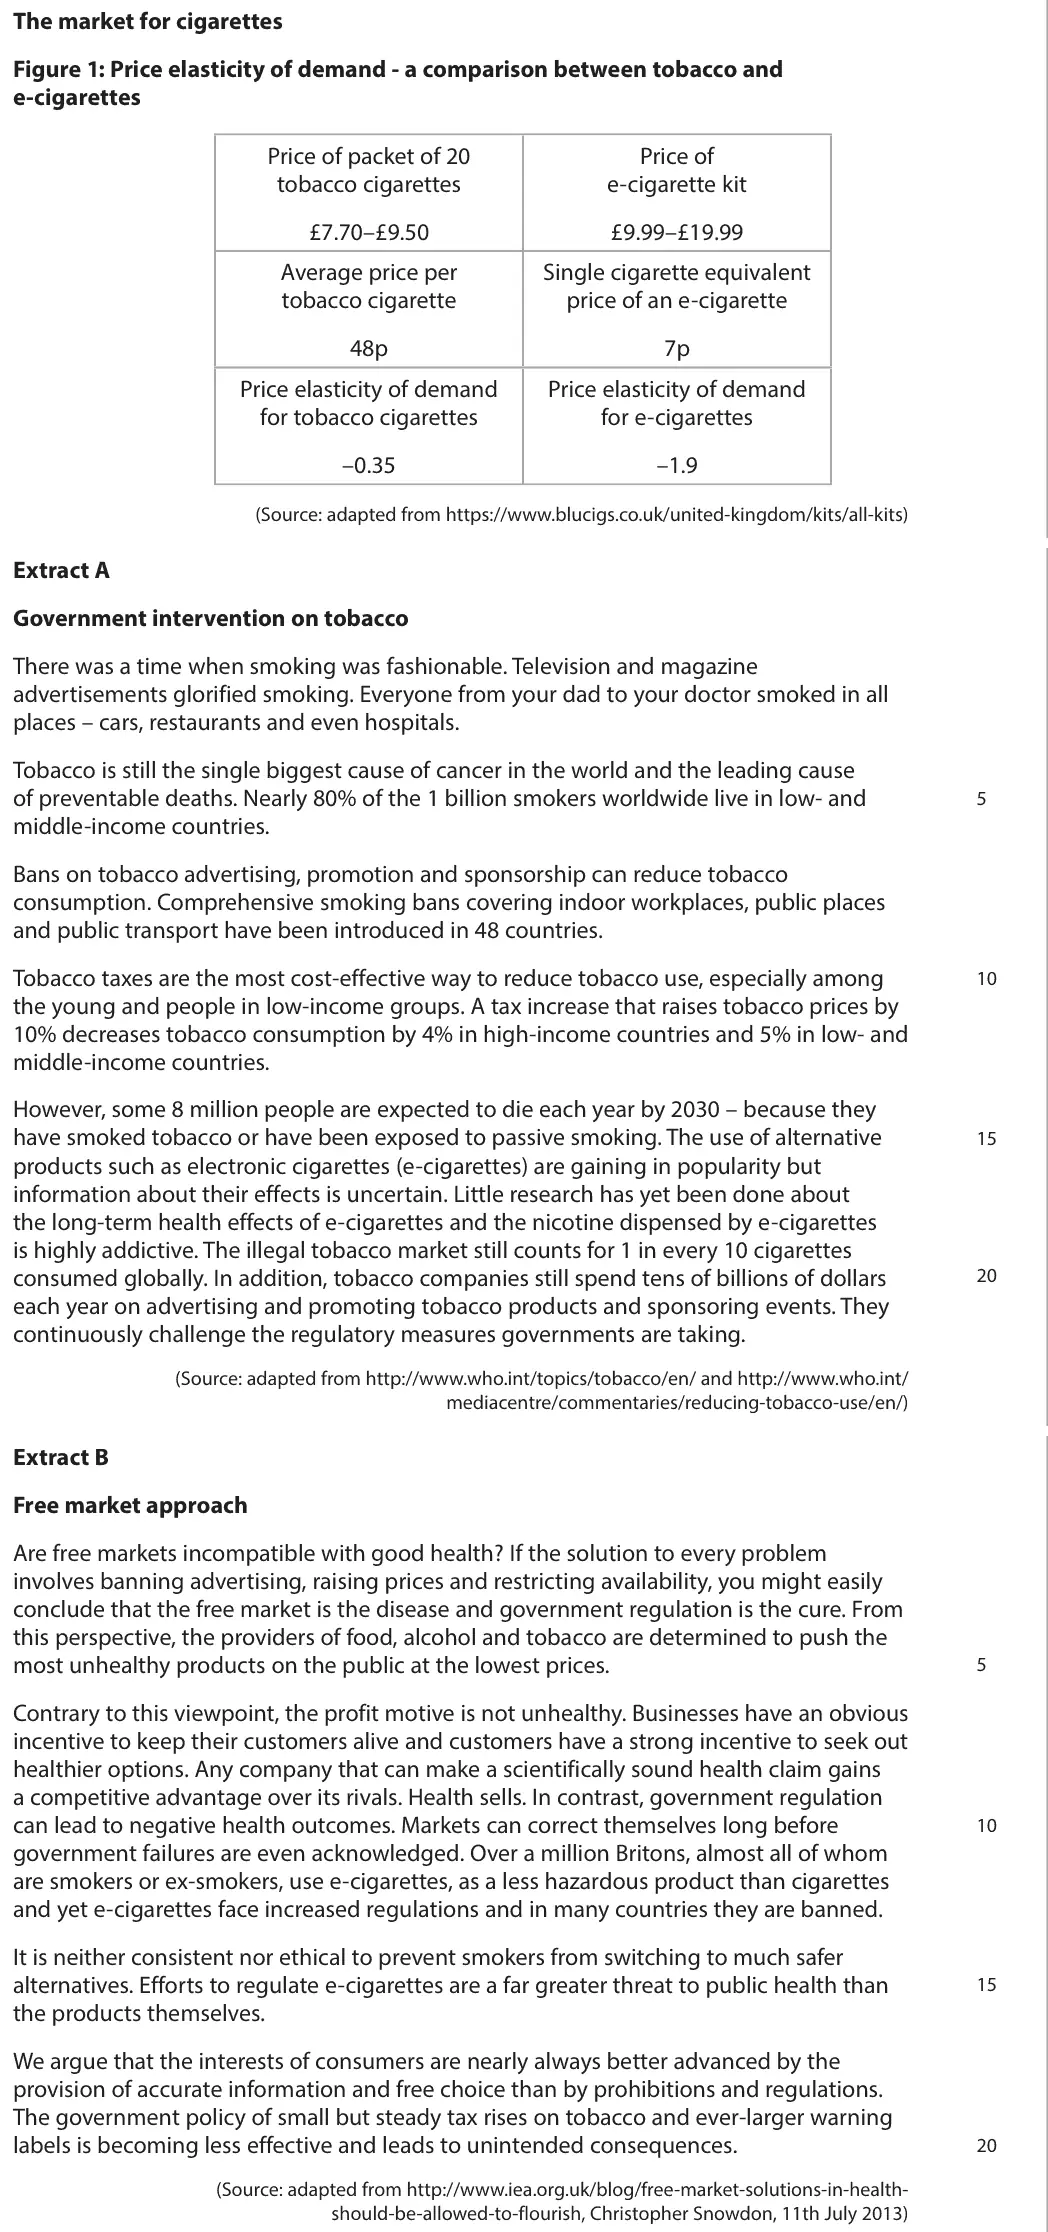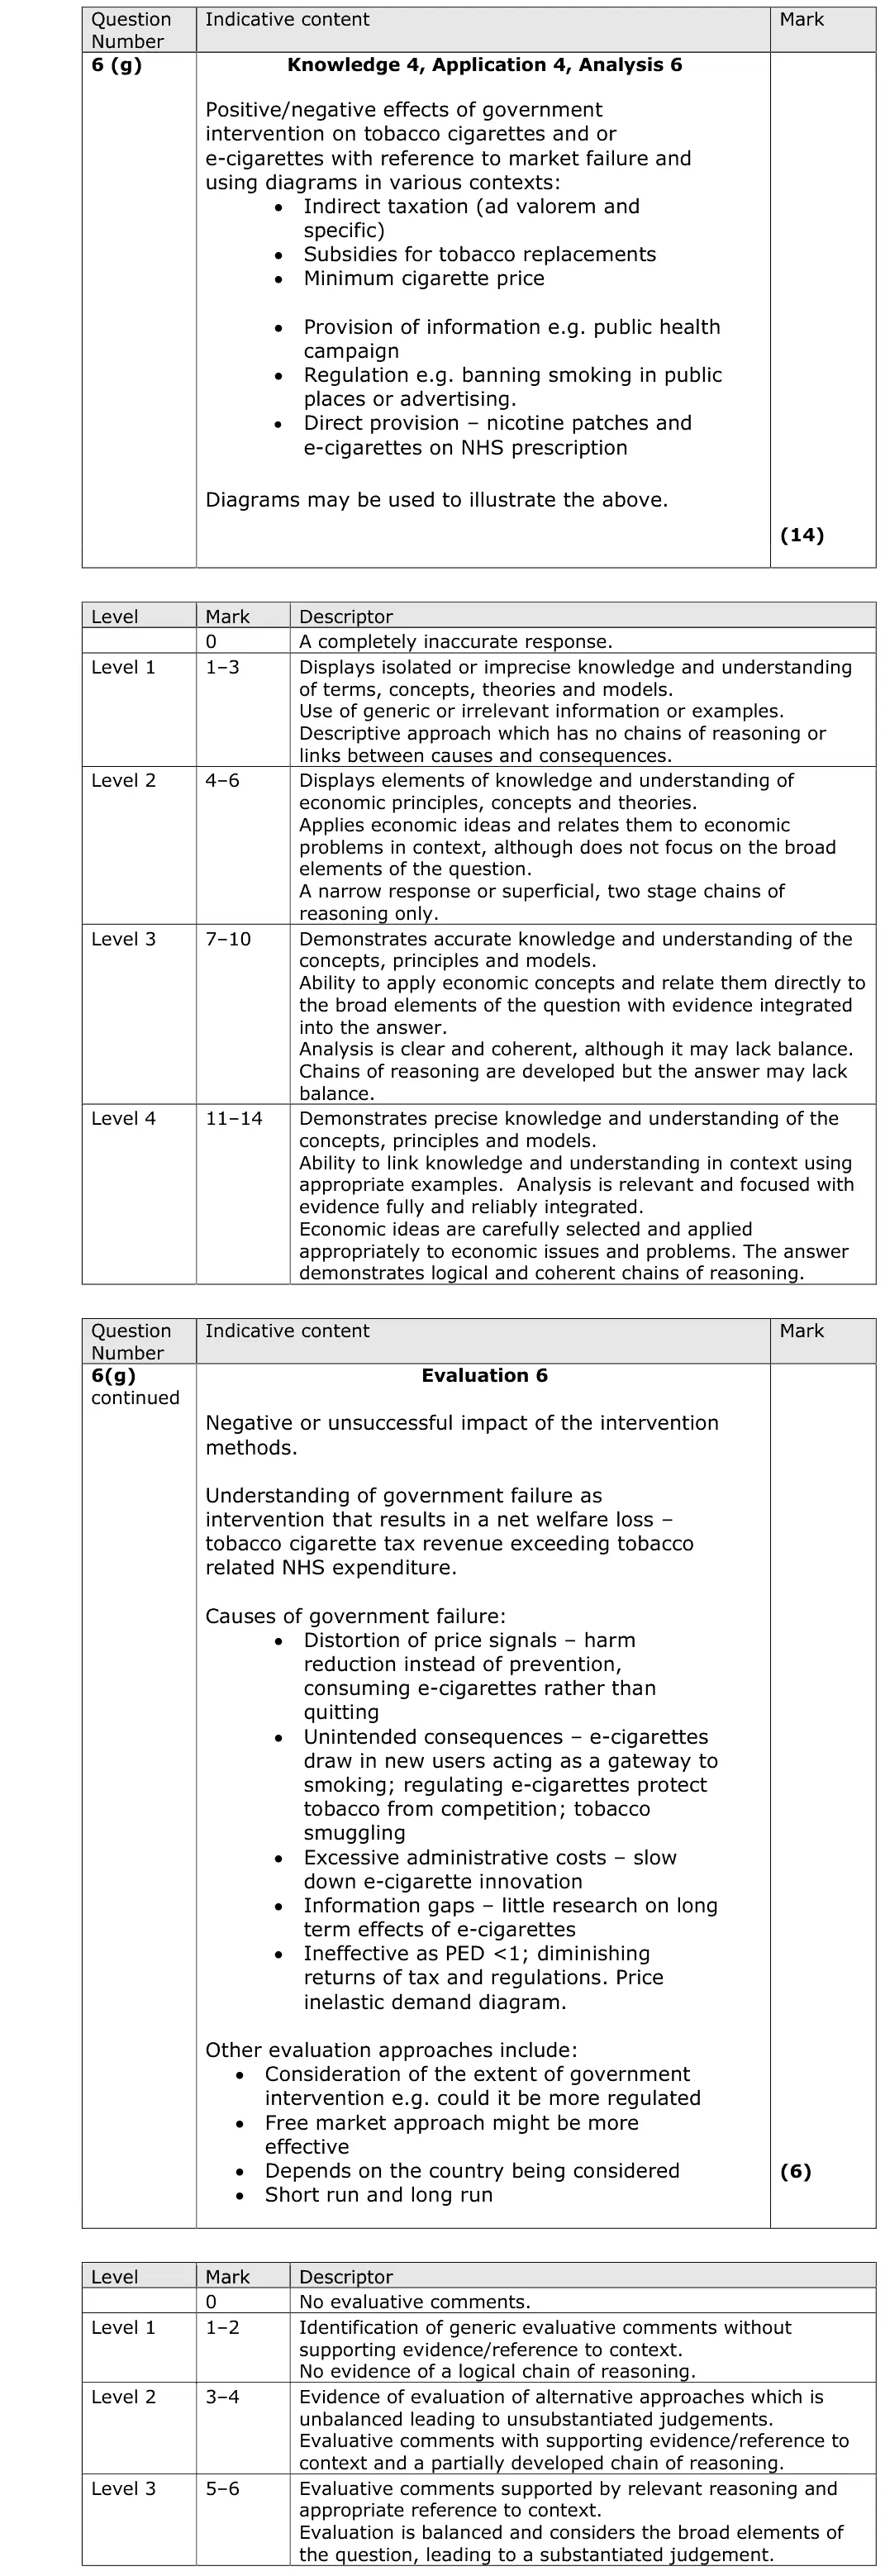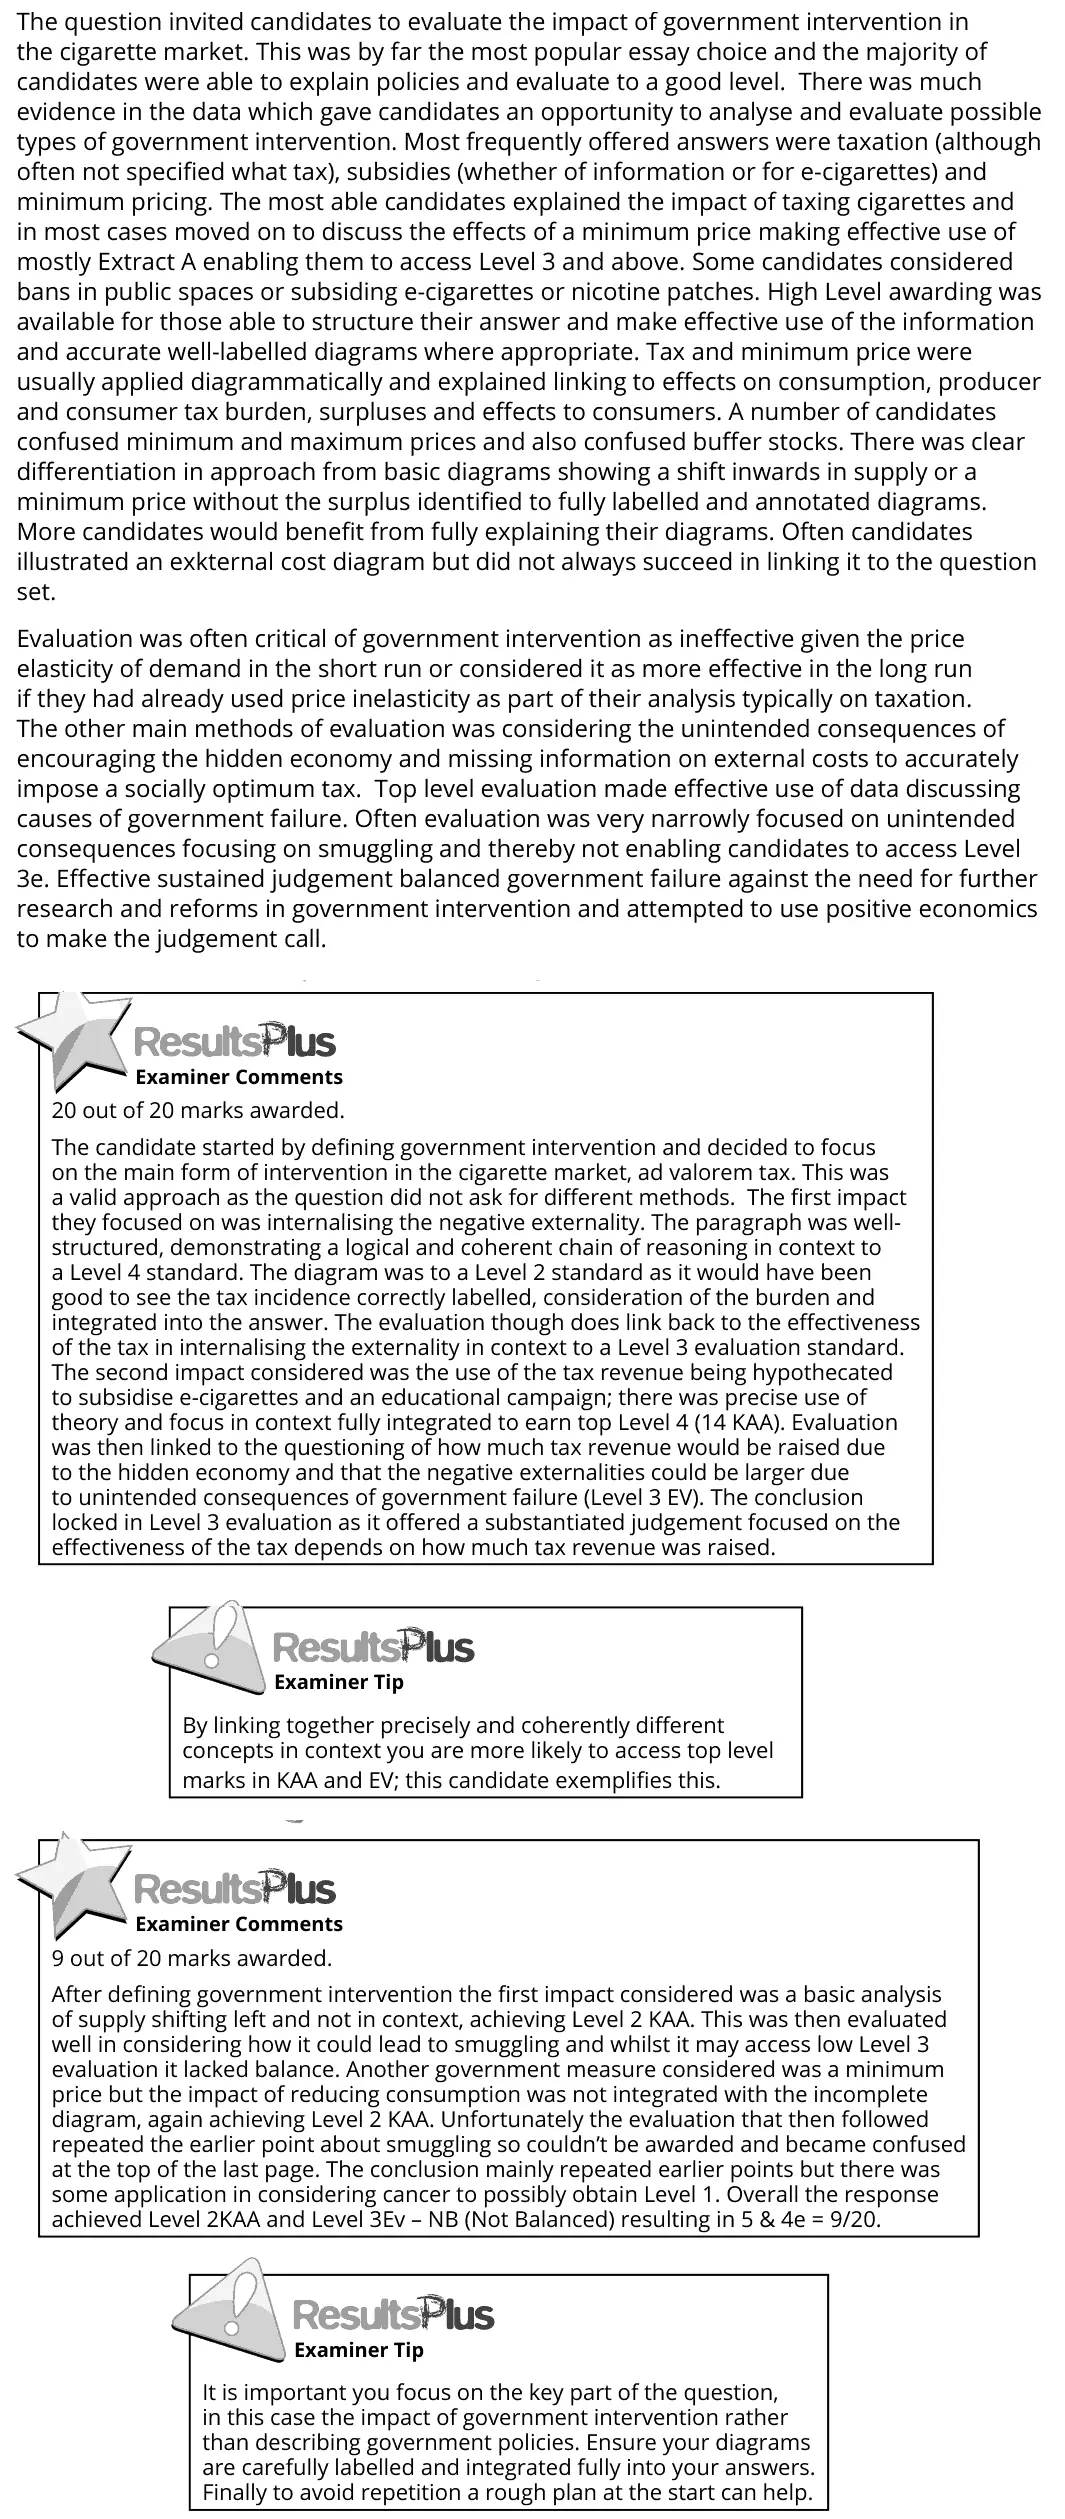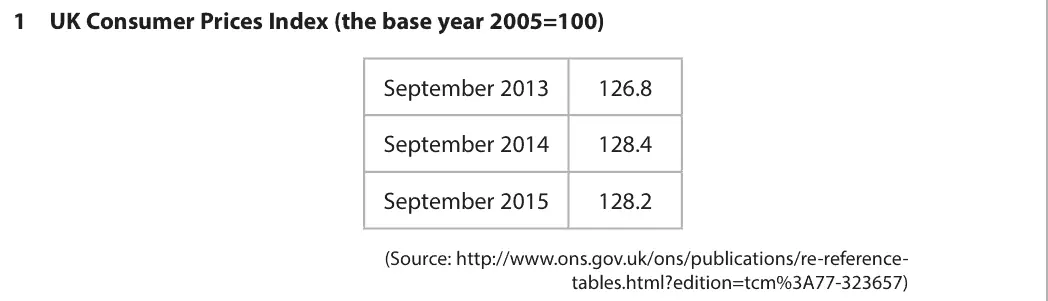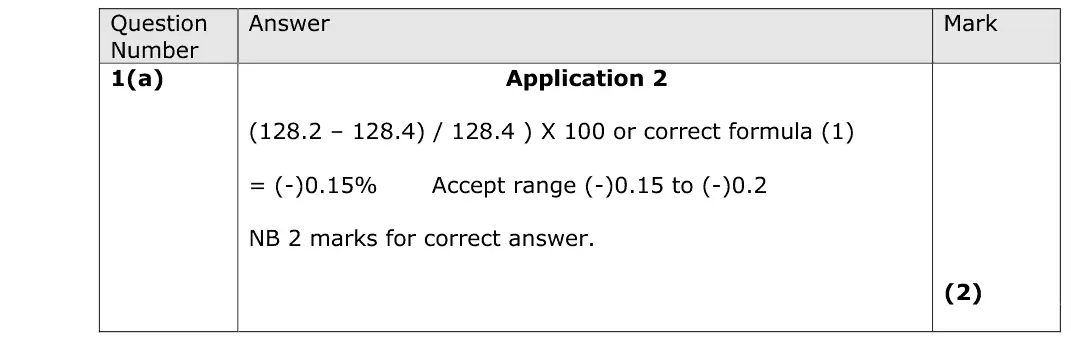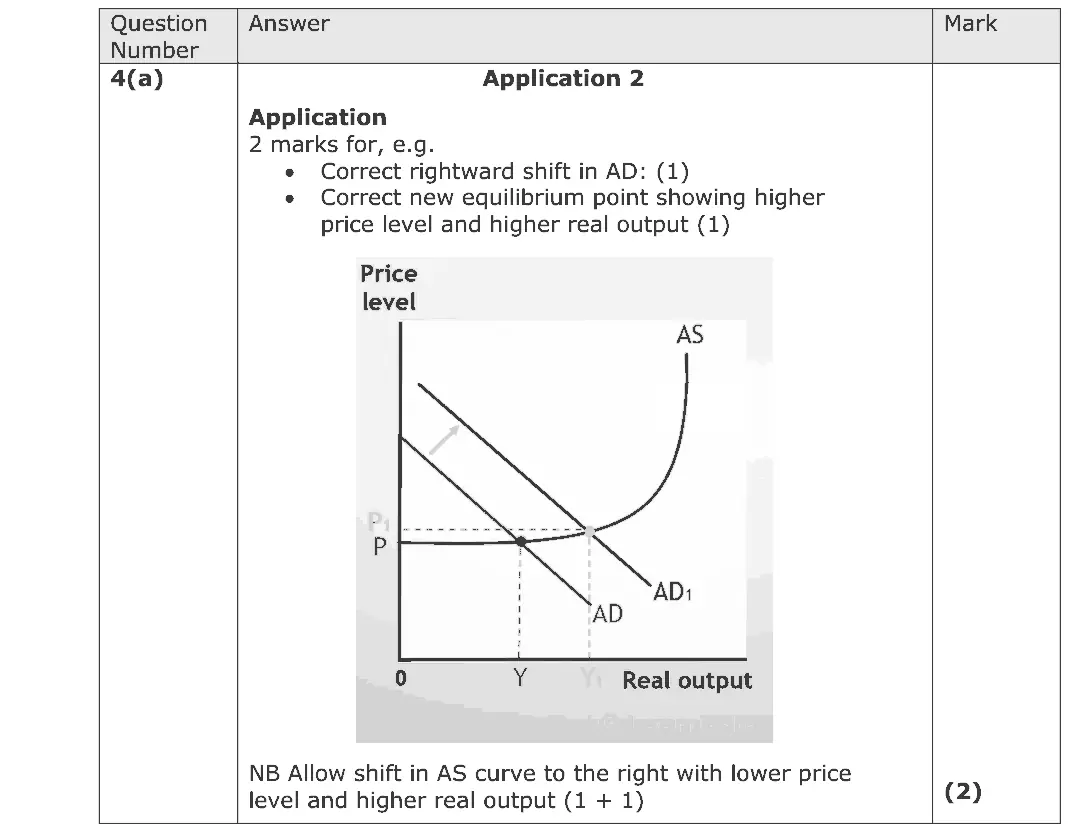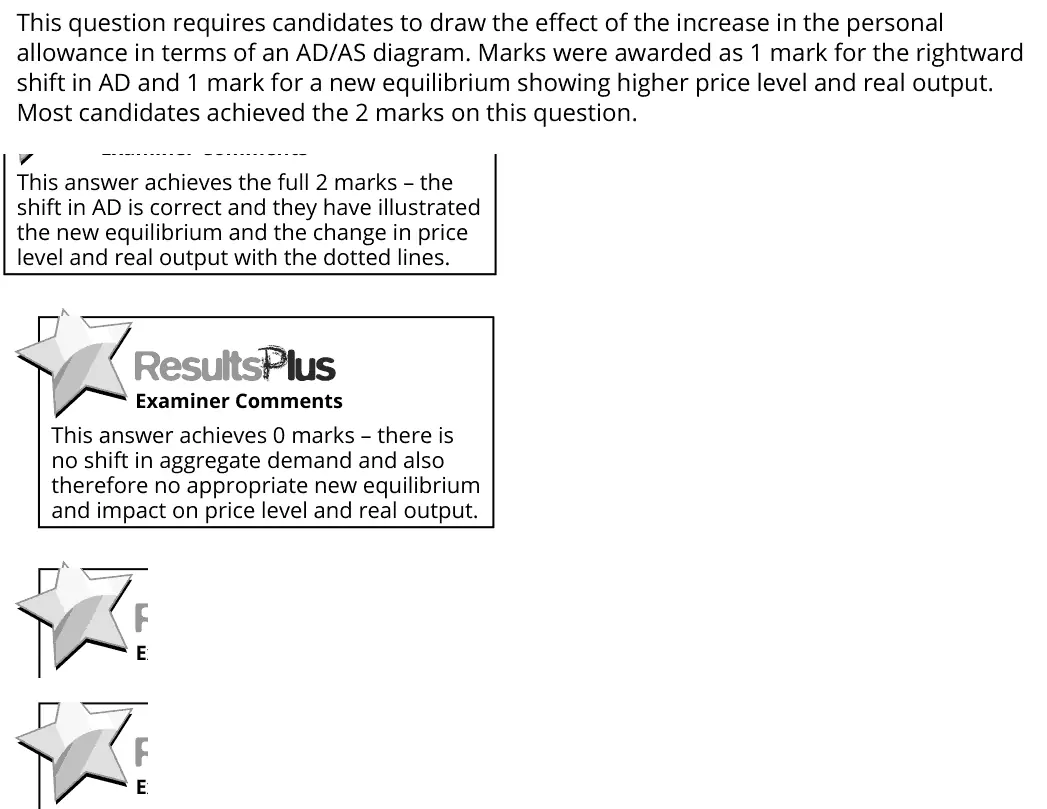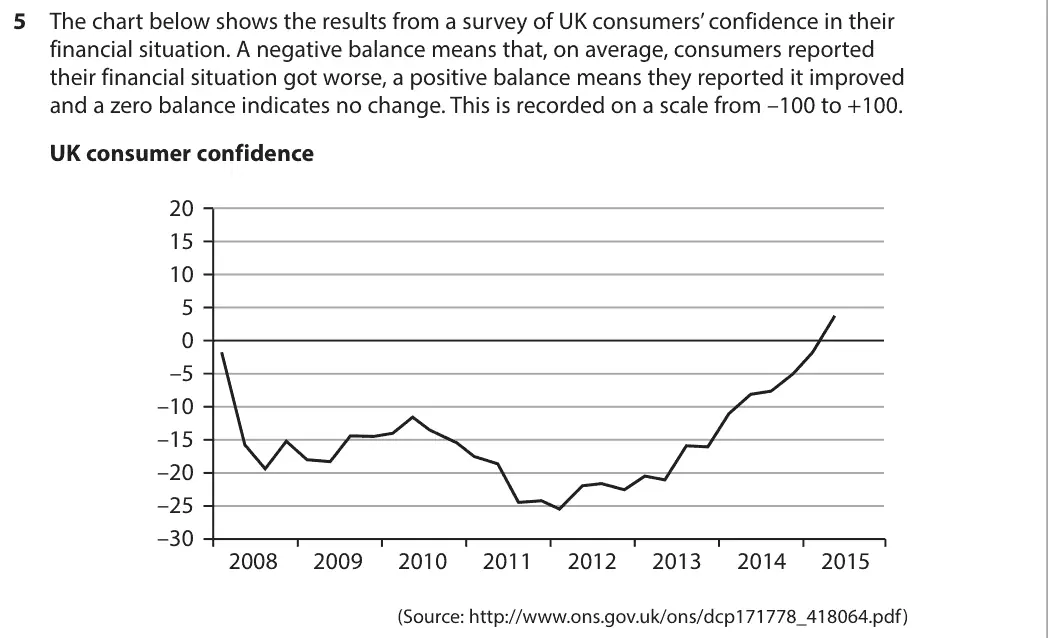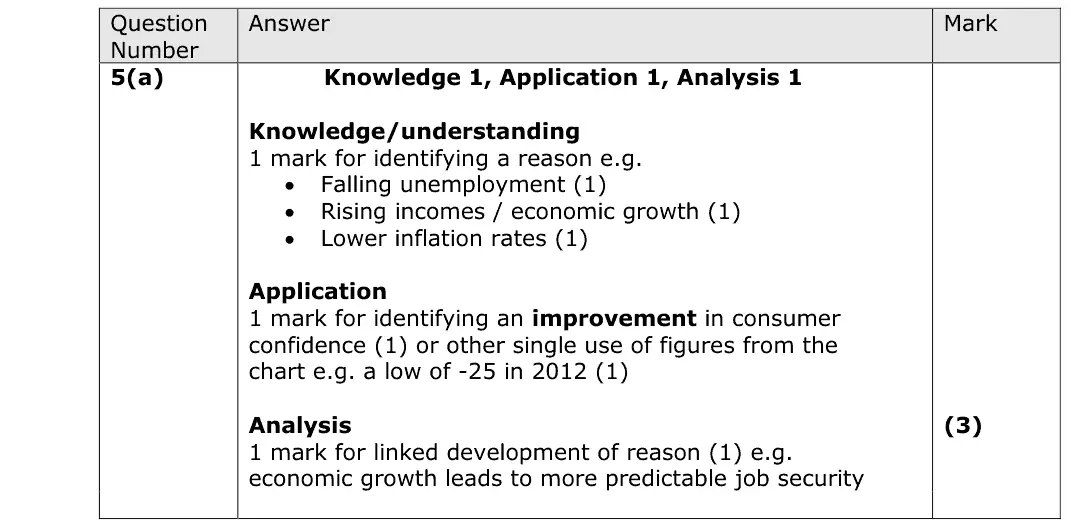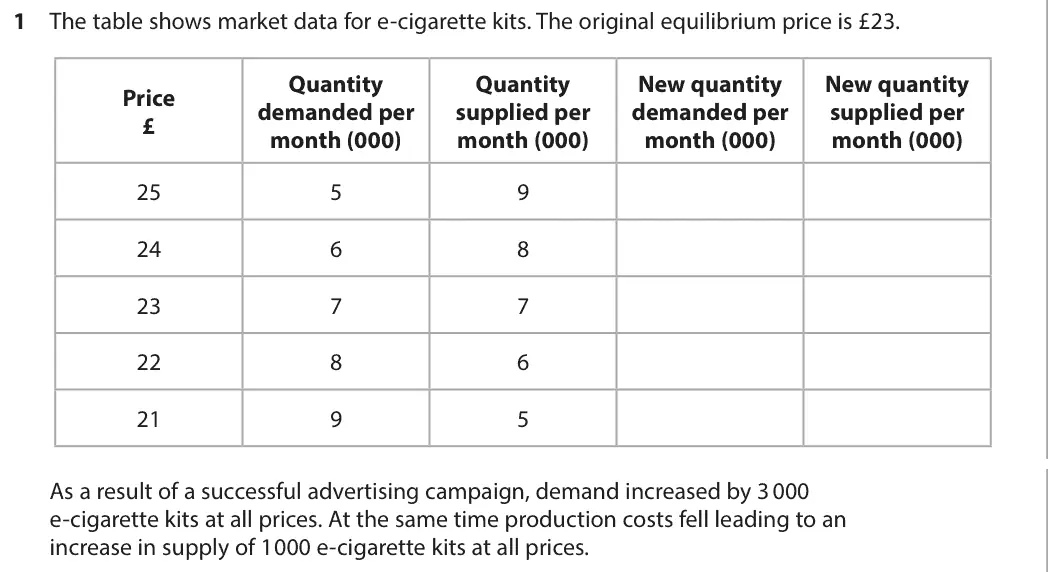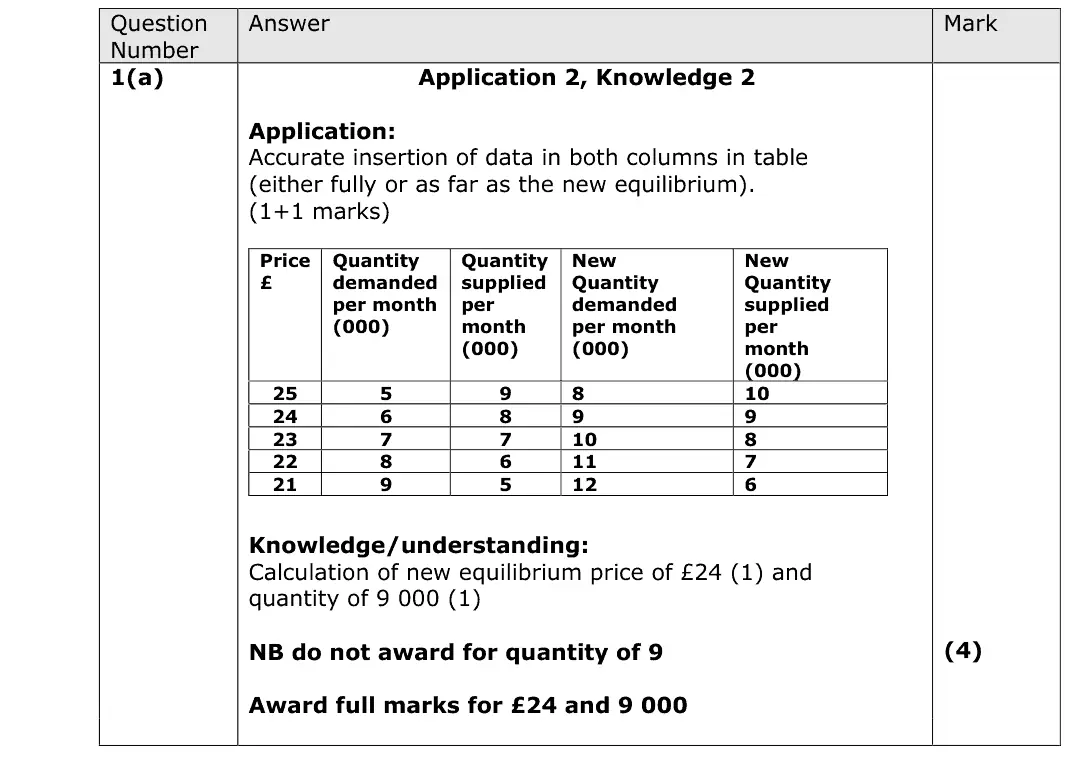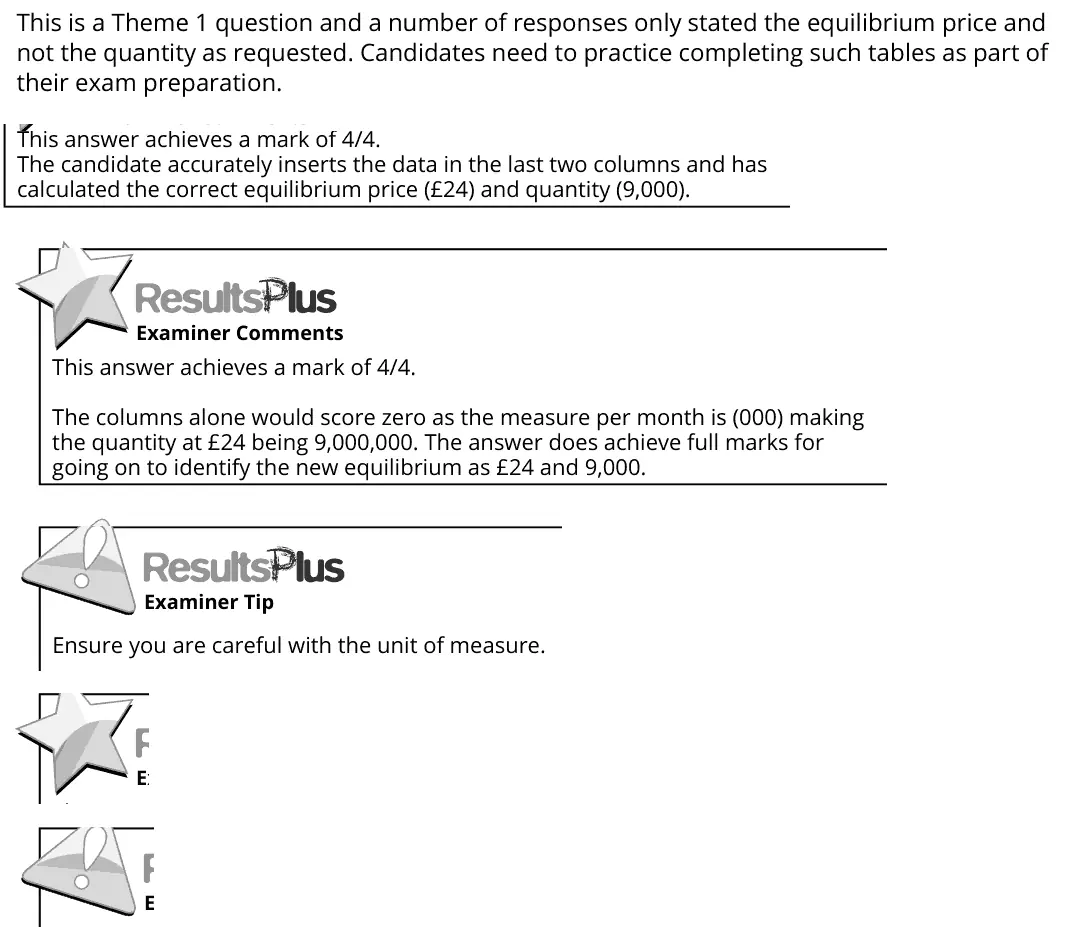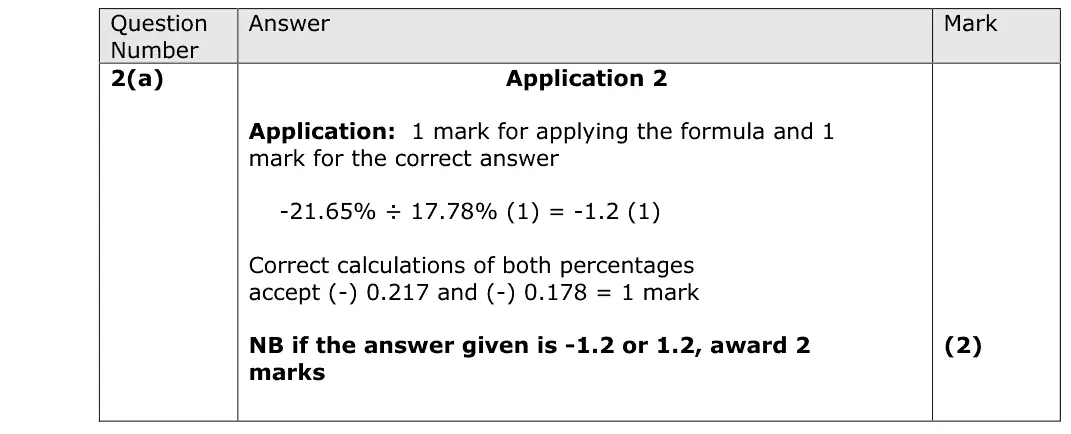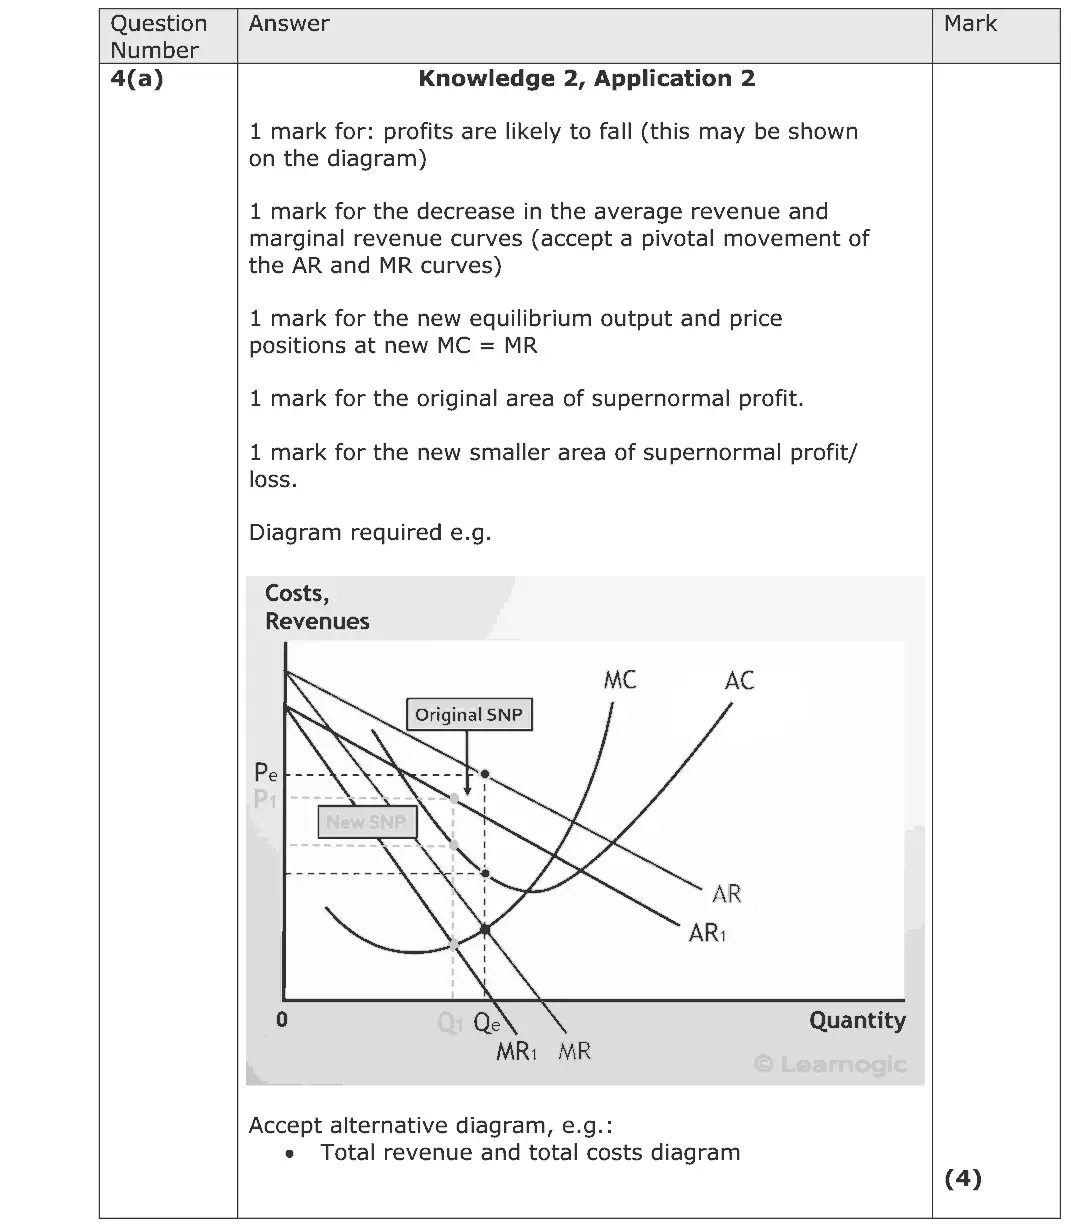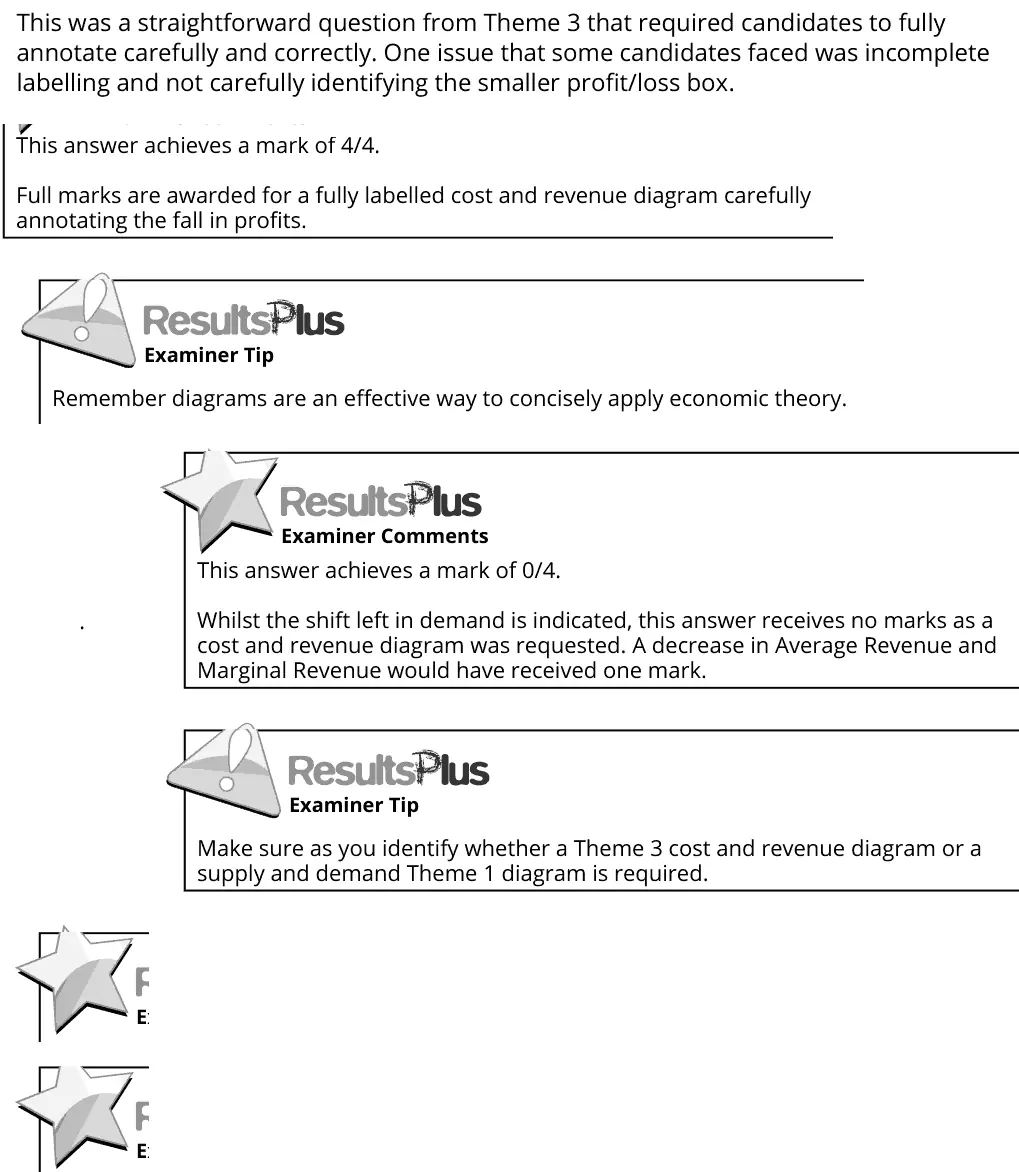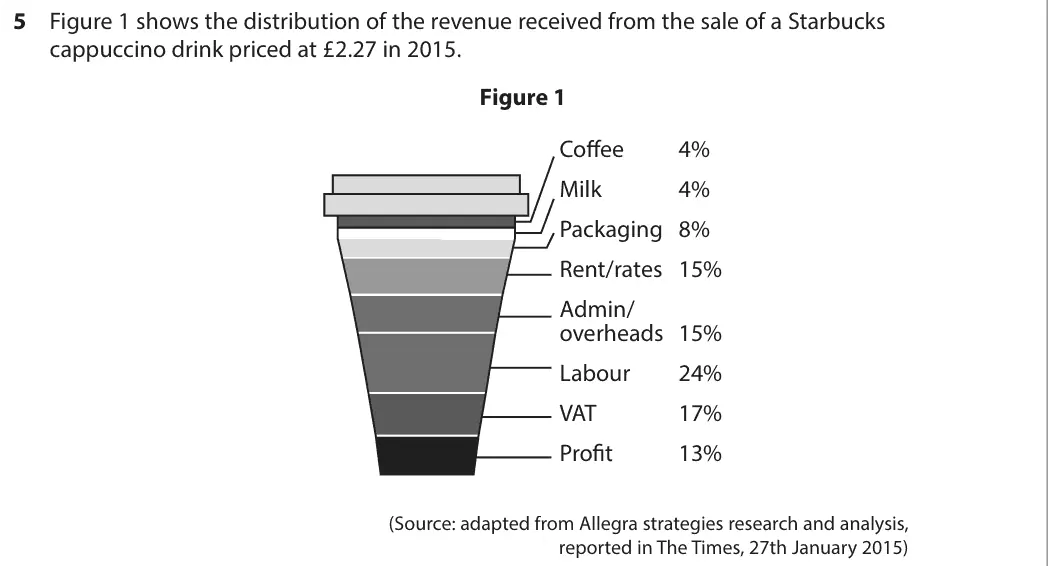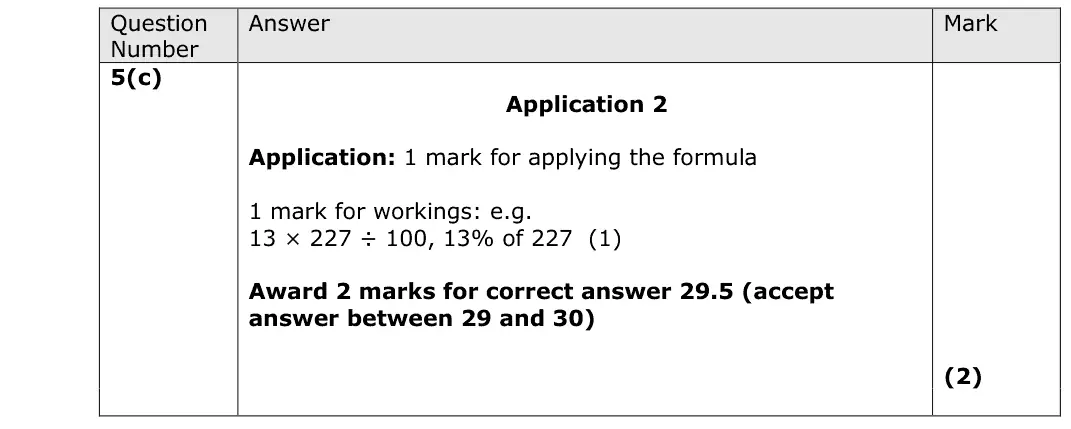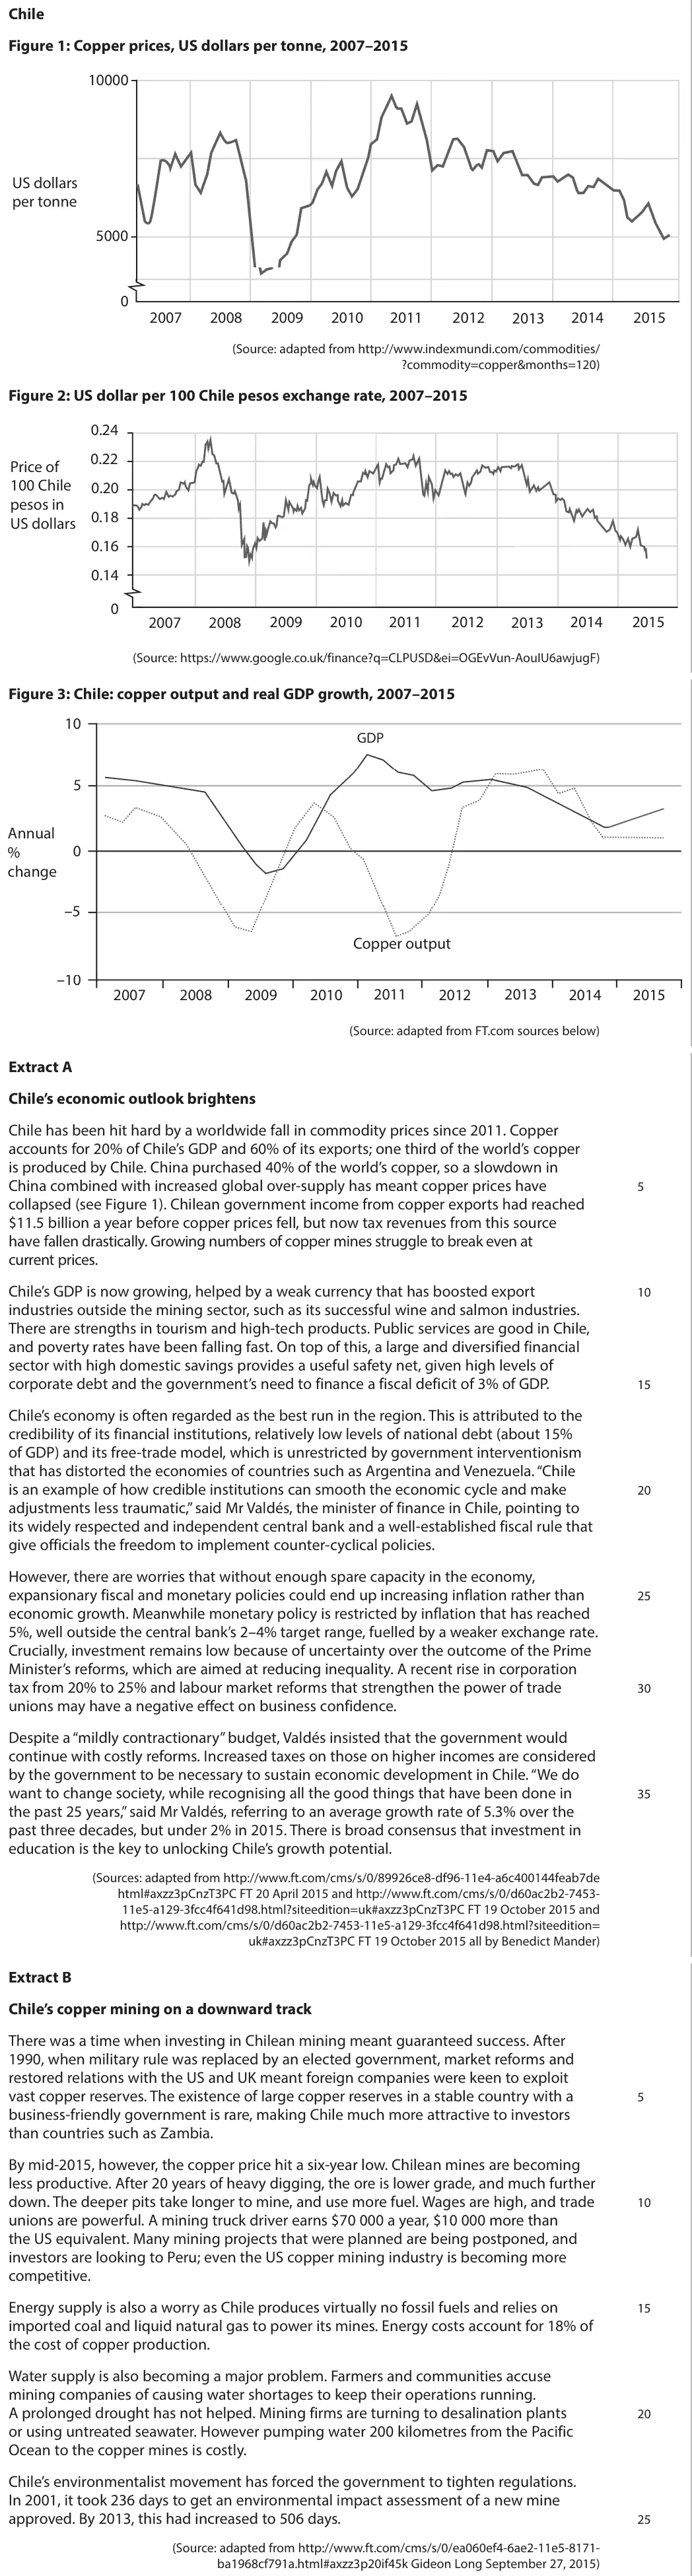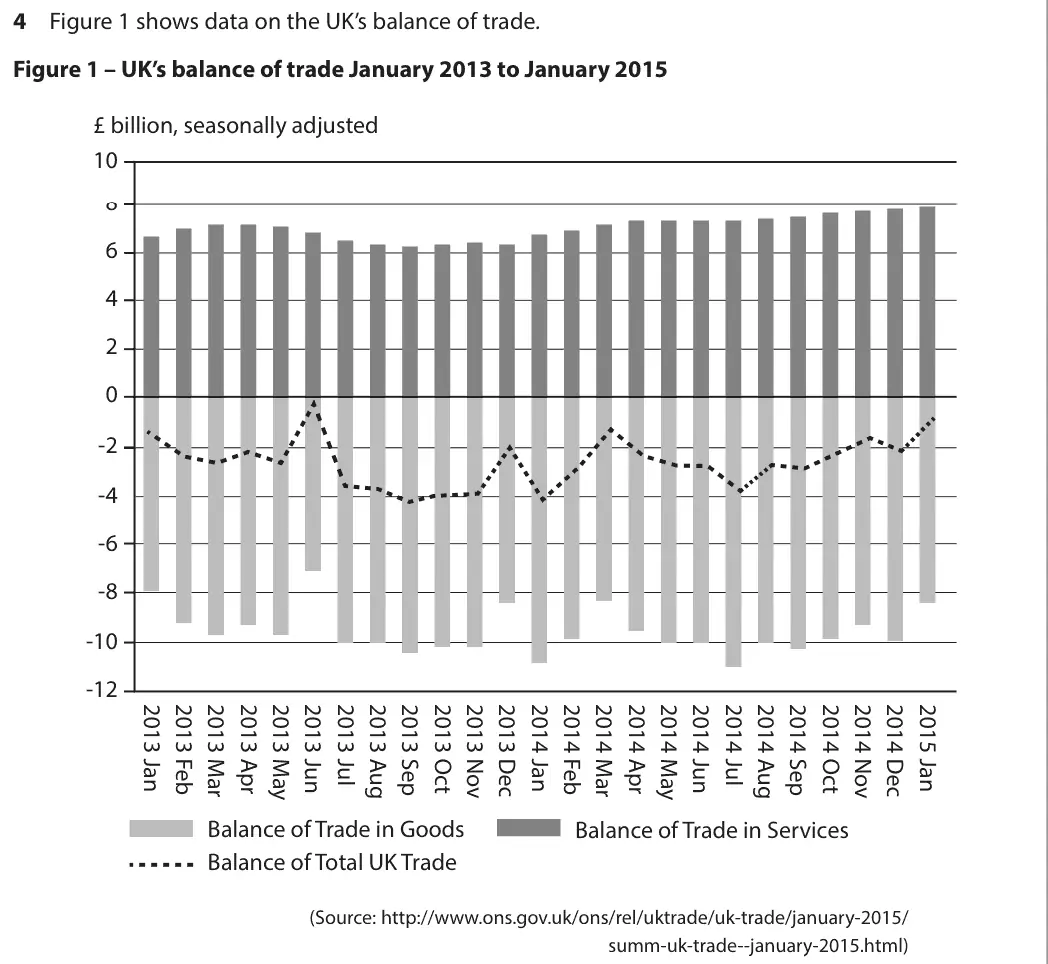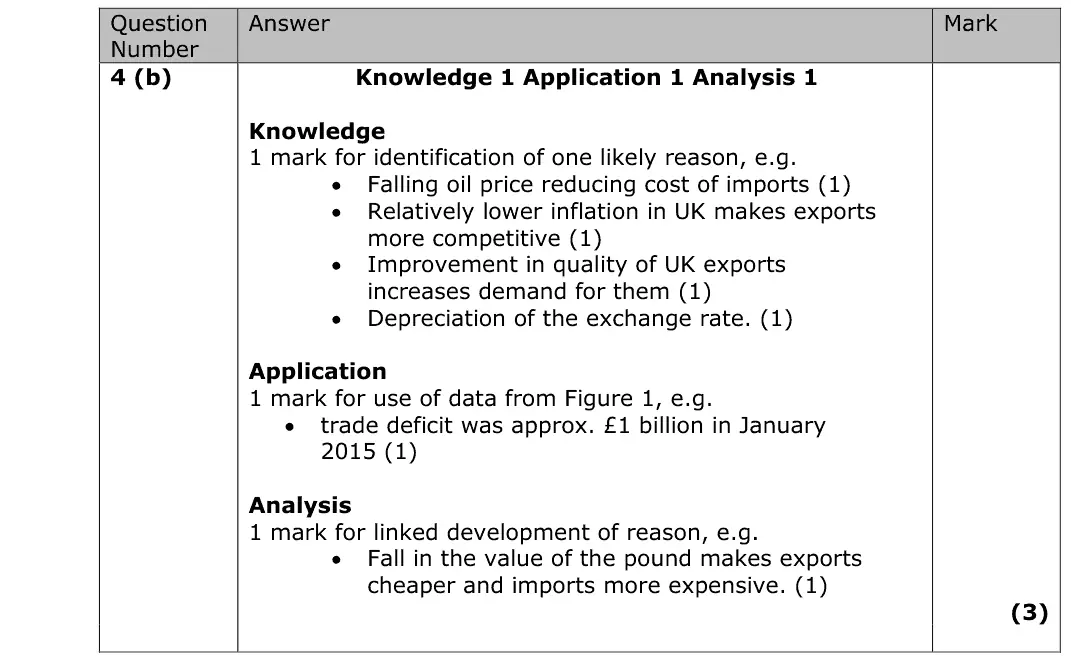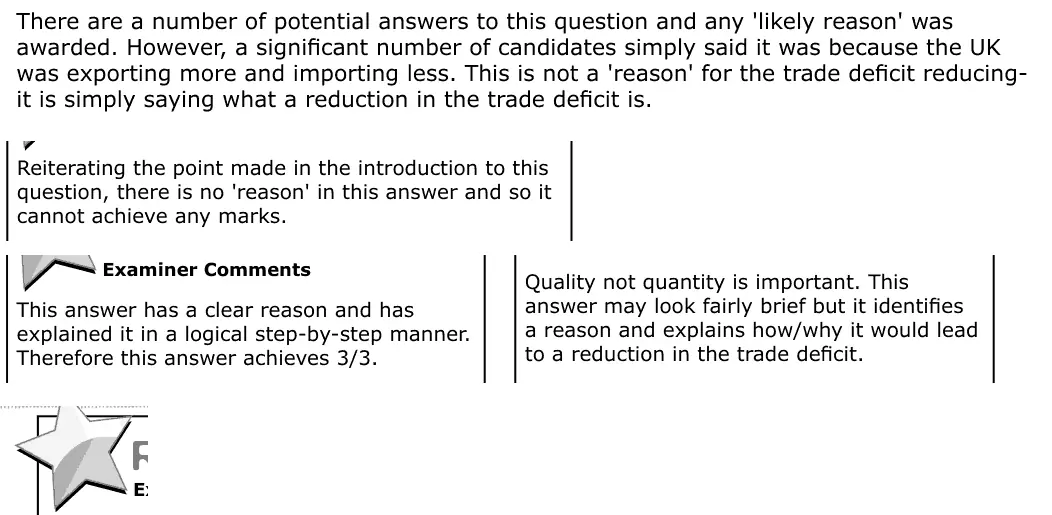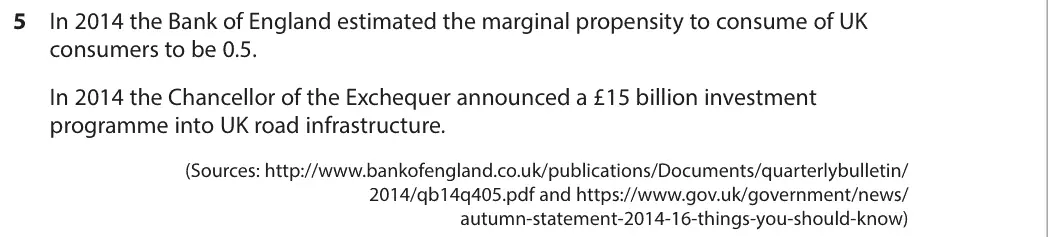
Data-response questions

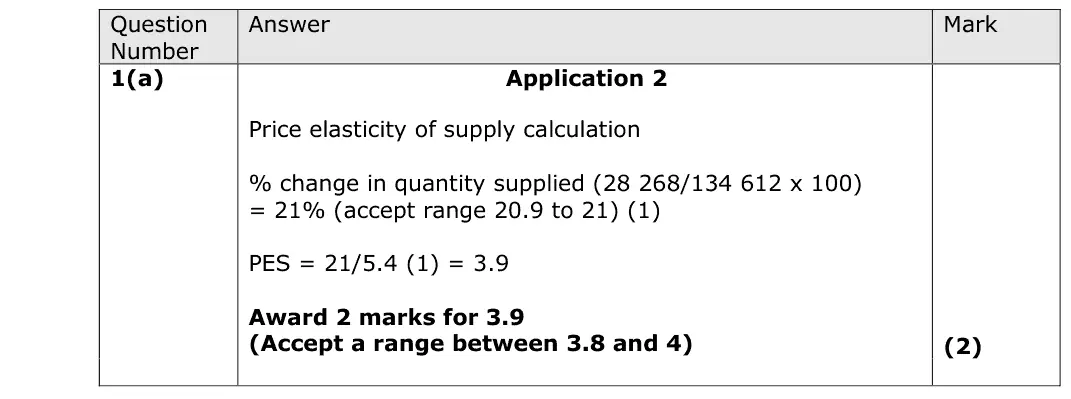
Every question that asks you to use the extracts or the figures. "With reference to the data" means a number or a quotation from the extract must appear in your answer. 453 questions.

Other types: Multiple-choice questions · Definition questions · Calculation questions · Diagram questions · Short explain questions (2–6 marks) · 8- to 15-mark responses · 20- and 25-mark essays

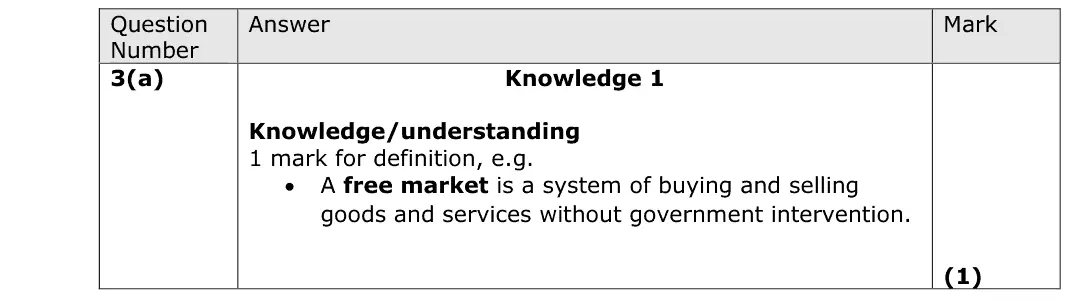
June 2025 · AS Paper 1 · Q3(a) 1 mark AO1=1 Definition economic systems
(a) The economy of Singapore is a highly developed free market economy with some elements of government intervention. Define the term ‘free market’. (1)
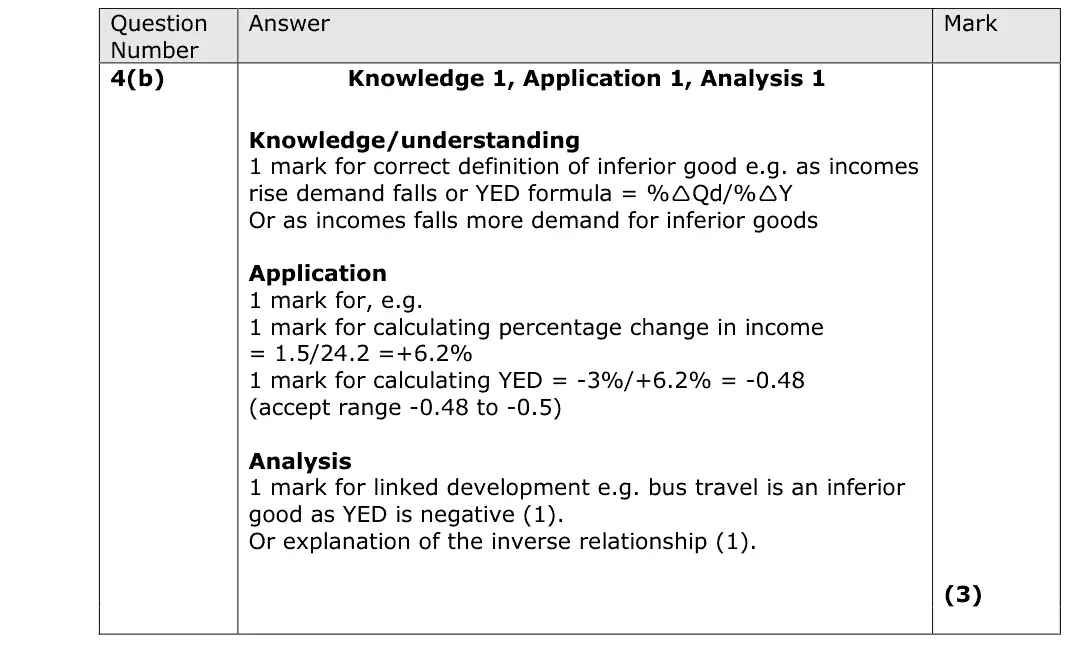
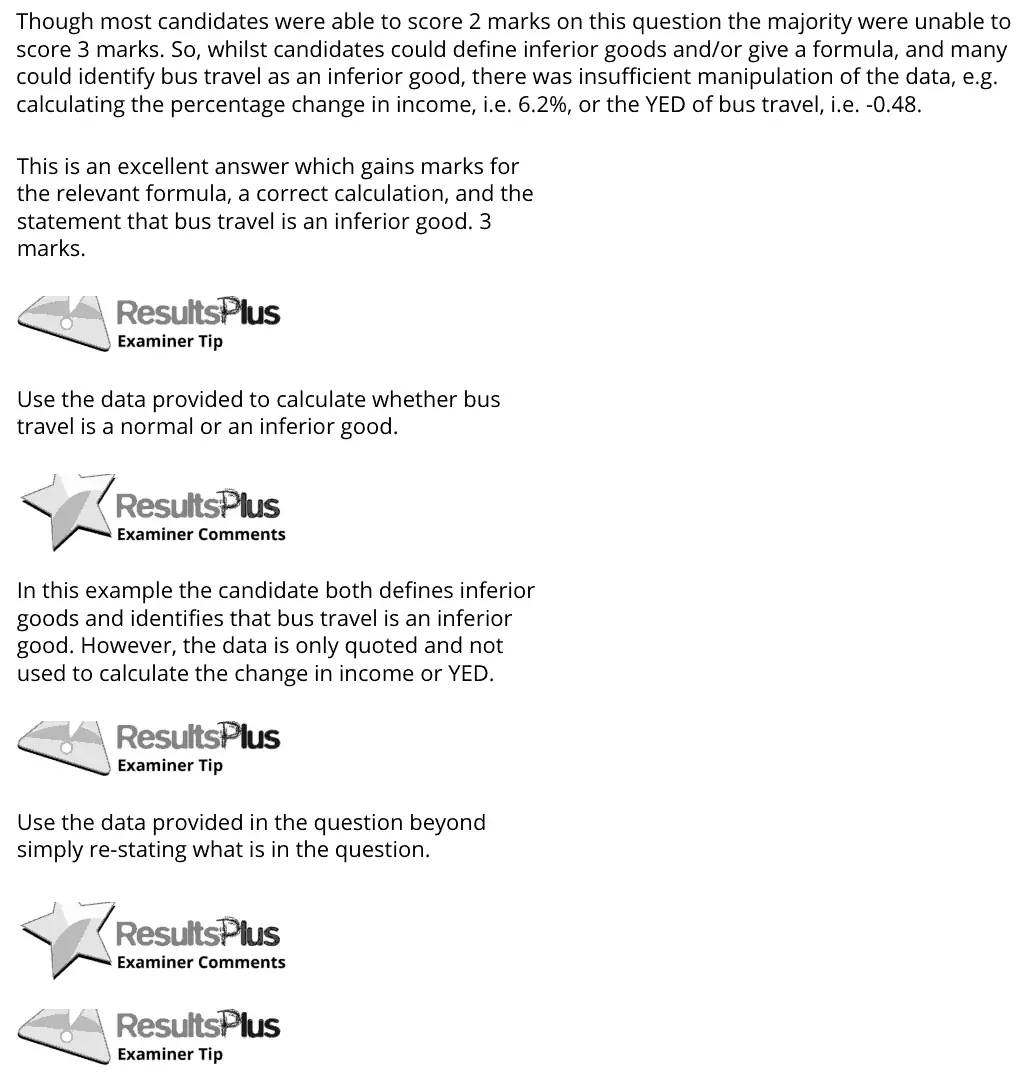
June 2025 · AS Paper 1 · Q4(b) 3 marks AO1=1, AO2=1, AO3=1 Short answer supply and demand
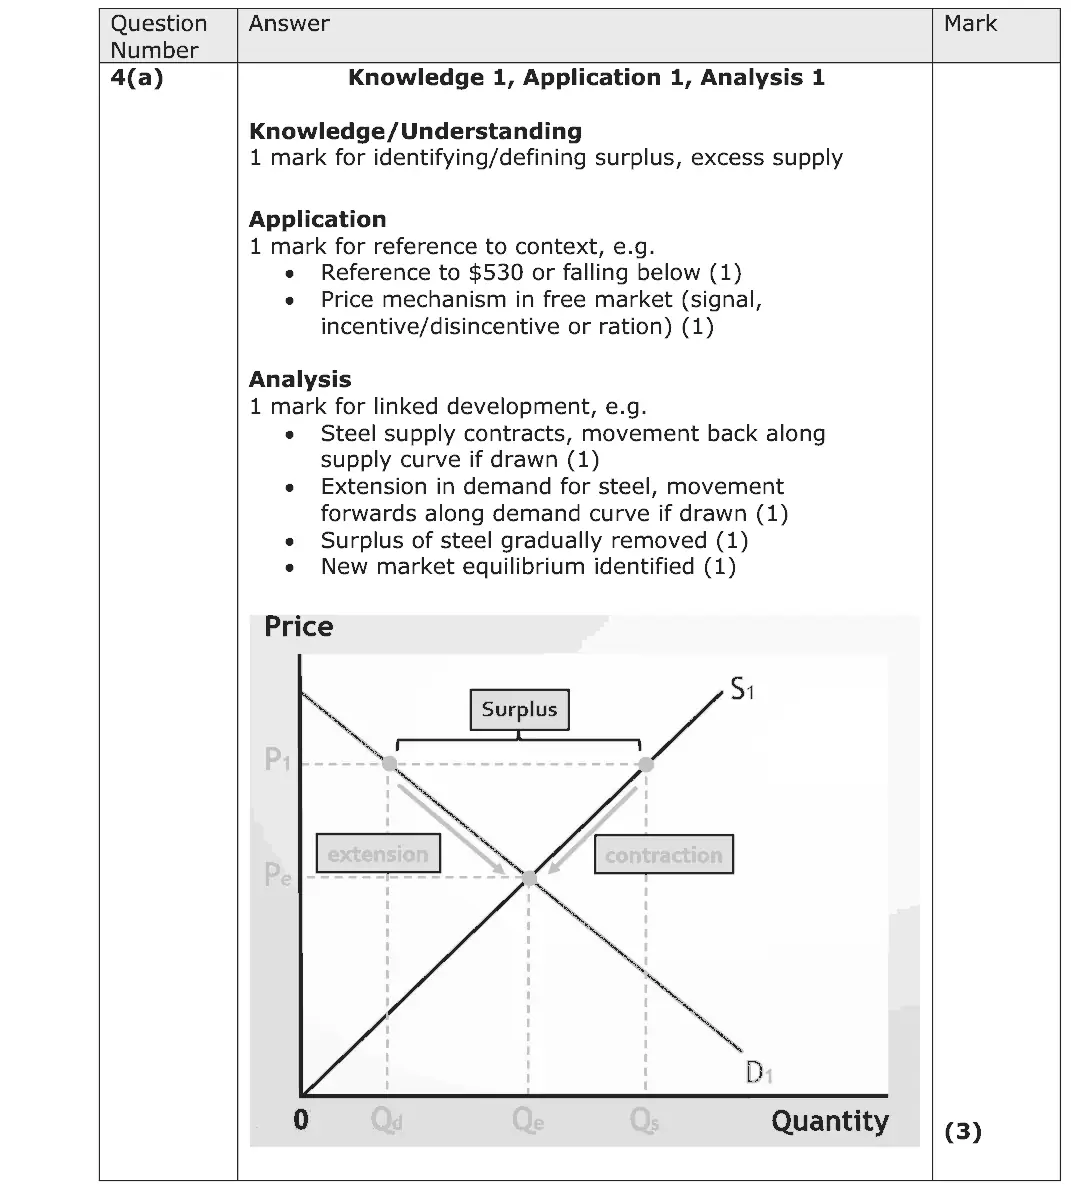
(b) Explain how the operation of market forces will eliminate an excess supply of coffee. (3)
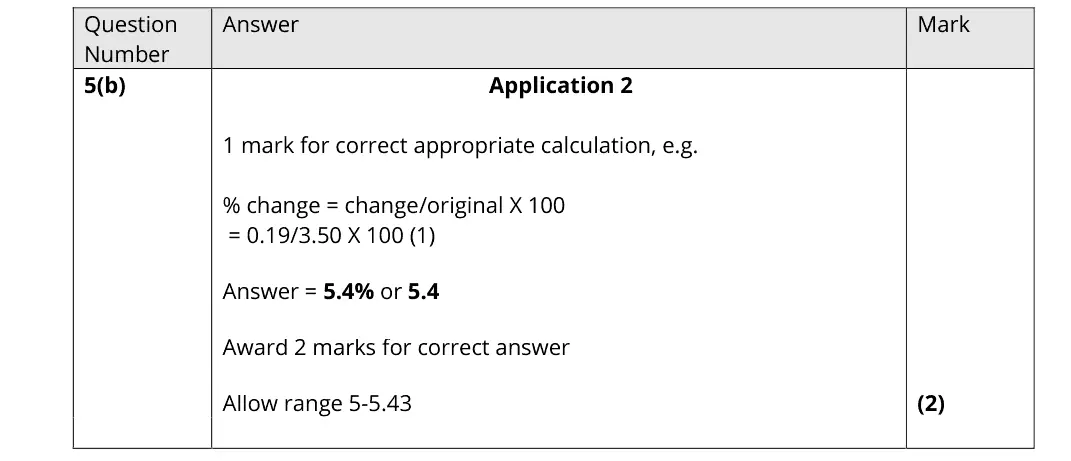
June 2025 · AS Paper 1 · Q5(b) 3 marks AO1=1, AO2=2 Calculation supply and demand
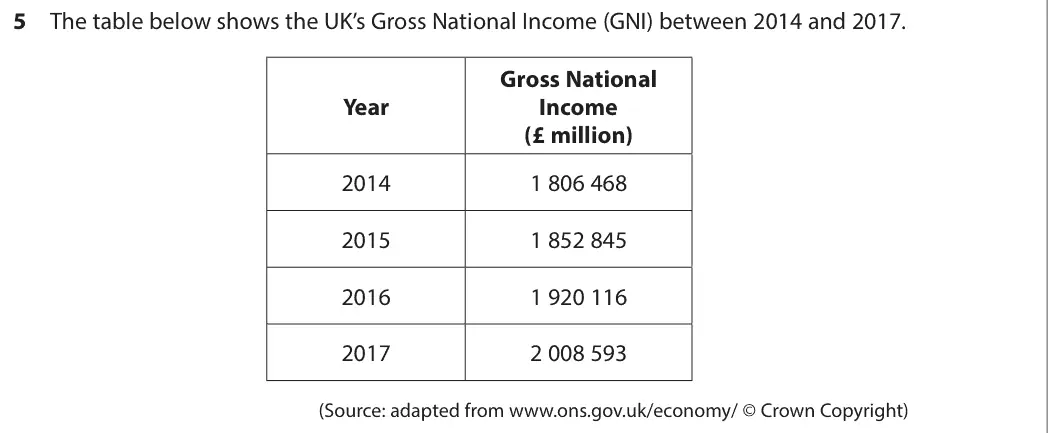
Data and extracts for question 55 In March 2019, 458 054 new car registrations were made, which subsequently fell by 44% in March 2020 due to the impact of the global health crisis. Demand for new vehicles can change quickly and can be caused by a variety of factors. (Source: adapted from https://fleetworld.co.uk/uk-new-car-registrations-slump-44-in-march/)
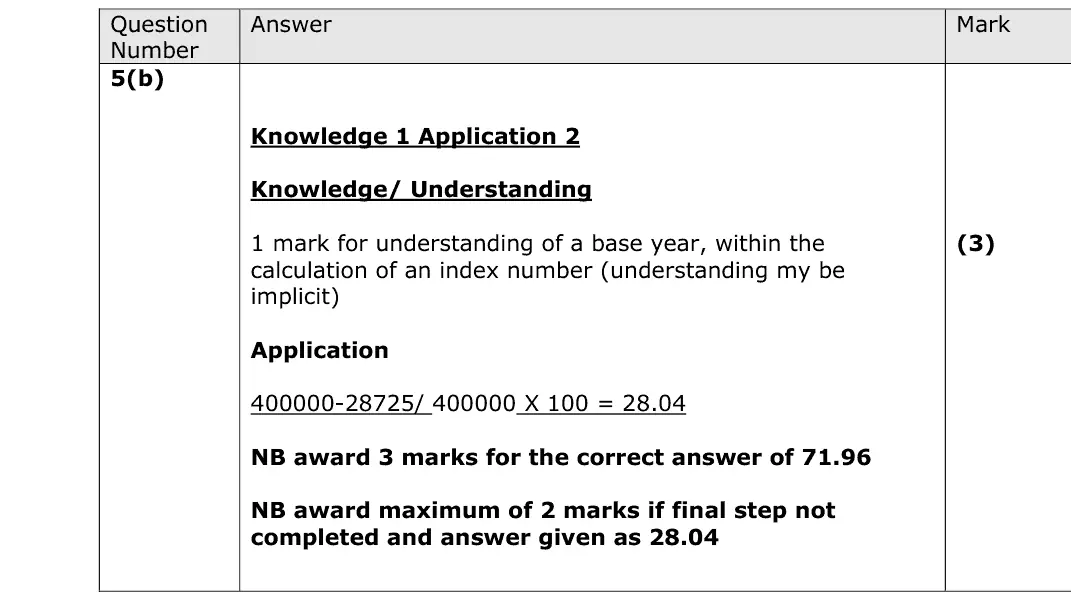
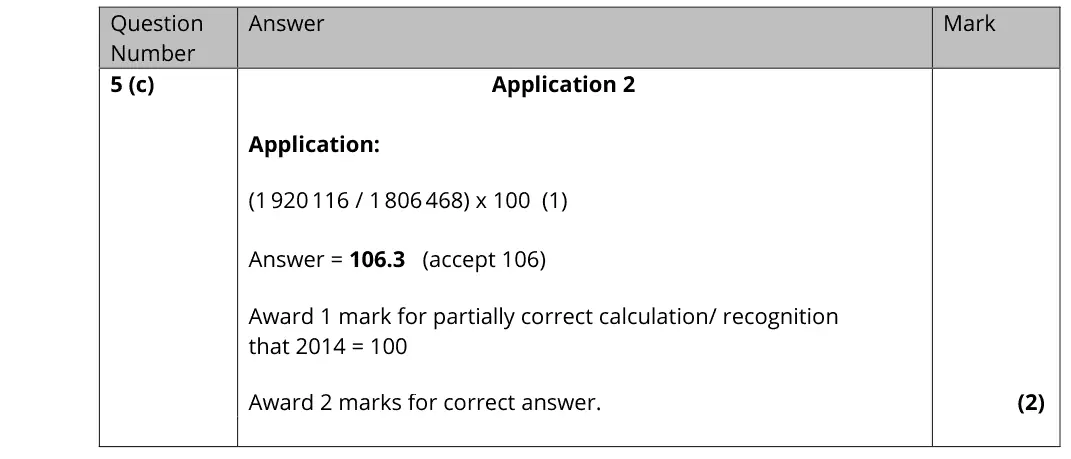
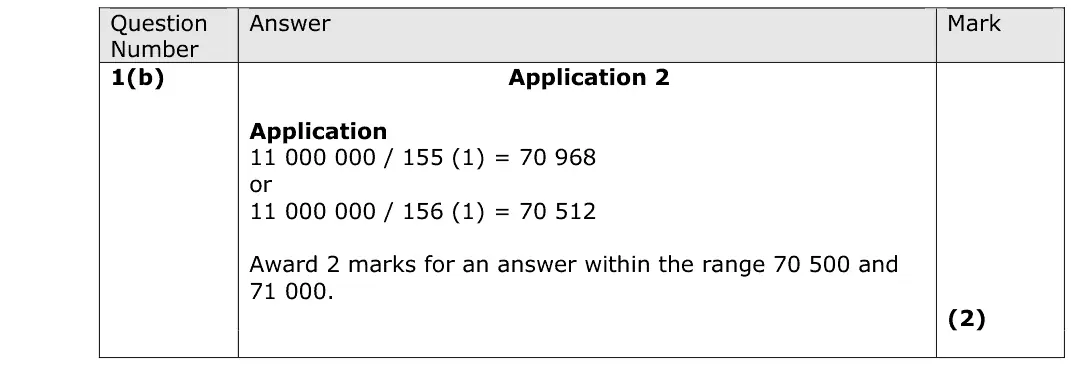
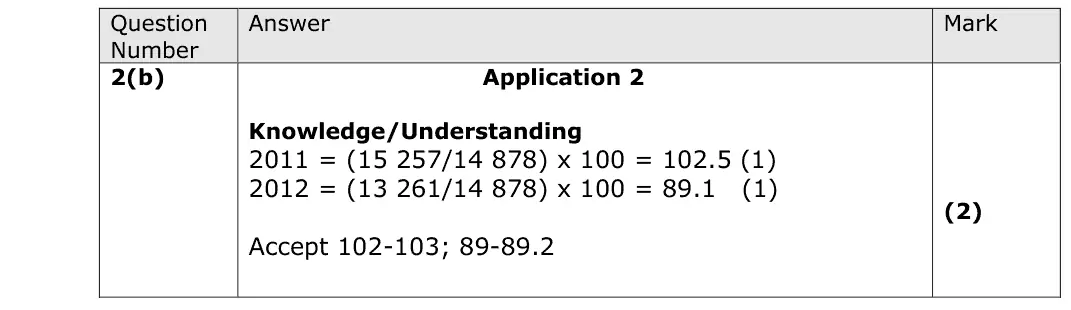
(b) The diagram on the previous page shows new car registrations in March from 2007 to 2023. Using 2010 as the base year, calculate the index number for 2023. (3)
June 2025 · AS Paper 1 · Q6(a) 5 marks AO1=1, AO2=2, AO3=2 Short answer price elasticity of demand
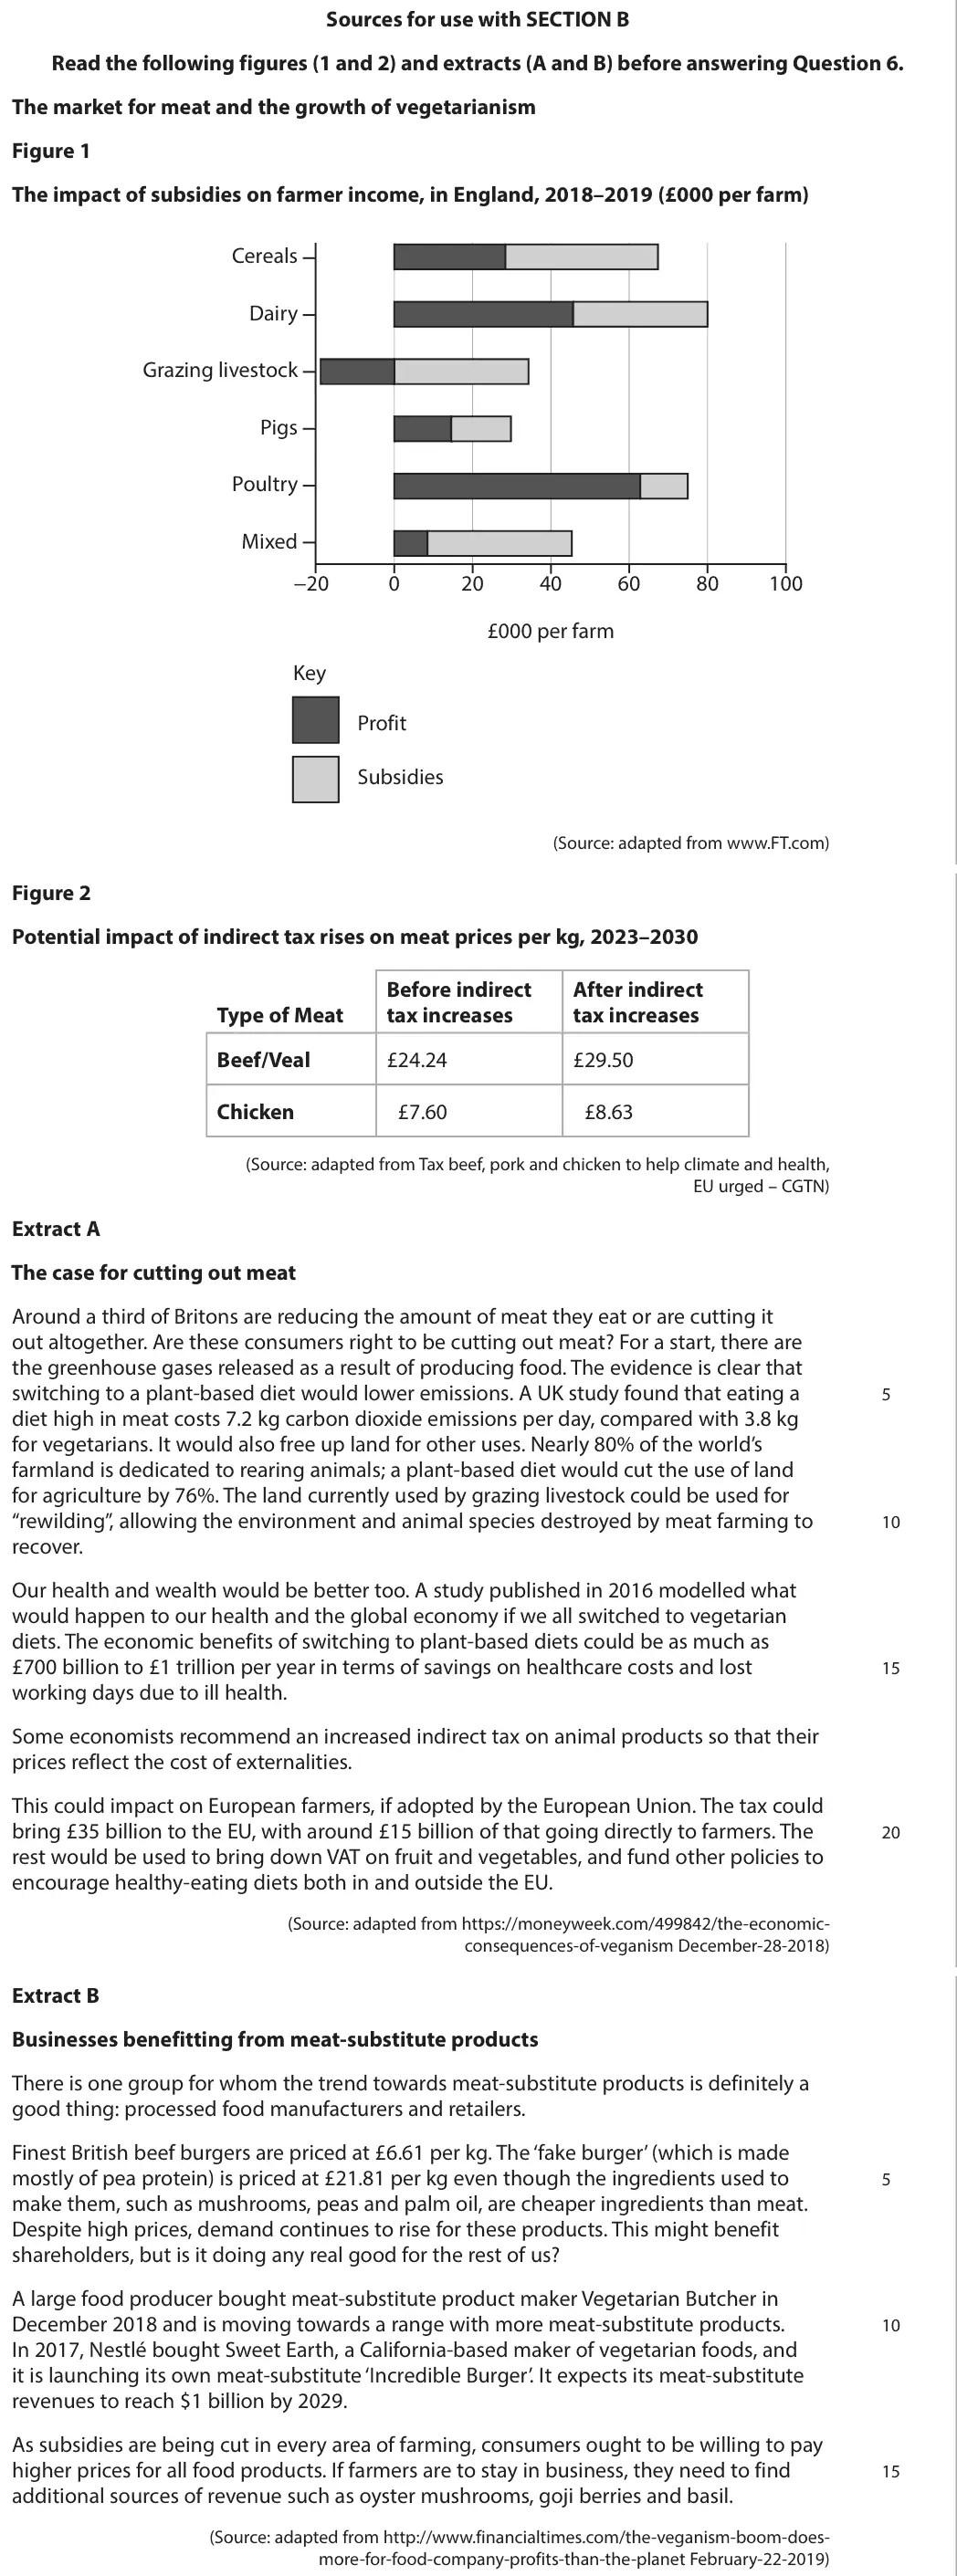
Data and extracts for question 6Sources for use with SECTION B Read the following figures (1 and 2) and extracts (A and B) before answering Question 6. The market for meat and the growth of vegetarianism Figure 1 The impact of subsidies on farmer income, in England, 2018–2019 (£000 per farm) Cereals Dairy Grazing livestock Pigs Poultry Mixed -20 0 20 40 60 80 100 £000 per farm Key Profit Subsidies (Source: adapted from www.FT.com) Figure 2 Potential impact of indirect tax rises on meat prices per kg, 2023–2030 Before indirect After indirect Type of Meat tax increases tax increases Beef/Veal £24.24 £29.50 Chicken £7.60 £8.63 (Source: adapted from Tax beef, pork and chicken to help climate and health, EU urged – CGTN) Extract A The case for cutting out meat Around a third of Britons are reducing the amount of meat they eat or are cutting it out altogether. Are these consumers right to be cutting out meat? For a start, there are the greenhouse gases released as a result of producing food. The evidence is clear that switching to a plant-based diet would lower emissions. A UK study found that eating a 5 diet high in meat costs 7.2 kg carbon dioxide emissions per day, compared with 3.8 kg for vegetarians. It would also free up land for other uses. Nearly 80% of the world’s farmland is dedicated to rearing animals; a plant-based diet would cut the use of land for agriculture by 76%. The land currently used by grazing livestock could be used for “rewilding”, allowing the environment and animal species destroyed by meat farming to 10 recover. Our health and wealth would be better too. A study published in 2016 modelled what would happen to our health and the global economy if we all switched to vegetarian diets. The economic benefits of switching to plant-based diets could be as much as £700 billion to £1 trillion per year in terms of savings on healthcare costs and lost 15 working days due to ill health. Some economists recommend an increased indirect tax on animal products so that their prices reflect the cost of externalities. This could impact on European farmers, if adopted by the European Union. The tax could bring £35 billion to the EU, with around £15 billion of that going directly to farmers. The 20 rest would be used to bring down VAT on fruit and vegetables, and fund other policies to encourage healthy-eating diets both in and outside the EU. (Source: adapted from https://moneyweek.com/499842/the-economic- consequences-of-veganism December-28-2018) Extract B Businesses benefitting from meat-substitute products There is one group for whom the trend towards meat-substitute products is definitely a good thing: processed food manufacturers and retailers. Finest British beef burgers are priced at £6.61 per kg. The ‘fake burger’ (which is made mostly of pea protein) is priced at £21.81 per kg even though the ingredients used to 5 make them, such as mushrooms, peas and palm oil, are cheaper ingredients than meat. Despite high prices, demand continues to rise for these products. This might benefit shareholders, but is it doing any real good for the rest of us? A large food producer bought meat-substitute product maker Vegetarian Butcher in December 2018 and is moving towards a range with more meat-substitute products. 10 In 2017, Nestlé bought Sweet Earth, a California-based maker of vegetarian foods, and it is launching its own meat-substitute ‘Incredible Burger’. It expects its meat-substitute revenues to reach $1 billion by 2029. As subsidies are being cut in every area of farming, consumers ought to be willing to pay higher prices for all food products. If farmers are to stay in business, they need to find 15 additional sources of revenue such as oyster mushrooms, goji berries and basil. (Source: adapted from http://www.financialtimes.com/the-veganism-boom-does- more-for-food-company-profits-than-the-planet February-22-2019)
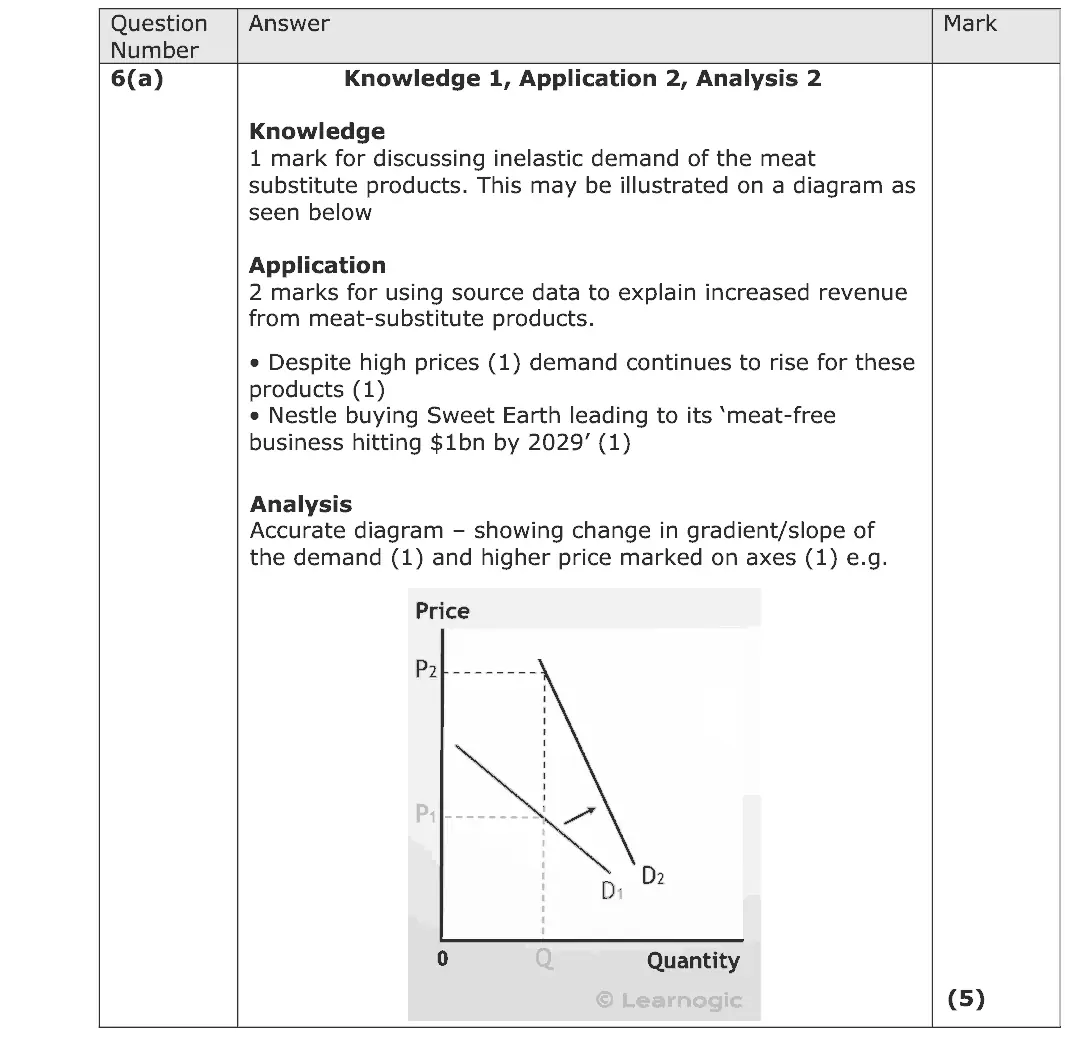
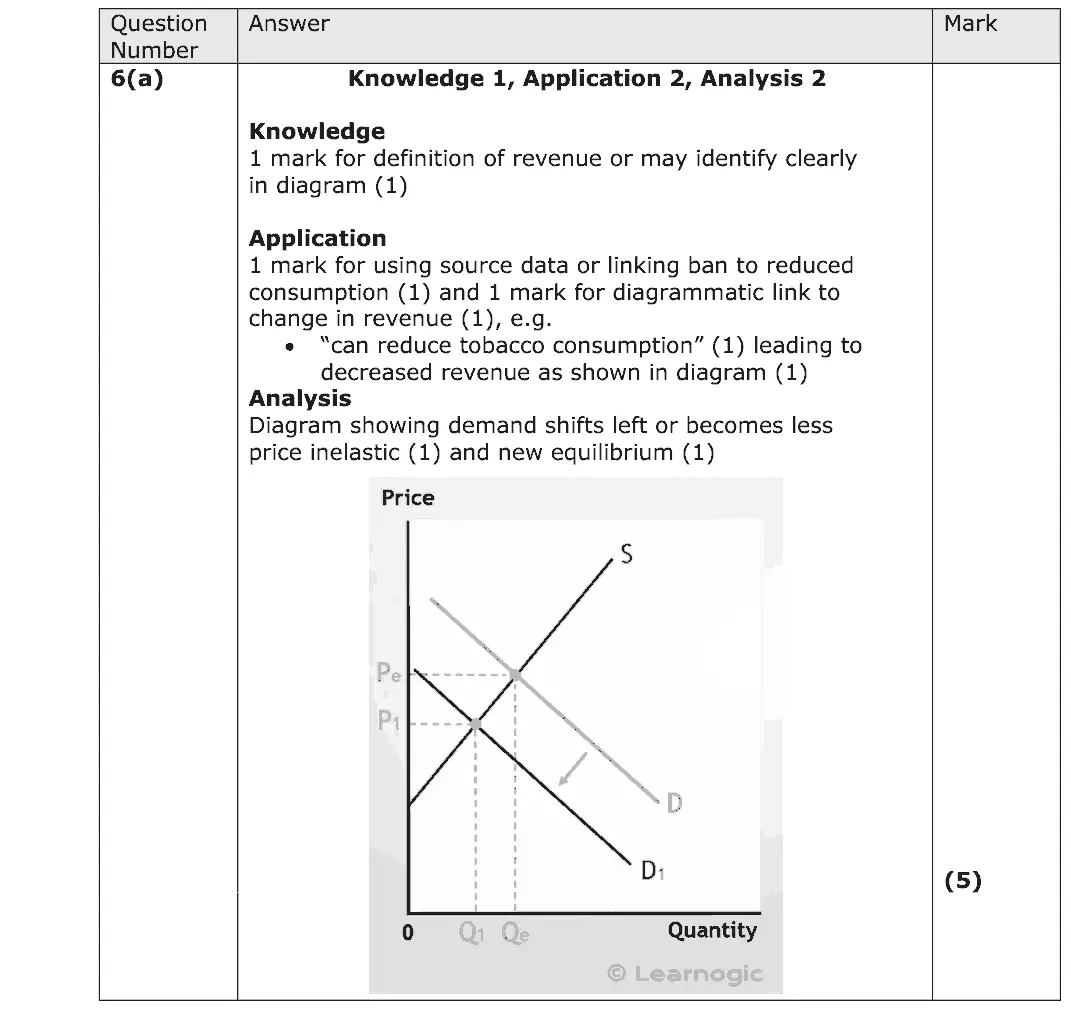
(a) With reference to Extract B, explain why the change to meat-substitute products may result in an increase in the revenue of food companies. Refer to the concept of price elasticity of demand in your answer. (5)
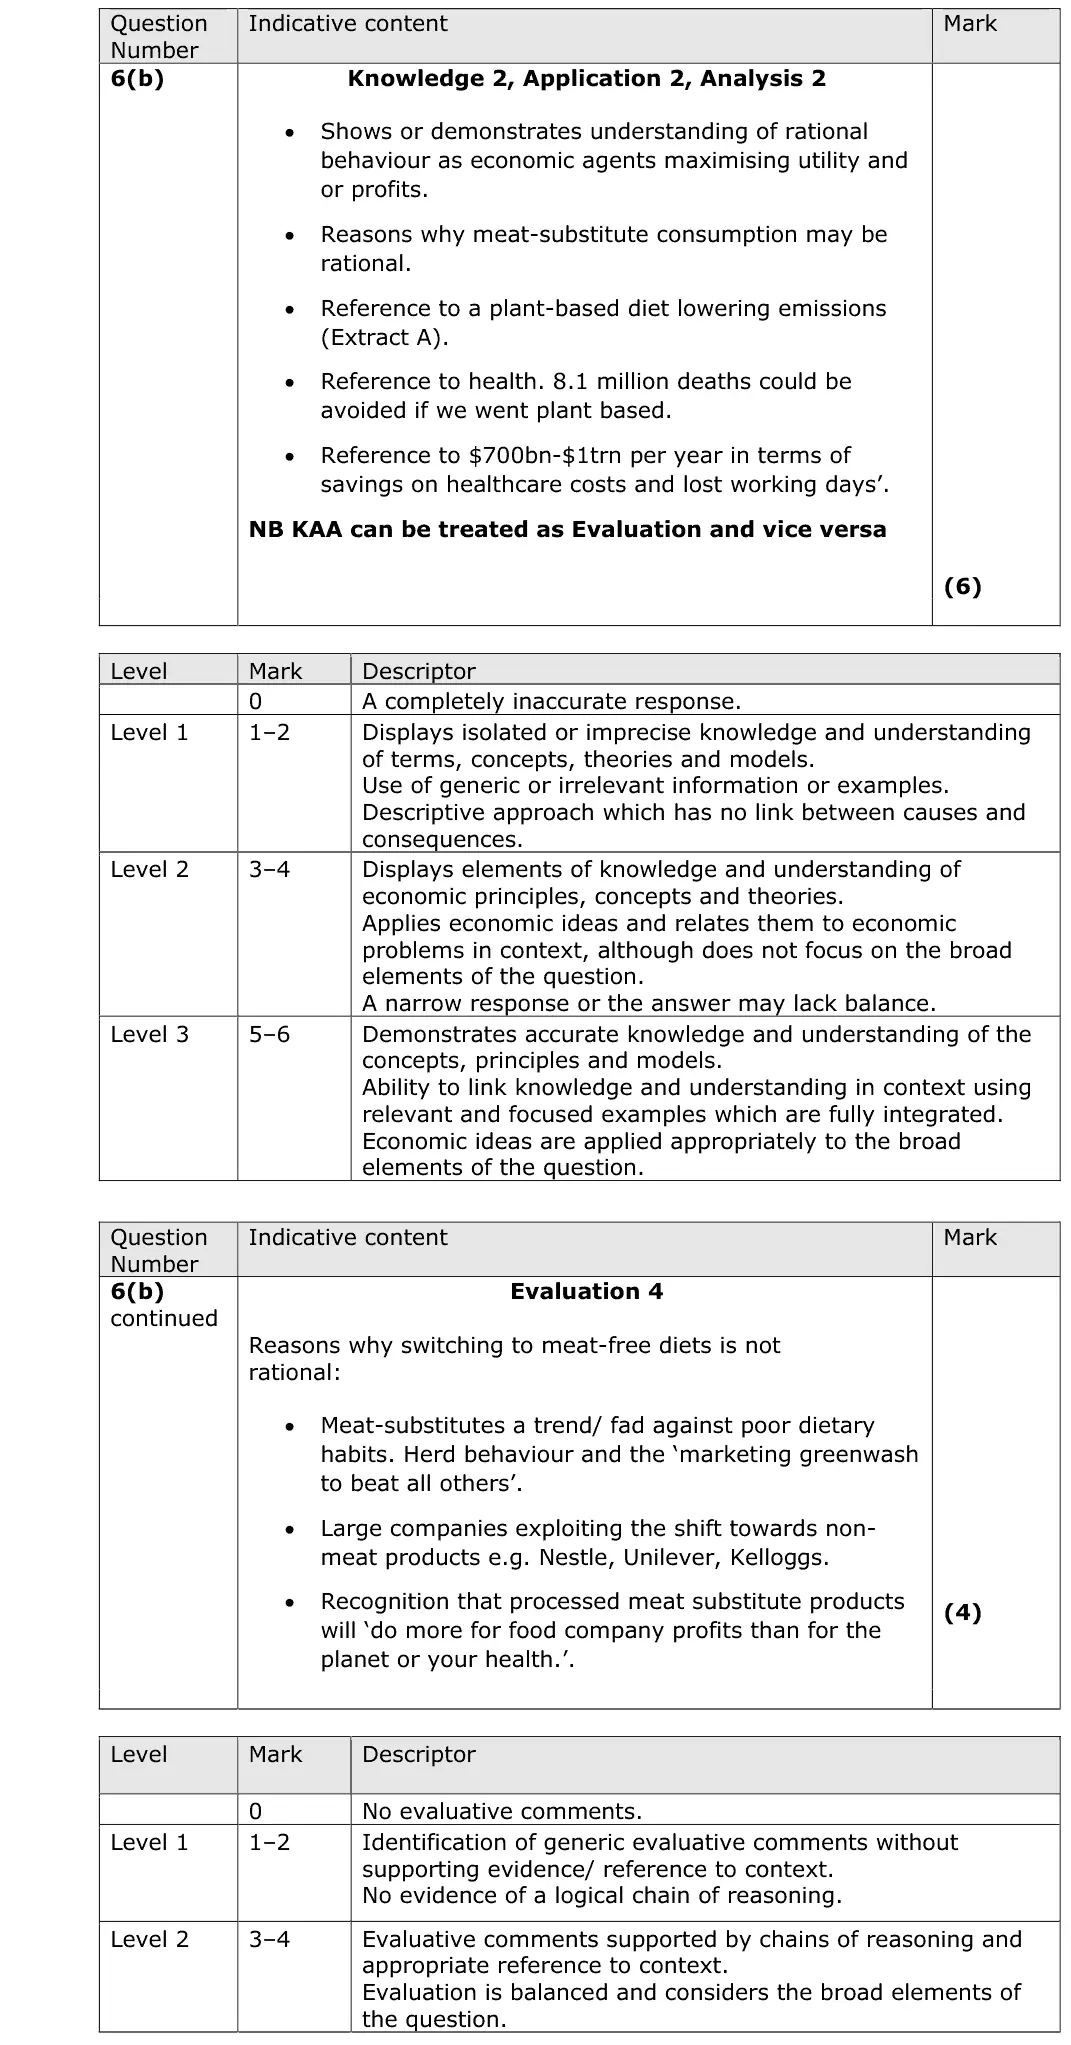
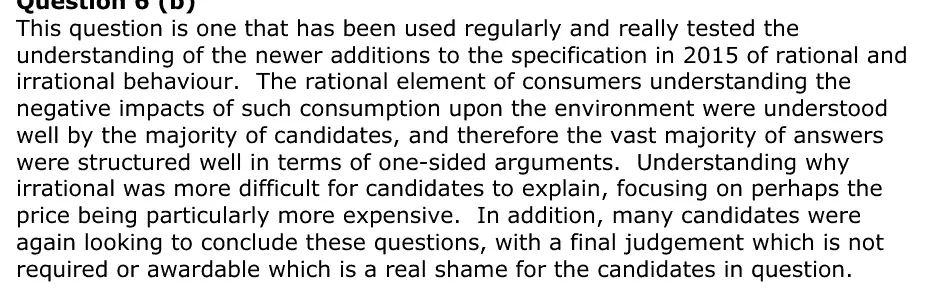
June 2025 · AS Paper 1 · Q6(b) 10 marks AO1=2, AO2=2, AO3=2, AO4=4 10-mark response rational decision making and behavioural economics
Data and extracts for question 6Sources for use with SECTION B Read the following figures (1 and 2) and extracts (A and B) before answering Question 6. The market for meat and the growth of vegetarianism Figure 1 The impact of subsidies on farmer income, in England, 2018–2019 (£000 per farm) Cereals Dairy Grazing livestock Pigs Poultry Mixed -20 0 20 40 60 80 100 £000 per farm Key Profit Subsidies (Source: adapted from www.FT.com) Figure 2 Potential impact of indirect tax rises on meat prices per kg, 2023–2030 Before indirect After indirect Type of Meat tax increases tax increases Beef/Veal £24.24 £29.50 Chicken £7.60 £8.63 (Source: adapted from Tax beef, pork and chicken to help climate and health, EU urged – CGTN) Extract A The case for cutting out meat Around a third of Britons are reducing the amount of meat they eat or are cutting it out altogether. Are these consumers right to be cutting out meat? For a start, there are the greenhouse gases released as a result of producing food. The evidence is clear that switching to a plant-based diet would lower emissions. A UK study found that eating a 5 diet high in meat costs 7.2 kg carbon dioxide emissions per day, compared with 3.8 kg for vegetarians. It would also free up land for other uses. Nearly 80% of the world’s farmland is dedicated to rearing animals; a plant-based diet would cut the use of land for agriculture by 76%. The land currently used by grazing livestock could be used for “rewilding”, allowing the environment and animal species destroyed by meat farming to 10 recover. Our health and wealth would be better too. A study published in 2016 modelled what would happen to our health and the global economy if we all switched to vegetarian diets. The economic benefits of switching to plant-based diets could be as much as £700 billion to £1 trillion per year in terms of savings on healthcare costs and lost 15 working days due to ill health. Some economists recommend an increased indirect tax on animal products so that their prices reflect the cost of externalities. This could impact on European farmers, if adopted by the European Union. The tax could bring £35 billion to the EU, with around £15 billion of that going directly to farmers. The 20 rest would be used to bring down VAT on fruit and vegetables, and fund other policies to encourage healthy-eating diets both in and outside the EU. (Source: adapted from https://moneyweek.com/499842/the-economic- consequences-of-veganism December-28-2018) Extract B Businesses benefitting from meat-substitute products There is one group for whom the trend towards meat-substitute products is definitely a good thing: processed food manufacturers and retailers. Finest British beef burgers are priced at £6.61 per kg. The ‘fake burger’ (which is made mostly of pea protein) is priced at £21.81 per kg even though the ingredients used to 5 make them, such as mushrooms, peas and palm oil, are cheaper ingredients than meat. Despite high prices, demand continues to rise for these products. This might benefit shareholders, but is it doing any real good for the rest of us? A large food producer bought meat-substitute product maker Vegetarian Butcher in December 2018 and is moving towards a range with more meat-substitute products. 10 In 2017, Nestlé bought Sweet Earth, a California-based maker of vegetarian foods, and it is launching its own meat-substitute ‘Incredible Burger’. It expects its meat-substitute revenues to reach $1 billion by 2029. As subsidies are being cut in every area of farming, consumers ought to be willing to pay higher prices for all food products. If farmers are to stay in business, they need to find 15 additional sources of revenue such as oyster mushrooms, goji berries and basil. (Source: adapted from http://www.financialtimes.com/the-veganism-boom-does- more-for-food-company-profits-than-the-planet February-22-2019)
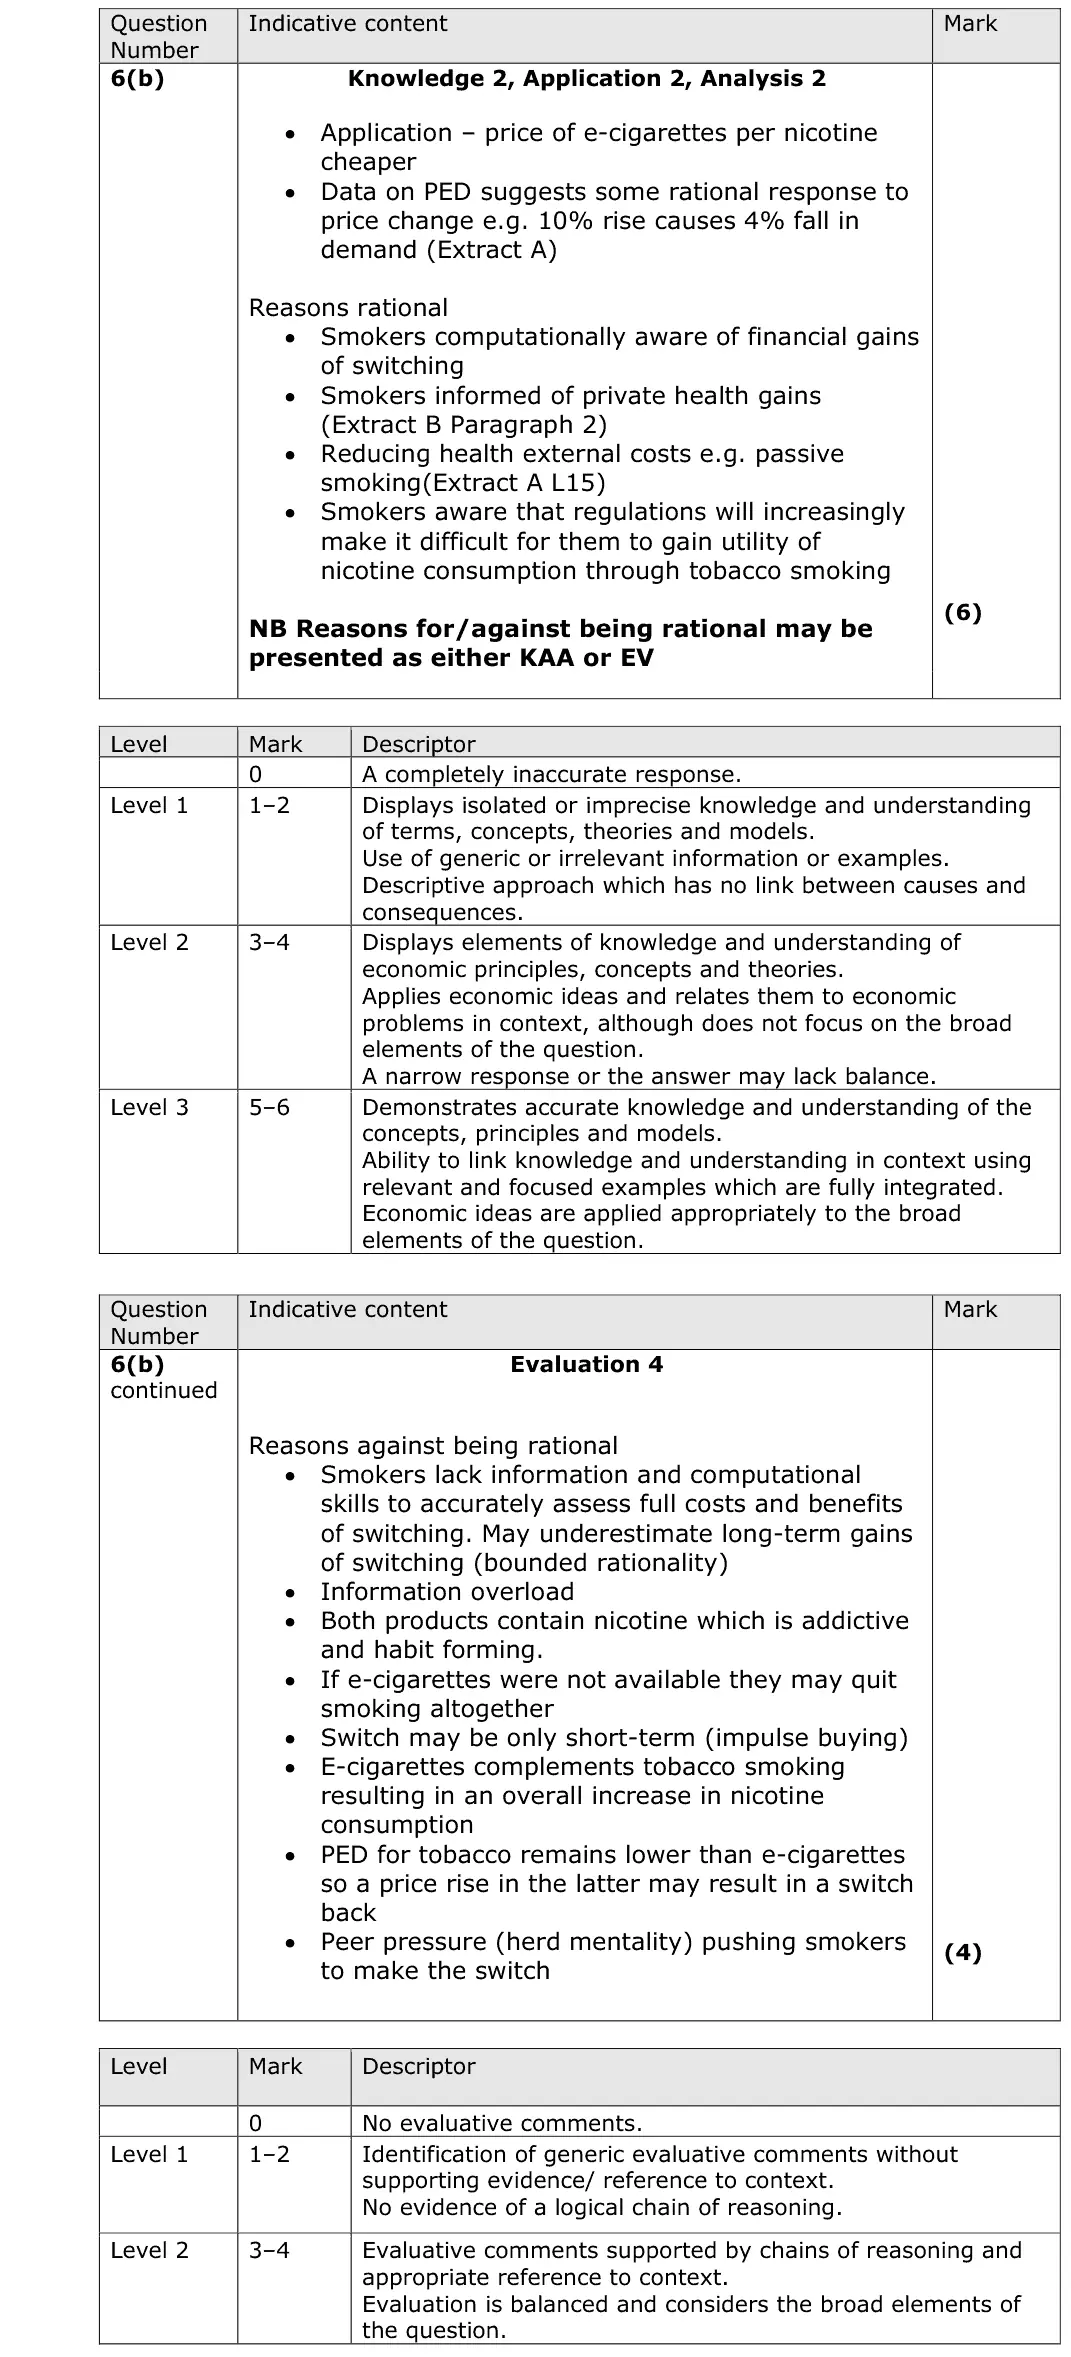
(b) With reference to the information provided and your own knowledge, assess the view that consumers switching to meat-substitute products is an example of rational behaviour. (10)
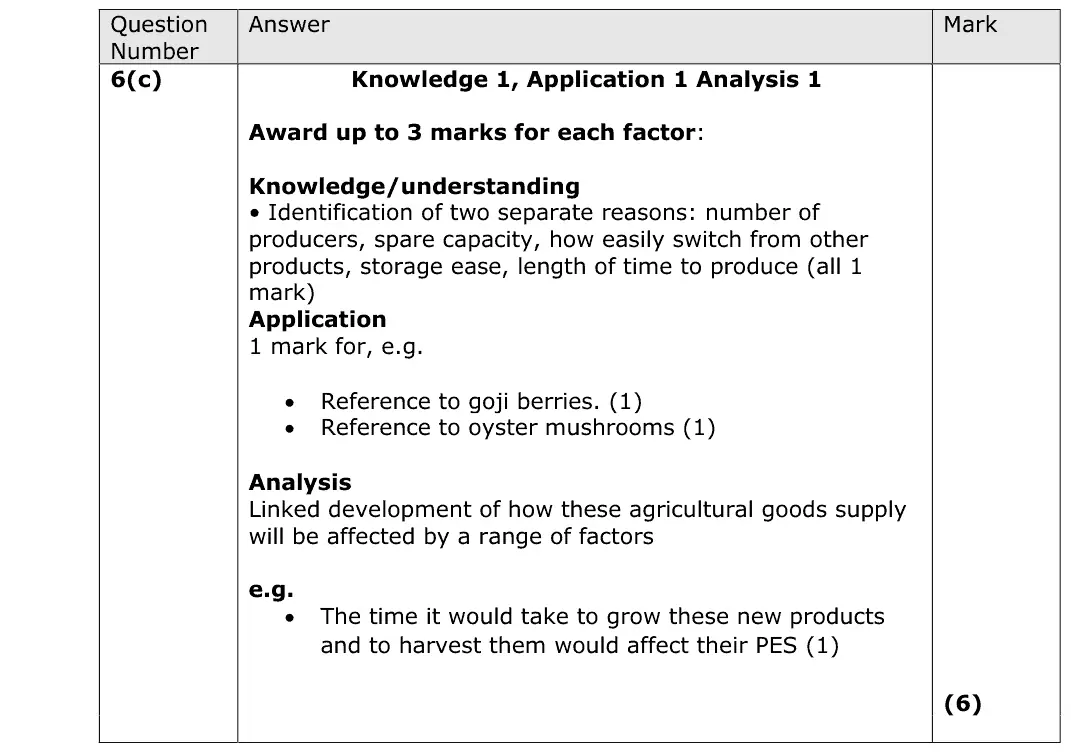
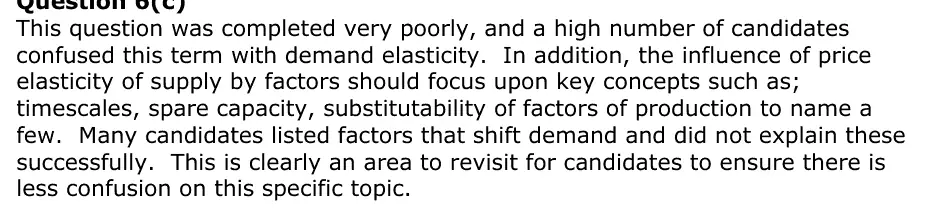
June 2025 · AS Paper 1 · Q6(c) 6 marks Short answer Hard elasticity of supply
Data and extracts for question 6Sources for use with SECTION B Read the following figures (1 and 2) and extracts (A and B) before answering Question 6. The market for meat and the growth of vegetarianism Figure 1 The impact of subsidies on farmer income, in England, 2018–2019 (£000 per farm) Cereals Dairy Grazing livestock Pigs Poultry Mixed -20 0 20 40 60 80 100 £000 per farm Key Profit Subsidies (Source: adapted from www.FT.com) Figure 2 Potential impact of indirect tax rises on meat prices per kg, 2023–2030 Before indirect After indirect Type of Meat tax increases tax increases Beef/Veal £24.24 £29.50 Chicken £7.60 £8.63 (Source: adapted from Tax beef, pork and chicken to help climate and health, EU urged – CGTN) Extract A The case for cutting out meat Around a third of Britons are reducing the amount of meat they eat or are cutting it out altogether. Are these consumers right to be cutting out meat? For a start, there are the greenhouse gases released as a result of producing food. The evidence is clear that switching to a plant-based diet would lower emissions. A UK study found that eating a 5 diet high in meat costs 7.2 kg carbon dioxide emissions per day, compared with 3.8 kg for vegetarians. It would also free up land for other uses. Nearly 80% of the world’s farmland is dedicated to rearing animals; a plant-based diet would cut the use of land for agriculture by 76%. The land currently used by grazing livestock could be used for “rewilding”, allowing the environment and animal species destroyed by meat farming to 10 recover. Our health and wealth would be better too. A study published in 2016 modelled what would happen to our health and the global economy if we all switched to vegetarian diets. The economic benefits of switching to plant-based diets could be as much as £700 billion to £1 trillion per year in terms of savings on healthcare costs and lost 15 working days due to ill health. Some economists recommend an increased indirect tax on animal products so that their prices reflect the cost of externalities. This could impact on European farmers, if adopted by the European Union. The tax could bring £35 billion to the EU, with around £15 billion of that going directly to farmers. The 20 rest would be used to bring down VAT on fruit and vegetables, and fund other policies to encourage healthy-eating diets both in and outside the EU. (Source: adapted from https://moneyweek.com/499842/the-economic- consequences-of-veganism December-28-2018) Extract B Businesses benefitting from meat-substitute products There is one group for whom the trend towards meat-substitute products is definitely a good thing: processed food manufacturers and retailers. Finest British beef burgers are priced at £6.61 per kg. The ‘fake burger’ (which is made mostly of pea protein) is priced at £21.81 per kg even though the ingredients used to 5 make them, such as mushrooms, peas and palm oil, are cheaper ingredients than meat. Despite high prices, demand continues to rise for these products. This might benefit shareholders, but is it doing any real good for the rest of us? A large food producer bought meat-substitute product maker Vegetarian Butcher in December 2018 and is moving towards a range with more meat-substitute products. 10 In 2017, Nestlé bought Sweet Earth, a California-based maker of vegetarian foods, and it is launching its own meat-substitute ‘Incredible Burger’. It expects its meat-substitute revenues to reach $1 billion by 2029. As subsidies are being cut in every area of farming, consumers ought to be willing to pay higher prices for all food products. If farmers are to stay in business, they need to find 15 additional sources of revenue such as oyster mushrooms, goji berries and basil. (Source: adapted from http://www.financialtimes.com/the-veganism-boom-does- more-for-food-company-profits-than-the-planet February-22-2019)
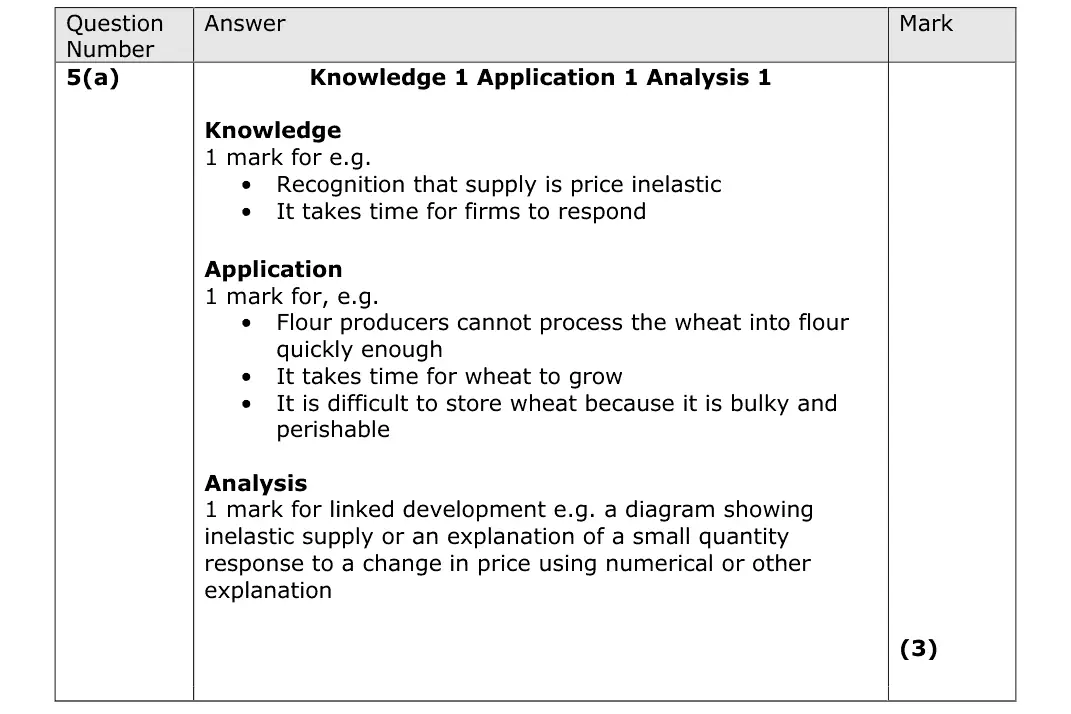
(c) With reference to the last paragraph of Extract B, explain two factors which are likely to influence price elasticity of supply. (6)
June 2025 · AS Paper 1 · Q6(d) 4 marks AO1=2, AO2=2 Short answer nature of economics
Data and extracts for question 6Sources for use with SECTION B Read the following figures (1 and 2) and extracts (A and B) before answering Question 6. The market for meat and the growth of vegetarianism Figure 1 The impact of subsidies on farmer income, in England, 2018–2019 (£000 per farm) Cereals Dairy Grazing livestock Pigs Poultry Mixed -20 0 20 40 60 80 100 £000 per farm Key Profit Subsidies (Source: adapted from www.FT.com) Figure 2 Potential impact of indirect tax rises on meat prices per kg, 2023–2030 Before indirect After indirect Type of Meat tax increases tax increases Beef/Veal £24.24 £29.50 Chicken £7.60 £8.63 (Source: adapted from Tax beef, pork and chicken to help climate and health, EU urged – CGTN) Extract A The case for cutting out meat Around a third of Britons are reducing the amount of meat they eat or are cutting it out altogether. Are these consumers right to be cutting out meat? For a start, there are the greenhouse gases released as a result of producing food. The evidence is clear that switching to a plant-based diet would lower emissions. A UK study found that eating a 5 diet high in meat costs 7.2 kg carbon dioxide emissions per day, compared with 3.8 kg for vegetarians. It would also free up land for other uses. Nearly 80% of the world’s farmland is dedicated to rearing animals; a plant-based diet would cut the use of land for agriculture by 76%. The land currently used by grazing livestock could be used for “rewilding”, allowing the environment and animal species destroyed by meat farming to 10 recover. Our health and wealth would be better too. A study published in 2016 modelled what would happen to our health and the global economy if we all switched to vegetarian diets. The economic benefits of switching to plant-based diets could be as much as £700 billion to £1 trillion per year in terms of savings on healthcare costs and lost 15 working days due to ill health. Some economists recommend an increased indirect tax on animal products so that their prices reflect the cost of externalities. This could impact on European farmers, if adopted by the European Union. The tax could bring £35 billion to the EU, with around £15 billion of that going directly to farmers. The 20 rest would be used to bring down VAT on fruit and vegetables, and fund other policies to encourage healthy-eating diets both in and outside the EU. (Source: adapted from https://moneyweek.com/499842/the-economic- consequences-of-veganism December-28-2018) Extract B Businesses benefitting from meat-substitute products There is one group for whom the trend towards meat-substitute products is definitely a good thing: processed food manufacturers and retailers. Finest British beef burgers are priced at £6.61 per kg. The ‘fake burger’ (which is made mostly of pea protein) is priced at £21.81 per kg even though the ingredients used to 5 make them, such as mushrooms, peas and palm oil, are cheaper ingredients than meat. Despite high prices, demand continues to rise for these products. This might benefit shareholders, but is it doing any real good for the rest of us? A large food producer bought meat-substitute product maker Vegetarian Butcher in December 2018 and is moving towards a range with more meat-substitute products. 10 In 2017, Nestlé bought Sweet Earth, a California-based maker of vegetarian foods, and it is launching its own meat-substitute ‘Incredible Burger’. It expects its meat-substitute revenues to reach $1 billion by 2029. As subsidies are being cut in every area of farming, consumers ought to be willing to pay higher prices for all food products. If farmers are to stay in business, they need to find 15 additional sources of revenue such as oyster mushrooms, goji berries and basil. (Source: adapted from http://www.financialtimes.com/the-veganism-boom-does- more-for-food-company-profits-than-the-planet February-22-2019)
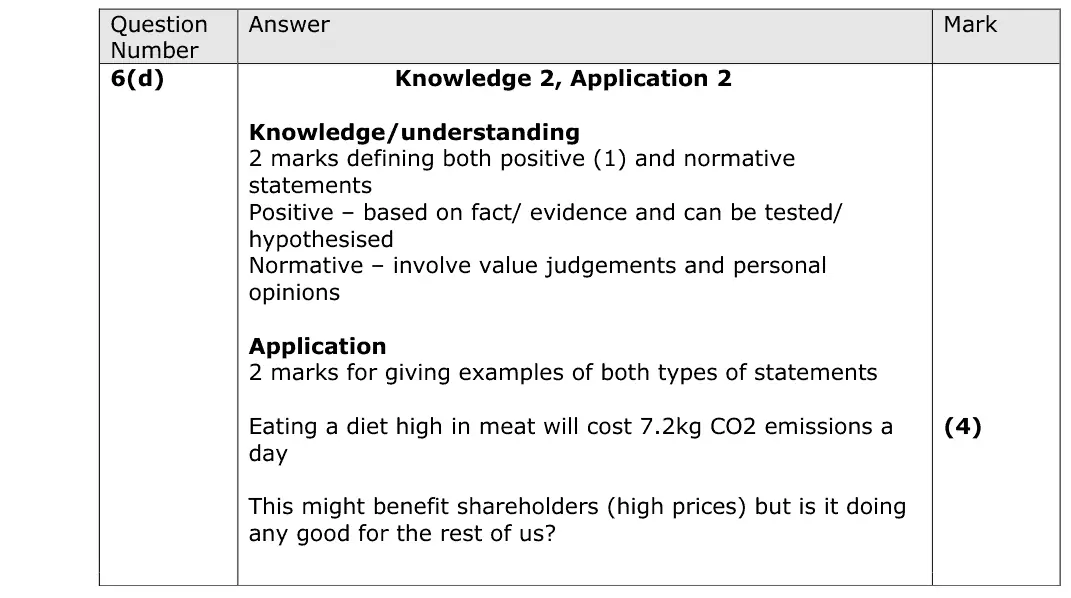
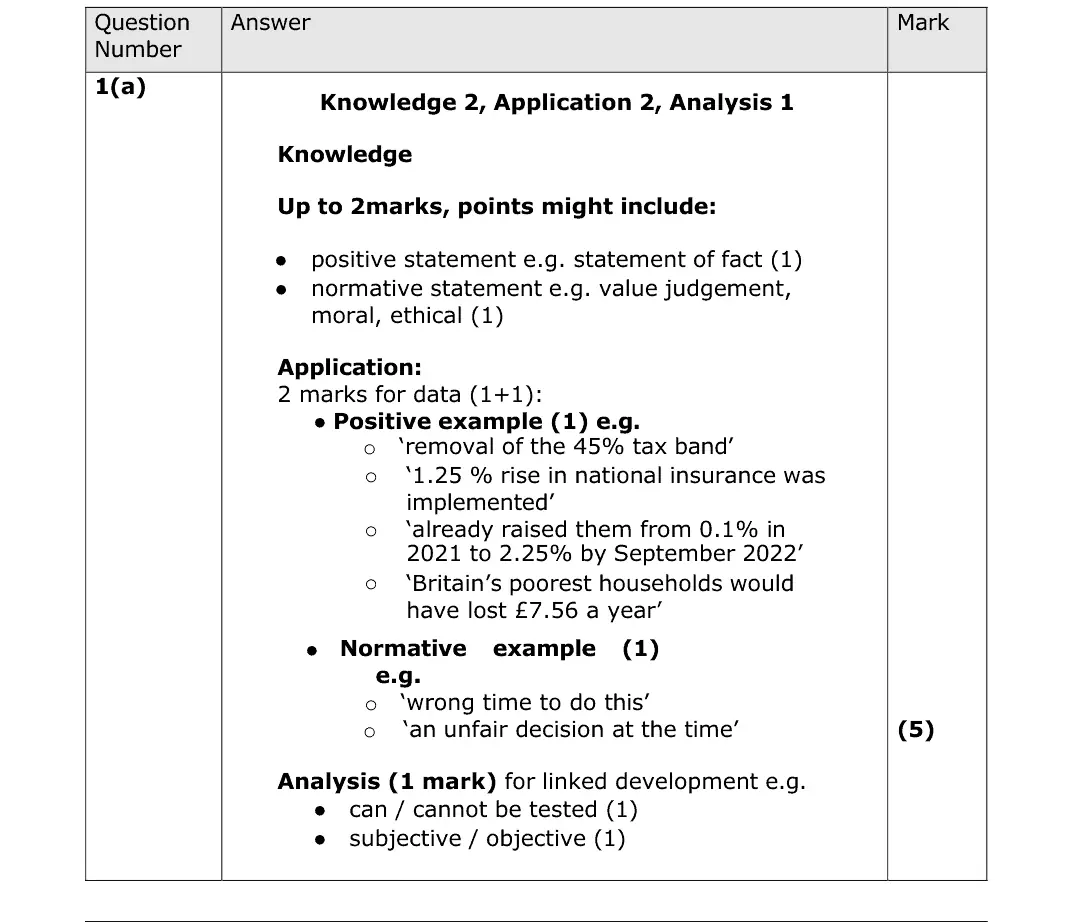
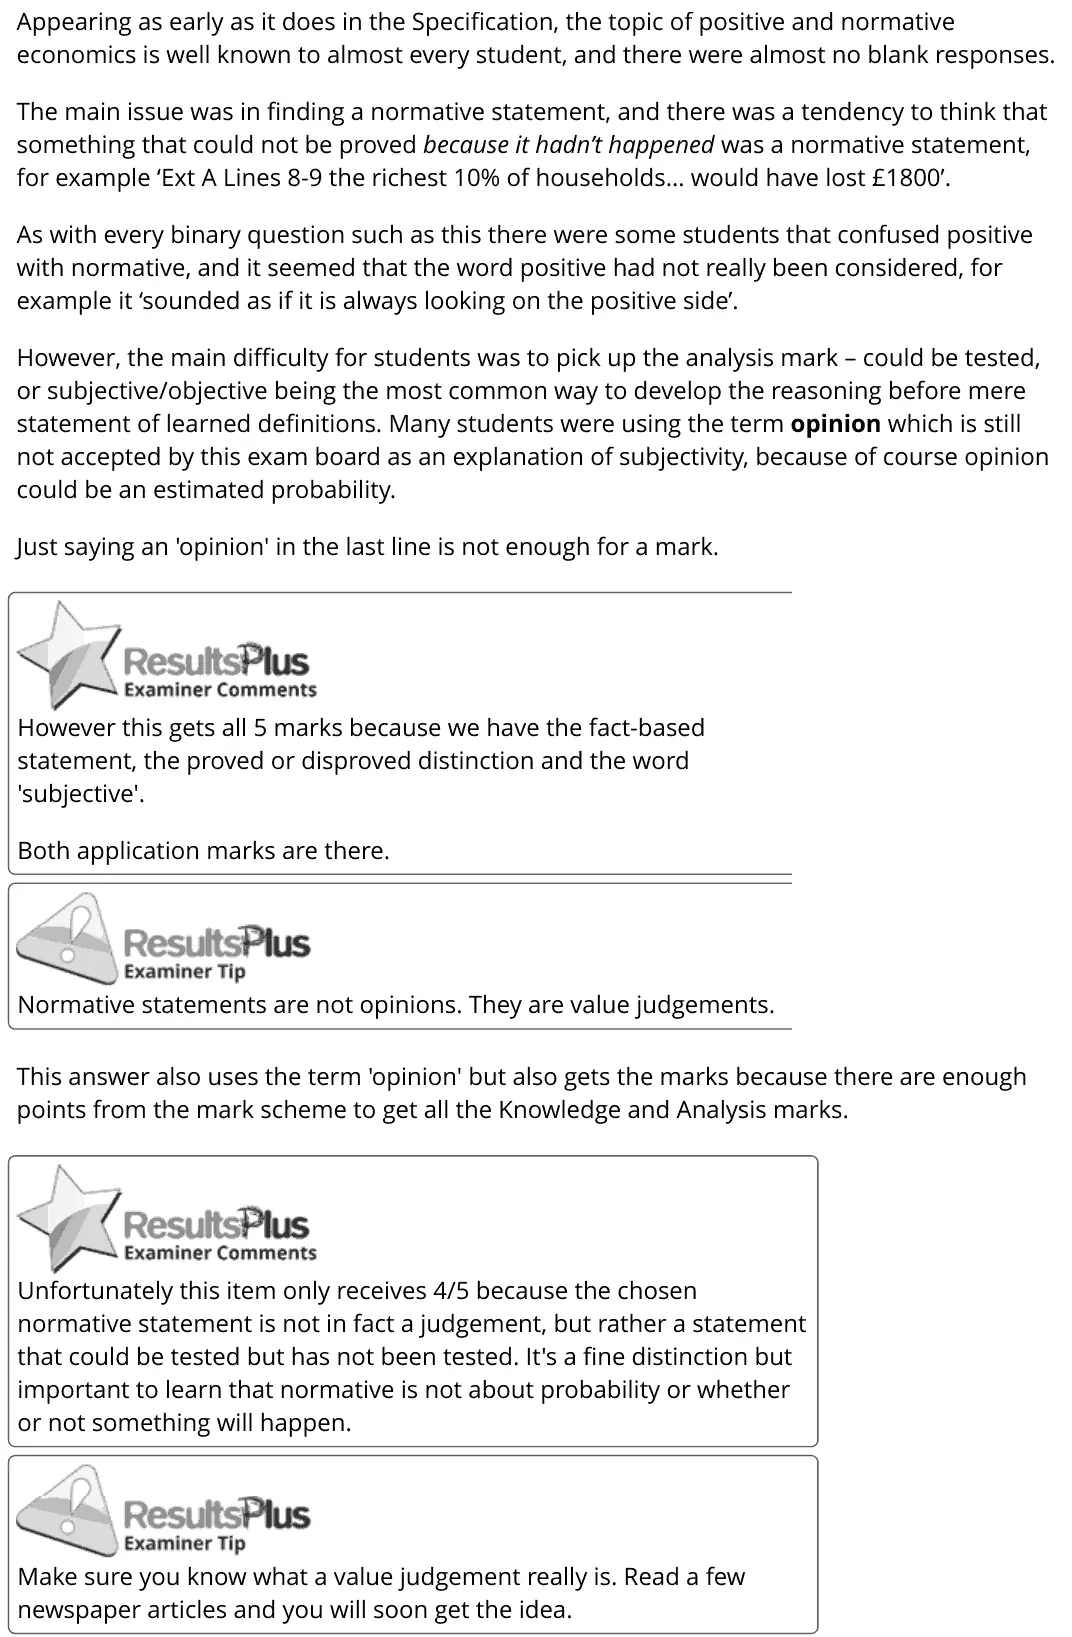
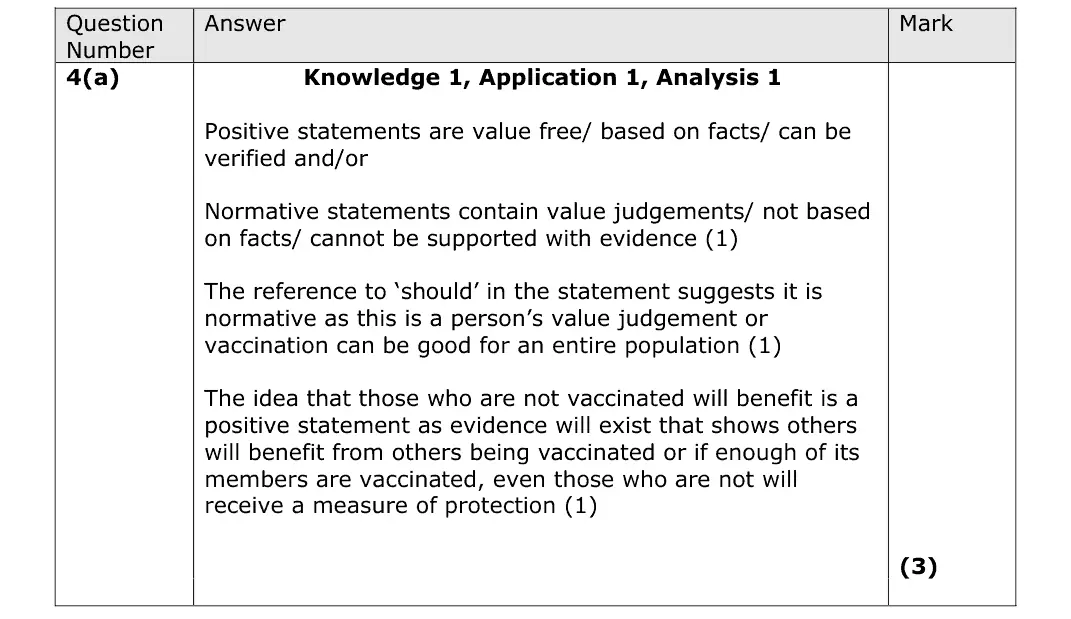
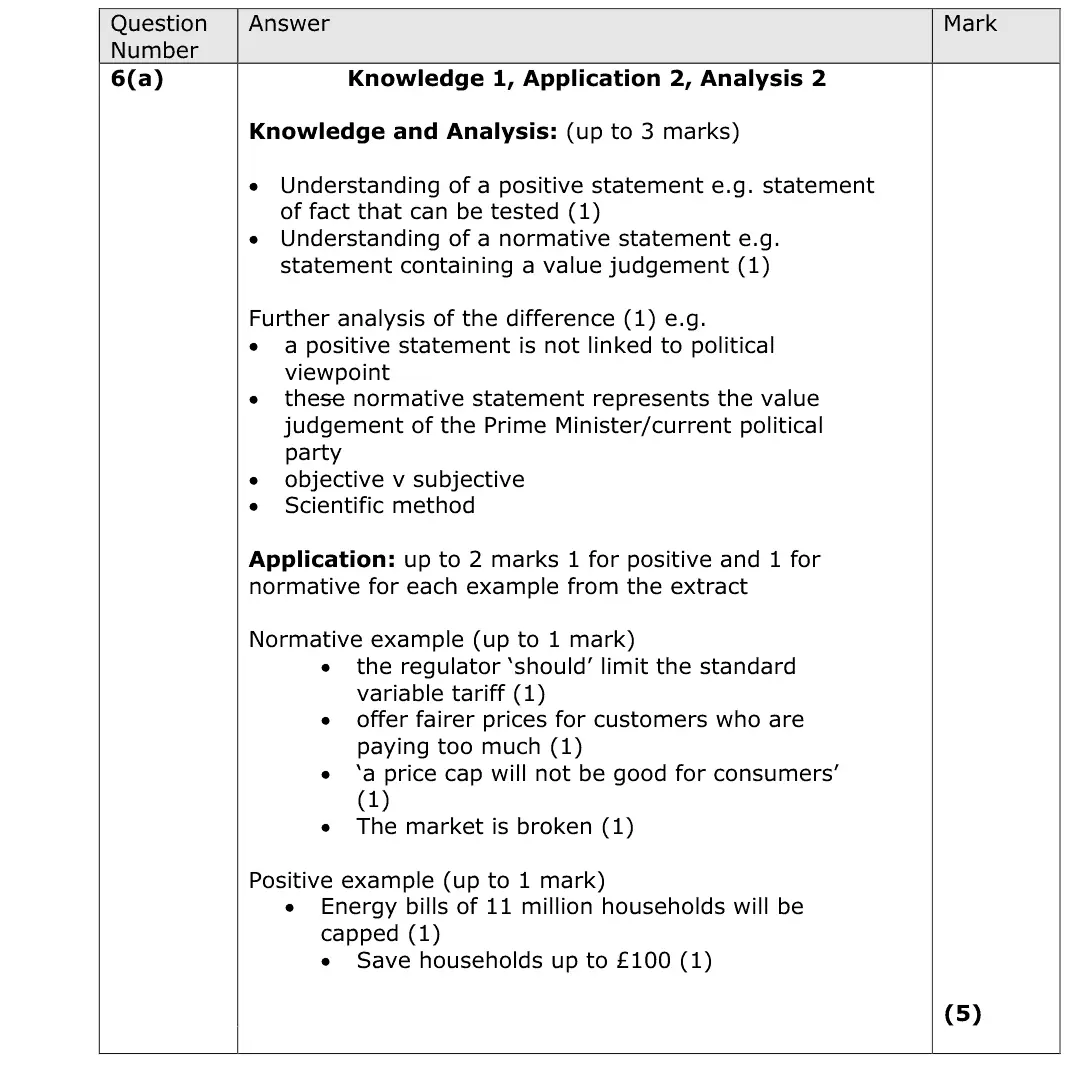
(d) Using examples from either Extract A or Extract B, explain what is meant by positive and normative economic statements. (4)
June 2025 · AS Paper 1 · Q6(e) 15 marks AO1=3, AO2=3, AO3=3, AO4=6 15-mark response externalities
Data and extracts for question 6Sources for use with SECTION B Read the following figures (1 and 2) and extracts (A and B) before answering Question 6. The market for meat and the growth of vegetarianism Figure 1 The impact of subsidies on farmer income, in England, 2018–2019 (£000 per farm) Cereals Dairy Grazing livestock Pigs Poultry Mixed -20 0 20 40 60 80 100 £000 per farm Key Profit Subsidies (Source: adapted from www.FT.com) Figure 2 Potential impact of indirect tax rises on meat prices per kg, 2023–2030 Before indirect After indirect Type of Meat tax increases tax increases Beef/Veal £24.24 £29.50 Chicken £7.60 £8.63 (Source: adapted from Tax beef, pork and chicken to help climate and health, EU urged – CGTN) Extract A The case for cutting out meat Around a third of Britons are reducing the amount of meat they eat or are cutting it out altogether. Are these consumers right to be cutting out meat? For a start, there are the greenhouse gases released as a result of producing food. The evidence is clear that switching to a plant-based diet would lower emissions. A UK study found that eating a 5 diet high in meat costs 7.2 kg carbon dioxide emissions per day, compared with 3.8 kg for vegetarians. It would also free up land for other uses. Nearly 80% of the world’s farmland is dedicated to rearing animals; a plant-based diet would cut the use of land for agriculture by 76%. The land currently used by grazing livestock could be used for “rewilding”, allowing the environment and animal species destroyed by meat farming to 10 recover. Our health and wealth would be better too. A study published in 2016 modelled what would happen to our health and the global economy if we all switched to vegetarian diets. The economic benefits of switching to plant-based diets could be as much as £700 billion to £1 trillion per year in terms of savings on healthcare costs and lost 15 working days due to ill health. Some economists recommend an increased indirect tax on animal products so that their prices reflect the cost of externalities. This could impact on European farmers, if adopted by the European Union. The tax could bring £35 billion to the EU, with around £15 billion of that going directly to farmers. The 20 rest would be used to bring down VAT on fruit and vegetables, and fund other policies to encourage healthy-eating diets both in and outside the EU. (Source: adapted from https://moneyweek.com/499842/the-economic- consequences-of-veganism December-28-2018) Extract B Businesses benefitting from meat-substitute products There is one group for whom the trend towards meat-substitute products is definitely a good thing: processed food manufacturers and retailers. Finest British beef burgers are priced at £6.61 per kg. The ‘fake burger’ (which is made mostly of pea protein) is priced at £21.81 per kg even though the ingredients used to 5 make them, such as mushrooms, peas and palm oil, are cheaper ingredients than meat. Despite high prices, demand continues to rise for these products. This might benefit shareholders, but is it doing any real good for the rest of us? A large food producer bought meat-substitute product maker Vegetarian Butcher in December 2018 and is moving towards a range with more meat-substitute products. 10 In 2017, Nestlé bought Sweet Earth, a California-based maker of vegetarian foods, and it is launching its own meat-substitute ‘Incredible Burger’. It expects its meat-substitute revenues to reach $1 billion by 2029. As subsidies are being cut in every area of farming, consumers ought to be willing to pay higher prices for all food products. If farmers are to stay in business, they need to find 15 additional sources of revenue such as oyster mushrooms, goji berries and basil. (Source: adapted from http://www.financialtimes.com/the-veganism-boom-does- more-for-food-company-profits-than-the-planet February-22-2019)
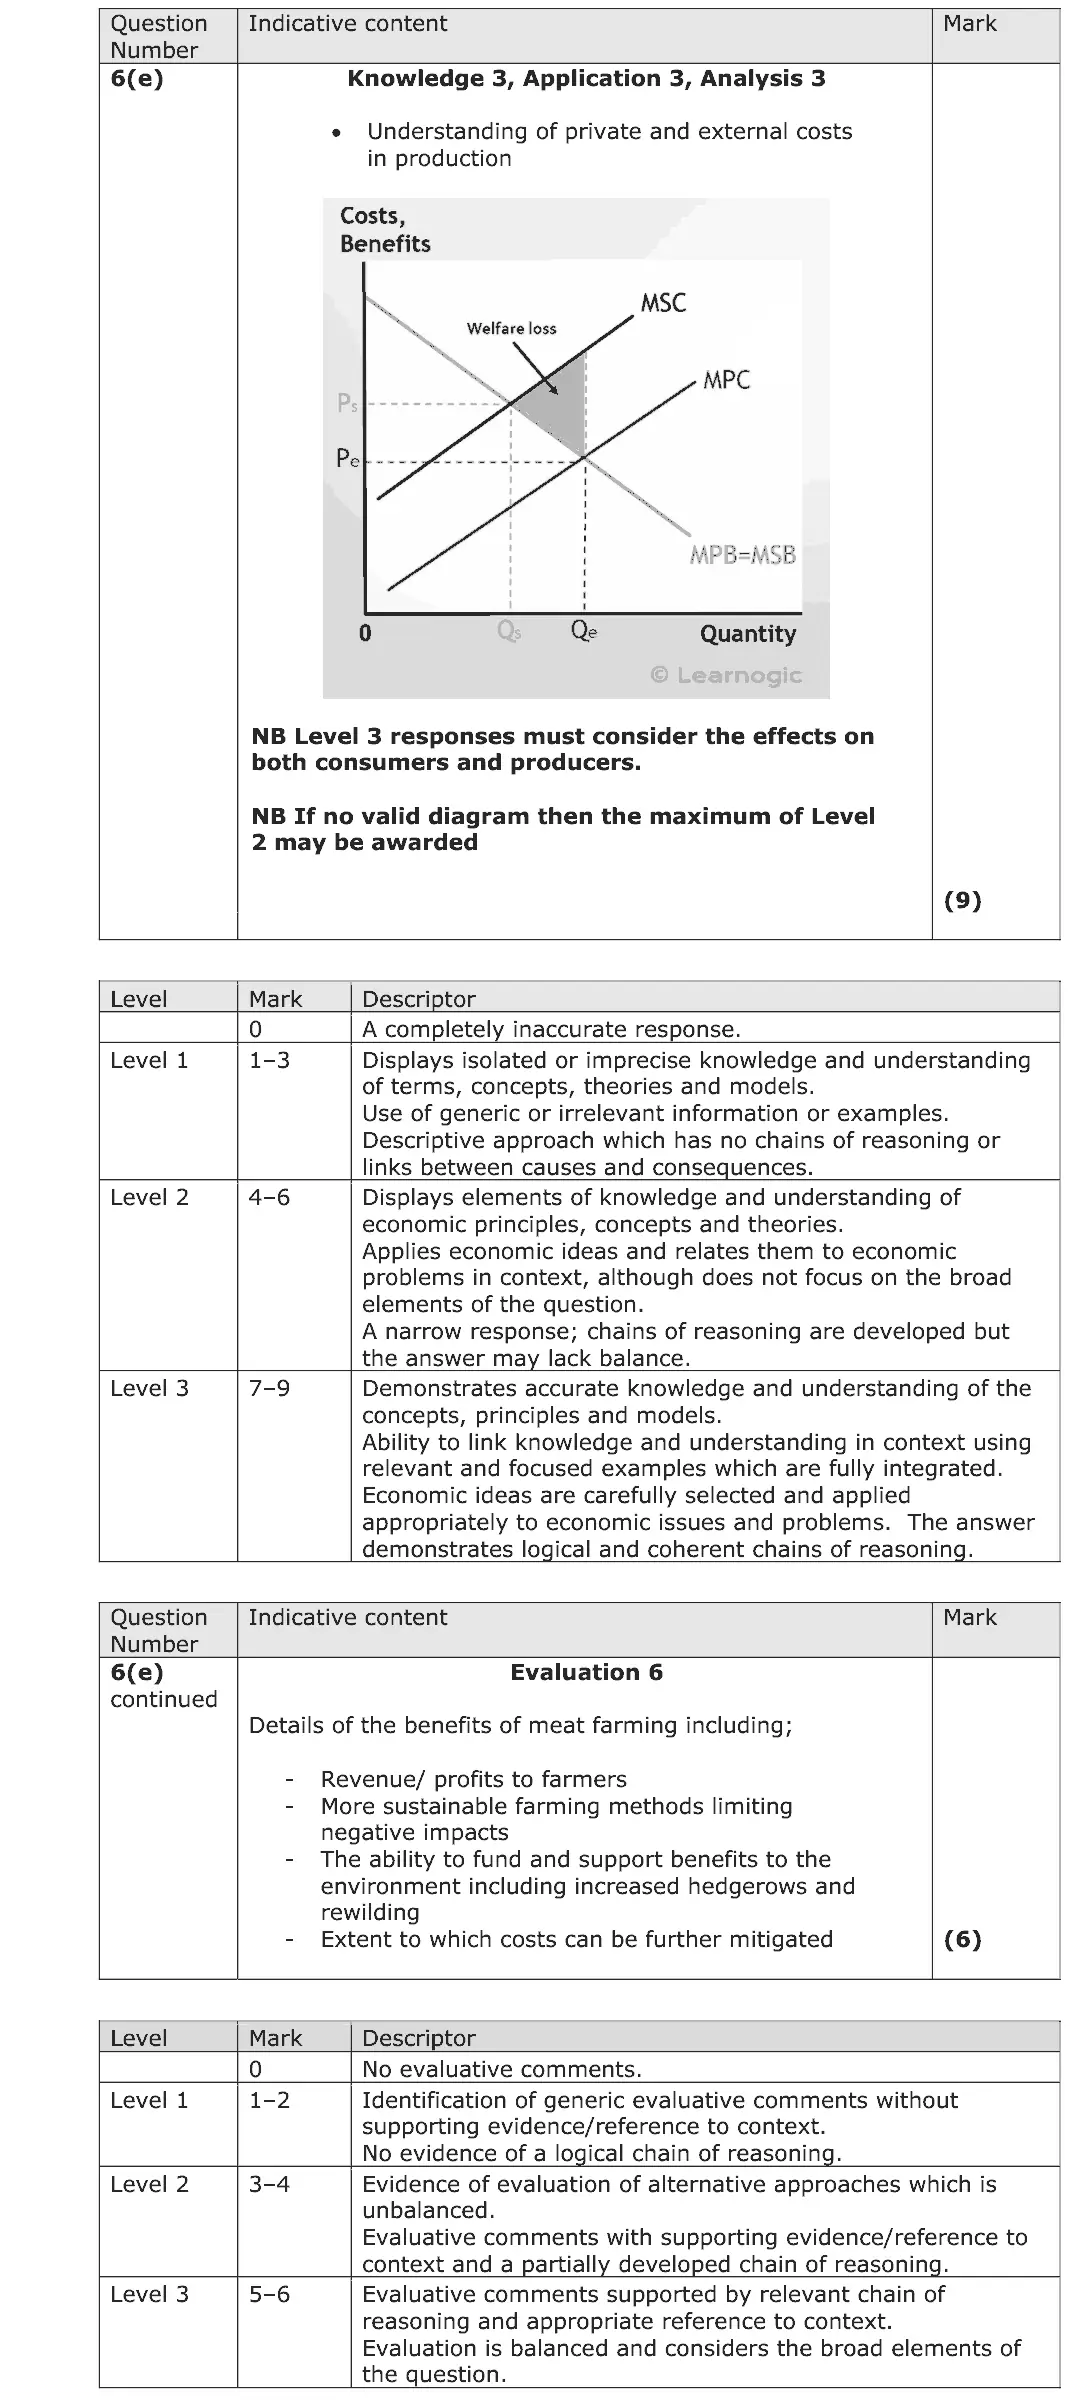
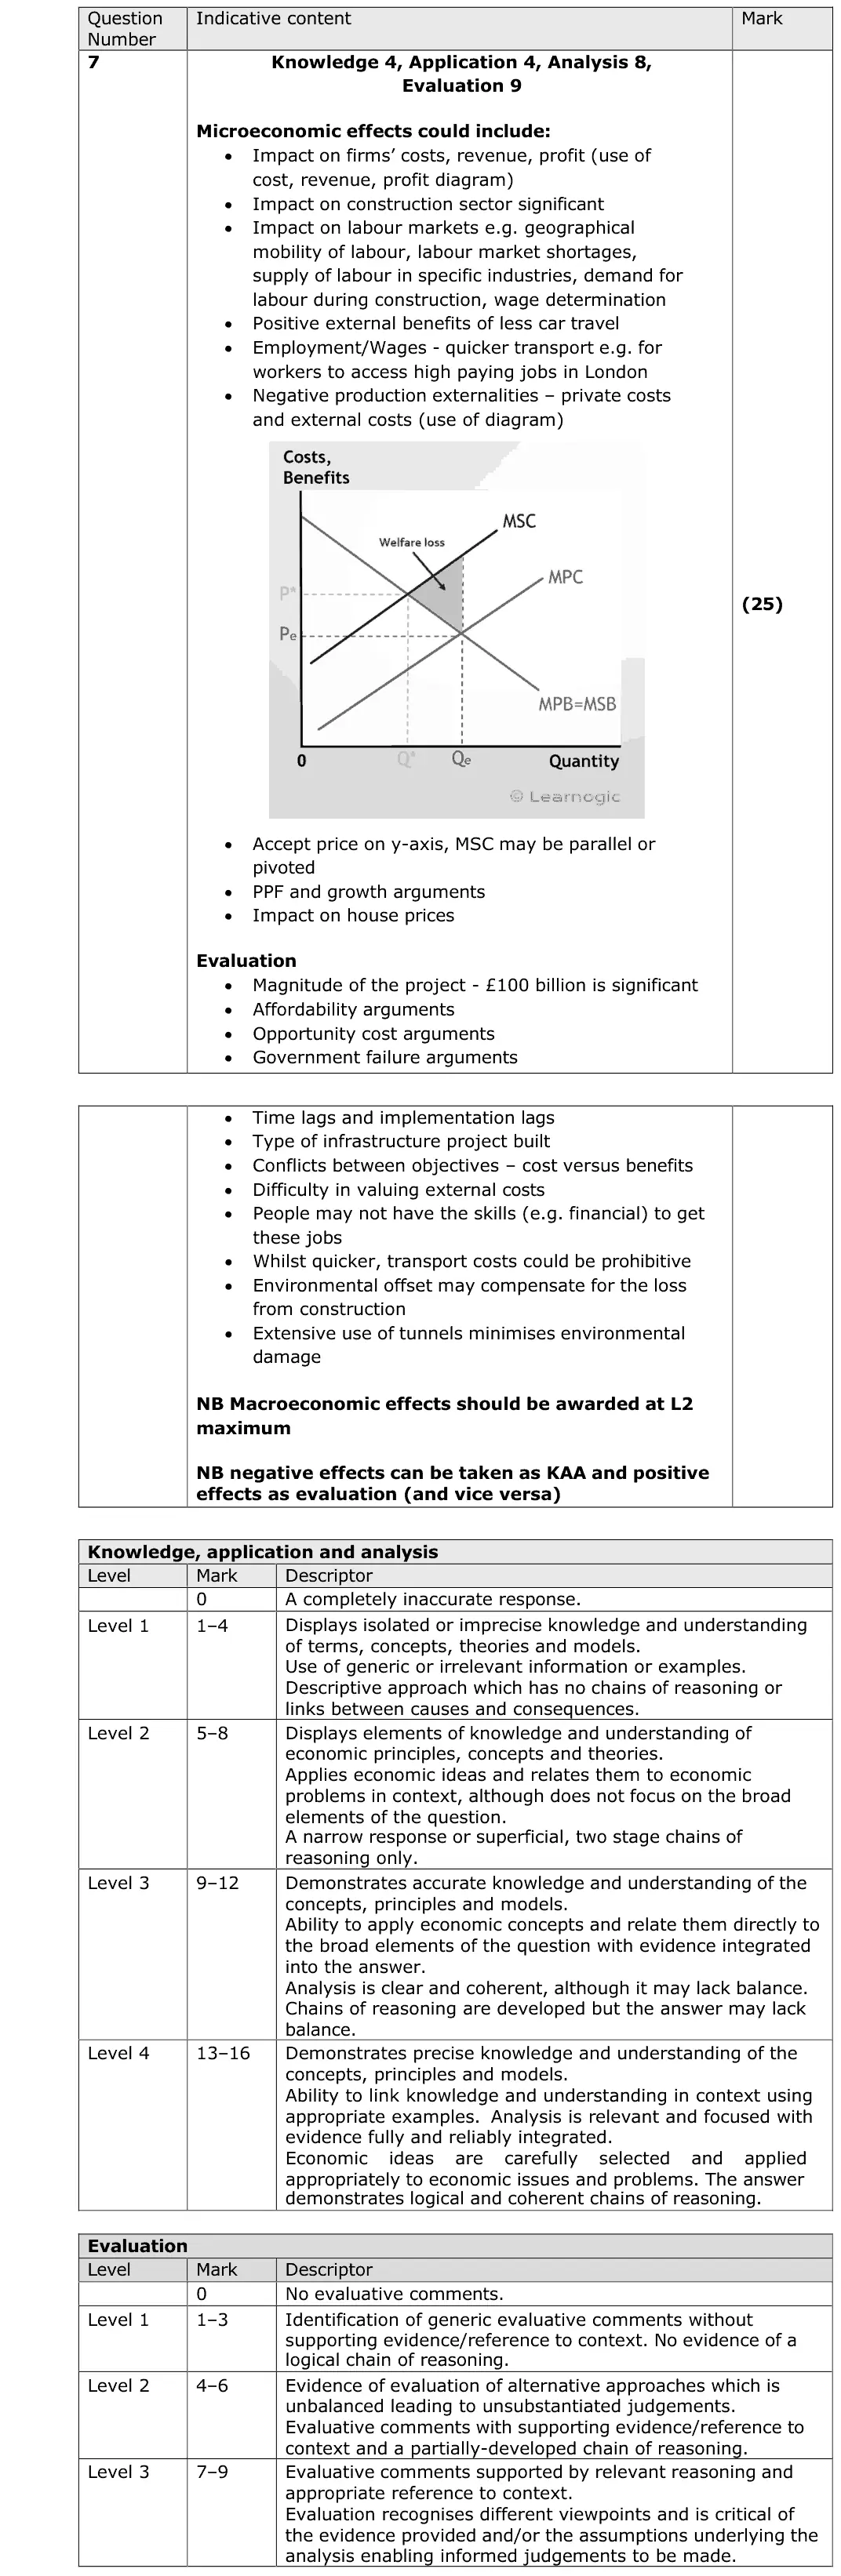
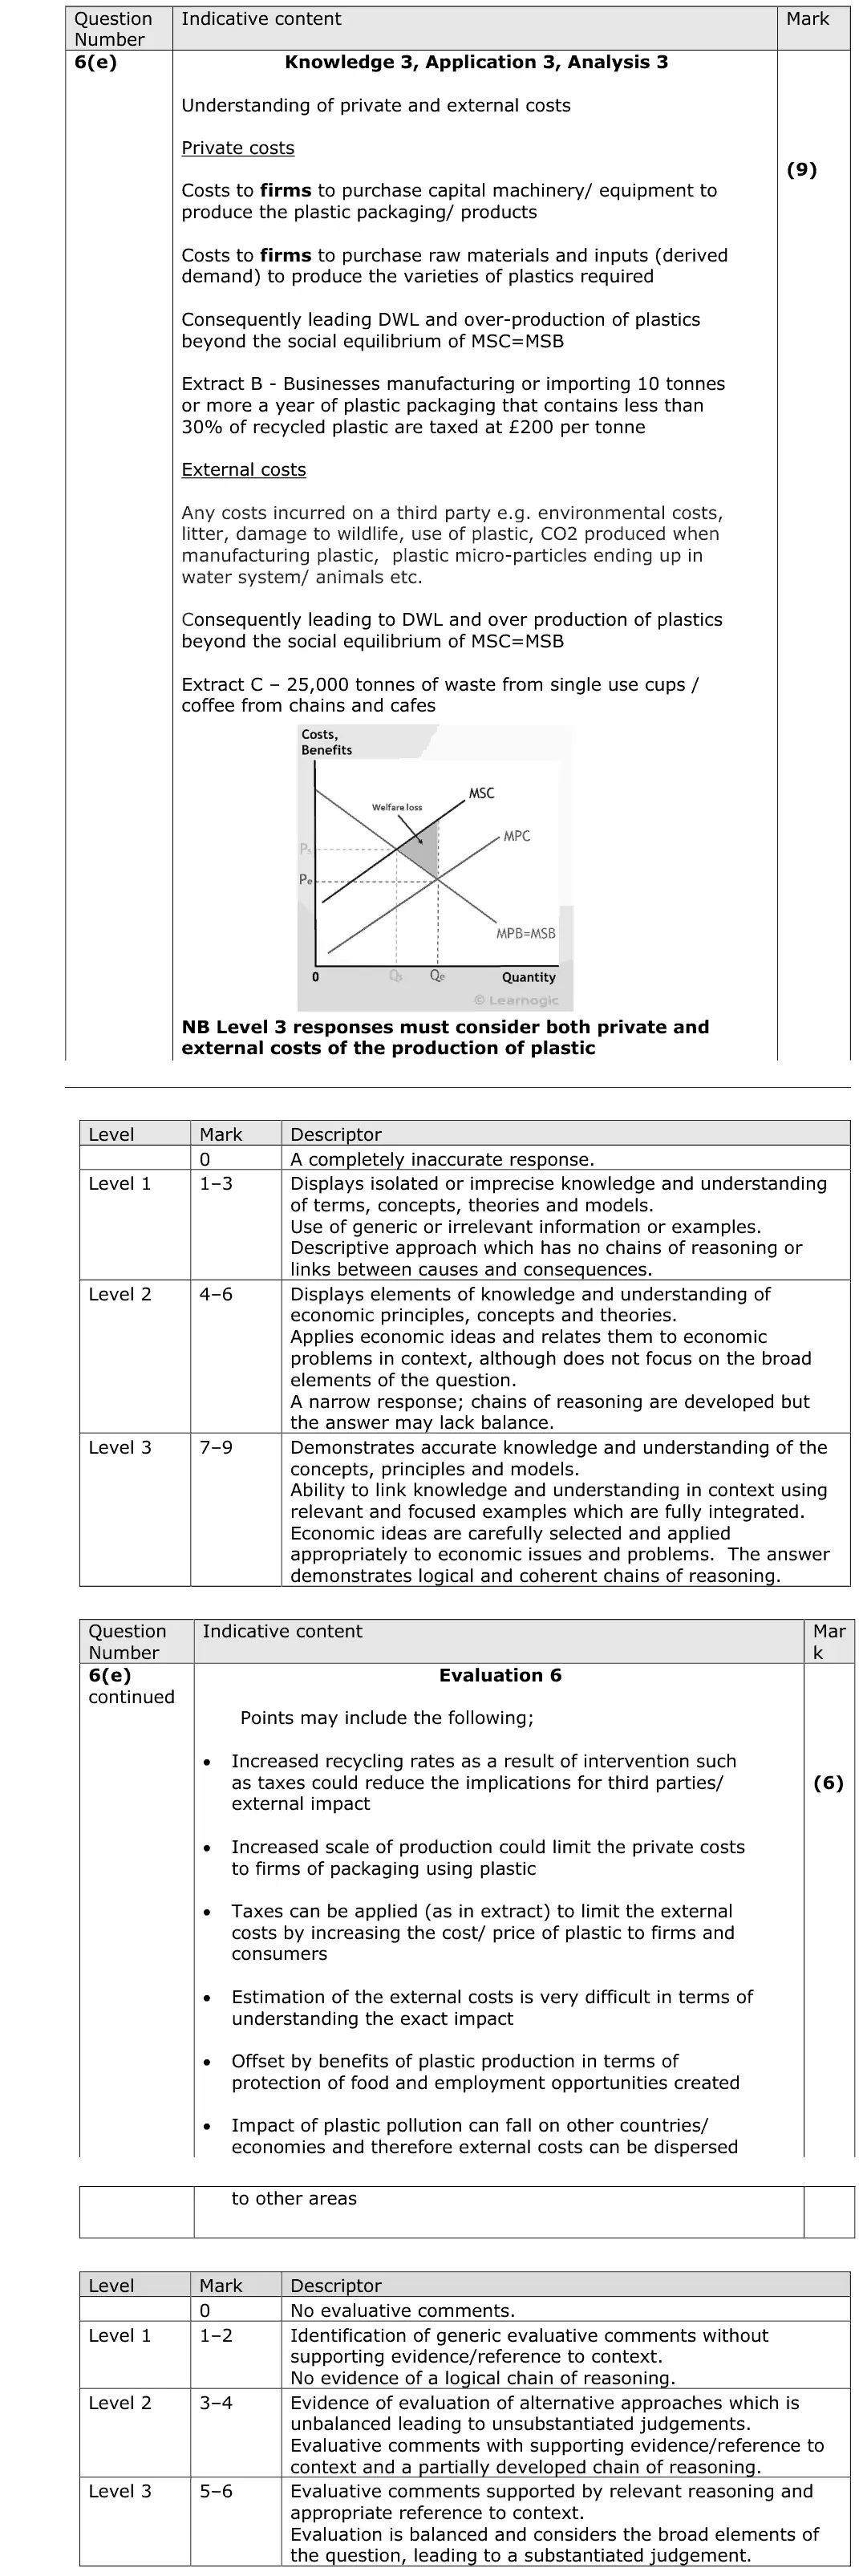
(e) With reference to Extract A, discuss the likely private costs and external costs caused by meat farming. Use an appropriate diagram in your answer. (15)
June 2025 · AS Paper 1 · Q6(f) 20 marks AO1=4, AO2=4, AO3=6, AO4=6 20-mark essay Either/or Hard government intervention in marketsindirect taxes and subsidies
Data and extracts for question 6Sources for use with SECTION B Read the following figures (1 and 2) and extracts (A and B) before answering Question 6. The market for meat and the growth of vegetarianism Figure 1 The impact of subsidies on farmer income, in England, 2018–2019 (£000 per farm) Cereals Dairy Grazing livestock Pigs Poultry Mixed -20 0 20 40 60 80 100 £000 per farm Key Profit Subsidies (Source: adapted from www.FT.com) Figure 2 Potential impact of indirect tax rises on meat prices per kg, 2023–2030 Before indirect After indirect Type of Meat tax increases tax increases Beef/Veal £24.24 £29.50 Chicken £7.60 £8.63 (Source: adapted from Tax beef, pork and chicken to help climate and health, EU urged – CGTN) Extract A The case for cutting out meat Around a third of Britons are reducing the amount of meat they eat or are cutting it out altogether. Are these consumers right to be cutting out meat? For a start, there are the greenhouse gases released as a result of producing food. The evidence is clear that switching to a plant-based diet would lower emissions. A UK study found that eating a 5 diet high in meat costs 7.2 kg carbon dioxide emissions per day, compared with 3.8 kg for vegetarians. It would also free up land for other uses. Nearly 80% of the world’s farmland is dedicated to rearing animals; a plant-based diet would cut the use of land for agriculture by 76%. The land currently used by grazing livestock could be used for “rewilding”, allowing the environment and animal species destroyed by meat farming to 10 recover. Our health and wealth would be better too. A study published in 2016 modelled what would happen to our health and the global economy if we all switched to vegetarian diets. The economic benefits of switching to plant-based diets could be as much as £700 billion to £1 trillion per year in terms of savings on healthcare costs and lost 15 working days due to ill health. Some economists recommend an increased indirect tax on animal products so that their prices reflect the cost of externalities. This could impact on European farmers, if adopted by the European Union. The tax could bring £35 billion to the EU, with around £15 billion of that going directly to farmers. The 20 rest would be used to bring down VAT on fruit and vegetables, and fund other policies to encourage healthy-eating diets both in and outside the EU. (Source: adapted from https://moneyweek.com/499842/the-economic- consequences-of-veganism December-28-2018) Extract B Businesses benefitting from meat-substitute products There is one group for whom the trend towards meat-substitute products is definitely a good thing: processed food manufacturers and retailers. Finest British beef burgers are priced at £6.61 per kg. The ‘fake burger’ (which is made mostly of pea protein) is priced at £21.81 per kg even though the ingredients used to 5 make them, such as mushrooms, peas and palm oil, are cheaper ingredients than meat. Despite high prices, demand continues to rise for these products. This might benefit shareholders, but is it doing any real good for the rest of us? A large food producer bought meat-substitute product maker Vegetarian Butcher in December 2018 and is moving towards a range with more meat-substitute products. 10 In 2017, Nestlé bought Sweet Earth, a California-based maker of vegetarian foods, and it is launching its own meat-substitute ‘Incredible Burger’. It expects its meat-substitute revenues to reach $1 billion by 2029. As subsidies are being cut in every area of farming, consumers ought to be willing to pay higher prices for all food products. If farmers are to stay in business, they need to find 15 additional sources of revenue such as oyster mushrooms, goji berries and basil. (Source: adapted from http://www.financialtimes.com/the-veganism-boom-does- more-for-food-company-profits-than-the-planet February-22-2019)
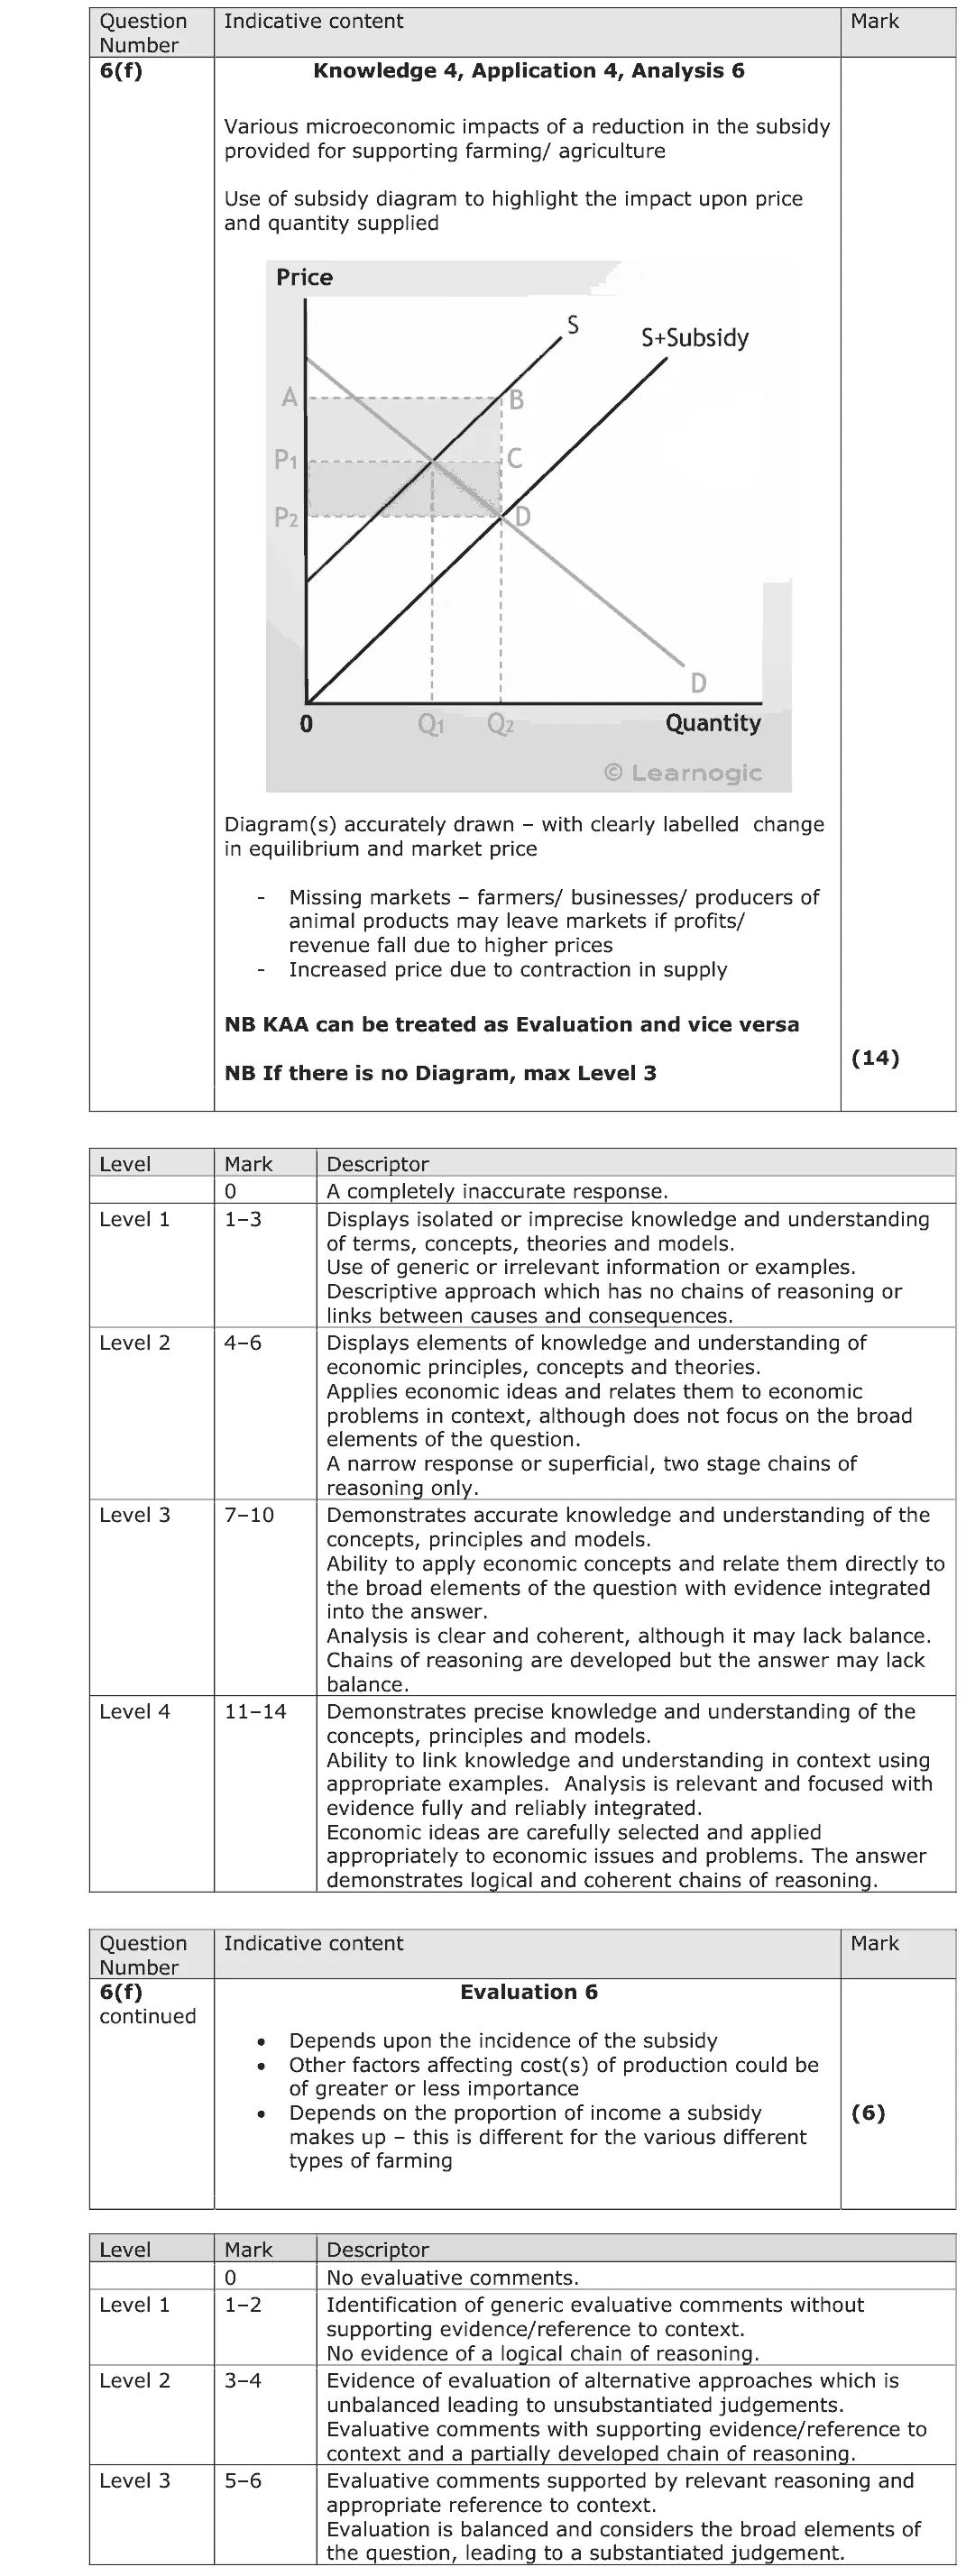
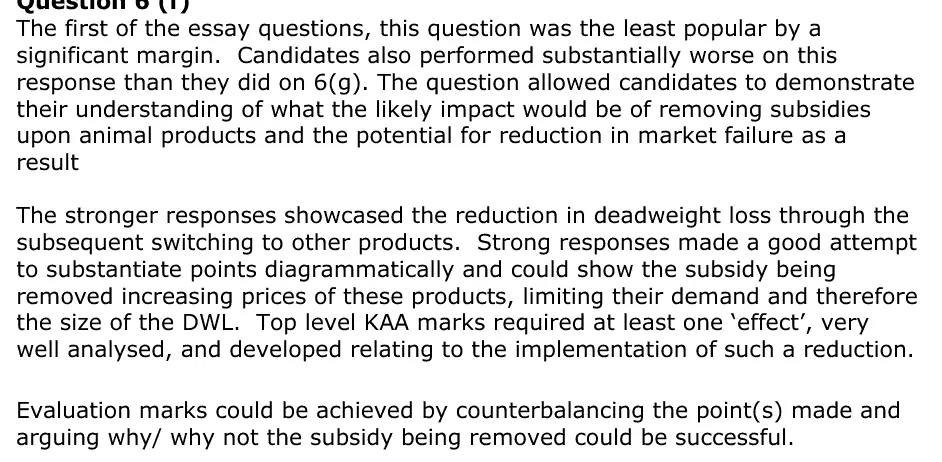
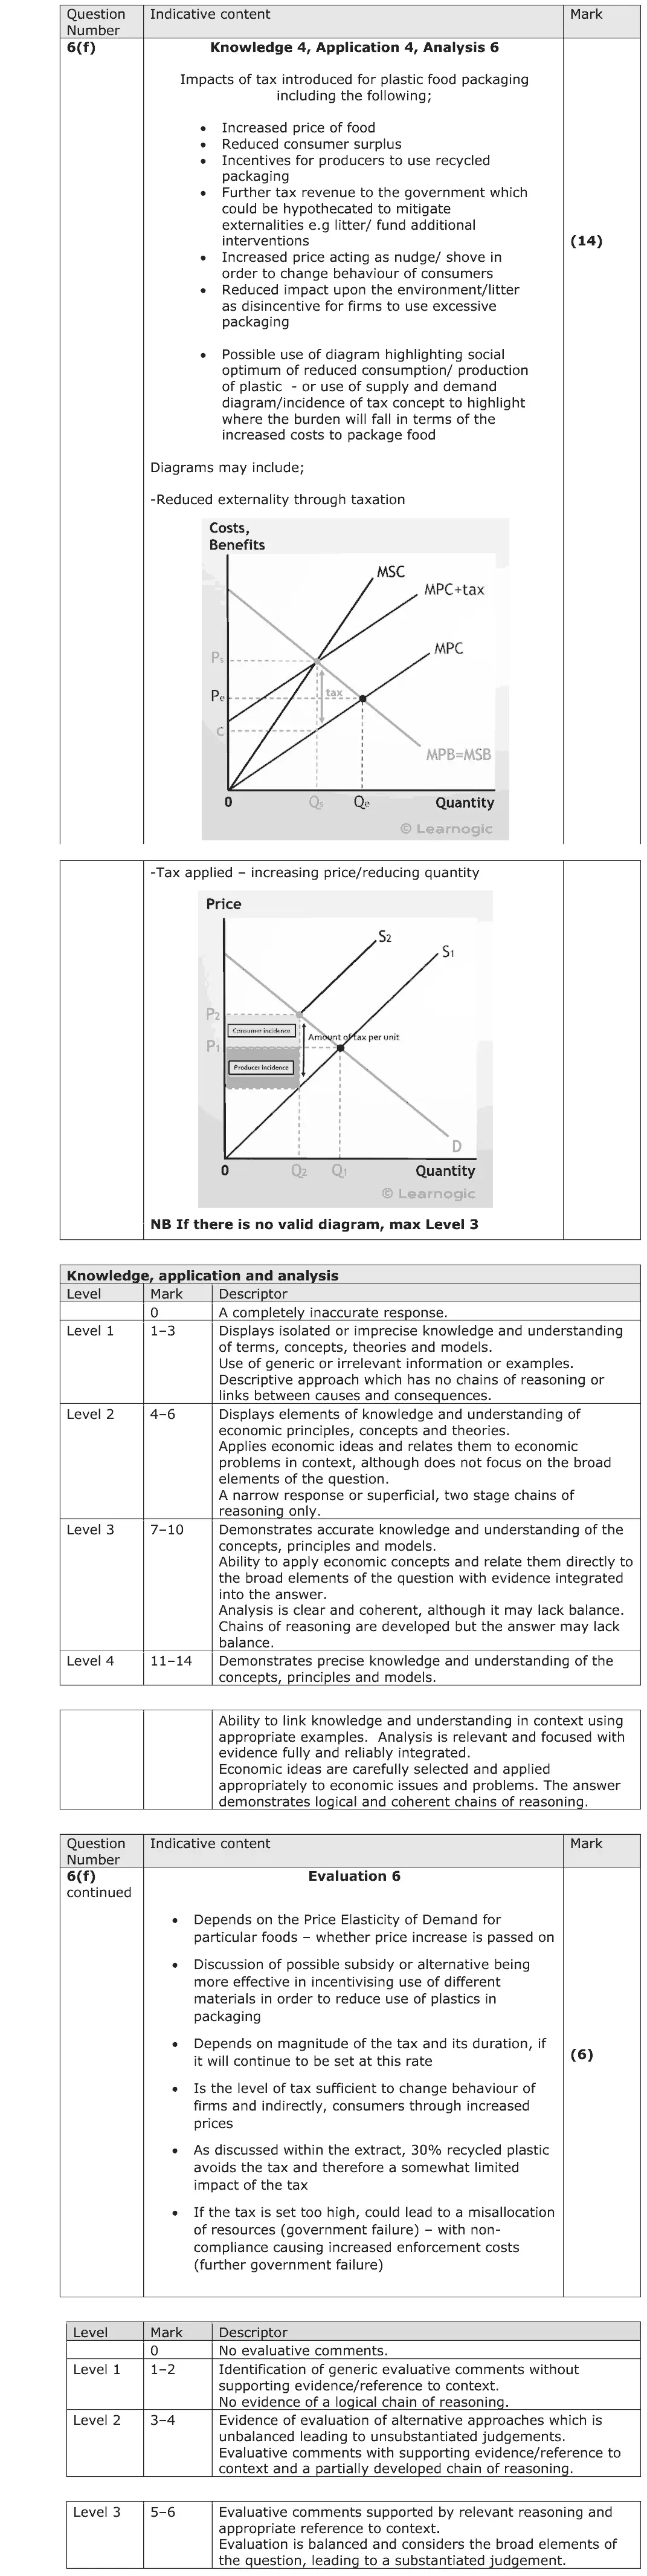
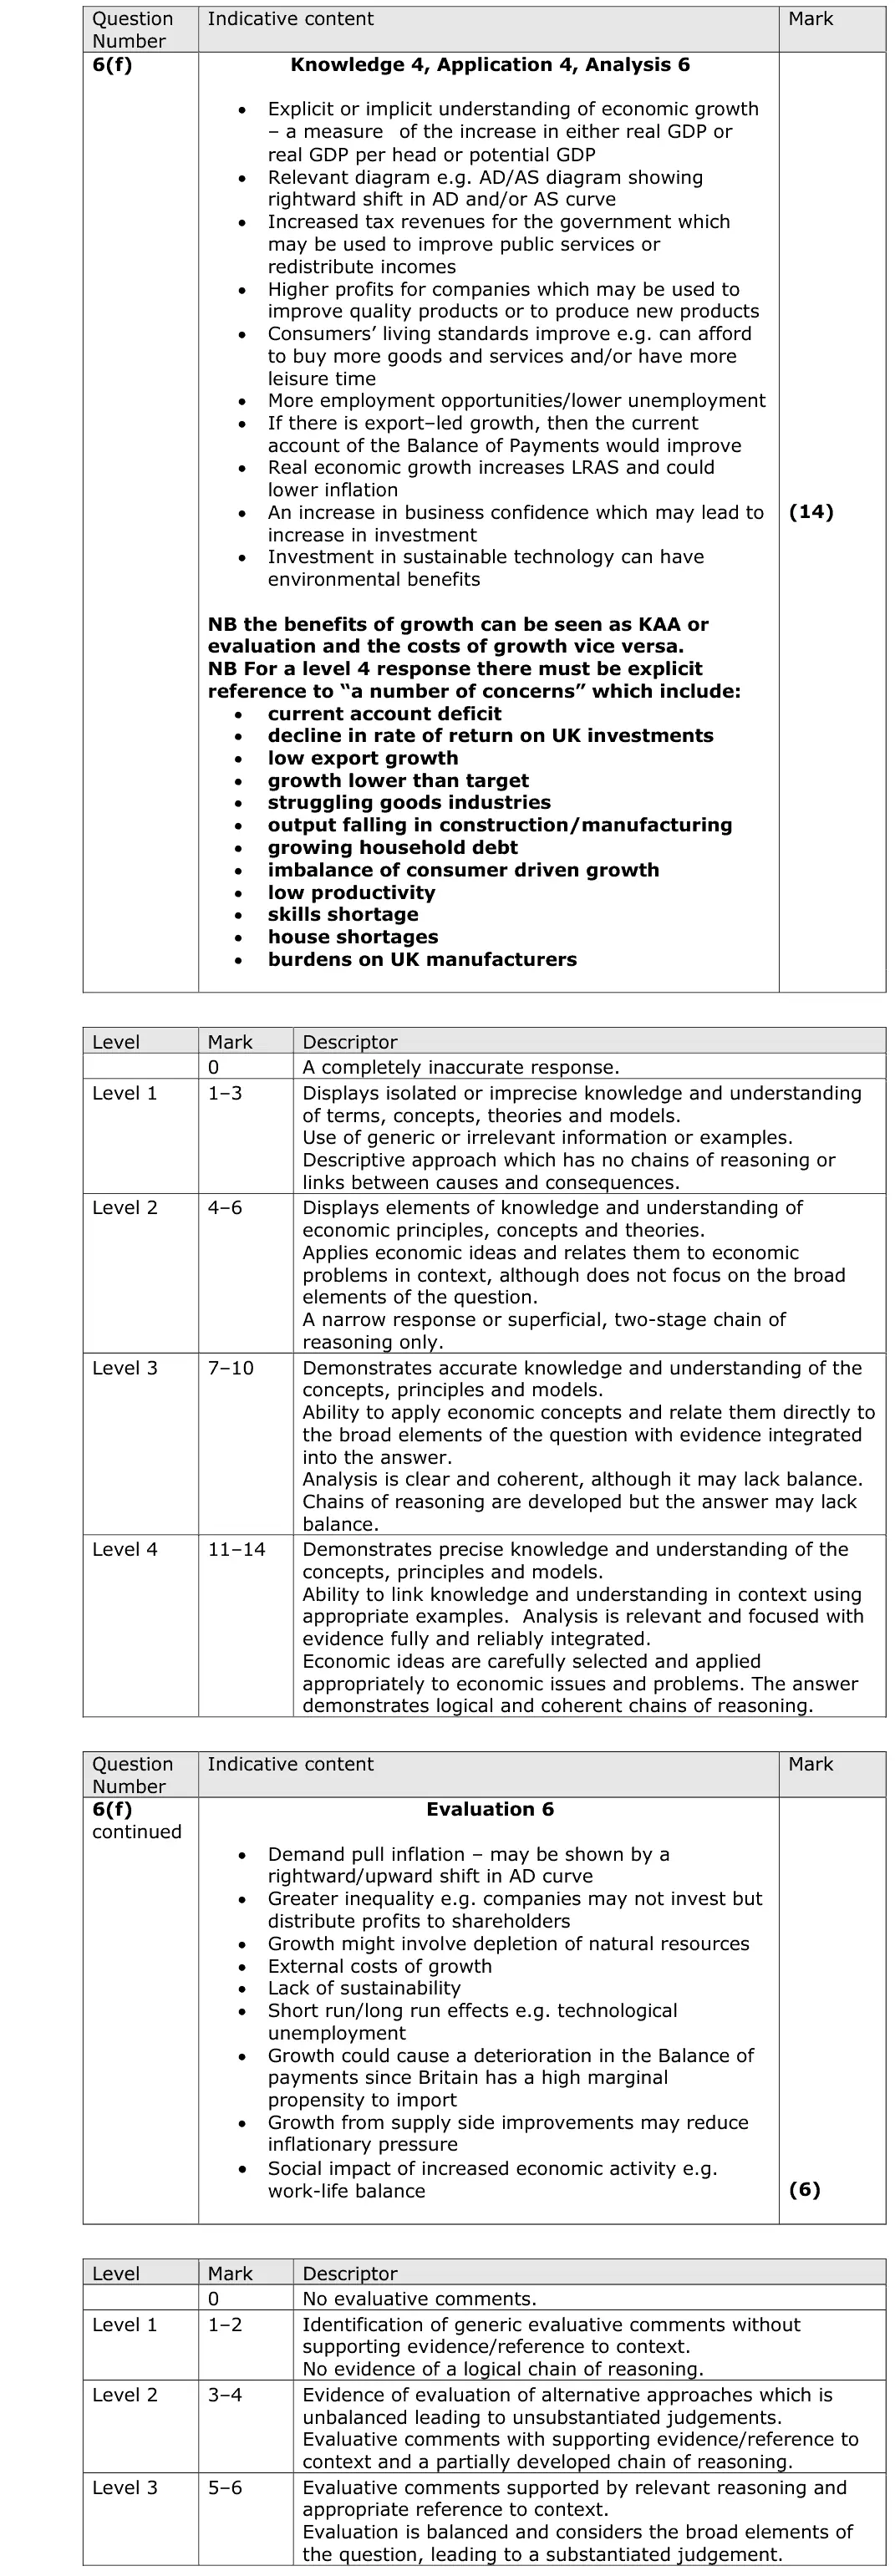
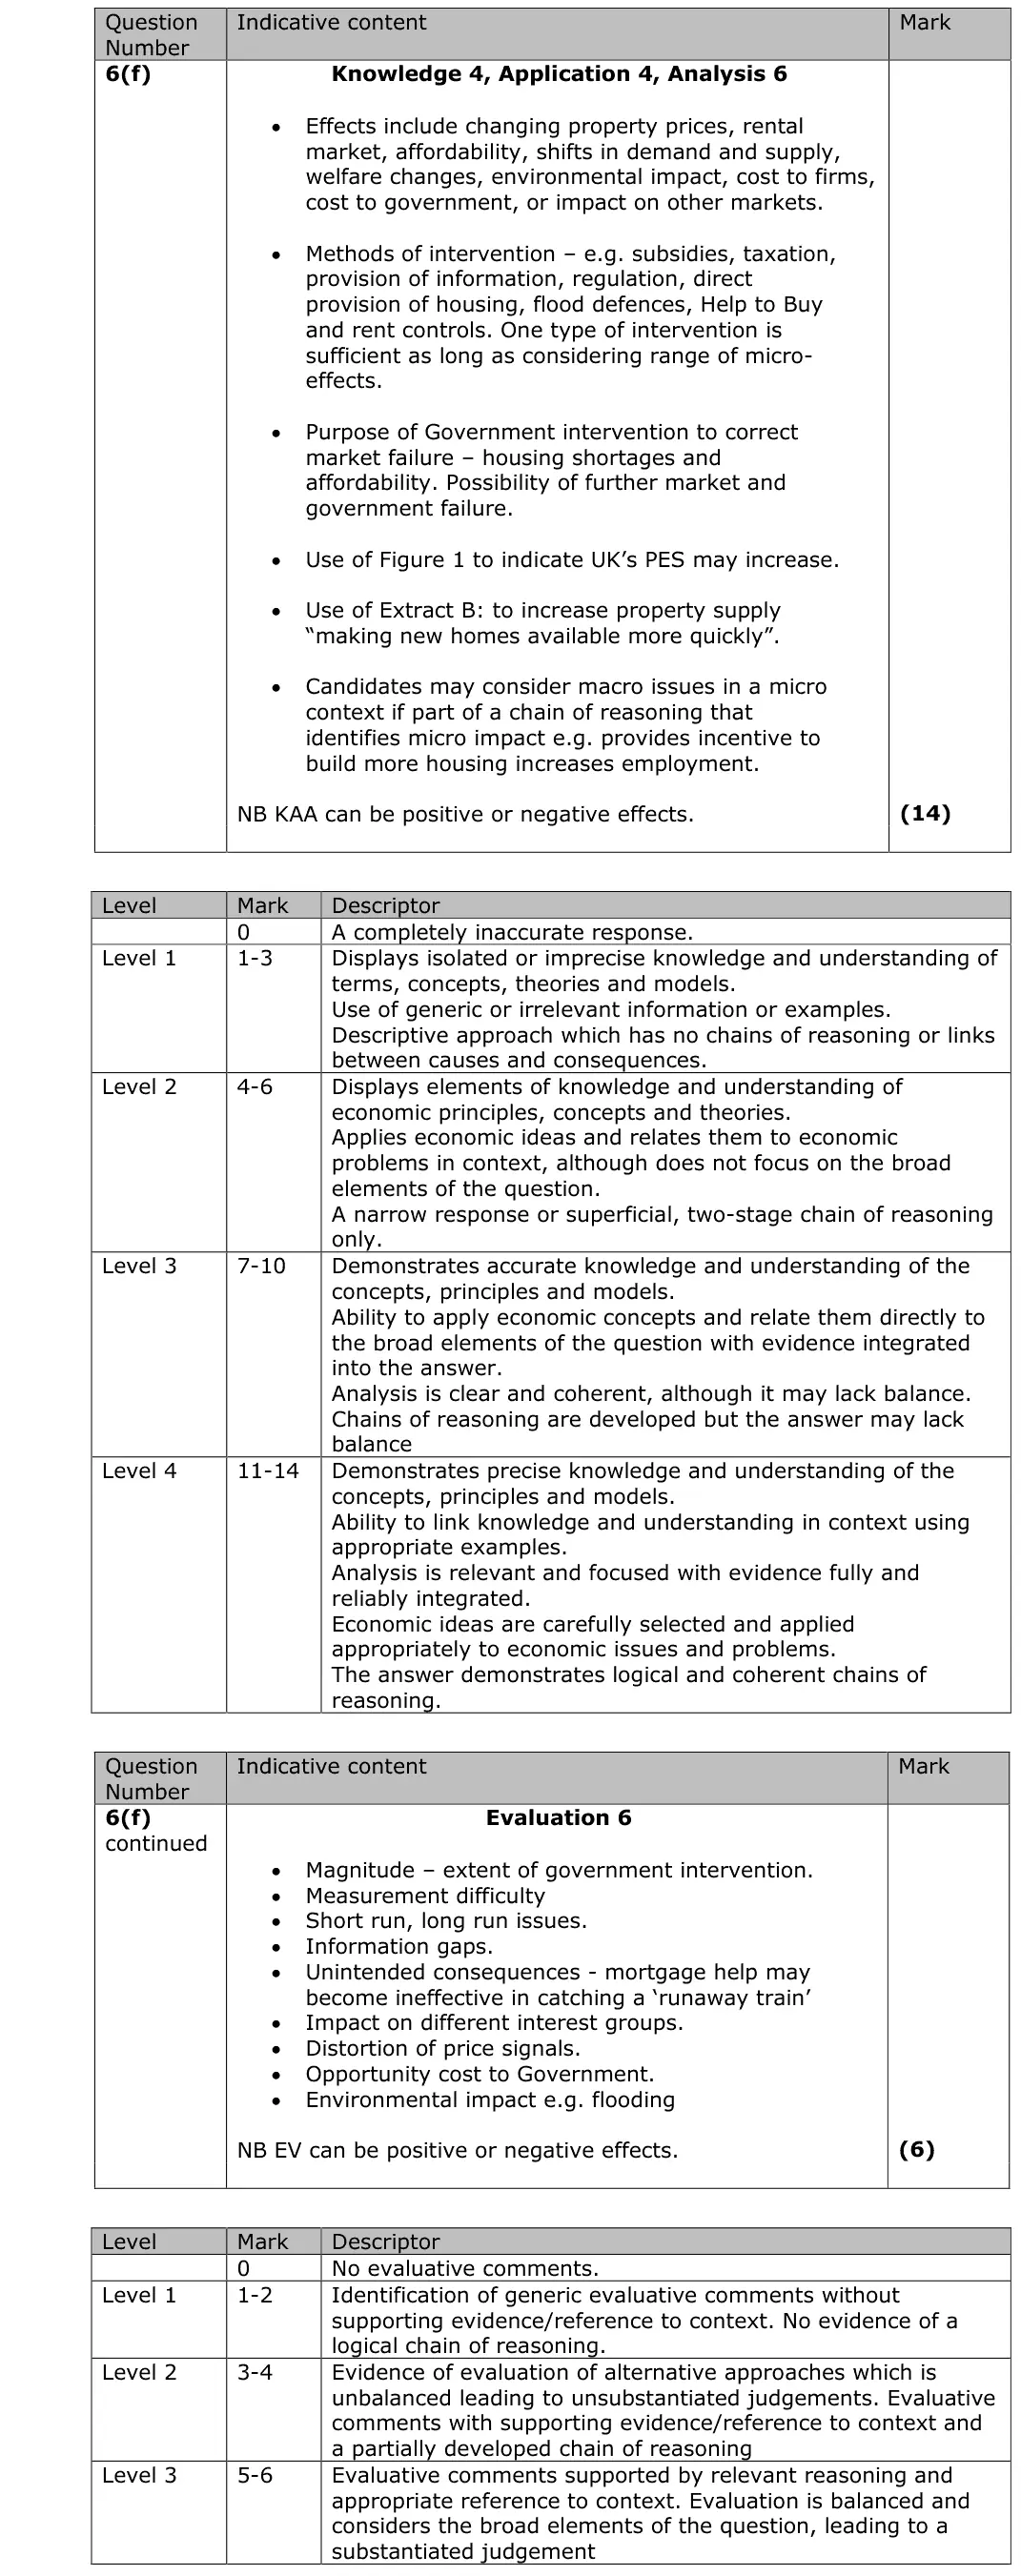
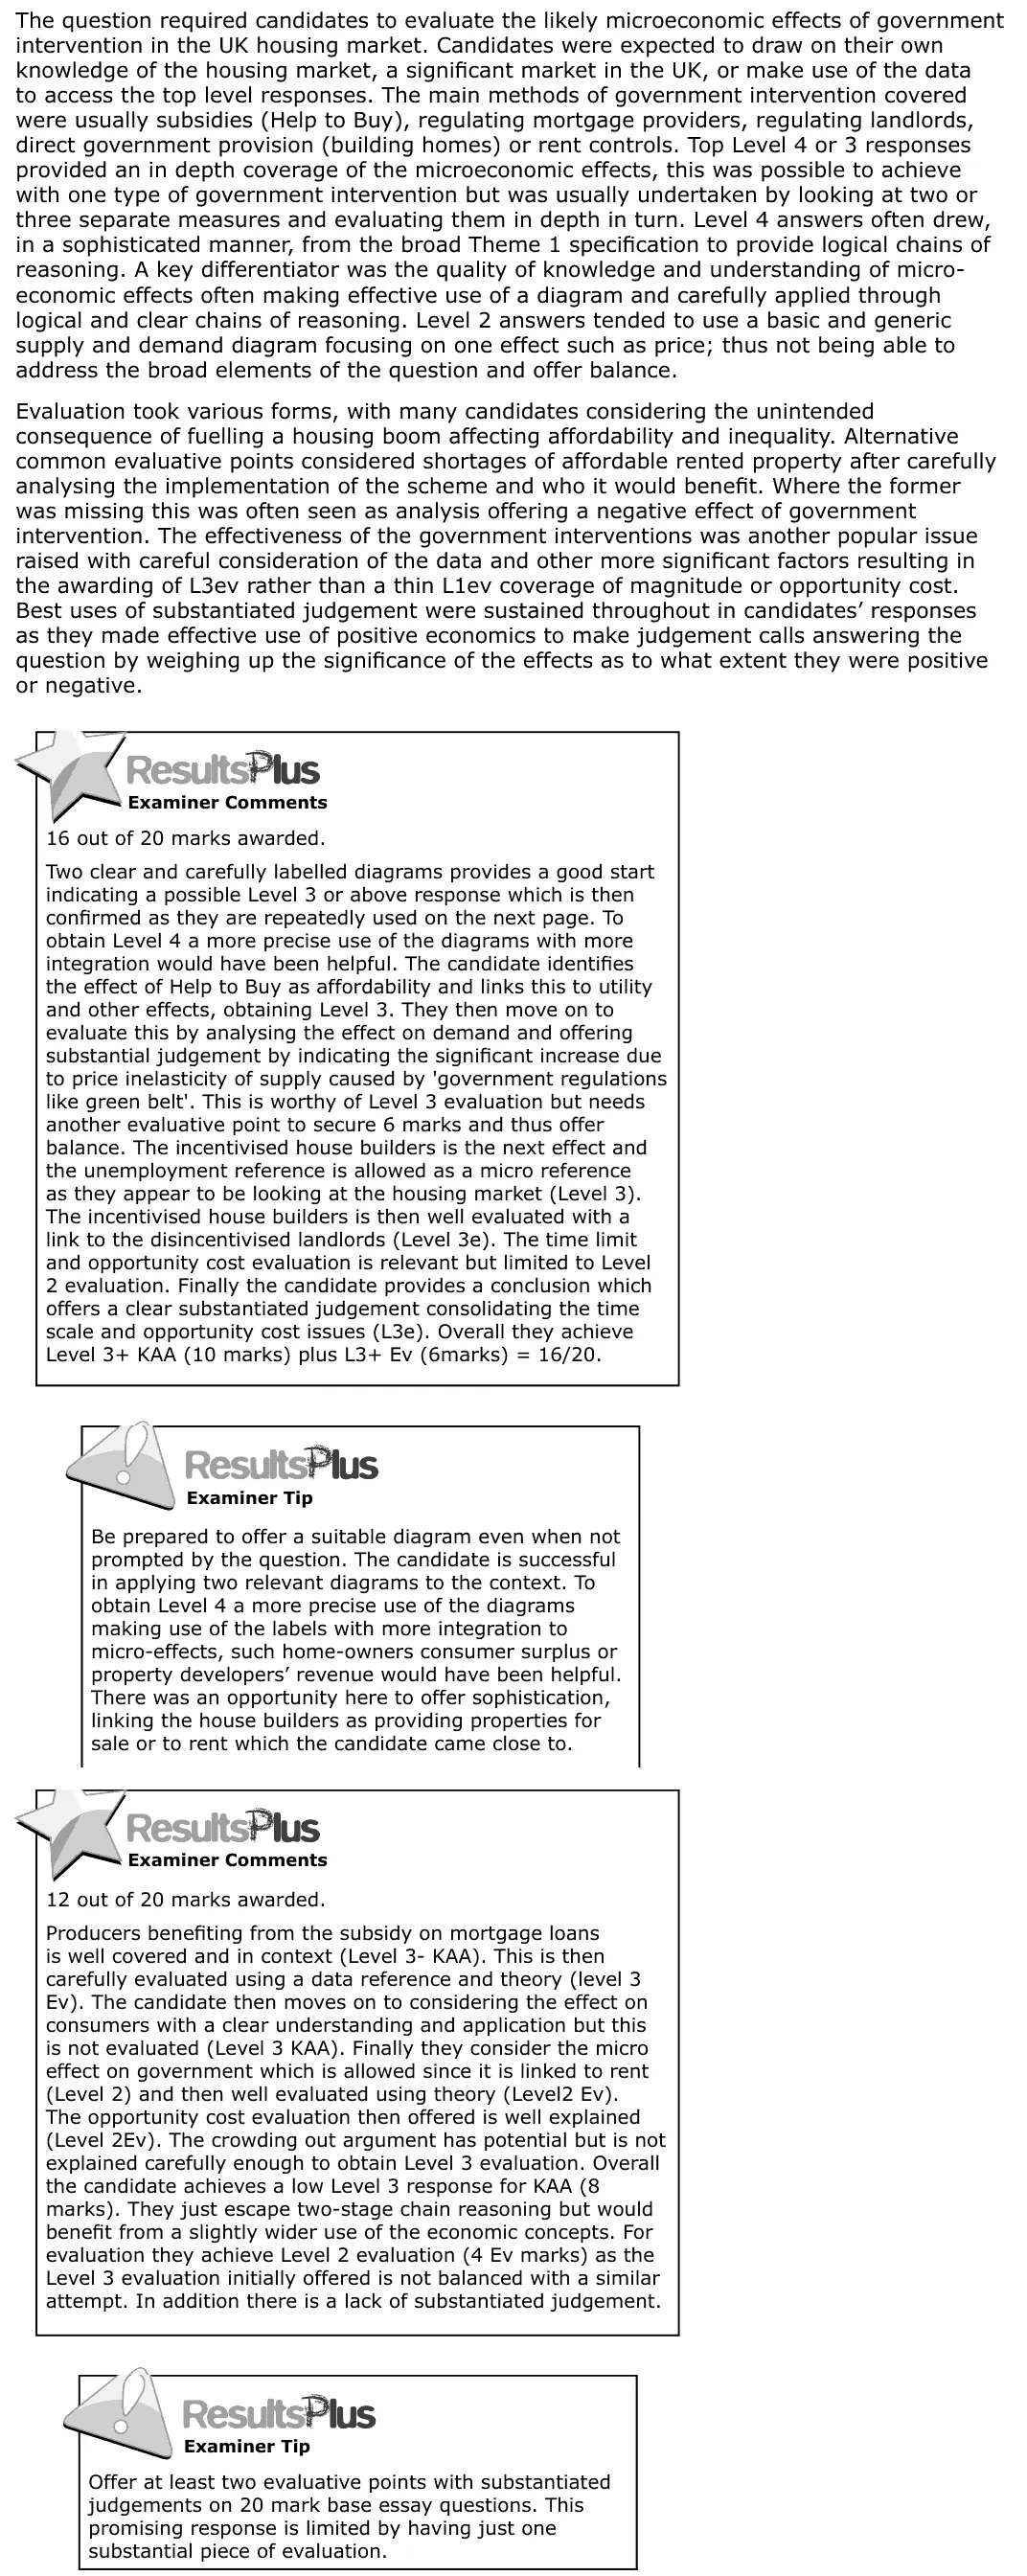
(f) Evaluate the likely microeconomic effects of a reduction in subsidies to farmers of animal products (Figure 1 and Extract B, line 14). Use a relevant diagram to support your answer. (20)
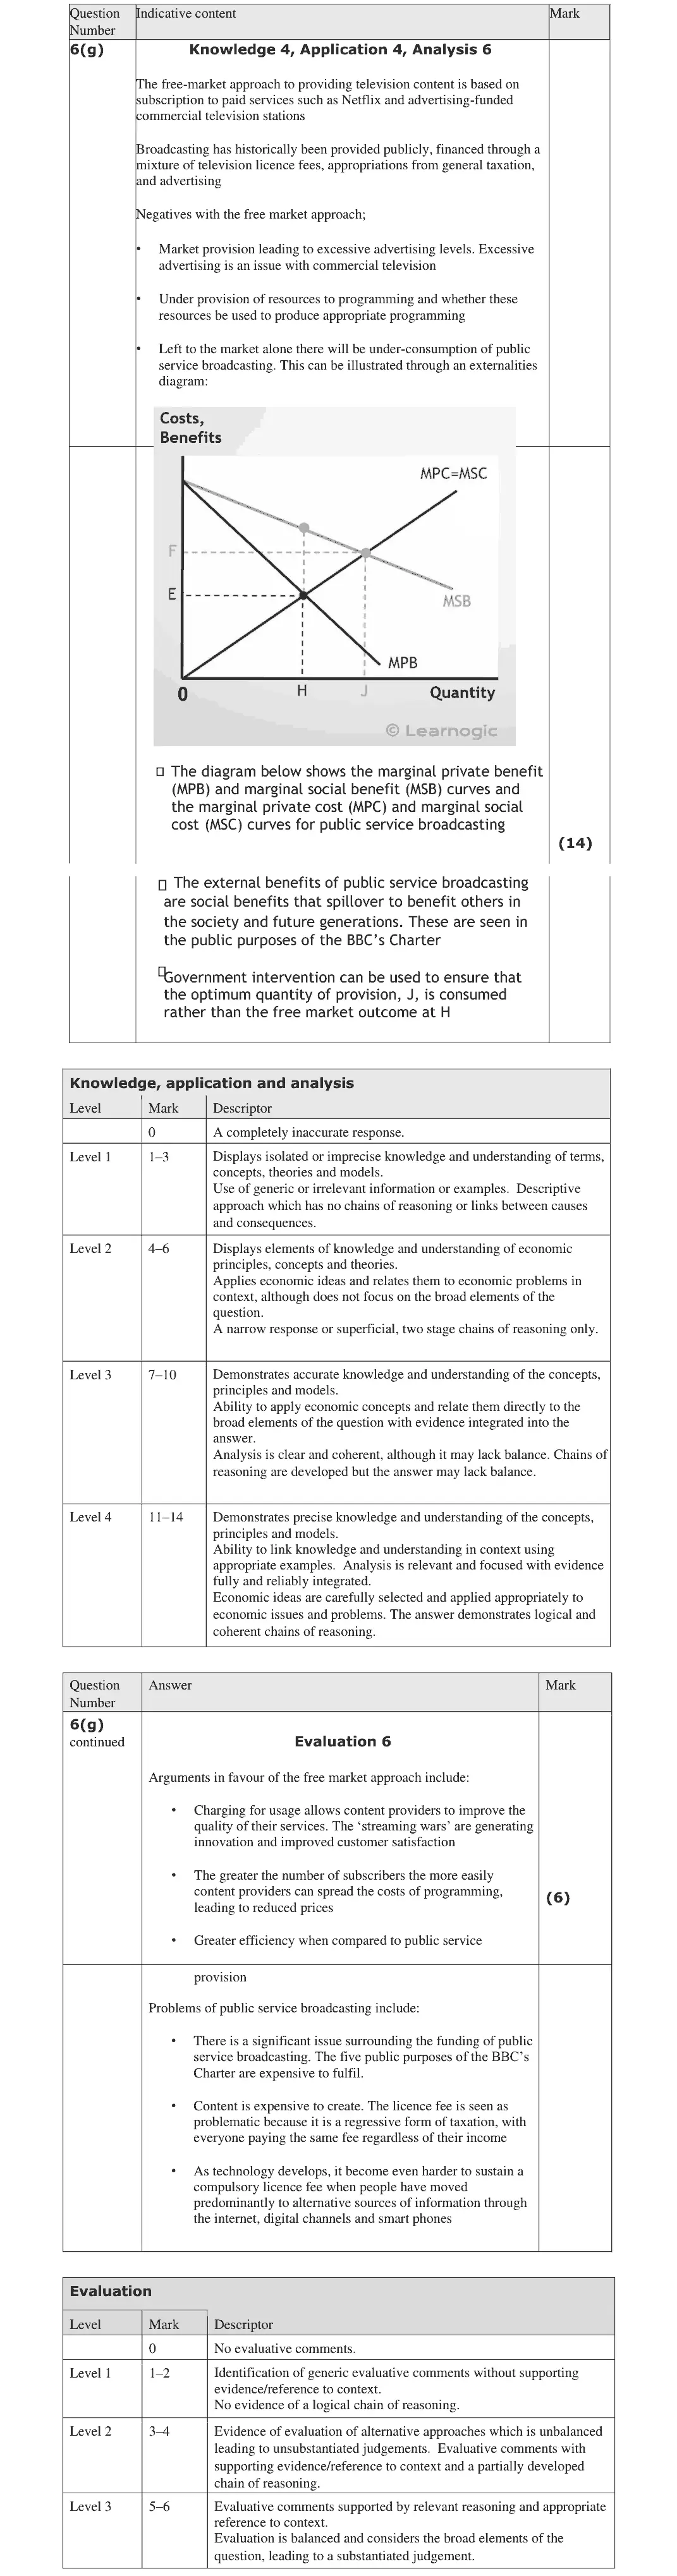
June 2025 · AS Paper 1 · Q6(g) 20 marks AO1=4, AO2=4, AO3=6, AO4=6 20-mark essay Either/or government intervention in marketsindirect taxes and subsidies
Data and extracts for question 6Sources for use with SECTION B Read the following figures (1 and 2) and extracts (A and B) before answering Question 6. The market for meat and the growth of vegetarianism Figure 1 The impact of subsidies on farmer income, in England, 2018–2019 (£000 per farm) Cereals Dairy Grazing livestock Pigs Poultry Mixed -20 0 20 40 60 80 100 £000 per farm Key Profit Subsidies (Source: adapted from www.FT.com) Figure 2 Potential impact of indirect tax rises on meat prices per kg, 2023–2030 Before indirect After indirect Type of Meat tax increases tax increases Beef/Veal £24.24 £29.50 Chicken £7.60 £8.63 (Source: adapted from Tax beef, pork and chicken to help climate and health, EU urged – CGTN) Extract A The case for cutting out meat Around a third of Britons are reducing the amount of meat they eat or are cutting it out altogether. Are these consumers right to be cutting out meat? For a start, there are the greenhouse gases released as a result of producing food. The evidence is clear that switching to a plant-based diet would lower emissions. A UK study found that eating a 5 diet high in meat costs 7.2 kg carbon dioxide emissions per day, compared with 3.8 kg for vegetarians. It would also free up land for other uses. Nearly 80% of the world’s farmland is dedicated to rearing animals; a plant-based diet would cut the use of land for agriculture by 76%. The land currently used by grazing livestock could be used for “rewilding”, allowing the environment and animal species destroyed by meat farming to 10 recover. Our health and wealth would be better too. A study published in 2016 modelled what would happen to our health and the global economy if we all switched to vegetarian diets. The economic benefits of switching to plant-based diets could be as much as £700 billion to £1 trillion per year in terms of savings on healthcare costs and lost 15 working days due to ill health. Some economists recommend an increased indirect tax on animal products so that their prices reflect the cost of externalities. This could impact on European farmers, if adopted by the European Union. The tax could bring £35 billion to the EU, with around £15 billion of that going directly to farmers. The 20 rest would be used to bring down VAT on fruit and vegetables, and fund other policies to encourage healthy-eating diets both in and outside the EU. (Source: adapted from https://moneyweek.com/499842/the-economic- consequences-of-veganism December-28-2018) Extract B Businesses benefitting from meat-substitute products There is one group for whom the trend towards meat-substitute products is definitely a good thing: processed food manufacturers and retailers. Finest British beef burgers are priced at £6.61 per kg. The ‘fake burger’ (which is made mostly of pea protein) is priced at £21.81 per kg even though the ingredients used to 5 make them, such as mushrooms, peas and palm oil, are cheaper ingredients than meat. Despite high prices, demand continues to rise for these products. This might benefit shareholders, but is it doing any real good for the rest of us? A large food producer bought meat-substitute product maker Vegetarian Butcher in December 2018 and is moving towards a range with more meat-substitute products. 10 In 2017, Nestlé bought Sweet Earth, a California-based maker of vegetarian foods, and it is launching its own meat-substitute ‘Incredible Burger’. It expects its meat-substitute revenues to reach $1 billion by 2029. As subsidies are being cut in every area of farming, consumers ought to be willing to pay higher prices for all food products. If farmers are to stay in business, they need to find 15 additional sources of revenue such as oyster mushrooms, goji berries and basil. (Source: adapted from http://www.financialtimes.com/the-veganism-boom-does- more-for-food-company-profits-than-the-planet February-22-2019)
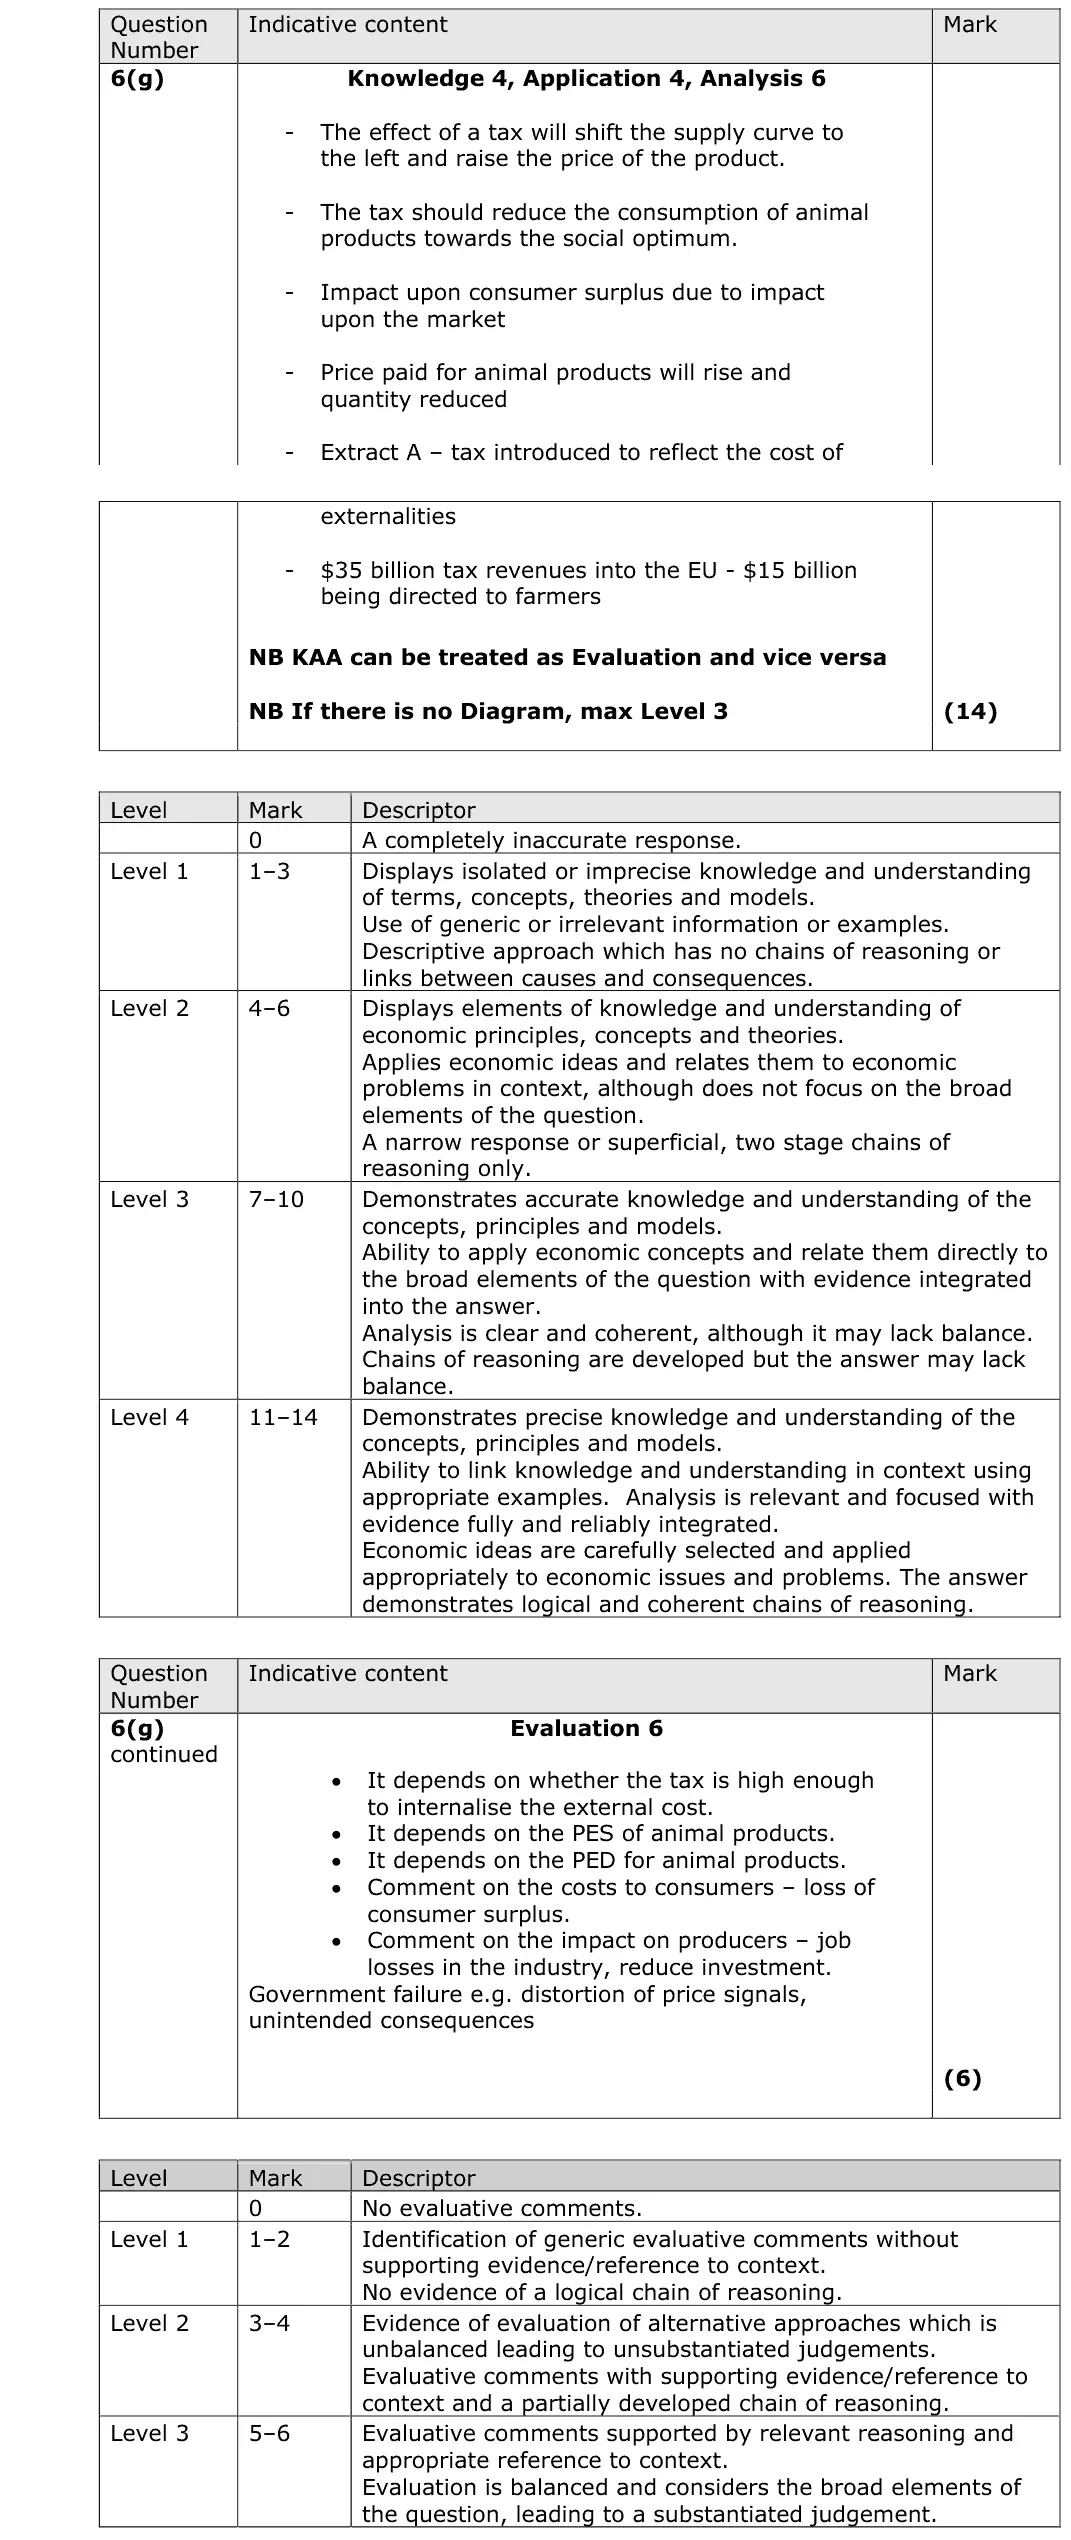
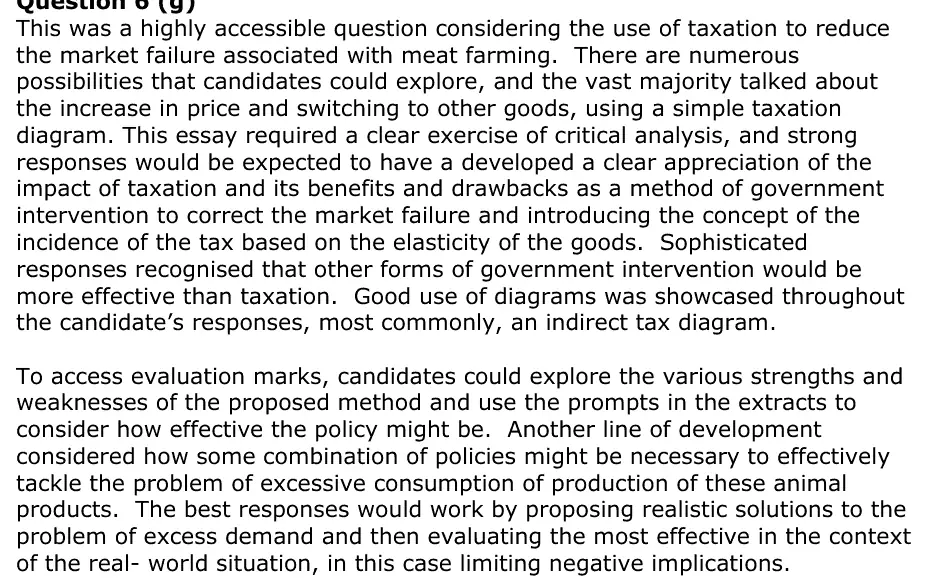
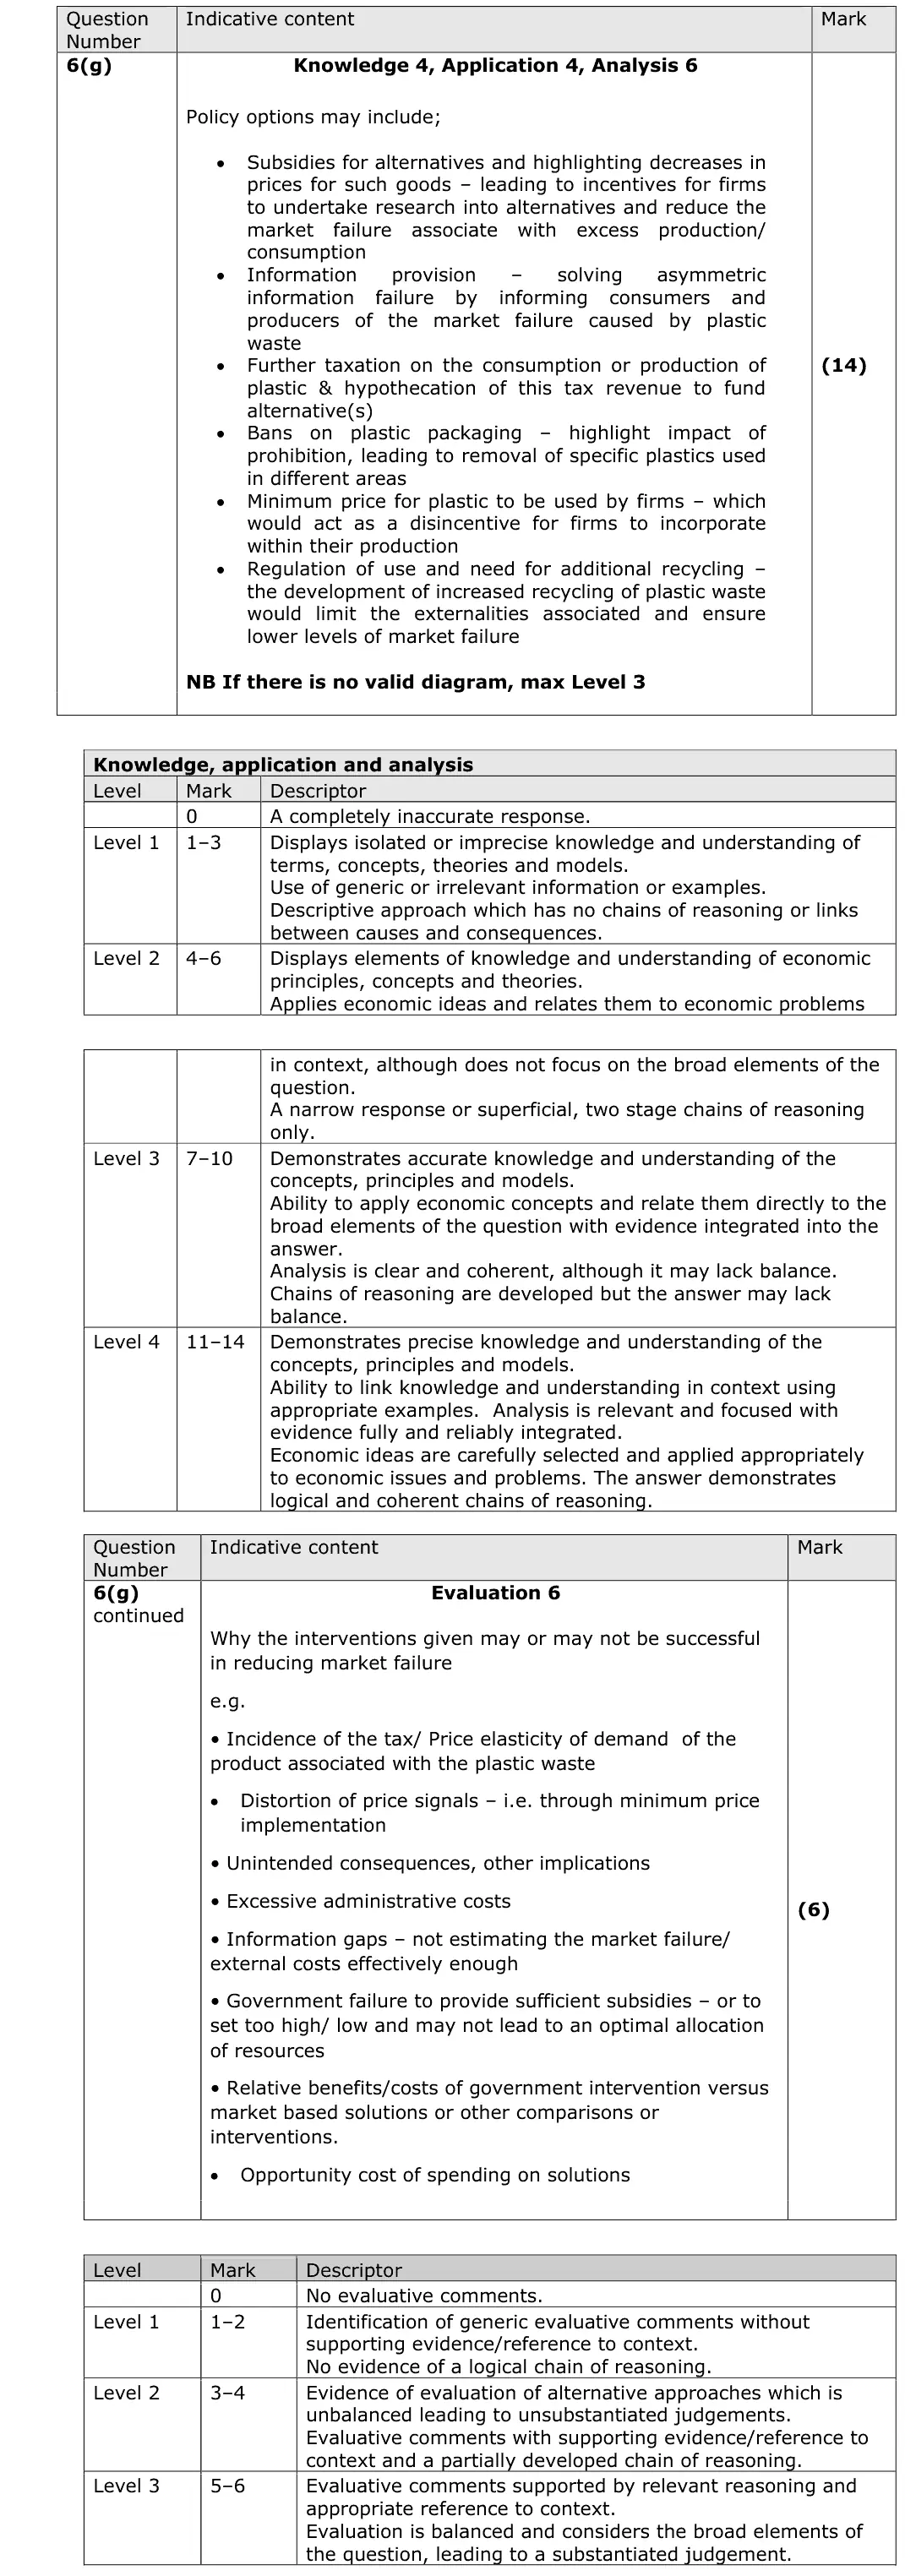
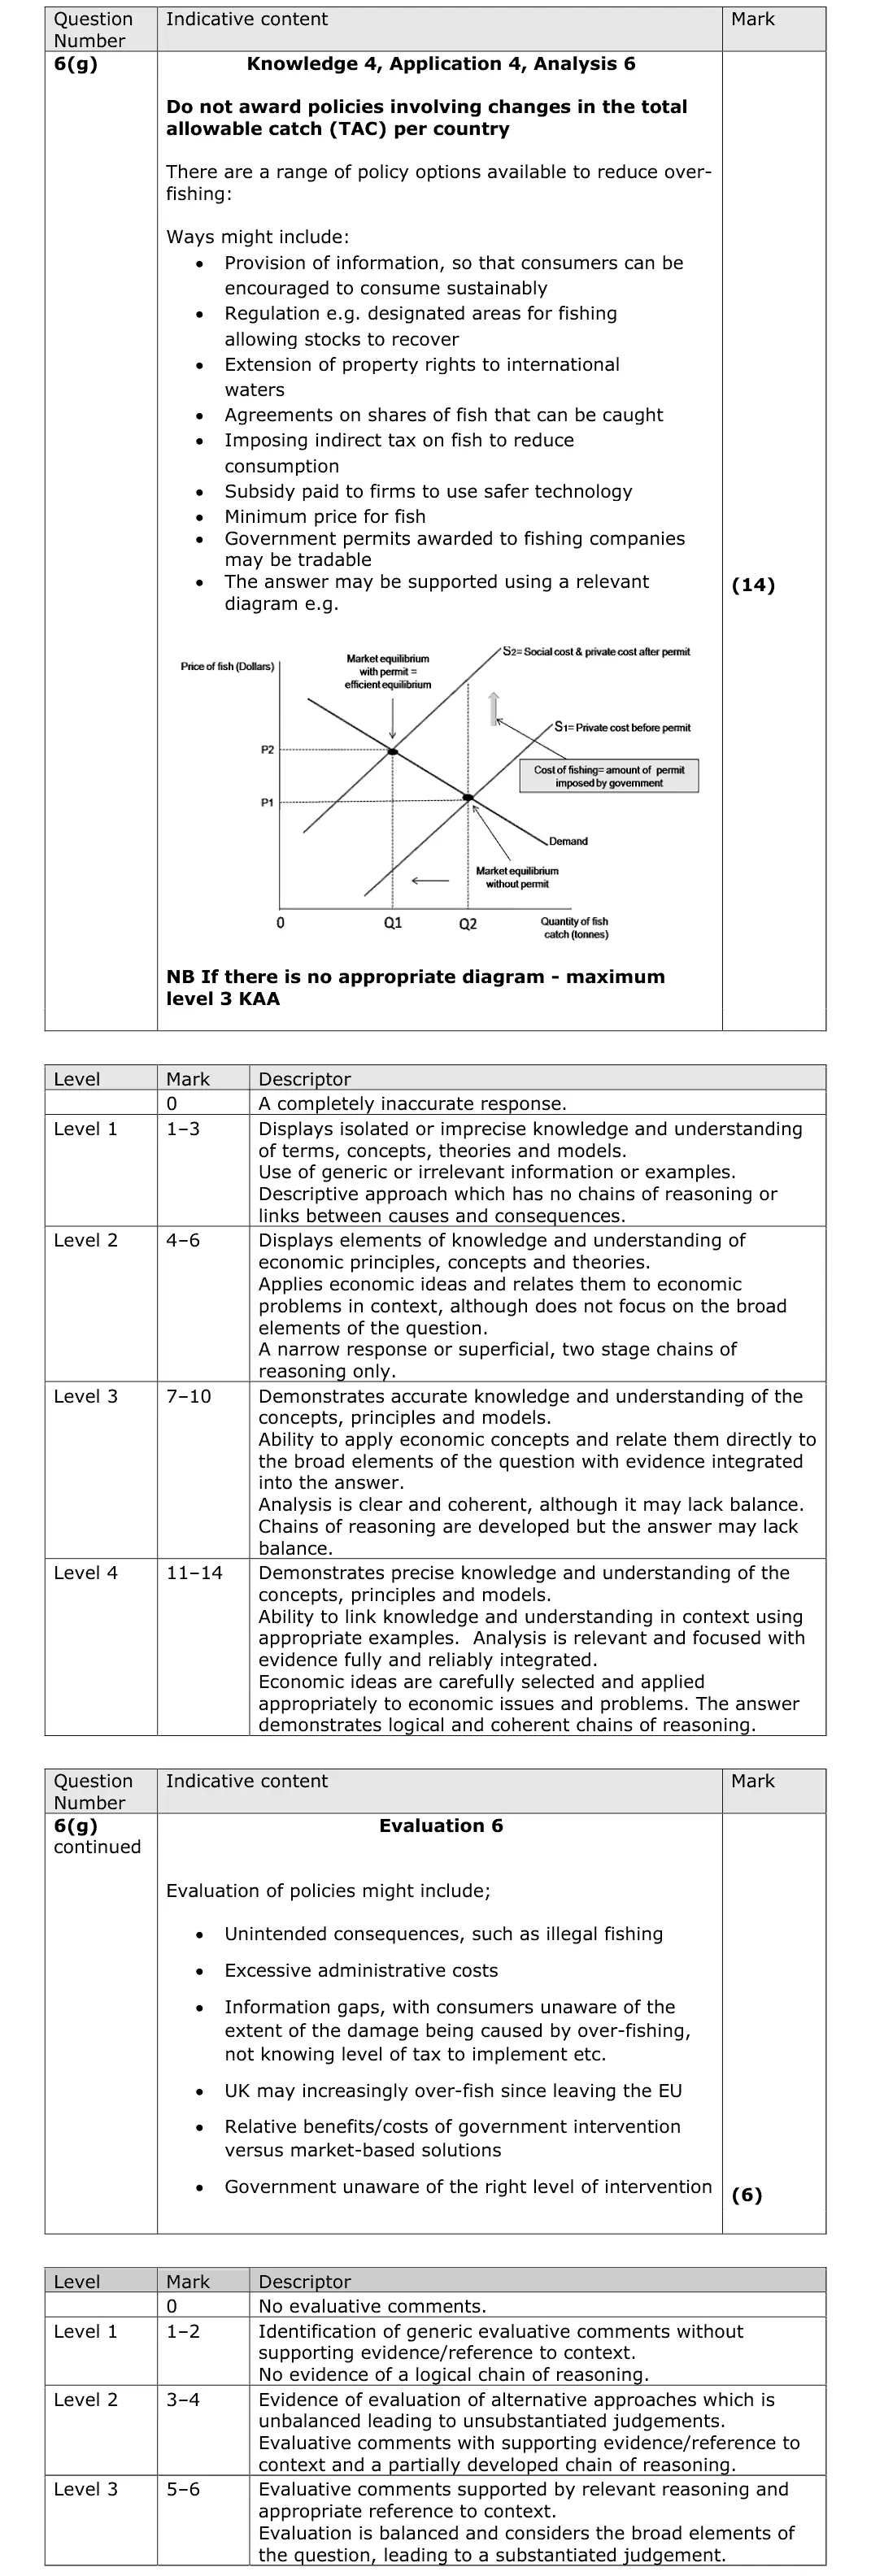
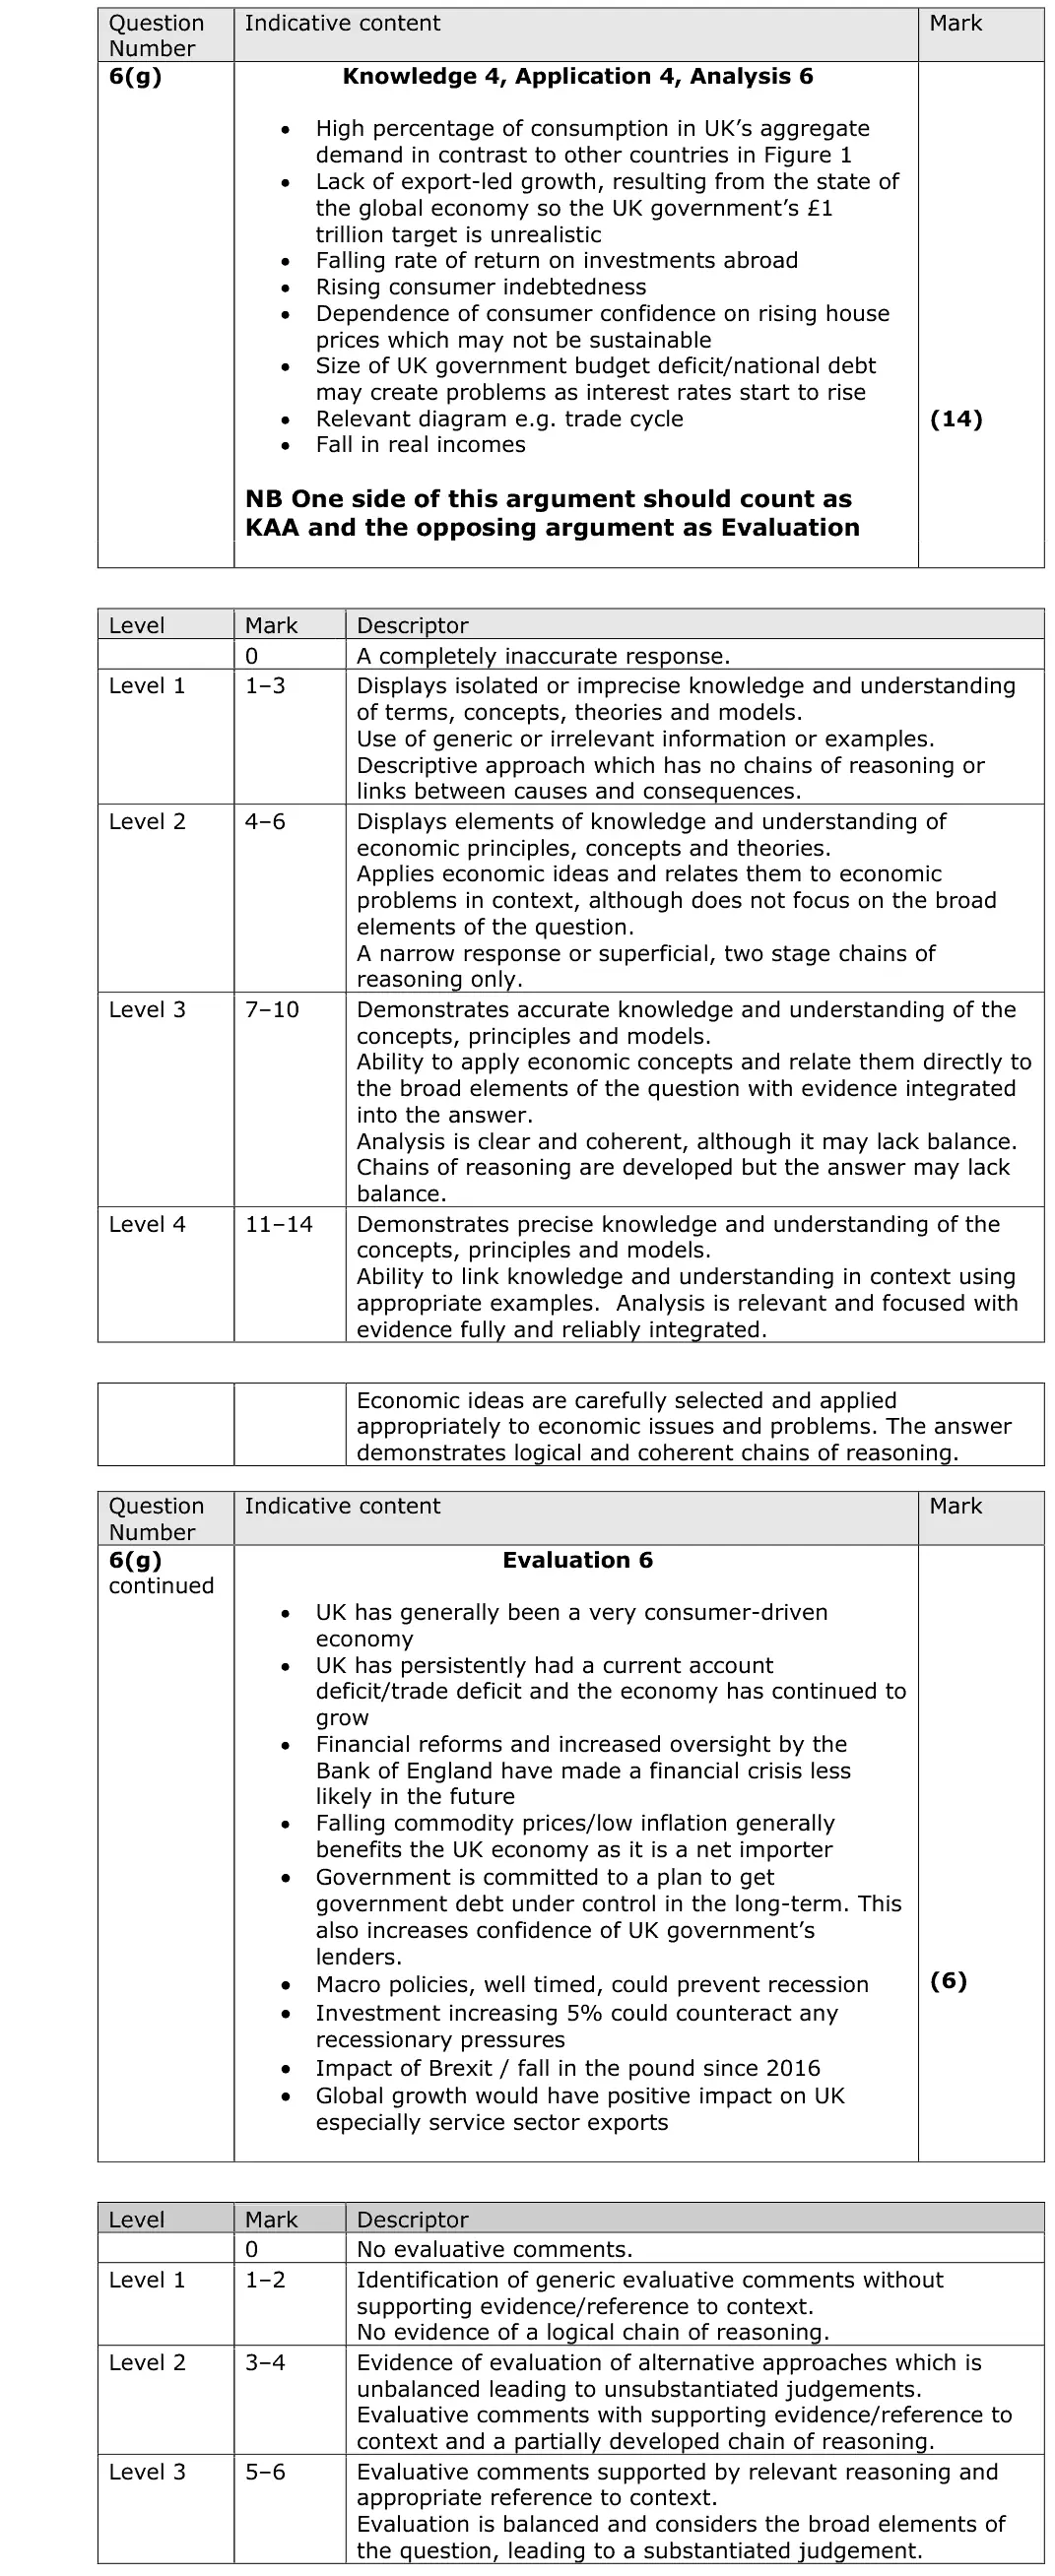
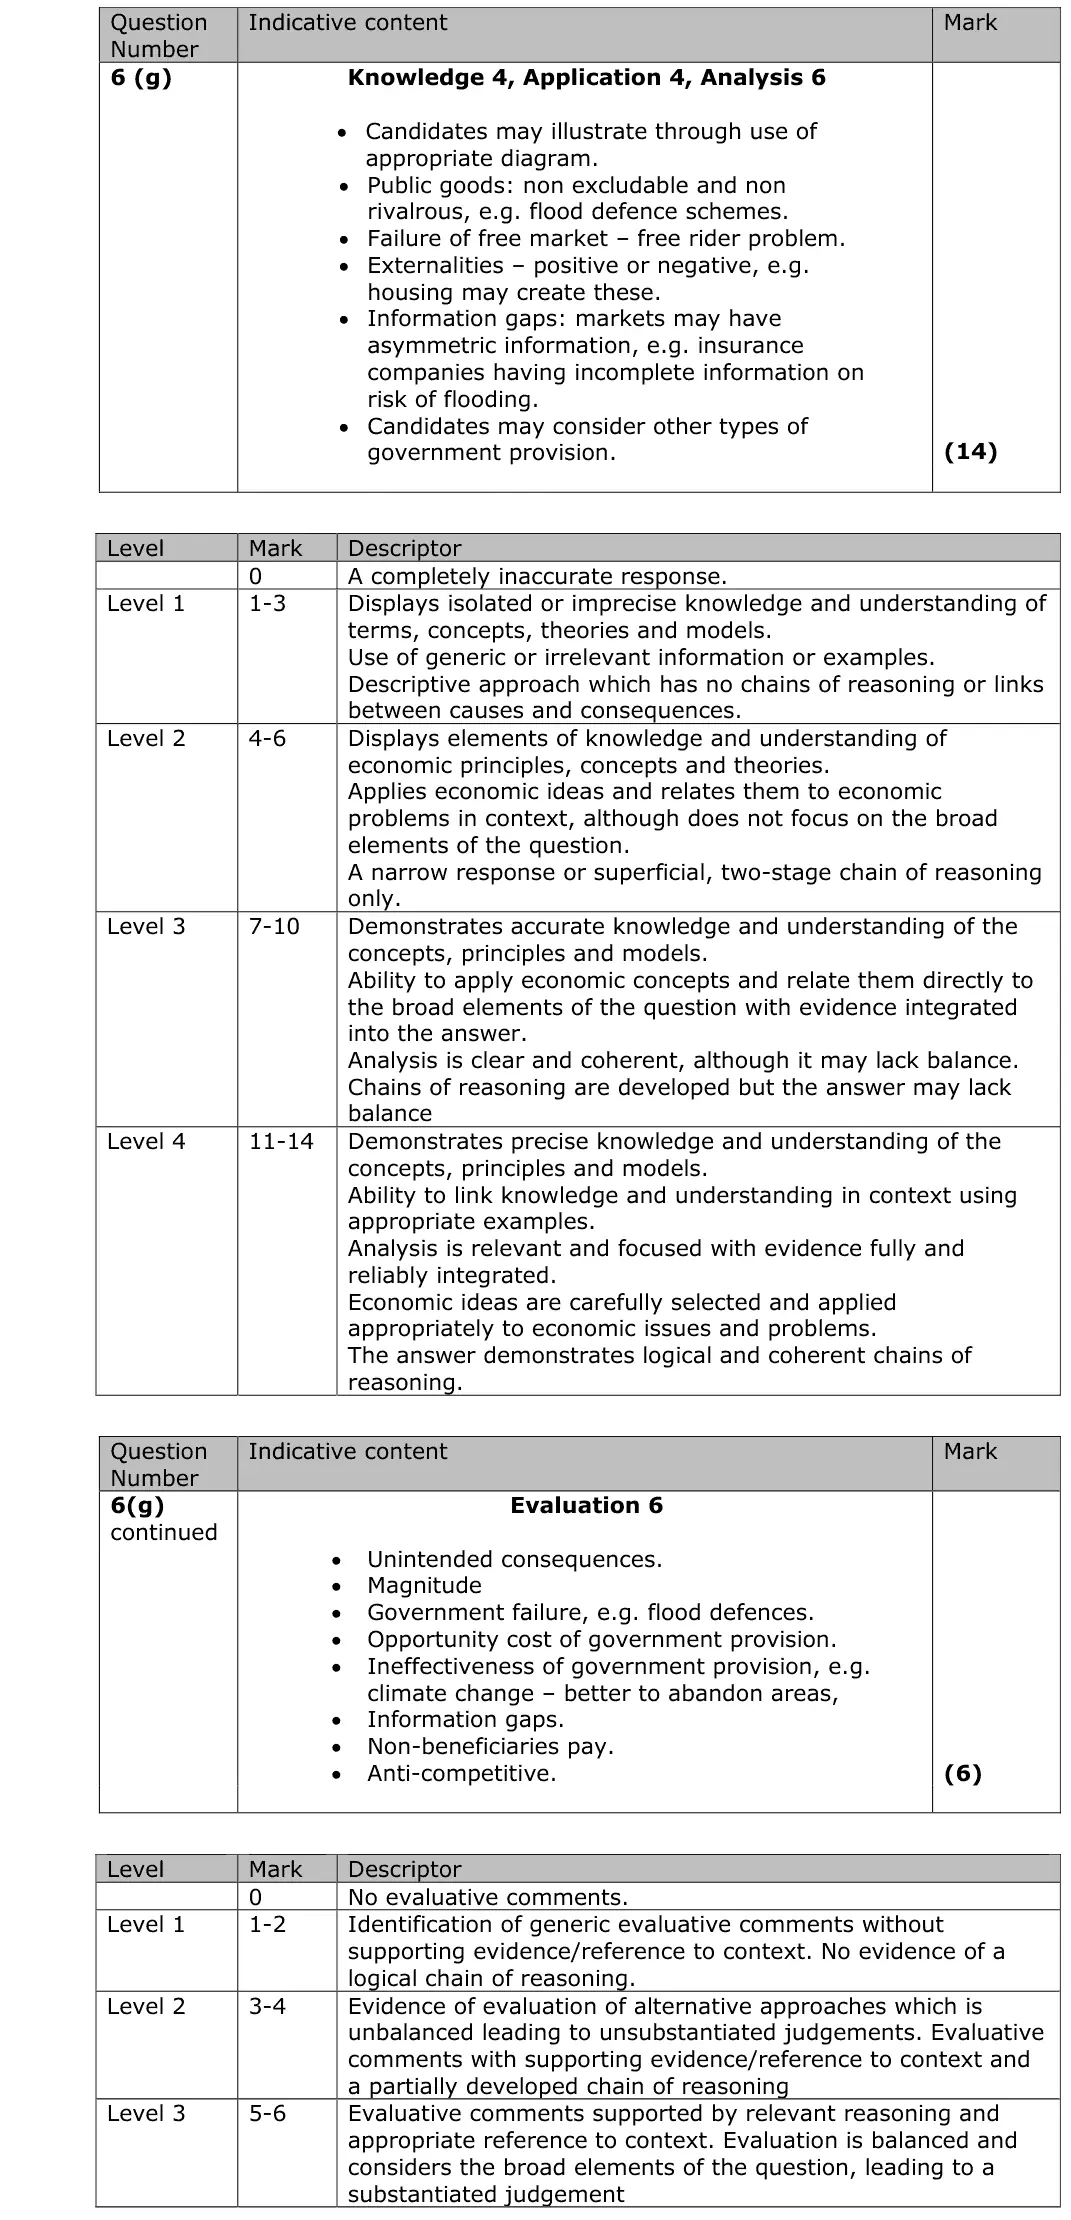
(g) Evaluate the likely microeconomic effects of an increase in indirect tax on animal products (Figure 2 and Extract A, line 17). Use a relevant diagram to support your answer. (20)
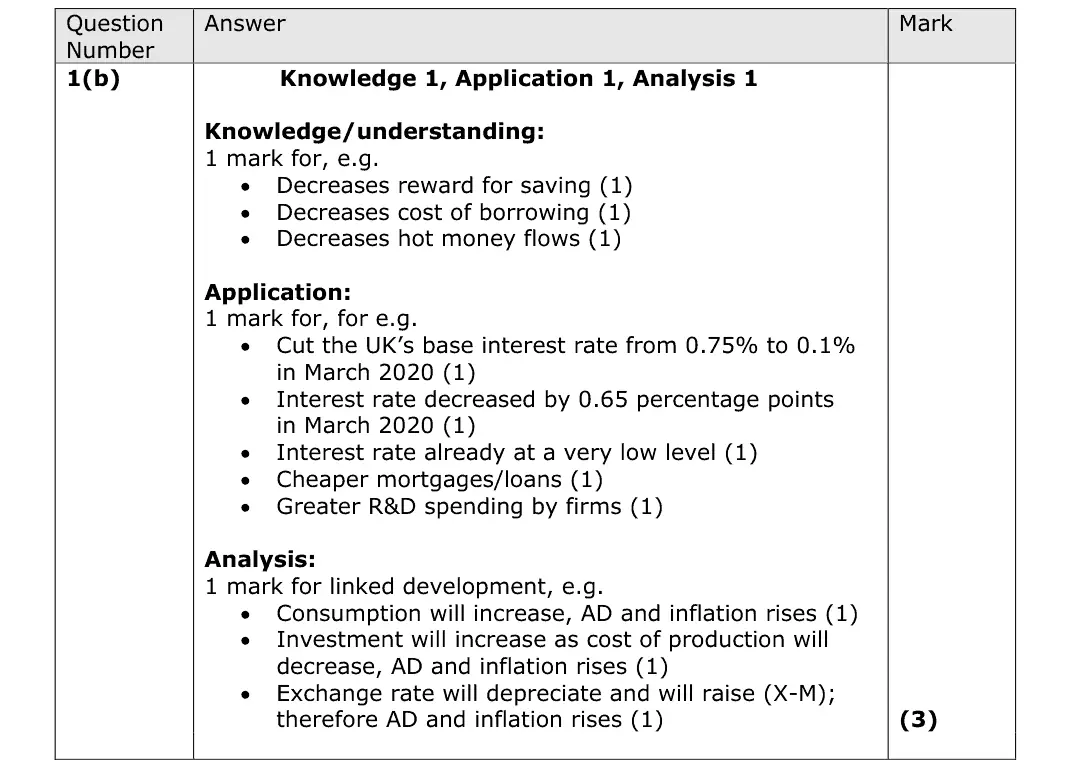
June 2025 · AS Paper 2 · Q1(b) 3 marks AO1=1, AO2=1, AO3=1 Short answer fiscal and monetary policy
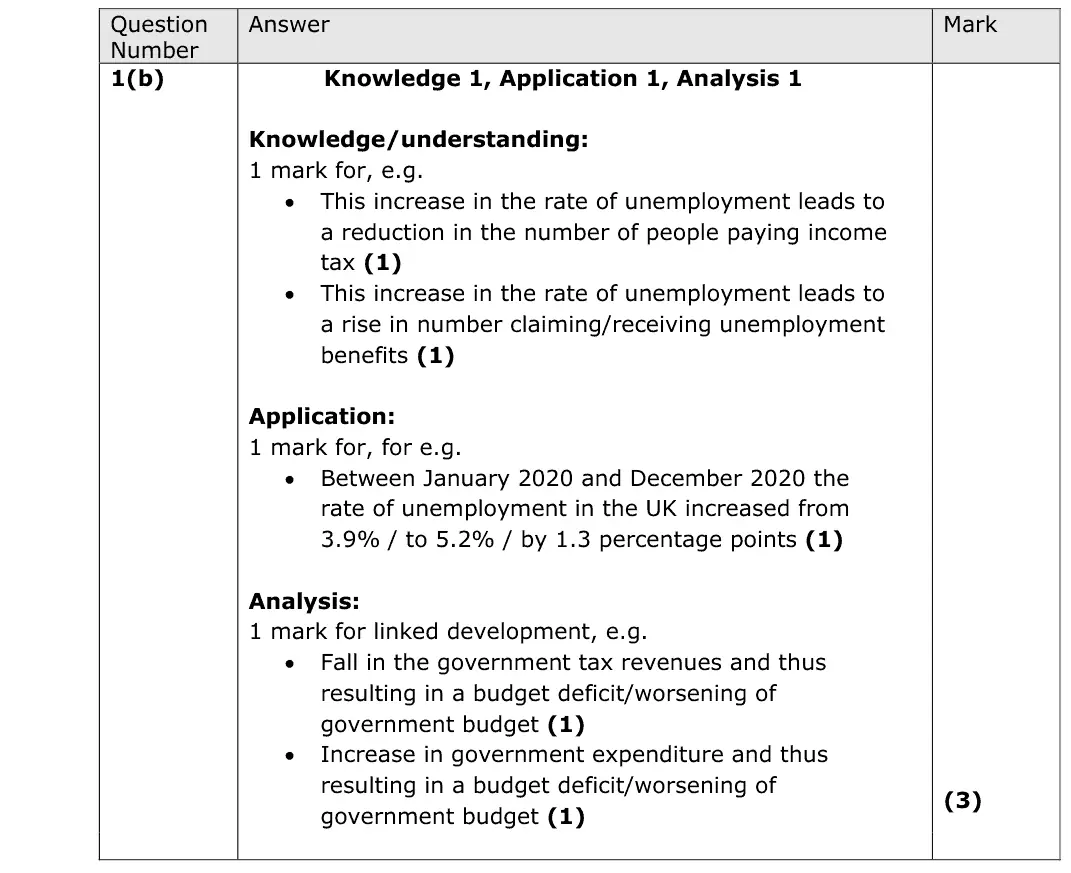
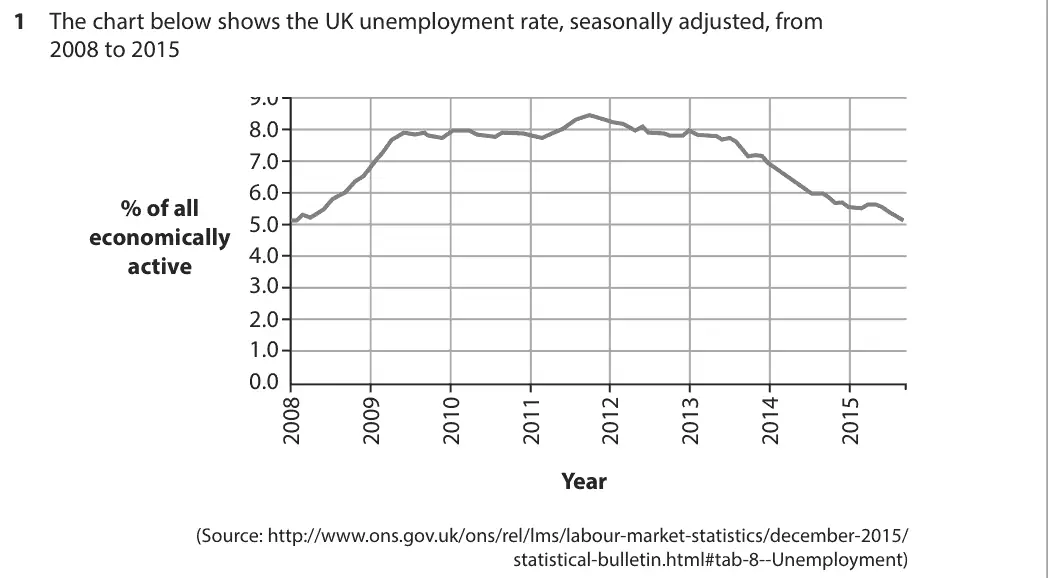
Data and extracts for question 11 Between January 2020 and December 2020, the rate of unemployment in the UK increased from 3.9% to 5.2%. This was as a result of the UK economy experiencing a recession.
(b) With reference to the information above, explain one possible effect of the increase in the rate of unemployment on the UK government budget. (3)
June 2025 · AS Paper 2 · Q2(b) 3 marks AO1=1, AO2=1, AO3=1 Short answer Hard aggregate demand
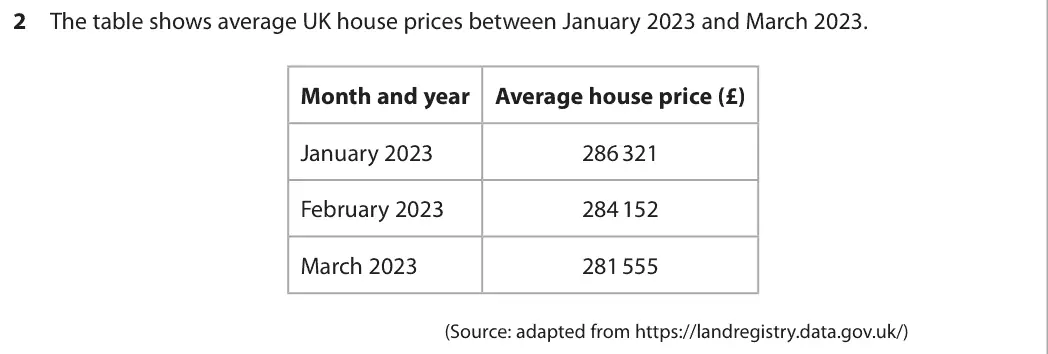
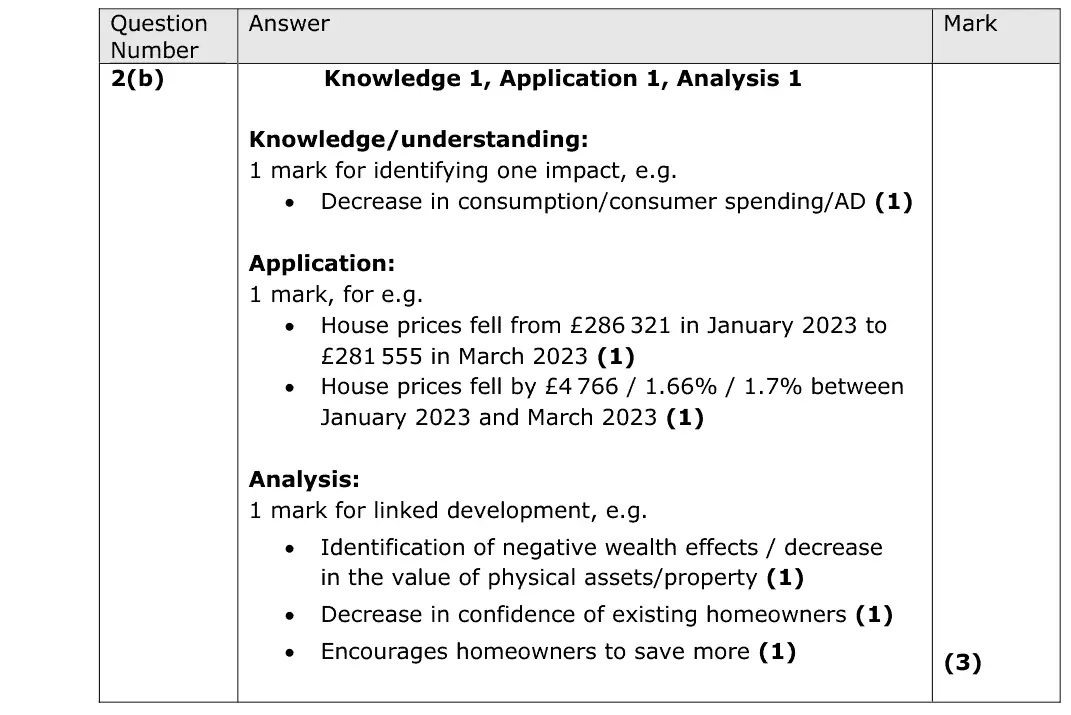
Data and extracts for question 22 The table shows average UK house prices between January 2023 and March 2023. Month and year Average house price (£) January 2023 286 321 February 2023 284 152 March 2023 281 555 (Source: adapted from https://landregistry.data.gov.uk/)
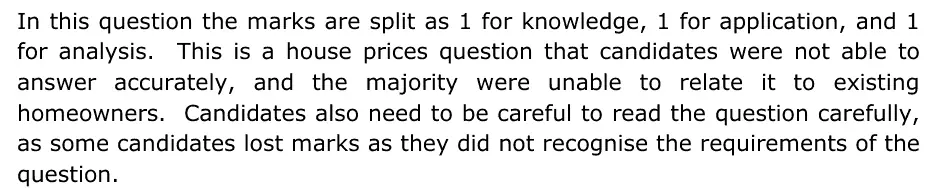
(b) Explain one likely impact of the fall in average UK house prices on existing homeowners between January 2023 and March 2023. Refer to the table on page 4 in your answer. (3)
June 2025 · AS Paper 2 · Q5(b) 3 marks AO1=1, AO2=1, AO3=1 Short answer balance of paymentsaggregate demand
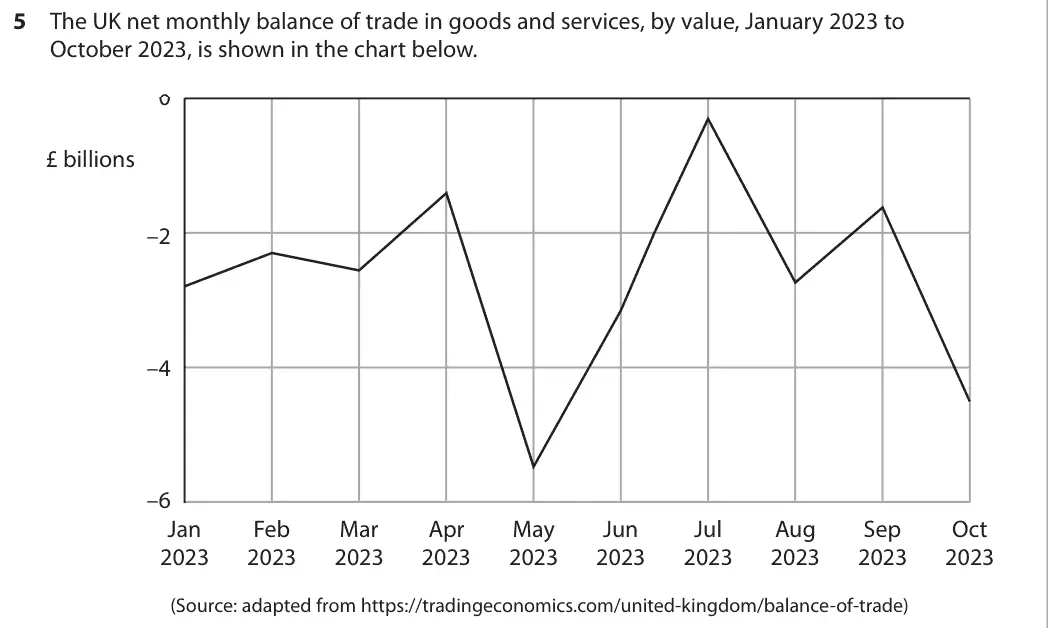
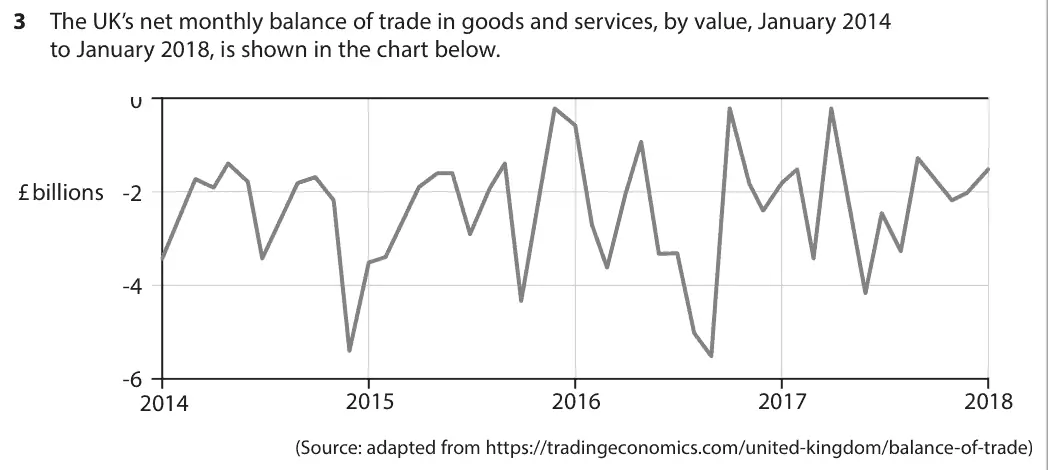
Data and extracts for question 55 The UK net monthly balance of trade in goods and services, by value, January 2023 to October 2023, is shown in the chart below. 0 £ billions –2 –4 –6 Jan Feb Mar Apr May Jun Jul Aug Sep Oct 2023 2023 2023 2023 2023 2023 2023 2023 2023 2023 (Source: adapted from https://tradingeconomics.com/united-kingdom/balance-of-trade)
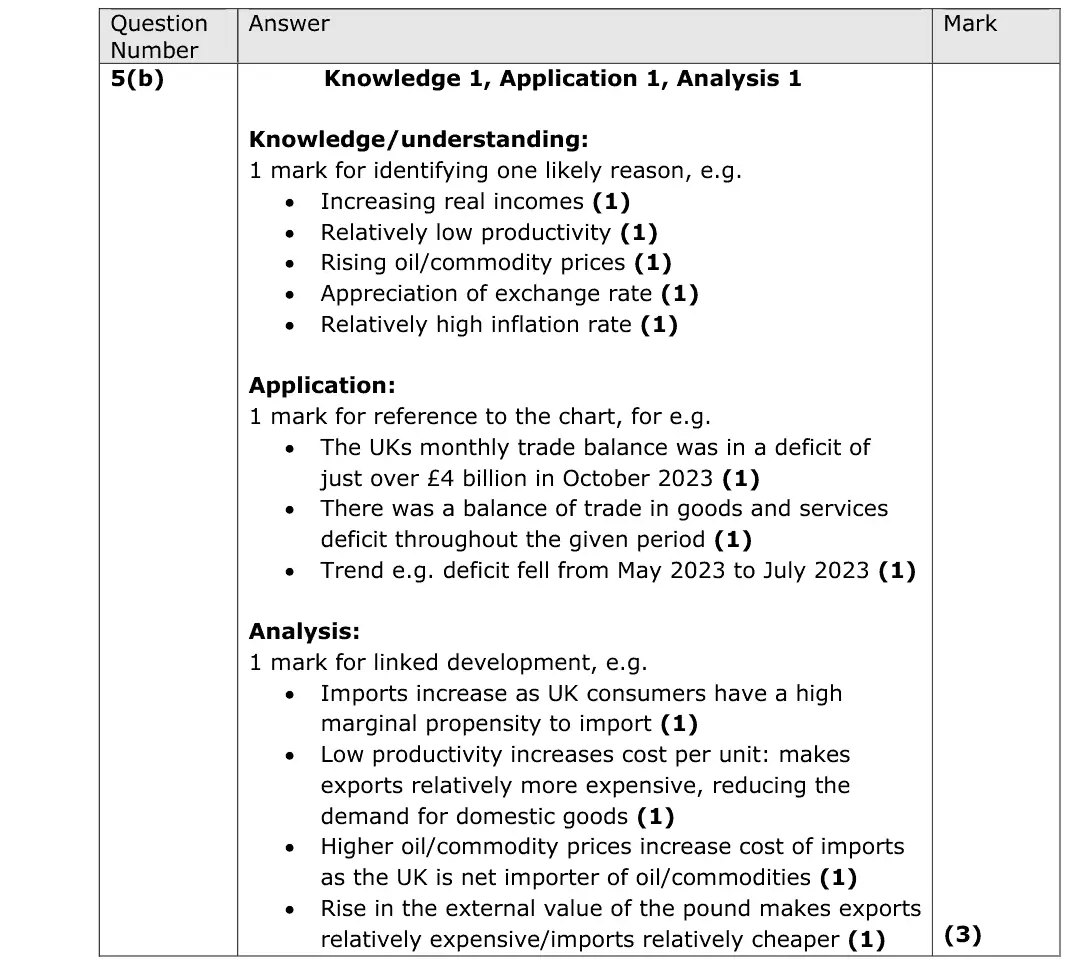
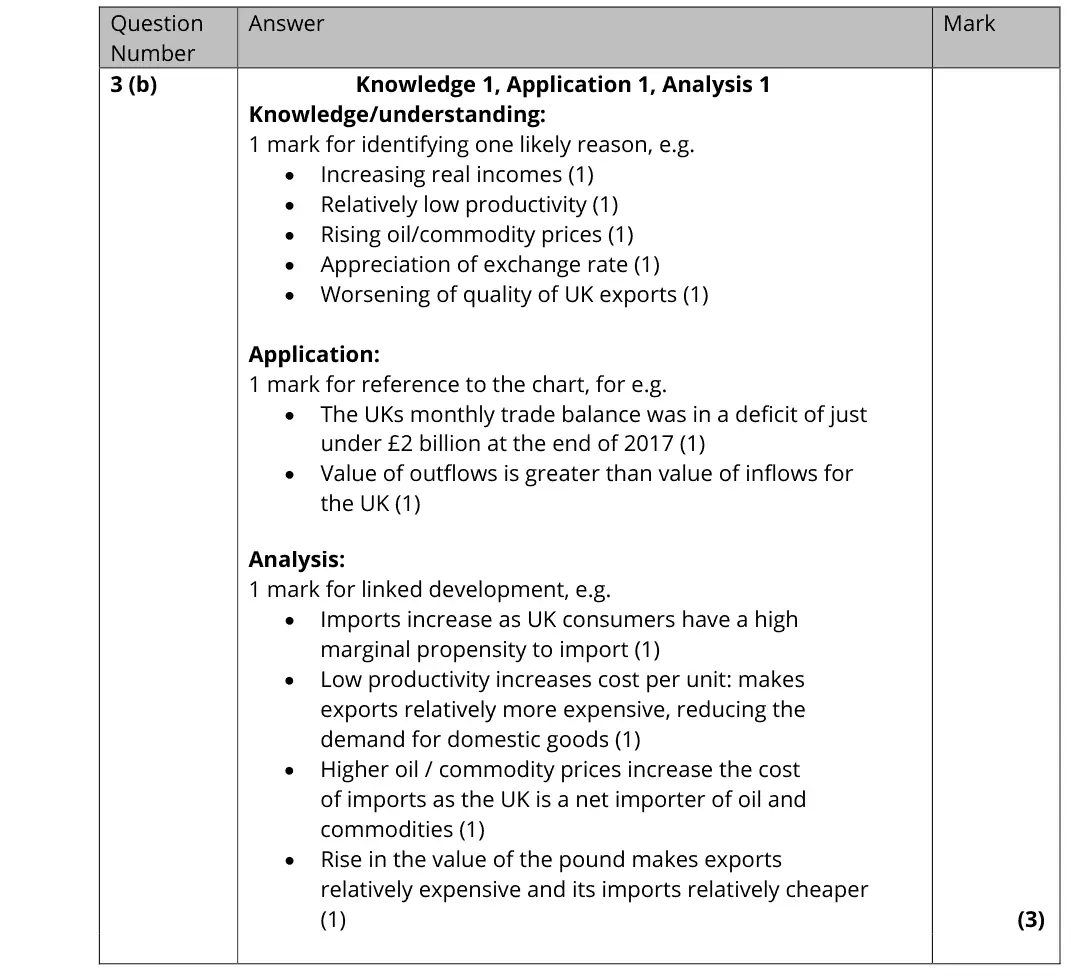
(b) Explain one likely reason for the deficit in the UK balance of trade in goods and services. Refer to the chart on page 10 in your answer. (3)
June 2025 · AS Paper 2 · Q6(a) 4 marks AO1=2, AO2=2 Short answer measuring economic growth
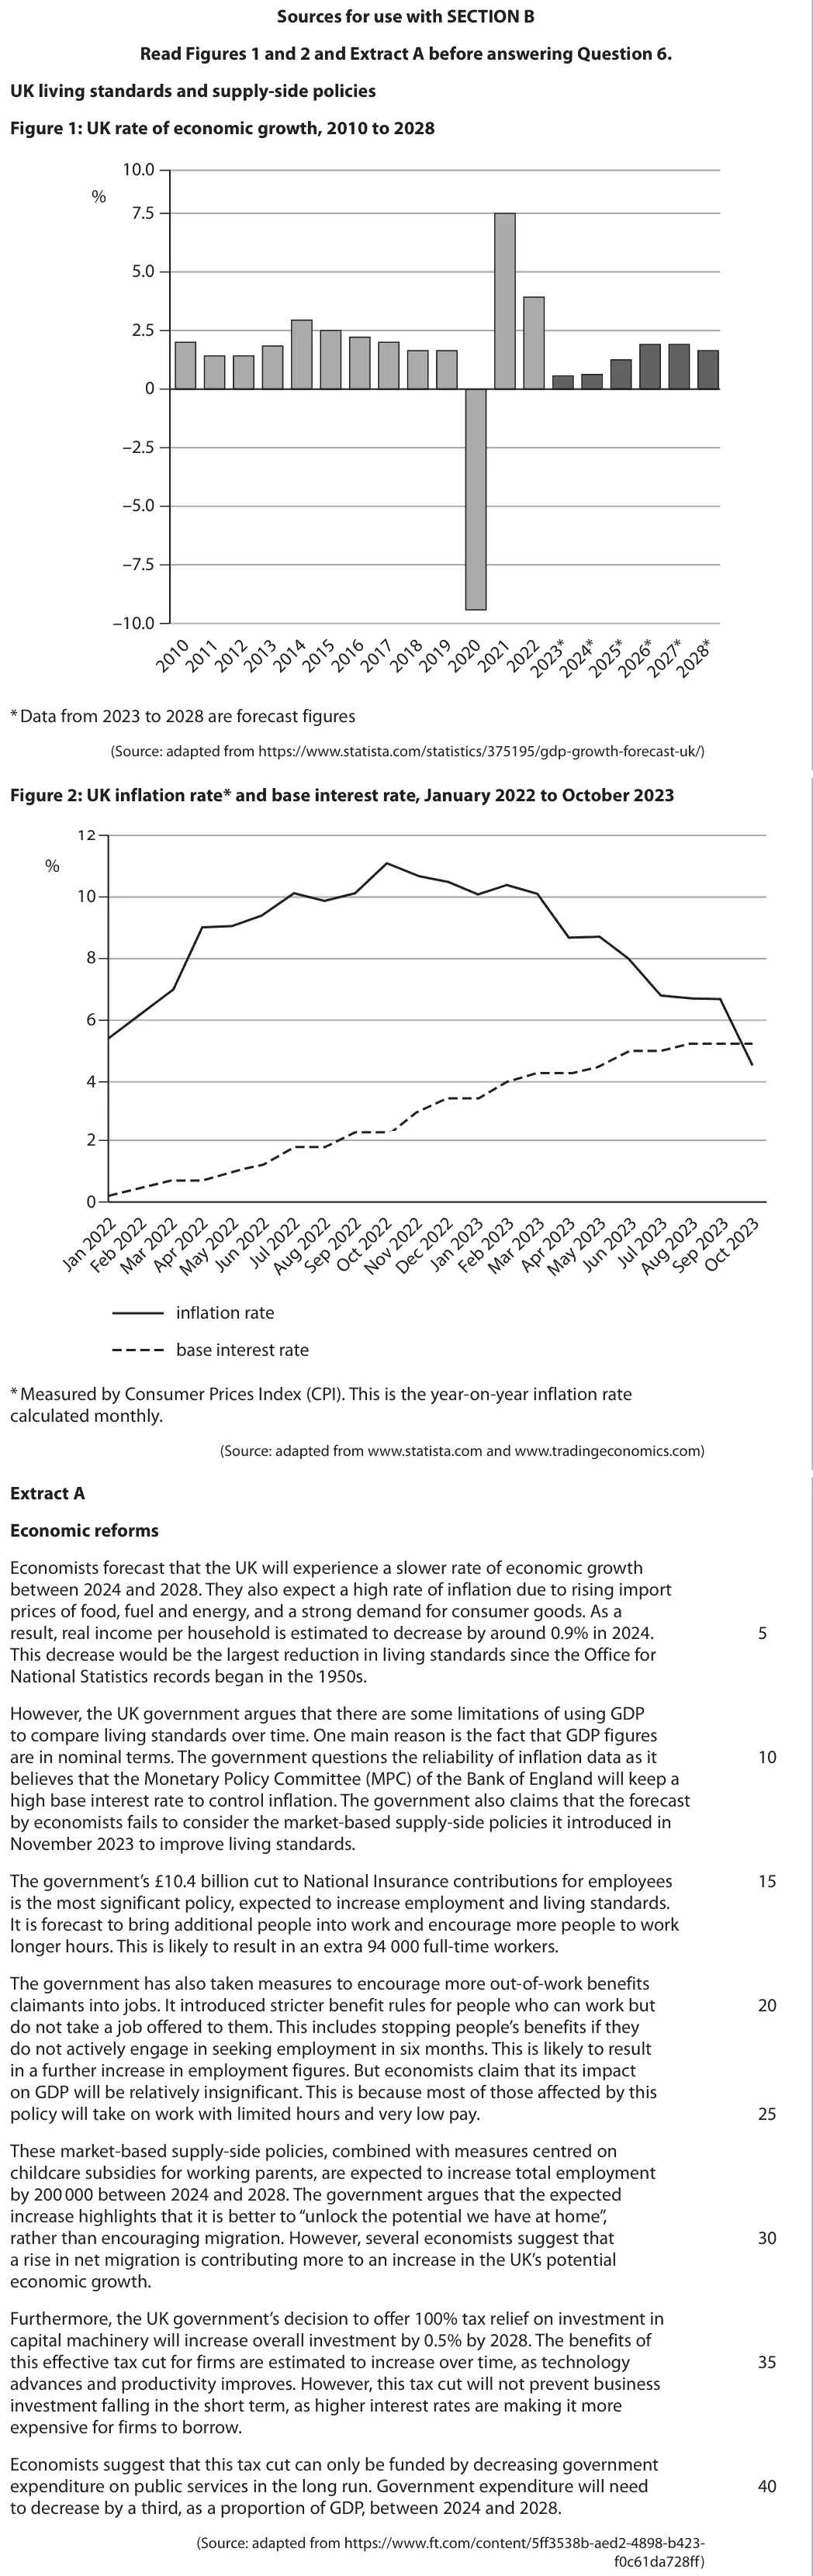
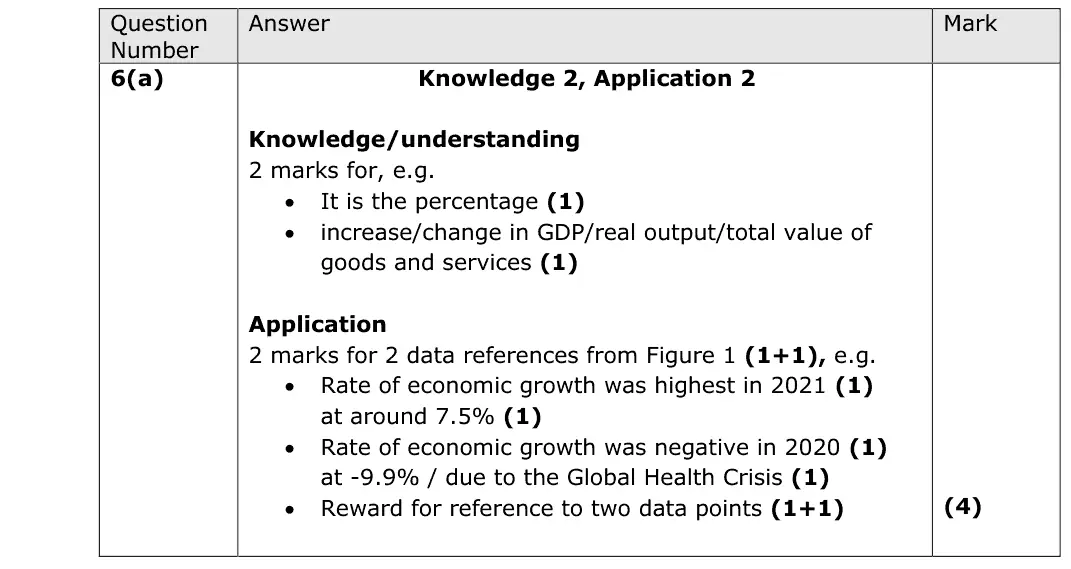
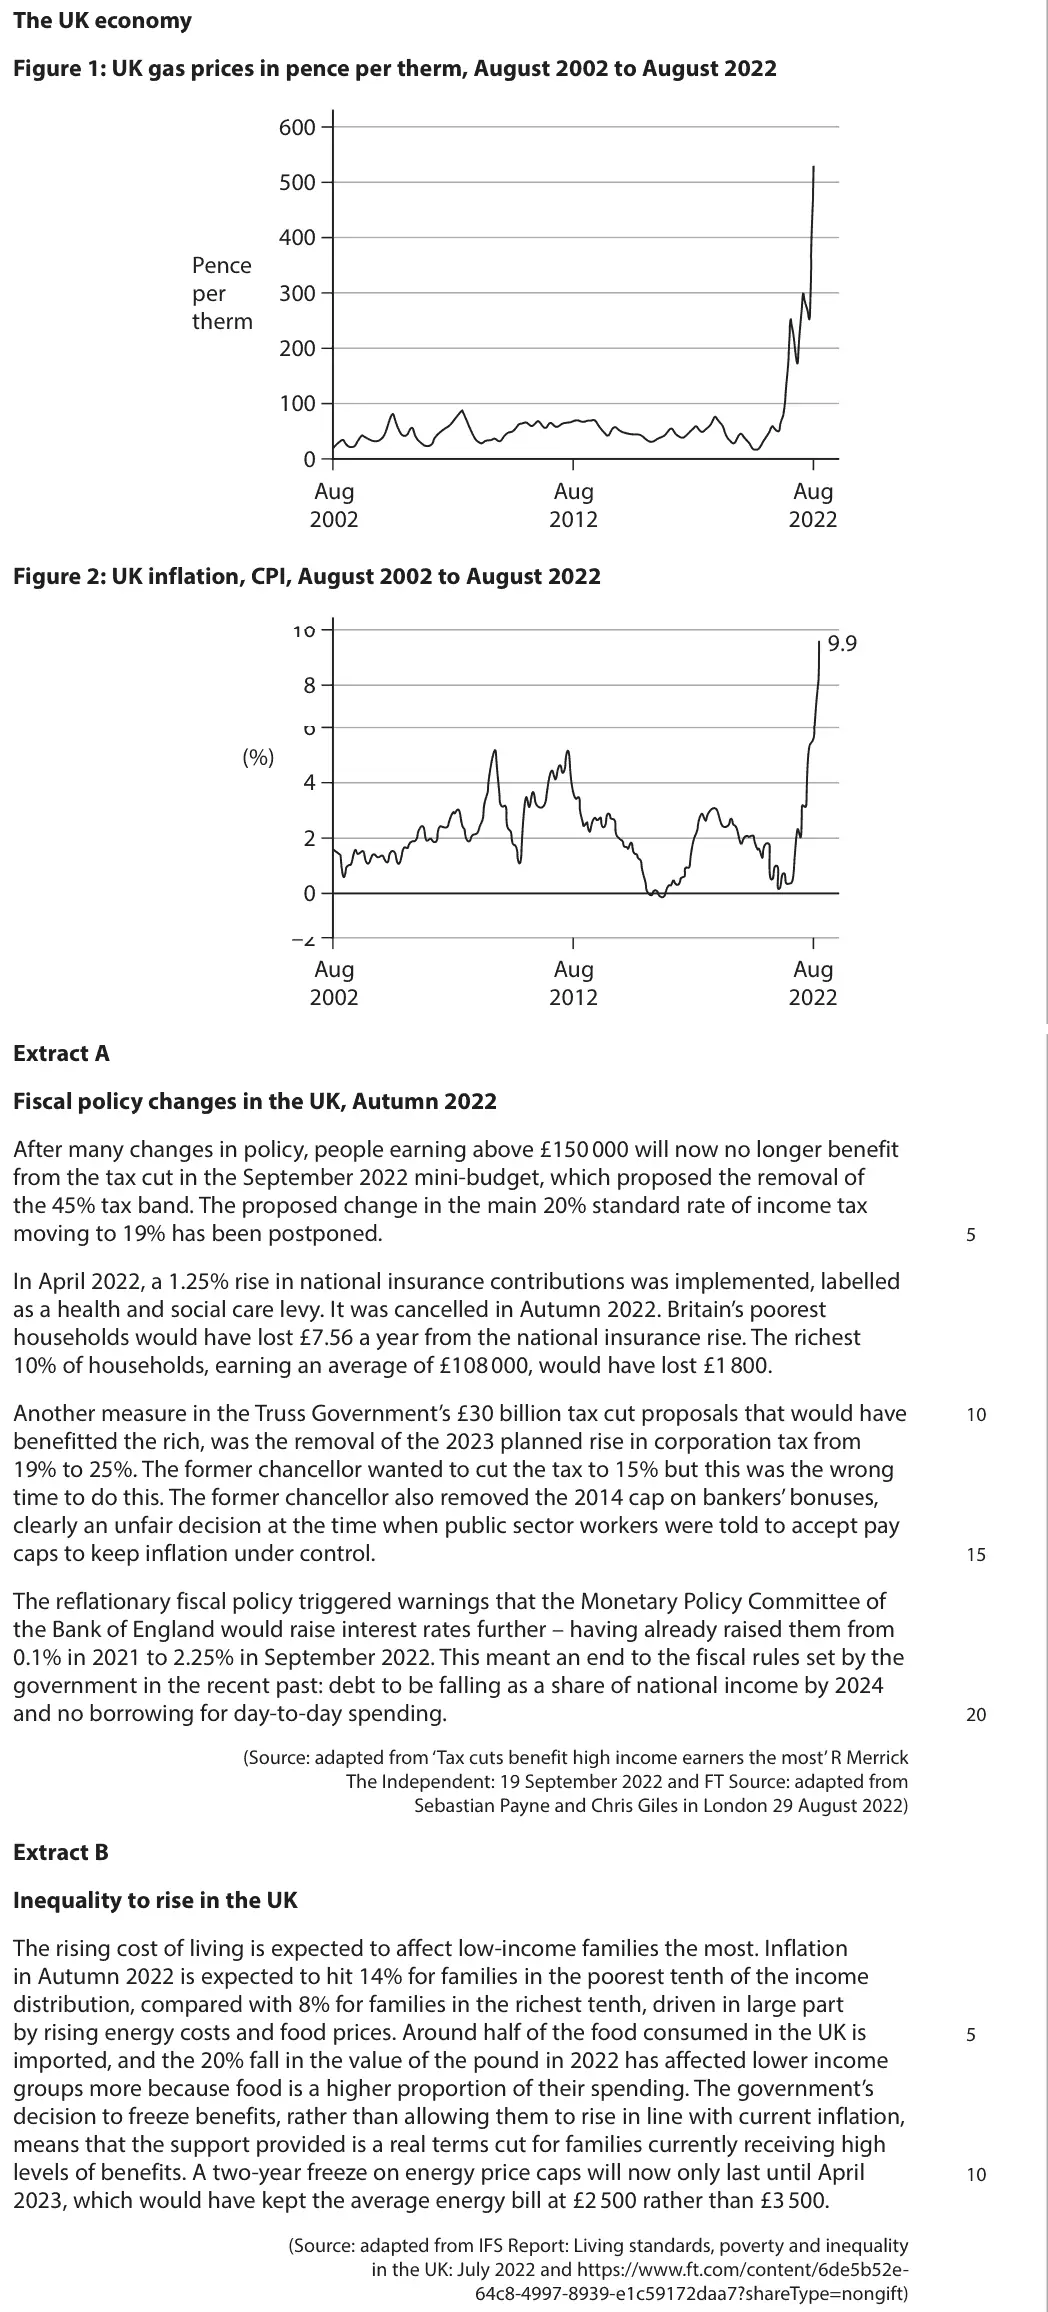
Data and extracts for question 6Sources for use with SECTION B Read Figures 1 and 2 and Extract A before answering Question 6. UK living standards and supply‑side policies Figure 1: UK rate of economic growth, 2010 to 2028 10.0 % 7.5 5.0 2.5 0 –2.5 –5.0 –7.5 –10.0 * Data from 2023 to 2028 are forecast figures (Source: adapted from https://www.statista.com/statistics/375195/gdp-growth-forecast-uk/) Figure 2: UK inflation rate* and base interest rate, January 2022 to October 2023 12 % 10 8 6 4 2 0 inflation rate base interest rate * Measured by Consumer Prices Index (CPI). This is the year-on-year inflation rate calculated monthly. (Source: adapted from www.statista.com and www.tradingeconomics.com) Extract A Economic reforms Economists forecast that the UK will experience a slower rate of economic growth between 2024 and 2028. They also expect a high rate of inflation due to rising import prices of food, fuel and energy, and a strong demand for consumer goods. As a result, real income per household is estimated to decrease by around 0.9% in 2024. 5 This decrease would be the largest reduction in living standards since the Office for National Statistics records began in the 1950s. However, the UK government argues that there are some limitations of using GDP to compare living standards over time. One main reason is the fact that GDP figures are in nominal terms. The government questions the reliability of inflation data as it 10 believes that the Monetary Policy Committee (MPC) of the Bank of England will keep a high base interest rate to control inflation. The government also claims that the forecast by economists fails to consider the market-based supply-side policies it introduced in November 2023 to improve living standards. The government’s £10.4 billion cut to National Insurance contributions for employees 15 is the most significant policy, expected to increase employment and living standards. It is forecast to bring additional people into work and encourage more people to work longer hours. This is likely to result in an extra 94 000 full-time workers. The government has also taken measures to encourage more out-of-work benefits claimants into jobs. It introduced stricter benefit rules for people who can work but 20 do not take a job offered to them. This includes stopping people’s benefits if they do not actively engage in seeking employment in six months. This is likely to result in a further increase in employment figures. But economists claim that its impact on GDP will be relatively insignificant. This is because most of those affected by this policy will take on work with limited hours and very low pay. 25 These market-based supply-side policies, combined with measures centred on childcare subsidies for working parents, are expected to increase total employment by 200 000 between 2024 and 2028. The government argues that the expected increase highlights that it is better to “unlock the potential we have at home”, rather than encouraging migration. However, several economists suggest that 30 a rise in net migration is contributing more to an increase in the UK’s potential economic growth. Furthermore, the UK government’s decision to offer 100% tax relief on investment in capital machinery will increase overall investment by 0.5% by 2028. The benefits of 35 this effective tax cut for firms are estimated to increase over time, as technology advances and productivity improves. However, this tax cut will not prevent business investment falling in the short term, as higher interest rates are making it more expensive for firms to borrow. Economists suggest that this tax cut can only be funded by decreasing government 40 expenditure on public services in the long run. Government expenditure will need to decrease by a third, as a proportion of GDP, between 2024 and 2028. (Source: adapted from https://www.ft.com/content/5ff3538b-aed2-4898-b423- f0c61da728ff)
(a) With reference to Figure 1, explain the term ‘rate of economic growth’. (4)
June 2025 · AS Paper 2 · Q6(b) 5 marks AO1=1, AO2=2, AO3=2 Short answer measuring economic growth
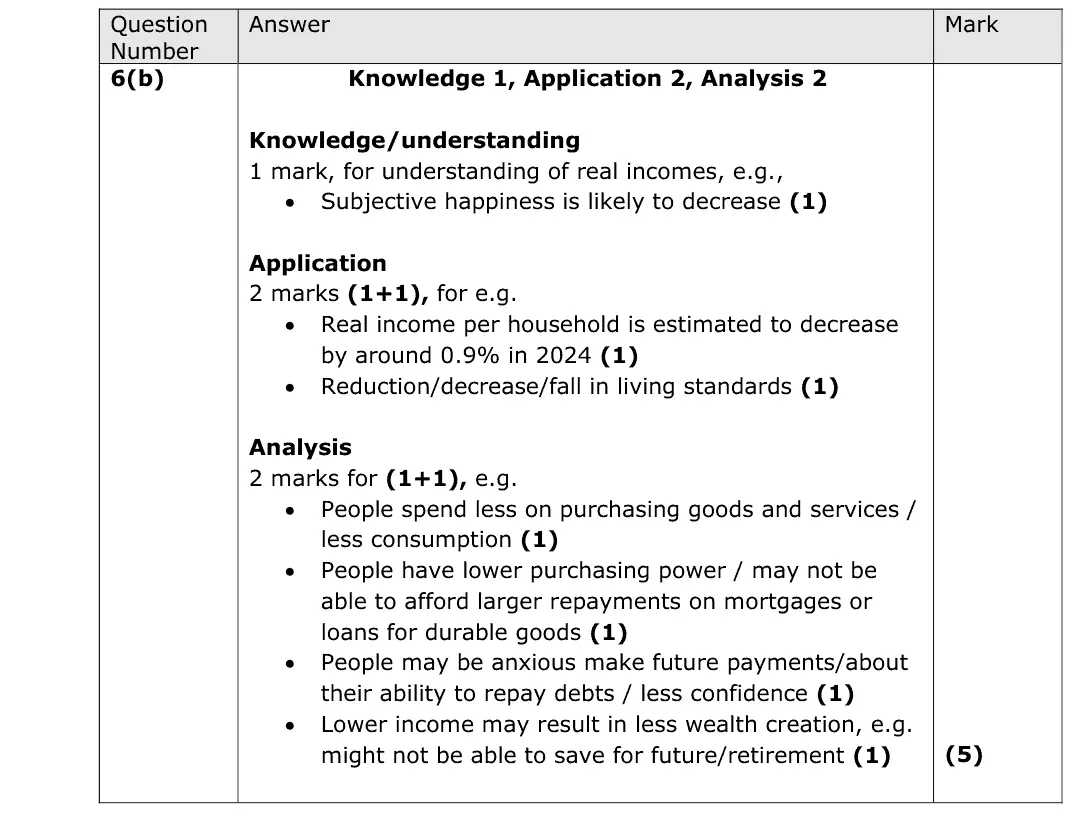
Data and extracts for question 6Sources for use with SECTION B Read Figures 1 and 2 and Extract A before answering Question 6. UK living standards and supply‑side policies Figure 1: UK rate of economic growth, 2010 to 2028 10.0 % 7.5 5.0 2.5 0 –2.5 –5.0 –7.5 –10.0 * Data from 2023 to 2028 are forecast figures (Source: adapted from https://www.statista.com/statistics/375195/gdp-growth-forecast-uk/) Figure 2: UK inflation rate* and base interest rate, January 2022 to October 2023 12 % 10 8 6 4 2 0 inflation rate base interest rate * Measured by Consumer Prices Index (CPI). This is the year-on-year inflation rate calculated monthly. (Source: adapted from www.statista.com and www.tradingeconomics.com) Extract A Economic reforms Economists forecast that the UK will experience a slower rate of economic growth between 2024 and 2028. They also expect a high rate of inflation due to rising import prices of food, fuel and energy, and a strong demand for consumer goods. As a result, real income per household is estimated to decrease by around 0.9% in 2024. 5 This decrease would be the largest reduction in living standards since the Office for National Statistics records began in the 1950s. However, the UK government argues that there are some limitations of using GDP to compare living standards over time. One main reason is the fact that GDP figures are in nominal terms. The government questions the reliability of inflation data as it 10 believes that the Monetary Policy Committee (MPC) of the Bank of England will keep a high base interest rate to control inflation. The government also claims that the forecast by economists fails to consider the market-based supply-side policies it introduced in November 2023 to improve living standards. The government’s £10.4 billion cut to National Insurance contributions for employees 15 is the most significant policy, expected to increase employment and living standards. It is forecast to bring additional people into work and encourage more people to work longer hours. This is likely to result in an extra 94 000 full-time workers. The government has also taken measures to encourage more out-of-work benefits claimants into jobs. It introduced stricter benefit rules for people who can work but 20 do not take a job offered to them. This includes stopping people’s benefits if they do not actively engage in seeking employment in six months. This is likely to result in a further increase in employment figures. But economists claim that its impact on GDP will be relatively insignificant. This is because most of those affected by this policy will take on work with limited hours and very low pay. 25 These market-based supply-side policies, combined with measures centred on childcare subsidies for working parents, are expected to increase total employment by 200 000 between 2024 and 2028. The government argues that the expected increase highlights that it is better to “unlock the potential we have at home”, rather than encouraging migration. However, several economists suggest that 30 a rise in net migration is contributing more to an increase in the UK’s potential economic growth. Furthermore, the UK government’s decision to offer 100% tax relief on investment in capital machinery will increase overall investment by 0.5% by 2028. The benefits of 35 this effective tax cut for firms are estimated to increase over time, as technology advances and productivity improves. However, this tax cut will not prevent business investment falling in the short term, as higher interest rates are making it more expensive for firms to borrow. Economists suggest that this tax cut can only be funded by decreasing government 40 expenditure on public services in the long run. Government expenditure will need to decrease by a third, as a proportion of GDP, between 2024 and 2028. (Source: adapted from https://www.ft.com/content/5ff3538b-aed2-4898-b423- f0c61da728ff)
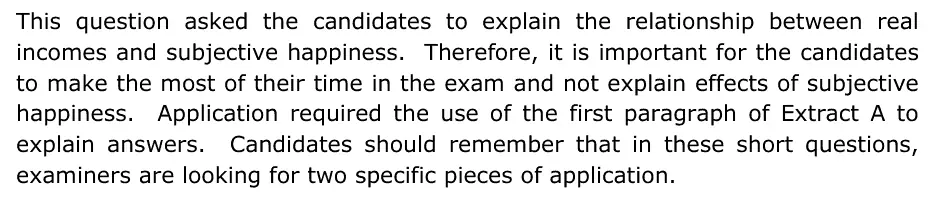
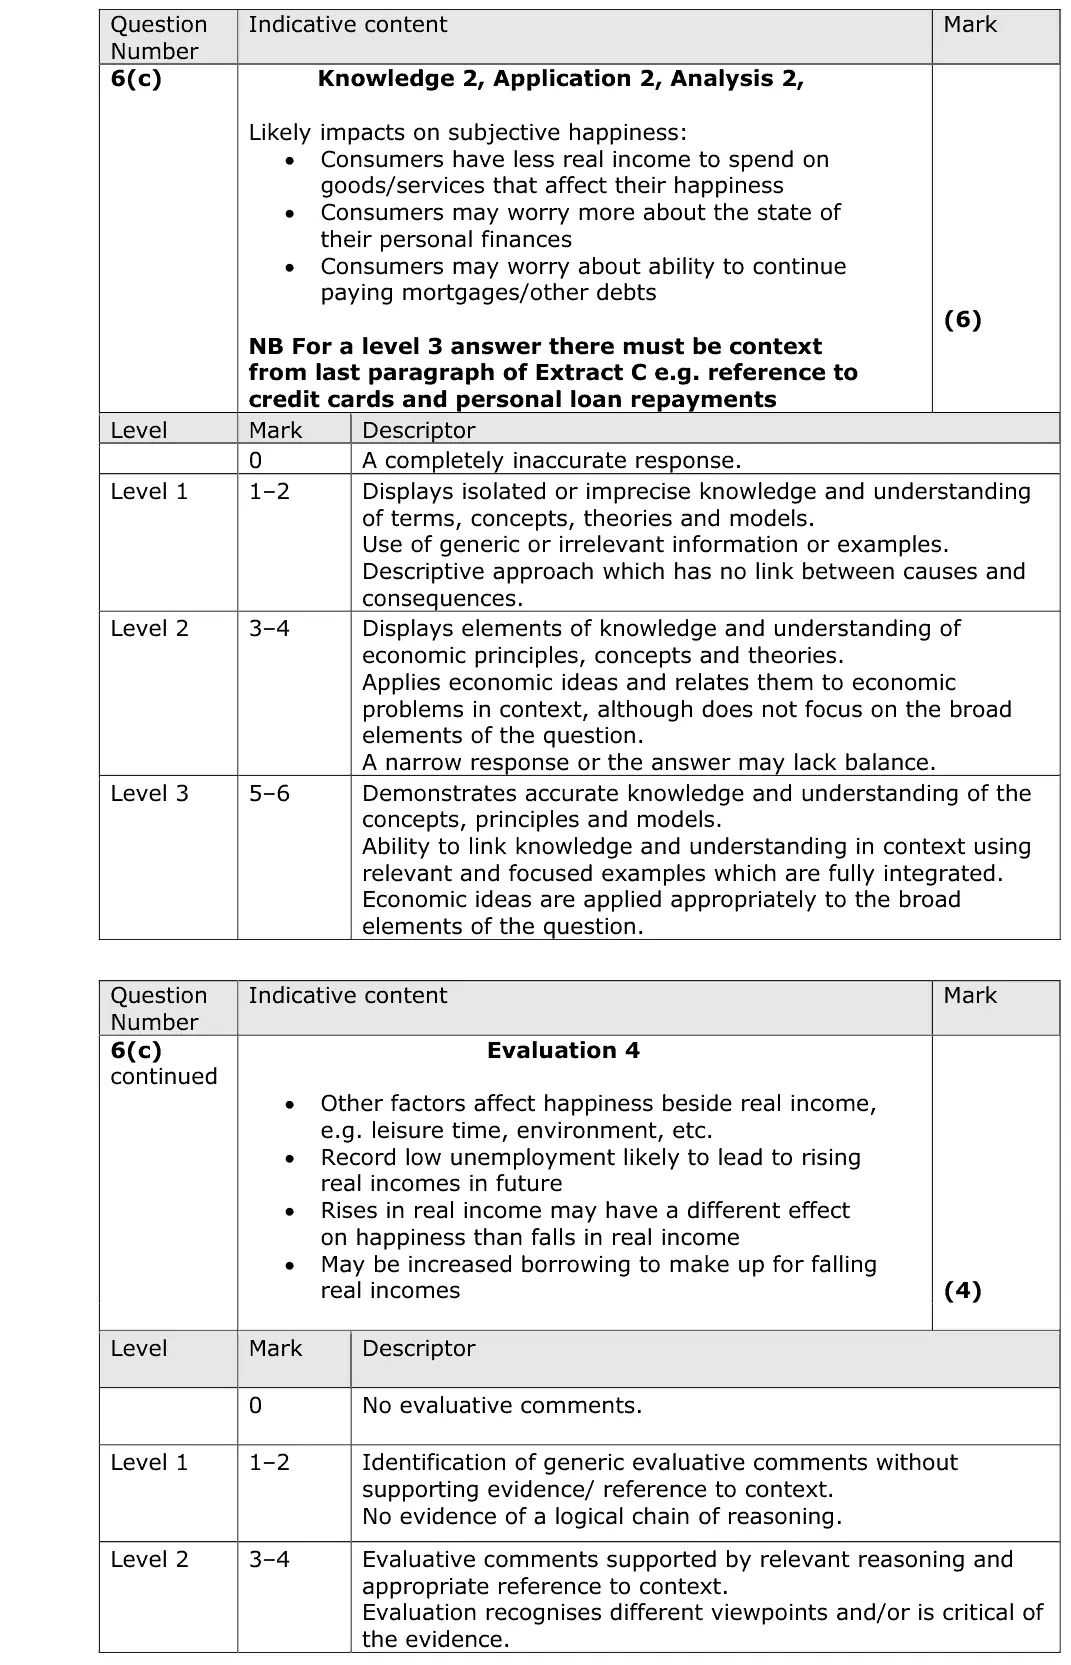
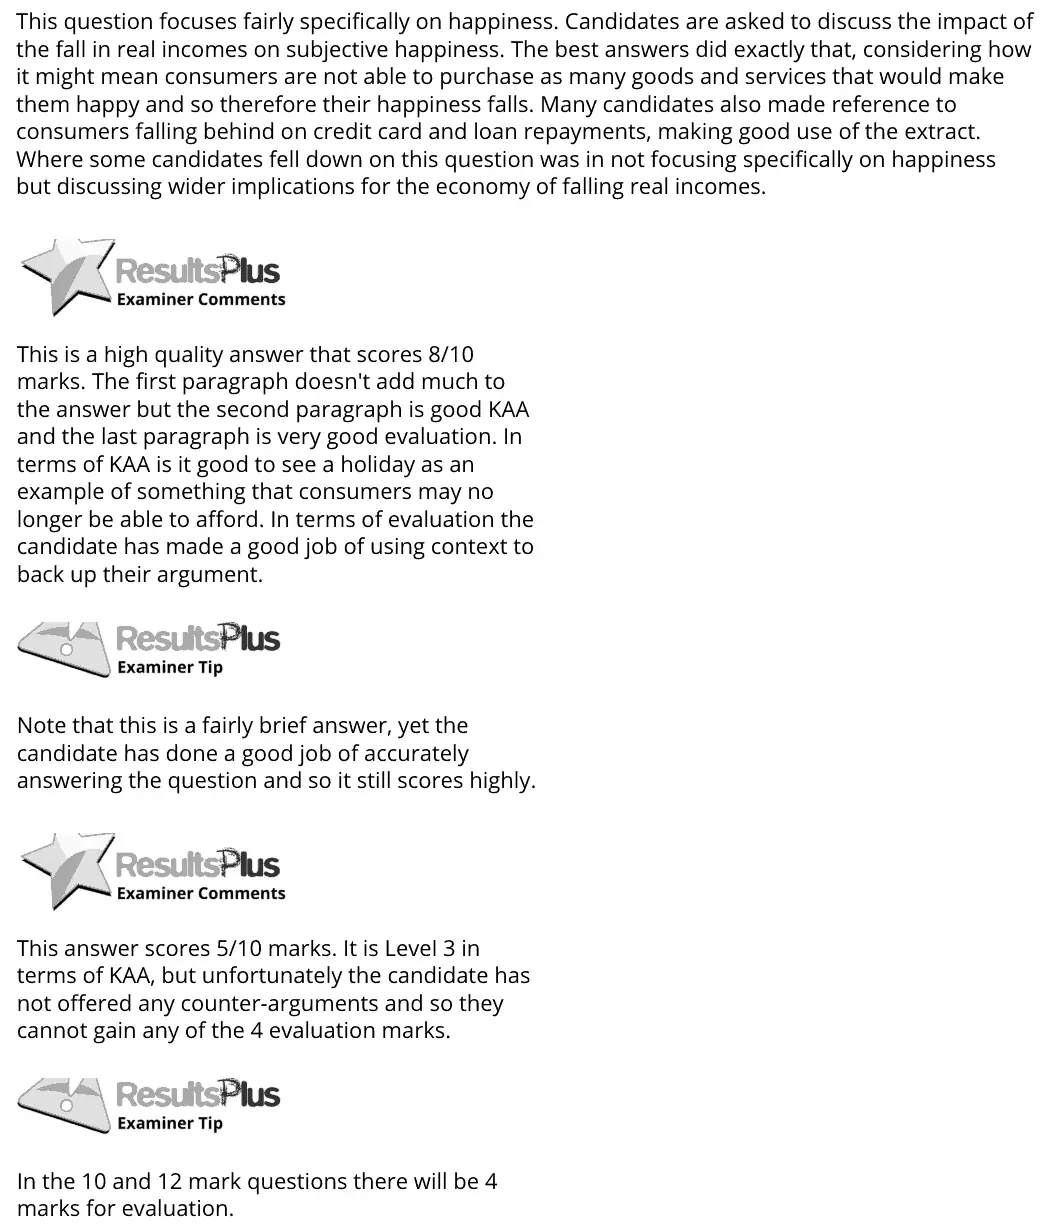
(b) With reference to the first paragraph of Extract A, explain the likely relationship between real incomes and subjective happiness. (5)
June 2025 · AS Paper 2 · Q6(c) 10 marks AO1=2, AO2=2, AO3=2, AO4=4 10-mark response measuring economic growth
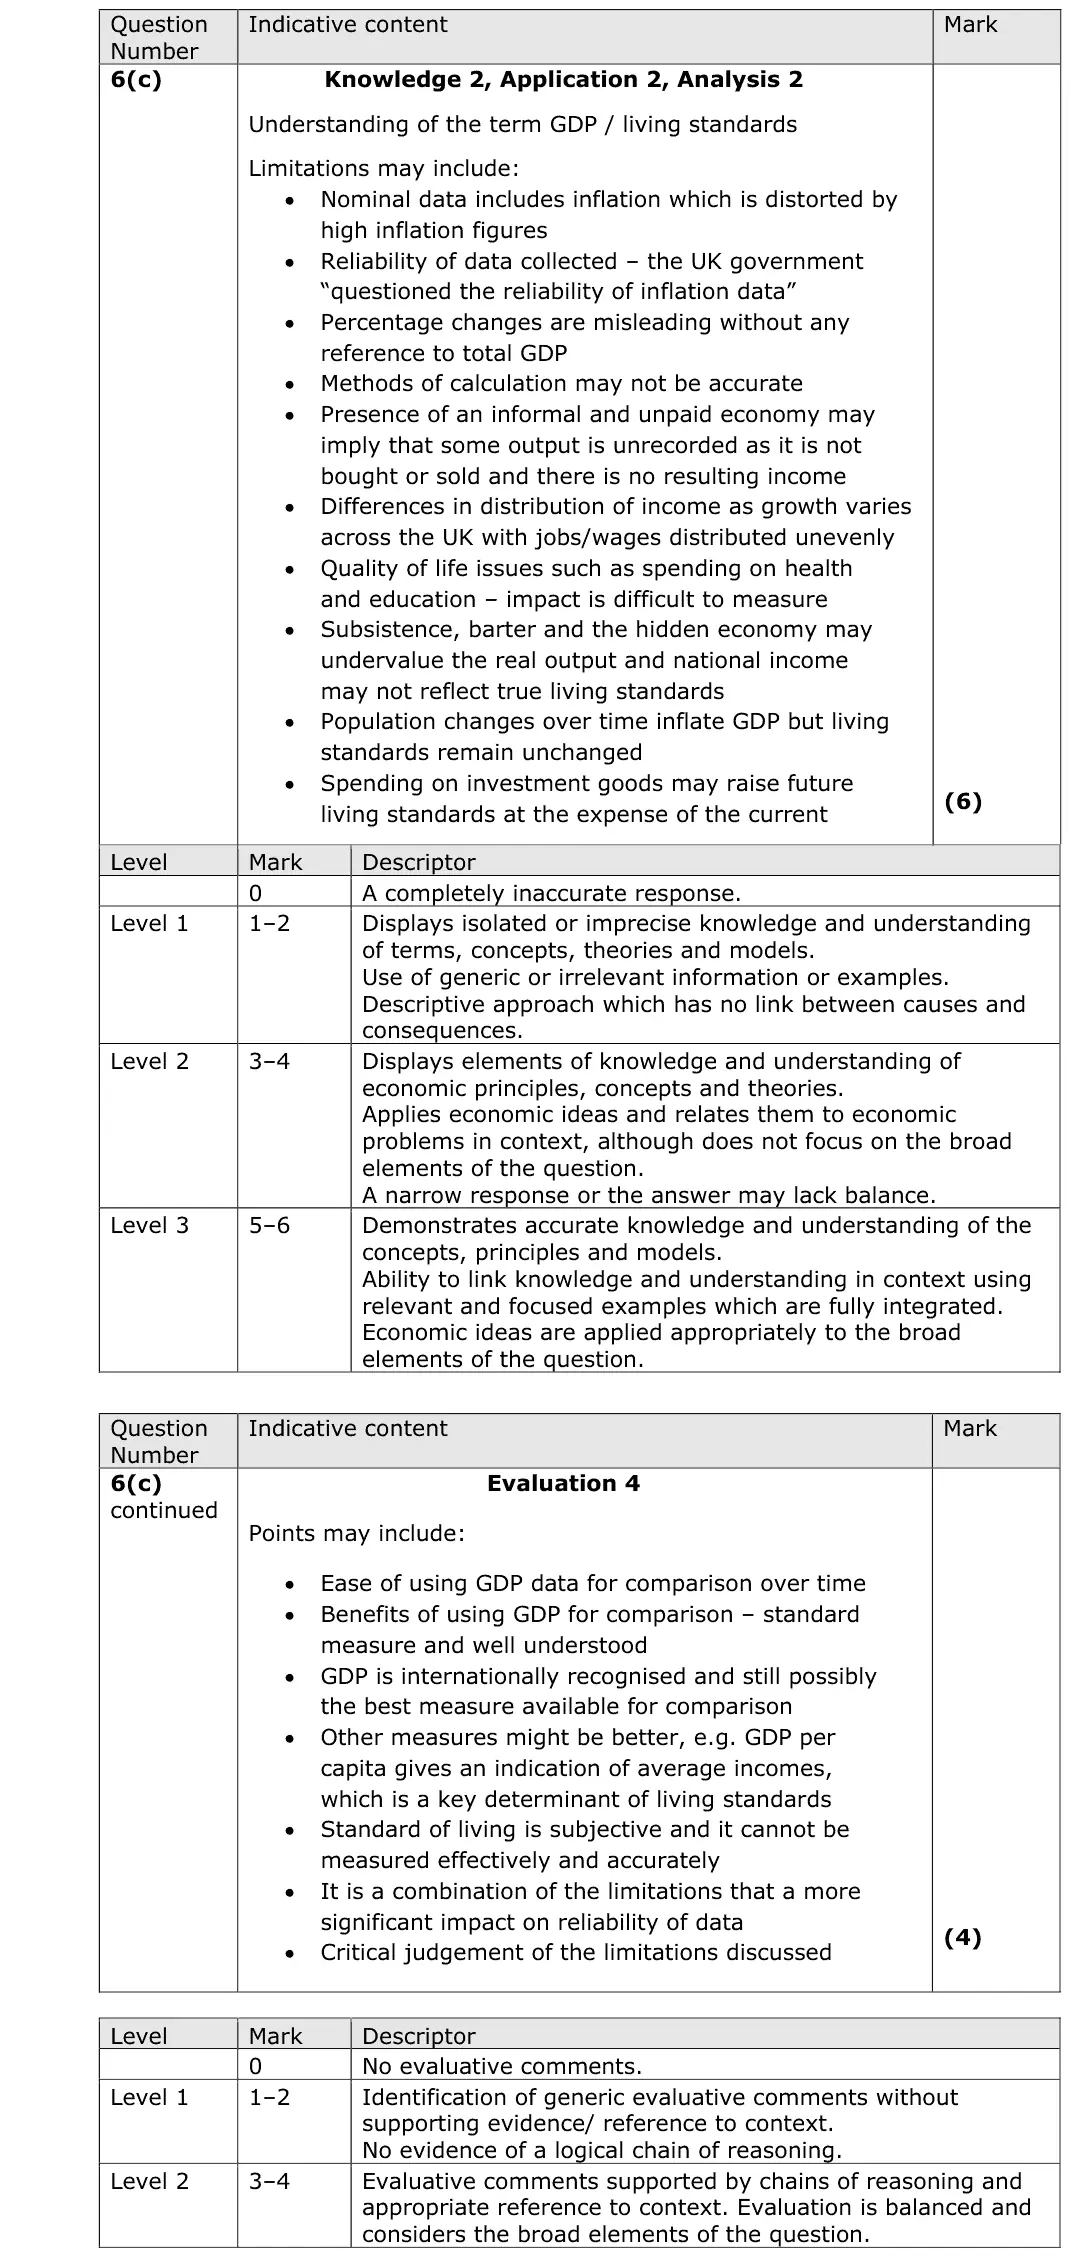
Data and extracts for question 6Sources for use with SECTION B Read Figures 1 and 2 and Extract A before answering Question 6. UK living standards and supply‑side policies Figure 1: UK rate of economic growth, 2010 to 2028 10.0 % 7.5 5.0 2.5 0 –2.5 –5.0 –7.5 –10.0 * Data from 2023 to 2028 are forecast figures (Source: adapted from https://www.statista.com/statistics/375195/gdp-growth-forecast-uk/) Figure 2: UK inflation rate* and base interest rate, January 2022 to October 2023 12 % 10 8 6 4 2 0 inflation rate base interest rate * Measured by Consumer Prices Index (CPI). This is the year-on-year inflation rate calculated monthly. (Source: adapted from www.statista.com and www.tradingeconomics.com) Extract A Economic reforms Economists forecast that the UK will experience a slower rate of economic growth between 2024 and 2028. They also expect a high rate of inflation due to rising import prices of food, fuel and energy, and a strong demand for consumer goods. As a result, real income per household is estimated to decrease by around 0.9% in 2024. 5 This decrease would be the largest reduction in living standards since the Office for National Statistics records began in the 1950s. However, the UK government argues that there are some limitations of using GDP to compare living standards over time. One main reason is the fact that GDP figures are in nominal terms. The government questions the reliability of inflation data as it 10 believes that the Monetary Policy Committee (MPC) of the Bank of England will keep a high base interest rate to control inflation. The government also claims that the forecast by economists fails to consider the market-based supply-side policies it introduced in November 2023 to improve living standards. The government’s £10.4 billion cut to National Insurance contributions for employees 15 is the most significant policy, expected to increase employment and living standards. It is forecast to bring additional people into work and encourage more people to work longer hours. This is likely to result in an extra 94 000 full-time workers. The government has also taken measures to encourage more out-of-work benefits claimants into jobs. It introduced stricter benefit rules for people who can work but 20 do not take a job offered to them. This includes stopping people’s benefits if they do not actively engage in seeking employment in six months. This is likely to result in a further increase in employment figures. But economists claim that its impact on GDP will be relatively insignificant. This is because most of those affected by this policy will take on work with limited hours and very low pay. 25 These market-based supply-side policies, combined with measures centred on childcare subsidies for working parents, are expected to increase total employment by 200 000 between 2024 and 2028. The government argues that the expected increase highlights that it is better to “unlock the potential we have at home”, rather than encouraging migration. However, several economists suggest that 30 a rise in net migration is contributing more to an increase in the UK’s potential economic growth. Furthermore, the UK government’s decision to offer 100% tax relief on investment in capital machinery will increase overall investment by 0.5% by 2028. The benefits of 35 this effective tax cut for firms are estimated to increase over time, as technology advances and productivity improves. However, this tax cut will not prevent business investment falling in the short term, as higher interest rates are making it more expensive for firms to borrow. Economists suggest that this tax cut can only be funded by decreasing government 40 expenditure on public services in the long run. Government expenditure will need to decrease by a third, as a proportion of GDP, between 2024 and 2028. (Source: adapted from https://www.ft.com/content/5ff3538b-aed2-4898-b423- f0c61da728ff)
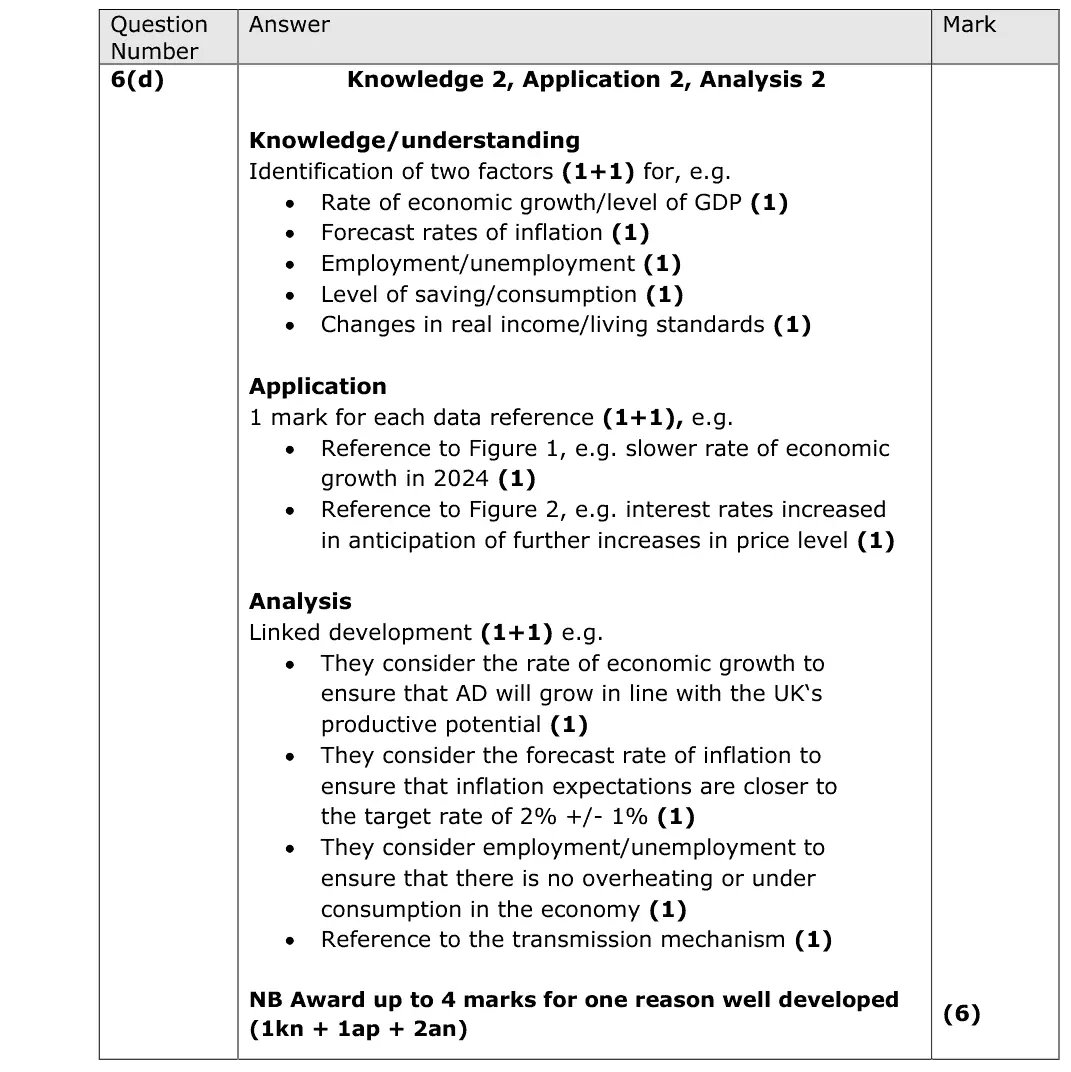
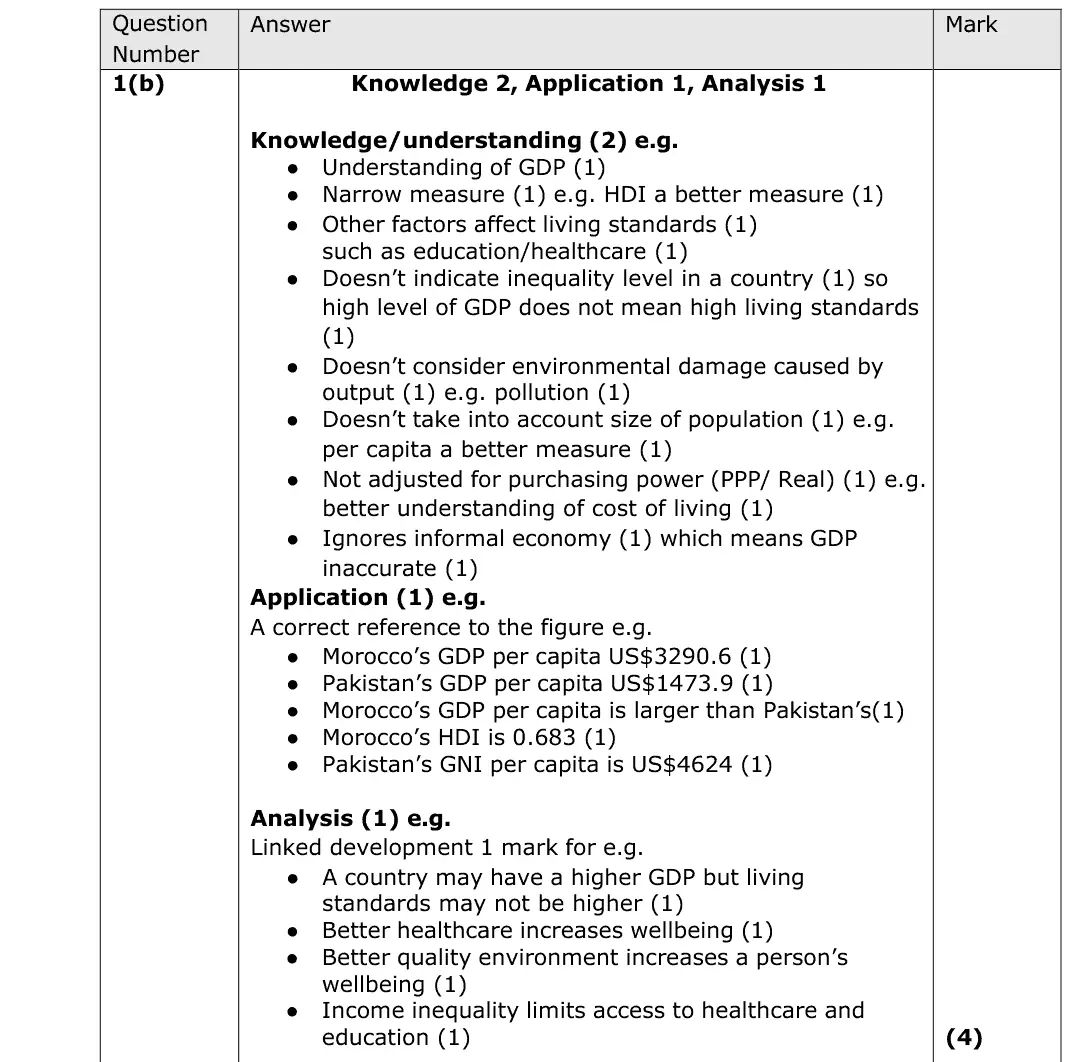
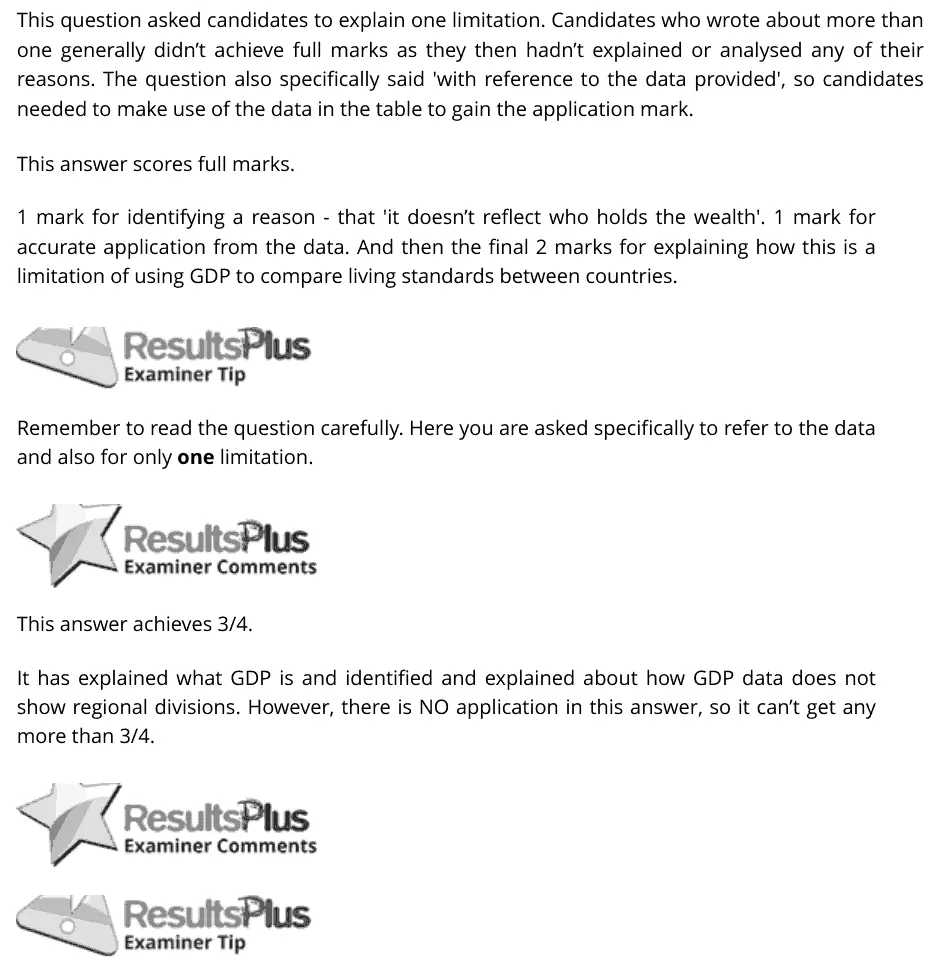
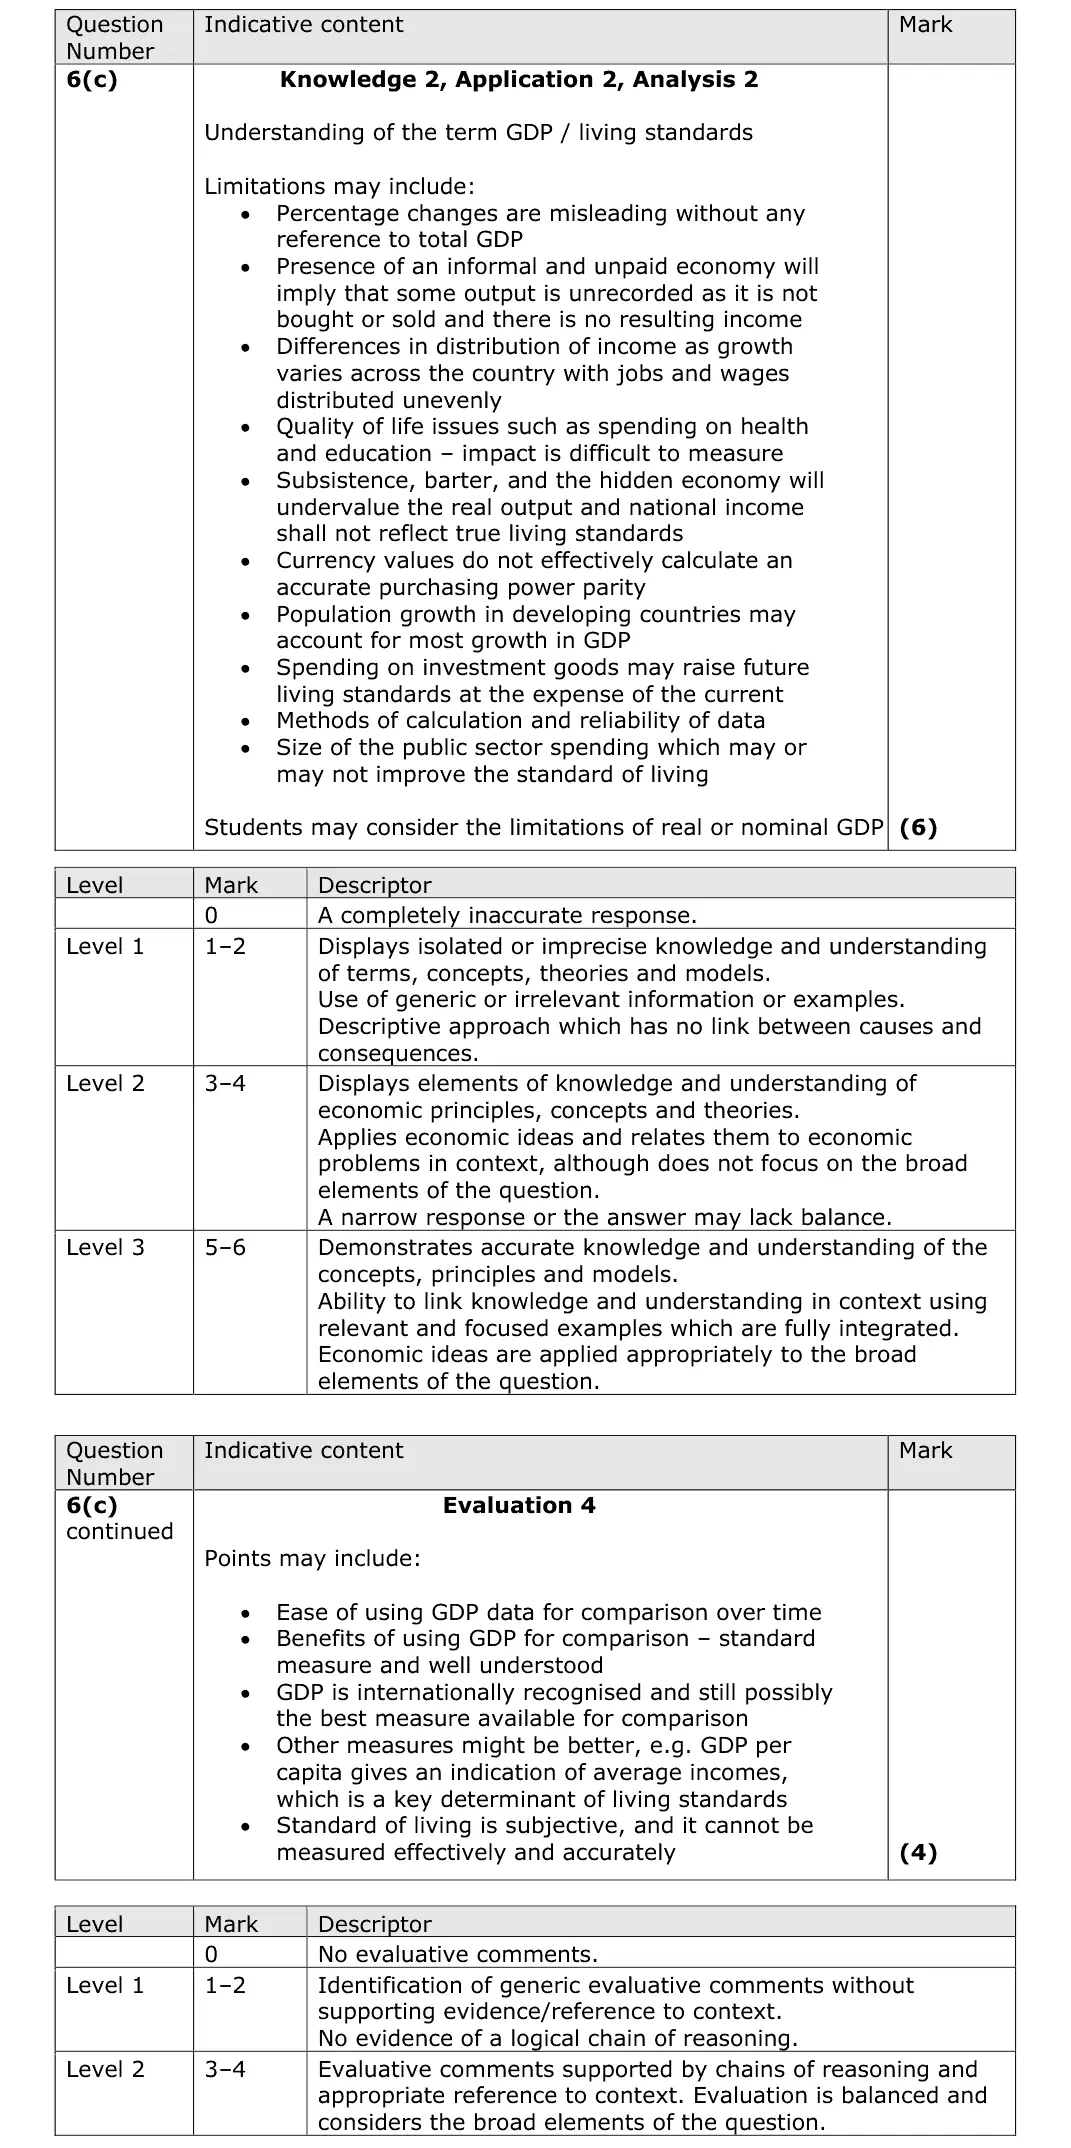
(c) With reference to Extract A and your own knowledge, assess the limitations of using GDP to compare living standards over time. (10)
June 2025 · AS Paper 2 · Q6(d) 6 marks AO1=2, AO2=2, AO3=2 Short answer fiscal and monetary policy
Data and extracts for question 6Sources for use with SECTION B Read Figures 1 and 2 and Extract A before answering Question 6. UK living standards and supply‑side policies Figure 1: UK rate of economic growth, 2010 to 2028 10.0 % 7.5 5.0 2.5 0 –2.5 –5.0 –7.5 –10.0 * Data from 2023 to 2028 are forecast figures (Source: adapted from https://www.statista.com/statistics/375195/gdp-growth-forecast-uk/) Figure 2: UK inflation rate* and base interest rate, January 2022 to October 2023 12 % 10 8 6 4 2 0 inflation rate base interest rate * Measured by Consumer Prices Index (CPI). This is the year-on-year inflation rate calculated monthly. (Source: adapted from www.statista.com and www.tradingeconomics.com) Extract A Economic reforms Economists forecast that the UK will experience a slower rate of economic growth between 2024 and 2028. They also expect a high rate of inflation due to rising import prices of food, fuel and energy, and a strong demand for consumer goods. As a result, real income per household is estimated to decrease by around 0.9% in 2024. 5 This decrease would be the largest reduction in living standards since the Office for National Statistics records began in the 1950s. However, the UK government argues that there are some limitations of using GDP to compare living standards over time. One main reason is the fact that GDP figures are in nominal terms. The government questions the reliability of inflation data as it 10 believes that the Monetary Policy Committee (MPC) of the Bank of England will keep a high base interest rate to control inflation. The government also claims that the forecast by economists fails to consider the market-based supply-side policies it introduced in November 2023 to improve living standards. The government’s £10.4 billion cut to National Insurance contributions for employees 15 is the most significant policy, expected to increase employment and living standards. It is forecast to bring additional people into work and encourage more people to work longer hours. This is likely to result in an extra 94 000 full-time workers. The government has also taken measures to encourage more out-of-work benefits claimants into jobs. It introduced stricter benefit rules for people who can work but 20 do not take a job offered to them. This includes stopping people’s benefits if they do not actively engage in seeking employment in six months. This is likely to result in a further increase in employment figures. But economists claim that its impact on GDP will be relatively insignificant. This is because most of those affected by this policy will take on work with limited hours and very low pay. 25 These market-based supply-side policies, combined with measures centred on childcare subsidies for working parents, are expected to increase total employment by 200 000 between 2024 and 2028. The government argues that the expected increase highlights that it is better to “unlock the potential we have at home”, rather than encouraging migration. However, several economists suggest that 30 a rise in net migration is contributing more to an increase in the UK’s potential economic growth. Furthermore, the UK government’s decision to offer 100% tax relief on investment in capital machinery will increase overall investment by 0.5% by 2028. The benefits of 35 this effective tax cut for firms are estimated to increase over time, as technology advances and productivity improves. However, this tax cut will not prevent business investment falling in the short term, as higher interest rates are making it more expensive for firms to borrow. Economists suggest that this tax cut can only be funded by decreasing government 40 expenditure on public services in the long run. Government expenditure will need to decrease by a third, as a proportion of GDP, between 2024 and 2028. (Source: adapted from https://www.ft.com/content/5ff3538b-aed2-4898-b423- f0c61da728ff)
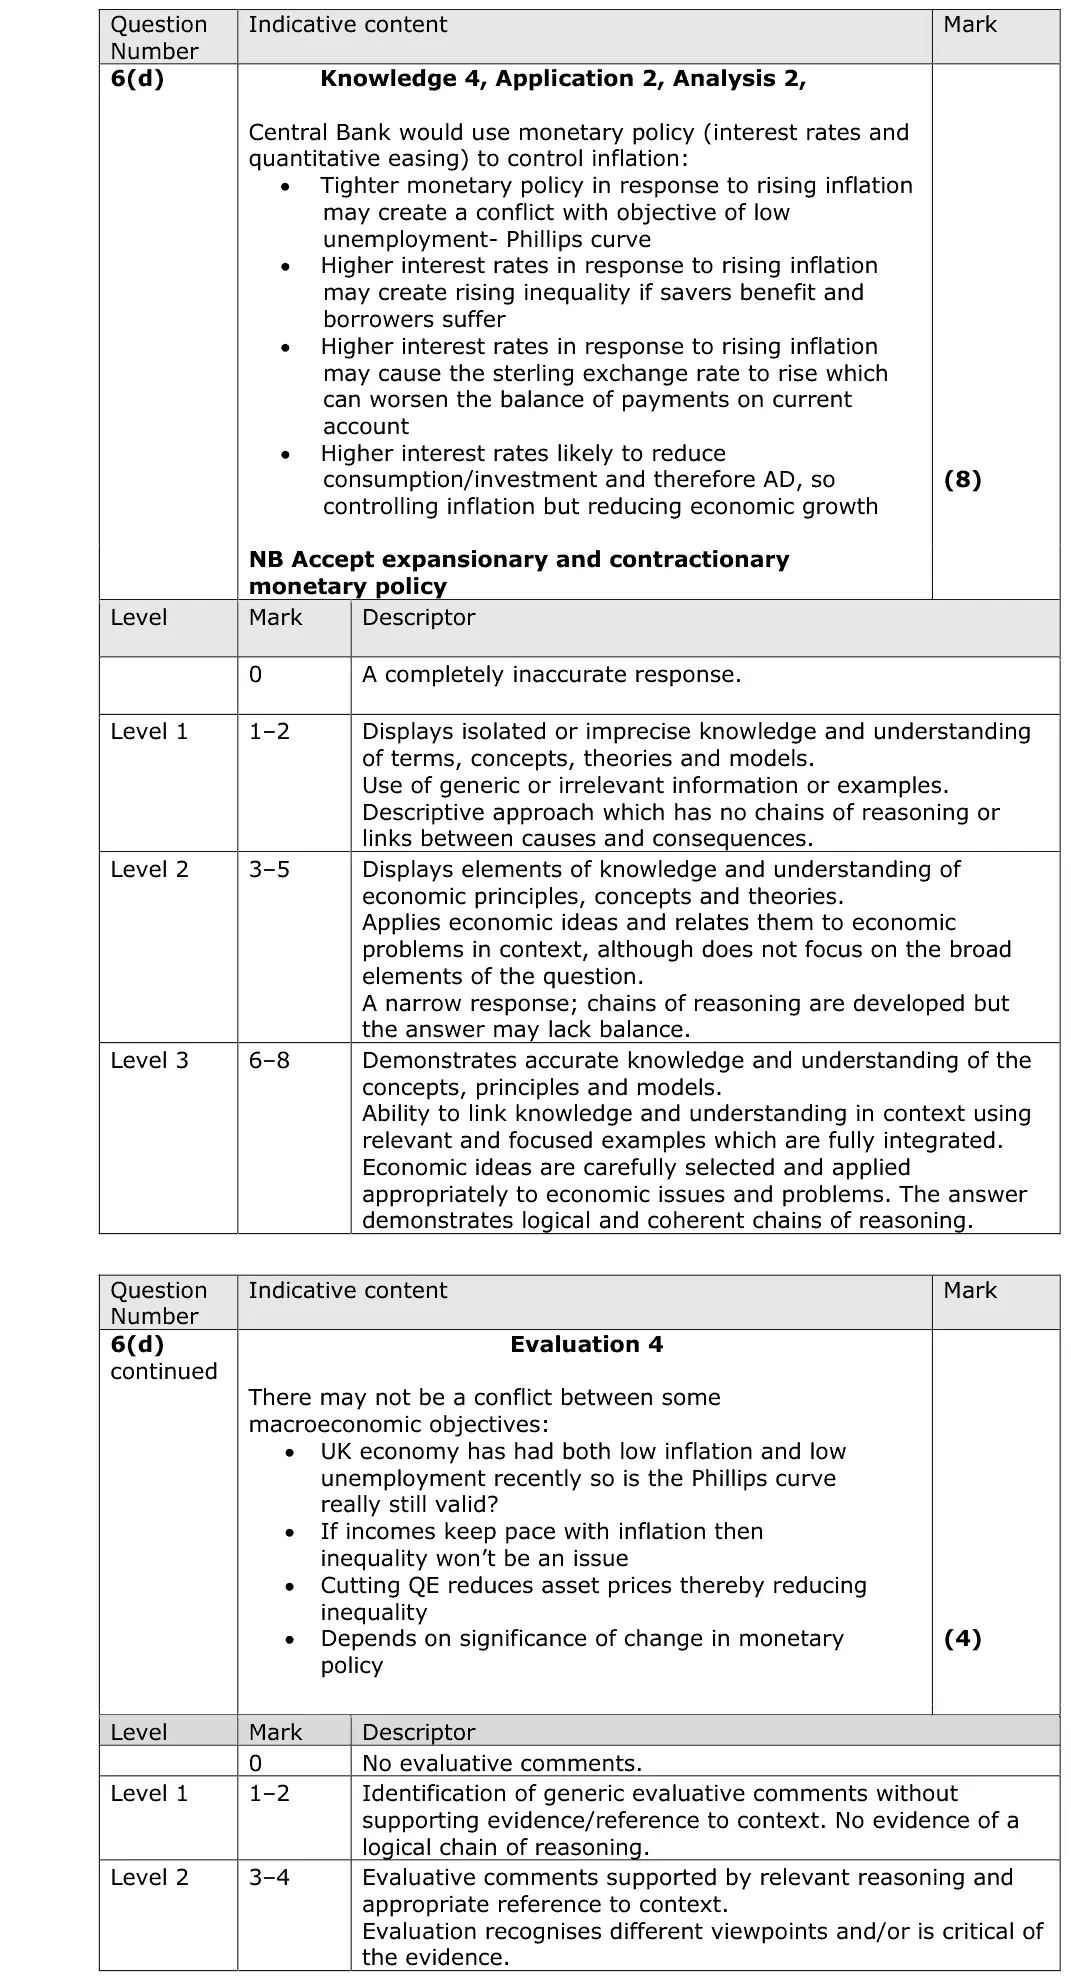
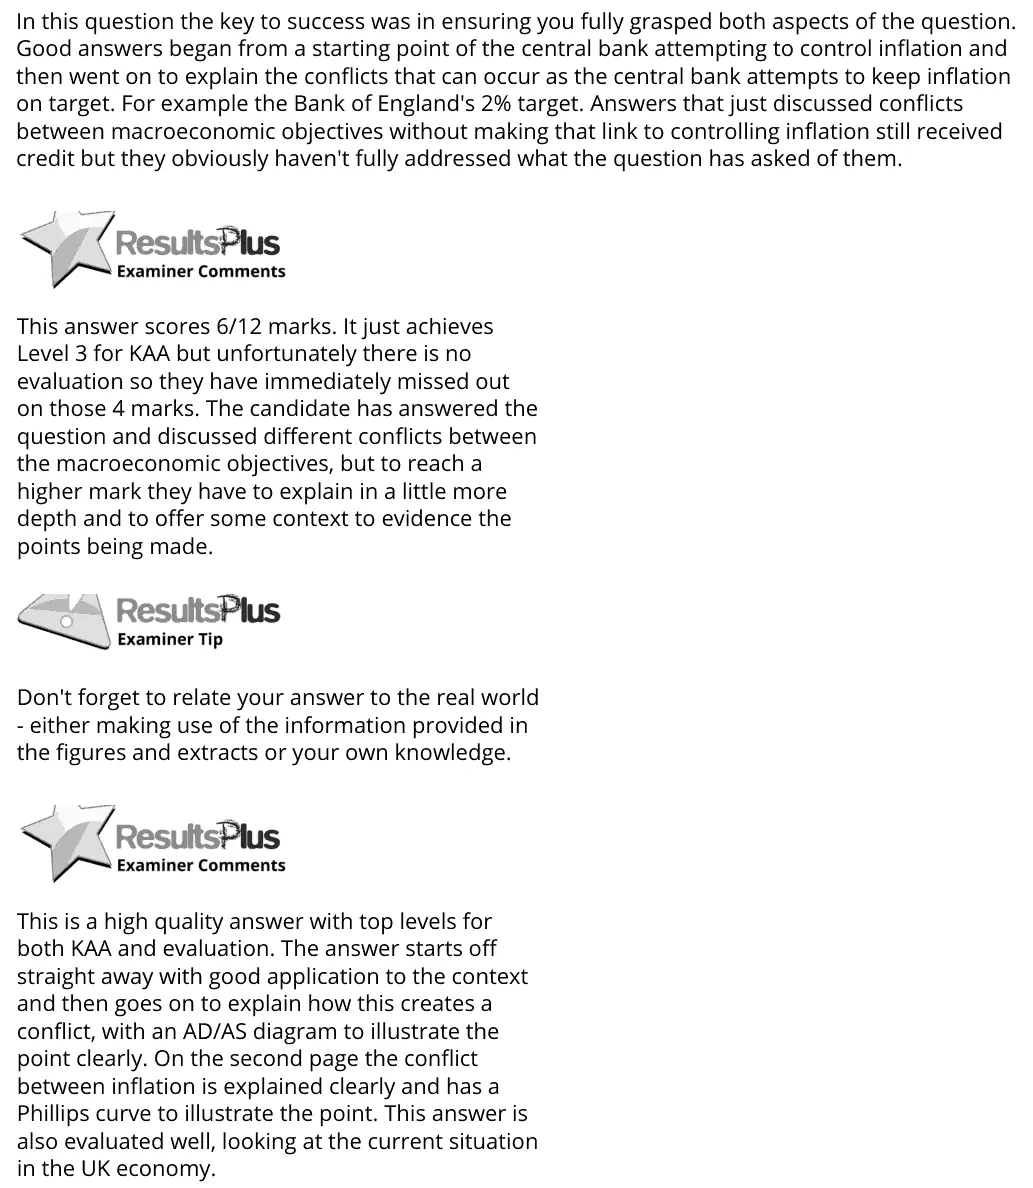
(d) With reference to the information provided, explain two factors that the Bank of England’s Monetary Policy Committee may have considered when changing the base interest rate. (6)
June 2025 · AS Paper 2 · Q6(e) 15 marks 15-mark response aggregate demandnational income and the multiplier
Data and extracts for question 6Sources for use with SECTION B Read Figures 1 and 2 and Extract A before answering Question 6. UK living standards and supply‑side policies Figure 1: UK rate of economic growth, 2010 to 2028 10.0 % 7.5 5.0 2.5 0 –2.5 –5.0 –7.5 –10.0 * Data from 2023 to 2028 are forecast figures (Source: adapted from https://www.statista.com/statistics/375195/gdp-growth-forecast-uk/) Figure 2: UK inflation rate* and base interest rate, January 2022 to October 2023 12 % 10 8 6 4 2 0 inflation rate base interest rate * Measured by Consumer Prices Index (CPI). This is the year-on-year inflation rate calculated monthly. (Source: adapted from www.statista.com and www.tradingeconomics.com) Extract A Economic reforms Economists forecast that the UK will experience a slower rate of economic growth between 2024 and 2028. They also expect a high rate of inflation due to rising import prices of food, fuel and energy, and a strong demand for consumer goods. As a result, real income per household is estimated to decrease by around 0.9% in 2024. 5 This decrease would be the largest reduction in living standards since the Office for National Statistics records began in the 1950s. However, the UK government argues that there are some limitations of using GDP to compare living standards over time. One main reason is the fact that GDP figures are in nominal terms. The government questions the reliability of inflation data as it 10 believes that the Monetary Policy Committee (MPC) of the Bank of England will keep a high base interest rate to control inflation. The government also claims that the forecast by economists fails to consider the market-based supply-side policies it introduced in November 2023 to improve living standards. The government’s £10.4 billion cut to National Insurance contributions for employees 15 is the most significant policy, expected to increase employment and living standards. It is forecast to bring additional people into work and encourage more people to work longer hours. This is likely to result in an extra 94 000 full-time workers. The government has also taken measures to encourage more out-of-work benefits claimants into jobs. It introduced stricter benefit rules for people who can work but 20 do not take a job offered to them. This includes stopping people’s benefits if they do not actively engage in seeking employment in six months. This is likely to result in a further increase in employment figures. But economists claim that its impact on GDP will be relatively insignificant. This is because most of those affected by this policy will take on work with limited hours and very low pay. 25 These market-based supply-side policies, combined with measures centred on childcare subsidies for working parents, are expected to increase total employment by 200 000 between 2024 and 2028. The government argues that the expected increase highlights that it is better to “unlock the potential we have at home”, rather than encouraging migration. However, several economists suggest that 30 a rise in net migration is contributing more to an increase in the UK’s potential economic growth. Furthermore, the UK government’s decision to offer 100% tax relief on investment in capital machinery will increase overall investment by 0.5% by 2028. The benefits of 35 this effective tax cut for firms are estimated to increase over time, as technology advances and productivity improves. However, this tax cut will not prevent business investment falling in the short term, as higher interest rates are making it more expensive for firms to borrow. Economists suggest that this tax cut can only be funded by decreasing government 40 expenditure on public services in the long run. Government expenditure will need to decrease by a third, as a proportion of GDP, between 2024 and 2028. (Source: adapted from https://www.ft.com/content/5ff3538b-aed2-4898-b423- f0c61da728ff)
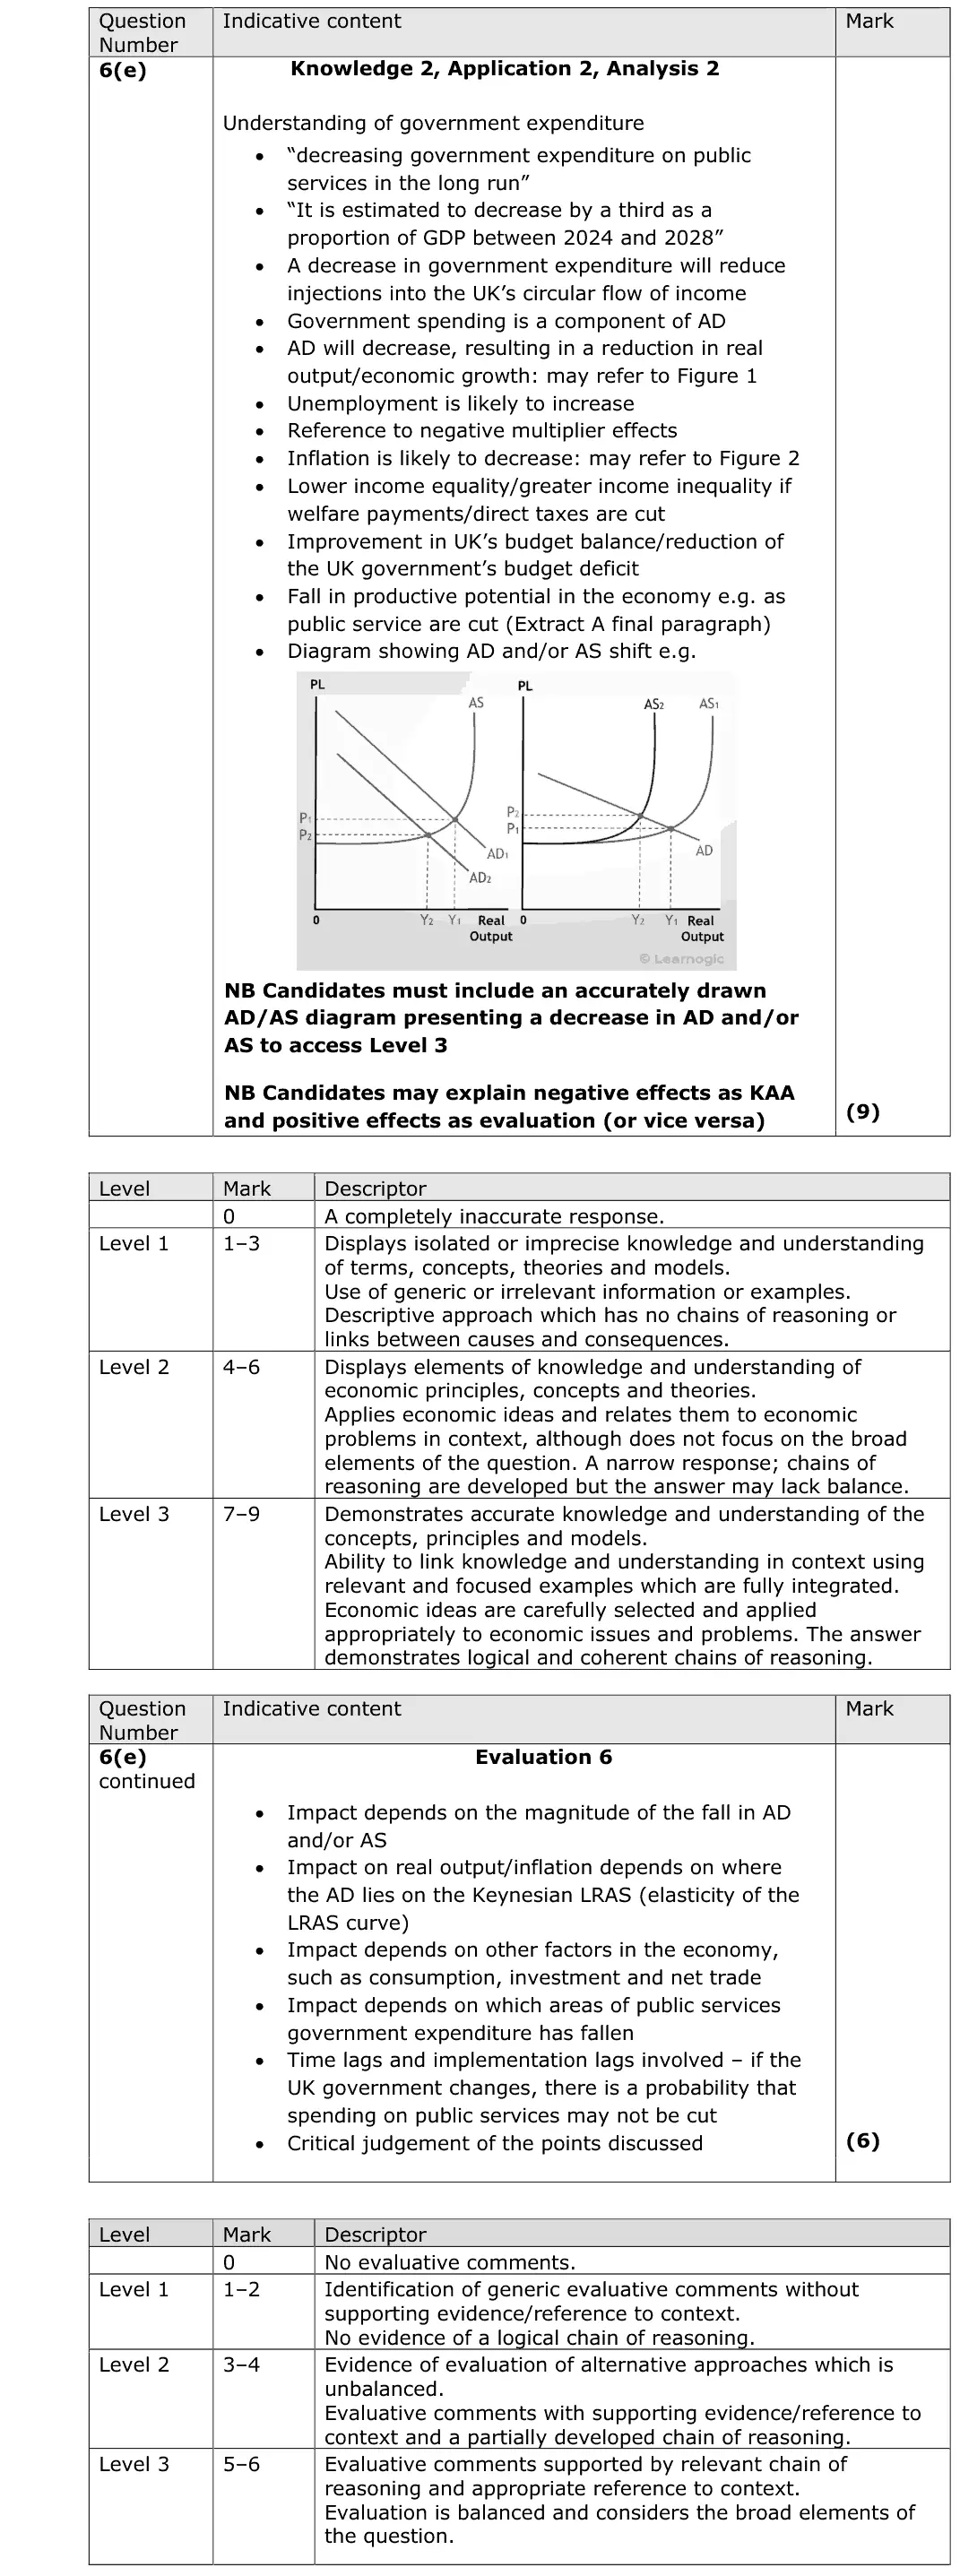
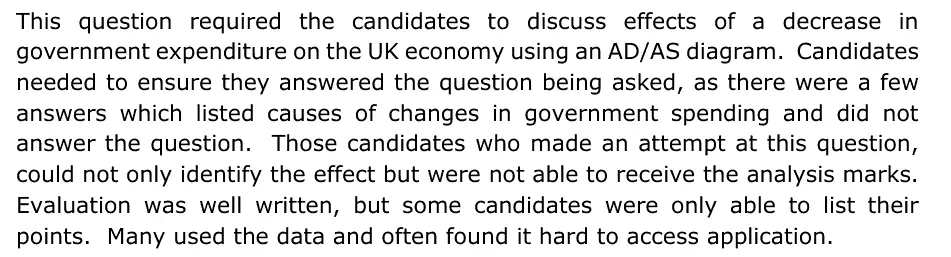
(e) Discuss the likely macroeconomic effects of a decrease in government expenditure on the UK economy. Use an aggregate demand and aggregate supply diagram to support your answer. (15)
June 2025 · AS Paper 2 · Q6(f) 20 marks AO1=4, AO2=4, AO3=6, AO4=6 20-mark essay Either/or inflation
Data and extracts for question 6Sources for use with SECTION B Read Figures 1 and 2 and Extract A before answering Question 6. UK living standards and supply‑side policies Figure 1: UK rate of economic growth, 2010 to 2028 10.0 % 7.5 5.0 2.5 0 –2.5 –5.0 –7.5 –10.0 * Data from 2023 to 2028 are forecast figures (Source: adapted from https://www.statista.com/statistics/375195/gdp-growth-forecast-uk/) Figure 2: UK inflation rate* and base interest rate, January 2022 to October 2023 12 % 10 8 6 4 2 0 inflation rate base interest rate * Measured by Consumer Prices Index (CPI). This is the year-on-year inflation rate calculated monthly. (Source: adapted from www.statista.com and www.tradingeconomics.com) Extract A Economic reforms Economists forecast that the UK will experience a slower rate of economic growth between 2024 and 2028. They also expect a high rate of inflation due to rising import prices of food, fuel and energy, and a strong demand for consumer goods. As a result, real income per household is estimated to decrease by around 0.9% in 2024. 5 This decrease would be the largest reduction in living standards since the Office for National Statistics records began in the 1950s. However, the UK government argues that there are some limitations of using GDP to compare living standards over time. One main reason is the fact that GDP figures are in nominal terms. The government questions the reliability of inflation data as it 10 believes that the Monetary Policy Committee (MPC) of the Bank of England will keep a high base interest rate to control inflation. The government also claims that the forecast by economists fails to consider the market-based supply-side policies it introduced in November 2023 to improve living standards. The government’s £10.4 billion cut to National Insurance contributions for employees 15 is the most significant policy, expected to increase employment and living standards. It is forecast to bring additional people into work and encourage more people to work longer hours. This is likely to result in an extra 94 000 full-time workers. The government has also taken measures to encourage more out-of-work benefits claimants into jobs. It introduced stricter benefit rules for people who can work but 20 do not take a job offered to them. This includes stopping people’s benefits if they do not actively engage in seeking employment in six months. This is likely to result in a further increase in employment figures. But economists claim that its impact on GDP will be relatively insignificant. This is because most of those affected by this policy will take on work with limited hours and very low pay. 25 These market-based supply-side policies, combined with measures centred on childcare subsidies for working parents, are expected to increase total employment by 200 000 between 2024 and 2028. The government argues that the expected increase highlights that it is better to “unlock the potential we have at home”, rather than encouraging migration. However, several economists suggest that 30 a rise in net migration is contributing more to an increase in the UK’s potential economic growth. Furthermore, the UK government’s decision to offer 100% tax relief on investment in capital machinery will increase overall investment by 0.5% by 2028. The benefits of 35 this effective tax cut for firms are estimated to increase over time, as technology advances and productivity improves. However, this tax cut will not prevent business investment falling in the short term, as higher interest rates are making it more expensive for firms to borrow. Economists suggest that this tax cut can only be funded by decreasing government 40 expenditure on public services in the long run. Government expenditure will need to decrease by a third, as a proportion of GDP, between 2024 and 2028. (Source: adapted from https://www.ft.com/content/5ff3538b-aed2-4898-b423- f0c61da728ff)
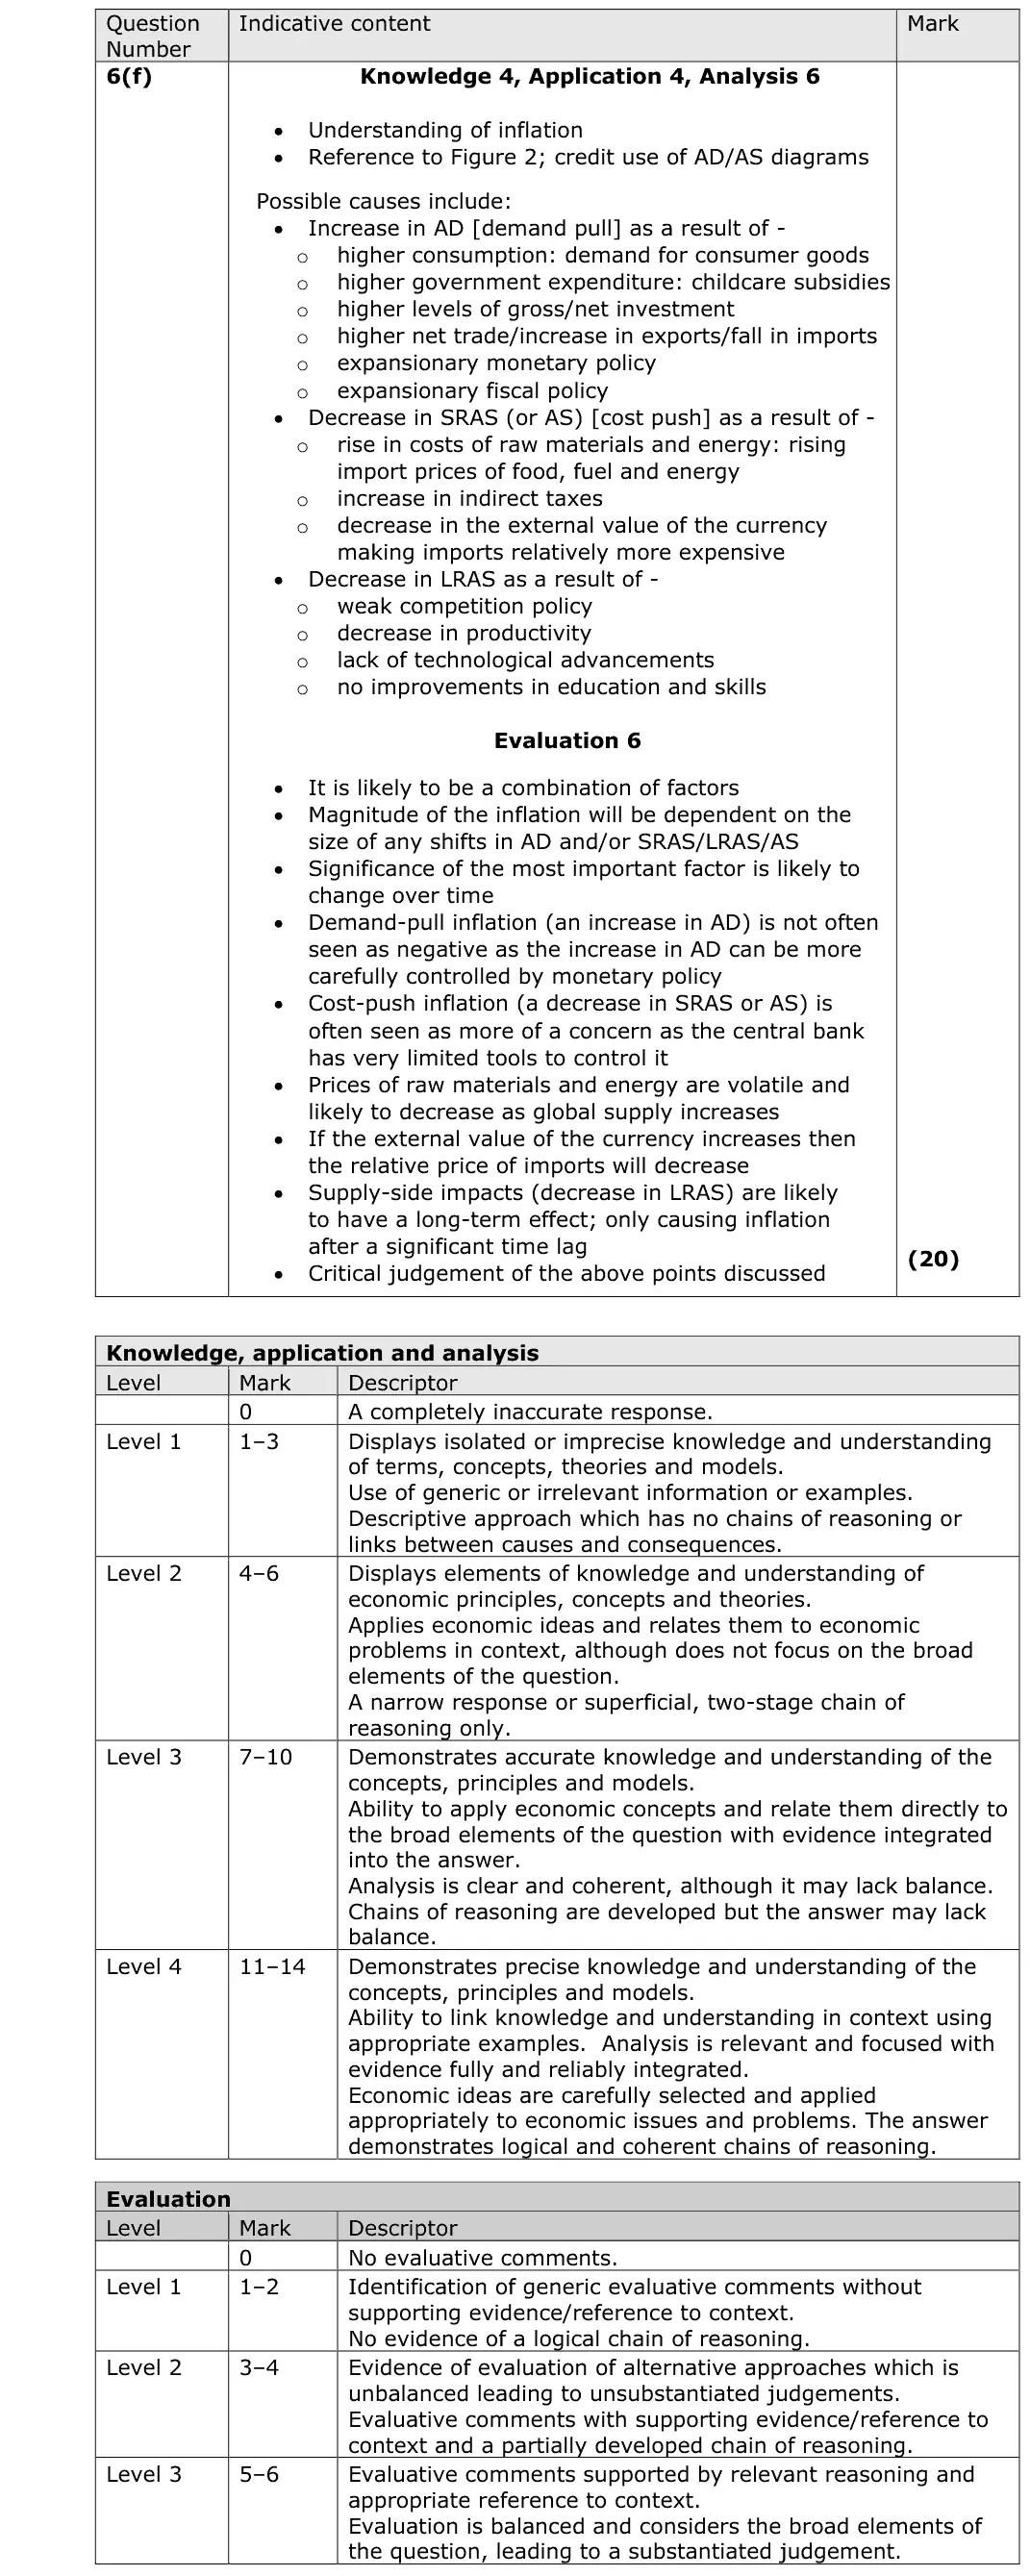
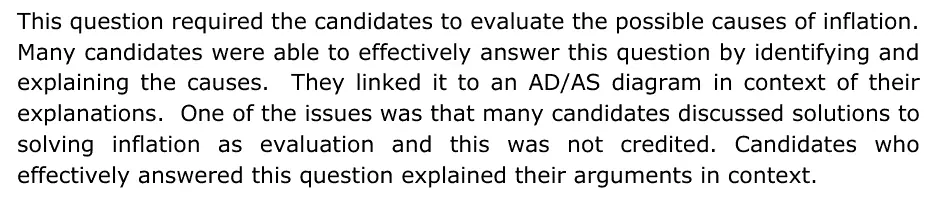
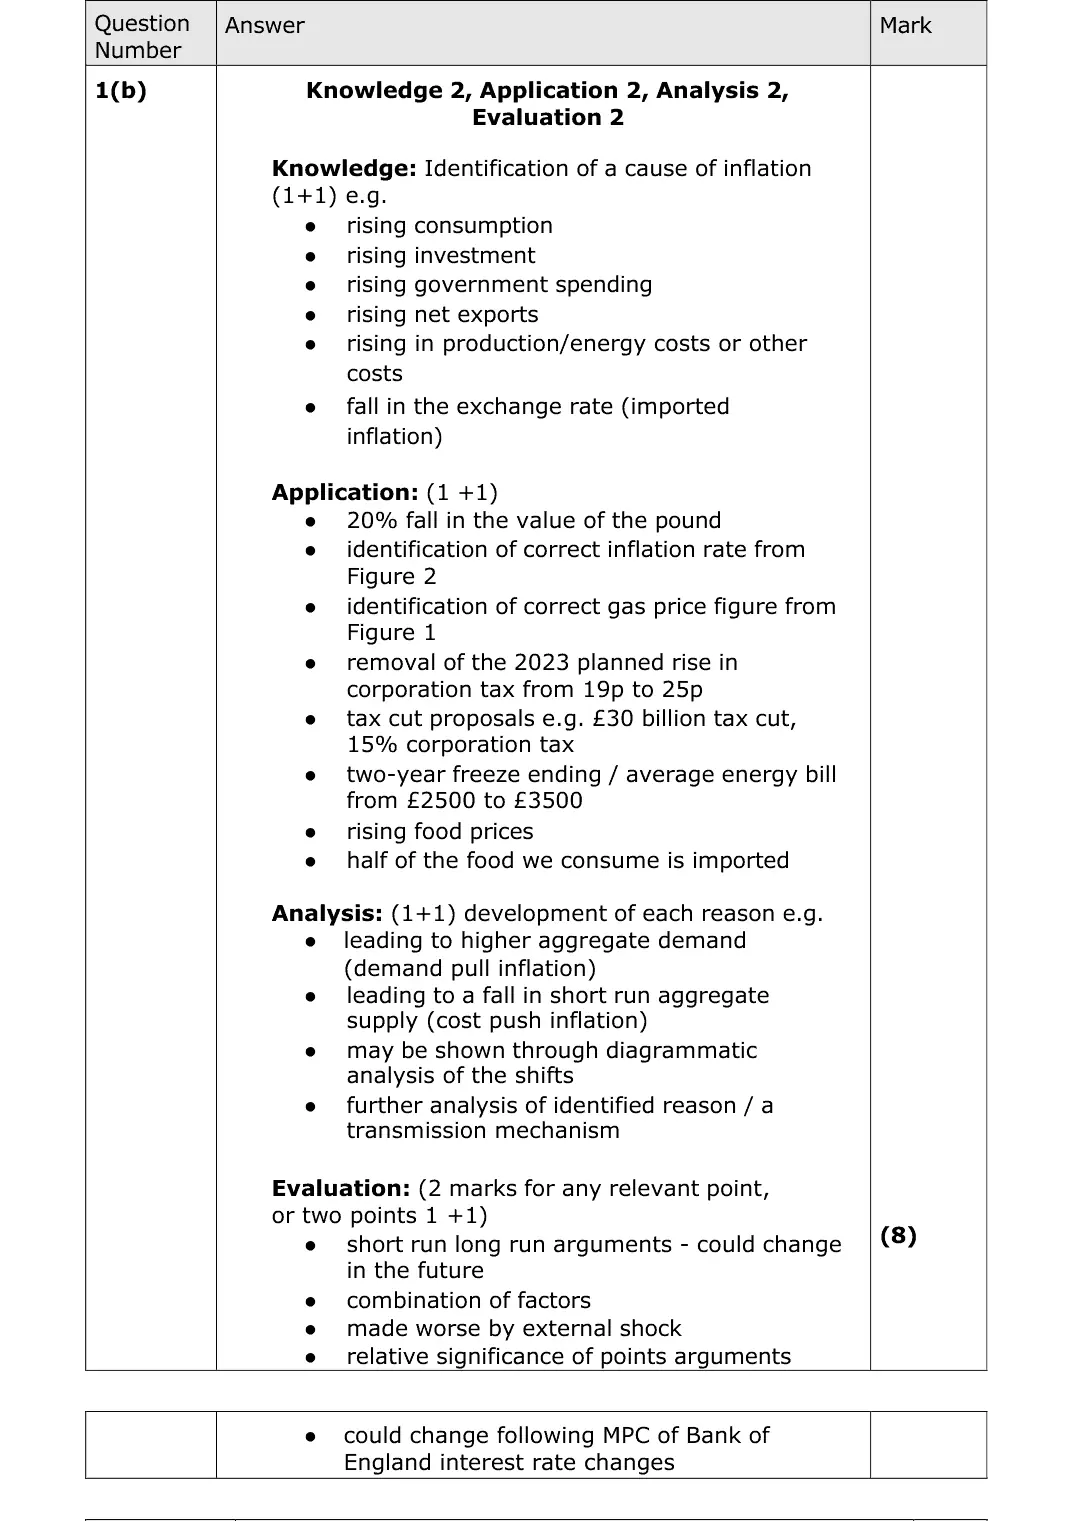
(f) Evaluate the possible causes of inflation in the UK. (20)
June 2025 · AS Paper 2 · Q6(g) 20 marks AO1=4, AO2=4, AO3=6, AO4=6 20-mark essay Either/or supply side policies
Data and extracts for question 6Sources for use with SECTION B Read Figures 1 and 2 and Extract A before answering Question 6. UK living standards and supply‑side policies Figure 1: UK rate of economic growth, 2010 to 2028 10.0 % 7.5 5.0 2.5 0 –2.5 –5.0 –7.5 –10.0 * Data from 2023 to 2028 are forecast figures (Source: adapted from https://www.statista.com/statistics/375195/gdp-growth-forecast-uk/) Figure 2: UK inflation rate* and base interest rate, January 2022 to October 2023 12 % 10 8 6 4 2 0 inflation rate base interest rate * Measured by Consumer Prices Index (CPI). This is the year-on-year inflation rate calculated monthly. (Source: adapted from www.statista.com and www.tradingeconomics.com) Extract A Economic reforms Economists forecast that the UK will experience a slower rate of economic growth between 2024 and 2028. They also expect a high rate of inflation due to rising import prices of food, fuel and energy, and a strong demand for consumer goods. As a result, real income per household is estimated to decrease by around 0.9% in 2024. 5 This decrease would be the largest reduction in living standards since the Office for National Statistics records began in the 1950s. However, the UK government argues that there are some limitations of using GDP to compare living standards over time. One main reason is the fact that GDP figures are in nominal terms. The government questions the reliability of inflation data as it 10 believes that the Monetary Policy Committee (MPC) of the Bank of England will keep a high base interest rate to control inflation. The government also claims that the forecast by economists fails to consider the market-based supply-side policies it introduced in November 2023 to improve living standards. The government’s £10.4 billion cut to National Insurance contributions for employees 15 is the most significant policy, expected to increase employment and living standards. It is forecast to bring additional people into work and encourage more people to work longer hours. This is likely to result in an extra 94 000 full-time workers. The government has also taken measures to encourage more out-of-work benefits claimants into jobs. It introduced stricter benefit rules for people who can work but 20 do not take a job offered to them. This includes stopping people’s benefits if they do not actively engage in seeking employment in six months. This is likely to result in a further increase in employment figures. But economists claim that its impact on GDP will be relatively insignificant. This is because most of those affected by this policy will take on work with limited hours and very low pay. 25 These market-based supply-side policies, combined with measures centred on childcare subsidies for working parents, are expected to increase total employment by 200 000 between 2024 and 2028. The government argues that the expected increase highlights that it is better to “unlock the potential we have at home”, rather than encouraging migration. However, several economists suggest that 30 a rise in net migration is contributing more to an increase in the UK’s potential economic growth. Furthermore, the UK government’s decision to offer 100% tax relief on investment in capital machinery will increase overall investment by 0.5% by 2028. The benefits of 35 this effective tax cut for firms are estimated to increase over time, as technology advances and productivity improves. However, this tax cut will not prevent business investment falling in the short term, as higher interest rates are making it more expensive for firms to borrow. Economists suggest that this tax cut can only be funded by decreasing government 40 expenditure on public services in the long run. Government expenditure will need to decrease by a third, as a proportion of GDP, between 2024 and 2028. (Source: adapted from https://www.ft.com/content/5ff3538b-aed2-4898-b423- f0c61da728ff)
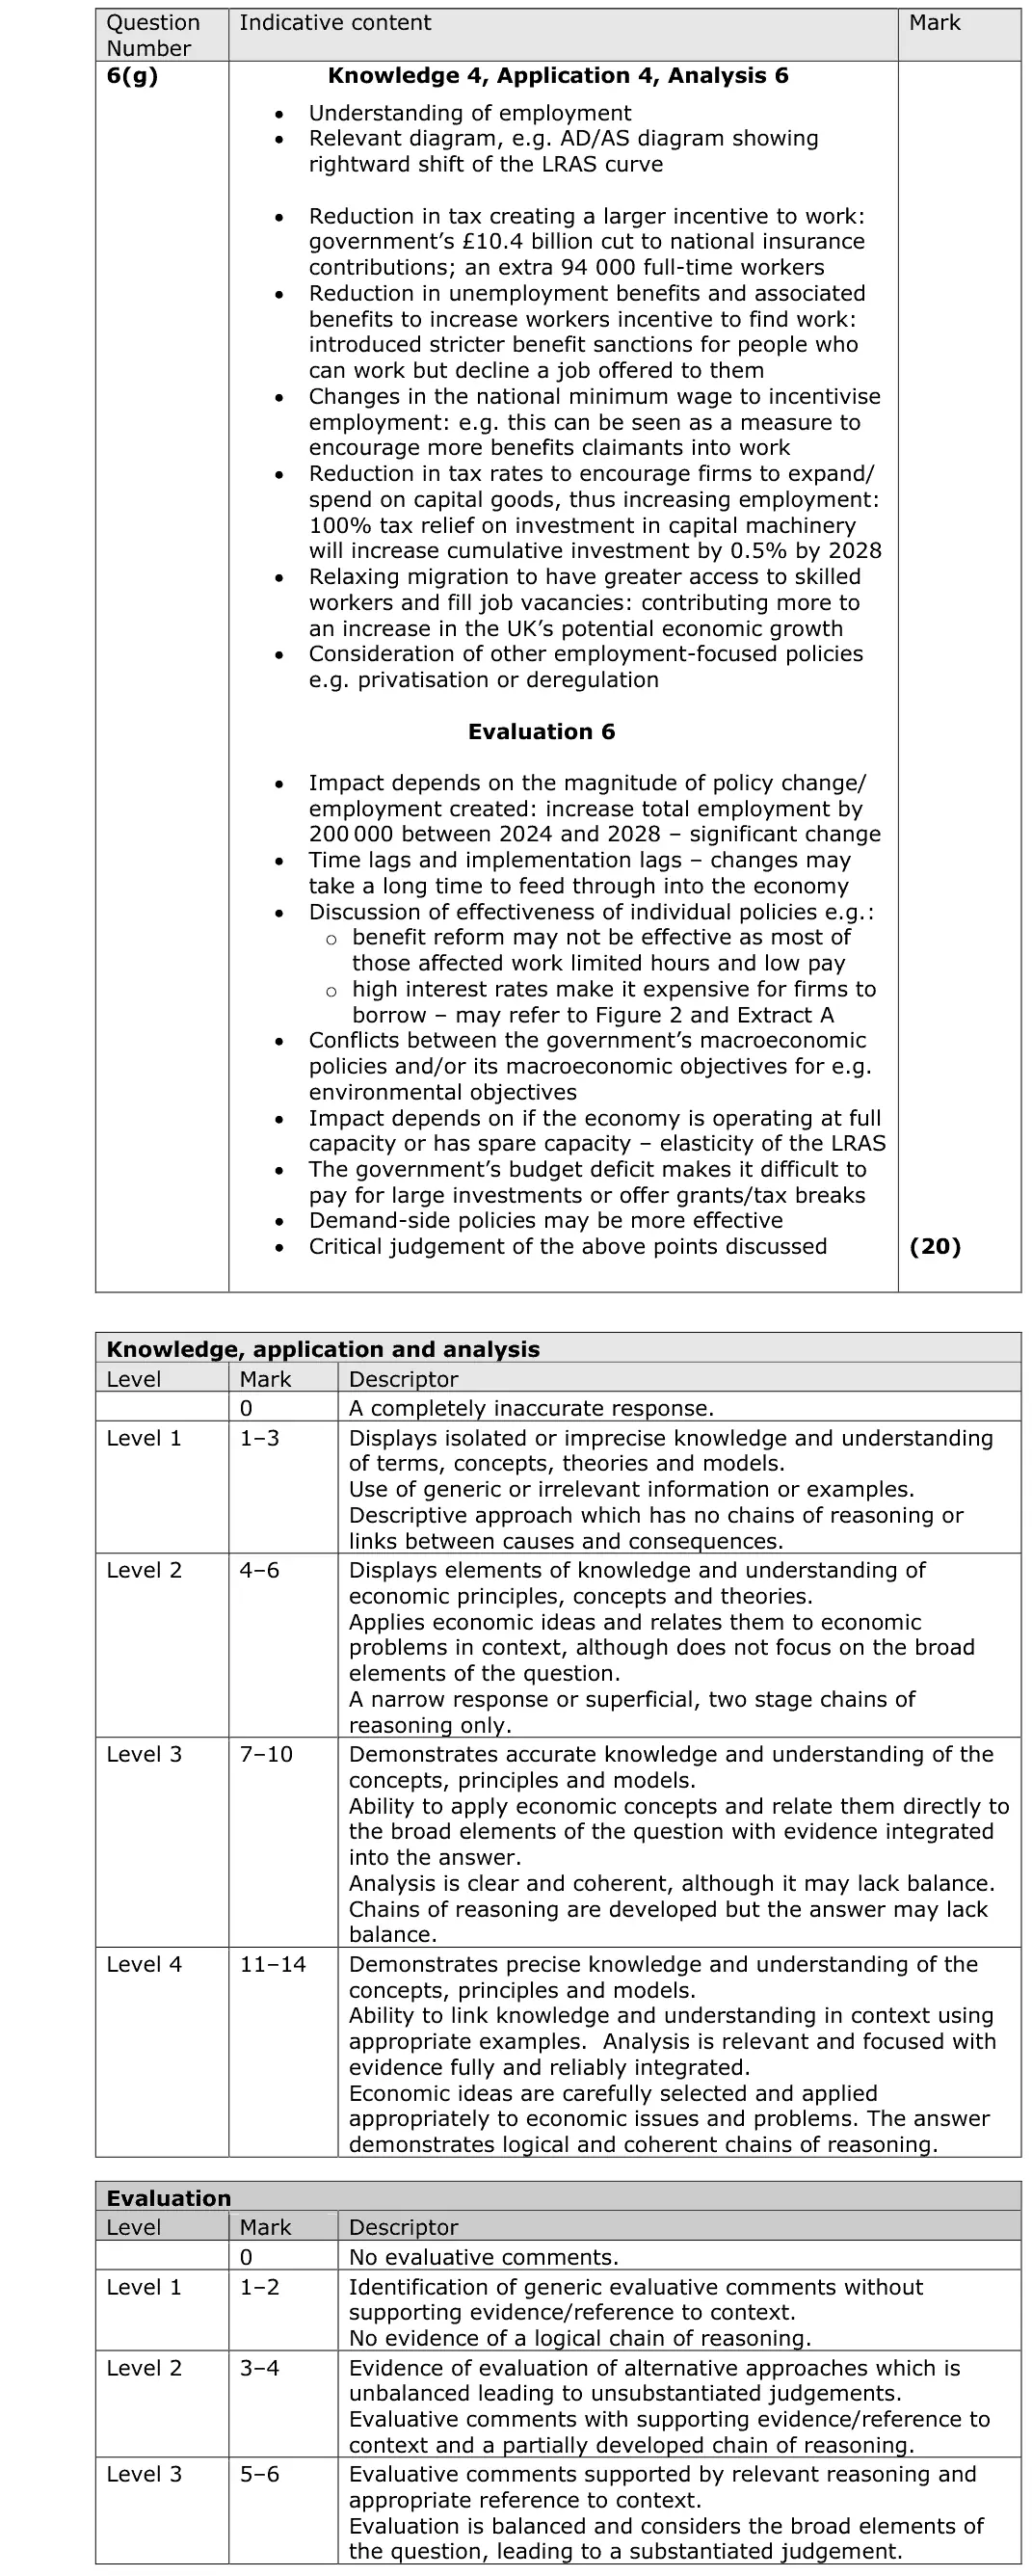
(g) Evaluate the use of market-based supply-side policies to increase UK employment. (20)
June 2025 · Paper 1 · Q1(a) 4 marks AO1=2, AO2=2 Calculation business growth and objectivesrevenues costs and profits
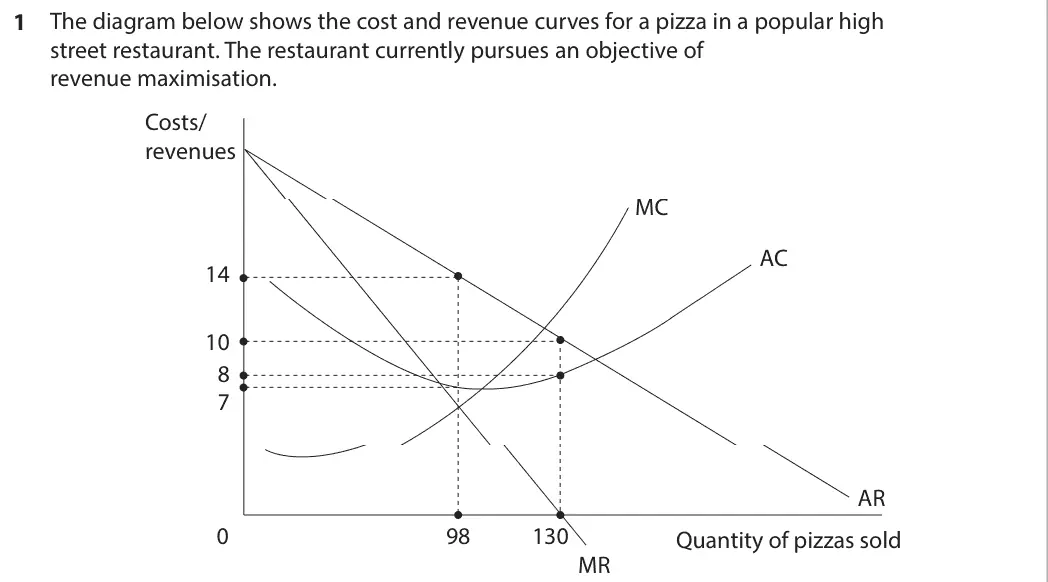
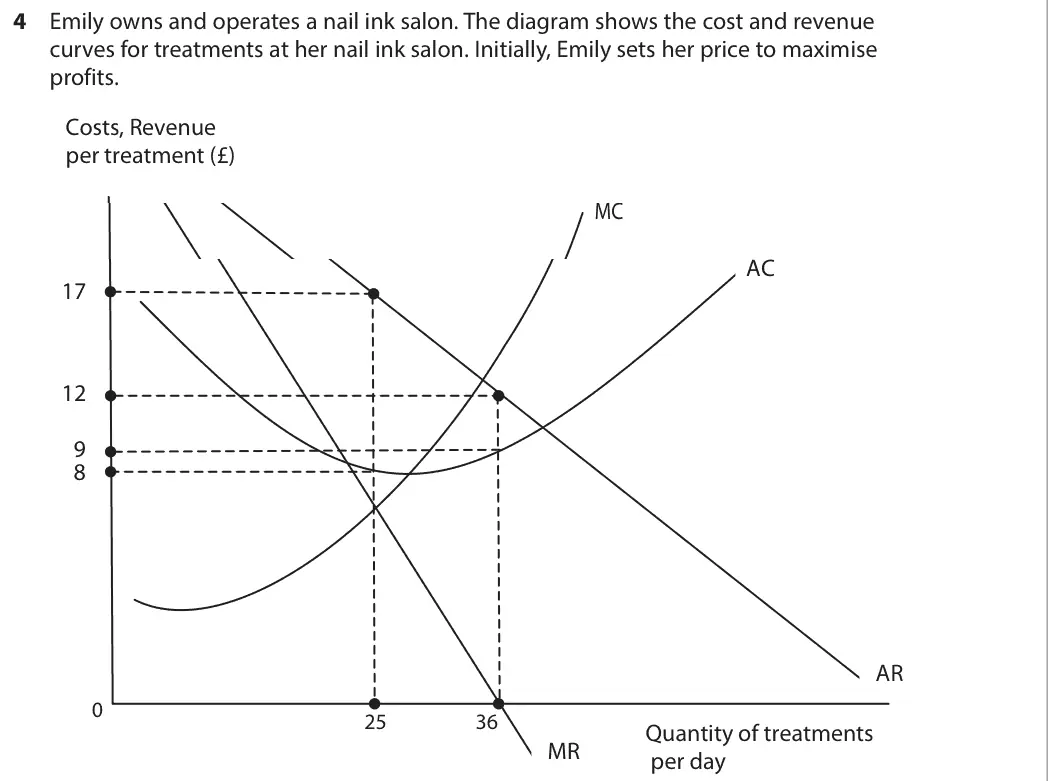
Data and extracts for question 11 The diagram below shows the cost and revenue curves for a pizza in a popular high street restaurant. The restaurant currently pursues an objective of revenue maximisation. Costs/ revenues MC AC 14 10 8 7 AR 0 98 130 Quantity of pizzas sold MR
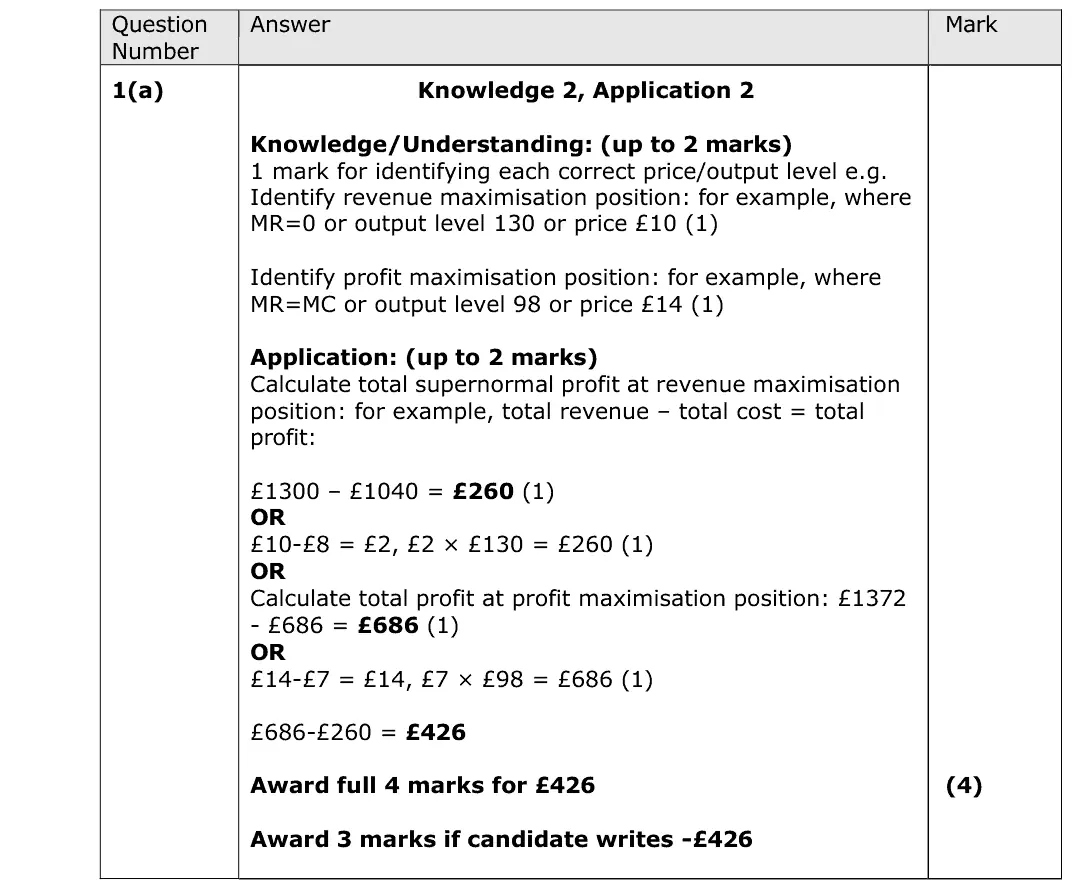
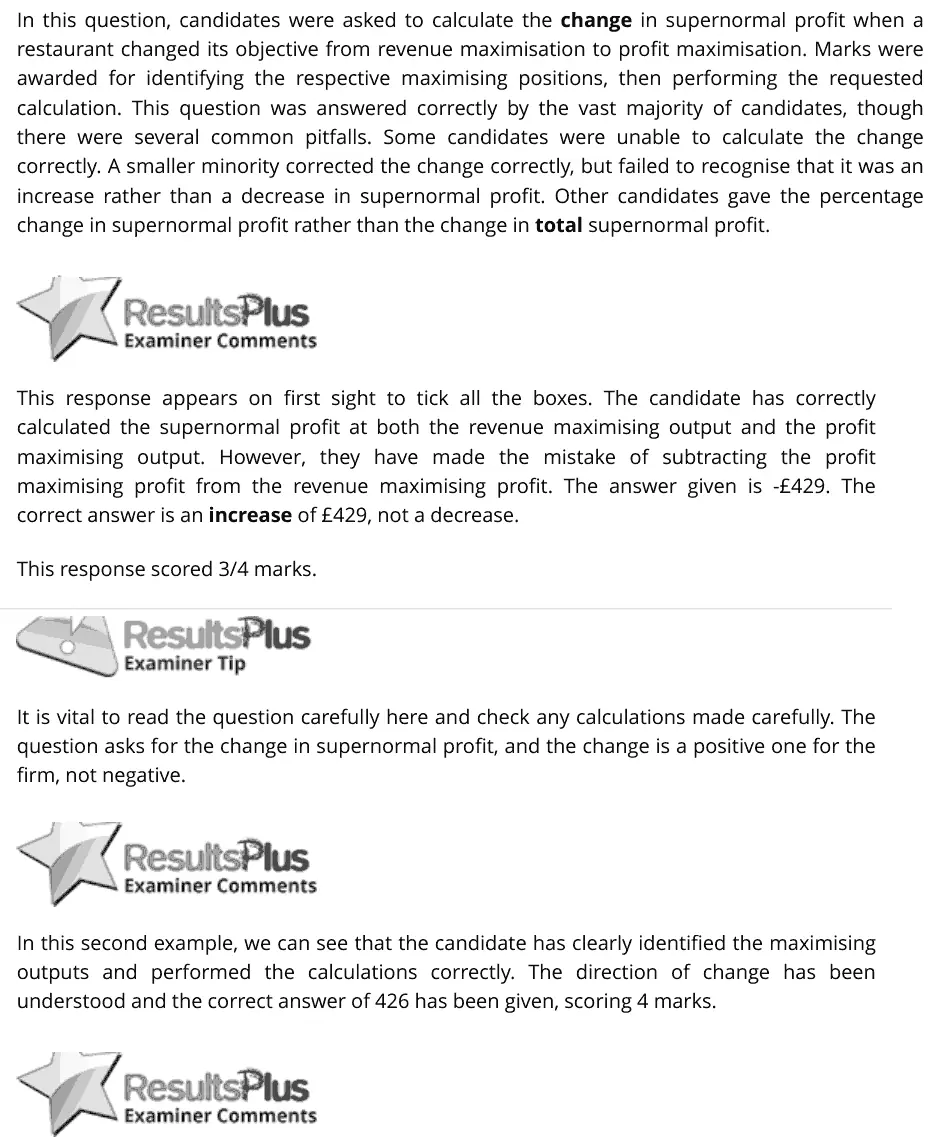
(a) Calculate the change in total supernormal profit if the restaurant changes its objective from revenue maximisation to profit maximisation. You are advised to show your working. (4)
June 2025 · Paper 1 · Q2(a) 4 marks AO1=2, AO2=1, AO3=1 Short answer elasticity of supply
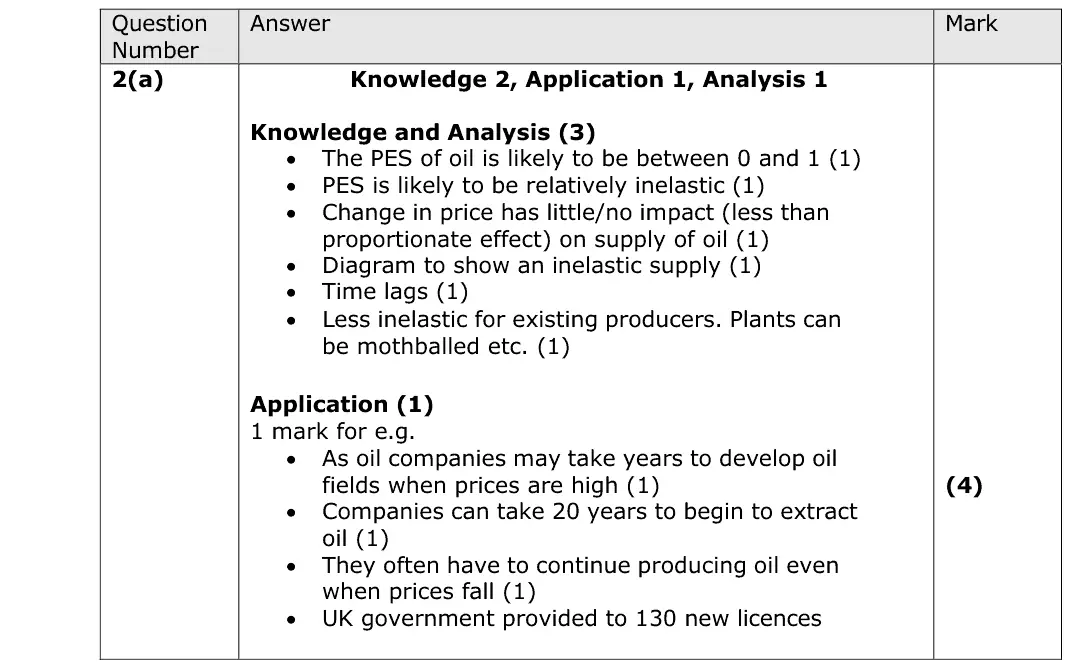
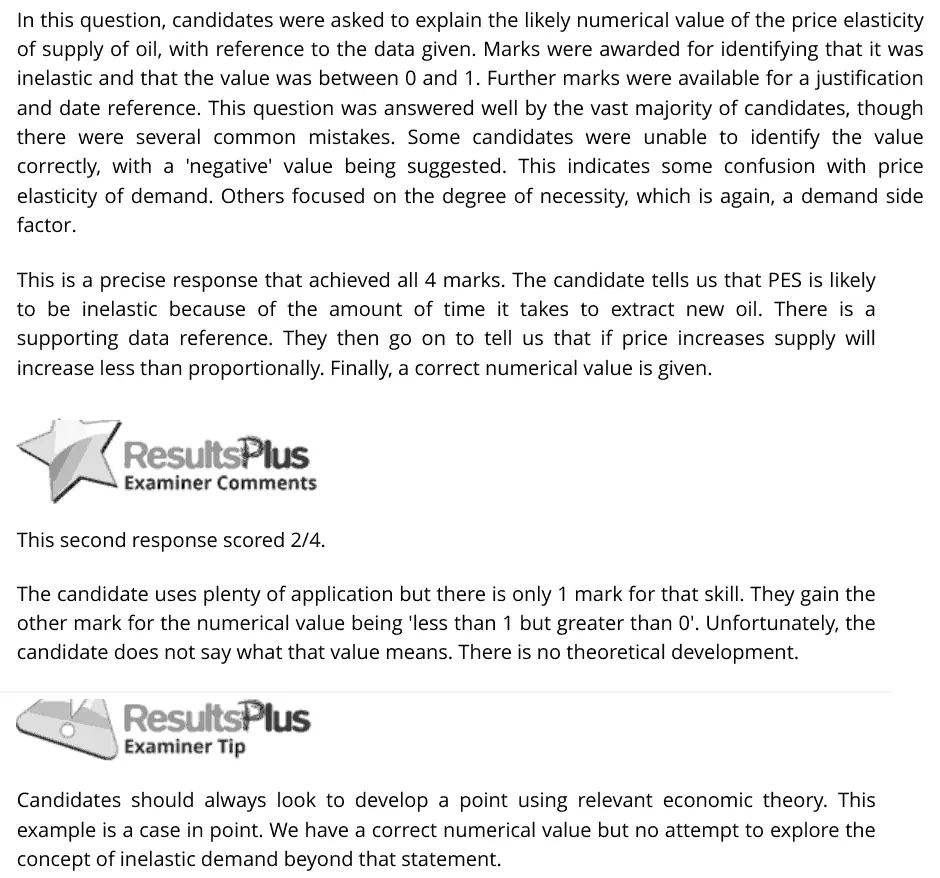
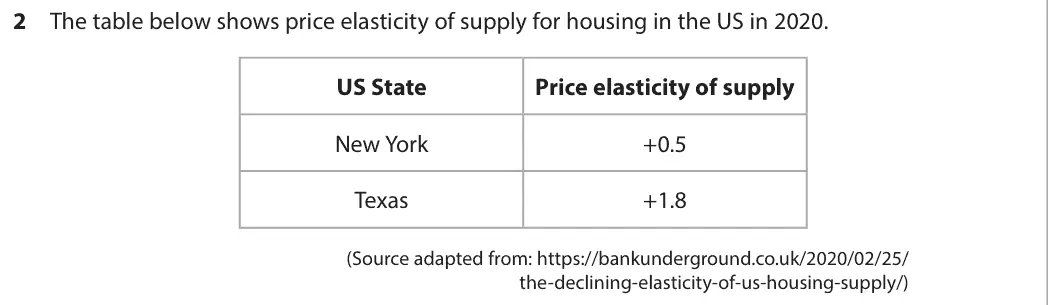
Data and extracts for question 22 In 2022 the UK government provided 130 new licences for North Sea oil and gas exploration, in order to reduce energy prices. However, companies can take 20 years to begin to extract oil. Furthermore, they often have to continue producing oil even when prices fall because the equipment has no other uses. (Source: adapted from https://www.theguardian.com/environment/2022/dec/12/ uk-ministers-face-legal-challenge-over-north-sea-oil-and-gas-licences)
(a) With reference to the data above, explain the likely numerical value of the price elasticity of supply for oil. (4)
June 2025 · Paper 1 · Q4(a) 4 marks AO1=3, AO2=1 Short answer public goods and information gaps
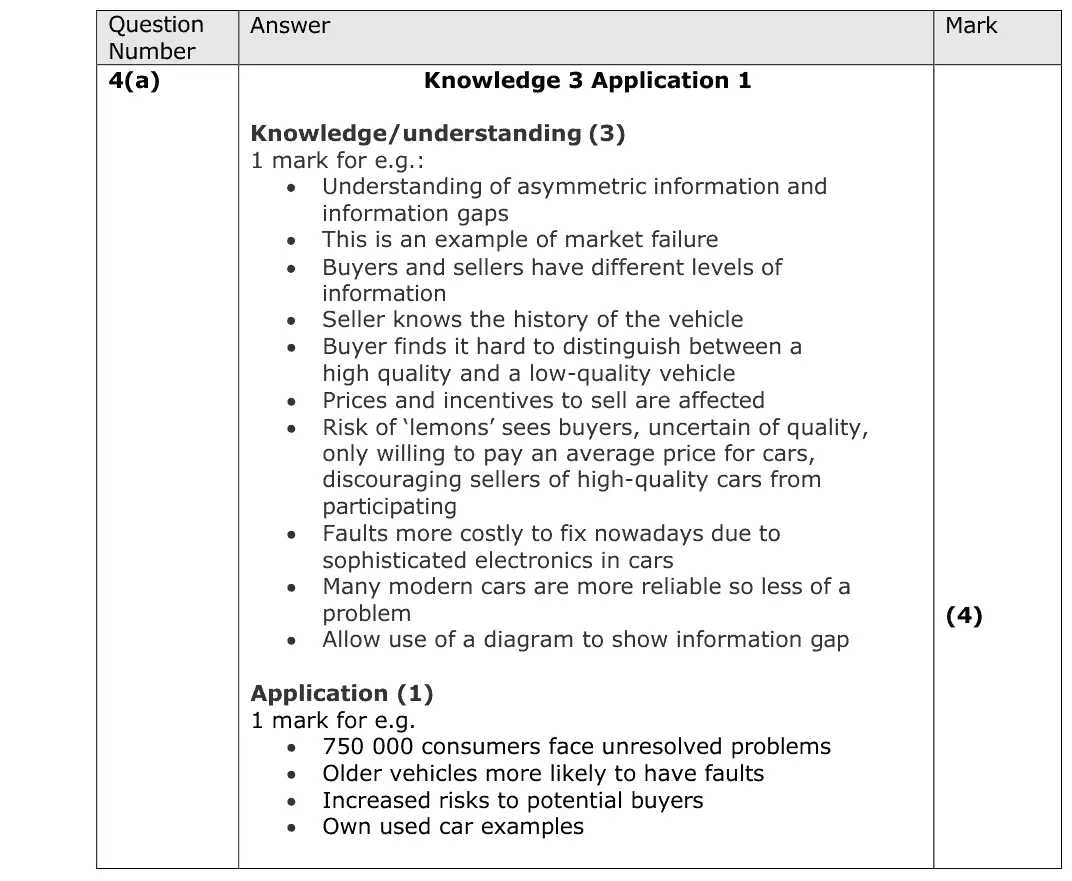
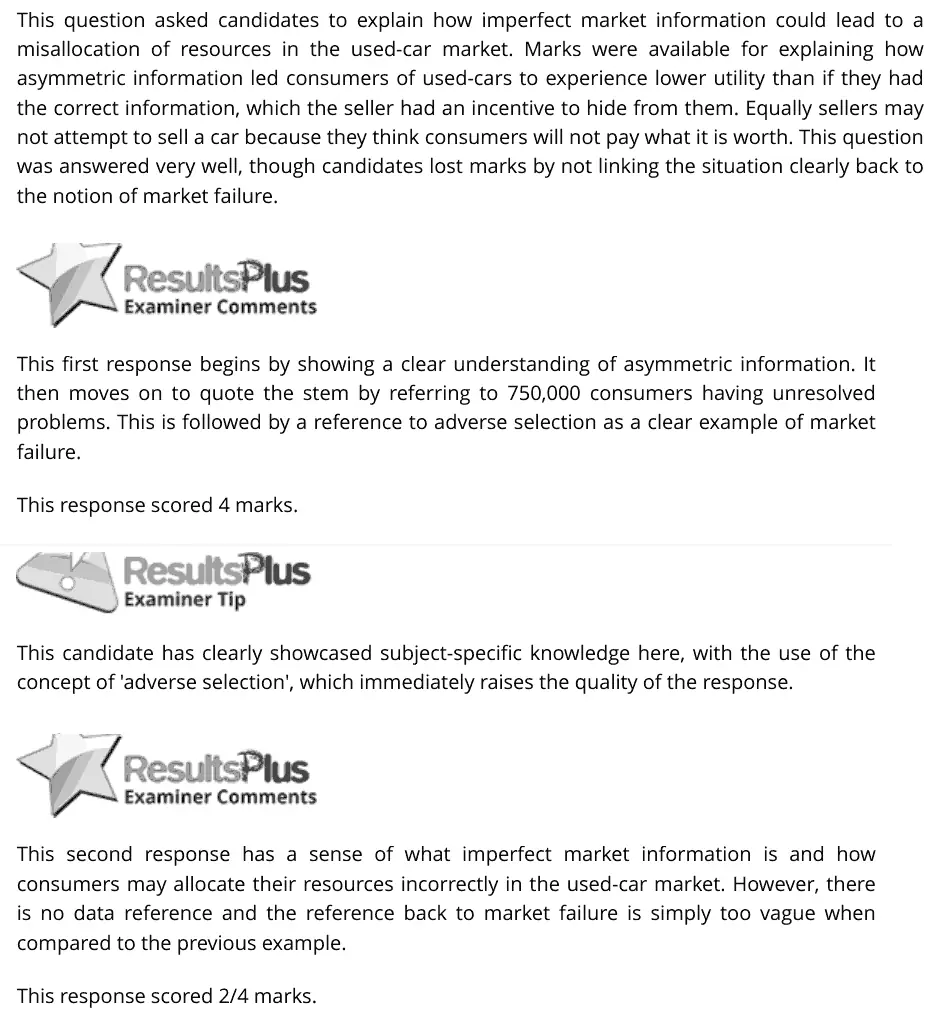
Data and extracts for question 44 Nearly 750 000 consumers in Britain face unresolved problems with used car purchases every year. Older vehicles tend to have more faults and increase the risks facing a potential buyer. (Source: adapted from https://www.gov.uk/government/news/new- approach-to-give-second-hand-car-buyers-a-better-deal)
(a) With reference to the data above, explain how imperfect market information may lead to a misallocation of resources in the used-car market. (4)
June 2025 · Paper 1 · Q6(a) 5 marks AO1=1, AO2=2, AO3=2 Short answer market structures and efficiency
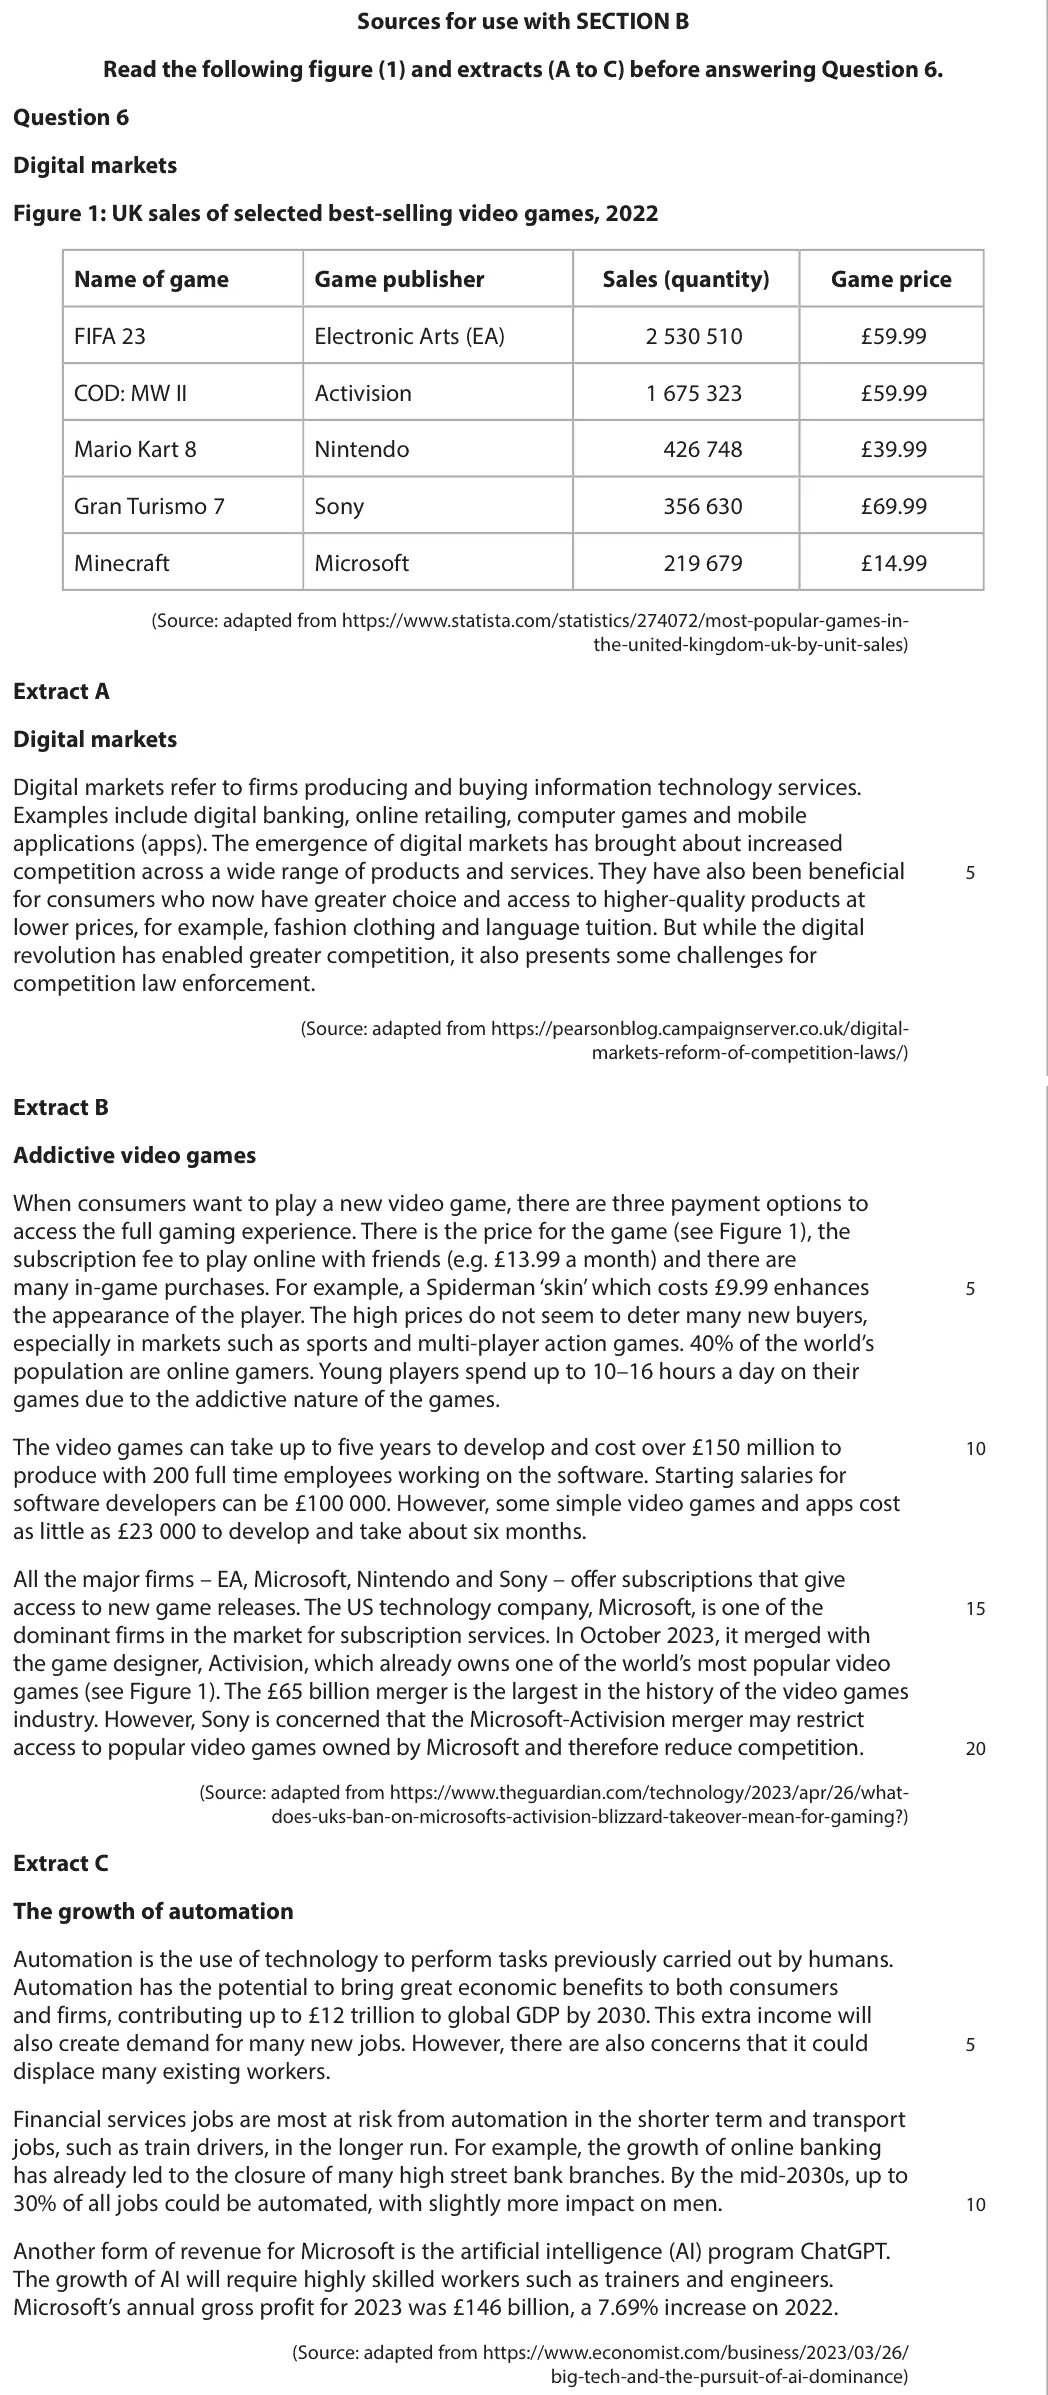
Data and extracts for question 6Sources for use with SECTION B Read the following figure (1) and extracts (A to C) before answering Question 6. Question 6 Digital markets Figure 1: UK sales of selected best-selling video games, 2022 Name of game Game publisher Sales (quantity) Game price FIFA 23 Electronic Arts (EA) 2 530 510 £59.99 COD: MW II Activision 1 675 323 £59.99 Mario Kart 8 Nintendo 426 748 £39.99 Gran Turismo 7 Sony 356 630 £69.99 Minecraft Microsoft 219 679 £14.99 (Source: adapted from https://www.statista.com/statistics/274072/most-popular-games-in- the-united-kingdom-uk-by-unit-sales) Extract A Digital markets Digital markets refer to firms producing and buying information technology services. Examples include digital banking, online retailing, computer games and mobile applications (apps). The emergence of digital markets has brought about increased competition across a wide range of products and services. They have also been beneficial 5 for consumers who now have greater choice and access to higher-quality products at lower prices, for example, fashion clothing and language tuition. But while the digital revolution has enabled greater competition, it also presents some challenges for competition law enforcement. (Source: adapted from https://pearsonblog.campaignserver.co.uk/digital- markets-reform-of-competition-laws/) Extract B Addictive video games When consumers want to play a new video game, there are three payment options to access the full gaming experience. There is the price for the game (see Figure 1), the subscription fee to play online with friends (e.g. £13.99 a month) and there are many in-game purchases. For example, a Spiderman ‘skin’ which costs £9.99 enhances 5 the appearance of the player. The high prices do not seem to deter many new buyers, especially in markets such as sports and multi-player action games. 40% of the world’s population are online gamers. Young players spend up to 10–16 hours a day on their games due to the addictive nature of the games. The video games can take up to five years to develop and cost over £150 million to 10 produce with 200 full time employees working on the software. Starting salaries for software developers can be £100 000. However, some simple video games and apps cost as little as £23 000 to develop and take about six months. All the major firms – EA, Microsoft, Nintendo and Sony – offer subscriptions that give access to new game releases. The US technology company, Microsoft, is one of the 15 dominant firms in the market for subscription services. In October 2023, it merged with the game designer, Activision, which already owns one of the world’s most popular video games (see Figure 1). The £65 billion merger is the largest in the history of the video games industry. However, Sony is concerned that the Microsoft-Activision merger may restrict access to popular video games owned by Microsoft and therefore reduce competition. 20 (Source: adapted from https://www.theguardian.com/technology/2023/apr/26/what- does-uks-ban-on-microsofts-activision-blizzard-takeover-mean-for-gaming?) Extract C The growth of automation Automation is the use of technology to perform tasks previously carried out by humans. Automation has the potential to bring great economic benefits to both consumers and firms, contributing up to £12 trillion to global GDP by 2030. This extra income will also create demand for many new jobs. However, there are also concerns that it could 5 displace many existing workers. Financial services jobs are most at risk from automation in the shorter term and transport jobs, such as train drivers, in the longer run. For example, the growth of online banking has already led to the closure of many high street bank branches. By the mid-2030s, up to 30% of all jobs could be automated, with slightly more impact on men. 10 Another form of revenue for Microsoft is the artificial intelligence (AI) program ChatGPT. The growth of AI will require highly skilled workers such as trainers and engineers. Microsoft’s annual gross profit for 2023 was £146 billion, a 7.69% increase on 2022. (Source: adapted from https://www.economist.com/business/2023/03/26/ big-tech-and-the-pursuit-of-ai-dominance)
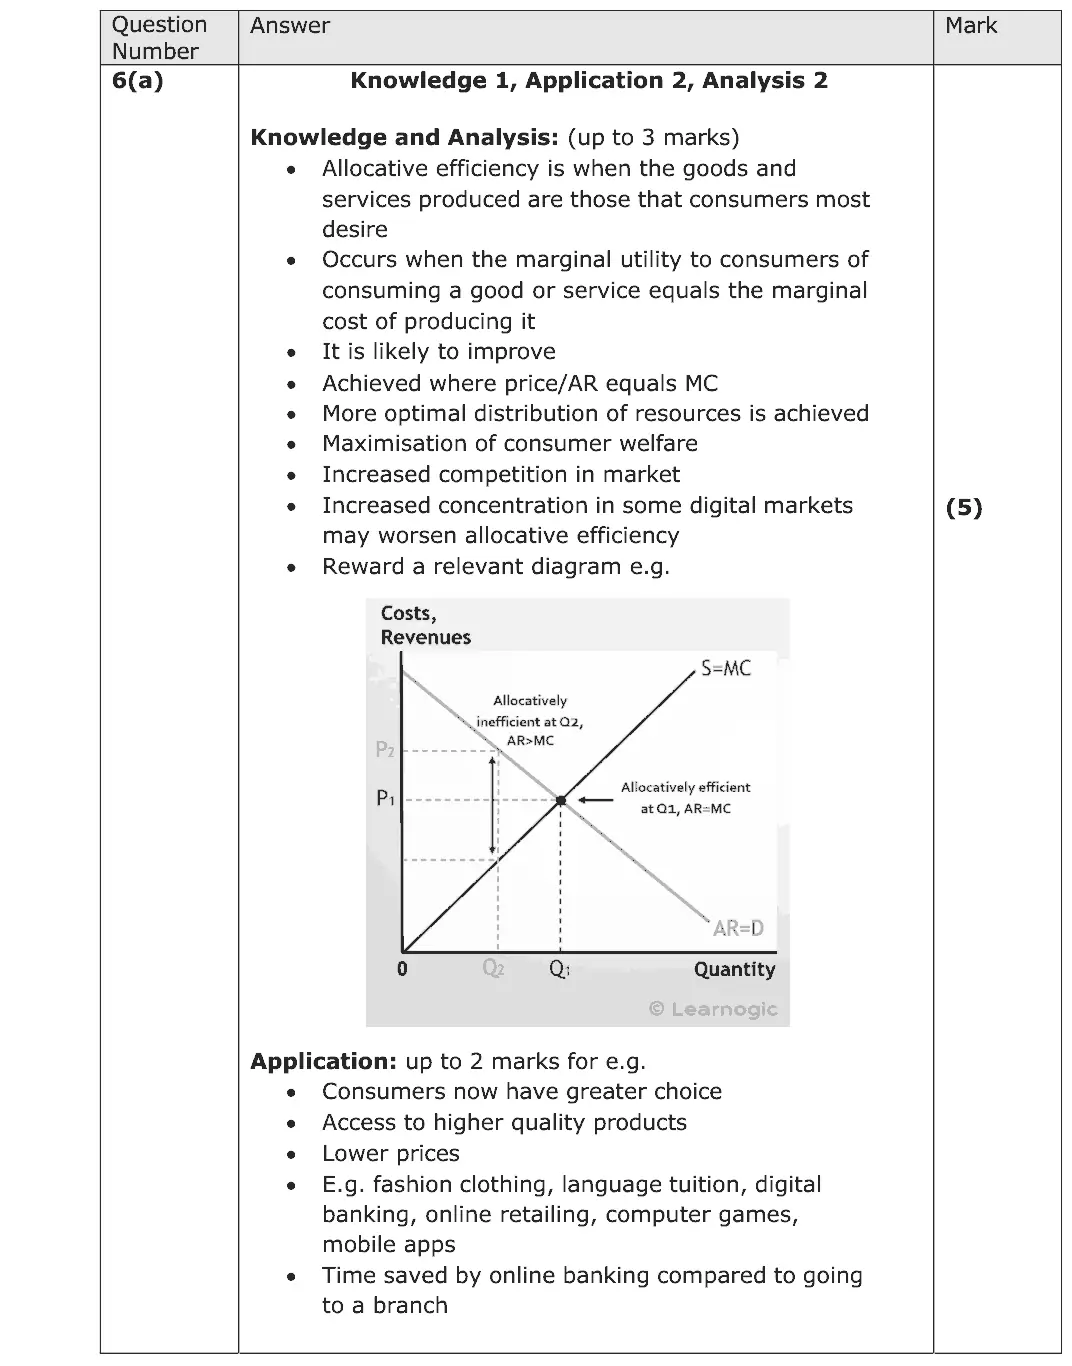
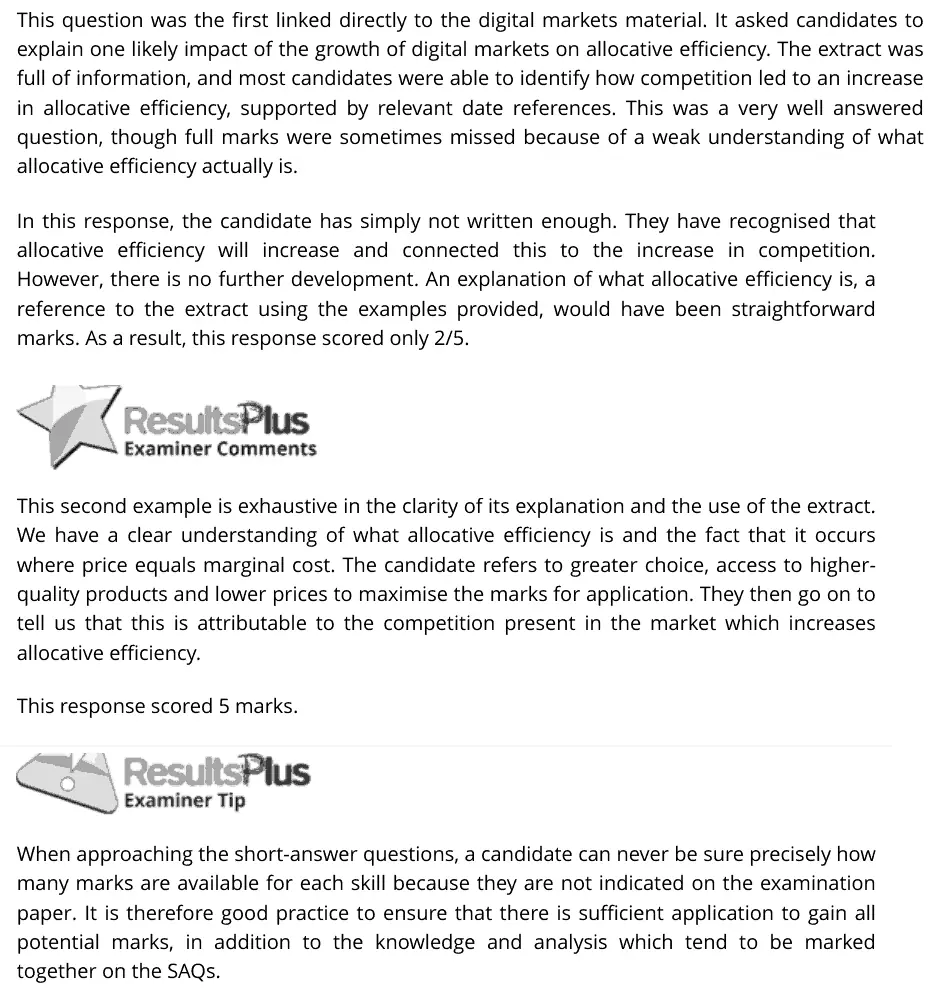
(a) With reference to Extract A, explain one likely impact of the growth of digital markets on allocative efficiency. (5)
June 2025 · Paper 1 · Q6(b) 8 marks AO1=2, AO2=2, AO3=2, AO4=2 8-mark response labour market
Data and extracts for question 6Sources for use with SECTION B Read the following figure (1) and extracts (A to C) before answering Question 6. Question 6 Digital markets Figure 1: UK sales of selected best-selling video games, 2022 Name of game Game publisher Sales (quantity) Game price FIFA 23 Electronic Arts (EA) 2 530 510 £59.99 COD: MW II Activision 1 675 323 £59.99 Mario Kart 8 Nintendo 426 748 £39.99 Gran Turismo 7 Sony 356 630 £69.99 Minecraft Microsoft 219 679 £14.99 (Source: adapted from https://www.statista.com/statistics/274072/most-popular-games-in- the-united-kingdom-uk-by-unit-sales) Extract A Digital markets Digital markets refer to firms producing and buying information technology services. Examples include digital banking, online retailing, computer games and mobile applications (apps). The emergence of digital markets has brought about increased competition across a wide range of products and services. They have also been beneficial 5 for consumers who now have greater choice and access to higher-quality products at lower prices, for example, fashion clothing and language tuition. But while the digital revolution has enabled greater competition, it also presents some challenges for competition law enforcement. (Source: adapted from https://pearsonblog.campaignserver.co.uk/digital- markets-reform-of-competition-laws/) Extract B Addictive video games When consumers want to play a new video game, there are three payment options to access the full gaming experience. There is the price for the game (see Figure 1), the subscription fee to play online with friends (e.g. £13.99 a month) and there are many in-game purchases. For example, a Spiderman ‘skin’ which costs £9.99 enhances 5 the appearance of the player. The high prices do not seem to deter many new buyers, especially in markets such as sports and multi-player action games. 40% of the world’s population are online gamers. Young players spend up to 10–16 hours a day on their games due to the addictive nature of the games. The video games can take up to five years to develop and cost over £150 million to 10 produce with 200 full time employees working on the software. Starting salaries for software developers can be £100 000. However, some simple video games and apps cost as little as £23 000 to develop and take about six months. All the major firms – EA, Microsoft, Nintendo and Sony – offer subscriptions that give access to new game releases. The US technology company, Microsoft, is one of the 15 dominant firms in the market for subscription services. In October 2023, it merged with the game designer, Activision, which already owns one of the world’s most popular video games (see Figure 1). The £65 billion merger is the largest in the history of the video games industry. However, Sony is concerned that the Microsoft-Activision merger may restrict access to popular video games owned by Microsoft and therefore reduce competition. 20 (Source: adapted from https://www.theguardian.com/technology/2023/apr/26/what- does-uks-ban-on-microsofts-activision-blizzard-takeover-mean-for-gaming?) Extract C The growth of automation Automation is the use of technology to perform tasks previously carried out by humans. Automation has the potential to bring great economic benefits to both consumers and firms, contributing up to £12 trillion to global GDP by 2030. This extra income will also create demand for many new jobs. However, there are also concerns that it could 5 displace many existing workers. Financial services jobs are most at risk from automation in the shorter term and transport jobs, such as train drivers, in the longer run. For example, the growth of online banking has already led to the closure of many high street bank branches. By the mid-2030s, up to 30% of all jobs could be automated, with slightly more impact on men. 10 Another form of revenue for Microsoft is the artificial intelligence (AI) program ChatGPT. The growth of AI will require highly skilled workers such as trainers and engineers. Microsoft’s annual gross profit for 2023 was £146 billion, a 7.69% increase on 2022. (Source: adapted from https://www.economist.com/business/2023/03/26/ big-tech-and-the-pursuit-of-ai-dominance)
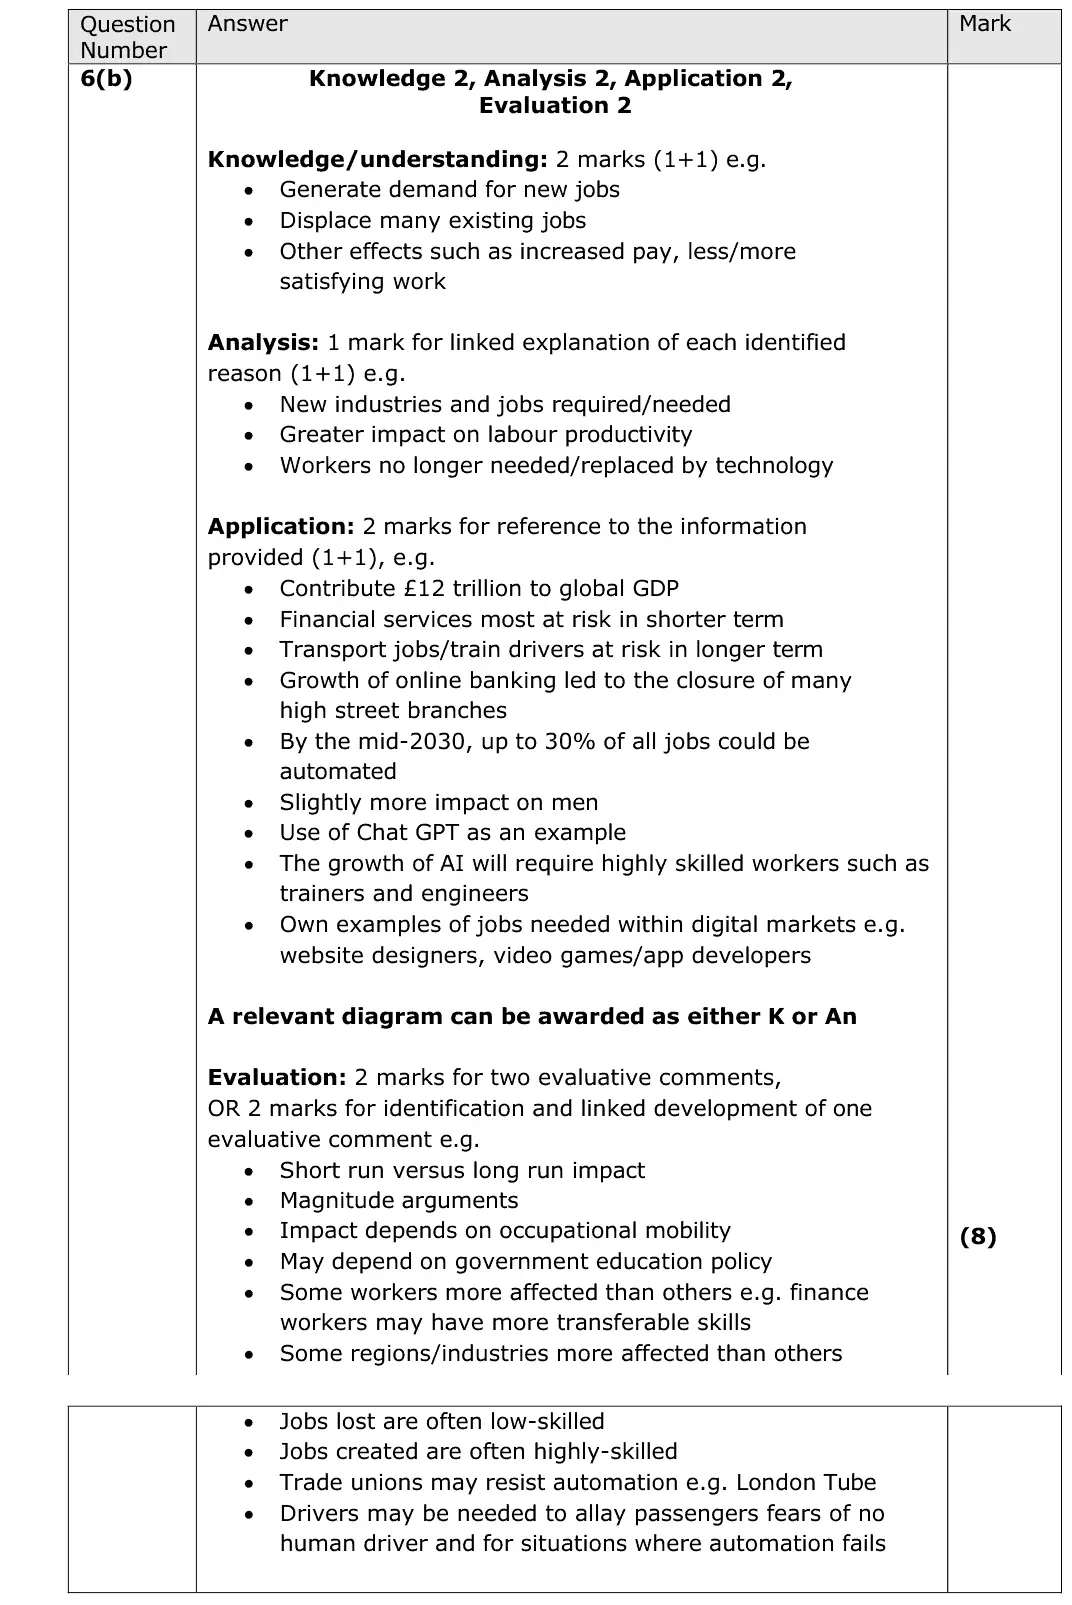
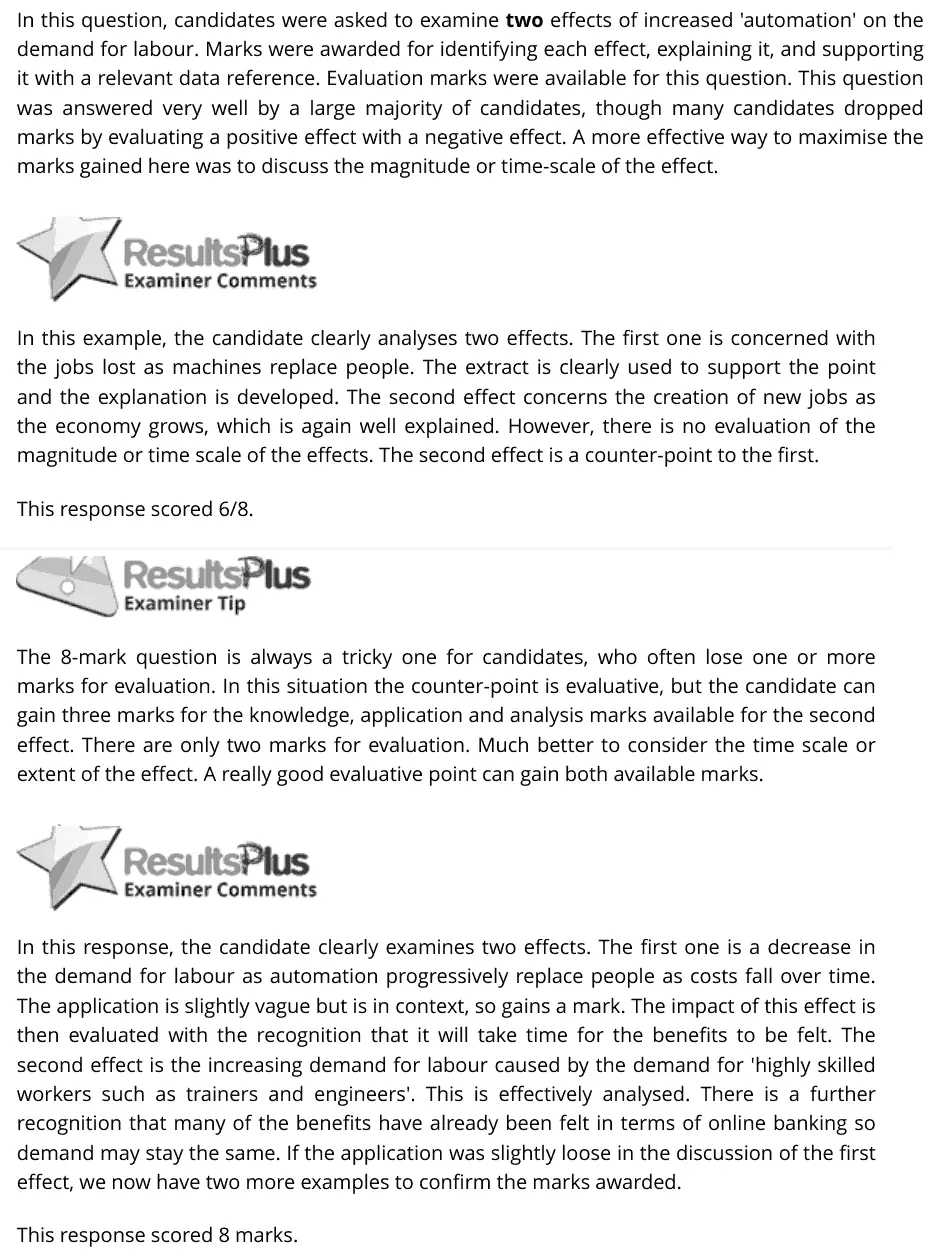
(b) With reference to Extract C, examine two effects of increased ‘automation’ on the demand for labour. (8)
June 2025 · Paper 1 · Q6(c) 12 marks AO1=2, AO2=2, AO3=4, AO4=4 12-mark response price elasticity of demand
Data and extracts for question 6Sources for use with SECTION B Read the following figure (1) and extracts (A to C) before answering Question 6. Question 6 Digital markets Figure 1: UK sales of selected best-selling video games, 2022 Name of game Game publisher Sales (quantity) Game price FIFA 23 Electronic Arts (EA) 2 530 510 £59.99 COD: MW II Activision 1 675 323 £59.99 Mario Kart 8 Nintendo 426 748 £39.99 Gran Turismo 7 Sony 356 630 £69.99 Minecraft Microsoft 219 679 £14.99 (Source: adapted from https://www.statista.com/statistics/274072/most-popular-games-in- the-united-kingdom-uk-by-unit-sales) Extract A Digital markets Digital markets refer to firms producing and buying information technology services. Examples include digital banking, online retailing, computer games and mobile applications (apps). The emergence of digital markets has brought about increased competition across a wide range of products and services. They have also been beneficial 5 for consumers who now have greater choice and access to higher-quality products at lower prices, for example, fashion clothing and language tuition. But while the digital revolution has enabled greater competition, it also presents some challenges for competition law enforcement. (Source: adapted from https://pearsonblog.campaignserver.co.uk/digital- markets-reform-of-competition-laws/) Extract B Addictive video games When consumers want to play a new video game, there are three payment options to access the full gaming experience. There is the price for the game (see Figure 1), the subscription fee to play online with friends (e.g. £13.99 a month) and there are many in-game purchases. For example, a Spiderman ‘skin’ which costs £9.99 enhances 5 the appearance of the player. The high prices do not seem to deter many new buyers, especially in markets such as sports and multi-player action games. 40% of the world’s population are online gamers. Young players spend up to 10–16 hours a day on their games due to the addictive nature of the games. The video games can take up to five years to develop and cost over £150 million to 10 produce with 200 full time employees working on the software. Starting salaries for software developers can be £100 000. However, some simple video games and apps cost as little as £23 000 to develop and take about six months. All the major firms – EA, Microsoft, Nintendo and Sony – offer subscriptions that give access to new game releases. The US technology company, Microsoft, is one of the 15 dominant firms in the market for subscription services. In October 2023, it merged with the game designer, Activision, which already owns one of the world’s most popular video games (see Figure 1). The £65 billion merger is the largest in the history of the video games industry. However, Sony is concerned that the Microsoft-Activision merger may restrict access to popular video games owned by Microsoft and therefore reduce competition. 20 (Source: adapted from https://www.theguardian.com/technology/2023/apr/26/what- does-uks-ban-on-microsofts-activision-blizzard-takeover-mean-for-gaming?) Extract C The growth of automation Automation is the use of technology to perform tasks previously carried out by humans. Automation has the potential to bring great economic benefits to both consumers and firms, contributing up to £12 trillion to global GDP by 2030. This extra income will also create demand for many new jobs. However, there are also concerns that it could 5 displace many existing workers. Financial services jobs are most at risk from automation in the shorter term and transport jobs, such as train drivers, in the longer run. For example, the growth of online banking has already led to the closure of many high street bank branches. By the mid-2030s, up to 30% of all jobs could be automated, with slightly more impact on men. 10 Another form of revenue for Microsoft is the artificial intelligence (AI) program ChatGPT. The growth of AI will require highly skilled workers such as trainers and engineers. Microsoft’s annual gross profit for 2023 was £146 billion, a 7.69% increase on 2022. (Source: adapted from https://www.economist.com/business/2023/03/26/ big-tech-and-the-pursuit-of-ai-dominance)
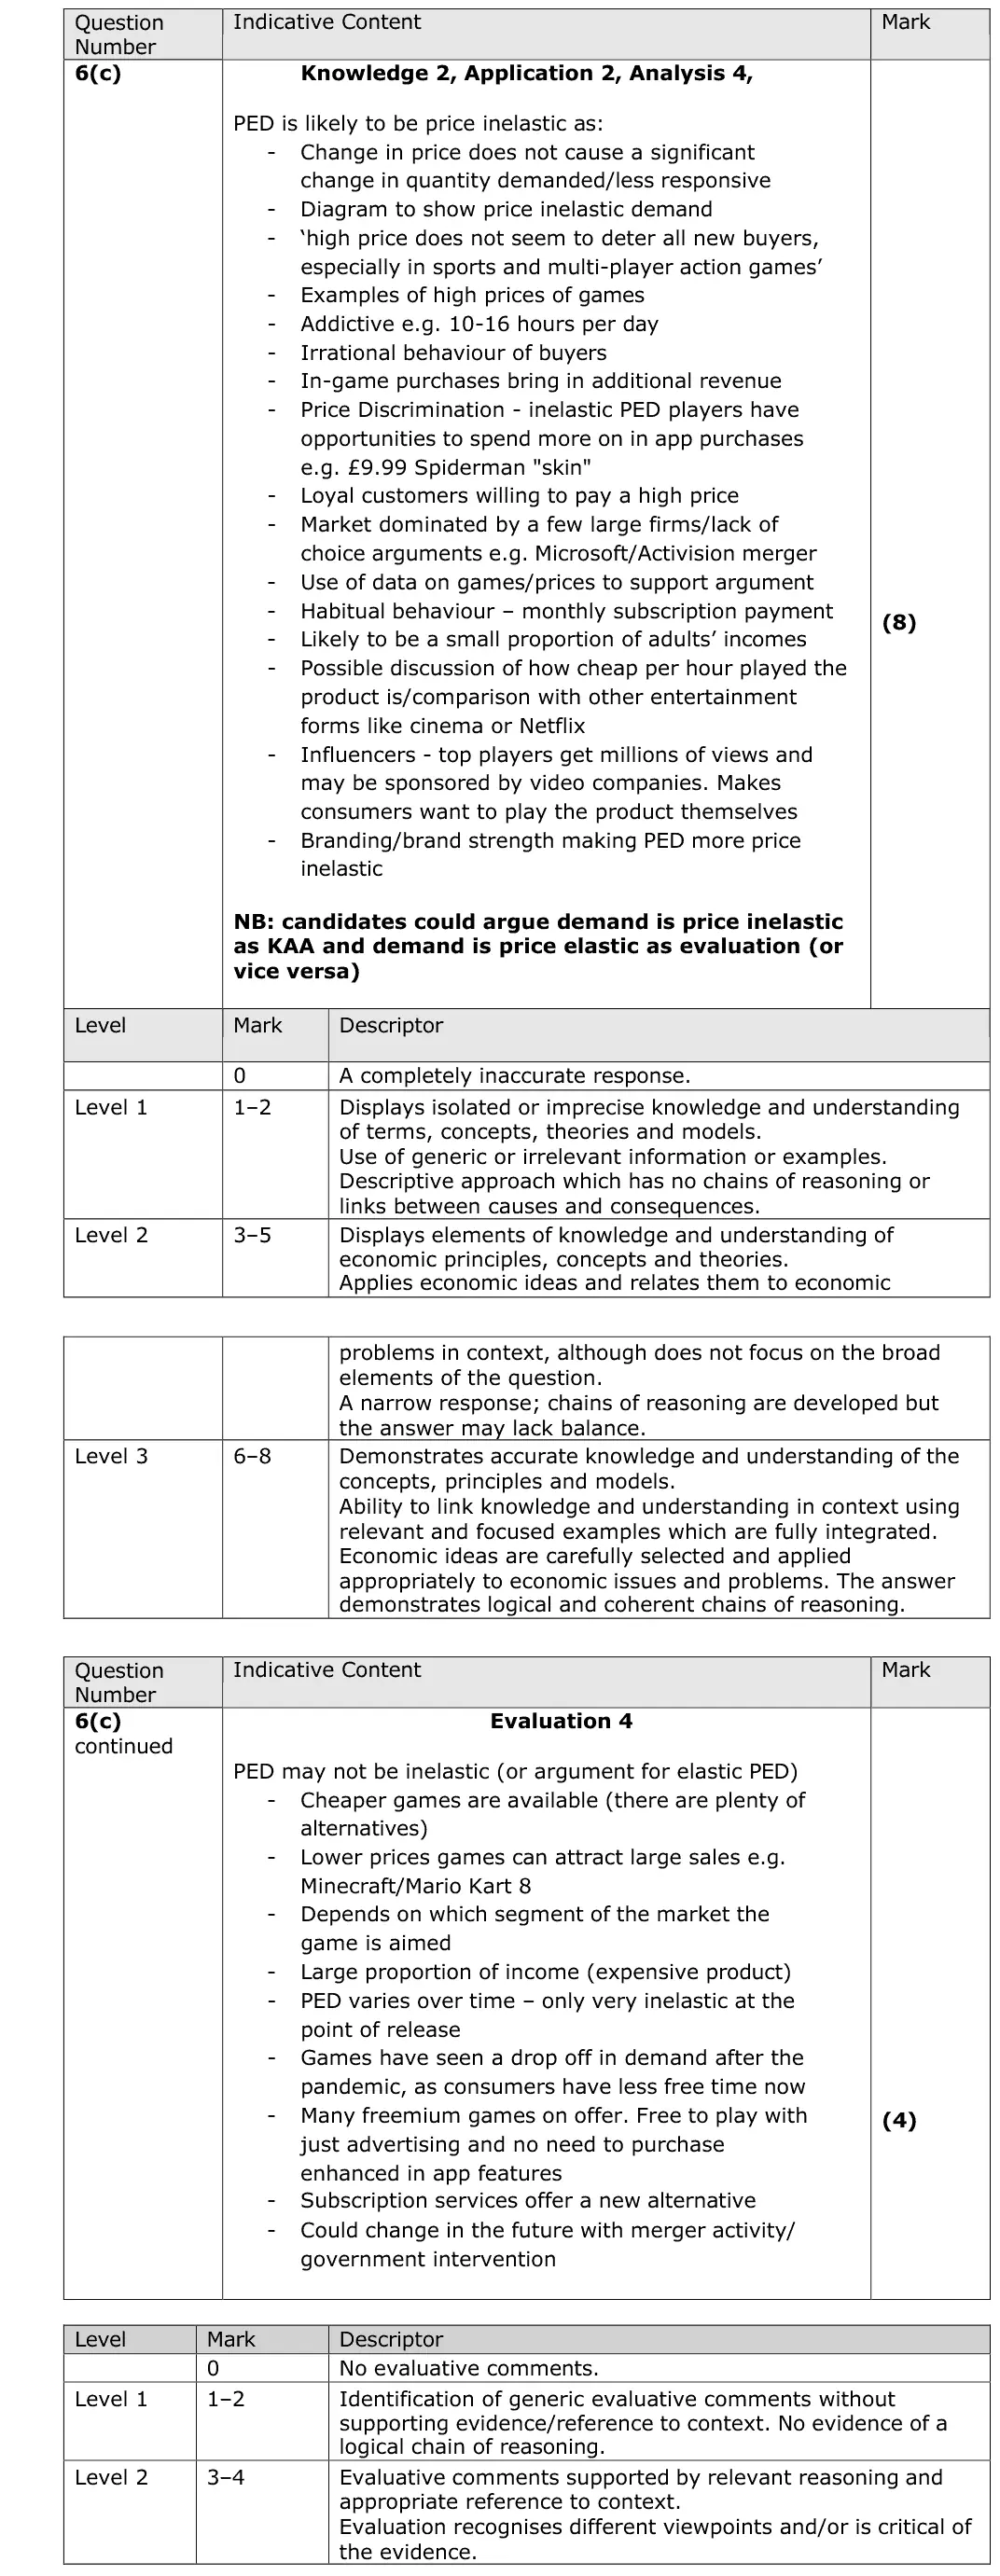
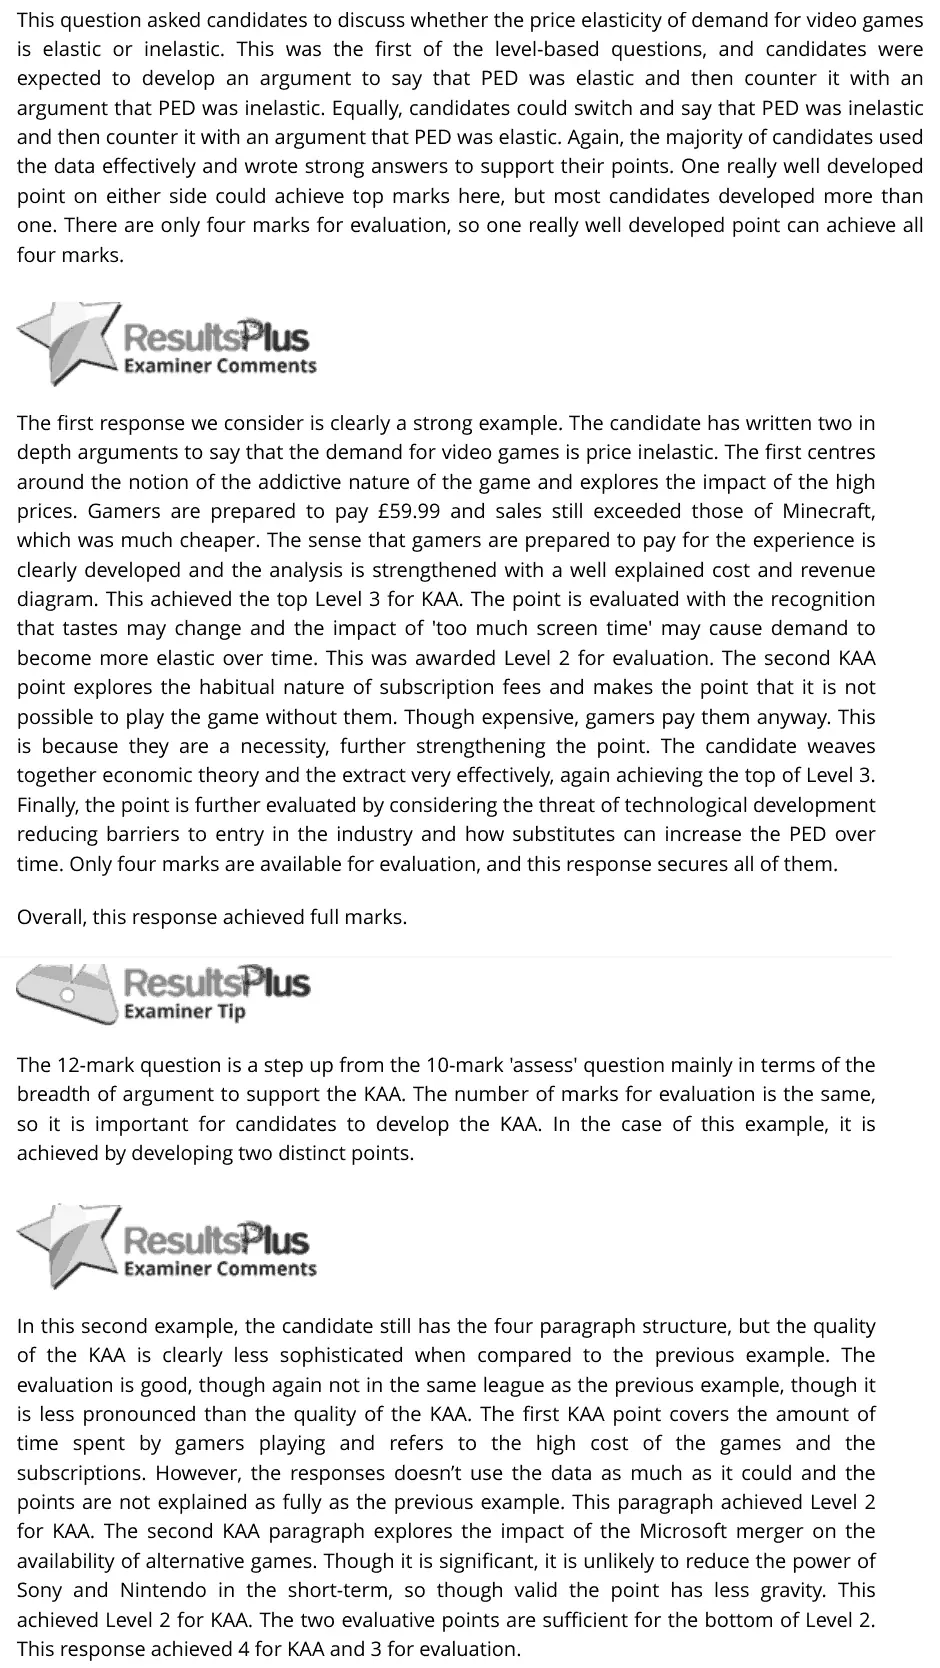
(c) With reference to the information provided, discuss whether the price elasticity of demand for video games is elastic or inelastic. (12)
June 2025 · Paper 1 · Q6(d) 10 marks AO1=2, AO2=2, AO3=2, AO4=4 10-mark response monopsony and contestability
Data and extracts for question 6Sources for use with SECTION B Read the following figure (1) and extracts (A to C) before answering Question 6. Question 6 Digital markets Figure 1: UK sales of selected best-selling video games, 2022 Name of game Game publisher Sales (quantity) Game price FIFA 23 Electronic Arts (EA) 2 530 510 £59.99 COD: MW II Activision 1 675 323 £59.99 Mario Kart 8 Nintendo 426 748 £39.99 Gran Turismo 7 Sony 356 630 £69.99 Minecraft Microsoft 219 679 £14.99 (Source: adapted from https://www.statista.com/statistics/274072/most-popular-games-in- the-united-kingdom-uk-by-unit-sales) Extract A Digital markets Digital markets refer to firms producing and buying information technology services. Examples include digital banking, online retailing, computer games and mobile applications (apps). The emergence of digital markets has brought about increased competition across a wide range of products and services. They have also been beneficial 5 for consumers who now have greater choice and access to higher-quality products at lower prices, for example, fashion clothing and language tuition. But while the digital revolution has enabled greater competition, it also presents some challenges for competition law enforcement. (Source: adapted from https://pearsonblog.campaignserver.co.uk/digital- markets-reform-of-competition-laws/) Extract B Addictive video games When consumers want to play a new video game, there are three payment options to access the full gaming experience. There is the price for the game (see Figure 1), the subscription fee to play online with friends (e.g. £13.99 a month) and there are many in-game purchases. For example, a Spiderman ‘skin’ which costs £9.99 enhances 5 the appearance of the player. The high prices do not seem to deter many new buyers, especially in markets such as sports and multi-player action games. 40% of the world’s population are online gamers. Young players spend up to 10–16 hours a day on their games due to the addictive nature of the games. The video games can take up to five years to develop and cost over £150 million to 10 produce with 200 full time employees working on the software. Starting salaries for software developers can be £100 000. However, some simple video games and apps cost as little as £23 000 to develop and take about six months. All the major firms – EA, Microsoft, Nintendo and Sony – offer subscriptions that give access to new game releases. The US technology company, Microsoft, is one of the 15 dominant firms in the market for subscription services. In October 2023, it merged with the game designer, Activision, which already owns one of the world’s most popular video games (see Figure 1). The £65 billion merger is the largest in the history of the video games industry. However, Sony is concerned that the Microsoft-Activision merger may restrict access to popular video games owned by Microsoft and therefore reduce competition. 20 (Source: adapted from https://www.theguardian.com/technology/2023/apr/26/what- does-uks-ban-on-microsofts-activision-blizzard-takeover-mean-for-gaming?) Extract C The growth of automation Automation is the use of technology to perform tasks previously carried out by humans. Automation has the potential to bring great economic benefits to both consumers and firms, contributing up to £12 trillion to global GDP by 2030. This extra income will also create demand for many new jobs. However, there are also concerns that it could 5 displace many existing workers. Financial services jobs are most at risk from automation in the shorter term and transport jobs, such as train drivers, in the longer run. For example, the growth of online banking has already led to the closure of many high street bank branches. By the mid-2030s, up to 30% of all jobs could be automated, with slightly more impact on men. 10 Another form of revenue for Microsoft is the artificial intelligence (AI) program ChatGPT. The growth of AI will require highly skilled workers such as trainers and engineers. Microsoft’s annual gross profit for 2023 was £146 billion, a 7.69% increase on 2022. (Source: adapted from https://www.economist.com/business/2023/03/26/ big-tech-and-the-pursuit-of-ai-dominance)
(d) With reference to the information provided, assess whether the market for video game development is contestable. (10)
June 2025 · Paper 1 · Q6(e) 15 marks AO1=3, AO2=3, AO3=3, AO4=6 15-mark response business growth and objectives
Data and extracts for question 6Sources for use with SECTION B Read the following figure (1) and extracts (A to C) before answering Question 6. Question 6 Digital markets Figure 1: UK sales of selected best-selling video games, 2022 Name of game Game publisher Sales (quantity) Game price FIFA 23 Electronic Arts (EA) 2 530 510 £59.99 COD: MW II Activision 1 675 323 £59.99 Mario Kart 8 Nintendo 426 748 £39.99 Gran Turismo 7 Sony 356 630 £69.99 Minecraft Microsoft 219 679 £14.99 (Source: adapted from https://www.statista.com/statistics/274072/most-popular-games-in- the-united-kingdom-uk-by-unit-sales) Extract A Digital markets Digital markets refer to firms producing and buying information technology services. Examples include digital banking, online retailing, computer games and mobile applications (apps). The emergence of digital markets has brought about increased competition across a wide range of products and services. They have also been beneficial 5 for consumers who now have greater choice and access to higher-quality products at lower prices, for example, fashion clothing and language tuition. But while the digital revolution has enabled greater competition, it also presents some challenges for competition law enforcement. (Source: adapted from https://pearsonblog.campaignserver.co.uk/digital- markets-reform-of-competition-laws/) Extract B Addictive video games When consumers want to play a new video game, there are three payment options to access the full gaming experience. There is the price for the game (see Figure 1), the subscription fee to play online with friends (e.g. £13.99 a month) and there are many in-game purchases. For example, a Spiderman ‘skin’ which costs £9.99 enhances 5 the appearance of the player. The high prices do not seem to deter many new buyers, especially in markets such as sports and multi-player action games. 40% of the world’s population are online gamers. Young players spend up to 10–16 hours a day on their games due to the addictive nature of the games. The video games can take up to five years to develop and cost over £150 million to 10 produce with 200 full time employees working on the software. Starting salaries for software developers can be £100 000. However, some simple video games and apps cost as little as £23 000 to develop and take about six months. All the major firms – EA, Microsoft, Nintendo and Sony – offer subscriptions that give access to new game releases. The US technology company, Microsoft, is one of the 15 dominant firms in the market for subscription services. In October 2023, it merged with the game designer, Activision, which already owns one of the world’s most popular video games (see Figure 1). The £65 billion merger is the largest in the history of the video games industry. However, Sony is concerned that the Microsoft-Activision merger may restrict access to popular video games owned by Microsoft and therefore reduce competition. 20 (Source: adapted from https://www.theguardian.com/technology/2023/apr/26/what- does-uks-ban-on-microsofts-activision-blizzard-takeover-mean-for-gaming?) Extract C The growth of automation Automation is the use of technology to perform tasks previously carried out by humans. Automation has the potential to bring great economic benefits to both consumers and firms, contributing up to £12 trillion to global GDP by 2030. This extra income will also create demand for many new jobs. However, there are also concerns that it could 5 displace many existing workers. Financial services jobs are most at risk from automation in the shorter term and transport jobs, such as train drivers, in the longer run. For example, the growth of online banking has already led to the closure of many high street bank branches. By the mid-2030s, up to 30% of all jobs could be automated, with slightly more impact on men. 10 Another form of revenue for Microsoft is the artificial intelligence (AI) program ChatGPT. The growth of AI will require highly skilled workers such as trainers and engineers. Microsoft’s annual gross profit for 2023 was £146 billion, a 7.69% increase on 2022. (Source: adapted from https://www.economist.com/business/2023/03/26/ big-tech-and-the-pursuit-of-ai-dominance)
(e) Discuss the likely benefits of mergers for firms such as Microsoft. (15)
June 2025 · Paper 1 · Q7 25 marks AO1=4, AO2=4, AO3=8, AO4=9 25-mark essay Either/or externalitieslabour market
7 High Speed 2 (HS2) was a £100 billion UK government rail project designed to expand the existing network. The journey time between London and Manchester would take just 1 hour and 11 minutes, 54 minutes quicker than today’s fastest time. Almost 900 homes, 1 000 businesses and around 60 ancient woodlands would be destroyed by its construction. (Source: adapted from https://www.independent.co.uk/climate-change/news/ hs2-railway-route-houses-demolish-woodland-destroy-environment- impact-london-birmingham-manchester-a8582316.html) Evaluate the likely microeconomic effects of building major infrastructure projects.
June 2025 · Paper 1 · Q8 25 marks AO1=4, AO2=4, AO3=8, AO4=9 25-mark essay Either/or externalitieslabour market
8 In 2023, the UK prime minister Rishi Sunak said that he wanted to see all students in England study some form of mathematics until they reach the age of 18 to ‘ensure that they leave school better equipped for the jobs of the future’. This would require additional spending on education. Just half of all 16 to 19 year-olds study mathematics. Yet in a world where data is everywhere and statistics are vital in every job, the workforce will require more analytical skills than ever before. (Source: adapted from https://educationhub.blog.gov.uk/2023/01/04/ studying-maths-to-18-what-you-need-to-know/) Evaluate the likely microeconomic effects of increased spending on education.
June 2025 · Paper 2 · Q1(b) 4 marks AO1=2, AO2=1, AO3=1 Short answer measuring economic growth
Data and extracts for question 11 Selected economic data on Morocco and Pakistan, 2021, constant values. Gross national income Gross domestic product Human development (GNI) per capita (GDP) per capita index (HDI) (2017 PPP US$) (US$) Morocco 0.683 7 303 3 290.6 Pakistan 0.544 4 624 1 473.9 (Source adapted from: https://hdr.undp.org)
(b) With reference to the data provided, explain one limitation of using GDP to compare living standards between countries. (4)
June 2025 · Paper 2 · Q2(b) 4 marks AO1=2, AO2=1, AO3=1 Short answer balance of payments
Data and extracts for question 22 UK current account of the balance of payments, percentage of GDP, 2012–2022. 0 % of GDP –1.5 –2.0 –2.5 –3.0 –3.5 –4.0 –4.5 –5.0 –5.5 –6.0 2012 2013 2014 2015 2016 2017 2018 2019 2020 2021 2022 (Source adapted from: https://data.worldbank.org/indicator/BN.CAB.XOKA.GD.ZS?end=2022 &locations=GB&start=2012)
(b) With reference to the chart on the previous page, explain one likely reason for the change in the UK current account deficit from 2016 to 2021. (4)
June 2025 · Paper 2 · Q4(c) 2 marks AO1=1, AO3=1 Short answer Hard globalisation and tradebalance of payments
Data and extracts for question 44 China terms of trade index (base year 2000 = 100), 2010–2020. 94 Index 92 90 88 86 84 82 80 78 0 2010 2011 2012 2013 2014 2015 2016 2017 2018 2019 2020 (Source adapted from: https://data.worldbank.org/indicator/TT.PRI.MRCH.XD.WD?end=2020 &locations=CN&start=2000)
(c) Explain the likely impact of the change in China’s terms of trade from 2012 to 2020 on China’s current account. Assume that demand for China’s exports and imports is price elastic. (2)
June 2025 · Paper 2 · Q5(a) 2 marks AO2=2 Calculation unemployment
Data and extracts for question 55 The UK’s labour force inactivity rate was 20.2% in January 2020 and increased to 21.5% in January 2022. After an increase in the early stages of the global health crisis, most developed countries have recorded a decrease in the inactivity rate back to, and below, levels in 2019. This is not the case in the UK. (Source adapted from: https://www.theguardian.com/business/2023/apr/13/ uk‑worst‑performer‑g7‑workforce‑participation‑since‑covid; tradingeconomics.com)
(a) The total UK labour force in January 2022 was 34.5 million. With reference to the information above, calculate the total number of inactive people in the UK labour force in January 2022. (2)
June 2025 · Paper 2 · Q6(a) 5 marks AO1=2, AO2=2, AO3=1 Short answer fiscal and monetary policypublic finances and taxation
Data and extracts for question 6Sources for use with SECTION B Read the following figures (1–2) and extracts (A and B) before answering Question 6. Question 6 The German economy Figure 1: German government tax revenue, % of total revenue, 2022 2%2% 4% Income taxes 6% Value added tax Petrol duty 9% Corporation tax 41% Tobacco duty Motor vehicle tax Other 36% (Source adapted from: https://www.bundesfinanzministerium.de) Figure 2: German government budget, % of GDP, 2014–2022 1.9 2 1.5 1.2 1.3 % of 1 0.6 GDP 0 –2 –2.6 –4 –3.7 –4.3 –6 2014 2016 2018 2020 2022 (Source adapted from: https://tradingeconomics.com/germany/government‑budget) Extract A The opportunities and challenges facing the German economy The German economy entered a recession in 2023, and business confidence in the country fell at the fastest pace since 2021. German growth was the lowest among major economies in 2023. The future, however, is a greater concern owing to external factors such as global conflicts and restrictions on free trade. 5 The German government has been trying to improve its economic performance, with an aim to have renewables account for 80% of its energy supply. However, this would be a major shift for Germany where fossil fuels such as coal and gas still provide 75% of the energy needs and exposes it to volatile global energy prices. The rapid building of liquid natural gas terminals has helped to secure energy supplies in the short term. 10 The German government needs to remove a number of problems that have long held back its economy. Infrastructure projects in renewable energy production, such as wind farms, have been delayed by lengthy planning procedures. Business leaders complain of excessive bureaucracy and lack of technological advances. Labour shortages are another issue. Germany is expected to be short of up to 7 million workers by 2035, partly due to 15 an ageing population. There is a lack of skilled workers in the building trade, electrical engineering and professional services, which are important for the country’s economic ambitions. The German government needs to introduce effective policies such as planning reforms to speed up construction projects or reforms to increase the flexibility of the labour market. 20 The German economy has long been one of the biggest exporters in the world. It has trade surpluses with all its major trading partners except China and in 2021 its current account surplus was 7.7% of GDP. However, this has caused tensions with the governments of other countries, in particular the USA, which sees Germany’s surplus as partly a cause of the USA’s huge current account deficit. Having said that, a weakening 25 euro caused by higher interest rates in the USA compared to the Eurozone is beginning to have an effect in reducing Germany’s current account surplus – which dropped to 4.2% in 2022. (Source adapted from: https://www.ft.com/, https://www.cnb.cz/en/monetary‑policy/inflation‑reports/boxes-and-annexes-contained-in- inflation-reports/The-German-economy-and-the-dollar-euro-exchange-rate, and https://tradingeconomics.com/germany/current-account-to-gdp) Extract B US technology firm Intel invests in German semiconductor factories Intel is to double its investment in semiconductor factories in eastern Germany to €30 billion. This is the largest foreign direct investment in Germany’s history. Intel acquired the land for the factories in November 2022 and the first factory is expected to start production within four to five years. The site is expected to create 7 000 construction 5 jobs during the building phase, about 3 000 permanent high‑tech jobs and tens of thousands of additional jobs across the semiconductor industry. (Source adapted from: https://www.ft.com)
(a) With reference to Figure 1, explain the distinction between direct and indirect taxation. (5)
June 2025 · Paper 2 · Q6(b) 8 marks AO1=2, AO2=2, AO3=2, AO4=2 8-mark response aggregate supply
Data and extracts for question 6Sources for use with SECTION B Read the following figures (1–2) and extracts (A and B) before answering Question 6. Question 6 The German economy Figure 1: German government tax revenue, % of total revenue, 2022 2%2% 4% Income taxes 6% Value added tax Petrol duty 9% Corporation tax 41% Tobacco duty Motor vehicle tax Other 36% (Source adapted from: https://www.bundesfinanzministerium.de) Figure 2: German government budget, % of GDP, 2014–2022 1.9 2 1.5 1.2 1.3 % of 1 0.6 GDP 0 –2 –2.6 –4 –3.7 –4.3 –6 2014 2016 2018 2020 2022 (Source adapted from: https://tradingeconomics.com/germany/government‑budget) Extract A The opportunities and challenges facing the German economy The German economy entered a recession in 2023, and business confidence in the country fell at the fastest pace since 2021. German growth was the lowest among major economies in 2023. The future, however, is a greater concern owing to external factors such as global conflicts and restrictions on free trade. 5 The German government has been trying to improve its economic performance, with an aim to have renewables account for 80% of its energy supply. However, this would be a major shift for Germany where fossil fuels such as coal and gas still provide 75% of the energy needs and exposes it to volatile global energy prices. The rapid building of liquid natural gas terminals has helped to secure energy supplies in the short term. 10 The German government needs to remove a number of problems that have long held back its economy. Infrastructure projects in renewable energy production, such as wind farms, have been delayed by lengthy planning procedures. Business leaders complain of excessive bureaucracy and lack of technological advances. Labour shortages are another issue. Germany is expected to be short of up to 7 million workers by 2035, partly due to 15 an ageing population. There is a lack of skilled workers in the building trade, electrical engineering and professional services, which are important for the country’s economic ambitions. The German government needs to introduce effective policies such as planning reforms to speed up construction projects or reforms to increase the flexibility of the labour market. 20 The German economy has long been one of the biggest exporters in the world. It has trade surpluses with all its major trading partners except China and in 2021 its current account surplus was 7.7% of GDP. However, this has caused tensions with the governments of other countries, in particular the USA, which sees Germany’s surplus as partly a cause of the USA’s huge current account deficit. Having said that, a weakening 25 euro caused by higher interest rates in the USA compared to the Eurozone is beginning to have an effect in reducing Germany’s current account surplus – which dropped to 4.2% in 2022. (Source adapted from: https://www.ft.com/, https://www.cnb.cz/en/monetary‑policy/inflation‑reports/boxes-and-annexes-contained-in- inflation-reports/The-German-economy-and-the-dollar-euro-exchange-rate, and https://tradingeconomics.com/germany/current-account-to-gdp) Extract B US technology firm Intel invests in German semiconductor factories Intel is to double its investment in semiconductor factories in eastern Germany to €30 billion. This is the largest foreign direct investment in Germany’s history. Intel acquired the land for the factories in November 2022 and the first factory is expected to start production within four to five years. The site is expected to create 7 000 construction 5 jobs during the building phase, about 3 000 permanent high‑tech jobs and tens of thousands of additional jobs across the semiconductor industry. (Source adapted from: https://www.ft.com)
(b) With reference to Extract A, examine two factors influencing the short‑run aggregate supply of the German economy. (8)
June 2025 · Paper 2 · Q6(c) 10 marks AO1=2, AO2=2, AO3=2, AO4=4 10-mark response public finances and taxationfiscal and monetary policy
Data and extracts for question 6Sources for use with SECTION B Read the following figures (1–2) and extracts (A and B) before answering Question 6. Question 6 The German economy Figure 1: German government tax revenue, % of total revenue, 2022 2%2% 4% Income taxes 6% Value added tax Petrol duty 9% Corporation tax 41% Tobacco duty Motor vehicle tax Other 36% (Source adapted from: https://www.bundesfinanzministerium.de) Figure 2: German government budget, % of GDP, 2014–2022 1.9 2 1.5 1.2 1.3 % of 1 0.6 GDP 0 –2 –2.6 –4 –3.7 –4.3 –6 2014 2016 2018 2020 2022 (Source adapted from: https://tradingeconomics.com/germany/government‑budget) Extract A The opportunities and challenges facing the German economy The German economy entered a recession in 2023, and business confidence in the country fell at the fastest pace since 2021. German growth was the lowest among major economies in 2023. The future, however, is a greater concern owing to external factors such as global conflicts and restrictions on free trade. 5 The German government has been trying to improve its economic performance, with an aim to have renewables account for 80% of its energy supply. However, this would be a major shift for Germany where fossil fuels such as coal and gas still provide 75% of the energy needs and exposes it to volatile global energy prices. The rapid building of liquid natural gas terminals has helped to secure energy supplies in the short term. 10 The German government needs to remove a number of problems that have long held back its economy. Infrastructure projects in renewable energy production, such as wind farms, have been delayed by lengthy planning procedures. Business leaders complain of excessive bureaucracy and lack of technological advances. Labour shortages are another issue. Germany is expected to be short of up to 7 million workers by 2035, partly due to 15 an ageing population. There is a lack of skilled workers in the building trade, electrical engineering and professional services, which are important for the country’s economic ambitions. The German government needs to introduce effective policies such as planning reforms to speed up construction projects or reforms to increase the flexibility of the labour market. 20 The German economy has long been one of the biggest exporters in the world. It has trade surpluses with all its major trading partners except China and in 2021 its current account surplus was 7.7% of GDP. However, this has caused tensions with the governments of other countries, in particular the USA, which sees Germany’s surplus as partly a cause of the USA’s huge current account deficit. Having said that, a weakening 25 euro caused by higher interest rates in the USA compared to the Eurozone is beginning to have an effect in reducing Germany’s current account surplus – which dropped to 4.2% in 2022. (Source adapted from: https://www.ft.com/, https://www.cnb.cz/en/monetary‑policy/inflation‑reports/boxes-and-annexes-contained-in- inflation-reports/The-German-economy-and-the-dollar-euro-exchange-rate, and https://tradingeconomics.com/germany/current-account-to-gdp) Extract B US technology firm Intel invests in German semiconductor factories Intel is to double its investment in semiconductor factories in eastern Germany to €30 billion. This is the largest foreign direct investment in Germany’s history. Intel acquired the land for the factories in November 2022 and the first factory is expected to start production within four to five years. The site is expected to create 7 000 construction 5 jobs during the building phase, about 3 000 permanent high‑tech jobs and tens of thousands of additional jobs across the semiconductor industry. (Source adapted from: https://www.ft.com)
(c) With reference to the information provided and your own knowledge, assess the likely macroeconomic effects of the German government’s budget deficit. (10)
June 2025 · Paper 2 · Q6(d) 12 marks AO1=2, AO2=2, AO3=4, AO4=4 12-mark response aggregate demandnational income and the multiplier
Data and extracts for question 6Sources for use with SECTION B Read the following figures (1–2) and extracts (A and B) before answering Question 6. Question 6 The German economy Figure 1: German government tax revenue, % of total revenue, 2022 2%2% 4% Income taxes 6% Value added tax Petrol duty 9% Corporation tax 41% Tobacco duty Motor vehicle tax Other 36% (Source adapted from: https://www.bundesfinanzministerium.de) Figure 2: German government budget, % of GDP, 2014–2022 1.9 2 1.5 1.2 1.3 % of 1 0.6 GDP 0 –2 –2.6 –4 –3.7 –4.3 –6 2014 2016 2018 2020 2022 (Source adapted from: https://tradingeconomics.com/germany/government‑budget) Extract A The opportunities and challenges facing the German economy The German economy entered a recession in 2023, and business confidence in the country fell at the fastest pace since 2021. German growth was the lowest among major economies in 2023. The future, however, is a greater concern owing to external factors such as global conflicts and restrictions on free trade. 5 The German government has been trying to improve its economic performance, with an aim to have renewables account for 80% of its energy supply. However, this would be a major shift for Germany where fossil fuels such as coal and gas still provide 75% of the energy needs and exposes it to volatile global energy prices. The rapid building of liquid natural gas terminals has helped to secure energy supplies in the short term. 10 The German government needs to remove a number of problems that have long held back its economy. Infrastructure projects in renewable energy production, such as wind farms, have been delayed by lengthy planning procedures. Business leaders complain of excessive bureaucracy and lack of technological advances. Labour shortages are another issue. Germany is expected to be short of up to 7 million workers by 2035, partly due to 15 an ageing population. There is a lack of skilled workers in the building trade, electrical engineering and professional services, which are important for the country’s economic ambitions. The German government needs to introduce effective policies such as planning reforms to speed up construction projects or reforms to increase the flexibility of the labour market. 20 The German economy has long been one of the biggest exporters in the world. It has trade surpluses with all its major trading partners except China and in 2021 its current account surplus was 7.7% of GDP. However, this has caused tensions with the governments of other countries, in particular the USA, which sees Germany’s surplus as partly a cause of the USA’s huge current account deficit. Having said that, a weakening 25 euro caused by higher interest rates in the USA compared to the Eurozone is beginning to have an effect in reducing Germany’s current account surplus – which dropped to 4.2% in 2022. (Source adapted from: https://www.ft.com/, https://www.cnb.cz/en/monetary‑policy/inflation‑reports/boxes-and-annexes-contained-in- inflation-reports/The-German-economy-and-the-dollar-euro-exchange-rate, and https://tradingeconomics.com/germany/current-account-to-gdp) Extract B US technology firm Intel invests in German semiconductor factories Intel is to double its investment in semiconductor factories in eastern Germany to €30 billion. This is the largest foreign direct investment in Germany’s history. Intel acquired the land for the factories in November 2022 and the first factory is expected to start production within four to five years. The site is expected to create 7 000 construction 5 jobs during the building phase, about 3 000 permanent high‑tech jobs and tens of thousands of additional jobs across the semiconductor industry. (Source adapted from: https://www.ft.com)
(d) With reference to Extract B, discuss the impact of the planned investment by Intel in a new semiconductor factory on Germany’s aggregate demand. Use an aggregate demand and aggregate supply diagram in your answer. (12)
June 2025 · Paper 2 · Q6(e) 15 marks AO1=3, AO2=3, AO3=3, AO4=6 15-mark response supply side policies
Data and extracts for question 6Sources for use with SECTION B Read the following figures (1–2) and extracts (A and B) before answering Question 6. Question 6 The German economy Figure 1: German government tax revenue, % of total revenue, 2022 2%2% 4% Income taxes 6% Value added tax Petrol duty 9% Corporation tax 41% Tobacco duty Motor vehicle tax Other 36% (Source adapted from: https://www.bundesfinanzministerium.de) Figure 2: German government budget, % of GDP, 2014–2022 1.9 2 1.5 1.2 1.3 % of 1 0.6 GDP 0 –2 –2.6 –4 –3.7 –4.3 –6 2014 2016 2018 2020 2022 (Source adapted from: https://tradingeconomics.com/germany/government‑budget) Extract A The opportunities and challenges facing the German economy The German economy entered a recession in 2023, and business confidence in the country fell at the fastest pace since 2021. German growth was the lowest among major economies in 2023. The future, however, is a greater concern owing to external factors such as global conflicts and restrictions on free trade. 5 The German government has been trying to improve its economic performance, with an aim to have renewables account for 80% of its energy supply. However, this would be a major shift for Germany where fossil fuels such as coal and gas still provide 75% of the energy needs and exposes it to volatile global energy prices. The rapid building of liquid natural gas terminals has helped to secure energy supplies in the short term. 10 The German government needs to remove a number of problems that have long held back its economy. Infrastructure projects in renewable energy production, such as wind farms, have been delayed by lengthy planning procedures. Business leaders complain of excessive bureaucracy and lack of technological advances. Labour shortages are another issue. Germany is expected to be short of up to 7 million workers by 2035, partly due to 15 an ageing population. There is a lack of skilled workers in the building trade, electrical engineering and professional services, which are important for the country’s economic ambitions. The German government needs to introduce effective policies such as planning reforms to speed up construction projects or reforms to increase the flexibility of the labour market. 20 The German economy has long been one of the biggest exporters in the world. It has trade surpluses with all its major trading partners except China and in 2021 its current account surplus was 7.7% of GDP. However, this has caused tensions with the governments of other countries, in particular the USA, which sees Germany’s surplus as partly a cause of the USA’s huge current account deficit. Having said that, a weakening 25 euro caused by higher interest rates in the USA compared to the Eurozone is beginning to have an effect in reducing Germany’s current account surplus – which dropped to 4.2% in 2022. (Source adapted from: https://www.ft.com/, https://www.cnb.cz/en/monetary‑policy/inflation‑reports/boxes-and-annexes-contained-in- inflation-reports/The-German-economy-and-the-dollar-euro-exchange-rate, and https://tradingeconomics.com/germany/current-account-to-gdp) Extract B US technology firm Intel invests in German semiconductor factories Intel is to double its investment in semiconductor factories in eastern Germany to €30 billion. This is the largest foreign direct investment in Germany’s history. Intel acquired the land for the factories in November 2022 and the first factory is expected to start production within four to five years. The site is expected to create 7 000 construction 5 jobs during the building phase, about 3 000 permanent high‑tech jobs and tens of thousands of additional jobs across the semiconductor industry. (Source adapted from: https://www.ft.com)
(e) Discuss supply‑side policies the German government could use ‘to improve its economic performance’ (Extract A, line 6). (15)
June 2025 · Paper 3 · Q1(a) 5 marks AO1=2, AO2=2, AO3=1 Short answer externalitiespublic goods and information gaps
Data and extracts for question 1Sources for use with SECTION A Read Figures 1 and 2 and the following Extracts A, B, C and D before answering Question 1. The cost of living in the UK Figure 1: The price per litre of unleaded petrol in the UK, in pence, 2016–2023 200 Pence per litre 180 160 140 120 100 0 2016 2017 2018 2019 2020 2021 2022 2023 (Source adapted from: RAC) Figure 2: UK inflation, as measured by CPI, and wage growth (excluding bonuses), 3-month averages, 2012–2022 10 Inflation % (9.4%) 8 6 Wage growth (4.7%) 4 2 0 –2 2012 2014 2016 2018 2020 2022 (Source adapted from: ONS) Extract A Supermarket restrictions on multibuy deals and advertising Government rules limiting the location of unhealthy foods in shops began in 2022. Less healthy products are no longer promoted in key locations, such as checkouts, store entrances, aisle ends and their online equivalents. Rules banning multibuy deals on foods and drinks high in fat, salt or sugar (HFSS) – including buy one get 5 one free (BOGOF), ‘3 for 2’, and restrictions on free refills for soft drinks – were due in October 2023. The restrictions banning HFSS adverts on TV before 9pm and paid-for adverts online were set for January 2024. (Source adapted from: https://www.gov.uk/government/news/government-delays- restrictions-on-multibuy-deals-and-advertising-on-tv-and-online) Extract B Supermarket pay in 2023 Supermarkets have been increasing their hourly pay rates and most now pay significantly more than the National Minimum Wage, which was set at £10.42 in April 2023. Tesco made its biggest ever investment in employee pay in 2023, spending 5 £230 million to finance an increase in its basic hourly rate of pay, to £11.02 per hour, rising to £11.95 in London. The pay increase is the latest boost in employment benefits as supermarkets continue to compete for in-store workers, with Sainsbury’s and Asda both increasing pay to above £11 per hour in July 2023, while Aldi pays £11.40 an hour. 10 Supermarkets have found themselves facing criticism over pay that did not rise in line with inflation. Some workers are taking industrial action, such as strikes, working closely with trade unions. (Source adapted from: https://www.grocerygazette.co.uk/2023/02/22/supermarket-pay-rate-2023/) Extract C Supermarket petrol pricing In 2023 David Potts, the boss of Morrisons, admitted that supermarkets increased profits at the petrol pumps as he was questioned in a parliamentary committee alongside executives from Tesco, Sainsbury’s and Asda who denied they were making more profit from keeping petrol prices high. 5 A Competition and Markets Authority (CMA) report indicates that supermarkets’ profits have doubled to 8% on fuel since 2017. It is expected to recommend that supermarkets must share local fuel prices on a comparison website in order to increase transparency and help bring down prices – a strategy tried successfully in Northern Ireland. All the supermarkets said they would welcome such a move. 10 In 2023, the RAC motoring group said that a price checker would be welcome but blamed high prices on the domination of petrol retailing in the UK by a few large supermarkets. “When the wholesale price of diesel fell this spring, we saw average retailer margin reach 22p a litre which was more than three times the long-term margin of 7p. This cannot be allowed to continue when households are having to 15 contend with a cost of living crisis,” an RAC spokesperson said. At the committee, one politician, Jane Hunt, said: “In 1978 there were many more supermarkets. Now there are very few…are you in fact a cartel?” (Source adapted from: https://www.theguardian.com/business/2023/jun/27/morrisons- boss-admits-supermarket-chains-have-hiked-profits-on-petrol) Extract D EU trade relations with the UK The Trade and Cooperation Agreement 2021 between the EU and the UK means that there are no tariffs or quotas on goods moving between the EU and UK, provided those goods meet the ‘rules of origin’ of a good, based on where the products or materials used in their production come from. They prevent goods 5 manufactured in outside countries being transported through the UK (or the EU) to avoid paying tariffs. To benefit from the zero tariff, businesses must show the origin of their goods. A product qualifies as ‘originating’ if it is ‘wholly obtained’ in the UK and EU or has been substantially transformed in one or both markets. That is why UK businesses 10 that re-export goods from outside countries with little or no further processing, may still face tariffs when trading with EU member states. ‘Rules of origin’ can be time consuming and complex. Some businesses cannot or do not wish to claim zero tariff because of the excessive administrative costs to firms. (Source adapted from: https://commonslibrary.parliament.uk/new-customs-rules-for-trade-with-the-eu/)
(a) Explain one reason why consumers buy less than the social optimum quantity of healthy food. (5)
June 2025 · Paper 3 · Q1(b) 8 marks AO1=2, AO2=2, AO3=2, AO4=2 8-mark response labour market
Data and extracts for question 1Sources for use with SECTION A Read Figures 1 and 2 and the following Extracts A, B, C and D before answering Question 1. The cost of living in the UK Figure 1: The price per litre of unleaded petrol in the UK, in pence, 2016–2023 200 Pence per litre 180 160 140 120 100 0 2016 2017 2018 2019 2020 2021 2022 2023 (Source adapted from: RAC) Figure 2: UK inflation, as measured by CPI, and wage growth (excluding bonuses), 3-month averages, 2012–2022 10 Inflation % (9.4%) 8 6 Wage growth (4.7%) 4 2 0 –2 2012 2014 2016 2018 2020 2022 (Source adapted from: ONS) Extract A Supermarket restrictions on multibuy deals and advertising Government rules limiting the location of unhealthy foods in shops began in 2022. Less healthy products are no longer promoted in key locations, such as checkouts, store entrances, aisle ends and their online equivalents. Rules banning multibuy deals on foods and drinks high in fat, salt or sugar (HFSS) – including buy one get 5 one free (BOGOF), ‘3 for 2’, and restrictions on free refills for soft drinks – were due in October 2023. The restrictions banning HFSS adverts on TV before 9pm and paid-for adverts online were set for January 2024. (Source adapted from: https://www.gov.uk/government/news/government-delays- restrictions-on-multibuy-deals-and-advertising-on-tv-and-online) Extract B Supermarket pay in 2023 Supermarkets have been increasing their hourly pay rates and most now pay significantly more than the National Minimum Wage, which was set at £10.42 in April 2023. Tesco made its biggest ever investment in employee pay in 2023, spending 5 £230 million to finance an increase in its basic hourly rate of pay, to £11.02 per hour, rising to £11.95 in London. The pay increase is the latest boost in employment benefits as supermarkets continue to compete for in-store workers, with Sainsbury’s and Asda both increasing pay to above £11 per hour in July 2023, while Aldi pays £11.40 an hour. 10 Supermarkets have found themselves facing criticism over pay that did not rise in line with inflation. Some workers are taking industrial action, such as strikes, working closely with trade unions. (Source adapted from: https://www.grocerygazette.co.uk/2023/02/22/supermarket-pay-rate-2023/) Extract C Supermarket petrol pricing In 2023 David Potts, the boss of Morrisons, admitted that supermarkets increased profits at the petrol pumps as he was questioned in a parliamentary committee alongside executives from Tesco, Sainsbury’s and Asda who denied they were making more profit from keeping petrol prices high. 5 A Competition and Markets Authority (CMA) report indicates that supermarkets’ profits have doubled to 8% on fuel since 2017. It is expected to recommend that supermarkets must share local fuel prices on a comparison website in order to increase transparency and help bring down prices – a strategy tried successfully in Northern Ireland. All the supermarkets said they would welcome such a move. 10 In 2023, the RAC motoring group said that a price checker would be welcome but blamed high prices on the domination of petrol retailing in the UK by a few large supermarkets. “When the wholesale price of diesel fell this spring, we saw average retailer margin reach 22p a litre which was more than three times the long-term margin of 7p. This cannot be allowed to continue when households are having to 15 contend with a cost of living crisis,” an RAC spokesperson said. At the committee, one politician, Jane Hunt, said: “In 1978 there were many more supermarkets. Now there are very few…are you in fact a cartel?” (Source adapted from: https://www.theguardian.com/business/2023/jun/27/morrisons- boss-admits-supermarket-chains-have-hiked-profits-on-petrol) Extract D EU trade relations with the UK The Trade and Cooperation Agreement 2021 between the EU and the UK means that there are no tariffs or quotas on goods moving between the EU and UK, provided those goods meet the ‘rules of origin’ of a good, based on where the products or materials used in their production come from. They prevent goods 5 manufactured in outside countries being transported through the UK (or the EU) to avoid paying tariffs. To benefit from the zero tariff, businesses must show the origin of their goods. A product qualifies as ‘originating’ if it is ‘wholly obtained’ in the UK and EU or has been substantially transformed in one or both markets. That is why UK businesses 10 that re-export goods from outside countries with little or no further processing, may still face tariffs when trading with EU member states. ‘Rules of origin’ can be time consuming and complex. Some businesses cannot or do not wish to claim zero tariff because of the excessive administrative costs to firms. (Source adapted from: https://commonslibrary.parliament.uk/new-customs-rules-for-trade-with-the-eu/)
(b) With reference to Extract B, examine two likely reasons why wages in supermarkets are above the National Minimum Wage of £10.42. (8)
June 2025 · Paper 3 · Q1(c) 12 marks AO1=2, AO2=2, AO3=4, AO4=4 12-mark response oligopoly
Data and extracts for question 1Sources for use with SECTION A Read Figures 1 and 2 and the following Extracts A, B, C and D before answering Question 1. The cost of living in the UK Figure 1: The price per litre of unleaded petrol in the UK, in pence, 2016–2023 200 Pence per litre 180 160 140 120 100 0 2016 2017 2018 2019 2020 2021 2022 2023 (Source adapted from: RAC) Figure 2: UK inflation, as measured by CPI, and wage growth (excluding bonuses), 3-month averages, 2012–2022 10 Inflation % (9.4%) 8 6 Wage growth (4.7%) 4 2 0 –2 2012 2014 2016 2018 2020 2022 (Source adapted from: ONS) Extract A Supermarket restrictions on multibuy deals and advertising Government rules limiting the location of unhealthy foods in shops began in 2022. Less healthy products are no longer promoted in key locations, such as checkouts, store entrances, aisle ends and their online equivalents. Rules banning multibuy deals on foods and drinks high in fat, salt or sugar (HFSS) – including buy one get 5 one free (BOGOF), ‘3 for 2’, and restrictions on free refills for soft drinks – were due in October 2023. The restrictions banning HFSS adverts on TV before 9pm and paid-for adverts online were set for January 2024. (Source adapted from: https://www.gov.uk/government/news/government-delays- restrictions-on-multibuy-deals-and-advertising-on-tv-and-online) Extract B Supermarket pay in 2023 Supermarkets have been increasing their hourly pay rates and most now pay significantly more than the National Minimum Wage, which was set at £10.42 in April 2023. Tesco made its biggest ever investment in employee pay in 2023, spending 5 £230 million to finance an increase in its basic hourly rate of pay, to £11.02 per hour, rising to £11.95 in London. The pay increase is the latest boost in employment benefits as supermarkets continue to compete for in-store workers, with Sainsbury’s and Asda both increasing pay to above £11 per hour in July 2023, while Aldi pays £11.40 an hour. 10 Supermarkets have found themselves facing criticism over pay that did not rise in line with inflation. Some workers are taking industrial action, such as strikes, working closely with trade unions. (Source adapted from: https://www.grocerygazette.co.uk/2023/02/22/supermarket-pay-rate-2023/) Extract C Supermarket petrol pricing In 2023 David Potts, the boss of Morrisons, admitted that supermarkets increased profits at the petrol pumps as he was questioned in a parliamentary committee alongside executives from Tesco, Sainsbury’s and Asda who denied they were making more profit from keeping petrol prices high. 5 A Competition and Markets Authority (CMA) report indicates that supermarkets’ profits have doubled to 8% on fuel since 2017. It is expected to recommend that supermarkets must share local fuel prices on a comparison website in order to increase transparency and help bring down prices – a strategy tried successfully in Northern Ireland. All the supermarkets said they would welcome such a move. 10 In 2023, the RAC motoring group said that a price checker would be welcome but blamed high prices on the domination of petrol retailing in the UK by a few large supermarkets. “When the wholesale price of diesel fell this spring, we saw average retailer margin reach 22p a litre which was more than three times the long-term margin of 7p. This cannot be allowed to continue when households are having to 15 contend with a cost of living crisis,” an RAC spokesperson said. At the committee, one politician, Jane Hunt, said: “In 1978 there were many more supermarkets. Now there are very few…are you in fact a cartel?” (Source adapted from: https://www.theguardian.com/business/2023/jun/27/morrisons- boss-admits-supermarket-chains-have-hiked-profits-on-petrol) Extract D EU trade relations with the UK The Trade and Cooperation Agreement 2021 between the EU and the UK means that there are no tariffs or quotas on goods moving between the EU and UK, provided those goods meet the ‘rules of origin’ of a good, based on where the products or materials used in their production come from. They prevent goods 5 manufactured in outside countries being transported through the UK (or the EU) to avoid paying tariffs. To benefit from the zero tariff, businesses must show the origin of their goods. A product qualifies as ‘originating’ if it is ‘wholly obtained’ in the UK and EU or has been substantially transformed in one or both markets. That is why UK businesses 10 that re-export goods from outside countries with little or no further processing, may still face tariffs when trading with EU member states. ‘Rules of origin’ can be time consuming and complex. Some businesses cannot or do not wish to claim zero tariff because of the excessive administrative costs to firms. (Source adapted from: https://commonslibrary.parliament.uk/new-customs-rules-for-trade-with-the-eu/)
(c) With reference to Figure 1 and Extract C, discuss whether supermarkets charging similar prices for petrol is evidence of collusion. Use game theory to support your answer. (12)
June 2025 · Paper 3 · Q1(d) 25 marks AO1=4, AO2=4, AO3=8, AO4=9 25-mark essay Either/or inflationrevenues costs and profits
Data and extracts for question 1Sources for use with SECTION A Read Figures 1 and 2 and the following Extracts A, B, C and D before answering Question 1. The cost of living in the UK Figure 1: The price per litre of unleaded petrol in the UK, in pence, 2016–2023 200 Pence per litre 180 160 140 120 100 0 2016 2017 2018 2019 2020 2021 2022 2023 (Source adapted from: RAC) Figure 2: UK inflation, as measured by CPI, and wage growth (excluding bonuses), 3-month averages, 2012–2022 10 Inflation % (9.4%) 8 6 Wage growth (4.7%) 4 2 0 –2 2012 2014 2016 2018 2020 2022 (Source adapted from: ONS) Extract A Supermarket restrictions on multibuy deals and advertising Government rules limiting the location of unhealthy foods in shops began in 2022. Less healthy products are no longer promoted in key locations, such as checkouts, store entrances, aisle ends and their online equivalents. Rules banning multibuy deals on foods and drinks high in fat, salt or sugar (HFSS) – including buy one get 5 one free (BOGOF), ‘3 for 2’, and restrictions on free refills for soft drinks – were due in October 2023. The restrictions banning HFSS adverts on TV before 9pm and paid-for adverts online were set for January 2024. (Source adapted from: https://www.gov.uk/government/news/government-delays- restrictions-on-multibuy-deals-and-advertising-on-tv-and-online) Extract B Supermarket pay in 2023 Supermarkets have been increasing their hourly pay rates and most now pay significantly more than the National Minimum Wage, which was set at £10.42 in April 2023. Tesco made its biggest ever investment in employee pay in 2023, spending 5 £230 million to finance an increase in its basic hourly rate of pay, to £11.02 per hour, rising to £11.95 in London. The pay increase is the latest boost in employment benefits as supermarkets continue to compete for in-store workers, with Sainsbury’s and Asda both increasing pay to above £11 per hour in July 2023, while Aldi pays £11.40 an hour. 10 Supermarkets have found themselves facing criticism over pay that did not rise in line with inflation. Some workers are taking industrial action, such as strikes, working closely with trade unions. (Source adapted from: https://www.grocerygazette.co.uk/2023/02/22/supermarket-pay-rate-2023/) Extract C Supermarket petrol pricing In 2023 David Potts, the boss of Morrisons, admitted that supermarkets increased profits at the petrol pumps as he was questioned in a parliamentary committee alongside executives from Tesco, Sainsbury’s and Asda who denied they were making more profit from keeping petrol prices high. 5 A Competition and Markets Authority (CMA) report indicates that supermarkets’ profits have doubled to 8% on fuel since 2017. It is expected to recommend that supermarkets must share local fuel prices on a comparison website in order to increase transparency and help bring down prices – a strategy tried successfully in Northern Ireland. All the supermarkets said they would welcome such a move. 10 In 2023, the RAC motoring group said that a price checker would be welcome but blamed high prices on the domination of petrol retailing in the UK by a few large supermarkets. “When the wholesale price of diesel fell this spring, we saw average retailer margin reach 22p a litre which was more than three times the long-term margin of 7p. This cannot be allowed to continue when households are having to 15 contend with a cost of living crisis,” an RAC spokesperson said. At the committee, one politician, Jane Hunt, said: “In 1978 there were many more supermarkets. Now there are very few…are you in fact a cartel?” (Source adapted from: https://www.theguardian.com/business/2023/jun/27/morrisons- boss-admits-supermarket-chains-have-hiked-profits-on-petrol) Extract D EU trade relations with the UK The Trade and Cooperation Agreement 2021 between the EU and the UK means that there are no tariffs or quotas on goods moving between the EU and UK, provided those goods meet the ‘rules of origin’ of a good, based on where the products or materials used in their production come from. They prevent goods 5 manufactured in outside countries being transported through the UK (or the EU) to avoid paying tariffs. To benefit from the zero tariff, businesses must show the origin of their goods. A product qualifies as ‘originating’ if it is ‘wholly obtained’ in the UK and EU or has been substantially transformed in one or both markets. That is why UK businesses 10 that re-export goods from outside countries with little or no further processing, may still face tariffs when trading with EU member states. ‘Rules of origin’ can be time consuming and complex. Some businesses cannot or do not wish to claim zero tariff because of the excessive administrative costs to firms. (Source adapted from: https://commonslibrary.parliament.uk/new-customs-rules-for-trade-with-the-eu/)
(d) Evaluate the microeconomic and macroeconomic effects of high levels of inflation. Refer to the UK or any other developed economy in your answer. (25)
June 2025 · Paper 3 · Q1(e) 25 marks AO1=4, AO2=4, AO3=8, AO4=9 25-mark essay Either/or trading blocs and protectionismrevenues costs and profits
Data and extracts for question 1Sources for use with SECTION A Read Figures 1 and 2 and the following Extracts A, B, C and D before answering Question 1. The cost of living in the UK Figure 1: The price per litre of unleaded petrol in the UK, in pence, 2016–2023 200 Pence per litre 180 160 140 120 100 0 2016 2017 2018 2019 2020 2021 2022 2023 (Source adapted from: RAC) Figure 2: UK inflation, as measured by CPI, and wage growth (excluding bonuses), 3-month averages, 2012–2022 10 Inflation % (9.4%) 8 6 Wage growth (4.7%) 4 2 0 –2 2012 2014 2016 2018 2020 2022 (Source adapted from: ONS) Extract A Supermarket restrictions on multibuy deals and advertising Government rules limiting the location of unhealthy foods in shops began in 2022. Less healthy products are no longer promoted in key locations, such as checkouts, store entrances, aisle ends and their online equivalents. Rules banning multibuy deals on foods and drinks high in fat, salt or sugar (HFSS) – including buy one get 5 one free (BOGOF), ‘3 for 2’, and restrictions on free refills for soft drinks – were due in October 2023. The restrictions banning HFSS adverts on TV before 9pm and paid-for adverts online were set for January 2024. (Source adapted from: https://www.gov.uk/government/news/government-delays- restrictions-on-multibuy-deals-and-advertising-on-tv-and-online) Extract B Supermarket pay in 2023 Supermarkets have been increasing their hourly pay rates and most now pay significantly more than the National Minimum Wage, which was set at £10.42 in April 2023. Tesco made its biggest ever investment in employee pay in 2023, spending 5 £230 million to finance an increase in its basic hourly rate of pay, to £11.02 per hour, rising to £11.95 in London. The pay increase is the latest boost in employment benefits as supermarkets continue to compete for in-store workers, with Sainsbury’s and Asda both increasing pay to above £11 per hour in July 2023, while Aldi pays £11.40 an hour. 10 Supermarkets have found themselves facing criticism over pay that did not rise in line with inflation. Some workers are taking industrial action, such as strikes, working closely with trade unions. (Source adapted from: https://www.grocerygazette.co.uk/2023/02/22/supermarket-pay-rate-2023/) Extract C Supermarket petrol pricing In 2023 David Potts, the boss of Morrisons, admitted that supermarkets increased profits at the petrol pumps as he was questioned in a parliamentary committee alongside executives from Tesco, Sainsbury’s and Asda who denied they were making more profit from keeping petrol prices high. 5 A Competition and Markets Authority (CMA) report indicates that supermarkets’ profits have doubled to 8% on fuel since 2017. It is expected to recommend that supermarkets must share local fuel prices on a comparison website in order to increase transparency and help bring down prices – a strategy tried successfully in Northern Ireland. All the supermarkets said they would welcome such a move. 10 In 2023, the RAC motoring group said that a price checker would be welcome but blamed high prices on the domination of petrol retailing in the UK by a few large supermarkets. “When the wholesale price of diesel fell this spring, we saw average retailer margin reach 22p a litre which was more than three times the long-term margin of 7p. This cannot be allowed to continue when households are having to 15 contend with a cost of living crisis,” an RAC spokesperson said. At the committee, one politician, Jane Hunt, said: “In 1978 there were many more supermarkets. Now there are very few…are you in fact a cartel?” (Source adapted from: https://www.theguardian.com/business/2023/jun/27/morrisons- boss-admits-supermarket-chains-have-hiked-profits-on-petrol) Extract D EU trade relations with the UK The Trade and Cooperation Agreement 2021 between the EU and the UK means that there are no tariffs or quotas on goods moving between the EU and UK, provided those goods meet the ‘rules of origin’ of a good, based on where the products or materials used in their production come from. They prevent goods 5 manufactured in outside countries being transported through the UK (or the EU) to avoid paying tariffs. To benefit from the zero tariff, businesses must show the origin of their goods. A product qualifies as ‘originating’ if it is ‘wholly obtained’ in the UK and EU or has been substantially transformed in one or both markets. That is why UK businesses 10 that re-export goods from outside countries with little or no further processing, may still face tariffs when trading with EU member states. ‘Rules of origin’ can be time consuming and complex. Some businesses cannot or do not wish to claim zero tariff because of the excessive administrative costs to firms. (Source adapted from: https://commonslibrary.parliament.uk/new-customs-rules-for-trade-with-the-eu/)
(e) Evaluate the microeconomic and macroeconomic effects of a regional trade agreement between the UK and the EU. (25)
June 2025 · Paper 3 · Q2(a) 5 marks AO1=2, AO2=2, AO3=1 Diagram Hard indirect taxes and subsidies
Data and extracts for question 2Sources for use with SECTION B Read Figure 3 and the following Extracts (E to G) before answering Question 2. The economy of India Figure 3: Selected economic data for India, 2006–2021 Human GDP per capita % people living in Year Development (US$) absolute poverty Index (HDI) value 2006 820.0 0.611 55.1 2016 1 714.3 0.624 27.7 2021 2 238.1 0.633 16.4 (Source adapted from: https://www.statista.com/statistics/1272613/india-multidimensional- poverty-index/; https://data.worldbank.org/indicator/; UN Human Development Reports) Extract E 135 million Indians escape absolute poverty in recent years Absolute poverty in India, measured by the number of people living on under US$2.15 a day, has fallen dramatically over the last 15 years. The government’s dedicated focus on improving access to sanitation, nutrition, cooking oil, banking services, drinking water and electricity has led to significant advances in these 5 areas. The $2.3 million provision of subsidised cooking oil has positively transformed lives, with a 14.6 percentage points improvement in the access to cooking oil. (Source adapted from: https://pib.gov.in/) Extract F Buffer stocks in India The Indian government is required to maintain a buffer stock of 11 million tonnes of wheat and 10 million tonnes of rice. The grains are purchased from farmers at the minimum support price and stored in secure warehouses across the country. India, once troubled by famine, has more recently managed to remain self-sufficient in 5 most food categories except edible oils, and is the world’s largest rice exporter. Even during the global health crisis 2020-2022, when the government distributed free food to nearly 800 million people, buffer stocks ran down but not out. Farmers are encouraged to produce more without any consideration of sustainability. (Source adapted from: https://ig.ft.com/india-population/) Extract G Population growth in India “The greatest obstacle in the path of overall economic development is the alarming rate of population growth,” was one Indian government minister’s view in 1967. In the 1970s, the Indian government took radical measures to try to prevent population growth, with little success. 5 Then, in the 1980s and 1990s, India began opening up its economy to the private sector. Policymakers began viewing a growing young population in the form of the so-called demographic dividend – when a majority of a country’s population is of working age (15-64 years) – as an engine for further economic development. In May 2023 India took over from China as the country with the highest population reaching 1.4 billion. However, 10 it needs enough well-paying jobs designed to serve the modern, urban economy. (Source adapted from: https://www.aljazeera.com/features/2023/4/18/overtaking-chinas- population-will-india-gain-or-lose)
(a) Using a demand and supply diagram, explain the cost of a subsidy on the market for cooking oil to the Indian government (Extract E, line 6). (5)
June 2025 · Paper 3 · Q2(b) 8 marks AO1=2, AO2=2, AO3=2, AO4=2 8-mark response emerging and developing economies
Data and extracts for question 2Sources for use with SECTION B Read Figure 3 and the following Extracts (E to G) before answering Question 2. The economy of India Figure 3: Selected economic data for India, 2006–2021 Human GDP per capita % people living in Year Development (US$) absolute poverty Index (HDI) value 2006 820.0 0.611 55.1 2016 1 714.3 0.624 27.7 2021 2 238.1 0.633 16.4 (Source adapted from: https://www.statista.com/statistics/1272613/india-multidimensional- poverty-index/; https://data.worldbank.org/indicator/; UN Human Development Reports) Extract E 135 million Indians escape absolute poverty in recent years Absolute poverty in India, measured by the number of people living on under US$2.15 a day, has fallen dramatically over the last 15 years. The government’s dedicated focus on improving access to sanitation, nutrition, cooking oil, banking services, drinking water and electricity has led to significant advances in these 5 areas. The $2.3 million provision of subsidised cooking oil has positively transformed lives, with a 14.6 percentage points improvement in the access to cooking oil. (Source adapted from: https://pib.gov.in/) Extract F Buffer stocks in India The Indian government is required to maintain a buffer stock of 11 million tonnes of wheat and 10 million tonnes of rice. The grains are purchased from farmers at the minimum support price and stored in secure warehouses across the country. India, once troubled by famine, has more recently managed to remain self-sufficient in 5 most food categories except edible oils, and is the world’s largest rice exporter. Even during the global health crisis 2020-2022, when the government distributed free food to nearly 800 million people, buffer stocks ran down but not out. Farmers are encouraged to produce more without any consideration of sustainability. (Source adapted from: https://ig.ft.com/india-population/) Extract G Population growth in India “The greatest obstacle in the path of overall economic development is the alarming rate of population growth,” was one Indian government minister’s view in 1967. In the 1970s, the Indian government took radical measures to try to prevent population growth, with little success. 5 Then, in the 1980s and 1990s, India began opening up its economy to the private sector. Policymakers began viewing a growing young population in the form of the so-called demographic dividend – when a majority of a country’s population is of working age (15-64 years) – as an engine for further economic development. In May 2023 India took over from China as the country with the highest population reaching 1.4 billion. However, 10 it needs enough well-paying jobs designed to serve the modern, urban economy. (Source adapted from: https://www.aljazeera.com/features/2023/4/18/overtaking-chinas- population-will-india-gain-or-lose)
(b) Examine two advantages of using the Human Development Index (HDI) to measure the level of economic development in India. (8)
June 2025 · Paper 3 · Q2(c) 12 marks AO1=2, AO2=2, AO3=4, AO4=4 12-mark response emerging and developing economies
Data and extracts for question 2Sources for use with SECTION B Read Figure 3 and the following Extracts (E to G) before answering Question 2. The economy of India Figure 3: Selected economic data for India, 2006–2021 Human GDP per capita % people living in Year Development (US$) absolute poverty Index (HDI) value 2006 820.0 0.611 55.1 2016 1 714.3 0.624 27.7 2021 2 238.1 0.633 16.4 (Source adapted from: https://www.statista.com/statistics/1272613/india-multidimensional- poverty-index/; https://data.worldbank.org/indicator/; UN Human Development Reports) Extract E 135 million Indians escape absolute poverty in recent years Absolute poverty in India, measured by the number of people living on under US$2.15 a day, has fallen dramatically over the last 15 years. The government’s dedicated focus on improving access to sanitation, nutrition, cooking oil, banking services, drinking water and electricity has led to significant advances in these 5 areas. The $2.3 million provision of subsidised cooking oil has positively transformed lives, with a 14.6 percentage points improvement in the access to cooking oil. (Source adapted from: https://pib.gov.in/) Extract F Buffer stocks in India The Indian government is required to maintain a buffer stock of 11 million tonnes of wheat and 10 million tonnes of rice. The grains are purchased from farmers at the minimum support price and stored in secure warehouses across the country. India, once troubled by famine, has more recently managed to remain self-sufficient in 5 most food categories except edible oils, and is the world’s largest rice exporter. Even during the global health crisis 2020-2022, when the government distributed free food to nearly 800 million people, buffer stocks ran down but not out. Farmers are encouraged to produce more without any consideration of sustainability. (Source adapted from: https://ig.ft.com/india-population/) Extract G Population growth in India “The greatest obstacle in the path of overall economic development is the alarming rate of population growth,” was one Indian government minister’s view in 1967. In the 1970s, the Indian government took radical measures to try to prevent population growth, with little success. 5 Then, in the 1980s and 1990s, India began opening up its economy to the private sector. Policymakers began viewing a growing young population in the form of the so-called demographic dividend – when a majority of a country’s population is of working age (15-64 years) – as an engine for further economic development. In May 2023 India took over from China as the country with the highest population reaching 1.4 billion. However, 10 it needs enough well-paying jobs designed to serve the modern, urban economy. (Source adapted from: https://www.aljazeera.com/features/2023/4/18/overtaking-chinas- population-will-india-gain-or-lose)
(c) With reference to Extract F, discuss the problems that might be involved with the buffer stock system in India. (12)
June 2025 · Paper 3 · Q2(d) 25 marks AO1=4, AO2=4, AO3=8, AO4=9 25-mark essay Either/or poverty and inequalitylabour market
Data and extracts for question 2Sources for use with SECTION B Read Figure 3 and the following Extracts (E to G) before answering Question 2. The economy of India Figure 3: Selected economic data for India, 2006–2021 Human GDP per capita % people living in Year Development (US$) absolute poverty Index (HDI) value 2006 820.0 0.611 55.1 2016 1 714.3 0.624 27.7 2021 2 238.1 0.633 16.4 (Source adapted from: https://www.statista.com/statistics/1272613/india-multidimensional- poverty-index/; https://data.worldbank.org/indicator/; UN Human Development Reports) Extract E 135 million Indians escape absolute poverty in recent years Absolute poverty in India, measured by the number of people living on under US$2.15 a day, has fallen dramatically over the last 15 years. The government’s dedicated focus on improving access to sanitation, nutrition, cooking oil, banking services, drinking water and electricity has led to significant advances in these 5 areas. The $2.3 million provision of subsidised cooking oil has positively transformed lives, with a 14.6 percentage points improvement in the access to cooking oil. (Source adapted from: https://pib.gov.in/) Extract F Buffer stocks in India The Indian government is required to maintain a buffer stock of 11 million tonnes of wheat and 10 million tonnes of rice. The grains are purchased from farmers at the minimum support price and stored in secure warehouses across the country. India, once troubled by famine, has more recently managed to remain self-sufficient in 5 most food categories except edible oils, and is the world’s largest rice exporter. Even during the global health crisis 2020-2022, when the government distributed free food to nearly 800 million people, buffer stocks ran down but not out. Farmers are encouraged to produce more without any consideration of sustainability. (Source adapted from: https://ig.ft.com/india-population/) Extract G Population growth in India “The greatest obstacle in the path of overall economic development is the alarming rate of population growth,” was one Indian government minister’s view in 1967. In the 1970s, the Indian government took radical measures to try to prevent population growth, with little success. 5 Then, in the 1980s and 1990s, India began opening up its economy to the private sector. Policymakers began viewing a growing young population in the form of the so-called demographic dividend – when a majority of a country’s population is of working age (15-64 years) – as an engine for further economic development. In May 2023 India took over from China as the country with the highest population reaching 1.4 billion. However, 10 it needs enough well-paying jobs designed to serve the modern, urban economy. (Source adapted from: https://www.aljazeera.com/features/2023/4/18/overtaking-chinas- population-will-india-gain-or-lose)
(d) Evaluate the microeconomic and macroeconomic reasons for the fall in poverty in India. (25)
June 2025 · Paper 3 · Q2(e) 25 marks AO1=4, AO2=4, AO3=8, AO4=9 25-mark essay Either/or emerging and developing economieslabour market
Data and extracts for question 2Sources for use with SECTION B Read Figure 3 and the following Extracts (E to G) before answering Question 2. The economy of India Figure 3: Selected economic data for India, 2006–2021 Human GDP per capita % people living in Year Development (US$) absolute poverty Index (HDI) value 2006 820.0 0.611 55.1 2016 1 714.3 0.624 27.7 2021 2 238.1 0.633 16.4 (Source adapted from: https://www.statista.com/statistics/1272613/india-multidimensional- poverty-index/; https://data.worldbank.org/indicator/; UN Human Development Reports) Extract E 135 million Indians escape absolute poverty in recent years Absolute poverty in India, measured by the number of people living on under US$2.15 a day, has fallen dramatically over the last 15 years. The government’s dedicated focus on improving access to sanitation, nutrition, cooking oil, banking services, drinking water and electricity has led to significant advances in these 5 areas. The $2.3 million provision of subsidised cooking oil has positively transformed lives, with a 14.6 percentage points improvement in the access to cooking oil. (Source adapted from: https://pib.gov.in/) Extract F Buffer stocks in India The Indian government is required to maintain a buffer stock of 11 million tonnes of wheat and 10 million tonnes of rice. The grains are purchased from farmers at the minimum support price and stored in secure warehouses across the country. India, once troubled by famine, has more recently managed to remain self-sufficient in 5 most food categories except edible oils, and is the world’s largest rice exporter. Even during the global health crisis 2020-2022, when the government distributed free food to nearly 800 million people, buffer stocks ran down but not out. Farmers are encouraged to produce more without any consideration of sustainability. (Source adapted from: https://ig.ft.com/india-population/) Extract G Population growth in India “The greatest obstacle in the path of overall economic development is the alarming rate of population growth,” was one Indian government minister’s view in 1967. In the 1970s, the Indian government took radical measures to try to prevent population growth, with little success. 5 Then, in the 1980s and 1990s, India began opening up its economy to the private sector. Policymakers began viewing a growing young population in the form of the so-called demographic dividend – when a majority of a country’s population is of working age (15-64 years) – as an engine for further economic development. In May 2023 India took over from China as the country with the highest population reaching 1.4 billion. However, 10 it needs enough well-paying jobs designed to serve the modern, urban economy. (Source adapted from: https://www.aljazeera.com/features/2023/4/18/overtaking-chinas- population-will-india-gain-or-lose)
(e) Evaluate the microeconomic and macroeconomic effects of rapid increases in population in India. (25)
June 2024 · AS Paper 1 · Q1(a) 3 marks AO1=1, AO2=1, AO3=1 Short answer nature of economics
Data and extracts for question 11 Scarcity of non‑renewable resources, such as oil, is a key reason why alternative resources have been developed by economies. In recent years, within the energy market there has been a large increase in the production of wind power.
(a) With reference to the information provided, explain the distinction between renewable and non‑renewable resources. (3)
June 2024 · AS Paper 1 · Q2(c) 2 marks AO1=1, AO2=1 Diagram supply and demand
Data and extracts for question 22 Vanilla bean prices increased to a record $600 a kilogramme in 2018 after a cyclone hit the tropical island of Madagascar, damaging crops. Madagascar supplies 75% to 80% of the world vanilla bean market.
(c) Annotate the diagram below to show the effect of the cyclone on the price of vanilla beans. (2) Supply Price of vanilla beans e Pe Demand 0 Qe Quantity of vanilla beans
June 2024 · AS Paper 1 · Q3(b) 3 marks AO1=1, AO2=1, AO3=1 Short answer externalitiesgovernment intervention in markets
Data and extracts for question 33 Singapore is mainly a free market economy.
The education system in Singapore produces some of the highest achieving students in international education rankings, with its teenagers coming top in tests in mathematics, reading and science. (b) Singapore’s education system is provided by the state. With reference to the information above, explain why education is normally provided by the state. (3)
June 2024 · AS Paper 1 · Q4(b) 3 marks AO1=1, AO2=1, AO3=1 Short answer nature of economics
Data and extracts for question 44 Statement 1 Finland has schools with an average class size of 19.6 Statement 2 Other countries ought to set school class sizes similar to Finland. (Source adapted from: https://www.oph.fi/en/news/2019)
5% of total government spending in Finland is on education and therefore other areas of the economy have reduced funding as a result, including the military despite an increase in recent global conflicts. (b) With reference to the information above, explain what is meant by ‘opportunity cost’. (3)
June 2024 · AS Paper 1 · Q5(a) 2 marks AO1=1, AO2=1 Calculation price elasticity of demand
Data and extracts for question 55 Chief Executive Elon Musk said “affordability” was the biggest barrier to Tesla reaching a far larger market. Before recent price cuts for its electric vehicles, he said, “We weren’t sure about what the price elasticity of demand was for Tesla. We found that even small changes in price have a big impact on demand.” (Source adapted from: https://www.ft.com/)
(a) In June 2023, Tesla further reduced the price of its Model 3 vehicle by £4 200 from £42 990. It has been forecast that the price cut will lead to a 15% increase in demand. Ceteris paribus, calculate the price elasticity of demand for the Model 3. You are advised to show your working. (2)
June 2024 · AS Paper 1 · Q6(a) 5 marks AO1=1, AO2=2, AO3=2 Short answer government failure
Data and extracts for question 6The market for plastic in the UK Figure 1: Trend in the purchase of single‑use plastic bags in millions, UK, 2014 to 2021 2014 2015 2016 2017 2018 2019 2020 2021 7 500 2 120 1 750 1 130 1 040 627 496 197 Extract A 10p charge continues to reduce use of plastic carrier bags The 5p charge on single‑use carrier bags was introduced in supermarkets in 2015. The charge was increased to 10p in 2021 and extended to all businesses. The UK Environment Minister said that the plastic bag charge has ended the irrational purchase of billions of single‑use carrier bags, thereby protecting our landscapes and 5 ensuring millions of pounds are redistributed to worthy causes. This was needed as without this legislation, the market is not able to effectively manage the situation. Consumers are now in the habit of bringing reusable carrier bags when shopping. In addition to single‑use carrier bag charges, major retailers have offered bottle deposit return schemes and refillable food and cleaning product options. These provide 10 incentives to consumers to reuse their plastic containers. However, retailers have suggested that most customers do not wish to pay more for cleaning products in reusable packaging. With the average household income falling by 4.3% in 2023, sales of refillable cleaning products are expected to fall from 200 000 to 130 000 this year. 15 (Source adapted from: https://www.circularonline.co.uk/news/) Extract B Plastic packaging tax Food manufacturers have criticised the implementation of a new UK environmental tax, warning it will force them to increase prices for consumers. The 2018 tax was designed to provide incentives to businesses to use recycled plastic in packaging. Businesses manufacturing or importing 10 tonnes or more a year of 5 plastic packaging that contains less than 30% recycled plastic are taxed at £200 a tonne. Plastic packaging containing more than this will be exempt from the tax. Helene Roberts, Chief Executive of Robinson Packaging, said increased prices for the consumer would be an unintended consequence of the tax. “It will just create inflationary pressures within the supply chain and firms may need to pass this on.” A wide range of 10 businesses are affected by the new tax, including retailers importing items such as bin liners, drink bottles and carrier bags. Food manufacturers are particularly impacted as the industry uses 40% of packaging in the UK. (Source adapted from: https://www.ft.com) Extract C Single‑use cups An estimated 2.5 billion single‑use cups are used in the UK every year by consumers buying coffee from chains and cafes, creating approximately 25 000 tonnes of waste. Research has found that while a 25p charge on single‑use cups increases the use of reusable coffee cups in coffee shops, a discount on reusable coffee cups has no impact at 5 all on their use. A 25p charge on single‑use cups increases the use of reusable coffee cups by 3.4%. Environmental messaging in cafes, for example posters about litter, increases the use of reusable coffee cups by 2.3%. The availability of reusable cups leads to an increase of 2.5% whereas the distribution of free reusable cups leads to a further increase of 4.3%. 10 “While the increases for individual measures were modest, the greatest behavioural change was when the measures were combined,” said Wouter Poortinga of Cardiff University. (Source adapted from: https://www.theguardian.com/environment/2017/mar/30/)
(a) Explain what is meant by the ‘unintended consequence’ (Extract B, line 9) of the plastic tax. (5)
June 2024 · AS Paper 1 · Q6(b) 10 marks AO1=2, AO2=2, AO3=2, AO4=4 10-mark response rational decision making and behavioural economics
Data and extracts for question 6The market for plastic in the UK Figure 1: Trend in the purchase of single‑use plastic bags in millions, UK, 2014 to 2021 2014 2015 2016 2017 2018 2019 2020 2021 7 500 2 120 1 750 1 130 1 040 627 496 197 Extract A 10p charge continues to reduce use of plastic carrier bags The 5p charge on single‑use carrier bags was introduced in supermarkets in 2015. The charge was increased to 10p in 2021 and extended to all businesses. The UK Environment Minister said that the plastic bag charge has ended the irrational purchase of billions of single‑use carrier bags, thereby protecting our landscapes and 5 ensuring millions of pounds are redistributed to worthy causes. This was needed as without this legislation, the market is not able to effectively manage the situation. Consumers are now in the habit of bringing reusable carrier bags when shopping. In addition to single‑use carrier bag charges, major retailers have offered bottle deposit return schemes and refillable food and cleaning product options. These provide 10 incentives to consumers to reuse their plastic containers. However, retailers have suggested that most customers do not wish to pay more for cleaning products in reusable packaging. With the average household income falling by 4.3% in 2023, sales of refillable cleaning products are expected to fall from 200 000 to 130 000 this year. 15 (Source adapted from: https://www.circularonline.co.uk/news/) Extract B Plastic packaging tax Food manufacturers have criticised the implementation of a new UK environmental tax, warning it will force them to increase prices for consumers. The 2018 tax was designed to provide incentives to businesses to use recycled plastic in packaging. Businesses manufacturing or importing 10 tonnes or more a year of 5 plastic packaging that contains less than 30% recycled plastic are taxed at £200 a tonne. Plastic packaging containing more than this will be exempt from the tax. Helene Roberts, Chief Executive of Robinson Packaging, said increased prices for the consumer would be an unintended consequence of the tax. “It will just create inflationary pressures within the supply chain and firms may need to pass this on.” A wide range of 10 businesses are affected by the new tax, including retailers importing items such as bin liners, drink bottles and carrier bags. Food manufacturers are particularly impacted as the industry uses 40% of packaging in the UK. (Source adapted from: https://www.ft.com) Extract C Single‑use cups An estimated 2.5 billion single‑use cups are used in the UK every year by consumers buying coffee from chains and cafes, creating approximately 25 000 tonnes of waste. Research has found that while a 25p charge on single‑use cups increases the use of reusable coffee cups in coffee shops, a discount on reusable coffee cups has no impact at 5 all on their use. A 25p charge on single‑use cups increases the use of reusable coffee cups by 3.4%. Environmental messaging in cafes, for example posters about litter, increases the use of reusable coffee cups by 2.3%. The availability of reusable cups leads to an increase of 2.5% whereas the distribution of free reusable cups leads to a further increase of 4.3%. 10 “While the increases for individual measures were modest, the greatest behavioural change was when the measures were combined,” said Wouter Poortinga of Cardiff University. (Source adapted from: https://www.theguardian.com/environment/2017/mar/30/)
(b) With reference to Extract A and your own knowledge, assess the view that it is irrational to buy plastic carrier bags when shopping. (10)
June 2024 · AS Paper 1 · Q6(c) 4 marks AO1=2, AO2=2 Short answer price elasticity of demand
Data and extracts for question 6The market for plastic in the UK Figure 1: Trend in the purchase of single‑use plastic bags in millions, UK, 2014 to 2021 2014 2015 2016 2017 2018 2019 2020 2021 7 500 2 120 1 750 1 130 1 040 627 496 197 Extract A 10p charge continues to reduce use of plastic carrier bags The 5p charge on single‑use carrier bags was introduced in supermarkets in 2015. The charge was increased to 10p in 2021 and extended to all businesses. The UK Environment Minister said that the plastic bag charge has ended the irrational purchase of billions of single‑use carrier bags, thereby protecting our landscapes and 5 ensuring millions of pounds are redistributed to worthy causes. This was needed as without this legislation, the market is not able to effectively manage the situation. Consumers are now in the habit of bringing reusable carrier bags when shopping. In addition to single‑use carrier bag charges, major retailers have offered bottle deposit return schemes and refillable food and cleaning product options. These provide 10 incentives to consumers to reuse their plastic containers. However, retailers have suggested that most customers do not wish to pay more for cleaning products in reusable packaging. With the average household income falling by 4.3% in 2023, sales of refillable cleaning products are expected to fall from 200 000 to 130 000 this year. 15 (Source adapted from: https://www.circularonline.co.uk/news/) Extract B Plastic packaging tax Food manufacturers have criticised the implementation of a new UK environmental tax, warning it will force them to increase prices for consumers. The 2018 tax was designed to provide incentives to businesses to use recycled plastic in packaging. Businesses manufacturing or importing 10 tonnes or more a year of 5 plastic packaging that contains less than 30% recycled plastic are taxed at £200 a tonne. Plastic packaging containing more than this will be exempt from the tax. Helene Roberts, Chief Executive of Robinson Packaging, said increased prices for the consumer would be an unintended consequence of the tax. “It will just create inflationary pressures within the supply chain and firms may need to pass this on.” A wide range of 10 businesses are affected by the new tax, including retailers importing items such as bin liners, drink bottles and carrier bags. Food manufacturers are particularly impacted as the industry uses 40% of packaging in the UK. (Source adapted from: https://www.ft.com) Extract C Single‑use cups An estimated 2.5 billion single‑use cups are used in the UK every year by consumers buying coffee from chains and cafes, creating approximately 25 000 tonnes of waste. Research has found that while a 25p charge on single‑use cups increases the use of reusable coffee cups in coffee shops, a discount on reusable coffee cups has no impact at 5 all on their use. A 25p charge on single‑use cups increases the use of reusable coffee cups by 3.4%. Environmental messaging in cafes, for example posters about litter, increases the use of reusable coffee cups by 2.3%. The availability of reusable cups leads to an increase of 2.5% whereas the distribution of free reusable cups leads to a further increase of 4.3%. 10 “While the increases for individual measures were modest, the greatest behavioural change was when the measures were combined,” said Wouter Poortinga of Cardiff University. (Source adapted from: https://www.theguardian.com/environment/2017/mar/30/)
(c) With reference to Extract A, explain the likely numerical value for the income elasticity of demand for reusable cleaning products. (4)
June 2024 · AS Paper 1 · Q6(d) 6 marks AO1=2, AO2=2, AO3=2 Short answer price elasticity of demandsupply and demand
Data and extracts for question 6The market for plastic in the UK Figure 1: Trend in the purchase of single‑use plastic bags in millions, UK, 2014 to 2021 2014 2015 2016 2017 2018 2019 2020 2021 7 500 2 120 1 750 1 130 1 040 627 496 197 Extract A 10p charge continues to reduce use of plastic carrier bags The 5p charge on single‑use carrier bags was introduced in supermarkets in 2015. The charge was increased to 10p in 2021 and extended to all businesses. The UK Environment Minister said that the plastic bag charge has ended the irrational purchase of billions of single‑use carrier bags, thereby protecting our landscapes and 5 ensuring millions of pounds are redistributed to worthy causes. This was needed as without this legislation, the market is not able to effectively manage the situation. Consumers are now in the habit of bringing reusable carrier bags when shopping. In addition to single‑use carrier bag charges, major retailers have offered bottle deposit return schemes and refillable food and cleaning product options. These provide 10 incentives to consumers to reuse their plastic containers. However, retailers have suggested that most customers do not wish to pay more for cleaning products in reusable packaging. With the average household income falling by 4.3% in 2023, sales of refillable cleaning products are expected to fall from 200 000 to 130 000 this year. 15 (Source adapted from: https://www.circularonline.co.uk/news/) Extract B Plastic packaging tax Food manufacturers have criticised the implementation of a new UK environmental tax, warning it will force them to increase prices for consumers. The 2018 tax was designed to provide incentives to businesses to use recycled plastic in packaging. Businesses manufacturing or importing 10 tonnes or more a year of 5 plastic packaging that contains less than 30% recycled plastic are taxed at £200 a tonne. Plastic packaging containing more than this will be exempt from the tax. Helene Roberts, Chief Executive of Robinson Packaging, said increased prices for the consumer would be an unintended consequence of the tax. “It will just create inflationary pressures within the supply chain and firms may need to pass this on.” A wide range of 10 businesses are affected by the new tax, including retailers importing items such as bin liners, drink bottles and carrier bags. Food manufacturers are particularly impacted as the industry uses 40% of packaging in the UK. (Source adapted from: https://www.ft.com) Extract C Single‑use cups An estimated 2.5 billion single‑use cups are used in the UK every year by consumers buying coffee from chains and cafes, creating approximately 25 000 tonnes of waste. Research has found that while a 25p charge on single‑use cups increases the use of reusable coffee cups in coffee shops, a discount on reusable coffee cups has no impact at 5 all on their use. A 25p charge on single‑use cups increases the use of reusable coffee cups by 3.4%. Environmental messaging in cafes, for example posters about litter, increases the use of reusable coffee cups by 2.3%. The availability of reusable cups leads to an increase of 2.5% whereas the distribution of free reusable cups leads to a further increase of 4.3%. 10 “While the increases for individual measures were modest, the greatest behavioural change was when the measures were combined,” said Wouter Poortinga of Cardiff University. (Source adapted from: https://www.theguardian.com/environment/2017/mar/30/)
(d) With reference to Extract C, explain how incentives to use reusable coffee cups may lead to a fall in demand for single‑use cups. (6)
June 2024 · AS Paper 1 · Q6(e) 15 marks AO1=3, AO2=3, AO3=3, AO4=6 15-mark response externalities
Data and extracts for question 6The market for plastic in the UK Figure 1: Trend in the purchase of single‑use plastic bags in millions, UK, 2014 to 2021 2014 2015 2016 2017 2018 2019 2020 2021 7 500 2 120 1 750 1 130 1 040 627 496 197 Extract A 10p charge continues to reduce use of plastic carrier bags The 5p charge on single‑use carrier bags was introduced in supermarkets in 2015. The charge was increased to 10p in 2021 and extended to all businesses. The UK Environment Minister said that the plastic bag charge has ended the irrational purchase of billions of single‑use carrier bags, thereby protecting our landscapes and 5 ensuring millions of pounds are redistributed to worthy causes. This was needed as without this legislation, the market is not able to effectively manage the situation. Consumers are now in the habit of bringing reusable carrier bags when shopping. In addition to single‑use carrier bag charges, major retailers have offered bottle deposit return schemes and refillable food and cleaning product options. These provide 10 incentives to consumers to reuse their plastic containers. However, retailers have suggested that most customers do not wish to pay more for cleaning products in reusable packaging. With the average household income falling by 4.3% in 2023, sales of refillable cleaning products are expected to fall from 200 000 to 130 000 this year. 15 (Source adapted from: https://www.circularonline.co.uk/news/) Extract B Plastic packaging tax Food manufacturers have criticised the implementation of a new UK environmental tax, warning it will force them to increase prices for consumers. The 2018 tax was designed to provide incentives to businesses to use recycled plastic in packaging. Businesses manufacturing or importing 10 tonnes or more a year of 5 plastic packaging that contains less than 30% recycled plastic are taxed at £200 a tonne. Plastic packaging containing more than this will be exempt from the tax. Helene Roberts, Chief Executive of Robinson Packaging, said increased prices for the consumer would be an unintended consequence of the tax. “It will just create inflationary pressures within the supply chain and firms may need to pass this on.” A wide range of 10 businesses are affected by the new tax, including retailers importing items such as bin liners, drink bottles and carrier bags. Food manufacturers are particularly impacted as the industry uses 40% of packaging in the UK. (Source adapted from: https://www.ft.com) Extract C Single‑use cups An estimated 2.5 billion single‑use cups are used in the UK every year by consumers buying coffee from chains and cafes, creating approximately 25 000 tonnes of waste. Research has found that while a 25p charge on single‑use cups increases the use of reusable coffee cups in coffee shops, a discount on reusable coffee cups has no impact at 5 all on their use. A 25p charge on single‑use cups increases the use of reusable coffee cups by 3.4%. Environmental messaging in cafes, for example posters about litter, increases the use of reusable coffee cups by 2.3%. The availability of reusable cups leads to an increase of 2.5% whereas the distribution of free reusable cups leads to a further increase of 4.3%. 10 “While the increases for individual measures were modest, the greatest behavioural change was when the measures were combined,” said Wouter Poortinga of Cardiff University. (Source adapted from: https://www.theguardian.com/environment/2017/mar/30/)
(e) Discuss the likely private costs and external costs of the production of plastic. (15)
June 2024 · AS Paper 1 · Q6(f) 20 marks AO1=4, AO2=4, AO3=6, AO4=6 20-mark essay Either/or Hard government intervention in marketsindirect taxes and subsidies
Data and extracts for question 6The market for plastic in the UK Figure 1: Trend in the purchase of single‑use plastic bags in millions, UK, 2014 to 2021 2014 2015 2016 2017 2018 2019 2020 2021 7 500 2 120 1 750 1 130 1 040 627 496 197 Extract A 10p charge continues to reduce use of plastic carrier bags The 5p charge on single‑use carrier bags was introduced in supermarkets in 2015. The charge was increased to 10p in 2021 and extended to all businesses. The UK Environment Minister said that the plastic bag charge has ended the irrational purchase of billions of single‑use carrier bags, thereby protecting our landscapes and 5 ensuring millions of pounds are redistributed to worthy causes. This was needed as without this legislation, the market is not able to effectively manage the situation. Consumers are now in the habit of bringing reusable carrier bags when shopping. In addition to single‑use carrier bag charges, major retailers have offered bottle deposit return schemes and refillable food and cleaning product options. These provide 10 incentives to consumers to reuse their plastic containers. However, retailers have suggested that most customers do not wish to pay more for cleaning products in reusable packaging. With the average household income falling by 4.3% in 2023, sales of refillable cleaning products are expected to fall from 200 000 to 130 000 this year. 15 (Source adapted from: https://www.circularonline.co.uk/news/) Extract B Plastic packaging tax Food manufacturers have criticised the implementation of a new UK environmental tax, warning it will force them to increase prices for consumers. The 2018 tax was designed to provide incentives to businesses to use recycled plastic in packaging. Businesses manufacturing or importing 10 tonnes or more a year of 5 plastic packaging that contains less than 30% recycled plastic are taxed at £200 a tonne. Plastic packaging containing more than this will be exempt from the tax. Helene Roberts, Chief Executive of Robinson Packaging, said increased prices for the consumer would be an unintended consequence of the tax. “It will just create inflationary pressures within the supply chain and firms may need to pass this on.” A wide range of 10 businesses are affected by the new tax, including retailers importing items such as bin liners, drink bottles and carrier bags. Food manufacturers are particularly impacted as the industry uses 40% of packaging in the UK. (Source adapted from: https://www.ft.com) Extract C Single‑use cups An estimated 2.5 billion single‑use cups are used in the UK every year by consumers buying coffee from chains and cafes, creating approximately 25 000 tonnes of waste. Research has found that while a 25p charge on single‑use cups increases the use of reusable coffee cups in coffee shops, a discount on reusable coffee cups has no impact at 5 all on their use. A 25p charge on single‑use cups increases the use of reusable coffee cups by 3.4%. Environmental messaging in cafes, for example posters about litter, increases the use of reusable coffee cups by 2.3%. The availability of reusable cups leads to an increase of 2.5% whereas the distribution of free reusable cups leads to a further increase of 4.3%. 10 “While the increases for individual measures were modest, the greatest behavioural change was when the measures were combined,” said Wouter Poortinga of Cardiff University. (Source adapted from: https://www.theguardian.com/environment/2017/mar/30/)
(f) Evaluate the likely impact of a tax on plastic food-packaging. Use a diagram to support your answer. (20)
June 2024 · AS Paper 1 · Q6(g) 20 marks AO1=4, AO2=4, AO3=6, AO4=6 20-mark essay Either/or government intervention in marketsgovernment failure
Data and extracts for question 6The market for plastic in the UK Figure 1: Trend in the purchase of single‑use plastic bags in millions, UK, 2014 to 2021 2014 2015 2016 2017 2018 2019 2020 2021 7 500 2 120 1 750 1 130 1 040 627 496 197 Extract A 10p charge continues to reduce use of plastic carrier bags The 5p charge on single‑use carrier bags was introduced in supermarkets in 2015. The charge was increased to 10p in 2021 and extended to all businesses. The UK Environment Minister said that the plastic bag charge has ended the irrational purchase of billions of single‑use carrier bags, thereby protecting our landscapes and 5 ensuring millions of pounds are redistributed to worthy causes. This was needed as without this legislation, the market is not able to effectively manage the situation. Consumers are now in the habit of bringing reusable carrier bags when shopping. In addition to single‑use carrier bag charges, major retailers have offered bottle deposit return schemes and refillable food and cleaning product options. These provide 10 incentives to consumers to reuse their plastic containers. However, retailers have suggested that most customers do not wish to pay more for cleaning products in reusable packaging. With the average household income falling by 4.3% in 2023, sales of refillable cleaning products are expected to fall from 200 000 to 130 000 this year. 15 (Source adapted from: https://www.circularonline.co.uk/news/) Extract B Plastic packaging tax Food manufacturers have criticised the implementation of a new UK environmental tax, warning it will force them to increase prices for consumers. The 2018 tax was designed to provide incentives to businesses to use recycled plastic in packaging. Businesses manufacturing or importing 10 tonnes or more a year of 5 plastic packaging that contains less than 30% recycled plastic are taxed at £200 a tonne. Plastic packaging containing more than this will be exempt from the tax. Helene Roberts, Chief Executive of Robinson Packaging, said increased prices for the consumer would be an unintended consequence of the tax. “It will just create inflationary pressures within the supply chain and firms may need to pass this on.” A wide range of 10 businesses are affected by the new tax, including retailers importing items such as bin liners, drink bottles and carrier bags. Food manufacturers are particularly impacted as the industry uses 40% of packaging in the UK. (Source adapted from: https://www.ft.com) Extract C Single‑use cups An estimated 2.5 billion single‑use cups are used in the UK every year by consumers buying coffee from chains and cafes, creating approximately 25 000 tonnes of waste. Research has found that while a 25p charge on single‑use cups increases the use of reusable coffee cups in coffee shops, a discount on reusable coffee cups has no impact at 5 all on their use. A 25p charge on single‑use cups increases the use of reusable coffee cups by 3.4%. Environmental messaging in cafes, for example posters about litter, increases the use of reusable coffee cups by 2.3%. The availability of reusable cups leads to an increase of 2.5% whereas the distribution of free reusable cups leads to a further increase of 4.3%. 10 “While the increases for individual measures were modest, the greatest behavioural change was when the measures were combined,” said Wouter Poortinga of Cardiff University. (Source adapted from: https://www.theguardian.com/environment/2017/mar/30/)
(g) Evaluate methods of government intervention which could be used to reduce the market failure associated with plastic waste. Use a diagram to support your answer. (20)
June 2024 · AS Paper 2 · Q1(b) 3 marks AO1=1, AO2=1, AO3=1 Short answer measuring economic growth
Data and extracts for question 11 In 2019 the average annual percentage increase in real Gross Domestic Product (GDP) was 1.7% in developed countries and it was 4.6% in developing countries. (Source: adapted from IMF, World Economic Outlook 2019)
(b) Explain one limitation of using GDP data to compare living standards between developed and developing countries. (3)
June 2024 · AS Paper 2 · Q3(b) 3 marks AO1=1, AO2=1, AO3=1 Short answer Hard unemployment
Data and extracts for question 33 The graph below shows UK long-term migration trends, September 2013 to September 2019. Immigration refers to the number of people entering the country to live there and emigration refers to the number of people leaving the country. 700 600 Immigration 500 Emigration 400 Thousands 300 200 Net migration 100 EU referendum (June 2016) 0 Sep 13 Sep 14 Sep 15 Sep 16 Sep 17 Sep 18 Sep 19 (Source: adapted from https://www.ons.gov.uk)
(b) With reference to the above chart, explain one likely effect of migration on employment in the UK. (3)
June 2024 · AS Paper 2 · Q5(b) 2 marks AO2=2 Calculation fiscal and monetary policy
Data and extracts for question 55 The table below shows the UK’s budget deficit between March 2016 and March 2019. Year Budget deficit (£ billion) 2016 83.6 2017 56.3 2018 56.0 2019 38.7 (Source: adapted from https://www.ons.gov.uk/economy/ governmentpublicsectorandtaxes/publicspending/bulletins/ ukgovernmentdebtanddeficitforeurostatmaast/september2019)
(b) Using the above table, calculate the percentage decrease in budget deficit between March 2016 and March 2019. You are advised to show your working. (2)
June 2024 · AS Paper 2 · Q6(a) 4 marks AO1=2, AO2=2 Short answer inflation
Data and extracts for question 6UK monetary policy since the Global Financial Crisis of 2008 Figure 1: UK inflation rate (as measured by the Consumer Prices Index) and UK nominal wage growth, annual percentage change, 2008 to 2019 5 % 4 Nominal wage growth 3 Inflation rate 2 1 0 –1 ‘08 ‘09 ‘10 ‘11 ‘12 ‘13 ‘14 ‘15 ‘16 ‘17 ‘18 ‘19 (Source: adapted from ONS) Figure 2: UK real GDP, annual percentage change, Q4 2006 to Q4 2019 2 % 1 0 -1 -2 -3 -4 Q4 Q4 Q4 Q4 Q4 Q4 Q4 2006 2008 2010 2012 2014 2016 2018 (Source: adapted from https://www.ons.gov.uk/economy/ grossdomesticproductgdp/timeseries/ihyq/qna) Extract A Has monetary policy worked? Between 2008 and 2009, financial markets around the world were crashing and many UK banks were adversely affected by the collapse of the housing market. This reduced access to credit for UK households and businesses. Faced with these large risks, the Monetary Policy Committee (MPC) of the Bank of 5 England reduced the base interest rate from 5.25% in February 2008 to 0.5% in March 2009. The MPC had known that reducing the base interest rate was not enough alone. It drafted the use of a new idea: quantitative easing (QE). It had bought assets worth £200 billion by November 2009. This QE was later implemented by the USA’s Federal 10 Reserve, and was claimed to be a success. In July 2012 the total spent on QE in the UK amounted to £375 billion. This decision has been credited with preventing the recession, caused by the Global Financial Crisis of 2008, turning into another Great Depression. The UK’s unemployment rate peaked at 8.5% in 2009 but had fallen to 4% in 2019, the lowest since the mid-1970s. 15 In 2016 the MPC further expanded its QE programme by £60 billion and reduced the base interest rate to 0.25%. Households with mortgages benefitted from the low interest rate, enabling them to continue consumption and therefore helping economic recovery. Nevertheless, this has resulted in a rise in household debts. Borrowing on credit cards and personal loans has increased above the levels seen before 2008. 20 Inflation caused by the fall in the exchange rate of the British pound, higher employment levels and nominal wage growth has since directed the MPC to increase base interest rates. It increased the base interest rate to 0.5% in November 2017, and then to 0.75% in March 2018. However, the uncertainty around the UK’s future trade relationship with the EU has meant that increases in the base interest rate were only marginal. 25 Many economists believe that if the UK and the EU are unable to form a trade agreement, base interest rates would need to be decreased again and QE expanded. Conversely, a few economists have argued that QE is no longer effective as a monetary policy instrument. They indicated that the base interest rate was usually reduced by as much as 5% during previous recessions. This is more than the UK can currently manage. Therefore 30 it would also require the government to implement a fiscal policy to deal with any future economic downturn. The Bank of England is, nonetheless, preparing for the worst-case scenario of a recession deeper than the downturn after the Global Financial Crisis of 2008. (Source: adapted from ‘The verdict on 10 years of quantitative easing’, Richard Partington, The Guardian, https://www.theguardian.com/business/2019/ mar/08/the-verdict-on-10-years-of-quantitative-easing)
(a) With reference to Figure 1, explain the term ‘inflation rate’. (4)
June 2024 · AS Paper 2 · Q6(b) 10 marks AO1=2, AO2=2, AO3=2, AO4=4 10-mark response national income and the multiplieraggregate demand
Data and extracts for question 6UK monetary policy since the Global Financial Crisis of 2008 Figure 1: UK inflation rate (as measured by the Consumer Prices Index) and UK nominal wage growth, annual percentage change, 2008 to 2019 5 % 4 Nominal wage growth 3 Inflation rate 2 1 0 –1 ‘08 ‘09 ‘10 ‘11 ‘12 ‘13 ‘14 ‘15 ‘16 ‘17 ‘18 ‘19 (Source: adapted from ONS) Figure 2: UK real GDP, annual percentage change, Q4 2006 to Q4 2019 2 % 1 0 -1 -2 -3 -4 Q4 Q4 Q4 Q4 Q4 Q4 Q4 2006 2008 2010 2012 2014 2016 2018 (Source: adapted from https://www.ons.gov.uk/economy/ grossdomesticproductgdp/timeseries/ihyq/qna) Extract A Has monetary policy worked? Between 2008 and 2009, financial markets around the world were crashing and many UK banks were adversely affected by the collapse of the housing market. This reduced access to credit for UK households and businesses. Faced with these large risks, the Monetary Policy Committee (MPC) of the Bank of 5 England reduced the base interest rate from 5.25% in February 2008 to 0.5% in March 2009. The MPC had known that reducing the base interest rate was not enough alone. It drafted the use of a new idea: quantitative easing (QE). It had bought assets worth £200 billion by November 2009. This QE was later implemented by the USA’s Federal 10 Reserve, and was claimed to be a success. In July 2012 the total spent on QE in the UK amounted to £375 billion. This decision has been credited with preventing the recession, caused by the Global Financial Crisis of 2008, turning into another Great Depression. The UK’s unemployment rate peaked at 8.5% in 2009 but had fallen to 4% in 2019, the lowest since the mid-1970s. 15 In 2016 the MPC further expanded its QE programme by £60 billion and reduced the base interest rate to 0.25%. Households with mortgages benefitted from the low interest rate, enabling them to continue consumption and therefore helping economic recovery. Nevertheless, this has resulted in a rise in household debts. Borrowing on credit cards and personal loans has increased above the levels seen before 2008. 20 Inflation caused by the fall in the exchange rate of the British pound, higher employment levels and nominal wage growth has since directed the MPC to increase base interest rates. It increased the base interest rate to 0.5% in November 2017, and then to 0.75% in March 2018. However, the uncertainty around the UK’s future trade relationship with the EU has meant that increases in the base interest rate were only marginal. 25 Many economists believe that if the UK and the EU are unable to form a trade agreement, base interest rates would need to be decreased again and QE expanded. Conversely, a few economists have argued that QE is no longer effective as a monetary policy instrument. They indicated that the base interest rate was usually reduced by as much as 5% during previous recessions. This is more than the UK can currently manage. Therefore 30 it would also require the government to implement a fiscal policy to deal with any future economic downturn. The Bank of England is, nonetheless, preparing for the worst-case scenario of a recession deeper than the downturn after the Global Financial Crisis of 2008. (Source: adapted from ‘The verdict on 10 years of quantitative easing’, Richard Partington, The Guardian, https://www.theguardian.com/business/2019/ mar/08/the-verdict-on-10-years-of-quantitative-easing)
(b) Assess the likely impact of an increase in real wages on the UK economy. Use an aggregate demand and aggregate supply diagram in your answer. (10)
June 2024 · AS Paper 2 · Q6(c) 6 marks AO1=2, AO2=2, AO3=2 Short answer economic growth and the trade cycle
Data and extracts for question 6UK monetary policy since the Global Financial Crisis of 2008 Figure 1: UK inflation rate (as measured by the Consumer Prices Index) and UK nominal wage growth, annual percentage change, 2008 to 2019 5 % 4 Nominal wage growth 3 Inflation rate 2 1 0 –1 ‘08 ‘09 ‘10 ‘11 ‘12 ‘13 ‘14 ‘15 ‘16 ‘17 ‘18 ‘19 (Source: adapted from ONS) Figure 2: UK real GDP, annual percentage change, Q4 2006 to Q4 2019 2 % 1 0 -1 -2 -3 -4 Q4 Q4 Q4 Q4 Q4 Q4 Q4 2006 2008 2010 2012 2014 2016 2018 (Source: adapted from https://www.ons.gov.uk/economy/ grossdomesticproductgdp/timeseries/ihyq/qna) Extract A Has monetary policy worked? Between 2008 and 2009, financial markets around the world were crashing and many UK banks were adversely affected by the collapse of the housing market. This reduced access to credit for UK households and businesses. Faced with these large risks, the Monetary Policy Committee (MPC) of the Bank of 5 England reduced the base interest rate from 5.25% in February 2008 to 0.5% in March 2009. The MPC had known that reducing the base interest rate was not enough alone. It drafted the use of a new idea: quantitative easing (QE). It had bought assets worth £200 billion by November 2009. This QE was later implemented by the USA’s Federal 10 Reserve, and was claimed to be a success. In July 2012 the total spent on QE in the UK amounted to £375 billion. This decision has been credited with preventing the recession, caused by the Global Financial Crisis of 2008, turning into another Great Depression. The UK’s unemployment rate peaked at 8.5% in 2009 but had fallen to 4% in 2019, the lowest since the mid-1970s. 15 In 2016 the MPC further expanded its QE programme by £60 billion and reduced the base interest rate to 0.25%. Households with mortgages benefitted from the low interest rate, enabling them to continue consumption and therefore helping economic recovery. Nevertheless, this has resulted in a rise in household debts. Borrowing on credit cards and personal loans has increased above the levels seen before 2008. 20 Inflation caused by the fall in the exchange rate of the British pound, higher employment levels and nominal wage growth has since directed the MPC to increase base interest rates. It increased the base interest rate to 0.5% in November 2017, and then to 0.75% in March 2018. However, the uncertainty around the UK’s future trade relationship with the EU has meant that increases in the base interest rate were only marginal. 25 Many economists believe that if the UK and the EU are unable to form a trade agreement, base interest rates would need to be decreased again and QE expanded. Conversely, a few economists have argued that QE is no longer effective as a monetary policy instrument. They indicated that the base interest rate was usually reduced by as much as 5% during previous recessions. This is more than the UK can currently manage. Therefore 30 it would also require the government to implement a fiscal policy to deal with any future economic downturn. The Bank of England is, nonetheless, preparing for the worst-case scenario of a recession deeper than the downturn after the Global Financial Crisis of 2008. (Source: adapted from ‘The verdict on 10 years of quantitative easing’, Richard Partington, The Guardian, https://www.theguardian.com/business/2019/ mar/08/the-verdict-on-10-years-of-quantitative-easing)
(c) With reference to the information provided, explain two characteristics of a recession. (6)
June 2024 · AS Paper 2 · Q6(d) 5 marks AO1=1, AO2=2, AO3=2 Short answer inflationaggregate supply
Data and extracts for question 6UK monetary policy since the Global Financial Crisis of 2008 Figure 1: UK inflation rate (as measured by the Consumer Prices Index) and UK nominal wage growth, annual percentage change, 2008 to 2019 5 % 4 Nominal wage growth 3 Inflation rate 2 1 0 –1 ‘08 ‘09 ‘10 ‘11 ‘12 ‘13 ‘14 ‘15 ‘16 ‘17 ‘18 ‘19 (Source: adapted from ONS) Figure 2: UK real GDP, annual percentage change, Q4 2006 to Q4 2019 2 % 1 0 -1 -2 -3 -4 Q4 Q4 Q4 Q4 Q4 Q4 Q4 2006 2008 2010 2012 2014 2016 2018 (Source: adapted from https://www.ons.gov.uk/economy/ grossdomesticproductgdp/timeseries/ihyq/qna) Extract A Has monetary policy worked? Between 2008 and 2009, financial markets around the world were crashing and many UK banks were adversely affected by the collapse of the housing market. This reduced access to credit for UK households and businesses. Faced with these large risks, the Monetary Policy Committee (MPC) of the Bank of 5 England reduced the base interest rate from 5.25% in February 2008 to 0.5% in March 2009. The MPC had known that reducing the base interest rate was not enough alone. It drafted the use of a new idea: quantitative easing (QE). It had bought assets worth £200 billion by November 2009. This QE was later implemented by the USA’s Federal 10 Reserve, and was claimed to be a success. In July 2012 the total spent on QE in the UK amounted to £375 billion. This decision has been credited with preventing the recession, caused by the Global Financial Crisis of 2008, turning into another Great Depression. The UK’s unemployment rate peaked at 8.5% in 2009 but had fallen to 4% in 2019, the lowest since the mid-1970s. 15 In 2016 the MPC further expanded its QE programme by £60 billion and reduced the base interest rate to 0.25%. Households with mortgages benefitted from the low interest rate, enabling them to continue consumption and therefore helping economic recovery. Nevertheless, this has resulted in a rise in household debts. Borrowing on credit cards and personal loans has increased above the levels seen before 2008. 20 Inflation caused by the fall in the exchange rate of the British pound, higher employment levels and nominal wage growth has since directed the MPC to increase base interest rates. It increased the base interest rate to 0.5% in November 2017, and then to 0.75% in March 2018. However, the uncertainty around the UK’s future trade relationship with the EU has meant that increases in the base interest rate were only marginal. 25 Many economists believe that if the UK and the EU are unable to form a trade agreement, base interest rates would need to be decreased again and QE expanded. Conversely, a few economists have argued that QE is no longer effective as a monetary policy instrument. They indicated that the base interest rate was usually reduced by as much as 5% during previous recessions. This is more than the UK can currently manage. Therefore 30 it would also require the government to implement a fiscal policy to deal with any future economic downturn. The Bank of England is, nonetheless, preparing for the worst-case scenario of a recession deeper than the downturn after the Global Financial Crisis of 2008. (Source: adapted from ‘The verdict on 10 years of quantitative easing’, Richard Partington, The Guardian, https://www.theguardian.com/business/2019/ mar/08/the-verdict-on-10-years-of-quantitative-easing)
(d) Explain one reason why ‘the fall in the exchange rate of the British pound’ (Extract A, line 21) is likely to increase inflation. (5)
June 2024 · AS Paper 2 · Q6(e) 15 marks AO1=3, AO2=3, AO3=3, AO4=6 15-mark response Hard fiscal and monetary policy
Data and extracts for question 6UK monetary policy since the Global Financial Crisis of 2008 Figure 1: UK inflation rate (as measured by the Consumer Prices Index) and UK nominal wage growth, annual percentage change, 2008 to 2019 5 % 4 Nominal wage growth 3 Inflation rate 2 1 0 –1 ‘08 ‘09 ‘10 ‘11 ‘12 ‘13 ‘14 ‘15 ‘16 ‘17 ‘18 ‘19 (Source: adapted from ONS) Figure 2: UK real GDP, annual percentage change, Q4 2006 to Q4 2019 2 % 1 0 -1 -2 -3 -4 Q4 Q4 Q4 Q4 Q4 Q4 Q4 2006 2008 2010 2012 2014 2016 2018 (Source: adapted from https://www.ons.gov.uk/economy/ grossdomesticproductgdp/timeseries/ihyq/qna) Extract A Has monetary policy worked? Between 2008 and 2009, financial markets around the world were crashing and many UK banks were adversely affected by the collapse of the housing market. This reduced access to credit for UK households and businesses. Faced with these large risks, the Monetary Policy Committee (MPC) of the Bank of 5 England reduced the base interest rate from 5.25% in February 2008 to 0.5% in March 2009. The MPC had known that reducing the base interest rate was not enough alone. It drafted the use of a new idea: quantitative easing (QE). It had bought assets worth £200 billion by November 2009. This QE was later implemented by the USA’s Federal 10 Reserve, and was claimed to be a success. In July 2012 the total spent on QE in the UK amounted to £375 billion. This decision has been credited with preventing the recession, caused by the Global Financial Crisis of 2008, turning into another Great Depression. The UK’s unemployment rate peaked at 8.5% in 2009 but had fallen to 4% in 2019, the lowest since the mid-1970s. 15 In 2016 the MPC further expanded its QE programme by £60 billion and reduced the base interest rate to 0.25%. Households with mortgages benefitted from the low interest rate, enabling them to continue consumption and therefore helping economic recovery. Nevertheless, this has resulted in a rise in household debts. Borrowing on credit cards and personal loans has increased above the levels seen before 2008. 20 Inflation caused by the fall in the exchange rate of the British pound, higher employment levels and nominal wage growth has since directed the MPC to increase base interest rates. It increased the base interest rate to 0.5% in November 2017, and then to 0.75% in March 2018. However, the uncertainty around the UK’s future trade relationship with the EU has meant that increases in the base interest rate were only marginal. 25 Many economists believe that if the UK and the EU are unable to form a trade agreement, base interest rates would need to be decreased again and QE expanded. Conversely, a few economists have argued that QE is no longer effective as a monetary policy instrument. They indicated that the base interest rate was usually reduced by as much as 5% during previous recessions. This is more than the UK can currently manage. Therefore 30 it would also require the government to implement a fiscal policy to deal with any future economic downturn. The Bank of England is, nonetheless, preparing for the worst-case scenario of a recession deeper than the downturn after the Global Financial Crisis of 2008. (Source: adapted from ‘The verdict on 10 years of quantitative easing’, Richard Partington, The Guardian, https://www.theguardian.com/business/2019/ mar/08/the-verdict-on-10-years-of-quantitative-easing)
(e) Discuss factors, apart from changes in real wages, which the MPC may have considered when changing the base interest rate. (15)
June 2024 · AS Paper 2 · Q6(f) 20 marks AO1=4, AO2=4, AO3=6, AO4=6 20-mark essay Either/or macroeconomic objectivesfiscal and monetary policy
Data and extracts for question 6UK monetary policy since the Global Financial Crisis of 2008 Figure 1: UK inflation rate (as measured by the Consumer Prices Index) and UK nominal wage growth, annual percentage change, 2008 to 2019 5 % 4 Nominal wage growth 3 Inflation rate 2 1 0 –1 ‘08 ‘09 ‘10 ‘11 ‘12 ‘13 ‘14 ‘15 ‘16 ‘17 ‘18 ‘19 (Source: adapted from ONS) Figure 2: UK real GDP, annual percentage change, Q4 2006 to Q4 2019 2 % 1 0 -1 -2 -3 -4 Q4 Q4 Q4 Q4 Q4 Q4 Q4 2006 2008 2010 2012 2014 2016 2018 (Source: adapted from https://www.ons.gov.uk/economy/ grossdomesticproductgdp/timeseries/ihyq/qna) Extract A Has monetary policy worked? Between 2008 and 2009, financial markets around the world were crashing and many UK banks were adversely affected by the collapse of the housing market. This reduced access to credit for UK households and businesses. Faced with these large risks, the Monetary Policy Committee (MPC) of the Bank of 5 England reduced the base interest rate from 5.25% in February 2008 to 0.5% in March 2009. The MPC had known that reducing the base interest rate was not enough alone. It drafted the use of a new idea: quantitative easing (QE). It had bought assets worth £200 billion by November 2009. This QE was later implemented by the USA’s Federal 10 Reserve, and was claimed to be a success. In July 2012 the total spent on QE in the UK amounted to £375 billion. This decision has been credited with preventing the recession, caused by the Global Financial Crisis of 2008, turning into another Great Depression. The UK’s unemployment rate peaked at 8.5% in 2009 but had fallen to 4% in 2019, the lowest since the mid-1970s. 15 In 2016 the MPC further expanded its QE programme by £60 billion and reduced the base interest rate to 0.25%. Households with mortgages benefitted from the low interest rate, enabling them to continue consumption and therefore helping economic recovery. Nevertheless, this has resulted in a rise in household debts. Borrowing on credit cards and personal loans has increased above the levels seen before 2008. 20 Inflation caused by the fall in the exchange rate of the British pound, higher employment levels and nominal wage growth has since directed the MPC to increase base interest rates. It increased the base interest rate to 0.5% in November 2017, and then to 0.75% in March 2018. However, the uncertainty around the UK’s future trade relationship with the EU has meant that increases in the base interest rate were only marginal. 25 Many economists believe that if the UK and the EU are unable to form a trade agreement, base interest rates would need to be decreased again and QE expanded. Conversely, a few economists have argued that QE is no longer effective as a monetary policy instrument. They indicated that the base interest rate was usually reduced by as much as 5% during previous recessions. This is more than the UK can currently manage. Therefore 30 it would also require the government to implement a fiscal policy to deal with any future economic downturn. The Bank of England is, nonetheless, preparing for the worst-case scenario of a recession deeper than the downturn after the Global Financial Crisis of 2008. (Source: adapted from ‘The verdict on 10 years of quantitative easing’, Richard Partington, The Guardian, https://www.theguardian.com/business/2019/ mar/08/the-verdict-on-10-years-of-quantitative-easing)
(f) Evaluate whether expansionary demand-side policies lead to conflicts between macroeconomic objectives. (20)
June 2024 · AS Paper 2 · Q6(g) 20 marks AO1=4, AO2=4, AO3=6, AO4=6 20-mark essay Either/or fiscal and monetary policymacroeconomic objectives
Data and extracts for question 6UK monetary policy since the Global Financial Crisis of 2008 Figure 1: UK inflation rate (as measured by the Consumer Prices Index) and UK nominal wage growth, annual percentage change, 2008 to 2019 5 % 4 Nominal wage growth 3 Inflation rate 2 1 0 –1 ‘08 ‘09 ‘10 ‘11 ‘12 ‘13 ‘14 ‘15 ‘16 ‘17 ‘18 ‘19 (Source: adapted from ONS) Figure 2: UK real GDP, annual percentage change, Q4 2006 to Q4 2019 2 % 1 0 -1 -2 -3 -4 Q4 Q4 Q4 Q4 Q4 Q4 Q4 2006 2008 2010 2012 2014 2016 2018 (Source: adapted from https://www.ons.gov.uk/economy/ grossdomesticproductgdp/timeseries/ihyq/qna) Extract A Has monetary policy worked? Between 2008 and 2009, financial markets around the world were crashing and many UK banks were adversely affected by the collapse of the housing market. This reduced access to credit for UK households and businesses. Faced with these large risks, the Monetary Policy Committee (MPC) of the Bank of 5 England reduced the base interest rate from 5.25% in February 2008 to 0.5% in March 2009. The MPC had known that reducing the base interest rate was not enough alone. It drafted the use of a new idea: quantitative easing (QE). It had bought assets worth £200 billion by November 2009. This QE was later implemented by the USA’s Federal 10 Reserve, and was claimed to be a success. In July 2012 the total spent on QE in the UK amounted to £375 billion. This decision has been credited with preventing the recession, caused by the Global Financial Crisis of 2008, turning into another Great Depression. The UK’s unemployment rate peaked at 8.5% in 2009 but had fallen to 4% in 2019, the lowest since the mid-1970s. 15 In 2016 the MPC further expanded its QE programme by £60 billion and reduced the base interest rate to 0.25%. Households with mortgages benefitted from the low interest rate, enabling them to continue consumption and therefore helping economic recovery. Nevertheless, this has resulted in a rise in household debts. Borrowing on credit cards and personal loans has increased above the levels seen before 2008. 20 Inflation caused by the fall in the exchange rate of the British pound, higher employment levels and nominal wage growth has since directed the MPC to increase base interest rates. It increased the base interest rate to 0.5% in November 2017, and then to 0.75% in March 2018. However, the uncertainty around the UK’s future trade relationship with the EU has meant that increases in the base interest rate were only marginal. 25 Many economists believe that if the UK and the EU are unable to form a trade agreement, base interest rates would need to be decreased again and QE expanded. Conversely, a few economists have argued that QE is no longer effective as a monetary policy instrument. They indicated that the base interest rate was usually reduced by as much as 5% during previous recessions. This is more than the UK can currently manage. Therefore 30 it would also require the government to implement a fiscal policy to deal with any future economic downturn. The Bank of England is, nonetheless, preparing for the worst-case scenario of a recession deeper than the downturn after the Global Financial Crisis of 2008. (Source: adapted from ‘The verdict on 10 years of quantitative easing’, Richard Partington, The Guardian, https://www.theguardian.com/business/2019/ mar/08/the-verdict-on-10-years-of-quantitative-easing)
(g) Evaluate whether the MPC has been successful in meeting the UK’s macroeconomic objectives between 2008 and 2019. (20)
June 2024 · Paper 1 · Q1(a) 4 marks AO1=2, AO2=1, AO3=1 Short answer price elasticity of demand
Data and extracts for question 11 The table below shows price elasticity of demand for bus tickets in London 2021 Age Price elasticity of demand 18+ Student -0.7 Adult -0.4 (Source adapted from: https://assets.publishing.service.gov.uk/government/uploads/ system/uploads/attachment_data/file/669090/youth-travel-concessions-price-elasticity.pdf and https://tfl.gov.uk/fares/find-fares/bus-and-tram-fares#on-this-page-4)
(a) Explain one likely reason for the difference in the price elasticity of demand for the 18+ student bus ticket and the adult bus ticket. (4)
June 2024 · Paper 1 · Q2(a) 4 marks AO1=2, AO2=1, AO3=1 Short answer elasticity of supply
Data and extracts for question 22 The table below shows price elasticity of supply for housing in the US in 2020. US State Price elasticity of supply New York +0.5 Texas +1.8 (Source adapted from: https://bankunderground.co.uk/2020/02/25/ the-declining-elasticity-of-us-housing-supply/)
(a) With reference to the data above, explain one likely reason for the difference in the price elasticity of supply. (4)
June 2024 · Paper 1 · Q4(a) 4 marks AO1=2, AO2=1, AO3=1 Short answer government intervention in markets
Data and extracts for question 44 In 2022 the government announced that the maximum undergraduate tuition fee for universities in England will remain at £9 250 per year for the next two years. (Source adapted from: https://questions-statements.parliament.uk/ written-statements/detail/2021-10-21/HCWS339)
(a) Explain one likely reason for the maximum price for an undergraduate university programme. (4)
June 2024 · Paper 1 · Q5(a) 4 marks AO1=2, AO2=1, AO3=1 Calculation oligopoly
Data and extracts for question 55 The graph below shows the largest mortgage lenders in the United Kingdom (UK) in 2020, by market share. 24.9% 25 % 19.5% 20 15 12.7% 11.1% 10.9% 9.8% 10 7.2% 5 3.9% 0 (Source adapted from: https://www.statista.com/statistics/727348/ uk-banks-gross-lending-market-share/)
(a) With reference to the information on the preceding page, explain the market structure of mortgage lending in the UK. (4)
June 2024 · Paper 1 · Q6(a) 5 marks AO1=1, AO2=1, AO3=3 Diagram supply and demand
Data and extracts for question 6The electronics industry Extract A Rising prices of electronics devices Computer chips act as the “brain” in all electronic devices. Makers of electronic devices face significant increases in the price of computer chips as they try to source enough components, including games consoles, computers and smartphones. The price of some computer chips has jumped from $0.20 each to more than $1. The prices of electronic 5 devices have risen for a range of reasons, including higher material costs and the growing popularity of home entertainment. (Source: adapted from https://www.ft.com/content/8c718a74- cd95-4b2d-ac0e-de0682e4e3cd) Extract B Labour shortages in the electronics industry Every year, highly skilled and experienced employees in the electronics industry retire. The current tight labour market has made an already difficult problem of hiring suitable engineering and computing graduates worse, especially since the nature of the industry is becoming increasingly technical. As production becomes 5 more automated, electronics jobs are more likely to require problem solving and analysis than just assembling skills. However, artificial intelligence and other new technologies can help fill some of the skills gap. In addition, by giving hazardous, repetitive, grimy work to robots, human beings can focus on more creative, analytic tasks. 10 (Source: adapted from https://www.ericsson.com/en/blog/2021/12/ manufacturing-problems-that-keep-ceos-awake-at-night) Extract C Serious concerns over merger The Competition and Markets Authority (CMA) has said the takeover of the Cambridge- based computer chip designer Arm by its US rival Nvidia raises serious competition concerns. It has launched an in-depth investigation into the £29.5 billion deal. The CMA said the merger could reduce choice for firms reliant on computer chips, pushing 5 up prices of products including cars, games consoles and mobile phones. In addition, severe global shortages of computer chips has disrupted the manufacture of a range of electronic goods pushing up costs for firms. Despite this, large electronics firms benefit from economies of scale and are able to finance high-risk innovation and global advertising. 10 (Source adapted from: https://www.theguardian.com/ business/2021/aug/20/watchdog-expresses-concerns- over-nvidias-takeover-of-uk-chip-designer-arm ) Extract D The growing problem of electronic waste Electronic waste is the fastest growing element of the world’s household waste problem. The problem in the UK is particularly bad. The country produces 24.9 kg a person a year – nearly 10 kg more than the EU average. In 2018, 1.2 million tonnes of electrical devices were sold in the UK, and 500 000 tonnes made it to recycling centres. Some appliances 5 are more likely to be recycled than others. The recycling rate for big appliances, such as fridges and cookers, is about 80%. Of small appliances, barely one in five makes it to the recycling centre. As items such as toasters, hairdryers and headphones fit into household bins, they are not often taken to a recycling centre. This causes many problems, such as hazardous substances contaminating soil, water pollution and other external costs. 10 Policy makers have a long list of options to combat this problem including stricter regulation, environmental education, taxation and financial incentives. In some countries, for example, household rubbish is weighed and recycling initiatives are subsidised. (Source adapted from: https://www.ft.com/content/26e1aa74- 2261-11ea-92da-f0c92e957a96)
(a) With reference to Extract A, explain the likely reasons for the change in price of electronic devices. Include a supply and demand diagram in your answer. (5)
June 2024 · Paper 1 · Q6(b) 8 marks AO1=2, AO2=2, AO3=2, AO4=2 8-mark response labour market
Data and extracts for question 6The electronics industry Extract A Rising prices of electronics devices Computer chips act as the “brain” in all electronic devices. Makers of electronic devices face significant increases in the price of computer chips as they try to source enough components, including games consoles, computers and smartphones. The price of some computer chips has jumped from $0.20 each to more than $1. The prices of electronic 5 devices have risen for a range of reasons, including higher material costs and the growing popularity of home entertainment. (Source: adapted from https://www.ft.com/content/8c718a74- cd95-4b2d-ac0e-de0682e4e3cd) Extract B Labour shortages in the electronics industry Every year, highly skilled and experienced employees in the electronics industry retire. The current tight labour market has made an already difficult problem of hiring suitable engineering and computing graduates worse, especially since the nature of the industry is becoming increasingly technical. As production becomes 5 more automated, electronics jobs are more likely to require problem solving and analysis than just assembling skills. However, artificial intelligence and other new technologies can help fill some of the skills gap. In addition, by giving hazardous, repetitive, grimy work to robots, human beings can focus on more creative, analytic tasks. 10 (Source: adapted from https://www.ericsson.com/en/blog/2021/12/ manufacturing-problems-that-keep-ceos-awake-at-night) Extract C Serious concerns over merger The Competition and Markets Authority (CMA) has said the takeover of the Cambridge- based computer chip designer Arm by its US rival Nvidia raises serious competition concerns. It has launched an in-depth investigation into the £29.5 billion deal. The CMA said the merger could reduce choice for firms reliant on computer chips, pushing 5 up prices of products including cars, games consoles and mobile phones. In addition, severe global shortages of computer chips has disrupted the manufacture of a range of electronic goods pushing up costs for firms. Despite this, large electronics firms benefit from economies of scale and are able to finance high-risk innovation and global advertising. 10 (Source adapted from: https://www.theguardian.com/ business/2021/aug/20/watchdog-expresses-concerns- over-nvidias-takeover-of-uk-chip-designer-arm ) Extract D The growing problem of electronic waste Electronic waste is the fastest growing element of the world’s household waste problem. The problem in the UK is particularly bad. The country produces 24.9 kg a person a year – nearly 10 kg more than the EU average. In 2018, 1.2 million tonnes of electrical devices were sold in the UK, and 500 000 tonnes made it to recycling centres. Some appliances 5 are more likely to be recycled than others. The recycling rate for big appliances, such as fridges and cookers, is about 80%. Of small appliances, barely one in five makes it to the recycling centre. As items such as toasters, hairdryers and headphones fit into household bins, they are not often taken to a recycling centre. This causes many problems, such as hazardous substances contaminating soil, water pollution and other external costs. 10 Policy makers have a long list of options to combat this problem including stricter regulation, environmental education, taxation and financial incentives. In some countries, for example, household rubbish is weighed and recycling initiatives are subsidised. (Source adapted from: https://www.ft.com/content/26e1aa74- 2261-11ea-92da-f0c92e957a96)
(b) Examine two factors which might influence the supply of labour in the electronics industry. (8)
June 2024 · Paper 1 · Q6(c) 10 marks AO1=2, AO2=2, AO3=2, AO4=4 10-mark response revenues costs and profits
Data and extracts for question 6The electronics industry Extract A Rising prices of electronics devices Computer chips act as the “brain” in all electronic devices. Makers of electronic devices face significant increases in the price of computer chips as they try to source enough components, including games consoles, computers and smartphones. The price of some computer chips has jumped from $0.20 each to more than $1. The prices of electronic 5 devices have risen for a range of reasons, including higher material costs and the growing popularity of home entertainment. (Source: adapted from https://www.ft.com/content/8c718a74- cd95-4b2d-ac0e-de0682e4e3cd) Extract B Labour shortages in the electronics industry Every year, highly skilled and experienced employees in the electronics industry retire. The current tight labour market has made an already difficult problem of hiring suitable engineering and computing graduates worse, especially since the nature of the industry is becoming increasingly technical. As production becomes 5 more automated, electronics jobs are more likely to require problem solving and analysis than just assembling skills. However, artificial intelligence and other new technologies can help fill some of the skills gap. In addition, by giving hazardous, repetitive, grimy work to robots, human beings can focus on more creative, analytic tasks. 10 (Source: adapted from https://www.ericsson.com/en/blog/2021/12/ manufacturing-problems-that-keep-ceos-awake-at-night) Extract C Serious concerns over merger The Competition and Markets Authority (CMA) has said the takeover of the Cambridge- based computer chip designer Arm by its US rival Nvidia raises serious competition concerns. It has launched an in-depth investigation into the £29.5 billion deal. The CMA said the merger could reduce choice for firms reliant on computer chips, pushing 5 up prices of products including cars, games consoles and mobile phones. In addition, severe global shortages of computer chips has disrupted the manufacture of a range of electronic goods pushing up costs for firms. Despite this, large electronics firms benefit from economies of scale and are able to finance high-risk innovation and global advertising. 10 (Source adapted from: https://www.theguardian.com/ business/2021/aug/20/watchdog-expresses-concerns- over-nvidias-takeover-of-uk-chip-designer-arm ) Extract D The growing problem of electronic waste Electronic waste is the fastest growing element of the world’s household waste problem. The problem in the UK is particularly bad. The country produces 24.9 kg a person a year – nearly 10 kg more than the EU average. In 2018, 1.2 million tonnes of electrical devices were sold in the UK, and 500 000 tonnes made it to recycling centres. Some appliances 5 are more likely to be recycled than others. The recycling rate for big appliances, such as fridges and cookers, is about 80%. Of small appliances, barely one in five makes it to the recycling centre. As items such as toasters, hairdryers and headphones fit into household bins, they are not often taken to a recycling centre. This causes many problems, such as hazardous substances contaminating soil, water pollution and other external costs. 10 Policy makers have a long list of options to combat this problem including stricter regulation, environmental education, taxation and financial incentives. In some countries, for example, household rubbish is weighed and recycling initiatives are subsidised. (Source adapted from: https://www.ft.com/content/26e1aa74- 2261-11ea-92da-f0c92e957a96)
(c) Assess whether firms in the electronics industry benefit from economies of scale. (10)
June 2024 · Paper 1 · Q6(d) 12 marks AO1=2, AO2=2, AO3=4, AO4=4 12-mark response competition policy and regulationmonopoly
Data and extracts for question 6The electronics industry Extract A Rising prices of electronics devices Computer chips act as the “brain” in all electronic devices. Makers of electronic devices face significant increases in the price of computer chips as they try to source enough components, including games consoles, computers and smartphones. The price of some computer chips has jumped from $0.20 each to more than $1. The prices of electronic 5 devices have risen for a range of reasons, including higher material costs and the growing popularity of home entertainment. (Source: adapted from https://www.ft.com/content/8c718a74- cd95-4b2d-ac0e-de0682e4e3cd) Extract B Labour shortages in the electronics industry Every year, highly skilled and experienced employees in the electronics industry retire. The current tight labour market has made an already difficult problem of hiring suitable engineering and computing graduates worse, especially since the nature of the industry is becoming increasingly technical. As production becomes 5 more automated, electronics jobs are more likely to require problem solving and analysis than just assembling skills. However, artificial intelligence and other new technologies can help fill some of the skills gap. In addition, by giving hazardous, repetitive, grimy work to robots, human beings can focus on more creative, analytic tasks. 10 (Source: adapted from https://www.ericsson.com/en/blog/2021/12/ manufacturing-problems-that-keep-ceos-awake-at-night) Extract C Serious concerns over merger The Competition and Markets Authority (CMA) has said the takeover of the Cambridge- based computer chip designer Arm by its US rival Nvidia raises serious competition concerns. It has launched an in-depth investigation into the £29.5 billion deal. The CMA said the merger could reduce choice for firms reliant on computer chips, pushing 5 up prices of products including cars, games consoles and mobile phones. In addition, severe global shortages of computer chips has disrupted the manufacture of a range of electronic goods pushing up costs for firms. Despite this, large electronics firms benefit from economies of scale and are able to finance high-risk innovation and global advertising. 10 (Source adapted from: https://www.theguardian.com/ business/2021/aug/20/watchdog-expresses-concerns- over-nvidias-takeover-of-uk-chip-designer-arm ) Extract D The growing problem of electronic waste Electronic waste is the fastest growing element of the world’s household waste problem. The problem in the UK is particularly bad. The country produces 24.9 kg a person a year – nearly 10 kg more than the EU average. In 2018, 1.2 million tonnes of electrical devices were sold in the UK, and 500 000 tonnes made it to recycling centres. Some appliances 5 are more likely to be recycled than others. The recycling rate for big appliances, such as fridges and cookers, is about 80%. Of small appliances, barely one in five makes it to the recycling centre. As items such as toasters, hairdryers and headphones fit into household bins, they are not often taken to a recycling centre. This causes many problems, such as hazardous substances contaminating soil, water pollution and other external costs. 10 Policy makers have a long list of options to combat this problem including stricter regulation, environmental education, taxation and financial incentives. In some countries, for example, household rubbish is weighed and recycling initiatives are subsidised. (Source adapted from: https://www.ft.com/content/26e1aa74- 2261-11ea-92da-f0c92e957a96)
(d) Discuss the likely concerns of the competition authorities regarding the proposed merger of the two companies referred to in Extract C. (12)
June 2024 · Paper 1 · Q6(e) 15 marks AO1=3, AO2=3, AO3=3, AO4=6 15-mark response government intervention in marketsexternalities
Data and extracts for question 6The electronics industry Extract A Rising prices of electronics devices Computer chips act as the “brain” in all electronic devices. Makers of electronic devices face significant increases in the price of computer chips as they try to source enough components, including games consoles, computers and smartphones. The price of some computer chips has jumped from $0.20 each to more than $1. The prices of electronic 5 devices have risen for a range of reasons, including higher material costs and the growing popularity of home entertainment. (Source: adapted from https://www.ft.com/content/8c718a74- cd95-4b2d-ac0e-de0682e4e3cd) Extract B Labour shortages in the electronics industry Every year, highly skilled and experienced employees in the electronics industry retire. The current tight labour market has made an already difficult problem of hiring suitable engineering and computing graduates worse, especially since the nature of the industry is becoming increasingly technical. As production becomes 5 more automated, electronics jobs are more likely to require problem solving and analysis than just assembling skills. However, artificial intelligence and other new technologies can help fill some of the skills gap. In addition, by giving hazardous, repetitive, grimy work to robots, human beings can focus on more creative, analytic tasks. 10 (Source: adapted from https://www.ericsson.com/en/blog/2021/12/ manufacturing-problems-that-keep-ceos-awake-at-night) Extract C Serious concerns over merger The Competition and Markets Authority (CMA) has said the takeover of the Cambridge- based computer chip designer Arm by its US rival Nvidia raises serious competition concerns. It has launched an in-depth investigation into the £29.5 billion deal. The CMA said the merger could reduce choice for firms reliant on computer chips, pushing 5 up prices of products including cars, games consoles and mobile phones. In addition, severe global shortages of computer chips has disrupted the manufacture of a range of electronic goods pushing up costs for firms. Despite this, large electronics firms benefit from economies of scale and are able to finance high-risk innovation and global advertising. 10 (Source adapted from: https://www.theguardian.com/ business/2021/aug/20/watchdog-expresses-concerns- over-nvidias-takeover-of-uk-chip-designer-arm ) Extract D The growing problem of electronic waste Electronic waste is the fastest growing element of the world’s household waste problem. The problem in the UK is particularly bad. The country produces 24.9 kg a person a year – nearly 10 kg more than the EU average. In 2018, 1.2 million tonnes of electrical devices were sold in the UK, and 500 000 tonnes made it to recycling centres. Some appliances 5 are more likely to be recycled than others. The recycling rate for big appliances, such as fridges and cookers, is about 80%. Of small appliances, barely one in five makes it to the recycling centre. As items such as toasters, hairdryers and headphones fit into household bins, they are not often taken to a recycling centre. This causes many problems, such as hazardous substances contaminating soil, water pollution and other external costs. 10 Policy makers have a long list of options to combat this problem including stricter regulation, environmental education, taxation and financial incentives. In some countries, for example, household rubbish is weighed and recycling initiatives are subsidised. (Source adapted from: https://www.ft.com/content/26e1aa74- 2261-11ea-92da-f0c92e957a96)
(e) With reference to Extract D, discuss possible methods of government intervention to reduce electronic waste. (15)
June 2024 · Paper 2 · Q1(b) 2 marks AO2=2 Calculation aggregate demand
Data and extracts for question 11 UK household savings as a percentage of household disposable income, quarter 1 (Q1) 2015 to quarter 3 (Q3) 2021 25 % 20 15 10 5 0 Q1 Q2 Q3 Q4 Q1 Q2 Q3 Q4 Q1 Q2 Q3 Q4 Q1 Q2 Q3 Q4 Q1 Q2 Q3 Q4 Q1 Q2 Q3 Q4 Q1 Q2 Q3 2015 2016 2017 2018 2019 2020 2021 (Source: https://www.ons.gov.uk/economy/grossdomesticproductgdp/timeseries/dgd8/ukea)
(b) In Q4 of 2015 average household disposable income was £26 300. Calculate the total amount of money saved by the average household in Q4 of 2015. (2)
June 2024 · Paper 2 · Q1(c) 2 marks AO1=1, AO3=1 Short answer aggregate demand
Data and extracts for question 11 UK household savings as a percentage of household disposable income, quarter 1 (Q1) 2015 to quarter 3 (Q3) 2021 25 % 20 15 10 5 0 Q1 Q2 Q3 Q4 Q1 Q2 Q3 Q4 Q1 Q2 Q3 Q4 Q1 Q2 Q3 Q4 Q1 Q2 Q3 Q4 Q1 Q2 Q3 Q4 Q1 Q2 Q3 2015 2016 2017 2018 2019 2020 2021 (Source: https://www.ons.gov.uk/economy/grossdomesticproductgdp/timeseries/dgd8/ukea)
(c) Explain one likely reason for the change in total household savings from Q1 2020 to Q2 2020. (2)
June 2024 · Paper 2 · Q2(b) 4 marks AO1=2, AO2=1, AO3=1 Short answer aggregate demand
Data and extracts for question 22 Investment in the European Union, percentage of GDP, January 2019 to October 2021 25 % 24.2 24 23.5 23.4 23.3 22.8 23 22.7 22.5 22.2 22.4 22 22 21.4 20.8 21 20 0 January April July October January April July October January April July October 2019 2019 2019 2019 2020 2020 2020 2020 2021 2021 2021 2021 (Source: adapted from https://www.ceicdata.com/en/indicator/ european-union/investment--nominal-gdp)
(b) With reference to the data, explain one likely effect of the fall in investment in 2020. (4)
June 2024 · Paper 2 · Q3(a) 4 marks AO1=2, AO2=1, AO3=1 Short answer financial sector
Data and extracts for question 33 A group of banks, including Barclays and JP Morgan, have been fined more than €1 billion by the EU’s competition authorities for rigging the foreign exchange market after the Global Financial Crisis of 2008. The EU found that traders at the banks had used online chat rooms to share information about customers’ orders, prices and other trading activities in order to manipulate the currency markets. (Source: adapted from https://www.ft.com/content/73163fa0- 77c5-11e9-bbad-7c18c0ea0201)
(a) With reference to the information above, explain what is meant by ‘market rigging’. (4)
June 2024 · Paper 2 · Q4(b) 4 marks AO1=2, AO2=2 Calculation national income and the multiplier
Data and extracts for question 44 Real GDP Trend GDP growth C Actual GDP growth D A B Time
(b) In July 2020 a survey estimated that the marginal propensity to consume in the UK was 0.1. (Source: adapted from https://ifs.org.uk/uploads/WP202035-MPCs-through- COVID-spending-saving-and-private-transfers.pdf) Calculate the total increase in aggregate demand from an increase in government spending of £60 million. (4)
June 2024 · Paper 2 · Q5(a) 4 marks AO1=2, AO2=1, AO3=1 Short answer trading blocs and protectionism
Data and extracts for question 55 In March 2018 the US imposed a tariff of 25% on steel imports from the UK. (Source: adapted from https://www.reuters.com/business/us-uk-announce- plans-formal-talks-metals-tariffs-wednesday-sources-2022-01-19/)
(a) Explain the likely impact of this tariff on the steel market in the US. (4)
June 2024 · Paper 2 · Q6(a) 5 marks AO1=2, AO2=2, AO3=1 Short answer public finances and taxation
Data and extracts for question 6The UK Economy Figure 1: UK national debt, percentage of GDP, 2001–2021 100 % 90 80 70 60 50 40 30 20 10 0 (Source: https://www.ons.gov.uk/economy/governmentpublicsectorandtaxes/ publicsectorfinance/bulletins/publicsectorfinances/december2021) Figure 2: UK fiscal deficit, percentage of GDP, 2001–2021 16 % 14 12 10 8 6 4 2 0 (Source: https://www.ons.gov.uk/economy/governmentpublicsectorandtaxes/ publicsectorfinance/bulletins/publicsectorfinances/december2021) Figure 3: Interest rate on a 10-year UK government bond, July 2022 to March 2023 4.5 % 4.0 3.5 3.0 2.5 2.0 1.5 0 Sep 22 Jul 22 Aug 22 Oct 22 Nov 22 Dec 22 Jan 23 Feb 23 Mar 23 (Source: https://www.ft.com/content/ece962c3-b7e5-48c6-a0b1-06f9823a4853# post-ad2ac225-0543-49e7-9ed5-af9907e83697) Figure 4: Income tax rates for 2023–24, compared to 2022–23 2022–23 2023–24 Tax band Income threshold Tax rate Income threshold Tax rate Personal Up to £12 570 0% Up to £12 570 0% allowance 20% 20% Basic rate £12 571–£50 270 £12 571–£50 270 Higher rate £50 271–£150 000 40% £50 271–£125 140 40% Additional rate Over £150 000 45% Over £125 140 45% (Source: Gov.uk) Extract A Freeze in income tax thresholds from 2023 onwards The freeze on the personal allowance, and the basic and higher-rate income tax bands in England, Wales and Northern Ireland will be extended to April 2028. While this freeze may not look like a tax rise on the face of it, having thresholds that fail to rise in line with salaries, people will still end up paying more tax on their income – particularly if they end 5 up in a higher tax band as a result. The biggest change announced in the Autumn Statement 2022 was the reduction of the additional-rate income tax threshold, dropping from £150 000 to £125 140 from 6 April 2023. It is estimated around 250 000 taxpayers will be pushed into the additional rate tax band, paying 45% tax on any income above the new limit. 10 The Chancellor said lowering the additional rate threshold means that a person earning £150 000 will pay an extra £1 200 income tax per year. (Source adapted from: https://www.which.co.uk/news/article/6- tax-changes-to-watch-out-for-in-2023) Extract B UK Monetary Policy Decisions At a special meeting on 19th March 2020, the monetary policy committee of the Bank of England announced further measures to help support the UK economy during the global health crisis. It voted to reduce the base rate of interest to 0.1% and restart the quantitative easing programme by buying £200 billion of UK government bonds and 5 corporate bonds. This followed a number of announcements by the UK government to try and limit the damage of the deep recession the country was facing and reduce the chances of deflation occurring in the UK. Government borrowing grew massively during 2020 and 2021 to fund support for businesses and workers. However, since then the monetary policy committee has rapidly increased the base 10 rate of interest – which reached 4% in February 2023. The UK government’s long-term borrowing costs are higher today than they were before former prime minister Liz Truss’s £45 billion proposed tax cuts caused the interest rate on 30-year government bonds to briefly rise above 5%, which almost caused a financial crisis. The Bank’s use of quantitative easing (QE) has also come in for criticism, with former 15 governor of the Bank of England Mervyn King saying that the decision to keep pumping money into the economy during the global health crisis was a mistake that fuelled inflation. He said: ‘central banks decided it was a good time to print a lot of money. That was a mistake [as] we had too much money chasing too few goods’. Experts have argued this pushed inflation higher in the UK by stimulating aggregate 20 demand. However, critics say QE does not cause inflation as most of the extra money is contained in the financial system and does not affect consumption and investment. Higher interest rates on the national debt may limit the ability of the UK government to increase spending on supply-side policies needed to boost economic growth, such as a £20 billion plan to transform carbon capture in the UK, which would create jobs and 25 support a move to cleaner electricity generation and technology. (Source: adapted from: https://www.bankofengland.co.uk/monetary-policy-summary-and- minutes/2020/monetary-policy-summary-for-the-special-monetary-policy-committee- meeting-on-19-march-2020 and https://www.ft.com)
(a) With reference to Figure 4 and your own knowledge, explain the distinction between a progressive and a regressive tax. (5)
June 2024 · Paper 2 · Q6(b) 8 marks AO1=2, AO2=2, AO3=2, AO4=2 8-mark response public finances and taxationaggregate demand
Data and extracts for question 6The UK Economy Figure 1: UK national debt, percentage of GDP, 2001–2021 100 % 90 80 70 60 50 40 30 20 10 0 (Source: https://www.ons.gov.uk/economy/governmentpublicsectorandtaxes/ publicsectorfinance/bulletins/publicsectorfinances/december2021) Figure 2: UK fiscal deficit, percentage of GDP, 2001–2021 16 % 14 12 10 8 6 4 2 0 (Source: https://www.ons.gov.uk/economy/governmentpublicsectorandtaxes/ publicsectorfinance/bulletins/publicsectorfinances/december2021) Figure 3: Interest rate on a 10-year UK government bond, July 2022 to March 2023 4.5 % 4.0 3.5 3.0 2.5 2.0 1.5 0 Sep 22 Jul 22 Aug 22 Oct 22 Nov 22 Dec 22 Jan 23 Feb 23 Mar 23 (Source: https://www.ft.com/content/ece962c3-b7e5-48c6-a0b1-06f9823a4853# post-ad2ac225-0543-49e7-9ed5-af9907e83697) Figure 4: Income tax rates for 2023–24, compared to 2022–23 2022–23 2023–24 Tax band Income threshold Tax rate Income threshold Tax rate Personal Up to £12 570 0% Up to £12 570 0% allowance 20% 20% Basic rate £12 571–£50 270 £12 571–£50 270 Higher rate £50 271–£150 000 40% £50 271–£125 140 40% Additional rate Over £150 000 45% Over £125 140 45% (Source: Gov.uk) Extract A Freeze in income tax thresholds from 2023 onwards The freeze on the personal allowance, and the basic and higher-rate income tax bands in England, Wales and Northern Ireland will be extended to April 2028. While this freeze may not look like a tax rise on the face of it, having thresholds that fail to rise in line with salaries, people will still end up paying more tax on their income – particularly if they end 5 up in a higher tax band as a result. The biggest change announced in the Autumn Statement 2022 was the reduction of the additional-rate income tax threshold, dropping from £150 000 to £125 140 from 6 April 2023. It is estimated around 250 000 taxpayers will be pushed into the additional rate tax band, paying 45% tax on any income above the new limit. 10 The Chancellor said lowering the additional rate threshold means that a person earning £150 000 will pay an extra £1 200 income tax per year. (Source adapted from: https://www.which.co.uk/news/article/6- tax-changes-to-watch-out-for-in-2023) Extract B UK Monetary Policy Decisions At a special meeting on 19th March 2020, the monetary policy committee of the Bank of England announced further measures to help support the UK economy during the global health crisis. It voted to reduce the base rate of interest to 0.1% and restart the quantitative easing programme by buying £200 billion of UK government bonds and 5 corporate bonds. This followed a number of announcements by the UK government to try and limit the damage of the deep recession the country was facing and reduce the chances of deflation occurring in the UK. Government borrowing grew massively during 2020 and 2021 to fund support for businesses and workers. However, since then the monetary policy committee has rapidly increased the base 10 rate of interest – which reached 4% in February 2023. The UK government’s long-term borrowing costs are higher today than they were before former prime minister Liz Truss’s £45 billion proposed tax cuts caused the interest rate on 30-year government bonds to briefly rise above 5%, which almost caused a financial crisis. The Bank’s use of quantitative easing (QE) has also come in for criticism, with former 15 governor of the Bank of England Mervyn King saying that the decision to keep pumping money into the economy during the global health crisis was a mistake that fuelled inflation. He said: ‘central banks decided it was a good time to print a lot of money. That was a mistake [as] we had too much money chasing too few goods’. Experts have argued this pushed inflation higher in the UK by stimulating aggregate 20 demand. However, critics say QE does not cause inflation as most of the extra money is contained in the financial system and does not affect consumption and investment. Higher interest rates on the national debt may limit the ability of the UK government to increase spending on supply-side policies needed to boost economic growth, such as a £20 billion plan to transform carbon capture in the UK, which would create jobs and 25 support a move to cleaner electricity generation and technology. (Source: adapted from: https://www.bankofengland.co.uk/monetary-policy-summary-and- minutes/2020/monetary-policy-summary-for-the-special-monetary-policy-committee- meeting-on-19-march-2020 and https://www.ft.com)
(b) With reference to Figure 4 and Extract A, examine the likely impact of the ‘freeze in income tax thresholds’ (Extract A line 1) on aggregate demand. (8)
June 2024 · Paper 2 · Q6(c) 10 marks AO1=2, AO2=2, AO3=2, AO4=4 10-mark response public finances and taxation
Data and extracts for question 6The UK Economy Figure 1: UK national debt, percentage of GDP, 2001–2021 100 % 90 80 70 60 50 40 30 20 10 0 (Source: https://www.ons.gov.uk/economy/governmentpublicsectorandtaxes/ publicsectorfinance/bulletins/publicsectorfinances/december2021) Figure 2: UK fiscal deficit, percentage of GDP, 2001–2021 16 % 14 12 10 8 6 4 2 0 (Source: https://www.ons.gov.uk/economy/governmentpublicsectorandtaxes/ publicsectorfinance/bulletins/publicsectorfinances/december2021) Figure 3: Interest rate on a 10-year UK government bond, July 2022 to March 2023 4.5 % 4.0 3.5 3.0 2.5 2.0 1.5 0 Sep 22 Jul 22 Aug 22 Oct 22 Nov 22 Dec 22 Jan 23 Feb 23 Mar 23 (Source: https://www.ft.com/content/ece962c3-b7e5-48c6-a0b1-06f9823a4853# post-ad2ac225-0543-49e7-9ed5-af9907e83697) Figure 4: Income tax rates for 2023–24, compared to 2022–23 2022–23 2023–24 Tax band Income threshold Tax rate Income threshold Tax rate Personal Up to £12 570 0% Up to £12 570 0% allowance 20% 20% Basic rate £12 571–£50 270 £12 571–£50 270 Higher rate £50 271–£150 000 40% £50 271–£125 140 40% Additional rate Over £150 000 45% Over £125 140 45% (Source: Gov.uk) Extract A Freeze in income tax thresholds from 2023 onwards The freeze on the personal allowance, and the basic and higher-rate income tax bands in England, Wales and Northern Ireland will be extended to April 2028. While this freeze may not look like a tax rise on the face of it, having thresholds that fail to rise in line with salaries, people will still end up paying more tax on their income – particularly if they end 5 up in a higher tax band as a result. The biggest change announced in the Autumn Statement 2022 was the reduction of the additional-rate income tax threshold, dropping from £150 000 to £125 140 from 6 April 2023. It is estimated around 250 000 taxpayers will be pushed into the additional rate tax band, paying 45% tax on any income above the new limit. 10 The Chancellor said lowering the additional rate threshold means that a person earning £150 000 will pay an extra £1 200 income tax per year. (Source adapted from: https://www.which.co.uk/news/article/6- tax-changes-to-watch-out-for-in-2023) Extract B UK Monetary Policy Decisions At a special meeting on 19th March 2020, the monetary policy committee of the Bank of England announced further measures to help support the UK economy during the global health crisis. It voted to reduce the base rate of interest to 0.1% and restart the quantitative easing programme by buying £200 billion of UK government bonds and 5 corporate bonds. This followed a number of announcements by the UK government to try and limit the damage of the deep recession the country was facing and reduce the chances of deflation occurring in the UK. Government borrowing grew massively during 2020 and 2021 to fund support for businesses and workers. However, since then the monetary policy committee has rapidly increased the base 10 rate of interest – which reached 4% in February 2023. The UK government’s long-term borrowing costs are higher today than they were before former prime minister Liz Truss’s £45 billion proposed tax cuts caused the interest rate on 30-year government bonds to briefly rise above 5%, which almost caused a financial crisis. The Bank’s use of quantitative easing (QE) has also come in for criticism, with former 15 governor of the Bank of England Mervyn King saying that the decision to keep pumping money into the economy during the global health crisis was a mistake that fuelled inflation. He said: ‘central banks decided it was a good time to print a lot of money. That was a mistake [as] we had too much money chasing too few goods’. Experts have argued this pushed inflation higher in the UK by stimulating aggregate 20 demand. However, critics say QE does not cause inflation as most of the extra money is contained in the financial system and does not affect consumption and investment. Higher interest rates on the national debt may limit the ability of the UK government to increase spending on supply-side policies needed to boost economic growth, such as a £20 billion plan to transform carbon capture in the UK, which would create jobs and 25 support a move to cleaner electricity generation and technology. (Source: adapted from: https://www.bankofengland.co.uk/monetary-policy-summary-and- minutes/2020/monetary-policy-summary-for-the-special-monetary-policy-committee- meeting-on-19-march-2020 and https://www.ft.com)
(c) Assess whether a fiscal deficit and national debt should be a cause for concern for the UK government. (10)
June 2024 · Paper 2 · Q6(d) 12 marks AO1=2, AO2=2, AO3=4, AO4=4 12-mark response fiscal and monetary policyfinancial sector
Data and extracts for question 6The UK Economy Figure 1: UK national debt, percentage of GDP, 2001–2021 100 % 90 80 70 60 50 40 30 20 10 0 (Source: https://www.ons.gov.uk/economy/governmentpublicsectorandtaxes/ publicsectorfinance/bulletins/publicsectorfinances/december2021) Figure 2: UK fiscal deficit, percentage of GDP, 2001–2021 16 % 14 12 10 8 6 4 2 0 (Source: https://www.ons.gov.uk/economy/governmentpublicsectorandtaxes/ publicsectorfinance/bulletins/publicsectorfinances/december2021) Figure 3: Interest rate on a 10-year UK government bond, July 2022 to March 2023 4.5 % 4.0 3.5 3.0 2.5 2.0 1.5 0 Sep 22 Jul 22 Aug 22 Oct 22 Nov 22 Dec 22 Jan 23 Feb 23 Mar 23 (Source: https://www.ft.com/content/ece962c3-b7e5-48c6-a0b1-06f9823a4853# post-ad2ac225-0543-49e7-9ed5-af9907e83697) Figure 4: Income tax rates for 2023–24, compared to 2022–23 2022–23 2023–24 Tax band Income threshold Tax rate Income threshold Tax rate Personal Up to £12 570 0% Up to £12 570 0% allowance 20% 20% Basic rate £12 571–£50 270 £12 571–£50 270 Higher rate £50 271–£150 000 40% £50 271–£125 140 40% Additional rate Over £150 000 45% Over £125 140 45% (Source: Gov.uk) Extract A Freeze in income tax thresholds from 2023 onwards The freeze on the personal allowance, and the basic and higher-rate income tax bands in England, Wales and Northern Ireland will be extended to April 2028. While this freeze may not look like a tax rise on the face of it, having thresholds that fail to rise in line with salaries, people will still end up paying more tax on their income – particularly if they end 5 up in a higher tax band as a result. The biggest change announced in the Autumn Statement 2022 was the reduction of the additional-rate income tax threshold, dropping from £150 000 to £125 140 from 6 April 2023. It is estimated around 250 000 taxpayers will be pushed into the additional rate tax band, paying 45% tax on any income above the new limit. 10 The Chancellor said lowering the additional rate threshold means that a person earning £150 000 will pay an extra £1 200 income tax per year. (Source adapted from: https://www.which.co.uk/news/article/6- tax-changes-to-watch-out-for-in-2023) Extract B UK Monetary Policy Decisions At a special meeting on 19th March 2020, the monetary policy committee of the Bank of England announced further measures to help support the UK economy during the global health crisis. It voted to reduce the base rate of interest to 0.1% and restart the quantitative easing programme by buying £200 billion of UK government bonds and 5 corporate bonds. This followed a number of announcements by the UK government to try and limit the damage of the deep recession the country was facing and reduce the chances of deflation occurring in the UK. Government borrowing grew massively during 2020 and 2021 to fund support for businesses and workers. However, since then the monetary policy committee has rapidly increased the base 10 rate of interest – which reached 4% in February 2023. The UK government’s long-term borrowing costs are higher today than they were before former prime minister Liz Truss’s £45 billion proposed tax cuts caused the interest rate on 30-year government bonds to briefly rise above 5%, which almost caused a financial crisis. The Bank’s use of quantitative easing (QE) has also come in for criticism, with former 15 governor of the Bank of England Mervyn King saying that the decision to keep pumping money into the economy during the global health crisis was a mistake that fuelled inflation. He said: ‘central banks decided it was a good time to print a lot of money. That was a mistake [as] we had too much money chasing too few goods’. Experts have argued this pushed inflation higher in the UK by stimulating aggregate 20 demand. However, critics say QE does not cause inflation as most of the extra money is contained in the financial system and does not affect consumption and investment. Higher interest rates on the national debt may limit the ability of the UK government to increase spending on supply-side policies needed to boost economic growth, such as a £20 billion plan to transform carbon capture in the UK, which would create jobs and 25 support a move to cleaner electricity generation and technology. (Source: adapted from: https://www.bankofengland.co.uk/monetary-policy-summary-and- minutes/2020/monetary-policy-summary-for-the-special-monetary-policy-committee- meeting-on-19-march-2020 and https://www.ft.com)
(d) With reference to Extract B, discuss the use of quantitative easing in preventing deflation. (12)
June 2024 · Paper 2 · Q6(e) 15 marks AO1=3, AO2=3, AO3=3, AO4=6 15-mark response supply side policies
Data and extracts for question 6The UK Economy Figure 1: UK national debt, percentage of GDP, 2001–2021 100 % 90 80 70 60 50 40 30 20 10 0 (Source: https://www.ons.gov.uk/economy/governmentpublicsectorandtaxes/ publicsectorfinance/bulletins/publicsectorfinances/december2021) Figure 2: UK fiscal deficit, percentage of GDP, 2001–2021 16 % 14 12 10 8 6 4 2 0 (Source: https://www.ons.gov.uk/economy/governmentpublicsectorandtaxes/ publicsectorfinance/bulletins/publicsectorfinances/december2021) Figure 3: Interest rate on a 10-year UK government bond, July 2022 to March 2023 4.5 % 4.0 3.5 3.0 2.5 2.0 1.5 0 Sep 22 Jul 22 Aug 22 Oct 22 Nov 22 Dec 22 Jan 23 Feb 23 Mar 23 (Source: https://www.ft.com/content/ece962c3-b7e5-48c6-a0b1-06f9823a4853# post-ad2ac225-0543-49e7-9ed5-af9907e83697) Figure 4: Income tax rates for 2023–24, compared to 2022–23 2022–23 2023–24 Tax band Income threshold Tax rate Income threshold Tax rate Personal Up to £12 570 0% Up to £12 570 0% allowance 20% 20% Basic rate £12 571–£50 270 £12 571–£50 270 Higher rate £50 271–£150 000 40% £50 271–£125 140 40% Additional rate Over £150 000 45% Over £125 140 45% (Source: Gov.uk) Extract A Freeze in income tax thresholds from 2023 onwards The freeze on the personal allowance, and the basic and higher-rate income tax bands in England, Wales and Northern Ireland will be extended to April 2028. While this freeze may not look like a tax rise on the face of it, having thresholds that fail to rise in line with salaries, people will still end up paying more tax on their income – particularly if they end 5 up in a higher tax band as a result. The biggest change announced in the Autumn Statement 2022 was the reduction of the additional-rate income tax threshold, dropping from £150 000 to £125 140 from 6 April 2023. It is estimated around 250 000 taxpayers will be pushed into the additional rate tax band, paying 45% tax on any income above the new limit. 10 The Chancellor said lowering the additional rate threshold means that a person earning £150 000 will pay an extra £1 200 income tax per year. (Source adapted from: https://www.which.co.uk/news/article/6- tax-changes-to-watch-out-for-in-2023) Extract B UK Monetary Policy Decisions At a special meeting on 19th March 2020, the monetary policy committee of the Bank of England announced further measures to help support the UK economy during the global health crisis. It voted to reduce the base rate of interest to 0.1% and restart the quantitative easing programme by buying £200 billion of UK government bonds and 5 corporate bonds. This followed a number of announcements by the UK government to try and limit the damage of the deep recession the country was facing and reduce the chances of deflation occurring in the UK. Government borrowing grew massively during 2020 and 2021 to fund support for businesses and workers. However, since then the monetary policy committee has rapidly increased the base 10 rate of interest – which reached 4% in February 2023. The UK government’s long-term borrowing costs are higher today than they were before former prime minister Liz Truss’s £45 billion proposed tax cuts caused the interest rate on 30-year government bonds to briefly rise above 5%, which almost caused a financial crisis. The Bank’s use of quantitative easing (QE) has also come in for criticism, with former 15 governor of the Bank of England Mervyn King saying that the decision to keep pumping money into the economy during the global health crisis was a mistake that fuelled inflation. He said: ‘central banks decided it was a good time to print a lot of money. That was a mistake [as] we had too much money chasing too few goods’. Experts have argued this pushed inflation higher in the UK by stimulating aggregate 20 demand. However, critics say QE does not cause inflation as most of the extra money is contained in the financial system and does not affect consumption and investment. Higher interest rates on the national debt may limit the ability of the UK government to increase spending on supply-side policies needed to boost economic growth, such as a £20 billion plan to transform carbon capture in the UK, which would create jobs and 25 support a move to cleaner electricity generation and technology. (Source: adapted from: https://www.bankofengland.co.uk/monetary-policy-summary-and- minutes/2020/monetary-policy-summary-for-the-special-monetary-policy-committee- meeting-on-19-march-2020 and https://www.ft.com)
(e) Discuss supply-side policies the UK government could introduce to stimulate economic growth. (15)
June 2024 · Paper 3 · Q1(a) 5 marks AO1=2, AO2=2, AO3=1 Short answer price elasticity of demand
Data and extracts for question 1The energy market Figure 1: UK wholesale gas prices per therm, 2021, in pence 500p Price per therm 400p 352p 300p 200p 100p 0p Feb Apr Jun Aug Oct Dec Figure 2: Number of firms supplying gas and electricity in the UK, 2004–2021 80 60 40 20 0 2004 06 08 10 12 14 16 18 21 Gas and electricity Electricity Gas Extract A Rising gas prices UK consumers are some of the biggest users of gas. 85% of homes use gas central heating, and gas generates a third of the country’s electricity. North Sea gas is running out – and as Britain has replaced coal-fired energy production with wind power in order to reduce carbon emissions, it has become dependent on gas imports. 5 Almost all UK businesses face significant rises in fuel costs over the next few months, and there is no substitute for energy, at least in the short run – an almost perfect example of price inelastic demand. (Source: adapted from https://www.theecoexperts.co.uk/ blog/reasons-for-uk-gas-price-increase) Extract B The UK gas market is broken During the past decade the government has allowed new entrants into the retail energy market with business models that left them ill-prepared to achieve long term business growth. Now the UK must choose between letting its energy market collapse and offering large subsidies for energy retailers. 5 The problem began in the 1980s and 1990s, when privatisation created an oligopolistic energy market dominated by the “Big Six”, which paid their shareholders high dividends and their bosses excessive salaries. The government responded to anger over high energy bills with further liberalisation. Some of the new entrants were innovative, such as Bulb, which offered consumption-tracking apps, and Octopus, which discouraged 10 consumption when demand was high with dynamic pricing. But most were under- capitalised and produced no energy, merely buying it on global wholesale markets and selling it on. Some paid little attention to ensuring continuity of supply or forward buying of gas. The constraints on energy retailers worsened in 2017 with the closure of a big 15 gas-storage facility, which left the UK able to store just 2% of its annual demand. Other big gas importing countries, by contrast, can store 20%–30%. The risks rose further in 2019, when the government capped consumer prices in response to continued complaints about high energy bills. The perfect storm came in the summer of 2021. As economies opened up, global 20 demand for energy rose. Gas supply in Russia, a big producer, was disrupted, and unusually calm weather reduced UK wind turbine energy production to 11% of capacity. In August Ofgem, the industry regulator, said that from October the firms would be able to raise prices for households by 54%. But since then the wholesale price of gas paid by UK energy firms has risen by more than 70%. The result is that UK energy firms are tied 25 into contracts to supply gas to households at far less than they must pay to get it. (Source: adapted from https://www.economist.com/britain/britains-gas-market-is-broken/) Extract C The gender pay gap in the oil and gas industry Despite best efforts to try to attract more women into the oil and gas industry, females are still hugely under-represented in science, technology, engineering and maths careers, whether school leavers, graduates or experienced workers. Women hold under 25% of careers in these areas, and typically hold more non-technical roles, which can attract 5 lower salaries than technical disciplines. There is an even smaller female representation in the offshore workforce (3.6%) e.g. working on rigs in the North Sea, an area that pays higher salaries than onshore work. Despite continued efforts there is still a lack of female applications. Only 5% of the applications to the technical apprentice programme were female, of which half withdrew 10 their applications at the first stage of the recruitment process. There is also a low representation of females in senior leadership roles within the oil and gas industry, especially in technical positions. Women also generally take up part-time positions which are typically lower paid. This has resulted in the oil and gas industry having an average gap in hourly pay of 25%. 15 In the majority of developed countries, women have made substantial progress in the labour market since the 1970s, with both wages and labour force participation increasing relative to that for men. Notwithstanding these large improvements, women still earn less than ‘comparable’ men in all developed countries and, since the 2000s, progress for women in the labour market seems to have slowed. 20 (Source: adapted from https://www.harbourenergy.com/media/2a2nmavb/chr-18311- 01-gender-pay-gap-2020-v6-final.pdf and https://ftp.iza.org/dp10975.pdf)
(a) With reference to Figure 1 and Extract A, explain what is meant by ‘price inelastic demand’ (line 8). (5)
June 2024 · Paper 3 · Q1(b) 8 marks AO1=2, AO2=2, AO3=2, AO4=2 8-mark response externalities
Data and extracts for question 1The energy market Figure 1: UK wholesale gas prices per therm, 2021, in pence 500p Price per therm 400p 352p 300p 200p 100p 0p Feb Apr Jun Aug Oct Dec Figure 2: Number of firms supplying gas and electricity in the UK, 2004–2021 80 60 40 20 0 2004 06 08 10 12 14 16 18 21 Gas and electricity Electricity Gas Extract A Rising gas prices UK consumers are some of the biggest users of gas. 85% of homes use gas central heating, and gas generates a third of the country’s electricity. North Sea gas is running out – and as Britain has replaced coal-fired energy production with wind power in order to reduce carbon emissions, it has become dependent on gas imports. 5 Almost all UK businesses face significant rises in fuel costs over the next few months, and there is no substitute for energy, at least in the short run – an almost perfect example of price inelastic demand. (Source: adapted from https://www.theecoexperts.co.uk/ blog/reasons-for-uk-gas-price-increase) Extract B The UK gas market is broken During the past decade the government has allowed new entrants into the retail energy market with business models that left them ill-prepared to achieve long term business growth. Now the UK must choose between letting its energy market collapse and offering large subsidies for energy retailers. 5 The problem began in the 1980s and 1990s, when privatisation created an oligopolistic energy market dominated by the “Big Six”, which paid their shareholders high dividends and their bosses excessive salaries. The government responded to anger over high energy bills with further liberalisation. Some of the new entrants were innovative, such as Bulb, which offered consumption-tracking apps, and Octopus, which discouraged 10 consumption when demand was high with dynamic pricing. But most were under- capitalised and produced no energy, merely buying it on global wholesale markets and selling it on. Some paid little attention to ensuring continuity of supply or forward buying of gas. The constraints on energy retailers worsened in 2017 with the closure of a big 15 gas-storage facility, which left the UK able to store just 2% of its annual demand. Other big gas importing countries, by contrast, can store 20%–30%. The risks rose further in 2019, when the government capped consumer prices in response to continued complaints about high energy bills. The perfect storm came in the summer of 2021. As economies opened up, global 20 demand for energy rose. Gas supply in Russia, a big producer, was disrupted, and unusually calm weather reduced UK wind turbine energy production to 11% of capacity. In August Ofgem, the industry regulator, said that from October the firms would be able to raise prices for households by 54%. But since then the wholesale price of gas paid by UK energy firms has risen by more than 70%. The result is that UK energy firms are tied 25 into contracts to supply gas to households at far less than they must pay to get it. (Source: adapted from https://www.economist.com/britain/britains-gas-market-is-broken/) Extract C The gender pay gap in the oil and gas industry Despite best efforts to try to attract more women into the oil and gas industry, females are still hugely under-represented in science, technology, engineering and maths careers, whether school leavers, graduates or experienced workers. Women hold under 25% of careers in these areas, and typically hold more non-technical roles, which can attract 5 lower salaries than technical disciplines. There is an even smaller female representation in the offshore workforce (3.6%) e.g. working on rigs in the North Sea, an area that pays higher salaries than onshore work. Despite continued efforts there is still a lack of female applications. Only 5% of the applications to the technical apprentice programme were female, of which half withdrew 10 their applications at the first stage of the recruitment process. There is also a low representation of females in senior leadership roles within the oil and gas industry, especially in technical positions. Women also generally take up part-time positions which are typically lower paid. This has resulted in the oil and gas industry having an average gap in hourly pay of 25%. 15 In the majority of developed countries, women have made substantial progress in the labour market since the 1970s, with both wages and labour force participation increasing relative to that for men. Notwithstanding these large improvements, women still earn less than ‘comparable’ men in all developed countries and, since the 2000s, progress for women in the labour market seems to have slowed. 20 (Source: adapted from https://www.harbourenergy.com/media/2a2nmavb/chr-18311- 01-gender-pay-gap-2020-v6-final.pdf and https://ftp.iza.org/dp10975.pdf)
(b) Examine one likely externality that arises when a producer generates electricity by burning gas. Use a diagram to show the external costs of production. (8)
June 2024 · Paper 3 · Q1(c) 12 marks AO1=2, AO2=2, AO3=4, AO4=4 12-mark response business growth and objectives
Data and extracts for question 1The energy market Figure 1: UK wholesale gas prices per therm, 2021, in pence 500p Price per therm 400p 352p 300p 200p 100p 0p Feb Apr Jun Aug Oct Dec Figure 2: Number of firms supplying gas and electricity in the UK, 2004–2021 80 60 40 20 0 2004 06 08 10 12 14 16 18 21 Gas and electricity Electricity Gas Extract A Rising gas prices UK consumers are some of the biggest users of gas. 85% of homes use gas central heating, and gas generates a third of the country’s electricity. North Sea gas is running out – and as Britain has replaced coal-fired energy production with wind power in order to reduce carbon emissions, it has become dependent on gas imports. 5 Almost all UK businesses face significant rises in fuel costs over the next few months, and there is no substitute for energy, at least in the short run – an almost perfect example of price inelastic demand. (Source: adapted from https://www.theecoexperts.co.uk/ blog/reasons-for-uk-gas-price-increase) Extract B The UK gas market is broken During the past decade the government has allowed new entrants into the retail energy market with business models that left them ill-prepared to achieve long term business growth. Now the UK must choose between letting its energy market collapse and offering large subsidies for energy retailers. 5 The problem began in the 1980s and 1990s, when privatisation created an oligopolistic energy market dominated by the “Big Six”, which paid their shareholders high dividends and their bosses excessive salaries. The government responded to anger over high energy bills with further liberalisation. Some of the new entrants were innovative, such as Bulb, which offered consumption-tracking apps, and Octopus, which discouraged 10 consumption when demand was high with dynamic pricing. But most were under- capitalised and produced no energy, merely buying it on global wholesale markets and selling it on. Some paid little attention to ensuring continuity of supply or forward buying of gas. The constraints on energy retailers worsened in 2017 with the closure of a big 15 gas-storage facility, which left the UK able to store just 2% of its annual demand. Other big gas importing countries, by contrast, can store 20%–30%. The risks rose further in 2019, when the government capped consumer prices in response to continued complaints about high energy bills. The perfect storm came in the summer of 2021. As economies opened up, global 20 demand for energy rose. Gas supply in Russia, a big producer, was disrupted, and unusually calm weather reduced UK wind turbine energy production to 11% of capacity. In August Ofgem, the industry regulator, said that from October the firms would be able to raise prices for households by 54%. But since then the wholesale price of gas paid by UK energy firms has risen by more than 70%. The result is that UK energy firms are tied 25 into contracts to supply gas to households at far less than they must pay to get it. (Source: adapted from https://www.economist.com/britain/britains-gas-market-is-broken/) Extract C The gender pay gap in the oil and gas industry Despite best efforts to try to attract more women into the oil and gas industry, females are still hugely under-represented in science, technology, engineering and maths careers, whether school leavers, graduates or experienced workers. Women hold under 25% of careers in these areas, and typically hold more non-technical roles, which can attract 5 lower salaries than technical disciplines. There is an even smaller female representation in the offshore workforce (3.6%) e.g. working on rigs in the North Sea, an area that pays higher salaries than onshore work. Despite continued efforts there is still a lack of female applications. Only 5% of the applications to the technical apprentice programme were female, of which half withdrew 10 their applications at the first stage of the recruitment process. There is also a low representation of females in senior leadership roles within the oil and gas industry, especially in technical positions. Women also generally take up part-time positions which are typically lower paid. This has resulted in the oil and gas industry having an average gap in hourly pay of 25%. 15 In the majority of developed countries, women have made substantial progress in the labour market since the 1970s, with both wages and labour force participation increasing relative to that for men. Notwithstanding these large improvements, women still earn less than ‘comparable’ men in all developed countries and, since the 2000s, progress for women in the labour market seems to have slowed. 20 (Source: adapted from https://www.harbourenergy.com/media/2a2nmavb/chr-18311- 01-gender-pay-gap-2020-v6-final.pdf and https://ftp.iza.org/dp10975.pdf)
(c) With reference to Figure 2 and Extract B, discuss the possible constraints on business growth for firms supplying energy to households in the UK. (12)
June 2024 · Paper 3 · Q1(d) 25 marks AO1=4, AO2=4, AO3=8, AO4=9 25-mark essay Either/or labour marketpoverty and inequality
Data and extracts for question 1The energy market Figure 1: UK wholesale gas prices per therm, 2021, in pence 500p Price per therm 400p 352p 300p 200p 100p 0p Feb Apr Jun Aug Oct Dec Figure 2: Number of firms supplying gas and electricity in the UK, 2004–2021 80 60 40 20 0 2004 06 08 10 12 14 16 18 21 Gas and electricity Electricity Gas Extract A Rising gas prices UK consumers are some of the biggest users of gas. 85% of homes use gas central heating, and gas generates a third of the country’s electricity. North Sea gas is running out – and as Britain has replaced coal-fired energy production with wind power in order to reduce carbon emissions, it has become dependent on gas imports. 5 Almost all UK businesses face significant rises in fuel costs over the next few months, and there is no substitute for energy, at least in the short run – an almost perfect example of price inelastic demand. (Source: adapted from https://www.theecoexperts.co.uk/ blog/reasons-for-uk-gas-price-increase) Extract B The UK gas market is broken During the past decade the government has allowed new entrants into the retail energy market with business models that left them ill-prepared to achieve long term business growth. Now the UK must choose between letting its energy market collapse and offering large subsidies for energy retailers. 5 The problem began in the 1980s and 1990s, when privatisation created an oligopolistic energy market dominated by the “Big Six”, which paid their shareholders high dividends and their bosses excessive salaries. The government responded to anger over high energy bills with further liberalisation. Some of the new entrants were innovative, such as Bulb, which offered consumption-tracking apps, and Octopus, which discouraged 10 consumption when demand was high with dynamic pricing. But most were under- capitalised and produced no energy, merely buying it on global wholesale markets and selling it on. Some paid little attention to ensuring continuity of supply or forward buying of gas. The constraints on energy retailers worsened in 2017 with the closure of a big 15 gas-storage facility, which left the UK able to store just 2% of its annual demand. Other big gas importing countries, by contrast, can store 20%–30%. The risks rose further in 2019, when the government capped consumer prices in response to continued complaints about high energy bills. The perfect storm came in the summer of 2021. As economies opened up, global 20 demand for energy rose. Gas supply in Russia, a big producer, was disrupted, and unusually calm weather reduced UK wind turbine energy production to 11% of capacity. In August Ofgem, the industry regulator, said that from October the firms would be able to raise prices for households by 54%. But since then the wholesale price of gas paid by UK energy firms has risen by more than 70%. The result is that UK energy firms are tied 25 into contracts to supply gas to households at far less than they must pay to get it. (Source: adapted from https://www.economist.com/britain/britains-gas-market-is-broken/) Extract C The gender pay gap in the oil and gas industry Despite best efforts to try to attract more women into the oil and gas industry, females are still hugely under-represented in science, technology, engineering and maths careers, whether school leavers, graduates or experienced workers. Women hold under 25% of careers in these areas, and typically hold more non-technical roles, which can attract 5 lower salaries than technical disciplines. There is an even smaller female representation in the offshore workforce (3.6%) e.g. working on rigs in the North Sea, an area that pays higher salaries than onshore work. Despite continued efforts there is still a lack of female applications. Only 5% of the applications to the technical apprentice programme were female, of which half withdrew 10 their applications at the first stage of the recruitment process. There is also a low representation of females in senior leadership roles within the oil and gas industry, especially in technical positions. Women also generally take up part-time positions which are typically lower paid. This has resulted in the oil and gas industry having an average gap in hourly pay of 25%. 15 In the majority of developed countries, women have made substantial progress in the labour market since the 1970s, with both wages and labour force participation increasing relative to that for men. Notwithstanding these large improvements, women still earn less than ‘comparable’ men in all developed countries and, since the 2000s, progress for women in the labour market seems to have slowed. 20 (Source: adapted from https://www.harbourenergy.com/media/2a2nmavb/chr-18311- 01-gender-pay-gap-2020-v6-final.pdf and https://ftp.iza.org/dp10975.pdf)
(d) Evaluate the microeconomic and macroeconomic factors that explain gender-based wage differences in the UK oil and gas industry. (25)
June 2024 · Paper 3 · Q1(e) 25 marks AO1=4, AO2=4, AO3=8, AO4=9 25-mark essay Either/or specialisation and division of labourglobalisation and trade
Data and extracts for question 1The energy market Figure 1: UK wholesale gas prices per therm, 2021, in pence 500p Price per therm 400p 352p 300p 200p 100p 0p Feb Apr Jun Aug Oct Dec Figure 2: Number of firms supplying gas and electricity in the UK, 2004–2021 80 60 40 20 0 2004 06 08 10 12 14 16 18 21 Gas and electricity Electricity Gas Extract A Rising gas prices UK consumers are some of the biggest users of gas. 85% of homes use gas central heating, and gas generates a third of the country’s electricity. North Sea gas is running out – and as Britain has replaced coal-fired energy production with wind power in order to reduce carbon emissions, it has become dependent on gas imports. 5 Almost all UK businesses face significant rises in fuel costs over the next few months, and there is no substitute for energy, at least in the short run – an almost perfect example of price inelastic demand. (Source: adapted from https://www.theecoexperts.co.uk/ blog/reasons-for-uk-gas-price-increase) Extract B The UK gas market is broken During the past decade the government has allowed new entrants into the retail energy market with business models that left them ill-prepared to achieve long term business growth. Now the UK must choose between letting its energy market collapse and offering large subsidies for energy retailers. 5 The problem began in the 1980s and 1990s, when privatisation created an oligopolistic energy market dominated by the “Big Six”, which paid their shareholders high dividends and their bosses excessive salaries. The government responded to anger over high energy bills with further liberalisation. Some of the new entrants were innovative, such as Bulb, which offered consumption-tracking apps, and Octopus, which discouraged 10 consumption when demand was high with dynamic pricing. But most were under- capitalised and produced no energy, merely buying it on global wholesale markets and selling it on. Some paid little attention to ensuring continuity of supply or forward buying of gas. The constraints on energy retailers worsened in 2017 with the closure of a big 15 gas-storage facility, which left the UK able to store just 2% of its annual demand. Other big gas importing countries, by contrast, can store 20%–30%. The risks rose further in 2019, when the government capped consumer prices in response to continued complaints about high energy bills. The perfect storm came in the summer of 2021. As economies opened up, global 20 demand for energy rose. Gas supply in Russia, a big producer, was disrupted, and unusually calm weather reduced UK wind turbine energy production to 11% of capacity. In August Ofgem, the industry regulator, said that from October the firms would be able to raise prices for households by 54%. But since then the wholesale price of gas paid by UK energy firms has risen by more than 70%. The result is that UK energy firms are tied 25 into contracts to supply gas to households at far less than they must pay to get it. (Source: adapted from https://www.economist.com/britain/britains-gas-market-is-broken/) Extract C The gender pay gap in the oil and gas industry Despite best efforts to try to attract more women into the oil and gas industry, females are still hugely under-represented in science, technology, engineering and maths careers, whether school leavers, graduates or experienced workers. Women hold under 25% of careers in these areas, and typically hold more non-technical roles, which can attract 5 lower salaries than technical disciplines. There is an even smaller female representation in the offshore workforce (3.6%) e.g. working on rigs in the North Sea, an area that pays higher salaries than onshore work. Despite continued efforts there is still a lack of female applications. Only 5% of the applications to the technical apprentice programme were female, of which half withdrew 10 their applications at the first stage of the recruitment process. There is also a low representation of females in senior leadership roles within the oil and gas industry, especially in technical positions. Women also generally take up part-time positions which are typically lower paid. This has resulted in the oil and gas industry having an average gap in hourly pay of 25%. 15 In the majority of developed countries, women have made substantial progress in the labour market since the 1970s, with both wages and labour force participation increasing relative to that for men. Notwithstanding these large improvements, women still earn less than ‘comparable’ men in all developed countries and, since the 2000s, progress for women in the labour market seems to have slowed. 20 (Source: adapted from https://www.harbourenergy.com/media/2a2nmavb/chr-18311- 01-gender-pay-gap-2020-v6-final.pdf and https://ftp.iza.org/dp10975.pdf)
(e) Evaluate the microeconomic and macroeconomic advantages for a country specialising in energy production using gas. (25)
June 2024 · Paper 3 · Q2(a) 5 marks AO1=2, AO2=2, AO3=1 Short answer exchange rates
Data and extracts for question 2Ghana – cocoa and chocolate production Figure 3: World’s largest cocoa growers and chocolate producers Cocoa growers Chocolate producers Ivory Coast 46% Germany 17% Ghana 18% Belgium 11% Indonesia 14% Italy 7.4% Nigeria 7% US 7.2% (Source: adapted from International Cocoa Association www.icco.org December 2021 and The Telegraph.co.uk accessed 24/2/22) Extract D From a managed to a floating exchange rate Ghana’s currency, the cedi, has depreciated significantly against major currencies, especially the US dollar (US$), since the adoption of the floating exchange rate system in 1992. From 1983 to 1992 it operated a managed exchange rate. Since the liberalisation of the foreign exchange market there have substantial swings and on average the cedi has 5 depreciated 98% against the US dollar. The cedi to US dollar rate has been very volatile recently, causing macroeconomic instability and limiting economic growth. (Source adapted from: https://www.theigc.org/project/on-the-causes-and-effect-of- exchange-rate-volatility-on-economic-growth-evidence-from-ghana/ and https://www.scirp.org/journal/paperinformation.aspx?paperid=95492) Extract E There is a lot of money in chocolate but the growers of cocoa see very little of it. In 2020 the chocolate retail industry was worth £78 billion, but Ghana – the world’s second largest cocoa producer – earned just over £1 billion. Cocoa farmers in Ghana now make roughly $1 a day (this often includes being subsidised by the Ghanaian government). This is a familiar pattern for many African countries where the economy 5 is still shaped by a colonial relationship in which they export commodities to be processed elsewhere. Ghana currently processes about 30% of its cocoa crop into chocolate, meaning that the exports can earn high prices. Despite plans for expanding the domestic chocolate industry there are still many obstacles in the way. The equipment to make chocolate is 10 very expensive and there is neither a local sugar nor dairy industry. Imported milk and sugar would increase the cost of production significantly, with the added problem that foreign currency would be needed. Producing chocolate requires consistent refrigeration, and the high cost of the equipment to achieve that is a major obstacle for entrepreneurs without substantial funds. There is an inconsistent supply of energy in rural parts of 15 Ghana. An alternative, making teas and wines using cocoa, can make 20 times more revenue than the raw beans, but they do not have the mass market appeal and high profits of chocolate. Access to funds is a big problem and one farmer, Nana Aduna, says that high interest rates on bank loans are an issue for start-up businesses and at the moment he cannot 20 afford to borrow money. “You cannot grow a business when you have to service interest rates of 18%–20% or even more,” he says. But the government has pledged to address these structural issues, using supply side policies. The Trade and Industry Minister announced that industrialisation is the focus of government policy. “It only makes sense that the most important commodity in 25 our country, which is cocoa… should become the target for a major programme of industrialisation,” he says. The ‘One District One Factory’ programme aims to kickstart industrialisation by providing the infrastructure for Ghana’s farms, by establishing processing plants in some of the big cocoa-growing areas. It has become easier for the private sector to invest in food 30 processing, and there is a big tax rebate available to processing companies that set up in the country’s enterprise zones – designated areas to encourage economic activity – in a bid to help them export. (Source: adapted from https://www.newsbreak.com/news/2201853748349/ghana-s- farmers-eye-sweet-success-from-chocolate and https://www.indepthnews.net/ index.php/the-world/africa/4495-ghana-starts-with-cocoa-to-end-neocolonial- trading-ties and https://www.brookings.edu/blog/africa-in-focus/2020/09/03/ pathways-to-structural-transformation-of-the-ghanaian-economy-and- some-roadblocks/ and https://www.ghanaweb.com/GhanaHomePage/ business/Speculators-driving-interbank-retail-FX-rates-gap-1468375) Extract F A new trade bloc for Africa The African Continental Free Trade Agreement (AfCFTA) has been signed by all 55 member states of the African Union, including Ghana, Nigeria, and South Africa. This brings together 1.2 billion people with a combined gross domestic product (GDP) of more than $2 trillion as of 2023. 5 The agreement commits countries to removing tariffs on 90% of goods, with other goods to be phased in later. The agreement also liberalises services and aims to tackle non-tariff barriers which reduce trade between African countries, such as long delays at the borders. (Source adapted from: https://www.aljazeera.com/economy/2018/3/20/ african-continental-free-trade-area-what-you-need-to-know)
(a) Explain one reason why a country might operate a managed exchange rate. Refer to Extract D in your answer. (5)
June 2024 · Paper 3 · Q2(b) 8 marks AO1=2, AO2=2, AO3=2, AO4=2 8-mark response emerging and developing economies
Data and extracts for question 2Ghana – cocoa and chocolate production Figure 3: World’s largest cocoa growers and chocolate producers Cocoa growers Chocolate producers Ivory Coast 46% Germany 17% Ghana 18% Belgium 11% Indonesia 14% Italy 7.4% Nigeria 7% US 7.2% (Source: adapted from International Cocoa Association www.icco.org December 2021 and The Telegraph.co.uk accessed 24/2/22) Extract D From a managed to a floating exchange rate Ghana’s currency, the cedi, has depreciated significantly against major currencies, especially the US dollar (US$), since the adoption of the floating exchange rate system in 1992. From 1983 to 1992 it operated a managed exchange rate. Since the liberalisation of the foreign exchange market there have substantial swings and on average the cedi has 5 depreciated 98% against the US dollar. The cedi to US dollar rate has been very volatile recently, causing macroeconomic instability and limiting economic growth. (Source adapted from: https://www.theigc.org/project/on-the-causes-and-effect-of- exchange-rate-volatility-on-economic-growth-evidence-from-ghana/ and https://www.scirp.org/journal/paperinformation.aspx?paperid=95492) Extract E There is a lot of money in chocolate but the growers of cocoa see very little of it. In 2020 the chocolate retail industry was worth £78 billion, but Ghana – the world’s second largest cocoa producer – earned just over £1 billion. Cocoa farmers in Ghana now make roughly $1 a day (this often includes being subsidised by the Ghanaian government). This is a familiar pattern for many African countries where the economy 5 is still shaped by a colonial relationship in which they export commodities to be processed elsewhere. Ghana currently processes about 30% of its cocoa crop into chocolate, meaning that the exports can earn high prices. Despite plans for expanding the domestic chocolate industry there are still many obstacles in the way. The equipment to make chocolate is 10 very expensive and there is neither a local sugar nor dairy industry. Imported milk and sugar would increase the cost of production significantly, with the added problem that foreign currency would be needed. Producing chocolate requires consistent refrigeration, and the high cost of the equipment to achieve that is a major obstacle for entrepreneurs without substantial funds. There is an inconsistent supply of energy in rural parts of 15 Ghana. An alternative, making teas and wines using cocoa, can make 20 times more revenue than the raw beans, but they do not have the mass market appeal and high profits of chocolate. Access to funds is a big problem and one farmer, Nana Aduna, says that high interest rates on bank loans are an issue for start-up businesses and at the moment he cannot 20 afford to borrow money. “You cannot grow a business when you have to service interest rates of 18%–20% or even more,” he says. But the government has pledged to address these structural issues, using supply side policies. The Trade and Industry Minister announced that industrialisation is the focus of government policy. “It only makes sense that the most important commodity in 25 our country, which is cocoa… should become the target for a major programme of industrialisation,” he says. The ‘One District One Factory’ programme aims to kickstart industrialisation by providing the infrastructure for Ghana’s farms, by establishing processing plants in some of the big cocoa-growing areas. It has become easier for the private sector to invest in food 30 processing, and there is a big tax rebate available to processing companies that set up in the country’s enterprise zones – designated areas to encourage economic activity – in a bid to help them export. (Source: adapted from https://www.newsbreak.com/news/2201853748349/ghana-s- farmers-eye-sweet-success-from-chocolate and https://www.indepthnews.net/ index.php/the-world/africa/4495-ghana-starts-with-cocoa-to-end-neocolonial- trading-ties and https://www.brookings.edu/blog/africa-in-focus/2020/09/03/ pathways-to-structural-transformation-of-the-ghanaian-economy-and- some-roadblocks/ and https://www.ghanaweb.com/GhanaHomePage/ business/Speculators-driving-interbank-retail-FX-rates-gap-1468375) Extract F A new trade bloc for Africa The African Continental Free Trade Agreement (AfCFTA) has been signed by all 55 member states of the African Union, including Ghana, Nigeria, and South Africa. This brings together 1.2 billion people with a combined gross domestic product (GDP) of more than $2 trillion as of 2023. 5 The agreement commits countries to removing tariffs on 90% of goods, with other goods to be phased in later. The agreement also liberalises services and aims to tackle non-tariff barriers which reduce trade between African countries, such as long delays at the borders. (Source adapted from: https://www.aljazeera.com/economy/2018/3/20/ african-continental-free-trade-area-what-you-need-to-know)
(b) With reference to the second paragraph of Extract E, examine two likely problems for the expansion of the chocolate industry in Ghana. (8)
June 2024 · Paper 3 · Q2(c) 12 marks AO1=2, AO2=2, AO3=4, AO4=4 12-mark response aggregate demandnational income and the multiplier
Data and extracts for question 2Ghana – cocoa and chocolate production Figure 3: World’s largest cocoa growers and chocolate producers Cocoa growers Chocolate producers Ivory Coast 46% Germany 17% Ghana 18% Belgium 11% Indonesia 14% Italy 7.4% Nigeria 7% US 7.2% (Source: adapted from International Cocoa Association www.icco.org December 2021 and The Telegraph.co.uk accessed 24/2/22) Extract D From a managed to a floating exchange rate Ghana’s currency, the cedi, has depreciated significantly against major currencies, especially the US dollar (US$), since the adoption of the floating exchange rate system in 1992. From 1983 to 1992 it operated a managed exchange rate. Since the liberalisation of the foreign exchange market there have substantial swings and on average the cedi has 5 depreciated 98% against the US dollar. The cedi to US dollar rate has been very volatile recently, causing macroeconomic instability and limiting economic growth. (Source adapted from: https://www.theigc.org/project/on-the-causes-and-effect-of- exchange-rate-volatility-on-economic-growth-evidence-from-ghana/ and https://www.scirp.org/journal/paperinformation.aspx?paperid=95492) Extract E There is a lot of money in chocolate but the growers of cocoa see very little of it. In 2020 the chocolate retail industry was worth £78 billion, but Ghana – the world’s second largest cocoa producer – earned just over £1 billion. Cocoa farmers in Ghana now make roughly $1 a day (this often includes being subsidised by the Ghanaian government). This is a familiar pattern for many African countries where the economy 5 is still shaped by a colonial relationship in which they export commodities to be processed elsewhere. Ghana currently processes about 30% of its cocoa crop into chocolate, meaning that the exports can earn high prices. Despite plans for expanding the domestic chocolate industry there are still many obstacles in the way. The equipment to make chocolate is 10 very expensive and there is neither a local sugar nor dairy industry. Imported milk and sugar would increase the cost of production significantly, with the added problem that foreign currency would be needed. Producing chocolate requires consistent refrigeration, and the high cost of the equipment to achieve that is a major obstacle for entrepreneurs without substantial funds. There is an inconsistent supply of energy in rural parts of 15 Ghana. An alternative, making teas and wines using cocoa, can make 20 times more revenue than the raw beans, but they do not have the mass market appeal and high profits of chocolate. Access to funds is a big problem and one farmer, Nana Aduna, says that high interest rates on bank loans are an issue for start-up businesses and at the moment he cannot 20 afford to borrow money. “You cannot grow a business when you have to service interest rates of 18%–20% or even more,” he says. But the government has pledged to address these structural issues, using supply side policies. The Trade and Industry Minister announced that industrialisation is the focus of government policy. “It only makes sense that the most important commodity in 25 our country, which is cocoa… should become the target for a major programme of industrialisation,” he says. The ‘One District One Factory’ programme aims to kickstart industrialisation by providing the infrastructure for Ghana’s farms, by establishing processing plants in some of the big cocoa-growing areas. It has become easier for the private sector to invest in food 30 processing, and there is a big tax rebate available to processing companies that set up in the country’s enterprise zones – designated areas to encourage economic activity – in a bid to help them export. (Source: adapted from https://www.newsbreak.com/news/2201853748349/ghana-s- farmers-eye-sweet-success-from-chocolate and https://www.indepthnews.net/ index.php/the-world/africa/4495-ghana-starts-with-cocoa-to-end-neocolonial- trading-ties and https://www.brookings.edu/blog/africa-in-focus/2020/09/03/ pathways-to-structural-transformation-of-the-ghanaian-economy-and- some-roadblocks/ and https://www.ghanaweb.com/GhanaHomePage/ business/Speculators-driving-interbank-retail-FX-rates-gap-1468375) Extract F A new trade bloc for Africa The African Continental Free Trade Agreement (AfCFTA) has been signed by all 55 member states of the African Union, including Ghana, Nigeria, and South Africa. This brings together 1.2 billion people with a combined gross domestic product (GDP) of more than $2 trillion as of 2023. 5 The agreement commits countries to removing tariffs on 90% of goods, with other goods to be phased in later. The agreement also liberalises services and aims to tackle non-tariff barriers which reduce trade between African countries, such as long delays at the borders. (Source adapted from: https://www.aljazeera.com/economy/2018/3/20/ african-continental-free-trade-area-what-you-need-to-know)
(c) Discuss factors influencing the level of aggregate demand in Ghana. Use an aggregate demand and aggregate supply diagram in your answer. (12)
June 2024 · Paper 3 · Q2(d) 25 marks AO1=4, AO2=4, AO3=8, AO4=9 25-mark essay Either/or revenues costs and profitsfiscal and monetary policy
Data and extracts for question 2Ghana – cocoa and chocolate production Figure 3: World’s largest cocoa growers and chocolate producers Cocoa growers Chocolate producers Ivory Coast 46% Germany 17% Ghana 18% Belgium 11% Indonesia 14% Italy 7.4% Nigeria 7% US 7.2% (Source: adapted from International Cocoa Association www.icco.org December 2021 and The Telegraph.co.uk accessed 24/2/22) Extract D From a managed to a floating exchange rate Ghana’s currency, the cedi, has depreciated significantly against major currencies, especially the US dollar (US$), since the adoption of the floating exchange rate system in 1992. From 1983 to 1992 it operated a managed exchange rate. Since the liberalisation of the foreign exchange market there have substantial swings and on average the cedi has 5 depreciated 98% against the US dollar. The cedi to US dollar rate has been very volatile recently, causing macroeconomic instability and limiting economic growth. (Source adapted from: https://www.theigc.org/project/on-the-causes-and-effect-of- exchange-rate-volatility-on-economic-growth-evidence-from-ghana/ and https://www.scirp.org/journal/paperinformation.aspx?paperid=95492) Extract E There is a lot of money in chocolate but the growers of cocoa see very little of it. In 2020 the chocolate retail industry was worth £78 billion, but Ghana – the world’s second largest cocoa producer – earned just over £1 billion. Cocoa farmers in Ghana now make roughly $1 a day (this often includes being subsidised by the Ghanaian government). This is a familiar pattern for many African countries where the economy 5 is still shaped by a colonial relationship in which they export commodities to be processed elsewhere. Ghana currently processes about 30% of its cocoa crop into chocolate, meaning that the exports can earn high prices. Despite plans for expanding the domestic chocolate industry there are still many obstacles in the way. The equipment to make chocolate is 10 very expensive and there is neither a local sugar nor dairy industry. Imported milk and sugar would increase the cost of production significantly, with the added problem that foreign currency would be needed. Producing chocolate requires consistent refrigeration, and the high cost of the equipment to achieve that is a major obstacle for entrepreneurs without substantial funds. There is an inconsistent supply of energy in rural parts of 15 Ghana. An alternative, making teas and wines using cocoa, can make 20 times more revenue than the raw beans, but they do not have the mass market appeal and high profits of chocolate. Access to funds is a big problem and one farmer, Nana Aduna, says that high interest rates on bank loans are an issue for start-up businesses and at the moment he cannot 20 afford to borrow money. “You cannot grow a business when you have to service interest rates of 18%–20% or even more,” he says. But the government has pledged to address these structural issues, using supply side policies. The Trade and Industry Minister announced that industrialisation is the focus of government policy. “It only makes sense that the most important commodity in 25 our country, which is cocoa… should become the target for a major programme of industrialisation,” he says. The ‘One District One Factory’ programme aims to kickstart industrialisation by providing the infrastructure for Ghana’s farms, by establishing processing plants in some of the big cocoa-growing areas. It has become easier for the private sector to invest in food 30 processing, and there is a big tax rebate available to processing companies that set up in the country’s enterprise zones – designated areas to encourage economic activity – in a bid to help them export. (Source: adapted from https://www.newsbreak.com/news/2201853748349/ghana-s- farmers-eye-sweet-success-from-chocolate and https://www.indepthnews.net/ index.php/the-world/africa/4495-ghana-starts-with-cocoa-to-end-neocolonial- trading-ties and https://www.brookings.edu/blog/africa-in-focus/2020/09/03/ pathways-to-structural-transformation-of-the-ghanaian-economy-and- some-roadblocks/ and https://www.ghanaweb.com/GhanaHomePage/ business/Speculators-driving-interbank-retail-FX-rates-gap-1468375) Extract F A new trade bloc for Africa The African Continental Free Trade Agreement (AfCFTA) has been signed by all 55 member states of the African Union, including Ghana, Nigeria, and South Africa. This brings together 1.2 billion people with a combined gross domestic product (GDP) of more than $2 trillion as of 2023. 5 The agreement commits countries to removing tariffs on 90% of goods, with other goods to be phased in later. The agreement also liberalises services and aims to tackle non-tariff barriers which reduce trade between African countries, such as long delays at the borders. (Source adapted from: https://www.aljazeera.com/economy/2018/3/20/ african-continental-free-trade-area-what-you-need-to-know)
(d) Evaluate the microeconomic and macroeconomic effects of high interest rates in Ghana, or another developing country of your choice. (25)
June 2024 · Paper 3 · Q2(e) 25 marks AO1=4, AO2=4, AO3=8, AO4=9 25-mark essay Either/or trading blocs and protectionismrevenues costs and profits
Data and extracts for question 2Ghana – cocoa and chocolate production Figure 3: World’s largest cocoa growers and chocolate producers Cocoa growers Chocolate producers Ivory Coast 46% Germany 17% Ghana 18% Belgium 11% Indonesia 14% Italy 7.4% Nigeria 7% US 7.2% (Source: adapted from International Cocoa Association www.icco.org December 2021 and The Telegraph.co.uk accessed 24/2/22) Extract D From a managed to a floating exchange rate Ghana’s currency, the cedi, has depreciated significantly against major currencies, especially the US dollar (US$), since the adoption of the floating exchange rate system in 1992. From 1983 to 1992 it operated a managed exchange rate. Since the liberalisation of the foreign exchange market there have substantial swings and on average the cedi has 5 depreciated 98% against the US dollar. The cedi to US dollar rate has been very volatile recently, causing macroeconomic instability and limiting economic growth. (Source adapted from: https://www.theigc.org/project/on-the-causes-and-effect-of- exchange-rate-volatility-on-economic-growth-evidence-from-ghana/ and https://www.scirp.org/journal/paperinformation.aspx?paperid=95492) Extract E There is a lot of money in chocolate but the growers of cocoa see very little of it. In 2020 the chocolate retail industry was worth £78 billion, but Ghana – the world’s second largest cocoa producer – earned just over £1 billion. Cocoa farmers in Ghana now make roughly $1 a day (this often includes being subsidised by the Ghanaian government). This is a familiar pattern for many African countries where the economy 5 is still shaped by a colonial relationship in which they export commodities to be processed elsewhere. Ghana currently processes about 30% of its cocoa crop into chocolate, meaning that the exports can earn high prices. Despite plans for expanding the domestic chocolate industry there are still many obstacles in the way. The equipment to make chocolate is 10 very expensive and there is neither a local sugar nor dairy industry. Imported milk and sugar would increase the cost of production significantly, with the added problem that foreign currency would be needed. Producing chocolate requires consistent refrigeration, and the high cost of the equipment to achieve that is a major obstacle for entrepreneurs without substantial funds. There is an inconsistent supply of energy in rural parts of 15 Ghana. An alternative, making teas and wines using cocoa, can make 20 times more revenue than the raw beans, but they do not have the mass market appeal and high profits of chocolate. Access to funds is a big problem and one farmer, Nana Aduna, says that high interest rates on bank loans are an issue for start-up businesses and at the moment he cannot 20 afford to borrow money. “You cannot grow a business when you have to service interest rates of 18%–20% or even more,” he says. But the government has pledged to address these structural issues, using supply side policies. The Trade and Industry Minister announced that industrialisation is the focus of government policy. “It only makes sense that the most important commodity in 25 our country, which is cocoa… should become the target for a major programme of industrialisation,” he says. The ‘One District One Factory’ programme aims to kickstart industrialisation by providing the infrastructure for Ghana’s farms, by establishing processing plants in some of the big cocoa-growing areas. It has become easier for the private sector to invest in food 30 processing, and there is a big tax rebate available to processing companies that set up in the country’s enterprise zones – designated areas to encourage economic activity – in a bid to help them export. (Source: adapted from https://www.newsbreak.com/news/2201853748349/ghana-s- farmers-eye-sweet-success-from-chocolate and https://www.indepthnews.net/ index.php/the-world/africa/4495-ghana-starts-with-cocoa-to-end-neocolonial- trading-ties and https://www.brookings.edu/blog/africa-in-focus/2020/09/03/ pathways-to-structural-transformation-of-the-ghanaian-economy-and- some-roadblocks/ and https://www.ghanaweb.com/GhanaHomePage/ business/Speculators-driving-interbank-retail-FX-rates-gap-1468375) Extract F A new trade bloc for Africa The African Continental Free Trade Agreement (AfCFTA) has been signed by all 55 member states of the African Union, including Ghana, Nigeria, and South Africa. This brings together 1.2 billion people with a combined gross domestic product (GDP) of more than $2 trillion as of 2023. 5 The agreement commits countries to removing tariffs on 90% of goods, with other goods to be phased in later. The agreement also liberalises services and aims to tackle non-tariff barriers which reduce trade between African countries, such as long delays at the borders. (Source adapted from: https://www.aljazeera.com/economy/2018/3/20/ african-continental-free-trade-area-what-you-need-to-know)
(e) Evaluate the microeconomic and macroeconomic effects of Ghana joining the African Continental Free Trade Agreement (Extract F). (25)
June 2023 · AS Paper 1 · Q1(b) 2 marks AO2=2 Short answer government intervention in markets
Data and extracts for question 11 In 2021, energy regulator Ofgem announced that the maximum price of energy will rise from £ 1 277 to £ 1 971 a year, for the average household bill. (Source: adapted from https://www.moneysavingexpert.com/ utilities/what-is-the-energy-price-cap/)
(b) Annotate the diagram below to show the original and new maximum price in this market. (2) Average annual household bill (£) S P1 D 0 Q1 Quantity of energy per household
June 2023 · AS Paper 1 · Q2(a) 3 marks AO1=1, AO2=1, AO3=1 Short answer elasticity of supply
Data and extracts for question 22 The world’s largest producer of natural gas is the USA. In 2021 production fell even though the price increased.
(a) Using the data provided, explain one likely factor that may influence the price elasticity of supply of gas. (3)
June 2023 · AS Paper 1 · Q4(a) 3 marks AO1=1, AO2=1, AO3=1 Short answer rational decision making and behavioural economicsprice mechanism and surplus
Data and extracts for question 44 During 2021 the UK experienced severe shortages of crisps, petrol and many other items. (Source: adapted from https://www.independent.co.uk/news/business/news/ uk-shortages-covid-brexit-supply-chain-b1968458.html)
(a) Explain one reason why it is rational for a firm to raise prices when there is excess demand. (3)
June 2023 · AS Paper 1 · Q5(a) 2 marks AO1=1, AO2=1 Definition economic systems
Data and extracts for question 55 During the global health crisis, 11.7 million jobs were furloughed, costing the UK Government £70 billion. This meant people were paid by the government 80% of their wages even though they did not work. Some private sector employers continued to pay the remaining 20 %. (Source: adapted from https://commonslibrary.parliament.uk/ examining-the-end-of-the-furlough-scheme)
(a) With reference to the above information, define the term ‘mixed economy’. (2)
June 2023 · AS Paper 1 · Q6(a) 5 marks AO1=1, AO2=2, AO3=2 Short answer price elasticity of demand
Data and extracts for question 6The market for television content Figure 1: Elasticities of demand for streamed television services, UK, 2021 Price elasticity of demand -0.6 Income elasticity of demand 1.6 (Source: adapted from https://www.consultancy.uk/news/24986/covid-19- presents-netflix-with-chance-to-hike-prices) Figure 2: Market shares of streamed content providers, Europe, 2021 39% Netflix 29% Amazon 9% Apple TV+ 7% Disney+ 3% DZN 2% Viaplay 1% TIM Vision 1% Sky Now Tv 1% HBO 1% IPLA 7% Others 0% 5% 10% 15% 20% 25% 30% 35% 40% 45% Market share (Source: adapted from Statista 2021) Extract A The growth of streamed television content Netflix currently has 13 million UK subscribers, who typically pay £9.99 a month to the US based private sector firm. At this price, up to two users can view the television content at the same time. The demand for individual firms’ streamed television content boomed when people were forced to stay at home and has only begun to slow recently as more 5 firms enter the market e.g. Amazon Prime Video. The launch of Disney+ at the end of 2019, including original content such as the £74 million Star Wars TV spin-off The Mandalorian, resulted in the service adding more UK subscribers in a year in 2020 than any other streaming platform has ever managed. However, the costs of providing streaming television content have risen. Consumers now 10 expect original content, for example Stranger Things which costs around £10 million an episode to make. Furthermore, advertising in a saturated market is expensive. In 2021, Netflix put up the price of its most-popular package by £1 a month to £9.99. Fortunately for Netflix, its subscriber demand has proven price inelastic. Just 3% of customers in a survey said they would definitely cancel their subscription after Netflix’s 15 latest price rise. (Source: adapted from ‘As UK hits peak, Netflix the streaming giant will have to work harder’, The Guardian, Monday 3 January 2022) Extract B Is television content a public good? Public service broadcasting in the UK is made up of a number of parts. First, there are the main UK-wide public service broadcasters (PSBs). There is the publicly funded BBC, and the publicly owned Channel 4 which is funded through advertisements. The BBC was established in 1922 by a Royal Charter. It is mainly funded through the TV 5 licence fee, which costs £159 a year and is a compulsory charge for those who watch live TV on any device. Live TV and catch-up services are free to view and do not restrict household usage. Without the licence fee very few people would pay due to the free rider problem. The BBC’s Charter sets out its five public purposes: 10 • To provide impartial news and information • To support learning for people of all ages • To show the most creative, highest quality and distinctive televised content • To provide content for minority groups which would not be profitable for a private firm 15 • To reflect the UK, its culture and values to the world. (Source: adapted from https://publications.parliament.uk/pa/cm5801/cmselect/ cmcumeds/156/15604, and ‘BBC licence fee to be abolished in 2027 and funding frozen’, The Guardian, Sunday 16 January 2022) Extract C The environmental impact of streaming television content The carbon footprint produced by watching a month of Netflix programmes is equivalent to driving a car to Saturn. Every activity in the chain required to stream video, from the use of huge datacentres and transmission over Wi-Fi and broadband to watching the content on a device, requires electricity. The majority of this is generated by emitting CO2. 5 Modern flatscreen televisions use significant amounts of energy. There’s very little a government can do about this in a free market dominated by US firms. The focus of any government intervention could be to encourage alternative forms of entertainment and recreation, support the development of more energy efficient devices, to improve information on the environmental effects or to use regulation to limit 10 viewing hours. (Source: adapted from ‘Streaming’s dirty secret: how viewing Netflix top 10 creates vast quantity of CO2’, The Guardian, Friday 29 October 2021)
(a) With reference to Figure 1 and Extract A, explain the relationship between price elasticity of demand and total revenue. (5)
June 2023 · AS Paper 1 · Q6(b) 6 marks AO1=2, AO2=2, AO3=2 Short answer externalities
Data and extracts for question 6The market for television content Figure 1: Elasticities of demand for streamed television services, UK, 2021 Price elasticity of demand -0.6 Income elasticity of demand 1.6 (Source: adapted from https://www.consultancy.uk/news/24986/covid-19- presents-netflix-with-chance-to-hike-prices) Figure 2: Market shares of streamed content providers, Europe, 2021 39% Netflix 29% Amazon 9% Apple TV+ 7% Disney+ 3% DZN 2% Viaplay 1% TIM Vision 1% Sky Now Tv 1% HBO 1% IPLA 7% Others 0% 5% 10% 15% 20% 25% 30% 35% 40% 45% Market share (Source: adapted from Statista 2021) Extract A The growth of streamed television content Netflix currently has 13 million UK subscribers, who typically pay £9.99 a month to the US based private sector firm. At this price, up to two users can view the television content at the same time. The demand for individual firms’ streamed television content boomed when people were forced to stay at home and has only begun to slow recently as more 5 firms enter the market e.g. Amazon Prime Video. The launch of Disney+ at the end of 2019, including original content such as the £74 million Star Wars TV spin-off The Mandalorian, resulted in the service adding more UK subscribers in a year in 2020 than any other streaming platform has ever managed. However, the costs of providing streaming television content have risen. Consumers now 10 expect original content, for example Stranger Things which costs around £10 million an episode to make. Furthermore, advertising in a saturated market is expensive. In 2021, Netflix put up the price of its most-popular package by £1 a month to £9.99. Fortunately for Netflix, its subscriber demand has proven price inelastic. Just 3% of customers in a survey said they would definitely cancel their subscription after Netflix’s 15 latest price rise. (Source: adapted from ‘As UK hits peak, Netflix the streaming giant will have to work harder’, The Guardian, Monday 3 January 2022) Extract B Is television content a public good? Public service broadcasting in the UK is made up of a number of parts. First, there are the main UK-wide public service broadcasters (PSBs). There is the publicly funded BBC, and the publicly owned Channel 4 which is funded through advertisements. The BBC was established in 1922 by a Royal Charter. It is mainly funded through the TV 5 licence fee, which costs £159 a year and is a compulsory charge for those who watch live TV on any device. Live TV and catch-up services are free to view and do not restrict household usage. Without the licence fee very few people would pay due to the free rider problem. The BBC’s Charter sets out its five public purposes: 10 • To provide impartial news and information • To support learning for people of all ages • To show the most creative, highest quality and distinctive televised content • To provide content for minority groups which would not be profitable for a private firm 15 • To reflect the UK, its culture and values to the world. (Source: adapted from https://publications.parliament.uk/pa/cm5801/cmselect/ cmcumeds/156/15604, and ‘BBC licence fee to be abolished in 2027 and funding frozen’, The Guardian, Sunday 16 January 2022) Extract C The environmental impact of streaming television content The carbon footprint produced by watching a month of Netflix programmes is equivalent to driving a car to Saturn. Every activity in the chain required to stream video, from the use of huge datacentres and transmission over Wi-Fi and broadband to watching the content on a device, requires electricity. The majority of this is generated by emitting CO2. 5 Modern flatscreen televisions use significant amounts of energy. There’s very little a government can do about this in a free market dominated by US firms. The focus of any government intervention could be to encourage alternative forms of entertainment and recreation, support the development of more energy efficient devices, to improve information on the environmental effects or to use regulation to limit 10 viewing hours. (Source: adapted from ‘Streaming’s dirty secret: how viewing Netflix top 10 creates vast quantity of CO2’, The Guardian, Friday 29 October 2021)
(b) With reference to Extract B, explain two external benefits associated with the consumption of ‘public service broadcasting’ (line 2). (6)
June 2023 · AS Paper 1 · Q6(c) 10 marks AO1=2, AO2=2, AO3=2, AO4=4 10-mark response public goods and information gaps
Data and extracts for question 6The market for television content Figure 1: Elasticities of demand for streamed television services, UK, 2021 Price elasticity of demand -0.6 Income elasticity of demand 1.6 (Source: adapted from https://www.consultancy.uk/news/24986/covid-19- presents-netflix-with-chance-to-hike-prices) Figure 2: Market shares of streamed content providers, Europe, 2021 39% Netflix 29% Amazon 9% Apple TV+ 7% Disney+ 3% DZN 2% Viaplay 1% TIM Vision 1% Sky Now Tv 1% HBO 1% IPLA 7% Others 0% 5% 10% 15% 20% 25% 30% 35% 40% 45% Market share (Source: adapted from Statista 2021) Extract A The growth of streamed television content Netflix currently has 13 million UK subscribers, who typically pay £9.99 a month to the US based private sector firm. At this price, up to two users can view the television content at the same time. The demand for individual firms’ streamed television content boomed when people were forced to stay at home and has only begun to slow recently as more 5 firms enter the market e.g. Amazon Prime Video. The launch of Disney+ at the end of 2019, including original content such as the £74 million Star Wars TV spin-off The Mandalorian, resulted in the service adding more UK subscribers in a year in 2020 than any other streaming platform has ever managed. However, the costs of providing streaming television content have risen. Consumers now 10 expect original content, for example Stranger Things which costs around £10 million an episode to make. Furthermore, advertising in a saturated market is expensive. In 2021, Netflix put up the price of its most-popular package by £1 a month to £9.99. Fortunately for Netflix, its subscriber demand has proven price inelastic. Just 3% of customers in a survey said they would definitely cancel their subscription after Netflix’s 15 latest price rise. (Source: adapted from ‘As UK hits peak, Netflix the streaming giant will have to work harder’, The Guardian, Monday 3 January 2022) Extract B Is television content a public good? Public service broadcasting in the UK is made up of a number of parts. First, there are the main UK-wide public service broadcasters (PSBs). There is the publicly funded BBC, and the publicly owned Channel 4 which is funded through advertisements. The BBC was established in 1922 by a Royal Charter. It is mainly funded through the TV 5 licence fee, which costs £159 a year and is a compulsory charge for those who watch live TV on any device. Live TV and catch-up services are free to view and do not restrict household usage. Without the licence fee very few people would pay due to the free rider problem. The BBC’s Charter sets out its five public purposes: 10 • To provide impartial news and information • To support learning for people of all ages • To show the most creative, highest quality and distinctive televised content • To provide content for minority groups which would not be profitable for a private firm 15 • To reflect the UK, its culture and values to the world. (Source: adapted from https://publications.parliament.uk/pa/cm5801/cmselect/ cmcumeds/156/15604, and ‘BBC licence fee to be abolished in 2027 and funding frozen’, The Guardian, Sunday 16 January 2022) Extract C The environmental impact of streaming television content The carbon footprint produced by watching a month of Netflix programmes is equivalent to driving a car to Saturn. Every activity in the chain required to stream video, from the use of huge datacentres and transmission over Wi-Fi and broadband to watching the content on a device, requires electricity. The majority of this is generated by emitting CO2. 5 Modern flatscreen televisions use significant amounts of energy. There’s very little a government can do about this in a free market dominated by US firms. The focus of any government intervention could be to encourage alternative forms of entertainment and recreation, support the development of more energy efficient devices, to improve information on the environmental effects or to use regulation to limit 10 viewing hours. (Source: adapted from ‘Streaming’s dirty secret: how viewing Netflix top 10 creates vast quantity of CO2’, The Guardian, Friday 29 October 2021)
(c) ‘Television content is a public good’ (Extract B). Assess this statement. (10)
June 2023 · AS Paper 1 · Q6(d) 4 marks AO1=2, AO2=2 Short answer price elasticity of demand
Data and extracts for question 6The market for television content Figure 1: Elasticities of demand for streamed television services, UK, 2021 Price elasticity of demand -0.6 Income elasticity of demand 1.6 (Source: adapted from https://www.consultancy.uk/news/24986/covid-19- presents-netflix-with-chance-to-hike-prices) Figure 2: Market shares of streamed content providers, Europe, 2021 39% Netflix 29% Amazon 9% Apple TV+ 7% Disney+ 3% DZN 2% Viaplay 1% TIM Vision 1% Sky Now Tv 1% HBO 1% IPLA 7% Others 0% 5% 10% 15% 20% 25% 30% 35% 40% 45% Market share (Source: adapted from Statista 2021) Extract A The growth of streamed television content Netflix currently has 13 million UK subscribers, who typically pay £9.99 a month to the US based private sector firm. At this price, up to two users can view the television content at the same time. The demand for individual firms’ streamed television content boomed when people were forced to stay at home and has only begun to slow recently as more 5 firms enter the market e.g. Amazon Prime Video. The launch of Disney+ at the end of 2019, including original content such as the £74 million Star Wars TV spin-off The Mandalorian, resulted in the service adding more UK subscribers in a year in 2020 than any other streaming platform has ever managed. However, the costs of providing streaming television content have risen. Consumers now 10 expect original content, for example Stranger Things which costs around £10 million an episode to make. Furthermore, advertising in a saturated market is expensive. In 2021, Netflix put up the price of its most-popular package by £1 a month to £9.99. Fortunately for Netflix, its subscriber demand has proven price inelastic. Just 3% of customers in a survey said they would definitely cancel their subscription after Netflix’s 15 latest price rise. (Source: adapted from ‘As UK hits peak, Netflix the streaming giant will have to work harder’, The Guardian, Monday 3 January 2022) Extract B Is television content a public good? Public service broadcasting in the UK is made up of a number of parts. First, there are the main UK-wide public service broadcasters (PSBs). There is the publicly funded BBC, and the publicly owned Channel 4 which is funded through advertisements. The BBC was established in 1922 by a Royal Charter. It is mainly funded through the TV 5 licence fee, which costs £159 a year and is a compulsory charge for those who watch live TV on any device. Live TV and catch-up services are free to view and do not restrict household usage. Without the licence fee very few people would pay due to the free rider problem. The BBC’s Charter sets out its five public purposes: 10 • To provide impartial news and information • To support learning for people of all ages • To show the most creative, highest quality and distinctive televised content • To provide content for minority groups which would not be profitable for a private firm 15 • To reflect the UK, its culture and values to the world. (Source: adapted from https://publications.parliament.uk/pa/cm5801/cmselect/ cmcumeds/156/15604, and ‘BBC licence fee to be abolished in 2027 and funding frozen’, The Guardian, Sunday 16 January 2022) Extract C The environmental impact of streaming television content The carbon footprint produced by watching a month of Netflix programmes is equivalent to driving a car to Saturn. Every activity in the chain required to stream video, from the use of huge datacentres and transmission over Wi-Fi and broadband to watching the content on a device, requires electricity. The majority of this is generated by emitting CO2. 5 Modern flatscreen televisions use significant amounts of energy. There’s very little a government can do about this in a free market dominated by US firms. The focus of any government intervention could be to encourage alternative forms of entertainment and recreation, support the development of more energy efficient devices, to improve information on the environmental effects or to use regulation to limit 10 viewing hours. (Source: adapted from ‘Streaming’s dirty secret: how viewing Netflix top 10 creates vast quantity of CO2’, The Guardian, Friday 29 October 2021)
(d) Using examples from the information provided, explain what is meant by both ‘substitutes’ and ‘complementary goods’. (4)
June 2023 · AS Paper 1 · Q6(e) 15 marks AO1=3, AO2=3, AO3=3, AO4=6 15-mark response supply and demand
Data and extracts for question 6The market for television content Figure 1: Elasticities of demand for streamed television services, UK, 2021 Price elasticity of demand -0.6 Income elasticity of demand 1.6 (Source: adapted from https://www.consultancy.uk/news/24986/covid-19- presents-netflix-with-chance-to-hike-prices) Figure 2: Market shares of streamed content providers, Europe, 2021 39% Netflix 29% Amazon 9% Apple TV+ 7% Disney+ 3% DZN 2% Viaplay 1% TIM Vision 1% Sky Now Tv 1% HBO 1% IPLA 7% Others 0% 5% 10% 15% 20% 25% 30% 35% 40% 45% Market share (Source: adapted from Statista 2021) Extract A The growth of streamed television content Netflix currently has 13 million UK subscribers, who typically pay £9.99 a month to the US based private sector firm. At this price, up to two users can view the television content at the same time. The demand for individual firms’ streamed television content boomed when people were forced to stay at home and has only begun to slow recently as more 5 firms enter the market e.g. Amazon Prime Video. The launch of Disney+ at the end of 2019, including original content such as the £74 million Star Wars TV spin-off The Mandalorian, resulted in the service adding more UK subscribers in a year in 2020 than any other streaming platform has ever managed. However, the costs of providing streaming television content have risen. Consumers now 10 expect original content, for example Stranger Things which costs around £10 million an episode to make. Furthermore, advertising in a saturated market is expensive. In 2021, Netflix put up the price of its most-popular package by £1 a month to £9.99. Fortunately for Netflix, its subscriber demand has proven price inelastic. Just 3% of customers in a survey said they would definitely cancel their subscription after Netflix’s 15 latest price rise. (Source: adapted from ‘As UK hits peak, Netflix the streaming giant will have to work harder’, The Guardian, Monday 3 January 2022) Extract B Is television content a public good? Public service broadcasting in the UK is made up of a number of parts. First, there are the main UK-wide public service broadcasters (PSBs). There is the publicly funded BBC, and the publicly owned Channel 4 which is funded through advertisements. The BBC was established in 1922 by a Royal Charter. It is mainly funded through the TV 5 licence fee, which costs £159 a year and is a compulsory charge for those who watch live TV on any device. Live TV and catch-up services are free to view and do not restrict household usage. Without the licence fee very few people would pay due to the free rider problem. The BBC’s Charter sets out its five public purposes: 10 • To provide impartial news and information • To support learning for people of all ages • To show the most creative, highest quality and distinctive televised content • To provide content for minority groups which would not be profitable for a private firm 15 • To reflect the UK, its culture and values to the world. (Source: adapted from https://publications.parliament.uk/pa/cm5801/cmselect/ cmcumeds/156/15604, and ‘BBC licence fee to be abolished in 2027 and funding frozen’, The Guardian, Sunday 16 January 2022) Extract C The environmental impact of streaming television content The carbon footprint produced by watching a month of Netflix programmes is equivalent to driving a car to Saturn. Every activity in the chain required to stream video, from the use of huge datacentres and transmission over Wi-Fi and broadband to watching the content on a device, requires electricity. The majority of this is generated by emitting CO2. 5 Modern flatscreen televisions use significant amounts of energy. There’s very little a government can do about this in a free market dominated by US firms. The focus of any government intervention could be to encourage alternative forms of entertainment and recreation, support the development of more energy efficient devices, to improve information on the environmental effects or to use regulation to limit 10 viewing hours. (Source: adapted from ‘Streaming’s dirty secret: how viewing Netflix top 10 creates vast quantity of CO2’, The Guardian, Friday 29 October 2021)
(e) Discuss likely reasons why the market price of streaming television content is increasing. Draw a supply and demand diagram to support your answer. (15)
June 2023 · AS Paper 1 · Q6(f) 20 marks AO1=4, AO2=4, AO3=6, AO4=6 20-mark essay Either/or government intervention in marketsexternalities
Data and extracts for question 6The market for television content Figure 1: Elasticities of demand for streamed television services, UK, 2021 Price elasticity of demand -0.6 Income elasticity of demand 1.6 (Source: adapted from https://www.consultancy.uk/news/24986/covid-19- presents-netflix-with-chance-to-hike-prices) Figure 2: Market shares of streamed content providers, Europe, 2021 39% Netflix 29% Amazon 9% Apple TV+ 7% Disney+ 3% DZN 2% Viaplay 1% TIM Vision 1% Sky Now Tv 1% HBO 1% IPLA 7% Others 0% 5% 10% 15% 20% 25% 30% 35% 40% 45% Market share (Source: adapted from Statista 2021) Extract A The growth of streamed television content Netflix currently has 13 million UK subscribers, who typically pay £9.99 a month to the US based private sector firm. At this price, up to two users can view the television content at the same time. The demand for individual firms’ streamed television content boomed when people were forced to stay at home and has only begun to slow recently as more 5 firms enter the market e.g. Amazon Prime Video. The launch of Disney+ at the end of 2019, including original content such as the £74 million Star Wars TV spin-off The Mandalorian, resulted in the service adding more UK subscribers in a year in 2020 than any other streaming platform has ever managed. However, the costs of providing streaming television content have risen. Consumers now 10 expect original content, for example Stranger Things which costs around £10 million an episode to make. Furthermore, advertising in a saturated market is expensive. In 2021, Netflix put up the price of its most-popular package by £1 a month to £9.99. Fortunately for Netflix, its subscriber demand has proven price inelastic. Just 3% of customers in a survey said they would definitely cancel their subscription after Netflix’s 15 latest price rise. (Source: adapted from ‘As UK hits peak, Netflix the streaming giant will have to work harder’, The Guardian, Monday 3 January 2022) Extract B Is television content a public good? Public service broadcasting in the UK is made up of a number of parts. First, there are the main UK-wide public service broadcasters (PSBs). There is the publicly funded BBC, and the publicly owned Channel 4 which is funded through advertisements. The BBC was established in 1922 by a Royal Charter. It is mainly funded through the TV 5 licence fee, which costs £159 a year and is a compulsory charge for those who watch live TV on any device. Live TV and catch-up services are free to view and do not restrict household usage. Without the licence fee very few people would pay due to the free rider problem. The BBC’s Charter sets out its five public purposes: 10 • To provide impartial news and information • To support learning for people of all ages • To show the most creative, highest quality and distinctive televised content • To provide content for minority groups which would not be profitable for a private firm 15 • To reflect the UK, its culture and values to the world. (Source: adapted from https://publications.parliament.uk/pa/cm5801/cmselect/ cmcumeds/156/15604, and ‘BBC licence fee to be abolished in 2027 and funding frozen’, The Guardian, Sunday 16 January 2022) Extract C The environmental impact of streaming television content The carbon footprint produced by watching a month of Netflix programmes is equivalent to driving a car to Saturn. Every activity in the chain required to stream video, from the use of huge datacentres and transmission over Wi-Fi and broadband to watching the content on a device, requires electricity. The majority of this is generated by emitting CO2. 5 Modern flatscreen televisions use significant amounts of energy. There’s very little a government can do about this in a free market dominated by US firms. The focus of any government intervention could be to encourage alternative forms of entertainment and recreation, support the development of more energy efficient devices, to improve information on the environmental effects or to use regulation to limit 10 viewing hours. (Source: adapted from ‘Streaming’s dirty secret: how viewing Netflix top 10 creates vast quantity of CO2’, The Guardian, Friday 29 October 2021)
(f) Evaluate possible methods of government intervention to reduce the environmental damage caused by the consumption of television content. (20)
June 2023 · AS Paper 1 · Q6(g) 20 marks AO1=4, AO2=4, AO3=6, AO4=6 20-mark essay Either/or economic systemsexternalities
Data and extracts for question 6The market for television content Figure 1: Elasticities of demand for streamed television services, UK, 2021 Price elasticity of demand -0.6 Income elasticity of demand 1.6 (Source: adapted from https://www.consultancy.uk/news/24986/covid-19- presents-netflix-with-chance-to-hike-prices) Figure 2: Market shares of streamed content providers, Europe, 2021 39% Netflix 29% Amazon 9% Apple TV+ 7% Disney+ 3% DZN 2% Viaplay 1% TIM Vision 1% Sky Now Tv 1% HBO 1% IPLA 7% Others 0% 5% 10% 15% 20% 25% 30% 35% 40% 45% Market share (Source: adapted from Statista 2021) Extract A The growth of streamed television content Netflix currently has 13 million UK subscribers, who typically pay £9.99 a month to the US based private sector firm. At this price, up to two users can view the television content at the same time. The demand for individual firms’ streamed television content boomed when people were forced to stay at home and has only begun to slow recently as more 5 firms enter the market e.g. Amazon Prime Video. The launch of Disney+ at the end of 2019, including original content such as the £74 million Star Wars TV spin-off The Mandalorian, resulted in the service adding more UK subscribers in a year in 2020 than any other streaming platform has ever managed. However, the costs of providing streaming television content have risen. Consumers now 10 expect original content, for example Stranger Things which costs around £10 million an episode to make. Furthermore, advertising in a saturated market is expensive. In 2021, Netflix put up the price of its most-popular package by £1 a month to £9.99. Fortunately for Netflix, its subscriber demand has proven price inelastic. Just 3% of customers in a survey said they would definitely cancel their subscription after Netflix’s 15 latest price rise. (Source: adapted from ‘As UK hits peak, Netflix the streaming giant will have to work harder’, The Guardian, Monday 3 January 2022) Extract B Is television content a public good? Public service broadcasting in the UK is made up of a number of parts. First, there are the main UK-wide public service broadcasters (PSBs). There is the publicly funded BBC, and the publicly owned Channel 4 which is funded through advertisements. The BBC was established in 1922 by a Royal Charter. It is mainly funded through the TV 5 licence fee, which costs £159 a year and is a compulsory charge for those who watch live TV on any device. Live TV and catch-up services are free to view and do not restrict household usage. Without the licence fee very few people would pay due to the free rider problem. The BBC’s Charter sets out its five public purposes: 10 • To provide impartial news and information • To support learning for people of all ages • To show the most creative, highest quality and distinctive televised content • To provide content for minority groups which would not be profitable for a private firm 15 • To reflect the UK, its culture and values to the world. (Source: adapted from https://publications.parliament.uk/pa/cm5801/cmselect/ cmcumeds/156/15604, and ‘BBC licence fee to be abolished in 2027 and funding frozen’, The Guardian, Sunday 16 January 2022) Extract C The environmental impact of streaming television content The carbon footprint produced by watching a month of Netflix programmes is equivalent to driving a car to Saturn. Every activity in the chain required to stream video, from the use of huge datacentres and transmission over Wi-Fi and broadband to watching the content on a device, requires electricity. The majority of this is generated by emitting CO2. 5 Modern flatscreen televisions use significant amounts of energy. There’s very little a government can do about this in a free market dominated by US firms. The focus of any government intervention could be to encourage alternative forms of entertainment and recreation, support the development of more energy efficient devices, to improve information on the environmental effects or to use regulation to limit 10 viewing hours. (Source: adapted from ‘Streaming’s dirty secret: how viewing Netflix top 10 creates vast quantity of CO2’, The Guardian, Friday 29 October 2021)
(g) Evaluate the possible disadvantages of a free market approach to the provision of television content. (20)
June 2023 · AS Paper 2 · Q1(a) 3 marks AO1=1, AO2=1, AO3=1 Short answer supply side policies
Data and extracts for question 11 Between 2019 and 2020 the UK Government increased its expenditure on healthcare from £175.1 billion to £219.9 billion.
(a) Explain one likely impact of this interventionist supply-side policy on aggregate supply in the UK. (3)
June 2023 · AS Paper 2 · Q3(b) 3 marks AO1=1, AO2=1, AO3=1 Calculation fiscal and monetary policy
Data and extracts for question 33 The chart below shows areas of UK Government tax revenues for 2021–22. The total tax revenue for the year was £820 billion. Other Government revenue £88 billion Income tax £198 billion Other taxes £84 billion Council tax £40 billion Business rates £24 billion National Insurance contributions £147 billion VAT £151 billion Excise duties £48 billion Corporation tax £40 billion (Source adapted from: https://assets.publishing.service.gov.uk/government/uploads/ system/uploads/attachment_data/file/966868/BUDGET_2021_-_web.pdf)
(b) Total UK Government tax revenue for 2021–22: £820 billion. Total UK Government expenditure for 2021–22: £1 053 billion. Using these figures, explain the likely impact of the above data on the UK Government’s budget balance. (3)
June 2023 · AS Paper 2 · Q5(b) 3 marks AO1=1, AO2=1, AO3=1 Short answer economic growth and the trade cycle
Data and extracts for question 55 The chart below shows UK real GDP growth rate (%), Quarter 1 (Q1) 2019 to Quarter 3 (Q3) 2021. 20 17.6 % 10 5.4 1.5 1.1 0.6 0.5 0.1 0 0 -1.3 -2.6 -10 -19.4 -20 Q1 Q2 Q3 Q4 Q1 Q2 Q3 Q4 Q1 Q2 Q3 2019 2019 2019 2019 2020 2020 2020 2020 2021 2021 2021 (Source adapted from: https://tradingeconomics.com/united-kingdom/gdp-growth)
(b) With reference to the chart, explain one likely benefit of economic growth to firms. (3)
June 2023 · AS Paper 2 · Q6(a) 4 marks AO1=2, AO2=2 Short answer balance of payments
Data and extracts for question 6UK balance of trade and inflation Figure 1: UK balance of trade in goods and services, January 2020 to October 2021 8 £ billion 6 4 2 0 -2 -4 -6 -8 Jan 2020 Apr 2020 Jul 2020 Oct 2020 Jan 2021 Apr 2021 Jul 2021 Oct 2021 (Source adapted from: https://tradingeconomics.com/united-kingdom/balance-of-trade) Figure 2: UK inflation rate as measured by annual percentage changes in the Consumer Prices Index (CPI), January 2020 to October 2021 6 % 5 4.2 4 3.2 3.1 3 2.5 2.1 2.0 1.8 2 1.7 1.5 1.5 1.0 0.8 1 0.7 0.7 0.6 0.7 0.4 0.5 0.6 0.5 0.3 0.2 0 Jan 2020 Apr 2020 Jul 2020 Oct 2020 Jan 2021 Apr 2021 Jul 2021 Oct 2021 (Source adapted from: https://tradingeconomics.com/united-kingdom/inflation-cpi) Extract A Balance of trade in goods and services Rising imports from non-EU countries have increased the UK’s trade deficit in the third quarter of 2021. This was as a result of the UK strengthening its trading relationships with countries outside the EU. An 11.2% increase in imports from non-EU countries has increased the UK’s trade deficit to nearly £7 billion. 5 Moreover, exports to non-EU countries were £0.8 billion lower than exports to EU countries. Despite the overall trade balance being in deficit, the UK services trade balance is in surplus, reflecting the economy’s heavy reliance on services. The trade in 10 services surplus increased by £2.2 billion to £35.6 billion. This was mostly as a result of an increase in the export of financial services. (Source: adapted from https://www.cityam.com/swelling- non-eu-imports-widens-uk-trade-deficit) Extract B Inflation In December 2021 the rate of inflation in the UK rose to 5.4%, its highest rate in 30 years. The speed of increase has taken economists by surprise. The Bank of England expected inflation to peak at this rate, but not until April 2022. The rate was more than two-and-a-half times its 2% inflation target. 5 Transport costs were the biggest contributor to rising inflation, with petrol prices increasing by over 5%. Moreover, supply chain bottlenecks constrained access to raw materials and limited the number of new products being sold in the market. At the same time, economists warned that the demand for goods and services in the UK economy was quickly increasing. This was a result of the easing of the 10 restrictions associated with the global health crisis. The high rate of inflation would normally be enough to prompt a significant increase in the base rate of interest by the Bank of England’s Monetary Policy Committee (MPC). Despite the lower rates of economic growth, the MPC increased the base interest rate from 0.1% to 0.5% in February 2022. 15 (Source: adapted from ‘UK inflation hits highest level in a decade’, FT, https://www.ft.com/content/dd5edcd1-2e70-4910-b642- 269574b4bcdd; ‘What does the UK’s soaring inflation rate mean for you?’, The Guardian, https://www.theguardian.com/business/2021/ dec/15/what-does-uk-soaring-inflation-rate-mean)
(a) With reference to Figure 1, explain the term ‘balance of trade in goods and services’. (4)
June 2023 · AS Paper 2 · Q6(b) 5 marks AO1=1, AO2=2, AO3=2 Short answer inflation
Data and extracts for question 6UK balance of trade and inflation Figure 1: UK balance of trade in goods and services, January 2020 to October 2021 8 £ billion 6 4 2 0 -2 -4 -6 -8 Jan 2020 Apr 2020 Jul 2020 Oct 2020 Jan 2021 Apr 2021 Jul 2021 Oct 2021 (Source adapted from: https://tradingeconomics.com/united-kingdom/balance-of-trade) Figure 2: UK inflation rate as measured by annual percentage changes in the Consumer Prices Index (CPI), January 2020 to October 2021 6 % 5 4.2 4 3.2 3.1 3 2.5 2.1 2.0 1.8 2 1.7 1.5 1.5 1.0 0.8 1 0.7 0.7 0.6 0.7 0.4 0.5 0.6 0.5 0.3 0.2 0 Jan 2020 Apr 2020 Jul 2020 Oct 2020 Jan 2021 Apr 2021 Jul 2021 Oct 2021 (Source adapted from: https://tradingeconomics.com/united-kingdom/inflation-cpi) Extract A Balance of trade in goods and services Rising imports from non-EU countries have increased the UK’s trade deficit in the third quarter of 2021. This was as a result of the UK strengthening its trading relationships with countries outside the EU. An 11.2% increase in imports from non-EU countries has increased the UK’s trade deficit to nearly £7 billion. 5 Moreover, exports to non-EU countries were £0.8 billion lower than exports to EU countries. Despite the overall trade balance being in deficit, the UK services trade balance is in surplus, reflecting the economy’s heavy reliance on services. The trade in 10 services surplus increased by £2.2 billion to £35.6 billion. This was mostly as a result of an increase in the export of financial services. (Source: adapted from https://www.cityam.com/swelling- non-eu-imports-widens-uk-trade-deficit) Extract B Inflation In December 2021 the rate of inflation in the UK rose to 5.4%, its highest rate in 30 years. The speed of increase has taken economists by surprise. The Bank of England expected inflation to peak at this rate, but not until April 2022. The rate was more than two-and-a-half times its 2% inflation target. 5 Transport costs were the biggest contributor to rising inflation, with petrol prices increasing by over 5%. Moreover, supply chain bottlenecks constrained access to raw materials and limited the number of new products being sold in the market. At the same time, economists warned that the demand for goods and services in the UK economy was quickly increasing. This was a result of the easing of the 10 restrictions associated with the global health crisis. The high rate of inflation would normally be enough to prompt a significant increase in the base rate of interest by the Bank of England’s Monetary Policy Committee (MPC). Despite the lower rates of economic growth, the MPC increased the base interest rate from 0.1% to 0.5% in February 2022. 15 (Source: adapted from ‘UK inflation hits highest level in a decade’, FT, https://www.ft.com/content/dd5edcd1-2e70-4910-b642- 269574b4bcdd; ‘What does the UK’s soaring inflation rate mean for you?’, The Guardian, https://www.theguardian.com/business/2021/ dec/15/what-does-uk-soaring-inflation-rate-mean)
(b) With reference to Figure 2, explain how the CPI inflation rate is measured. Refer to the concept of weights in your answer. (5)
June 2023 · AS Paper 2 · Q6(c) 10 marks AO1=2, AO2=2, AO3=2, AO4=4 10-mark response aggregate demandnational income and the multiplier
Data and extracts for question 6UK balance of trade and inflation Figure 1: UK balance of trade in goods and services, January 2020 to October 2021 8 £ billion 6 4 2 0 -2 -4 -6 -8 Jan 2020 Apr 2020 Jul 2020 Oct 2020 Jan 2021 Apr 2021 Jul 2021 Oct 2021 (Source adapted from: https://tradingeconomics.com/united-kingdom/balance-of-trade) Figure 2: UK inflation rate as measured by annual percentage changes in the Consumer Prices Index (CPI), January 2020 to October 2021 6 % 5 4.2 4 3.2 3.1 3 2.5 2.1 2.0 1.8 2 1.7 1.5 1.5 1.0 0.8 1 0.7 0.7 0.6 0.7 0.4 0.5 0.6 0.5 0.3 0.2 0 Jan 2020 Apr 2020 Jul 2020 Oct 2020 Jan 2021 Apr 2021 Jul 2021 Oct 2021 (Source adapted from: https://tradingeconomics.com/united-kingdom/inflation-cpi) Extract A Balance of trade in goods and services Rising imports from non-EU countries have increased the UK’s trade deficit in the third quarter of 2021. This was as a result of the UK strengthening its trading relationships with countries outside the EU. An 11.2% increase in imports from non-EU countries has increased the UK’s trade deficit to nearly £7 billion. 5 Moreover, exports to non-EU countries were £0.8 billion lower than exports to EU countries. Despite the overall trade balance being in deficit, the UK services trade balance is in surplus, reflecting the economy’s heavy reliance on services. The trade in 10 services surplus increased by £2.2 billion to £35.6 billion. This was mostly as a result of an increase in the export of financial services. (Source: adapted from https://www.cityam.com/swelling- non-eu-imports-widens-uk-trade-deficit) Extract B Inflation In December 2021 the rate of inflation in the UK rose to 5.4%, its highest rate in 30 years. The speed of increase has taken economists by surprise. The Bank of England expected inflation to peak at this rate, but not until April 2022. The rate was more than two-and-a-half times its 2% inflation target. 5 Transport costs were the biggest contributor to rising inflation, with petrol prices increasing by over 5%. Moreover, supply chain bottlenecks constrained access to raw materials and limited the number of new products being sold in the market. At the same time, economists warned that the demand for goods and services in the UK economy was quickly increasing. This was a result of the easing of the 10 restrictions associated with the global health crisis. The high rate of inflation would normally be enough to prompt a significant increase in the base rate of interest by the Bank of England’s Monetary Policy Committee (MPC). Despite the lower rates of economic growth, the MPC increased the base interest rate from 0.1% to 0.5% in February 2022. 15 (Source: adapted from ‘UK inflation hits highest level in a decade’, FT, https://www.ft.com/content/dd5edcd1-2e70-4910-b642- 269574b4bcdd; ‘What does the UK’s soaring inflation rate mean for you?’, The Guardian, https://www.theguardian.com/business/2021/ dec/15/what-does-uk-soaring-inflation-rate-mean)
(c) With reference to Extract A, assess the likely impact of a rise in the value of exports on the UK economy. (10)
June 2023 · AS Paper 2 · Q6(d) 6 marks AO1=2, AO2=2, AO3=2 Short answer inflation
Data and extracts for question 6UK balance of trade and inflation Figure 1: UK balance of trade in goods and services, January 2020 to October 2021 8 £ billion 6 4 2 0 -2 -4 -6 -8 Jan 2020 Apr 2020 Jul 2020 Oct 2020 Jan 2021 Apr 2021 Jul 2021 Oct 2021 (Source adapted from: https://tradingeconomics.com/united-kingdom/balance-of-trade) Figure 2: UK inflation rate as measured by annual percentage changes in the Consumer Prices Index (CPI), January 2020 to October 2021 6 % 5 4.2 4 3.2 3.1 3 2.5 2.1 2.0 1.8 2 1.7 1.5 1.5 1.0 0.8 1 0.7 0.7 0.6 0.7 0.4 0.5 0.6 0.5 0.3 0.2 0 Jan 2020 Apr 2020 Jul 2020 Oct 2020 Jan 2021 Apr 2021 Jul 2021 Oct 2021 (Source adapted from: https://tradingeconomics.com/united-kingdom/inflation-cpi) Extract A Balance of trade in goods and services Rising imports from non-EU countries have increased the UK’s trade deficit in the third quarter of 2021. This was as a result of the UK strengthening its trading relationships with countries outside the EU. An 11.2% increase in imports from non-EU countries has increased the UK’s trade deficit to nearly £7 billion. 5 Moreover, exports to non-EU countries were £0.8 billion lower than exports to EU countries. Despite the overall trade balance being in deficit, the UK services trade balance is in surplus, reflecting the economy’s heavy reliance on services. The trade in 10 services surplus increased by £2.2 billion to £35.6 billion. This was mostly as a result of an increase in the export of financial services. (Source: adapted from https://www.cityam.com/swelling- non-eu-imports-widens-uk-trade-deficit) Extract B Inflation In December 2021 the rate of inflation in the UK rose to 5.4%, its highest rate in 30 years. The speed of increase has taken economists by surprise. The Bank of England expected inflation to peak at this rate, but not until April 2022. The rate was more than two-and-a-half times its 2% inflation target. 5 Transport costs were the biggest contributor to rising inflation, with petrol prices increasing by over 5%. Moreover, supply chain bottlenecks constrained access to raw materials and limited the number of new products being sold in the market. At the same time, economists warned that the demand for goods and services in the UK economy was quickly increasing. This was a result of the easing of the 10 restrictions associated with the global health crisis. The high rate of inflation would normally be enough to prompt a significant increase in the base rate of interest by the Bank of England’s Monetary Policy Committee (MPC). Despite the lower rates of economic growth, the MPC increased the base interest rate from 0.1% to 0.5% in February 2022. 15 (Source: adapted from ‘UK inflation hits highest level in a decade’, FT, https://www.ft.com/content/dd5edcd1-2e70-4910-b642- 269574b4bcdd; ‘What does the UK’s soaring inflation rate mean for you?’, The Guardian, https://www.theguardian.com/business/2021/ dec/15/what-does-uk-soaring-inflation-rate-mean)
(d) With reference to Extract B, explain two reasons for the increase in the rate of UK inflation. (6)
June 2023 · AS Paper 2 · Q6(e) 15 marks AO1=3, AO2=3, AO3=3, AO4=6 15-mark response inflation
Data and extracts for question 6UK balance of trade and inflation Figure 1: UK balance of trade in goods and services, January 2020 to October 2021 8 £ billion 6 4 2 0 -2 -4 -6 -8 Jan 2020 Apr 2020 Jul 2020 Oct 2020 Jan 2021 Apr 2021 Jul 2021 Oct 2021 (Source adapted from: https://tradingeconomics.com/united-kingdom/balance-of-trade) Figure 2: UK inflation rate as measured by annual percentage changes in the Consumer Prices Index (CPI), January 2020 to October 2021 6 % 5 4.2 4 3.2 3.1 3 2.5 2.1 2.0 1.8 2 1.7 1.5 1.5 1.0 0.8 1 0.7 0.7 0.6 0.7 0.4 0.5 0.6 0.5 0.3 0.2 0 Jan 2020 Apr 2020 Jul 2020 Oct 2020 Jan 2021 Apr 2021 Jul 2021 Oct 2021 (Source adapted from: https://tradingeconomics.com/united-kingdom/inflation-cpi) Extract A Balance of trade in goods and services Rising imports from non-EU countries have increased the UK’s trade deficit in the third quarter of 2021. This was as a result of the UK strengthening its trading relationships with countries outside the EU. An 11.2% increase in imports from non-EU countries has increased the UK’s trade deficit to nearly £7 billion. 5 Moreover, exports to non-EU countries were £0.8 billion lower than exports to EU countries. Despite the overall trade balance being in deficit, the UK services trade balance is in surplus, reflecting the economy’s heavy reliance on services. The trade in 10 services surplus increased by £2.2 billion to £35.6 billion. This was mostly as a result of an increase in the export of financial services. (Source: adapted from https://www.cityam.com/swelling- non-eu-imports-widens-uk-trade-deficit) Extract B Inflation In December 2021 the rate of inflation in the UK rose to 5.4%, its highest rate in 30 years. The speed of increase has taken economists by surprise. The Bank of England expected inflation to peak at this rate, but not until April 2022. The rate was more than two-and-a-half times its 2% inflation target. 5 Transport costs were the biggest contributor to rising inflation, with petrol prices increasing by over 5%. Moreover, supply chain bottlenecks constrained access to raw materials and limited the number of new products being sold in the market. At the same time, economists warned that the demand for goods and services in the UK economy was quickly increasing. This was a result of the easing of the 10 restrictions associated with the global health crisis. The high rate of inflation would normally be enough to prompt a significant increase in the base rate of interest by the Bank of England’s Monetary Policy Committee (MPC). Despite the lower rates of economic growth, the MPC increased the base interest rate from 0.1% to 0.5% in February 2022. 15 (Source: adapted from ‘UK inflation hits highest level in a decade’, FT, https://www.ft.com/content/dd5edcd1-2e70-4910-b642- 269574b4bcdd; ‘What does the UK’s soaring inflation rate mean for you?’, The Guardian, https://www.theguardian.com/business/2021/ dec/15/what-does-uk-soaring-inflation-rate-mean)
(e) Discuss the likely economic effects of the high rate of UK inflation on consumers and workers. (15)
June 2023 · AS Paper 2 · Q6(f) 20 marks AO1=4, AO2=4, AO3=6, AO4=6 20-mark essay Either/or Hard aggregate demandbalance of payments
Data and extracts for question 6UK balance of trade and inflation Figure 1: UK balance of trade in goods and services, January 2020 to October 2021 8 £ billion 6 4 2 0 -2 -4 -6 -8 Jan 2020 Apr 2020 Jul 2020 Oct 2020 Jan 2021 Apr 2021 Jul 2021 Oct 2021 (Source adapted from: https://tradingeconomics.com/united-kingdom/balance-of-trade) Figure 2: UK inflation rate as measured by annual percentage changes in the Consumer Prices Index (CPI), January 2020 to October 2021 6 % 5 4.2 4 3.2 3.1 3 2.5 2.1 2.0 1.8 2 1.7 1.5 1.5 1.0 0.8 1 0.7 0.7 0.6 0.7 0.4 0.5 0.6 0.5 0.3 0.2 0 Jan 2020 Apr 2020 Jul 2020 Oct 2020 Jan 2021 Apr 2021 Jul 2021 Oct 2021 (Source adapted from: https://tradingeconomics.com/united-kingdom/inflation-cpi) Extract A Balance of trade in goods and services Rising imports from non-EU countries have increased the UK’s trade deficit in the third quarter of 2021. This was as a result of the UK strengthening its trading relationships with countries outside the EU. An 11.2% increase in imports from non-EU countries has increased the UK’s trade deficit to nearly £7 billion. 5 Moreover, exports to non-EU countries were £0.8 billion lower than exports to EU countries. Despite the overall trade balance being in deficit, the UK services trade balance is in surplus, reflecting the economy’s heavy reliance on services. The trade in 10 services surplus increased by £2.2 billion to £35.6 billion. This was mostly as a result of an increase in the export of financial services. (Source: adapted from https://www.cityam.com/swelling- non-eu-imports-widens-uk-trade-deficit) Extract B Inflation In December 2021 the rate of inflation in the UK rose to 5.4%, its highest rate in 30 years. The speed of increase has taken economists by surprise. The Bank of England expected inflation to peak at this rate, but not until April 2022. The rate was more than two-and-a-half times its 2% inflation target. 5 Transport costs were the biggest contributor to rising inflation, with petrol prices increasing by over 5%. Moreover, supply chain bottlenecks constrained access to raw materials and limited the number of new products being sold in the market. At the same time, economists warned that the demand for goods and services in the UK economy was quickly increasing. This was a result of the easing of the 10 restrictions associated with the global health crisis. The high rate of inflation would normally be enough to prompt a significant increase in the base rate of interest by the Bank of England’s Monetary Policy Committee (MPC). Despite the lower rates of economic growth, the MPC increased the base interest rate from 0.1% to 0.5% in February 2022. 15 (Source: adapted from ‘UK inflation hits highest level in a decade’, FT, https://www.ft.com/content/dd5edcd1-2e70-4910-b642- 269574b4bcdd; ‘What does the UK’s soaring inflation rate mean for you?’, The Guardian, https://www.theguardian.com/business/2021/ dec/15/what-does-uk-soaring-inflation-rate-mean)
(f) Evaluate the main influences on the UK’s net trade balance. (20)
June 2023 · AS Paper 2 · Q6(g) 20 marks AO1=4, AO2=4, AO3=6, AO4=6 20-mark essay Either/or fiscal and monetary policyinflation
Data and extracts for question 6UK balance of trade and inflation Figure 1: UK balance of trade in goods and services, January 2020 to October 2021 8 £ billion 6 4 2 0 -2 -4 -6 -8 Jan 2020 Apr 2020 Jul 2020 Oct 2020 Jan 2021 Apr 2021 Jul 2021 Oct 2021 (Source adapted from: https://tradingeconomics.com/united-kingdom/balance-of-trade) Figure 2: UK inflation rate as measured by annual percentage changes in the Consumer Prices Index (CPI), January 2020 to October 2021 6 % 5 4.2 4 3.2 3.1 3 2.5 2.1 2.0 1.8 2 1.7 1.5 1.5 1.0 0.8 1 0.7 0.7 0.6 0.7 0.4 0.5 0.6 0.5 0.3 0.2 0 Jan 2020 Apr 2020 Jul 2020 Oct 2020 Jan 2021 Apr 2021 Jul 2021 Oct 2021 (Source adapted from: https://tradingeconomics.com/united-kingdom/inflation-cpi) Extract A Balance of trade in goods and services Rising imports from non-EU countries have increased the UK’s trade deficit in the third quarter of 2021. This was as a result of the UK strengthening its trading relationships with countries outside the EU. An 11.2% increase in imports from non-EU countries has increased the UK’s trade deficit to nearly £7 billion. 5 Moreover, exports to non-EU countries were £0.8 billion lower than exports to EU countries. Despite the overall trade balance being in deficit, the UK services trade balance is in surplus, reflecting the economy’s heavy reliance on services. The trade in 10 services surplus increased by £2.2 billion to £35.6 billion. This was mostly as a result of an increase in the export of financial services. (Source: adapted from https://www.cityam.com/swelling- non-eu-imports-widens-uk-trade-deficit) Extract B Inflation In December 2021 the rate of inflation in the UK rose to 5.4%, its highest rate in 30 years. The speed of increase has taken economists by surprise. The Bank of England expected inflation to peak at this rate, but not until April 2022. The rate was more than two-and-a-half times its 2% inflation target. 5 Transport costs were the biggest contributor to rising inflation, with petrol prices increasing by over 5%. Moreover, supply chain bottlenecks constrained access to raw materials and limited the number of new products being sold in the market. At the same time, economists warned that the demand for goods and services in the UK economy was quickly increasing. This was a result of the easing of the 10 restrictions associated with the global health crisis. The high rate of inflation would normally be enough to prompt a significant increase in the base rate of interest by the Bank of England’s Monetary Policy Committee (MPC). Despite the lower rates of economic growth, the MPC increased the base interest rate from 0.1% to 0.5% in February 2022. 15 (Source: adapted from ‘UK inflation hits highest level in a decade’, FT, https://www.ft.com/content/dd5edcd1-2e70-4910-b642- 269574b4bcdd; ‘What does the UK’s soaring inflation rate mean for you?’, The Guardian, https://www.theguardian.com/business/2021/ dec/15/what-does-uk-soaring-inflation-rate-mean)
(g) Evaluate how interest rates are used to control UK inflation. (20)
June 2023 · Paper 1 · Q1(a) 4 marks AO1=2, AO2=1, AO3=1 Short answer economic systems
Data and extracts for question 11 In a major reform of its command economy, the Cuban government will allow small private businesses to operate in most fields. Free market economists have long called for the role of small business to be expanded to help jump‑start the economy and to create jobs. (Source adapted from: https://www.telegraph.co.uk/news/2021/02/07/ cuba-allows-massive-expansion-private-businesses/)
(a) With reference to the information provided, explain one advantage of a free market economy. (4)
June 2023 · Paper 1 · Q2(a) 2 marks AO2=2 Calculation production possibility frontiers
Data and extracts for question 22 The production possibility frontier shows last year’s harvest for a UK farmer at point X. Wheat 7 Y 6 Z 5 4 X 3 2 W 1 Oats 0 1 2 3 4 5
(a) Calculate the opportunity cost of the decision by the farmer to harvest 6 units of wheat this year at point Y (movement from point X to point Y). (2)
June 2023 · Paper 1 · Q2(b) 2 marks AO1=1, AO3=1 Short answer production possibility frontiers
Data and extracts for question 22 The production possibility frontier shows last year’s harvest for a UK farmer at point X. Wheat 7 Y 6 Z 5 4 X 3 2 W 1 Oats 0 1 2 3 4 5
(b) Explain the impact on efficiency of producing at point W in the following year. (2)
June 2023 · Paper 1 · Q3(b) 4 marks AO1=2, AO2=2 Diagram market structures and efficiency
Data and extracts for question 33 A luxury brownie baker is faced with falling demand as incomes fall.
(b) Small local bakeries have many of the characteristics of monopolistic competition. Draw the short run profit maximising equilibrium of a loss‑making luxury brownie baker. (4)
June 2023 · Paper 1 · Q4(a) 2 marks AO2=2 Calculation supply and demand
Data and extracts for question 44 An annual season ticket for a train journey between London and Reading is planned to increase from £5 044 to £5 664 in 2023. (Source adapted from: https://commonslibrary.parliament.uk/ how-much-could-rail-fares-increase-by-in-2023-and-why)
(a) With reference to the information provided, calculate the percentage change in the price of an annual season ticket. (2)
June 2023 · Paper 1 · Q4(b) 2 marks AO1=1, AO3=1 Short answer price mechanism and surplus
Data and extracts for question 44 An annual season ticket for a train journey between London and Reading is planned to increase from £5 044 to £5 664 in 2023. (Source adapted from: https://commonslibrary.parliament.uk/ how-much-could-rail-fares-increase-by-in-2023-and-why)
(b) Explain the likely impact of the increase in price of a season ticket on consumer surplus. (2) The diagram below shows the demand and supply for sugary drinks. Price of sugary M S drinks F G Minimum P1 price E H Pe L J D K
June 2023 · Paper 1 · Q5(b) 4 marks AO1=2, AO2=1, AO3=1 Short answer monopsony and contestabilitylabour market
Data and extracts for question 55 Index of pay in the public and private sector. Nominal average weekly earnings (base year January 2018 = 100) 120 118 Private Sector 115 114 Index 110 Public Sector 105 100 2018 2019 2020 2021 2022 (Source adapted from: https://www.ft.com/content/48dafbb9- 371d-4683-9afb-26652add888c)
(b) Over 90% of nurses work in the public sector. Nurses in the public sector have experienced wage rises lower than those in the private sector over the past 10 years. (Source adapted from: https://www.nuffieldtrust.org.uk/resource/chart-of- the-week-real-terms-nhs-staff-pay-from-2010-to-2020) Using the information provided and the concept of monopsony, explain why nurses in the public sector have had lower wage rises than those in the private sector. (4)
June 2023 · Paper 1 · Q6(a) 5 marks AO1=1, AO2=2, AO3=2 Calculation oligopoly
Data and extracts for question 6The UK online streaming services market Figure 1: Market share of UK online streaming services Q2 2021 Q3 2021 Q4 2021 Q1 2022 Q2 2022 Amazon Prime Video 37.9% 41.1% 45.0% 27.1% 25.9% Disney+ 16.0% 17.7% 19.3% 14.1% 21.5% Netflix 15.0% 10.5% 5.0% 9.4% 4.5% NOW 11.3% 11.2% 5.6% 11.0% 11.1% AppleTV+ 4.0% 5.5% 7.3% 9.2% 9.9% BritBox 4.0% 3.0% 5.7% 6.0% 5.9% Others 11.8 11.0% 12.1% 23.2% 21.2% (Source adapted from: Kantar, Worldpanel Division Geotech 2022) Figure 2: UK online streaming services – monthly fees Streaming service provider September 2022 Netflix premium (4 users/ultra HD*) £15.99 Netflix standard (2 users/HD) £10.99 *This is the highest quality Netflix basic (single user/non HD**) £6.99 picture currently available Amazon Prime Video £8.99 ** This is the basic quality picture Amazon Prime Video – Student price £4.49 Disney+ £7.99 AppleTV+ £4.99 (Source adapted from: https://www.radiotimes.com/tv/what- to-watch-tv/best-streaming-service-uk/) Extract A How Netflix makes use of behavioural science In the last few years, companies have been trying to find ways to attract the attention of customers. Various streaming platforms such as Netflix, Amazon, and YouTube use ‘nudges’ to influence consumer behaviour. The ‘next‑up’ feature on Netflix or ‘auto‑play’ on YouTube has been subject to research that relates it to binge‑watching. 5 Binge‑watching is the practice of viewing for a prolonged period, multiple episodes of a TV show or several films in rapid succession. Similarly, the policy of offering a one‑month free subscription under the label of ‘free trial’ requires credit card information to turn the forgetful subscriber into a potential paying one. Following this strategy, Netflix has expanded to 190 countries in just seven years 10 and according to the Wall Street Journal, the company generated total revenue of over $5.2 billion in 2019, which was an increase from 2018 of around $4 billion. However, 2022 data shows that consumers, increasingly worried about the rising cost of living, are turning their back on Netflix. With a reported cancellation of over 200 000 subscriptions in the first quarter and another two million forecast to leave by the 15 end of the year. Subscribers are rethinking their commitment to the streaming services that grew their numbers sharply during the home‑based months of the global health crisis. Netflix subscribers have also quoted a decline in value for money and satisfaction with the quality of the shows as key motives for cancellation. Disney now see higher satisfaction rankings than Netflix across the quality of shows, 20 amount of original content, number of new‑release films, variety of classic films and amount of kids’ content. Forecast cancellation rates for Disney+ fell to an all‑time low of 3.2%. (Source adapted from: https://www.novanudge.com/post/sludge-on-demand-how-netflix- makes-use-of-behavioural-science https://www.theguardian.com/media/2022/apr/20/netflix-shares-fall-losing-subscribers) Extract B The economics of price discrimination Throughout 2022, Netflix, a 100‑billion‑dollar company, increased prices in the US, Canada, the UK and Ireland (most of which saw similar price increases in 2021, too). In sharp contrast, Netflix recently announced it was reducing its prices in India (standard/2‑user 499 rupees a month, equivalent to £5.42) in a bid to compete with 5 Disney+ and Prime. UK students currently enrolled in a college or university who have a valid student email address can join Prime Student through the Amazon website. This gives them nearly 50% off a standard Prime membership and many other exclusive benefits. (Source adapted from: https://help.netflix.com/en/node/24926/in) Extract C Educational Website and TV Programmes BBC Bitesize is a learning platform created by the BBC in 1998. The online study resource allows parents to teach their children from home, using ready-made lesson plans and study guides with questions for all ages. The revision sessions are free to watch and they are available for children aged five up to their late teens. The guides are written by 5 teachers and subject experts, so they are reliable and follow the National Curriculum. Last year Bitesize attracted around two million weekly unique browsers with a peak week of 3.3 million in the GCSE exam period. Oak National Academy is a freely available learning resource website created for pupils aged four to sixteen. Launched in 2020, as a response to the global health crisis, the 10 website includes lesson slides, video lessons, worksheets, and quizzes conforming to the national curriculum in England. Ministers have set aside £43 million to fund the Oak National Academy over the next three years. (Source adapted from: https://www.bbc.co.uk/bitesize/articles/zmjdhbk https://www.structural-learning.com/post/oak-academy-a-teachers-guide#:~:text=Oak%20 National%20Academy%20is%20a,the%20national%20curriculum%20of%20England)
(a) With reference to Figure 1, explain the market structure that best describes the market for UK online streaming services. (5)
June 2023 · Paper 1 · Q6(b) 10 marks AO1=2, AO2=2, AO3=2, AO4=4 10-mark response rational decision making and behavioural economics
Data and extracts for question 6The UK online streaming services market Figure 1: Market share of UK online streaming services Q2 2021 Q3 2021 Q4 2021 Q1 2022 Q2 2022 Amazon Prime Video 37.9% 41.1% 45.0% 27.1% 25.9% Disney+ 16.0% 17.7% 19.3% 14.1% 21.5% Netflix 15.0% 10.5% 5.0% 9.4% 4.5% NOW 11.3% 11.2% 5.6% 11.0% 11.1% AppleTV+ 4.0% 5.5% 7.3% 9.2% 9.9% BritBox 4.0% 3.0% 5.7% 6.0% 5.9% Others 11.8 11.0% 12.1% 23.2% 21.2% (Source adapted from: Kantar, Worldpanel Division Geotech 2022) Figure 2: UK online streaming services – monthly fees Streaming service provider September 2022 Netflix premium (4 users/ultra HD*) £15.99 Netflix standard (2 users/HD) £10.99 *This is the highest quality Netflix basic (single user/non HD**) £6.99 picture currently available Amazon Prime Video £8.99 ** This is the basic quality picture Amazon Prime Video – Student price £4.49 Disney+ £7.99 AppleTV+ £4.99 (Source adapted from: https://www.radiotimes.com/tv/what- to-watch-tv/best-streaming-service-uk/) Extract A How Netflix makes use of behavioural science In the last few years, companies have been trying to find ways to attract the attention of customers. Various streaming platforms such as Netflix, Amazon, and YouTube use ‘nudges’ to influence consumer behaviour. The ‘next‑up’ feature on Netflix or ‘auto‑play’ on YouTube has been subject to research that relates it to binge‑watching. 5 Binge‑watching is the practice of viewing for a prolonged period, multiple episodes of a TV show or several films in rapid succession. Similarly, the policy of offering a one‑month free subscription under the label of ‘free trial’ requires credit card information to turn the forgetful subscriber into a potential paying one. Following this strategy, Netflix has expanded to 190 countries in just seven years 10 and according to the Wall Street Journal, the company generated total revenue of over $5.2 billion in 2019, which was an increase from 2018 of around $4 billion. However, 2022 data shows that consumers, increasingly worried about the rising cost of living, are turning their back on Netflix. With a reported cancellation of over 200 000 subscriptions in the first quarter and another two million forecast to leave by the 15 end of the year. Subscribers are rethinking their commitment to the streaming services that grew their numbers sharply during the home‑based months of the global health crisis. Netflix subscribers have also quoted a decline in value for money and satisfaction with the quality of the shows as key motives for cancellation. Disney now see higher satisfaction rankings than Netflix across the quality of shows, 20 amount of original content, number of new‑release films, variety of classic films and amount of kids’ content. Forecast cancellation rates for Disney+ fell to an all‑time low of 3.2%. (Source adapted from: https://www.novanudge.com/post/sludge-on-demand-how-netflix- makes-use-of-behavioural-science https://www.theguardian.com/media/2022/apr/20/netflix-shares-fall-losing-subscribers) Extract B The economics of price discrimination Throughout 2022, Netflix, a 100‑billion‑dollar company, increased prices in the US, Canada, the UK and Ireland (most of which saw similar price increases in 2021, too). In sharp contrast, Netflix recently announced it was reducing its prices in India (standard/2‑user 499 rupees a month, equivalent to £5.42) in a bid to compete with 5 Disney+ and Prime. UK students currently enrolled in a college or university who have a valid student email address can join Prime Student through the Amazon website. This gives them nearly 50% off a standard Prime membership and many other exclusive benefits. (Source adapted from: https://help.netflix.com/en/node/24926/in) Extract C Educational Website and TV Programmes BBC Bitesize is a learning platform created by the BBC in 1998. The online study resource allows parents to teach their children from home, using ready-made lesson plans and study guides with questions for all ages. The revision sessions are free to watch and they are available for children aged five up to their late teens. The guides are written by 5 teachers and subject experts, so they are reliable and follow the National Curriculum. Last year Bitesize attracted around two million weekly unique browsers with a peak week of 3.3 million in the GCSE exam period. Oak National Academy is a freely available learning resource website created for pupils aged four to sixteen. Launched in 2020, as a response to the global health crisis, the 10 website includes lesson slides, video lessons, worksheets, and quizzes conforming to the national curriculum in England. Ministers have set aside £43 million to fund the Oak National Academy over the next three years. (Source adapted from: https://www.bbc.co.uk/bitesize/articles/zmjdhbk https://www.structural-learning.com/post/oak-academy-a-teachers-guide#:~:text=Oak%20 National%20Academy%20is%20a,the%20national%20curriculum%20of%20England)
(b) With reference to the information provided, assess whether Netflix subscribers behave rationally. (10)
June 2023 · Paper 1 · Q6(c) 8 marks AO1=2, AO2=2, AO3=2, AO4=2 8-mark response price elasticity of demand
Data and extracts for question 6The UK online streaming services market Figure 1: Market share of UK online streaming services Q2 2021 Q3 2021 Q4 2021 Q1 2022 Q2 2022 Amazon Prime Video 37.9% 41.1% 45.0% 27.1% 25.9% Disney+ 16.0% 17.7% 19.3% 14.1% 21.5% Netflix 15.0% 10.5% 5.0% 9.4% 4.5% NOW 11.3% 11.2% 5.6% 11.0% 11.1% AppleTV+ 4.0% 5.5% 7.3% 9.2% 9.9% BritBox 4.0% 3.0% 5.7% 6.0% 5.9% Others 11.8 11.0% 12.1% 23.2% 21.2% (Source adapted from: Kantar, Worldpanel Division Geotech 2022) Figure 2: UK online streaming services – monthly fees Streaming service provider September 2022 Netflix premium (4 users/ultra HD*) £15.99 Netflix standard (2 users/HD) £10.99 *This is the highest quality Netflix basic (single user/non HD**) £6.99 picture currently available Amazon Prime Video £8.99 ** This is the basic quality picture Amazon Prime Video – Student price £4.49 Disney+ £7.99 AppleTV+ £4.99 (Source adapted from: https://www.radiotimes.com/tv/what- to-watch-tv/best-streaming-service-uk/) Extract A How Netflix makes use of behavioural science In the last few years, companies have been trying to find ways to attract the attention of customers. Various streaming platforms such as Netflix, Amazon, and YouTube use ‘nudges’ to influence consumer behaviour. The ‘next‑up’ feature on Netflix or ‘auto‑play’ on YouTube has been subject to research that relates it to binge‑watching. 5 Binge‑watching is the practice of viewing for a prolonged period, multiple episodes of a TV show or several films in rapid succession. Similarly, the policy of offering a one‑month free subscription under the label of ‘free trial’ requires credit card information to turn the forgetful subscriber into a potential paying one. Following this strategy, Netflix has expanded to 190 countries in just seven years 10 and according to the Wall Street Journal, the company generated total revenue of over $5.2 billion in 2019, which was an increase from 2018 of around $4 billion. However, 2022 data shows that consumers, increasingly worried about the rising cost of living, are turning their back on Netflix. With a reported cancellation of over 200 000 subscriptions in the first quarter and another two million forecast to leave by the 15 end of the year. Subscribers are rethinking their commitment to the streaming services that grew their numbers sharply during the home‑based months of the global health crisis. Netflix subscribers have also quoted a decline in value for money and satisfaction with the quality of the shows as key motives for cancellation. Disney now see higher satisfaction rankings than Netflix across the quality of shows, 20 amount of original content, number of new‑release films, variety of classic films and amount of kids’ content. Forecast cancellation rates for Disney+ fell to an all‑time low of 3.2%. (Source adapted from: https://www.novanudge.com/post/sludge-on-demand-how-netflix- makes-use-of-behavioural-science https://www.theguardian.com/media/2022/apr/20/netflix-shares-fall-losing-subscribers) Extract B The economics of price discrimination Throughout 2022, Netflix, a 100‑billion‑dollar company, increased prices in the US, Canada, the UK and Ireland (most of which saw similar price increases in 2021, too). In sharp contrast, Netflix recently announced it was reducing its prices in India (standard/2‑user 499 rupees a month, equivalent to £5.42) in a bid to compete with 5 Disney+ and Prime. UK students currently enrolled in a college or university who have a valid student email address can join Prime Student through the Amazon website. This gives them nearly 50% off a standard Prime membership and many other exclusive benefits. (Source adapted from: https://help.netflix.com/en/node/24926/in) Extract C Educational Website and TV Programmes BBC Bitesize is a learning platform created by the BBC in 1998. The online study resource allows parents to teach their children from home, using ready-made lesson plans and study guides with questions for all ages. The revision sessions are free to watch and they are available for children aged five up to their late teens. The guides are written by 5 teachers and subject experts, so they are reliable and follow the National Curriculum. Last year Bitesize attracted around two million weekly unique browsers with a peak week of 3.3 million in the GCSE exam period. Oak National Academy is a freely available learning resource website created for pupils aged four to sixteen. Launched in 2020, as a response to the global health crisis, the 10 website includes lesson slides, video lessons, worksheets, and quizzes conforming to the national curriculum in England. Ministers have set aside £43 million to fund the Oak National Academy over the next three years. (Source adapted from: https://www.bbc.co.uk/bitesize/articles/zmjdhbk https://www.structural-learning.com/post/oak-academy-a-teachers-guide#:~:text=Oak%20 National%20Academy%20is%20a,the%20national%20curriculum%20of%20England)
(c) With reference to the information provided, examine the likely numerical value of the cross elasticity of demand between UK online streaming services. (8)
June 2023 · Paper 1 · Q6(d) 12 marks AO1=2, AO2=2, AO3=4, AO4=4 12-mark response externalities
Data and extracts for question 6The UK online streaming services market Figure 1: Market share of UK online streaming services Q2 2021 Q3 2021 Q4 2021 Q1 2022 Q2 2022 Amazon Prime Video 37.9% 41.1% 45.0% 27.1% 25.9% Disney+ 16.0% 17.7% 19.3% 14.1% 21.5% Netflix 15.0% 10.5% 5.0% 9.4% 4.5% NOW 11.3% 11.2% 5.6% 11.0% 11.1% AppleTV+ 4.0% 5.5% 7.3% 9.2% 9.9% BritBox 4.0% 3.0% 5.7% 6.0% 5.9% Others 11.8 11.0% 12.1% 23.2% 21.2% (Source adapted from: Kantar, Worldpanel Division Geotech 2022) Figure 2: UK online streaming services – monthly fees Streaming service provider September 2022 Netflix premium (4 users/ultra HD*) £15.99 Netflix standard (2 users/HD) £10.99 *This is the highest quality Netflix basic (single user/non HD**) £6.99 picture currently available Amazon Prime Video £8.99 ** This is the basic quality picture Amazon Prime Video – Student price £4.49 Disney+ £7.99 AppleTV+ £4.99 (Source adapted from: https://www.radiotimes.com/tv/what- to-watch-tv/best-streaming-service-uk/) Extract A How Netflix makes use of behavioural science In the last few years, companies have been trying to find ways to attract the attention of customers. Various streaming platforms such as Netflix, Amazon, and YouTube use ‘nudges’ to influence consumer behaviour. The ‘next‑up’ feature on Netflix or ‘auto‑play’ on YouTube has been subject to research that relates it to binge‑watching. 5 Binge‑watching is the practice of viewing for a prolonged period, multiple episodes of a TV show or several films in rapid succession. Similarly, the policy of offering a one‑month free subscription under the label of ‘free trial’ requires credit card information to turn the forgetful subscriber into a potential paying one. Following this strategy, Netflix has expanded to 190 countries in just seven years 10 and according to the Wall Street Journal, the company generated total revenue of over $5.2 billion in 2019, which was an increase from 2018 of around $4 billion. However, 2022 data shows that consumers, increasingly worried about the rising cost of living, are turning their back on Netflix. With a reported cancellation of over 200 000 subscriptions in the first quarter and another two million forecast to leave by the 15 end of the year. Subscribers are rethinking their commitment to the streaming services that grew their numbers sharply during the home‑based months of the global health crisis. Netflix subscribers have also quoted a decline in value for money and satisfaction with the quality of the shows as key motives for cancellation. Disney now see higher satisfaction rankings than Netflix across the quality of shows, 20 amount of original content, number of new‑release films, variety of classic films and amount of kids’ content. Forecast cancellation rates for Disney+ fell to an all‑time low of 3.2%. (Source adapted from: https://www.novanudge.com/post/sludge-on-demand-how-netflix- makes-use-of-behavioural-science https://www.theguardian.com/media/2022/apr/20/netflix-shares-fall-losing-subscribers) Extract B The economics of price discrimination Throughout 2022, Netflix, a 100‑billion‑dollar company, increased prices in the US, Canada, the UK and Ireland (most of which saw similar price increases in 2021, too). In sharp contrast, Netflix recently announced it was reducing its prices in India (standard/2‑user 499 rupees a month, equivalent to £5.42) in a bid to compete with 5 Disney+ and Prime. UK students currently enrolled in a college or university who have a valid student email address can join Prime Student through the Amazon website. This gives them nearly 50% off a standard Prime membership and many other exclusive benefits. (Source adapted from: https://help.netflix.com/en/node/24926/in) Extract C Educational Website and TV Programmes BBC Bitesize is a learning platform created by the BBC in 1998. The online study resource allows parents to teach their children from home, using ready-made lesson plans and study guides with questions for all ages. The revision sessions are free to watch and they are available for children aged five up to their late teens. The guides are written by 5 teachers and subject experts, so they are reliable and follow the National Curriculum. Last year Bitesize attracted around two million weekly unique browsers with a peak week of 3.3 million in the GCSE exam period. Oak National Academy is a freely available learning resource website created for pupils aged four to sixteen. Launched in 2020, as a response to the global health crisis, the 10 website includes lesson slides, video lessons, worksheets, and quizzes conforming to the national curriculum in England. Ministers have set aside £43 million to fund the Oak National Academy over the next three years. (Source adapted from: https://www.bbc.co.uk/bitesize/articles/zmjdhbk https://www.structural-learning.com/post/oak-academy-a-teachers-guide#:~:text=Oak%20 National%20Academy%20is%20a,the%20national%20curriculum%20of%20England)
(d) With reference to Extract C, discuss the likely private and external benefits of viewing educational websites and TV programmes. (12)
June 2023 · Paper 1 · Q6(e) 15 marks AO1=3, AO2=3, AO3=3, AO4=6 15-mark response monopoly
Data and extracts for question 6The UK online streaming services market Figure 1: Market share of UK online streaming services Q2 2021 Q3 2021 Q4 2021 Q1 2022 Q2 2022 Amazon Prime Video 37.9% 41.1% 45.0% 27.1% 25.9% Disney+ 16.0% 17.7% 19.3% 14.1% 21.5% Netflix 15.0% 10.5% 5.0% 9.4% 4.5% NOW 11.3% 11.2% 5.6% 11.0% 11.1% AppleTV+ 4.0% 5.5% 7.3% 9.2% 9.9% BritBox 4.0% 3.0% 5.7% 6.0% 5.9% Others 11.8 11.0% 12.1% 23.2% 21.2% (Source adapted from: Kantar, Worldpanel Division Geotech 2022) Figure 2: UK online streaming services – monthly fees Streaming service provider September 2022 Netflix premium (4 users/ultra HD*) £15.99 Netflix standard (2 users/HD) £10.99 *This is the highest quality Netflix basic (single user/non HD**) £6.99 picture currently available Amazon Prime Video £8.99 ** This is the basic quality picture Amazon Prime Video – Student price £4.49 Disney+ £7.99 AppleTV+ £4.99 (Source adapted from: https://www.radiotimes.com/tv/what- to-watch-tv/best-streaming-service-uk/) Extract A How Netflix makes use of behavioural science In the last few years, companies have been trying to find ways to attract the attention of customers. Various streaming platforms such as Netflix, Amazon, and YouTube use ‘nudges’ to influence consumer behaviour. The ‘next‑up’ feature on Netflix or ‘auto‑play’ on YouTube has been subject to research that relates it to binge‑watching. 5 Binge‑watching is the practice of viewing for a prolonged period, multiple episodes of a TV show or several films in rapid succession. Similarly, the policy of offering a one‑month free subscription under the label of ‘free trial’ requires credit card information to turn the forgetful subscriber into a potential paying one. Following this strategy, Netflix has expanded to 190 countries in just seven years 10 and according to the Wall Street Journal, the company generated total revenue of over $5.2 billion in 2019, which was an increase from 2018 of around $4 billion. However, 2022 data shows that consumers, increasingly worried about the rising cost of living, are turning their back on Netflix. With a reported cancellation of over 200 000 subscriptions in the first quarter and another two million forecast to leave by the 15 end of the year. Subscribers are rethinking their commitment to the streaming services that grew their numbers sharply during the home‑based months of the global health crisis. Netflix subscribers have also quoted a decline in value for money and satisfaction with the quality of the shows as key motives for cancellation. Disney now see higher satisfaction rankings than Netflix across the quality of shows, 20 amount of original content, number of new‑release films, variety of classic films and amount of kids’ content. Forecast cancellation rates for Disney+ fell to an all‑time low of 3.2%. (Source adapted from: https://www.novanudge.com/post/sludge-on-demand-how-netflix- makes-use-of-behavioural-science https://www.theguardian.com/media/2022/apr/20/netflix-shares-fall-losing-subscribers) Extract B The economics of price discrimination Throughout 2022, Netflix, a 100‑billion‑dollar company, increased prices in the US, Canada, the UK and Ireland (most of which saw similar price increases in 2021, too). In sharp contrast, Netflix recently announced it was reducing its prices in India (standard/2‑user 499 rupees a month, equivalent to £5.42) in a bid to compete with 5 Disney+ and Prime. UK students currently enrolled in a college or university who have a valid student email address can join Prime Student through the Amazon website. This gives them nearly 50% off a standard Prime membership and many other exclusive benefits. (Source adapted from: https://help.netflix.com/en/node/24926/in) Extract C Educational Website and TV Programmes BBC Bitesize is a learning platform created by the BBC in 1998. The online study resource allows parents to teach their children from home, using ready-made lesson plans and study guides with questions for all ages. The revision sessions are free to watch and they are available for children aged five up to their late teens. The guides are written by 5 teachers and subject experts, so they are reliable and follow the National Curriculum. Last year Bitesize attracted around two million weekly unique browsers with a peak week of 3.3 million in the GCSE exam period. Oak National Academy is a freely available learning resource website created for pupils aged four to sixteen. Launched in 2020, as a response to the global health crisis, the 10 website includes lesson slides, video lessons, worksheets, and quizzes conforming to the national curriculum in England. Ministers have set aside £43 million to fund the Oak National Academy over the next three years. (Source adapted from: https://www.bbc.co.uk/bitesize/articles/zmjdhbk https://www.structural-learning.com/post/oak-academy-a-teachers-guide#:~:text=Oak%20 National%20Academy%20is%20a,the%20national%20curriculum%20of%20England)
(e) Using examples from Figure 2 or Extract B, discuss the likely impact of price discrimination on a firm’s profits. Use a relevant diagram to support your answer. (15)
June 2023 · Paper 2 · Q2(b) 4 marks AO1=2, AO2=1, AO3=1 Short answer unemployment
Data and extracts for question 22 UK unemployment rate (%), December 2020 – June 2022 6 5.2 5.1 5.0 5.0 4.9 4.9 4.7 5 4.6 4.4 4.3 4.2 4.1 4.0 4.0 3.8 3.7 3.8 3.8 3.8 4 % 3 2 1 0 (Source: adapted from https://www.ons.gov.uk/employmentandlabourmarket/ peopleinwork/employmentandemployeetypes/bulletins/employmentintheuk/august2022)
(b) With reference to the chart on the previous page, explain one likely reason for the change in the UK’s rate of unemployment. (4)
June 2023 · Paper 2 · Q3(a) 2 marks AO2=2 Calculation measuring economic growth
Data and extracts for question 33 UK real GDP, 2020–2022 Annual percentage change on Total (£ millions) previous year 2020 –9.9% 2 045 091 2021 7.5% 2 198 473 2022* 3.5% *2022 figures are forecast (Source: adapted from https://www.ons.gov.uk/economy/grossdomesticproductgdp)
(a) Calculate the value of the total forecast GDP in 2022. (2)
June 2023 · Paper 2 · Q4(b) 4 marks AO2=3, AO3=1 Short answer national income and the multiplier
Data and extracts for question 44 UK consumption, % of GDP, 2004–2021 87.0 86.5 86.0 85.5 85.0 % 84.5 84.0 83.5 83.0 0 2004 2006 2008 2010 2012 2014 2016 2018 2020 (Source: adapted from https://data.worldbank.org/indicator/NE.CON.TOTL.ZS?end=2021& locations=GB&start=2002)
(b) With reference to the chart on the previous page, explain the likely effect of a fall in the marginal propensity to consume on the level of real GDP. Refer to the multiplier in your answer. (4)
June 2023 · Paper 2 · Q5(a) 2 marks AO2=2 Calculation public finances and taxation
Data and extracts for question 55 In 2021, the US total GDP was $23 trillion and national debt was $28.4 trillion. (Source: adapted from https://data.worldbank.org/indicator/NY.GDP.MKTP.CD?locations=US and https://fiscaldata.treasury.gov/national-debt/)
(a) Calculate the US national debt in 2021 as a percentage of GDP. (2)
June 2023 · Paper 2 · Q6(a) 5 marks AO1=2, AO2=2, AO3=1 Short answer trading blocs and protectionism
Data and extracts for question 6Trade and development in Africa Figure 1: Intra- and extra-regional exports as a percentage of total exports, 2020 Europe Asia North America Africa Latin America/Caribbean 0 20 40 60 80 100 (%) Intra: within a region Extra: outside a region (Source: adapted from https://www.economist.com/middle-east-and-africa/2022/03/26/ why-it-costs-so-much-to-move-goods-around-africa) Extract A: Why it costs so much to move goods around Africa Lorries carrying, among other things, cobalt from Congo, copper from Zambia and tea from Malawi queued for miles as they waited to cross the Limpopo river into South Africa. Many were there for days. Some drivers bribe their way to the front; 1 000 rand (£49) is the going rate. Others cannot afford to. 5 African politicians say they want to end such delays. The African Continental Free Trade Area (AfCFTA) regional trade agreement, so far agreed by 41 of Africa’s 55 countries, could boost the region’s economies by making it easier to trade between themselves. In 2020 just 18% of exports were to other African countries (see Figure 1), lower than the equivalent in North America (30%), Asia (58%) or Europe (68%). More trade within the 10 region could lead to more jobs, higher wages and less poverty. The AfCFTA pledges to improve trade in two ways. The first is by reducing tariffs. This could boost intra‑African trade by 15% to 25%, says the IMF. The second is to reduce non‑tariff barriers which could cause a 50% rise in intra‑African trade. Poor infrastructure is a major barrier to trade. Africa’s land area is bigger than China, 15 India, the United States and much of Europe combined. Yet its railway network is not very much bigger than France’s and Germany’s put together. Many lines were built by colonial companies to link mines to ports, rather than countries to one another. Newer Chinese‑built railways across African borders are under‑used, either because they struggle to compete on price with road transport or because they lack additional services 20 such as storage yards. Ports are small and slow. Cargo waits for more than two weeks on average, compared to less than a week in Asia, Europe and Latin America. Handling costs are around 50% higher than in other parts of the world. Nearly 90% of transport of goods goes by road, of which there are not enough. Road 25 quality is poor. Just 800 000 km of the total of 2.8 million km in sub‑Saharan Africa are paved. The IMF estimates that if the quality of Africa’s infrastructure were brought up to the global average this would increase intra‑African trade by 7%. However, even bigger gains could be made by improving how trade flows. The key problem is a lack of information. 30 In much of the world large firms can buy space on trains or lorries as they need it. But in Africa, where markets for this do not exist, firms such as miners have to sign long‑term contracts with larger transport firms in which they agree to pay for capacity, whether they use it all or not. (Source: adapted from https://www.economist.com/middle-east-and-africa/2022/03/26/ why-it-costs-so-much-to-move-goods-around-africa) Extract B: Economic reform in Angola When the new president, João Lourenço, took power in the southern African country of Angola in 2017, he pledged to reform the economy. This is a challenging task. The oil industry accounts for nearly all of Angola’s exports and two‑thirds of government revenues. The government is heavily involved in oil production along with significant 5 foreign direct investment from international firms such as Chevron and Total. Declining production and falling oil prices brought about a collapse in GDP and rapidly rising debts to China and the IMF. To reduce the cost of debt repayments, improve the country’s fiscal position, and support a steadily declining debt‑to‑GDP ratio, the government of Angola has opted for debt 10 relief. Together with a complete stop on debt repayments for the next three years, Angola will gain additional cash flow of $6.9 billion in 2020–22. This will help bring Angola’s total annual borrowing to a much more manageable level of around 8.7% of GDP. With improved finances the government will have more money to spend supporting the economy and providing vital public services to its citizens, over 17 million of whom still 15 live in absolute poverty. The IMF, which has since 2018 agreed to lend $4.5 billion to Angola, is also encouraged by the country’s fiscal policies. The finance minister, Vera Daves de Sousa, wants the state oil firm to sell shares to the public and for over one hundred state firms to be privatised. There have been delays – just 34 sales have taken place so far. But, she says, private firms 20 must be the ‘main driver’ of growth and the economy must diversify away from oil. Since 2019 Angola has ended government intervention in the foreign exchange market and moved towards a floating exchange rate. This led to a rapid depreciation in the kwanza (the Angolan currency) before stabilising after a few months. (Sources: adapted from https://www.economist.com/middle-east-and-africa/2021/02/20/ joao-lourencos-reforms-in-angola-are-pleasing-the-imf, https://www.cabri-sbo.org/en/ blog/2021/country-spotlight-angolas-commitment-to-prudent-and-proactive-public-debt- management, and https://www.focus-economics.com/countries/angola/news/special/ kwanza-dives-to-all-time-low-as-central-bank-floats-the-currency)
(a) With reference to Extract A, explain what is meant by a ‘regional trade agreement’ (Extract A, line 7). (5)
June 2023 · Paper 2 · Q6(b) 8 marks AO1=2, AO2=2, AO3=2, AO4=2 8-mark response emerging and developing economies
Data and extracts for question 6Trade and development in Africa Figure 1: Intra- and extra-regional exports as a percentage of total exports, 2020 Europe Asia North America Africa Latin America/Caribbean 0 20 40 60 80 100 (%) Intra: within a region Extra: outside a region (Source: adapted from https://www.economist.com/middle-east-and-africa/2022/03/26/ why-it-costs-so-much-to-move-goods-around-africa) Extract A: Why it costs so much to move goods around Africa Lorries carrying, among other things, cobalt from Congo, copper from Zambia and tea from Malawi queued for miles as they waited to cross the Limpopo river into South Africa. Many were there for days. Some drivers bribe their way to the front; 1 000 rand (£49) is the going rate. Others cannot afford to. 5 African politicians say they want to end such delays. The African Continental Free Trade Area (AfCFTA) regional trade agreement, so far agreed by 41 of Africa’s 55 countries, could boost the region’s economies by making it easier to trade between themselves. In 2020 just 18% of exports were to other African countries (see Figure 1), lower than the equivalent in North America (30%), Asia (58%) or Europe (68%). More trade within the 10 region could lead to more jobs, higher wages and less poverty. The AfCFTA pledges to improve trade in two ways. The first is by reducing tariffs. This could boost intra‑African trade by 15% to 25%, says the IMF. The second is to reduce non‑tariff barriers which could cause a 50% rise in intra‑African trade. Poor infrastructure is a major barrier to trade. Africa’s land area is bigger than China, 15 India, the United States and much of Europe combined. Yet its railway network is not very much bigger than France’s and Germany’s put together. Many lines were built by colonial companies to link mines to ports, rather than countries to one another. Newer Chinese‑built railways across African borders are under‑used, either because they struggle to compete on price with road transport or because they lack additional services 20 such as storage yards. Ports are small and slow. Cargo waits for more than two weeks on average, compared to less than a week in Asia, Europe and Latin America. Handling costs are around 50% higher than in other parts of the world. Nearly 90% of transport of goods goes by road, of which there are not enough. Road 25 quality is poor. Just 800 000 km of the total of 2.8 million km in sub‑Saharan Africa are paved. The IMF estimates that if the quality of Africa’s infrastructure were brought up to the global average this would increase intra‑African trade by 7%. However, even bigger gains could be made by improving how trade flows. The key problem is a lack of information. 30 In much of the world large firms can buy space on trains or lorries as they need it. But in Africa, where markets for this do not exist, firms such as miners have to sign long‑term contracts with larger transport firms in which they agree to pay for capacity, whether they use it all or not. (Source: adapted from https://www.economist.com/middle-east-and-africa/2022/03/26/ why-it-costs-so-much-to-move-goods-around-africa) Extract B: Economic reform in Angola When the new president, João Lourenço, took power in the southern African country of Angola in 2017, he pledged to reform the economy. This is a challenging task. The oil industry accounts for nearly all of Angola’s exports and two‑thirds of government revenues. The government is heavily involved in oil production along with significant 5 foreign direct investment from international firms such as Chevron and Total. Declining production and falling oil prices brought about a collapse in GDP and rapidly rising debts to China and the IMF. To reduce the cost of debt repayments, improve the country’s fiscal position, and support a steadily declining debt‑to‑GDP ratio, the government of Angola has opted for debt 10 relief. Together with a complete stop on debt repayments for the next three years, Angola will gain additional cash flow of $6.9 billion in 2020–22. This will help bring Angola’s total annual borrowing to a much more manageable level of around 8.7% of GDP. With improved finances the government will have more money to spend supporting the economy and providing vital public services to its citizens, over 17 million of whom still 15 live in absolute poverty. The IMF, which has since 2018 agreed to lend $4.5 billion to Angola, is also encouraged by the country’s fiscal policies. The finance minister, Vera Daves de Sousa, wants the state oil firm to sell shares to the public and for over one hundred state firms to be privatised. There have been delays – just 34 sales have taken place so far. But, she says, private firms 20 must be the ‘main driver’ of growth and the economy must diversify away from oil. Since 2019 Angola has ended government intervention in the foreign exchange market and moved towards a floating exchange rate. This led to a rapid depreciation in the kwanza (the Angolan currency) before stabilising after a few months. (Sources: adapted from https://www.economist.com/middle-east-and-africa/2021/02/20/ joao-lourencos-reforms-in-angola-are-pleasing-the-imf, https://www.cabri-sbo.org/en/ blog/2021/country-spotlight-angolas-commitment-to-prudent-and-proactive-public-debt- management, and https://www.focus-economics.com/countries/angola/news/special/ kwanza-dives-to-all-time-low-as-central-bank-floats-the-currency)
(b) With reference to Extract A, examine two causes of the high cost of transporting goods between African countries. (8)
June 2023 · Paper 2 · Q6(d) 10 marks AO1=2, AO2=2, AO3=2, AO4=4 10-mark response emerging and developing economies
Data and extracts for question 6Trade and development in Africa Figure 1: Intra- and extra-regional exports as a percentage of total exports, 2020 Europe Asia North America Africa Latin America/Caribbean 0 20 40 60 80 100 (%) Intra: within a region Extra: outside a region (Source: adapted from https://www.economist.com/middle-east-and-africa/2022/03/26/ why-it-costs-so-much-to-move-goods-around-africa) Extract A: Why it costs so much to move goods around Africa Lorries carrying, among other things, cobalt from Congo, copper from Zambia and tea from Malawi queued for miles as they waited to cross the Limpopo river into South Africa. Many were there for days. Some drivers bribe their way to the front; 1 000 rand (£49) is the going rate. Others cannot afford to. 5 African politicians say they want to end such delays. The African Continental Free Trade Area (AfCFTA) regional trade agreement, so far agreed by 41 of Africa’s 55 countries, could boost the region’s economies by making it easier to trade between themselves. In 2020 just 18% of exports were to other African countries (see Figure 1), lower than the equivalent in North America (30%), Asia (58%) or Europe (68%). More trade within the 10 region could lead to more jobs, higher wages and less poverty. The AfCFTA pledges to improve trade in two ways. The first is by reducing tariffs. This could boost intra‑African trade by 15% to 25%, says the IMF. The second is to reduce non‑tariff barriers which could cause a 50% rise in intra‑African trade. Poor infrastructure is a major barrier to trade. Africa’s land area is bigger than China, 15 India, the United States and much of Europe combined. Yet its railway network is not very much bigger than France’s and Germany’s put together. Many lines were built by colonial companies to link mines to ports, rather than countries to one another. Newer Chinese‑built railways across African borders are under‑used, either because they struggle to compete on price with road transport or because they lack additional services 20 such as storage yards. Ports are small and slow. Cargo waits for more than two weeks on average, compared to less than a week in Asia, Europe and Latin America. Handling costs are around 50% higher than in other parts of the world. Nearly 90% of transport of goods goes by road, of which there are not enough. Road 25 quality is poor. Just 800 000 km of the total of 2.8 million km in sub‑Saharan Africa are paved. The IMF estimates that if the quality of Africa’s infrastructure were brought up to the global average this would increase intra‑African trade by 7%. However, even bigger gains could be made by improving how trade flows. The key problem is a lack of information. 30 In much of the world large firms can buy space on trains or lorries as they need it. But in Africa, where markets for this do not exist, firms such as miners have to sign long‑term contracts with larger transport firms in which they agree to pay for capacity, whether they use it all or not. (Source: adapted from https://www.economist.com/middle-east-and-africa/2022/03/26/ why-it-costs-so-much-to-move-goods-around-africa) Extract B: Economic reform in Angola When the new president, João Lourenço, took power in the southern African country of Angola in 2017, he pledged to reform the economy. This is a challenging task. The oil industry accounts for nearly all of Angola’s exports and two‑thirds of government revenues. The government is heavily involved in oil production along with significant 5 foreign direct investment from international firms such as Chevron and Total. Declining production and falling oil prices brought about a collapse in GDP and rapidly rising debts to China and the IMF. To reduce the cost of debt repayments, improve the country’s fiscal position, and support a steadily declining debt‑to‑GDP ratio, the government of Angola has opted for debt 10 relief. Together with a complete stop on debt repayments for the next three years, Angola will gain additional cash flow of $6.9 billion in 2020–22. This will help bring Angola’s total annual borrowing to a much more manageable level of around 8.7% of GDP. With improved finances the government will have more money to spend supporting the economy and providing vital public services to its citizens, over 17 million of whom still 15 live in absolute poverty. The IMF, which has since 2018 agreed to lend $4.5 billion to Angola, is also encouraged by the country’s fiscal policies. The finance minister, Vera Daves de Sousa, wants the state oil firm to sell shares to the public and for over one hundred state firms to be privatised. There have been delays – just 34 sales have taken place so far. But, she says, private firms 20 must be the ‘main driver’ of growth and the economy must diversify away from oil. Since 2019 Angola has ended government intervention in the foreign exchange market and moved towards a floating exchange rate. This led to a rapid depreciation in the kwanza (the Angolan currency) before stabilising after a few months. (Sources: adapted from https://www.economist.com/middle-east-and-africa/2021/02/20/ joao-lourencos-reforms-in-angola-are-pleasing-the-imf, https://www.cabri-sbo.org/en/ blog/2021/country-spotlight-angolas-commitment-to-prudent-and-proactive-public-debt- management, and https://www.focus-economics.com/countries/angola/news/special/ kwanza-dives-to-all-time-low-as-central-bank-floats-the-currency)
(d) Assess two likely benefits of debt relief to Angola. Refer to Extract B in your answer. (10)
June 2023 · Paper 2 · Q6(e) 15 marks AO1=3, AO2=3, AO3=3, AO4=6 15-mark response emerging and developing economies
Data and extracts for question 6Trade and development in Africa Figure 1: Intra- and extra-regional exports as a percentage of total exports, 2020 Europe Asia North America Africa Latin America/Caribbean 0 20 40 60 80 100 (%) Intra: within a region Extra: outside a region (Source: adapted from https://www.economist.com/middle-east-and-africa/2022/03/26/ why-it-costs-so-much-to-move-goods-around-africa) Extract A: Why it costs so much to move goods around Africa Lorries carrying, among other things, cobalt from Congo, copper from Zambia and tea from Malawi queued for miles as they waited to cross the Limpopo river into South Africa. Many were there for days. Some drivers bribe their way to the front; 1 000 rand (£49) is the going rate. Others cannot afford to. 5 African politicians say they want to end such delays. The African Continental Free Trade Area (AfCFTA) regional trade agreement, so far agreed by 41 of Africa’s 55 countries, could boost the region’s economies by making it easier to trade between themselves. In 2020 just 18% of exports were to other African countries (see Figure 1), lower than the equivalent in North America (30%), Asia (58%) or Europe (68%). More trade within the 10 region could lead to more jobs, higher wages and less poverty. The AfCFTA pledges to improve trade in two ways. The first is by reducing tariffs. This could boost intra‑African trade by 15% to 25%, says the IMF. The second is to reduce non‑tariff barriers which could cause a 50% rise in intra‑African trade. Poor infrastructure is a major barrier to trade. Africa’s land area is bigger than China, 15 India, the United States and much of Europe combined. Yet its railway network is not very much bigger than France’s and Germany’s put together. Many lines were built by colonial companies to link mines to ports, rather than countries to one another. Newer Chinese‑built railways across African borders are under‑used, either because they struggle to compete on price with road transport or because they lack additional services 20 such as storage yards. Ports are small and slow. Cargo waits for more than two weeks on average, compared to less than a week in Asia, Europe and Latin America. Handling costs are around 50% higher than in other parts of the world. Nearly 90% of transport of goods goes by road, of which there are not enough. Road 25 quality is poor. Just 800 000 km of the total of 2.8 million km in sub‑Saharan Africa are paved. The IMF estimates that if the quality of Africa’s infrastructure were brought up to the global average this would increase intra‑African trade by 7%. However, even bigger gains could be made by improving how trade flows. The key problem is a lack of information. 30 In much of the world large firms can buy space on trains or lorries as they need it. But in Africa, where markets for this do not exist, firms such as miners have to sign long‑term contracts with larger transport firms in which they agree to pay for capacity, whether they use it all or not. (Source: adapted from https://www.economist.com/middle-east-and-africa/2022/03/26/ why-it-costs-so-much-to-move-goods-around-africa) Extract B: Economic reform in Angola When the new president, João Lourenço, took power in the southern African country of Angola in 2017, he pledged to reform the economy. This is a challenging task. The oil industry accounts for nearly all of Angola’s exports and two‑thirds of government revenues. The government is heavily involved in oil production along with significant 5 foreign direct investment from international firms such as Chevron and Total. Declining production and falling oil prices brought about a collapse in GDP and rapidly rising debts to China and the IMF. To reduce the cost of debt repayments, improve the country’s fiscal position, and support a steadily declining debt‑to‑GDP ratio, the government of Angola has opted for debt 10 relief. Together with a complete stop on debt repayments for the next three years, Angola will gain additional cash flow of $6.9 billion in 2020–22. This will help bring Angola’s total annual borrowing to a much more manageable level of around 8.7% of GDP. With improved finances the government will have more money to spend supporting the economy and providing vital public services to its citizens, over 17 million of whom still 15 live in absolute poverty. The IMF, which has since 2018 agreed to lend $4.5 billion to Angola, is also encouraged by the country’s fiscal policies. The finance minister, Vera Daves de Sousa, wants the state oil firm to sell shares to the public and for over one hundred state firms to be privatised. There have been delays – just 34 sales have taken place so far. But, she says, private firms 20 must be the ‘main driver’ of growth and the economy must diversify away from oil. Since 2019 Angola has ended government intervention in the foreign exchange market and moved towards a floating exchange rate. This led to a rapid depreciation in the kwanza (the Angolan currency) before stabilising after a few months. (Sources: adapted from https://www.economist.com/middle-east-and-africa/2021/02/20/ joao-lourencos-reforms-in-angola-are-pleasing-the-imf, https://www.cabri-sbo.org/en/ blog/2021/country-spotlight-angolas-commitment-to-prudent-and-proactive-public-debt- management, and https://www.focus-economics.com/countries/angola/news/special/ kwanza-dives-to-all-time-low-as-central-bank-floats-the-currency)
(e) Discuss market-orientated strategies the Angolan government could use to improve development. (15)
June 2023 · Paper 3 · Q1(a) 5 marks AO1=2, AO2=2, AO3=1 Short answer nature of economics
Data and extracts for question 1The UK economy Figure 1: UK gas prices in pence per therm, August 2002 to August 2022 600 500 400 Pence per 300 therm 200 100 0 Aug Aug Aug 2002 2012 2022 Figure 2: UK inflation, CPI, August 2002 to August 2022 10 9.9 8 6 (%) 4 2 0 –2 Aug Aug Aug 2002 2012 2022 Extract A Fiscal policy changes in the UK, Autumn 2022 After many changes in policy, people earning above £150 000 will now no longer benefit from the tax cut in the September 2022 mini‑budget, which proposed the removal of the 45% tax band. The proposed change in the main 20% standard rate of income tax moving to 19% has been postponed. 5 In April 2022, a 1.25% rise in national insurance contributions was implemented, labelled as a health and social care levy. It was cancelled in Autumn 2022. Britain’s poorest households would have lost £7.56 a year from the national insurance rise. The richest 10% of households, earning an average of £108 000, would have lost £1 800. Another measure in the Truss Government’s £30 billion tax cut proposals that would have 10 benefitted the rich, was the removal of the 2023 planned rise in corporation tax from 19% to 25%. The former chancellor wanted to cut the tax to 15% but this was the wrong time to do this. The former chancellor also removed the 2014 cap on bankers’ bonuses, clearly an unfair decision at the time when public sector workers were told to accept pay caps to keep inflation under control. 15 The reflationary fiscal policy triggered warnings that the Monetary Policy Committee of the Bank of England would raise interest rates further – having already raised them from 0.1% in 2021 to 2.25% in September 2022. This meant an end to the fiscal rules set by the government in the recent past: debt to be falling as a share of national income by 2024 and no borrowing for day‑to‑day spending. 20 (Source: adapted from ‘Tax cuts benefit high income earners the most’ R Merrick The Independent: 19 September 2022 and FT Source: adapted from Sebastian Payne and Chris Giles in London 29 August 2022) Extract B Inequality to rise in the UK The rising cost of living is expected to affect low‑income families the most. Inflation in Autumn 2022 is expected to hit 14% for families in the poorest tenth of the income distribution, compared with 8% for families in the richest tenth, driven in large part by rising energy costs and food prices. Around half of the food consumed in the UK is 5 imported, and the 20% fall in the value of the pound in 2022 has affected lower income groups more because food is a higher proportion of their spending. The government’s decision to freeze benefits, rather than allowing them to rise in line with current inflation, means that the support provided is a real terms cut for families currently receiving high levels of benefits. A two‑year freeze on energy price caps will now only last until April 10 2023, which would have kept the average energy bill at £2 500 rather than £3 500. (Source: adapted from IFS Report: Living standards, poverty and inequality in the UK: July 2022 and https://www.ft.com/content/6de5b52e- 64c8-4997-8939-e1c59172daa7?shareType=nongift)
(a) Explain the difference between a positive and a normative statement, using an example of each from Extract A. (5)
June 2023 · Paper 3 · Q1(b) 8 marks AO1=2, AO2=2, AO3=2, AO4=2 8-mark response inflation
Data and extracts for question 1The UK economy Figure 1: UK gas prices in pence per therm, August 2002 to August 2022 600 500 400 Pence per 300 therm 200 100 0 Aug Aug Aug 2002 2012 2022 Figure 2: UK inflation, CPI, August 2002 to August 2022 10 9.9 8 6 (%) 4 2 0 –2 Aug Aug Aug 2002 2012 2022 Extract A Fiscal policy changes in the UK, Autumn 2022 After many changes in policy, people earning above £150 000 will now no longer benefit from the tax cut in the September 2022 mini‑budget, which proposed the removal of the 45% tax band. The proposed change in the main 20% standard rate of income tax moving to 19% has been postponed. 5 In April 2022, a 1.25% rise in national insurance contributions was implemented, labelled as a health and social care levy. It was cancelled in Autumn 2022. Britain’s poorest households would have lost £7.56 a year from the national insurance rise. The richest 10% of households, earning an average of £108 000, would have lost £1 800. Another measure in the Truss Government’s £30 billion tax cut proposals that would have 10 benefitted the rich, was the removal of the 2023 planned rise in corporation tax from 19% to 25%. The former chancellor wanted to cut the tax to 15% but this was the wrong time to do this. The former chancellor also removed the 2014 cap on bankers’ bonuses, clearly an unfair decision at the time when public sector workers were told to accept pay caps to keep inflation under control. 15 The reflationary fiscal policy triggered warnings that the Monetary Policy Committee of the Bank of England would raise interest rates further – having already raised them from 0.1% in 2021 to 2.25% in September 2022. This meant an end to the fiscal rules set by the government in the recent past: debt to be falling as a share of national income by 2024 and no borrowing for day‑to‑day spending. 20 (Source: adapted from ‘Tax cuts benefit high income earners the most’ R Merrick The Independent: 19 September 2022 and FT Source: adapted from Sebastian Payne and Chris Giles in London 29 August 2022) Extract B Inequality to rise in the UK The rising cost of living is expected to affect low‑income families the most. Inflation in Autumn 2022 is expected to hit 14% for families in the poorest tenth of the income distribution, compared with 8% for families in the richest tenth, driven in large part by rising energy costs and food prices. Around half of the food consumed in the UK is 5 imported, and the 20% fall in the value of the pound in 2022 has affected lower income groups more because food is a higher proportion of their spending. The government’s decision to freeze benefits, rather than allowing them to rise in line with current inflation, means that the support provided is a real terms cut for families currently receiving high levels of benefits. A two‑year freeze on energy price caps will now only last until April 10 2023, which would have kept the average energy bill at £2 500 rather than £3 500. (Source: adapted from IFS Report: Living standards, poverty and inequality in the UK: July 2022 and https://www.ft.com/content/6de5b52e- 64c8-4997-8939-e1c59172daa7?shareType=nongift)
(b) Examine two reasons for the rise in inflation in the UK. Refer to the information provided in your answer. (8)
June 2023 · Paper 3 · Q1(c) 12 marks AO1=2, AO2=2, AO3=4, AO4=4 12-mark response revenues costs and profits
Data and extracts for question 1The UK economy Figure 1: UK gas prices in pence per therm, August 2002 to August 2022 600 500 400 Pence per 300 therm 200 100 0 Aug Aug Aug 2002 2012 2022 Figure 2: UK inflation, CPI, August 2002 to August 2022 10 9.9 8 6 (%) 4 2 0 –2 Aug Aug Aug 2002 2012 2022 Extract A Fiscal policy changes in the UK, Autumn 2022 After many changes in policy, people earning above £150 000 will now no longer benefit from the tax cut in the September 2022 mini‑budget, which proposed the removal of the 45% tax band. The proposed change in the main 20% standard rate of income tax moving to 19% has been postponed. 5 In April 2022, a 1.25% rise in national insurance contributions was implemented, labelled as a health and social care levy. It was cancelled in Autumn 2022. Britain’s poorest households would have lost £7.56 a year from the national insurance rise. The richest 10% of households, earning an average of £108 000, would have lost £1 800. Another measure in the Truss Government’s £30 billion tax cut proposals that would have 10 benefitted the rich, was the removal of the 2023 planned rise in corporation tax from 19% to 25%. The former chancellor wanted to cut the tax to 15% but this was the wrong time to do this. The former chancellor also removed the 2014 cap on bankers’ bonuses, clearly an unfair decision at the time when public sector workers were told to accept pay caps to keep inflation under control. 15 The reflationary fiscal policy triggered warnings that the Monetary Policy Committee of the Bank of England would raise interest rates further – having already raised them from 0.1% in 2021 to 2.25% in September 2022. This meant an end to the fiscal rules set by the government in the recent past: debt to be falling as a share of national income by 2024 and no borrowing for day‑to‑day spending. 20 (Source: adapted from ‘Tax cuts benefit high income earners the most’ R Merrick The Independent: 19 September 2022 and FT Source: adapted from Sebastian Payne and Chris Giles in London 29 August 2022) Extract B Inequality to rise in the UK The rising cost of living is expected to affect low‑income families the most. Inflation in Autumn 2022 is expected to hit 14% for families in the poorest tenth of the income distribution, compared with 8% for families in the richest tenth, driven in large part by rising energy costs and food prices. Around half of the food consumed in the UK is 5 imported, and the 20% fall in the value of the pound in 2022 has affected lower income groups more because food is a higher proportion of their spending. The government’s decision to freeze benefits, rather than allowing them to rise in line with current inflation, means that the support provided is a real terms cut for families currently receiving high levels of benefits. A two‑year freeze on energy price caps will now only last until April 10 2023, which would have kept the average energy bill at £2 500 rather than £3 500. (Source: adapted from IFS Report: Living standards, poverty and inequality in the UK: July 2022 and https://www.ft.com/content/6de5b52e- 64c8-4997-8939-e1c59172daa7?shareType=nongift)
(c) Discuss the likely impact of a rise in gas prices on a firm that uses a large amount of gas in its production process. Use a cost and revenue diagram to support your answer. (12)
June 2023 · Paper 3 · Q1(d) 25 marks AO1=4, AO2=4, AO3=8, AO4=9 25-mark essay Either/or macroeconomic policy in a global contextlabour market
Data and extracts for question 1The UK economy Figure 1: UK gas prices in pence per therm, August 2002 to August 2022 600 500 400 Pence per 300 therm 200 100 0 Aug Aug Aug 2002 2012 2022 Figure 2: UK inflation, CPI, August 2002 to August 2022 10 9.9 8 6 (%) 4 2 0 –2 Aug Aug Aug 2002 2012 2022 Extract A Fiscal policy changes in the UK, Autumn 2022 After many changes in policy, people earning above £150 000 will now no longer benefit from the tax cut in the September 2022 mini‑budget, which proposed the removal of the 45% tax band. The proposed change in the main 20% standard rate of income tax moving to 19% has been postponed. 5 In April 2022, a 1.25% rise in national insurance contributions was implemented, labelled as a health and social care levy. It was cancelled in Autumn 2022. Britain’s poorest households would have lost £7.56 a year from the national insurance rise. The richest 10% of households, earning an average of £108 000, would have lost £1 800. Another measure in the Truss Government’s £30 billion tax cut proposals that would have 10 benefitted the rich, was the removal of the 2023 planned rise in corporation tax from 19% to 25%. The former chancellor wanted to cut the tax to 15% but this was the wrong time to do this. The former chancellor also removed the 2014 cap on bankers’ bonuses, clearly an unfair decision at the time when public sector workers were told to accept pay caps to keep inflation under control. 15 The reflationary fiscal policy triggered warnings that the Monetary Policy Committee of the Bank of England would raise interest rates further – having already raised them from 0.1% in 2021 to 2.25% in September 2022. This meant an end to the fiscal rules set by the government in the recent past: debt to be falling as a share of national income by 2024 and no borrowing for day‑to‑day spending. 20 (Source: adapted from ‘Tax cuts benefit high income earners the most’ R Merrick The Independent: 19 September 2022 and FT Source: adapted from Sebastian Payne and Chris Giles in London 29 August 2022) Extract B Inequality to rise in the UK The rising cost of living is expected to affect low‑income families the most. Inflation in Autumn 2022 is expected to hit 14% for families in the poorest tenth of the income distribution, compared with 8% for families in the richest tenth, driven in large part by rising energy costs and food prices. Around half of the food consumed in the UK is 5 imported, and the 20% fall in the value of the pound in 2022 has affected lower income groups more because food is a higher proportion of their spending. The government’s decision to freeze benefits, rather than allowing them to rise in line with current inflation, means that the support provided is a real terms cut for families currently receiving high levels of benefits. A two‑year freeze on energy price caps will now only last until April 10 2023, which would have kept the average energy bill at £2 500 rather than £3 500. (Source: adapted from IFS Report: Living standards, poverty and inequality in the UK: July 2022 and https://www.ft.com/content/6de5b52e- 64c8-4997-8939-e1c59172daa7?shareType=nongift)
(d) Evaluate microeconomic and macroeconomic policies that could be used to reduce inequality in the UK. (25)
June 2023 · Paper 3 · Q1(e) 25 marks AO1=4, AO2=4, AO3=8, AO4=9 25-mark essay Either/or public finances and taxation
Data and extracts for question 1The UK economy Figure 1: UK gas prices in pence per therm, August 2002 to August 2022 600 500 400 Pence per 300 therm 200 100 0 Aug Aug Aug 2002 2012 2022 Figure 2: UK inflation, CPI, August 2002 to August 2022 10 9.9 8 6 (%) 4 2 0 –2 Aug Aug Aug 2002 2012 2022 Extract A Fiscal policy changes in the UK, Autumn 2022 After many changes in policy, people earning above £150 000 will now no longer benefit from the tax cut in the September 2022 mini‑budget, which proposed the removal of the 45% tax band. The proposed change in the main 20% standard rate of income tax moving to 19% has been postponed. 5 In April 2022, a 1.25% rise in national insurance contributions was implemented, labelled as a health and social care levy. It was cancelled in Autumn 2022. Britain’s poorest households would have lost £7.56 a year from the national insurance rise. The richest 10% of households, earning an average of £108 000, would have lost £1 800. Another measure in the Truss Government’s £30 billion tax cut proposals that would have 10 benefitted the rich, was the removal of the 2023 planned rise in corporation tax from 19% to 25%. The former chancellor wanted to cut the tax to 15% but this was the wrong time to do this. The former chancellor also removed the 2014 cap on bankers’ bonuses, clearly an unfair decision at the time when public sector workers were told to accept pay caps to keep inflation under control. 15 The reflationary fiscal policy triggered warnings that the Monetary Policy Committee of the Bank of England would raise interest rates further – having already raised them from 0.1% in 2021 to 2.25% in September 2022. This meant an end to the fiscal rules set by the government in the recent past: debt to be falling as a share of national income by 2024 and no borrowing for day‑to‑day spending. 20 (Source: adapted from ‘Tax cuts benefit high income earners the most’ R Merrick The Independent: 19 September 2022 and FT Source: adapted from Sebastian Payne and Chris Giles in London 29 August 2022) Extract B Inequality to rise in the UK The rising cost of living is expected to affect low‑income families the most. Inflation in Autumn 2022 is expected to hit 14% for families in the poorest tenth of the income distribution, compared with 8% for families in the richest tenth, driven in large part by rising energy costs and food prices. Around half of the food consumed in the UK is 5 imported, and the 20% fall in the value of the pound in 2022 has affected lower income groups more because food is a higher proportion of their spending. The government’s decision to freeze benefits, rather than allowing them to rise in line with current inflation, means that the support provided is a real terms cut for families currently receiving high levels of benefits. A two‑year freeze on energy price caps will now only last until April 10 2023, which would have kept the average energy bill at £2 500 rather than £3 500. (Source: adapted from IFS Report: Living standards, poverty and inequality in the UK: July 2022 and https://www.ft.com/content/6de5b52e- 64c8-4997-8939-e1c59172daa7?shareType=nongift)
(e) Evaluate the likely microeconomic and macroeconomic effects of tax cuts in the UK. (25)
June 2023 · Paper 3 · Q2(a) 5 marks AO1=2, AO2=2, AO3=1 Short answer financial sector
Data and extracts for question 2Changes in the nature of UK towns and cities Figure 3: Growing and declining high street firms – net change in store numbers, 2013–2022 Barbers Beauty salons Cafés and tearooms Nail salons Restaurants Fashion shops Estate agents Post Office services Clothes – women Banks and other financial institutions –4 000 –3 000 –2 000 –1 000 0 1 000 2 000 3 000 4 000 5 000 Net increase/decrease in store numbers (Source: adapted from https://www2.deloitte.com/uk/en/pages/consumer- business/articles/what-next-for-the-high-street.html) Figure 4: House price changes in the UK (%), 2005 to 2022 15 10 5 0 (%) –5 –10 –15 –20 2005 2010 2015 2020 2022 (Source: adapted from https://www.theguardian.com/money/2022/sep/28/ uk-house-prices-may-fall-20-amid-mortgage-carnage-warn-experts) Extract C What next for the high street? A high street is typically found in all UK towns and cities. Shops normally encountered in a typical UK high street can include successful small firms such as independent food retailers, cafés, nail and beauty salons, restaurants and charity shops. They differ from out‑of‑town shopping centres by being more diverse, family‑run and offering local or 5 personalised services. Customers are often very loyal. However, the high street may often have limited access by car or expensive parking facilities. The rise of online retailers such as Amazon and eBay have placed huge pressures on UK high streets, with many well‑known shops – and even successful retail chains – forced to close due to lost business. Many high street firms cannot compete on price with online 10 retailers who – because they frequently have very low fixed costs – can significantly undercut the high street shops on price. Even before online shopping, competition was eroding high street activity, with out‑of‑town retail parks that were not necessarily cheaper but provide a larger range of shops and offer plentiful parking. They offer a shopping experience that other retailing 15 cannot match – pleasant, safe pedestrian shopping, a clean environment, fun activities for children and spend‑the‑day‑there potential. While the list of retail and leisure failures might suggest that the high street does not have a future, some analysts argue the opposite. Many believe that the high street is ideally placed to reinvent itself in response to the structural shift in working and 20 shopping patterns that has resulted from the global health crisis 2020–22. The perceived weaknesses of the high street model – its fragmented ownership, lack of centralised coordination and high vacancy rates – become strengths as they lower the barriers to entry for new concepts and operators. They also enable risk taking and innovation that will ultimately lead to a more flourishing and diverse environment on our local high 25 streets. It should be possible for small firms to flourish even when staff shortages are pushing up wages in the high street, and house price falls damage consumer confidence and spending on perceived luxuries. (Source: adapted from https://www.designingbuildings.co.uk/ and https://www2.deloitte. com/uk/en/pages/consumer-business/articles/what-next-for-the-high-street.html) Extract D UK house prices may fall up to 20% Turmoil on the UK financial markets has prompted analysts to predict that house prices could fall dramatically, and many lenders in the mortgage sector are withdrawing deals. People coming to the end of their fixed‑rate mortgages are seeing rises from 2% to over 5.5%, with increases in the cost of borrowing of over £5 200 a year by 2024 for the 5 average mortgage in the UK. Many people think UK house prices will never fall, but analysts say the fall could be between 10% and 20%. One mortgage lender said that a lack of housing supply will not keep house prices up when mortgage interest rates are somewhere between 5% and 7%. He claimed that ‘the decade‑long property bubble is about to burst […] It’s a buyer’s market now’. The 10 greatest impact will be seen in the southeast of England. (Source: adapted from https://www.theguardian.com/money/2022/sep/28/ uk-house-prices-may-fall-20-amid-mortgage-carnage-warn-experts) Extract E UK job vacancies hit record 1.1 million as labour shortages increase The ratio of jobless people to vacancies is 1.45 to 1, lower than at any point in the last 40 years. Social care for example has 300 000 current unfilled posts. ‘Today’s figures show that labour shortages are now affecting the whole economy,’ said one analyst. ‘There are almost a million people fewer in the labour market, largely due to 5 younger people staying in education and older people dropping out of the workforce.’ The inactivity rate is 21.1%, and many people are not returning to work after the global health crisis. ‘People seeking work do not have the skills or availability that employers need,’ said Kitty Ussher, chief economist at the Institute of Directors. Firms offering higher wages does not solve the issue. 10 (Source: adapted from https://www.ft.com/content/463f4fbd- 3a50-45b5-891c-5cb5ba623df8)
(a) Using the data provided in Extract D, explain one role of financial markets. (5)
June 2023 · Paper 3 · Q2(b) 8 marks AO1=2, AO2=2, AO3=2, AO4=2 8-mark response business growth and objectives
Data and extracts for question 2Changes in the nature of UK towns and cities Figure 3: Growing and declining high street firms – net change in store numbers, 2013–2022 Barbers Beauty salons Cafés and tearooms Nail salons Restaurants Fashion shops Estate agents Post Office services Clothes – women Banks and other financial institutions –4 000 –3 000 –2 000 –1 000 0 1 000 2 000 3 000 4 000 5 000 Net increase/decrease in store numbers (Source: adapted from https://www2.deloitte.com/uk/en/pages/consumer- business/articles/what-next-for-the-high-street.html) Figure 4: House price changes in the UK (%), 2005 to 2022 15 10 5 0 (%) –5 –10 –15 –20 2005 2010 2015 2020 2022 (Source: adapted from https://www.theguardian.com/money/2022/sep/28/ uk-house-prices-may-fall-20-amid-mortgage-carnage-warn-experts) Extract C What next for the high street? A high street is typically found in all UK towns and cities. Shops normally encountered in a typical UK high street can include successful small firms such as independent food retailers, cafés, nail and beauty salons, restaurants and charity shops. They differ from out‑of‑town shopping centres by being more diverse, family‑run and offering local or 5 personalised services. Customers are often very loyal. However, the high street may often have limited access by car or expensive parking facilities. The rise of online retailers such as Amazon and eBay have placed huge pressures on UK high streets, with many well‑known shops – and even successful retail chains – forced to close due to lost business. Many high street firms cannot compete on price with online 10 retailers who – because they frequently have very low fixed costs – can significantly undercut the high street shops on price. Even before online shopping, competition was eroding high street activity, with out‑of‑town retail parks that were not necessarily cheaper but provide a larger range of shops and offer plentiful parking. They offer a shopping experience that other retailing 15 cannot match – pleasant, safe pedestrian shopping, a clean environment, fun activities for children and spend‑the‑day‑there potential. While the list of retail and leisure failures might suggest that the high street does not have a future, some analysts argue the opposite. Many believe that the high street is ideally placed to reinvent itself in response to the structural shift in working and 20 shopping patterns that has resulted from the global health crisis 2020–22. The perceived weaknesses of the high street model – its fragmented ownership, lack of centralised coordination and high vacancy rates – become strengths as they lower the barriers to entry for new concepts and operators. They also enable risk taking and innovation that will ultimately lead to a more flourishing and diverse environment on our local high 25 streets. It should be possible for small firms to flourish even when staff shortages are pushing up wages in the high street, and house price falls damage consumer confidence and spending on perceived luxuries. (Source: adapted from https://www.designingbuildings.co.uk/ and https://www2.deloitte. com/uk/en/pages/consumer-business/articles/what-next-for-the-high-street.html) Extract D UK house prices may fall up to 20% Turmoil on the UK financial markets has prompted analysts to predict that house prices could fall dramatically, and many lenders in the mortgage sector are withdrawing deals. People coming to the end of their fixed‑rate mortgages are seeing rises from 2% to over 5.5%, with increases in the cost of borrowing of over £5 200 a year by 2024 for the 5 average mortgage in the UK. Many people think UK house prices will never fall, but analysts say the fall could be between 10% and 20%. One mortgage lender said that a lack of housing supply will not keep house prices up when mortgage interest rates are somewhere between 5% and 7%. He claimed that ‘the decade‑long property bubble is about to burst […] It’s a buyer’s market now’. The 10 greatest impact will be seen in the southeast of England. (Source: adapted from https://www.theguardian.com/money/2022/sep/28/ uk-house-prices-may-fall-20-amid-mortgage-carnage-warn-experts) Extract E UK job vacancies hit record 1.1 million as labour shortages increase The ratio of jobless people to vacancies is 1.45 to 1, lower than at any point in the last 40 years. Social care for example has 300 000 current unfilled posts. ‘Today’s figures show that labour shortages are now affecting the whole economy,’ said one analyst. ‘There are almost a million people fewer in the labour market, largely due to 5 younger people staying in education and older people dropping out of the workforce.’ The inactivity rate is 21.1%, and many people are not returning to work after the global health crisis. ‘People seeking work do not have the skills or availability that employers need,’ said Kitty Ussher, chief economist at the Institute of Directors. Firms offering higher wages does not solve the issue. 10 (Source: adapted from https://www.ft.com/content/463f4fbd- 3a50-45b5-891c-5cb5ba623df8)
(b) Examine two reasons why retailers on the high street tend to remain small. (8)
June 2023 · Paper 3 · Q2(c) 12 marks AO1=2, AO2=2, AO3=4, AO4=4 12-mark response oligopolyrevenues costs and profits
Data and extracts for question 2Changes in the nature of UK towns and cities Figure 3: Growing and declining high street firms – net change in store numbers, 2013–2022 Barbers Beauty salons Cafés and tearooms Nail salons Restaurants Fashion shops Estate agents Post Office services Clothes – women Banks and other financial institutions –4 000 –3 000 –2 000 –1 000 0 1 000 2 000 3 000 4 000 5 000 Net increase/decrease in store numbers (Source: adapted from https://www2.deloitte.com/uk/en/pages/consumer- business/articles/what-next-for-the-high-street.html) Figure 4: House price changes in the UK (%), 2005 to 2022 15 10 5 0 (%) –5 –10 –15 –20 2005 2010 2015 2020 2022 (Source: adapted from https://www.theguardian.com/money/2022/sep/28/ uk-house-prices-may-fall-20-amid-mortgage-carnage-warn-experts) Extract C What next for the high street? A high street is typically found in all UK towns and cities. Shops normally encountered in a typical UK high street can include successful small firms such as independent food retailers, cafés, nail and beauty salons, restaurants and charity shops. They differ from out‑of‑town shopping centres by being more diverse, family‑run and offering local or 5 personalised services. Customers are often very loyal. However, the high street may often have limited access by car or expensive parking facilities. The rise of online retailers such as Amazon and eBay have placed huge pressures on UK high streets, with many well‑known shops – and even successful retail chains – forced to close due to lost business. Many high street firms cannot compete on price with online 10 retailers who – because they frequently have very low fixed costs – can significantly undercut the high street shops on price. Even before online shopping, competition was eroding high street activity, with out‑of‑town retail parks that were not necessarily cheaper but provide a larger range of shops and offer plentiful parking. They offer a shopping experience that other retailing 15 cannot match – pleasant, safe pedestrian shopping, a clean environment, fun activities for children and spend‑the‑day‑there potential. While the list of retail and leisure failures might suggest that the high street does not have a future, some analysts argue the opposite. Many believe that the high street is ideally placed to reinvent itself in response to the structural shift in working and 20 shopping patterns that has resulted from the global health crisis 2020–22. The perceived weaknesses of the high street model – its fragmented ownership, lack of centralised coordination and high vacancy rates – become strengths as they lower the barriers to entry for new concepts and operators. They also enable risk taking and innovation that will ultimately lead to a more flourishing and diverse environment on our local high 25 streets. It should be possible for small firms to flourish even when staff shortages are pushing up wages in the high street, and house price falls damage consumer confidence and spending on perceived luxuries. (Source: adapted from https://www.designingbuildings.co.uk/ and https://www2.deloitte. com/uk/en/pages/consumer-business/articles/what-next-for-the-high-street.html) Extract D UK house prices may fall up to 20% Turmoil on the UK financial markets has prompted analysts to predict that house prices could fall dramatically, and many lenders in the mortgage sector are withdrawing deals. People coming to the end of their fixed‑rate mortgages are seeing rises from 2% to over 5.5%, with increases in the cost of borrowing of over £5 200 a year by 2024 for the 5 average mortgage in the UK. Many people think UK house prices will never fall, but analysts say the fall could be between 10% and 20%. One mortgage lender said that a lack of housing supply will not keep house prices up when mortgage interest rates are somewhere between 5% and 7%. He claimed that ‘the decade‑long property bubble is about to burst […] It’s a buyer’s market now’. The 10 greatest impact will be seen in the southeast of England. (Source: adapted from https://www.theguardian.com/money/2022/sep/28/ uk-house-prices-may-fall-20-amid-mortgage-carnage-warn-experts) Extract E UK job vacancies hit record 1.1 million as labour shortages increase The ratio of jobless people to vacancies is 1.45 to 1, lower than at any point in the last 40 years. Social care for example has 300 000 current unfilled posts. ‘Today’s figures show that labour shortages are now affecting the whole economy,’ said one analyst. ‘There are almost a million people fewer in the labour market, largely due to 5 younger people staying in education and older people dropping out of the workforce.’ The inactivity rate is 21.1%, and many people are not returning to work after the global health crisis. ‘People seeking work do not have the skills or availability that employers need,’ said Kitty Ussher, chief economist at the Institute of Directors. Firms offering higher wages does not solve the issue. 10 (Source: adapted from https://www.ft.com/content/463f4fbd- 3a50-45b5-891c-5cb5ba623df8)
(c) Discuss possible methods of price and non‑price competition that firms could use to increase the value of sales on the high street. (12)
June 2023 · Paper 3 · Q2(d) 25 marks AO1=4, AO2=4, AO3=8, AO4=9 25-mark essay Either/or Hard aggregate demandlabour market
Data and extracts for question 2Changes in the nature of UK towns and cities Figure 3: Growing and declining high street firms – net change in store numbers, 2013–2022 Barbers Beauty salons Cafés and tearooms Nail salons Restaurants Fashion shops Estate agents Post Office services Clothes – women Banks and other financial institutions –4 000 –3 000 –2 000 –1 000 0 1 000 2 000 3 000 4 000 5 000 Net increase/decrease in store numbers (Source: adapted from https://www2.deloitte.com/uk/en/pages/consumer- business/articles/what-next-for-the-high-street.html) Figure 4: House price changes in the UK (%), 2005 to 2022 15 10 5 0 (%) –5 –10 –15 –20 2005 2010 2015 2020 2022 (Source: adapted from https://www.theguardian.com/money/2022/sep/28/ uk-house-prices-may-fall-20-amid-mortgage-carnage-warn-experts) Extract C What next for the high street? A high street is typically found in all UK towns and cities. Shops normally encountered in a typical UK high street can include successful small firms such as independent food retailers, cafés, nail and beauty salons, restaurants and charity shops. They differ from out‑of‑town shopping centres by being more diverse, family‑run and offering local or 5 personalised services. Customers are often very loyal. However, the high street may often have limited access by car or expensive parking facilities. The rise of online retailers such as Amazon and eBay have placed huge pressures on UK high streets, with many well‑known shops – and even successful retail chains – forced to close due to lost business. Many high street firms cannot compete on price with online 10 retailers who – because they frequently have very low fixed costs – can significantly undercut the high street shops on price. Even before online shopping, competition was eroding high street activity, with out‑of‑town retail parks that were not necessarily cheaper but provide a larger range of shops and offer plentiful parking. They offer a shopping experience that other retailing 15 cannot match – pleasant, safe pedestrian shopping, a clean environment, fun activities for children and spend‑the‑day‑there potential. While the list of retail and leisure failures might suggest that the high street does not have a future, some analysts argue the opposite. Many believe that the high street is ideally placed to reinvent itself in response to the structural shift in working and 20 shopping patterns that has resulted from the global health crisis 2020–22. The perceived weaknesses of the high street model – its fragmented ownership, lack of centralised coordination and high vacancy rates – become strengths as they lower the barriers to entry for new concepts and operators. They also enable risk taking and innovation that will ultimately lead to a more flourishing and diverse environment on our local high 25 streets. It should be possible for small firms to flourish even when staff shortages are pushing up wages in the high street, and house price falls damage consumer confidence and spending on perceived luxuries. (Source: adapted from https://www.designingbuildings.co.uk/ and https://www2.deloitte. com/uk/en/pages/consumer-business/articles/what-next-for-the-high-street.html) Extract D UK house prices may fall up to 20% Turmoil on the UK financial markets has prompted analysts to predict that house prices could fall dramatically, and many lenders in the mortgage sector are withdrawing deals. People coming to the end of their fixed‑rate mortgages are seeing rises from 2% to over 5.5%, with increases in the cost of borrowing of over £5 200 a year by 2024 for the 5 average mortgage in the UK. Many people think UK house prices will never fall, but analysts say the fall could be between 10% and 20%. One mortgage lender said that a lack of housing supply will not keep house prices up when mortgage interest rates are somewhere between 5% and 7%. He claimed that ‘the decade‑long property bubble is about to burst […] It’s a buyer’s market now’. The 10 greatest impact will be seen in the southeast of England. (Source: adapted from https://www.theguardian.com/money/2022/sep/28/ uk-house-prices-may-fall-20-amid-mortgage-carnage-warn-experts) Extract E UK job vacancies hit record 1.1 million as labour shortages increase The ratio of jobless people to vacancies is 1.45 to 1, lower than at any point in the last 40 years. Social care for example has 300 000 current unfilled posts. ‘Today’s figures show that labour shortages are now affecting the whole economy,’ said one analyst. ‘There are almost a million people fewer in the labour market, largely due to 5 younger people staying in education and older people dropping out of the workforce.’ The inactivity rate is 21.1%, and many people are not returning to work after the global health crisis. ‘People seeking work do not have the skills or availability that employers need,’ said Kitty Ussher, chief economist at the Institute of Directors. Firms offering higher wages does not solve the issue. 10 (Source: adapted from https://www.ft.com/content/463f4fbd- 3a50-45b5-891c-5cb5ba623df8)
(d) Evaluate the microeconomic and macroeconomic effects of falling house prices. (25)
June 2023 · Paper 3 · Q2(e) 25 marks AO1=4, AO2=4, AO3=8, AO4=9 25-mark essay Either/or Hard labour marketinflation
Data and extracts for question 2Changes in the nature of UK towns and cities Figure 3: Growing and declining high street firms – net change in store numbers, 2013–2022 Barbers Beauty salons Cafés and tearooms Nail salons Restaurants Fashion shops Estate agents Post Office services Clothes – women Banks and other financial institutions –4 000 –3 000 –2 000 –1 000 0 1 000 2 000 3 000 4 000 5 000 Net increase/decrease in store numbers (Source: adapted from https://www2.deloitte.com/uk/en/pages/consumer- business/articles/what-next-for-the-high-street.html) Figure 4: House price changes in the UK (%), 2005 to 2022 15 10 5 0 (%) –5 –10 –15 –20 2005 2010 2015 2020 2022 (Source: adapted from https://www.theguardian.com/money/2022/sep/28/ uk-house-prices-may-fall-20-amid-mortgage-carnage-warn-experts) Extract C What next for the high street? A high street is typically found in all UK towns and cities. Shops normally encountered in a typical UK high street can include successful small firms such as independent food retailers, cafés, nail and beauty salons, restaurants and charity shops. They differ from out‑of‑town shopping centres by being more diverse, family‑run and offering local or 5 personalised services. Customers are often very loyal. However, the high street may often have limited access by car or expensive parking facilities. The rise of online retailers such as Amazon and eBay have placed huge pressures on UK high streets, with many well‑known shops – and even successful retail chains – forced to close due to lost business. Many high street firms cannot compete on price with online 10 retailers who – because they frequently have very low fixed costs – can significantly undercut the high street shops on price. Even before online shopping, competition was eroding high street activity, with out‑of‑town retail parks that were not necessarily cheaper but provide a larger range of shops and offer plentiful parking. They offer a shopping experience that other retailing 15 cannot match – pleasant, safe pedestrian shopping, a clean environment, fun activities for children and spend‑the‑day‑there potential. While the list of retail and leisure failures might suggest that the high street does not have a future, some analysts argue the opposite. Many believe that the high street is ideally placed to reinvent itself in response to the structural shift in working and 20 shopping patterns that has resulted from the global health crisis 2020–22. The perceived weaknesses of the high street model – its fragmented ownership, lack of centralised coordination and high vacancy rates – become strengths as they lower the barriers to entry for new concepts and operators. They also enable risk taking and innovation that will ultimately lead to a more flourishing and diverse environment on our local high 25 streets. It should be possible for small firms to flourish even when staff shortages are pushing up wages in the high street, and house price falls damage consumer confidence and spending on perceived luxuries. (Source: adapted from https://www.designingbuildings.co.uk/ and https://www2.deloitte. com/uk/en/pages/consumer-business/articles/what-next-for-the-high-street.html) Extract D UK house prices may fall up to 20% Turmoil on the UK financial markets has prompted analysts to predict that house prices could fall dramatically, and many lenders in the mortgage sector are withdrawing deals. People coming to the end of their fixed‑rate mortgages are seeing rises from 2% to over 5.5%, with increases in the cost of borrowing of over £5 200 a year by 2024 for the 5 average mortgage in the UK. Many people think UK house prices will never fall, but analysts say the fall could be between 10% and 20%. One mortgage lender said that a lack of housing supply will not keep house prices up when mortgage interest rates are somewhere between 5% and 7%. He claimed that ‘the decade‑long property bubble is about to burst […] It’s a buyer’s market now’. The 10 greatest impact will be seen in the southeast of England. (Source: adapted from https://www.theguardian.com/money/2022/sep/28/ uk-house-prices-may-fall-20-amid-mortgage-carnage-warn-experts) Extract E UK job vacancies hit record 1.1 million as labour shortages increase The ratio of jobless people to vacancies is 1.45 to 1, lower than at any point in the last 40 years. Social care for example has 300 000 current unfilled posts. ‘Today’s figures show that labour shortages are now affecting the whole economy,’ said one analyst. ‘There are almost a million people fewer in the labour market, largely due to 5 younger people staying in education and older people dropping out of the workforce.’ The inactivity rate is 21.1%, and many people are not returning to work after the global health crisis. ‘People seeking work do not have the skills or availability that employers need,’ said Kitty Ussher, chief economist at the Institute of Directors. Firms offering higher wages does not solve the issue. 10 (Source: adapted from https://www.ft.com/content/463f4fbd- 3a50-45b5-891c-5cb5ba623df8)
(e) Evaluate the microeconomic and macroeconomic effects of labour shortages in the UK, or a developed economy of your choice. (25)
June 2022 · AS Paper 1 · Q1(b) 3 marks AO1=1, AO2=1, AO3=1 Short answer public goods and information gapsgovernment intervention in markets
Data and extracts for question 11 Since 2015, the government has invested £74 million on a flood defence scheme in the Calder Valley. The scheme will protect homes, businesses and jobs. (Source: https://www.theguardian.com/uk-news/2020/feb/10/yorkshire-residents-criticise- delays-to-flood-defence-scheme)
(b) Explain why flood defences such as those in the Calder Valley are usually provided by the public sector. (3)
June 2022 · AS Paper 1 · Q3(b) 3 marks AO1=1, AO2=2 Short answer specialisation and division of labour
Data and extracts for question 33 The world’s first cryptocurrency, Bitcoin is stored and exchanged securely on the internet through a digital ledger known as a blockchain. Bitcoins are divisible into smaller units known as satoshis. (Source: https://www.coinbase.com/price/bitcoin)
(b) Explain how Bitcoin fulfils one function of money, apart from as a medium of exchange. (3)
June 2022 · AS Paper 1 · Q4(a) 3 marks AO1=1, AO2=1, AO3=1 Short answer nature of economics
Data and extracts for question 44 A large number of people should be vaccinated against a new virus, so that even those who are not vaccinated will benefit.
(a) With reference to the statement above, explain the difference between positive and normative statements. (3)
June 2022 · AS Paper 1 · Q5(a) 3 marks AO1=1, AO2=1, AO3=1 Short answer elasticity of supply
Data and extracts for question 55 In March 2020, a substantial increase in the demand for flour resulted in the retail price of flour increasing. Despite the price rises, the supply of flour failed to keep up with the increased demand.
(a) Explain one reason why flour producers might find it difficult to increase quantity supplied in the short run. (3)
June 2022 · AS Paper 1 · Q6(a) 5 marks AO1=1, AO2=2, AO3=2 Diagram supply and demandgovernment intervention in markets
Data and extracts for question 6The market for fish Extract A Total allowable catches of North Sea cod halved in response to falling stocks In 2020, new lower limits on the quantity of cod that can be caught by the UK fishing fleet came into force. These limits on the fish catch, called total allowable catches (TACs), were agreed at the annual EU fisheries negotiations. It was the last December EU meeting attended by the UK before it left the EU. It was 5 agreed that cod catch limits will be cut by 50% in the North Sea, while reduced limits were agreed for cod in the Celtic Sea, Irish Sea and west of Scotland. However, there were increases for other types of fish, with TACs for haddock in the North Sea rising by 23% and for sole rising by 19%. UK Fisheries Minister George Eustice said: “This year there has been mounting scientific 10 evidence suggesting that cod is being overfished in many parts of the northeast Atlantic and we have responded to conserve stocks”. These new regulations applied to the UK while it remained part of the Common Fisheries Policy. In the future it will become an independent coastal state and negotiate on fisheries with the EU and other coastal states such as Norway. 15 (Source adapted from: https://www.independent.co.uk/news/business/news/north-sea-cod- stocks-quota-climate-change-brexit-a9252196.html) Figure 1 Atlantic over-fishing: share of total allowable catch (TAC) in excess of scientific advice (2019) Country Excess TAC (%) Excess TAC (tonnes) Sweden 52.4 17 369 106 925 United Kingdom 24.3 34 052 Ireland 21.7 49 914 Denmark 19.7 20 620 Germany 18.0 The Netherlands 13.5 31 910 3 009 Belgium 10.4 France 9.4 27 230 Spain 6.6 16 689 Portugal 3.8 3 662 (Source adapted from: Statista 2018) Extract B The tragedy of the commons The ‘tragedy of the commons’ may occur when there are common access resources (CARs). These are natural resources over which no private ownership has been established. Therefore, there are difficulties in excluding people from using or exploiting them. CARs include fisheries and common grazing lands. Oceans are so vast that it is 5 impractical for one fishing company to establish ownership and control. This means that others cannot be prevented from exploiting the ocean. Economists have suggested that with the lack of ownership of these resources, private producers will act in their own self-interest and exploit CARs to maximise profit. This exploitation is unsustainable. In other words, CARs provide an opportunity for individuals to create profit, while 10 creating negative externalities which impact on everybody else. This process is referred to as the ‘tragedy of the commons’. The ‘tragedy of the commons’ is at the core of a range of problems that are relevant and threatening to natural resources, environments and human health. In the case of overfishing, fishing companies are not made accountable for the state of the ocean. 15 They continue to fish as much as possible to maximise profit. Today, 90% of fish stocks are depleted. The reason for such a wide range of problems is because there is an environmental cost for everything. The ‘tragedy of the commons’ is the outcome of the fact that every resource is limited on this planet, coupled with the rising level of demand for these 20 resources. These issues are large-scale and require laws, regulation and international cooperation. (Source adapted from: http://felixonline.co.uk/articles/2019-12-09-tragedy-commons- drama-planet-not-enjoying/)
(a) Explain the likely impact of the new 2020 TACs on the price of cod. Include a supply and demand diagram in your answer. (5)
June 2022 · AS Paper 1 · Q6(b) 10 marks AO1=2, AO2=2, AO3=2, AO4=4 10-mark response rational decision making and behavioural economics
Data and extracts for question 6The market for fish Extract A Total allowable catches of North Sea cod halved in response to falling stocks In 2020, new lower limits on the quantity of cod that can be caught by the UK fishing fleet came into force. These limits on the fish catch, called total allowable catches (TACs), were agreed at the annual EU fisheries negotiations. It was the last December EU meeting attended by the UK before it left the EU. It was 5 agreed that cod catch limits will be cut by 50% in the North Sea, while reduced limits were agreed for cod in the Celtic Sea, Irish Sea and west of Scotland. However, there were increases for other types of fish, with TACs for haddock in the North Sea rising by 23% and for sole rising by 19%. UK Fisheries Minister George Eustice said: “This year there has been mounting scientific 10 evidence suggesting that cod is being overfished in many parts of the northeast Atlantic and we have responded to conserve stocks”. These new regulations applied to the UK while it remained part of the Common Fisheries Policy. In the future it will become an independent coastal state and negotiate on fisheries with the EU and other coastal states such as Norway. 15 (Source adapted from: https://www.independent.co.uk/news/business/news/north-sea-cod- stocks-quota-climate-change-brexit-a9252196.html) Figure 1 Atlantic over-fishing: share of total allowable catch (TAC) in excess of scientific advice (2019) Country Excess TAC (%) Excess TAC (tonnes) Sweden 52.4 17 369 106 925 United Kingdom 24.3 34 052 Ireland 21.7 49 914 Denmark 19.7 20 620 Germany 18.0 The Netherlands 13.5 31 910 3 009 Belgium 10.4 France 9.4 27 230 Spain 6.6 16 689 Portugal 3.8 3 662 (Source adapted from: Statista 2018) Extract B The tragedy of the commons The ‘tragedy of the commons’ may occur when there are common access resources (CARs). These are natural resources over which no private ownership has been established. Therefore, there are difficulties in excluding people from using or exploiting them. CARs include fisheries and common grazing lands. Oceans are so vast that it is 5 impractical for one fishing company to establish ownership and control. This means that others cannot be prevented from exploiting the ocean. Economists have suggested that with the lack of ownership of these resources, private producers will act in their own self-interest and exploit CARs to maximise profit. This exploitation is unsustainable. In other words, CARs provide an opportunity for individuals to create profit, while 10 creating negative externalities which impact on everybody else. This process is referred to as the ‘tragedy of the commons’. The ‘tragedy of the commons’ is at the core of a range of problems that are relevant and threatening to natural resources, environments and human health. In the case of overfishing, fishing companies are not made accountable for the state of the ocean. 15 They continue to fish as much as possible to maximise profit. Today, 90% of fish stocks are depleted. The reason for such a wide range of problems is because there is an environmental cost for everything. The ‘tragedy of the commons’ is the outcome of the fact that every resource is limited on this planet, coupled with the rising level of demand for these 20 resources. These issues are large-scale and require laws, regulation and international cooperation. (Source adapted from: http://felixonline.co.uk/articles/2019-12-09-tragedy-commons- drama-planet-not-enjoying/)
According to Extract B, lines 15–16, ‘fishing companies are not made accountable for the state of the ocean. They continue to fish as much as possible to maximise profit’. (b) Assess whether it is rational for fishing companies to behave in this way. (10)
June 2022 · AS Paper 1 · Q6(c) 6 marks AO1=2, AO2=2, AO3=2 Short answer economic systems
Data and extracts for question 6The market for fish Extract A Total allowable catches of North Sea cod halved in response to falling stocks In 2020, new lower limits on the quantity of cod that can be caught by the UK fishing fleet came into force. These limits on the fish catch, called total allowable catches (TACs), were agreed at the annual EU fisheries negotiations. It was the last December EU meeting attended by the UK before it left the EU. It was 5 agreed that cod catch limits will be cut by 50% in the North Sea, while reduced limits were agreed for cod in the Celtic Sea, Irish Sea and west of Scotland. However, there were increases for other types of fish, with TACs for haddock in the North Sea rising by 23% and for sole rising by 19%. UK Fisheries Minister George Eustice said: “This year there has been mounting scientific 10 evidence suggesting that cod is being overfished in many parts of the northeast Atlantic and we have responded to conserve stocks”. These new regulations applied to the UK while it remained part of the Common Fisheries Policy. In the future it will become an independent coastal state and negotiate on fisheries with the EU and other coastal states such as Norway. 15 (Source adapted from: https://www.independent.co.uk/news/business/news/north-sea-cod- stocks-quota-climate-change-brexit-a9252196.html) Figure 1 Atlantic over-fishing: share of total allowable catch (TAC) in excess of scientific advice (2019) Country Excess TAC (%) Excess TAC (tonnes) Sweden 52.4 17 369 106 925 United Kingdom 24.3 34 052 Ireland 21.7 49 914 Denmark 19.7 20 620 Germany 18.0 The Netherlands 13.5 31 910 3 009 Belgium 10.4 France 9.4 27 230 Spain 6.6 16 689 Portugal 3.8 3 662 (Source adapted from: Statista 2018) Extract B The tragedy of the commons The ‘tragedy of the commons’ may occur when there are common access resources (CARs). These are natural resources over which no private ownership has been established. Therefore, there are difficulties in excluding people from using or exploiting them. CARs include fisheries and common grazing lands. Oceans are so vast that it is 5 impractical for one fishing company to establish ownership and control. This means that others cannot be prevented from exploiting the ocean. Economists have suggested that with the lack of ownership of these resources, private producers will act in their own self-interest and exploit CARs to maximise profit. This exploitation is unsustainable. In other words, CARs provide an opportunity for individuals to create profit, while 10 creating negative externalities which impact on everybody else. This process is referred to as the ‘tragedy of the commons’. The ‘tragedy of the commons’ is at the core of a range of problems that are relevant and threatening to natural resources, environments and human health. In the case of overfishing, fishing companies are not made accountable for the state of the ocean. 15 They continue to fish as much as possible to maximise profit. Today, 90% of fish stocks are depleted. The reason for such a wide range of problems is because there is an environmental cost for everything. The ‘tragedy of the commons’ is the outcome of the fact that every resource is limited on this planet, coupled with the rising level of demand for these 20 resources. These issues are large-scale and require laws, regulation and international cooperation. (Source adapted from: http://felixonline.co.uk/articles/2019-12-09-tragedy-commons- drama-planet-not-enjoying/)
(c) With reference to the information provided and your own knowledge, explain two characteristics of private ownership in a free market economy. (6)
June 2022 · AS Paper 1 · Q6(d) 4 marks AO1=2, AO2=2 Calculation price elasticity of demand
Data and extracts for question 6The market for fish Extract A Total allowable catches of North Sea cod halved in response to falling stocks In 2020, new lower limits on the quantity of cod that can be caught by the UK fishing fleet came into force. These limits on the fish catch, called total allowable catches (TACs), were agreed at the annual EU fisheries negotiations. It was the last December EU meeting attended by the UK before it left the EU. It was 5 agreed that cod catch limits will be cut by 50% in the North Sea, while reduced limits were agreed for cod in the Celtic Sea, Irish Sea and west of Scotland. However, there were increases for other types of fish, with TACs for haddock in the North Sea rising by 23% and for sole rising by 19%. UK Fisheries Minister George Eustice said: “This year there has been mounting scientific 10 evidence suggesting that cod is being overfished in many parts of the northeast Atlantic and we have responded to conserve stocks”. These new regulations applied to the UK while it remained part of the Common Fisheries Policy. In the future it will become an independent coastal state and negotiate on fisheries with the EU and other coastal states such as Norway. 15 (Source adapted from: https://www.independent.co.uk/news/business/news/north-sea-cod- stocks-quota-climate-change-brexit-a9252196.html) Figure 1 Atlantic over-fishing: share of total allowable catch (TAC) in excess of scientific advice (2019) Country Excess TAC (%) Excess TAC (tonnes) Sweden 52.4 17 369 106 925 United Kingdom 24.3 34 052 Ireland 21.7 49 914 Denmark 19.7 20 620 Germany 18.0 The Netherlands 13.5 31 910 3 009 Belgium 10.4 France 9.4 27 230 Spain 6.6 16 689 Portugal 3.8 3 662 (Source adapted from: Statista 2018) Extract B The tragedy of the commons The ‘tragedy of the commons’ may occur when there are common access resources (CARs). These are natural resources over which no private ownership has been established. Therefore, there are difficulties in excluding people from using or exploiting them. CARs include fisheries and common grazing lands. Oceans are so vast that it is 5 impractical for one fishing company to establish ownership and control. This means that others cannot be prevented from exploiting the ocean. Economists have suggested that with the lack of ownership of these resources, private producers will act in their own self-interest and exploit CARs to maximise profit. This exploitation is unsustainable. In other words, CARs provide an opportunity for individuals to create profit, while 10 creating negative externalities which impact on everybody else. This process is referred to as the ‘tragedy of the commons’. The ‘tragedy of the commons’ is at the core of a range of problems that are relevant and threatening to natural resources, environments and human health. In the case of overfishing, fishing companies are not made accountable for the state of the ocean. 15 They continue to fish as much as possible to maximise profit. Today, 90% of fish stocks are depleted. The reason for such a wide range of problems is because there is an environmental cost for everything. The ‘tragedy of the commons’ is the outcome of the fact that every resource is limited on this planet, coupled with the rising level of demand for these 20 resources. These issues are large-scale and require laws, regulation and international cooperation. (Source adapted from: http://felixonline.co.uk/articles/2019-12-09-tragedy-commons- drama-planet-not-enjoying/)
Fish and chips are complementary goods with an estimated cross elasticity of demand of –8. Currently 950 000 bags of chips are sold in UK fish and chip shops each day. (d) With reference to the information provided, calculate the new quantity demanded of bags of chips from fish and chip shops, following a 2% increase in the price of fish. You are advised to show your working. (4)
June 2022 · AS Paper 1 · Q6(e) 15 marks AO1=3, AO2=3, AO3=3, AO4=6 15-mark response specialisation and division of labour
Data and extracts for question 6The market for fish Extract A Total allowable catches of North Sea cod halved in response to falling stocks In 2020, new lower limits on the quantity of cod that can be caught by the UK fishing fleet came into force. These limits on the fish catch, called total allowable catches (TACs), were agreed at the annual EU fisheries negotiations. It was the last December EU meeting attended by the UK before it left the EU. It was 5 agreed that cod catch limits will be cut by 50% in the North Sea, while reduced limits were agreed for cod in the Celtic Sea, Irish Sea and west of Scotland. However, there were increases for other types of fish, with TACs for haddock in the North Sea rising by 23% and for sole rising by 19%. UK Fisheries Minister George Eustice said: “This year there has been mounting scientific 10 evidence suggesting that cod is being overfished in many parts of the northeast Atlantic and we have responded to conserve stocks”. These new regulations applied to the UK while it remained part of the Common Fisheries Policy. In the future it will become an independent coastal state and negotiate on fisheries with the EU and other coastal states such as Norway. 15 (Source adapted from: https://www.independent.co.uk/news/business/news/north-sea-cod- stocks-quota-climate-change-brexit-a9252196.html) Figure 1 Atlantic over-fishing: share of total allowable catch (TAC) in excess of scientific advice (2019) Country Excess TAC (%) Excess TAC (tonnes) Sweden 52.4 17 369 106 925 United Kingdom 24.3 34 052 Ireland 21.7 49 914 Denmark 19.7 20 620 Germany 18.0 The Netherlands 13.5 31 910 3 009 Belgium 10.4 France 9.4 27 230 Spain 6.6 16 689 Portugal 3.8 3 662 (Source adapted from: Statista 2018) Extract B The tragedy of the commons The ‘tragedy of the commons’ may occur when there are common access resources (CARs). These are natural resources over which no private ownership has been established. Therefore, there are difficulties in excluding people from using or exploiting them. CARs include fisheries and common grazing lands. Oceans are so vast that it is 5 impractical for one fishing company to establish ownership and control. This means that others cannot be prevented from exploiting the ocean. Economists have suggested that with the lack of ownership of these resources, private producers will act in their own self-interest and exploit CARs to maximise profit. This exploitation is unsustainable. In other words, CARs provide an opportunity for individuals to create profit, while 10 creating negative externalities which impact on everybody else. This process is referred to as the ‘tragedy of the commons’. The ‘tragedy of the commons’ is at the core of a range of problems that are relevant and threatening to natural resources, environments and human health. In the case of overfishing, fishing companies are not made accountable for the state of the ocean. 15 They continue to fish as much as possible to maximise profit. Today, 90% of fish stocks are depleted. The reason for such a wide range of problems is because there is an environmental cost for everything. The ‘tragedy of the commons’ is the outcome of the fact that every resource is limited on this planet, coupled with the rising level of demand for these 20 resources. These issues are large-scale and require laws, regulation and international cooperation. (Source adapted from: http://felixonline.co.uk/articles/2019-12-09-tragedy-commons- drama-planet-not-enjoying/)
The UK fishing industry employs about 24 000 people, more than half of them working in Scotland. (e) Discuss the likely impacts on an economy of specialising in the fishing industry. Use a production possibility frontier diagram in your answer. (15)
June 2022 · AS Paper 1 · Q6(f) 20 marks AO1=4, AO2=4, AO3=6, AO4=6 20-mark essay Either/or Hard externalities
Data and extracts for question 6The market for fish Extract A Total allowable catches of North Sea cod halved in response to falling stocks In 2020, new lower limits on the quantity of cod that can be caught by the UK fishing fleet came into force. These limits on the fish catch, called total allowable catches (TACs), were agreed at the annual EU fisheries negotiations. It was the last December EU meeting attended by the UK before it left the EU. It was 5 agreed that cod catch limits will be cut by 50% in the North Sea, while reduced limits were agreed for cod in the Celtic Sea, Irish Sea and west of Scotland. However, there were increases for other types of fish, with TACs for haddock in the North Sea rising by 23% and for sole rising by 19%. UK Fisheries Minister George Eustice said: “This year there has been mounting scientific 10 evidence suggesting that cod is being overfished in many parts of the northeast Atlantic and we have responded to conserve stocks”. These new regulations applied to the UK while it remained part of the Common Fisheries Policy. In the future it will become an independent coastal state and negotiate on fisheries with the EU and other coastal states such as Norway. 15 (Source adapted from: https://www.independent.co.uk/news/business/news/north-sea-cod- stocks-quota-climate-change-brexit-a9252196.html) Figure 1 Atlantic over-fishing: share of total allowable catch (TAC) in excess of scientific advice (2019) Country Excess TAC (%) Excess TAC (tonnes) Sweden 52.4 17 369 106 925 United Kingdom 24.3 34 052 Ireland 21.7 49 914 Denmark 19.7 20 620 Germany 18.0 The Netherlands 13.5 31 910 3 009 Belgium 10.4 France 9.4 27 230 Spain 6.6 16 689 Portugal 3.8 3 662 (Source adapted from: Statista 2018) Extract B The tragedy of the commons The ‘tragedy of the commons’ may occur when there are common access resources (CARs). These are natural resources over which no private ownership has been established. Therefore, there are difficulties in excluding people from using or exploiting them. CARs include fisheries and common grazing lands. Oceans are so vast that it is 5 impractical for one fishing company to establish ownership and control. This means that others cannot be prevented from exploiting the ocean. Economists have suggested that with the lack of ownership of these resources, private producers will act in their own self-interest and exploit CARs to maximise profit. This exploitation is unsustainable. In other words, CARs provide an opportunity for individuals to create profit, while 10 creating negative externalities which impact on everybody else. This process is referred to as the ‘tragedy of the commons’. The ‘tragedy of the commons’ is at the core of a range of problems that are relevant and threatening to natural resources, environments and human health. In the case of overfishing, fishing companies are not made accountable for the state of the ocean. 15 They continue to fish as much as possible to maximise profit. Today, 90% of fish stocks are depleted. The reason for such a wide range of problems is because there is an environmental cost for everything. The ‘tragedy of the commons’ is the outcome of the fact that every resource is limited on this planet, coupled with the rising level of demand for these 20 resources. These issues are large-scale and require laws, regulation and international cooperation. (Source adapted from: http://felixonline.co.uk/articles/2019-12-09-tragedy-commons- drama-planet-not-enjoying/)
(f) Some economists suggest that the market price of cod does not result in the socially optimum level of output. Evaluate the likely external costs from the over-fishing of cod. Use an appropriate diagram in your answer. (20)
June 2022 · AS Paper 1 · Q6(g) 20 marks AO1=4, AO2=4, AO3=6, AO4=6 20-mark essay Either/or government intervention in markets
Data and extracts for question 6The market for fish Extract A Total allowable catches of North Sea cod halved in response to falling stocks In 2020, new lower limits on the quantity of cod that can be caught by the UK fishing fleet came into force. These limits on the fish catch, called total allowable catches (TACs), were agreed at the annual EU fisheries negotiations. It was the last December EU meeting attended by the UK before it left the EU. It was 5 agreed that cod catch limits will be cut by 50% in the North Sea, while reduced limits were agreed for cod in the Celtic Sea, Irish Sea and west of Scotland. However, there were increases for other types of fish, with TACs for haddock in the North Sea rising by 23% and for sole rising by 19%. UK Fisheries Minister George Eustice said: “This year there has been mounting scientific 10 evidence suggesting that cod is being overfished in many parts of the northeast Atlantic and we have responded to conserve stocks”. These new regulations applied to the UK while it remained part of the Common Fisheries Policy. In the future it will become an independent coastal state and negotiate on fisheries with the EU and other coastal states such as Norway. 15 (Source adapted from: https://www.independent.co.uk/news/business/news/north-sea-cod- stocks-quota-climate-change-brexit-a9252196.html) Figure 1 Atlantic over-fishing: share of total allowable catch (TAC) in excess of scientific advice (2019) Country Excess TAC (%) Excess TAC (tonnes) Sweden 52.4 17 369 106 925 United Kingdom 24.3 34 052 Ireland 21.7 49 914 Denmark 19.7 20 620 Germany 18.0 The Netherlands 13.5 31 910 3 009 Belgium 10.4 France 9.4 27 230 Spain 6.6 16 689 Portugal 3.8 3 662 (Source adapted from: Statista 2018) Extract B The tragedy of the commons The ‘tragedy of the commons’ may occur when there are common access resources (CARs). These are natural resources over which no private ownership has been established. Therefore, there are difficulties in excluding people from using or exploiting them. CARs include fisheries and common grazing lands. Oceans are so vast that it is 5 impractical for one fishing company to establish ownership and control. This means that others cannot be prevented from exploiting the ocean. Economists have suggested that with the lack of ownership of these resources, private producers will act in their own self-interest and exploit CARs to maximise profit. This exploitation is unsustainable. In other words, CARs provide an opportunity for individuals to create profit, while 10 creating negative externalities which impact on everybody else. This process is referred to as the ‘tragedy of the commons’. The ‘tragedy of the commons’ is at the core of a range of problems that are relevant and threatening to natural resources, environments and human health. In the case of overfishing, fishing companies are not made accountable for the state of the ocean. 15 They continue to fish as much as possible to maximise profit. Today, 90% of fish stocks are depleted. The reason for such a wide range of problems is because there is an environmental cost for everything. The ‘tragedy of the commons’ is the outcome of the fact that every resource is limited on this planet, coupled with the rising level of demand for these 20 resources. These issues are large-scale and require laws, regulation and international cooperation. (Source adapted from: http://felixonline.co.uk/articles/2019-12-09-tragedy-commons- drama-planet-not-enjoying/)
(g) Other than using a TAC, evaluate the policy options which could be used to reduce market failure resulting from over-fishing. Use at least one appropriate diagram in your answer. (20)
June 2022 · AS Paper 2 · Q1(b) 3 marks AO1=1, AO2=1, AO3=1 Short answer fiscal and monetary policy
Data and extracts for question 11 In March 2020 the Monetary Policy Committee (MPC) of the Bank of England reintroduced its quantitative easing programme.
The MPC of the Bank of England also cut the UK’s base interest rate from 0.75% to 0.1% in March 2020. (b) Explain one likely impact of a decrease in the base interest rate on inflation. (3)
June 2022 · AS Paper 2 · Q2(c) 2 marks AO2=2 Calculation measuring economic growth
Data and extracts for question 22 The table below shows the UK’s nominal Gross Domestic Product (GDP) and population, 2016 to 2018. GDP Population Year (£ millions) (millions) 2016 1 995 478 65.6 2017 2 033 234 66.0 2018 2 061 408 66.4 (Source: ONS, https://www.ons.gov.uk/)
(c) Calculate the UK’s nominal GDP per capita in 2018. You are advised to show your working. (2)
June 2022 · AS Paper 2 · Q3(b) 3 marks AO1=1, AO2=1, AO3=1 Short answer measuring economic growth
Data and extracts for question 33 UK average weekly earnings, January 2007 to January 2019 550 500 £ per week Key 450 real earnings 400 nominal earnings 350 0 2007 2010 2013 2016 2019 (Source adapted from: https://www.ons.gov.uk/employmentandlabourmarket/peopleinwork/ employmentandemployeetypes/bulletins/averageweeklyearningsingreatbritain/march2019)
(b) With reference to the chart, explain the likely relationship between real incomes and subjective happiness. (3)
June 2022 · AS Paper 2 · Q5(b) 3 marks AO1=1, AO2=1, AO3=1 Short answer inflation
Data and extracts for question 55 Annual rate of UK inflation, as measured by the Consumer Prices Index (CPI), January 2016 to September 2019. 3.5 % 3.0 2.5 2.0 1.5 1.0 0.5 0 January January January January 2016 2017 2018 2019 (Source adapted from: https://tradingeconomics.com/united-kingdom/inflation-cpi)
(b) Explain one limitation of CPI in measuring the rate of inflation. (3)
June 2022 · AS Paper 2 · Q6(a) 4 marks AO1=2, AO2=2 Short answer aggregate demand
Data and extracts for question 6UK investment and productivity Figure 1: UK investment, annual percentage change, 2014 to 2019 10 % 8 6 4 2 0 -2 -4 2014 2015 2016 2017 2018 2019 (Source adapted from: https://www.ft.com/content/5e12351e-baaf-11e9-96bd-8e884d3ea203) Figure 2: UK labour productivity, annual percentage change, 2014 to 2019 2 % 1 0 -1 -2 2014 2015 2016 2017 2018 2019 (Source adapted from: https://www.theguardian.com/business/2019/oct/08/uk-productivity- brexit-boris-johnson-labour) Extract A Another recession? For the first time in nearly seven years, the UK economy contracted by 0.2% in the second quarter of 2019. This was as a result of a significantly weaker than expected performance in almost every part of the UK economy. Business investment has been weak across the world, but it is particularly low in the UK. 5 Firms are reluctant to commit to capital spending while there is economic uncertainty. Growth in investment, in areas such as transport and machinery, has slowed. Global trade tensions are also affecting investment decisions. Labour productivity decreased by 0.5% in the second quarter of 2019, the worst performance since mid-2014. Declining productivity is a concern especially as it 10 comes at a time when the unemployment rate has been one of the lowest. The rate of unemployment decreased from 6% in July 2014 to 3.8% in July 2019. The UK’s economic growth has been held back by low investment and productivity since the Global Financial Crisis of 2008. Moreover, the uncertainty over the UK’s future trade relationship with the EU has discouraged companies from investing in productivity- 15 boosting technology. This has decreased the prospects for increases in workers’ pay. Without business investment and improvements in productivity, short-term growth in real GDP is likely to slow further and reduce living standards. However, the UK Government expects the UK economy to perform better than Germany and Italy. These export-focused countries are highly exposed to the slowdown in world 20 trade and the fall in average global incomes. The UK economy is seeing continued strength in consumer spending. Consumption will support growth, provided there is no sudden shock to the UK labour market. Household incomes are strong, primarily due to high employment. Government expenditure has also been rising since the end of 2018. The UK Government has promised more money 25 for schools and infrastructure improvements. Despite this, some economists believe that the UK economy is likely to experience another recession. They claim that low income households cannot cope with a new downturn. The overall picture for the UK economy does not look promising because most businesses are reluctant to invest, productivity is low and economic growth relies on 30 continued consumption. (Source adapted from: ‘On the brink: Britain’s economy braced for Brexit shock’, FT, https:// www.ft.com/ content/40c604d2-c01c-11e9-89e2-41e555e96722; ‘Recession threat hangs over UK economy ahead of Brexit, FT, https://www.ft.com/content/5e12351e-baaf- 11e9-96bd-8e884d3ea203; ‘UK productivity falls at fastest pace in five years as Brexit dents investment, The Guardian, https://www.theguardian.com/ business/2019/oct/08/ uk-productivity-brexit-boris-johnson-labour)
(a) With reference to Figure 1, explain the term ‘investment’. (4)
June 2022 · AS Paper 2 · Q6(b) 6 marks AO1=2, AO2=2, AO3=2 Short answer aggregate demand
Data and extracts for question 6UK investment and productivity Figure 1: UK investment, annual percentage change, 2014 to 2019 10 % 8 6 4 2 0 -2 -4 2014 2015 2016 2017 2018 2019 (Source adapted from: https://www.ft.com/content/5e12351e-baaf-11e9-96bd-8e884d3ea203) Figure 2: UK labour productivity, annual percentage change, 2014 to 2019 2 % 1 0 -1 -2 2014 2015 2016 2017 2018 2019 (Source adapted from: https://www.theguardian.com/business/2019/oct/08/uk-productivity- brexit-boris-johnson-labour) Extract A Another recession? For the first time in nearly seven years, the UK economy contracted by 0.2% in the second quarter of 2019. This was as a result of a significantly weaker than expected performance in almost every part of the UK economy. Business investment has been weak across the world, but it is particularly low in the UK. 5 Firms are reluctant to commit to capital spending while there is economic uncertainty. Growth in investment, in areas such as transport and machinery, has slowed. Global trade tensions are also affecting investment decisions. Labour productivity decreased by 0.5% in the second quarter of 2019, the worst performance since mid-2014. Declining productivity is a concern especially as it 10 comes at a time when the unemployment rate has been one of the lowest. The rate of unemployment decreased from 6% in July 2014 to 3.8% in July 2019. The UK’s economic growth has been held back by low investment and productivity since the Global Financial Crisis of 2008. Moreover, the uncertainty over the UK’s future trade relationship with the EU has discouraged companies from investing in productivity- 15 boosting technology. This has decreased the prospects for increases in workers’ pay. Without business investment and improvements in productivity, short-term growth in real GDP is likely to slow further and reduce living standards. However, the UK Government expects the UK economy to perform better than Germany and Italy. These export-focused countries are highly exposed to the slowdown in world 20 trade and the fall in average global incomes. The UK economy is seeing continued strength in consumer spending. Consumption will support growth, provided there is no sudden shock to the UK labour market. Household incomes are strong, primarily due to high employment. Government expenditure has also been rising since the end of 2018. The UK Government has promised more money 25 for schools and infrastructure improvements. Despite this, some economists believe that the UK economy is likely to experience another recession. They claim that low income households cannot cope with a new downturn. The overall picture for the UK economy does not look promising because most businesses are reluctant to invest, productivity is low and economic growth relies on 30 continued consumption. (Source adapted from: ‘On the brink: Britain’s economy braced for Brexit shock’, FT, https:// www.ft.com/ content/40c604d2-c01c-11e9-89e2-41e555e96722; ‘Recession threat hangs over UK economy ahead of Brexit, FT, https://www.ft.com/content/5e12351e-baaf- 11e9-96bd-8e884d3ea203; ‘UK productivity falls at fastest pace in five years as Brexit dents investment, The Guardian, https://www.theguardian.com/ business/2019/oct/08/ uk-productivity-brexit-boris-johnson-labour)
(b) With reference to Extract A, explain two influences on the level of UK investment. (6)
June 2022 · AS Paper 2 · Q6(c) 10 marks AO1=2, AO2=2, AO3=2, AO4=4 10-mark response measuring economic growth
Data and extracts for question 6UK investment and productivity Figure 1: UK investment, annual percentage change, 2014 to 2019 10 % 8 6 4 2 0 -2 -4 2014 2015 2016 2017 2018 2019 (Source adapted from: https://www.ft.com/content/5e12351e-baaf-11e9-96bd-8e884d3ea203) Figure 2: UK labour productivity, annual percentage change, 2014 to 2019 2 % 1 0 -1 -2 2014 2015 2016 2017 2018 2019 (Source adapted from: https://www.theguardian.com/business/2019/oct/08/uk-productivity- brexit-boris-johnson-labour) Extract A Another recession? For the first time in nearly seven years, the UK economy contracted by 0.2% in the second quarter of 2019. This was as a result of a significantly weaker than expected performance in almost every part of the UK economy. Business investment has been weak across the world, but it is particularly low in the UK. 5 Firms are reluctant to commit to capital spending while there is economic uncertainty. Growth in investment, in areas such as transport and machinery, has slowed. Global trade tensions are also affecting investment decisions. Labour productivity decreased by 0.5% in the second quarter of 2019, the worst performance since mid-2014. Declining productivity is a concern especially as it 10 comes at a time when the unemployment rate has been one of the lowest. The rate of unemployment decreased from 6% in July 2014 to 3.8% in July 2019. The UK’s economic growth has been held back by low investment and productivity since the Global Financial Crisis of 2008. Moreover, the uncertainty over the UK’s future trade relationship with the EU has discouraged companies from investing in productivity- 15 boosting technology. This has decreased the prospects for increases in workers’ pay. Without business investment and improvements in productivity, short-term growth in real GDP is likely to slow further and reduce living standards. However, the UK Government expects the UK economy to perform better than Germany and Italy. These export-focused countries are highly exposed to the slowdown in world 20 trade and the fall in average global incomes. The UK economy is seeing continued strength in consumer spending. Consumption will support growth, provided there is no sudden shock to the UK labour market. Household incomes are strong, primarily due to high employment. Government expenditure has also been rising since the end of 2018. The UK Government has promised more money 25 for schools and infrastructure improvements. Despite this, some economists believe that the UK economy is likely to experience another recession. They claim that low income households cannot cope with a new downturn. The overall picture for the UK economy does not look promising because most businesses are reluctant to invest, productivity is low and economic growth relies on 30 continued consumption. (Source adapted from: ‘On the brink: Britain’s economy braced for Brexit shock’, FT, https:// www.ft.com/ content/40c604d2-c01c-11e9-89e2-41e555e96722; ‘Recession threat hangs over UK economy ahead of Brexit, FT, https://www.ft.com/content/5e12351e-baaf- 11e9-96bd-8e884d3ea203; ‘UK productivity falls at fastest pace in five years as Brexit dents investment, The Guardian, https://www.theguardian.com/ business/2019/oct/08/ uk-productivity-brexit-boris-johnson-labour)
(c) With reference to the fourth paragraph of Extract A, assess the limitations of using GDP to compare living standards over time. (10)
June 2022 · AS Paper 2 · Q6(d) 5 marks AO1=1, AO2=2, AO3=2 Short answer balance of paymentseconomic growth and the trade cycle
Data and extracts for question 6UK investment and productivity Figure 1: UK investment, annual percentage change, 2014 to 2019 10 % 8 6 4 2 0 -2 -4 2014 2015 2016 2017 2018 2019 (Source adapted from: https://www.ft.com/content/5e12351e-baaf-11e9-96bd-8e884d3ea203) Figure 2: UK labour productivity, annual percentage change, 2014 to 2019 2 % 1 0 -1 -2 2014 2015 2016 2017 2018 2019 (Source adapted from: https://www.theguardian.com/business/2019/oct/08/uk-productivity- brexit-boris-johnson-labour) Extract A Another recession? For the first time in nearly seven years, the UK economy contracted by 0.2% in the second quarter of 2019. This was as a result of a significantly weaker than expected performance in almost every part of the UK economy. Business investment has been weak across the world, but it is particularly low in the UK. 5 Firms are reluctant to commit to capital spending while there is economic uncertainty. Growth in investment, in areas such as transport and machinery, has slowed. Global trade tensions are also affecting investment decisions. Labour productivity decreased by 0.5% in the second quarter of 2019, the worst performance since mid-2014. Declining productivity is a concern especially as it 10 comes at a time when the unemployment rate has been one of the lowest. The rate of unemployment decreased from 6% in July 2014 to 3.8% in July 2019. The UK’s economic growth has been held back by low investment and productivity since the Global Financial Crisis of 2008. Moreover, the uncertainty over the UK’s future trade relationship with the EU has discouraged companies from investing in productivity- 15 boosting technology. This has decreased the prospects for increases in workers’ pay. Without business investment and improvements in productivity, short-term growth in real GDP is likely to slow further and reduce living standards. However, the UK Government expects the UK economy to perform better than Germany and Italy. These export-focused countries are highly exposed to the slowdown in world 20 trade and the fall in average global incomes. The UK economy is seeing continued strength in consumer spending. Consumption will support growth, provided there is no sudden shock to the UK labour market. Household incomes are strong, primarily due to high employment. Government expenditure has also been rising since the end of 2018. The UK Government has promised more money 25 for schools and infrastructure improvements. Despite this, some economists believe that the UK economy is likely to experience another recession. They claim that low income households cannot cope with a new downturn. The overall picture for the UK economy does not look promising because most businesses are reluctant to invest, productivity is low and economic growth relies on 30 continued consumption. (Source adapted from: ‘On the brink: Britain’s economy braced for Brexit shock’, FT, https:// www.ft.com/ content/40c604d2-c01c-11e9-89e2-41e555e96722; ‘Recession threat hangs over UK economy ahead of Brexit, FT, https://www.ft.com/content/5e12351e-baaf- 11e9-96bd-8e884d3ea203; ‘UK productivity falls at fastest pace in five years as Brexit dents investment, The Guardian, https://www.theguardian.com/ business/2019/oct/08/ uk-productivity-brexit-boris-johnson-labour)
(d) Explain one likely reason why ‘the UK Government expects the UK economy to perform better than Germany and Italy’ (Extract A, lines 19–20). (5)
June 2022 · AS Paper 2 · Q6(e) 15 marks AO1=3, AO2=3, AO3=3, AO4=6 15-mark response economic growth and the trade cycle
Data and extracts for question 6UK investment and productivity Figure 1: UK investment, annual percentage change, 2014 to 2019 10 % 8 6 4 2 0 -2 -4 2014 2015 2016 2017 2018 2019 (Source adapted from: https://www.ft.com/content/5e12351e-baaf-11e9-96bd-8e884d3ea203) Figure 2: UK labour productivity, annual percentage change, 2014 to 2019 2 % 1 0 -1 -2 2014 2015 2016 2017 2018 2019 (Source adapted from: https://www.theguardian.com/business/2019/oct/08/uk-productivity- brexit-boris-johnson-labour) Extract A Another recession? For the first time in nearly seven years, the UK economy contracted by 0.2% in the second quarter of 2019. This was as a result of a significantly weaker than expected performance in almost every part of the UK economy. Business investment has been weak across the world, but it is particularly low in the UK. 5 Firms are reluctant to commit to capital spending while there is economic uncertainty. Growth in investment, in areas such as transport and machinery, has slowed. Global trade tensions are also affecting investment decisions. Labour productivity decreased by 0.5% in the second quarter of 2019, the worst performance since mid-2014. Declining productivity is a concern especially as it 10 comes at a time when the unemployment rate has been one of the lowest. The rate of unemployment decreased from 6% in July 2014 to 3.8% in July 2019. The UK’s economic growth has been held back by low investment and productivity since the Global Financial Crisis of 2008. Moreover, the uncertainty over the UK’s future trade relationship with the EU has discouraged companies from investing in productivity- 15 boosting technology. This has decreased the prospects for increases in workers’ pay. Without business investment and improvements in productivity, short-term growth in real GDP is likely to slow further and reduce living standards. However, the UK Government expects the UK economy to perform better than Germany and Italy. These export-focused countries are highly exposed to the slowdown in world 20 trade and the fall in average global incomes. The UK economy is seeing continued strength in consumer spending. Consumption will support growth, provided there is no sudden shock to the UK labour market. Household incomes are strong, primarily due to high employment. Government expenditure has also been rising since the end of 2018. The UK Government has promised more money 25 for schools and infrastructure improvements. Despite this, some economists believe that the UK economy is likely to experience another recession. They claim that low income households cannot cope with a new downturn. The overall picture for the UK economy does not look promising because most businesses are reluctant to invest, productivity is low and economic growth relies on 30 continued consumption. (Source adapted from: ‘On the brink: Britain’s economy braced for Brexit shock’, FT, https:// www.ft.com/ content/40c604d2-c01c-11e9-89e2-41e555e96722; ‘Recession threat hangs over UK economy ahead of Brexit, FT, https://www.ft.com/content/5e12351e-baaf- 11e9-96bd-8e884d3ea203; ‘UK productivity falls at fastest pace in five years as Brexit dents investment, The Guardian, https://www.theguardian.com/ business/2019/oct/08/ uk-productivity-brexit-boris-johnson-labour)
(e) With reference to the information provided, discuss the likely impact of a recession on the UK economy. (15)
June 2022 · AS Paper 2 · Q6(f) 20 marks AO1=4, AO2=4, AO3=6, AO4=6 20-mark essay Either/or fiscal and monetary policy
Data and extracts for question 6UK investment and productivity Figure 1: UK investment, annual percentage change, 2014 to 2019 10 % 8 6 4 2 0 -2 -4 2014 2015 2016 2017 2018 2019 (Source adapted from: https://www.ft.com/content/5e12351e-baaf-11e9-96bd-8e884d3ea203) Figure 2: UK labour productivity, annual percentage change, 2014 to 2019 2 % 1 0 -1 -2 2014 2015 2016 2017 2018 2019 (Source adapted from: https://www.theguardian.com/business/2019/oct/08/uk-productivity- brexit-boris-johnson-labour) Extract A Another recession? For the first time in nearly seven years, the UK economy contracted by 0.2% in the second quarter of 2019. This was as a result of a significantly weaker than expected performance in almost every part of the UK economy. Business investment has been weak across the world, but it is particularly low in the UK. 5 Firms are reluctant to commit to capital spending while there is economic uncertainty. Growth in investment, in areas such as transport and machinery, has slowed. Global trade tensions are also affecting investment decisions. Labour productivity decreased by 0.5% in the second quarter of 2019, the worst performance since mid-2014. Declining productivity is a concern especially as it 10 comes at a time when the unemployment rate has been one of the lowest. The rate of unemployment decreased from 6% in July 2014 to 3.8% in July 2019. The UK’s economic growth has been held back by low investment and productivity since the Global Financial Crisis of 2008. Moreover, the uncertainty over the UK’s future trade relationship with the EU has discouraged companies from investing in productivity- 15 boosting technology. This has decreased the prospects for increases in workers’ pay. Without business investment and improvements in productivity, short-term growth in real GDP is likely to slow further and reduce living standards. However, the UK Government expects the UK economy to perform better than Germany and Italy. These export-focused countries are highly exposed to the slowdown in world 20 trade and the fall in average global incomes. The UK economy is seeing continued strength in consumer spending. Consumption will support growth, provided there is no sudden shock to the UK labour market. Household incomes are strong, primarily due to high employment. Government expenditure has also been rising since the end of 2018. The UK Government has promised more money 25 for schools and infrastructure improvements. Despite this, some economists believe that the UK economy is likely to experience another recession. They claim that low income households cannot cope with a new downturn. The overall picture for the UK economy does not look promising because most businesses are reluctant to invest, productivity is low and economic growth relies on 30 continued consumption. (Source adapted from: ‘On the brink: Britain’s economy braced for Brexit shock’, FT, https:// www.ft.com/ content/40c604d2-c01c-11e9-89e2-41e555e96722; ‘Recession threat hangs over UK economy ahead of Brexit, FT, https://www.ft.com/content/5e12351e-baaf- 11e9-96bd-8e884d3ea203; ‘UK productivity falls at fastest pace in five years as Brexit dents investment, The Guardian, https://www.theguardian.com/ business/2019/oct/08/ uk-productivity-brexit-boris-johnson-labour)
(f) Evaluate the fiscal policies the UK Government could use if it believes that ‘the UK economy is likely to experience another recession’ (Extract A, lines 27–28). (20)
June 2022 · AS Paper 2 · Q6(g) 20 marks AO1=4, AO2=4, AO3=6, AO4=6 20-mark essay Either/or Hard supply side policies
Data and extracts for question 6UK investment and productivity Figure 1: UK investment, annual percentage change, 2014 to 2019 10 % 8 6 4 2 0 -2 -4 2014 2015 2016 2017 2018 2019 (Source adapted from: https://www.ft.com/content/5e12351e-baaf-11e9-96bd-8e884d3ea203) Figure 2: UK labour productivity, annual percentage change, 2014 to 2019 2 % 1 0 -1 -2 2014 2015 2016 2017 2018 2019 (Source adapted from: https://www.theguardian.com/business/2019/oct/08/uk-productivity- brexit-boris-johnson-labour) Extract A Another recession? For the first time in nearly seven years, the UK economy contracted by 0.2% in the second quarter of 2019. This was as a result of a significantly weaker than expected performance in almost every part of the UK economy. Business investment has been weak across the world, but it is particularly low in the UK. 5 Firms are reluctant to commit to capital spending while there is economic uncertainty. Growth in investment, in areas such as transport and machinery, has slowed. Global trade tensions are also affecting investment decisions. Labour productivity decreased by 0.5% in the second quarter of 2019, the worst performance since mid-2014. Declining productivity is a concern especially as it 10 comes at a time when the unemployment rate has been one of the lowest. The rate of unemployment decreased from 6% in July 2014 to 3.8% in July 2019. The UK’s economic growth has been held back by low investment and productivity since the Global Financial Crisis of 2008. Moreover, the uncertainty over the UK’s future trade relationship with the EU has discouraged companies from investing in productivity- 15 boosting technology. This has decreased the prospects for increases in workers’ pay. Without business investment and improvements in productivity, short-term growth in real GDP is likely to slow further and reduce living standards. However, the UK Government expects the UK economy to perform better than Germany and Italy. These export-focused countries are highly exposed to the slowdown in world 20 trade and the fall in average global incomes. The UK economy is seeing continued strength in consumer spending. Consumption will support growth, provided there is no sudden shock to the UK labour market. Household incomes are strong, primarily due to high employment. Government expenditure has also been rising since the end of 2018. The UK Government has promised more money 25 for schools and infrastructure improvements. Despite this, some economists believe that the UK economy is likely to experience another recession. They claim that low income households cannot cope with a new downturn. The overall picture for the UK economy does not look promising because most businesses are reluctant to invest, productivity is low and economic growth relies on 30 continued consumption. (Source adapted from: ‘On the brink: Britain’s economy braced for Brexit shock’, FT, https:// www.ft.com/ content/40c604d2-c01c-11e9-89e2-41e555e96722; ‘Recession threat hangs over UK economy ahead of Brexit, FT, https://www.ft.com/content/5e12351e-baaf- 11e9-96bd-8e884d3ea203; ‘UK productivity falls at fastest pace in five years as Brexit dents investment, The Guardian, https://www.theguardian.com/ business/2019/oct/08/ uk-productivity-brexit-boris-johnson-labour)
(g) Evaluate the supply-side policies the UK Government could use to increase the UK’s productivity. (20)
June 2022 · Paper 1 · Q1(b) 4 marks AO1=2, AO2=2 Diagram supply and demand
Data and extracts for question 11 Disney+ is a streaming service that distributes films and television series produced by the Walt Disney Studios. Disney+ subscribers (million) November 2019 10 December 2019 26.5 February 2020 28.6 April 2020 50 (Source adapted from: https://www.businessofapps.com/data/disney-plus-statistics/)
(b) Draw a supply and demand diagram to show the likely effect of the change in the number of subscribers on the market equilibrium for Disney+ services. (4)
June 2022 · Paper 1 · Q2(a) 2 marks AO2=2 Calculation price elasticity of demand
Data and extracts for question 22 The table below shows data on the drinks market in Chile in 2017. Price elasticity of demand for sweetened drinks –1.37 Cross price elasticity of demand for bottled water +0.63 in response to a price change in sweetened drinks (Source: adapted from https://bmcpublichealth.biomedcentral.com/ articles/10.1186/s12889-017-4098-x)
(a) The price of sweetened drinks increases by 5%. Ceteris paribus, calculate the percentage change in the quantity demanded for sweetened drinks. You are advised to show your working. (2)
June 2022 · Paper 1 · Q2(b) 2 marks AO2=2 Calculation price elasticity of demand
Data and extracts for question 22 The table below shows data on the drinks market in Chile in 2017. Price elasticity of demand for sweetened drinks –1.37 Cross price elasticity of demand for bottled water +0.63 in response to a price change in sweetened drinks (Source: adapted from https://bmcpublichealth.biomedcentral.com/ articles/10.1186/s12889-017-4098-x)
(b) The price of sweetened drinks increases by 5%. Ceteris paribus, calculate the percentage change in the quantity demanded for bottled water. You are advised to show your working. (2)
June 2022 · Paper 1 · Q3(a) 4 marks AO1=2, AO2=2 Diagram externalities
Data and extracts for question 33 A company that provides drinking water and treats waste water has been fined £180 000 after an incident that killed about 2 500 fish. The charges relate to an illegal discharge of sewage from the waste water treatment plant that polluted nine kilometres of the River Severn, a popular tourist destination. (Source: adapted from https://www.leaderlive.co.uk/news/wrexham/ 19393552.water-company-fined-today-sewage-leaked-wrexham-river-killing-2-500-fish/)
(a) Draw an externalities diagram to show the likely impact of the sewage discharge on the local tourist industry. (4)
June 2022 · Paper 1 · Q4(a) 4 marks AO1=2, AO2=2 Diagram oligopoly
Data and extracts for question 44 Pilgrim’s Pride is the second-largest chicken supplier in the US. It will pay a $107.9 million fine for price fixing with Tyson Foods and other chicken suppliers. The firms limited production to force prices higher and harm major customers, including KFC. Pilgrim’s Pride is thought to have gained at least $361 million in total revenue from the collusion. (Source: adapted from https://www.drovers.com/news/industry/ pilgrims-pride-agrees-price-fixing-fine)
(a) Draw a simple two firm/two outcome game theory model to show why the chicken suppliers may have colluded. (4)
June 2022 · Paper 1 · Q5(b) 2 marks AO1=1, AO3=1 Short answer revenues costs and profits
Data and extracts for question 55 The makers of Fiat cars merged with the makers of Vauxhall cars in 2021. Fiat management had aggressively sought a merger to achieve economies of scale. The competition authorities in the EU investigated the merger. (Source: adapted from https://www.thedrive.com/news/34856/ the-merged-fiat-chrysler-and-peugeot-group-will-be-called-stellantis)
(b) Explain one type of internal economies of scale that the newly merged car company may achieve. (2)
June 2022 · Paper 1 · Q5(c) 2 marks AO1=1, AO3=1 Short answer competition policy and regulation
Data and extracts for question 55 The makers of Fiat cars merged with the makers of Vauxhall cars in 2021. Fiat management had aggressively sought a merger to achieve economies of scale. The competition authorities in the EU investigated the merger. (Source: adapted from https://www.thedrive.com/news/34856/ the-merged-fiat-chrysler-and-peugeot-group-will-be-called-stellantis)
(c) Explain one likely concern the EU competition authorities may have had about the merger. (2)
June 2022 · Paper 1 · Q6(a) 5 marks AO1=1, AO2=2, AO3=2 Calculation oligopoly
Data and extracts for question 6UK branded coffee shop chains market Figure 1: Branded coffee shops by number of shops in the UK in 2021 Costa 2681 Starbucks 1025 Caffè Nero 648 Coffee 50 AMT shop chains 40 Soho Coffee 30 Coffee Republic 3748 Other chains 0 500 1000 1500 2000 2500 3000 3500 4000 Number of shops (Source: adapted from https://www.statista.com/statistics/297863/ leading-coffee-shop-chains-in-the-united-kingdom-uk-store-number/) Figure 2: International coffee price (Arabica bean), US dollars per kilogram Month Price Change Jan 2020 3.13 – Feb 2020 2.99 –4.47% Mar 2020 3.27 9.36% Apr 2020 3.41 4.28% May 2020 3.30 –3.23% Jun 2020 3.12 –5.45% Jul 2020 3.24 3.85% Aug 2020 3.60 11.11% Sep 2020 3.67 1.94% Oct 2020 3.35 –8.72% Nov 2020 3.31 –1.19% Dec 2020 3.48 5.14% (Source: adapted from https://www.indexmundi.com/commodities/ ?commodity=other-mild-arabicas-coffee&months=12) Extract A Tough market conditions for coffee shops – but coffee quality is king UK coffee shop chains have experienced slow growth opportunities and rising costs. In 2019 the UK market leader, Costa Coffee, opened over 60% fewer stores than in 2018, while Starbucks opened just three new stores overall in 2019. By 2020, many costs were rising: staff shortages meant rising wages for baristas (trained 5 coffeemakers), a 6.2% National Minimum Wage increase for over 25-year-olds and rising rents. In a challenging UK economy, consumers placed coffee quality ahead of convenient location when choosing a coffee shop. This demonstrates the need for coffee shops to match rising expectations in the UK’s increasingly crowded coffee shop market in 10 order to stay competitive. Independent coffee shops (total 25 892 shops in 2020) remain a threat to the branded coffee shops as they pursue a unique luxury experience for customers. This will often focus on the atmosphere and customer service, luxury food and drink ranges and being a part of the local community. Independent coffee shops run on average profit as low as 2% of revenue, and many go out of business as new chains 15 arrive in a locality. In January 2020, Coca-Cola finalised its £3.9 billion takeover of market leader, Costa Coffee. The Coca-Cola company’s stated aims are to maximise long-term returns to shareholders while being mindful of overall responsibilities such as supporting sustainable communities. Major brands, such as Costa, continue to lead coffee shop 20 expansion in 2020 as competition intensifies. (Source: adapted from https://www.worldcoffeeportal.com/Latest/InsightAnalysis/2020/ February/5-UK-coffee-shop-market-dynamics-to-watch-in-2020) Extract B Greggs aiming for ‘coffee shop experience’ Greggs is looking to increase its branded coffee shop market share after the British bakery chain achieved record profits and overtook Starbucks in the amount of coffee it served in the UK. Although Greggs will continue to focus on the food-to-go market, it will be investing in better coffee machines and providing WiFi. It wants one in three 5 new outlets to have more seating. The company believes that it has the ability to take market share in two ways, by expanding its coffee range and at the same time enhancing the coffee shop experience. Greggs is modelling its plan on rival chain Pret A Manger, which has changed from focusing on food-to-go sales to mainly eating in. Greggs has transformed itself from an unremarkable seller of bread and pastries into one of the UK’s 10 most popular food-on-the-go chains, in part thanks to its embrace of vegan, gluten-free and healthy options as well as clever marketing that have changed its image. (Source: adapted from Financial Times, 3 March 2020 https://www.ft.com/ content/6fb6d73a-5d24-11ea-8033-fa40a0d65a98)
(a) With reference to Figure 1, calculate the three-firm concentration ratio for branded coffee shop chains. (5)
June 2022 · Paper 1 · Q6(b) 8 marks AO1=2, AO2=2, AO3=2, AO4=2 8-mark response Hard price elasticity of demandelasticity of supply
Data and extracts for question 6UK branded coffee shop chains market Figure 1: Branded coffee shops by number of shops in the UK in 2021 Costa 2681 Starbucks 1025 Caffè Nero 648 Coffee 50 AMT shop chains 40 Soho Coffee 30 Coffee Republic 3748 Other chains 0 500 1000 1500 2000 2500 3000 3500 4000 Number of shops (Source: adapted from https://www.statista.com/statistics/297863/ leading-coffee-shop-chains-in-the-united-kingdom-uk-store-number/) Figure 2: International coffee price (Arabica bean), US dollars per kilogram Month Price Change Jan 2020 3.13 – Feb 2020 2.99 –4.47% Mar 2020 3.27 9.36% Apr 2020 3.41 4.28% May 2020 3.30 –3.23% Jun 2020 3.12 –5.45% Jul 2020 3.24 3.85% Aug 2020 3.60 11.11% Sep 2020 3.67 1.94% Oct 2020 3.35 –8.72% Nov 2020 3.31 –1.19% Dec 2020 3.48 5.14% (Source: adapted from https://www.indexmundi.com/commodities/ ?commodity=other-mild-arabicas-coffee&months=12) Extract A Tough market conditions for coffee shops – but coffee quality is king UK coffee shop chains have experienced slow growth opportunities and rising costs. In 2019 the UK market leader, Costa Coffee, opened over 60% fewer stores than in 2018, while Starbucks opened just three new stores overall in 2019. By 2020, many costs were rising: staff shortages meant rising wages for baristas (trained 5 coffeemakers), a 6.2% National Minimum Wage increase for over 25-year-olds and rising rents. In a challenging UK economy, consumers placed coffee quality ahead of convenient location when choosing a coffee shop. This demonstrates the need for coffee shops to match rising expectations in the UK’s increasingly crowded coffee shop market in 10 order to stay competitive. Independent coffee shops (total 25 892 shops in 2020) remain a threat to the branded coffee shops as they pursue a unique luxury experience for customers. This will often focus on the atmosphere and customer service, luxury food and drink ranges and being a part of the local community. Independent coffee shops run on average profit as low as 2% of revenue, and many go out of business as new chains 15 arrive in a locality. In January 2020, Coca-Cola finalised its £3.9 billion takeover of market leader, Costa Coffee. The Coca-Cola company’s stated aims are to maximise long-term returns to shareholders while being mindful of overall responsibilities such as supporting sustainable communities. Major brands, such as Costa, continue to lead coffee shop 20 expansion in 2020 as competition intensifies. (Source: adapted from https://www.worldcoffeeportal.com/Latest/InsightAnalysis/2020/ February/5-UK-coffee-shop-market-dynamics-to-watch-in-2020) Extract B Greggs aiming for ‘coffee shop experience’ Greggs is looking to increase its branded coffee shop market share after the British bakery chain achieved record profits and overtook Starbucks in the amount of coffee it served in the UK. Although Greggs will continue to focus on the food-to-go market, it will be investing in better coffee machines and providing WiFi. It wants one in three 5 new outlets to have more seating. The company believes that it has the ability to take market share in two ways, by expanding its coffee range and at the same time enhancing the coffee shop experience. Greggs is modelling its plan on rival chain Pret A Manger, which has changed from focusing on food-to-go sales to mainly eating in. Greggs has transformed itself from an unremarkable seller of bread and pastries into one of the UK’s 10 most popular food-on-the-go chains, in part thanks to its embrace of vegan, gluten-free and healthy options as well as clever marketing that have changed its image. (Source: adapted from Financial Times, 3 March 2020 https://www.ft.com/ content/6fb6d73a-5d24-11ea-8033-fa40a0d65a98)
(b) With reference to Figure 2 and your understanding of price elasticity, examine two factors that may cause significant changes in the international price of coffee beans. (8)
June 2022 · Paper 1 · Q6(c) 10 marks AO1=2, AO2=2, AO3=2, AO4=4 10-mark response business growth and objectives
Data and extracts for question 6UK branded coffee shop chains market Figure 1: Branded coffee shops by number of shops in the UK in 2021 Costa 2681 Starbucks 1025 Caffè Nero 648 Coffee 50 AMT shop chains 40 Soho Coffee 30 Coffee Republic 3748 Other chains 0 500 1000 1500 2000 2500 3000 3500 4000 Number of shops (Source: adapted from https://www.statista.com/statistics/297863/ leading-coffee-shop-chains-in-the-united-kingdom-uk-store-number/) Figure 2: International coffee price (Arabica bean), US dollars per kilogram Month Price Change Jan 2020 3.13 – Feb 2020 2.99 –4.47% Mar 2020 3.27 9.36% Apr 2020 3.41 4.28% May 2020 3.30 –3.23% Jun 2020 3.12 –5.45% Jul 2020 3.24 3.85% Aug 2020 3.60 11.11% Sep 2020 3.67 1.94% Oct 2020 3.35 –8.72% Nov 2020 3.31 –1.19% Dec 2020 3.48 5.14% (Source: adapted from https://www.indexmundi.com/commodities/ ?commodity=other-mild-arabicas-coffee&months=12) Extract A Tough market conditions for coffee shops – but coffee quality is king UK coffee shop chains have experienced slow growth opportunities and rising costs. In 2019 the UK market leader, Costa Coffee, opened over 60% fewer stores than in 2018, while Starbucks opened just three new stores overall in 2019. By 2020, many costs were rising: staff shortages meant rising wages for baristas (trained 5 coffeemakers), a 6.2% National Minimum Wage increase for over 25-year-olds and rising rents. In a challenging UK economy, consumers placed coffee quality ahead of convenient location when choosing a coffee shop. This demonstrates the need for coffee shops to match rising expectations in the UK’s increasingly crowded coffee shop market in 10 order to stay competitive. Independent coffee shops (total 25 892 shops in 2020) remain a threat to the branded coffee shops as they pursue a unique luxury experience for customers. This will often focus on the atmosphere and customer service, luxury food and drink ranges and being a part of the local community. Independent coffee shops run on average profit as low as 2% of revenue, and many go out of business as new chains 15 arrive in a locality. In January 2020, Coca-Cola finalised its £3.9 billion takeover of market leader, Costa Coffee. The Coca-Cola company’s stated aims are to maximise long-term returns to shareholders while being mindful of overall responsibilities such as supporting sustainable communities. Major brands, such as Costa, continue to lead coffee shop 20 expansion in 2020 as competition intensifies. (Source: adapted from https://www.worldcoffeeportal.com/Latest/InsightAnalysis/2020/ February/5-UK-coffee-shop-market-dynamics-to-watch-in-2020) Extract B Greggs aiming for ‘coffee shop experience’ Greggs is looking to increase its branded coffee shop market share after the British bakery chain achieved record profits and overtook Starbucks in the amount of coffee it served in the UK. Although Greggs will continue to focus on the food-to-go market, it will be investing in better coffee machines and providing WiFi. It wants one in three 5 new outlets to have more seating. The company believes that it has the ability to take market share in two ways, by expanding its coffee range and at the same time enhancing the coffee shop experience. Greggs is modelling its plan on rival chain Pret A Manger, which has changed from focusing on food-to-go sales to mainly eating in. Greggs has transformed itself from an unremarkable seller of bread and pastries into one of the UK’s 10 most popular food-on-the-go chains, in part thanks to its embrace of vegan, gluten-free and healthy options as well as clever marketing that have changed its image. (Source: adapted from Financial Times, 3 March 2020 https://www.ft.com/ content/6fb6d73a-5d24-11ea-8033-fa40a0d65a98)
(c) Profit maximisation is assumed to be the business objective of most firms. With reference to Extract A, assess whether this is the case for coffee shop owners. (10)
June 2022 · Paper 1 · Q6(d) 12 marks AO1=2, AO2=2, AO3=4, AO4=4 12-mark response revenues costs and profits
Data and extracts for question 6UK branded coffee shop chains market Figure 1: Branded coffee shops by number of shops in the UK in 2021 Costa 2681 Starbucks 1025 Caffè Nero 648 Coffee 50 AMT shop chains 40 Soho Coffee 30 Coffee Republic 3748 Other chains 0 500 1000 1500 2000 2500 3000 3500 4000 Number of shops (Source: adapted from https://www.statista.com/statistics/297863/ leading-coffee-shop-chains-in-the-united-kingdom-uk-store-number/) Figure 2: International coffee price (Arabica bean), US dollars per kilogram Month Price Change Jan 2020 3.13 – Feb 2020 2.99 –4.47% Mar 2020 3.27 9.36% Apr 2020 3.41 4.28% May 2020 3.30 –3.23% Jun 2020 3.12 –5.45% Jul 2020 3.24 3.85% Aug 2020 3.60 11.11% Sep 2020 3.67 1.94% Oct 2020 3.35 –8.72% Nov 2020 3.31 –1.19% Dec 2020 3.48 5.14% (Source: adapted from https://www.indexmundi.com/commodities/ ?commodity=other-mild-arabicas-coffee&months=12) Extract A Tough market conditions for coffee shops – but coffee quality is king UK coffee shop chains have experienced slow growth opportunities and rising costs. In 2019 the UK market leader, Costa Coffee, opened over 60% fewer stores than in 2018, while Starbucks opened just three new stores overall in 2019. By 2020, many costs were rising: staff shortages meant rising wages for baristas (trained 5 coffeemakers), a 6.2% National Minimum Wage increase for over 25-year-olds and rising rents. In a challenging UK economy, consumers placed coffee quality ahead of convenient location when choosing a coffee shop. This demonstrates the need for coffee shops to match rising expectations in the UK’s increasingly crowded coffee shop market in 10 order to stay competitive. Independent coffee shops (total 25 892 shops in 2020) remain a threat to the branded coffee shops as they pursue a unique luxury experience for customers. This will often focus on the atmosphere and customer service, luxury food and drink ranges and being a part of the local community. Independent coffee shops run on average profit as low as 2% of revenue, and many go out of business as new chains 15 arrive in a locality. In January 2020, Coca-Cola finalised its £3.9 billion takeover of market leader, Costa Coffee. The Coca-Cola company’s stated aims are to maximise long-term returns to shareholders while being mindful of overall responsibilities such as supporting sustainable communities. Major brands, such as Costa, continue to lead coffee shop 20 expansion in 2020 as competition intensifies. (Source: adapted from https://www.worldcoffeeportal.com/Latest/InsightAnalysis/2020/ February/5-UK-coffee-shop-market-dynamics-to-watch-in-2020) Extract B Greggs aiming for ‘coffee shop experience’ Greggs is looking to increase its branded coffee shop market share after the British bakery chain achieved record profits and overtook Starbucks in the amount of coffee it served in the UK. Although Greggs will continue to focus on the food-to-go market, it will be investing in better coffee machines and providing WiFi. It wants one in three 5 new outlets to have more seating. The company believes that it has the ability to take market share in two ways, by expanding its coffee range and at the same time enhancing the coffee shop experience. Greggs is modelling its plan on rival chain Pret A Manger, which has changed from focusing on food-to-go sales to mainly eating in. Greggs has transformed itself from an unremarkable seller of bread and pastries into one of the UK’s 10 most popular food-on-the-go chains, in part thanks to its embrace of vegan, gluten-free and healthy options as well as clever marketing that have changed its image. (Source: adapted from Financial Times, 3 March 2020 https://www.ft.com/ content/6fb6d73a-5d24-11ea-8033-fa40a0d65a98)
(d) Using a cost and revenue diagram, discuss the likely impact of ‘rising costs’ for coffee shops on their profitability (Extract A, line 2). (12)
June 2022 · Paper 1 · Q6(e) 15 marks AO1=3, AO2=3, AO3=3, AO4=6 15-mark response monopsony and contestability
Data and extracts for question 6UK branded coffee shop chains market Figure 1: Branded coffee shops by number of shops in the UK in 2021 Costa 2681 Starbucks 1025 Caffè Nero 648 Coffee 50 AMT shop chains 40 Soho Coffee 30 Coffee Republic 3748 Other chains 0 500 1000 1500 2000 2500 3000 3500 4000 Number of shops (Source: adapted from https://www.statista.com/statistics/297863/ leading-coffee-shop-chains-in-the-united-kingdom-uk-store-number/) Figure 2: International coffee price (Arabica bean), US dollars per kilogram Month Price Change Jan 2020 3.13 – Feb 2020 2.99 –4.47% Mar 2020 3.27 9.36% Apr 2020 3.41 4.28% May 2020 3.30 –3.23% Jun 2020 3.12 –5.45% Jul 2020 3.24 3.85% Aug 2020 3.60 11.11% Sep 2020 3.67 1.94% Oct 2020 3.35 –8.72% Nov 2020 3.31 –1.19% Dec 2020 3.48 5.14% (Source: adapted from https://www.indexmundi.com/commodities/ ?commodity=other-mild-arabicas-coffee&months=12) Extract A Tough market conditions for coffee shops – but coffee quality is king UK coffee shop chains have experienced slow growth opportunities and rising costs. In 2019 the UK market leader, Costa Coffee, opened over 60% fewer stores than in 2018, while Starbucks opened just three new stores overall in 2019. By 2020, many costs were rising: staff shortages meant rising wages for baristas (trained 5 coffeemakers), a 6.2% National Minimum Wage increase for over 25-year-olds and rising rents. In a challenging UK economy, consumers placed coffee quality ahead of convenient location when choosing a coffee shop. This demonstrates the need for coffee shops to match rising expectations in the UK’s increasingly crowded coffee shop market in 10 order to stay competitive. Independent coffee shops (total 25 892 shops in 2020) remain a threat to the branded coffee shops as they pursue a unique luxury experience for customers. This will often focus on the atmosphere and customer service, luxury food and drink ranges and being a part of the local community. Independent coffee shops run on average profit as low as 2% of revenue, and many go out of business as new chains 15 arrive in a locality. In January 2020, Coca-Cola finalised its £3.9 billion takeover of market leader, Costa Coffee. The Coca-Cola company’s stated aims are to maximise long-term returns to shareholders while being mindful of overall responsibilities such as supporting sustainable communities. Major brands, such as Costa, continue to lead coffee shop 20 expansion in 2020 as competition intensifies. (Source: adapted from https://www.worldcoffeeportal.com/Latest/InsightAnalysis/2020/ February/5-UK-coffee-shop-market-dynamics-to-watch-in-2020) Extract B Greggs aiming for ‘coffee shop experience’ Greggs is looking to increase its branded coffee shop market share after the British bakery chain achieved record profits and overtook Starbucks in the amount of coffee it served in the UK. Although Greggs will continue to focus on the food-to-go market, it will be investing in better coffee machines and providing WiFi. It wants one in three 5 new outlets to have more seating. The company believes that it has the ability to take market share in two ways, by expanding its coffee range and at the same time enhancing the coffee shop experience. Greggs is modelling its plan on rival chain Pret A Manger, which has changed from focusing on food-to-go sales to mainly eating in. Greggs has transformed itself from an unremarkable seller of bread and pastries into one of the UK’s 10 most popular food-on-the-go chains, in part thanks to its embrace of vegan, gluten-free and healthy options as well as clever marketing that have changed its image. (Source: adapted from Financial Times, 3 March 2020 https://www.ft.com/ content/6fb6d73a-5d24-11ea-8033-fa40a0d65a98)
(e) With reference to the information provided, discuss whether the coffee shop market is contestable. (15)
June 2022 · Paper 2 · Q1(a) 4 marks AO2=3, AO3=1 Calculation national income and the multiplier
Data and extracts for question 11 According to the Bank of England, the UK’s marginal propensity to consume is estimated to be 0.64. (Source: adapted from https://www.bankofengland.co.uk/-/media/boe/files/working- paper/2017/the-consumption-response-to-positive-and-negative-income-changes.pdf?)
(a) Using the information above, calculate the total reduction in the UK’s GDP from a fall in government spending of £20 million. (4)
June 2022 · Paper 2 · Q2(b) 4 marks AO1=2, AO2=1, AO3=1 Short answer aggregate demand
Data and extracts for question 22 Annual percentage change in average UK house prices 12 10 8 % 6 4 2 0 (Source: adapted from https://www.nationwide.co.uk/-/media/MainSite/ documents/about/house-price-index/2021/May_2021.pdf)
(b) With reference to the chart on the previous page, explain the likely impact of an increase in average house prices on UK consumption. (4)
June 2022 · Paper 2 · Q3(a) 4 marks AO1=2, AO2=1, AO3=1 Short answer aggregate demand
Data and extracts for question 33 Bank of England base interest rate, 2016–2020 0.8 0.7 0.6 0.5 % 0.4 0.3 0.2 0.1 0.0 2016 2017 2018 2019 2020 (Source: adapted from https://www.bankofengland.co.uk/ monetary-policy/the-interest-rate-bank-rate)
(a) With reference to the chart above, explain the likely impact of a reduction in the base interest rate on UK investment. (4)
June 2022 · Paper 2 · Q4(b) 4 marks AO1=3, AO2=1 Short answer Hard public finances and taxation
Data and extracts for question 44 The trade cycle Real GDP Positive output gap Trend GDP Z Actual GDP Time
(b) With reference to the graph, explain the difference between automatic stabilisers and discretionary fiscal policy. (4)
June 2022 · Paper 2 · Q5(a) 4 marks AO1=2, AO2=1, AO3=1 Short answer financial sector
Data and extracts for question 55 In May 2020, the UK government introduced a loan scheme to help small businesses survive the downturn in the economy. Small businesses could borrow up to £50 000 at an interest rate of 2.5% for up to 6 years from a bank. The government guaranteed 100% of the loans, to enable banks to issue them quickly, and only minimal checks were made on borrowers. (Source: adapted from https://www.ft.com/content/1ca15db2-93e4-4e34-877d-110309cd9716)
(a) With reference to the information above, explain one role of financial markets. (4)
June 2022 · Paper 2 · Q6(a) 5 marks AO1=2, AO2=2, AO3=1 Diagram poverty and inequality
Data and extracts for question 6UK Government spending and inequality Figure 1: UK regional gross disposable household income per capita, 2018 £ per capita 19 000 to 21 000 17 000 to 18 999 16 000 to 16 999 15 000 to 15 999 14 500 to 14 999 14 000 to 14 499 13 000 to 13 999 North East South East (Source: adapted from University of Sheffield/Office for National Statistics: https://www.sheffield.ac.uk/news/nr/uk-higher-regional-inequality-large-wealthy-country-1.862262) Figure 2: UK subjective happiness by income, April 2021 Answer to the question: ‘On a scale of 1–10, how happy did you feel after yesterday?' (0 = not at all, 10 = completely) Less than £10 000 £10 000–£20 000 £20 000–£40 000 More than £40 000 7.31 7.02 7.13 7.29 (Source: adapted from https://www.ons.gov.uk/peoplepopulationandcommunity/wellbeing/ datasets/incomegroupsplitestimatesonpersonalandeconomicwellbeingacrosstime) Extract A Regional inequality in the UK Geographically, the UK is highly unequal in incomes. According to research from the University of Sheffield, the estimate of the Gini coefficient is 0.34. There are a number of different reasons for this. First, labour in poor places tend to develop too few skills, with a lack of education holding people back. In Rotherham in the north of England, for 5 example, 21% of disadvantaged 18-year-olds from state schools and colleges go on to higher education compared to 41% in London. Secondly, there is a lack of infrastructure spending in northern cities compared to London. In 2017–18, 28% of public expenditure on transport – and 46% of capital expenditure on railways – was spent in London. The argument for this is that London gets a lot of public money because a lot of people take 10 public transport. This has angered many people in the North. These problems cannot be solved quickly. They compound each other. Just as people are rarely poor for one reason, regions do not fall behind only because they have poor transport, poor schools or poor policy making, but for all those reasons and more. Ideally, the UK would develop a bold plan for regional development that could be followed 15 by future governments, as Germany did for its eastern part. Tera Allas of McKinsey, a consultancy firm, argues that improving education is crucial, even if the returns are not immediately obvious. It is easier to improve schools than to persuade businesses to move to a poorer part of the country. (Source: adapted from https://www.economist.com/britain/2020/07/30/ why-britain-is-more-geographically-unequal-than-any-other-rich-country) Extract B Public sector spending on infrastructure Economic differences across the UK are large and have grown. The government is looking at reducing this inequality partly through spending on transport infrastructure. Public sector capital spending is due to rise from just over 2% of GDP to 3%. That amounts to around £20 billion of additional spending per year on new capital projects. The 5 government is looking to take advantage of current low interest rates to finance the expansion without worsening its fiscal position. The government is determined to focus this spending on the north of England, Wales and the Midlands. Planned schemes include a new Trafford Park tram line in Manchester and reopening train lines and stations closed back in the 1960s, including stations in 10 Haxby in Yorkshire and Blyth in Northumberland. Progress has already been made in Wales with the reopening of Bow Street station near Aberystwyth. This project has taken 11 years to become a reality and cost £8m. It is estimated that it will generate a boost to the economy of £24m through boosting local trade, creating new jobs in the local area, and easing pressure on congested roads heading into Aberystwyth. 15 (Source: adapted from https://www.economist.com/britain/2020/01/09/the-coming- splurge-on-northern-infrastructure and https://www.wales247.co.uk/transport-for-wales- delivers-new-bow-street-station) Extract C Options for UK tax rises in the future There are a number of options for raising additional tax revenue in the future. These include: • increasing council tax on houses: this annual charge paid to local government is currently based on estimated house prices in 1991 and so is very out of date. This 5 would negatively affect areas where house prices have risen the most since 1991 • a one-off wealth tax: a 5% tax on property and pension wealth of more than £500 000 would raise £260 billion to help pay for the global health crisis in five years, according to proposals from the Wealth Commission • increasing corporation tax: at the 2021 Budget the Chancellor announced that 10 the top rate of UK corporation tax would be increased to 25% by 2023. This will remain the lowest rate in the G7 group of the world's largest advanced countries, but will raise £17.2 billion in 2025–26. (Source: adapted from https://www.telegraph.co.uk/tax/income-tax/five-tax-rises-rishi- sunak-considering-chances-happening-budget/, and https://home.kpmg/uk/en/home/ insights/2021/03/tmd-corporation-tax-rate-to-increase-to-25-percent.html)
(a) Using a Lorenz curve diagram, explain how income inequality is measured using the Gini coefficient. Refer to Extract A in your answer. (5)
June 2022 · Paper 2 · Q6(b) 8 marks AO1=2, AO2=2, AO3=2, AO4=2 8-mark response poverty and inequality
Data and extracts for question 6UK Government spending and inequality Figure 1: UK regional gross disposable household income per capita, 2018 £ per capita 19 000 to 21 000 17 000 to 18 999 16 000 to 16 999 15 000 to 15 999 14 500 to 14 999 14 000 to 14 499 13 000 to 13 999 North East South East (Source: adapted from University of Sheffield/Office for National Statistics: https://www.sheffield.ac.uk/news/nr/uk-higher-regional-inequality-large-wealthy-country-1.862262) Figure 2: UK subjective happiness by income, April 2021 Answer to the question: ‘On a scale of 1–10, how happy did you feel after yesterday?' (0 = not at all, 10 = completely) Less than £10 000 £10 000–£20 000 £20 000–£40 000 More than £40 000 7.31 7.02 7.13 7.29 (Source: adapted from https://www.ons.gov.uk/peoplepopulationandcommunity/wellbeing/ datasets/incomegroupsplitestimatesonpersonalandeconomicwellbeingacrosstime) Extract A Regional inequality in the UK Geographically, the UK is highly unequal in incomes. According to research from the University of Sheffield, the estimate of the Gini coefficient is 0.34. There are a number of different reasons for this. First, labour in poor places tend to develop too few skills, with a lack of education holding people back. In Rotherham in the north of England, for 5 example, 21% of disadvantaged 18-year-olds from state schools and colleges go on to higher education compared to 41% in London. Secondly, there is a lack of infrastructure spending in northern cities compared to London. In 2017–18, 28% of public expenditure on transport – and 46% of capital expenditure on railways – was spent in London. The argument for this is that London gets a lot of public money because a lot of people take 10 public transport. This has angered many people in the North. These problems cannot be solved quickly. They compound each other. Just as people are rarely poor for one reason, regions do not fall behind only because they have poor transport, poor schools or poor policy making, but for all those reasons and more. Ideally, the UK would develop a bold plan for regional development that could be followed 15 by future governments, as Germany did for its eastern part. Tera Allas of McKinsey, a consultancy firm, argues that improving education is crucial, even if the returns are not immediately obvious. It is easier to improve schools than to persuade businesses to move to a poorer part of the country. (Source: adapted from https://www.economist.com/britain/2020/07/30/ why-britain-is-more-geographically-unequal-than-any-other-rich-country) Extract B Public sector spending on infrastructure Economic differences across the UK are large and have grown. The government is looking at reducing this inequality partly through spending on transport infrastructure. Public sector capital spending is due to rise from just over 2% of GDP to 3%. That amounts to around £20 billion of additional spending per year on new capital projects. The 5 government is looking to take advantage of current low interest rates to finance the expansion without worsening its fiscal position. The government is determined to focus this spending on the north of England, Wales and the Midlands. Planned schemes include a new Trafford Park tram line in Manchester and reopening train lines and stations closed back in the 1960s, including stations in 10 Haxby in Yorkshire and Blyth in Northumberland. Progress has already been made in Wales with the reopening of Bow Street station near Aberystwyth. This project has taken 11 years to become a reality and cost £8m. It is estimated that it will generate a boost to the economy of £24m through boosting local trade, creating new jobs in the local area, and easing pressure on congested roads heading into Aberystwyth. 15 (Source: adapted from https://www.economist.com/britain/2020/01/09/the-coming- splurge-on-northern-infrastructure and https://www.wales247.co.uk/transport-for-wales- delivers-new-bow-street-station) Extract C Options for UK tax rises in the future There are a number of options for raising additional tax revenue in the future. These include: • increasing council tax on houses: this annual charge paid to local government is currently based on estimated house prices in 1991 and so is very out of date. This 5 would negatively affect areas where house prices have risen the most since 1991 • a one-off wealth tax: a 5% tax on property and pension wealth of more than £500 000 would raise £260 billion to help pay for the global health crisis in five years, according to proposals from the Wealth Commission • increasing corporation tax: at the 2021 Budget the Chancellor announced that 10 the top rate of UK corporation tax would be increased to 25% by 2023. This will remain the lowest rate in the G7 group of the world's largest advanced countries, but will raise £17.2 billion in 2025–26. (Source: adapted from https://www.telegraph.co.uk/tax/income-tax/five-tax-rises-rishi- sunak-considering-chances-happening-budget/, and https://home.kpmg/uk/en/home/ insights/2021/03/tmd-corporation-tax-rate-to-increase-to-25-percent.html)
(b) With reference to Figure 1 and Extract A, examine two likely causes of income inequality within the UK. (8)
June 2022 · Paper 2 · Q6(c) 10 marks AO1=2, AO2=2, AO3=2, AO4=4 10-mark response measuring economic growth
Data and extracts for question 6UK Government spending and inequality Figure 1: UK regional gross disposable household income per capita, 2018 £ per capita 19 000 to 21 000 17 000 to 18 999 16 000 to 16 999 15 000 to 15 999 14 500 to 14 999 14 000 to 14 499 13 000 to 13 999 North East South East (Source: adapted from University of Sheffield/Office for National Statistics: https://www.sheffield.ac.uk/news/nr/uk-higher-regional-inequality-large-wealthy-country-1.862262) Figure 2: UK subjective happiness by income, April 2021 Answer to the question: ‘On a scale of 1–10, how happy did you feel after yesterday?' (0 = not at all, 10 = completely) Less than £10 000 £10 000–£20 000 £20 000–£40 000 More than £40 000 7.31 7.02 7.13 7.29 (Source: adapted from https://www.ons.gov.uk/peoplepopulationandcommunity/wellbeing/ datasets/incomegroupsplitestimatesonpersonalandeconomicwellbeingacrosstime) Extract A Regional inequality in the UK Geographically, the UK is highly unequal in incomes. According to research from the University of Sheffield, the estimate of the Gini coefficient is 0.34. There are a number of different reasons for this. First, labour in poor places tend to develop too few skills, with a lack of education holding people back. In Rotherham in the north of England, for 5 example, 21% of disadvantaged 18-year-olds from state schools and colleges go on to higher education compared to 41% in London. Secondly, there is a lack of infrastructure spending in northern cities compared to London. In 2017–18, 28% of public expenditure on transport – and 46% of capital expenditure on railways – was spent in London. The argument for this is that London gets a lot of public money because a lot of people take 10 public transport. This has angered many people in the North. These problems cannot be solved quickly. They compound each other. Just as people are rarely poor for one reason, regions do not fall behind only because they have poor transport, poor schools or poor policy making, but for all those reasons and more. Ideally, the UK would develop a bold plan for regional development that could be followed 15 by future governments, as Germany did for its eastern part. Tera Allas of McKinsey, a consultancy firm, argues that improving education is crucial, even if the returns are not immediately obvious. It is easier to improve schools than to persuade businesses to move to a poorer part of the country. (Source: adapted from https://www.economist.com/britain/2020/07/30/ why-britain-is-more-geographically-unequal-than-any-other-rich-country) Extract B Public sector spending on infrastructure Economic differences across the UK are large and have grown. The government is looking at reducing this inequality partly through spending on transport infrastructure. Public sector capital spending is due to rise from just over 2% of GDP to 3%. That amounts to around £20 billion of additional spending per year on new capital projects. The 5 government is looking to take advantage of current low interest rates to finance the expansion without worsening its fiscal position. The government is determined to focus this spending on the north of England, Wales and the Midlands. Planned schemes include a new Trafford Park tram line in Manchester and reopening train lines and stations closed back in the 1960s, including stations in 10 Haxby in Yorkshire and Blyth in Northumberland. Progress has already been made in Wales with the reopening of Bow Street station near Aberystwyth. This project has taken 11 years to become a reality and cost £8m. It is estimated that it will generate a boost to the economy of £24m through boosting local trade, creating new jobs in the local area, and easing pressure on congested roads heading into Aberystwyth. 15 (Source: adapted from https://www.economist.com/britain/2020/01/09/the-coming- splurge-on-northern-infrastructure and https://www.wales247.co.uk/transport-for-wales- delivers-new-bow-street-station) Extract C Options for UK tax rises in the future There are a number of options for raising additional tax revenue in the future. These include: • increasing council tax on houses: this annual charge paid to local government is currently based on estimated house prices in 1991 and so is very out of date. This 5 would negatively affect areas where house prices have risen the most since 1991 • a one-off wealth tax: a 5% tax on property and pension wealth of more than £500 000 would raise £260 billion to help pay for the global health crisis in five years, according to proposals from the Wealth Commission • increasing corporation tax: at the 2021 Budget the Chancellor announced that 10 the top rate of UK corporation tax would be increased to 25% by 2023. This will remain the lowest rate in the G7 group of the world's largest advanced countries, but will raise £17.2 billion in 2025–26. (Source: adapted from https://www.telegraph.co.uk/tax/income-tax/five-tax-rises-rishi- sunak-considering-chances-happening-budget/, and https://home.kpmg/uk/en/home/ insights/2021/03/tmd-corporation-tax-rate-to-increase-to-25-percent.html)
(c) With reference to Figure 2, assess whether an increase in real income improves subjective happiness within the UK. (10)
June 2022 · Paper 2 · Q6(d) 12 marks AO1=2, AO2=2, AO3=4, AO4=4 12-mark response public finances and taxation
Data and extracts for question 6UK Government spending and inequality Figure 1: UK regional gross disposable household income per capita, 2018 £ per capita 19 000 to 21 000 17 000 to 18 999 16 000 to 16 999 15 000 to 15 999 14 500 to 14 999 14 000 to 14 499 13 000 to 13 999 North East South East (Source: adapted from University of Sheffield/Office for National Statistics: https://www.sheffield.ac.uk/news/nr/uk-higher-regional-inequality-large-wealthy-country-1.862262) Figure 2: UK subjective happiness by income, April 2021 Answer to the question: ‘On a scale of 1–10, how happy did you feel after yesterday?' (0 = not at all, 10 = completely) Less than £10 000 £10 000–£20 000 £20 000–£40 000 More than £40 000 7.31 7.02 7.13 7.29 (Source: adapted from https://www.ons.gov.uk/peoplepopulationandcommunity/wellbeing/ datasets/incomegroupsplitestimatesonpersonalandeconomicwellbeingacrosstime) Extract A Regional inequality in the UK Geographically, the UK is highly unequal in incomes. According to research from the University of Sheffield, the estimate of the Gini coefficient is 0.34. There are a number of different reasons for this. First, labour in poor places tend to develop too few skills, with a lack of education holding people back. In Rotherham in the north of England, for 5 example, 21% of disadvantaged 18-year-olds from state schools and colleges go on to higher education compared to 41% in London. Secondly, there is a lack of infrastructure spending in northern cities compared to London. In 2017–18, 28% of public expenditure on transport – and 46% of capital expenditure on railways – was spent in London. The argument for this is that London gets a lot of public money because a lot of people take 10 public transport. This has angered many people in the North. These problems cannot be solved quickly. They compound each other. Just as people are rarely poor for one reason, regions do not fall behind only because they have poor transport, poor schools or poor policy making, but for all those reasons and more. Ideally, the UK would develop a bold plan for regional development that could be followed 15 by future governments, as Germany did for its eastern part. Tera Allas of McKinsey, a consultancy firm, argues that improving education is crucial, even if the returns are not immediately obvious. It is easier to improve schools than to persuade businesses to move to a poorer part of the country. (Source: adapted from https://www.economist.com/britain/2020/07/30/ why-britain-is-more-geographically-unequal-than-any-other-rich-country) Extract B Public sector spending on infrastructure Economic differences across the UK are large and have grown. The government is looking at reducing this inequality partly through spending on transport infrastructure. Public sector capital spending is due to rise from just over 2% of GDP to 3%. That amounts to around £20 billion of additional spending per year on new capital projects. The 5 government is looking to take advantage of current low interest rates to finance the expansion without worsening its fiscal position. The government is determined to focus this spending on the north of England, Wales and the Midlands. Planned schemes include a new Trafford Park tram line in Manchester and reopening train lines and stations closed back in the 1960s, including stations in 10 Haxby in Yorkshire and Blyth in Northumberland. Progress has already been made in Wales with the reopening of Bow Street station near Aberystwyth. This project has taken 11 years to become a reality and cost £8m. It is estimated that it will generate a boost to the economy of £24m through boosting local trade, creating new jobs in the local area, and easing pressure on congested roads heading into Aberystwyth. 15 (Source: adapted from https://www.economist.com/britain/2020/01/09/the-coming- splurge-on-northern-infrastructure and https://www.wales247.co.uk/transport-for-wales- delivers-new-bow-street-station) Extract C Options for UK tax rises in the future There are a number of options for raising additional tax revenue in the future. These include: • increasing council tax on houses: this annual charge paid to local government is currently based on estimated house prices in 1991 and so is very out of date. This 5 would negatively affect areas where house prices have risen the most since 1991 • a one-off wealth tax: a 5% tax on property and pension wealth of more than £500 000 would raise £260 billion to help pay for the global health crisis in five years, according to proposals from the Wealth Commission • increasing corporation tax: at the 2021 Budget the Chancellor announced that 10 the top rate of UK corporation tax would be increased to 25% by 2023. This will remain the lowest rate in the G7 group of the world's largest advanced countries, but will raise £17.2 billion in 2025–26. (Source: adapted from https://www.telegraph.co.uk/tax/income-tax/five-tax-rises-rishi- sunak-considering-chances-happening-budget/, and https://home.kpmg/uk/en/home/ insights/2021/03/tmd-corporation-tax-rate-to-increase-to-25-percent.html)
(d) With reference to Extract C and your own knowledge, discuss methods the UK government could use to increase tax revenue. (12)
June 2022 · Paper 2 · Q6(e) 15 marks AO1=3, AO2=3, AO3=3, AO4=6 15-mark response supply side policiesnational income and the multiplier
Data and extracts for question 6UK Government spending and inequality Figure 1: UK regional gross disposable household income per capita, 2018 £ per capita 19 000 to 21 000 17 000 to 18 999 16 000 to 16 999 15 000 to 15 999 14 500 to 14 999 14 000 to 14 499 13 000 to 13 999 North East South East (Source: adapted from University of Sheffield/Office for National Statistics: https://www.sheffield.ac.uk/news/nr/uk-higher-regional-inequality-large-wealthy-country-1.862262) Figure 2: UK subjective happiness by income, April 2021 Answer to the question: ‘On a scale of 1–10, how happy did you feel after yesterday?' (0 = not at all, 10 = completely) Less than £10 000 £10 000–£20 000 £20 000–£40 000 More than £40 000 7.31 7.02 7.13 7.29 (Source: adapted from https://www.ons.gov.uk/peoplepopulationandcommunity/wellbeing/ datasets/incomegroupsplitestimatesonpersonalandeconomicwellbeingacrosstime) Extract A Regional inequality in the UK Geographically, the UK is highly unequal in incomes. According to research from the University of Sheffield, the estimate of the Gini coefficient is 0.34. There are a number of different reasons for this. First, labour in poor places tend to develop too few skills, with a lack of education holding people back. In Rotherham in the north of England, for 5 example, 21% of disadvantaged 18-year-olds from state schools and colleges go on to higher education compared to 41% in London. Secondly, there is a lack of infrastructure spending in northern cities compared to London. In 2017–18, 28% of public expenditure on transport – and 46% of capital expenditure on railways – was spent in London. The argument for this is that London gets a lot of public money because a lot of people take 10 public transport. This has angered many people in the North. These problems cannot be solved quickly. They compound each other. Just as people are rarely poor for one reason, regions do not fall behind only because they have poor transport, poor schools or poor policy making, but for all those reasons and more. Ideally, the UK would develop a bold plan for regional development that could be followed 15 by future governments, as Germany did for its eastern part. Tera Allas of McKinsey, a consultancy firm, argues that improving education is crucial, even if the returns are not immediately obvious. It is easier to improve schools than to persuade businesses to move to a poorer part of the country. (Source: adapted from https://www.economist.com/britain/2020/07/30/ why-britain-is-more-geographically-unequal-than-any-other-rich-country) Extract B Public sector spending on infrastructure Economic differences across the UK are large and have grown. The government is looking at reducing this inequality partly through spending on transport infrastructure. Public sector capital spending is due to rise from just over 2% of GDP to 3%. That amounts to around £20 billion of additional spending per year on new capital projects. The 5 government is looking to take advantage of current low interest rates to finance the expansion without worsening its fiscal position. The government is determined to focus this spending on the north of England, Wales and the Midlands. Planned schemes include a new Trafford Park tram line in Manchester and reopening train lines and stations closed back in the 1960s, including stations in 10 Haxby in Yorkshire and Blyth in Northumberland. Progress has already been made in Wales with the reopening of Bow Street station near Aberystwyth. This project has taken 11 years to become a reality and cost £8m. It is estimated that it will generate a boost to the economy of £24m through boosting local trade, creating new jobs in the local area, and easing pressure on congested roads heading into Aberystwyth. 15 (Source: adapted from https://www.economist.com/britain/2020/01/09/the-coming- splurge-on-northern-infrastructure and https://www.wales247.co.uk/transport-for-wales- delivers-new-bow-street-station) Extract C Options for UK tax rises in the future There are a number of options for raising additional tax revenue in the future. These include: • increasing council tax on houses: this annual charge paid to local government is currently based on estimated house prices in 1991 and so is very out of date. This 5 would negatively affect areas where house prices have risen the most since 1991 • a one-off wealth tax: a 5% tax on property and pension wealth of more than £500 000 would raise £260 billion to help pay for the global health crisis in five years, according to proposals from the Wealth Commission • increasing corporation tax: at the 2021 Budget the Chancellor announced that 10 the top rate of UK corporation tax would be increased to 25% by 2023. This will remain the lowest rate in the G7 group of the world's largest advanced countries, but will raise £17.2 billion in 2025–26. (Source: adapted from https://www.telegraph.co.uk/tax/income-tax/five-tax-rises-rishi- sunak-considering-chances-happening-budget/, and https://home.kpmg/uk/en/home/ insights/2021/03/tmd-corporation-tax-rate-to-increase-to-25-percent.html)
(e) With reference to Extract B, discuss the benefits of an increase in infrastructure spending on the UK economy. Use an aggregate demand and aggregate supply diagram to support your answer. (15)
June 2022 · Paper 3 · Q1(a) 5 marks AO1=2, AO2=2, AO3=1 Short answer externalities
Data and extracts for question 1The food delivery industry Figure 1: Market share for third‑party food delivery services in the UK, 2019 1.2% 10.2% 21.3% 67.3% Just Eat Deliveroo Uber Eats Others (Source: adapted from https://onefourzerogroup.com/the‑takeaway‑takeover/) Extract A National Minimum Wage rises are more significant for 23 to 25-year-olds In 2021, the National Minimum Wage main rate, also known as the National Living Wage, rose by 2.2% to £8.91, following a 6.2% rise in 2020. By reducing the age at which people are eligible for the National Living Wage to 23 in 2021, it is estimated that an additional 7.5% of 23 to 25-year-olds could get a 71p an hour pay rise. This amounts to an 8.7% 5 increase, which may cause further financial worries for employers. (Source: adapted from https://www.ndna.org.uk/NDNA/News/Latest_news/2020/ Minimum_wages_to_rise_by_inflation_in_April.aspx) Extract B What is the true cost of the food delivery service? The food delivery industry has boomed in recent years. Just Eat, Uber Eats and Deliveroo all offer very similar services – third‑party food delivery firms that take up to 30% of the price of restaurant meals and deliver them to customers within a certain radius. The average spend per customer is around £15 with a £5 delivery fee, about five times 5 more expensive than cooking at home and the same price as eating in the restaurant. Cash rich, time poor professionals increasingly turn to food delivery. Food delivery comes with many layers of packaging. In the UK, there are 200 million meals annually with around 1.4 billion individual pieces of plastic for heat retention and protection when travelling, but does it really have to be plastic? People tend to 10 order more food, often high in fat, sugar and salt, and don’t even have to get up from their sofa. But there are concerns that the delivery firms are exploiting employees who have no alternative. There is an issue of low pay and informal contracts. Delivery drivers are classed as ‘independent contractors’, and therefore not subject to some employment 15 rights including a guaranteed minimum wage, sick pay, pensions or holiday pay. Drivers are paid either a flat hourly rate, or a fee per delivery. Factors such as delivery distance, speed, how busy it is and whether there are multiple drop‑offs are all factored into how much a driver is paid. Deliveroo says its wages amount to around £10 per hour, but drivers say that during 2020 their pay has been as low as £1 per hour. Drivers are not 20 paid extra for petrol or to maintain their vehicles. Many drivers are recent immigrants or students, who do not have property or savings to fall back on. The government could address this with widening minimum pay legislation to contracted workers, by setting codes of practice, or by setting recommended wage targets. Furthermore, there are health and safety issues for workers. Vehicle safety checks, 25 length of shifts and safety equipment are of concern. However, there are still people who take benefit from working flexibility. (Source: adapted from https://www.theguardian.com/australia‑news/2020/oct/25/home- food-delivery‑what‑is‑the‑most‑ethical‑way‑to‑order‑in and https://digitalcommons.molloy. edu/cgi/viewcontent.cgi?article=1043&context=bus_fac) Extract C Integration in the third‑party food delivery industry The Competition and Markets Authority (CMA) is watching carefully to prevent any one firm having complete control of the food delivery industry. Just Eat, the market leader, agreed to merge with successful Dutch firm Takeaway.com in 2020, creating a new European leader by revenues. It also bought Grubhub in the US, with 20 million active 5 users. Just Eat uses an aggressive pricing strategy, undercutting delivery fees below the average cost of other firms in the market, that will force them to merge in order to gain some economies of scale. Amazon, having failed with its own delivery company Amazon Restaurants in 2018, has bought 16% of Deliveroo. The CMA took over a year to agree to the partial integration, 10 on the argument that Deliveroo would close down without external investment. Amazon has unique expertise in marketing, increasing customer share and, most importantly, efficiency in delivering things. Food delivery is often uneconomical because a single household puts in a single order from a single restaurant at any one time. Tech companies such as Amazon can improve the business: once a meal has been ordered, an 15 app often moves that restaurant to the top of the rankings for that neighbourhood, in the hope of getting a second and third delivery. So why do restaurants turn to these delivery firms? The sheer volume of customers these delivery firms can hold makes it a difficult deal to turn down. But resentment from small business restaurant owners, angry at being wholly dependent on tech companies, is 20 growing. Most restaurants would prefer that customers come in and pick up their orders themselves because they do not have to pay the 30% commission. Restaurant profit margins are small, and the effects of a 20% fall in the external value of the pound since 2016 on food costs are significant, given that over half of their food and drink is sourced outside the UK. 25 (Source: adapted from https://www.ft.com/content/c20f6848‑3c4b‑11ea‑a01a-bae547046735 https://www.ft.com/content/edf8a144‑a101‑4ef8‑80e3‑7d2f1565d35c and https://www.thisismoney.co.uk/money/markets/article‑8138703/Uber‑set‑sell- takeaway-division‑rival‑Deliveroo‑two‑years.html and https://www.ft.com/content/c20f6848-3c4b‑11ea‑a01a‑bae547046735 and https://www.ft.com/content/bed7c4d8-28c1-11ea-9a4f-963f0ec7e134 and https://www.economist.com/1843/2021/01/26/gulp‑the‑secret‑economics-of-food‑delivery)
(a) Using the information provided, explain one externality that arises in the food delivery market. (5)
June 2022 · Paper 3 · Q1(b) 8 marks AO1=2, AO2=2, AO3=2, AO4=2 8-mark response Hard price elasticity of demand
Data and extracts for question 1The food delivery industry Figure 1: Market share for third‑party food delivery services in the UK, 2019 1.2% 10.2% 21.3% 67.3% Just Eat Deliveroo Uber Eats Others (Source: adapted from https://onefourzerogroup.com/the‑takeaway‑takeover/) Extract A National Minimum Wage rises are more significant for 23 to 25-year-olds In 2021, the National Minimum Wage main rate, also known as the National Living Wage, rose by 2.2% to £8.91, following a 6.2% rise in 2020. By reducing the age at which people are eligible for the National Living Wage to 23 in 2021, it is estimated that an additional 7.5% of 23 to 25-year-olds could get a 71p an hour pay rise. This amounts to an 8.7% 5 increase, which may cause further financial worries for employers. (Source: adapted from https://www.ndna.org.uk/NDNA/News/Latest_news/2020/ Minimum_wages_to_rise_by_inflation_in_April.aspx) Extract B What is the true cost of the food delivery service? The food delivery industry has boomed in recent years. Just Eat, Uber Eats and Deliveroo all offer very similar services – third‑party food delivery firms that take up to 30% of the price of restaurant meals and deliver them to customers within a certain radius. The average spend per customer is around £15 with a £5 delivery fee, about five times 5 more expensive than cooking at home and the same price as eating in the restaurant. Cash rich, time poor professionals increasingly turn to food delivery. Food delivery comes with many layers of packaging. In the UK, there are 200 million meals annually with around 1.4 billion individual pieces of plastic for heat retention and protection when travelling, but does it really have to be plastic? People tend to 10 order more food, often high in fat, sugar and salt, and don’t even have to get up from their sofa. But there are concerns that the delivery firms are exploiting employees who have no alternative. There is an issue of low pay and informal contracts. Delivery drivers are classed as ‘independent contractors’, and therefore not subject to some employment 15 rights including a guaranteed minimum wage, sick pay, pensions or holiday pay. Drivers are paid either a flat hourly rate, or a fee per delivery. Factors such as delivery distance, speed, how busy it is and whether there are multiple drop‑offs are all factored into how much a driver is paid. Deliveroo says its wages amount to around £10 per hour, but drivers say that during 2020 their pay has been as low as £1 per hour. Drivers are not 20 paid extra for petrol or to maintain their vehicles. Many drivers are recent immigrants or students, who do not have property or savings to fall back on. The government could address this with widening minimum pay legislation to contracted workers, by setting codes of practice, or by setting recommended wage targets. Furthermore, there are health and safety issues for workers. Vehicle safety checks, 25 length of shifts and safety equipment are of concern. However, there are still people who take benefit from working flexibility. (Source: adapted from https://www.theguardian.com/australia‑news/2020/oct/25/home- food-delivery‑what‑is‑the‑most‑ethical‑way‑to‑order‑in and https://digitalcommons.molloy. edu/cgi/viewcontent.cgi?article=1043&context=bus_fac) Extract C Integration in the third‑party food delivery industry The Competition and Markets Authority (CMA) is watching carefully to prevent any one firm having complete control of the food delivery industry. Just Eat, the market leader, agreed to merge with successful Dutch firm Takeaway.com in 2020, creating a new European leader by revenues. It also bought Grubhub in the US, with 20 million active 5 users. Just Eat uses an aggressive pricing strategy, undercutting delivery fees below the average cost of other firms in the market, that will force them to merge in order to gain some economies of scale. Amazon, having failed with its own delivery company Amazon Restaurants in 2018, has bought 16% of Deliveroo. The CMA took over a year to agree to the partial integration, 10 on the argument that Deliveroo would close down without external investment. Amazon has unique expertise in marketing, increasing customer share and, most importantly, efficiency in delivering things. Food delivery is often uneconomical because a single household puts in a single order from a single restaurant at any one time. Tech companies such as Amazon can improve the business: once a meal has been ordered, an 15 app often moves that restaurant to the top of the rankings for that neighbourhood, in the hope of getting a second and third delivery. So why do restaurants turn to these delivery firms? The sheer volume of customers these delivery firms can hold makes it a difficult deal to turn down. But resentment from small business restaurant owners, angry at being wholly dependent on tech companies, is 20 growing. Most restaurants would prefer that customers come in and pick up their orders themselves because they do not have to pay the 30% commission. Restaurant profit margins are small, and the effects of a 20% fall in the external value of the pound since 2016 on food costs are significant, given that over half of their food and drink is sourced outside the UK. 25 (Source: adapted from https://www.ft.com/content/c20f6848‑3c4b‑11ea‑a01a-bae547046735 https://www.ft.com/content/edf8a144‑a101‑4ef8‑80e3‑7d2f1565d35c and https://www.thisismoney.co.uk/money/markets/article‑8138703/Uber‑set‑sell- takeaway-division‑rival‑Deliveroo‑two‑years.html and https://www.ft.com/content/c20f6848-3c4b‑11ea‑a01a‑bae547046735 and https://www.ft.com/content/bed7c4d8-28c1-11ea-9a4f-963f0ec7e134 and https://www.economist.com/1843/2021/01/26/gulp‑the‑secret‑economics-of-food‑delivery)
(b) With reference to Extract B, examine whether the demand for delivered food is price inelastic and income elastic. (8)
June 2022 · Paper 3 · Q1(c) 12 marks AO1=2, AO2=2, AO3=4, AO4=4 12-mark response business growth and objectivesrevenues costs and profits
Data and extracts for question 1The food delivery industry Figure 1: Market share for third‑party food delivery services in the UK, 2019 1.2% 10.2% 21.3% 67.3% Just Eat Deliveroo Uber Eats Others (Source: adapted from https://onefourzerogroup.com/the‑takeaway‑takeover/) Extract A National Minimum Wage rises are more significant for 23 to 25-year-olds In 2021, the National Minimum Wage main rate, also known as the National Living Wage, rose by 2.2% to £8.91, following a 6.2% rise in 2020. By reducing the age at which people are eligible for the National Living Wage to 23 in 2021, it is estimated that an additional 7.5% of 23 to 25-year-olds could get a 71p an hour pay rise. This amounts to an 8.7% 5 increase, which may cause further financial worries for employers. (Source: adapted from https://www.ndna.org.uk/NDNA/News/Latest_news/2020/ Minimum_wages_to_rise_by_inflation_in_April.aspx) Extract B What is the true cost of the food delivery service? The food delivery industry has boomed in recent years. Just Eat, Uber Eats and Deliveroo all offer very similar services – third‑party food delivery firms that take up to 30% of the price of restaurant meals and deliver them to customers within a certain radius. The average spend per customer is around £15 with a £5 delivery fee, about five times 5 more expensive than cooking at home and the same price as eating in the restaurant. Cash rich, time poor professionals increasingly turn to food delivery. Food delivery comes with many layers of packaging. In the UK, there are 200 million meals annually with around 1.4 billion individual pieces of plastic for heat retention and protection when travelling, but does it really have to be plastic? People tend to 10 order more food, often high in fat, sugar and salt, and don’t even have to get up from their sofa. But there are concerns that the delivery firms are exploiting employees who have no alternative. There is an issue of low pay and informal contracts. Delivery drivers are classed as ‘independent contractors’, and therefore not subject to some employment 15 rights including a guaranteed minimum wage, sick pay, pensions or holiday pay. Drivers are paid either a flat hourly rate, or a fee per delivery. Factors such as delivery distance, speed, how busy it is and whether there are multiple drop‑offs are all factored into how much a driver is paid. Deliveroo says its wages amount to around £10 per hour, but drivers say that during 2020 their pay has been as low as £1 per hour. Drivers are not 20 paid extra for petrol or to maintain their vehicles. Many drivers are recent immigrants or students, who do not have property or savings to fall back on. The government could address this with widening minimum pay legislation to contracted workers, by setting codes of practice, or by setting recommended wage targets. Furthermore, there are health and safety issues for workers. Vehicle safety checks, 25 length of shifts and safety equipment are of concern. However, there are still people who take benefit from working flexibility. (Source: adapted from https://www.theguardian.com/australia‑news/2020/oct/25/home- food-delivery‑what‑is‑the‑most‑ethical‑way‑to‑order‑in and https://digitalcommons.molloy. edu/cgi/viewcontent.cgi?article=1043&context=bus_fac) Extract C Integration in the third‑party food delivery industry The Competition and Markets Authority (CMA) is watching carefully to prevent any one firm having complete control of the food delivery industry. Just Eat, the market leader, agreed to merge with successful Dutch firm Takeaway.com in 2020, creating a new European leader by revenues. It also bought Grubhub in the US, with 20 million active 5 users. Just Eat uses an aggressive pricing strategy, undercutting delivery fees below the average cost of other firms in the market, that will force them to merge in order to gain some economies of scale. Amazon, having failed with its own delivery company Amazon Restaurants in 2018, has bought 16% of Deliveroo. The CMA took over a year to agree to the partial integration, 10 on the argument that Deliveroo would close down without external investment. Amazon has unique expertise in marketing, increasing customer share and, most importantly, efficiency in delivering things. Food delivery is often uneconomical because a single household puts in a single order from a single restaurant at any one time. Tech companies such as Amazon can improve the business: once a meal has been ordered, an 15 app often moves that restaurant to the top of the rankings for that neighbourhood, in the hope of getting a second and third delivery. So why do restaurants turn to these delivery firms? The sheer volume of customers these delivery firms can hold makes it a difficult deal to turn down. But resentment from small business restaurant owners, angry at being wholly dependent on tech companies, is 20 growing. Most restaurants would prefer that customers come in and pick up their orders themselves because they do not have to pay the 30% commission. Restaurant profit margins are small, and the effects of a 20% fall in the external value of the pound since 2016 on food costs are significant, given that over half of their food and drink is sourced outside the UK. 25 (Source: adapted from https://www.ft.com/content/c20f6848‑3c4b‑11ea‑a01a-bae547046735 https://www.ft.com/content/edf8a144‑a101‑4ef8‑80e3‑7d2f1565d35c and https://www.thisismoney.co.uk/money/markets/article‑8138703/Uber‑set‑sell- takeaway-division‑rival‑Deliveroo‑two‑years.html and https://www.ft.com/content/c20f6848-3c4b‑11ea‑a01a‑bae547046735 and https://www.ft.com/content/bed7c4d8-28c1-11ea-9a4f-963f0ec7e134 and https://www.economist.com/1843/2021/01/26/gulp‑the‑secret‑economics-of-food‑delivery)
(c) With reference to Extract C, discuss the likely effects of increasing integration within the food delivery market. (12)
June 2022 · Paper 3 · Q1(d) 25 marks AO1=4, AO2=4, AO3=8, AO4=9 25-mark essay Either/or exchange ratesrevenues costs and profits
Data and extracts for question 1The food delivery industry Figure 1: Market share for third‑party food delivery services in the UK, 2019 1.2% 10.2% 21.3% 67.3% Just Eat Deliveroo Uber Eats Others (Source: adapted from https://onefourzerogroup.com/the‑takeaway‑takeover/) Extract A National Minimum Wage rises are more significant for 23 to 25-year-olds In 2021, the National Minimum Wage main rate, also known as the National Living Wage, rose by 2.2% to £8.91, following a 6.2% rise in 2020. By reducing the age at which people are eligible for the National Living Wage to 23 in 2021, it is estimated that an additional 7.5% of 23 to 25-year-olds could get a 71p an hour pay rise. This amounts to an 8.7% 5 increase, which may cause further financial worries for employers. (Source: adapted from https://www.ndna.org.uk/NDNA/News/Latest_news/2020/ Minimum_wages_to_rise_by_inflation_in_April.aspx) Extract B What is the true cost of the food delivery service? The food delivery industry has boomed in recent years. Just Eat, Uber Eats and Deliveroo all offer very similar services – third‑party food delivery firms that take up to 30% of the price of restaurant meals and deliver them to customers within a certain radius. The average spend per customer is around £15 with a £5 delivery fee, about five times 5 more expensive than cooking at home and the same price as eating in the restaurant. Cash rich, time poor professionals increasingly turn to food delivery. Food delivery comes with many layers of packaging. In the UK, there are 200 million meals annually with around 1.4 billion individual pieces of plastic for heat retention and protection when travelling, but does it really have to be plastic? People tend to 10 order more food, often high in fat, sugar and salt, and don’t even have to get up from their sofa. But there are concerns that the delivery firms are exploiting employees who have no alternative. There is an issue of low pay and informal contracts. Delivery drivers are classed as ‘independent contractors’, and therefore not subject to some employment 15 rights including a guaranteed minimum wage, sick pay, pensions or holiday pay. Drivers are paid either a flat hourly rate, or a fee per delivery. Factors such as delivery distance, speed, how busy it is and whether there are multiple drop‑offs are all factored into how much a driver is paid. Deliveroo says its wages amount to around £10 per hour, but drivers say that during 2020 their pay has been as low as £1 per hour. Drivers are not 20 paid extra for petrol or to maintain their vehicles. Many drivers are recent immigrants or students, who do not have property or savings to fall back on. The government could address this with widening minimum pay legislation to contracted workers, by setting codes of practice, or by setting recommended wage targets. Furthermore, there are health and safety issues for workers. Vehicle safety checks, 25 length of shifts and safety equipment are of concern. However, there are still people who take benefit from working flexibility. (Source: adapted from https://www.theguardian.com/australia‑news/2020/oct/25/home- food-delivery‑what‑is‑the‑most‑ethical‑way‑to‑order‑in and https://digitalcommons.molloy. edu/cgi/viewcontent.cgi?article=1043&context=bus_fac) Extract C Integration in the third‑party food delivery industry The Competition and Markets Authority (CMA) is watching carefully to prevent any one firm having complete control of the food delivery industry. Just Eat, the market leader, agreed to merge with successful Dutch firm Takeaway.com in 2020, creating a new European leader by revenues. It also bought Grubhub in the US, with 20 million active 5 users. Just Eat uses an aggressive pricing strategy, undercutting delivery fees below the average cost of other firms in the market, that will force them to merge in order to gain some economies of scale. Amazon, having failed with its own delivery company Amazon Restaurants in 2018, has bought 16% of Deliveroo. The CMA took over a year to agree to the partial integration, 10 on the argument that Deliveroo would close down without external investment. Amazon has unique expertise in marketing, increasing customer share and, most importantly, efficiency in delivering things. Food delivery is often uneconomical because a single household puts in a single order from a single restaurant at any one time. Tech companies such as Amazon can improve the business: once a meal has been ordered, an 15 app often moves that restaurant to the top of the rankings for that neighbourhood, in the hope of getting a second and third delivery. So why do restaurants turn to these delivery firms? The sheer volume of customers these delivery firms can hold makes it a difficult deal to turn down. But resentment from small business restaurant owners, angry at being wholly dependent on tech companies, is 20 growing. Most restaurants would prefer that customers come in and pick up their orders themselves because they do not have to pay the 30% commission. Restaurant profit margins are small, and the effects of a 20% fall in the external value of the pound since 2016 on food costs are significant, given that over half of their food and drink is sourced outside the UK. 25 (Source: adapted from https://www.ft.com/content/c20f6848‑3c4b‑11ea‑a01a-bae547046735 https://www.ft.com/content/edf8a144‑a101‑4ef8‑80e3‑7d2f1565d35c and https://www.thisismoney.co.uk/money/markets/article‑8138703/Uber‑set‑sell- takeaway-division‑rival‑Deliveroo‑two‑years.html and https://www.ft.com/content/c20f6848-3c4b‑11ea‑a01a‑bae547046735 and https://www.ft.com/content/bed7c4d8-28c1-11ea-9a4f-963f0ec7e134 and https://www.economist.com/1843/2021/01/26/gulp‑the‑secret‑economics-of-food‑delivery)
(d) Evaluate the microeconomic and macroeconomic effects of a depreciation of the pound. Refer to restaurants or other food delivery services in your answer. (25)
June 2022 · Paper 3 · Q1(e) 25 marks AO1=4, AO2=4, AO3=8, AO4=9 25-mark essay Either/or labour marketnational income and the multiplier
Data and extracts for question 1The food delivery industry Figure 1: Market share for third‑party food delivery services in the UK, 2019 1.2% 10.2% 21.3% 67.3% Just Eat Deliveroo Uber Eats Others (Source: adapted from https://onefourzerogroup.com/the‑takeaway‑takeover/) Extract A National Minimum Wage rises are more significant for 23 to 25-year-olds In 2021, the National Minimum Wage main rate, also known as the National Living Wage, rose by 2.2% to £8.91, following a 6.2% rise in 2020. By reducing the age at which people are eligible for the National Living Wage to 23 in 2021, it is estimated that an additional 7.5% of 23 to 25-year-olds could get a 71p an hour pay rise. This amounts to an 8.7% 5 increase, which may cause further financial worries for employers. (Source: adapted from https://www.ndna.org.uk/NDNA/News/Latest_news/2020/ Minimum_wages_to_rise_by_inflation_in_April.aspx) Extract B What is the true cost of the food delivery service? The food delivery industry has boomed in recent years. Just Eat, Uber Eats and Deliveroo all offer very similar services – third‑party food delivery firms that take up to 30% of the price of restaurant meals and deliver them to customers within a certain radius. The average spend per customer is around £15 with a £5 delivery fee, about five times 5 more expensive than cooking at home and the same price as eating in the restaurant. Cash rich, time poor professionals increasingly turn to food delivery. Food delivery comes with many layers of packaging. In the UK, there are 200 million meals annually with around 1.4 billion individual pieces of plastic for heat retention and protection when travelling, but does it really have to be plastic? People tend to 10 order more food, often high in fat, sugar and salt, and don’t even have to get up from their sofa. But there are concerns that the delivery firms are exploiting employees who have no alternative. There is an issue of low pay and informal contracts. Delivery drivers are classed as ‘independent contractors’, and therefore not subject to some employment 15 rights including a guaranteed minimum wage, sick pay, pensions or holiday pay. Drivers are paid either a flat hourly rate, or a fee per delivery. Factors such as delivery distance, speed, how busy it is and whether there are multiple drop‑offs are all factored into how much a driver is paid. Deliveroo says its wages amount to around £10 per hour, but drivers say that during 2020 their pay has been as low as £1 per hour. Drivers are not 20 paid extra for petrol or to maintain their vehicles. Many drivers are recent immigrants or students, who do not have property or savings to fall back on. The government could address this with widening minimum pay legislation to contracted workers, by setting codes of practice, or by setting recommended wage targets. Furthermore, there are health and safety issues for workers. Vehicle safety checks, 25 length of shifts and safety equipment are of concern. However, there are still people who take benefit from working flexibility. (Source: adapted from https://www.theguardian.com/australia‑news/2020/oct/25/home- food-delivery‑what‑is‑the‑most‑ethical‑way‑to‑order‑in and https://digitalcommons.molloy. edu/cgi/viewcontent.cgi?article=1043&context=bus_fac) Extract C Integration in the third‑party food delivery industry The Competition and Markets Authority (CMA) is watching carefully to prevent any one firm having complete control of the food delivery industry. Just Eat, the market leader, agreed to merge with successful Dutch firm Takeaway.com in 2020, creating a new European leader by revenues. It also bought Grubhub in the US, with 20 million active 5 users. Just Eat uses an aggressive pricing strategy, undercutting delivery fees below the average cost of other firms in the market, that will force them to merge in order to gain some economies of scale. Amazon, having failed with its own delivery company Amazon Restaurants in 2018, has bought 16% of Deliveroo. The CMA took over a year to agree to the partial integration, 10 on the argument that Deliveroo would close down without external investment. Amazon has unique expertise in marketing, increasing customer share and, most importantly, efficiency in delivering things. Food delivery is often uneconomical because a single household puts in a single order from a single restaurant at any one time. Tech companies such as Amazon can improve the business: once a meal has been ordered, an 15 app often moves that restaurant to the top of the rankings for that neighbourhood, in the hope of getting a second and third delivery. So why do restaurants turn to these delivery firms? The sheer volume of customers these delivery firms can hold makes it a difficult deal to turn down. But resentment from small business restaurant owners, angry at being wholly dependent on tech companies, is 20 growing. Most restaurants would prefer that customers come in and pick up their orders themselves because they do not have to pay the 30% commission. Restaurant profit margins are small, and the effects of a 20% fall in the external value of the pound since 2016 on food costs are significant, given that over half of their food and drink is sourced outside the UK. 25 (Source: adapted from https://www.ft.com/content/c20f6848‑3c4b‑11ea‑a01a-bae547046735 https://www.ft.com/content/edf8a144‑a101‑4ef8‑80e3‑7d2f1565d35c and https://www.thisismoney.co.uk/money/markets/article‑8138703/Uber‑set‑sell- takeaway-division‑rival‑Deliveroo‑two‑years.html and https://www.ft.com/content/c20f6848-3c4b‑11ea‑a01a‑bae547046735 and https://www.ft.com/content/bed7c4d8-28c1-11ea-9a4f-963f0ec7e134 and https://www.economist.com/1843/2021/01/26/gulp‑the‑secret‑economics-of-food‑delivery)
(e) Evaluate the microeconomic and macroeconomic effects of significant increases in the minimum wage. Refer to restaurants or other food delivery services in your answer. (25)
June 2022 · Paper 3 · Q2(a) 5 marks AO1=2, AO2=2, AO3=1 Short answer Hard emerging and developing economies
Data and extracts for question 2Sub‑Saharan Africa – growth and development Figure 2: Kenya population, millions, 1960 to 2020 60 53.7 50 42.0 40 millions 32.0 30 23.7 20 16.4 11.3 8.1 10 0 1960 1970 1980 1990 2000 2010 2020 (Source: adapted from Population, total ‑ Kenya | Data (worldbank.org)) Extract D Growth and development in Africa: 'Africa has a massive opportunity as a low‑cost provider of services' The outlook for Africa’s economies is not as simple as the Lewis model of growth and development implies: do more manufacturing or stay poor. Many countries are expanding into areas that economists are starting to call 'industries without smoking 5 chimneys'. Some, such as flower‑exports, may not be classified as manufactured goods in export statistics. But the process of producing flowers looks a lot like factory work and demands many of the same management skills. These industries also deliver many of the benefits of normal manufacturing, including many well‑paid jobs, and greater opportunities. 10 (Source: adapted from https://www.economist.com/special‑report/2020/03/26/many‑of- africas-economies‑are‑doing‑well) Extract E The demography of Kenya – ‘Demography will shape Africa’s future’ Falling birth rates, when accompanied by rising literacy, can help kick‑start growth. In Kenya 39% of the population is below the age of 15, falling from 43% in 2009. The labour force (15–64 years) is 57% and is the fastest growing population group. 6% of the population is over the age of 60. The number of children per family has fallen sharply, 5 from 8.1 children in 1978 to 4.6 children in 2008, and it is projected to possibly reach 2.4 children by 2050. In the 1970s little more than half of children in sub‑Saharan Africa were enrolled in primary school. That share has shot up to almost 100%. The statistic is slightly misleading, since the percentage of children regularly attending schools is nearer 60%. 10 Why does Kenya’s population continue to rise rapidly, while family size declines? There are two reasons. First, due to high fertility in previous decades, there are many more families in Kenya today. So even though families are smaller, the total number of children continues to grow. Second, Kenyans are living longer, with better healthcare – for example, polio was eradicated in 2014. Life expectancy is projected to increase from 15 54 years today to 68 years by 2050. 28% of Kenya is urbanised, and is becoming rapidly more so. By the 2030s it is expected that 36% of Kenyans will live in towns or cities rather than the poorer rural areas. Rich countries are urban countries. No country has ever reached high income levels with low urbanisation. Large urban centres have two distinct economic advantages. First, as more 20 people interact, there is more scope for innovation. Young people need jobs, but they also create jobs. Kenya has an educated workforce and a dynamic service industry, which typically has lower barriers of entry than agriculture or manufacturing, and provides opportunities for young entrepreneurs. Second, larger groups of population living in close proximity allow for economies of scale. 25 In light of these facts, Kenya’s future pattern of population growth can be a force of good. A large urbanising and well‑educated population tends to generate a strong middle class and vibrant private sector. Economic development may be easier to achieve and sustain – though it is not guaranteed. (Source: adapted from https://www.economist.com/special‑report/2020/03/26/ africas‑population‑will‑double‑by‑2050 and https://kenya.unfpa.org/sites/default/files/pub‑pdf/state_of_kenya_population_ report_2020.pdf and https://www.worldbank.org/en/news/opinion/2010/04/28/ demographic‑transition‑growth‑kenya) Extract F Kenya has an absolute advantage in cut flowers In the UK, 80% of cut flowers come via the Netherlands, although a significant proportion come from Kenya. Some Kenyan flowers come straight to the UK on direct flights from Nairobi, where entire terminals at certain airports are dedicated to flights exporting flowers. 5 Kenya flower production has three major advantages over the Netherlands: areas of high altitude with cool nights, which many flowers benefit from, proximity to the equator for maximum hours of sunlight, and cheaper labour. This means an end to seasonal production and the beginning of a 365‑day‑a‑year absolute advantage. The Netherlands has cost advantages in machinery and transport equipment, not flowers. 10 Cut flowers are now Kenya’s second largest export after tea, contributing around 1% of the country’s GDP. They are also one of the country’s largest sources of employment, with over 100 000 people working directly in the flower industry and an estimated two million indirectly. (Source: adapted from: https://www.economist.com/middle‑east‑and‑africa/2021/02/11/ kenyas-floral‑exports‑are-blooming‑once‑more) Extract G Changes in interest rates in sub‑Saharan Africa When Robert Matsiko was a young man his grain‑milling business in eastern Africa was destroyed by fire. Now, after building it back up from the ashes, he is being hurt by high interest rates. To buy a new machine he must borrow from a bank at an annual rate of 22%. 'You fear to do that,' Mr Matsiko says. Many other entrepreneurs feel the same, 5 which stops their businesses from growing, although very small firms can get help from microfinance schemes. Kenya’s central bank rate has fallen from over 20% to 7% in the last decade, but the rates charged to small businesses and individuals are much higher than the central bank interest rate. In sub‑Saharan Africa, the gap between saving and borrowing rates 10 is higher than anywhere else. The average bank lends at 6.8% above the central bank interest rate. Mobile banking, credit‑information sharing and innovation have helped to bring borrowing costs down. But until birth rates fall, interest rates will stay relatively high, because families with many children cannot afford to save. (Source: adapted from https://www.economist.com/finance‑and‑economics/2020/05/21/ why-interest‑rates-are‑so-high‑in-africa)
(a) Explain what is meant by the Lewis model. Refer to Extract D in your answer. (5)
June 2022 · Paper 3 · Q2(b) 8 marks AO1=2, AO2=2, AO3=2, AO4=2 8-mark response emerging and developing economies
Data and extracts for question 2Sub‑Saharan Africa – growth and development Figure 2: Kenya population, millions, 1960 to 2020 60 53.7 50 42.0 40 millions 32.0 30 23.7 20 16.4 11.3 8.1 10 0 1960 1970 1980 1990 2000 2010 2020 (Source: adapted from Population, total ‑ Kenya | Data (worldbank.org)) Extract D Growth and development in Africa: 'Africa has a massive opportunity as a low‑cost provider of services' The outlook for Africa’s economies is not as simple as the Lewis model of growth and development implies: do more manufacturing or stay poor. Many countries are expanding into areas that economists are starting to call 'industries without smoking 5 chimneys'. Some, such as flower‑exports, may not be classified as manufactured goods in export statistics. But the process of producing flowers looks a lot like factory work and demands many of the same management skills. These industries also deliver many of the benefits of normal manufacturing, including many well‑paid jobs, and greater opportunities. 10 (Source: adapted from https://www.economist.com/special‑report/2020/03/26/many‑of- africas-economies‑are‑doing‑well) Extract E The demography of Kenya – ‘Demography will shape Africa’s future’ Falling birth rates, when accompanied by rising literacy, can help kick‑start growth. In Kenya 39% of the population is below the age of 15, falling from 43% in 2009. The labour force (15–64 years) is 57% and is the fastest growing population group. 6% of the population is over the age of 60. The number of children per family has fallen sharply, 5 from 8.1 children in 1978 to 4.6 children in 2008, and it is projected to possibly reach 2.4 children by 2050. In the 1970s little more than half of children in sub‑Saharan Africa were enrolled in primary school. That share has shot up to almost 100%. The statistic is slightly misleading, since the percentage of children regularly attending schools is nearer 60%. 10 Why does Kenya’s population continue to rise rapidly, while family size declines? There are two reasons. First, due to high fertility in previous decades, there are many more families in Kenya today. So even though families are smaller, the total number of children continues to grow. Second, Kenyans are living longer, with better healthcare – for example, polio was eradicated in 2014. Life expectancy is projected to increase from 15 54 years today to 68 years by 2050. 28% of Kenya is urbanised, and is becoming rapidly more so. By the 2030s it is expected that 36% of Kenyans will live in towns or cities rather than the poorer rural areas. Rich countries are urban countries. No country has ever reached high income levels with low urbanisation. Large urban centres have two distinct economic advantages. First, as more 20 people interact, there is more scope for innovation. Young people need jobs, but they also create jobs. Kenya has an educated workforce and a dynamic service industry, which typically has lower barriers of entry than agriculture or manufacturing, and provides opportunities for young entrepreneurs. Second, larger groups of population living in close proximity allow for economies of scale. 25 In light of these facts, Kenya’s future pattern of population growth can be a force of good. A large urbanising and well‑educated population tends to generate a strong middle class and vibrant private sector. Economic development may be easier to achieve and sustain – though it is not guaranteed. (Source: adapted from https://www.economist.com/special‑report/2020/03/26/ africas‑population‑will‑double‑by‑2050 and https://kenya.unfpa.org/sites/default/files/pub‑pdf/state_of_kenya_population_ report_2020.pdf and https://www.worldbank.org/en/news/opinion/2010/04/28/ demographic‑transition‑growth‑kenya) Extract F Kenya has an absolute advantage in cut flowers In the UK, 80% of cut flowers come via the Netherlands, although a significant proportion come from Kenya. Some Kenyan flowers come straight to the UK on direct flights from Nairobi, where entire terminals at certain airports are dedicated to flights exporting flowers. 5 Kenya flower production has three major advantages over the Netherlands: areas of high altitude with cool nights, which many flowers benefit from, proximity to the equator for maximum hours of sunlight, and cheaper labour. This means an end to seasonal production and the beginning of a 365‑day‑a‑year absolute advantage. The Netherlands has cost advantages in machinery and transport equipment, not flowers. 10 Cut flowers are now Kenya’s second largest export after tea, contributing around 1% of the country’s GDP. They are also one of the country’s largest sources of employment, with over 100 000 people working directly in the flower industry and an estimated two million indirectly. (Source: adapted from: https://www.economist.com/middle‑east‑and‑africa/2021/02/11/ kenyas-floral‑exports‑are-blooming‑once‑more) Extract G Changes in interest rates in sub‑Saharan Africa When Robert Matsiko was a young man his grain‑milling business in eastern Africa was destroyed by fire. Now, after building it back up from the ashes, he is being hurt by high interest rates. To buy a new machine he must borrow from a bank at an annual rate of 22%. 'You fear to do that,' Mr Matsiko says. Many other entrepreneurs feel the same, 5 which stops their businesses from growing, although very small firms can get help from microfinance schemes. Kenya’s central bank rate has fallen from over 20% to 7% in the last decade, but the rates charged to small businesses and individuals are much higher than the central bank interest rate. In sub‑Saharan Africa, the gap between saving and borrowing rates 10 is higher than anywhere else. The average bank lends at 6.8% above the central bank interest rate. Mobile banking, credit‑information sharing and innovation have helped to bring borrowing costs down. But until birth rates fall, interest rates will stay relatively high, because families with many children cannot afford to save. (Source: adapted from https://www.economist.com/finance‑and‑economics/2020/05/21/ why-interest‑rates-are‑so-high‑in-africa)
(b) Examine two demographic factors influencing development in Kenya. (8)
June 2022 · Paper 3 · Q2(c) 12 marks AO1=2, AO2=2, AO3=4, AO4=4 12-mark response Hard globalisation and trade
Data and extracts for question 2Sub‑Saharan Africa – growth and development Figure 2: Kenya population, millions, 1960 to 2020 60 53.7 50 42.0 40 millions 32.0 30 23.7 20 16.4 11.3 8.1 10 0 1960 1970 1980 1990 2000 2010 2020 (Source: adapted from Population, total ‑ Kenya | Data (worldbank.org)) Extract D Growth and development in Africa: 'Africa has a massive opportunity as a low‑cost provider of services' The outlook for Africa’s economies is not as simple as the Lewis model of growth and development implies: do more manufacturing or stay poor. Many countries are expanding into areas that economists are starting to call 'industries without smoking 5 chimneys'. Some, such as flower‑exports, may not be classified as manufactured goods in export statistics. But the process of producing flowers looks a lot like factory work and demands many of the same management skills. These industries also deliver many of the benefits of normal manufacturing, including many well‑paid jobs, and greater opportunities. 10 (Source: adapted from https://www.economist.com/special‑report/2020/03/26/many‑of- africas-economies‑are‑doing‑well) Extract E The demography of Kenya – ‘Demography will shape Africa’s future’ Falling birth rates, when accompanied by rising literacy, can help kick‑start growth. In Kenya 39% of the population is below the age of 15, falling from 43% in 2009. The labour force (15–64 years) is 57% and is the fastest growing population group. 6% of the population is over the age of 60. The number of children per family has fallen sharply, 5 from 8.1 children in 1978 to 4.6 children in 2008, and it is projected to possibly reach 2.4 children by 2050. In the 1970s little more than half of children in sub‑Saharan Africa were enrolled in primary school. That share has shot up to almost 100%. The statistic is slightly misleading, since the percentage of children regularly attending schools is nearer 60%. 10 Why does Kenya’s population continue to rise rapidly, while family size declines? There are two reasons. First, due to high fertility in previous decades, there are many more families in Kenya today. So even though families are smaller, the total number of children continues to grow. Second, Kenyans are living longer, with better healthcare – for example, polio was eradicated in 2014. Life expectancy is projected to increase from 15 54 years today to 68 years by 2050. 28% of Kenya is urbanised, and is becoming rapidly more so. By the 2030s it is expected that 36% of Kenyans will live in towns or cities rather than the poorer rural areas. Rich countries are urban countries. No country has ever reached high income levels with low urbanisation. Large urban centres have two distinct economic advantages. First, as more 20 people interact, there is more scope for innovation. Young people need jobs, but they also create jobs. Kenya has an educated workforce and a dynamic service industry, which typically has lower barriers of entry than agriculture or manufacturing, and provides opportunities for young entrepreneurs. Second, larger groups of population living in close proximity allow for economies of scale. 25 In light of these facts, Kenya’s future pattern of population growth can be a force of good. A large urbanising and well‑educated population tends to generate a strong middle class and vibrant private sector. Economic development may be easier to achieve and sustain – though it is not guaranteed. (Source: adapted from https://www.economist.com/special‑report/2020/03/26/ africas‑population‑will‑double‑by‑2050 and https://kenya.unfpa.org/sites/default/files/pub‑pdf/state_of_kenya_population_ report_2020.pdf and https://www.worldbank.org/en/news/opinion/2010/04/28/ demographic‑transition‑growth‑kenya) Extract F Kenya has an absolute advantage in cut flowers In the UK, 80% of cut flowers come via the Netherlands, although a significant proportion come from Kenya. Some Kenyan flowers come straight to the UK on direct flights from Nairobi, where entire terminals at certain airports are dedicated to flights exporting flowers. 5 Kenya flower production has three major advantages over the Netherlands: areas of high altitude with cool nights, which many flowers benefit from, proximity to the equator for maximum hours of sunlight, and cheaper labour. This means an end to seasonal production and the beginning of a 365‑day‑a‑year absolute advantage. The Netherlands has cost advantages in machinery and transport equipment, not flowers. 10 Cut flowers are now Kenya’s second largest export after tea, contributing around 1% of the country’s GDP. They are also one of the country’s largest sources of employment, with over 100 000 people working directly in the flower industry and an estimated two million indirectly. (Source: adapted from: https://www.economist.com/middle‑east‑and‑africa/2021/02/11/ kenyas-floral‑exports‑are-blooming‑once‑more) Extract G Changes in interest rates in sub‑Saharan Africa When Robert Matsiko was a young man his grain‑milling business in eastern Africa was destroyed by fire. Now, after building it back up from the ashes, he is being hurt by high interest rates. To buy a new machine he must borrow from a bank at an annual rate of 22%. 'You fear to do that,' Mr Matsiko says. Many other entrepreneurs feel the same, 5 which stops their businesses from growing, although very small firms can get help from microfinance schemes. Kenya’s central bank rate has fallen from over 20% to 7% in the last decade, but the rates charged to small businesses and individuals are much higher than the central bank interest rate. In sub‑Saharan Africa, the gap between saving and borrowing rates 10 is higher than anywhere else. The average bank lends at 6.8% above the central bank interest rate. Mobile banking, credit‑information sharing and innovation have helped to bring borrowing costs down. But until birth rates fall, interest rates will stay relatively high, because families with many children cannot afford to save. (Source: adapted from https://www.economist.com/finance‑and‑economics/2020/05/21/ why-interest‑rates-are‑so-high‑in-africa)
(c) Using the example of cut flowers (Extract F), discuss how the concept of absolute advantage may lead to growth in Kenya. Use numerical or diagrammatic analysis in your answer. (12)
June 2022 · Paper 3 · Q2(d) 25 marks AO1=4, AO2=4, AO3=8, AO4=9 25-mark essay Either/or fiscal and monetary policyrevenues costs and profits
Data and extracts for question 2Sub‑Saharan Africa – growth and development Figure 2: Kenya population, millions, 1960 to 2020 60 53.7 50 42.0 40 millions 32.0 30 23.7 20 16.4 11.3 8.1 10 0 1960 1970 1980 1990 2000 2010 2020 (Source: adapted from Population, total ‑ Kenya | Data (worldbank.org)) Extract D Growth and development in Africa: 'Africa has a massive opportunity as a low‑cost provider of services' The outlook for Africa’s economies is not as simple as the Lewis model of growth and development implies: do more manufacturing or stay poor. Many countries are expanding into areas that economists are starting to call 'industries without smoking 5 chimneys'. Some, such as flower‑exports, may not be classified as manufactured goods in export statistics. But the process of producing flowers looks a lot like factory work and demands many of the same management skills. These industries also deliver many of the benefits of normal manufacturing, including many well‑paid jobs, and greater opportunities. 10 (Source: adapted from https://www.economist.com/special‑report/2020/03/26/many‑of- africas-economies‑are‑doing‑well) Extract E The demography of Kenya – ‘Demography will shape Africa’s future’ Falling birth rates, when accompanied by rising literacy, can help kick‑start growth. In Kenya 39% of the population is below the age of 15, falling from 43% in 2009. The labour force (15–64 years) is 57% and is the fastest growing population group. 6% of the population is over the age of 60. The number of children per family has fallen sharply, 5 from 8.1 children in 1978 to 4.6 children in 2008, and it is projected to possibly reach 2.4 children by 2050. In the 1970s little more than half of children in sub‑Saharan Africa were enrolled in primary school. That share has shot up to almost 100%. The statistic is slightly misleading, since the percentage of children regularly attending schools is nearer 60%. 10 Why does Kenya’s population continue to rise rapidly, while family size declines? There are two reasons. First, due to high fertility in previous decades, there are many more families in Kenya today. So even though families are smaller, the total number of children continues to grow. Second, Kenyans are living longer, with better healthcare – for example, polio was eradicated in 2014. Life expectancy is projected to increase from 15 54 years today to 68 years by 2050. 28% of Kenya is urbanised, and is becoming rapidly more so. By the 2030s it is expected that 36% of Kenyans will live in towns or cities rather than the poorer rural areas. Rich countries are urban countries. No country has ever reached high income levels with low urbanisation. Large urban centres have two distinct economic advantages. First, as more 20 people interact, there is more scope for innovation. Young people need jobs, but they also create jobs. Kenya has an educated workforce and a dynamic service industry, which typically has lower barriers of entry than agriculture or manufacturing, and provides opportunities for young entrepreneurs. Second, larger groups of population living in close proximity allow for economies of scale. 25 In light of these facts, Kenya’s future pattern of population growth can be a force of good. A large urbanising and well‑educated population tends to generate a strong middle class and vibrant private sector. Economic development may be easier to achieve and sustain – though it is not guaranteed. (Source: adapted from https://www.economist.com/special‑report/2020/03/26/ africas‑population‑will‑double‑by‑2050 and https://kenya.unfpa.org/sites/default/files/pub‑pdf/state_of_kenya_population_ report_2020.pdf and https://www.worldbank.org/en/news/opinion/2010/04/28/ demographic‑transition‑growth‑kenya) Extract F Kenya has an absolute advantage in cut flowers In the UK, 80% of cut flowers come via the Netherlands, although a significant proportion come from Kenya. Some Kenyan flowers come straight to the UK on direct flights from Nairobi, where entire terminals at certain airports are dedicated to flights exporting flowers. 5 Kenya flower production has three major advantages over the Netherlands: areas of high altitude with cool nights, which many flowers benefit from, proximity to the equator for maximum hours of sunlight, and cheaper labour. This means an end to seasonal production and the beginning of a 365‑day‑a‑year absolute advantage. The Netherlands has cost advantages in machinery and transport equipment, not flowers. 10 Cut flowers are now Kenya’s second largest export after tea, contributing around 1% of the country’s GDP. They are also one of the country’s largest sources of employment, with over 100 000 people working directly in the flower industry and an estimated two million indirectly. (Source: adapted from: https://www.economist.com/middle‑east‑and‑africa/2021/02/11/ kenyas-floral‑exports‑are-blooming‑once‑more) Extract G Changes in interest rates in sub‑Saharan Africa When Robert Matsiko was a young man his grain‑milling business in eastern Africa was destroyed by fire. Now, after building it back up from the ashes, he is being hurt by high interest rates. To buy a new machine he must borrow from a bank at an annual rate of 22%. 'You fear to do that,' Mr Matsiko says. Many other entrepreneurs feel the same, 5 which stops their businesses from growing, although very small firms can get help from microfinance schemes. Kenya’s central bank rate has fallen from over 20% to 7% in the last decade, but the rates charged to small businesses and individuals are much higher than the central bank interest rate. In sub‑Saharan Africa, the gap between saving and borrowing rates 10 is higher than anywhere else. The average bank lends at 6.8% above the central bank interest rate. Mobile banking, credit‑information sharing and innovation have helped to bring borrowing costs down. But until birth rates fall, interest rates will stay relatively high, because families with many children cannot afford to save. (Source: adapted from https://www.economist.com/finance‑and‑economics/2020/05/21/ why-interest‑rates-are‑so-high‑in-africa)
(d) Evaluate the microeconomic and macroeconomic effects of decreasing interest rates in Kenya, or another developing country of your choice. (25)
June 2022 · Paper 3 · Q2(e) 25 marks AO1=4, AO2=4, AO3=8, AO4=9 25-mark essay Either/or emerging and developing economies
Data and extracts for question 2Sub‑Saharan Africa – growth and development Figure 2: Kenya population, millions, 1960 to 2020 60 53.7 50 42.0 40 millions 32.0 30 23.7 20 16.4 11.3 8.1 10 0 1960 1970 1980 1990 2000 2010 2020 (Source: adapted from Population, total ‑ Kenya | Data (worldbank.org)) Extract D Growth and development in Africa: 'Africa has a massive opportunity as a low‑cost provider of services' The outlook for Africa’s economies is not as simple as the Lewis model of growth and development implies: do more manufacturing or stay poor. Many countries are expanding into areas that economists are starting to call 'industries without smoking 5 chimneys'. Some, such as flower‑exports, may not be classified as manufactured goods in export statistics. But the process of producing flowers looks a lot like factory work and demands many of the same management skills. These industries also deliver many of the benefits of normal manufacturing, including many well‑paid jobs, and greater opportunities. 10 (Source: adapted from https://www.economist.com/special‑report/2020/03/26/many‑of- africas-economies‑are‑doing‑well) Extract E The demography of Kenya – ‘Demography will shape Africa’s future’ Falling birth rates, when accompanied by rising literacy, can help kick‑start growth. In Kenya 39% of the population is below the age of 15, falling from 43% in 2009. The labour force (15–64 years) is 57% and is the fastest growing population group. 6% of the population is over the age of 60. The number of children per family has fallen sharply, 5 from 8.1 children in 1978 to 4.6 children in 2008, and it is projected to possibly reach 2.4 children by 2050. In the 1970s little more than half of children in sub‑Saharan Africa were enrolled in primary school. That share has shot up to almost 100%. The statistic is slightly misleading, since the percentage of children regularly attending schools is nearer 60%. 10 Why does Kenya’s population continue to rise rapidly, while family size declines? There are two reasons. First, due to high fertility in previous decades, there are many more families in Kenya today. So even though families are smaller, the total number of children continues to grow. Second, Kenyans are living longer, with better healthcare – for example, polio was eradicated in 2014. Life expectancy is projected to increase from 15 54 years today to 68 years by 2050. 28% of Kenya is urbanised, and is becoming rapidly more so. By the 2030s it is expected that 36% of Kenyans will live in towns or cities rather than the poorer rural areas. Rich countries are urban countries. No country has ever reached high income levels with low urbanisation. Large urban centres have two distinct economic advantages. First, as more 20 people interact, there is more scope for innovation. Young people need jobs, but they also create jobs. Kenya has an educated workforce and a dynamic service industry, which typically has lower barriers of entry than agriculture or manufacturing, and provides opportunities for young entrepreneurs. Second, larger groups of population living in close proximity allow for economies of scale. 25 In light of these facts, Kenya’s future pattern of population growth can be a force of good. A large urbanising and well‑educated population tends to generate a strong middle class and vibrant private sector. Economic development may be easier to achieve and sustain – though it is not guaranteed. (Source: adapted from https://www.economist.com/special‑report/2020/03/26/ africas‑population‑will‑double‑by‑2050 and https://kenya.unfpa.org/sites/default/files/pub‑pdf/state_of_kenya_population_ report_2020.pdf and https://www.worldbank.org/en/news/opinion/2010/04/28/ demographic‑transition‑growth‑kenya) Extract F Kenya has an absolute advantage in cut flowers In the UK, 80% of cut flowers come via the Netherlands, although a significant proportion come from Kenya. Some Kenyan flowers come straight to the UK on direct flights from Nairobi, where entire terminals at certain airports are dedicated to flights exporting flowers. 5 Kenya flower production has three major advantages over the Netherlands: areas of high altitude with cool nights, which many flowers benefit from, proximity to the equator for maximum hours of sunlight, and cheaper labour. This means an end to seasonal production and the beginning of a 365‑day‑a‑year absolute advantage. The Netherlands has cost advantages in machinery and transport equipment, not flowers. 10 Cut flowers are now Kenya’s second largest export after tea, contributing around 1% of the country’s GDP. They are also one of the country’s largest sources of employment, with over 100 000 people working directly in the flower industry and an estimated two million indirectly. (Source: adapted from: https://www.economist.com/middle‑east‑and‑africa/2021/02/11/ kenyas-floral‑exports‑are-blooming‑once‑more) Extract G Changes in interest rates in sub‑Saharan Africa When Robert Matsiko was a young man his grain‑milling business in eastern Africa was destroyed by fire. Now, after building it back up from the ashes, he is being hurt by high interest rates. To buy a new machine he must borrow from a bank at an annual rate of 22%. 'You fear to do that,' Mr Matsiko says. Many other entrepreneurs feel the same, 5 which stops their businesses from growing, although very small firms can get help from microfinance schemes. Kenya’s central bank rate has fallen from over 20% to 7% in the last decade, but the rates charged to small businesses and individuals are much higher than the central bank interest rate. In sub‑Saharan Africa, the gap between saving and borrowing rates 10 is higher than anywhere else. The average bank lends at 6.8% above the central bank interest rate. Mobile banking, credit‑information sharing and innovation have helped to bring borrowing costs down. But until birth rates fall, interest rates will stay relatively high, because families with many children cannot afford to save. (Source: adapted from https://www.economist.com/finance‑and‑economics/2020/05/21/ why-interest‑rates-are‑so-high‑in-africa)
(e) Evaluate the microeconomic and macroeconomic strategies that could be used to promote development in Kenya, or another developing country of your choice. (25)
November 2021 · Paper 1 · Q1(b) 4 marks AO1=2, AO2=1, AO3=1 Short answer labour market
Data and extracts for question 11 Statement 1: Since Poland joined the European Union (EU) in 2004, over one million of its workforce have migrated to other countries in the EU. Statement 2: Many engineers have left Poland for higher paid jobs in other countries in the EU. (Source: https://www.forbes.com/sites/freylindsay/2019/08/09/polands-emigration-rate-is- falling-but-people-are-still-worried-about-the-brain-drain-bogeyman/#9550525792e6)
(b) Explain the likely impact of migration on the wage level of engineers in Poland. (4)
November 2021 · Paper 1 · Q2(a) 4 marks AO1=2, AO2=2 Diagram supply and demand
Data and extracts for question 22 Cobalt is a key metal used in the batteries of electric cars. China is the world’s largest producer of electric cars but has recently cut subsidies to its manufacturers. The Democratic Republic of the Congo (DRC) produces more than 60% of the world’s supply of cobalt, from its small-scale mines. Many new small mines opened in 2018 as a result of improved expectations of profit. The following graph shows the price of cobalt between June 2018 and June 2019. 45 40 35 30 $ per pound 25 weight 20 (454 grams) 15 10 5 0 June 2018 June 2019
(a) With reference to the information provided, draw a supply and demand diagram to show why the price of cobalt fell between June 2018 and June 2019. (4)
November 2021 · Paper 1 · Q3(a) 4 marks AO1=2, AO2=2 Diagram monopoly
Data and extracts for question 33 River Island is a clothing retailer. Students are offered a River Island student discount code to benefit from a 10% price reduction as an attempt by the firm to increase profit.
(a) Complete the third-degree price discrimination diagram below. Draw the impact on each sub-market by showing the price and profit. (4) Students (a) Non-students (b) Pricea Priceb AC = MC ARa ARb MRb MRa 0 0 Quantitya Quantityb of clothing of clothing
November 2021 · Paper 1 · Q4(a) 2 marks AO2=2 Calculation revenues costs and profits
Data and extracts for question 44 Patrick Street Productions produces musicals. Its latest production is ‘It’s a Wonderful Life’ and the total cost of this production is $200 000. The ticket price is $40. The theatre has a capacity of 300 seats. The company aims for revenue maximisation. If this is achieved, revenue from ticket sales will cover 30% of total costs. Charitable donations contribute 12.5% towards total cost and a government subsidy ensures the production covers all of its costs. (Source adapted from: https://www.cbc.ca/news/canada/british-columbia/a-bit-of- a-desperate-time-as-costs-rise-professional-theatre-companies-survive-rather-than- thrive-1.5489733)
(a) Calculate the total revenue from ticket sales for ‘It’s a Wonderful Life’, assuming it is shown only five times, all at full capacity. You are advised to show your working. (2)
November 2021 · Paper 1 · Q4(b) 2 marks AO2=2 Calculation indirect taxes and subsidies
Data and extracts for question 44 Patrick Street Productions produces musicals. Its latest production is ‘It’s a Wonderful Life’ and the total cost of this production is $200 000. The ticket price is $40. The theatre has a capacity of 300 seats. The company aims for revenue maximisation. If this is achieved, revenue from ticket sales will cover 30% of total costs. Charitable donations contribute 12.5% towards total cost and a government subsidy ensures the production covers all of its costs. (Source adapted from: https://www.cbc.ca/news/canada/british-columbia/a-bit-of- a-desperate-time-as-costs-rise-professional-theatre-companies-survive-rather-than- thrive-1.5489733)
(b) Calculate the value of the government subsidy necessary for this production to cover all of its costs. (2)
November 2021 · Paper 1 · Q5(a) 4 marks AO1=2, AO2=2 Diagram market structures and efficiency
Data and extracts for question 55 In Sicily, many households can grow lemons of the same quality as each other. Chiara decides to sell lemons at her local market, expecting to make a normal profit. She notices that all of the many lemon sellers are charging exactly the same price.
(a) Draw diagrams showing the equilibrium positions for both the lemon market and a typical firm in the long run. (4) Firm Market
November 2021 · Paper 1 · Q6(a) 5 marks AO1=1, AO2=2, AO3=2 Short answer revenues costs and profits
Data and extracts for question 6The travel and tourism industry Figure 1: Package holiday market share of the six largest providers, booked by UK residents, 2019 TUI 29% Jet2 16% Thomas Cook 13% Expedia 8% On The Beach 6% BA Holidays 4% (Source adapted from: https://knowledge.sharescope.co.uk/2019/10/16/finding-companies- that-control-their-own-destinies/The Times/ATOL) Figure 2: Jet2 package holiday prices to Sorrento Price 12 hours after Thomas Cook shutdown Price before Thomas Cook shutdown 2 Adults for 7 Nights from Monday 25 May 2020 2 Adults for 7 Nights from Monday 25 May 2020 Half Board Half Board 1 x Premium Double or Twin room 1 x Premium Double or Twin room Return flights from Edinburgh Return flights from Edinburgh View flight times View flight times 22 kg Bag Allowance 22 kg Bag Allowance 10 kg Hand Baggage 10 kg Hand Baggage ATOL Protected ATOL Protected Coach Transfers Coach Transfers Holiday price from £1,576 Per person price Holiday price from £1,648 Per person price £788 £824 Data accessed: 22nd and 23rd September 2019 Extract A Marginal productivity of cabin crew Cabin crew are responsible for loading passengers and providing in-flight meals. United Airlines is planning to reduce the number of its cabin crew members onboard international flights. The airline currently operates its planes with one more cabin crew member than its competitors. The marginal productivity of this additional crew member 5 may be low. By reducing the number of its cabin crew members United Airlines will be able to operate more efficiently and compete more effectively. (Source adapted from: https://simpleflying.com/united-airlines-to-reduce-number-of-crew- on-international-flights/) Extract B Thomas Cook’s environmental impact Thomas Cook Group plc’s operations included its airline and 560 high street travel agents providing flights, hotels and package holidays. The environmental impact of the travel industry is significant. It accounts for 8% of all global carbon emissions. Thomas Cook recognised the risks presented by climate change 5 and actively engaged in reducing their airline emissions. Its plans included using more efficient aircraft and using lower-carbon fuel. In 2018, Thomas Cook was included in the top 10 of the world’s most fuel-efficient airlines. (Source adapted from: https://www.thomascookgroup.com/investors/insight_external_ assest/Thomas+Cook+Sustainability+Report+2018.pdf) Extract C Why did Thomas Cook shut down? Thomas Cook Group plc ceased trading on 23 September 2019. The collapse of Thomas Cook left 600 000 travellers stranded overseas and approximately 21 000 worldwide employees were left without a job. Thomas Cook’s management said that the failure of rescue talks between banks, 5 shareholders and the UK Government meant it had no choice but to shut down the business. But in truth the tour operator’s problems go back much further. A disastrous merger in 2007, increased debts, the internet revolution in holiday booking and Brexit uncertainty all contributed to the failure of the business. 10 In 2007 it merged with MyTravel. Thomas Cook directors had an objective of rapid company growth over short-term profitability. The merger was supposed to create a European giant, promising £75 million-a-year cost savings and a springboard to challenge emerging internet rivals. In reality, Thomas Cook was merging with a company that had only made a profit once in the previous six years, and the deal left the Group 15 with huge debts. In May 2019, the firm reported a £1.5 billion loss. The role of the management in Thomas Cook’s collapse is being investigated by the UK Government. Thomas Cook executives’ salaries and bonuses have been questioned. Directors received salaries totalling £20 million in the five years before its collapse. The Chief Executive Officer (CEO) earned a £500 000 cash bonus in 2017 and about 20 £8.5 million in his five years with the company. It seems that around £4 million of this was in the form of shares. The share price reached £1.46 in 2018, but each share is now worthless. The CEO said that the directors had worked “exhaustively” to rescue Thomas Cook and create a long-term turnaround strategy. “It is a matter of profound regret to me and the 25 rest of the board that we were not successful.” The UK prime minister admitted that the government refused to grant £150 million as a subsidy to help rescue Thomas Cook in the short run. The UK prime minister stated: “Clearly, that is a lot of taxpayers’ money and sets up, as people will appreciate, a moral hazard in the case of future such commercial difficulties that companies face. I have 30 questions about whether it’s right that the directors, or whoever, the board, should pay themselves large sums when businesses can go down the tubes like that. One is driven to reflect on whether the directors of these companies are properly incentivised to sort such matters out”. (Source adapted from: https://www.theguardian.com/business/2019/sep/23/thomas-cook- as-the-world-turned-the-sun-ceased-to-shine-on-venerable-tour-operator and https://www.ft.com/content/a7dd2554-de23-11e9-b112-9624ec9edc59)
(a) Explain the likely impact of diminishing marginal productivity of labour on cabin crew staffing levels. Refer to Extract A in your answer. (5)
November 2021 · Paper 1 · Q6(b) 8 marks AO1=2, AO2=2, AO3=2, AO4=2 8-mark response externalities
Data and extracts for question 6The travel and tourism industry Figure 1: Package holiday market share of the six largest providers, booked by UK residents, 2019 TUI 29% Jet2 16% Thomas Cook 13% Expedia 8% On The Beach 6% BA Holidays 4% (Source adapted from: https://knowledge.sharescope.co.uk/2019/10/16/finding-companies- that-control-their-own-destinies/The Times/ATOL) Figure 2: Jet2 package holiday prices to Sorrento Price 12 hours after Thomas Cook shutdown Price before Thomas Cook shutdown 2 Adults for 7 Nights from Monday 25 May 2020 2 Adults for 7 Nights from Monday 25 May 2020 Half Board Half Board 1 x Premium Double or Twin room 1 x Premium Double or Twin room Return flights from Edinburgh Return flights from Edinburgh View flight times View flight times 22 kg Bag Allowance 22 kg Bag Allowance 10 kg Hand Baggage 10 kg Hand Baggage ATOL Protected ATOL Protected Coach Transfers Coach Transfers Holiday price from £1,576 Per person price Holiday price from £1,648 Per person price £788 £824 Data accessed: 22nd and 23rd September 2019 Extract A Marginal productivity of cabin crew Cabin crew are responsible for loading passengers and providing in-flight meals. United Airlines is planning to reduce the number of its cabin crew members onboard international flights. The airline currently operates its planes with one more cabin crew member than its competitors. The marginal productivity of this additional crew member 5 may be low. By reducing the number of its cabin crew members United Airlines will be able to operate more efficiently and compete more effectively. (Source adapted from: https://simpleflying.com/united-airlines-to-reduce-number-of-crew- on-international-flights/) Extract B Thomas Cook’s environmental impact Thomas Cook Group plc’s operations included its airline and 560 high street travel agents providing flights, hotels and package holidays. The environmental impact of the travel industry is significant. It accounts for 8% of all global carbon emissions. Thomas Cook recognised the risks presented by climate change 5 and actively engaged in reducing their airline emissions. Its plans included using more efficient aircraft and using lower-carbon fuel. In 2018, Thomas Cook was included in the top 10 of the world’s most fuel-efficient airlines. (Source adapted from: https://www.thomascookgroup.com/investors/insight_external_ assest/Thomas+Cook+Sustainability+Report+2018.pdf) Extract C Why did Thomas Cook shut down? Thomas Cook Group plc ceased trading on 23 September 2019. The collapse of Thomas Cook left 600 000 travellers stranded overseas and approximately 21 000 worldwide employees were left without a job. Thomas Cook’s management said that the failure of rescue talks between banks, 5 shareholders and the UK Government meant it had no choice but to shut down the business. But in truth the tour operator’s problems go back much further. A disastrous merger in 2007, increased debts, the internet revolution in holiday booking and Brexit uncertainty all contributed to the failure of the business. 10 In 2007 it merged with MyTravel. Thomas Cook directors had an objective of rapid company growth over short-term profitability. The merger was supposed to create a European giant, promising £75 million-a-year cost savings and a springboard to challenge emerging internet rivals. In reality, Thomas Cook was merging with a company that had only made a profit once in the previous six years, and the deal left the Group 15 with huge debts. In May 2019, the firm reported a £1.5 billion loss. The role of the management in Thomas Cook’s collapse is being investigated by the UK Government. Thomas Cook executives’ salaries and bonuses have been questioned. Directors received salaries totalling £20 million in the five years before its collapse. The Chief Executive Officer (CEO) earned a £500 000 cash bonus in 2017 and about 20 £8.5 million in his five years with the company. It seems that around £4 million of this was in the form of shares. The share price reached £1.46 in 2018, but each share is now worthless. The CEO said that the directors had worked “exhaustively” to rescue Thomas Cook and create a long-term turnaround strategy. “It is a matter of profound regret to me and the 25 rest of the board that we were not successful.” The UK prime minister admitted that the government refused to grant £150 million as a subsidy to help rescue Thomas Cook in the short run. The UK prime minister stated: “Clearly, that is a lot of taxpayers’ money and sets up, as people will appreciate, a moral hazard in the case of future such commercial difficulties that companies face. I have 30 questions about whether it’s right that the directors, or whoever, the board, should pay themselves large sums when businesses can go down the tubes like that. One is driven to reflect on whether the directors of these companies are properly incentivised to sort such matters out”. (Source adapted from: https://www.theguardian.com/business/2019/sep/23/thomas-cook- as-the-world-turned-the-sun-ceased-to-shine-on-venerable-tour-operator and https://www.ft.com/content/a7dd2554-de23-11e9-b112-9624ec9edc59)
(b) Examine the likely impact of Thomas Cook’s plan ‘to reduce their airline emissions’ (Extract B, line 6) on the social optimum position. Use an appropriate externalities diagram in your answer. (8)
November 2021 · Paper 1 · Q6(c) 10 marks AO1=2, AO2=2, AO3=2, AO4=4 10-mark response business growth and objectives
Data and extracts for question 6The travel and tourism industry Figure 1: Package holiday market share of the six largest providers, booked by UK residents, 2019 TUI 29% Jet2 16% Thomas Cook 13% Expedia 8% On The Beach 6% BA Holidays 4% (Source adapted from: https://knowledge.sharescope.co.uk/2019/10/16/finding-companies- that-control-their-own-destinies/The Times/ATOL) Figure 2: Jet2 package holiday prices to Sorrento Price 12 hours after Thomas Cook shutdown Price before Thomas Cook shutdown 2 Adults for 7 Nights from Monday 25 May 2020 2 Adults for 7 Nights from Monday 25 May 2020 Half Board Half Board 1 x Premium Double or Twin room 1 x Premium Double or Twin room Return flights from Edinburgh Return flights from Edinburgh View flight times View flight times 22 kg Bag Allowance 22 kg Bag Allowance 10 kg Hand Baggage 10 kg Hand Baggage ATOL Protected ATOL Protected Coach Transfers Coach Transfers Holiday price from £1,576 Per person price Holiday price from £1,648 Per person price £788 £824 Data accessed: 22nd and 23rd September 2019 Extract A Marginal productivity of cabin crew Cabin crew are responsible for loading passengers and providing in-flight meals. United Airlines is planning to reduce the number of its cabin crew members onboard international flights. The airline currently operates its planes with one more cabin crew member than its competitors. The marginal productivity of this additional crew member 5 may be low. By reducing the number of its cabin crew members United Airlines will be able to operate more efficiently and compete more effectively. (Source adapted from: https://simpleflying.com/united-airlines-to-reduce-number-of-crew- on-international-flights/) Extract B Thomas Cook’s environmental impact Thomas Cook Group plc’s operations included its airline and 560 high street travel agents providing flights, hotels and package holidays. The environmental impact of the travel industry is significant. It accounts for 8% of all global carbon emissions. Thomas Cook recognised the risks presented by climate change 5 and actively engaged in reducing their airline emissions. Its plans included using more efficient aircraft and using lower-carbon fuel. In 2018, Thomas Cook was included in the top 10 of the world’s most fuel-efficient airlines. (Source adapted from: https://www.thomascookgroup.com/investors/insight_external_ assest/Thomas+Cook+Sustainability+Report+2018.pdf) Extract C Why did Thomas Cook shut down? Thomas Cook Group plc ceased trading on 23 September 2019. The collapse of Thomas Cook left 600 000 travellers stranded overseas and approximately 21 000 worldwide employees were left without a job. Thomas Cook’s management said that the failure of rescue talks between banks, 5 shareholders and the UK Government meant it had no choice but to shut down the business. But in truth the tour operator’s problems go back much further. A disastrous merger in 2007, increased debts, the internet revolution in holiday booking and Brexit uncertainty all contributed to the failure of the business. 10 In 2007 it merged with MyTravel. Thomas Cook directors had an objective of rapid company growth over short-term profitability. The merger was supposed to create a European giant, promising £75 million-a-year cost savings and a springboard to challenge emerging internet rivals. In reality, Thomas Cook was merging with a company that had only made a profit once in the previous six years, and the deal left the Group 15 with huge debts. In May 2019, the firm reported a £1.5 billion loss. The role of the management in Thomas Cook’s collapse is being investigated by the UK Government. Thomas Cook executives’ salaries and bonuses have been questioned. Directors received salaries totalling £20 million in the five years before its collapse. The Chief Executive Officer (CEO) earned a £500 000 cash bonus in 2017 and about 20 £8.5 million in his five years with the company. It seems that around £4 million of this was in the form of shares. The share price reached £1.46 in 2018, but each share is now worthless. The CEO said that the directors had worked “exhaustively” to rescue Thomas Cook and create a long-term turnaround strategy. “It is a matter of profound regret to me and the 25 rest of the board that we were not successful.” The UK prime minister admitted that the government refused to grant £150 million as a subsidy to help rescue Thomas Cook in the short run. The UK prime minister stated: “Clearly, that is a lot of taxpayers’ money and sets up, as people will appreciate, a moral hazard in the case of future such commercial difficulties that companies face. I have 30 questions about whether it’s right that the directors, or whoever, the board, should pay themselves large sums when businesses can go down the tubes like that. One is driven to reflect on whether the directors of these companies are properly incentivised to sort such matters out”. (Source adapted from: https://www.theguardian.com/business/2019/sep/23/thomas-cook- as-the-world-turned-the-sun-ceased-to-shine-on-venerable-tour-operator and https://www.ft.com/content/a7dd2554-de23-11e9-b112-9624ec9edc59)
(c) With reference to Extract C, assess whether Thomas Cook’s failure was caused by the principal-agent problem. (10)
November 2021 · Paper 1 · Q6(d) 12 marks AO1=2, AO2=2, AO3=4, AO4=4 12-mark response revenues costs and profitsgovernment intervention in markets
Data and extracts for question 6The travel and tourism industry Figure 1: Package holiday market share of the six largest providers, booked by UK residents, 2019 TUI 29% Jet2 16% Thomas Cook 13% Expedia 8% On The Beach 6% BA Holidays 4% (Source adapted from: https://knowledge.sharescope.co.uk/2019/10/16/finding-companies- that-control-their-own-destinies/The Times/ATOL) Figure 2: Jet2 package holiday prices to Sorrento Price 12 hours after Thomas Cook shutdown Price before Thomas Cook shutdown 2 Adults for 7 Nights from Monday 25 May 2020 2 Adults for 7 Nights from Monday 25 May 2020 Half Board Half Board 1 x Premium Double or Twin room 1 x Premium Double or Twin room Return flights from Edinburgh Return flights from Edinburgh View flight times View flight times 22 kg Bag Allowance 22 kg Bag Allowance 10 kg Hand Baggage 10 kg Hand Baggage ATOL Protected ATOL Protected Coach Transfers Coach Transfers Holiday price from £1,576 Per person price Holiday price from £1,648 Per person price £788 £824 Data accessed: 22nd and 23rd September 2019 Extract A Marginal productivity of cabin crew Cabin crew are responsible for loading passengers and providing in-flight meals. United Airlines is planning to reduce the number of its cabin crew members onboard international flights. The airline currently operates its planes with one more cabin crew member than its competitors. The marginal productivity of this additional crew member 5 may be low. By reducing the number of its cabin crew members United Airlines will be able to operate more efficiently and compete more effectively. (Source adapted from: https://simpleflying.com/united-airlines-to-reduce-number-of-crew- on-international-flights/) Extract B Thomas Cook’s environmental impact Thomas Cook Group plc’s operations included its airline and 560 high street travel agents providing flights, hotels and package holidays. The environmental impact of the travel industry is significant. It accounts for 8% of all global carbon emissions. Thomas Cook recognised the risks presented by climate change 5 and actively engaged in reducing their airline emissions. Its plans included using more efficient aircraft and using lower-carbon fuel. In 2018, Thomas Cook was included in the top 10 of the world’s most fuel-efficient airlines. (Source adapted from: https://www.thomascookgroup.com/investors/insight_external_ assest/Thomas+Cook+Sustainability+Report+2018.pdf) Extract C Why did Thomas Cook shut down? Thomas Cook Group plc ceased trading on 23 September 2019. The collapse of Thomas Cook left 600 000 travellers stranded overseas and approximately 21 000 worldwide employees were left without a job. Thomas Cook’s management said that the failure of rescue talks between banks, 5 shareholders and the UK Government meant it had no choice but to shut down the business. But in truth the tour operator’s problems go back much further. A disastrous merger in 2007, increased debts, the internet revolution in holiday booking and Brexit uncertainty all contributed to the failure of the business. 10 In 2007 it merged with MyTravel. Thomas Cook directors had an objective of rapid company growth over short-term profitability. The merger was supposed to create a European giant, promising £75 million-a-year cost savings and a springboard to challenge emerging internet rivals. In reality, Thomas Cook was merging with a company that had only made a profit once in the previous six years, and the deal left the Group 15 with huge debts. In May 2019, the firm reported a £1.5 billion loss. The role of the management in Thomas Cook’s collapse is being investigated by the UK Government. Thomas Cook executives’ salaries and bonuses have been questioned. Directors received salaries totalling £20 million in the five years before its collapse. The Chief Executive Officer (CEO) earned a £500 000 cash bonus in 2017 and about 20 £8.5 million in his five years with the company. It seems that around £4 million of this was in the form of shares. The share price reached £1.46 in 2018, but each share is now worthless. The CEO said that the directors had worked “exhaustively” to rescue Thomas Cook and create a long-term turnaround strategy. “It is a matter of profound regret to me and the 25 rest of the board that we were not successful.” The UK prime minister admitted that the government refused to grant £150 million as a subsidy to help rescue Thomas Cook in the short run. The UK prime minister stated: “Clearly, that is a lot of taxpayers’ money and sets up, as people will appreciate, a moral hazard in the case of future such commercial difficulties that companies face. I have 30 questions about whether it’s right that the directors, or whoever, the board, should pay themselves large sums when businesses can go down the tubes like that. One is driven to reflect on whether the directors of these companies are properly incentivised to sort such matters out”. (Source adapted from: https://www.theguardian.com/business/2019/sep/23/thomas-cook- as-the-world-turned-the-sun-ceased-to-shine-on-venerable-tour-operator and https://www.ft.com/content/a7dd2554-de23-11e9-b112-9624ec9edc59)
(d) With reference to Extract C, discuss the proposed government subsidy to prevent Thomas Cook from reaching its shut-down point. (12)
November 2021 · Paper 1 · Q6(e) 15 marks AO1=3, AO2=3, AO3=3, AO4=6 15-mark response oligopolymonopoly
Data and extracts for question 6The travel and tourism industry Figure 1: Package holiday market share of the six largest providers, booked by UK residents, 2019 TUI 29% Jet2 16% Thomas Cook 13% Expedia 8% On The Beach 6% BA Holidays 4% (Source adapted from: https://knowledge.sharescope.co.uk/2019/10/16/finding-companies- that-control-their-own-destinies/The Times/ATOL) Figure 2: Jet2 package holiday prices to Sorrento Price 12 hours after Thomas Cook shutdown Price before Thomas Cook shutdown 2 Adults for 7 Nights from Monday 25 May 2020 2 Adults for 7 Nights from Monday 25 May 2020 Half Board Half Board 1 x Premium Double or Twin room 1 x Premium Double or Twin room Return flights from Edinburgh Return flights from Edinburgh View flight times View flight times 22 kg Bag Allowance 22 kg Bag Allowance 10 kg Hand Baggage 10 kg Hand Baggage ATOL Protected ATOL Protected Coach Transfers Coach Transfers Holiday price from £1,576 Per person price Holiday price from £1,648 Per person price £788 £824 Data accessed: 22nd and 23rd September 2019 Extract A Marginal productivity of cabin crew Cabin crew are responsible for loading passengers and providing in-flight meals. United Airlines is planning to reduce the number of its cabin crew members onboard international flights. The airline currently operates its planes with one more cabin crew member than its competitors. The marginal productivity of this additional crew member 5 may be low. By reducing the number of its cabin crew members United Airlines will be able to operate more efficiently and compete more effectively. (Source adapted from: https://simpleflying.com/united-airlines-to-reduce-number-of-crew- on-international-flights/) Extract B Thomas Cook’s environmental impact Thomas Cook Group plc’s operations included its airline and 560 high street travel agents providing flights, hotels and package holidays. The environmental impact of the travel industry is significant. It accounts for 8% of all global carbon emissions. Thomas Cook recognised the risks presented by climate change 5 and actively engaged in reducing their airline emissions. Its plans included using more efficient aircraft and using lower-carbon fuel. In 2018, Thomas Cook was included in the top 10 of the world’s most fuel-efficient airlines. (Source adapted from: https://www.thomascookgroup.com/investors/insight_external_ assest/Thomas+Cook+Sustainability+Report+2018.pdf) Extract C Why did Thomas Cook shut down? Thomas Cook Group plc ceased trading on 23 September 2019. The collapse of Thomas Cook left 600 000 travellers stranded overseas and approximately 21 000 worldwide employees were left without a job. Thomas Cook’s management said that the failure of rescue talks between banks, 5 shareholders and the UK Government meant it had no choice but to shut down the business. But in truth the tour operator’s problems go back much further. A disastrous merger in 2007, increased debts, the internet revolution in holiday booking and Brexit uncertainty all contributed to the failure of the business. 10 In 2007 it merged with MyTravel. Thomas Cook directors had an objective of rapid company growth over short-term profitability. The merger was supposed to create a European giant, promising £75 million-a-year cost savings and a springboard to challenge emerging internet rivals. In reality, Thomas Cook was merging with a company that had only made a profit once in the previous six years, and the deal left the Group 15 with huge debts. In May 2019, the firm reported a £1.5 billion loss. The role of the management in Thomas Cook’s collapse is being investigated by the UK Government. Thomas Cook executives’ salaries and bonuses have been questioned. Directors received salaries totalling £20 million in the five years before its collapse. The Chief Executive Officer (CEO) earned a £500 000 cash bonus in 2017 and about 20 £8.5 million in his five years with the company. It seems that around £4 million of this was in the form of shares. The share price reached £1.46 in 2018, but each share is now worthless. The CEO said that the directors had worked “exhaustively” to rescue Thomas Cook and create a long-term turnaround strategy. “It is a matter of profound regret to me and the 25 rest of the board that we were not successful.” The UK prime minister admitted that the government refused to grant £150 million as a subsidy to help rescue Thomas Cook in the short run. The UK prime minister stated: “Clearly, that is a lot of taxpayers’ money and sets up, as people will appreciate, a moral hazard in the case of future such commercial difficulties that companies face. I have 30 questions about whether it’s right that the directors, or whoever, the board, should pay themselves large sums when businesses can go down the tubes like that. One is driven to reflect on whether the directors of these companies are properly incentivised to sort such matters out”. (Source adapted from: https://www.theguardian.com/business/2019/sep/23/thomas-cook- as-the-world-turned-the-sun-ceased-to-shine-on-venerable-tour-operator and https://www.ft.com/content/a7dd2554-de23-11e9-b112-9624ec9edc59)
(e) With reference to the information provided, discuss the decision by Jet2 to increase its package holiday prices. (15)
November 2021 · Paper 2 · Q1(b) 2 marks AO2=2 Calculation national income and the multiplier
Data and extracts for question 11 After the Global Financial Crisis of 2008, the US President introduced expansionary fiscal policies of $800 billion. The International Monetary Fund estimated that the multiplier at the time was approximately 1.5. (Source adapted from: https://www.economist.com/the-economist-explains/2016/09/07/ what-is-the-keynesian-multiplier)
(b) Calculate the total final increase in US aggregate demand as a result of the President’s ‘expansionary fiscal policies’, assuming no other changes. (2)
November 2021 · Paper 2 · Q3(b) 4 marks AO1=2, AO2=1, AO3=1 Short answer exchange ratesbalance of payments
Data and extracts for question 33 British pound to US dollar exchange rate (value of one pound in dollars), June 2017 to June 2019. 1.40 1.35 Value of one pound in dollars 1.30 1.25 1.20 1st Jan 2018 1st Jan 2019 (Source adapted from: https://www.xe.com/currencycharts/?from=GBP&to=USD&view=2Y)
(b) Explain the likely impact of the change in the exchange rate of the pound shown in the graph from 1st January 2018 to 1st January 2019 on the UK current account of the balance of payments. (4)
November 2021 · Paper 2 · Q4(a) 4 marks AO1=2, AO2=1, AO3=1 Short answer aggregate supply
Data and extracts for question 44 A number of business groups have signed an open letter to the UK Government asking it to commit to delivering the full High Speed 2 rail link. This will connect London to the northern cities of Manchester and Leeds at a cost of £56 billion and reduce journey times by as much as 50%. (Source adapted from: https://www.theguardian.com/uk-news/2019/jun/22/business-heads- urge-next-pm-to-commit-to-finishing-hs2)
(a) Explain one likely impact of this project on aggregate supply in the UK. (4)
November 2021 · Paper 2 · Q5(b) 2 marks AO2=2 Calculation measuring economic growth
Data and extracts for question 55 GDP at Purchasing Power Parities, Germany and France (nominal, trillions of US dollars) 2010–2017. 4.50 3 . 90 4.00 3 . 76 3 . 75 3 . 69 3 . 54 3 . 50 3 . 41 3 . 38 3.50 2 . 86 3.00 2 . 85 2 . 81 2. 64 2 . 68 2 . 58 2 . 47 2 . 43 2.50 US$ trillions 2.00 1.50 1.00 0.50 0.00 2010 2011 2012 2013 2014 2015 2016 2017 Germany France (Source: https://data.worldbank.org/indicator/NY.GDP.MKTP.CD?end=2017&locations=DE&st art=1970&view=chart)
(b) Calculate the percentage change in Germany’s nominal GDP from 2016 to 2017. (2)
November 2021 · Paper 2 · Q6(a) 5 marks AO1=1, AO2=2, AO3=2 Calculation emerging and developing economies
Data and extracts for question 6Trade and aid in Rwanda Figure 1: Aid funding received by Rwanda (per capita, US dollars), 2008 to 2018 125 123 120 115 110 105 US dollars 100 95 90 85 83 80 0 2008 2009 2010 2011 2012 2013 2014 2015 2016 2017 2018 (Source adapted from: data.worldbank.org) Figure 2: Population of Rwanda (millions), 2008 to 2018 12.5 12.0 11.5 11.0 Millions 10.5 10.0 9.5 0 2008 2009 2010 2011 2012 2013 2014 2015 2016 2017 2018 (Source adapted from: https://tradingeconomics.com/rwanda/population) Figure 3: Rwanda real GDP annual percentage growth rate, 2008 to 2018 12 11 10 9 8 % 7 6 5 4 0 2008 2009 2010 2011 2012 2013 2014 2015 2016 2017 2018 (Source adapted from: African Development Bank Statistics accessed April 2020) Extract A Rwandan tariffs on imports of used clothing In a market in Kigali, Rwanda’s capital, an auction is under way. Sellers offer crumpled T-shirts and faded jeans; traders argue over the best picks. Everything is second-hand. A Tommy Hilfiger shirt sells for 5 000 Rwandan francs ($5.82); a plain one for a tenth of that. Afterwards, a trader sorts through the purchases he will resell in his home village. 5 The logos hint at their previous lives: Kent State University, a rotary club in Pennsylvania, Number One Dad. These auctions were once twice as busy, but in 2016 Rwanda’s government increased import tariffs on a kilo of used clothes from $0.20 to $2.50. Now many traders struggle to make a profit. The traders are not the only ones who are unhappy. Exporters in the US 10 claim the tariffs are costing jobs there. In March, the US President warned that he would suspend Rwanda’s tariff-free access to US markets for its clothing exports after 60 days if it did not remove the tariff. Globally, about $4 billion of used clothes crossed borders in 2016. The share from China and South Korea is growing, but 70% still come from Europe and North America. Many 15 go to Asia and eastern Europe, but Africa remains the largest market. The trade enables poor people to afford clothes and creates retail jobs. However, governments worry that the trade undercuts their own clothing manufacturers. Second-hand imports of clothing now dominate African markets. Researchers at the Overseas Development Institute, a British think-tank, estimate that Tanzania imports 20 540 million used items of clothing and 180 million new ones each year, while producing fewer than 20 million itself. African manufacturing is weak for many reasons, from ineffective privatisations to collapsing infrastructure. But second-hand clothing imports are a major factor: it is estimated that they accounted for half of the fall in employment in the African clothing industry between 1981 and 2000. 25 For example, a clothing factory in Kigali is operating at only 40% of capacity and employs 600 workers, down from 1 100 in the 1990s. It is hard to compete, says Ritesh Patel, its manager, when a used imported T-shirt sells for the price of a bottle of water. Instead, the company specialises in uniforms for police, soldiers and security guards, which cannot be bought second-hand. 30 The threatened suspension of tariff-free access to the US market would hurt Rwanda, but not very much. Last year Rwanda sold just $1.5 million of clothing to the US. Nor, with about 12 million people, is Rwanda a big market for US exports. (Source adapted from: https://www.economist.com/finance-and-economics/2018/05/31/ rwanda-refuses-to-remove-tariffs-on-imports-of-used-clothing) Extract B Development in Rwanda Rwanda’s strong economic growth has been accompanied by substantial improvements in living standards, with a two-thirds drop in child mortality and near-universal primary school enrolment. A strong focus on policies to encourage industrialisation and poverty reduction initiatives have contributed to significant improvements in access to services 5 and human development indicators. Absolute poverty declined from 59% to 39% of the population between 2001 and 2014 but was almost stagnant between 2014 and 2017. The official inequality measure, the Gini index, declined from 0.52 in 2006 to 0.43 in 2017. (Source adapted from: https://www.worldbank.org/en/country/rwanda/overview)
(a) Using the data in Figures 1 and 2, calculate the change in the level of total aid funding to Rwanda between 2011 and 2012. (5)
November 2021 · Paper 2 · Q6(b) 8 marks AO1=2, AO2=2, AO3=2, AO4=2 8-mark response emerging and developing economies
Data and extracts for question 6Trade and aid in Rwanda Figure 1: Aid funding received by Rwanda (per capita, US dollars), 2008 to 2018 125 123 120 115 110 105 US dollars 100 95 90 85 83 80 0 2008 2009 2010 2011 2012 2013 2014 2015 2016 2017 2018 (Source adapted from: data.worldbank.org) Figure 2: Population of Rwanda (millions), 2008 to 2018 12.5 12.0 11.5 11.0 Millions 10.5 10.0 9.5 0 2008 2009 2010 2011 2012 2013 2014 2015 2016 2017 2018 (Source adapted from: https://tradingeconomics.com/rwanda/population) Figure 3: Rwanda real GDP annual percentage growth rate, 2008 to 2018 12 11 10 9 8 % 7 6 5 4 0 2008 2009 2010 2011 2012 2013 2014 2015 2016 2017 2018 (Source adapted from: African Development Bank Statistics accessed April 2020) Extract A Rwandan tariffs on imports of used clothing In a market in Kigali, Rwanda’s capital, an auction is under way. Sellers offer crumpled T-shirts and faded jeans; traders argue over the best picks. Everything is second-hand. A Tommy Hilfiger shirt sells for 5 000 Rwandan francs ($5.82); a plain one for a tenth of that. Afterwards, a trader sorts through the purchases he will resell in his home village. 5 The logos hint at their previous lives: Kent State University, a rotary club in Pennsylvania, Number One Dad. These auctions were once twice as busy, but in 2016 Rwanda’s government increased import tariffs on a kilo of used clothes from $0.20 to $2.50. Now many traders struggle to make a profit. The traders are not the only ones who are unhappy. Exporters in the US 10 claim the tariffs are costing jobs there. In March, the US President warned that he would suspend Rwanda’s tariff-free access to US markets for its clothing exports after 60 days if it did not remove the tariff. Globally, about $4 billion of used clothes crossed borders in 2016. The share from China and South Korea is growing, but 70% still come from Europe and North America. Many 15 go to Asia and eastern Europe, but Africa remains the largest market. The trade enables poor people to afford clothes and creates retail jobs. However, governments worry that the trade undercuts their own clothing manufacturers. Second-hand imports of clothing now dominate African markets. Researchers at the Overseas Development Institute, a British think-tank, estimate that Tanzania imports 20 540 million used items of clothing and 180 million new ones each year, while producing fewer than 20 million itself. African manufacturing is weak for many reasons, from ineffective privatisations to collapsing infrastructure. But second-hand clothing imports are a major factor: it is estimated that they accounted for half of the fall in employment in the African clothing industry between 1981 and 2000. 25 For example, a clothing factory in Kigali is operating at only 40% of capacity and employs 600 workers, down from 1 100 in the 1990s. It is hard to compete, says Ritesh Patel, its manager, when a used imported T-shirt sells for the price of a bottle of water. Instead, the company specialises in uniforms for police, soldiers and security guards, which cannot be bought second-hand. 30 The threatened suspension of tariff-free access to the US market would hurt Rwanda, but not very much. Last year Rwanda sold just $1.5 million of clothing to the US. Nor, with about 12 million people, is Rwanda a big market for US exports. (Source adapted from: https://www.economist.com/finance-and-economics/2018/05/31/ rwanda-refuses-to-remove-tariffs-on-imports-of-used-clothing) Extract B Development in Rwanda Rwanda’s strong economic growth has been accompanied by substantial improvements in living standards, with a two-thirds drop in child mortality and near-universal primary school enrolment. A strong focus on policies to encourage industrialisation and poverty reduction initiatives have contributed to significant improvements in access to services 5 and human development indicators. Absolute poverty declined from 59% to 39% of the population between 2001 and 2014 but was almost stagnant between 2014 and 2017. The official inequality measure, the Gini index, declined from 0.52 in 2006 to 0.43 in 2017. (Source adapted from: https://www.worldbank.org/en/country/rwanda/overview)
(b) With reference to the information provided, examine two likely benefits for the Rwandan economy of the growth in the country’s population. (8)
November 2021 · Paper 2 · Q6(c) 10 marks AO1=2, AO2=2, AO3=2, AO4=4 10-mark response emerging and developing economies
Data and extracts for question 6Trade and aid in Rwanda Figure 1: Aid funding received by Rwanda (per capita, US dollars), 2008 to 2018 125 123 120 115 110 105 US dollars 100 95 90 85 83 80 0 2008 2009 2010 2011 2012 2013 2014 2015 2016 2017 2018 (Source adapted from: data.worldbank.org) Figure 2: Population of Rwanda (millions), 2008 to 2018 12.5 12.0 11.5 11.0 Millions 10.5 10.0 9.5 0 2008 2009 2010 2011 2012 2013 2014 2015 2016 2017 2018 (Source adapted from: https://tradingeconomics.com/rwanda/population) Figure 3: Rwanda real GDP annual percentage growth rate, 2008 to 2018 12 11 10 9 8 % 7 6 5 4 0 2008 2009 2010 2011 2012 2013 2014 2015 2016 2017 2018 (Source adapted from: African Development Bank Statistics accessed April 2020) Extract A Rwandan tariffs on imports of used clothing In a market in Kigali, Rwanda’s capital, an auction is under way. Sellers offer crumpled T-shirts and faded jeans; traders argue over the best picks. Everything is second-hand. A Tommy Hilfiger shirt sells for 5 000 Rwandan francs ($5.82); a plain one for a tenth of that. Afterwards, a trader sorts through the purchases he will resell in his home village. 5 The logos hint at their previous lives: Kent State University, a rotary club in Pennsylvania, Number One Dad. These auctions were once twice as busy, but in 2016 Rwanda’s government increased import tariffs on a kilo of used clothes from $0.20 to $2.50. Now many traders struggle to make a profit. The traders are not the only ones who are unhappy. Exporters in the US 10 claim the tariffs are costing jobs there. In March, the US President warned that he would suspend Rwanda’s tariff-free access to US markets for its clothing exports after 60 days if it did not remove the tariff. Globally, about $4 billion of used clothes crossed borders in 2016. The share from China and South Korea is growing, but 70% still come from Europe and North America. Many 15 go to Asia and eastern Europe, but Africa remains the largest market. The trade enables poor people to afford clothes and creates retail jobs. However, governments worry that the trade undercuts their own clothing manufacturers. Second-hand imports of clothing now dominate African markets. Researchers at the Overseas Development Institute, a British think-tank, estimate that Tanzania imports 20 540 million used items of clothing and 180 million new ones each year, while producing fewer than 20 million itself. African manufacturing is weak for many reasons, from ineffective privatisations to collapsing infrastructure. But second-hand clothing imports are a major factor: it is estimated that they accounted for half of the fall in employment in the African clothing industry between 1981 and 2000. 25 For example, a clothing factory in Kigali is operating at only 40% of capacity and employs 600 workers, down from 1 100 in the 1990s. It is hard to compete, says Ritesh Patel, its manager, when a used imported T-shirt sells for the price of a bottle of water. Instead, the company specialises in uniforms for police, soldiers and security guards, which cannot be bought second-hand. 30 The threatened suspension of tariff-free access to the US market would hurt Rwanda, but not very much. Last year Rwanda sold just $1.5 million of clothing to the US. Nor, with about 12 million people, is Rwanda a big market for US exports. (Source adapted from: https://www.economist.com/finance-and-economics/2018/05/31/ rwanda-refuses-to-remove-tariffs-on-imports-of-used-clothing) Extract B Development in Rwanda Rwanda’s strong economic growth has been accompanied by substantial improvements in living standards, with a two-thirds drop in child mortality and near-universal primary school enrolment. A strong focus on policies to encourage industrialisation and poverty reduction initiatives have contributed to significant improvements in access to services 5 and human development indicators. Absolute poverty declined from 59% to 39% of the population between 2001 and 2014 but was almost stagnant between 2014 and 2017. The official inequality measure, the Gini index, declined from 0.52 in 2006 to 0.43 in 2017. (Source adapted from: https://www.worldbank.org/en/country/rwanda/overview)
(c) With reference to the information provided, assess the likely impact on the Rwandan economy of the change in aid received between 2017 and 2018. (10)
November 2021 · Paper 2 · Q6(d) 12 marks AO1=2, AO2=2, AO3=4, AO4=4 12-mark response trading blocs and protectionism
Data and extracts for question 6Trade and aid in Rwanda Figure 1: Aid funding received by Rwanda (per capita, US dollars), 2008 to 2018 125 123 120 115 110 105 US dollars 100 95 90 85 83 80 0 2008 2009 2010 2011 2012 2013 2014 2015 2016 2017 2018 (Source adapted from: data.worldbank.org) Figure 2: Population of Rwanda (millions), 2008 to 2018 12.5 12.0 11.5 11.0 Millions 10.5 10.0 9.5 0 2008 2009 2010 2011 2012 2013 2014 2015 2016 2017 2018 (Source adapted from: https://tradingeconomics.com/rwanda/population) Figure 3: Rwanda real GDP annual percentage growth rate, 2008 to 2018 12 11 10 9 8 % 7 6 5 4 0 2008 2009 2010 2011 2012 2013 2014 2015 2016 2017 2018 (Source adapted from: African Development Bank Statistics accessed April 2020) Extract A Rwandan tariffs on imports of used clothing In a market in Kigali, Rwanda’s capital, an auction is under way. Sellers offer crumpled T-shirts and faded jeans; traders argue over the best picks. Everything is second-hand. A Tommy Hilfiger shirt sells for 5 000 Rwandan francs ($5.82); a plain one for a tenth of that. Afterwards, a trader sorts through the purchases he will resell in his home village. 5 The logos hint at their previous lives: Kent State University, a rotary club in Pennsylvania, Number One Dad. These auctions were once twice as busy, but in 2016 Rwanda’s government increased import tariffs on a kilo of used clothes from $0.20 to $2.50. Now many traders struggle to make a profit. The traders are not the only ones who are unhappy. Exporters in the US 10 claim the tariffs are costing jobs there. In March, the US President warned that he would suspend Rwanda’s tariff-free access to US markets for its clothing exports after 60 days if it did not remove the tariff. Globally, about $4 billion of used clothes crossed borders in 2016. The share from China and South Korea is growing, but 70% still come from Europe and North America. Many 15 go to Asia and eastern Europe, but Africa remains the largest market. The trade enables poor people to afford clothes and creates retail jobs. However, governments worry that the trade undercuts their own clothing manufacturers. Second-hand imports of clothing now dominate African markets. Researchers at the Overseas Development Institute, a British think-tank, estimate that Tanzania imports 20 540 million used items of clothing and 180 million new ones each year, while producing fewer than 20 million itself. African manufacturing is weak for many reasons, from ineffective privatisations to collapsing infrastructure. But second-hand clothing imports are a major factor: it is estimated that they accounted for half of the fall in employment in the African clothing industry between 1981 and 2000. 25 For example, a clothing factory in Kigali is operating at only 40% of capacity and employs 600 workers, down from 1 100 in the 1990s. It is hard to compete, says Ritesh Patel, its manager, when a used imported T-shirt sells for the price of a bottle of water. Instead, the company specialises in uniforms for police, soldiers and security guards, which cannot be bought second-hand. 30 The threatened suspension of tariff-free access to the US market would hurt Rwanda, but not very much. Last year Rwanda sold just $1.5 million of clothing to the US. Nor, with about 12 million people, is Rwanda a big market for US exports. (Source adapted from: https://www.economist.com/finance-and-economics/2018/05/31/ rwanda-refuses-to-remove-tariffs-on-imports-of-used-clothing) Extract B Development in Rwanda Rwanda’s strong economic growth has been accompanied by substantial improvements in living standards, with a two-thirds drop in child mortality and near-universal primary school enrolment. A strong focus on policies to encourage industrialisation and poverty reduction initiatives have contributed to significant improvements in access to services 5 and human development indicators. Absolute poverty declined from 59% to 39% of the population between 2001 and 2014 but was almost stagnant between 2014 and 2017. The official inequality measure, the Gini index, declined from 0.52 in 2006 to 0.43 in 2017. (Source adapted from: https://www.worldbank.org/en/country/rwanda/overview)
(d) Discuss the likely impact on Rwandan consumers and clothing manufacturers of the increase in the tariff on imports of second-hand clothes. Use an appropriate diagram to support your answer. (12)
November 2021 · Paper 2 · Q6(e) 15 marks AO1=3, AO2=3, AO3=3, AO4=6 15-mark response emerging and developing economies
Data and extracts for question 6Trade and aid in Rwanda Figure 1: Aid funding received by Rwanda (per capita, US dollars), 2008 to 2018 125 123 120 115 110 105 US dollars 100 95 90 85 83 80 0 2008 2009 2010 2011 2012 2013 2014 2015 2016 2017 2018 (Source adapted from: data.worldbank.org) Figure 2: Population of Rwanda (millions), 2008 to 2018 12.5 12.0 11.5 11.0 Millions 10.5 10.0 9.5 0 2008 2009 2010 2011 2012 2013 2014 2015 2016 2017 2018 (Source adapted from: https://tradingeconomics.com/rwanda/population) Figure 3: Rwanda real GDP annual percentage growth rate, 2008 to 2018 12 11 10 9 8 % 7 6 5 4 0 2008 2009 2010 2011 2012 2013 2014 2015 2016 2017 2018 (Source adapted from: African Development Bank Statistics accessed April 2020) Extract A Rwandan tariffs on imports of used clothing In a market in Kigali, Rwanda’s capital, an auction is under way. Sellers offer crumpled T-shirts and faded jeans; traders argue over the best picks. Everything is second-hand. A Tommy Hilfiger shirt sells for 5 000 Rwandan francs ($5.82); a plain one for a tenth of that. Afterwards, a trader sorts through the purchases he will resell in his home village. 5 The logos hint at their previous lives: Kent State University, a rotary club in Pennsylvania, Number One Dad. These auctions were once twice as busy, but in 2016 Rwanda’s government increased import tariffs on a kilo of used clothes from $0.20 to $2.50. Now many traders struggle to make a profit. The traders are not the only ones who are unhappy. Exporters in the US 10 claim the tariffs are costing jobs there. In March, the US President warned that he would suspend Rwanda’s tariff-free access to US markets for its clothing exports after 60 days if it did not remove the tariff. Globally, about $4 billion of used clothes crossed borders in 2016. The share from China and South Korea is growing, but 70% still come from Europe and North America. Many 15 go to Asia and eastern Europe, but Africa remains the largest market. The trade enables poor people to afford clothes and creates retail jobs. However, governments worry that the trade undercuts their own clothing manufacturers. Second-hand imports of clothing now dominate African markets. Researchers at the Overseas Development Institute, a British think-tank, estimate that Tanzania imports 20 540 million used items of clothing and 180 million new ones each year, while producing fewer than 20 million itself. African manufacturing is weak for many reasons, from ineffective privatisations to collapsing infrastructure. But second-hand clothing imports are a major factor: it is estimated that they accounted for half of the fall in employment in the African clothing industry between 1981 and 2000. 25 For example, a clothing factory in Kigali is operating at only 40% of capacity and employs 600 workers, down from 1 100 in the 1990s. It is hard to compete, says Ritesh Patel, its manager, when a used imported T-shirt sells for the price of a bottle of water. Instead, the company specialises in uniforms for police, soldiers and security guards, which cannot be bought second-hand. 30 The threatened suspension of tariff-free access to the US market would hurt Rwanda, but not very much. Last year Rwanda sold just $1.5 million of clothing to the US. Nor, with about 12 million people, is Rwanda a big market for US exports. (Source adapted from: https://www.economist.com/finance-and-economics/2018/05/31/ rwanda-refuses-to-remove-tariffs-on-imports-of-used-clothing) Extract B Development in Rwanda Rwanda’s strong economic growth has been accompanied by substantial improvements in living standards, with a two-thirds drop in child mortality and near-universal primary school enrolment. A strong focus on policies to encourage industrialisation and poverty reduction initiatives have contributed to significant improvements in access to services 5 and human development indicators. Absolute poverty declined from 59% to 39% of the population between 2001 and 2014 but was almost stagnant between 2014 and 2017. The official inequality measure, the Gini index, declined from 0.52 in 2006 to 0.43 in 2017. (Source adapted from: https://www.worldbank.org/en/country/rwanda/overview)
(e) Discuss policies, other than import tariffs, that the Rwandan government could use to develop its manufacturing industries. (15)
November 2021 · Paper 3 · Q1(a) 5 marks AO1=2, AO2=2, AO3=1 Short answer market structures and efficiency
Data and extracts for question 1Hand car wash (HCW) firms in the UK Extract A What is the true human cost of your £5 hand car wash (HCW)? The UK’s hand car washes (HCWs) are extremely price competitive, but they have also been linked to modern slavery. Are they ever fair for workers? There is little agreement about how many HCWs there are in the UK. Estimates range from 10 000 to 20 000. This lack of accurate information about the industry makes 5 government regulation very difficult. Automated car washes, with their fierce rotating bristles, used to be the first option for drivers in a hurry. Now there is more choice. While the economy slows and incomes fail to keep up with inflation, demand for HCWs has grown. Many people see paying £5 for a car washed by someone else, rather than cleaning it at home, as a small expense which yields a high utility. But what is the true 10 cost of a £5 car wash – and what should we be paying? The growth of HCWs is partly the result of changes in the structure of industry in the UK. Many petrol stations have closed as drivers fill up at supermarkets. Garages and their forecourts have closed as cars become more reliable and locked into service agreements. The available sites for HCWs have therefore increased significantly and rents have fallen. 15 HCW entrepreneurs have identified available land and have benefitted from changes in the labour market, partly as a result of EU migration. UK drivers are now able to obtain cheap and effective hand car washing. For many migrants, car washes are a first job. “They accept car washing for a short period while they improve their language skills and move into other industries,” says Ian Clark, a professor of work and employment at 20 Nottingham Business School. “But there are also car-wash workers without networks who are in a dead end, working there for long periods.” Many drivers are only interested in getting the cheapest wash. If the price is very low, it probably means that workers are receiving less than the minimum wage and working in poor conditions. Crude calculations illustrate the problem. A £5 HCW employing five 25 workers for 10 hours a day would need to wash 79 cars a day to just cover the wage costs. This assumes the workers are paid the minimum wage. This is one car every seven and a half minutes. Even if the profit can be higher on valet services, the price of which can be as little as £12 for a full inside-and-out clean, it’s hard to see how a car wash price as low as £5 pays a living wage. This ignores all other costs which HCWs incur such as 30 business rates and rent. Evidence from car-wash workers is limited but Clark and others have been able to build a picture of some of the tougher conditions on drenched forecourts. “Like nail bars and small garment manufacturers, car washes are what we call ‘hard-to-reach places,’” Clark explains. As part of the research, Clark and his team spoke to workers from 45 HCWs in 35 the Midlands. Clark and his team met and observed workers who lacked waterproof boots or trousers, or hi-vis jackets and gloves. “They’re spraying around hydrochloric acid solution for alloy wheels, breathing in the vapour and fumes,” Clark says. Some workers were paid a little over half the minimum wage. 40 (Source adapted from: https://www.theguardian.com/world/2018/jul/16/true-human-cost- 5-pound-hand-car-wash-modern-slavery) Extract B Government intervention in the HCW industry There are three main areas of government intervention that might impact on labour intensive firms such as HCWs: First, there is the planning issue which focuses on the impact on the environment, for example, the disposal and recycling of waste water and chemicals. There could be 5 planning regulations to prevent the use of tarmac rather than concrete on forecourts. Tarmac allows waste water and chemicals to seep into the sub soil. It could also be a requirement to have a sludge trap to stop the waste entering waterways. Second, there is the health and safety issue for workers. Prolonged exposure to chemicals and lack of protective clothing puts the health of workers at risk. Performance targets 10 could involve minimum levels of protective clothing and rest breaks for the workers. Third, there is the issue of tax. The informal nature of the business type makes tax evasion easier. Not all UK HCWs violate regulations. There are legitimate, regulated HCW firms as well as examples of good practice by independent outlets. One national supermarket, Tesco, 15 has banned all independent hand car washes from its car parks. It is now in a partnership agreement with national car wash operator Waves. It uses a WashMark certificate of quality and compliance which was introduced by the industry to improve working conditions. Other major supermarkets are considering similar changes. One adviser believes £9 is a reasonable minimum price for a basic wash. Some pressure groups have 20 developed a mobile phone app where evidence of unreasonable conditions can be reported by drivers. Involving drivers in the issue, and making them demand fairer car washes, creates an incentive for good businesses to improve practices and come forward to get a WashMark certificate. 25 (Source adapted from: https://www.parliament.uk/documents/commons-committees/ environmental-audit/Hand-Car-Wash-evidence.pdf research into HCWs by Professor Ian Clark, Nottingham Business School May 2018)
(a) Using the information provided, explain the market structure that best describes the hand car wash (HCW) industry in the UK. (5)
November 2021 · Paper 3 · Q1(b) 8 marks AO1=2, AO2=2, AO3=2, AO4=2 8-mark response price elasticity of demandsupply and demand
Data and extracts for question 1Hand car wash (HCW) firms in the UK Extract A What is the true human cost of your £5 hand car wash (HCW)? The UK’s hand car washes (HCWs) are extremely price competitive, but they have also been linked to modern slavery. Are they ever fair for workers? There is little agreement about how many HCWs there are in the UK. Estimates range from 10 000 to 20 000. This lack of accurate information about the industry makes 5 government regulation very difficult. Automated car washes, with their fierce rotating bristles, used to be the first option for drivers in a hurry. Now there is more choice. While the economy slows and incomes fail to keep up with inflation, demand for HCWs has grown. Many people see paying £5 for a car washed by someone else, rather than cleaning it at home, as a small expense which yields a high utility. But what is the true 10 cost of a £5 car wash – and what should we be paying? The growth of HCWs is partly the result of changes in the structure of industry in the UK. Many petrol stations have closed as drivers fill up at supermarkets. Garages and their forecourts have closed as cars become more reliable and locked into service agreements. The available sites for HCWs have therefore increased significantly and rents have fallen. 15 HCW entrepreneurs have identified available land and have benefitted from changes in the labour market, partly as a result of EU migration. UK drivers are now able to obtain cheap and effective hand car washing. For many migrants, car washes are a first job. “They accept car washing for a short period while they improve their language skills and move into other industries,” says Ian Clark, a professor of work and employment at 20 Nottingham Business School. “But there are also car-wash workers without networks who are in a dead end, working there for long periods.” Many drivers are only interested in getting the cheapest wash. If the price is very low, it probably means that workers are receiving less than the minimum wage and working in poor conditions. Crude calculations illustrate the problem. A £5 HCW employing five 25 workers for 10 hours a day would need to wash 79 cars a day to just cover the wage costs. This assumes the workers are paid the minimum wage. This is one car every seven and a half minutes. Even if the profit can be higher on valet services, the price of which can be as little as £12 for a full inside-and-out clean, it’s hard to see how a car wash price as low as £5 pays a living wage. This ignores all other costs which HCWs incur such as 30 business rates and rent. Evidence from car-wash workers is limited but Clark and others have been able to build a picture of some of the tougher conditions on drenched forecourts. “Like nail bars and small garment manufacturers, car washes are what we call ‘hard-to-reach places,’” Clark explains. As part of the research, Clark and his team spoke to workers from 45 HCWs in 35 the Midlands. Clark and his team met and observed workers who lacked waterproof boots or trousers, or hi-vis jackets and gloves. “They’re spraying around hydrochloric acid solution for alloy wheels, breathing in the vapour and fumes,” Clark says. Some workers were paid a little over half the minimum wage. 40 (Source adapted from: https://www.theguardian.com/world/2018/jul/16/true-human-cost- 5-pound-hand-car-wash-modern-slavery) Extract B Government intervention in the HCW industry There are three main areas of government intervention that might impact on labour intensive firms such as HCWs: First, there is the planning issue which focuses on the impact on the environment, for example, the disposal and recycling of waste water and chemicals. There could be 5 planning regulations to prevent the use of tarmac rather than concrete on forecourts. Tarmac allows waste water and chemicals to seep into the sub soil. It could also be a requirement to have a sludge trap to stop the waste entering waterways. Second, there is the health and safety issue for workers. Prolonged exposure to chemicals and lack of protective clothing puts the health of workers at risk. Performance targets 10 could involve minimum levels of protective clothing and rest breaks for the workers. Third, there is the issue of tax. The informal nature of the business type makes tax evasion easier. Not all UK HCWs violate regulations. There are legitimate, regulated HCW firms as well as examples of good practice by independent outlets. One national supermarket, Tesco, 15 has banned all independent hand car washes from its car parks. It is now in a partnership agreement with national car wash operator Waves. It uses a WashMark certificate of quality and compliance which was introduced by the industry to improve working conditions. Other major supermarkets are considering similar changes. One adviser believes £9 is a reasonable minimum price for a basic wash. Some pressure groups have 20 developed a mobile phone app where evidence of unreasonable conditions can be reported by drivers. Involving drivers in the issue, and making them demand fairer car washes, creates an incentive for good businesses to improve practices and come forward to get a WashMark certificate. 25 (Source adapted from: https://www.parliament.uk/documents/commons-committees/ environmental-audit/Hand-Car-Wash-evidence.pdf research into HCWs by Professor Ian Clark, Nottingham Business School May 2018)
(b) Examine two reasons why the demand for HCWs increases during a period when consumer ‘incomes fail to keep up with inflation’ (Extract A line 8). (8)
November 2021 · Paper 3 · Q1(c) 12 marks AO1=2, AO2=2, AO3=4, AO4=4 12-mark response labour market
Data and extracts for question 1Hand car wash (HCW) firms in the UK Extract A What is the true human cost of your £5 hand car wash (HCW)? The UK’s hand car washes (HCWs) are extremely price competitive, but they have also been linked to modern slavery. Are they ever fair for workers? There is little agreement about how many HCWs there are in the UK. Estimates range from 10 000 to 20 000. This lack of accurate information about the industry makes 5 government regulation very difficult. Automated car washes, with their fierce rotating bristles, used to be the first option for drivers in a hurry. Now there is more choice. While the economy slows and incomes fail to keep up with inflation, demand for HCWs has grown. Many people see paying £5 for a car washed by someone else, rather than cleaning it at home, as a small expense which yields a high utility. But what is the true 10 cost of a £5 car wash – and what should we be paying? The growth of HCWs is partly the result of changes in the structure of industry in the UK. Many petrol stations have closed as drivers fill up at supermarkets. Garages and their forecourts have closed as cars become more reliable and locked into service agreements. The available sites for HCWs have therefore increased significantly and rents have fallen. 15 HCW entrepreneurs have identified available land and have benefitted from changes in the labour market, partly as a result of EU migration. UK drivers are now able to obtain cheap and effective hand car washing. For many migrants, car washes are a first job. “They accept car washing for a short period while they improve their language skills and move into other industries,” says Ian Clark, a professor of work and employment at 20 Nottingham Business School. “But there are also car-wash workers without networks who are in a dead end, working there for long periods.” Many drivers are only interested in getting the cheapest wash. If the price is very low, it probably means that workers are receiving less than the minimum wage and working in poor conditions. Crude calculations illustrate the problem. A £5 HCW employing five 25 workers for 10 hours a day would need to wash 79 cars a day to just cover the wage costs. This assumes the workers are paid the minimum wage. This is one car every seven and a half minutes. Even if the profit can be higher on valet services, the price of which can be as little as £12 for a full inside-and-out clean, it’s hard to see how a car wash price as low as £5 pays a living wage. This ignores all other costs which HCWs incur such as 30 business rates and rent. Evidence from car-wash workers is limited but Clark and others have been able to build a picture of some of the tougher conditions on drenched forecourts. “Like nail bars and small garment manufacturers, car washes are what we call ‘hard-to-reach places,’” Clark explains. As part of the research, Clark and his team spoke to workers from 45 HCWs in 35 the Midlands. Clark and his team met and observed workers who lacked waterproof boots or trousers, or hi-vis jackets and gloves. “They’re spraying around hydrochloric acid solution for alloy wheels, breathing in the vapour and fumes,” Clark says. Some workers were paid a little over half the minimum wage. 40 (Source adapted from: https://www.theguardian.com/world/2018/jul/16/true-human-cost- 5-pound-hand-car-wash-modern-slavery) Extract B Government intervention in the HCW industry There are three main areas of government intervention that might impact on labour intensive firms such as HCWs: First, there is the planning issue which focuses on the impact on the environment, for example, the disposal and recycling of waste water and chemicals. There could be 5 planning regulations to prevent the use of tarmac rather than concrete on forecourts. Tarmac allows waste water and chemicals to seep into the sub soil. It could also be a requirement to have a sludge trap to stop the waste entering waterways. Second, there is the health and safety issue for workers. Prolonged exposure to chemicals and lack of protective clothing puts the health of workers at risk. Performance targets 10 could involve minimum levels of protective clothing and rest breaks for the workers. Third, there is the issue of tax. The informal nature of the business type makes tax evasion easier. Not all UK HCWs violate regulations. There are legitimate, regulated HCW firms as well as examples of good practice by independent outlets. One national supermarket, Tesco, 15 has banned all independent hand car washes from its car parks. It is now in a partnership agreement with national car wash operator Waves. It uses a WashMark certificate of quality and compliance which was introduced by the industry to improve working conditions. Other major supermarkets are considering similar changes. One adviser believes £9 is a reasonable minimum price for a basic wash. Some pressure groups have 20 developed a mobile phone app where evidence of unreasonable conditions can be reported by drivers. Involving drivers in the issue, and making them demand fairer car washes, creates an incentive for good businesses to improve practices and come forward to get a WashMark certificate. 25 (Source adapted from: https://www.parliament.uk/documents/commons-committees/ environmental-audit/Hand-Car-Wash-evidence.pdf research into HCWs by Professor Ian Clark, Nottingham Business School May 2018)
(c) Discuss the likely effects of changes in the level of migration on firms such as HCWs in the UK. Use a labour market diagram and the information provided to support your answer. (12)
November 2021 · Paper 3 · Q1(d) 25 marks AO1=4, AO2=4, AO3=8, AO4=9 25-mark essay Either/or monopsony and contestabilityeconomic growth and the trade cycle
Data and extracts for question 1Hand car wash (HCW) firms in the UK Extract A What is the true human cost of your £5 hand car wash (HCW)? The UK’s hand car washes (HCWs) are extremely price competitive, but they have also been linked to modern slavery. Are they ever fair for workers? There is little agreement about how many HCWs there are in the UK. Estimates range from 10 000 to 20 000. This lack of accurate information about the industry makes 5 government regulation very difficult. Automated car washes, with their fierce rotating bristles, used to be the first option for drivers in a hurry. Now there is more choice. While the economy slows and incomes fail to keep up with inflation, demand for HCWs has grown. Many people see paying £5 for a car washed by someone else, rather than cleaning it at home, as a small expense which yields a high utility. But what is the true 10 cost of a £5 car wash – and what should we be paying? The growth of HCWs is partly the result of changes in the structure of industry in the UK. Many petrol stations have closed as drivers fill up at supermarkets. Garages and their forecourts have closed as cars become more reliable and locked into service agreements. The available sites for HCWs have therefore increased significantly and rents have fallen. 15 HCW entrepreneurs have identified available land and have benefitted from changes in the labour market, partly as a result of EU migration. UK drivers are now able to obtain cheap and effective hand car washing. For many migrants, car washes are a first job. “They accept car washing for a short period while they improve their language skills and move into other industries,” says Ian Clark, a professor of work and employment at 20 Nottingham Business School. “But there are also car-wash workers without networks who are in a dead end, working there for long periods.” Many drivers are only interested in getting the cheapest wash. If the price is very low, it probably means that workers are receiving less than the minimum wage and working in poor conditions. Crude calculations illustrate the problem. A £5 HCW employing five 25 workers for 10 hours a day would need to wash 79 cars a day to just cover the wage costs. This assumes the workers are paid the minimum wage. This is one car every seven and a half minutes. Even if the profit can be higher on valet services, the price of which can be as little as £12 for a full inside-and-out clean, it’s hard to see how a car wash price as low as £5 pays a living wage. This ignores all other costs which HCWs incur such as 30 business rates and rent. Evidence from car-wash workers is limited but Clark and others have been able to build a picture of some of the tougher conditions on drenched forecourts. “Like nail bars and small garment manufacturers, car washes are what we call ‘hard-to-reach places,’” Clark explains. As part of the research, Clark and his team spoke to workers from 45 HCWs in 35 the Midlands. Clark and his team met and observed workers who lacked waterproof boots or trousers, or hi-vis jackets and gloves. “They’re spraying around hydrochloric acid solution for alloy wheels, breathing in the vapour and fumes,” Clark says. Some workers were paid a little over half the minimum wage. 40 (Source adapted from: https://www.theguardian.com/world/2018/jul/16/true-human-cost- 5-pound-hand-car-wash-modern-slavery) Extract B Government intervention in the HCW industry There are three main areas of government intervention that might impact on labour intensive firms such as HCWs: First, there is the planning issue which focuses on the impact on the environment, for example, the disposal and recycling of waste water and chemicals. There could be 5 planning regulations to prevent the use of tarmac rather than concrete on forecourts. Tarmac allows waste water and chemicals to seep into the sub soil. It could also be a requirement to have a sludge trap to stop the waste entering waterways. Second, there is the health and safety issue for workers. Prolonged exposure to chemicals and lack of protective clothing puts the health of workers at risk. Performance targets 10 could involve minimum levels of protective clothing and rest breaks for the workers. Third, there is the issue of tax. The informal nature of the business type makes tax evasion easier. Not all UK HCWs violate regulations. There are legitimate, regulated HCW firms as well as examples of good practice by independent outlets. One national supermarket, Tesco, 15 has banned all independent hand car washes from its car parks. It is now in a partnership agreement with national car wash operator Waves. It uses a WashMark certificate of quality and compliance which was introduced by the industry to improve working conditions. Other major supermarkets are considering similar changes. One adviser believes £9 is a reasonable minimum price for a basic wash. Some pressure groups have 20 developed a mobile phone app where evidence of unreasonable conditions can be reported by drivers. Involving drivers in the issue, and making them demand fairer car washes, creates an incentive for good businesses to improve practices and come forward to get a WashMark certificate. 25 (Source adapted from: https://www.parliament.uk/documents/commons-committees/ environmental-audit/Hand-Car-Wash-evidence.pdf research into HCWs by Professor Ian Clark, Nottingham Business School May 2018)
(d) Evaluate the microeconomic and macroeconomic factors which determine the number of firms in an industry. Refer to HCWs or another industry of your choice. (25)
November 2021 · Paper 3 · Q1(e) 25 marks AO1=4, AO2=4, AO3=8, AO4=9 25-mark essay Either/or competition policy and regulationlabour marketpoverty and inequality
Data and extracts for question 1Hand car wash (HCW) firms in the UK Extract A What is the true human cost of your £5 hand car wash (HCW)? The UK’s hand car washes (HCWs) are extremely price competitive, but they have also been linked to modern slavery. Are they ever fair for workers? There is little agreement about how many HCWs there are in the UK. Estimates range from 10 000 to 20 000. This lack of accurate information about the industry makes 5 government regulation very difficult. Automated car washes, with their fierce rotating bristles, used to be the first option for drivers in a hurry. Now there is more choice. While the economy slows and incomes fail to keep up with inflation, demand for HCWs has grown. Many people see paying £5 for a car washed by someone else, rather than cleaning it at home, as a small expense which yields a high utility. But what is the true 10 cost of a £5 car wash – and what should we be paying? The growth of HCWs is partly the result of changes in the structure of industry in the UK. Many petrol stations have closed as drivers fill up at supermarkets. Garages and their forecourts have closed as cars become more reliable and locked into service agreements. The available sites for HCWs have therefore increased significantly and rents have fallen. 15 HCW entrepreneurs have identified available land and have benefitted from changes in the labour market, partly as a result of EU migration. UK drivers are now able to obtain cheap and effective hand car washing. For many migrants, car washes are a first job. “They accept car washing for a short period while they improve their language skills and move into other industries,” says Ian Clark, a professor of work and employment at 20 Nottingham Business School. “But there are also car-wash workers without networks who are in a dead end, working there for long periods.” Many drivers are only interested in getting the cheapest wash. If the price is very low, it probably means that workers are receiving less than the minimum wage and working in poor conditions. Crude calculations illustrate the problem. A £5 HCW employing five 25 workers for 10 hours a day would need to wash 79 cars a day to just cover the wage costs. This assumes the workers are paid the minimum wage. This is one car every seven and a half minutes. Even if the profit can be higher on valet services, the price of which can be as little as £12 for a full inside-and-out clean, it’s hard to see how a car wash price as low as £5 pays a living wage. This ignores all other costs which HCWs incur such as 30 business rates and rent. Evidence from car-wash workers is limited but Clark and others have been able to build a picture of some of the tougher conditions on drenched forecourts. “Like nail bars and small garment manufacturers, car washes are what we call ‘hard-to-reach places,’” Clark explains. As part of the research, Clark and his team spoke to workers from 45 HCWs in 35 the Midlands. Clark and his team met and observed workers who lacked waterproof boots or trousers, or hi-vis jackets and gloves. “They’re spraying around hydrochloric acid solution for alloy wheels, breathing in the vapour and fumes,” Clark says. Some workers were paid a little over half the minimum wage. 40 (Source adapted from: https://www.theguardian.com/world/2018/jul/16/true-human-cost- 5-pound-hand-car-wash-modern-slavery) Extract B Government intervention in the HCW industry There are three main areas of government intervention that might impact on labour intensive firms such as HCWs: First, there is the planning issue which focuses on the impact on the environment, for example, the disposal and recycling of waste water and chemicals. There could be 5 planning regulations to prevent the use of tarmac rather than concrete on forecourts. Tarmac allows waste water and chemicals to seep into the sub soil. It could also be a requirement to have a sludge trap to stop the waste entering waterways. Second, there is the health and safety issue for workers. Prolonged exposure to chemicals and lack of protective clothing puts the health of workers at risk. Performance targets 10 could involve minimum levels of protective clothing and rest breaks for the workers. Third, there is the issue of tax. The informal nature of the business type makes tax evasion easier. Not all UK HCWs violate regulations. There are legitimate, regulated HCW firms as well as examples of good practice by independent outlets. One national supermarket, Tesco, 15 has banned all independent hand car washes from its car parks. It is now in a partnership agreement with national car wash operator Waves. It uses a WashMark certificate of quality and compliance which was introduced by the industry to improve working conditions. Other major supermarkets are considering similar changes. One adviser believes £9 is a reasonable minimum price for a basic wash. Some pressure groups have 20 developed a mobile phone app where evidence of unreasonable conditions can be reported by drivers. Involving drivers in the issue, and making them demand fairer car washes, creates an incentive for good businesses to improve practices and come forward to get a WashMark certificate. 25 (Source adapted from: https://www.parliament.uk/documents/commons-committees/ environmental-audit/Hand-Car-Wash-evidence.pdf research into HCWs by Professor Ian Clark, Nottingham Business School May 2018)
(e) Evaluate the microeconomic and macroeconomic effects of increased government intervention in an industry. Refer to HCWs or another industry of your choice. (25)
November 2021 · Paper 3 · Q2(a) 5 marks AO1=2, AO2=2, AO3=1 Short answer Hard public finances and taxation
Data and extracts for question 2The German economy Figure 1: German government budget balance, percentage of GDP, 2010 to 2019 1.9 2 1.5 1.2 1.2 0.9 0.6 0 0 –0.1 –1 % of GDP –2 –4 –4.2 –6 2010 2012 2014 2016 2018 2020 (Source adapted from: The Economist Nov 14th 2019) Figure 2: German national debt, percentage of GDP, 2010 to 2019 85 80 75 70 % of GDP 65 60 55 0 2010 2012 2014 2016 2018 2020 (Source adapted from: The Economist Nov 14th 2019) Figure 3: Annual percentage change in real GDP, Germany and average of developed economies, 2005 to 2021 (forecasted data for 2020 and 2021) 4 2 0 % –2 –4 –6 2005 2010 2015 2020 Germany Average of developed economies (Source adapted from: IMF and German Federal Statistical Office) Figure 4: Unemployment rate in Germany, percentage of labour force, 2005 to 2020 (2020 figure is forecasted) 12.5 11 . 7 % 10 . 8 % 10.0 9 % 8 . 1 % 7 . 7 % 7 . 8 % 7.5 7 . 1 % 6 . 8 % 6 . 9 % 6 . 7 % 6 . 4 % 6 . 1 % 6 . 1 % % 5 . 7 % 5 . 2 % 5 % 5.0 2.5 0 (Source adapted from: bundesagentur für arbeit.de and https://www.ft.com/ content/5486b247-c73e-4887-a2b2-528b23e301a6) Extract C Why Germany keeps to budget rules despite a slowdown in growth Germany’s economic boom is over, as it has entered recession. During the last ten years of economic growth well over 4 million jobs were created. The fear of recession has revived a debate in Germany: should the government spend more to stimulate growth? It is written into the German constitution that the fiscal 5 deficit cannot be greater than 0.35% of GDP, once the effects of the economic cycle have been removed. Germany’s budget has been in surplus since 2014 and the government is always reluctant to increase spending which would create a deficit. In 2018, aided by booming employment and low interest costs on existing debt, the budget ran to a surplus 1.9% of GDP. 10 Germany’s main trading partners have long been angered by German fiscal policy. The French President criticised Germany’s budget and current account surpluses that “always occur at the expense of others”. Large parts of Germany’s infrastructure need significant investment. As the economy has slowed, a decision to run a balanced-budget policy has become harder to defend. In 15 wealthy regions of Germany, crumbling schools have been closed for fear of collapse, and information and mobile technology on a wide scale needs to be modernised. The World Economic Forum reported that accessibility of fibre optic broadband also “remains the privilege of the few”. However, private sector firms, such as major motor manufacturers, are still willing to invest in new technology and the profitability of some of these 20 firms, in the long run, benefits as a result. The state development bank puts Germany’s investment shortfall at €138 billion (£120 billion). Arguments for a much more expansionary fiscal policy have failed to influence government policy. Big government programmes, such as a recent package to reduce Germany’s carbon emissions, are only implemented when they satisfy fiscal rules. 25 (Source adapted from: The Economist Nov 14th 2019 and https://www.ft.com/content/3cec4908-d164-11e9-8367-807ebd53ab77 7th September 2019 and https://www.ft.com/content/198f072e-4e42-11ea-95a0-43d18ec715f5 and https://www.ft.com/content/d89d9404-c586-11e9-a8e9-296ca66511c9 and https://www.ft.com/content/8f87c03c-93dc-11e8-b67b-b8205561c3fe) Extract D Germany drops to number 7 in the Global Competitiveness Index Despite being the largest economy in the European Union, Germany’s competitiveness is declining, according to the World Economic Forum (WEF). Germany dropped four places in the WEF’s Global Competitiveness Index, coming in as the seventh-most competitive economy. Out of the 103 indicators used in the report, Germany received lower scores in 5 53 areas in 2019. (Source: https://www.dw.com/en/germany-falls-in-global-competitiveness- ranking/a-50745071 8 October 2019)
(a) Explain one reason why a country such as Germany wants to avoid an increase in the national debt relative to GDP (Figure 2). (5)
November 2021 · Paper 3 · Q2(b) 8 marks AO1=2, AO2=2, AO3=2, AO4=2 8-mark response unemployment
Data and extracts for question 2The German economy Figure 1: German government budget balance, percentage of GDP, 2010 to 2019 1.9 2 1.5 1.2 1.2 0.9 0.6 0 0 –0.1 –1 % of GDP –2 –4 –4.2 –6 2010 2012 2014 2016 2018 2020 (Source adapted from: The Economist Nov 14th 2019) Figure 2: German national debt, percentage of GDP, 2010 to 2019 85 80 75 70 % of GDP 65 60 55 0 2010 2012 2014 2016 2018 2020 (Source adapted from: The Economist Nov 14th 2019) Figure 3: Annual percentage change in real GDP, Germany and average of developed economies, 2005 to 2021 (forecasted data for 2020 and 2021) 4 2 0 % –2 –4 –6 2005 2010 2015 2020 Germany Average of developed economies (Source adapted from: IMF and German Federal Statistical Office) Figure 4: Unemployment rate in Germany, percentage of labour force, 2005 to 2020 (2020 figure is forecasted) 12.5 11 . 7 % 10 . 8 % 10.0 9 % 8 . 1 % 7 . 7 % 7 . 8 % 7.5 7 . 1 % 6 . 8 % 6 . 9 % 6 . 7 % 6 . 4 % 6 . 1 % 6 . 1 % % 5 . 7 % 5 . 2 % 5 % 5.0 2.5 0 (Source adapted from: bundesagentur für arbeit.de and https://www.ft.com/ content/5486b247-c73e-4887-a2b2-528b23e301a6) Extract C Why Germany keeps to budget rules despite a slowdown in growth Germany’s economic boom is over, as it has entered recession. During the last ten years of economic growth well over 4 million jobs were created. The fear of recession has revived a debate in Germany: should the government spend more to stimulate growth? It is written into the German constitution that the fiscal 5 deficit cannot be greater than 0.35% of GDP, once the effects of the economic cycle have been removed. Germany’s budget has been in surplus since 2014 and the government is always reluctant to increase spending which would create a deficit. In 2018, aided by booming employment and low interest costs on existing debt, the budget ran to a surplus 1.9% of GDP. 10 Germany’s main trading partners have long been angered by German fiscal policy. The French President criticised Germany’s budget and current account surpluses that “always occur at the expense of others”. Large parts of Germany’s infrastructure need significant investment. As the economy has slowed, a decision to run a balanced-budget policy has become harder to defend. In 15 wealthy regions of Germany, crumbling schools have been closed for fear of collapse, and information and mobile technology on a wide scale needs to be modernised. The World Economic Forum reported that accessibility of fibre optic broadband also “remains the privilege of the few”. However, private sector firms, such as major motor manufacturers, are still willing to invest in new technology and the profitability of some of these 20 firms, in the long run, benefits as a result. The state development bank puts Germany’s investment shortfall at €138 billion (£120 billion). Arguments for a much more expansionary fiscal policy have failed to influence government policy. Big government programmes, such as a recent package to reduce Germany’s carbon emissions, are only implemented when they satisfy fiscal rules. 25 (Source adapted from: The Economist Nov 14th 2019 and https://www.ft.com/content/3cec4908-d164-11e9-8367-807ebd53ab77 7th September 2019 and https://www.ft.com/content/198f072e-4e42-11ea-95a0-43d18ec715f5 and https://www.ft.com/content/d89d9404-c586-11e9-a8e9-296ca66511c9 and https://www.ft.com/content/8f87c03c-93dc-11e8-b67b-b8205561c3fe) Extract D Germany drops to number 7 in the Global Competitiveness Index Despite being the largest economy in the European Union, Germany’s competitiveness is declining, according to the World Economic Forum (WEF). Germany dropped four places in the WEF’s Global Competitiveness Index, coming in as the seventh-most competitive economy. Out of the 103 indicators used in the report, Germany received lower scores in 5 53 areas in 2019. (Source: https://www.dw.com/en/germany-falls-in-global-competitiveness- ranking/a-50745071 8 October 2019)
(b) Examine two likely effects of the forecast change in the rate of unemployment between 2019 to 2020, on firms in Germany. Refer to Figure 4 in your answer. (8)
November 2021 · Paper 3 · Q2(c) 12 marks AO1=2, AO2=2, AO3=4, AO4=4 12-mark response revenues costs and profits
Data and extracts for question 2The German economy Figure 1: German government budget balance, percentage of GDP, 2010 to 2019 1.9 2 1.5 1.2 1.2 0.9 0.6 0 0 –0.1 –1 % of GDP –2 –4 –4.2 –6 2010 2012 2014 2016 2018 2020 (Source adapted from: The Economist Nov 14th 2019) Figure 2: German national debt, percentage of GDP, 2010 to 2019 85 80 75 70 % of GDP 65 60 55 0 2010 2012 2014 2016 2018 2020 (Source adapted from: The Economist Nov 14th 2019) Figure 3: Annual percentage change in real GDP, Germany and average of developed economies, 2005 to 2021 (forecasted data for 2020 and 2021) 4 2 0 % –2 –4 –6 2005 2010 2015 2020 Germany Average of developed economies (Source adapted from: IMF and German Federal Statistical Office) Figure 4: Unemployment rate in Germany, percentage of labour force, 2005 to 2020 (2020 figure is forecasted) 12.5 11 . 7 % 10 . 8 % 10.0 9 % 8 . 1 % 7 . 7 % 7 . 8 % 7.5 7 . 1 % 6 . 8 % 6 . 9 % 6 . 7 % 6 . 4 % 6 . 1 % 6 . 1 % % 5 . 7 % 5 . 2 % 5 % 5.0 2.5 0 (Source adapted from: bundesagentur für arbeit.de and https://www.ft.com/ content/5486b247-c73e-4887-a2b2-528b23e301a6) Extract C Why Germany keeps to budget rules despite a slowdown in growth Germany’s economic boom is over, as it has entered recession. During the last ten years of economic growth well over 4 million jobs were created. The fear of recession has revived a debate in Germany: should the government spend more to stimulate growth? It is written into the German constitution that the fiscal 5 deficit cannot be greater than 0.35% of GDP, once the effects of the economic cycle have been removed. Germany’s budget has been in surplus since 2014 and the government is always reluctant to increase spending which would create a deficit. In 2018, aided by booming employment and low interest costs on existing debt, the budget ran to a surplus 1.9% of GDP. 10 Germany’s main trading partners have long been angered by German fiscal policy. The French President criticised Germany’s budget and current account surpluses that “always occur at the expense of others”. Large parts of Germany’s infrastructure need significant investment. As the economy has slowed, a decision to run a balanced-budget policy has become harder to defend. In 15 wealthy regions of Germany, crumbling schools have been closed for fear of collapse, and information and mobile technology on a wide scale needs to be modernised. The World Economic Forum reported that accessibility of fibre optic broadband also “remains the privilege of the few”. However, private sector firms, such as major motor manufacturers, are still willing to invest in new technology and the profitability of some of these 20 firms, in the long run, benefits as a result. The state development bank puts Germany’s investment shortfall at €138 billion (£120 billion). Arguments for a much more expansionary fiscal policy have failed to influence government policy. Big government programmes, such as a recent package to reduce Germany’s carbon emissions, are only implemented when they satisfy fiscal rules. 25 (Source adapted from: The Economist Nov 14th 2019 and https://www.ft.com/content/3cec4908-d164-11e9-8367-807ebd53ab77 7th September 2019 and https://www.ft.com/content/198f072e-4e42-11ea-95a0-43d18ec715f5 and https://www.ft.com/content/d89d9404-c586-11e9-a8e9-296ca66511c9 and https://www.ft.com/content/8f87c03c-93dc-11e8-b67b-b8205561c3fe) Extract D Germany drops to number 7 in the Global Competitiveness Index Despite being the largest economy in the European Union, Germany’s competitiveness is declining, according to the World Economic Forum (WEF). Germany dropped four places in the WEF’s Global Competitiveness Index, coming in as the seventh-most competitive economy. Out of the 103 indicators used in the report, Germany received lower scores in 5 53 areas in 2019. (Source: https://www.dw.com/en/germany-falls-in-global-competitiveness- ranking/a-50745071 8 October 2019)
(c) Discuss the likely impact of investment in new technology on the profitability of firms in Germany, as described in Extract C line 20. Use a cost and revenue diagram to support your answer. (12)
November 2021 · Paper 3 · Q2(d) 25 marks AO1=4, AO2=4, AO3=8, AO4=9 25-mark essay Either/or economic growth and the trade cycleinternational competitiveness
Data and extracts for question 2The German economy Figure 1: German government budget balance, percentage of GDP, 2010 to 2019 1.9 2 1.5 1.2 1.2 0.9 0.6 0 0 –0.1 –1 % of GDP –2 –4 –4.2 –6 2010 2012 2014 2016 2018 2020 (Source adapted from: The Economist Nov 14th 2019) Figure 2: German national debt, percentage of GDP, 2010 to 2019 85 80 75 70 % of GDP 65 60 55 0 2010 2012 2014 2016 2018 2020 (Source adapted from: The Economist Nov 14th 2019) Figure 3: Annual percentage change in real GDP, Germany and average of developed economies, 2005 to 2021 (forecasted data for 2020 and 2021) 4 2 0 % –2 –4 –6 2005 2010 2015 2020 Germany Average of developed economies (Source adapted from: IMF and German Federal Statistical Office) Figure 4: Unemployment rate in Germany, percentage of labour force, 2005 to 2020 (2020 figure is forecasted) 12.5 11 . 7 % 10 . 8 % 10.0 9 % 8 . 1 % 7 . 7 % 7 . 8 % 7.5 7 . 1 % 6 . 8 % 6 . 9 % 6 . 7 % 6 . 4 % 6 . 1 % 6 . 1 % % 5 . 7 % 5 . 2 % 5 % 5.0 2.5 0 (Source adapted from: bundesagentur für arbeit.de and https://www.ft.com/ content/5486b247-c73e-4887-a2b2-528b23e301a6) Extract C Why Germany keeps to budget rules despite a slowdown in growth Germany’s economic boom is over, as it has entered recession. During the last ten years of economic growth well over 4 million jobs were created. The fear of recession has revived a debate in Germany: should the government spend more to stimulate growth? It is written into the German constitution that the fiscal 5 deficit cannot be greater than 0.35% of GDP, once the effects of the economic cycle have been removed. Germany’s budget has been in surplus since 2014 and the government is always reluctant to increase spending which would create a deficit. In 2018, aided by booming employment and low interest costs on existing debt, the budget ran to a surplus 1.9% of GDP. 10 Germany’s main trading partners have long been angered by German fiscal policy. The French President criticised Germany’s budget and current account surpluses that “always occur at the expense of others”. Large parts of Germany’s infrastructure need significant investment. As the economy has slowed, a decision to run a balanced-budget policy has become harder to defend. In 15 wealthy regions of Germany, crumbling schools have been closed for fear of collapse, and information and mobile technology on a wide scale needs to be modernised. The World Economic Forum reported that accessibility of fibre optic broadband also “remains the privilege of the few”. However, private sector firms, such as major motor manufacturers, are still willing to invest in new technology and the profitability of some of these 20 firms, in the long run, benefits as a result. The state development bank puts Germany’s investment shortfall at €138 billion (£120 billion). Arguments for a much more expansionary fiscal policy have failed to influence government policy. Big government programmes, such as a recent package to reduce Germany’s carbon emissions, are only implemented when they satisfy fiscal rules. 25 (Source adapted from: The Economist Nov 14th 2019 and https://www.ft.com/content/3cec4908-d164-11e9-8367-807ebd53ab77 7th September 2019 and https://www.ft.com/content/198f072e-4e42-11ea-95a0-43d18ec715f5 and https://www.ft.com/content/d89d9404-c586-11e9-a8e9-296ca66511c9 and https://www.ft.com/content/8f87c03c-93dc-11e8-b67b-b8205561c3fe) Extract D Germany drops to number 7 in the Global Competitiveness Index Despite being the largest economy in the European Union, Germany’s competitiveness is declining, according to the World Economic Forum (WEF). Germany dropped four places in the WEF’s Global Competitiveness Index, coming in as the seventh-most competitive economy. Out of the 103 indicators used in the report, Germany received lower scores in 5 53 areas in 2019. (Source: https://www.dw.com/en/germany-falls-in-global-competitiveness- ranking/a-50745071 8 October 2019)
(d) Evaluate the microeconomic and macroeconomic factors which are likely to determine the rate of economic growth in Germany relative to other developed economies. (25)
November 2021 · Paper 3 · Q2(e) 25 marks AO1=4, AO2=4, AO3=8, AO4=9 25-mark essay Either/or fiscal and monetary policypublic finances and taxation
Data and extracts for question 2The German economy Figure 1: German government budget balance, percentage of GDP, 2010 to 2019 1.9 2 1.5 1.2 1.2 0.9 0.6 0 0 –0.1 –1 % of GDP –2 –4 –4.2 –6 2010 2012 2014 2016 2018 2020 (Source adapted from: The Economist Nov 14th 2019) Figure 2: German national debt, percentage of GDP, 2010 to 2019 85 80 75 70 % of GDP 65 60 55 0 2010 2012 2014 2016 2018 2020 (Source adapted from: The Economist Nov 14th 2019) Figure 3: Annual percentage change in real GDP, Germany and average of developed economies, 2005 to 2021 (forecasted data for 2020 and 2021) 4 2 0 % –2 –4 –6 2005 2010 2015 2020 Germany Average of developed economies (Source adapted from: IMF and German Federal Statistical Office) Figure 4: Unemployment rate in Germany, percentage of labour force, 2005 to 2020 (2020 figure is forecasted) 12.5 11 . 7 % 10 . 8 % 10.0 9 % 8 . 1 % 7 . 7 % 7 . 8 % 7.5 7 . 1 % 6 . 8 % 6 . 9 % 6 . 7 % 6 . 4 % 6 . 1 % 6 . 1 % % 5 . 7 % 5 . 2 % 5 % 5.0 2.5 0 (Source adapted from: bundesagentur für arbeit.de and https://www.ft.com/ content/5486b247-c73e-4887-a2b2-528b23e301a6) Extract C Why Germany keeps to budget rules despite a slowdown in growth Germany’s economic boom is over, as it has entered recession. During the last ten years of economic growth well over 4 million jobs were created. The fear of recession has revived a debate in Germany: should the government spend more to stimulate growth? It is written into the German constitution that the fiscal 5 deficit cannot be greater than 0.35% of GDP, once the effects of the economic cycle have been removed. Germany’s budget has been in surplus since 2014 and the government is always reluctant to increase spending which would create a deficit. In 2018, aided by booming employment and low interest costs on existing debt, the budget ran to a surplus 1.9% of GDP. 10 Germany’s main trading partners have long been angered by German fiscal policy. The French President criticised Germany’s budget and current account surpluses that “always occur at the expense of others”. Large parts of Germany’s infrastructure need significant investment. As the economy has slowed, a decision to run a balanced-budget policy has become harder to defend. In 15 wealthy regions of Germany, crumbling schools have been closed for fear of collapse, and information and mobile technology on a wide scale needs to be modernised. The World Economic Forum reported that accessibility of fibre optic broadband also “remains the privilege of the few”. However, private sector firms, such as major motor manufacturers, are still willing to invest in new technology and the profitability of some of these 20 firms, in the long run, benefits as a result. The state development bank puts Germany’s investment shortfall at €138 billion (£120 billion). Arguments for a much more expansionary fiscal policy have failed to influence government policy. Big government programmes, such as a recent package to reduce Germany’s carbon emissions, are only implemented when they satisfy fiscal rules. 25 (Source adapted from: The Economist Nov 14th 2019 and https://www.ft.com/content/3cec4908-d164-11e9-8367-807ebd53ab77 7th September 2019 and https://www.ft.com/content/198f072e-4e42-11ea-95a0-43d18ec715f5 and https://www.ft.com/content/d89d9404-c586-11e9-a8e9-296ca66511c9 and https://www.ft.com/content/8f87c03c-93dc-11e8-b67b-b8205561c3fe) Extract D Germany drops to number 7 in the Global Competitiveness Index Despite being the largest economy in the European Union, Germany’s competitiveness is declining, according to the World Economic Forum (WEF). Germany dropped four places in the WEF’s Global Competitiveness Index, coming in as the seventh-most competitive economy. Out of the 103 indicators used in the report, Germany received lower scores in 5 53 areas in 2019. (Source: https://www.dw.com/en/germany-falls-in-global-competitiveness- ranking/a-50745071 8 October 2019)
(e) Evaluate the microeconomic and macroeconomic impacts of ‘a much more expansionary fiscal policy’ (Extract C line 23) on the German economy. (25)
October 2020 · AS Paper 1 · Q3(b) 3 marks AO1=1, AO2=1, AO3=1 Short answer nature of economics
Data and extracts for question 33 The ‘Energy Company Obligation’ is the government’s term for its programme to make houses in the UK more energy efficient.
(b) Explain an opportunity cost to the government of granting subsidies to energy suppliers to install loft insulation. (3)
October 2020 · AS Paper 1 · Q4(b) 3 marks AO1=1, AO2=1, AO3=1 Short answer government intervention in marketsindirect taxes and subsidies
Data and extracts for question 44 The UK Government uses a range of indirect taxes to affect the market prices and quantities of many goods and services.
(b) Using an example, explain why the government imposes specific taxes on many goods and services. (3)
October 2020 · AS Paper 1 · Q5(b) 2 marks AO1=2 Short answer externalities
Data and extracts for question 55 HS2 is a high-speed rail network linking the north and south of England. HS2 will be four years late and cost double the Department for Transport’s original estimate. (Source: https://www.transportxtra.com/publications/local-transport-today/news /58459/hs2-will-be-four-years-late-and-cost-double-the-dft-s-estimate-mps-told)
(b) Explain one likely microeconomic reason why the government is using taxpayers’ money to fund HS2. (2)
October 2020 · AS Paper 1 · Q6(a) 5 marks AO1=1, AO2=2, AO3=2 Short answer price elasticity of demand
Data and extracts for question 6The market for higher education in the UK Figure 1: Average graduate earnings, according to subject studied, compared to average non-graduate earnings (per cent) 2018 selected subjects. Economics Medicine Architecture Business Top 5 Law Bottom 5 Psychology Philosophy English Agriculture Creative arts –20% 0% 20% 40% (Source: adapted from https://www.ifs.org.uk/publications/13731 The impact of undergraduate degrees on early-career earnings, Research report, November 2018) Figure 2: Student loans outstanding at the end of financial years 2013 to 2018 in England 120 000 100 000 80 000 60 000 102 357 87 629 74 960 40 000 63 776 53 668 45 418 20 000 0 2013 2014 2015 2016 2017 2018 Financial year (Source: adapted from https://www.slc.co.uk/official-statistics/ student-loans-debt-and-repayment/england.aspx) Figure 3: Number of applications to UCAS according to median income of area lowest household highest household income below £23 000 income above £35 400 90 000 80 000 70 000 60 000 50 000 40 000 30 000 20 000 10 000 0 2007 2008 2009 2010 2011 2012 2013 2014 2015 2016 (Source: adapted from https://www.ucas.com/corporate/data-and-analysis/ucas-undergraduate- releases/2018-cycle-applicant-figures-january-deadline) Extract A Rethinking tuition fees The value of a degree is significant. The latest data shows that the median university graduate income was £10 000 more than the average non-graduate income in 2018. This ‘graduate premium’ means graduates will contribute significantly to the economy. In addition, the government will benefit greatly from additional tax revenues. 5 However, funding higher education continues to be a major issue. English universities charge some of the world’s highest fees. Interest rates on student loans are now 6.3%. There are a large number of courses where graduates are likely to earn less than non-graduates, despite an average of £50 000 of debt. The Department for Education estimates that 45% of the value of loans will not be 10 repaid. Outstanding student loans in England totalled more than £100 billion in 2018. By 2023 total outstanding student loans are forecast to rise to £120 billion. One option for revising student fees could be to charge higher fees for courses that are more expensive to teach or that have a better chance of higher earnings. That would make Science or Mathematics degrees more expensive to study than English or 15 Philosophy. At most universities the level of fees is likely to be the same flat rate of £9 250 per year. However, science-based courses need more expensive equipment and courses such as medicine require more teaching time and personal instruction. Tuition fees were introduced in 1998 at £1 000 per year. They are currently £9 250. 20 Economists estimate that the price elasticity of demand for higher education is about –0.5. Charging £9 250 a year for an undergraduate degree makes England very expensive by international standards. Scotland has no fees for Scottish students, and fees in Wales and Northern Ireland are significantly lower. Much of Europe has low or no fees and Germany, which used to charge fees, has abolished them, replacing them with a graduate tax. 25 The only country with comparable fees is the United States. Top private colleges can charge more than the equivalent of £30 000 per year while state colleges can charge local students less than fees in England. Despite this, student numbers at English universities have continued to increase from 450 000 in 1998 to over 700 000 in 2018. Students from all backgrounds are more likely to 30 go to university than ever before. However, applicants from low-income areas are much less likely to go to university than applicants from high-income areas. The Universities and Colleges Admissions Service (UCAS) found that in the most deprived 10% of postal areas about 20% of young people went to university in 2018, compared with 50% in the highest income areas. Research 35 by University College London revealed that even when candidates from low-income areas had the same exam results, they were much less likely to apply to university than candidates from high-income areas. (Source: adapted from https://www.theguardian.com/education/2018/dec/16/change-in-student-loan- accounting-could-add-10bn-to-national-debt) Extract B Low-income university students twice as likely to drop out than high-income ones The number of students from low-income areas who drop out of university before finishing their degree is at its highest in five years, indicating a considerable waste of scarce educational resources. This news comes at the same time as a drive to recruit students from poorer backgrounds, with universities spending a total of £725 million on 5 access initiatives in the past academic year alone. A number of top universities have started to lower their A level grade offers to students from low-income areas, in an attempt to encourage them to apply. However, there is a danger with ‘enticing’ disadvantaged students through lower grade offers, if universities are not going to provide ongoing support for them once they begin their courses. 10 The latest figures show that 9% of disadvantaged undergraduates do not continue in higher education beyond their first year. In comparison, the average drop-out rate among students from the high-income backgrounds was less than 5%. The gap continues to widen. A report, published by the Office for Fair Access, concluded that: ‘The significance of 15 this for students is huge. Higher education can be a transformational experience that opens doors to rewarding careers and social mobility, but this is only the case if students achieve successful outcomes.’ (Source: adapted from https://www.telegraph.co.uk/news/2017/06/28/number-poor-students-dropping- university-highest-level-five/)
(a) Explain why ‘the price elasticity of demand for higher education is about –0.5’ may be of relevance to English universities. Refer to Extract A in your answer. (5)
October 2020 · AS Paper 1 · Q6(b) 10 marks AO1=2, AO2=2, AO3=2, AO4=4 10-mark response nature of economicsproduction possibility frontiers
Data and extracts for question 6The market for higher education in the UK Figure 1: Average graduate earnings, according to subject studied, compared to average non-graduate earnings (per cent) 2018 selected subjects. Economics Medicine Architecture Business Top 5 Law Bottom 5 Psychology Philosophy English Agriculture Creative arts –20% 0% 20% 40% (Source: adapted from https://www.ifs.org.uk/publications/13731 The impact of undergraduate degrees on early-career earnings, Research report, November 2018) Figure 2: Student loans outstanding at the end of financial years 2013 to 2018 in England 120 000 100 000 80 000 60 000 102 357 87 629 74 960 40 000 63 776 53 668 45 418 20 000 0 2013 2014 2015 2016 2017 2018 Financial year (Source: adapted from https://www.slc.co.uk/official-statistics/ student-loans-debt-and-repayment/england.aspx) Figure 3: Number of applications to UCAS according to median income of area lowest household highest household income below £23 000 income above £35 400 90 000 80 000 70 000 60 000 50 000 40 000 30 000 20 000 10 000 0 2007 2008 2009 2010 2011 2012 2013 2014 2015 2016 (Source: adapted from https://www.ucas.com/corporate/data-and-analysis/ucas-undergraduate- releases/2018-cycle-applicant-figures-january-deadline) Extract A Rethinking tuition fees The value of a degree is significant. The latest data shows that the median university graduate income was £10 000 more than the average non-graduate income in 2018. This ‘graduate premium’ means graduates will contribute significantly to the economy. In addition, the government will benefit greatly from additional tax revenues. 5 However, funding higher education continues to be a major issue. English universities charge some of the world’s highest fees. Interest rates on student loans are now 6.3%. There are a large number of courses where graduates are likely to earn less than non-graduates, despite an average of £50 000 of debt. The Department for Education estimates that 45% of the value of loans will not be 10 repaid. Outstanding student loans in England totalled more than £100 billion in 2018. By 2023 total outstanding student loans are forecast to rise to £120 billion. One option for revising student fees could be to charge higher fees for courses that are more expensive to teach or that have a better chance of higher earnings. That would make Science or Mathematics degrees more expensive to study than English or 15 Philosophy. At most universities the level of fees is likely to be the same flat rate of £9 250 per year. However, science-based courses need more expensive equipment and courses such as medicine require more teaching time and personal instruction. Tuition fees were introduced in 1998 at £1 000 per year. They are currently £9 250. 20 Economists estimate that the price elasticity of demand for higher education is about –0.5. Charging £9 250 a year for an undergraduate degree makes England very expensive by international standards. Scotland has no fees for Scottish students, and fees in Wales and Northern Ireland are significantly lower. Much of Europe has low or no fees and Germany, which used to charge fees, has abolished them, replacing them with a graduate tax. 25 The only country with comparable fees is the United States. Top private colleges can charge more than the equivalent of £30 000 per year while state colleges can charge local students less than fees in England. Despite this, student numbers at English universities have continued to increase from 450 000 in 1998 to over 700 000 in 2018. Students from all backgrounds are more likely to 30 go to university than ever before. However, applicants from low-income areas are much less likely to go to university than applicants from high-income areas. The Universities and Colleges Admissions Service (UCAS) found that in the most deprived 10% of postal areas about 20% of young people went to university in 2018, compared with 50% in the highest income areas. Research 35 by University College London revealed that even when candidates from low-income areas had the same exam results, they were much less likely to apply to university than candidates from high-income areas. (Source: adapted from https://www.theguardian.com/education/2018/dec/16/change-in-student-loan- accounting-could-add-10bn-to-national-debt) Extract B Low-income university students twice as likely to drop out than high-income ones The number of students from low-income areas who drop out of university before finishing their degree is at its highest in five years, indicating a considerable waste of scarce educational resources. This news comes at the same time as a drive to recruit students from poorer backgrounds, with universities spending a total of £725 million on 5 access initiatives in the past academic year alone. A number of top universities have started to lower their A level grade offers to students from low-income areas, in an attempt to encourage them to apply. However, there is a danger with ‘enticing’ disadvantaged students through lower grade offers, if universities are not going to provide ongoing support for them once they begin their courses. 10 The latest figures show that 9% of disadvantaged undergraduates do not continue in higher education beyond their first year. In comparison, the average drop-out rate among students from the high-income backgrounds was less than 5%. The gap continues to widen. A report, published by the Office for Fair Access, concluded that: ‘The significance of 15 this for students is huge. Higher education can be a transformational experience that opens doors to rewarding careers and social mobility, but this is only the case if students achieve successful outcomes.’ (Source: adapted from https://www.telegraph.co.uk/news/2017/06/28/number-poor-students-dropping- university-highest-level-five/)
According to Extract B, the drop-out rate of students from low-income households is much higher than that of high-income households. (b) Assess the likely impact of these drop-out rates on the allocation of resources within an economy. (10)
October 2020 · AS Paper 1 · Q6(c) 6 marks AO1=2, AO2=2, AO3=2 Short answer externalities
Data and extracts for question 6The market for higher education in the UK Figure 1: Average graduate earnings, according to subject studied, compared to average non-graduate earnings (per cent) 2018 selected subjects. Economics Medicine Architecture Business Top 5 Law Bottom 5 Psychology Philosophy English Agriculture Creative arts –20% 0% 20% 40% (Source: adapted from https://www.ifs.org.uk/publications/13731 The impact of undergraduate degrees on early-career earnings, Research report, November 2018) Figure 2: Student loans outstanding at the end of financial years 2013 to 2018 in England 120 000 100 000 80 000 60 000 102 357 87 629 74 960 40 000 63 776 53 668 45 418 20 000 0 2013 2014 2015 2016 2017 2018 Financial year (Source: adapted from https://www.slc.co.uk/official-statistics/ student-loans-debt-and-repayment/england.aspx) Figure 3: Number of applications to UCAS according to median income of area lowest household highest household income below £23 000 income above £35 400 90 000 80 000 70 000 60 000 50 000 40 000 30 000 20 000 10 000 0 2007 2008 2009 2010 2011 2012 2013 2014 2015 2016 (Source: adapted from https://www.ucas.com/corporate/data-and-analysis/ucas-undergraduate- releases/2018-cycle-applicant-figures-january-deadline) Extract A Rethinking tuition fees The value of a degree is significant. The latest data shows that the median university graduate income was £10 000 more than the average non-graduate income in 2018. This ‘graduate premium’ means graduates will contribute significantly to the economy. In addition, the government will benefit greatly from additional tax revenues. 5 However, funding higher education continues to be a major issue. English universities charge some of the world’s highest fees. Interest rates on student loans are now 6.3%. There are a large number of courses where graduates are likely to earn less than non-graduates, despite an average of £50 000 of debt. The Department for Education estimates that 45% of the value of loans will not be 10 repaid. Outstanding student loans in England totalled more than £100 billion in 2018. By 2023 total outstanding student loans are forecast to rise to £120 billion. One option for revising student fees could be to charge higher fees for courses that are more expensive to teach or that have a better chance of higher earnings. That would make Science or Mathematics degrees more expensive to study than English or 15 Philosophy. At most universities the level of fees is likely to be the same flat rate of £9 250 per year. However, science-based courses need more expensive equipment and courses such as medicine require more teaching time and personal instruction. Tuition fees were introduced in 1998 at £1 000 per year. They are currently £9 250. 20 Economists estimate that the price elasticity of demand for higher education is about –0.5. Charging £9 250 a year for an undergraduate degree makes England very expensive by international standards. Scotland has no fees for Scottish students, and fees in Wales and Northern Ireland are significantly lower. Much of Europe has low or no fees and Germany, which used to charge fees, has abolished them, replacing them with a graduate tax. 25 The only country with comparable fees is the United States. Top private colleges can charge more than the equivalent of £30 000 per year while state colleges can charge local students less than fees in England. Despite this, student numbers at English universities have continued to increase from 450 000 in 1998 to over 700 000 in 2018. Students from all backgrounds are more likely to 30 go to university than ever before. However, applicants from low-income areas are much less likely to go to university than applicants from high-income areas. The Universities and Colleges Admissions Service (UCAS) found that in the most deprived 10% of postal areas about 20% of young people went to university in 2018, compared with 50% in the highest income areas. Research 35 by University College London revealed that even when candidates from low-income areas had the same exam results, they were much less likely to apply to university than candidates from high-income areas. (Source: adapted from https://www.theguardian.com/education/2018/dec/16/change-in-student-loan- accounting-could-add-10bn-to-national-debt) Extract B Low-income university students twice as likely to drop out than high-income ones The number of students from low-income areas who drop out of university before finishing their degree is at its highest in five years, indicating a considerable waste of scarce educational resources. This news comes at the same time as a drive to recruit students from poorer backgrounds, with universities spending a total of £725 million on 5 access initiatives in the past academic year alone. A number of top universities have started to lower their A level grade offers to students from low-income areas, in an attempt to encourage them to apply. However, there is a danger with ‘enticing’ disadvantaged students through lower grade offers, if universities are not going to provide ongoing support for them once they begin their courses. 10 The latest figures show that 9% of disadvantaged undergraduates do not continue in higher education beyond their first year. In comparison, the average drop-out rate among students from the high-income backgrounds was less than 5%. The gap continues to widen. A report, published by the Office for Fair Access, concluded that: ‘The significance of 15 this for students is huge. Higher education can be a transformational experience that opens doors to rewarding careers and social mobility, but this is only the case if students achieve successful outcomes.’ (Source: adapted from https://www.telegraph.co.uk/news/2017/06/28/number-poor-students-dropping- university-highest-level-five/)
(c) With reference to Extract A, explain one likely private benefit to students and one likely external benefit of higher education. (6)
October 2020 · AS Paper 1 · Q6(d) 4 marks AO1=2, AO2=2 Calculation government intervention in markets
Data and extracts for question 6The market for higher education in the UK Figure 1: Average graduate earnings, according to subject studied, compared to average non-graduate earnings (per cent) 2018 selected subjects. Economics Medicine Architecture Business Top 5 Law Bottom 5 Psychology Philosophy English Agriculture Creative arts –20% 0% 20% 40% (Source: adapted from https://www.ifs.org.uk/publications/13731 The impact of undergraduate degrees on early-career earnings, Research report, November 2018) Figure 2: Student loans outstanding at the end of financial years 2013 to 2018 in England 120 000 100 000 80 000 60 000 102 357 87 629 74 960 40 000 63 776 53 668 45 418 20 000 0 2013 2014 2015 2016 2017 2018 Financial year (Source: adapted from https://www.slc.co.uk/official-statistics/ student-loans-debt-and-repayment/england.aspx) Figure 3: Number of applications to UCAS according to median income of area lowest household highest household income below £23 000 income above £35 400 90 000 80 000 70 000 60 000 50 000 40 000 30 000 20 000 10 000 0 2007 2008 2009 2010 2011 2012 2013 2014 2015 2016 (Source: adapted from https://www.ucas.com/corporate/data-and-analysis/ucas-undergraduate- releases/2018-cycle-applicant-figures-january-deadline) Extract A Rethinking tuition fees The value of a degree is significant. The latest data shows that the median university graduate income was £10 000 more than the average non-graduate income in 2018. This ‘graduate premium’ means graduates will contribute significantly to the economy. In addition, the government will benefit greatly from additional tax revenues. 5 However, funding higher education continues to be a major issue. English universities charge some of the world’s highest fees. Interest rates on student loans are now 6.3%. There are a large number of courses where graduates are likely to earn less than non-graduates, despite an average of £50 000 of debt. The Department for Education estimates that 45% of the value of loans will not be 10 repaid. Outstanding student loans in England totalled more than £100 billion in 2018. By 2023 total outstanding student loans are forecast to rise to £120 billion. One option for revising student fees could be to charge higher fees for courses that are more expensive to teach or that have a better chance of higher earnings. That would make Science or Mathematics degrees more expensive to study than English or 15 Philosophy. At most universities the level of fees is likely to be the same flat rate of £9 250 per year. However, science-based courses need more expensive equipment and courses such as medicine require more teaching time and personal instruction. Tuition fees were introduced in 1998 at £1 000 per year. They are currently £9 250. 20 Economists estimate that the price elasticity of demand for higher education is about –0.5. Charging £9 250 a year for an undergraduate degree makes England very expensive by international standards. Scotland has no fees for Scottish students, and fees in Wales and Northern Ireland are significantly lower. Much of Europe has low or no fees and Germany, which used to charge fees, has abolished them, replacing them with a graduate tax. 25 The only country with comparable fees is the United States. Top private colleges can charge more than the equivalent of £30 000 per year while state colleges can charge local students less than fees in England. Despite this, student numbers at English universities have continued to increase from 450 000 in 1998 to over 700 000 in 2018. Students from all backgrounds are more likely to 30 go to university than ever before. However, applicants from low-income areas are much less likely to go to university than applicants from high-income areas. The Universities and Colleges Admissions Service (UCAS) found that in the most deprived 10% of postal areas about 20% of young people went to university in 2018, compared with 50% in the highest income areas. Research 35 by University College London revealed that even when candidates from low-income areas had the same exam results, they were much less likely to apply to university than candidates from high-income areas. (Source: adapted from https://www.theguardian.com/education/2018/dec/16/change-in-student-loan- accounting-could-add-10bn-to-national-debt) Extract B Low-income university students twice as likely to drop out than high-income ones The number of students from low-income areas who drop out of university before finishing their degree is at its highest in five years, indicating a considerable waste of scarce educational resources. This news comes at the same time as a drive to recruit students from poorer backgrounds, with universities spending a total of £725 million on 5 access initiatives in the past academic year alone. A number of top universities have started to lower their A level grade offers to students from low-income areas, in an attempt to encourage them to apply. However, there is a danger with ‘enticing’ disadvantaged students through lower grade offers, if universities are not going to provide ongoing support for them once they begin their courses. 10 The latest figures show that 9% of disadvantaged undergraduates do not continue in higher education beyond their first year. In comparison, the average drop-out rate among students from the high-income backgrounds was less than 5%. The gap continues to widen. A report, published by the Office for Fair Access, concluded that: ‘The significance of 15 this for students is huge. Higher education can be a transformational experience that opens doors to rewarding careers and social mobility, but this is only the case if students achieve successful outcomes.’ (Source: adapted from https://www.telegraph.co.uk/news/2017/06/28/number-poor-students-dropping- university-highest-level-five/)
(d) With reference to Figure 2, calculate the percentage increase in outstanding student loans from 2013 to 2018. You are advised to show your working. (4)
October 2020 · AS Paper 1 · Q6(e) 15 marks AO1=3, AO2=3, AO3=3, AO4=6 15-mark response price mechanism and surplus
Data and extracts for question 6The market for higher education in the UK Figure 1: Average graduate earnings, according to subject studied, compared to average non-graduate earnings (per cent) 2018 selected subjects. Economics Medicine Architecture Business Top 5 Law Bottom 5 Psychology Philosophy English Agriculture Creative arts –20% 0% 20% 40% (Source: adapted from https://www.ifs.org.uk/publications/13731 The impact of undergraduate degrees on early-career earnings, Research report, November 2018) Figure 2: Student loans outstanding at the end of financial years 2013 to 2018 in England 120 000 100 000 80 000 60 000 102 357 87 629 74 960 40 000 63 776 53 668 45 418 20 000 0 2013 2014 2015 2016 2017 2018 Financial year (Source: adapted from https://www.slc.co.uk/official-statistics/ student-loans-debt-and-repayment/england.aspx) Figure 3: Number of applications to UCAS according to median income of area lowest household highest household income below £23 000 income above £35 400 90 000 80 000 70 000 60 000 50 000 40 000 30 000 20 000 10 000 0 2007 2008 2009 2010 2011 2012 2013 2014 2015 2016 (Source: adapted from https://www.ucas.com/corporate/data-and-analysis/ucas-undergraduate- releases/2018-cycle-applicant-figures-january-deadline) Extract A Rethinking tuition fees The value of a degree is significant. The latest data shows that the median university graduate income was £10 000 more than the average non-graduate income in 2018. This ‘graduate premium’ means graduates will contribute significantly to the economy. In addition, the government will benefit greatly from additional tax revenues. 5 However, funding higher education continues to be a major issue. English universities charge some of the world’s highest fees. Interest rates on student loans are now 6.3%. There are a large number of courses where graduates are likely to earn less than non-graduates, despite an average of £50 000 of debt. The Department for Education estimates that 45% of the value of loans will not be 10 repaid. Outstanding student loans in England totalled more than £100 billion in 2018. By 2023 total outstanding student loans are forecast to rise to £120 billion. One option for revising student fees could be to charge higher fees for courses that are more expensive to teach or that have a better chance of higher earnings. That would make Science or Mathematics degrees more expensive to study than English or 15 Philosophy. At most universities the level of fees is likely to be the same flat rate of £9 250 per year. However, science-based courses need more expensive equipment and courses such as medicine require more teaching time and personal instruction. Tuition fees were introduced in 1998 at £1 000 per year. They are currently £9 250. 20 Economists estimate that the price elasticity of demand for higher education is about –0.5. Charging £9 250 a year for an undergraduate degree makes England very expensive by international standards. Scotland has no fees for Scottish students, and fees in Wales and Northern Ireland are significantly lower. Much of Europe has low or no fees and Germany, which used to charge fees, has abolished them, replacing them with a graduate tax. 25 The only country with comparable fees is the United States. Top private colleges can charge more than the equivalent of £30 000 per year while state colleges can charge local students less than fees in England. Despite this, student numbers at English universities have continued to increase from 450 000 in 1998 to over 700 000 in 2018. Students from all backgrounds are more likely to 30 go to university than ever before. However, applicants from low-income areas are much less likely to go to university than applicants from high-income areas. The Universities and Colleges Admissions Service (UCAS) found that in the most deprived 10% of postal areas about 20% of young people went to university in 2018, compared with 50% in the highest income areas. Research 35 by University College London revealed that even when candidates from low-income areas had the same exam results, they were much less likely to apply to university than candidates from high-income areas. (Source: adapted from https://www.theguardian.com/education/2018/dec/16/change-in-student-loan- accounting-could-add-10bn-to-national-debt) Extract B Low-income university students twice as likely to drop out than high-income ones The number of students from low-income areas who drop out of university before finishing their degree is at its highest in five years, indicating a considerable waste of scarce educational resources. This news comes at the same time as a drive to recruit students from poorer backgrounds, with universities spending a total of £725 million on 5 access initiatives in the past academic year alone. A number of top universities have started to lower their A level grade offers to students from low-income areas, in an attempt to encourage them to apply. However, there is a danger with ‘enticing’ disadvantaged students through lower grade offers, if universities are not going to provide ongoing support for them once they begin their courses. 10 The latest figures show that 9% of disadvantaged undergraduates do not continue in higher education beyond their first year. In comparison, the average drop-out rate among students from the high-income backgrounds was less than 5%. The gap continues to widen. A report, published by the Office for Fair Access, concluded that: ‘The significance of 15 this for students is huge. Higher education can be a transformational experience that opens doors to rewarding careers and social mobility, but this is only the case if students achieve successful outcomes.’ (Source: adapted from https://www.telegraph.co.uk/news/2017/06/28/number-poor-students-dropping- university-highest-level-five/)
(e) With reference to Figure 1 and Extract A, discuss the benefits of allowing universities to charge higher tuition fees for some degree courses. (15)
October 2020 · AS Paper 1 · Q6(f) 20 marks AO1=4, AO2=4, AO3=6, AO4=6 20-mark essay Either/or economic systemsprice mechanism and surplus
Data and extracts for question 6The market for higher education in the UK Figure 1: Average graduate earnings, according to subject studied, compared to average non-graduate earnings (per cent) 2018 selected subjects. Economics Medicine Architecture Business Top 5 Law Bottom 5 Psychology Philosophy English Agriculture Creative arts –20% 0% 20% 40% (Source: adapted from https://www.ifs.org.uk/publications/13731 The impact of undergraduate degrees on early-career earnings, Research report, November 2018) Figure 2: Student loans outstanding at the end of financial years 2013 to 2018 in England 120 000 100 000 80 000 60 000 102 357 87 629 74 960 40 000 63 776 53 668 45 418 20 000 0 2013 2014 2015 2016 2017 2018 Financial year (Source: adapted from https://www.slc.co.uk/official-statistics/ student-loans-debt-and-repayment/england.aspx) Figure 3: Number of applications to UCAS according to median income of area lowest household highest household income below £23 000 income above £35 400 90 000 80 000 70 000 60 000 50 000 40 000 30 000 20 000 10 000 0 2007 2008 2009 2010 2011 2012 2013 2014 2015 2016 (Source: adapted from https://www.ucas.com/corporate/data-and-analysis/ucas-undergraduate- releases/2018-cycle-applicant-figures-january-deadline) Extract A Rethinking tuition fees The value of a degree is significant. The latest data shows that the median university graduate income was £10 000 more than the average non-graduate income in 2018. This ‘graduate premium’ means graduates will contribute significantly to the economy. In addition, the government will benefit greatly from additional tax revenues. 5 However, funding higher education continues to be a major issue. English universities charge some of the world’s highest fees. Interest rates on student loans are now 6.3%. There are a large number of courses where graduates are likely to earn less than non-graduates, despite an average of £50 000 of debt. The Department for Education estimates that 45% of the value of loans will not be 10 repaid. Outstanding student loans in England totalled more than £100 billion in 2018. By 2023 total outstanding student loans are forecast to rise to £120 billion. One option for revising student fees could be to charge higher fees for courses that are more expensive to teach or that have a better chance of higher earnings. That would make Science or Mathematics degrees more expensive to study than English or 15 Philosophy. At most universities the level of fees is likely to be the same flat rate of £9 250 per year. However, science-based courses need more expensive equipment and courses such as medicine require more teaching time and personal instruction. Tuition fees were introduced in 1998 at £1 000 per year. They are currently £9 250. 20 Economists estimate that the price elasticity of demand for higher education is about –0.5. Charging £9 250 a year for an undergraduate degree makes England very expensive by international standards. Scotland has no fees for Scottish students, and fees in Wales and Northern Ireland are significantly lower. Much of Europe has low or no fees and Germany, which used to charge fees, has abolished them, replacing them with a graduate tax. 25 The only country with comparable fees is the United States. Top private colleges can charge more than the equivalent of £30 000 per year while state colleges can charge local students less than fees in England. Despite this, student numbers at English universities have continued to increase from 450 000 in 1998 to over 700 000 in 2018. Students from all backgrounds are more likely to 30 go to university than ever before. However, applicants from low-income areas are much less likely to go to university than applicants from high-income areas. The Universities and Colleges Admissions Service (UCAS) found that in the most deprived 10% of postal areas about 20% of young people went to university in 2018, compared with 50% in the highest income areas. Research 35 by University College London revealed that even when candidates from low-income areas had the same exam results, they were much less likely to apply to university than candidates from high-income areas. (Source: adapted from https://www.theguardian.com/education/2018/dec/16/change-in-student-loan- accounting-could-add-10bn-to-national-debt) Extract B Low-income university students twice as likely to drop out than high-income ones The number of students from low-income areas who drop out of university before finishing their degree is at its highest in five years, indicating a considerable waste of scarce educational resources. This news comes at the same time as a drive to recruit students from poorer backgrounds, with universities spending a total of £725 million on 5 access initiatives in the past academic year alone. A number of top universities have started to lower their A level grade offers to students from low-income areas, in an attempt to encourage them to apply. However, there is a danger with ‘enticing’ disadvantaged students through lower grade offers, if universities are not going to provide ongoing support for them once they begin their courses. 10 The latest figures show that 9% of disadvantaged undergraduates do not continue in higher education beyond their first year. In comparison, the average drop-out rate among students from the high-income backgrounds was less than 5%. The gap continues to widen. A report, published by the Office for Fair Access, concluded that: ‘The significance of 15 this for students is huge. Higher education can be a transformational experience that opens doors to rewarding careers and social mobility, but this is only the case if students achieve successful outcomes.’ (Source: adapted from https://www.telegraph.co.uk/news/2017/06/28/number-poor-students-dropping- university-highest-level-five/)
(f) Evaluate the possible advantages of a free market approach to providing services such as education. (20)
October 2020 · AS Paper 1 · Q6(g) 20 marks AO1=4, AO2=4, AO3=6, AO4=6 20-mark essay Either/or externalitiesgovernment intervention in markets
Data and extracts for question 6The market for higher education in the UK Figure 1: Average graduate earnings, according to subject studied, compared to average non-graduate earnings (per cent) 2018 selected subjects. Economics Medicine Architecture Business Top 5 Law Bottom 5 Psychology Philosophy English Agriculture Creative arts –20% 0% 20% 40% (Source: adapted from https://www.ifs.org.uk/publications/13731 The impact of undergraduate degrees on early-career earnings, Research report, November 2018) Figure 2: Student loans outstanding at the end of financial years 2013 to 2018 in England 120 000 100 000 80 000 60 000 102 357 87 629 74 960 40 000 63 776 53 668 45 418 20 000 0 2013 2014 2015 2016 2017 2018 Financial year (Source: adapted from https://www.slc.co.uk/official-statistics/ student-loans-debt-and-repayment/england.aspx) Figure 3: Number of applications to UCAS according to median income of area lowest household highest household income below £23 000 income above £35 400 90 000 80 000 70 000 60 000 50 000 40 000 30 000 20 000 10 000 0 2007 2008 2009 2010 2011 2012 2013 2014 2015 2016 (Source: adapted from https://www.ucas.com/corporate/data-and-analysis/ucas-undergraduate- releases/2018-cycle-applicant-figures-january-deadline) Extract A Rethinking tuition fees The value of a degree is significant. The latest data shows that the median university graduate income was £10 000 more than the average non-graduate income in 2018. This ‘graduate premium’ means graduates will contribute significantly to the economy. In addition, the government will benefit greatly from additional tax revenues. 5 However, funding higher education continues to be a major issue. English universities charge some of the world’s highest fees. Interest rates on student loans are now 6.3%. There are a large number of courses where graduates are likely to earn less than non-graduates, despite an average of £50 000 of debt. The Department for Education estimates that 45% of the value of loans will not be 10 repaid. Outstanding student loans in England totalled more than £100 billion in 2018. By 2023 total outstanding student loans are forecast to rise to £120 billion. One option for revising student fees could be to charge higher fees for courses that are more expensive to teach or that have a better chance of higher earnings. That would make Science or Mathematics degrees more expensive to study than English or 15 Philosophy. At most universities the level of fees is likely to be the same flat rate of £9 250 per year. However, science-based courses need more expensive equipment and courses such as medicine require more teaching time and personal instruction. Tuition fees were introduced in 1998 at £1 000 per year. They are currently £9 250. 20 Economists estimate that the price elasticity of demand for higher education is about –0.5. Charging £9 250 a year for an undergraduate degree makes England very expensive by international standards. Scotland has no fees for Scottish students, and fees in Wales and Northern Ireland are significantly lower. Much of Europe has low or no fees and Germany, which used to charge fees, has abolished them, replacing them with a graduate tax. 25 The only country with comparable fees is the United States. Top private colleges can charge more than the equivalent of £30 000 per year while state colleges can charge local students less than fees in England. Despite this, student numbers at English universities have continued to increase from 450 000 in 1998 to over 700 000 in 2018. Students from all backgrounds are more likely to 30 go to university than ever before. However, applicants from low-income areas are much less likely to go to university than applicants from high-income areas. The Universities and Colleges Admissions Service (UCAS) found that in the most deprived 10% of postal areas about 20% of young people went to university in 2018, compared with 50% in the highest income areas. Research 35 by University College London revealed that even when candidates from low-income areas had the same exam results, they were much less likely to apply to university than candidates from high-income areas. (Source: adapted from https://www.theguardian.com/education/2018/dec/16/change-in-student-loan- accounting-could-add-10bn-to-national-debt) Extract B Low-income university students twice as likely to drop out than high-income ones The number of students from low-income areas who drop out of university before finishing their degree is at its highest in five years, indicating a considerable waste of scarce educational resources. This news comes at the same time as a drive to recruit students from poorer backgrounds, with universities spending a total of £725 million on 5 access initiatives in the past academic year alone. A number of top universities have started to lower their A level grade offers to students from low-income areas, in an attempt to encourage them to apply. However, there is a danger with ‘enticing’ disadvantaged students through lower grade offers, if universities are not going to provide ongoing support for them once they begin their courses. 10 The latest figures show that 9% of disadvantaged undergraduates do not continue in higher education beyond their first year. In comparison, the average drop-out rate among students from the high-income backgrounds was less than 5%. The gap continues to widen. A report, published by the Office for Fair Access, concluded that: ‘The significance of 15 this for students is huge. Higher education can be a transformational experience that opens doors to rewarding careers and social mobility, but this is only the case if students achieve successful outcomes.’ (Source: adapted from https://www.telegraph.co.uk/news/2017/06/28/number-poor-students-dropping- university-highest-level-five/)
(g) Evaluate whether government intervention is able to correct market failure in education. (20)
October 2020 · AS Paper 2 · Q3(b) 3 marks AO1=1, AO2=1, AO3=1 Short answer balance of paymentsaggregate demand
Data and extracts for question 33 The UK’s net monthly balance of trade in goods and services, by value, January 2014 to January 2018, is shown in the chart below. 2 0 £ billions -2 -4 -6 2015 2016 2017 2018 2014 (Source: adapted from https://tradingeconomics.com/united-kingdom/balance-of-trade)
(b) Explain one likely reason for the UK’s balance of trade in goods and services over the period shown. Refer to the chart on page 6 in your answer. (3)
October 2020 · AS Paper 2 · Q5(c) 2 marks AO2=2 Calculation measuring economic growth
Data and extracts for question 55 The table below shows the UK’s Gross National Income (GNI) between 2014 and 2017. Gross National Year Income (£ million) 2014 1 806 468 2015 1 852 845 2016 1 920 116 2017 2 008 593 (Source: adapted from www.ons.gov.uk/economy/ © Crown Copyright)
(c) Using 2014 as the base year, calculate the index number for 2016. You are advised to show your working. (2)
October 2020 · AS Paper 2 · Q6(a) 4 marks AO1=2, AO2=2 Short answer fiscal and monetary policy
Data and extracts for question 6UK government budget and household consumption Figure 1: UK government spending and tax revenue as % of GDP, 1980–2018 50 45 40 35 30 25 0 1980 2018 1990 2000 2010 Government spending Government tax revenue (Source: adapted from Office for Budget Responsibility (OBR), http://cdn.obr.uk/EFO- MaRch_2018.pdf © Crown copyright 2018) Figure 2: UK real household consumption, quarterly, £ billions, 1997 to 2018 (Source: adapted from ONS, www.ons.gov.uk/economy/nationalaccounts/satelliteaccounts/ bulletins/consumertrends/apriltojune2018) Extract A UK household consumption Despite the slow growth in real household disposable incomes, consumer spending rose in 2017. Annual spending per person increased by £589, when compared with 2016. This may have reflected UK households’ delay in adjusting to the increase in inflation that was associated with the fall in the exchange rate of the British pound. The increase 5 in consumption has also been driven by low interest rates. In 2017 UK house prices increased by an average of 5.1%. UK consumers have financed most of their spending by borrowing on credit cards in order to maintain their living standards. In 2017 borrowing on credit cards rose by 9.6%, the second-highest level since before the financial crisis. This has increased the Bank of 10 England’s concerns about the sustainability of borrowing, given the slow growth in real incomes. The Bank has also indicated that the base interest rate was likely to rise faster than previously expected. More expensive credit could therefore constrain the ability of households to spend. (Source: adapted from ‘Consumer Trends UK’, ONS, https://www.ons.gov.uk/economy/ nationalaccounts/ satelliteaccounts/bulletins/consumertrends/octobertodecember2017 and © Crown copyright 2018) Extract B Reduction of the UK’s budget deficit Since 2010 many economists have believed that the biggest problem facing the government was the rising budget deficit. In late 2017, the UK’s Chancellor of the Exchequer announced that the government would continue with its plans to decrease its budget deficit. To address this issue, the government further reduced welfare payments 5 and introduced extra spending cuts in the public sector. The UK government had estimated that the fall in UK productivity since the financial crisis was only temporary. However, it has now accepted that this fall in the level of productivity is a long-term issue. Subsequently, the UK’s forecast long-term trend rate of growth was reduced. Slower growth means lower tax receipts, higher spending and a 10 bigger budget deficit. Some economists have suggested that the government should not pursue additional reductions in the budget deficit. They have also claimed that the responsibility of the government is not to balance the budget but to balance the economy by moving it to full employment. 15 (Source: adapted from ‘Philip Hammond must ditch deficit reduction and invest. But will he?’, The Guardian, https:// www.theguardian.com/politics/2017/nov/19/philip-hammond-must-ditch-deficit- reduction-and-invest-but-will-he’)
(a) With reference to Figure 1, explain the term ‘balanced government budget’. (4)
October 2020 · AS Paper 2 · Q6(b) 5 marks AO1=1, AO2=2, AO3=2 Short answer aggregate demand
Data and extracts for question 6UK government budget and household consumption Figure 1: UK government spending and tax revenue as % of GDP, 1980–2018 50 45 40 35 30 25 0 1980 2018 1990 2000 2010 Government spending Government tax revenue (Source: adapted from Office for Budget Responsibility (OBR), http://cdn.obr.uk/EFO- MaRch_2018.pdf © Crown copyright 2018) Figure 2: UK real household consumption, quarterly, £ billions, 1997 to 2018 (Source: adapted from ONS, www.ons.gov.uk/economy/nationalaccounts/satelliteaccounts/ bulletins/consumertrends/apriltojune2018) Extract A UK household consumption Despite the slow growth in real household disposable incomes, consumer spending rose in 2017. Annual spending per person increased by £589, when compared with 2016. This may have reflected UK households’ delay in adjusting to the increase in inflation that was associated with the fall in the exchange rate of the British pound. The increase 5 in consumption has also been driven by low interest rates. In 2017 UK house prices increased by an average of 5.1%. UK consumers have financed most of their spending by borrowing on credit cards in order to maintain their living standards. In 2017 borrowing on credit cards rose by 9.6%, the second-highest level since before the financial crisis. This has increased the Bank of 10 England’s concerns about the sustainability of borrowing, given the slow growth in real incomes. The Bank has also indicated that the base interest rate was likely to rise faster than previously expected. More expensive credit could therefore constrain the ability of households to spend. (Source: adapted from ‘Consumer Trends UK’, ONS, https://www.ons.gov.uk/economy/ nationalaccounts/ satelliteaccounts/bulletins/consumertrends/octobertodecember2017 and © Crown copyright 2018) Extract B Reduction of the UK’s budget deficit Since 2010 many economists have believed that the biggest problem facing the government was the rising budget deficit. In late 2017, the UK’s Chancellor of the Exchequer announced that the government would continue with its plans to decrease its budget deficit. To address this issue, the government further reduced welfare payments 5 and introduced extra spending cuts in the public sector. The UK government had estimated that the fall in UK productivity since the financial crisis was only temporary. However, it has now accepted that this fall in the level of productivity is a long-term issue. Subsequently, the UK’s forecast long-term trend rate of growth was reduced. Slower growth means lower tax receipts, higher spending and a 10 bigger budget deficit. Some economists have suggested that the government should not pursue additional reductions in the budget deficit. They have also claimed that the responsibility of the government is not to balance the budget but to balance the economy by moving it to full employment. 15 (Source: adapted from ‘Philip Hammond must ditch deficit reduction and invest. But will he?’, The Guardian, https:// www.theguardian.com/politics/2017/nov/19/philip-hammond-must-ditch-deficit- reduction-and-invest-but-will-he’)
(b) Explain the likely effect of a fall in the exchange rate of the British pound on aggregate demand. Refer to Extract A in your answer. (5)
October 2020 · AS Paper 2 · Q6(c) 6 marks AO1=2, AO2=2, AO3=2 Short answer aggregate demand
Data and extracts for question 6UK government budget and household consumption Figure 1: UK government spending and tax revenue as % of GDP, 1980–2018 50 45 40 35 30 25 0 1980 2018 1990 2000 2010 Government spending Government tax revenue (Source: adapted from Office for Budget Responsibility (OBR), http://cdn.obr.uk/EFO- MaRch_2018.pdf © Crown copyright 2018) Figure 2: UK real household consumption, quarterly, £ billions, 1997 to 2018 (Source: adapted from ONS, www.ons.gov.uk/economy/nationalaccounts/satelliteaccounts/ bulletins/consumertrends/apriltojune2018) Extract A UK household consumption Despite the slow growth in real household disposable incomes, consumer spending rose in 2017. Annual spending per person increased by £589, when compared with 2016. This may have reflected UK households’ delay in adjusting to the increase in inflation that was associated with the fall in the exchange rate of the British pound. The increase 5 in consumption has also been driven by low interest rates. In 2017 UK house prices increased by an average of 5.1%. UK consumers have financed most of their spending by borrowing on credit cards in order to maintain their living standards. In 2017 borrowing on credit cards rose by 9.6%, the second-highest level since before the financial crisis. This has increased the Bank of 10 England’s concerns about the sustainability of borrowing, given the slow growth in real incomes. The Bank has also indicated that the base interest rate was likely to rise faster than previously expected. More expensive credit could therefore constrain the ability of households to spend. (Source: adapted from ‘Consumer Trends UK’, ONS, https://www.ons.gov.uk/economy/ nationalaccounts/ satelliteaccounts/bulletins/consumertrends/octobertodecember2017 and © Crown copyright 2018) Extract B Reduction of the UK’s budget deficit Since 2010 many economists have believed that the biggest problem facing the government was the rising budget deficit. In late 2017, the UK’s Chancellor of the Exchequer announced that the government would continue with its plans to decrease its budget deficit. To address this issue, the government further reduced welfare payments 5 and introduced extra spending cuts in the public sector. The UK government had estimated that the fall in UK productivity since the financial crisis was only temporary. However, it has now accepted that this fall in the level of productivity is a long-term issue. Subsequently, the UK’s forecast long-term trend rate of growth was reduced. Slower growth means lower tax receipts, higher spending and a 10 bigger budget deficit. Some economists have suggested that the government should not pursue additional reductions in the budget deficit. They have also claimed that the responsibility of the government is not to balance the budget but to balance the economy by moving it to full employment. 15 (Source: adapted from ‘Philip Hammond must ditch deficit reduction and invest. But will he?’, The Guardian, https:// www.theguardian.com/politics/2017/nov/19/philip-hammond-must-ditch-deficit- reduction-and-invest-but-will-he’)
(c) With reference to Figure 2 and Extract A, explain two likely influences on the level of UK real household consumption. (6)
October 2020 · AS Paper 2 · Q6(d) 10 marks AO1=2, AO2=2, AO3=2, AO4=4 10-mark response national income and the multiplieraggregate demand
Data and extracts for question 6UK government budget and household consumption Figure 1: UK government spending and tax revenue as % of GDP, 1980–2018 50 45 40 35 30 25 0 1980 2018 1990 2000 2010 Government spending Government tax revenue (Source: adapted from Office for Budget Responsibility (OBR), http://cdn.obr.uk/EFO- MaRch_2018.pdf © Crown copyright 2018) Figure 2: UK real household consumption, quarterly, £ billions, 1997 to 2018 (Source: adapted from ONS, www.ons.gov.uk/economy/nationalaccounts/satelliteaccounts/ bulletins/consumertrends/apriltojune2018) Extract A UK household consumption Despite the slow growth in real household disposable incomes, consumer spending rose in 2017. Annual spending per person increased by £589, when compared with 2016. This may have reflected UK households’ delay in adjusting to the increase in inflation that was associated with the fall in the exchange rate of the British pound. The increase 5 in consumption has also been driven by low interest rates. In 2017 UK house prices increased by an average of 5.1%. UK consumers have financed most of their spending by borrowing on credit cards in order to maintain their living standards. In 2017 borrowing on credit cards rose by 9.6%, the second-highest level since before the financial crisis. This has increased the Bank of 10 England’s concerns about the sustainability of borrowing, given the slow growth in real incomes. The Bank has also indicated that the base interest rate was likely to rise faster than previously expected. More expensive credit could therefore constrain the ability of households to spend. (Source: adapted from ‘Consumer Trends UK’, ONS, https://www.ons.gov.uk/economy/ nationalaccounts/ satelliteaccounts/bulletins/consumertrends/octobertodecember2017 and © Crown copyright 2018) Extract B Reduction of the UK’s budget deficit Since 2010 many economists have believed that the biggest problem facing the government was the rising budget deficit. In late 2017, the UK’s Chancellor of the Exchequer announced that the government would continue with its plans to decrease its budget deficit. To address this issue, the government further reduced welfare payments 5 and introduced extra spending cuts in the public sector. The UK government had estimated that the fall in UK productivity since the financial crisis was only temporary. However, it has now accepted that this fall in the level of productivity is a long-term issue. Subsequently, the UK’s forecast long-term trend rate of growth was reduced. Slower growth means lower tax receipts, higher spending and a 10 bigger budget deficit. Some economists have suggested that the government should not pursue additional reductions in the budget deficit. They have also claimed that the responsibility of the government is not to balance the budget but to balance the economy by moving it to full employment. 15 (Source: adapted from ‘Philip Hammond must ditch deficit reduction and invest. But will he?’, The Guardian, https:// www.theguardian.com/politics/2017/nov/19/philip-hammond-must-ditch-deficit- reduction-and-invest-but-will-he’)
(d) Assess the likely impact on the UK economy of an ‘increase in consumption’ (Extract A, lines 5–6). Use an aggregate demand and aggregate supply diagram in your answer. (10)
October 2020 · AS Paper 2 · Q6(e) 15 marks AO1=3, AO2=3, AO3=3, AO4=6 15-mark response Hard economic growth and the trade cycleaggregate supply
Data and extracts for question 6UK government budget and household consumption Figure 1: UK government spending and tax revenue as % of GDP, 1980–2018 50 45 40 35 30 25 0 1980 2018 1990 2000 2010 Government spending Government tax revenue (Source: adapted from Office for Budget Responsibility (OBR), http://cdn.obr.uk/EFO- MaRch_2018.pdf © Crown copyright 2018) Figure 2: UK real household consumption, quarterly, £ billions, 1997 to 2018 (Source: adapted from ONS, www.ons.gov.uk/economy/nationalaccounts/satelliteaccounts/ bulletins/consumertrends/apriltojune2018) Extract A UK household consumption Despite the slow growth in real household disposable incomes, consumer spending rose in 2017. Annual spending per person increased by £589, when compared with 2016. This may have reflected UK households’ delay in adjusting to the increase in inflation that was associated with the fall in the exchange rate of the British pound. The increase 5 in consumption has also been driven by low interest rates. In 2017 UK house prices increased by an average of 5.1%. UK consumers have financed most of their spending by borrowing on credit cards in order to maintain their living standards. In 2017 borrowing on credit cards rose by 9.6%, the second-highest level since before the financial crisis. This has increased the Bank of 10 England’s concerns about the sustainability of borrowing, given the slow growth in real incomes. The Bank has also indicated that the base interest rate was likely to rise faster than previously expected. More expensive credit could therefore constrain the ability of households to spend. (Source: adapted from ‘Consumer Trends UK’, ONS, https://www.ons.gov.uk/economy/ nationalaccounts/ satelliteaccounts/bulletins/consumertrends/octobertodecember2017 and © Crown copyright 2018) Extract B Reduction of the UK’s budget deficit Since 2010 many economists have believed that the biggest problem facing the government was the rising budget deficit. In late 2017, the UK’s Chancellor of the Exchequer announced that the government would continue with its plans to decrease its budget deficit. To address this issue, the government further reduced welfare payments 5 and introduced extra spending cuts in the public sector. The UK government had estimated that the fall in UK productivity since the financial crisis was only temporary. However, it has now accepted that this fall in the level of productivity is a long-term issue. Subsequently, the UK’s forecast long-term trend rate of growth was reduced. Slower growth means lower tax receipts, higher spending and a 10 bigger budget deficit. Some economists have suggested that the government should not pursue additional reductions in the budget deficit. They have also claimed that the responsibility of the government is not to balance the budget but to balance the economy by moving it to full employment. 15 (Source: adapted from ‘Philip Hammond must ditch deficit reduction and invest. But will he?’, The Guardian, https:// www.theguardian.com/politics/2017/nov/19/philip-hammond-must-ditch-deficit- reduction-and-invest-but-will-he’)
(e) Discuss the factors that might explain why ‘the UK’s forecast long-term trend rate of growth was reduced’ (Extract B lines 9–10). (15)
October 2020 · AS Paper 2 · Q6(f) 20 marks AO1=4, AO2=4, AO3=6, AO4=6 20-mark essay Either/or supply side policies
Data and extracts for question 6UK government budget and household consumption Figure 1: UK government spending and tax revenue as % of GDP, 1980–2018 50 45 40 35 30 25 0 1980 2018 1990 2000 2010 Government spending Government tax revenue (Source: adapted from Office for Budget Responsibility (OBR), http://cdn.obr.uk/EFO- MaRch_2018.pdf © Crown copyright 2018) Figure 2: UK real household consumption, quarterly, £ billions, 1997 to 2018 (Source: adapted from ONS, www.ons.gov.uk/economy/nationalaccounts/satelliteaccounts/ bulletins/consumertrends/apriltojune2018) Extract A UK household consumption Despite the slow growth in real household disposable incomes, consumer spending rose in 2017. Annual spending per person increased by £589, when compared with 2016. This may have reflected UK households’ delay in adjusting to the increase in inflation that was associated with the fall in the exchange rate of the British pound. The increase 5 in consumption has also been driven by low interest rates. In 2017 UK house prices increased by an average of 5.1%. UK consumers have financed most of their spending by borrowing on credit cards in order to maintain their living standards. In 2017 borrowing on credit cards rose by 9.6%, the second-highest level since before the financial crisis. This has increased the Bank of 10 England’s concerns about the sustainability of borrowing, given the slow growth in real incomes. The Bank has also indicated that the base interest rate was likely to rise faster than previously expected. More expensive credit could therefore constrain the ability of households to spend. (Source: adapted from ‘Consumer Trends UK’, ONS, https://www.ons.gov.uk/economy/ nationalaccounts/ satelliteaccounts/bulletins/consumertrends/octobertodecember2017 and © Crown copyright 2018) Extract B Reduction of the UK’s budget deficit Since 2010 many economists have believed that the biggest problem facing the government was the rising budget deficit. In late 2017, the UK’s Chancellor of the Exchequer announced that the government would continue with its plans to decrease its budget deficit. To address this issue, the government further reduced welfare payments 5 and introduced extra spending cuts in the public sector. The UK government had estimated that the fall in UK productivity since the financial crisis was only temporary. However, it has now accepted that this fall in the level of productivity is a long-term issue. Subsequently, the UK’s forecast long-term trend rate of growth was reduced. Slower growth means lower tax receipts, higher spending and a 10 bigger budget deficit. Some economists have suggested that the government should not pursue additional reductions in the budget deficit. They have also claimed that the responsibility of the government is not to balance the budget but to balance the economy by moving it to full employment. 15 (Source: adapted from ‘Philip Hammond must ditch deficit reduction and invest. But will he?’, The Guardian, https:// www.theguardian.com/politics/2017/nov/19/philip-hammond-must-ditch-deficit- reduction-and-invest-but-will-he’)
(f) Evaluate supply-side policies that could be used to increase the UK’s rate of economic growth. (20)
October 2020 · AS Paper 2 · Q6(g) 20 marks AO1=4, AO2=4, AO3=6, AO4=6 20-mark essay Either/or fiscal and monetary policymacroeconomic objectives
Data and extracts for question 6UK government budget and household consumption Figure 1: UK government spending and tax revenue as % of GDP, 1980–2018 50 45 40 35 30 25 0 1980 2018 1990 2000 2010 Government spending Government tax revenue (Source: adapted from Office for Budget Responsibility (OBR), http://cdn.obr.uk/EFO- MaRch_2018.pdf © Crown copyright 2018) Figure 2: UK real household consumption, quarterly, £ billions, 1997 to 2018 (Source: adapted from ONS, www.ons.gov.uk/economy/nationalaccounts/satelliteaccounts/ bulletins/consumertrends/apriltojune2018) Extract A UK household consumption Despite the slow growth in real household disposable incomes, consumer spending rose in 2017. Annual spending per person increased by £589, when compared with 2016. This may have reflected UK households’ delay in adjusting to the increase in inflation that was associated with the fall in the exchange rate of the British pound. The increase 5 in consumption has also been driven by low interest rates. In 2017 UK house prices increased by an average of 5.1%. UK consumers have financed most of their spending by borrowing on credit cards in order to maintain their living standards. In 2017 borrowing on credit cards rose by 9.6%, the second-highest level since before the financial crisis. This has increased the Bank of 10 England’s concerns about the sustainability of borrowing, given the slow growth in real incomes. The Bank has also indicated that the base interest rate was likely to rise faster than previously expected. More expensive credit could therefore constrain the ability of households to spend. (Source: adapted from ‘Consumer Trends UK’, ONS, https://www.ons.gov.uk/economy/ nationalaccounts/ satelliteaccounts/bulletins/consumertrends/octobertodecember2017 and © Crown copyright 2018) Extract B Reduction of the UK’s budget deficit Since 2010 many economists have believed that the biggest problem facing the government was the rising budget deficit. In late 2017, the UK’s Chancellor of the Exchequer announced that the government would continue with its plans to decrease its budget deficit. To address this issue, the government further reduced welfare payments 5 and introduced extra spending cuts in the public sector. The UK government had estimated that the fall in UK productivity since the financial crisis was only temporary. However, it has now accepted that this fall in the level of productivity is a long-term issue. Subsequently, the UK’s forecast long-term trend rate of growth was reduced. Slower growth means lower tax receipts, higher spending and a 10 bigger budget deficit. Some economists have suggested that the government should not pursue additional reductions in the budget deficit. They have also claimed that the responsibility of the government is not to balance the budget but to balance the economy by moving it to full employment. 15 (Source: adapted from ‘Philip Hammond must ditch deficit reduction and invest. But will he?’, The Guardian, https:// www.theguardian.com/politics/2017/nov/19/philip-hammond-must-ditch-deficit- reduction-and-invest-but-will-he’)
(g) Evaluate the likely macroeconomic effects of the UK government pursuing a policy of reducing its budget deficit. (20)
October 2020 · Paper 1 · Q1(a) 4 marks AO1=2, AO2=2 Diagram indirect taxes and subsidies
Data and extracts for question 11 Fuel duty is an excise tax imposed on the sale of petrol, included in the price paid by consumers, set at 58 pence per litre. (Source: https://www.gov.uk/tax-on-shopping/fuel-duty)
(a) Draw a supply and demand diagram to show the incidence of a specific petrol tax on consumers and producers. (4)
October 2020 · Paper 1 · Q4(a) 2 marks AO1=1, AO3=1 Short answer Hard revenues costs and profits
Data and extracts for question 44 The following illustrates the daily average cost curve for a doughnut producer: Costs (£) Average Cost 0 Z Output
(a) Explain what happens to total cost at output levels greater than Z. (2)
October 2020 · Paper 1 · Q5(a) 2 marks AO1=1, AO3=1 Short answer business growth and objectives
Data and extracts for question 55 ‘Bettys’ is a luxury café, first opened in Harrogate in 1919 specialising in afternoon tea service. Since then it has opened a further five branches in Yorkshire. It has no plans to increase the number of cafés. The six branches have 2 million customers a year. (Source adapted from: https://www.forbes.com/sites/sarahturner/2018/03/22/the-famed-yorkshire-cafe- that-blends-nostalgia-with-profits-and-conservation/#7eb50cec7a4e)
(a) Explain one likely reason why this business has remained small. (2)
October 2020 · Paper 1 · Q5(b) 2 marks AO1=2 Short answer business growth and objectives
Data and extracts for question 55 ‘Bettys’ is a luxury café, first opened in Harrogate in 1919 specialising in afternoon tea service. Since then it has opened a further five branches in Yorkshire. It has no plans to increase the number of cafés. The six branches have 2 million customers a year. (Source adapted from: https://www.forbes.com/sites/sarahturner/2018/03/22/the-famed-yorkshire-cafe- that-blends-nostalgia-with-profits-and-conservation/#7eb50cec7a4e)
(b) Explain why the previous expansion of this business could be described as ‘organic growth’. (2)
October 2020 · Paper 1 · Q6(a) 5 marks AO1=1, AO2=1, AO3=3 Diagram indirect taxes and subsidiessupply and demand
Data and extracts for question 6The UK Rail Industry Figure 1: UK government subsidy to Northern, a train operating company in Northern England 290 287.9 285 280 277.0 275 0 2017 2018 (Source adapted from: https://www.theyworkforyou.com/wrans/?id=2018-10-18.181280.h) Figure 2: Rail passenger kilometres travelled per year in the UK, billions 70 65 billion (2018) 60 50 40 30 20 10 0 1985 1995 2005 2015 (Source adapted from: fullfact.org) Figure 3: Price of a single off-peak train journey, Edinburgh to Leeds Saturday 22nd December 2018 19:00 hours Adult Young Persons (16–25) Railcard £105.30 £69.50 (Source: https://www.lner.co.uk/buy-tickets/booking-engine) Extract A The case for nationalisation Privatisation has not made the rail industry cheaper to operate, despite the promise from one government source that it would see private companies bringing: “more competition, greater efficiency and a wider choice of services”. One reason, suggest the critics, is fragmentation. Instead of pushing British Rail into 5 the private sector as a single supplier the government chose to break it into three components of track, train operators and rolling stock i.e. the trains and carriages. This has encouraged each part of the rail industry to prioritise its own profits rather than collaborating to improve the system. Privatisation, meanwhile, never really worked. The rail network of 2 500 stations and 10 32 000 km of tracks was renationalised in 2001. This has encouraged the government’s transport secretary, a supporter of private sector involvement, to argue that the state Network Rail monopoly should be removed so that companies can bid to build new rail lines to upgrade the railway. The privately-owned train operators are now the subject of fierce criticism, due to 15 overcrowding and cancelled services. Private companies are supposed to compete to win a bid to be the train operator for a region for a short number of years. However in recent years the number of private companies bidding or renewing their contract as rail operators has fallen. In May 2018 the government rescued the East Coast line by renationalising it. The line had been run by the private rail operator Virgin Rail, which was 20 suffering lower passenger numbers and revenue than forecast. Some argue that there is a simple solution: reunite track and train in the only feasible manner, nationalisation. (Source adapted from: https://www.ft.com/content/d82848ca-f7ba-11e7-88f7-5465a6ce1a00) Extract B Southern Rail boss paid £495 000 The Chief Executive of Southern Rail, the private-sector train operator that has become associated with delays, losses, cancellations and strikes, was paid £495 000 last year. This increased calls for nationalisation and a maximum wage for executives at companies with government contracts. In contrast the average base pay for a train driver in the UK is 5 £47 705, although they can earn up to £63 000. Nearly a third of Southern Rail trains were late in 2016 as it tried to deal with a labour dispute that involved extensive strike action. The rail trade unions are opposed to planned changes to the role of train guards, which they claim will put passenger safety at risk. 10 (Source adapted from: Rob Davies, The Guardian 10 April 2017 https://www.theguardian.com/business/2017/apr/10/southern-rail-boss-double-pay-rise)
(a) Refer to Figure 1. Explain the likely effect of the change in subsidy levels between 2017 and 2018 on rail fares. Include a supply and demand diagram in your answer. (5)
October 2020 · Paper 1 · Q6(b) 8 marks AO1=2, AO2=2, AO3=2, AO4=2 8-mark response supply and demand
Data and extracts for question 6The UK Rail Industry Figure 1: UK government subsidy to Northern, a train operating company in Northern England 290 287.9 285 280 277.0 275 0 2017 2018 (Source adapted from: https://www.theyworkforyou.com/wrans/?id=2018-10-18.181280.h) Figure 2: Rail passenger kilometres travelled per year in the UK, billions 70 65 billion (2018) 60 50 40 30 20 10 0 1985 1995 2005 2015 (Source adapted from: fullfact.org) Figure 3: Price of a single off-peak train journey, Edinburgh to Leeds Saturday 22nd December 2018 19:00 hours Adult Young Persons (16–25) Railcard £105.30 £69.50 (Source: https://www.lner.co.uk/buy-tickets/booking-engine) Extract A The case for nationalisation Privatisation has not made the rail industry cheaper to operate, despite the promise from one government source that it would see private companies bringing: “more competition, greater efficiency and a wider choice of services”. One reason, suggest the critics, is fragmentation. Instead of pushing British Rail into 5 the private sector as a single supplier the government chose to break it into three components of track, train operators and rolling stock i.e. the trains and carriages. This has encouraged each part of the rail industry to prioritise its own profits rather than collaborating to improve the system. Privatisation, meanwhile, never really worked. The rail network of 2 500 stations and 10 32 000 km of tracks was renationalised in 2001. This has encouraged the government’s transport secretary, a supporter of private sector involvement, to argue that the state Network Rail monopoly should be removed so that companies can bid to build new rail lines to upgrade the railway. The privately-owned train operators are now the subject of fierce criticism, due to 15 overcrowding and cancelled services. Private companies are supposed to compete to win a bid to be the train operator for a region for a short number of years. However in recent years the number of private companies bidding or renewing their contract as rail operators has fallen. In May 2018 the government rescued the East Coast line by renationalising it. The line had been run by the private rail operator Virgin Rail, which was 20 suffering lower passenger numbers and revenue than forecast. Some argue that there is a simple solution: reunite track and train in the only feasible manner, nationalisation. (Source adapted from: https://www.ft.com/content/d82848ca-f7ba-11e7-88f7-5465a6ce1a00) Extract B Southern Rail boss paid £495 000 The Chief Executive of Southern Rail, the private-sector train operator that has become associated with delays, losses, cancellations and strikes, was paid £495 000 last year. This increased calls for nationalisation and a maximum wage for executives at companies with government contracts. In contrast the average base pay for a train driver in the UK is 5 £47 705, although they can earn up to £63 000. Nearly a third of Southern Rail trains were late in 2016 as it tried to deal with a labour dispute that involved extensive strike action. The rail trade unions are opposed to planned changes to the role of train guards, which they claim will put passenger safety at risk. 10 (Source adapted from: Rob Davies, The Guardian 10 April 2017 https://www.theguardian.com/business/2017/apr/10/southern-rail-boss-double-pay-rise)
(b) With reference to Figure 2, examine two possible factors which may have influenced demand for rail travel since 2008. (8)
October 2020 · Paper 1 · Q6(c) 10 marks AO1=2, AO2=2, AO3=2, AO4=4 10-mark response competition policy and regulationlabour market
Data and extracts for question 6The UK Rail Industry Figure 1: UK government subsidy to Northern, a train operating company in Northern England 290 287.9 285 280 277.0 275 0 2017 2018 (Source adapted from: https://www.theyworkforyou.com/wrans/?id=2018-10-18.181280.h) Figure 2: Rail passenger kilometres travelled per year in the UK, billions 70 65 billion (2018) 60 50 40 30 20 10 0 1985 1995 2005 2015 (Source adapted from: fullfact.org) Figure 3: Price of a single off-peak train journey, Edinburgh to Leeds Saturday 22nd December 2018 19:00 hours Adult Young Persons (16–25) Railcard £105.30 £69.50 (Source: https://www.lner.co.uk/buy-tickets/booking-engine) Extract A The case for nationalisation Privatisation has not made the rail industry cheaper to operate, despite the promise from one government source that it would see private companies bringing: “more competition, greater efficiency and a wider choice of services”. One reason, suggest the critics, is fragmentation. Instead of pushing British Rail into 5 the private sector as a single supplier the government chose to break it into three components of track, train operators and rolling stock i.e. the trains and carriages. This has encouraged each part of the rail industry to prioritise its own profits rather than collaborating to improve the system. Privatisation, meanwhile, never really worked. The rail network of 2 500 stations and 10 32 000 km of tracks was renationalised in 2001. This has encouraged the government’s transport secretary, a supporter of private sector involvement, to argue that the state Network Rail monopoly should be removed so that companies can bid to build new rail lines to upgrade the railway. The privately-owned train operators are now the subject of fierce criticism, due to 15 overcrowding and cancelled services. Private companies are supposed to compete to win a bid to be the train operator for a region for a short number of years. However in recent years the number of private companies bidding or renewing their contract as rail operators has fallen. In May 2018 the government rescued the East Coast line by renationalising it. The line had been run by the private rail operator Virgin Rail, which was 20 suffering lower passenger numbers and revenue than forecast. Some argue that there is a simple solution: reunite track and train in the only feasible manner, nationalisation. (Source adapted from: https://www.ft.com/content/d82848ca-f7ba-11e7-88f7-5465a6ce1a00) Extract B Southern Rail boss paid £495 000 The Chief Executive of Southern Rail, the private-sector train operator that has become associated with delays, losses, cancellations and strikes, was paid £495 000 last year. This increased calls for nationalisation and a maximum wage for executives at companies with government contracts. In contrast the average base pay for a train driver in the UK is 5 £47 705, although they can earn up to £63 000. Nearly a third of Southern Rail trains were late in 2016 as it tried to deal with a labour dispute that involved extensive strike action. The rail trade unions are opposed to planned changes to the role of train guards, which they claim will put passenger safety at risk. 10 (Source adapted from: Rob Davies, The Guardian 10 April 2017 https://www.theguardian.com/business/2017/apr/10/southern-rail-boss-double-pay-rise)
(c) Assess whether complete nationalisation of the rail industry might protect employees. (10)
October 2020 · Paper 1 · Q6(d) 12 marks AO1=2, AO2=2, AO3=4, AO4=4 12-mark response monopoly
Data and extracts for question 6The UK Rail Industry Figure 1: UK government subsidy to Northern, a train operating company in Northern England 290 287.9 285 280 277.0 275 0 2017 2018 (Source adapted from: https://www.theyworkforyou.com/wrans/?id=2018-10-18.181280.h) Figure 2: Rail passenger kilometres travelled per year in the UK, billions 70 65 billion (2018) 60 50 40 30 20 10 0 1985 1995 2005 2015 (Source adapted from: fullfact.org) Figure 3: Price of a single off-peak train journey, Edinburgh to Leeds Saturday 22nd December 2018 19:00 hours Adult Young Persons (16–25) Railcard £105.30 £69.50 (Source: https://www.lner.co.uk/buy-tickets/booking-engine) Extract A The case for nationalisation Privatisation has not made the rail industry cheaper to operate, despite the promise from one government source that it would see private companies bringing: “more competition, greater efficiency and a wider choice of services”. One reason, suggest the critics, is fragmentation. Instead of pushing British Rail into 5 the private sector as a single supplier the government chose to break it into three components of track, train operators and rolling stock i.e. the trains and carriages. This has encouraged each part of the rail industry to prioritise its own profits rather than collaborating to improve the system. Privatisation, meanwhile, never really worked. The rail network of 2 500 stations and 10 32 000 km of tracks was renationalised in 2001. This has encouraged the government’s transport secretary, a supporter of private sector involvement, to argue that the state Network Rail monopoly should be removed so that companies can bid to build new rail lines to upgrade the railway. The privately-owned train operators are now the subject of fierce criticism, due to 15 overcrowding and cancelled services. Private companies are supposed to compete to win a bid to be the train operator for a region for a short number of years. However in recent years the number of private companies bidding or renewing their contract as rail operators has fallen. In May 2018 the government rescued the East Coast line by renationalising it. The line had been run by the private rail operator Virgin Rail, which was 20 suffering lower passenger numbers and revenue than forecast. Some argue that there is a simple solution: reunite track and train in the only feasible manner, nationalisation. (Source adapted from: https://www.ft.com/content/d82848ca-f7ba-11e7-88f7-5465a6ce1a00) Extract B Southern Rail boss paid £495 000 The Chief Executive of Southern Rail, the private-sector train operator that has become associated with delays, losses, cancellations and strikes, was paid £495 000 last year. This increased calls for nationalisation and a maximum wage for executives at companies with government contracts. In contrast the average base pay for a train driver in the UK is 5 £47 705, although they can earn up to £63 000. Nearly a third of Southern Rail trains were late in 2016 as it tried to deal with a labour dispute that involved extensive strike action. The rail trade unions are opposed to planned changes to the role of train guards, which they claim will put passenger safety at risk. 10 (Source adapted from: Rob Davies, The Guardian 10 April 2017 https://www.theguardian.com/business/2017/apr/10/southern-rail-boss-double-pay-rise)
(d) With reference to Extract A, paragraph 3, discuss whether the rail network can be considered to be a natural monopoly. (12)
October 2020 · Paper 1 · Q6(e) 15 marks AO1=3, AO2=3, AO3=3, AO4=6 15-mark response monopoly
Data and extracts for question 6The UK Rail Industry Figure 1: UK government subsidy to Northern, a train operating company in Northern England 290 287.9 285 280 277.0 275 0 2017 2018 (Source adapted from: https://www.theyworkforyou.com/wrans/?id=2018-10-18.181280.h) Figure 2: Rail passenger kilometres travelled per year in the UK, billions 70 65 billion (2018) 60 50 40 30 20 10 0 1985 1995 2005 2015 (Source adapted from: fullfact.org) Figure 3: Price of a single off-peak train journey, Edinburgh to Leeds Saturday 22nd December 2018 19:00 hours Adult Young Persons (16–25) Railcard £105.30 £69.50 (Source: https://www.lner.co.uk/buy-tickets/booking-engine) Extract A The case for nationalisation Privatisation has not made the rail industry cheaper to operate, despite the promise from one government source that it would see private companies bringing: “more competition, greater efficiency and a wider choice of services”. One reason, suggest the critics, is fragmentation. Instead of pushing British Rail into 5 the private sector as a single supplier the government chose to break it into three components of track, train operators and rolling stock i.e. the trains and carriages. This has encouraged each part of the rail industry to prioritise its own profits rather than collaborating to improve the system. Privatisation, meanwhile, never really worked. The rail network of 2 500 stations and 10 32 000 km of tracks was renationalised in 2001. This has encouraged the government’s transport secretary, a supporter of private sector involvement, to argue that the state Network Rail monopoly should be removed so that companies can bid to build new rail lines to upgrade the railway. The privately-owned train operators are now the subject of fierce criticism, due to 15 overcrowding and cancelled services. Private companies are supposed to compete to win a bid to be the train operator for a region for a short number of years. However in recent years the number of private companies bidding or renewing their contract as rail operators has fallen. In May 2018 the government rescued the East Coast line by renationalising it. The line had been run by the private rail operator Virgin Rail, which was 20 suffering lower passenger numbers and revenue than forecast. Some argue that there is a simple solution: reunite track and train in the only feasible manner, nationalisation. (Source adapted from: https://www.ft.com/content/d82848ca-f7ba-11e7-88f7-5465a6ce1a00) Extract B Southern Rail boss paid £495 000 The Chief Executive of Southern Rail, the private-sector train operator that has become associated with delays, losses, cancellations and strikes, was paid £495 000 last year. This increased calls for nationalisation and a maximum wage for executives at companies with government contracts. In contrast the average base pay for a train driver in the UK is 5 £47 705, although they can earn up to £63 000. Nearly a third of Southern Rail trains were late in 2016 as it tried to deal with a labour dispute that involved extensive strike action. The rail trade unions are opposed to planned changes to the role of train guards, which they claim will put passenger safety at risk. 10 (Source adapted from: Rob Davies, The Guardian 10 April 2017 https://www.theguardian.com/business/2017/apr/10/southern-rail-boss-double-pay-rise)
(e) Discuss the likely benefits of price discrimination to rail passengers. Use a diagram to support your answer. (15)
October 2020 · Paper 1 · Q8 25 marks AO1=4, AO2=4, AO3=8, AO4=9 25-mark essay Either/or monopsony and contestability
8 ‘Amazon.com, the giant online retailer, has too much power.’ It uses its market power to put a squeeze on publishers, in effect driving down the prices it pays for books. If a publisher refuses, Amazon may take action by ‘delaying their delivery, raising their prices, and steering customers to other publishers’. (Source adapted from: https://www.nytimes.com) Evaluate the likely costs of a monopsony operating in a market such as book retailing.
October 2020 · Paper 2 · Q1(a) 2 marks AO2=2 Calculation Hard measuring economic growth
Data and extracts for question 11 UK real Gross Domestic Product (GDP), annual percentage change 2014–2017 2.9% 3 2.3% 2 1.8% 1.7% % 1 0 2014 2015 2016 2017 (Source: https://www.ons.gov.uk/economy/grossdomesticproductgdp/timeseries/ihyp/qna)
(a) Total real UK GDP in 2016 was £200 000 million. With reference to the chart above, calculate the total real UK GDP for 2017. You are advised to show your working. (2)
October 2020 · Paper 2 · Q2(b) 4 marks AO1=2, AO2=1, AO3=1 Short answer national income and the multiplier
Data and extracts for question 22 The planned investment in the redevelopment of Dover Port will cost £115 million. The Chief Executive said it will lead to many ‘new job opportunities for local people and a transformed waterfront experience’ with new cafés, bars, and shops. (Source adapted from: https://www.kentonline.co.uk/dover/news/docklands‑ redevelopment‑work‑to‑start‑118581/)
(b) Using the example above, explain how the multiplier process leads to an increase in aggregate demand. (4)
October 2020 · Paper 2 · Q3(a) 4 marks AO1=2, AO2=1, AO3=1 Short answer emerging and developing economies
Data and extracts for question 33 In 2018, the International Monetary Fund (IMF) lent Argentina $57 billion as part of a bailout package to help prevent the country’s government defaulting on its debts. This financial crisis also caused significant capital flight out of Argentina’s economy. (Source adapted from: https://www.ft.com/content/737b48bc‑c1c9‑11e8‑95b1‑d36dfef1b89a)
(a) Explain the role of the IMF in providing financial assistance to countries such as Argentina. (4)
October 2020 · Paper 2 · Q4(a) 2 marks AO2=2 Calculation unemployment
Data and extracts for question 44 Number of unemployed persons, UK, as measured by the claimant count, thousands 960 943 940 924 920 910 900 900 894 891 880 Thousands 866 860 850 836 840 833 823 820 812 800 0 O Oc tc Nov Dec Jan Feb Mar Apr May Jun Jul Aug Sep 2 2 0 0 1 1 7 7 2017 2017 2018 2018 2018 2018 2018 2018 2018 2018 2018 (Source: https://tradingeconomics.com/united‑kingdom/unemployed‑persons)
(a) Calculate the percentage change in the number of UK unemployed persons between April and July 2018. You are advised to show your working. (2)
October 2020 · Paper 2 · Q4(b) 2 marks AO1=1, AO3=1 Short answer unemployment
Data and extracts for question 44 Number of unemployed persons, UK, as measured by the claimant count, thousands 960 943 940 924 920 910 900 900 894 891 880 Thousands 866 860 850 836 840 833 823 820 812 800 0 O Oc tc Nov Dec Jan Feb Mar Apr May Jun Jul Aug Sep 2 2 0 0 1 1 7 7 2017 2017 2018 2018 2018 2018 2018 2018 2018 2018 2018 (Source: https://tradingeconomics.com/united‑kingdom/unemployed‑persons)
(b) Explain one likely reason for the increase in the number of people unemployed in the UK over the time period shown. (2)
October 2020 · Paper 2 · Q5(a) 4 marks AO1=2, AO2=2 Diagram national income and the multiplieraggregate supply
Data and extracts for question 55 The Hong Kong‑Zhuhai‑Macau Bridge is the world’s longest sea bridge. It reduces the journey time from Hong Kong to Zhuhai from 4 hours to just 30 minutes. It cost the equivalent of $18.8 billion and was government funded. (Source adapted from: www.theguardian.com)
(a) Draw an aggregate demand and aggregate supply diagram to show the likely impact of this new bridge on the price level and real output in the region. (4)
October 2020 · Paper 2 · Q6(a) 5 marks AO1=2, AO2=2, AO3=1 Short answer emerging and developing economies
Data and extracts for question 6Trade and Development Issues in Africa Figure 1: The Fairtrade scheme in the cocoa industry. How the additional revenue is spent by cocoa farmers. Improving business administration and infrastructure 44% Investing in farm equipment, training and funding 45% Supporting social services for the community 10% Other 1% (Source: https://www.fairtrade.org.uk/~/media/FairtradeUK/What%20is%20Fairtrade/Documents/ Policy%20and%20Research%20documents/Monitoring%20reports/Fairtrade%20Monitoring%20 Report_9thEdition%202016.pdf) Figure 2: Ivory Coast exports – relative share of main products (%), 2016 23% cocoa beans & cocoa products 54% oil 11% rubber 7% 5% 54% gold 5% 7% other 23% 11% (Source: https://atlas.media.mit.edu/en/visualize/tree_map/hs92/export/civ/all/show/2016/) Extract A Cheap cocoa is costing farmers dear The median annual income of cocoa farmers in the west African country, Ivory Coast, is just US$2 600. Research suggests that an annual income of US$6 133 is needed for this country’s farmers to have a decent, living income. This situation is even worse for farmers who are not part of a Fairtrade scheme. 5 World cocoa prices fell by more than a third in 2017. Cocoa farmers have to accept all the risk from price volatility, putting a significant strain on their fragile incomes. On the other hand, cocoa processors and chocolate manufacturers are able to adapt or even make high profit and consumers continue to enjoy their chocolate. This is still happening despite considerable investment in agriculture to build a 10 sustainable cocoa sector. The focus has been on raising productivity and diversifying crops. The average cocoa farm in the Ivory Coast produces only around half of the output that could be achieved with training and resources such as fertilisers, equipment and replanting. If farmers diversify into other crops, livestock or non‑farm activities, they lower the risk they face of fluctuating world cocoa prices. 15 Even tripling farm output would not provide the average cocoa farmer with a living income. Diversification alone will not always make farms more profitable. If we want farmers to earn a living income, we must also be willing to pay farmers more. (Source adapted from: https://www.fairtrade.org.uk/Media‑Centre/Blog/2018/October/ Cheap‑cocoa‑is‑costing‑farmers‑dear) Extract B Sub‑Saharan Africa is becoming more integrated After two years of negotiations, representatives of a large number of African countries signed the African Continental Free Trade Agreement (AfCFTA) in Kigali on March 21, 2018. This created a trading bloc of 1.2 billion people with a combined gross domestic product of more than US$2 trillion. The agreement committed countries to removing tariffs on 5 90% of goods and to liberalise services. This can be seen as a sign of rapid and steady regional integration. Sub‑Saharan Africa in particular is much more integrated today than in the past. The level of integration in sub‑Saharan Africa is now similar to that in the world’s other developing and emerging market economies. 10 However, the two largest African economies, Nigeria and South Africa, refused to sign the agreement. Nigeria’s manufacturers and trade unions are concerned about the potential negative impacts of becoming more open to imports from other African countries with lower labour costs. Greater interdependence can expose small economies to their partners’ recessions. 15 After nearly 20 years of strong economic activity, sub‑Saharan Africa experienced the downside of integration in 2015. The collapse in commodity prices and the slowdown in economic activity in Nigeria and South Africa contributed to sub‑Saharan African growth slowing sharply. Since 2017 growth has begun to recover. The recovery is mixed, though, and it is unclear to what extent the slow recovery of the larger economies is still 20 affecting the rest of sub‑Saharan Africa. (Source adapted from: https://www.imf.org/ and https://www.pulse.ng/)
(a) With reference to Figure 1 and Extract A, explain the likely impact of a Fairtrade scheme on agricultural communities. (5)
October 2020 · Paper 2 · Q6(b) 8 marks AO1=2, AO2=2, AO3=2, AO4=2 8-mark response emerging and developing economies
Data and extracts for question 6Trade and Development Issues in Africa Figure 1: The Fairtrade scheme in the cocoa industry. How the additional revenue is spent by cocoa farmers. Improving business administration and infrastructure 44% Investing in farm equipment, training and funding 45% Supporting social services for the community 10% Other 1% (Source: https://www.fairtrade.org.uk/~/media/FairtradeUK/What%20is%20Fairtrade/Documents/ Policy%20and%20Research%20documents/Monitoring%20reports/Fairtrade%20Monitoring%20 Report_9thEdition%202016.pdf) Figure 2: Ivory Coast exports – relative share of main products (%), 2016 23% cocoa beans & cocoa products 54% oil 11% rubber 7% 5% 54% gold 5% 7% other 23% 11% (Source: https://atlas.media.mit.edu/en/visualize/tree_map/hs92/export/civ/all/show/2016/) Extract A Cheap cocoa is costing farmers dear The median annual income of cocoa farmers in the west African country, Ivory Coast, is just US$2 600. Research suggests that an annual income of US$6 133 is needed for this country’s farmers to have a decent, living income. This situation is even worse for farmers who are not part of a Fairtrade scheme. 5 World cocoa prices fell by more than a third in 2017. Cocoa farmers have to accept all the risk from price volatility, putting a significant strain on their fragile incomes. On the other hand, cocoa processors and chocolate manufacturers are able to adapt or even make high profit and consumers continue to enjoy their chocolate. This is still happening despite considerable investment in agriculture to build a 10 sustainable cocoa sector. The focus has been on raising productivity and diversifying crops. The average cocoa farm in the Ivory Coast produces only around half of the output that could be achieved with training and resources such as fertilisers, equipment and replanting. If farmers diversify into other crops, livestock or non‑farm activities, they lower the risk they face of fluctuating world cocoa prices. 15 Even tripling farm output would not provide the average cocoa farmer with a living income. Diversification alone will not always make farms more profitable. If we want farmers to earn a living income, we must also be willing to pay farmers more. (Source adapted from: https://www.fairtrade.org.uk/Media‑Centre/Blog/2018/October/ Cheap‑cocoa‑is‑costing‑farmers‑dear) Extract B Sub‑Saharan Africa is becoming more integrated After two years of negotiations, representatives of a large number of African countries signed the African Continental Free Trade Agreement (AfCFTA) in Kigali on March 21, 2018. This created a trading bloc of 1.2 billion people with a combined gross domestic product of more than US$2 trillion. The agreement committed countries to removing tariffs on 5 90% of goods and to liberalise services. This can be seen as a sign of rapid and steady regional integration. Sub‑Saharan Africa in particular is much more integrated today than in the past. The level of integration in sub‑Saharan Africa is now similar to that in the world’s other developing and emerging market economies. 10 However, the two largest African economies, Nigeria and South Africa, refused to sign the agreement. Nigeria’s manufacturers and trade unions are concerned about the potential negative impacts of becoming more open to imports from other African countries with lower labour costs. Greater interdependence can expose small economies to their partners’ recessions. 15 After nearly 20 years of strong economic activity, sub‑Saharan Africa experienced the downside of integration in 2015. The collapse in commodity prices and the slowdown in economic activity in Nigeria and South Africa contributed to sub‑Saharan African growth slowing sharply. Since 2017 growth has begun to recover. The recovery is mixed, though, and it is unclear to what extent the slow recovery of the larger economies is still 20 affecting the rest of sub‑Saharan Africa. (Source adapted from: https://www.imf.org/ and https://www.pulse.ng/)
(b) Examine two ways, apart from Fairtrade schemes, in which cocoa farmers could boost their incomes despite the falling price of cocoa. (8)
October 2020 · Paper 2 · Q6(c) 12 marks AO1=2, AO2=2, AO3=4, AO4=4 12-mark response emerging and developing economiesglobalisation and trade
Data and extracts for question 6Trade and Development Issues in Africa Figure 1: The Fairtrade scheme in the cocoa industry. How the additional revenue is spent by cocoa farmers. Improving business administration and infrastructure 44% Investing in farm equipment, training and funding 45% Supporting social services for the community 10% Other 1% (Source: https://www.fairtrade.org.uk/~/media/FairtradeUK/What%20is%20Fairtrade/Documents/ Policy%20and%20Research%20documents/Monitoring%20reports/Fairtrade%20Monitoring%20 Report_9thEdition%202016.pdf) Figure 2: Ivory Coast exports – relative share of main products (%), 2016 23% cocoa beans & cocoa products 54% oil 11% rubber 7% 5% 54% gold 5% 7% other 23% 11% (Source: https://atlas.media.mit.edu/en/visualize/tree_map/hs92/export/civ/all/show/2016/) Extract A Cheap cocoa is costing farmers dear The median annual income of cocoa farmers in the west African country, Ivory Coast, is just US$2 600. Research suggests that an annual income of US$6 133 is needed for this country’s farmers to have a decent, living income. This situation is even worse for farmers who are not part of a Fairtrade scheme. 5 World cocoa prices fell by more than a third in 2017. Cocoa farmers have to accept all the risk from price volatility, putting a significant strain on their fragile incomes. On the other hand, cocoa processors and chocolate manufacturers are able to adapt or even make high profit and consumers continue to enjoy their chocolate. This is still happening despite considerable investment in agriculture to build a 10 sustainable cocoa sector. The focus has been on raising productivity and diversifying crops. The average cocoa farm in the Ivory Coast produces only around half of the output that could be achieved with training and resources such as fertilisers, equipment and replanting. If farmers diversify into other crops, livestock or non‑farm activities, they lower the risk they face of fluctuating world cocoa prices. 15 Even tripling farm output would not provide the average cocoa farmer with a living income. Diversification alone will not always make farms more profitable. If we want farmers to earn a living income, we must also be willing to pay farmers more. (Source adapted from: https://www.fairtrade.org.uk/Media‑Centre/Blog/2018/October/ Cheap‑cocoa‑is‑costing‑farmers‑dear) Extract B Sub‑Saharan Africa is becoming more integrated After two years of negotiations, representatives of a large number of African countries signed the African Continental Free Trade Agreement (AfCFTA) in Kigali on March 21, 2018. This created a trading bloc of 1.2 billion people with a combined gross domestic product of more than US$2 trillion. The agreement committed countries to removing tariffs on 5 90% of goods and to liberalise services. This can be seen as a sign of rapid and steady regional integration. Sub‑Saharan Africa in particular is much more integrated today than in the past. The level of integration in sub‑Saharan Africa is now similar to that in the world’s other developing and emerging market economies. 10 However, the two largest African economies, Nigeria and South Africa, refused to sign the agreement. Nigeria’s manufacturers and trade unions are concerned about the potential negative impacts of becoming more open to imports from other African countries with lower labour costs. Greater interdependence can expose small economies to their partners’ recessions. 15 After nearly 20 years of strong economic activity, sub‑Saharan Africa experienced the downside of integration in 2015. The collapse in commodity prices and the slowdown in economic activity in Nigeria and South Africa contributed to sub‑Saharan African growth slowing sharply. Since 2017 growth has begun to recover. The recovery is mixed, though, and it is unclear to what extent the slow recovery of the larger economies is still 20 affecting the rest of sub‑Saharan Africa. (Source adapted from: https://www.imf.org/ and https://www.pulse.ng/)
(c) Discuss the problems for the Ivory Coast of dependency on cocoa for a large proportion of their exports. Refer to Figure 2 in your answer. (12)
October 2020 · Paper 2 · Q6(d) 10 marks AO1=2, AO2=2, AO3=2, AO4=4 10-mark response macroeconomic policy in a global contextinternational competitiveness
Data and extracts for question 6Trade and Development Issues in Africa Figure 1: The Fairtrade scheme in the cocoa industry. How the additional revenue is spent by cocoa farmers. Improving business administration and infrastructure 44% Investing in farm equipment, training and funding 45% Supporting social services for the community 10% Other 1% (Source: https://www.fairtrade.org.uk/~/media/FairtradeUK/What%20is%20Fairtrade/Documents/ Policy%20and%20Research%20documents/Monitoring%20reports/Fairtrade%20Monitoring%20 Report_9thEdition%202016.pdf) Figure 2: Ivory Coast exports – relative share of main products (%), 2016 23% cocoa beans & cocoa products 54% oil 11% rubber 7% 5% 54% gold 5% 7% other 23% 11% (Source: https://atlas.media.mit.edu/en/visualize/tree_map/hs92/export/civ/all/show/2016/) Extract A Cheap cocoa is costing farmers dear The median annual income of cocoa farmers in the west African country, Ivory Coast, is just US$2 600. Research suggests that an annual income of US$6 133 is needed for this country’s farmers to have a decent, living income. This situation is even worse for farmers who are not part of a Fairtrade scheme. 5 World cocoa prices fell by more than a third in 2017. Cocoa farmers have to accept all the risk from price volatility, putting a significant strain on their fragile incomes. On the other hand, cocoa processors and chocolate manufacturers are able to adapt or even make high profit and consumers continue to enjoy their chocolate. This is still happening despite considerable investment in agriculture to build a 10 sustainable cocoa sector. The focus has been on raising productivity and diversifying crops. The average cocoa farm in the Ivory Coast produces only around half of the output that could be achieved with training and resources such as fertilisers, equipment and replanting. If farmers diversify into other crops, livestock or non‑farm activities, they lower the risk they face of fluctuating world cocoa prices. 15 Even tripling farm output would not provide the average cocoa farmer with a living income. Diversification alone will not always make farms more profitable. If we want farmers to earn a living income, we must also be willing to pay farmers more. (Source adapted from: https://www.fairtrade.org.uk/Media‑Centre/Blog/2018/October/ Cheap‑cocoa‑is‑costing‑farmers‑dear) Extract B Sub‑Saharan Africa is becoming more integrated After two years of negotiations, representatives of a large number of African countries signed the African Continental Free Trade Agreement (AfCFTA) in Kigali on March 21, 2018. This created a trading bloc of 1.2 billion people with a combined gross domestic product of more than US$2 trillion. The agreement committed countries to removing tariffs on 5 90% of goods and to liberalise services. This can be seen as a sign of rapid and steady regional integration. Sub‑Saharan Africa in particular is much more integrated today than in the past. The level of integration in sub‑Saharan Africa is now similar to that in the world’s other developing and emerging market economies. 10 However, the two largest African economies, Nigeria and South Africa, refused to sign the agreement. Nigeria’s manufacturers and trade unions are concerned about the potential negative impacts of becoming more open to imports from other African countries with lower labour costs. Greater interdependence can expose small economies to their partners’ recessions. 15 After nearly 20 years of strong economic activity, sub‑Saharan Africa experienced the downside of integration in 2015. The collapse in commodity prices and the slowdown in economic activity in Nigeria and South Africa contributed to sub‑Saharan African growth slowing sharply. Since 2017 growth has begun to recover. The recovery is mixed, though, and it is unclear to what extent the slow recovery of the larger economies is still 20 affecting the rest of sub‑Saharan Africa. (Source adapted from: https://www.imf.org/ and https://www.pulse.ng/)
(d) Nigeria is considering joining the African Continental Free Trade Agreement. Assess policies the Nigerian government could use in response to the concerns of the country’s ‘manufacturers and trade unions’ (Extract B paragraph 3) if they join this trading bloc. (10)
October 2020 · Paper 3 · Q1(a) 5 marks AO1=2, AO2=2, AO3=1 Short answer exchange rates
Data and extracts for question 1Turkey – an emerging economy Figure 1: Turkey’s central bank lending rate, percent, 2013–2018 25 20 15 % 10 5 0 2014 2015 2016 2017 2018 Figure 2: Selected emerging economy exchange rates, percentage change against the US dollar: January 2018 compared to January 2016. Russian rouble South African rand Polish zloty Hong Kong dollar Chinese renminbi Indian rupee Turkish lira Argentine peso -60 -40 -20 0 20 Percentage changes (Source adapted from: FT.com) Extract A Can Turkey’s central bank avoid another rate rise? At an annual rate of 25%, Turkey’s inflation is alarming. However, it may have peaked. This may be a turning point for the economically struggling country, whose currency (the Turkish lira) has lost nearly a third of its value against the US dollar in 2018. The central bank may be able to avoid tightening monetary policy further, as a severe economic 5 adjustment is already well under way. Turkey is highly indebted in foreign currency. The Turkish government takes measures against excessive appreciation or depreciation of the Turkish lira to reduce financial stability risks. The financial market faces difficulties in trying to restore foreign investors’ confidence. Consumer prices increased by 2.7% in October 2018, a much lower rate than the 6.3% 10 recorded in September 2018. The lira has stabilised, having risen 16% since the central bank raised interest rates by 6.25 percentage points. However, the government wants lower borrowing costs to fuel credit growth and economic expansion. Timothy Ash at a London investment bank says at this point it’s “illogical” to raise interest rates again in Turkey. That’s because Turkey’s economy is already experiencing a severe slowdown. 15 In the long term Turkey’s economic growth is expected to be above that of other emerging markets such as Brazil, Russia and China. Turkey’s private sector is resilient. Between 2018–50 we expect Turkey to grow by an annual average of 3.1%. Brazil is expected to grow by an annual average of 2.1%, Russia by 1.6% and China by 2.8%. GDP growth will nevertheless be well below that recorded in 2004–07 and 2010–15. Average 20 growth in GDP per head will be substantially lower, mainly reflecting the expected rise in the total population. (Source adapted from: https://ftalphaville.ft.com/2018/11/06/1541508141000/Can‑Turkey‑s-central‑bank- avoid‑another‑rate‑hike‑/. 6 Nov 2018 Colby Smith and one sentence The president wants lower borrowing costs to fuel credit growth and economic expansion from https://www.theguardian.com/world/2018/aug/07/turkey‑urged‑to‑announce-emergency-interest‑rate‑hike Larry Elliott 7/8/18 and http://country.eiu.com/article.aspx?articleid=157174199&Country=Turkey&topic=Economy&subtopic= Long-term+outlook&subsubtopic=Summary) Extract B Turkey aims to bin the plastic bag You get a free plastic bag whenever you go to a shop, even if it is just to buy a loaf of bread or a chocolate bar. In Turkey, plastic bags are everywhere, with millions being thrown away, and their use is causing a growing environmental problem. In Istanbul, the country’s biggest city with about 12 million people, around 10 000 tonnes 5 of waste are being collected every day. Plastic bags and other plastic waste make up 950 tonnes, or almost 10%, of the total waste. The Turkish government said it was looking at ways to discourage the consumption of single‑use plastic bags. One possible step currently under review is a ban of the black bags that are said to contain carcinogens. Another is that the state may raise taxes 10 on plastic products, which could lead to supermarkets charging consumers for the bags. In Corlu, a town north‑west of Istanbul, a local environmental group distributed 20 000 canvas bags to shoppers in one month. In some parts of Turkey, plastic bags are completely banned, with heavy fines for both firms and consumers who use them. (Source adapted from: tseibert@thenational.ae https://www.thenational.ae/world/europe/turkey‑aims‑to‑bin‑the‑plastic‑bag‑1.530059 accessed 11/11/18) Extract C Istanbul’s third airport set to be the busiest in the world Istanbul’s third airport is being constructed over an area of 76.5 million square metres, to the north of Istanbul. When complete, the new airport will have six runways and have an annual passenger capacity of up to 200 million people, making it potentially the world’s busiest airport. “This airport is going to be the most important hub between Asia and 5 Europe,” said one business leader. The airport design includes high vaulted ceilings and spacious, modern and efficient design – and its tulip‑shaped air traffic control tower won the 2016 International Architecture Award. It uses mobile applications and artificial intelligence for customers, is energy efficient and has a high‑tech security system. The site employs 36 000 people and 10 is estimated to cost the equivalent of £10 billion. However, the rush to meet the deadline set by the Turkish government is a major cause of accidents on the construction site, according to the construction workers’ union. (Source adapted from: https://www.lonelyplanet.com/news/2018/08/08/istanbuls‑huge‑new‑airport/ and https://www.voanews.com/a/istanbul‑to‑unveil‑new‑airport‑seeks‑to‑be‑world‑s‑biggest/4632308.html)
(a) Explain how the Turkish central bank intervenes in the currency market to prevent ‘excessive appreciation or depreciation of the Turkish lira’ (Extract A, lines 7–8). (5)
October 2020 · Paper 3 · Q1(b) 8 marks AO1=2, AO2=2, AO3=2, AO4=2 8-mark response exchange rates
Data and extracts for question 1Turkey – an emerging economy Figure 1: Turkey’s central bank lending rate, percent, 2013–2018 25 20 15 % 10 5 0 2014 2015 2016 2017 2018 Figure 2: Selected emerging economy exchange rates, percentage change against the US dollar: January 2018 compared to January 2016. Russian rouble South African rand Polish zloty Hong Kong dollar Chinese renminbi Indian rupee Turkish lira Argentine peso -60 -40 -20 0 20 Percentage changes (Source adapted from: FT.com) Extract A Can Turkey’s central bank avoid another rate rise? At an annual rate of 25%, Turkey’s inflation is alarming. However, it may have peaked. This may be a turning point for the economically struggling country, whose currency (the Turkish lira) has lost nearly a third of its value against the US dollar in 2018. The central bank may be able to avoid tightening monetary policy further, as a severe economic 5 adjustment is already well under way. Turkey is highly indebted in foreign currency. The Turkish government takes measures against excessive appreciation or depreciation of the Turkish lira to reduce financial stability risks. The financial market faces difficulties in trying to restore foreign investors’ confidence. Consumer prices increased by 2.7% in October 2018, a much lower rate than the 6.3% 10 recorded in September 2018. The lira has stabilised, having risen 16% since the central bank raised interest rates by 6.25 percentage points. However, the government wants lower borrowing costs to fuel credit growth and economic expansion. Timothy Ash at a London investment bank says at this point it’s “illogical” to raise interest rates again in Turkey. That’s because Turkey’s economy is already experiencing a severe slowdown. 15 In the long term Turkey’s economic growth is expected to be above that of other emerging markets such as Brazil, Russia and China. Turkey’s private sector is resilient. Between 2018–50 we expect Turkey to grow by an annual average of 3.1%. Brazil is expected to grow by an annual average of 2.1%, Russia by 1.6% and China by 2.8%. GDP growth will nevertheless be well below that recorded in 2004–07 and 2010–15. Average 20 growth in GDP per head will be substantially lower, mainly reflecting the expected rise in the total population. (Source adapted from: https://ftalphaville.ft.com/2018/11/06/1541508141000/Can‑Turkey‑s-central‑bank- avoid‑another‑rate‑hike‑/. 6 Nov 2018 Colby Smith and one sentence The president wants lower borrowing costs to fuel credit growth and economic expansion from https://www.theguardian.com/world/2018/aug/07/turkey‑urged‑to‑announce-emergency-interest‑rate‑hike Larry Elliott 7/8/18 and http://country.eiu.com/article.aspx?articleid=157174199&Country=Turkey&topic=Economy&subtopic= Long-term+outlook&subsubtopic=Summary) Extract B Turkey aims to bin the plastic bag You get a free plastic bag whenever you go to a shop, even if it is just to buy a loaf of bread or a chocolate bar. In Turkey, plastic bags are everywhere, with millions being thrown away, and their use is causing a growing environmental problem. In Istanbul, the country’s biggest city with about 12 million people, around 10 000 tonnes 5 of waste are being collected every day. Plastic bags and other plastic waste make up 950 tonnes, or almost 10%, of the total waste. The Turkish government said it was looking at ways to discourage the consumption of single‑use plastic bags. One possible step currently under review is a ban of the black bags that are said to contain carcinogens. Another is that the state may raise taxes 10 on plastic products, which could lead to supermarkets charging consumers for the bags. In Corlu, a town north‑west of Istanbul, a local environmental group distributed 20 000 canvas bags to shoppers in one month. In some parts of Turkey, plastic bags are completely banned, with heavy fines for both firms and consumers who use them. (Source adapted from: tseibert@thenational.ae https://www.thenational.ae/world/europe/turkey‑aims‑to‑bin‑the‑plastic‑bag‑1.530059 accessed 11/11/18) Extract C Istanbul’s third airport set to be the busiest in the world Istanbul’s third airport is being constructed over an area of 76.5 million square metres, to the north of Istanbul. When complete, the new airport will have six runways and have an annual passenger capacity of up to 200 million people, making it potentially the world’s busiest airport. “This airport is going to be the most important hub between Asia and 5 Europe,” said one business leader. The airport design includes high vaulted ceilings and spacious, modern and efficient design – and its tulip‑shaped air traffic control tower won the 2016 International Architecture Award. It uses mobile applications and artificial intelligence for customers, is energy efficient and has a high‑tech security system. The site employs 36 000 people and 10 is estimated to cost the equivalent of £10 billion. However, the rush to meet the deadline set by the Turkish government is a major cause of accidents on the construction site, according to the construction workers’ union. (Source adapted from: https://www.lonelyplanet.com/news/2018/08/08/istanbuls‑huge‑new‑airport/ and https://www.voanews.com/a/istanbul‑to‑unveil‑new‑airport‑seeks‑to‑be‑world‑s‑biggest/4632308.html)
(b) Examine two reasons why the Turkish government may want to avoid a significant fall in the exchange rate of the Turkish lira. (8)
October 2020 · Paper 3 · Q1(c) 12 marks AO1=2, AO2=2, AO3=4, AO4=4 12-mark response government intervention in marketsexternalities
Data and extracts for question 1Turkey – an emerging economy Figure 1: Turkey’s central bank lending rate, percent, 2013–2018 25 20 15 % 10 5 0 2014 2015 2016 2017 2018 Figure 2: Selected emerging economy exchange rates, percentage change against the US dollar: January 2018 compared to January 2016. Russian rouble South African rand Polish zloty Hong Kong dollar Chinese renminbi Indian rupee Turkish lira Argentine peso -60 -40 -20 0 20 Percentage changes (Source adapted from: FT.com) Extract A Can Turkey’s central bank avoid another rate rise? At an annual rate of 25%, Turkey’s inflation is alarming. However, it may have peaked. This may be a turning point for the economically struggling country, whose currency (the Turkish lira) has lost nearly a third of its value against the US dollar in 2018. The central bank may be able to avoid tightening monetary policy further, as a severe economic 5 adjustment is already well under way. Turkey is highly indebted in foreign currency. The Turkish government takes measures against excessive appreciation or depreciation of the Turkish lira to reduce financial stability risks. The financial market faces difficulties in trying to restore foreign investors’ confidence. Consumer prices increased by 2.7% in October 2018, a much lower rate than the 6.3% 10 recorded in September 2018. The lira has stabilised, having risen 16% since the central bank raised interest rates by 6.25 percentage points. However, the government wants lower borrowing costs to fuel credit growth and economic expansion. Timothy Ash at a London investment bank says at this point it’s “illogical” to raise interest rates again in Turkey. That’s because Turkey’s economy is already experiencing a severe slowdown. 15 In the long term Turkey’s economic growth is expected to be above that of other emerging markets such as Brazil, Russia and China. Turkey’s private sector is resilient. Between 2018–50 we expect Turkey to grow by an annual average of 3.1%. Brazil is expected to grow by an annual average of 2.1%, Russia by 1.6% and China by 2.8%. GDP growth will nevertheless be well below that recorded in 2004–07 and 2010–15. Average 20 growth in GDP per head will be substantially lower, mainly reflecting the expected rise in the total population. (Source adapted from: https://ftalphaville.ft.com/2018/11/06/1541508141000/Can‑Turkey‑s-central‑bank- avoid‑another‑rate‑hike‑/. 6 Nov 2018 Colby Smith and one sentence The president wants lower borrowing costs to fuel credit growth and economic expansion from https://www.theguardian.com/world/2018/aug/07/turkey‑urged‑to‑announce-emergency-interest‑rate‑hike Larry Elliott 7/8/18 and http://country.eiu.com/article.aspx?articleid=157174199&Country=Turkey&topic=Economy&subtopic= Long-term+outlook&subsubtopic=Summary) Extract B Turkey aims to bin the plastic bag You get a free plastic bag whenever you go to a shop, even if it is just to buy a loaf of bread or a chocolate bar. In Turkey, plastic bags are everywhere, with millions being thrown away, and their use is causing a growing environmental problem. In Istanbul, the country’s biggest city with about 12 million people, around 10 000 tonnes 5 of waste are being collected every day. Plastic bags and other plastic waste make up 950 tonnes, or almost 10%, of the total waste. The Turkish government said it was looking at ways to discourage the consumption of single‑use plastic bags. One possible step currently under review is a ban of the black bags that are said to contain carcinogens. Another is that the state may raise taxes 10 on plastic products, which could lead to supermarkets charging consumers for the bags. In Corlu, a town north‑west of Istanbul, a local environmental group distributed 20 000 canvas bags to shoppers in one month. In some parts of Turkey, plastic bags are completely banned, with heavy fines for both firms and consumers who use them. (Source adapted from: tseibert@thenational.ae https://www.thenational.ae/world/europe/turkey‑aims‑to‑bin‑the‑plastic‑bag‑1.530059 accessed 11/11/18) Extract C Istanbul’s third airport set to be the busiest in the world Istanbul’s third airport is being constructed over an area of 76.5 million square metres, to the north of Istanbul. When complete, the new airport will have six runways and have an annual passenger capacity of up to 200 million people, making it potentially the world’s busiest airport. “This airport is going to be the most important hub between Asia and 5 Europe,” said one business leader. The airport design includes high vaulted ceilings and spacious, modern and efficient design – and its tulip‑shaped air traffic control tower won the 2016 International Architecture Award. It uses mobile applications and artificial intelligence for customers, is energy efficient and has a high‑tech security system. The site employs 36 000 people and 10 is estimated to cost the equivalent of £10 billion. However, the rush to meet the deadline set by the Turkish government is a major cause of accidents on the construction site, according to the construction workers’ union. (Source adapted from: https://www.lonelyplanet.com/news/2018/08/08/istanbuls‑huge‑new‑airport/ and https://www.voanews.com/a/istanbul‑to‑unveil‑new‑airport‑seeks‑to‑be‑world‑s‑biggest/4632308.html)
(c) Discuss the likely success of policies to reduce the consumption of single‑use plastic bags in cities such as Istanbul. (12)
October 2020 · Paper 3 · Q1(d) 25 marks AO1=4, AO2=4, AO3=8, AO4=9 25-mark essay Either/or fiscal and monetary policyrevenues costs and profits
Data and extracts for question 1Turkey – an emerging economy Figure 1: Turkey’s central bank lending rate, percent, 2013–2018 25 20 15 % 10 5 0 2014 2015 2016 2017 2018 Figure 2: Selected emerging economy exchange rates, percentage change against the US dollar: January 2018 compared to January 2016. Russian rouble South African rand Polish zloty Hong Kong dollar Chinese renminbi Indian rupee Turkish lira Argentine peso -60 -40 -20 0 20 Percentage changes (Source adapted from: FT.com) Extract A Can Turkey’s central bank avoid another rate rise? At an annual rate of 25%, Turkey’s inflation is alarming. However, it may have peaked. This may be a turning point for the economically struggling country, whose currency (the Turkish lira) has lost nearly a third of its value against the US dollar in 2018. The central bank may be able to avoid tightening monetary policy further, as a severe economic 5 adjustment is already well under way. Turkey is highly indebted in foreign currency. The Turkish government takes measures against excessive appreciation or depreciation of the Turkish lira to reduce financial stability risks. The financial market faces difficulties in trying to restore foreign investors’ confidence. Consumer prices increased by 2.7% in October 2018, a much lower rate than the 6.3% 10 recorded in September 2018. The lira has stabilised, having risen 16% since the central bank raised interest rates by 6.25 percentage points. However, the government wants lower borrowing costs to fuel credit growth and economic expansion. Timothy Ash at a London investment bank says at this point it’s “illogical” to raise interest rates again in Turkey. That’s because Turkey’s economy is already experiencing a severe slowdown. 15 In the long term Turkey’s economic growth is expected to be above that of other emerging markets such as Brazil, Russia and China. Turkey’s private sector is resilient. Between 2018–50 we expect Turkey to grow by an annual average of 3.1%. Brazil is expected to grow by an annual average of 2.1%, Russia by 1.6% and China by 2.8%. GDP growth will nevertheless be well below that recorded in 2004–07 and 2010–15. Average 20 growth in GDP per head will be substantially lower, mainly reflecting the expected rise in the total population. (Source adapted from: https://ftalphaville.ft.com/2018/11/06/1541508141000/Can‑Turkey‑s-central‑bank- avoid‑another‑rate‑hike‑/. 6 Nov 2018 Colby Smith and one sentence The president wants lower borrowing costs to fuel credit growth and economic expansion from https://www.theguardian.com/world/2018/aug/07/turkey‑urged‑to‑announce-emergency-interest‑rate‑hike Larry Elliott 7/8/18 and http://country.eiu.com/article.aspx?articleid=157174199&Country=Turkey&topic=Economy&subtopic= Long-term+outlook&subsubtopic=Summary) Extract B Turkey aims to bin the plastic bag You get a free plastic bag whenever you go to a shop, even if it is just to buy a loaf of bread or a chocolate bar. In Turkey, plastic bags are everywhere, with millions being thrown away, and their use is causing a growing environmental problem. In Istanbul, the country’s biggest city with about 12 million people, around 10 000 tonnes 5 of waste are being collected every day. Plastic bags and other plastic waste make up 950 tonnes, or almost 10%, of the total waste. The Turkish government said it was looking at ways to discourage the consumption of single‑use plastic bags. One possible step currently under review is a ban of the black bags that are said to contain carcinogens. Another is that the state may raise taxes 10 on plastic products, which could lead to supermarkets charging consumers for the bags. In Corlu, a town north‑west of Istanbul, a local environmental group distributed 20 000 canvas bags to shoppers in one month. In some parts of Turkey, plastic bags are completely banned, with heavy fines for both firms and consumers who use them. (Source adapted from: tseibert@thenational.ae https://www.thenational.ae/world/europe/turkey‑aims‑to‑bin‑the‑plastic‑bag‑1.530059 accessed 11/11/18) Extract C Istanbul’s third airport set to be the busiest in the world Istanbul’s third airport is being constructed over an area of 76.5 million square metres, to the north of Istanbul. When complete, the new airport will have six runways and have an annual passenger capacity of up to 200 million people, making it potentially the world’s busiest airport. “This airport is going to be the most important hub between Asia and 5 Europe,” said one business leader. The airport design includes high vaulted ceilings and spacious, modern and efficient design – and its tulip‑shaped air traffic control tower won the 2016 International Architecture Award. It uses mobile applications and artificial intelligence for customers, is energy efficient and has a high‑tech security system. The site employs 36 000 people and 10 is estimated to cost the equivalent of £10 billion. However, the rush to meet the deadline set by the Turkish government is a major cause of accidents on the construction site, according to the construction workers’ union. (Source adapted from: https://www.lonelyplanet.com/news/2018/08/08/istanbuls‑huge‑new‑airport/ and https://www.voanews.com/a/istanbul‑to‑unveil‑new‑airport‑seeks‑to‑be‑world‑s‑biggest/4632308.html)
(d) Evaluate the likely microeconomic and macroeconomic effects of a rise in interest rates in Turkey. (25)
October 2020 · Paper 3 · Q1(e) 25 marks AO1=4, AO2=4, AO3=8, AO4=9 25-mark essay Either/or supply side policiesexternalities
Data and extracts for question 1Turkey – an emerging economy Figure 1: Turkey’s central bank lending rate, percent, 2013–2018 25 20 15 % 10 5 0 2014 2015 2016 2017 2018 Figure 2: Selected emerging economy exchange rates, percentage change against the US dollar: January 2018 compared to January 2016. Russian rouble South African rand Polish zloty Hong Kong dollar Chinese renminbi Indian rupee Turkish lira Argentine peso -60 -40 -20 0 20 Percentage changes (Source adapted from: FT.com) Extract A Can Turkey’s central bank avoid another rate rise? At an annual rate of 25%, Turkey’s inflation is alarming. However, it may have peaked. This may be a turning point for the economically struggling country, whose currency (the Turkish lira) has lost nearly a third of its value against the US dollar in 2018. The central bank may be able to avoid tightening monetary policy further, as a severe economic 5 adjustment is already well under way. Turkey is highly indebted in foreign currency. The Turkish government takes measures against excessive appreciation or depreciation of the Turkish lira to reduce financial stability risks. The financial market faces difficulties in trying to restore foreign investors’ confidence. Consumer prices increased by 2.7% in October 2018, a much lower rate than the 6.3% 10 recorded in September 2018. The lira has stabilised, having risen 16% since the central bank raised interest rates by 6.25 percentage points. However, the government wants lower borrowing costs to fuel credit growth and economic expansion. Timothy Ash at a London investment bank says at this point it’s “illogical” to raise interest rates again in Turkey. That’s because Turkey’s economy is already experiencing a severe slowdown. 15 In the long term Turkey’s economic growth is expected to be above that of other emerging markets such as Brazil, Russia and China. Turkey’s private sector is resilient. Between 2018–50 we expect Turkey to grow by an annual average of 3.1%. Brazil is expected to grow by an annual average of 2.1%, Russia by 1.6% and China by 2.8%. GDP growth will nevertheless be well below that recorded in 2004–07 and 2010–15. Average 20 growth in GDP per head will be substantially lower, mainly reflecting the expected rise in the total population. (Source adapted from: https://ftalphaville.ft.com/2018/11/06/1541508141000/Can‑Turkey‑s-central‑bank- avoid‑another‑rate‑hike‑/. 6 Nov 2018 Colby Smith and one sentence The president wants lower borrowing costs to fuel credit growth and economic expansion from https://www.theguardian.com/world/2018/aug/07/turkey‑urged‑to‑announce-emergency-interest‑rate‑hike Larry Elliott 7/8/18 and http://country.eiu.com/article.aspx?articleid=157174199&Country=Turkey&topic=Economy&subtopic= Long-term+outlook&subsubtopic=Summary) Extract B Turkey aims to bin the plastic bag You get a free plastic bag whenever you go to a shop, even if it is just to buy a loaf of bread or a chocolate bar. In Turkey, plastic bags are everywhere, with millions being thrown away, and their use is causing a growing environmental problem. In Istanbul, the country’s biggest city with about 12 million people, around 10 000 tonnes 5 of waste are being collected every day. Plastic bags and other plastic waste make up 950 tonnes, or almost 10%, of the total waste. The Turkish government said it was looking at ways to discourage the consumption of single‑use plastic bags. One possible step currently under review is a ban of the black bags that are said to contain carcinogens. Another is that the state may raise taxes 10 on plastic products, which could lead to supermarkets charging consumers for the bags. In Corlu, a town north‑west of Istanbul, a local environmental group distributed 20 000 canvas bags to shoppers in one month. In some parts of Turkey, plastic bags are completely banned, with heavy fines for both firms and consumers who use them. (Source adapted from: tseibert@thenational.ae https://www.thenational.ae/world/europe/turkey‑aims‑to‑bin‑the‑plastic‑bag‑1.530059 accessed 11/11/18) Extract C Istanbul’s third airport set to be the busiest in the world Istanbul’s third airport is being constructed over an area of 76.5 million square metres, to the north of Istanbul. When complete, the new airport will have six runways and have an annual passenger capacity of up to 200 million people, making it potentially the world’s busiest airport. “This airport is going to be the most important hub between Asia and 5 Europe,” said one business leader. The airport design includes high vaulted ceilings and spacious, modern and efficient design – and its tulip‑shaped air traffic control tower won the 2016 International Architecture Award. It uses mobile applications and artificial intelligence for customers, is energy efficient and has a high‑tech security system. The site employs 36 000 people and 10 is estimated to cost the equivalent of £10 billion. However, the rush to meet the deadline set by the Turkish government is a major cause of accidents on the construction site, according to the construction workers’ union. (Source adapted from: https://www.lonelyplanet.com/news/2018/08/08/istanbuls‑huge‑new‑airport/ and https://www.voanews.com/a/istanbul‑to‑unveil‑new‑airport‑seeks‑to‑be‑world‑s‑biggest/4632308.html)
(e) Evaluate the microeconomic and macroeconomic impact of large infrastructure projects such as the building of a third airport in Istanbul. (25)
October 2020 · Paper 3 · Q2(a) 5 marks AO1=2, AO2=2, AO3=1 Short answer measuring economic growth
Data and extracts for question 2The UK economy Figure 3: GDP per hour worked, nominal values at PPPs, percentage above or below UK level, 2018 Japan Italy US France Germany -10 0 10 20 30 40 Percentages (Source adapted from: ONS.gov.uk) Figure 4: UK index of output per hour worked, base year 2016 = 100 130 120 110 100 Index 90 80 70 60 50 2000 2005 2010 2015 2018 Key Productivity if pre-crisis trend had continued Actual UK productivity (Source adapted from: ONS.gov.uk) Figure 5: Proportion of adults with low literacy and/or numeracy skills, by age, selected countries Aged 16-24 Aged 55-65 Italy US England Spain N. Ireland France Canada Germany Japan S Korea 0 10 20 30 40 50 60 (Source adapted from: OECD.org) (Figures 3, 4 and 5 Source: FT.com 2016 data published https://www.ft.com/content/6ada0002‑9a57‑11e8‑9702‑5946bae86e6d 2018) Extract D The end of the High Street? Homebase, the UK’s second‑largest do‑it‑yourself (DIY) retailer, made £20–40 million a year profit up to 2016. The Australian conglomerate Wesfarmers bought Homebase for £340 million in 2016, and began to rebrand 24 stores under its own name. It scaled back on curtain, cushion and other homeware sales in favour of power tools and building materials. 5 In 2018 Wesfarmers sold the DIY chain for £1, in the face of “extremely challenging” market conditions and excess store space. The chain was bought by restructuring specialist Hilco, which had also rescued the music chain HMV in 2013, and the stores have gone back to using the Homebase name. Over 70% of Homebase stores are currently losing money and the new owner wants to exit loss‑making stores and agree to rent reductions, as sales 10 fell 10% in 2018. Homebase has gone back to popular products and brands dropped by its previous owner Wesfarmers. The closures will add to the mounting job losses on Britain’s high streets. About 25 000 jobs have gone in the first seven months of 2018, according to analysis by an economics thinktank. A further 8 300 jobs are under threat at suppliers, with the multiplier effect 15 meaning that GDP is £1.5 billion less than projected. Several Marks & Spencer clothing stores closed their doors for the last time as the high‑street chain pushes ahead with a transformation plan. It plans to close 100 stores by 2022. Toys R Us, Poundworld and Maplin have shut down completely, while New Look, Mothercare and Carpetright have plans to close hundreds of stores as losses rise sharply. 20 Increasing rents and higher business rates have occurred at the same time as falling consumer confidence. Meanwhile, House of Fraser employees and pensioners are nervously awaiting more details about their future. The £90 million rescue deal by Sports Direct, the sportswear chain controlled by Mike Ashley, will protect 16 000 jobs for the time being. (Source adapted from: https://www.ft.com/content/00d0bb9e‑a6ee‑11e8‑8ecf‑a7ae1beff35b 24 August 2018 and https://www.theguardian.com/business/2018/aug/13/homebase‑close‑80‑stores‑high‑street‑job‑losses‑mount Patrick Collinson 13 Aug 2018)
(a) With specific reference to Figure 3, explain why productivity is measured by ‘GDP per hour worked, nominal values at PPPs’. (5)
October 2020 · Paper 3 · Q2(b) 8 marks AO1=2, AO2=2, AO3=2, AO4=2 8-mark response aggregate supply
Data and extracts for question 2The UK economy Figure 3: GDP per hour worked, nominal values at PPPs, percentage above or below UK level, 2018 Japan Italy US France Germany -10 0 10 20 30 40 Percentages (Source adapted from: ONS.gov.uk) Figure 4: UK index of output per hour worked, base year 2016 = 100 130 120 110 100 Index 90 80 70 60 50 2000 2005 2010 2015 2018 Key Productivity if pre-crisis trend had continued Actual UK productivity (Source adapted from: ONS.gov.uk) Figure 5: Proportion of adults with low literacy and/or numeracy skills, by age, selected countries Aged 16-24 Aged 55-65 Italy US England Spain N. Ireland France Canada Germany Japan S Korea 0 10 20 30 40 50 60 (Source adapted from: OECD.org) (Figures 3, 4 and 5 Source: FT.com 2016 data published https://www.ft.com/content/6ada0002‑9a57‑11e8‑9702‑5946bae86e6d 2018) Extract D The end of the High Street? Homebase, the UK’s second‑largest do‑it‑yourself (DIY) retailer, made £20–40 million a year profit up to 2016. The Australian conglomerate Wesfarmers bought Homebase for £340 million in 2016, and began to rebrand 24 stores under its own name. It scaled back on curtain, cushion and other homeware sales in favour of power tools and building materials. 5 In 2018 Wesfarmers sold the DIY chain for £1, in the face of “extremely challenging” market conditions and excess store space. The chain was bought by restructuring specialist Hilco, which had also rescued the music chain HMV in 2013, and the stores have gone back to using the Homebase name. Over 70% of Homebase stores are currently losing money and the new owner wants to exit loss‑making stores and agree to rent reductions, as sales 10 fell 10% in 2018. Homebase has gone back to popular products and brands dropped by its previous owner Wesfarmers. The closures will add to the mounting job losses on Britain’s high streets. About 25 000 jobs have gone in the first seven months of 2018, according to analysis by an economics thinktank. A further 8 300 jobs are under threat at suppliers, with the multiplier effect 15 meaning that GDP is £1.5 billion less than projected. Several Marks & Spencer clothing stores closed their doors for the last time as the high‑street chain pushes ahead with a transformation plan. It plans to close 100 stores by 2022. Toys R Us, Poundworld and Maplin have shut down completely, while New Look, Mothercare and Carpetright have plans to close hundreds of stores as losses rise sharply. 20 Increasing rents and higher business rates have occurred at the same time as falling consumer confidence. Meanwhile, House of Fraser employees and pensioners are nervously awaiting more details about their future. The £90 million rescue deal by Sports Direct, the sportswear chain controlled by Mike Ashley, will protect 16 000 jobs for the time being. (Source adapted from: https://www.ft.com/content/00d0bb9e‑a6ee‑11e8‑8ecf‑a7ae1beff35b 24 August 2018 and https://www.theguardian.com/business/2018/aug/13/homebase‑close‑80‑stores‑high‑street‑job‑losses‑mount Patrick Collinson 13 Aug 2018)
(b) Apart from literacy and numeracy skills in young workers, examine one reason for the trend in productivity in the UK, over the period shown in Figure 4. (8)
October 2020 · Paper 3 · Q2(c) 12 marks AO1=2, AO2=2, AO3=4, AO4=4 12-mark response revenues costs and profits
Data and extracts for question 2The UK economy Figure 3: GDP per hour worked, nominal values at PPPs, percentage above or below UK level, 2018 Japan Italy US France Germany -10 0 10 20 30 40 Percentages (Source adapted from: ONS.gov.uk) Figure 4: UK index of output per hour worked, base year 2016 = 100 130 120 110 100 Index 90 80 70 60 50 2000 2005 2010 2015 2018 Key Productivity if pre-crisis trend had continued Actual UK productivity (Source adapted from: ONS.gov.uk) Figure 5: Proportion of adults with low literacy and/or numeracy skills, by age, selected countries Aged 16-24 Aged 55-65 Italy US England Spain N. Ireland France Canada Germany Japan S Korea 0 10 20 30 40 50 60 (Source adapted from: OECD.org) (Figures 3, 4 and 5 Source: FT.com 2016 data published https://www.ft.com/content/6ada0002‑9a57‑11e8‑9702‑5946bae86e6d 2018) Extract D The end of the High Street? Homebase, the UK’s second‑largest do‑it‑yourself (DIY) retailer, made £20–40 million a year profit up to 2016. The Australian conglomerate Wesfarmers bought Homebase for £340 million in 2016, and began to rebrand 24 stores under its own name. It scaled back on curtain, cushion and other homeware sales in favour of power tools and building materials. 5 In 2018 Wesfarmers sold the DIY chain for £1, in the face of “extremely challenging” market conditions and excess store space. The chain was bought by restructuring specialist Hilco, which had also rescued the music chain HMV in 2013, and the stores have gone back to using the Homebase name. Over 70% of Homebase stores are currently losing money and the new owner wants to exit loss‑making stores and agree to rent reductions, as sales 10 fell 10% in 2018. Homebase has gone back to popular products and brands dropped by its previous owner Wesfarmers. The closures will add to the mounting job losses on Britain’s high streets. About 25 000 jobs have gone in the first seven months of 2018, according to analysis by an economics thinktank. A further 8 300 jobs are under threat at suppliers, with the multiplier effect 15 meaning that GDP is £1.5 billion less than projected. Several Marks & Spencer clothing stores closed their doors for the last time as the high‑street chain pushes ahead with a transformation plan. It plans to close 100 stores by 2022. Toys R Us, Poundworld and Maplin have shut down completely, while New Look, Mothercare and Carpetright have plans to close hundreds of stores as losses rise sharply. 20 Increasing rents and higher business rates have occurred at the same time as falling consumer confidence. Meanwhile, House of Fraser employees and pensioners are nervously awaiting more details about their future. The £90 million rescue deal by Sports Direct, the sportswear chain controlled by Mike Ashley, will protect 16 000 jobs for the time being. (Source adapted from: https://www.ft.com/content/00d0bb9e‑a6ee‑11e8‑8ecf‑a7ae1beff35b 24 August 2018 and https://www.theguardian.com/business/2018/aug/13/homebase‑close‑80‑stores‑high‑street‑job‑losses‑mount Patrick Collinson 13 Aug 2018)
(c) Discuss factors that are causing many high street retailers in the UK to close some branches or shut down completely. Use a cost and revenue diagram to support your answer. (12)
October 2020 · Paper 3 · Q2(d) 25 marks AO1=4, AO2=4, AO3=8, AO4=9 25-mark essay Either/or international competitivenesssupply side policies
Data and extracts for question 2The UK economy Figure 3: GDP per hour worked, nominal values at PPPs, percentage above or below UK level, 2018 Japan Italy US France Germany -10 0 10 20 30 40 Percentages (Source adapted from: ONS.gov.uk) Figure 4: UK index of output per hour worked, base year 2016 = 100 130 120 110 100 Index 90 80 70 60 50 2000 2005 2010 2015 2018 Key Productivity if pre-crisis trend had continued Actual UK productivity (Source adapted from: ONS.gov.uk) Figure 5: Proportion of adults with low literacy and/or numeracy skills, by age, selected countries Aged 16-24 Aged 55-65 Italy US England Spain N. Ireland France Canada Germany Japan S Korea 0 10 20 30 40 50 60 (Source adapted from: OECD.org) (Figures 3, 4 and 5 Source: FT.com 2016 data published https://www.ft.com/content/6ada0002‑9a57‑11e8‑9702‑5946bae86e6d 2018) Extract D The end of the High Street? Homebase, the UK’s second‑largest do‑it‑yourself (DIY) retailer, made £20–40 million a year profit up to 2016. The Australian conglomerate Wesfarmers bought Homebase for £340 million in 2016, and began to rebrand 24 stores under its own name. It scaled back on curtain, cushion and other homeware sales in favour of power tools and building materials. 5 In 2018 Wesfarmers sold the DIY chain for £1, in the face of “extremely challenging” market conditions and excess store space. The chain was bought by restructuring specialist Hilco, which had also rescued the music chain HMV in 2013, and the stores have gone back to using the Homebase name. Over 70% of Homebase stores are currently losing money and the new owner wants to exit loss‑making stores and agree to rent reductions, as sales 10 fell 10% in 2018. Homebase has gone back to popular products and brands dropped by its previous owner Wesfarmers. The closures will add to the mounting job losses on Britain’s high streets. About 25 000 jobs have gone in the first seven months of 2018, according to analysis by an economics thinktank. A further 8 300 jobs are under threat at suppliers, with the multiplier effect 15 meaning that GDP is £1.5 billion less than projected. Several Marks & Spencer clothing stores closed their doors for the last time as the high‑street chain pushes ahead with a transformation plan. It plans to close 100 stores by 2022. Toys R Us, Poundworld and Maplin have shut down completely, while New Look, Mothercare and Carpetright have plans to close hundreds of stores as losses rise sharply. 20 Increasing rents and higher business rates have occurred at the same time as falling consumer confidence. Meanwhile, House of Fraser employees and pensioners are nervously awaiting more details about their future. The £90 million rescue deal by Sports Direct, the sportswear chain controlled by Mike Ashley, will protect 16 000 jobs for the time being. (Source adapted from: https://www.ft.com/content/00d0bb9e‑a6ee‑11e8‑8ecf‑a7ae1beff35b 24 August 2018 and https://www.theguardian.com/business/2018/aug/13/homebase‑close‑80‑stores‑high‑street‑job‑losses‑mount Patrick Collinson 13 Aug 2018)
(d) Evaluate possible microeconomic and macroeconomic policies which could be used to improve UK competitiveness. (25)
October 2020 · Paper 3 · Q2(e) 25 marks AO1=4, AO2=4, AO3=8, AO4=9 25-mark essay Either/or aggregate supplylabour market
Data and extracts for question 2The UK economy Figure 3: GDP per hour worked, nominal values at PPPs, percentage above or below UK level, 2018 Japan Italy US France Germany -10 0 10 20 30 40 Percentages (Source adapted from: ONS.gov.uk) Figure 4: UK index of output per hour worked, base year 2016 = 100 130 120 110 100 Index 90 80 70 60 50 2000 2005 2010 2015 2018 Key Productivity if pre-crisis trend had continued Actual UK productivity (Source adapted from: ONS.gov.uk) Figure 5: Proportion of adults with low literacy and/or numeracy skills, by age, selected countries Aged 16-24 Aged 55-65 Italy US England Spain N. Ireland France Canada Germany Japan S Korea 0 10 20 30 40 50 60 (Source adapted from: OECD.org) (Figures 3, 4 and 5 Source: FT.com 2016 data published https://www.ft.com/content/6ada0002‑9a57‑11e8‑9702‑5946bae86e6d 2018) Extract D The end of the High Street? Homebase, the UK’s second‑largest do‑it‑yourself (DIY) retailer, made £20–40 million a year profit up to 2016. The Australian conglomerate Wesfarmers bought Homebase for £340 million in 2016, and began to rebrand 24 stores under its own name. It scaled back on curtain, cushion and other homeware sales in favour of power tools and building materials. 5 In 2018 Wesfarmers sold the DIY chain for £1, in the face of “extremely challenging” market conditions and excess store space. The chain was bought by restructuring specialist Hilco, which had also rescued the music chain HMV in 2013, and the stores have gone back to using the Homebase name. Over 70% of Homebase stores are currently losing money and the new owner wants to exit loss‑making stores and agree to rent reductions, as sales 10 fell 10% in 2018. Homebase has gone back to popular products and brands dropped by its previous owner Wesfarmers. The closures will add to the mounting job losses on Britain’s high streets. About 25 000 jobs have gone in the first seven months of 2018, according to analysis by an economics thinktank. A further 8 300 jobs are under threat at suppliers, with the multiplier effect 15 meaning that GDP is £1.5 billion less than projected. Several Marks & Spencer clothing stores closed their doors for the last time as the high‑street chain pushes ahead with a transformation plan. It plans to close 100 stores by 2022. Toys R Us, Poundworld and Maplin have shut down completely, while New Look, Mothercare and Carpetright have plans to close hundreds of stores as losses rise sharply. 20 Increasing rents and higher business rates have occurred at the same time as falling consumer confidence. Meanwhile, House of Fraser employees and pensioners are nervously awaiting more details about their future. The £90 million rescue deal by Sports Direct, the sportswear chain controlled by Mike Ashley, will protect 16 000 jobs for the time being. (Source adapted from: https://www.ft.com/content/00d0bb9e‑a6ee‑11e8‑8ecf‑a7ae1beff35b 24 August 2018 and https://www.theguardian.com/business/2018/aug/13/homebase‑close‑80‑stores‑high‑street‑job‑losses‑mount Patrick Collinson 13 Aug 2018)
(e) Evaluate the microeconomic and macroeconomic effects of a decline in the literacy and numeracy skills of a country’s young workers. (25)
June 2019 · AS Paper 1 · Q1(b) 3 marks AO1=1, AO2=1, AO3=1 Short answer specialisation and division of labour
Data and extracts for question 11 Henry Ford designed his first moving assembly line in 1913, and revolutionised the car production process of the Ford Model T. This assembly line, at the first Ford factory, became the benchmark for mass production methods around the world. (Source: adapted from https://www.ford.co.uk/experience-ford/history-and-heritage)
(b) Explain one advantage of the division of labour in car production. (3)
June 2019 · AS Paper 1 · Q2(a) 2 marks AO2=2 Short answer price mechanism and surplus
Data and extracts for question 22 The consensus that diesel emissions are bad for health has led to many cities planning to ban diesel vehicles from their centres. The mayors of Paris, Mexico City, Madrid and Athens have said they intend to ban these vehicles by 2025. (Source: adapted from http://www.autoexpress.co.uk/car-news/consumer-news/98747/ diesel-ban-clean-air-zone-expansion-could-see-diesel-cars-charged-to)
(a) Annotate the diagram to show the change in consumer surplus in the market for diesel vehicles, following the change in demand caused by the proposed 2025 ban in some city centres. (2) Price of diesel vehicles S P D 0 Q Quantity of diesel vehicles
June 2019 · AS Paper 1 · Q5(b) 3 marks AO1=1, AO2=1, AO3=1 Short answer price elasticity of demand
Data and extracts for question 55 2015 2017 Average weekly pocket money for children £7 £8.75 aged under 10 years In the UK, Freddo is a popular chocolate snack bought by children who are under 10 years old. Freddo’s income elasticity of demand is estimated to be –0.1.
(b) Explain one reason why the income elasticity of demand is significant to the producer of Freddos. (3)
June 2019 · AS Paper 1 · Q6(a) 5 marks AO1=1, AO2=2, AO3=2 Short answer nature of economics
Data and extracts for question 6Health provision Figure 1: National Health Service (NHS) in England: Government spending and projected funding gap, £ billions, 2015 to 2020 140 Government spending required to meet forecast demand 130 120 £ billions 110 100 Government spending on the NHS 90 0 2015 2016 2018 2019 2017 2020 (Source: https://www.economist.com/news/britain/21706563-nhs-mess- reformers-believe-new-models-health-care-many-pioneered) Figure 2: Percentage of NHS patients in England waiting over 18 weeks for non-emergency treatment 12% 10% 10.1% Jan 2017 8% 5.7% Jan 2013 6% 4% 2% 0% Jan 2013 Jan 2014 Jan 2015 Jan 2016 Jan 2017 (Source: https://www.statista.com/chart/8813/more-and- more-people-made-to-wait-by-the-nhs/) Extract A Hospitals already full National Health Service (NHS) managers’ warned that bed occupancy rates are approaching 99% in some parts of the country, compared with recommended levels of 85%. In 2017 the number of patients waiting for non-urgent treatment passed the four million mark, the highest figure for almost a decade. 5 The chief executive of the NHS suggested that waiting list targets for routine operations such as hip and knee replacements would have to be sacrificed in order to protect other services, including accident and emergency (A&E) and cancer care. However, the government has insisted waiting time targets must still be met. Recently the Chancellor awarded the NHS £2.8 billion over three years, including £1.6 billion 10 in 2018 - less than the £4 billion which NHS officials had asked for to keep up with an ageing population and new medical technologies. NHS managers said there was now very little spare capacity in the system, warning of shortages of paramedics, doctors, A&E consultants and nurses. (Source: adapted from http://www.telegraph.co.uk/news/2017/12/07/hospitals- already-full-bursting-pressures-mount-warn-nhs-chiefs/) Extract B How health care is funded Most countries have a mixed economy of health provision typically funded from taxation, patient fees and private health insurance. The NHS was launched in the UK in 1948 to ensure direct state provision by the government of health care ‘free at the point of use’. The NHS is mainly funded from 5 general taxation. However, some NHS patients pay for some of their medical care, such as prescriptions to buy medicine. In the ongoing debate about how best to fund the NHS, some people have proposed introducing a £12 charge for visiting a General Practitioner (GP) doctor. Proponents argue that such a charge would deter overuse of GP services by those who do not have 10 genuine health needs. It would also raise additional money for the NHS and create incentives which will stimulate innovation and more choice. Estimates suggested that a £12 charge on the 450 million visits a year to GPs could have raised enough to cover hospitals’ overspend in 2016. Based on exemptions for prescriptions, 90% of patients will not be charged including the elderly, children and low 15 income groups. There would also be administrative costs of collecting the charge and verifying exemptions. These arrangements would significantly reduce the amount a charge would generate, assuming no one paying would be dissuaded from visiting their GP. The proportion of people in the UK taking out private health insurance (PHI) to pay for private health care has increased to 10.6%, despite significant increases in the 20 prices of treatment in private hospitals. Some economists argue that the government should provide subsidies to encourage people to take out private health insurance. This would reduce the burden on the NHS by taking some people out of the state system. Furthermore it is argued that private health care increases choice for users, encourages competition and drives up standards of care. 25 A typical PHI policy for a healthy 35-year-old costs about £650 a year but this rises steeply to £2 300 for those aged 70, when claims are far more likely. The level of contribution is based on their risk of requiring health care. PHI also tends to incur high management and administrative costs due to the resources required to assess risk and claims. Also there is the possibility of market failure given asymmetric information. 30 (Source: adapted from https://www.kingsfund.org.uk/ publications/how-health-care-is-funded) Extract C Public parks are a public good Public parks are places which people can use for free to exercise or to relax. Parkrun Limited organises free weekly runs in local parks attracting hundreds of joggers per park to enjoy healthy exercise. The government is proposing to ban local authorities charging Parkrun for the use of public parks to fund the maintenance of public parks. The 5 government considers that it is appropriate for the public to pay a reasonable sum for the private use of a facility such as a tennis court or a football pitch which may be used exclusively. However, the government does not consider it appropriate for a local authority to charge a volunteer community group ‘seeking to provide a free weekly event’ for the use of a public park. Parkrun share the park with other park users. Although a running 10 course may be marked out there is no restriction on other people using the park. (Source: adapted from © Crown Copyright Running Free – Government consultation on preserving the free use of public parks, April 2017, https://www.gov.uk/ government/uploads/system/uploads/attachment_data/file/608372/ Parkrun_ConDoc.pdf and http://www.telegraph.co.uk/news/2017/04/14/ councils-banned-charging-runners-take-part-regular-saturday/)
(a) With reference to Extract A and Figure 2, explain how the health care market in the UK illustrates the economic problem. (5)
June 2019 · AS Paper 1 · Q6(b) 6 marks AO1=2, AO2=2, AO3=2 Short answer public goods and information gaps
Data and extracts for question 6Health provision Figure 1: National Health Service (NHS) in England: Government spending and projected funding gap, £ billions, 2015 to 2020 140 Government spending required to meet forecast demand 130 120 £ billions 110 100 Government spending on the NHS 90 0 2015 2016 2018 2019 2017 2020 (Source: https://www.economist.com/news/britain/21706563-nhs-mess- reformers-believe-new-models-health-care-many-pioneered) Figure 2: Percentage of NHS patients in England waiting over 18 weeks for non-emergency treatment 12% 10% 10.1% Jan 2017 8% 5.7% Jan 2013 6% 4% 2% 0% Jan 2013 Jan 2014 Jan 2015 Jan 2016 Jan 2017 (Source: https://www.statista.com/chart/8813/more-and- more-people-made-to-wait-by-the-nhs/) Extract A Hospitals already full National Health Service (NHS) managers’ warned that bed occupancy rates are approaching 99% in some parts of the country, compared with recommended levels of 85%. In 2017 the number of patients waiting for non-urgent treatment passed the four million mark, the highest figure for almost a decade. 5 The chief executive of the NHS suggested that waiting list targets for routine operations such as hip and knee replacements would have to be sacrificed in order to protect other services, including accident and emergency (A&E) and cancer care. However, the government has insisted waiting time targets must still be met. Recently the Chancellor awarded the NHS £2.8 billion over three years, including £1.6 billion 10 in 2018 - less than the £4 billion which NHS officials had asked for to keep up with an ageing population and new medical technologies. NHS managers said there was now very little spare capacity in the system, warning of shortages of paramedics, doctors, A&E consultants and nurses. (Source: adapted from http://www.telegraph.co.uk/news/2017/12/07/hospitals- already-full-bursting-pressures-mount-warn-nhs-chiefs/) Extract B How health care is funded Most countries have a mixed economy of health provision typically funded from taxation, patient fees and private health insurance. The NHS was launched in the UK in 1948 to ensure direct state provision by the government of health care ‘free at the point of use’. The NHS is mainly funded from 5 general taxation. However, some NHS patients pay for some of their medical care, such as prescriptions to buy medicine. In the ongoing debate about how best to fund the NHS, some people have proposed introducing a £12 charge for visiting a General Practitioner (GP) doctor. Proponents argue that such a charge would deter overuse of GP services by those who do not have 10 genuine health needs. It would also raise additional money for the NHS and create incentives which will stimulate innovation and more choice. Estimates suggested that a £12 charge on the 450 million visits a year to GPs could have raised enough to cover hospitals’ overspend in 2016. Based on exemptions for prescriptions, 90% of patients will not be charged including the elderly, children and low 15 income groups. There would also be administrative costs of collecting the charge and verifying exemptions. These arrangements would significantly reduce the amount a charge would generate, assuming no one paying would be dissuaded from visiting their GP. The proportion of people in the UK taking out private health insurance (PHI) to pay for private health care has increased to 10.6%, despite significant increases in the 20 prices of treatment in private hospitals. Some economists argue that the government should provide subsidies to encourage people to take out private health insurance. This would reduce the burden on the NHS by taking some people out of the state system. Furthermore it is argued that private health care increases choice for users, encourages competition and drives up standards of care. 25 A typical PHI policy for a healthy 35-year-old costs about £650 a year but this rises steeply to £2 300 for those aged 70, when claims are far more likely. The level of contribution is based on their risk of requiring health care. PHI also tends to incur high management and administrative costs due to the resources required to assess risk and claims. Also there is the possibility of market failure given asymmetric information. 30 (Source: adapted from https://www.kingsfund.org.uk/ publications/how-health-care-is-funded) Extract C Public parks are a public good Public parks are places which people can use for free to exercise or to relax. Parkrun Limited organises free weekly runs in local parks attracting hundreds of joggers per park to enjoy healthy exercise. The government is proposing to ban local authorities charging Parkrun for the use of public parks to fund the maintenance of public parks. The 5 government considers that it is appropriate for the public to pay a reasonable sum for the private use of a facility such as a tennis court or a football pitch which may be used exclusively. However, the government does not consider it appropriate for a local authority to charge a volunteer community group ‘seeking to provide a free weekly event’ for the use of a public park. Parkrun share the park with other park users. Although a running 10 course may be marked out there is no restriction on other people using the park. (Source: adapted from © Crown Copyright Running Free – Government consultation on preserving the free use of public parks, April 2017, https://www.gov.uk/ government/uploads/system/uploads/attachment_data/file/608372/ Parkrun_ConDoc.pdf and http://www.telegraph.co.uk/news/2017/04/14/ councils-banned-charging-runners-take-part-regular-saturday/)
(b) Explain how ‘asymmetric information’ (Extract B, line 30) can lead to market failure in health provision. (6)
June 2019 · AS Paper 1 · Q6(c) 10 marks AO1=2, AO2=2, AO3=2, AO4=4 10-mark response public goods and information gaps
Data and extracts for question 6Health provision Figure 1: National Health Service (NHS) in England: Government spending and projected funding gap, £ billions, 2015 to 2020 140 Government spending required to meet forecast demand 130 120 £ billions 110 100 Government spending on the NHS 90 0 2015 2016 2018 2019 2017 2020 (Source: https://www.economist.com/news/britain/21706563-nhs-mess- reformers-believe-new-models-health-care-many-pioneered) Figure 2: Percentage of NHS patients in England waiting over 18 weeks for non-emergency treatment 12% 10% 10.1% Jan 2017 8% 5.7% Jan 2013 6% 4% 2% 0% Jan 2013 Jan 2014 Jan 2015 Jan 2016 Jan 2017 (Source: https://www.statista.com/chart/8813/more-and- more-people-made-to-wait-by-the-nhs/) Extract A Hospitals already full National Health Service (NHS) managers’ warned that bed occupancy rates are approaching 99% in some parts of the country, compared with recommended levels of 85%. In 2017 the number of patients waiting for non-urgent treatment passed the four million mark, the highest figure for almost a decade. 5 The chief executive of the NHS suggested that waiting list targets for routine operations such as hip and knee replacements would have to be sacrificed in order to protect other services, including accident and emergency (A&E) and cancer care. However, the government has insisted waiting time targets must still be met. Recently the Chancellor awarded the NHS £2.8 billion over three years, including £1.6 billion 10 in 2018 - less than the £4 billion which NHS officials had asked for to keep up with an ageing population and new medical technologies. NHS managers said there was now very little spare capacity in the system, warning of shortages of paramedics, doctors, A&E consultants and nurses. (Source: adapted from http://www.telegraph.co.uk/news/2017/12/07/hospitals- already-full-bursting-pressures-mount-warn-nhs-chiefs/) Extract B How health care is funded Most countries have a mixed economy of health provision typically funded from taxation, patient fees and private health insurance. The NHS was launched in the UK in 1948 to ensure direct state provision by the government of health care ‘free at the point of use’. The NHS is mainly funded from 5 general taxation. However, some NHS patients pay for some of their medical care, such as prescriptions to buy medicine. In the ongoing debate about how best to fund the NHS, some people have proposed introducing a £12 charge for visiting a General Practitioner (GP) doctor. Proponents argue that such a charge would deter overuse of GP services by those who do not have 10 genuine health needs. It would also raise additional money for the NHS and create incentives which will stimulate innovation and more choice. Estimates suggested that a £12 charge on the 450 million visits a year to GPs could have raised enough to cover hospitals’ overspend in 2016. Based on exemptions for prescriptions, 90% of patients will not be charged including the elderly, children and low 15 income groups. There would also be administrative costs of collecting the charge and verifying exemptions. These arrangements would significantly reduce the amount a charge would generate, assuming no one paying would be dissuaded from visiting their GP. The proportion of people in the UK taking out private health insurance (PHI) to pay for private health care has increased to 10.6%, despite significant increases in the 20 prices of treatment in private hospitals. Some economists argue that the government should provide subsidies to encourage people to take out private health insurance. This would reduce the burden on the NHS by taking some people out of the state system. Furthermore it is argued that private health care increases choice for users, encourages competition and drives up standards of care. 25 A typical PHI policy for a healthy 35-year-old costs about £650 a year but this rises steeply to £2 300 for those aged 70, when claims are far more likely. The level of contribution is based on their risk of requiring health care. PHI also tends to incur high management and administrative costs due to the resources required to assess risk and claims. Also there is the possibility of market failure given asymmetric information. 30 (Source: adapted from https://www.kingsfund.org.uk/ publications/how-health-care-is-funded) Extract C Public parks are a public good Public parks are places which people can use for free to exercise or to relax. Parkrun Limited organises free weekly runs in local parks attracting hundreds of joggers per park to enjoy healthy exercise. The government is proposing to ban local authorities charging Parkrun for the use of public parks to fund the maintenance of public parks. The 5 government considers that it is appropriate for the public to pay a reasonable sum for the private use of a facility such as a tennis court or a football pitch which may be used exclusively. However, the government does not consider it appropriate for a local authority to charge a volunteer community group ‘seeking to provide a free weekly event’ for the use of a public park. Parkrun share the park with other park users. Although a running 10 course may be marked out there is no restriction on other people using the park. (Source: adapted from © Crown Copyright Running Free – Government consultation on preserving the free use of public parks, April 2017, https://www.gov.uk/ government/uploads/system/uploads/attachment_data/file/608372/ Parkrun_ConDoc.pdf and http://www.telegraph.co.uk/news/2017/04/14/ councils-banned-charging-runners-take-part-regular-saturday/)
(c) ‘Public parks are a public good’ (Extract C, line 1). Assess this statement. (10)
June 2019 · AS Paper 1 · Q6(d) 4 marks AO1=2, AO2=2 Calculation government intervention in markets
Data and extracts for question 6Health provision Figure 1: National Health Service (NHS) in England: Government spending and projected funding gap, £ billions, 2015 to 2020 140 Government spending required to meet forecast demand 130 120 £ billions 110 100 Government spending on the NHS 90 0 2015 2016 2018 2019 2017 2020 (Source: https://www.economist.com/news/britain/21706563-nhs-mess- reformers-believe-new-models-health-care-many-pioneered) Figure 2: Percentage of NHS patients in England waiting over 18 weeks for non-emergency treatment 12% 10% 10.1% Jan 2017 8% 5.7% Jan 2013 6% 4% 2% 0% Jan 2013 Jan 2014 Jan 2015 Jan 2016 Jan 2017 (Source: https://www.statista.com/chart/8813/more-and- more-people-made-to-wait-by-the-nhs/) Extract A Hospitals already full National Health Service (NHS) managers’ warned that bed occupancy rates are approaching 99% in some parts of the country, compared with recommended levels of 85%. In 2017 the number of patients waiting for non-urgent treatment passed the four million mark, the highest figure for almost a decade. 5 The chief executive of the NHS suggested that waiting list targets for routine operations such as hip and knee replacements would have to be sacrificed in order to protect other services, including accident and emergency (A&E) and cancer care. However, the government has insisted waiting time targets must still be met. Recently the Chancellor awarded the NHS £2.8 billion over three years, including £1.6 billion 10 in 2018 - less than the £4 billion which NHS officials had asked for to keep up with an ageing population and new medical technologies. NHS managers said there was now very little spare capacity in the system, warning of shortages of paramedics, doctors, A&E consultants and nurses. (Source: adapted from http://www.telegraph.co.uk/news/2017/12/07/hospitals- already-full-bursting-pressures-mount-warn-nhs-chiefs/) Extract B How health care is funded Most countries have a mixed economy of health provision typically funded from taxation, patient fees and private health insurance. The NHS was launched in the UK in 1948 to ensure direct state provision by the government of health care ‘free at the point of use’. The NHS is mainly funded from 5 general taxation. However, some NHS patients pay for some of their medical care, such as prescriptions to buy medicine. In the ongoing debate about how best to fund the NHS, some people have proposed introducing a £12 charge for visiting a General Practitioner (GP) doctor. Proponents argue that such a charge would deter overuse of GP services by those who do not have 10 genuine health needs. It would also raise additional money for the NHS and create incentives which will stimulate innovation and more choice. Estimates suggested that a £12 charge on the 450 million visits a year to GPs could have raised enough to cover hospitals’ overspend in 2016. Based on exemptions for prescriptions, 90% of patients will not be charged including the elderly, children and low 15 income groups. There would also be administrative costs of collecting the charge and verifying exemptions. These arrangements would significantly reduce the amount a charge would generate, assuming no one paying would be dissuaded from visiting their GP. The proportion of people in the UK taking out private health insurance (PHI) to pay for private health care has increased to 10.6%, despite significant increases in the 20 prices of treatment in private hospitals. Some economists argue that the government should provide subsidies to encourage people to take out private health insurance. This would reduce the burden on the NHS by taking some people out of the state system. Furthermore it is argued that private health care increases choice for users, encourages competition and drives up standards of care. 25 A typical PHI policy for a healthy 35-year-old costs about £650 a year but this rises steeply to £2 300 for those aged 70, when claims are far more likely. The level of contribution is based on their risk of requiring health care. PHI also tends to incur high management and administrative costs due to the resources required to assess risk and claims. Also there is the possibility of market failure given asymmetric information. 30 (Source: adapted from https://www.kingsfund.org.uk/ publications/how-health-care-is-funded) Extract C Public parks are a public good Public parks are places which people can use for free to exercise or to relax. Parkrun Limited organises free weekly runs in local parks attracting hundreds of joggers per park to enjoy healthy exercise. The government is proposing to ban local authorities charging Parkrun for the use of public parks to fund the maintenance of public parks. The 5 government considers that it is appropriate for the public to pay a reasonable sum for the private use of a facility such as a tennis court or a football pitch which may be used exclusively. However, the government does not consider it appropriate for a local authority to charge a volunteer community group ‘seeking to provide a free weekly event’ for the use of a public park. Parkrun share the park with other park users. Although a running 10 course may be marked out there is no restriction on other people using the park. (Source: adapted from © Crown Copyright Running Free – Government consultation on preserving the free use of public parks, April 2017, https://www.gov.uk/ government/uploads/system/uploads/attachment_data/file/608372/ Parkrun_ConDoc.pdf and http://www.telegraph.co.uk/news/2017/04/14/ councils-banned-charging-runners-take-part-regular-saturday/)
(d) Calculate the annual revenue raised by charging £12 per GP visit. Assume there will be 450 million GP visits per year and 90% of these will not be charged. You are advised to show your working. (4)
June 2019 · AS Paper 1 · Q6(e) 15 marks AO1=3, AO2=3, AO3=3, AO4=6 15-mark response supply and demand
Data and extracts for question 6Health provision Figure 1: National Health Service (NHS) in England: Government spending and projected funding gap, £ billions, 2015 to 2020 140 Government spending required to meet forecast demand 130 120 £ billions 110 100 Government spending on the NHS 90 0 2015 2016 2018 2019 2017 2020 (Source: https://www.economist.com/news/britain/21706563-nhs-mess- reformers-believe-new-models-health-care-many-pioneered) Figure 2: Percentage of NHS patients in England waiting over 18 weeks for non-emergency treatment 12% 10% 10.1% Jan 2017 8% 5.7% Jan 2013 6% 4% 2% 0% Jan 2013 Jan 2014 Jan 2015 Jan 2016 Jan 2017 (Source: https://www.statista.com/chart/8813/more-and- more-people-made-to-wait-by-the-nhs/) Extract A Hospitals already full National Health Service (NHS) managers’ warned that bed occupancy rates are approaching 99% in some parts of the country, compared with recommended levels of 85%. In 2017 the number of patients waiting for non-urgent treatment passed the four million mark, the highest figure for almost a decade. 5 The chief executive of the NHS suggested that waiting list targets for routine operations such as hip and knee replacements would have to be sacrificed in order to protect other services, including accident and emergency (A&E) and cancer care. However, the government has insisted waiting time targets must still be met. Recently the Chancellor awarded the NHS £2.8 billion over three years, including £1.6 billion 10 in 2018 - less than the £4 billion which NHS officials had asked for to keep up with an ageing population and new medical technologies. NHS managers said there was now very little spare capacity in the system, warning of shortages of paramedics, doctors, A&E consultants and nurses. (Source: adapted from http://www.telegraph.co.uk/news/2017/12/07/hospitals- already-full-bursting-pressures-mount-warn-nhs-chiefs/) Extract B How health care is funded Most countries have a mixed economy of health provision typically funded from taxation, patient fees and private health insurance. The NHS was launched in the UK in 1948 to ensure direct state provision by the government of health care ‘free at the point of use’. The NHS is mainly funded from 5 general taxation. However, some NHS patients pay for some of their medical care, such as prescriptions to buy medicine. In the ongoing debate about how best to fund the NHS, some people have proposed introducing a £12 charge for visiting a General Practitioner (GP) doctor. Proponents argue that such a charge would deter overuse of GP services by those who do not have 10 genuine health needs. It would also raise additional money for the NHS and create incentives which will stimulate innovation and more choice. Estimates suggested that a £12 charge on the 450 million visits a year to GPs could have raised enough to cover hospitals’ overspend in 2016. Based on exemptions for prescriptions, 90% of patients will not be charged including the elderly, children and low 15 income groups. There would also be administrative costs of collecting the charge and verifying exemptions. These arrangements would significantly reduce the amount a charge would generate, assuming no one paying would be dissuaded from visiting their GP. The proportion of people in the UK taking out private health insurance (PHI) to pay for private health care has increased to 10.6%, despite significant increases in the 20 prices of treatment in private hospitals. Some economists argue that the government should provide subsidies to encourage people to take out private health insurance. This would reduce the burden on the NHS by taking some people out of the state system. Furthermore it is argued that private health care increases choice for users, encourages competition and drives up standards of care. 25 A typical PHI policy for a healthy 35-year-old costs about £650 a year but this rises steeply to £2 300 for those aged 70, when claims are far more likely. The level of contribution is based on their risk of requiring health care. PHI also tends to incur high management and administrative costs due to the resources required to assess risk and claims. Also there is the possibility of market failure given asymmetric information. 30 (Source: adapted from https://www.kingsfund.org.uk/ publications/how-health-care-is-funded) Extract C Public parks are a public good Public parks are places which people can use for free to exercise or to relax. Parkrun Limited organises free weekly runs in local parks attracting hundreds of joggers per park to enjoy healthy exercise. The government is proposing to ban local authorities charging Parkrun for the use of public parks to fund the maintenance of public parks. The 5 government considers that it is appropriate for the public to pay a reasonable sum for the private use of a facility such as a tennis court or a football pitch which may be used exclusively. However, the government does not consider it appropriate for a local authority to charge a volunteer community group ‘seeking to provide a free weekly event’ for the use of a public park. Parkrun share the park with other park users. Although a running 10 course may be marked out there is no restriction on other people using the park. (Source: adapted from © Crown Copyright Running Free – Government consultation on preserving the free use of public parks, April 2017, https://www.gov.uk/ government/uploads/system/uploads/attachment_data/file/608372/ Parkrun_ConDoc.pdf and http://www.telegraph.co.uk/news/2017/04/14/ councils-banned-charging-runners-take-part-regular-saturday/)
(e) Discuss likely reasons why the prices of treatments in private sector hospitals are increasing. Draw a supply and demand diagram to support your answer. (15)
June 2019 · AS Paper 1 · Q6(f) 20 marks AO1=4, AO2=4, AO3=6, AO4=6 20-mark essay Either/or government intervention in marketssupply and demand
Data and extracts for question 6Health provision Figure 1: National Health Service (NHS) in England: Government spending and projected funding gap, £ billions, 2015 to 2020 140 Government spending required to meet forecast demand 130 120 £ billions 110 100 Government spending on the NHS 90 0 2015 2016 2018 2019 2017 2020 (Source: https://www.economist.com/news/britain/21706563-nhs-mess- reformers-believe-new-models-health-care-many-pioneered) Figure 2: Percentage of NHS patients in England waiting over 18 weeks for non-emergency treatment 12% 10% 10.1% Jan 2017 8% 5.7% Jan 2013 6% 4% 2% 0% Jan 2013 Jan 2014 Jan 2015 Jan 2016 Jan 2017 (Source: https://www.statista.com/chart/8813/more-and- more-people-made-to-wait-by-the-nhs/) Extract A Hospitals already full National Health Service (NHS) managers’ warned that bed occupancy rates are approaching 99% in some parts of the country, compared with recommended levels of 85%. In 2017 the number of patients waiting for non-urgent treatment passed the four million mark, the highest figure for almost a decade. 5 The chief executive of the NHS suggested that waiting list targets for routine operations such as hip and knee replacements would have to be sacrificed in order to protect other services, including accident and emergency (A&E) and cancer care. However, the government has insisted waiting time targets must still be met. Recently the Chancellor awarded the NHS £2.8 billion over three years, including £1.6 billion 10 in 2018 - less than the £4 billion which NHS officials had asked for to keep up with an ageing population and new medical technologies. NHS managers said there was now very little spare capacity in the system, warning of shortages of paramedics, doctors, A&E consultants and nurses. (Source: adapted from http://www.telegraph.co.uk/news/2017/12/07/hospitals- already-full-bursting-pressures-mount-warn-nhs-chiefs/) Extract B How health care is funded Most countries have a mixed economy of health provision typically funded from taxation, patient fees and private health insurance. The NHS was launched in the UK in 1948 to ensure direct state provision by the government of health care ‘free at the point of use’. The NHS is mainly funded from 5 general taxation. However, some NHS patients pay for some of their medical care, such as prescriptions to buy medicine. In the ongoing debate about how best to fund the NHS, some people have proposed introducing a £12 charge for visiting a General Practitioner (GP) doctor. Proponents argue that such a charge would deter overuse of GP services by those who do not have 10 genuine health needs. It would also raise additional money for the NHS and create incentives which will stimulate innovation and more choice. Estimates suggested that a £12 charge on the 450 million visits a year to GPs could have raised enough to cover hospitals’ overspend in 2016. Based on exemptions for prescriptions, 90% of patients will not be charged including the elderly, children and low 15 income groups. There would also be administrative costs of collecting the charge and verifying exemptions. These arrangements would significantly reduce the amount a charge would generate, assuming no one paying would be dissuaded from visiting their GP. The proportion of people in the UK taking out private health insurance (PHI) to pay for private health care has increased to 10.6%, despite significant increases in the 20 prices of treatment in private hospitals. Some economists argue that the government should provide subsidies to encourage people to take out private health insurance. This would reduce the burden on the NHS by taking some people out of the state system. Furthermore it is argued that private health care increases choice for users, encourages competition and drives up standards of care. 25 A typical PHI policy for a healthy 35-year-old costs about £650 a year but this rises steeply to £2 300 for those aged 70, when claims are far more likely. The level of contribution is based on their risk of requiring health care. PHI also tends to incur high management and administrative costs due to the resources required to assess risk and claims. Also there is the possibility of market failure given asymmetric information. 30 (Source: adapted from https://www.kingsfund.org.uk/ publications/how-health-care-is-funded) Extract C Public parks are a public good Public parks are places which people can use for free to exercise or to relax. Parkrun Limited organises free weekly runs in local parks attracting hundreds of joggers per park to enjoy healthy exercise. The government is proposing to ban local authorities charging Parkrun for the use of public parks to fund the maintenance of public parks. The 5 government considers that it is appropriate for the public to pay a reasonable sum for the private use of a facility such as a tennis court or a football pitch which may be used exclusively. However, the government does not consider it appropriate for a local authority to charge a volunteer community group ‘seeking to provide a free weekly event’ for the use of a public park. Parkrun share the park with other park users. Although a running 10 course may be marked out there is no restriction on other people using the park. (Source: adapted from © Crown Copyright Running Free – Government consultation on preserving the free use of public parks, April 2017, https://www.gov.uk/ government/uploads/system/uploads/attachment_data/file/608372/ Parkrun_ConDoc.pdf and http://www.telegraph.co.uk/news/2017/04/14/ councils-banned-charging-runners-take-part-regular-saturday/)
(f) Evaluate possible ways the government could intervene to reduce the excess demand for state-funded health care. (20)
June 2019 · AS Paper 1 · Q6(g) 20 marks AO1=4, AO2=4, AO3=6, AO4=6 20-mark essay Either/or economic systemsexternalities
Data and extracts for question 6Health provision Figure 1: National Health Service (NHS) in England: Government spending and projected funding gap, £ billions, 2015 to 2020 140 Government spending required to meet forecast demand 130 120 £ billions 110 100 Government spending on the NHS 90 0 2015 2016 2018 2019 2017 2020 (Source: https://www.economist.com/news/britain/21706563-nhs-mess- reformers-believe-new-models-health-care-many-pioneered) Figure 2: Percentage of NHS patients in England waiting over 18 weeks for non-emergency treatment 12% 10% 10.1% Jan 2017 8% 5.7% Jan 2013 6% 4% 2% 0% Jan 2013 Jan 2014 Jan 2015 Jan 2016 Jan 2017 (Source: https://www.statista.com/chart/8813/more-and- more-people-made-to-wait-by-the-nhs/) Extract A Hospitals already full National Health Service (NHS) managers’ warned that bed occupancy rates are approaching 99% in some parts of the country, compared with recommended levels of 85%. In 2017 the number of patients waiting for non-urgent treatment passed the four million mark, the highest figure for almost a decade. 5 The chief executive of the NHS suggested that waiting list targets for routine operations such as hip and knee replacements would have to be sacrificed in order to protect other services, including accident and emergency (A&E) and cancer care. However, the government has insisted waiting time targets must still be met. Recently the Chancellor awarded the NHS £2.8 billion over three years, including £1.6 billion 10 in 2018 - less than the £4 billion which NHS officials had asked for to keep up with an ageing population and new medical technologies. NHS managers said there was now very little spare capacity in the system, warning of shortages of paramedics, doctors, A&E consultants and nurses. (Source: adapted from http://www.telegraph.co.uk/news/2017/12/07/hospitals- already-full-bursting-pressures-mount-warn-nhs-chiefs/) Extract B How health care is funded Most countries have a mixed economy of health provision typically funded from taxation, patient fees and private health insurance. The NHS was launched in the UK in 1948 to ensure direct state provision by the government of health care ‘free at the point of use’. The NHS is mainly funded from 5 general taxation. However, some NHS patients pay for some of their medical care, such as prescriptions to buy medicine. In the ongoing debate about how best to fund the NHS, some people have proposed introducing a £12 charge for visiting a General Practitioner (GP) doctor. Proponents argue that such a charge would deter overuse of GP services by those who do not have 10 genuine health needs. It would also raise additional money for the NHS and create incentives which will stimulate innovation and more choice. Estimates suggested that a £12 charge on the 450 million visits a year to GPs could have raised enough to cover hospitals’ overspend in 2016. Based on exemptions for prescriptions, 90% of patients will not be charged including the elderly, children and low 15 income groups. There would also be administrative costs of collecting the charge and verifying exemptions. These arrangements would significantly reduce the amount a charge would generate, assuming no one paying would be dissuaded from visiting their GP. The proportion of people in the UK taking out private health insurance (PHI) to pay for private health care has increased to 10.6%, despite significant increases in the 20 prices of treatment in private hospitals. Some economists argue that the government should provide subsidies to encourage people to take out private health insurance. This would reduce the burden on the NHS by taking some people out of the state system. Furthermore it is argued that private health care increases choice for users, encourages competition and drives up standards of care. 25 A typical PHI policy for a healthy 35-year-old costs about £650 a year but this rises steeply to £2 300 for those aged 70, when claims are far more likely. The level of contribution is based on their risk of requiring health care. PHI also tends to incur high management and administrative costs due to the resources required to assess risk and claims. Also there is the possibility of market failure given asymmetric information. 30 (Source: adapted from https://www.kingsfund.org.uk/ publications/how-health-care-is-funded) Extract C Public parks are a public good Public parks are places which people can use for free to exercise or to relax. Parkrun Limited organises free weekly runs in local parks attracting hundreds of joggers per park to enjoy healthy exercise. The government is proposing to ban local authorities charging Parkrun for the use of public parks to fund the maintenance of public parks. The 5 government considers that it is appropriate for the public to pay a reasonable sum for the private use of a facility such as a tennis court or a football pitch which may be used exclusively. However, the government does not consider it appropriate for a local authority to charge a volunteer community group ‘seeking to provide a free weekly event’ for the use of a public park. Parkrun share the park with other park users. Although a running 10 course may be marked out there is no restriction on other people using the park. (Source: adapted from © Crown Copyright Running Free – Government consultation on preserving the free use of public parks, April 2017, https://www.gov.uk/ government/uploads/system/uploads/attachment_data/file/608372/ Parkrun_ConDoc.pdf and http://www.telegraph.co.uk/news/2017/04/14/ councils-banned-charging-runners-take-part-regular-saturday/)
(g) Evaluate the possible disadvantages of a free market approach to providing health care. (20)
June 2019 · AS Paper 2 · Q1(a) 1 mark AO1=1 Definition national income and the multiplier
Data and extracts for question 11 It is estimated that building a second runway at Gatwick airport will require an investment of £9.3 billion. The total increase in UK GDP as a result of this injection is expected to be around £44.1 billion. (Source: adapted from www.gov.uk/government/uploads/system/uploads/attachment_ data/file/ 452267/AC01_tagged_amend_25_11.pdf © Crown Copyright)
(a) Define the term ‘injection’ in this context. (1)
June 2019 · AS Paper 2 · Q1(b) 2 marks AO2=2 Calculation national income and the multiplier
Data and extracts for question 11 It is estimated that building a second runway at Gatwick airport will require an investment of £9.3 billion. The total increase in UK GDP as a result of this injection is expected to be around £44.1 billion. (Source: adapted from www.gov.uk/government/uploads/system/uploads/attachment_ data/file/ 452267/AC01_tagged_amend_25_11.pdf © Crown Copyright)
(b) Calculate the value of the multiplier based on the data given. You are advised to show your working. (2)
June 2019 · AS Paper 2 · Q3(a) 3 marks AO1=1, AO2=1, AO3=1 Short answer unemployment
Data and extracts for question 33 UK unemployment rate as a % of all those economically active, seasonally adjusted, from 2008 to 2018 9 8 7 % unemployed 6 5 4 0 2008 2010 2012 2014 2016 2018 (Source: adapted from https://www.ons.gov.uk/employmentandlabourmarket/ peoplenotinwork/ unemployment/timeseries/mgsx Crown Copyright)
(a) With reference to the chart above, explain one likely economic effect of the change in the UK unemployment rate between 2012 and 2018. (3)
June 2019 · AS Paper 2 · Q5(b) 2 marks AO2=2 Calculation inflation
Data and extracts for question 55 The table below shows average UK house prices between July 2014 and July 2017. Year Average house prices Index numbers of (£) average UK house prices (2014 is the base year) 2014 189 709 100 2015 200 141 2016 215 127 2017 226 185 119.2 (Source: adapted from http://landregistry.data.gov.uk/app/ukhpi/explore - Crown Copyright)
(b) Using 2014 as the base year, calculate the index number for (2) (i) 2015 (ii) 2016.
June 2019 · AS Paper 2 · Q6(a) 4 marks AO1=2, AO2=2 Short answer inflation
Data and extracts for question 6UK inflation and economic growth Figure 1: UK inflation rate as measured by annual percentage changes in the Consumer Price Index (CPI), January 2014 to January 2018 3.5 3.0 % 2.5 2.0 1.5 1.0 0.5 0.0 -0.5 (Source: www.bankofengland.co.uk/publications/Pages/inflationreport/2017/aug.aspx) Figure 2: Selected changes to the CPI basket of goods and services, 2017 IN OUT Non-dairy milk Apple cider Jigsaw puzzles Menthol cigarettes Child scooters Child swings Cycling helmets Basic mobile phones (Source: www.theguardian.com/business/2017/mar/14/uk-inflation- ons-basket-goods-gin-cycling-helmets) Figure 3: UK exports, £ billions per month, January 2014 to January 2018 52 50 £ billions 48 46 44 42 40 0 (Source: Trading Economics, ONS - https://tradingeconomics.com/united-kingdom/exports) Figure 4: Annual percentage change in real Gross Domestic Product (GDP), 2014-2017 2014 2015 2016 2017 United Kingdom 3.1 2.2 1.8 2.0 Developing countries (average) 4.7 4.2 4.1 4.5 (Source: IMF, World Economic Outlook 2017) Extract A Rising inflation After January 2017, the inflation rate, as measured by the Consumer Price Index (CPI), in the UK has exceeded the Bank of England’s 2% target. Sharp increases in food prices as a result of the fall in the exchange rate of the pound have contributed to rising inflation. Between January and September 2017, food prices have increased by 3.5 percentage 5 points. The Office for National Statistics (ONS) has identified that the rapid increase in food prices affected people on low fixed incomes the most. It leaves them with very little money to spend on relatively more expensive items. Moreover, the Bank of England has observed a rise in the size of personal debt relative to income. In order to maintain their standard of 10 living, many consumers on low fixed incomes are using their credit cards and taking out short-term loans to fund their spending. Inflation rose to over 3% at the end of 2017 leading to the Monetary Policy Committee increasing the base rate of interest by 0.25 percentage points to 0.5% in November 2017. Wage growth has been lagging behind price rises and this is expected to continue. 15 Basic wage increases are expected to be only around 1%. This has heaped considerable pressure on households. The ONS has updated the shopping basket that is used in the measurement of UK inflation, to reflect the lifestyle of households in the country. Technological advancements, changes in consumer tastes and a move towards health, fitness and 20 gluten-free products have made it essential to revise the 2017 basket. (Source: adapted from ‘UK inflation tipped to rise again with wages forecast to stagnate’, The Guardian, https://www.theguardian.com/business/2017/aug/13/ uk-inflation-tipped-to-rise-again-with-wages-forecast-to-stagnate#img-1) Extract B Economic growth and living standards Economic growth is expected to accelerate again as foreign demand for UK exports increases due to the global economic recovery. According to some economists, consumer spending is no longer the engine of growth for the UK. The increase in exports, which is largely due to the fall in the exchange rate of the pound, is expected to be the most 5 significant driver of the UK’s economic growth. Some economists have proposed that the quality of economic growth needs to be measured and not just the quantity. This will allow governments to understand how GDP growth affects the living standards of its citizens. They want governments to publish data on the quality of life alongside GDP data as economic growth varies across the country 10 with jobs and wages distributed unevenly. Economic growth figures also hide differences that are not considered in GDP calculations. In 2017, it was estimated that the relative size of the informal economy of developing countries was nearly five times greater than that of the UK. (Source: adapted from ‘Growth to accelerate as UK economy bounces back’, The Telegraph, http://www.telegraph.co.uk /business/2017/08/01/ growth-accelerate-uk-economy-bounces-back/; ‘GDP is not enough: economists and businesses demand new measure of inclusive growth’, The Telegraph, http://www.telegraph.co.uk/business/2017/03/07/gdp-not- enough-economists-businesses-demand-new-measure-inclusive/)
(a) With reference to the first paragraph of Extract A and Figure 1, explain how the change in the exchange rate of the pound has ‘contributed to rising inflation’ (Extract A, line 4). (4)
June 2019 · AS Paper 2 · Q6(b) 6 marks AO1=2, AO2=2, AO3=2 Short answer inflation
Data and extracts for question 6UK inflation and economic growth Figure 1: UK inflation rate as measured by annual percentage changes in the Consumer Price Index (CPI), January 2014 to January 2018 3.5 3.0 % 2.5 2.0 1.5 1.0 0.5 0.0 -0.5 (Source: www.bankofengland.co.uk/publications/Pages/inflationreport/2017/aug.aspx) Figure 2: Selected changes to the CPI basket of goods and services, 2017 IN OUT Non-dairy milk Apple cider Jigsaw puzzles Menthol cigarettes Child scooters Child swings Cycling helmets Basic mobile phones (Source: www.theguardian.com/business/2017/mar/14/uk-inflation- ons-basket-goods-gin-cycling-helmets) Figure 3: UK exports, £ billions per month, January 2014 to January 2018 52 50 £ billions 48 46 44 42 40 0 (Source: Trading Economics, ONS - https://tradingeconomics.com/united-kingdom/exports) Figure 4: Annual percentage change in real Gross Domestic Product (GDP), 2014-2017 2014 2015 2016 2017 United Kingdom 3.1 2.2 1.8 2.0 Developing countries (average) 4.7 4.2 4.1 4.5 (Source: IMF, World Economic Outlook 2017) Extract A Rising inflation After January 2017, the inflation rate, as measured by the Consumer Price Index (CPI), in the UK has exceeded the Bank of England’s 2% target. Sharp increases in food prices as a result of the fall in the exchange rate of the pound have contributed to rising inflation. Between January and September 2017, food prices have increased by 3.5 percentage 5 points. The Office for National Statistics (ONS) has identified that the rapid increase in food prices affected people on low fixed incomes the most. It leaves them with very little money to spend on relatively more expensive items. Moreover, the Bank of England has observed a rise in the size of personal debt relative to income. In order to maintain their standard of 10 living, many consumers on low fixed incomes are using their credit cards and taking out short-term loans to fund their spending. Inflation rose to over 3% at the end of 2017 leading to the Monetary Policy Committee increasing the base rate of interest by 0.25 percentage points to 0.5% in November 2017. Wage growth has been lagging behind price rises and this is expected to continue. 15 Basic wage increases are expected to be only around 1%. This has heaped considerable pressure on households. The ONS has updated the shopping basket that is used in the measurement of UK inflation, to reflect the lifestyle of households in the country. Technological advancements, changes in consumer tastes and a move towards health, fitness and 20 gluten-free products have made it essential to revise the 2017 basket. (Source: adapted from ‘UK inflation tipped to rise again with wages forecast to stagnate’, The Guardian, https://www.theguardian.com/business/2017/aug/13/ uk-inflation-tipped-to-rise-again-with-wages-forecast-to-stagnate#img-1) Extract B Economic growth and living standards Economic growth is expected to accelerate again as foreign demand for UK exports increases due to the global economic recovery. According to some economists, consumer spending is no longer the engine of growth for the UK. The increase in exports, which is largely due to the fall in the exchange rate of the pound, is expected to be the most 5 significant driver of the UK’s economic growth. Some economists have proposed that the quality of economic growth needs to be measured and not just the quantity. This will allow governments to understand how GDP growth affects the living standards of its citizens. They want governments to publish data on the quality of life alongside GDP data as economic growth varies across the country 10 with jobs and wages distributed unevenly. Economic growth figures also hide differences that are not considered in GDP calculations. In 2017, it was estimated that the relative size of the informal economy of developing countries was nearly five times greater than that of the UK. (Source: adapted from ‘Growth to accelerate as UK economy bounces back’, The Telegraph, http://www.telegraph.co.uk /business/2017/08/01/ growth-accelerate-uk-economy-bounces-back/; ‘GDP is not enough: economists and businesses demand new measure of inclusive growth’, The Telegraph, http://www.telegraph.co.uk/business/2017/03/07/gdp-not- enough-economists-businesses-demand-new-measure-inclusive/)
(b) With reference to Extract A, explain two likely economic effects of the higher rate of UK inflation. (6)
June 2019 · AS Paper 2 · Q6(c) 5 marks AO1=1, AO2=2, AO3=2 Short answer inflation
Data and extracts for question 6UK inflation and economic growth Figure 1: UK inflation rate as measured by annual percentage changes in the Consumer Price Index (CPI), January 2014 to January 2018 3.5 3.0 % 2.5 2.0 1.5 1.0 0.5 0.0 -0.5 (Source: www.bankofengland.co.uk/publications/Pages/inflationreport/2017/aug.aspx) Figure 2: Selected changes to the CPI basket of goods and services, 2017 IN OUT Non-dairy milk Apple cider Jigsaw puzzles Menthol cigarettes Child scooters Child swings Cycling helmets Basic mobile phones (Source: www.theguardian.com/business/2017/mar/14/uk-inflation- ons-basket-goods-gin-cycling-helmets) Figure 3: UK exports, £ billions per month, January 2014 to January 2018 52 50 £ billions 48 46 44 42 40 0 (Source: Trading Economics, ONS - https://tradingeconomics.com/united-kingdom/exports) Figure 4: Annual percentage change in real Gross Domestic Product (GDP), 2014-2017 2014 2015 2016 2017 United Kingdom 3.1 2.2 1.8 2.0 Developing countries (average) 4.7 4.2 4.1 4.5 (Source: IMF, World Economic Outlook 2017) Extract A Rising inflation After January 2017, the inflation rate, as measured by the Consumer Price Index (CPI), in the UK has exceeded the Bank of England’s 2% target. Sharp increases in food prices as a result of the fall in the exchange rate of the pound have contributed to rising inflation. Between January and September 2017, food prices have increased by 3.5 percentage 5 points. The Office for National Statistics (ONS) has identified that the rapid increase in food prices affected people on low fixed incomes the most. It leaves them with very little money to spend on relatively more expensive items. Moreover, the Bank of England has observed a rise in the size of personal debt relative to income. In order to maintain their standard of 10 living, many consumers on low fixed incomes are using their credit cards and taking out short-term loans to fund their spending. Inflation rose to over 3% at the end of 2017 leading to the Monetary Policy Committee increasing the base rate of interest by 0.25 percentage points to 0.5% in November 2017. Wage growth has been lagging behind price rises and this is expected to continue. 15 Basic wage increases are expected to be only around 1%. This has heaped considerable pressure on households. The ONS has updated the shopping basket that is used in the measurement of UK inflation, to reflect the lifestyle of households in the country. Technological advancements, changes in consumer tastes and a move towards health, fitness and 20 gluten-free products have made it essential to revise the 2017 basket. (Source: adapted from ‘UK inflation tipped to rise again with wages forecast to stagnate’, The Guardian, https://www.theguardian.com/business/2017/aug/13/ uk-inflation-tipped-to-rise-again-with-wages-forecast-to-stagnate#img-1) Extract B Economic growth and living standards Economic growth is expected to accelerate again as foreign demand for UK exports increases due to the global economic recovery. According to some economists, consumer spending is no longer the engine of growth for the UK. The increase in exports, which is largely due to the fall in the exchange rate of the pound, is expected to be the most 5 significant driver of the UK’s economic growth. Some economists have proposed that the quality of economic growth needs to be measured and not just the quantity. This will allow governments to understand how GDP growth affects the living standards of its citizens. They want governments to publish data on the quality of life alongside GDP data as economic growth varies across the country 10 with jobs and wages distributed unevenly. Economic growth figures also hide differences that are not considered in GDP calculations. In 2017, it was estimated that the relative size of the informal economy of developing countries was nearly five times greater than that of the UK. (Source: adapted from ‘Growth to accelerate as UK economy bounces back’, The Telegraph, http://www.telegraph.co.uk /business/2017/08/01/ growth-accelerate-uk-economy-bounces-back/; ‘GDP is not enough: economists and businesses demand new measure of inclusive growth’, The Telegraph, http://www.telegraph.co.uk/business/2017/03/07/gdp-not- enough-economists-businesses-demand-new-measure-inclusive/)
(c) With reference to the last paragraph of Extract A and Figure 2, explain one reason why it is necessary to regularly update the CPI basket of goods and services. (5)
June 2019 · AS Paper 2 · Q6(d) 10 marks AO1=2, AO2=2, AO3=2, AO4=4 10-mark response aggregate demandnational income and the multiplier
Data and extracts for question 6UK inflation and economic growth Figure 1: UK inflation rate as measured by annual percentage changes in the Consumer Price Index (CPI), January 2014 to January 2018 3.5 3.0 % 2.5 2.0 1.5 1.0 0.5 0.0 -0.5 (Source: www.bankofengland.co.uk/publications/Pages/inflationreport/2017/aug.aspx) Figure 2: Selected changes to the CPI basket of goods and services, 2017 IN OUT Non-dairy milk Apple cider Jigsaw puzzles Menthol cigarettes Child scooters Child swings Cycling helmets Basic mobile phones (Source: www.theguardian.com/business/2017/mar/14/uk-inflation- ons-basket-goods-gin-cycling-helmets) Figure 3: UK exports, £ billions per month, January 2014 to January 2018 52 50 £ billions 48 46 44 42 40 0 (Source: Trading Economics, ONS - https://tradingeconomics.com/united-kingdom/exports) Figure 4: Annual percentage change in real Gross Domestic Product (GDP), 2014-2017 2014 2015 2016 2017 United Kingdom 3.1 2.2 1.8 2.0 Developing countries (average) 4.7 4.2 4.1 4.5 (Source: IMF, World Economic Outlook 2017) Extract A Rising inflation After January 2017, the inflation rate, as measured by the Consumer Price Index (CPI), in the UK has exceeded the Bank of England’s 2% target. Sharp increases in food prices as a result of the fall in the exchange rate of the pound have contributed to rising inflation. Between January and September 2017, food prices have increased by 3.5 percentage 5 points. The Office for National Statistics (ONS) has identified that the rapid increase in food prices affected people on low fixed incomes the most. It leaves them with very little money to spend on relatively more expensive items. Moreover, the Bank of England has observed a rise in the size of personal debt relative to income. In order to maintain their standard of 10 living, many consumers on low fixed incomes are using their credit cards and taking out short-term loans to fund their spending. Inflation rose to over 3% at the end of 2017 leading to the Monetary Policy Committee increasing the base rate of interest by 0.25 percentage points to 0.5% in November 2017. Wage growth has been lagging behind price rises and this is expected to continue. 15 Basic wage increases are expected to be only around 1%. This has heaped considerable pressure on households. The ONS has updated the shopping basket that is used in the measurement of UK inflation, to reflect the lifestyle of households in the country. Technological advancements, changes in consumer tastes and a move towards health, fitness and 20 gluten-free products have made it essential to revise the 2017 basket. (Source: adapted from ‘UK inflation tipped to rise again with wages forecast to stagnate’, The Guardian, https://www.theguardian.com/business/2017/aug/13/ uk-inflation-tipped-to-rise-again-with-wages-forecast-to-stagnate#img-1) Extract B Economic growth and living standards Economic growth is expected to accelerate again as foreign demand for UK exports increases due to the global economic recovery. According to some economists, consumer spending is no longer the engine of growth for the UK. The increase in exports, which is largely due to the fall in the exchange rate of the pound, is expected to be the most 5 significant driver of the UK’s economic growth. Some economists have proposed that the quality of economic growth needs to be measured and not just the quantity. This will allow governments to understand how GDP growth affects the living standards of its citizens. They want governments to publish data on the quality of life alongside GDP data as economic growth varies across the country 10 with jobs and wages distributed unevenly. Economic growth figures also hide differences that are not considered in GDP calculations. In 2017, it was estimated that the relative size of the informal economy of developing countries was nearly five times greater than that of the UK. (Source: adapted from ‘Growth to accelerate as UK economy bounces back’, The Telegraph, http://www.telegraph.co.uk /business/2017/08/01/ growth-accelerate-uk-economy-bounces-back/; ‘GDP is not enough: economists and businesses demand new measure of inclusive growth’, The Telegraph, http://www.telegraph.co.uk/business/2017/03/07/gdp-not- enough-economists-businesses-demand-new-measure-inclusive/)
(d) With reference to Figure 3, assess the likely impact of the change in the value of exports, since mid-2016, on the economic growth of the UK. Use an aggregate demand and aggregate supply diagram in your answer. (10)
June 2019 · AS Paper 2 · Q6(e) 15 marks AO1=3, AO2=3, AO3=3, AO4=6 15-mark response measuring economic growth
Data and extracts for question 6UK inflation and economic growth Figure 1: UK inflation rate as measured by annual percentage changes in the Consumer Price Index (CPI), January 2014 to January 2018 3.5 3.0 % 2.5 2.0 1.5 1.0 0.5 0.0 -0.5 (Source: www.bankofengland.co.uk/publications/Pages/inflationreport/2017/aug.aspx) Figure 2: Selected changes to the CPI basket of goods and services, 2017 IN OUT Non-dairy milk Apple cider Jigsaw puzzles Menthol cigarettes Child scooters Child swings Cycling helmets Basic mobile phones (Source: www.theguardian.com/business/2017/mar/14/uk-inflation- ons-basket-goods-gin-cycling-helmets) Figure 3: UK exports, £ billions per month, January 2014 to January 2018 52 50 £ billions 48 46 44 42 40 0 (Source: Trading Economics, ONS - https://tradingeconomics.com/united-kingdom/exports) Figure 4: Annual percentage change in real Gross Domestic Product (GDP), 2014-2017 2014 2015 2016 2017 United Kingdom 3.1 2.2 1.8 2.0 Developing countries (average) 4.7 4.2 4.1 4.5 (Source: IMF, World Economic Outlook 2017) Extract A Rising inflation After January 2017, the inflation rate, as measured by the Consumer Price Index (CPI), in the UK has exceeded the Bank of England’s 2% target. Sharp increases in food prices as a result of the fall in the exchange rate of the pound have contributed to rising inflation. Between January and September 2017, food prices have increased by 3.5 percentage 5 points. The Office for National Statistics (ONS) has identified that the rapid increase in food prices affected people on low fixed incomes the most. It leaves them with very little money to spend on relatively more expensive items. Moreover, the Bank of England has observed a rise in the size of personal debt relative to income. In order to maintain their standard of 10 living, many consumers on low fixed incomes are using their credit cards and taking out short-term loans to fund their spending. Inflation rose to over 3% at the end of 2017 leading to the Monetary Policy Committee increasing the base rate of interest by 0.25 percentage points to 0.5% in November 2017. Wage growth has been lagging behind price rises and this is expected to continue. 15 Basic wage increases are expected to be only around 1%. This has heaped considerable pressure on households. The ONS has updated the shopping basket that is used in the measurement of UK inflation, to reflect the lifestyle of households in the country. Technological advancements, changes in consumer tastes and a move towards health, fitness and 20 gluten-free products have made it essential to revise the 2017 basket. (Source: adapted from ‘UK inflation tipped to rise again with wages forecast to stagnate’, The Guardian, https://www.theguardian.com/business/2017/aug/13/ uk-inflation-tipped-to-rise-again-with-wages-forecast-to-stagnate#img-1) Extract B Economic growth and living standards Economic growth is expected to accelerate again as foreign demand for UK exports increases due to the global economic recovery. According to some economists, consumer spending is no longer the engine of growth for the UK. The increase in exports, which is largely due to the fall in the exchange rate of the pound, is expected to be the most 5 significant driver of the UK’s economic growth. Some economists have proposed that the quality of economic growth needs to be measured and not just the quantity. This will allow governments to understand how GDP growth affects the living standards of its citizens. They want governments to publish data on the quality of life alongside GDP data as economic growth varies across the country 10 with jobs and wages distributed unevenly. Economic growth figures also hide differences that are not considered in GDP calculations. In 2017, it was estimated that the relative size of the informal economy of developing countries was nearly five times greater than that of the UK. (Source: adapted from ‘Growth to accelerate as UK economy bounces back’, The Telegraph, http://www.telegraph.co.uk /business/2017/08/01/ growth-accelerate-uk-economy-bounces-back/; ‘GDP is not enough: economists and businesses demand new measure of inclusive growth’, The Telegraph, http://www.telegraph.co.uk/business/2017/03/07/gdp-not- enough-economists-businesses-demand-new-measure-inclusive/)
(e) With reference to Figure 4, Extract B and your own knowledge, discuss the limitations of using GDP data to compare living standards between the UK and developing countries. (15)
June 2019 · AS Paper 2 · Q6(f) 20 marks AO1=4, AO2=4, AO3=6, AO4=6 20-mark essay Either/or fiscal and monetary policyinflation
Data and extracts for question 6UK inflation and economic growth Figure 1: UK inflation rate as measured by annual percentage changes in the Consumer Price Index (CPI), January 2014 to January 2018 3.5 3.0 % 2.5 2.0 1.5 1.0 0.5 0.0 -0.5 (Source: www.bankofengland.co.uk/publications/Pages/inflationreport/2017/aug.aspx) Figure 2: Selected changes to the CPI basket of goods and services, 2017 IN OUT Non-dairy milk Apple cider Jigsaw puzzles Menthol cigarettes Child scooters Child swings Cycling helmets Basic mobile phones (Source: www.theguardian.com/business/2017/mar/14/uk-inflation- ons-basket-goods-gin-cycling-helmets) Figure 3: UK exports, £ billions per month, January 2014 to January 2018 52 50 £ billions 48 46 44 42 40 0 (Source: Trading Economics, ONS - https://tradingeconomics.com/united-kingdom/exports) Figure 4: Annual percentage change in real Gross Domestic Product (GDP), 2014-2017 2014 2015 2016 2017 United Kingdom 3.1 2.2 1.8 2.0 Developing countries (average) 4.7 4.2 4.1 4.5 (Source: IMF, World Economic Outlook 2017) Extract A Rising inflation After January 2017, the inflation rate, as measured by the Consumer Price Index (CPI), in the UK has exceeded the Bank of England’s 2% target. Sharp increases in food prices as a result of the fall in the exchange rate of the pound have contributed to rising inflation. Between January and September 2017, food prices have increased by 3.5 percentage 5 points. The Office for National Statistics (ONS) has identified that the rapid increase in food prices affected people on low fixed incomes the most. It leaves them with very little money to spend on relatively more expensive items. Moreover, the Bank of England has observed a rise in the size of personal debt relative to income. In order to maintain their standard of 10 living, many consumers on low fixed incomes are using their credit cards and taking out short-term loans to fund their spending. Inflation rose to over 3% at the end of 2017 leading to the Monetary Policy Committee increasing the base rate of interest by 0.25 percentage points to 0.5% in November 2017. Wage growth has been lagging behind price rises and this is expected to continue. 15 Basic wage increases are expected to be only around 1%. This has heaped considerable pressure on households. The ONS has updated the shopping basket that is used in the measurement of UK inflation, to reflect the lifestyle of households in the country. Technological advancements, changes in consumer tastes and a move towards health, fitness and 20 gluten-free products have made it essential to revise the 2017 basket. (Source: adapted from ‘UK inflation tipped to rise again with wages forecast to stagnate’, The Guardian, https://www.theguardian.com/business/2017/aug/13/ uk-inflation-tipped-to-rise-again-with-wages-forecast-to-stagnate#img-1) Extract B Economic growth and living standards Economic growth is expected to accelerate again as foreign demand for UK exports increases due to the global economic recovery. According to some economists, consumer spending is no longer the engine of growth for the UK. The increase in exports, which is largely due to the fall in the exchange rate of the pound, is expected to be the most 5 significant driver of the UK’s economic growth. Some economists have proposed that the quality of economic growth needs to be measured and not just the quantity. This will allow governments to understand how GDP growth affects the living standards of its citizens. They want governments to publish data on the quality of life alongside GDP data as economic growth varies across the country 10 with jobs and wages distributed unevenly. Economic growth figures also hide differences that are not considered in GDP calculations. In 2017, it was estimated that the relative size of the informal economy of developing countries was nearly five times greater than that of the UK. (Source: adapted from ‘Growth to accelerate as UK economy bounces back’, The Telegraph, http://www.telegraph.co.uk /business/2017/08/01/ growth-accelerate-uk-economy-bounces-back/; ‘GDP is not enough: economists and businesses demand new measure of inclusive growth’, The Telegraph, http://www.telegraph.co.uk/business/2017/03/07/gdp-not- enough-economists-businesses-demand-new-measure-inclusive/)
(f) Evaluate the use of interest rate changes as a means of controlling UK inflation. (20)
June 2019 · Paper 1 · Q1(a) 2 marks AO2=2 Calculation elasticity of supply
Data and extracts for question 11 Between 2016 and 2017 the average price of new build houses in the UK rose by an estimated 5.4%. Year Quantity of UK new house builds 2016 134 612 2017 162 880 (Source: http://www.telegraph.co.uk/business/2017/05/25/number-new-homes-built- hits-highest-level-since-financial-crisis/)
(a) With reference to the data provided, calculate the price elasticity of supply for new house builds between 2016 and 2017. You are advised to show your workings. (2)
June 2019 · Paper 1 · Q2(a) 4 marks AO1=2, AO2=2 Diagram supply and demand
Data and extracts for question 22 In August 2017 Hurricane Harvey caused the closure of nearly a quarter of the oil production capacity in the United States.
(a) Draw a supply and demand diagram to show the likely microeconomic effects of the hurricane on the US oil market. (4)
June 2019 · Paper 1 · Q4(b) 4 marks AO1=2, AO2=2 Calculation revenues costs and profits
Data and extracts for question 44 In 2016, the insurance group Esure undertook a demerger with its GoCompare price comparison website.
Following the demerger, GoCompare announced in 2017 a profit of £17.5 million, up 21.5% on 2016. Total revenue in 2017 was £75.8 million, up 4.1% on 2016. (Source: adapted from https://www.insuranceage.co.uk/insurer/3107496/ profits-up-at-go-compare) (b) Calculate, using the information provided, the total costs of GoCompare in 2016. (4)
June 2019 · Paper 1 · Q6(a) 5 marks AO1=1, AO2=2, AO3=2 Short answer nature of economics
Data and extracts for question 6Energy and telecommunication markets in the UK Figure 1: Average annual household bill from the Big Six UK energy suppliers, 2017 1250 1000 * 750 Average annual bill £ 500 250 0 Average annual bill on standard variable tariff Supplier’s cheapest annual average tariff *market cheapest annual tariff (Source: https://www.lovemoney.com/news/67298/standard-variable-tariff-compared- cheapest-deal-provider-savings) Extract A Energy price cap to fix ‘broken’ market in UK The Prime Minister recently said that the regulator Ofgem (Office of Gas and Electricity Markets) should limit electricity and gas suppliers’ most expensive tariffs. Under the planned new legislation, the energy bills of 11 million households will be capped for as long as five years. The government claimed this cap could save households 5 up to £100 a year. This legislation would force Ofgem to change the licence conditions for energy suppliers so that they are required to cap electricity and gas prices. The measure will apply to anyone on a standard variable tariff, the expensive plans that customers are moved to when cheaper, fixed-price deals end. Ofgem will need to consult energy companies on how the cap is calculated, the government said. The Prime Minister 10 repeated her claim that she had to act because the ‘market is broken’, a charge the big energy companies reject. “I have been clear that our broken energy market has to change – it has to offer fairer prices for millions of loyal customers who have been paying hundreds of pounds too much,” she said. However, Michael Lewis, chief executive of E.ON said “the government must guard 15 against any unintended consequences that undermine customer service and push up prices as a whole. A price cap will not be good for customers. It will reduce competition and innovation”. Smaller suppliers such as First Utility said the Big Six had only themselves to blame for the cap, because they had kept millions of people on standard variable tariffs. 20 (Source: adapted from ‘UK puts energy efficiency at heart of climate change strategy’, Adam Vaughan, Copyright Guardian News & Media Ltd 2017 https://www.theguardian.com/ money/2017/oct/12/may-energy-price-cap-ofgem-electricity-gas-tariffs) Figure 2: The monthly rental cost of a telephone landline BT Retail 20 19 Virgin Media 18 Orange/EE 17 Wholesale 16 Line Rental* 15 Price 14 (£) 13 12 11 10 9 8 7 0 2006 2007 2008 2009 2010 2011 2012 2013 2014 2015 2016 *Wholesale line rental – the rental price BT Openreach charges telephone service providers (Source: https://www.ofcom.org.uk/about-ofcom/latest/features-and-news/ landline-prices-review) Extract B BT profit rises BT Group, which includes BT Openreach and BT Retail, reported a rise in profit as revenue increased following the integration of the consumer mobile business, EE. BT finalised the takeover of EE in August 2016, and the integration has resulted in BT controlling 35% of the mobile consumer market. The profit of the UK-based telecommunication group in its 5 second quarter 2017 rose to £566 million. BT Group chief executive Gavin Patterson said: “We will operate a multi-brand strategy with UK customers being able to choose a mix of BT, EE or Plusnet services, depending on which suits them best. The acquisition enables us to offer great value bundles of services and customers are set to be the winners as we compete for their business”. 10 (Source: adapted from www.marketwatch.com (Oct 27 – 2016) and http://home.bt.com/ news/bt-life/bt-to-retain-ee-brand-as-acquisition-confirmed-11364037422234) Extract C BT to slash landline charges for 1 million customers Rental charges for landline-only customers – households with a telephone-only contract but no BT broadband – will fall from £18.99 to £11.99 per month after the regulator attacked existing deals as ‘poor value for money’. This rental reduction will save a million landline-only customers £84 a year. 5 The regulator Ofcom (Office of Communications) said it stepped in because these bills for landline-only customers – nearly two-thirds of whom are over 65 – have “soared” in recent years. This is despite BT and other landline providers benefiting from significant cuts in the wholesale line rental cost of providing the service by BT Openreach. Many landline-only customers are elderly, and have been with BT for decades. Ofcom has 10 focused on BT because it accounts for two-thirds of the UK’s 1.5m landline-only customers. A spokesperson for Ofcom said “This position [of dominance] has allowed BT to increase prices without much risk of losing customers, and other providers have followed BT’s pricing lead. We expect BT’s price cut to mean other providers will follow suit”. Ofcom 15 said that over three-quarters of BT’s landline-only customers have never switched provider, which has left them a prime target for price rises. The regulator said that all major landline providers have increased their line rental charges by between 23% and 47% in recent years, while their own costs for providing the service have fallen about 27%. Ofcom said it is also looking at measures to help people shop around for better 20 deals with more confidence. (Source: adapted from ‘BT to slash landline charges for 1m customers’, Mark Sweney, Copyright Guardian News & Media Ltd 2017 https://www.theguardian.com/business/2017/ oct/26/bt-to-slash-landline-charges-for-1m-customers)
(a) With reference to Extract A, explain the difference between a positive statement and a normative statement. (5)
June 2019 · Paper 1 · Q6(b) 8 marks AO1=2, AO2=2, AO3=2, AO4=2 8-mark response business growth and objectives
Data and extracts for question 6Energy and telecommunication markets in the UK Figure 1: Average annual household bill from the Big Six UK energy suppliers, 2017 1250 1000 * 750 Average annual bill £ 500 250 0 Average annual bill on standard variable tariff Supplier’s cheapest annual average tariff *market cheapest annual tariff (Source: https://www.lovemoney.com/news/67298/standard-variable-tariff-compared- cheapest-deal-provider-savings) Extract A Energy price cap to fix ‘broken’ market in UK The Prime Minister recently said that the regulator Ofgem (Office of Gas and Electricity Markets) should limit electricity and gas suppliers’ most expensive tariffs. Under the planned new legislation, the energy bills of 11 million households will be capped for as long as five years. The government claimed this cap could save households 5 up to £100 a year. This legislation would force Ofgem to change the licence conditions for energy suppliers so that they are required to cap electricity and gas prices. The measure will apply to anyone on a standard variable tariff, the expensive plans that customers are moved to when cheaper, fixed-price deals end. Ofgem will need to consult energy companies on how the cap is calculated, the government said. The Prime Minister 10 repeated her claim that she had to act because the ‘market is broken’, a charge the big energy companies reject. “I have been clear that our broken energy market has to change – it has to offer fairer prices for millions of loyal customers who have been paying hundreds of pounds too much,” she said. However, Michael Lewis, chief executive of E.ON said “the government must guard 15 against any unintended consequences that undermine customer service and push up prices as a whole. A price cap will not be good for customers. It will reduce competition and innovation”. Smaller suppliers such as First Utility said the Big Six had only themselves to blame for the cap, because they had kept millions of people on standard variable tariffs. 20 (Source: adapted from ‘UK puts energy efficiency at heart of climate change strategy’, Adam Vaughan, Copyright Guardian News & Media Ltd 2017 https://www.theguardian.com/ money/2017/oct/12/may-energy-price-cap-ofgem-electricity-gas-tariffs) Figure 2: The monthly rental cost of a telephone landline BT Retail 20 19 Virgin Media 18 Orange/EE 17 Wholesale 16 Line Rental* 15 Price 14 (£) 13 12 11 10 9 8 7 0 2006 2007 2008 2009 2010 2011 2012 2013 2014 2015 2016 *Wholesale line rental – the rental price BT Openreach charges telephone service providers (Source: https://www.ofcom.org.uk/about-ofcom/latest/features-and-news/ landline-prices-review) Extract B BT profit rises BT Group, which includes BT Openreach and BT Retail, reported a rise in profit as revenue increased following the integration of the consumer mobile business, EE. BT finalised the takeover of EE in August 2016, and the integration has resulted in BT controlling 35% of the mobile consumer market. The profit of the UK-based telecommunication group in its 5 second quarter 2017 rose to £566 million. BT Group chief executive Gavin Patterson said: “We will operate a multi-brand strategy with UK customers being able to choose a mix of BT, EE or Plusnet services, depending on which suits them best. The acquisition enables us to offer great value bundles of services and customers are set to be the winners as we compete for their business”. 10 (Source: adapted from www.marketwatch.com (Oct 27 – 2016) and http://home.bt.com/ news/bt-life/bt-to-retain-ee-brand-as-acquisition-confirmed-11364037422234) Extract C BT to slash landline charges for 1 million customers Rental charges for landline-only customers – households with a telephone-only contract but no BT broadband – will fall from £18.99 to £11.99 per month after the regulator attacked existing deals as ‘poor value for money’. This rental reduction will save a million landline-only customers £84 a year. 5 The regulator Ofcom (Office of Communications) said it stepped in because these bills for landline-only customers – nearly two-thirds of whom are over 65 – have “soared” in recent years. This is despite BT and other landline providers benefiting from significant cuts in the wholesale line rental cost of providing the service by BT Openreach. Many landline-only customers are elderly, and have been with BT for decades. Ofcom has 10 focused on BT because it accounts for two-thirds of the UK’s 1.5m landline-only customers. A spokesperson for Ofcom said “This position [of dominance] has allowed BT to increase prices without much risk of losing customers, and other providers have followed BT’s pricing lead. We expect BT’s price cut to mean other providers will follow suit”. Ofcom 15 said that over three-quarters of BT’s landline-only customers have never switched provider, which has left them a prime target for price rises. The regulator said that all major landline providers have increased their line rental charges by between 23% and 47% in recent years, while their own costs for providing the service have fallen about 27%. Ofcom said it is also looking at measures to help people shop around for better 20 deals with more confidence. (Source: adapted from ‘BT to slash landline charges for 1m customers’, Mark Sweney, Copyright Guardian News & Media Ltd 2017 https://www.theguardian.com/business/2017/ oct/26/bt-to-slash-landline-charges-for-1m-customers)
(b) With reference to Extract B, examine the likely benefits to consumers of the integration between BT and EE. (8)
June 2019 · Paper 1 · Q6(c) 10 marks AO1=2, AO2=2, AO3=2, AO4=4 10-mark response public goods and information gapsrational decision making and behavioural economics
Data and extracts for question 6Energy and telecommunication markets in the UK Figure 1: Average annual household bill from the Big Six UK energy suppliers, 2017 1250 1000 * 750 Average annual bill £ 500 250 0 Average annual bill on standard variable tariff Supplier’s cheapest annual average tariff *market cheapest annual tariff (Source: https://www.lovemoney.com/news/67298/standard-variable-tariff-compared- cheapest-deal-provider-savings) Extract A Energy price cap to fix ‘broken’ market in UK The Prime Minister recently said that the regulator Ofgem (Office of Gas and Electricity Markets) should limit electricity and gas suppliers’ most expensive tariffs. Under the planned new legislation, the energy bills of 11 million households will be capped for as long as five years. The government claimed this cap could save households 5 up to £100 a year. This legislation would force Ofgem to change the licence conditions for energy suppliers so that they are required to cap electricity and gas prices. The measure will apply to anyone on a standard variable tariff, the expensive plans that customers are moved to when cheaper, fixed-price deals end. Ofgem will need to consult energy companies on how the cap is calculated, the government said. The Prime Minister 10 repeated her claim that she had to act because the ‘market is broken’, a charge the big energy companies reject. “I have been clear that our broken energy market has to change – it has to offer fairer prices for millions of loyal customers who have been paying hundreds of pounds too much,” she said. However, Michael Lewis, chief executive of E.ON said “the government must guard 15 against any unintended consequences that undermine customer service and push up prices as a whole. A price cap will not be good for customers. It will reduce competition and innovation”. Smaller suppliers such as First Utility said the Big Six had only themselves to blame for the cap, because they had kept millions of people on standard variable tariffs. 20 (Source: adapted from ‘UK puts energy efficiency at heart of climate change strategy’, Adam Vaughan, Copyright Guardian News & Media Ltd 2017 https://www.theguardian.com/ money/2017/oct/12/may-energy-price-cap-ofgem-electricity-gas-tariffs) Figure 2: The monthly rental cost of a telephone landline BT Retail 20 19 Virgin Media 18 Orange/EE 17 Wholesale 16 Line Rental* 15 Price 14 (£) 13 12 11 10 9 8 7 0 2006 2007 2008 2009 2010 2011 2012 2013 2014 2015 2016 *Wholesale line rental – the rental price BT Openreach charges telephone service providers (Source: https://www.ofcom.org.uk/about-ofcom/latest/features-and-news/ landline-prices-review) Extract B BT profit rises BT Group, which includes BT Openreach and BT Retail, reported a rise in profit as revenue increased following the integration of the consumer mobile business, EE. BT finalised the takeover of EE in August 2016, and the integration has resulted in BT controlling 35% of the mobile consumer market. The profit of the UK-based telecommunication group in its 5 second quarter 2017 rose to £566 million. BT Group chief executive Gavin Patterson said: “We will operate a multi-brand strategy with UK customers being able to choose a mix of BT, EE or Plusnet services, depending on which suits them best. The acquisition enables us to offer great value bundles of services and customers are set to be the winners as we compete for their business”. 10 (Source: adapted from www.marketwatch.com (Oct 27 – 2016) and http://home.bt.com/ news/bt-life/bt-to-retain-ee-brand-as-acquisition-confirmed-11364037422234) Extract C BT to slash landline charges for 1 million customers Rental charges for landline-only customers – households with a telephone-only contract but no BT broadband – will fall from £18.99 to £11.99 per month after the regulator attacked existing deals as ‘poor value for money’. This rental reduction will save a million landline-only customers £84 a year. 5 The regulator Ofcom (Office of Communications) said it stepped in because these bills for landline-only customers – nearly two-thirds of whom are over 65 – have “soared” in recent years. This is despite BT and other landline providers benefiting from significant cuts in the wholesale line rental cost of providing the service by BT Openreach. Many landline-only customers are elderly, and have been with BT for decades. Ofcom has 10 focused on BT because it accounts for two-thirds of the UK’s 1.5m landline-only customers. A spokesperson for Ofcom said “This position [of dominance] has allowed BT to increase prices without much risk of losing customers, and other providers have followed BT’s pricing lead. We expect BT’s price cut to mean other providers will follow suit”. Ofcom 15 said that over three-quarters of BT’s landline-only customers have never switched provider, which has left them a prime target for price rises. The regulator said that all major landline providers have increased their line rental charges by between 23% and 47% in recent years, while their own costs for providing the service have fallen about 27%. Ofcom said it is also looking at measures to help people shop around for better 20 deals with more confidence. (Source: adapted from ‘BT to slash landline charges for 1m customers’, Mark Sweney, Copyright Guardian News & Media Ltd 2017 https://www.theguardian.com/business/2017/ oct/26/bt-to-slash-landline-charges-for-1m-customers)
(c) With reference to Extract C, assess possible reasons why many ‘landline-only’ customers do not switch to a cheaper telephone provider. (10)
June 2019 · Paper 1 · Q6(d) 12 marks AO1=2, AO2=2, AO3=4, AO4=4 12-mark response revenues costs and profits
Data and extracts for question 6Energy and telecommunication markets in the UK Figure 1: Average annual household bill from the Big Six UK energy suppliers, 2017 1250 1000 * 750 Average annual bill £ 500 250 0 Average annual bill on standard variable tariff Supplier’s cheapest annual average tariff *market cheapest annual tariff (Source: https://www.lovemoney.com/news/67298/standard-variable-tariff-compared- cheapest-deal-provider-savings) Extract A Energy price cap to fix ‘broken’ market in UK The Prime Minister recently said that the regulator Ofgem (Office of Gas and Electricity Markets) should limit electricity and gas suppliers’ most expensive tariffs. Under the planned new legislation, the energy bills of 11 million households will be capped for as long as five years. The government claimed this cap could save households 5 up to £100 a year. This legislation would force Ofgem to change the licence conditions for energy suppliers so that they are required to cap electricity and gas prices. The measure will apply to anyone on a standard variable tariff, the expensive plans that customers are moved to when cheaper, fixed-price deals end. Ofgem will need to consult energy companies on how the cap is calculated, the government said. The Prime Minister 10 repeated her claim that she had to act because the ‘market is broken’, a charge the big energy companies reject. “I have been clear that our broken energy market has to change – it has to offer fairer prices for millions of loyal customers who have been paying hundreds of pounds too much,” she said. However, Michael Lewis, chief executive of E.ON said “the government must guard 15 against any unintended consequences that undermine customer service and push up prices as a whole. A price cap will not be good for customers. It will reduce competition and innovation”. Smaller suppliers such as First Utility said the Big Six had only themselves to blame for the cap, because they had kept millions of people on standard variable tariffs. 20 (Source: adapted from ‘UK puts energy efficiency at heart of climate change strategy’, Adam Vaughan, Copyright Guardian News & Media Ltd 2017 https://www.theguardian.com/ money/2017/oct/12/may-energy-price-cap-ofgem-electricity-gas-tariffs) Figure 2: The monthly rental cost of a telephone landline BT Retail 20 19 Virgin Media 18 Orange/EE 17 Wholesale 16 Line Rental* 15 Price 14 (£) 13 12 11 10 9 8 7 0 2006 2007 2008 2009 2010 2011 2012 2013 2014 2015 2016 *Wholesale line rental – the rental price BT Openreach charges telephone service providers (Source: https://www.ofcom.org.uk/about-ofcom/latest/features-and-news/ landline-prices-review) Extract B BT profit rises BT Group, which includes BT Openreach and BT Retail, reported a rise in profit as revenue increased following the integration of the consumer mobile business, EE. BT finalised the takeover of EE in August 2016, and the integration has resulted in BT controlling 35% of the mobile consumer market. The profit of the UK-based telecommunication group in its 5 second quarter 2017 rose to £566 million. BT Group chief executive Gavin Patterson said: “We will operate a multi-brand strategy with UK customers being able to choose a mix of BT, EE or Plusnet services, depending on which suits them best. The acquisition enables us to offer great value bundles of services and customers are set to be the winners as we compete for their business”. 10 (Source: adapted from www.marketwatch.com (Oct 27 – 2016) and http://home.bt.com/ news/bt-life/bt-to-retain-ee-brand-as-acquisition-confirmed-11364037422234) Extract C BT to slash landline charges for 1 million customers Rental charges for landline-only customers – households with a telephone-only contract but no BT broadband – will fall from £18.99 to £11.99 per month after the regulator attacked existing deals as ‘poor value for money’. This rental reduction will save a million landline-only customers £84 a year. 5 The regulator Ofcom (Office of Communications) said it stepped in because these bills for landline-only customers – nearly two-thirds of whom are over 65 – have “soared” in recent years. This is despite BT and other landline providers benefiting from significant cuts in the wholesale line rental cost of providing the service by BT Openreach. Many landline-only customers are elderly, and have been with BT for decades. Ofcom has 10 focused on BT because it accounts for two-thirds of the UK’s 1.5m landline-only customers. A spokesperson for Ofcom said “This position [of dominance] has allowed BT to increase prices without much risk of losing customers, and other providers have followed BT’s pricing lead. We expect BT’s price cut to mean other providers will follow suit”. Ofcom 15 said that over three-quarters of BT’s landline-only customers have never switched provider, which has left them a prime target for price rises. The regulator said that all major landline providers have increased their line rental charges by between 23% and 47% in recent years, while their own costs for providing the service have fallen about 27%. Ofcom said it is also looking at measures to help people shop around for better 20 deals with more confidence. (Source: adapted from ‘BT to slash landline charges for 1m customers’, Mark Sweney, Copyright Guardian News & Media Ltd 2017 https://www.theguardian.com/business/2017/ oct/26/bt-to-slash-landline-charges-for-1m-customers)
(d) Discuss one likely reason for the rise in BT’s profit (Figure 2, Extracts B and C). Use a cost and revenue diagram to support your answer. (12)
June 2019 · Paper 1 · Q6(e) 15 marks AO1=3, AO2=3, AO3=3, AO4=6 15-mark response competition policy and regulation
Data and extracts for question 6Energy and telecommunication markets in the UK Figure 1: Average annual household bill from the Big Six UK energy suppliers, 2017 1250 1000 * 750 Average annual bill £ 500 250 0 Average annual bill on standard variable tariff Supplier’s cheapest annual average tariff *market cheapest annual tariff (Source: https://www.lovemoney.com/news/67298/standard-variable-tariff-compared- cheapest-deal-provider-savings) Extract A Energy price cap to fix ‘broken’ market in UK The Prime Minister recently said that the regulator Ofgem (Office of Gas and Electricity Markets) should limit electricity and gas suppliers’ most expensive tariffs. Under the planned new legislation, the energy bills of 11 million households will be capped for as long as five years. The government claimed this cap could save households 5 up to £100 a year. This legislation would force Ofgem to change the licence conditions for energy suppliers so that they are required to cap electricity and gas prices. The measure will apply to anyone on a standard variable tariff, the expensive plans that customers are moved to when cheaper, fixed-price deals end. Ofgem will need to consult energy companies on how the cap is calculated, the government said. The Prime Minister 10 repeated her claim that she had to act because the ‘market is broken’, a charge the big energy companies reject. “I have been clear that our broken energy market has to change – it has to offer fairer prices for millions of loyal customers who have been paying hundreds of pounds too much,” she said. However, Michael Lewis, chief executive of E.ON said “the government must guard 15 against any unintended consequences that undermine customer service and push up prices as a whole. A price cap will not be good for customers. It will reduce competition and innovation”. Smaller suppliers such as First Utility said the Big Six had only themselves to blame for the cap, because they had kept millions of people on standard variable tariffs. 20 (Source: adapted from ‘UK puts energy efficiency at heart of climate change strategy’, Adam Vaughan, Copyright Guardian News & Media Ltd 2017 https://www.theguardian.com/ money/2017/oct/12/may-energy-price-cap-ofgem-electricity-gas-tariffs) Figure 2: The monthly rental cost of a telephone landline BT Retail 20 19 Virgin Media 18 Orange/EE 17 Wholesale 16 Line Rental* 15 Price 14 (£) 13 12 11 10 9 8 7 0 2006 2007 2008 2009 2010 2011 2012 2013 2014 2015 2016 *Wholesale line rental – the rental price BT Openreach charges telephone service providers (Source: https://www.ofcom.org.uk/about-ofcom/latest/features-and-news/ landline-prices-review) Extract B BT profit rises BT Group, which includes BT Openreach and BT Retail, reported a rise in profit as revenue increased following the integration of the consumer mobile business, EE. BT finalised the takeover of EE in August 2016, and the integration has resulted in BT controlling 35% of the mobile consumer market. The profit of the UK-based telecommunication group in its 5 second quarter 2017 rose to £566 million. BT Group chief executive Gavin Patterson said: “We will operate a multi-brand strategy with UK customers being able to choose a mix of BT, EE or Plusnet services, depending on which suits them best. The acquisition enables us to offer great value bundles of services and customers are set to be the winners as we compete for their business”. 10 (Source: adapted from www.marketwatch.com (Oct 27 – 2016) and http://home.bt.com/ news/bt-life/bt-to-retain-ee-brand-as-acquisition-confirmed-11364037422234) Extract C BT to slash landline charges for 1 million customers Rental charges for landline-only customers – households with a telephone-only contract but no BT broadband – will fall from £18.99 to £11.99 per month after the regulator attacked existing deals as ‘poor value for money’. This rental reduction will save a million landline-only customers £84 a year. 5 The regulator Ofcom (Office of Communications) said it stepped in because these bills for landline-only customers – nearly two-thirds of whom are over 65 – have “soared” in recent years. This is despite BT and other landline providers benefiting from significant cuts in the wholesale line rental cost of providing the service by BT Openreach. Many landline-only customers are elderly, and have been with BT for decades. Ofcom has 10 focused on BT because it accounts for two-thirds of the UK’s 1.5m landline-only customers. A spokesperson for Ofcom said “This position [of dominance] has allowed BT to increase prices without much risk of losing customers, and other providers have followed BT’s pricing lead. We expect BT’s price cut to mean other providers will follow suit”. Ofcom 15 said that over three-quarters of BT’s landline-only customers have never switched provider, which has left them a prime target for price rises. The regulator said that all major landline providers have increased their line rental charges by between 23% and 47% in recent years, while their own costs for providing the service have fallen about 27%. Ofcom said it is also looking at measures to help people shop around for better 20 deals with more confidence. (Source: adapted from ‘BT to slash landline charges for 1m customers’, Mark Sweney, Copyright Guardian News & Media Ltd 2017 https://www.theguardian.com/business/2017/ oct/26/bt-to-slash-landline-charges-for-1m-customers)
(e) Discuss methods of government intervention to protect consumers within the utilities markets, such as energy and telecommunications. (15)
June 2019 · Paper 2 · Q1(b) 2 marks AO2=2 Calculation inflation
Data and extracts for question 11 Monthly additions to UK credit card lending, £ billions, 2015 – 2017 16 000 15 500 15 000 14 500 14 000 £ billions 13 500 13 000 12 500 12 000 0 (Source: https://www.ukfinance.org.uk/statistics/cards/)
(b) Using the chart, calculate an index number for additions to credit card lending in March 2017, using January 2016 as the base. You are advised to show your working. (2)
June 2019 · Paper 2 · Q3(a) 2 marks AO1=1, AO3=1 Short answer international competitiveness
Data and extracts for question 33 Unit labour costs for selected European countries, 2017, base year 2010 = 100. Country Unit labour costs Austria 113 Hungary 120 Estonia 129 France 107 (Source: http://www.oecd-ilibrary.org/economics/data/labour/unit-labour- cost-quarterly-indicators-early-estimates_data-00607-en)
(a) Explain one likely reason for Estonia’s unit labour costs rising faster than in other European countries. (2)
June 2019 · Paper 2 · Q6(a) 5 marks AO1=2, AO2=2, AO3=1 Short answer financial sector
Data and extracts for question 6The UK economy since the financial crisis Figure 1: Pound sterling to US$ exchange rate, 2016-17 $ per £ 1.50 UK votes to leave the EU 1.40 UK general election announced 1.30 Price of £1 in US dollars 1.20 1.10 1.00 0 (Source: adapted from https://www.ft.com/content/ d50ce580-3968-11e7-ac89-b01cc67cfeec) Extract A UK companies use forward currency market The Norfolk-based picture frames maker Nielsen Bainbridge recently made forward contracts in the foreign exchange market to reduce the impact of currency fluctuations. The pound’s post-Brexit referendum depreciation has been a test of nerve for Nielsen Bainbridge and many other importers. At present the company’s suppliers are located 5 in Europe or China. “Currency therefore has a big impact on our business and the margins we can obtain,” says Ms Burdett, the Finance Director. Forward contracts enable institutions, businesses and individuals to lock in an exchange rate over a certain period of time regardless of how the rate moves during that time. Ms Burdett buys currency as soon as Nielsen Bainbridge confirms a large order as a way to fix costs. One third of UK 10 business managers are considering shifting from EU to UK suppliers. (Source: adapted from ’UK companies use pound strength to hedge forex risk’ by Roger Blitz, Markets, © FT.com, 16 May 2017. https://www.ft.com/content/ d50ce580-3968-11e7-ac89-b01cc67cfeec) Extract B Bank of England seeking to prevent future bank bailouts The Bank of England has ordered big lenders in the UK to find £116 billion of funding to ensure that taxpayers will never again have to bail out the banking sector. The Bank intends to publish details of how each of the big lenders would cope in the event they find themselves in a situation similar to Royal Bank of Scotland and Lloyds Banking 5 Group, which needed £65 billion of taxpayer bailouts during the 2008 Global Financial Crisis. This had a significant negative impact on the UK government’s national debt and, many would argue, increased the need for contractionary fiscal policy. Having said that, the UK government sold all its shares in Lloyds Banking Group in 2017 and, according to the Chancellor of the Exchequer, “recovered every penny of its investment in Lloyds”. 10 Sir Jon Cunliffe, the deputy governor at the Bank responsible for financial stability, said regulators needed to let banks fail in a similar way that traditional companies collapse. This has not been possible in the past because of the risk that savers lose their money and because a system did not exist to allow banks to be put into insolvency. “Just like when other businesses fail, losses arising from bank failure would be imposed 15 on shareholders and investors. This protects the public from loss and incentivises banks to operate more prudently,” said Cunliffe. (Source: adapted from ‘Bank of England tells lenders to find £116bn to help prevent bailouts’, by Jill Treanor, 02 October 2017, Copyright The Guardian News and Media Ltd https://www.theguardian.com/business/2017/oct/02 /bank-of-england-bailouts-rbs-lloyds and ‘Lloyds bank bailout repaid in full, Philip Hammond claims’, by Jill Treanor, Larry Elliott, 21 April 2017, Copyright Guardian News & Media Ltd 2017 https://www.theguardian.com/business/ 2017/apr/21/lloyds-bank-bailout-repaid-in-full-philip-hammond-claims) Extract C Bank of England tells lenders to increase capital reserves The Bank of England has told lenders they will need to build a special reserve worth £11.4 billion by the end of 2018 as it tries to make banks more resilient to the risk posed by mounting consumer debt. This reserve of assets that can be readily turned into cash is a way of forcing banks to set aside capital reserves in good times in order to keep lending 5 to the wider economy at a steady level, even during an economic downturn. In 2017 the Bank of England told UK banks it would raise the reserve ratio, relative to all assets, from zero to 0.5% and also forecast a further increase to 1% by the end of 2017. The move is not intended to directly reduce consumer demand for credit, which in 2017 grew by 10.3% on an annual basis, but it may well lead to banks becoming less willing 10 to lend to consumers. Since the Bank of England has recently become increasingly concerned about consumer borrowing, including rising car loans and credit card debt, this may be no bad thing as far as the Bank of England is concerned, even if it does have a negative impact on the wider economy. Analysts are concerned about the impact on consumer confidence of rising inflation, 15 partly caused by a falling pound. With falling real incomes consumers could become more vulnerable to falling behind with their credit card and personal loan repayments. Despite these concerns the UK economy recently recorded the lowest rate of unemployment since 1975. (Source: adapted from ‘Bank of England tells lenders to increase capital buffers by £11.4bn’ by Caroline Binham, Gemma Tetlow and Martin Arnold © Financial Times 2017 https://www.ft.com/content/9bc99294-5b1b-11e7-9bc8-8055f264aa8b)
(a) With reference to Extract A, explain the role of forward markets in currencies. (5)
June 2019 · Paper 2 · Q6(b) 8 marks AO1=2, AO2=2, AO3=2, AO4=2 8-mark response exchange rates
Data and extracts for question 6The UK economy since the financial crisis Figure 1: Pound sterling to US$ exchange rate, 2016-17 $ per £ 1.50 UK votes to leave the EU 1.40 UK general election announced 1.30 Price of £1 in US dollars 1.20 1.10 1.00 0 (Source: adapted from https://www.ft.com/content/ d50ce580-3968-11e7-ac89-b01cc67cfeec) Extract A UK companies use forward currency market The Norfolk-based picture frames maker Nielsen Bainbridge recently made forward contracts in the foreign exchange market to reduce the impact of currency fluctuations. The pound’s post-Brexit referendum depreciation has been a test of nerve for Nielsen Bainbridge and many other importers. At present the company’s suppliers are located 5 in Europe or China. “Currency therefore has a big impact on our business and the margins we can obtain,” says Ms Burdett, the Finance Director. Forward contracts enable institutions, businesses and individuals to lock in an exchange rate over a certain period of time regardless of how the rate moves during that time. Ms Burdett buys currency as soon as Nielsen Bainbridge confirms a large order as a way to fix costs. One third of UK 10 business managers are considering shifting from EU to UK suppliers. (Source: adapted from ’UK companies use pound strength to hedge forex risk’ by Roger Blitz, Markets, © FT.com, 16 May 2017. https://www.ft.com/content/ d50ce580-3968-11e7-ac89-b01cc67cfeec) Extract B Bank of England seeking to prevent future bank bailouts The Bank of England has ordered big lenders in the UK to find £116 billion of funding to ensure that taxpayers will never again have to bail out the banking sector. The Bank intends to publish details of how each of the big lenders would cope in the event they find themselves in a situation similar to Royal Bank of Scotland and Lloyds Banking 5 Group, which needed £65 billion of taxpayer bailouts during the 2008 Global Financial Crisis. This had a significant negative impact on the UK government’s national debt and, many would argue, increased the need for contractionary fiscal policy. Having said that, the UK government sold all its shares in Lloyds Banking Group in 2017 and, according to the Chancellor of the Exchequer, “recovered every penny of its investment in Lloyds”. 10 Sir Jon Cunliffe, the deputy governor at the Bank responsible for financial stability, said regulators needed to let banks fail in a similar way that traditional companies collapse. This has not been possible in the past because of the risk that savers lose their money and because a system did not exist to allow banks to be put into insolvency. “Just like when other businesses fail, losses arising from bank failure would be imposed 15 on shareholders and investors. This protects the public from loss and incentivises banks to operate more prudently,” said Cunliffe. (Source: adapted from ‘Bank of England tells lenders to find £116bn to help prevent bailouts’, by Jill Treanor, 02 October 2017, Copyright The Guardian News and Media Ltd https://www.theguardian.com/business/2017/oct/02 /bank-of-england-bailouts-rbs-lloyds and ‘Lloyds bank bailout repaid in full, Philip Hammond claims’, by Jill Treanor, Larry Elliott, 21 April 2017, Copyright Guardian News & Media Ltd 2017 https://www.theguardian.com/business/ 2017/apr/21/lloyds-bank-bailout-repaid-in-full-philip-hammond-claims) Extract C Bank of England tells lenders to increase capital reserves The Bank of England has told lenders they will need to build a special reserve worth £11.4 billion by the end of 2018 as it tries to make banks more resilient to the risk posed by mounting consumer debt. This reserve of assets that can be readily turned into cash is a way of forcing banks to set aside capital reserves in good times in order to keep lending 5 to the wider economy at a steady level, even during an economic downturn. In 2017 the Bank of England told UK banks it would raise the reserve ratio, relative to all assets, from zero to 0.5% and also forecast a further increase to 1% by the end of 2017. The move is not intended to directly reduce consumer demand for credit, which in 2017 grew by 10.3% on an annual basis, but it may well lead to banks becoming less willing 10 to lend to consumers. Since the Bank of England has recently become increasingly concerned about consumer borrowing, including rising car loans and credit card debt, this may be no bad thing as far as the Bank of England is concerned, even if it does have a negative impact on the wider economy. Analysts are concerned about the impact on consumer confidence of rising inflation, 15 partly caused by a falling pound. With falling real incomes consumers could become more vulnerable to falling behind with their credit card and personal loan repayments. Despite these concerns the UK economy recently recorded the lowest rate of unemployment since 1975. (Source: adapted from ‘Bank of England tells lenders to increase capital buffers by £11.4bn’ by Caroline Binham, Gemma Tetlow and Martin Arnold © Financial Times 2017 https://www.ft.com/content/9bc99294-5b1b-11e7-9bc8-8055f264aa8b)
(b) With reference to Extract A and Figure 1, examine the likely impact of the change in the sterling exchange rate on the UK economy. (8)
June 2019 · Paper 2 · Q6(c) 10 marks AO1=2, AO2=2, AO3=2, AO4=4 10-mark response measuring economic growth
Data and extracts for question 6The UK economy since the financial crisis Figure 1: Pound sterling to US$ exchange rate, 2016-17 $ per £ 1.50 UK votes to leave the EU 1.40 UK general election announced 1.30 Price of £1 in US dollars 1.20 1.10 1.00 0 (Source: adapted from https://www.ft.com/content/ d50ce580-3968-11e7-ac89-b01cc67cfeec) Extract A UK companies use forward currency market The Norfolk-based picture frames maker Nielsen Bainbridge recently made forward contracts in the foreign exchange market to reduce the impact of currency fluctuations. The pound’s post-Brexit referendum depreciation has been a test of nerve for Nielsen Bainbridge and many other importers. At present the company’s suppliers are located 5 in Europe or China. “Currency therefore has a big impact on our business and the margins we can obtain,” says Ms Burdett, the Finance Director. Forward contracts enable institutions, businesses and individuals to lock in an exchange rate over a certain period of time regardless of how the rate moves during that time. Ms Burdett buys currency as soon as Nielsen Bainbridge confirms a large order as a way to fix costs. One third of UK 10 business managers are considering shifting from EU to UK suppliers. (Source: adapted from ’UK companies use pound strength to hedge forex risk’ by Roger Blitz, Markets, © FT.com, 16 May 2017. https://www.ft.com/content/ d50ce580-3968-11e7-ac89-b01cc67cfeec) Extract B Bank of England seeking to prevent future bank bailouts The Bank of England has ordered big lenders in the UK to find £116 billion of funding to ensure that taxpayers will never again have to bail out the banking sector. The Bank intends to publish details of how each of the big lenders would cope in the event they find themselves in a situation similar to Royal Bank of Scotland and Lloyds Banking 5 Group, which needed £65 billion of taxpayer bailouts during the 2008 Global Financial Crisis. This had a significant negative impact on the UK government’s national debt and, many would argue, increased the need for contractionary fiscal policy. Having said that, the UK government sold all its shares in Lloyds Banking Group in 2017 and, according to the Chancellor of the Exchequer, “recovered every penny of its investment in Lloyds”. 10 Sir Jon Cunliffe, the deputy governor at the Bank responsible for financial stability, said regulators needed to let banks fail in a similar way that traditional companies collapse. This has not been possible in the past because of the risk that savers lose their money and because a system did not exist to allow banks to be put into insolvency. “Just like when other businesses fail, losses arising from bank failure would be imposed 15 on shareholders and investors. This protects the public from loss and incentivises banks to operate more prudently,” said Cunliffe. (Source: adapted from ‘Bank of England tells lenders to find £116bn to help prevent bailouts’, by Jill Treanor, 02 October 2017, Copyright The Guardian News and Media Ltd https://www.theguardian.com/business/2017/oct/02 /bank-of-england-bailouts-rbs-lloyds and ‘Lloyds bank bailout repaid in full, Philip Hammond claims’, by Jill Treanor, Larry Elliott, 21 April 2017, Copyright Guardian News & Media Ltd 2017 https://www.theguardian.com/business/ 2017/apr/21/lloyds-bank-bailout-repaid-in-full-philip-hammond-claims) Extract C Bank of England tells lenders to increase capital reserves The Bank of England has told lenders they will need to build a special reserve worth £11.4 billion by the end of 2018 as it tries to make banks more resilient to the risk posed by mounting consumer debt. This reserve of assets that can be readily turned into cash is a way of forcing banks to set aside capital reserves in good times in order to keep lending 5 to the wider economy at a steady level, even during an economic downturn. In 2017 the Bank of England told UK banks it would raise the reserve ratio, relative to all assets, from zero to 0.5% and also forecast a further increase to 1% by the end of 2017. The move is not intended to directly reduce consumer demand for credit, which in 2017 grew by 10.3% on an annual basis, but it may well lead to banks becoming less willing 10 to lend to consumers. Since the Bank of England has recently become increasingly concerned about consumer borrowing, including rising car loans and credit card debt, this may be no bad thing as far as the Bank of England is concerned, even if it does have a negative impact on the wider economy. Analysts are concerned about the impact on consumer confidence of rising inflation, 15 partly caused by a falling pound. With falling real incomes consumers could become more vulnerable to falling behind with their credit card and personal loan repayments. Despite these concerns the UK economy recently recorded the lowest rate of unemployment since 1975. (Source: adapted from ‘Bank of England tells lenders to increase capital buffers by £11.4bn’ by Caroline Binham, Gemma Tetlow and Martin Arnold © Financial Times 2017 https://www.ft.com/content/9bc99294-5b1b-11e7-9bc8-8055f264aa8b)
(c) With reference to the last paragraph in Extract C, assess the impact of a fall in real incomes on subjective happiness. (10)
June 2019 · Paper 2 · Q6(d) 12 marks AO1=4, AO2=2, AO3=2, AO4=4 12-mark response macroeconomic objectivesfiscal and monetary policy
Data and extracts for question 6The UK economy since the financial crisis Figure 1: Pound sterling to US$ exchange rate, 2016-17 $ per £ 1.50 UK votes to leave the EU 1.40 UK general election announced 1.30 Price of £1 in US dollars 1.20 1.10 1.00 0 (Source: adapted from https://www.ft.com/content/ d50ce580-3968-11e7-ac89-b01cc67cfeec) Extract A UK companies use forward currency market The Norfolk-based picture frames maker Nielsen Bainbridge recently made forward contracts in the foreign exchange market to reduce the impact of currency fluctuations. The pound’s post-Brexit referendum depreciation has been a test of nerve for Nielsen Bainbridge and many other importers. At present the company’s suppliers are located 5 in Europe or China. “Currency therefore has a big impact on our business and the margins we can obtain,” says Ms Burdett, the Finance Director. Forward contracts enable institutions, businesses and individuals to lock in an exchange rate over a certain period of time regardless of how the rate moves during that time. Ms Burdett buys currency as soon as Nielsen Bainbridge confirms a large order as a way to fix costs. One third of UK 10 business managers are considering shifting from EU to UK suppliers. (Source: adapted from ’UK companies use pound strength to hedge forex risk’ by Roger Blitz, Markets, © FT.com, 16 May 2017. https://www.ft.com/content/ d50ce580-3968-11e7-ac89-b01cc67cfeec) Extract B Bank of England seeking to prevent future bank bailouts The Bank of England has ordered big lenders in the UK to find £116 billion of funding to ensure that taxpayers will never again have to bail out the banking sector. The Bank intends to publish details of how each of the big lenders would cope in the event they find themselves in a situation similar to Royal Bank of Scotland and Lloyds Banking 5 Group, which needed £65 billion of taxpayer bailouts during the 2008 Global Financial Crisis. This had a significant negative impact on the UK government’s national debt and, many would argue, increased the need for contractionary fiscal policy. Having said that, the UK government sold all its shares in Lloyds Banking Group in 2017 and, according to the Chancellor of the Exchequer, “recovered every penny of its investment in Lloyds”. 10 Sir Jon Cunliffe, the deputy governor at the Bank responsible for financial stability, said regulators needed to let banks fail in a similar way that traditional companies collapse. This has not been possible in the past because of the risk that savers lose their money and because a system did not exist to allow banks to be put into insolvency. “Just like when other businesses fail, losses arising from bank failure would be imposed 15 on shareholders and investors. This protects the public from loss and incentivises banks to operate more prudently,” said Cunliffe. (Source: adapted from ‘Bank of England tells lenders to find £116bn to help prevent bailouts’, by Jill Treanor, 02 October 2017, Copyright The Guardian News and Media Ltd https://www.theguardian.com/business/2017/oct/02 /bank-of-england-bailouts-rbs-lloyds and ‘Lloyds bank bailout repaid in full, Philip Hammond claims’, by Jill Treanor, Larry Elliott, 21 April 2017, Copyright Guardian News & Media Ltd 2017 https://www.theguardian.com/business/ 2017/apr/21/lloyds-bank-bailout-repaid-in-full-philip-hammond-claims) Extract C Bank of England tells lenders to increase capital reserves The Bank of England has told lenders they will need to build a special reserve worth £11.4 billion by the end of 2018 as it tries to make banks more resilient to the risk posed by mounting consumer debt. This reserve of assets that can be readily turned into cash is a way of forcing banks to set aside capital reserves in good times in order to keep lending 5 to the wider economy at a steady level, even during an economic downturn. In 2017 the Bank of England told UK banks it would raise the reserve ratio, relative to all assets, from zero to 0.5% and also forecast a further increase to 1% by the end of 2017. The move is not intended to directly reduce consumer demand for credit, which in 2017 grew by 10.3% on an annual basis, but it may well lead to banks becoming less willing 10 to lend to consumers. Since the Bank of England has recently become increasingly concerned about consumer borrowing, including rising car loans and credit card debt, this may be no bad thing as far as the Bank of England is concerned, even if it does have a negative impact on the wider economy. Analysts are concerned about the impact on consumer confidence of rising inflation, 15 partly caused by a falling pound. With falling real incomes consumers could become more vulnerable to falling behind with their credit card and personal loan repayments. Despite these concerns the UK economy recently recorded the lowest rate of unemployment since 1975. (Source: adapted from ‘Bank of England tells lenders to increase capital buffers by £11.4bn’ by Caroline Binham, Gemma Tetlow and Martin Arnold © Financial Times 2017 https://www.ft.com/content/9bc99294-5b1b-11e7-9bc8-8055f264aa8b)
(d) With reference to Extract C, discuss the potential conflicts between macroeconomic objectives when the central bank attempts to control inflation. (12)
June 2019 · Paper 2 · Q6(e) 15 marks AO1=3, AO2=3, AO3=3, AO4=6 15-mark response financial sector
Data and extracts for question 6The UK economy since the financial crisis Figure 1: Pound sterling to US$ exchange rate, 2016-17 $ per £ 1.50 UK votes to leave the EU 1.40 UK general election announced 1.30 Price of £1 in US dollars 1.20 1.10 1.00 0 (Source: adapted from https://www.ft.com/content/ d50ce580-3968-11e7-ac89-b01cc67cfeec) Extract A UK companies use forward currency market The Norfolk-based picture frames maker Nielsen Bainbridge recently made forward contracts in the foreign exchange market to reduce the impact of currency fluctuations. The pound’s post-Brexit referendum depreciation has been a test of nerve for Nielsen Bainbridge and many other importers. At present the company’s suppliers are located 5 in Europe or China. “Currency therefore has a big impact on our business and the margins we can obtain,” says Ms Burdett, the Finance Director. Forward contracts enable institutions, businesses and individuals to lock in an exchange rate over a certain period of time regardless of how the rate moves during that time. Ms Burdett buys currency as soon as Nielsen Bainbridge confirms a large order as a way to fix costs. One third of UK 10 business managers are considering shifting from EU to UK suppliers. (Source: adapted from ’UK companies use pound strength to hedge forex risk’ by Roger Blitz, Markets, © FT.com, 16 May 2017. https://www.ft.com/content/ d50ce580-3968-11e7-ac89-b01cc67cfeec) Extract B Bank of England seeking to prevent future bank bailouts The Bank of England has ordered big lenders in the UK to find £116 billion of funding to ensure that taxpayers will never again have to bail out the banking sector. The Bank intends to publish details of how each of the big lenders would cope in the event they find themselves in a situation similar to Royal Bank of Scotland and Lloyds Banking 5 Group, which needed £65 billion of taxpayer bailouts during the 2008 Global Financial Crisis. This had a significant negative impact on the UK government’s national debt and, many would argue, increased the need for contractionary fiscal policy. Having said that, the UK government sold all its shares in Lloyds Banking Group in 2017 and, according to the Chancellor of the Exchequer, “recovered every penny of its investment in Lloyds”. 10 Sir Jon Cunliffe, the deputy governor at the Bank responsible for financial stability, said regulators needed to let banks fail in a similar way that traditional companies collapse. This has not been possible in the past because of the risk that savers lose their money and because a system did not exist to allow banks to be put into insolvency. “Just like when other businesses fail, losses arising from bank failure would be imposed 15 on shareholders and investors. This protects the public from loss and incentivises banks to operate more prudently,” said Cunliffe. (Source: adapted from ‘Bank of England tells lenders to find £116bn to help prevent bailouts’, by Jill Treanor, 02 October 2017, Copyright The Guardian News and Media Ltd https://www.theguardian.com/business/2017/oct/02 /bank-of-england-bailouts-rbs-lloyds and ‘Lloyds bank bailout repaid in full, Philip Hammond claims’, by Jill Treanor, Larry Elliott, 21 April 2017, Copyright Guardian News & Media Ltd 2017 https://www.theguardian.com/business/ 2017/apr/21/lloyds-bank-bailout-repaid-in-full-philip-hammond-claims) Extract C Bank of England tells lenders to increase capital reserves The Bank of England has told lenders they will need to build a special reserve worth £11.4 billion by the end of 2018 as it tries to make banks more resilient to the risk posed by mounting consumer debt. This reserve of assets that can be readily turned into cash is a way of forcing banks to set aside capital reserves in good times in order to keep lending 5 to the wider economy at a steady level, even during an economic downturn. In 2017 the Bank of England told UK banks it would raise the reserve ratio, relative to all assets, from zero to 0.5% and also forecast a further increase to 1% by the end of 2017. The move is not intended to directly reduce consumer demand for credit, which in 2017 grew by 10.3% on an annual basis, but it may well lead to banks becoming less willing 10 to lend to consumers. Since the Bank of England has recently become increasingly concerned about consumer borrowing, including rising car loans and credit card debt, this may be no bad thing as far as the Bank of England is concerned, even if it does have a negative impact on the wider economy. Analysts are concerned about the impact on consumer confidence of rising inflation, 15 partly caused by a falling pound. With falling real incomes consumers could become more vulnerable to falling behind with their credit card and personal loan repayments. Despite these concerns the UK economy recently recorded the lowest rate of unemployment since 1975. (Source: adapted from ‘Bank of England tells lenders to increase capital buffers by £11.4bn’ by Caroline Binham, Gemma Tetlow and Martin Arnold © Financial Times 2017 https://www.ft.com/content/9bc99294-5b1b-11e7-9bc8-8055f264aa8b)
(e) Discuss whether providing substantial government financial support to banks is the best policy response during a financial crisis. (15)
June 2019 · Paper 3 · Q1(a) 5 marks AO1=2, AO2=2, AO3=1 Calculation oligopoly
Data and extracts for question 1Markets for food and drinks high in fat, salt or sugar (HFSS) Figure 1: UK market share of potato crisps, 2017 Market share Market share Price Firm Brand Size of firm of product (£) Walkers All Walkers 55.3% of which: 35 g 28.1% 0.45 Regular Standard Regular Max 50 g 7.4% 0.63 Sensations 40 g 2.0% 0.59 Doritos 40 g 4.7% 0.45 Other 13.1% KP KP 50 g 22.7% 0.52 Tayto Golden Wonder 4.2% <40g 3.1% 0.38 40g+ 1.1% 0.72 Other Other 17.8% (Source: adapted from https://academic.oup.com/restud/article/3108825/ The-Effects-of-Banning-Advertising-in-Junk-Food 6 April 2017) Extract A The effects of a total ban on advertising of HFSS foods Food and drinks which are high in fat, salt or sugar (HFSS) tend to be sold in highly concentrated markets. Tough new rules banning advertisements for HFSS products, such as those for confectionery, fizzy drinks and potato crisps, come into effect in July 2017 as a means to reduce consumption. The rules apply to media targeted at under-16s and will 5 mean a major reduction in the number of advertisements children see for HFSS products in posters near schools, in films targeted at children, on catch-up television and in social media if it is directed at children. There are three main factors that will determine the effectiveness of the intervention: first, whether advertising acts to expand the market share or steal rivals’ market share. 10 Secondly, how firms in the market adapt their behaviour in response to the ban. Thirdly, what substitute products do consumers turn to if they opted out of the targeted market. Results from a recent survey in the UK suggest that the total quantity of crisps sold would fall by around 15% in the presence of an advertising ban, or by 10% if firms respond with price cuts, since the ban acts to make the market more competitive and firms respond to 15 the ban by, on average, lowering their prices. The survey showed that following a ban, consumers are more likely to switch to another junk food than to a healthy food, which (in addition to the pricing response of firms) acts to partially offset any health gains from the policy. (Source: adapted from The Effects of Banning Advertising in Junk Food Markets, Dubois, Pierre; Griffith, Rachel, Review of Economic Studies Copyright © 2017, Oxford University Press https://academic.oup.com/ restud/article/3108825/The-Effects-of-Banning-Advertising-in-Junk-Food 6 April 2017 and https://www.asa.org.uk/news/tougher-new-food-and- drink-rules-come-into-effect-in-children-s-media.html 30 June 2017) Extract B Taxing HFSS foods and subsidising healthy eating widens inequality Since low-income groups spend a higher proportion of their income on food and tend to eat less healthily, they are the main targets of taxes on products that are high in fat, salt or sugar (HFSS). Subsidies on healthy food are seen as an alternative policy approach to encourage healthy eating. While data on the impact of such policies are scarce, a recent 5 study on the distributional impacts of HFSS taxes and healthy food subsidies found that these actually widened health and fiscal inequalities. The policies tend to be regressive and favour higher-income consumers. Taxes on unhealthy food increase prices which have a greater impact on low income groups rather than higher income groups. Lower income groups prefer to buy HFSS food. 10 Subsidies encouraged all income groups to buy more fruit and vegetables. However, those on higher incomes proved more responsive and the average share of budget spent on healthy food actually increased for the higher income groups who were more likely to buy the subsidised healthy food and then spend the savings they had enjoyed on yet more healthy food. The diets of the higher income groups before the subsidy tended 15 to be healthier. The choices of the higher income groups are more responsive to price changes. By contrast, lower income groups, if they responded to lower prices, often used the money saved to buy unhealthy items or something else entirely. The long-term benefits of a healthier diet are harder to grasp for consumers when information gaps exist. Often the immediate boost of a tasty treat is more appealing. Taxes and subsidies 20 do not change that. Other strategies are needed to promote healthy eating, especially education. (Source: adapted from Economist 5 October 2017 https://www.economist. com/news/finance-and-economics/21730033-study-suggests- lower-income-families-end-up-paying-more-their-food-taxing-fat and https://papers.ssrn.com/sol3/papers.cfm?abstract_id=3031005 The Economic Journal September 2017 Vol 127 Issue 604) Extract C Tax on fatty foods in Denmark is an economic disaster Denmark introduced a specific tax on saturated fat in October 2011. Recognised as a world-leading public health policy, it was abandoned just 15 months later having been both an economic and political disaster. Indirect taxes of this sort are invariably regressive, disproportionately affecting the 5 elderly and the poor. The specific tax led to prices rising on average 15% for highest-fat products, yielding a total decrease of 5% in the intake of saturated fat from products such as minced beef and cream. 80% of Danish consumers did not change their shopping habits at all. The behavioural change was economically damaging as consumers switched to cheaper brands and crossed the border to Sweden and Germany to do their shopping. 10 Danish tax revenue fell as a result. (Source: adapted from https://iea.org.uk/in-the-media/press-release/ evidence-shows-a-fat-tax-would-hit-poorest-the-hardest 25 May 2013 and https://www.cambridge.org/core/journals/public-health-nutrition/article/ effects-of-the-danish-saturated-fat-tax-on-the-demand-for-meat-and-dairy- products/984CF03634C819D50E66C7B5DC5209DA/core-reader)
(a) With reference to Figure 1 and Extract A, explain what is meant by a ‘highly concentrated’ market for potato crisps (Extract A, lines 2–3). (5)
June 2019 · Paper 3 · Q1(c) 12 marks AO1=2, AO2=2, AO3=4, AO4=4 12-mark response oligopoly
Data and extracts for question 1Markets for food and drinks high in fat, salt or sugar (HFSS) Figure 1: UK market share of potato crisps, 2017 Market share Market share Price Firm Brand Size of firm of product (£) Walkers All Walkers 55.3% of which: 35 g 28.1% 0.45 Regular Standard Regular Max 50 g 7.4% 0.63 Sensations 40 g 2.0% 0.59 Doritos 40 g 4.7% 0.45 Other 13.1% KP KP 50 g 22.7% 0.52 Tayto Golden Wonder 4.2% <40g 3.1% 0.38 40g+ 1.1% 0.72 Other Other 17.8% (Source: adapted from https://academic.oup.com/restud/article/3108825/ The-Effects-of-Banning-Advertising-in-Junk-Food 6 April 2017) Extract A The effects of a total ban on advertising of HFSS foods Food and drinks which are high in fat, salt or sugar (HFSS) tend to be sold in highly concentrated markets. Tough new rules banning advertisements for HFSS products, such as those for confectionery, fizzy drinks and potato crisps, come into effect in July 2017 as a means to reduce consumption. The rules apply to media targeted at under-16s and will 5 mean a major reduction in the number of advertisements children see for HFSS products in posters near schools, in films targeted at children, on catch-up television and in social media if it is directed at children. There are three main factors that will determine the effectiveness of the intervention: first, whether advertising acts to expand the market share or steal rivals’ market share. 10 Secondly, how firms in the market adapt their behaviour in response to the ban. Thirdly, what substitute products do consumers turn to if they opted out of the targeted market. Results from a recent survey in the UK suggest that the total quantity of crisps sold would fall by around 15% in the presence of an advertising ban, or by 10% if firms respond with price cuts, since the ban acts to make the market more competitive and firms respond to 15 the ban by, on average, lowering their prices. The survey showed that following a ban, consumers are more likely to switch to another junk food than to a healthy food, which (in addition to the pricing response of firms) acts to partially offset any health gains from the policy. (Source: adapted from The Effects of Banning Advertising in Junk Food Markets, Dubois, Pierre; Griffith, Rachel, Review of Economic Studies Copyright © 2017, Oxford University Press https://academic.oup.com/ restud/article/3108825/The-Effects-of-Banning-Advertising-in-Junk-Food 6 April 2017 and https://www.asa.org.uk/news/tougher-new-food-and- drink-rules-come-into-effect-in-children-s-media.html 30 June 2017) Extract B Taxing HFSS foods and subsidising healthy eating widens inequality Since low-income groups spend a higher proportion of their income on food and tend to eat less healthily, they are the main targets of taxes on products that are high in fat, salt or sugar (HFSS). Subsidies on healthy food are seen as an alternative policy approach to encourage healthy eating. While data on the impact of such policies are scarce, a recent 5 study on the distributional impacts of HFSS taxes and healthy food subsidies found that these actually widened health and fiscal inequalities. The policies tend to be regressive and favour higher-income consumers. Taxes on unhealthy food increase prices which have a greater impact on low income groups rather than higher income groups. Lower income groups prefer to buy HFSS food. 10 Subsidies encouraged all income groups to buy more fruit and vegetables. However, those on higher incomes proved more responsive and the average share of budget spent on healthy food actually increased for the higher income groups who were more likely to buy the subsidised healthy food and then spend the savings they had enjoyed on yet more healthy food. The diets of the higher income groups before the subsidy tended 15 to be healthier. The choices of the higher income groups are more responsive to price changes. By contrast, lower income groups, if they responded to lower prices, often used the money saved to buy unhealthy items or something else entirely. The long-term benefits of a healthier diet are harder to grasp for consumers when information gaps exist. Often the immediate boost of a tasty treat is more appealing. Taxes and subsidies 20 do not change that. Other strategies are needed to promote healthy eating, especially education. (Source: adapted from Economist 5 October 2017 https://www.economist. com/news/finance-and-economics/21730033-study-suggests- lower-income-families-end-up-paying-more-their-food-taxing-fat and https://papers.ssrn.com/sol3/papers.cfm?abstract_id=3031005 The Economic Journal September 2017 Vol 127 Issue 604) Extract C Tax on fatty foods in Denmark is an economic disaster Denmark introduced a specific tax on saturated fat in October 2011. Recognised as a world-leading public health policy, it was abandoned just 15 months later having been both an economic and political disaster. Indirect taxes of this sort are invariably regressive, disproportionately affecting the 5 elderly and the poor. The specific tax led to prices rising on average 15% for highest-fat products, yielding a total decrease of 5% in the intake of saturated fat from products such as minced beef and cream. 80% of Danish consumers did not change their shopping habits at all. The behavioural change was economically damaging as consumers switched to cheaper brands and crossed the border to Sweden and Germany to do their shopping. 10 Danish tax revenue fell as a result. (Source: adapted from https://iea.org.uk/in-the-media/press-release/ evidence-shows-a-fat-tax-would-hit-poorest-the-hardest 25 May 2013 and https://www.cambridge.org/core/journals/public-health-nutrition/article/ effects-of-the-danish-saturated-fat-tax-on-the-demand-for-meat-and-dairy- products/984CF03634C819D50E66C7B5DC5209DA/core-reader)
(c) In Extract A, lines 15–16, it was suggested that some firms may respond to the advertising ban by cutting the prices of their products. Using game theory and the information provided in Figure 1 and Extract A, discuss the effects on firms of cutting prices in an oligopolistic market. (12)
June 2019 · Paper 3 · Q1(e) 25 marks AO1=4, AO2=4, AO3=8, AO4=9 25-mark essay Either/or indirect taxes and subsidiesgovernment intervention in marketspublic finances and taxation
Data and extracts for question 1Markets for food and drinks high in fat, salt or sugar (HFSS) Figure 1: UK market share of potato crisps, 2017 Market share Market share Price Firm Brand Size of firm of product (£) Walkers All Walkers 55.3% of which: 35 g 28.1% 0.45 Regular Standard Regular Max 50 g 7.4% 0.63 Sensations 40 g 2.0% 0.59 Doritos 40 g 4.7% 0.45 Other 13.1% KP KP 50 g 22.7% 0.52 Tayto Golden Wonder 4.2% <40g 3.1% 0.38 40g+ 1.1% 0.72 Other Other 17.8% (Source: adapted from https://academic.oup.com/restud/article/3108825/ The-Effects-of-Banning-Advertising-in-Junk-Food 6 April 2017) Extract A The effects of a total ban on advertising of HFSS foods Food and drinks which are high in fat, salt or sugar (HFSS) tend to be sold in highly concentrated markets. Tough new rules banning advertisements for HFSS products, such as those for confectionery, fizzy drinks and potato crisps, come into effect in July 2017 as a means to reduce consumption. The rules apply to media targeted at under-16s and will 5 mean a major reduction in the number of advertisements children see for HFSS products in posters near schools, in films targeted at children, on catch-up television and in social media if it is directed at children. There are three main factors that will determine the effectiveness of the intervention: first, whether advertising acts to expand the market share or steal rivals’ market share. 10 Secondly, how firms in the market adapt their behaviour in response to the ban. Thirdly, what substitute products do consumers turn to if they opted out of the targeted market. Results from a recent survey in the UK suggest that the total quantity of crisps sold would fall by around 15% in the presence of an advertising ban, or by 10% if firms respond with price cuts, since the ban acts to make the market more competitive and firms respond to 15 the ban by, on average, lowering their prices. The survey showed that following a ban, consumers are more likely to switch to another junk food than to a healthy food, which (in addition to the pricing response of firms) acts to partially offset any health gains from the policy. (Source: adapted from The Effects of Banning Advertising in Junk Food Markets, Dubois, Pierre; Griffith, Rachel, Review of Economic Studies Copyright © 2017, Oxford University Press https://academic.oup.com/ restud/article/3108825/The-Effects-of-Banning-Advertising-in-Junk-Food 6 April 2017 and https://www.asa.org.uk/news/tougher-new-food-and- drink-rules-come-into-effect-in-children-s-media.html 30 June 2017) Extract B Taxing HFSS foods and subsidising healthy eating widens inequality Since low-income groups spend a higher proportion of their income on food and tend to eat less healthily, they are the main targets of taxes on products that are high in fat, salt or sugar (HFSS). Subsidies on healthy food are seen as an alternative policy approach to encourage healthy eating. While data on the impact of such policies are scarce, a recent 5 study on the distributional impacts of HFSS taxes and healthy food subsidies found that these actually widened health and fiscal inequalities. The policies tend to be regressive and favour higher-income consumers. Taxes on unhealthy food increase prices which have a greater impact on low income groups rather than higher income groups. Lower income groups prefer to buy HFSS food. 10 Subsidies encouraged all income groups to buy more fruit and vegetables. However, those on higher incomes proved more responsive and the average share of budget spent on healthy food actually increased for the higher income groups who were more likely to buy the subsidised healthy food and then spend the savings they had enjoyed on yet more healthy food. The diets of the higher income groups before the subsidy tended 15 to be healthier. The choices of the higher income groups are more responsive to price changes. By contrast, lower income groups, if they responded to lower prices, often used the money saved to buy unhealthy items or something else entirely. The long-term benefits of a healthier diet are harder to grasp for consumers when information gaps exist. Often the immediate boost of a tasty treat is more appealing. Taxes and subsidies 20 do not change that. Other strategies are needed to promote healthy eating, especially education. (Source: adapted from Economist 5 October 2017 https://www.economist. com/news/finance-and-economics/21730033-study-suggests- lower-income-families-end-up-paying-more-their-food-taxing-fat and https://papers.ssrn.com/sol3/papers.cfm?abstract_id=3031005 The Economic Journal September 2017 Vol 127 Issue 604) Extract C Tax on fatty foods in Denmark is an economic disaster Denmark introduced a specific tax on saturated fat in October 2011. Recognised as a world-leading public health policy, it was abandoned just 15 months later having been both an economic and political disaster. Indirect taxes of this sort are invariably regressive, disproportionately affecting the 5 elderly and the poor. The specific tax led to prices rising on average 15% for highest-fat products, yielding a total decrease of 5% in the intake of saturated fat from products such as minced beef and cream. 80% of Danish consumers did not change their shopping habits at all. The behavioural change was economically damaging as consumers switched to cheaper brands and crossed the border to Sweden and Germany to do their shopping. 10 Danish tax revenue fell as a result. (Source: adapted from https://iea.org.uk/in-the-media/press-release/ evidence-shows-a-fat-tax-would-hit-poorest-the-hardest 25 May 2013 and https://www.cambridge.org/core/journals/public-health-nutrition/article/ effects-of-the-danish-saturated-fat-tax-on-the-demand-for-meat-and-dairy- products/984CF03634C819D50E66C7B5DC5209DA/core-reader)
(e) Evaluate the likely microeconomic and macroeconomic effects of imposing a tax on HFSS foods. (25)
June 2019 · Paper 3 · Q2(a) 5 marks AO1=2, AO2=2, AO3=1 Short answer nature of economics
Data and extracts for question 2Mozambique Figure 2: Interest rates (bank rate of the central bank) and inflation rates of selected African countries, 2017 Selected country Central bank Inflation rate rate of interest (CPI measure) Congo (D.R.) 14% 13.8% Ghana 21% 9.1% Kenya 10% 10.1% Malawi 18% 21.4% Mozambique 21.75% 18.0% Nigeria 14% 21.1% (Source: official government websites, and other news sources, July 2017) Extract D Rising debt levels in Africa Increases in national debt have brought several African governments towards a debt-servicing crisis when the repayment of debt and interest become unsustainable. Between 2010 and 2015, many sub-Saharan countries raised debt totalling more than £20 billion. Back then, with commodity prices soaring and foreign loans available at very 5 low interest rates, everyone agreed that borrowing was the way to grow an economy with expansionary fiscal policy. Since 2015, some African governments – beneficiaries of big debt write-offs at the start of the century – have taken to private debt markets too eagerly, leaving them with heavy repayment schedules at a time of lower commodity prices. 10 Until recently, the International Monetary Fund (IMF) has played down African debt concerns, pointing to better management of public resources and greater transparency. But it was shaken by Mozambique’s default on more than £2 billion of secret loans used to purchase a non-existent tuna-fishing fleet, raising fears of hidden debt in other African countries with similar levels of corruption. The median level of debt in sub-Saharan Africa 15 had risen sharply from 34% of gross domestic product in 2013 to 48% in 2017. Although that is low by international standards, analysts said debt burdens were heavier than they appeared because of most African countries’ low tax base. “The real thing to look for is debt to revenue, or debt-service as a percentage of government spending,” said John Ashbourne, Africa Economist at Capital Economics. In several countries, he said, debt 20 payments were above 20% of government revenue, with an opportunity cost in terms of government spending. (Source: adapted from African debt worries intensify as levels near tipping point by David Pilling © Financial Times 2017 https://www.ft.com/ content/939808dc-b4d8-11e7-a398-73d59db9e399) Extract E Mozambique’s economic stability is being put to the test The economy of Mozambique, which gained independence from Portugal in 1975, has continued to under-perform. Large-scale emigration, especially of skilled workers, economic dependence on South Africa, a severe drought, a prolonged civil war and political tensions have hindered the country’s development. More than half of 5 Mozambique’s 26 million people continue to live below the poverty line. GDP growth declined to 3.6% in 2016 due to fiscal tightening and a slowdown in foreign direct investment. A weak manufacturing sector employs just 3.2% of the population, and is made up of small enterprises (90%), many of which were set up with the aid of microfinance. Traditional export earnings dropped due to depressed global demand. 10 In addition a wide-scale drought seriously affected agricultural production. Foreign currency inflows have weakened – as large-scale gas projects were put on hold, and 14 external lenders suspended direct budget support, as a lesson to be learned from the tuna-fleet scandal. The state budget deficit was 10.7% of GDP in 2017. High interest rates have reduced aggregate demand, and import costs added to inflation following further 15 depreciation of Mozambique’s currency, the metical, to a new low of 100 meticals to £1. Mozambique needs urgently to improve its investment environment and confidence in its institutions. The World Economic Forum’s global competitiveness ranking placed Mozambique 136 out of 137 countries. Longer term, Mozambique’s economic prospects are promising. There has been 20 progress in talks on restoring international confidence in the government’s running of the economy, leading to a lasting and sustainable agreement between rival political groups. The development of gas fields off Mozambique’s coast discovered in 2011 is set to transform the economy, coming into production in the 2020s. A rise in coal and electricity exports should help growth to increase. But in the short term, it remains 25 uncertain whether Mozambique can deliver badly needed economic stability. (Source: adapted from http://www.africaneconomicoutlook.org/en/country-notes/ mozambiqua and https://www.chathamhouse.org/expert/comment/ mozambique-s-stability-being-put-test 6 October 2017 Dr Alex Vines OBE) Extract F Microfinance in Mozambique Microfinance in Mozambique started in the late 1980s through projects initiated by international relief organisations. The sector has expanded to include many private banks and non-government organisations (NGOs), see Figure 3. This has resulted in wider use (over 100 000 borrowers) and many new business start-ups which could not have gained 5 finance from any other source. Evidence suggests that there is unfulfilled demand for microfinance and a large potential for expansion. (Source: adapted from http://www.mftransparency.org/microfinance-pricing/mozambique/) Figure 3: The cost of microfinance loans in Mozambique, 2015 Each symbol represents loans 200% to a number of borrowers (up to 2 000) by one institution. Institution Type Private banks 150% NGO 100% Mean annual percentage rate of interest 50% 0% 40 000 0 20 000 60 000 Loan size (meticals) (Source: http://www.mftransparency.org/microfinance-pricing/mozambique/)
(a) With reference to Extract D line 21, explain why ‘opportunity cost’ is a problem for governments of developing countries when servicing debt. (5)
June 2019 · Paper 3 · Q2(b) 8 marks AO1=2, AO2=2, AO3=2, AO4=2 8-mark response business growth and objectives
Data and extracts for question 2Mozambique Figure 2: Interest rates (bank rate of the central bank) and inflation rates of selected African countries, 2017 Selected country Central bank Inflation rate rate of interest (CPI measure) Congo (D.R.) 14% 13.8% Ghana 21% 9.1% Kenya 10% 10.1% Malawi 18% 21.4% Mozambique 21.75% 18.0% Nigeria 14% 21.1% (Source: official government websites, and other news sources, July 2017) Extract D Rising debt levels in Africa Increases in national debt have brought several African governments towards a debt-servicing crisis when the repayment of debt and interest become unsustainable. Between 2010 and 2015, many sub-Saharan countries raised debt totalling more than £20 billion. Back then, with commodity prices soaring and foreign loans available at very 5 low interest rates, everyone agreed that borrowing was the way to grow an economy with expansionary fiscal policy. Since 2015, some African governments – beneficiaries of big debt write-offs at the start of the century – have taken to private debt markets too eagerly, leaving them with heavy repayment schedules at a time of lower commodity prices. 10 Until recently, the International Monetary Fund (IMF) has played down African debt concerns, pointing to better management of public resources and greater transparency. But it was shaken by Mozambique’s default on more than £2 billion of secret loans used to purchase a non-existent tuna-fishing fleet, raising fears of hidden debt in other African countries with similar levels of corruption. The median level of debt in sub-Saharan Africa 15 had risen sharply from 34% of gross domestic product in 2013 to 48% in 2017. Although that is low by international standards, analysts said debt burdens were heavier than they appeared because of most African countries’ low tax base. “The real thing to look for is debt to revenue, or debt-service as a percentage of government spending,” said John Ashbourne, Africa Economist at Capital Economics. In several countries, he said, debt 20 payments were above 20% of government revenue, with an opportunity cost in terms of government spending. (Source: adapted from African debt worries intensify as levels near tipping point by David Pilling © Financial Times 2017 https://www.ft.com/ content/939808dc-b4d8-11e7-a398-73d59db9e399) Extract E Mozambique’s economic stability is being put to the test The economy of Mozambique, which gained independence from Portugal in 1975, has continued to under-perform. Large-scale emigration, especially of skilled workers, economic dependence on South Africa, a severe drought, a prolonged civil war and political tensions have hindered the country’s development. More than half of 5 Mozambique’s 26 million people continue to live below the poverty line. GDP growth declined to 3.6% in 2016 due to fiscal tightening and a slowdown in foreign direct investment. A weak manufacturing sector employs just 3.2% of the population, and is made up of small enterprises (90%), many of which were set up with the aid of microfinance. Traditional export earnings dropped due to depressed global demand. 10 In addition a wide-scale drought seriously affected agricultural production. Foreign currency inflows have weakened – as large-scale gas projects were put on hold, and 14 external lenders suspended direct budget support, as a lesson to be learned from the tuna-fleet scandal. The state budget deficit was 10.7% of GDP in 2017. High interest rates have reduced aggregate demand, and import costs added to inflation following further 15 depreciation of Mozambique’s currency, the metical, to a new low of 100 meticals to £1. Mozambique needs urgently to improve its investment environment and confidence in its institutions. The World Economic Forum’s global competitiveness ranking placed Mozambique 136 out of 137 countries. Longer term, Mozambique’s economic prospects are promising. There has been 20 progress in talks on restoring international confidence in the government’s running of the economy, leading to a lasting and sustainable agreement between rival political groups. The development of gas fields off Mozambique’s coast discovered in 2011 is set to transform the economy, coming into production in the 2020s. A rise in coal and electricity exports should help growth to increase. But in the short term, it remains 25 uncertain whether Mozambique can deliver badly needed economic stability. (Source: adapted from http://www.africaneconomicoutlook.org/en/country-notes/ mozambiqua and https://www.chathamhouse.org/expert/comment/ mozambique-s-stability-being-put-test 6 October 2017 Dr Alex Vines OBE) Extract F Microfinance in Mozambique Microfinance in Mozambique started in the late 1980s through projects initiated by international relief organisations. The sector has expanded to include many private banks and non-government organisations (NGOs), see Figure 3. This has resulted in wider use (over 100 000 borrowers) and many new business start-ups which could not have gained 5 finance from any other source. Evidence suggests that there is unfulfilled demand for microfinance and a large potential for expansion. (Source: adapted from http://www.mftransparency.org/microfinance-pricing/mozambique/) Figure 3: The cost of microfinance loans in Mozambique, 2015 Each symbol represents loans 200% to a number of borrowers (up to 2 000) by one institution. Institution Type Private banks 150% NGO 100% Mean annual percentage rate of interest 50% 0% 40 000 0 20 000 60 000 Loan size (meticals) (Source: http://www.mftransparency.org/microfinance-pricing/mozambique/)
(b) Examine two reasons, apart from access to finance, why 90% of the manufacturing sector in Mozambique ‘is made up of small enterprises’ (Extract E, line 9). (8)
June 2019 · Paper 3 · Q2(c) 12 marks AO1=2, AO2=2, AO3=4, AO4=4 12-mark response emerging and developing economies
Data and extracts for question 2Mozambique Figure 2: Interest rates (bank rate of the central bank) and inflation rates of selected African countries, 2017 Selected country Central bank Inflation rate rate of interest (CPI measure) Congo (D.R.) 14% 13.8% Ghana 21% 9.1% Kenya 10% 10.1% Malawi 18% 21.4% Mozambique 21.75% 18.0% Nigeria 14% 21.1% (Source: official government websites, and other news sources, July 2017) Extract D Rising debt levels in Africa Increases in national debt have brought several African governments towards a debt-servicing crisis when the repayment of debt and interest become unsustainable. Between 2010 and 2015, many sub-Saharan countries raised debt totalling more than £20 billion. Back then, with commodity prices soaring and foreign loans available at very 5 low interest rates, everyone agreed that borrowing was the way to grow an economy with expansionary fiscal policy. Since 2015, some African governments – beneficiaries of big debt write-offs at the start of the century – have taken to private debt markets too eagerly, leaving them with heavy repayment schedules at a time of lower commodity prices. 10 Until recently, the International Monetary Fund (IMF) has played down African debt concerns, pointing to better management of public resources and greater transparency. But it was shaken by Mozambique’s default on more than £2 billion of secret loans used to purchase a non-existent tuna-fishing fleet, raising fears of hidden debt in other African countries with similar levels of corruption. The median level of debt in sub-Saharan Africa 15 had risen sharply from 34% of gross domestic product in 2013 to 48% in 2017. Although that is low by international standards, analysts said debt burdens were heavier than they appeared because of most African countries’ low tax base. “The real thing to look for is debt to revenue, or debt-service as a percentage of government spending,” said John Ashbourne, Africa Economist at Capital Economics. In several countries, he said, debt 20 payments were above 20% of government revenue, with an opportunity cost in terms of government spending. (Source: adapted from African debt worries intensify as levels near tipping point by David Pilling © Financial Times 2017 https://www.ft.com/ content/939808dc-b4d8-11e7-a398-73d59db9e399) Extract E Mozambique’s economic stability is being put to the test The economy of Mozambique, which gained independence from Portugal in 1975, has continued to under-perform. Large-scale emigration, especially of skilled workers, economic dependence on South Africa, a severe drought, a prolonged civil war and political tensions have hindered the country’s development. More than half of 5 Mozambique’s 26 million people continue to live below the poverty line. GDP growth declined to 3.6% in 2016 due to fiscal tightening and a slowdown in foreign direct investment. A weak manufacturing sector employs just 3.2% of the population, and is made up of small enterprises (90%), many of which were set up with the aid of microfinance. Traditional export earnings dropped due to depressed global demand. 10 In addition a wide-scale drought seriously affected agricultural production. Foreign currency inflows have weakened – as large-scale gas projects were put on hold, and 14 external lenders suspended direct budget support, as a lesson to be learned from the tuna-fleet scandal. The state budget deficit was 10.7% of GDP in 2017. High interest rates have reduced aggregate demand, and import costs added to inflation following further 15 depreciation of Mozambique’s currency, the metical, to a new low of 100 meticals to £1. Mozambique needs urgently to improve its investment environment and confidence in its institutions. The World Economic Forum’s global competitiveness ranking placed Mozambique 136 out of 137 countries. Longer term, Mozambique’s economic prospects are promising. There has been 20 progress in talks on restoring international confidence in the government’s running of the economy, leading to a lasting and sustainable agreement between rival political groups. The development of gas fields off Mozambique’s coast discovered in 2011 is set to transform the economy, coming into production in the 2020s. A rise in coal and electricity exports should help growth to increase. But in the short term, it remains 25 uncertain whether Mozambique can deliver badly needed economic stability. (Source: adapted from http://www.africaneconomicoutlook.org/en/country-notes/ mozambiqua and https://www.chathamhouse.org/expert/comment/ mozambique-s-stability-being-put-test 6 October 2017 Dr Alex Vines OBE) Extract F Microfinance in Mozambique Microfinance in Mozambique started in the late 1980s through projects initiated by international relief organisations. The sector has expanded to include many private banks and non-government organisations (NGOs), see Figure 3. This has resulted in wider use (over 100 000 borrowers) and many new business start-ups which could not have gained 5 finance from any other source. Evidence suggests that there is unfulfilled demand for microfinance and a large potential for expansion. (Source: adapted from http://www.mftransparency.org/microfinance-pricing/mozambique/) Figure 3: The cost of microfinance loans in Mozambique, 2015 Each symbol represents loans 200% to a number of borrowers (up to 2 000) by one institution. Institution Type Private banks 150% NGO 100% Mean annual percentage rate of interest 50% 0% 40 000 0 20 000 60 000 Loan size (meticals) (Source: http://www.mftransparency.org/microfinance-pricing/mozambique/)
(c) Discuss whether borrowers benefit from microfinance. Make reference to Mozambique in your answer. (12)
June 2019 · Paper 3 · Q2(d) 25 marks AO1=4, AO2=4, AO3=8, AO4=9 25-mark essay Either/or emerging and developing economies
Data and extracts for question 2Mozambique Figure 2: Interest rates (bank rate of the central bank) and inflation rates of selected African countries, 2017 Selected country Central bank Inflation rate rate of interest (CPI measure) Congo (D.R.) 14% 13.8% Ghana 21% 9.1% Kenya 10% 10.1% Malawi 18% 21.4% Mozambique 21.75% 18.0% Nigeria 14% 21.1% (Source: official government websites, and other news sources, July 2017) Extract D Rising debt levels in Africa Increases in national debt have brought several African governments towards a debt-servicing crisis when the repayment of debt and interest become unsustainable. Between 2010 and 2015, many sub-Saharan countries raised debt totalling more than £20 billion. Back then, with commodity prices soaring and foreign loans available at very 5 low interest rates, everyone agreed that borrowing was the way to grow an economy with expansionary fiscal policy. Since 2015, some African governments – beneficiaries of big debt write-offs at the start of the century – have taken to private debt markets too eagerly, leaving them with heavy repayment schedules at a time of lower commodity prices. 10 Until recently, the International Monetary Fund (IMF) has played down African debt concerns, pointing to better management of public resources and greater transparency. But it was shaken by Mozambique’s default on more than £2 billion of secret loans used to purchase a non-existent tuna-fishing fleet, raising fears of hidden debt in other African countries with similar levels of corruption. The median level of debt in sub-Saharan Africa 15 had risen sharply from 34% of gross domestic product in 2013 to 48% in 2017. Although that is low by international standards, analysts said debt burdens were heavier than they appeared because of most African countries’ low tax base. “The real thing to look for is debt to revenue, or debt-service as a percentage of government spending,” said John Ashbourne, Africa Economist at Capital Economics. In several countries, he said, debt 20 payments were above 20% of government revenue, with an opportunity cost in terms of government spending. (Source: adapted from African debt worries intensify as levels near tipping point by David Pilling © Financial Times 2017 https://www.ft.com/ content/939808dc-b4d8-11e7-a398-73d59db9e399) Extract E Mozambique’s economic stability is being put to the test The economy of Mozambique, which gained independence from Portugal in 1975, has continued to under-perform. Large-scale emigration, especially of skilled workers, economic dependence on South Africa, a severe drought, a prolonged civil war and political tensions have hindered the country’s development. More than half of 5 Mozambique’s 26 million people continue to live below the poverty line. GDP growth declined to 3.6% in 2016 due to fiscal tightening and a slowdown in foreign direct investment. A weak manufacturing sector employs just 3.2% of the population, and is made up of small enterprises (90%), many of which were set up with the aid of microfinance. Traditional export earnings dropped due to depressed global demand. 10 In addition a wide-scale drought seriously affected agricultural production. Foreign currency inflows have weakened – as large-scale gas projects were put on hold, and 14 external lenders suspended direct budget support, as a lesson to be learned from the tuna-fleet scandal. The state budget deficit was 10.7% of GDP in 2017. High interest rates have reduced aggregate demand, and import costs added to inflation following further 15 depreciation of Mozambique’s currency, the metical, to a new low of 100 meticals to £1. Mozambique needs urgently to improve its investment environment and confidence in its institutions. The World Economic Forum’s global competitiveness ranking placed Mozambique 136 out of 137 countries. Longer term, Mozambique’s economic prospects are promising. There has been 20 progress in talks on restoring international confidence in the government’s running of the economy, leading to a lasting and sustainable agreement between rival political groups. The development of gas fields off Mozambique’s coast discovered in 2011 is set to transform the economy, coming into production in the 2020s. A rise in coal and electricity exports should help growth to increase. But in the short term, it remains 25 uncertain whether Mozambique can deliver badly needed economic stability. (Source: adapted from http://www.africaneconomicoutlook.org/en/country-notes/ mozambiqua and https://www.chathamhouse.org/expert/comment/ mozambique-s-stability-being-put-test 6 October 2017 Dr Alex Vines OBE) Extract F Microfinance in Mozambique Microfinance in Mozambique started in the late 1980s through projects initiated by international relief organisations. The sector has expanded to include many private banks and non-government organisations (NGOs), see Figure 3. This has resulted in wider use (over 100 000 borrowers) and many new business start-ups which could not have gained 5 finance from any other source. Evidence suggests that there is unfulfilled demand for microfinance and a large potential for expansion. (Source: adapted from http://www.mftransparency.org/microfinance-pricing/mozambique/) Figure 3: The cost of microfinance loans in Mozambique, 2015 Each symbol represents loans 200% to a number of borrowers (up to 2 000) by one institution. Institution Type Private banks 150% NGO 100% Mean annual percentage rate of interest 50% 0% 40 000 0 20 000 60 000 Loan size (meticals) (Source: http://www.mftransparency.org/microfinance-pricing/mozambique/)
(d) Evaluate the microeconomic and macroeconomic factors, apart from access to credit and banking, influencing growth and development in Mozambique. (25)
June 2019 · Paper 3 · Q2(e) 25 marks AO1=4, AO2=4, AO3=8, AO4=9 25-mark essay Either/or Hard inflation
Data and extracts for question 2Mozambique Figure 2: Interest rates (bank rate of the central bank) and inflation rates of selected African countries, 2017 Selected country Central bank Inflation rate rate of interest (CPI measure) Congo (D.R.) 14% 13.8% Ghana 21% 9.1% Kenya 10% 10.1% Malawi 18% 21.4% Mozambique 21.75% 18.0% Nigeria 14% 21.1% (Source: official government websites, and other news sources, July 2017) Extract D Rising debt levels in Africa Increases in national debt have brought several African governments towards a debt-servicing crisis when the repayment of debt and interest become unsustainable. Between 2010 and 2015, many sub-Saharan countries raised debt totalling more than £20 billion. Back then, with commodity prices soaring and foreign loans available at very 5 low interest rates, everyone agreed that borrowing was the way to grow an economy with expansionary fiscal policy. Since 2015, some African governments – beneficiaries of big debt write-offs at the start of the century – have taken to private debt markets too eagerly, leaving them with heavy repayment schedules at a time of lower commodity prices. 10 Until recently, the International Monetary Fund (IMF) has played down African debt concerns, pointing to better management of public resources and greater transparency. But it was shaken by Mozambique’s default on more than £2 billion of secret loans used to purchase a non-existent tuna-fishing fleet, raising fears of hidden debt in other African countries with similar levels of corruption. The median level of debt in sub-Saharan Africa 15 had risen sharply from 34% of gross domestic product in 2013 to 48% in 2017. Although that is low by international standards, analysts said debt burdens were heavier than they appeared because of most African countries’ low tax base. “The real thing to look for is debt to revenue, or debt-service as a percentage of government spending,” said John Ashbourne, Africa Economist at Capital Economics. In several countries, he said, debt 20 payments were above 20% of government revenue, with an opportunity cost in terms of government spending. (Source: adapted from African debt worries intensify as levels near tipping point by David Pilling © Financial Times 2017 https://www.ft.com/ content/939808dc-b4d8-11e7-a398-73d59db9e399) Extract E Mozambique’s economic stability is being put to the test The economy of Mozambique, which gained independence from Portugal in 1975, has continued to under-perform. Large-scale emigration, especially of skilled workers, economic dependence on South Africa, a severe drought, a prolonged civil war and political tensions have hindered the country’s development. More than half of 5 Mozambique’s 26 million people continue to live below the poverty line. GDP growth declined to 3.6% in 2016 due to fiscal tightening and a slowdown in foreign direct investment. A weak manufacturing sector employs just 3.2% of the population, and is made up of small enterprises (90%), many of which were set up with the aid of microfinance. Traditional export earnings dropped due to depressed global demand. 10 In addition a wide-scale drought seriously affected agricultural production. Foreign currency inflows have weakened – as large-scale gas projects were put on hold, and 14 external lenders suspended direct budget support, as a lesson to be learned from the tuna-fleet scandal. The state budget deficit was 10.7% of GDP in 2017. High interest rates have reduced aggregate demand, and import costs added to inflation following further 15 depreciation of Mozambique’s currency, the metical, to a new low of 100 meticals to £1. Mozambique needs urgently to improve its investment environment and confidence in its institutions. The World Economic Forum’s global competitiveness ranking placed Mozambique 136 out of 137 countries. Longer term, Mozambique’s economic prospects are promising. There has been 20 progress in talks on restoring international confidence in the government’s running of the economy, leading to a lasting and sustainable agreement between rival political groups. The development of gas fields off Mozambique’s coast discovered in 2011 is set to transform the economy, coming into production in the 2020s. A rise in coal and electricity exports should help growth to increase. But in the short term, it remains 25 uncertain whether Mozambique can deliver badly needed economic stability. (Source: adapted from http://www.africaneconomicoutlook.org/en/country-notes/ mozambiqua and https://www.chathamhouse.org/expert/comment/ mozambique-s-stability-being-put-test 6 October 2017 Dr Alex Vines OBE) Extract F Microfinance in Mozambique Microfinance in Mozambique started in the late 1980s through projects initiated by international relief organisations. The sector has expanded to include many private banks and non-government organisations (NGOs), see Figure 3. This has resulted in wider use (over 100 000 borrowers) and many new business start-ups which could not have gained 5 finance from any other source. Evidence suggests that there is unfulfilled demand for microfinance and a large potential for expansion. (Source: adapted from http://www.mftransparency.org/microfinance-pricing/mozambique/) Figure 3: The cost of microfinance loans in Mozambique, 2015 Each symbol represents loans 200% to a number of borrowers (up to 2 000) by one institution. Institution Type Private banks 150% NGO 100% Mean annual percentage rate of interest 50% 0% 40 000 0 20 000 60 000 Loan size (meticals) (Source: http://www.mftransparency.org/microfinance-pricing/mozambique/)
(e) Evaluate the likely microeconomic and macroeconomic effects of relatively high inflation rates in many African countries. (25)
June 2018 · AS Paper 1 · Q1(b) 2 marks AO2=2 Calculation nature of economics
Data and extracts for question 11 Statement 1: Cuba has a healthcare system with a patient to doctor ratio of 155:1. Statement 2: Other countries ought to adopt a similar healthcare system to that which exists in Cuba.
(b) Cuba’s population is estimated to be 11 million. With reference to Statement 1 above, calculate the estimated number of doctors in Cuba. You are advised to show your working. (2)
June 2018 · AS Paper 1 · Q2(a) 2 marks AO2=2 Calculation price elasticity of demand
Data and extracts for question 22 In February 2016 the Daily Mail newspaper increased its price from 60p to 65p. By August 2016 its sales had fallen by 5.41%.
(a) Ceteris paribus, calculate the price elasticity of demand for the Daily Mail newspaper over this period. You are advised to show your working. (2)
June 2018 · AS Paper 1 · Q4(b) 3 marks AO1=1, AO2=1, AO3=1 Calculation price elasticity of demand
Data and extracts for question 44 Between 2013 and 2015, median household income in the UK increased from £24 200 to £25 700. Over the same period the demand for bus travel fell by 3%.
(b) Using the data provided, explain whether bus travel is a normal good or an inferior good. (3)
June 2018 · AS Paper 1 · Q5(b) 2 marks AO2=2 Diagram production possibility frontiers
Data and extracts for question 55 The British Broadcasting Corporation (BBC) is a TV broadcaster. It is financed through an annual TV licence fee of £145.50. At this fee level many TV owners benefit from consumer surplus.
(b) The diagram shows the production possibility frontier for the BBC. Assuming the BBC is at point W, annotate the diagram to show the opportunity cost of providing more educational programmes. (2)
June 2018 · AS Paper 1 · Q6(a) 5 marks AO1=1, AO2=2, AO3=2 Diagram supply and demand
Data and extracts for question 6Energy markets Figure 1: Annual surplus or shortage of uranium, measured in millions of kilograms 25 Kg millions 15 5 0 -5 -15 -25 Figures from 2016 are forecast (Source: adapted from http://www.telegraph.co.uk/business/2016/11/20/uranium- the-unloved-metal-whose-price-is-poised-to-go-radioactiv/) Extract A Uranium: the unloved metal Uranium is a fuel source for nuclear energy production. The price of uranium has fallen to a 13-year low. Uranium is a relatively common metal but locating it in the right concentrations can be difficult. Australia has the biggest known resource of uranium, followed by Kazakhstan. Kazakhstan’s production has increased significantly since 2007, 5 accounting for a large proportion of the surplus of this metal. Given the large stockpiles of uranium some firms have ceased production. The biggest impact on the uranium market has been the devastating accident at the nuclear power station in Fukushima, Japan, in 2011. The accident caused a leak of radiation. The accident reduced confidence in the entire nuclear industry, as high doses 10 of radiation leaks increase the risk of cancer. In addition the high cost of safely storing radioactive waste has delayed the building of new nuclear power stations. Japan initially closed all of its 50 nuclear power stations which reduced the demand for uranium. But it has since concluded that nuclear power must be part of its mix of energy suppliers. Despite this setback in 2016 work started on a new uranium mine in Spain to meet 15 the expected rise in demand for the metal. Uranium is a controlled material, so mining companies have to comply with many regulations before opening a new mine. When it opens in 2018, this will be the only uranium mine in Europe, producing 2.2 million kilos a year. It has been in development for more than a decade. Most developed countries, with the notable exception of Germany, have concluded that 20 nuclear power is an essential part of their energy supply. The US and UK are committed to building new nuclear power stations, the latter providing a £30 billion subsidy to build a new nuclear plant at Hinkley Point. China is also building a further 60 nuclear power stations. Supporters of nuclear power say it provides a reliable source of energy at a time when 25 the world’s population is increasing, unlike solar power and wind power which both vary with the weather. In addition they argue that no country can significantly reduce carbon emissions, which are causing climate change, without nuclear. France and the UK have committed themselves to shut down all coal-fired power stations by 2025. So demand for uranium over the next two decades seems guaranteed. 30 (Source: adapted from Uranium: the unloved metal whose price is poised to go radioactive, Jon Yeomans, The Telegraph, 20 November 2016 http://www.telegraph.co.uk/business/2016/11/20/uranium-the- unloved-metal-whose-price-is-poised-to-go-radioactiv/) Extract B Irrational consumers pay the price The UK Government has announced that it might introduce maximum price controls on energy used by households. The UK’s largest energy suppliers are braced for what could be the industry’s most significant government intervention following a decade of rising energy bills and low 5 numbers of consumers switching between energy providers. The Prime Minister promised to intervene because the energy market is “manifestly not working” for consumers. Energy prices have risen by 158% in the last 15 years, and four million households, especially those on low incomes, are still on the most expensive energy rates. 10 Some energy analysts have warned the Government against taking a highly interventionist approach that could undermine the energy market and leave customers paying higher prices in the future. (Source: adapted from http://www.telegraph.co.uk/business/2017/03/22/ governments-pledge-cut-energy-prices-risks-leaving-consumers/) Extract C The economics of climate change Rising carbon dioxide emissions result from the increase in the use of coal, gas and oil in transport and for energy production. In addition, deforestation, food production and processing methods make the problem worse. These carbon emissions are causing a rise in global average temperatures, known as climate change. Climate change could cause 5 hundreds of millions of people to suffer hunger, water shortages and coastal flooding. Three elements of policy are required for an effective global response to reduce carbon emissions. The first is the pricing of carbon, implemented through tax, trading pollution permits or regulation. The second policy is to support innovation and the deployment of low-carbon technologies. And the third is action to remove barriers to energy efficiency, 10 and to inform, educate and persuade individuals about what they can do to respond to climate change. (Source: adapted from www.sternreview.org.uk/)
(a) With reference to Figure 1 and Extract A, explain why the price of uranium has ‘fallen to a 13-year low’ (Extract A, lines 2 and 3) in 2016. Include a supply and demand diagram in your answer. (5)
June 2018 · AS Paper 1 · Q6(b) 10 marks AO1=2, AO2=2, AO3=2, AO4=4 10-mark response Hard elasticity of supply
Data and extracts for question 6Energy markets Figure 1: Annual surplus or shortage of uranium, measured in millions of kilograms 25 Kg millions 15 5 0 -5 -15 -25 Figures from 2016 are forecast (Source: adapted from http://www.telegraph.co.uk/business/2016/11/20/uranium- the-unloved-metal-whose-price-is-poised-to-go-radioactiv/) Extract A Uranium: the unloved metal Uranium is a fuel source for nuclear energy production. The price of uranium has fallen to a 13-year low. Uranium is a relatively common metal but locating it in the right concentrations can be difficult. Australia has the biggest known resource of uranium, followed by Kazakhstan. Kazakhstan’s production has increased significantly since 2007, 5 accounting for a large proportion of the surplus of this metal. Given the large stockpiles of uranium some firms have ceased production. The biggest impact on the uranium market has been the devastating accident at the nuclear power station in Fukushima, Japan, in 2011. The accident caused a leak of radiation. The accident reduced confidence in the entire nuclear industry, as high doses 10 of radiation leaks increase the risk of cancer. In addition the high cost of safely storing radioactive waste has delayed the building of new nuclear power stations. Japan initially closed all of its 50 nuclear power stations which reduced the demand for uranium. But it has since concluded that nuclear power must be part of its mix of energy suppliers. Despite this setback in 2016 work started on a new uranium mine in Spain to meet 15 the expected rise in demand for the metal. Uranium is a controlled material, so mining companies have to comply with many regulations before opening a new mine. When it opens in 2018, this will be the only uranium mine in Europe, producing 2.2 million kilos a year. It has been in development for more than a decade. Most developed countries, with the notable exception of Germany, have concluded that 20 nuclear power is an essential part of their energy supply. The US and UK are committed to building new nuclear power stations, the latter providing a £30 billion subsidy to build a new nuclear plant at Hinkley Point. China is also building a further 60 nuclear power stations. Supporters of nuclear power say it provides a reliable source of energy at a time when 25 the world’s population is increasing, unlike solar power and wind power which both vary with the weather. In addition they argue that no country can significantly reduce carbon emissions, which are causing climate change, without nuclear. France and the UK have committed themselves to shut down all coal-fired power stations by 2025. So demand for uranium over the next two decades seems guaranteed. 30 (Source: adapted from Uranium: the unloved metal whose price is poised to go radioactive, Jon Yeomans, The Telegraph, 20 November 2016 http://www.telegraph.co.uk/business/2016/11/20/uranium-the- unloved-metal-whose-price-is-poised-to-go-radioactiv/) Extract B Irrational consumers pay the price The UK Government has announced that it might introduce maximum price controls on energy used by households. The UK’s largest energy suppliers are braced for what could be the industry’s most significant government intervention following a decade of rising energy bills and low 5 numbers of consumers switching between energy providers. The Prime Minister promised to intervene because the energy market is “manifestly not working” for consumers. Energy prices have risen by 158% in the last 15 years, and four million households, especially those on low incomes, are still on the most expensive energy rates. 10 Some energy analysts have warned the Government against taking a highly interventionist approach that could undermine the energy market and leave customers paying higher prices in the future. (Source: adapted from http://www.telegraph.co.uk/business/2017/03/22/ governments-pledge-cut-energy-prices-risks-leaving-consumers/) Extract C The economics of climate change Rising carbon dioxide emissions result from the increase in the use of coal, gas and oil in transport and for energy production. In addition, deforestation, food production and processing methods make the problem worse. These carbon emissions are causing a rise in global average temperatures, known as climate change. Climate change could cause 5 hundreds of millions of people to suffer hunger, water shortages and coastal flooding. Three elements of policy are required for an effective global response to reduce carbon emissions. The first is the pricing of carbon, implemented through tax, trading pollution permits or regulation. The second policy is to support innovation and the deployment of low-carbon technologies. And the third is action to remove barriers to energy efficiency, 10 and to inform, educate and persuade individuals about what they can do to respond to climate change. (Source: adapted from www.sternreview.org.uk/)
(b) With reference to Extract A and your own knowledge, assess whether the supply of uranium is likely to be price elastic or price inelastic. (10)
June 2018 · AS Paper 1 · Q6(c) 6 marks AO1=2, AO2=2, AO3=2 Short answer rational decision making and behavioural economics
Data and extracts for question 6Energy markets Figure 1: Annual surplus or shortage of uranium, measured in millions of kilograms 25 Kg millions 15 5 0 -5 -15 -25 Figures from 2016 are forecast (Source: adapted from http://www.telegraph.co.uk/business/2016/11/20/uranium- the-unloved-metal-whose-price-is-poised-to-go-radioactiv/) Extract A Uranium: the unloved metal Uranium is a fuel source for nuclear energy production. The price of uranium has fallen to a 13-year low. Uranium is a relatively common metal but locating it in the right concentrations can be difficult. Australia has the biggest known resource of uranium, followed by Kazakhstan. Kazakhstan’s production has increased significantly since 2007, 5 accounting for a large proportion of the surplus of this metal. Given the large stockpiles of uranium some firms have ceased production. The biggest impact on the uranium market has been the devastating accident at the nuclear power station in Fukushima, Japan, in 2011. The accident caused a leak of radiation. The accident reduced confidence in the entire nuclear industry, as high doses 10 of radiation leaks increase the risk of cancer. In addition the high cost of safely storing radioactive waste has delayed the building of new nuclear power stations. Japan initially closed all of its 50 nuclear power stations which reduced the demand for uranium. But it has since concluded that nuclear power must be part of its mix of energy suppliers. Despite this setback in 2016 work started on a new uranium mine in Spain to meet 15 the expected rise in demand for the metal. Uranium is a controlled material, so mining companies have to comply with many regulations before opening a new mine. When it opens in 2018, this will be the only uranium mine in Europe, producing 2.2 million kilos a year. It has been in development for more than a decade. Most developed countries, with the notable exception of Germany, have concluded that 20 nuclear power is an essential part of their energy supply. The US and UK are committed to building new nuclear power stations, the latter providing a £30 billion subsidy to build a new nuclear plant at Hinkley Point. China is also building a further 60 nuclear power stations. Supporters of nuclear power say it provides a reliable source of energy at a time when 25 the world’s population is increasing, unlike solar power and wind power which both vary with the weather. In addition they argue that no country can significantly reduce carbon emissions, which are causing climate change, without nuclear. France and the UK have committed themselves to shut down all coal-fired power stations by 2025. So demand for uranium over the next two decades seems guaranteed. 30 (Source: adapted from Uranium: the unloved metal whose price is poised to go radioactive, Jon Yeomans, The Telegraph, 20 November 2016 http://www.telegraph.co.uk/business/2016/11/20/uranium-the- unloved-metal-whose-price-is-poised-to-go-radioactiv/) Extract B Irrational consumers pay the price The UK Government has announced that it might introduce maximum price controls on energy used by households. The UK’s largest energy suppliers are braced for what could be the industry’s most significant government intervention following a decade of rising energy bills and low 5 numbers of consumers switching between energy providers. The Prime Minister promised to intervene because the energy market is “manifestly not working” for consumers. Energy prices have risen by 158% in the last 15 years, and four million households, especially those on low incomes, are still on the most expensive energy rates. 10 Some energy analysts have warned the Government against taking a highly interventionist approach that could undermine the energy market and leave customers paying higher prices in the future. (Source: adapted from http://www.telegraph.co.uk/business/2017/03/22/ governments-pledge-cut-energy-prices-risks-leaving-consumers/) Extract C The economics of climate change Rising carbon dioxide emissions result from the increase in the use of coal, gas and oil in transport and for energy production. In addition, deforestation, food production and processing methods make the problem worse. These carbon emissions are causing a rise in global average temperatures, known as climate change. Climate change could cause 5 hundreds of millions of people to suffer hunger, water shortages and coastal flooding. Three elements of policy are required for an effective global response to reduce carbon emissions. The first is the pricing of carbon, implemented through tax, trading pollution permits or regulation. The second policy is to support innovation and the deployment of low-carbon technologies. And the third is action to remove barriers to energy efficiency, 10 and to inform, educate and persuade individuals about what they can do to respond to climate change. (Source: adapted from www.sternreview.org.uk/)
(c) With reference to Extract B, explain two likely reasons why many consumers of energy have not switched to suppliers offering lower prices. (6)
June 2018 · AS Paper 1 · Q6(d) 4 marks AO1=2, AO2=2 Short answer nature of economics
Data and extracts for question 6Energy markets Figure 1: Annual surplus or shortage of uranium, measured in millions of kilograms 25 Kg millions 15 5 0 -5 -15 -25 Figures from 2016 are forecast (Source: adapted from http://www.telegraph.co.uk/business/2016/11/20/uranium- the-unloved-metal-whose-price-is-poised-to-go-radioactiv/) Extract A Uranium: the unloved metal Uranium is a fuel source for nuclear energy production. The price of uranium has fallen to a 13-year low. Uranium is a relatively common metal but locating it in the right concentrations can be difficult. Australia has the biggest known resource of uranium, followed by Kazakhstan. Kazakhstan’s production has increased significantly since 2007, 5 accounting for a large proportion of the surplus of this metal. Given the large stockpiles of uranium some firms have ceased production. The biggest impact on the uranium market has been the devastating accident at the nuclear power station in Fukushima, Japan, in 2011. The accident caused a leak of radiation. The accident reduced confidence in the entire nuclear industry, as high doses 10 of radiation leaks increase the risk of cancer. In addition the high cost of safely storing radioactive waste has delayed the building of new nuclear power stations. Japan initially closed all of its 50 nuclear power stations which reduced the demand for uranium. But it has since concluded that nuclear power must be part of its mix of energy suppliers. Despite this setback in 2016 work started on a new uranium mine in Spain to meet 15 the expected rise in demand for the metal. Uranium is a controlled material, so mining companies have to comply with many regulations before opening a new mine. When it opens in 2018, this will be the only uranium mine in Europe, producing 2.2 million kilos a year. It has been in development for more than a decade. Most developed countries, with the notable exception of Germany, have concluded that 20 nuclear power is an essential part of their energy supply. The US and UK are committed to building new nuclear power stations, the latter providing a £30 billion subsidy to build a new nuclear plant at Hinkley Point. China is also building a further 60 nuclear power stations. Supporters of nuclear power say it provides a reliable source of energy at a time when 25 the world’s population is increasing, unlike solar power and wind power which both vary with the weather. In addition they argue that no country can significantly reduce carbon emissions, which are causing climate change, without nuclear. France and the UK have committed themselves to shut down all coal-fired power stations by 2025. So demand for uranium over the next two decades seems guaranteed. 30 (Source: adapted from Uranium: the unloved metal whose price is poised to go radioactive, Jon Yeomans, The Telegraph, 20 November 2016 http://www.telegraph.co.uk/business/2016/11/20/uranium-the- unloved-metal-whose-price-is-poised-to-go-radioactiv/) Extract B Irrational consumers pay the price The UK Government has announced that it might introduce maximum price controls on energy used by households. The UK’s largest energy suppliers are braced for what could be the industry’s most significant government intervention following a decade of rising energy bills and low 5 numbers of consumers switching between energy providers. The Prime Minister promised to intervene because the energy market is “manifestly not working” for consumers. Energy prices have risen by 158% in the last 15 years, and four million households, especially those on low incomes, are still on the most expensive energy rates. 10 Some energy analysts have warned the Government against taking a highly interventionist approach that could undermine the energy market and leave customers paying higher prices in the future. (Source: adapted from http://www.telegraph.co.uk/business/2017/03/22/ governments-pledge-cut-energy-prices-risks-leaving-consumers/) Extract C The economics of climate change Rising carbon dioxide emissions result from the increase in the use of coal, gas and oil in transport and for energy production. In addition, deforestation, food production and processing methods make the problem worse. These carbon emissions are causing a rise in global average temperatures, known as climate change. Climate change could cause 5 hundreds of millions of people to suffer hunger, water shortages and coastal flooding. Three elements of policy are required for an effective global response to reduce carbon emissions. The first is the pricing of carbon, implemented through tax, trading pollution permits or regulation. The second policy is to support innovation and the deployment of low-carbon technologies. And the third is action to remove barriers to energy efficiency, 10 and to inform, educate and persuade individuals about what they can do to respond to climate change. (Source: adapted from www.sternreview.org.uk/)
(d) Using examples from the information provided, explain what is meant by renewable and non-renewable energy. (4)
June 2018 · AS Paper 1 · Q6(e) 15 marks AO1=3, AO2=3, AO3=3, AO4=6 15-mark response government intervention in markets
Data and extracts for question 6Energy markets Figure 1: Annual surplus or shortage of uranium, measured in millions of kilograms 25 Kg millions 15 5 0 -5 -15 -25 Figures from 2016 are forecast (Source: adapted from http://www.telegraph.co.uk/business/2016/11/20/uranium- the-unloved-metal-whose-price-is-poised-to-go-radioactiv/) Extract A Uranium: the unloved metal Uranium is a fuel source for nuclear energy production. The price of uranium has fallen to a 13-year low. Uranium is a relatively common metal but locating it in the right concentrations can be difficult. Australia has the biggest known resource of uranium, followed by Kazakhstan. Kazakhstan’s production has increased significantly since 2007, 5 accounting for a large proportion of the surplus of this metal. Given the large stockpiles of uranium some firms have ceased production. The biggest impact on the uranium market has been the devastating accident at the nuclear power station in Fukushima, Japan, in 2011. The accident caused a leak of radiation. The accident reduced confidence in the entire nuclear industry, as high doses 10 of radiation leaks increase the risk of cancer. In addition the high cost of safely storing radioactive waste has delayed the building of new nuclear power stations. Japan initially closed all of its 50 nuclear power stations which reduced the demand for uranium. But it has since concluded that nuclear power must be part of its mix of energy suppliers. Despite this setback in 2016 work started on a new uranium mine in Spain to meet 15 the expected rise in demand for the metal. Uranium is a controlled material, so mining companies have to comply with many regulations before opening a new mine. When it opens in 2018, this will be the only uranium mine in Europe, producing 2.2 million kilos a year. It has been in development for more than a decade. Most developed countries, with the notable exception of Germany, have concluded that 20 nuclear power is an essential part of their energy supply. The US and UK are committed to building new nuclear power stations, the latter providing a £30 billion subsidy to build a new nuclear plant at Hinkley Point. China is also building a further 60 nuclear power stations. Supporters of nuclear power say it provides a reliable source of energy at a time when 25 the world’s population is increasing, unlike solar power and wind power which both vary with the weather. In addition they argue that no country can significantly reduce carbon emissions, which are causing climate change, without nuclear. France and the UK have committed themselves to shut down all coal-fired power stations by 2025. So demand for uranium over the next two decades seems guaranteed. 30 (Source: adapted from Uranium: the unloved metal whose price is poised to go radioactive, Jon Yeomans, The Telegraph, 20 November 2016 http://www.telegraph.co.uk/business/2016/11/20/uranium-the- unloved-metal-whose-price-is-poised-to-go-radioactiv/) Extract B Irrational consumers pay the price The UK Government has announced that it might introduce maximum price controls on energy used by households. The UK’s largest energy suppliers are braced for what could be the industry’s most significant government intervention following a decade of rising energy bills and low 5 numbers of consumers switching between energy providers. The Prime Minister promised to intervene because the energy market is “manifestly not working” for consumers. Energy prices have risen by 158% in the last 15 years, and four million households, especially those on low incomes, are still on the most expensive energy rates. 10 Some energy analysts have warned the Government against taking a highly interventionist approach that could undermine the energy market and leave customers paying higher prices in the future. (Source: adapted from http://www.telegraph.co.uk/business/2017/03/22/ governments-pledge-cut-energy-prices-risks-leaving-consumers/) Extract C The economics of climate change Rising carbon dioxide emissions result from the increase in the use of coal, gas and oil in transport and for energy production. In addition, deforestation, food production and processing methods make the problem worse. These carbon emissions are causing a rise in global average temperatures, known as climate change. Climate change could cause 5 hundreds of millions of people to suffer hunger, water shortages and coastal flooding. Three elements of policy are required for an effective global response to reduce carbon emissions. The first is the pricing of carbon, implemented through tax, trading pollution permits or regulation. The second policy is to support innovation and the deployment of low-carbon technologies. And the third is action to remove barriers to energy efficiency, 10 and to inform, educate and persuade individuals about what they can do to respond to climate change. (Source: adapted from www.sternreview.org.uk/)
The UK Government is considering introducing a maximum price for energy. (e) Discuss the likely microeconomic effects of this decision on energy producers and consumers. Include a supply and demand diagram in your answer. (15)
June 2018 · AS Paper 1 · Q6(f) 20 marks AO1=4, AO2=4, AO3=6, AO4=6 20-mark essay Either/or Hard externalities
Data and extracts for question 6Energy markets Figure 1: Annual surplus or shortage of uranium, measured in millions of kilograms 25 Kg millions 15 5 0 -5 -15 -25 Figures from 2016 are forecast (Source: adapted from http://www.telegraph.co.uk/business/2016/11/20/uranium- the-unloved-metal-whose-price-is-poised-to-go-radioactiv/) Extract A Uranium: the unloved metal Uranium is a fuel source for nuclear energy production. The price of uranium has fallen to a 13-year low. Uranium is a relatively common metal but locating it in the right concentrations can be difficult. Australia has the biggest known resource of uranium, followed by Kazakhstan. Kazakhstan’s production has increased significantly since 2007, 5 accounting for a large proportion of the surplus of this metal. Given the large stockpiles of uranium some firms have ceased production. The biggest impact on the uranium market has been the devastating accident at the nuclear power station in Fukushima, Japan, in 2011. The accident caused a leak of radiation. The accident reduced confidence in the entire nuclear industry, as high doses 10 of radiation leaks increase the risk of cancer. In addition the high cost of safely storing radioactive waste has delayed the building of new nuclear power stations. Japan initially closed all of its 50 nuclear power stations which reduced the demand for uranium. But it has since concluded that nuclear power must be part of its mix of energy suppliers. Despite this setback in 2016 work started on a new uranium mine in Spain to meet 15 the expected rise in demand for the metal. Uranium is a controlled material, so mining companies have to comply with many regulations before opening a new mine. When it opens in 2018, this will be the only uranium mine in Europe, producing 2.2 million kilos a year. It has been in development for more than a decade. Most developed countries, with the notable exception of Germany, have concluded that 20 nuclear power is an essential part of their energy supply. The US and UK are committed to building new nuclear power stations, the latter providing a £30 billion subsidy to build a new nuclear plant at Hinkley Point. China is also building a further 60 nuclear power stations. Supporters of nuclear power say it provides a reliable source of energy at a time when 25 the world’s population is increasing, unlike solar power and wind power which both vary with the weather. In addition they argue that no country can significantly reduce carbon emissions, which are causing climate change, without nuclear. France and the UK have committed themselves to shut down all coal-fired power stations by 2025. So demand for uranium over the next two decades seems guaranteed. 30 (Source: adapted from Uranium: the unloved metal whose price is poised to go radioactive, Jon Yeomans, The Telegraph, 20 November 2016 http://www.telegraph.co.uk/business/2016/11/20/uranium-the- unloved-metal-whose-price-is-poised-to-go-radioactiv/) Extract B Irrational consumers pay the price The UK Government has announced that it might introduce maximum price controls on energy used by households. The UK’s largest energy suppliers are braced for what could be the industry’s most significant government intervention following a decade of rising energy bills and low 5 numbers of consumers switching between energy providers. The Prime Minister promised to intervene because the energy market is “manifestly not working” for consumers. Energy prices have risen by 158% in the last 15 years, and four million households, especially those on low incomes, are still on the most expensive energy rates. 10 Some energy analysts have warned the Government against taking a highly interventionist approach that could undermine the energy market and leave customers paying higher prices in the future. (Source: adapted from http://www.telegraph.co.uk/business/2017/03/22/ governments-pledge-cut-energy-prices-risks-leaving-consumers/) Extract C The economics of climate change Rising carbon dioxide emissions result from the increase in the use of coal, gas and oil in transport and for energy production. In addition, deforestation, food production and processing methods make the problem worse. These carbon emissions are causing a rise in global average temperatures, known as climate change. Climate change could cause 5 hundreds of millions of people to suffer hunger, water shortages and coastal flooding. Three elements of policy are required for an effective global response to reduce carbon emissions. The first is the pricing of carbon, implemented through tax, trading pollution permits or regulation. The second policy is to support innovation and the deployment of low-carbon technologies. And the third is action to remove barriers to energy efficiency, 10 and to inform, educate and persuade individuals about what they can do to respond to climate change. (Source: adapted from www.sternreview.org.uk/)
(f) Using the concept of external costs, evaluate whether nuclear power is under-provided or over-provided in the energy market. Use an appropriate diagram in your answer. (20)
June 2018 · AS Paper 1 · Q6(g) 20 marks AO1=4, AO2=4, AO3=6, AO4=6 20-mark essay Either/or government intervention in markets
Data and extracts for question 6Energy markets Figure 1: Annual surplus or shortage of uranium, measured in millions of kilograms 25 Kg millions 15 5 0 -5 -15 -25 Figures from 2016 are forecast (Source: adapted from http://www.telegraph.co.uk/business/2016/11/20/uranium- the-unloved-metal-whose-price-is-poised-to-go-radioactiv/) Extract A Uranium: the unloved metal Uranium is a fuel source for nuclear energy production. The price of uranium has fallen to a 13-year low. Uranium is a relatively common metal but locating it in the right concentrations can be difficult. Australia has the biggest known resource of uranium, followed by Kazakhstan. Kazakhstan’s production has increased significantly since 2007, 5 accounting for a large proportion of the surplus of this metal. Given the large stockpiles of uranium some firms have ceased production. The biggest impact on the uranium market has been the devastating accident at the nuclear power station in Fukushima, Japan, in 2011. The accident caused a leak of radiation. The accident reduced confidence in the entire nuclear industry, as high doses 10 of radiation leaks increase the risk of cancer. In addition the high cost of safely storing radioactive waste has delayed the building of new nuclear power stations. Japan initially closed all of its 50 nuclear power stations which reduced the demand for uranium. But it has since concluded that nuclear power must be part of its mix of energy suppliers. Despite this setback in 2016 work started on a new uranium mine in Spain to meet 15 the expected rise in demand for the metal. Uranium is a controlled material, so mining companies have to comply with many regulations before opening a new mine. When it opens in 2018, this will be the only uranium mine in Europe, producing 2.2 million kilos a year. It has been in development for more than a decade. Most developed countries, with the notable exception of Germany, have concluded that 20 nuclear power is an essential part of their energy supply. The US and UK are committed to building new nuclear power stations, the latter providing a £30 billion subsidy to build a new nuclear plant at Hinkley Point. China is also building a further 60 nuclear power stations. Supporters of nuclear power say it provides a reliable source of energy at a time when 25 the world’s population is increasing, unlike solar power and wind power which both vary with the weather. In addition they argue that no country can significantly reduce carbon emissions, which are causing climate change, without nuclear. France and the UK have committed themselves to shut down all coal-fired power stations by 2025. So demand for uranium over the next two decades seems guaranteed. 30 (Source: adapted from Uranium: the unloved metal whose price is poised to go radioactive, Jon Yeomans, The Telegraph, 20 November 2016 http://www.telegraph.co.uk/business/2016/11/20/uranium-the- unloved-metal-whose-price-is-poised-to-go-radioactiv/) Extract B Irrational consumers pay the price The UK Government has announced that it might introduce maximum price controls on energy used by households. The UK’s largest energy suppliers are braced for what could be the industry’s most significant government intervention following a decade of rising energy bills and low 5 numbers of consumers switching between energy providers. The Prime Minister promised to intervene because the energy market is “manifestly not working” for consumers. Energy prices have risen by 158% in the last 15 years, and four million households, especially those on low incomes, are still on the most expensive energy rates. 10 Some energy analysts have warned the Government against taking a highly interventionist approach that could undermine the energy market and leave customers paying higher prices in the future. (Source: adapted from http://www.telegraph.co.uk/business/2017/03/22/ governments-pledge-cut-energy-prices-risks-leaving-consumers/) Extract C The economics of climate change Rising carbon dioxide emissions result from the increase in the use of coal, gas and oil in transport and for energy production. In addition, deforestation, food production and processing methods make the problem worse. These carbon emissions are causing a rise in global average temperatures, known as climate change. Climate change could cause 5 hundreds of millions of people to suffer hunger, water shortages and coastal flooding. Three elements of policy are required for an effective global response to reduce carbon emissions. The first is the pricing of carbon, implemented through tax, trading pollution permits or regulation. The second policy is to support innovation and the deployment of low-carbon technologies. And the third is action to remove barriers to energy efficiency, 10 and to inform, educate and persuade individuals about what they can do to respond to climate change. (Source: adapted from www.sternreview.org.uk/)
(g) Evaluate ways in which government intervention could be used to reduce carbon emissions. Use at least one appropriate diagram in your answer. (20)
June 2018 · AS Paper 2 · Q1(b) 2 marks AO2=2 Calculation measuring economic growth
Data and extracts for question 11 The table below shows the UK Gross Domestic Product (GDP) and population, 2013 to 2015. GDP Population Year (£ millions) (millions) 2013 1 739 563 64.1 2014 1 822 480 64.6 2015 1 872 714 65.1 (Source: ONS, https://www.ons.gov.uk/)
(b) Calculate the UK’s GDP per capita in 2015. You are advised to show your working. (2)
June 2018 · AS Paper 2 · Q3(a) 3 marks AO1=1, AO2=1, AO3=1 Short answer fiscal and monetary policy
Data and extracts for question 33 UK base interest rate, January 2008 to January 2017 6 5.5 % 5 4.5 4 3.5 3 2.5 2 1.5 1 0.5 0 (Source: Bank of England, http://www.bankofengland.co.uk/boeapps/iadb/Repo.asp)
(a) With reference to the chart above, explain one factor that the Monetary Policy Committee (MPC) of the Bank of England may have considered when reducing the base interest rate. (3)
June 2018 · AS Paper 2 · Q5(b) 2 marks AO2=2 Calculation aggregate demand
Data and extracts for question 55 The chart below shows selected areas of forecast UK government spending for 2015/16 and 2016/17. 232 Social protection 240 141 Health 145 99 Education 102 45 Defence 46 28 Housing 34 0 100 150 250 50 200 £ billions 2015/16 2016/17 (Source: Budget 2015, https://www.gov.uk/government/uploads/system/uploads/ attachment_data/file/416330/47881_Budget_2015_Web_Accessible.pdf; Budget 2016, https://www.gov.uk/government/uploads/system/uploads/attachment_ data/file/508193/HMT_Budget_2016_Web_Accessible.pdf)
(b) In 2016/17 total forecast UK government spending amounted to £772 billion and total forecast tax receipts amounted to £716 billion. Calculate forecast UK government spending on social protection as a percentage of total forecast UK government spending in 2016/17. You are advised to show your working. (2)
June 2018 · AS Paper 2 · Q6(a) 4 marks AO1=2, AO2=2 Short answer unemployment
Data and extracts for question 6The UK economy Figure 1: Unemployment – International Labour Organisation (ILO) and the claimant count, millions, 2010-2016 3 2.5 2 Millions 1.5 1 0.5 0 2010 2011 2012 2013 2014 2015 2016 ILO Claimant count (Source: ONS Datasets, https://www.ons.gov.uk/) Figure 2: Household savings*, 2010-2015 12 % 10 8 6 4 2 0 2011 2012 2013 2014 2015 2010 * Savings as a percentage of household disposable income (Source: http://www.tradingeconomics.com/united-kingdom/personal-savings) Figure 3: UK average house prices, 2005–2016 220 200 180 160 140 0 2006 2008 2010 2012 2014 2016 (Source: http://www.telegraph.co.uk/property/house-prices/ the-state-of-the-uk-housing-market-in-five-charts/) Extract A Soaring house prices House prices are still rising rapidly. The average UK house price was £214 000 in June 2016, according to the Office for National Statistics (ONS). This is £24 000 more than it was at its peak in September 2007, just before the economic downturn. First-time buyers have experienced the largest rise in house prices. 5 Even the loss of consumer confidence over Britain’s vote to leave the EU did not stop house prices from rising – annual growth increased from 5.2% in July 2016 to 5.6% in August 2016. House price growth was the strongest in London, with annual average prices rising by 9.6%. However, in Wales average house prices actually fell by 0.5% during the same period. In its first post-Brexit referendum forecast, estate agency Countrywide 10 said that house prices will fall by 1% across the UK in 2017, before rising by 2% in 2018. Real household income in the UK fell by 10.4% in the years following the financial crisis. This increased the difference between real income and house prices. In 1997, a house cost little more than twice the average income. By early 2015, the average price of a house was five times the average annual income. 15 The rate of home ownership for 25 to 34-year-olds has fallen to 35.8% over the last twenty-five years as houses became less affordable. First-time buyers have to wait longer to save up for a house deposit. Conversely, home ownership has risen to 78.6% among those aged 65 to 74. (Source: adapted from ‘The state of the UK housing market in five charts’, The Telegraph, http://www.telegraph.co.uk/property/house-prices/ the-state-of-the-uk-housing-market-in-five-charts/; ‘UK house price growth slows as demand cools after Brexit vote’, The Guardian, https://www.theguardian.com/business/2016/sep/30/uk-house- price-growth-slows-demand-cools-brexit-vote-nationwide) Extract B UK migration trends in the year ending June 2016 Inward migration levels are among the highest ever recorded with an estimated 650 000 people moving to the UK. This is an increase of around 11 000 from the previous year. Employment remains the most common reason for long-term migration (312 000) to the UK, with around 182 000 of these coming with a definite job and 130 000 looking for 5 work. Long-term migration to the UK for study was estimated to be 163 000. In addition, 80 000 long-term migrants arrived in the UK to accompany their families. There were 41 280 refugees applying for asylum, including dependants, of which 10 547 people were granted asylum. Asylum applicants cannot usually accept offers of employment while 10 their case is being processed. (Source: adapted from ‘Migration Statistics Quarterly Report: December 2016’, ONS, https:// www.ons.gov.uk/peoplepopulationandcommunity/populationandmigration/ internationalmigration/bulletins/migrationstatisticsquarterlyreport/dec2016)
(a) With reference to Figure 1, explain one reason why the claimant count and the ILO measure of unemployment differ. (4)
June 2018 · AS Paper 2 · Q6(b) 10 marks AO1=2, AO2=2, AO3=2, AO4=4 10-mark response aggregate demandnational income and the multiplier
Data and extracts for question 6The UK economy Figure 1: Unemployment – International Labour Organisation (ILO) and the claimant count, millions, 2010-2016 3 2.5 2 Millions 1.5 1 0.5 0 2010 2011 2012 2013 2014 2015 2016 ILO Claimant count (Source: ONS Datasets, https://www.ons.gov.uk/) Figure 2: Household savings*, 2010-2015 12 % 10 8 6 4 2 0 2011 2012 2013 2014 2015 2010 * Savings as a percentage of household disposable income (Source: http://www.tradingeconomics.com/united-kingdom/personal-savings) Figure 3: UK average house prices, 2005–2016 220 200 180 160 140 0 2006 2008 2010 2012 2014 2016 (Source: http://www.telegraph.co.uk/property/house-prices/ the-state-of-the-uk-housing-market-in-five-charts/) Extract A Soaring house prices House prices are still rising rapidly. The average UK house price was £214 000 in June 2016, according to the Office for National Statistics (ONS). This is £24 000 more than it was at its peak in September 2007, just before the economic downturn. First-time buyers have experienced the largest rise in house prices. 5 Even the loss of consumer confidence over Britain’s vote to leave the EU did not stop house prices from rising – annual growth increased from 5.2% in July 2016 to 5.6% in August 2016. House price growth was the strongest in London, with annual average prices rising by 9.6%. However, in Wales average house prices actually fell by 0.5% during the same period. In its first post-Brexit referendum forecast, estate agency Countrywide 10 said that house prices will fall by 1% across the UK in 2017, before rising by 2% in 2018. Real household income in the UK fell by 10.4% in the years following the financial crisis. This increased the difference between real income and house prices. In 1997, a house cost little more than twice the average income. By early 2015, the average price of a house was five times the average annual income. 15 The rate of home ownership for 25 to 34-year-olds has fallen to 35.8% over the last twenty-five years as houses became less affordable. First-time buyers have to wait longer to save up for a house deposit. Conversely, home ownership has risen to 78.6% among those aged 65 to 74. (Source: adapted from ‘The state of the UK housing market in five charts’, The Telegraph, http://www.telegraph.co.uk/property/house-prices/ the-state-of-the-uk-housing-market-in-five-charts/; ‘UK house price growth slows as demand cools after Brexit vote’, The Guardian, https://www.theguardian.com/business/2016/sep/30/uk-house- price-growth-slows-demand-cools-brexit-vote-nationwide) Extract B UK migration trends in the year ending June 2016 Inward migration levels are among the highest ever recorded with an estimated 650 000 people moving to the UK. This is an increase of around 11 000 from the previous year. Employment remains the most common reason for long-term migration (312 000) to the UK, with around 182 000 of these coming with a definite job and 130 000 looking for 5 work. Long-term migration to the UK for study was estimated to be 163 000. In addition, 80 000 long-term migrants arrived in the UK to accompany their families. There were 41 280 refugees applying for asylum, including dependants, of which 10 547 people were granted asylum. Asylum applicants cannot usually accept offers of employment while 10 their case is being processed. (Source: adapted from ‘Migration Statistics Quarterly Report: December 2016’, ONS, https:// www.ons.gov.uk/peoplepopulationandcommunity/populationandmigration/ internationalmigration/bulletins/migrationstatisticsquarterlyreport/dec2016)
(b) With reference to Extract A, assess the likely macroeconomic effects of an increase in house prices. Use an aggregate demand and aggregate supply diagram in your answer. (10)
June 2018 · AS Paper 2 · Q6(c) 5 marks AO1=1, AO2=2, AO3=2 Short answer aggregate demand
Data and extracts for question 6The UK economy Figure 1: Unemployment – International Labour Organisation (ILO) and the claimant count, millions, 2010-2016 3 2.5 2 Millions 1.5 1 0.5 0 2010 2011 2012 2013 2014 2015 2016 ILO Claimant count (Source: ONS Datasets, https://www.ons.gov.uk/) Figure 2: Household savings*, 2010-2015 12 % 10 8 6 4 2 0 2011 2012 2013 2014 2015 2010 * Savings as a percentage of household disposable income (Source: http://www.tradingeconomics.com/united-kingdom/personal-savings) Figure 3: UK average house prices, 2005–2016 220 200 180 160 140 0 2006 2008 2010 2012 2014 2016 (Source: http://www.telegraph.co.uk/property/house-prices/ the-state-of-the-uk-housing-market-in-five-charts/) Extract A Soaring house prices House prices are still rising rapidly. The average UK house price was £214 000 in June 2016, according to the Office for National Statistics (ONS). This is £24 000 more than it was at its peak in September 2007, just before the economic downturn. First-time buyers have experienced the largest rise in house prices. 5 Even the loss of consumer confidence over Britain’s vote to leave the EU did not stop house prices from rising – annual growth increased from 5.2% in July 2016 to 5.6% in August 2016. House price growth was the strongest in London, with annual average prices rising by 9.6%. However, in Wales average house prices actually fell by 0.5% during the same period. In its first post-Brexit referendum forecast, estate agency Countrywide 10 said that house prices will fall by 1% across the UK in 2017, before rising by 2% in 2018. Real household income in the UK fell by 10.4% in the years following the financial crisis. This increased the difference between real income and house prices. In 1997, a house cost little more than twice the average income. By early 2015, the average price of a house was five times the average annual income. 15 The rate of home ownership for 25 to 34-year-olds has fallen to 35.8% over the last twenty-five years as houses became less affordable. First-time buyers have to wait longer to save up for a house deposit. Conversely, home ownership has risen to 78.6% among those aged 65 to 74. (Source: adapted from ‘The state of the UK housing market in five charts’, The Telegraph, http://www.telegraph.co.uk/property/house-prices/ the-state-of-the-uk-housing-market-in-five-charts/; ‘UK house price growth slows as demand cools after Brexit vote’, The Guardian, https://www.theguardian.com/business/2016/sep/30/uk-house- price-growth-slows-demand-cools-brexit-vote-nationwide) Extract B UK migration trends in the year ending June 2016 Inward migration levels are among the highest ever recorded with an estimated 650 000 people moving to the UK. This is an increase of around 11 000 from the previous year. Employment remains the most common reason for long-term migration (312 000) to the UK, with around 182 000 of these coming with a definite job and 130 000 looking for 5 work. Long-term migration to the UK for study was estimated to be 163 000. In addition, 80 000 long-term migrants arrived in the UK to accompany their families. There were 41 280 refugees applying for asylum, including dependants, of which 10 547 people were granted asylum. Asylum applicants cannot usually accept offers of employment while 10 their case is being processed. (Source: adapted from ‘Migration Statistics Quarterly Report: December 2016’, ONS, https:// www.ons.gov.uk/peoplepopulationandcommunity/populationandmigration/ internationalmigration/bulletins/migrationstatisticsquarterlyreport/dec2016)
(c) With reference to the information provided, explain one likely factor, other than changes in house prices, that could influence the level of savings of UK households. (5)
June 2018 · AS Paper 2 · Q6(d) 6 marks AO1=2, AO2=2, AO3=2 Short answer national income and the multiplier
Data and extracts for question 6The UK economy Figure 1: Unemployment – International Labour Organisation (ILO) and the claimant count, millions, 2010-2016 3 2.5 2 Millions 1.5 1 0.5 0 2010 2011 2012 2013 2014 2015 2016 ILO Claimant count (Source: ONS Datasets, https://www.ons.gov.uk/) Figure 2: Household savings*, 2010-2015 12 % 10 8 6 4 2 0 2011 2012 2013 2014 2015 2010 * Savings as a percentage of household disposable income (Source: http://www.tradingeconomics.com/united-kingdom/personal-savings) Figure 3: UK average house prices, 2005–2016 220 200 180 160 140 0 2006 2008 2010 2012 2014 2016 (Source: http://www.telegraph.co.uk/property/house-prices/ the-state-of-the-uk-housing-market-in-five-charts/) Extract A Soaring house prices House prices are still rising rapidly. The average UK house price was £214 000 in June 2016, according to the Office for National Statistics (ONS). This is £24 000 more than it was at its peak in September 2007, just before the economic downturn. First-time buyers have experienced the largest rise in house prices. 5 Even the loss of consumer confidence over Britain’s vote to leave the EU did not stop house prices from rising – annual growth increased from 5.2% in July 2016 to 5.6% in August 2016. House price growth was the strongest in London, with annual average prices rising by 9.6%. However, in Wales average house prices actually fell by 0.5% during the same period. In its first post-Brexit referendum forecast, estate agency Countrywide 10 said that house prices will fall by 1% across the UK in 2017, before rising by 2% in 2018. Real household income in the UK fell by 10.4% in the years following the financial crisis. This increased the difference between real income and house prices. In 1997, a house cost little more than twice the average income. By early 2015, the average price of a house was five times the average annual income. 15 The rate of home ownership for 25 to 34-year-olds has fallen to 35.8% over the last twenty-five years as houses became less affordable. First-time buyers have to wait longer to save up for a house deposit. Conversely, home ownership has risen to 78.6% among those aged 65 to 74. (Source: adapted from ‘The state of the UK housing market in five charts’, The Telegraph, http://www.telegraph.co.uk/property/house-prices/ the-state-of-the-uk-housing-market-in-five-charts/; ‘UK house price growth slows as demand cools after Brexit vote’, The Guardian, https://www.theguardian.com/business/2016/sep/30/uk-house- price-growth-slows-demand-cools-brexit-vote-nationwide) Extract B UK migration trends in the year ending June 2016 Inward migration levels are among the highest ever recorded with an estimated 650 000 people moving to the UK. This is an increase of around 11 000 from the previous year. Employment remains the most common reason for long-term migration (312 000) to the UK, with around 182 000 of these coming with a definite job and 130 000 looking for 5 work. Long-term migration to the UK for study was estimated to be 163 000. In addition, 80 000 long-term migrants arrived in the UK to accompany their families. There were 41 280 refugees applying for asylum, including dependants, of which 10 547 people were granted asylum. Asylum applicants cannot usually accept offers of employment while 10 their case is being processed. (Source: adapted from ‘Migration Statistics Quarterly Report: December 2016’, ONS, https:// www.ons.gov.uk/peoplepopulationandcommunity/populationandmigration/ internationalmigration/bulletins/migrationstatisticsquarterlyreport/dec2016)
(d) Explain two factors that might cause a rise in the value of the multiplier. (6)
June 2018 · AS Paper 2 · Q6(e) 15 marks AO1=3, AO2=3, AO3=3, AO4=6 15-mark response unemployment
Data and extracts for question 6The UK economy Figure 1: Unemployment – International Labour Organisation (ILO) and the claimant count, millions, 2010-2016 3 2.5 2 Millions 1.5 1 0.5 0 2010 2011 2012 2013 2014 2015 2016 ILO Claimant count (Source: ONS Datasets, https://www.ons.gov.uk/) Figure 2: Household savings*, 2010-2015 12 % 10 8 6 4 2 0 2011 2012 2013 2014 2015 2010 * Savings as a percentage of household disposable income (Source: http://www.tradingeconomics.com/united-kingdom/personal-savings) Figure 3: UK average house prices, 2005–2016 220 200 180 160 140 0 2006 2008 2010 2012 2014 2016 (Source: http://www.telegraph.co.uk/property/house-prices/ the-state-of-the-uk-housing-market-in-five-charts/) Extract A Soaring house prices House prices are still rising rapidly. The average UK house price was £214 000 in June 2016, according to the Office for National Statistics (ONS). This is £24 000 more than it was at its peak in September 2007, just before the economic downturn. First-time buyers have experienced the largest rise in house prices. 5 Even the loss of consumer confidence over Britain’s vote to leave the EU did not stop house prices from rising – annual growth increased from 5.2% in July 2016 to 5.6% in August 2016. House price growth was the strongest in London, with annual average prices rising by 9.6%. However, in Wales average house prices actually fell by 0.5% during the same period. In its first post-Brexit referendum forecast, estate agency Countrywide 10 said that house prices will fall by 1% across the UK in 2017, before rising by 2% in 2018. Real household income in the UK fell by 10.4% in the years following the financial crisis. This increased the difference between real income and house prices. In 1997, a house cost little more than twice the average income. By early 2015, the average price of a house was five times the average annual income. 15 The rate of home ownership for 25 to 34-year-olds has fallen to 35.8% over the last twenty-five years as houses became less affordable. First-time buyers have to wait longer to save up for a house deposit. Conversely, home ownership has risen to 78.6% among those aged 65 to 74. (Source: adapted from ‘The state of the UK housing market in five charts’, The Telegraph, http://www.telegraph.co.uk/property/house-prices/ the-state-of-the-uk-housing-market-in-five-charts/; ‘UK house price growth slows as demand cools after Brexit vote’, The Guardian, https://www.theguardian.com/business/2016/sep/30/uk-house- price-growth-slows-demand-cools-brexit-vote-nationwide) Extract B UK migration trends in the year ending June 2016 Inward migration levels are among the highest ever recorded with an estimated 650 000 people moving to the UK. This is an increase of around 11 000 from the previous year. Employment remains the most common reason for long-term migration (312 000) to the UK, with around 182 000 of these coming with a definite job and 130 000 looking for 5 work. Long-term migration to the UK for study was estimated to be 163 000. In addition, 80 000 long-term migrants arrived in the UK to accompany their families. There were 41 280 refugees applying for asylum, including dependants, of which 10 547 people were granted asylum. Asylum applicants cannot usually accept offers of employment while 10 their case is being processed. (Source: adapted from ‘Migration Statistics Quarterly Report: December 2016’, ONS, https:// www.ons.gov.uk/peoplepopulationandcommunity/populationandmigration/ internationalmigration/bulletins/migrationstatisticsquarterlyreport/dec2016)
(e) With reference to Extract B and Figure 1, discuss the likely impact of migration on employment and unemployment in the UK. (15)
June 2018 · Paper 1 · Q1(a) 2 marks AO2=2 Calculation production possibility frontiers
Data and extracts for question 11 The diagram refers to production possibility frontiers for a country that produces capital goods and consumer goods. X 100 Output of capital goods W V U 50 Y Z 0 80 100 120 140 170 Output of consumer goods Originally, the economy has a production possibility frontier shown by the line XY, operating at point V. The production possibility frontier then moves to XZ, operating at point U.
(a) Calculate the original and the new opportunity cost of producing 50 capital goods. You are advised to show your working. (2)
June 2018 · Paper 1 · Q1(c) 2 marks AO1=1, AO3=1 Short answer production possibility frontiers
Data and extracts for question 11 The diagram refers to production possibility frontiers for a country that produces capital goods and consumer goods. X 100 Output of capital goods W V U 50 Y Z 0 80 100 120 140 170 Output of consumer goods Originally, the economy has a production possibility frontier shown by the line XY, operating at point V. The production possibility frontier then moves to XZ, operating at point U.
(c) Explain one characteristic of the economy at position W. (2)
June 2018 · Paper 1 · Q2(a) 2 marks AO2=2 Calculation indirect taxes and subsidies
Data and extracts for question 22 The number of individual weekly ticket sales from UK National Lottery games operated by Camelot was 73 million in the financial year 2015–2016. The sale price of each lottery ticket was £2. This figure included 24 pence of tax revenue on each ticket sold.
(a) Calculate the weekly revenue received by Camelot after paying the tax to the government. You are advised to show your working. (2)
June 2018 · Paper 1 · Q2(b) 2 marks AO1=1, AO3=1 Short answer price elasticity of demand
Data and extracts for question 22 The number of individual weekly ticket sales from UK National Lottery games operated by Camelot was 73 million in the financial year 2015–2016. The sale price of each lottery ticket was £2. This figure included 24 pence of tax revenue on each ticket sold.
Research conducted for HMRC estimated the cross elasticity of demand for using gaming machines to be 1.28 in response to changes in the price of national lottery tickets. (Source: https://www.gov.uk/government/uploads/system/uploads/ attachment_data/file/322845/report313.pdf) In October 2013 Camelot increased the price of a national lottery ticket from £1 to £2. (b) Explain the likely impact of the price increase of national lottery tickets on the demand for using gaming machines. (2)
June 2018 · Paper 1 · Q3(c) 2 marks AO1=1, AO3=1 Short answer supply and demand
Data and extracts for question 33 The average fee charged by high-street estate agents to homeowners for selling property is 1.3% of the final sale price. (Source: http://www.which.co.uk/money/mortgages-and-property/home- movers/guides/selling-a-house/estate-agent-fees-and-contracts)
(c) Explain one likely reason for the difference in average house prices between London and the North East of England. (2)
June 2018 · Paper 1 · Q4(a) 4 marks AO1=2, AO2=2 Calculation business growth and objectivesrevenues costs and profits
Data and extracts for question 44 Emily owns and operates a nail ink salon. The diagram shows the cost and revenue curves for treatments at her nail ink salon. Initially, Emily sets her price to maximise profits. Costs, Revenue per treatment (£) MC AC 17 12 9 8 AR 0 25 36 Quantity of treatments MR per day
(a) Calculate the change in total supernormal profit if Emily changes her objective from profit maximisation to revenue maximisation. You are advised to show your working. (4)
June 2018 · Paper 1 · Q5(b) 2 marks AO1=1, AO3=1 Short answer supply and demand
Data and extracts for question 55 The following graph shows the global sales of personal computers (PCs) between 2011 and 2015. 400 350 352.4 350.4 315.1 300 308.2 276.7 250 millions 200 of PCs 150 100 50 0 2011 2012 2013 2014 2015 (Source: adapted from IDC and reported in The Times, 14th January 2016)
(b) Explain one likely reason for the decrease in sales of PCs. (2)
June 2018 · Paper 1 · Q5(c) 2 marks AO2=2 Calculation oligopoly
Data and extracts for question 55 The following graph shows the global sales of personal computers (PCs) between 2011 and 2015. 400 350 352.4 350.4 315.1 300 308.2 276.7 250 millions 200 of PCs 150 100 50 0 2011 2012 2013 2014 2015 (Source: adapted from IDC and reported in The Times, 14th January 2016)
The following table shows global sales of PCs by company in 2015. Sales of PCs Company (million) Lenovo 57 182 HP 53 534 Dell 39 049 Apple 20 794 Acer Group 19 680 Others 86 461 Total 276 700 (Source: IDC, reported in The Times, 14th January 2016) (c) Calculate the five-firm concentration ratio. You are advised to show your working. (2)
June 2018 · Paper 1 · Q6(a) 5 marks AO1=1, AO2=1, AO3=3 Short answer supply and demand
Data and extracts for question 6The UK energy market Figure 1: UK retail electricity and gas real price indices, 2004–2015 Gas Electricity Indices: 2010 (base) = 100 140 index 120 100 80 60 40 20 0 2004 2006 2008 2010 2012 2014 2016 (Source: https://assets.publishing.service.gov.uk/media/5773de34e5274a0da3000113/ final-report-energy-market-investigation.pdf) Figure 2: UK retail electricity and gas supply: market share by company, 2016 Company Electricity Gas % % British Gas 23 36 EON 16 13 SSE 16 13 EDF 12 8 Scottish Power 11 9 RWE (nPower) 10 9 Other companies 12 12 Total 100 100 (Sources: https://www.ofgem.gov.uk/chart/ electricity-supply-market-shares-company-domestic-gb and https://www.ofgem.gov.uk/data-portal/retail-market-indicators) Extract A Competition and Markets Authority (CMA) report into the UK energy market An investigation into the UK energy market by the CMA concluded that customers have been paying £1.4 billion a year more than they would in a fully competitive market. It found that 70% of domestic customers of the six largest energy firms were on an expensive standard rate. These customers could each save over £300 a year by switching 5 to a cheaper deal but appear reluctant to do so. However, the CMA investigation found no evidence of anti-competitive practices by firms. There has even been an increase in new entrant energy suppliers over recent years and their combined market share has reached 12% in both gas and electricity supply. To protect consumers, the CMA has introduced various measures to open up and 10 increase competition in the UK energy market. These include: • the creation of a database designed to help consumers switch energy suppliers – rival suppliers can directly contact these customers • the conversion of all homes to smart energy meters making it easier for customers to measure energy consumption and switch supplier 15 • new rules to protect the four million vulnerable customers using prepaid meters – this includes a temporary price cap until smart meters have been installed. (Source: adapted from ‘Competition and Markets Authority Final report into Energy Market Investigation’ https://www.gov.uk/government/ news/cma-publishes-final-energy-report-in-full) Extract B Proposals to regulate profits in the UK energy market Currently energy retail companies make an average profit of 7% of total revenue. The Chairman of the Competition and Markets Authority (CMA) suggested that these profits are as much as five times higher than they should be, given the companies’ limited role in marketing, metering and billing customers. He recommended a profit cap of 1.25% of 5 total revenue. However, Scottish Power criticised proposals for regulating profits saying that it would reduce investment in the energy industry and undermine long-term energy provision. The firm claimed that such a low rate of return is below the profit margin made by supermarkets. 10 All six large energy firms are vertically integrated – producing as well as distributing gas and electricity. This can provide efficiency benefits but also harm competition. (Source: adapted from ‘Profit cap doesn’t fit with new investment, energy boss warns’, by Robin Pagnamenta, The Times, 19th September 2016) Extract C Skills shortages in the UK energy sector The energy sector is facing a skills shortage of engineers and technicians. Some 29% of employers in the gas and electricity industries report unfilled job vacancies compared with an average of 18% across all industries. A lack of information and advice on career prospects for young people is partly to blame 5 - many graduates have a negative image of the work involved. There is also a lack of students taking science, technology, engineering and maths-based subjects at school and university. Less than one-fifth of the energy sector’s workforce are women. The energy sector is characterised by an ageing workforce - data from the UK Labour Force Survey reveal that around two-thirds of workers are aged over 50. These cannot 10 easily be replaced as a long time period is required for training and developing workers’ skills in a highly regulated industry. Urgent action is required by businesses and the government to reduce labour immobility to benefit the energy sector. This action could include policies to increase investment in training programmes, recruit skilled workers from overseas, change the industry image 15 and deal with its ageing workforce. (Source: adapted from ‘Sector insights: skills and performance challenges in the energy sector’, by the UK Commission for Employment and Skills, March 2015; https://www.gov.uk/government/uploads/system/uploads/attachment_ data/file/416998/15.03.25._Energy_SLMI_-_evidence_report.pdf)
(a) With reference to Figure 1, explain one likely reason for the overall trend in the real price of gas and electricity. (5)
June 2018 · Paper 1 · Q6(b) 12 marks AO1=2, AO2=2, AO3=4, AO4=4 12-mark response competition policy and regulationpublic goods and information gaps
Data and extracts for question 6The UK energy market Figure 1: UK retail electricity and gas real price indices, 2004–2015 Gas Electricity Indices: 2010 (base) = 100 140 index 120 100 80 60 40 20 0 2004 2006 2008 2010 2012 2014 2016 (Source: https://assets.publishing.service.gov.uk/media/5773de34e5274a0da3000113/ final-report-energy-market-investigation.pdf) Figure 2: UK retail electricity and gas supply: market share by company, 2016 Company Electricity Gas % % British Gas 23 36 EON 16 13 SSE 16 13 EDF 12 8 Scottish Power 11 9 RWE (nPower) 10 9 Other companies 12 12 Total 100 100 (Sources: https://www.ofgem.gov.uk/chart/ electricity-supply-market-shares-company-domestic-gb and https://www.ofgem.gov.uk/data-portal/retail-market-indicators) Extract A Competition and Markets Authority (CMA) report into the UK energy market An investigation into the UK energy market by the CMA concluded that customers have been paying £1.4 billion a year more than they would in a fully competitive market. It found that 70% of domestic customers of the six largest energy firms were on an expensive standard rate. These customers could each save over £300 a year by switching 5 to a cheaper deal but appear reluctant to do so. However, the CMA investigation found no evidence of anti-competitive practices by firms. There has even been an increase in new entrant energy suppliers over recent years and their combined market share has reached 12% in both gas and electricity supply. To protect consumers, the CMA has introduced various measures to open up and 10 increase competition in the UK energy market. These include: • the creation of a database designed to help consumers switch energy suppliers – rival suppliers can directly contact these customers • the conversion of all homes to smart energy meters making it easier for customers to measure energy consumption and switch supplier 15 • new rules to protect the four million vulnerable customers using prepaid meters – this includes a temporary price cap until smart meters have been installed. (Source: adapted from ‘Competition and Markets Authority Final report into Energy Market Investigation’ https://www.gov.uk/government/ news/cma-publishes-final-energy-report-in-full) Extract B Proposals to regulate profits in the UK energy market Currently energy retail companies make an average profit of 7% of total revenue. The Chairman of the Competition and Markets Authority (CMA) suggested that these profits are as much as five times higher than they should be, given the companies’ limited role in marketing, metering and billing customers. He recommended a profit cap of 1.25% of 5 total revenue. However, Scottish Power criticised proposals for regulating profits saying that it would reduce investment in the energy industry and undermine long-term energy provision. The firm claimed that such a low rate of return is below the profit margin made by supermarkets. 10 All six large energy firms are vertically integrated – producing as well as distributing gas and electricity. This can provide efficiency benefits but also harm competition. (Source: adapted from ‘Profit cap doesn’t fit with new investment, energy boss warns’, by Robin Pagnamenta, The Times, 19th September 2016) Extract C Skills shortages in the UK energy sector The energy sector is facing a skills shortage of engineers and technicians. Some 29% of employers in the gas and electricity industries report unfilled job vacancies compared with an average of 18% across all industries. A lack of information and advice on career prospects for young people is partly to blame 5 - many graduates have a negative image of the work involved. There is also a lack of students taking science, technology, engineering and maths-based subjects at school and university. Less than one-fifth of the energy sector’s workforce are women. The energy sector is characterised by an ageing workforce - data from the UK Labour Force Survey reveal that around two-thirds of workers are aged over 50. These cannot 10 easily be replaced as a long time period is required for training and developing workers’ skills in a highly regulated industry. Urgent action is required by businesses and the government to reduce labour immobility to benefit the energy sector. This action could include policies to increase investment in training programmes, recruit skilled workers from overseas, change the industry image 15 and deal with its ageing workforce. (Source: adapted from ‘Sector insights: skills and performance challenges in the energy sector’, by the UK Commission for Employment and Skills, March 2015; https://www.gov.uk/government/uploads/system/uploads/attachment_ data/file/416998/15.03.25._Energy_SLMI_-_evidence_report.pdf)
(b) With reference to Extract A, discuss the likely effectiveness of ‘measures to open up and increase competition’ in the UK energy market. (12)
June 2018 · Paper 1 · Q6(c) 10 marks AO1=2, AO2=2, AO3=2, AO4=4 10-mark response competition policy and regulation
Data and extracts for question 6The UK energy market Figure 1: UK retail electricity and gas real price indices, 2004–2015 Gas Electricity Indices: 2010 (base) = 100 140 index 120 100 80 60 40 20 0 2004 2006 2008 2010 2012 2014 2016 (Source: https://assets.publishing.service.gov.uk/media/5773de34e5274a0da3000113/ final-report-energy-market-investigation.pdf) Figure 2: UK retail electricity and gas supply: market share by company, 2016 Company Electricity Gas % % British Gas 23 36 EON 16 13 SSE 16 13 EDF 12 8 Scottish Power 11 9 RWE (nPower) 10 9 Other companies 12 12 Total 100 100 (Sources: https://www.ofgem.gov.uk/chart/ electricity-supply-market-shares-company-domestic-gb and https://www.ofgem.gov.uk/data-portal/retail-market-indicators) Extract A Competition and Markets Authority (CMA) report into the UK energy market An investigation into the UK energy market by the CMA concluded that customers have been paying £1.4 billion a year more than they would in a fully competitive market. It found that 70% of domestic customers of the six largest energy firms were on an expensive standard rate. These customers could each save over £300 a year by switching 5 to a cheaper deal but appear reluctant to do so. However, the CMA investigation found no evidence of anti-competitive practices by firms. There has even been an increase in new entrant energy suppliers over recent years and their combined market share has reached 12% in both gas and electricity supply. To protect consumers, the CMA has introduced various measures to open up and 10 increase competition in the UK energy market. These include: • the creation of a database designed to help consumers switch energy suppliers – rival suppliers can directly contact these customers • the conversion of all homes to smart energy meters making it easier for customers to measure energy consumption and switch supplier 15 • new rules to protect the four million vulnerable customers using prepaid meters – this includes a temporary price cap until smart meters have been installed. (Source: adapted from ‘Competition and Markets Authority Final report into Energy Market Investigation’ https://www.gov.uk/government/ news/cma-publishes-final-energy-report-in-full) Extract B Proposals to regulate profits in the UK energy market Currently energy retail companies make an average profit of 7% of total revenue. The Chairman of the Competition and Markets Authority (CMA) suggested that these profits are as much as five times higher than they should be, given the companies’ limited role in marketing, metering and billing customers. He recommended a profit cap of 1.25% of 5 total revenue. However, Scottish Power criticised proposals for regulating profits saying that it would reduce investment in the energy industry and undermine long-term energy provision. The firm claimed that such a low rate of return is below the profit margin made by supermarkets. 10 All six large energy firms are vertically integrated – producing as well as distributing gas and electricity. This can provide efficiency benefits but also harm competition. (Source: adapted from ‘Profit cap doesn’t fit with new investment, energy boss warns’, by Robin Pagnamenta, The Times, 19th September 2016) Extract C Skills shortages in the UK energy sector The energy sector is facing a skills shortage of engineers and technicians. Some 29% of employers in the gas and electricity industries report unfilled job vacancies compared with an average of 18% across all industries. A lack of information and advice on career prospects for young people is partly to blame 5 - many graduates have a negative image of the work involved. There is also a lack of students taking science, technology, engineering and maths-based subjects at school and university. Less than one-fifth of the energy sector’s workforce are women. The energy sector is characterised by an ageing workforce - data from the UK Labour Force Survey reveal that around two-thirds of workers are aged over 50. These cannot 10 easily be replaced as a long time period is required for training and developing workers’ skills in a highly regulated industry. Urgent action is required by businesses and the government to reduce labour immobility to benefit the energy sector. This action could include policies to increase investment in training programmes, recruit skilled workers from overseas, change the industry image 15 and deal with its ageing workforce. (Source: adapted from ‘Sector insights: skills and performance challenges in the energy sector’, by the UK Commission for Employment and Skills, March 2015; https://www.gov.uk/government/uploads/system/uploads/attachment_ data/file/416998/15.03.25._Energy_SLMI_-_evidence_report.pdf)
(c) With reference to Extract B, assess how the regulation of energy suppliers’ profits is likely to affect consumers and suppliers in the energy market. (10)
June 2018 · Paper 1 · Q6(d) 8 marks AO1=2, AO2=2, AO3=2, AO4=2 8-mark response price elasticity of demand
Data and extracts for question 6The UK energy market Figure 1: UK retail electricity and gas real price indices, 2004–2015 Gas Electricity Indices: 2010 (base) = 100 140 index 120 100 80 60 40 20 0 2004 2006 2008 2010 2012 2014 2016 (Source: https://assets.publishing.service.gov.uk/media/5773de34e5274a0da3000113/ final-report-energy-market-investigation.pdf) Figure 2: UK retail electricity and gas supply: market share by company, 2016 Company Electricity Gas % % British Gas 23 36 EON 16 13 SSE 16 13 EDF 12 8 Scottish Power 11 9 RWE (nPower) 10 9 Other companies 12 12 Total 100 100 (Sources: https://www.ofgem.gov.uk/chart/ electricity-supply-market-shares-company-domestic-gb and https://www.ofgem.gov.uk/data-portal/retail-market-indicators) Extract A Competition and Markets Authority (CMA) report into the UK energy market An investigation into the UK energy market by the CMA concluded that customers have been paying £1.4 billion a year more than they would in a fully competitive market. It found that 70% of domestic customers of the six largest energy firms were on an expensive standard rate. These customers could each save over £300 a year by switching 5 to a cheaper deal but appear reluctant to do so. However, the CMA investigation found no evidence of anti-competitive practices by firms. There has even been an increase in new entrant energy suppliers over recent years and their combined market share has reached 12% in both gas and electricity supply. To protect consumers, the CMA has introduced various measures to open up and 10 increase competition in the UK energy market. These include: • the creation of a database designed to help consumers switch energy suppliers – rival suppliers can directly contact these customers • the conversion of all homes to smart energy meters making it easier for customers to measure energy consumption and switch supplier 15 • new rules to protect the four million vulnerable customers using prepaid meters – this includes a temporary price cap until smart meters have been installed. (Source: adapted from ‘Competition and Markets Authority Final report into Energy Market Investigation’ https://www.gov.uk/government/ news/cma-publishes-final-energy-report-in-full) Extract B Proposals to regulate profits in the UK energy market Currently energy retail companies make an average profit of 7% of total revenue. The Chairman of the Competition and Markets Authority (CMA) suggested that these profits are as much as five times higher than they should be, given the companies’ limited role in marketing, metering and billing customers. He recommended a profit cap of 1.25% of 5 total revenue. However, Scottish Power criticised proposals for regulating profits saying that it would reduce investment in the energy industry and undermine long-term energy provision. The firm claimed that such a low rate of return is below the profit margin made by supermarkets. 10 All six large energy firms are vertically integrated – producing as well as distributing gas and electricity. This can provide efficiency benefits but also harm competition. (Source: adapted from ‘Profit cap doesn’t fit with new investment, energy boss warns’, by Robin Pagnamenta, The Times, 19th September 2016) Extract C Skills shortages in the UK energy sector The energy sector is facing a skills shortage of engineers and technicians. Some 29% of employers in the gas and electricity industries report unfilled job vacancies compared with an average of 18% across all industries. A lack of information and advice on career prospects for young people is partly to blame 5 - many graduates have a negative image of the work involved. There is also a lack of students taking science, technology, engineering and maths-based subjects at school and university. Less than one-fifth of the energy sector’s workforce are women. The energy sector is characterised by an ageing workforce - data from the UK Labour Force Survey reveal that around two-thirds of workers are aged over 50. These cannot 10 easily be replaced as a long time period is required for training and developing workers’ skills in a highly regulated industry. Urgent action is required by businesses and the government to reduce labour immobility to benefit the energy sector. This action could include policies to increase investment in training programmes, recruit skilled workers from overseas, change the industry image 15 and deal with its ageing workforce. (Source: adapted from ‘Sector insights: skills and performance challenges in the energy sector’, by the UK Commission for Employment and Skills, March 2015; https://www.gov.uk/government/uploads/system/uploads/attachment_ data/file/416998/15.03.25._Energy_SLMI_-_evidence_report.pdf)
The price elasticity of demand for electricity in the UK is estimated to be –0.35 in the short run and –0.85 in the long run. (d) With reference to Extract A and your own knowledge, examine two possible reasons for the change in price elasticity of demand for electricity over time. (8)
June 2018 · Paper 1 · Q6(e) 15 marks AO1=3, AO2=3, AO3=3, AO4=6 15-mark response labour market
Data and extracts for question 6The UK energy market Figure 1: UK retail electricity and gas real price indices, 2004–2015 Gas Electricity Indices: 2010 (base) = 100 140 index 120 100 80 60 40 20 0 2004 2006 2008 2010 2012 2014 2016 (Source: https://assets.publishing.service.gov.uk/media/5773de34e5274a0da3000113/ final-report-energy-market-investigation.pdf) Figure 2: UK retail electricity and gas supply: market share by company, 2016 Company Electricity Gas % % British Gas 23 36 EON 16 13 SSE 16 13 EDF 12 8 Scottish Power 11 9 RWE (nPower) 10 9 Other companies 12 12 Total 100 100 (Sources: https://www.ofgem.gov.uk/chart/ electricity-supply-market-shares-company-domestic-gb and https://www.ofgem.gov.uk/data-portal/retail-market-indicators) Extract A Competition and Markets Authority (CMA) report into the UK energy market An investigation into the UK energy market by the CMA concluded that customers have been paying £1.4 billion a year more than they would in a fully competitive market. It found that 70% of domestic customers of the six largest energy firms were on an expensive standard rate. These customers could each save over £300 a year by switching 5 to a cheaper deal but appear reluctant to do so. However, the CMA investigation found no evidence of anti-competitive practices by firms. There has even been an increase in new entrant energy suppliers over recent years and their combined market share has reached 12% in both gas and electricity supply. To protect consumers, the CMA has introduced various measures to open up and 10 increase competition in the UK energy market. These include: • the creation of a database designed to help consumers switch energy suppliers – rival suppliers can directly contact these customers • the conversion of all homes to smart energy meters making it easier for customers to measure energy consumption and switch supplier 15 • new rules to protect the four million vulnerable customers using prepaid meters – this includes a temporary price cap until smart meters have been installed. (Source: adapted from ‘Competition and Markets Authority Final report into Energy Market Investigation’ https://www.gov.uk/government/ news/cma-publishes-final-energy-report-in-full) Extract B Proposals to regulate profits in the UK energy market Currently energy retail companies make an average profit of 7% of total revenue. The Chairman of the Competition and Markets Authority (CMA) suggested that these profits are as much as five times higher than they should be, given the companies’ limited role in marketing, metering and billing customers. He recommended a profit cap of 1.25% of 5 total revenue. However, Scottish Power criticised proposals for regulating profits saying that it would reduce investment in the energy industry and undermine long-term energy provision. The firm claimed that such a low rate of return is below the profit margin made by supermarkets. 10 All six large energy firms are vertically integrated – producing as well as distributing gas and electricity. This can provide efficiency benefits but also harm competition. (Source: adapted from ‘Profit cap doesn’t fit with new investment, energy boss warns’, by Robin Pagnamenta, The Times, 19th September 2016) Extract C Skills shortages in the UK energy sector The energy sector is facing a skills shortage of engineers and technicians. Some 29% of employers in the gas and electricity industries report unfilled job vacancies compared with an average of 18% across all industries. A lack of information and advice on career prospects for young people is partly to blame 5 - many graduates have a negative image of the work involved. There is also a lack of students taking science, technology, engineering and maths-based subjects at school and university. Less than one-fifth of the energy sector’s workforce are women. The energy sector is characterised by an ageing workforce - data from the UK Labour Force Survey reveal that around two-thirds of workers are aged over 50. These cannot 10 easily be replaced as a long time period is required for training and developing workers’ skills in a highly regulated industry. Urgent action is required by businesses and the government to reduce labour immobility to benefit the energy sector. This action could include policies to increase investment in training programmes, recruit skilled workers from overseas, change the industry image 15 and deal with its ageing workforce. (Source: adapted from ‘Sector insights: skills and performance challenges in the energy sector’, by the UK Commission for Employment and Skills, March 2015; https://www.gov.uk/government/uploads/system/uploads/attachment_ data/file/416998/15.03.25._Energy_SLMI_-_evidence_report.pdf)
(e) With reference to Extract C and your own knowledge, discuss policies businesses and government might implement to reduce labour immobility to benefit the energy sector. (15)
June 2018 · Paper 2 · Q1(b) 4 marks AO1=2, AO2=1, AO3=1 Short answer globalisation and trade
Data and extracts for question 11 The trade deal known as the Comprehensive Economic and Trade Agreement (CETA) is designed to eliminate or reduce trade barriers between the European Union (EU) and Canada. It is estimated that it will increase trade by 20% and boost EU GDP by 12 billion euros. (Source: http://www.theguardian.com/business/2016/oct/30/eu-canada- sign-ceta-free-trade-deal-trudeau-juncker)
(b) With reference to the theory of comparative advantage, explain how CETA may increase the GDP of both the EU and Canada. (4)
June 2018 · Paper 2 · Q3(a) 2 marks AO2=2 Calculation balance of payments
Data and extracts for question 33 United States current account of the balance of payments, 1993–2015 0 –100 –200 –300 –400 US$ (billions) –500 –600 –700 –800 –900 –1000 1994 1996 1998 2000 2002 2004 2006 2008 2010 2012 2014 Year (Source: http://data.worldbank.org/indicator/BN.CAB.XOKA. CD?end=2015&locations=US&start=1993)
(a) Calculate the percentage change in the United States current account deficit on the balance of payments between 1998 and 2006. (2)
June 2018 · Paper 2 · Q4(a) 2 marks AO1=1, AO3=1 Short answer public finances and taxation
Data and extracts for question 44 The UK has experienced a budget deficit since 2001. The government aimed to reach a budget surplus by 2019, but in 2016 this target was abandoned. (Source: adapted from https://www.gov.uk/government/news/autumn- statement-2016-some-of-the-things-weve-announced)
(a) Explain one likely reason why the 2019 budget surplus target was abandoned. (2)
June 2018 · Paper 2 · Q4(b) 2 marks AO1=1, AO3=1 Short answer public finances and taxation
Data and extracts for question 44 The UK has experienced a budget deficit since 2001. The government aimed to reach a budget surplus by 2019, but in 2016 this target was abandoned. (Source: adapted from https://www.gov.uk/government/news/autumn- statement-2016-some-of-the-things-weve-announced)
(b) Explain the likely impact of abandoning the budget surplus target on the UK national debt. (2)
June 2018 · Paper 2 · Q5(a) 2 marks AO1=1, AO3=1 Short answer aggregate demand
Data and extracts for question 55 UK total bank lending to individuals, percentage change on previous year 2014 2.5% 2015 3.2% 2016 4.0% (Source: Bank of England 2017)
(a) Explain one likely reason why consumer demand for bank loans has increased. (2)
June 2018 · Paper 2 · Q5(c) 2 marks AO2=2 Calculation financial sector
Data and extracts for question 55 UK total bank lending to individuals, percentage change on previous year 2014 2.5% 2015 3.2% 2016 4.0% (Source: Bank of England 2017)
(c) Calculate the index number for the total value of bank lending in 2016 using 2015 as a base year. (2)
June 2018 · Paper 2 · Q6(a) 5 marks AO1=2, AO2=2, AO3=1 Short answer poverty and inequality
Data and extracts for question 6Globalisation and Inequality Figure 1: Proportion of population in absolute poverty (US$1.90-a-day 2011 PPP) 70 60 50 % 40 30 20 10 0 1990 1992 1994 1996 1998 2000 2002 2004 2006 2008 2010 2012 Year Key: Sub-Saharan Africa East Asia (Source: https://openknowledge.worldbank.org/bitstream/ handle/10986/25078/9781464809583.pdf) Extract A Lessons from globalisation The past 25 years have seen a freeing up of trade. Capital has been free to move around the world. Formerly closed economies in Asia have been opened up and tariffs cut. In emerging economies, a billion people have been taken out of absolute poverty, but relative poverty remains a problem. 5 In many advanced economies globalisation has come to mean, according to the Governor of the Bank of England, “low wages, insecure employment, stateless corporations and striking inequalities”. His solution to these problems is threefold: an acceptance by economists that not everybody has gained from trade and technology; a better mix of monetary policy, fiscal policy and structural reform to boost growth; and 10 more inclusive growth. In essence, this is the same conclusion that was reached in the past when there was a fear that market forces had to be moderated to prevent capitalism from destroying itself. The good news is that this moderation of capitalism included real policy changes: an extension of the right to vote, the growth of trade unions, the creation of welfare states, a 15 move to more progressive tax policies, nationalisation of key sectors of the economy, and more activist demand management. The bad news is that this process took about 100 years and was not completed until the end of the Second World War. What’s more, protectionism seems to be on the increase as countries seek to protect themselves from inequalities caused by rapid globalisation. 20 (Source: adapted from https://www.theguardian.com/business/2016/dec/05/ mark-carney-globalisation-bank-of-england-capitalism) Extract B Tackling inequality Despite decades of substantial progress in boosting prosperity and reducing absolute poverty, the world continues to suffer from substantial inequalities. For example, the poorest children are four times less likely than the richest children to be enrolled in primary education across developing countries. Among the estimated 780 million 5 illiterate adults worldwide, nearly two-thirds are women. Poor people face higher risks of malnutrition and death in childhood and lower chances of receiving key healthcare. Such inequalities result in high financial costs, limit economic growth, and generate social and political burdens and barriers. These consequences highlight the importance of directing attention to the problem of 10 inequality. There are other reasons to tackle inequality. Most economies are struggling to recover from the global financial crisis that started in 2008 and the subsequent slowdown in global growth. The goal of eliminating absolute poverty by 2030 might not be achieved without accelerated economic growth or reductions in inequalities within countries, especially in those with large numbers of poor. Generally speaking, 15 poverty can be reduced through higher average growth, a narrowing in inequality, or a combination of the two. Achieving the same poverty reduction during a slowdown in growth therefore requires a more equal income distribution. Some level of inequality is desirable to maintain an appropriate incentive structure in the economy or simply because inequality also reflects different levels of talent and effort 20 among individuals. However, the substantial inequality observed in the world today offers great scope for reducing the gap between rich and poor. Policies to redistribute income from higher-income and wealthy households to those on lower incomes can be achieved without compromising growth, if done effectively. A trade-off between efficiency and fairness is not inevitable. 25 (Source: adapted from https://openknowledge.worldbank.org/ bitstream/handle/10986/25078/9781464809583.pdf)
(a) With reference to the information provided, explain the distinction between absolute poverty and relative poverty. (5)
June 2018 · Paper 2 · Q6(b) 8 marks AO1=2, AO2=2, AO3=2, AO4=2 8-mark response emerging and developing economies
Data and extracts for question 6Globalisation and Inequality Figure 1: Proportion of population in absolute poverty (US$1.90-a-day 2011 PPP) 70 60 50 % 40 30 20 10 0 1990 1992 1994 1996 1998 2000 2002 2004 2006 2008 2010 2012 Year Key: Sub-Saharan Africa East Asia (Source: https://openknowledge.worldbank.org/bitstream/ handle/10986/25078/9781464809583.pdf) Extract A Lessons from globalisation The past 25 years have seen a freeing up of trade. Capital has been free to move around the world. Formerly closed economies in Asia have been opened up and tariffs cut. In emerging economies, a billion people have been taken out of absolute poverty, but relative poverty remains a problem. 5 In many advanced economies globalisation has come to mean, according to the Governor of the Bank of England, “low wages, insecure employment, stateless corporations and striking inequalities”. His solution to these problems is threefold: an acceptance by economists that not everybody has gained from trade and technology; a better mix of monetary policy, fiscal policy and structural reform to boost growth; and 10 more inclusive growth. In essence, this is the same conclusion that was reached in the past when there was a fear that market forces had to be moderated to prevent capitalism from destroying itself. The good news is that this moderation of capitalism included real policy changes: an extension of the right to vote, the growth of trade unions, the creation of welfare states, a 15 move to more progressive tax policies, nationalisation of key sectors of the economy, and more activist demand management. The bad news is that this process took about 100 years and was not completed until the end of the Second World War. What’s more, protectionism seems to be on the increase as countries seek to protect themselves from inequalities caused by rapid globalisation. 20 (Source: adapted from https://www.theguardian.com/business/2016/dec/05/ mark-carney-globalisation-bank-of-england-capitalism) Extract B Tackling inequality Despite decades of substantial progress in boosting prosperity and reducing absolute poverty, the world continues to suffer from substantial inequalities. For example, the poorest children are four times less likely than the richest children to be enrolled in primary education across developing countries. Among the estimated 780 million 5 illiterate adults worldwide, nearly two-thirds are women. Poor people face higher risks of malnutrition and death in childhood and lower chances of receiving key healthcare. Such inequalities result in high financial costs, limit economic growth, and generate social and political burdens and barriers. These consequences highlight the importance of directing attention to the problem of 10 inequality. There are other reasons to tackle inequality. Most economies are struggling to recover from the global financial crisis that started in 2008 and the subsequent slowdown in global growth. The goal of eliminating absolute poverty by 2030 might not be achieved without accelerated economic growth or reductions in inequalities within countries, especially in those with large numbers of poor. Generally speaking, 15 poverty can be reduced through higher average growth, a narrowing in inequality, or a combination of the two. Achieving the same poverty reduction during a slowdown in growth therefore requires a more equal income distribution. Some level of inequality is desirable to maintain an appropriate incentive structure in the economy or simply because inequality also reflects different levels of talent and effort 20 among individuals. However, the substantial inequality observed in the world today offers great scope for reducing the gap between rich and poor. Policies to redistribute income from higher-income and wealthy households to those on lower incomes can be achieved without compromising growth, if done effectively. A trade-off between efficiency and fairness is not inevitable. 25 (Source: adapted from https://openknowledge.worldbank.org/ bitstream/handle/10986/25078/9781464809583.pdf)
(b) With reference to the information provided and your own knowledge, examine two factors that might explain the differing rates of decline in absolute poverty in East Asia and Sub-Saharan Africa. (8)
June 2018 · Paper 2 · Q6(c) 12 marks AO1=2, AO2=2, AO3=4, AO4=4 12-mark response macroeconomic policy in a global contextglobalisation and trade
Data and extracts for question 6Globalisation and Inequality Figure 1: Proportion of population in absolute poverty (US$1.90-a-day 2011 PPP) 70 60 50 % 40 30 20 10 0 1990 1992 1994 1996 1998 2000 2002 2004 2006 2008 2010 2012 Year Key: Sub-Saharan Africa East Asia (Source: https://openknowledge.worldbank.org/bitstream/ handle/10986/25078/9781464809583.pdf) Extract A Lessons from globalisation The past 25 years have seen a freeing up of trade. Capital has been free to move around the world. Formerly closed economies in Asia have been opened up and tariffs cut. In emerging economies, a billion people have been taken out of absolute poverty, but relative poverty remains a problem. 5 In many advanced economies globalisation has come to mean, according to the Governor of the Bank of England, “low wages, insecure employment, stateless corporations and striking inequalities”. His solution to these problems is threefold: an acceptance by economists that not everybody has gained from trade and technology; a better mix of monetary policy, fiscal policy and structural reform to boost growth; and 10 more inclusive growth. In essence, this is the same conclusion that was reached in the past when there was a fear that market forces had to be moderated to prevent capitalism from destroying itself. The good news is that this moderation of capitalism included real policy changes: an extension of the right to vote, the growth of trade unions, the creation of welfare states, a 15 move to more progressive tax policies, nationalisation of key sectors of the economy, and more activist demand management. The bad news is that this process took about 100 years and was not completed until the end of the Second World War. What’s more, protectionism seems to be on the increase as countries seek to protect themselves from inequalities caused by rapid globalisation. 20 (Source: adapted from https://www.theguardian.com/business/2016/dec/05/ mark-carney-globalisation-bank-of-england-capitalism) Extract B Tackling inequality Despite decades of substantial progress in boosting prosperity and reducing absolute poverty, the world continues to suffer from substantial inequalities. For example, the poorest children are four times less likely than the richest children to be enrolled in primary education across developing countries. Among the estimated 780 million 5 illiterate adults worldwide, nearly two-thirds are women. Poor people face higher risks of malnutrition and death in childhood and lower chances of receiving key healthcare. Such inequalities result in high financial costs, limit economic growth, and generate social and political burdens and barriers. These consequences highlight the importance of directing attention to the problem of 10 inequality. There are other reasons to tackle inequality. Most economies are struggling to recover from the global financial crisis that started in 2008 and the subsequent slowdown in global growth. The goal of eliminating absolute poverty by 2030 might not be achieved without accelerated economic growth or reductions in inequalities within countries, especially in those with large numbers of poor. Generally speaking, 15 poverty can be reduced through higher average growth, a narrowing in inequality, or a combination of the two. Achieving the same poverty reduction during a slowdown in growth therefore requires a more equal income distribution. Some level of inequality is desirable to maintain an appropriate incentive structure in the economy or simply because inequality also reflects different levels of talent and effort 20 among individuals. However, the substantial inequality observed in the world today offers great scope for reducing the gap between rich and poor. Policies to redistribute income from higher-income and wealthy households to those on lower incomes can be achieved without compromising growth, if done effectively. A trade-off between efficiency and fairness is not inevitable. 25 (Source: adapted from https://openknowledge.worldbank.org/ bitstream/handle/10986/25078/9781464809583.pdf)
(c) With reference to Extract A, discuss two macroeconomic policies, apart from protectionism, that a government could use to reduce the negative effects of globalisation. (12)
June 2018 · Paper 2 · Q6(d) 10 marks AO1=2, AO2=2, AO3=2, AO4=4 10-mark response poverty and inequality
Data and extracts for question 6Globalisation and Inequality Figure 1: Proportion of population in absolute poverty (US$1.90-a-day 2011 PPP) 70 60 50 % 40 30 20 10 0 1990 1992 1994 1996 1998 2000 2002 2004 2006 2008 2010 2012 Year Key: Sub-Saharan Africa East Asia (Source: https://openknowledge.worldbank.org/bitstream/ handle/10986/25078/9781464809583.pdf) Extract A Lessons from globalisation The past 25 years have seen a freeing up of trade. Capital has been free to move around the world. Formerly closed economies in Asia have been opened up and tariffs cut. In emerging economies, a billion people have been taken out of absolute poverty, but relative poverty remains a problem. 5 In many advanced economies globalisation has come to mean, according to the Governor of the Bank of England, “low wages, insecure employment, stateless corporations and striking inequalities”. His solution to these problems is threefold: an acceptance by economists that not everybody has gained from trade and technology; a better mix of monetary policy, fiscal policy and structural reform to boost growth; and 10 more inclusive growth. In essence, this is the same conclusion that was reached in the past when there was a fear that market forces had to be moderated to prevent capitalism from destroying itself. The good news is that this moderation of capitalism included real policy changes: an extension of the right to vote, the growth of trade unions, the creation of welfare states, a 15 move to more progressive tax policies, nationalisation of key sectors of the economy, and more activist demand management. The bad news is that this process took about 100 years and was not completed until the end of the Second World War. What’s more, protectionism seems to be on the increase as countries seek to protect themselves from inequalities caused by rapid globalisation. 20 (Source: adapted from https://www.theguardian.com/business/2016/dec/05/ mark-carney-globalisation-bank-of-england-capitalism) Extract B Tackling inequality Despite decades of substantial progress in boosting prosperity and reducing absolute poverty, the world continues to suffer from substantial inequalities. For example, the poorest children are four times less likely than the richest children to be enrolled in primary education across developing countries. Among the estimated 780 million 5 illiterate adults worldwide, nearly two-thirds are women. Poor people face higher risks of malnutrition and death in childhood and lower chances of receiving key healthcare. Such inequalities result in high financial costs, limit economic growth, and generate social and political burdens and barriers. These consequences highlight the importance of directing attention to the problem of 10 inequality. There are other reasons to tackle inequality. Most economies are struggling to recover from the global financial crisis that started in 2008 and the subsequent slowdown in global growth. The goal of eliminating absolute poverty by 2030 might not be achieved without accelerated economic growth or reductions in inequalities within countries, especially in those with large numbers of poor. Generally speaking, 15 poverty can be reduced through higher average growth, a narrowing in inequality, or a combination of the two. Achieving the same poverty reduction during a slowdown in growth therefore requires a more equal income distribution. Some level of inequality is desirable to maintain an appropriate incentive structure in the economy or simply because inequality also reflects different levels of talent and effort 20 among individuals. However, the substantial inequality observed in the world today offers great scope for reducing the gap between rich and poor. Policies to redistribute income from higher-income and wealthy households to those on lower incomes can be achieved without compromising growth, if done effectively. A trade-off between efficiency and fairness is not inevitable. 25 (Source: adapted from https://openknowledge.worldbank.org/ bitstream/handle/10986/25078/9781464809583.pdf)
(d) Assess the view that ‘some level of inequality is desirable to maintain an appropriate incentive structure in the economy’ (Extract B, lines 19 and 20). (10)
June 2018 · Paper 3 · Q1(a) 5 marks AO1=2, AO2=2, AO3=1 Short answer oligopoly
Data and extracts for question 1Branded coffee shops Figure 1: Market share of UK branded coffee shops, 2015, percentages Others Costa Coffee 29% 31% Pret a Manger 5% Morrisons Starbucks 6% 13% Tesco Caffè Nero 7% 9% (Source: http://metro.co.uk/2015/12/14/the-uks-most-popular- coffee-shop-has-been-revealed-5564569/) Figure 2: Number of Starbucks coffee shops worldwide, 2003–2016 Number of coffee shops 30 000 25 085 25 000 23 043 21 366 19 767 20 000 18 066 17 003 16 63516 858 16 680 15 011 15 000 12 440 8 569 10 241 10 000 7 225 5 000 0 2003 2004 2005 2006 2007 2008 2009 2010 2011 2012 2013 2014 2015 2016 (Source: https://www.statista.com/statistics/266465/ number-of-starbucks-stores-worldwide/) Figure 3: Price comparison in selected London coffee retailers, February 2017 Coffee style Starbucks Costa Coffee Caffè Nero Greggs McDonald’s Espresso Double £2.00 £2.00 £1.70 £1.65 £0.99 Latte Medium £2.60 £2.50 £2.50 £1.80 £1.79 Latte Large £2.80 £2.70 £2.80 £2.10 £2.09 (Source: data collected from coffee shops in Holborn, London on 25 February 2017) Extract A Starbucks in Britain – a loss-making business? Coffee shops are among the most profitable parts of the food and drink industry, and few are doing quite as well as Starbucks, a US-based transnational company. Starbucks may be complaining of adverse global market conditions but that did not stop the world’s biggest coffee chain from reporting record annual profits in 2016. It made a profit of 5 almost US$4.2 billion for the year, up 16% on 2015. That was mainly the result of a strong performance in its biggest market, America, where revenue rose 11%. The fastest growth was in the China and Asia Pacific region, with revenue up 23%. Howard Schultz, the CEO of Starbucks, said its Chinese coffee shops were the most efficient and profitable. While Starbucks still makes most of its profit in the US, Mr Schultz has said expansion in China 10 will secure its future for “decades to come” and announced plans to more than double the number of shops in China to 5 000 by 2021. However its British subsidiary, at first glance, appears to be doing less well. It has announced its first ever profit in Britain in 2015 – of just £1 million – despite opening its first coffee shop in the UK in 1998. It now has 849 UK outlets. The main reason why 15 Starbucks has reported persistent losses in the UK is not due to a lack of demand for its coffee, but to minimise its tax bill. It is claimed that some of Starbucks’ revenue earned in the UK is transferred to its Dutch subsidiary, which is charged lower rates of tax. Starbucks is not finding life as easy in Britain as in the USA. It faces competition from home-grown chains such as Costa and Caffè Nero. Accusations of tax avoidance have also 20 damaged Starbucks’ sales to the benefit of its competitors. A survey found that a third less people rated Starbucks as their preferred coffee shop than they did before the tax- avoidance allegations were first published. These issues have forced Starbucks to change its strategy. It has slowed down its expansion plans in the UK and has closed 67 underperforming coffee shops over the past 25 year. It has also tried to repair its reputation by transferring its European headquarters from Amsterdam to London. (Sources: adapted from The Economist 14 February 2015 http://www.economist.com/ news/business-and-finance/21643271-tax and Starbucks company report 2016 and http://s21.q4cdn.com/369030626/files/doc_financials/ 2015/Starbucks-Fiscal-2015_Financial-Highlights.pdf) Extract B Tax on disposable coffee cups? Two and a half billion disposable cups are thrown away every year in the UK, that is, seven million every day. Only one in 400 is recycled. The UK Environment Minister has suggested that a coffee cup tax could work in a similar manner to the plastic bag charge. The 5 pence a bag charge has led to an 85% reduction in the number of bags 5 being given out since October 2015. It is estimated that introducing a tax on disposable coffee cups would cut usage by two billion every year. One environment spokesperson, Kate Parminter, said: “We’ve seen how dramatically a small charge has affected public behaviour when it comes to the plastic bags and it is clearly time to extend it to coffee cups. Most people purchase a tea or coffee and throw away the cup without even 10 thinking about it, but a charge would increase our awareness of the environmental impact.” In response, another MP welcomed her comments but said he did not believe a tax was the solution. He said: “My initial reaction is charging 5p or 10p for the cup will not work. It will not encourage people to take their own cups in if a coffee goes up from £2.60 to 15 £2.65. I suspect a more technological answer is what we need – either the composition of the disposable cups being changed so they’re more easily recyclable, or changing the technology in the recycling.” Disposable coffee cups contain a plastic coating inside the cups which prevent them from becoming soggy, making them difficult to recycle. There are just two specialist 20 facilities in the UK that have the required equipment to separate plastic from paper for recycling. Almost no recycled paper is used in the production of disposable cups, meaning that some 43 000 trees must be cut down annually to keep up with the demand. CO emissions of around 83 000 tonnes are generated every year for their production. 25 (Sources: adapted from http://www.independent.co.uk/news/uk/politics/disposable-coffee- cups-could-be-taxed-like-plastic-bags-environment-minister-says-a6938126.html 05/09/16 and https://www.cchdaily.co.uk/lib-dems-call-5p-plastic-bag-tax-coffee-cups) Extract C German city of Freiburg takes action on cutting the use of disposable coffee cups The ‘Freiburg cup’, made from dishwasher-proof plastic, can be reused hundreds of times. Cups are issued with a one-euro deposit, and can be returned to any of the participating coffee shops in the German city. The cups, which are provided to coffee shops by local councils, are washed in the cafés and bakeries that have signed up to the scheme before 5 being reused. 56 coffee retailers have signed up, and 10 000 cups are being used. One of the main obstacles facing a wider-reaching scheme, however, is the number of café chains in Germany that are unwilling to use unbranded multi-use cups, particularly Starbucks and McDonald’s. Starbucks already offers a discounted coffee for customers with a multi-use cup, but only if it is bearing the unmistakable Starbucks logo. 10 (Source: adapted from http://www.dw.com/en/germanys-love-for-coffee-to-go- leaves-environmental-groups-demanding-action/a-36689719)
(a) With reference to Figure 1, briefly explain the market structure that best describes the UK branded coffee shop market. (5)
June 2018 · Paper 3 · Q1(b) 12 marks AO1=2, AO2=2, AO3=4, AO4=4 12-mark response oligopoly
Data and extracts for question 1Branded coffee shops Figure 1: Market share of UK branded coffee shops, 2015, percentages Others Costa Coffee 29% 31% Pret a Manger 5% Morrisons Starbucks 6% 13% Tesco Caffè Nero 7% 9% (Source: http://metro.co.uk/2015/12/14/the-uks-most-popular- coffee-shop-has-been-revealed-5564569/) Figure 2: Number of Starbucks coffee shops worldwide, 2003–2016 Number of coffee shops 30 000 25 085 25 000 23 043 21 366 19 767 20 000 18 066 17 003 16 63516 858 16 680 15 011 15 000 12 440 8 569 10 241 10 000 7 225 5 000 0 2003 2004 2005 2006 2007 2008 2009 2010 2011 2012 2013 2014 2015 2016 (Source: https://www.statista.com/statistics/266465/ number-of-starbucks-stores-worldwide/) Figure 3: Price comparison in selected London coffee retailers, February 2017 Coffee style Starbucks Costa Coffee Caffè Nero Greggs McDonald’s Espresso Double £2.00 £2.00 £1.70 £1.65 £0.99 Latte Medium £2.60 £2.50 £2.50 £1.80 £1.79 Latte Large £2.80 £2.70 £2.80 £2.10 £2.09 (Source: data collected from coffee shops in Holborn, London on 25 February 2017) Extract A Starbucks in Britain – a loss-making business? Coffee shops are among the most profitable parts of the food and drink industry, and few are doing quite as well as Starbucks, a US-based transnational company. Starbucks may be complaining of adverse global market conditions but that did not stop the world’s biggest coffee chain from reporting record annual profits in 2016. It made a profit of 5 almost US$4.2 billion for the year, up 16% on 2015. That was mainly the result of a strong performance in its biggest market, America, where revenue rose 11%. The fastest growth was in the China and Asia Pacific region, with revenue up 23%. Howard Schultz, the CEO of Starbucks, said its Chinese coffee shops were the most efficient and profitable. While Starbucks still makes most of its profit in the US, Mr Schultz has said expansion in China 10 will secure its future for “decades to come” and announced plans to more than double the number of shops in China to 5 000 by 2021. However its British subsidiary, at first glance, appears to be doing less well. It has announced its first ever profit in Britain in 2015 – of just £1 million – despite opening its first coffee shop in the UK in 1998. It now has 849 UK outlets. The main reason why 15 Starbucks has reported persistent losses in the UK is not due to a lack of demand for its coffee, but to minimise its tax bill. It is claimed that some of Starbucks’ revenue earned in the UK is transferred to its Dutch subsidiary, which is charged lower rates of tax. Starbucks is not finding life as easy in Britain as in the USA. It faces competition from home-grown chains such as Costa and Caffè Nero. Accusations of tax avoidance have also 20 damaged Starbucks’ sales to the benefit of its competitors. A survey found that a third less people rated Starbucks as their preferred coffee shop than they did before the tax- avoidance allegations were first published. These issues have forced Starbucks to change its strategy. It has slowed down its expansion plans in the UK and has closed 67 underperforming coffee shops over the past 25 year. It has also tried to repair its reputation by transferring its European headquarters from Amsterdam to London. (Sources: adapted from The Economist 14 February 2015 http://www.economist.com/ news/business-and-finance/21643271-tax and Starbucks company report 2016 and http://s21.q4cdn.com/369030626/files/doc_financials/ 2015/Starbucks-Fiscal-2015_Financial-Highlights.pdf) Extract B Tax on disposable coffee cups? Two and a half billion disposable cups are thrown away every year in the UK, that is, seven million every day. Only one in 400 is recycled. The UK Environment Minister has suggested that a coffee cup tax could work in a similar manner to the plastic bag charge. The 5 pence a bag charge has led to an 85% reduction in the number of bags 5 being given out since October 2015. It is estimated that introducing a tax on disposable coffee cups would cut usage by two billion every year. One environment spokesperson, Kate Parminter, said: “We’ve seen how dramatically a small charge has affected public behaviour when it comes to the plastic bags and it is clearly time to extend it to coffee cups. Most people purchase a tea or coffee and throw away the cup without even 10 thinking about it, but a charge would increase our awareness of the environmental impact.” In response, another MP welcomed her comments but said he did not believe a tax was the solution. He said: “My initial reaction is charging 5p or 10p for the cup will not work. It will not encourage people to take their own cups in if a coffee goes up from £2.60 to 15 £2.65. I suspect a more technological answer is what we need – either the composition of the disposable cups being changed so they’re more easily recyclable, or changing the technology in the recycling.” Disposable coffee cups contain a plastic coating inside the cups which prevent them from becoming soggy, making them difficult to recycle. There are just two specialist 20 facilities in the UK that have the required equipment to separate plastic from paper for recycling. Almost no recycled paper is used in the production of disposable cups, meaning that some 43 000 trees must be cut down annually to keep up with the demand. CO emissions of around 83 000 tonnes are generated every year for their production. 25 (Sources: adapted from http://www.independent.co.uk/news/uk/politics/disposable-coffee- cups-could-be-taxed-like-plastic-bags-environment-minister-says-a6938126.html 05/09/16 and https://www.cchdaily.co.uk/lib-dems-call-5p-plastic-bag-tax-coffee-cups) Extract C German city of Freiburg takes action on cutting the use of disposable coffee cups The ‘Freiburg cup’, made from dishwasher-proof plastic, can be reused hundreds of times. Cups are issued with a one-euro deposit, and can be returned to any of the participating coffee shops in the German city. The cups, which are provided to coffee shops by local councils, are washed in the cafés and bakeries that have signed up to the scheme before 5 being reused. 56 coffee retailers have signed up, and 10 000 cups are being used. One of the main obstacles facing a wider-reaching scheme, however, is the number of café chains in Germany that are unwilling to use unbranded multi-use cups, particularly Starbucks and McDonald’s. Starbucks already offers a discounted coffee for customers with a multi-use cup, but only if it is bearing the unmistakable Starbucks logo. 10 (Source: adapted from http://www.dw.com/en/germanys-love-for-coffee-to-go- leaves-environmental-groups-demanding-action/a-36689719)
(b) With reference to Figure 3 and other information provided, discuss the price and non-price strategies that Starbucks may use to increase profitability. (12)
June 2018 · Paper 3 · Q1(c) 8 marks AO1=2, AO2=2, AO3=2, AO4=2 8-mark response government intervention in marketsexternalities
Data and extracts for question 1Branded coffee shops Figure 1: Market share of UK branded coffee shops, 2015, percentages Others Costa Coffee 29% 31% Pret a Manger 5% Morrisons Starbucks 6% 13% Tesco Caffè Nero 7% 9% (Source: http://metro.co.uk/2015/12/14/the-uks-most-popular- coffee-shop-has-been-revealed-5564569/) Figure 2: Number of Starbucks coffee shops worldwide, 2003–2016 Number of coffee shops 30 000 25 085 25 000 23 043 21 366 19 767 20 000 18 066 17 003 16 63516 858 16 680 15 011 15 000 12 440 8 569 10 241 10 000 7 225 5 000 0 2003 2004 2005 2006 2007 2008 2009 2010 2011 2012 2013 2014 2015 2016 (Source: https://www.statista.com/statistics/266465/ number-of-starbucks-stores-worldwide/) Figure 3: Price comparison in selected London coffee retailers, February 2017 Coffee style Starbucks Costa Coffee Caffè Nero Greggs McDonald’s Espresso Double £2.00 £2.00 £1.70 £1.65 £0.99 Latte Medium £2.60 £2.50 £2.50 £1.80 £1.79 Latte Large £2.80 £2.70 £2.80 £2.10 £2.09 (Source: data collected from coffee shops in Holborn, London on 25 February 2017) Extract A Starbucks in Britain – a loss-making business? Coffee shops are among the most profitable parts of the food and drink industry, and few are doing quite as well as Starbucks, a US-based transnational company. Starbucks may be complaining of adverse global market conditions but that did not stop the world’s biggest coffee chain from reporting record annual profits in 2016. It made a profit of 5 almost US$4.2 billion for the year, up 16% on 2015. That was mainly the result of a strong performance in its biggest market, America, where revenue rose 11%. The fastest growth was in the China and Asia Pacific region, with revenue up 23%. Howard Schultz, the CEO of Starbucks, said its Chinese coffee shops were the most efficient and profitable. While Starbucks still makes most of its profit in the US, Mr Schultz has said expansion in China 10 will secure its future for “decades to come” and announced plans to more than double the number of shops in China to 5 000 by 2021. However its British subsidiary, at first glance, appears to be doing less well. It has announced its first ever profit in Britain in 2015 – of just £1 million – despite opening its first coffee shop in the UK in 1998. It now has 849 UK outlets. The main reason why 15 Starbucks has reported persistent losses in the UK is not due to a lack of demand for its coffee, but to minimise its tax bill. It is claimed that some of Starbucks’ revenue earned in the UK is transferred to its Dutch subsidiary, which is charged lower rates of tax. Starbucks is not finding life as easy in Britain as in the USA. It faces competition from home-grown chains such as Costa and Caffè Nero. Accusations of tax avoidance have also 20 damaged Starbucks’ sales to the benefit of its competitors. A survey found that a third less people rated Starbucks as their preferred coffee shop than they did before the tax- avoidance allegations were first published. These issues have forced Starbucks to change its strategy. It has slowed down its expansion plans in the UK and has closed 67 underperforming coffee shops over the past 25 year. It has also tried to repair its reputation by transferring its European headquarters from Amsterdam to London. (Sources: adapted from The Economist 14 February 2015 http://www.economist.com/ news/business-and-finance/21643271-tax and Starbucks company report 2016 and http://s21.q4cdn.com/369030626/files/doc_financials/ 2015/Starbucks-Fiscal-2015_Financial-Highlights.pdf) Extract B Tax on disposable coffee cups? Two and a half billion disposable cups are thrown away every year in the UK, that is, seven million every day. Only one in 400 is recycled. The UK Environment Minister has suggested that a coffee cup tax could work in a similar manner to the plastic bag charge. The 5 pence a bag charge has led to an 85% reduction in the number of bags 5 being given out since October 2015. It is estimated that introducing a tax on disposable coffee cups would cut usage by two billion every year. One environment spokesperson, Kate Parminter, said: “We’ve seen how dramatically a small charge has affected public behaviour when it comes to the plastic bags and it is clearly time to extend it to coffee cups. Most people purchase a tea or coffee and throw away the cup without even 10 thinking about it, but a charge would increase our awareness of the environmental impact.” In response, another MP welcomed her comments but said he did not believe a tax was the solution. He said: “My initial reaction is charging 5p or 10p for the cup will not work. It will not encourage people to take their own cups in if a coffee goes up from £2.60 to 15 £2.65. I suspect a more technological answer is what we need – either the composition of the disposable cups being changed so they’re more easily recyclable, or changing the technology in the recycling.” Disposable coffee cups contain a plastic coating inside the cups which prevent them from becoming soggy, making them difficult to recycle. There are just two specialist 20 facilities in the UK that have the required equipment to separate plastic from paper for recycling. Almost no recycled paper is used in the production of disposable cups, meaning that some 43 000 trees must be cut down annually to keep up with the demand. CO emissions of around 83 000 tonnes are generated every year for their production. 25 (Sources: adapted from http://www.independent.co.uk/news/uk/politics/disposable-coffee- cups-could-be-taxed-like-plastic-bags-environment-minister-says-a6938126.html 05/09/16 and https://www.cchdaily.co.uk/lib-dems-call-5p-plastic-bag-tax-coffee-cups) Extract C German city of Freiburg takes action on cutting the use of disposable coffee cups The ‘Freiburg cup’, made from dishwasher-proof plastic, can be reused hundreds of times. Cups are issued with a one-euro deposit, and can be returned to any of the participating coffee shops in the German city. The cups, which are provided to coffee shops by local councils, are washed in the cafés and bakeries that have signed up to the scheme before 5 being reused. 56 coffee retailers have signed up, and 10 000 cups are being used. One of the main obstacles facing a wider-reaching scheme, however, is the number of café chains in Germany that are unwilling to use unbranded multi-use cups, particularly Starbucks and McDonald’s. Starbucks already offers a discounted coffee for customers with a multi-use cup, but only if it is bearing the unmistakable Starbucks logo. 10 (Source: adapted from http://www.dw.com/en/germanys-love-for-coffee-to-go- leaves-environmental-groups-demanding-action/a-36689719)
(c) Examine the advantages of using an indirect tax as a means of reducing the use of disposable coffee cups. (8)
June 2018 · Paper 3 · Q1(d) 25 marks AO1=4, AO2=4, AO3=8, AO4=9 25-mark essay Either/or business growth and objectivesglobalisation and trade
Data and extracts for question 1Branded coffee shops Figure 1: Market share of UK branded coffee shops, 2015, percentages Others Costa Coffee 29% 31% Pret a Manger 5% Morrisons Starbucks 6% 13% Tesco Caffè Nero 7% 9% (Source: http://metro.co.uk/2015/12/14/the-uks-most-popular- coffee-shop-has-been-revealed-5564569/) Figure 2: Number of Starbucks coffee shops worldwide, 2003–2016 Number of coffee shops 30 000 25 085 25 000 23 043 21 366 19 767 20 000 18 066 17 003 16 63516 858 16 680 15 011 15 000 12 440 8 569 10 241 10 000 7 225 5 000 0 2003 2004 2005 2006 2007 2008 2009 2010 2011 2012 2013 2014 2015 2016 (Source: https://www.statista.com/statistics/266465/ number-of-starbucks-stores-worldwide/) Figure 3: Price comparison in selected London coffee retailers, February 2017 Coffee style Starbucks Costa Coffee Caffè Nero Greggs McDonald’s Espresso Double £2.00 £2.00 £1.70 £1.65 £0.99 Latte Medium £2.60 £2.50 £2.50 £1.80 £1.79 Latte Large £2.80 £2.70 £2.80 £2.10 £2.09 (Source: data collected from coffee shops in Holborn, London on 25 February 2017) Extract A Starbucks in Britain – a loss-making business? Coffee shops are among the most profitable parts of the food and drink industry, and few are doing quite as well as Starbucks, a US-based transnational company. Starbucks may be complaining of adverse global market conditions but that did not stop the world’s biggest coffee chain from reporting record annual profits in 2016. It made a profit of 5 almost US$4.2 billion for the year, up 16% on 2015. That was mainly the result of a strong performance in its biggest market, America, where revenue rose 11%. The fastest growth was in the China and Asia Pacific region, with revenue up 23%. Howard Schultz, the CEO of Starbucks, said its Chinese coffee shops were the most efficient and profitable. While Starbucks still makes most of its profit in the US, Mr Schultz has said expansion in China 10 will secure its future for “decades to come” and announced plans to more than double the number of shops in China to 5 000 by 2021. However its British subsidiary, at first glance, appears to be doing less well. It has announced its first ever profit in Britain in 2015 – of just £1 million – despite opening its first coffee shop in the UK in 1998. It now has 849 UK outlets. The main reason why 15 Starbucks has reported persistent losses in the UK is not due to a lack of demand for its coffee, but to minimise its tax bill. It is claimed that some of Starbucks’ revenue earned in the UK is transferred to its Dutch subsidiary, which is charged lower rates of tax. Starbucks is not finding life as easy in Britain as in the USA. It faces competition from home-grown chains such as Costa and Caffè Nero. Accusations of tax avoidance have also 20 damaged Starbucks’ sales to the benefit of its competitors. A survey found that a third less people rated Starbucks as their preferred coffee shop than they did before the tax- avoidance allegations were first published. These issues have forced Starbucks to change its strategy. It has slowed down its expansion plans in the UK and has closed 67 underperforming coffee shops over the past 25 year. It has also tried to repair its reputation by transferring its European headquarters from Amsterdam to London. (Sources: adapted from The Economist 14 February 2015 http://www.economist.com/ news/business-and-finance/21643271-tax and Starbucks company report 2016 and http://s21.q4cdn.com/369030626/files/doc_financials/ 2015/Starbucks-Fiscal-2015_Financial-Highlights.pdf) Extract B Tax on disposable coffee cups? Two and a half billion disposable cups are thrown away every year in the UK, that is, seven million every day. Only one in 400 is recycled. The UK Environment Minister has suggested that a coffee cup tax could work in a similar manner to the plastic bag charge. The 5 pence a bag charge has led to an 85% reduction in the number of bags 5 being given out since October 2015. It is estimated that introducing a tax on disposable coffee cups would cut usage by two billion every year. One environment spokesperson, Kate Parminter, said: “We’ve seen how dramatically a small charge has affected public behaviour when it comes to the plastic bags and it is clearly time to extend it to coffee cups. Most people purchase a tea or coffee and throw away the cup without even 10 thinking about it, but a charge would increase our awareness of the environmental impact.” In response, another MP welcomed her comments but said he did not believe a tax was the solution. He said: “My initial reaction is charging 5p or 10p for the cup will not work. It will not encourage people to take their own cups in if a coffee goes up from £2.60 to 15 £2.65. I suspect a more technological answer is what we need – either the composition of the disposable cups being changed so they’re more easily recyclable, or changing the technology in the recycling.” Disposable coffee cups contain a plastic coating inside the cups which prevent them from becoming soggy, making them difficult to recycle. There are just two specialist 20 facilities in the UK that have the required equipment to separate plastic from paper for recycling. Almost no recycled paper is used in the production of disposable cups, meaning that some 43 000 trees must be cut down annually to keep up with the demand. CO emissions of around 83 000 tonnes are generated every year for their production. 25 (Sources: adapted from http://www.independent.co.uk/news/uk/politics/disposable-coffee- cups-could-be-taxed-like-plastic-bags-environment-minister-says-a6938126.html 05/09/16 and https://www.cchdaily.co.uk/lib-dems-call-5p-plastic-bag-tax-coffee-cups) Extract C German city of Freiburg takes action on cutting the use of disposable coffee cups The ‘Freiburg cup’, made from dishwasher-proof plastic, can be reused hundreds of times. Cups are issued with a one-euro deposit, and can be returned to any of the participating coffee shops in the German city. The cups, which are provided to coffee shops by local councils, are washed in the cafés and bakeries that have signed up to the scheme before 5 being reused. 56 coffee retailers have signed up, and 10 000 cups are being used. One of the main obstacles facing a wider-reaching scheme, however, is the number of café chains in Germany that are unwilling to use unbranded multi-use cups, particularly Starbucks and McDonald’s. Starbucks already offers a discounted coffee for customers with a multi-use cup, but only if it is bearing the unmistakable Starbucks logo. 10 (Source: adapted from http://www.dw.com/en/germanys-love-for-coffee-to-go- leaves-environmental-groups-demanding-action/a-36689719)
(d) Evaluate the microeconomic and macroeconomic factors that may influence Starbucks’ decision whether to expand in a particular country. (25)
June 2018 · Paper 3 · Q1(e) 25 marks AO1=4, AO2=4, AO3=8, AO4=9 25-mark essay Either/or supply and demandnational income and the multiplier
Data and extracts for question 1Branded coffee shops Figure 1: Market share of UK branded coffee shops, 2015, percentages Others Costa Coffee 29% 31% Pret a Manger 5% Morrisons Starbucks 6% 13% Tesco Caffè Nero 7% 9% (Source: http://metro.co.uk/2015/12/14/the-uks-most-popular- coffee-shop-has-been-revealed-5564569/) Figure 2: Number of Starbucks coffee shops worldwide, 2003–2016 Number of coffee shops 30 000 25 085 25 000 23 043 21 366 19 767 20 000 18 066 17 003 16 63516 858 16 680 15 011 15 000 12 440 8 569 10 241 10 000 7 225 5 000 0 2003 2004 2005 2006 2007 2008 2009 2010 2011 2012 2013 2014 2015 2016 (Source: https://www.statista.com/statistics/266465/ number-of-starbucks-stores-worldwide/) Figure 3: Price comparison in selected London coffee retailers, February 2017 Coffee style Starbucks Costa Coffee Caffè Nero Greggs McDonald’s Espresso Double £2.00 £2.00 £1.70 £1.65 £0.99 Latte Medium £2.60 £2.50 £2.50 £1.80 £1.79 Latte Large £2.80 £2.70 £2.80 £2.10 £2.09 (Source: data collected from coffee shops in Holborn, London on 25 February 2017) Extract A Starbucks in Britain – a loss-making business? Coffee shops are among the most profitable parts of the food and drink industry, and few are doing quite as well as Starbucks, a US-based transnational company. Starbucks may be complaining of adverse global market conditions but that did not stop the world’s biggest coffee chain from reporting record annual profits in 2016. It made a profit of 5 almost US$4.2 billion for the year, up 16% on 2015. That was mainly the result of a strong performance in its biggest market, America, where revenue rose 11%. The fastest growth was in the China and Asia Pacific region, with revenue up 23%. Howard Schultz, the CEO of Starbucks, said its Chinese coffee shops were the most efficient and profitable. While Starbucks still makes most of its profit in the US, Mr Schultz has said expansion in China 10 will secure its future for “decades to come” and announced plans to more than double the number of shops in China to 5 000 by 2021. However its British subsidiary, at first glance, appears to be doing less well. It has announced its first ever profit in Britain in 2015 – of just £1 million – despite opening its first coffee shop in the UK in 1998. It now has 849 UK outlets. The main reason why 15 Starbucks has reported persistent losses in the UK is not due to a lack of demand for its coffee, but to minimise its tax bill. It is claimed that some of Starbucks’ revenue earned in the UK is transferred to its Dutch subsidiary, which is charged lower rates of tax. Starbucks is not finding life as easy in Britain as in the USA. It faces competition from home-grown chains such as Costa and Caffè Nero. Accusations of tax avoidance have also 20 damaged Starbucks’ sales to the benefit of its competitors. A survey found that a third less people rated Starbucks as their preferred coffee shop than they did before the tax- avoidance allegations were first published. These issues have forced Starbucks to change its strategy. It has slowed down its expansion plans in the UK and has closed 67 underperforming coffee shops over the past 25 year. It has also tried to repair its reputation by transferring its European headquarters from Amsterdam to London. (Sources: adapted from The Economist 14 February 2015 http://www.economist.com/ news/business-and-finance/21643271-tax and Starbucks company report 2016 and http://s21.q4cdn.com/369030626/files/doc_financials/ 2015/Starbucks-Fiscal-2015_Financial-Highlights.pdf) Extract B Tax on disposable coffee cups? Two and a half billion disposable cups are thrown away every year in the UK, that is, seven million every day. Only one in 400 is recycled. The UK Environment Minister has suggested that a coffee cup tax could work in a similar manner to the plastic bag charge. The 5 pence a bag charge has led to an 85% reduction in the number of bags 5 being given out since October 2015. It is estimated that introducing a tax on disposable coffee cups would cut usage by two billion every year. One environment spokesperson, Kate Parminter, said: “We’ve seen how dramatically a small charge has affected public behaviour when it comes to the plastic bags and it is clearly time to extend it to coffee cups. Most people purchase a tea or coffee and throw away the cup without even 10 thinking about it, but a charge would increase our awareness of the environmental impact.” In response, another MP welcomed her comments but said he did not believe a tax was the solution. He said: “My initial reaction is charging 5p or 10p for the cup will not work. It will not encourage people to take their own cups in if a coffee goes up from £2.60 to 15 £2.65. I suspect a more technological answer is what we need – either the composition of the disposable cups being changed so they’re more easily recyclable, or changing the technology in the recycling.” Disposable coffee cups contain a plastic coating inside the cups which prevent them from becoming soggy, making them difficult to recycle. There are just two specialist 20 facilities in the UK that have the required equipment to separate plastic from paper for recycling. Almost no recycled paper is used in the production of disposable cups, meaning that some 43 000 trees must be cut down annually to keep up with the demand. CO emissions of around 83 000 tonnes are generated every year for their production. 25 (Sources: adapted from http://www.independent.co.uk/news/uk/politics/disposable-coffee- cups-could-be-taxed-like-plastic-bags-environment-minister-says-a6938126.html 05/09/16 and https://www.cchdaily.co.uk/lib-dems-call-5p-plastic-bag-tax-coffee-cups) Extract C German city of Freiburg takes action on cutting the use of disposable coffee cups The ‘Freiburg cup’, made from dishwasher-proof plastic, can be reused hundreds of times. Cups are issued with a one-euro deposit, and can be returned to any of the participating coffee shops in the German city. The cups, which are provided to coffee shops by local councils, are washed in the cafés and bakeries that have signed up to the scheme before 5 being reused. 56 coffee retailers have signed up, and 10 000 cups are being used. One of the main obstacles facing a wider-reaching scheme, however, is the number of café chains in Germany that are unwilling to use unbranded multi-use cups, particularly Starbucks and McDonald’s. Starbucks already offers a discounted coffee for customers with a multi-use cup, but only if it is bearing the unmistakable Starbucks logo. 10 (Source: adapted from http://www.dw.com/en/germanys-love-for-coffee-to-go- leaves-environmental-groups-demanding-action/a-36689719)
(e) With reference to the information provided and your own knowledge, evaluate the microeconomic and macroeconomic effects of increased UK demand for coffee at branded coffee shops. (25)
June 2018 · Paper 3 · Q2(a) 5 marks AO1=2, AO2=2, AO3=1 Short answer globalisation and trade
Data and extracts for question 2Indonesia Figure 4: World coal prices, 2006–2016, US dollars per tonne 250 200 150 $ per tonne 100 50 0 2006 08 10 12 14 16 (Source: http://www.economist.com/news/world-week/21697025-business-week) Figure 5: Indonesia’s real GDP, annual percentage change 10 5 + % 0 change – in GDP 5 10 15 2006 08 10 12 14 16 (Source: http://www.economist.com/news/world-week/21697025-business-week) Extract D Indonesia’s economic outlook The Indonesian economy is expected to grow by an average of 4.8% a year between 2017 and 2021. Joko Widodo, president of Indonesia since 2014, is increasingly confident in his role and now has enough political support to pass some of his desired supply-side reforms. His government has been aggressively trying to improve the business and investment 5 environment by easing regulations and offering tax incentives, for example to firms investing in special economic zones. Indonesia receives US$2.3 billion a year in overseas development aid, which is mainly spent on education and healthcare. There is also ongoing aid from international institutions and non-government organisations paying for restructuring after the 2004 10 Indian Ocean earthquake and tsunami, which led to the loss of over 170 000 lives and much damage to economic livelihood. Aid agencies have supported the Indonesian government in providing healthcare free at the point of access for 88 million of the poorest people, free schooling for 12 years for each child, and tertiary education for students accepted into university. There is a scheme to provide each of Indonesia’s 15 15.5 million poorest households with a cash transfer of 200 000 rupiah (US$14.37) a month. The World Bank has approved US$800 million in infrastructure loans to Indonesia, with another US$950 million as conditional loans. The Asian Development Bank has committed itself to lending US$2 billion. In December Japan’s development agency lent Indonesia US$535 million to construct two power stations. 20 (Sources: adapted from http://country.eiu.com/Indonesia and http://www.economist.com/ news/special-report/21693404-after-decades-underinvestment- infrastructure-spending-picking-up-last) Extract E Indonesia’s economic policies as commodity prices collapse Indonesia is the world’s fourth largest exporter of coal and the raw material accounts for 11% of its exports. Its other main exports are crude oil, palm oil, rubber and tin. Its main commodity exports tripled in value between 2000 and 2010, and as exports boomed, so did the economy. But the value of commodity exports has fallen by more than half from 5 its peak. Coal now sells for just US$50 per tonne, against US$125 in 2011. In the decade to 2014, Indonesia’s real GDP grew by an annual average of 6%, but the collapse in commodity prices has slowed the economy. In 2015 growth was 4.8%, the slowest rate since 2009. But compared with many other commodity exporters, Indonesia is getting off lightly. 10 The value of the rupiah, Indonesia’s currency, against the US dollar has fallen by 30% since 2013, but has since stabilised. Other emerging market currencies have depreciated even more steeply over that period. Despite the weak exchange rate, Indonesia’s inflation rate has mostly remained within the central bank’s target range of 3-5%. The main impact of the rupiah’s fall has been to curb imports, helping limit Indonesia’s current account 15 deficit to around 2% of GDP despite weaker export earnings. A cautious fiscal policy during the boom years has allowed for a modest fiscal expansion to offset the effects of weak exports and investment. The national debt is just 26% of GDP. Mr Widodo knows that Indonesia cannot raise its long-term growth rate if the economy remains reliant on coal. It needs a broader range of manufacturing and service industries. 20 If new enterprise is to flourish, Indonesia must support local entrepreneurship. The labour market is inflexible. To start a business takes an average of 47 days, compared with four in Malaysia and two in Singapore. The President’s supply-side policies are improving the business climate. The average number of days needed to approve a new power plant has declined from 900 to 200. The government recently revised its “negative investment 25 list” of sectors in which foreign ownership is banned or restricted, fully opening up the rubber, film and restaurant sectors, among others. In 2015 he launched a series of measures to try to reduce government failure, including easing some regulations, streamlining licensing procedures for firms on industrial estates and providing tax incentives to invest in special economic zones. 30 The government has used savings from cutting fuel subsidies, worth over 4% of GDP, to fund extra capital spending. But the budget deficit still widened to 2.8% of GDP, very close to the legal limit of 3%. If public expenditure is to increase further, the government will need to raise more revenue. That will not be easy. Most workers and employers pay little or no tax. Only 27 million of Indonesia’s 255 million people are registered taxpayers, 35 and in 2014 just 900 000 of them paid what they owed, leaving it with a tax revenue to GDP ratio of around 10%. Big companies say that they are being squeezed harder by the tax authorities because they are an easier target. Infrastructure spending will help bring foreign investment and good jobs to Indonesia as well as encouraging exports. Indonesia’s infrastructure problem can be summed up 40 as too few roads and congested ports. In the short term, infrastructure spending puts people to work and boosts demand for raw materials. In the longer term this spending offers the chance to make up for decades of neglect and underinvestment. Indonesia has plans for 65 dams, 16 of which are already under construction. In 2015 work started on the Keureuto Dam, designed to boost agricultural productivity in Aceh. Recently fields 45 were flooded for the massive Jatigede Dam in West Java, after 20 years of delays. Once complete, the dam will irrigate 90 000 hectares of rice paddy, increasing efficiency by giving farmers two harvests a year instead of one. (Sources: adapted from http://www.economist.com/news/special-report/21693405- secure-growth-it-needs-indonesia-must-resist-its-protectionist-urges-roll- out and http://www.economist.com/news/special-report/21693404-after- decades-underinvestment-infrastructure-spending-picking-up-last)
(a) Using the data in Figure 4 and other information provided, explain the likely change to Indonesia’s terms of trade since 2011. (5)
June 2018 · Paper 3 · Q2(b) 8 marks AO1=2, AO2=2, AO3=2, AO4=2 8-mark response Hard revenues costs and profits
Data and extracts for question 2Indonesia Figure 4: World coal prices, 2006–2016, US dollars per tonne 250 200 150 $ per tonne 100 50 0 2006 08 10 12 14 16 (Source: http://www.economist.com/news/world-week/21697025-business-week) Figure 5: Indonesia’s real GDP, annual percentage change 10 5 + % 0 change – in GDP 5 10 15 2006 08 10 12 14 16 (Source: http://www.economist.com/news/world-week/21697025-business-week) Extract D Indonesia’s economic outlook The Indonesian economy is expected to grow by an average of 4.8% a year between 2017 and 2021. Joko Widodo, president of Indonesia since 2014, is increasingly confident in his role and now has enough political support to pass some of his desired supply-side reforms. His government has been aggressively trying to improve the business and investment 5 environment by easing regulations and offering tax incentives, for example to firms investing in special economic zones. Indonesia receives US$2.3 billion a year in overseas development aid, which is mainly spent on education and healthcare. There is also ongoing aid from international institutions and non-government organisations paying for restructuring after the 2004 10 Indian Ocean earthquake and tsunami, which led to the loss of over 170 000 lives and much damage to economic livelihood. Aid agencies have supported the Indonesian government in providing healthcare free at the point of access for 88 million of the poorest people, free schooling for 12 years for each child, and tertiary education for students accepted into university. There is a scheme to provide each of Indonesia’s 15 15.5 million poorest households with a cash transfer of 200 000 rupiah (US$14.37) a month. The World Bank has approved US$800 million in infrastructure loans to Indonesia, with another US$950 million as conditional loans. The Asian Development Bank has committed itself to lending US$2 billion. In December Japan’s development agency lent Indonesia US$535 million to construct two power stations. 20 (Sources: adapted from http://country.eiu.com/Indonesia and http://www.economist.com/ news/special-report/21693404-after-decades-underinvestment- infrastructure-spending-picking-up-last) Extract E Indonesia’s economic policies as commodity prices collapse Indonesia is the world’s fourth largest exporter of coal and the raw material accounts for 11% of its exports. Its other main exports are crude oil, palm oil, rubber and tin. Its main commodity exports tripled in value between 2000 and 2010, and as exports boomed, so did the economy. But the value of commodity exports has fallen by more than half from 5 its peak. Coal now sells for just US$50 per tonne, against US$125 in 2011. In the decade to 2014, Indonesia’s real GDP grew by an annual average of 6%, but the collapse in commodity prices has slowed the economy. In 2015 growth was 4.8%, the slowest rate since 2009. But compared with many other commodity exporters, Indonesia is getting off lightly. 10 The value of the rupiah, Indonesia’s currency, against the US dollar has fallen by 30% since 2013, but has since stabilised. Other emerging market currencies have depreciated even more steeply over that period. Despite the weak exchange rate, Indonesia’s inflation rate has mostly remained within the central bank’s target range of 3-5%. The main impact of the rupiah’s fall has been to curb imports, helping limit Indonesia’s current account 15 deficit to around 2% of GDP despite weaker export earnings. A cautious fiscal policy during the boom years has allowed for a modest fiscal expansion to offset the effects of weak exports and investment. The national debt is just 26% of GDP. Mr Widodo knows that Indonesia cannot raise its long-term growth rate if the economy remains reliant on coal. It needs a broader range of manufacturing and service industries. 20 If new enterprise is to flourish, Indonesia must support local entrepreneurship. The labour market is inflexible. To start a business takes an average of 47 days, compared with four in Malaysia and two in Singapore. The President’s supply-side policies are improving the business climate. The average number of days needed to approve a new power plant has declined from 900 to 200. The government recently revised its “negative investment 25 list” of sectors in which foreign ownership is banned or restricted, fully opening up the rubber, film and restaurant sectors, among others. In 2015 he launched a series of measures to try to reduce government failure, including easing some regulations, streamlining licensing procedures for firms on industrial estates and providing tax incentives to invest in special economic zones. 30 The government has used savings from cutting fuel subsidies, worth over 4% of GDP, to fund extra capital spending. But the budget deficit still widened to 2.8% of GDP, very close to the legal limit of 3%. If public expenditure is to increase further, the government will need to raise more revenue. That will not be easy. Most workers and employers pay little or no tax. Only 27 million of Indonesia’s 255 million people are registered taxpayers, 35 and in 2014 just 900 000 of them paid what they owed, leaving it with a tax revenue to GDP ratio of around 10%. Big companies say that they are being squeezed harder by the tax authorities because they are an easier target. Infrastructure spending will help bring foreign investment and good jobs to Indonesia as well as encouraging exports. Indonesia’s infrastructure problem can be summed up 40 as too few roads and congested ports. In the short term, infrastructure spending puts people to work and boosts demand for raw materials. In the longer term this spending offers the chance to make up for decades of neglect and underinvestment. Indonesia has plans for 65 dams, 16 of which are already under construction. In 2015 work started on the Keureuto Dam, designed to boost agricultural productivity in Aceh. Recently fields 45 were flooded for the massive Jatigede Dam in West Java, after 20 years of delays. Once complete, the dam will irrigate 90 000 hectares of rice paddy, increasing efficiency by giving farmers two harvests a year instead of one. (Sources: adapted from http://www.economist.com/news/special-report/21693405- secure-growth-it-needs-indonesia-must-resist-its-protectionist-urges-roll- out and http://www.economist.com/news/special-report/21693404-after- decades-underinvestment-infrastructure-spending-picking-up-last)
(b) Examine the likely effects on the profitability of Indonesian rice farmers of the government’s increased investment in dams (Extract E, lines 43-48). Use a cost and revenue diagram to support your answer. (8)
June 2018 · Paper 3 · Q2(c) 12 marks AO1=2, AO2=2, AO3=4, AO4=4 12-mark response emerging and developing economies
Data and extracts for question 2Indonesia Figure 4: World coal prices, 2006–2016, US dollars per tonne 250 200 150 $ per tonne 100 50 0 2006 08 10 12 14 16 (Source: http://www.economist.com/news/world-week/21697025-business-week) Figure 5: Indonesia’s real GDP, annual percentage change 10 5 + % 0 change – in GDP 5 10 15 2006 08 10 12 14 16 (Source: http://www.economist.com/news/world-week/21697025-business-week) Extract D Indonesia’s economic outlook The Indonesian economy is expected to grow by an average of 4.8% a year between 2017 and 2021. Joko Widodo, president of Indonesia since 2014, is increasingly confident in his role and now has enough political support to pass some of his desired supply-side reforms. His government has been aggressively trying to improve the business and investment 5 environment by easing regulations and offering tax incentives, for example to firms investing in special economic zones. Indonesia receives US$2.3 billion a year in overseas development aid, which is mainly spent on education and healthcare. There is also ongoing aid from international institutions and non-government organisations paying for restructuring after the 2004 10 Indian Ocean earthquake and tsunami, which led to the loss of over 170 000 lives and much damage to economic livelihood. Aid agencies have supported the Indonesian government in providing healthcare free at the point of access for 88 million of the poorest people, free schooling for 12 years for each child, and tertiary education for students accepted into university. There is a scheme to provide each of Indonesia’s 15 15.5 million poorest households with a cash transfer of 200 000 rupiah (US$14.37) a month. The World Bank has approved US$800 million in infrastructure loans to Indonesia, with another US$950 million as conditional loans. The Asian Development Bank has committed itself to lending US$2 billion. In December Japan’s development agency lent Indonesia US$535 million to construct two power stations. 20 (Sources: adapted from http://country.eiu.com/Indonesia and http://www.economist.com/ news/special-report/21693404-after-decades-underinvestment- infrastructure-spending-picking-up-last) Extract E Indonesia’s economic policies as commodity prices collapse Indonesia is the world’s fourth largest exporter of coal and the raw material accounts for 11% of its exports. Its other main exports are crude oil, palm oil, rubber and tin. Its main commodity exports tripled in value between 2000 and 2010, and as exports boomed, so did the economy. But the value of commodity exports has fallen by more than half from 5 its peak. Coal now sells for just US$50 per tonne, against US$125 in 2011. In the decade to 2014, Indonesia’s real GDP grew by an annual average of 6%, but the collapse in commodity prices has slowed the economy. In 2015 growth was 4.8%, the slowest rate since 2009. But compared with many other commodity exporters, Indonesia is getting off lightly. 10 The value of the rupiah, Indonesia’s currency, against the US dollar has fallen by 30% since 2013, but has since stabilised. Other emerging market currencies have depreciated even more steeply over that period. Despite the weak exchange rate, Indonesia’s inflation rate has mostly remained within the central bank’s target range of 3-5%. The main impact of the rupiah’s fall has been to curb imports, helping limit Indonesia’s current account 15 deficit to around 2% of GDP despite weaker export earnings. A cautious fiscal policy during the boom years has allowed for a modest fiscal expansion to offset the effects of weak exports and investment. The national debt is just 26% of GDP. Mr Widodo knows that Indonesia cannot raise its long-term growth rate if the economy remains reliant on coal. It needs a broader range of manufacturing and service industries. 20 If new enterprise is to flourish, Indonesia must support local entrepreneurship. The labour market is inflexible. To start a business takes an average of 47 days, compared with four in Malaysia and two in Singapore. The President’s supply-side policies are improving the business climate. The average number of days needed to approve a new power plant has declined from 900 to 200. The government recently revised its “negative investment 25 list” of sectors in which foreign ownership is banned or restricted, fully opening up the rubber, film and restaurant sectors, among others. In 2015 he launched a series of measures to try to reduce government failure, including easing some regulations, streamlining licensing procedures for firms on industrial estates and providing tax incentives to invest in special economic zones. 30 The government has used savings from cutting fuel subsidies, worth over 4% of GDP, to fund extra capital spending. But the budget deficit still widened to 2.8% of GDP, very close to the legal limit of 3%. If public expenditure is to increase further, the government will need to raise more revenue. That will not be easy. Most workers and employers pay little or no tax. Only 27 million of Indonesia’s 255 million people are registered taxpayers, 35 and in 2014 just 900 000 of them paid what they owed, leaving it with a tax revenue to GDP ratio of around 10%. Big companies say that they are being squeezed harder by the tax authorities because they are an easier target. Infrastructure spending will help bring foreign investment and good jobs to Indonesia as well as encouraging exports. Indonesia’s infrastructure problem can be summed up 40 as too few roads and congested ports. In the short term, infrastructure spending puts people to work and boosts demand for raw materials. In the longer term this spending offers the chance to make up for decades of neglect and underinvestment. Indonesia has plans for 65 dams, 16 of which are already under construction. In 2015 work started on the Keureuto Dam, designed to boost agricultural productivity in Aceh. Recently fields 45 were flooded for the massive Jatigede Dam in West Java, after 20 years of delays. Once complete, the dam will irrigate 90 000 hectares of rice paddy, increasing efficiency by giving farmers two harvests a year instead of one. (Sources: adapted from http://www.economist.com/news/special-report/21693405- secure-growth-it-needs-indonesia-must-resist-its-protectionist-urges-roll- out and http://www.economist.com/news/special-report/21693404-after- decades-underinvestment-infrastructure-spending-picking-up-last)
(c) Discuss the benefits of aid to Indonesia. (12)
June 2018 · Paper 3 · Q2(d) 25 marks AO1=4, AO2=4, AO3=8, AO4=9 25-mark essay Either/or emerging and developing economiesprice elasticity of demand
Data and extracts for question 2Indonesia Figure 4: World coal prices, 2006–2016, US dollars per tonne 250 200 150 $ per tonne 100 50 0 2006 08 10 12 14 16 (Source: http://www.economist.com/news/world-week/21697025-business-week) Figure 5: Indonesia’s real GDP, annual percentage change 10 5 + % 0 change – in GDP 5 10 15 2006 08 10 12 14 16 (Source: http://www.economist.com/news/world-week/21697025-business-week) Extract D Indonesia’s economic outlook The Indonesian economy is expected to grow by an average of 4.8% a year between 2017 and 2021. Joko Widodo, president of Indonesia since 2014, is increasingly confident in his role and now has enough political support to pass some of his desired supply-side reforms. His government has been aggressively trying to improve the business and investment 5 environment by easing regulations and offering tax incentives, for example to firms investing in special economic zones. Indonesia receives US$2.3 billion a year in overseas development aid, which is mainly spent on education and healthcare. There is also ongoing aid from international institutions and non-government organisations paying for restructuring after the 2004 10 Indian Ocean earthquake and tsunami, which led to the loss of over 170 000 lives and much damage to economic livelihood. Aid agencies have supported the Indonesian government in providing healthcare free at the point of access for 88 million of the poorest people, free schooling for 12 years for each child, and tertiary education for students accepted into university. There is a scheme to provide each of Indonesia’s 15 15.5 million poorest households with a cash transfer of 200 000 rupiah (US$14.37) a month. The World Bank has approved US$800 million in infrastructure loans to Indonesia, with another US$950 million as conditional loans. The Asian Development Bank has committed itself to lending US$2 billion. In December Japan’s development agency lent Indonesia US$535 million to construct two power stations. 20 (Sources: adapted from http://country.eiu.com/Indonesia and http://www.economist.com/ news/special-report/21693404-after-decades-underinvestment- infrastructure-spending-picking-up-last) Extract E Indonesia’s economic policies as commodity prices collapse Indonesia is the world’s fourth largest exporter of coal and the raw material accounts for 11% of its exports. Its other main exports are crude oil, palm oil, rubber and tin. Its main commodity exports tripled in value between 2000 and 2010, and as exports boomed, so did the economy. But the value of commodity exports has fallen by more than half from 5 its peak. Coal now sells for just US$50 per tonne, against US$125 in 2011. In the decade to 2014, Indonesia’s real GDP grew by an annual average of 6%, but the collapse in commodity prices has slowed the economy. In 2015 growth was 4.8%, the slowest rate since 2009. But compared with many other commodity exporters, Indonesia is getting off lightly. 10 The value of the rupiah, Indonesia’s currency, against the US dollar has fallen by 30% since 2013, but has since stabilised. Other emerging market currencies have depreciated even more steeply over that period. Despite the weak exchange rate, Indonesia’s inflation rate has mostly remained within the central bank’s target range of 3-5%. The main impact of the rupiah’s fall has been to curb imports, helping limit Indonesia’s current account 15 deficit to around 2% of GDP despite weaker export earnings. A cautious fiscal policy during the boom years has allowed for a modest fiscal expansion to offset the effects of weak exports and investment. The national debt is just 26% of GDP. Mr Widodo knows that Indonesia cannot raise its long-term growth rate if the economy remains reliant on coal. It needs a broader range of manufacturing and service industries. 20 If new enterprise is to flourish, Indonesia must support local entrepreneurship. The labour market is inflexible. To start a business takes an average of 47 days, compared with four in Malaysia and two in Singapore. The President’s supply-side policies are improving the business climate. The average number of days needed to approve a new power plant has declined from 900 to 200. The government recently revised its “negative investment 25 list” of sectors in which foreign ownership is banned or restricted, fully opening up the rubber, film and restaurant sectors, among others. In 2015 he launched a series of measures to try to reduce government failure, including easing some regulations, streamlining licensing procedures for firms on industrial estates and providing tax incentives to invest in special economic zones. 30 The government has used savings from cutting fuel subsidies, worth over 4% of GDP, to fund extra capital spending. But the budget deficit still widened to 2.8% of GDP, very close to the legal limit of 3%. If public expenditure is to increase further, the government will need to raise more revenue. That will not be easy. Most workers and employers pay little or no tax. Only 27 million of Indonesia’s 255 million people are registered taxpayers, 35 and in 2014 just 900 000 of them paid what they owed, leaving it with a tax revenue to GDP ratio of around 10%. Big companies say that they are being squeezed harder by the tax authorities because they are an easier target. Infrastructure spending will help bring foreign investment and good jobs to Indonesia as well as encouraging exports. Indonesia’s infrastructure problem can be summed up 40 as too few roads and congested ports. In the short term, infrastructure spending puts people to work and boosts demand for raw materials. In the longer term this spending offers the chance to make up for decades of neglect and underinvestment. Indonesia has plans for 65 dams, 16 of which are already under construction. In 2015 work started on the Keureuto Dam, designed to boost agricultural productivity in Aceh. Recently fields 45 were flooded for the massive Jatigede Dam in West Java, after 20 years of delays. Once complete, the dam will irrigate 90 000 hectares of rice paddy, increasing efficiency by giving farmers two harvests a year instead of one. (Sources: adapted from http://www.economist.com/news/special-report/21693405- secure-growth-it-needs-indonesia-must-resist-its-protectionist-urges-roll- out and http://www.economist.com/news/special-report/21693404-after- decades-underinvestment-infrastructure-spending-picking-up-last)
(d) With reference to the information provided and your own knowledge, evaluate the microeconomic and macroeconomic effects on Indonesia of the volatility of prices of commodities such as coal. (25)
June 2018 · Paper 3 · Q2(e) 25 marks AO1=4, AO2=4, AO3=8, AO4=9 25-mark essay Either/or supply side policiescompetition policy and regulation
Data and extracts for question 2Indonesia Figure 4: World coal prices, 2006–2016, US dollars per tonne 250 200 150 $ per tonne 100 50 0 2006 08 10 12 14 16 (Source: http://www.economist.com/news/world-week/21697025-business-week) Figure 5: Indonesia’s real GDP, annual percentage change 10 5 + % 0 change – in GDP 5 10 15 2006 08 10 12 14 16 (Source: http://www.economist.com/news/world-week/21697025-business-week) Extract D Indonesia’s economic outlook The Indonesian economy is expected to grow by an average of 4.8% a year between 2017 and 2021. Joko Widodo, president of Indonesia since 2014, is increasingly confident in his role and now has enough political support to pass some of his desired supply-side reforms. His government has been aggressively trying to improve the business and investment 5 environment by easing regulations and offering tax incentives, for example to firms investing in special economic zones. Indonesia receives US$2.3 billion a year in overseas development aid, which is mainly spent on education and healthcare. There is also ongoing aid from international institutions and non-government organisations paying for restructuring after the 2004 10 Indian Ocean earthquake and tsunami, which led to the loss of over 170 000 lives and much damage to economic livelihood. Aid agencies have supported the Indonesian government in providing healthcare free at the point of access for 88 million of the poorest people, free schooling for 12 years for each child, and tertiary education for students accepted into university. There is a scheme to provide each of Indonesia’s 15 15.5 million poorest households with a cash transfer of 200 000 rupiah (US$14.37) a month. The World Bank has approved US$800 million in infrastructure loans to Indonesia, with another US$950 million as conditional loans. The Asian Development Bank has committed itself to lending US$2 billion. In December Japan’s development agency lent Indonesia US$535 million to construct two power stations. 20 (Sources: adapted from http://country.eiu.com/Indonesia and http://www.economist.com/ news/special-report/21693404-after-decades-underinvestment- infrastructure-spending-picking-up-last) Extract E Indonesia’s economic policies as commodity prices collapse Indonesia is the world’s fourth largest exporter of coal and the raw material accounts for 11% of its exports. Its other main exports are crude oil, palm oil, rubber and tin. Its main commodity exports tripled in value between 2000 and 2010, and as exports boomed, so did the economy. But the value of commodity exports has fallen by more than half from 5 its peak. Coal now sells for just US$50 per tonne, against US$125 in 2011. In the decade to 2014, Indonesia’s real GDP grew by an annual average of 6%, but the collapse in commodity prices has slowed the economy. In 2015 growth was 4.8%, the slowest rate since 2009. But compared with many other commodity exporters, Indonesia is getting off lightly. 10 The value of the rupiah, Indonesia’s currency, against the US dollar has fallen by 30% since 2013, but has since stabilised. Other emerging market currencies have depreciated even more steeply over that period. Despite the weak exchange rate, Indonesia’s inflation rate has mostly remained within the central bank’s target range of 3-5%. The main impact of the rupiah’s fall has been to curb imports, helping limit Indonesia’s current account 15 deficit to around 2% of GDP despite weaker export earnings. A cautious fiscal policy during the boom years has allowed for a modest fiscal expansion to offset the effects of weak exports and investment. The national debt is just 26% of GDP. Mr Widodo knows that Indonesia cannot raise its long-term growth rate if the economy remains reliant on coal. It needs a broader range of manufacturing and service industries. 20 If new enterprise is to flourish, Indonesia must support local entrepreneurship. The labour market is inflexible. To start a business takes an average of 47 days, compared with four in Malaysia and two in Singapore. The President’s supply-side policies are improving the business climate. The average number of days needed to approve a new power plant has declined from 900 to 200. The government recently revised its “negative investment 25 list” of sectors in which foreign ownership is banned or restricted, fully opening up the rubber, film and restaurant sectors, among others. In 2015 he launched a series of measures to try to reduce government failure, including easing some regulations, streamlining licensing procedures for firms on industrial estates and providing tax incentives to invest in special economic zones. 30 The government has used savings from cutting fuel subsidies, worth over 4% of GDP, to fund extra capital spending. But the budget deficit still widened to 2.8% of GDP, very close to the legal limit of 3%. If public expenditure is to increase further, the government will need to raise more revenue. That will not be easy. Most workers and employers pay little or no tax. Only 27 million of Indonesia’s 255 million people are registered taxpayers, 35 and in 2014 just 900 000 of them paid what they owed, leaving it with a tax revenue to GDP ratio of around 10%. Big companies say that they are being squeezed harder by the tax authorities because they are an easier target. Infrastructure spending will help bring foreign investment and good jobs to Indonesia as well as encouraging exports. Indonesia’s infrastructure problem can be summed up 40 as too few roads and congested ports. In the short term, infrastructure spending puts people to work and boosts demand for raw materials. In the longer term this spending offers the chance to make up for decades of neglect and underinvestment. Indonesia has plans for 65 dams, 16 of which are already under construction. In 2015 work started on the Keureuto Dam, designed to boost agricultural productivity in Aceh. Recently fields 45 were flooded for the massive Jatigede Dam in West Java, after 20 years of delays. Once complete, the dam will irrigate 90 000 hectares of rice paddy, increasing efficiency by giving farmers two harvests a year instead of one. (Sources: adapted from http://www.economist.com/news/special-report/21693405- secure-growth-it-needs-indonesia-must-resist-its-protectionist-urges-roll- out and http://www.economist.com/news/special-report/21693404-after- decades-underinvestment-infrastructure-spending-picking-up-last)
(e) Evaluate the likely microeconomic and macroeconomic effects of the supply-side policies recently introduced in Indonesia. (25)
June 2017 · AS Paper 1 · Q1(a) 3 marks AO1=1, AO2=1, AO3=1 Calculation production possibility frontiersnature of economics
Data and extracts for question 11 The production possibility frontier for an economy is shown in the table below. Capital goods output Consumer goods output Opportunity cost (million units) (million units) 0 42 – 10 40 20 36 30 30 40 22 50 12 60 0
(a) Explain, using marginal analysis from the table above, the concept of opportunity cost. (You may use the last column in answering the question.) (3)
June 2017 · AS Paper 1 · Q2(a) 1 mark AO1=1 Definition supply and demand
Data and extracts for question 22 The table below shows UK wheat production between 2010 and 2015. Index numbers of wheat Wheat production Year production (‘000 tonnes) (2010 is base year) 2010 14 878 100 2011 15 257 2012 13 261 2013 11 921 80.1 2014 16 606 111.6 2015 16 129 108.4 (Source: adapted from https://www.gov.uk/government/uploads/ system/uploadsattachment_data/file/466383/farming- statistics-2015-wheat-and-barley-production-uk.pdf)
(a) Define the term ‘base year’. (1)
June 2017 · AS Paper 1 · Q2(b) 2 marks AO2=2 Calculation supply and demand
Data and extracts for question 22 The table below shows UK wheat production between 2010 and 2015. Index numbers of wheat Wheat production Year production (‘000 tonnes) (2010 is base year) 2010 14 878 100 2011 15 257 2012 13 261 2013 11 921 80.1 2014 16 606 111.6 2015 16 129 108.4 (Source: adapted from https://www.gov.uk/government/uploads/ system/uploadsattachment_data/file/466383/farming- statistics-2015-wheat-and-barley-production-uk.pdf)
(b) Calculate the index numbers for 2011 and 2012, using 2010 as the base year. (2)
June 2017 · AS Paper 1 · Q4(a) 3 marks AO1=1, AO2=1, AO3=1 Short answer price mechanism and surplussupply and demand
Data and extracts for question 44 The excess supply of carbon steel has recently caused its global price to fall below $530 per tonne. (Source: adapted from http://www.meps.co.uk/allproducts%20steel%20price.htm)
(a) Explain how the price mechanism responds to excess supply in a free market. (3)
June 2017 · AS Paper 1 · Q5(a) 3 marks AO1=1, AO2=1, AO3=1 Short answer government intervention in marketssupply and demand
Data and extracts for question 55 Universities UK raised concerns about the proposal to reduce the maximum tuition fees (fee cap) for undergraduate courses in England from £9 000 to £6 000. It stated “This unfunded proposal to reduce the fee cap would damage the quality of experience our universities could deliver to students and remove opportunities for those seeking to benefit from a university education”. (Source: adapted from tuition fees 2015 Times letter Universities UK http://www.universitiesuk.ac.uk/highereducation/ Pages/UUKboardFeesLetter.aspx#.VjoQRbfhDIU)
(a) Explain why reducing the tuition fee cap may result in excess demand for university places. (3)
June 2017 · AS Paper 1 · Q6(a) 5 marks AO1=1, AO2=2, AO3=2 Diagram supply and demand
Data and extracts for question 6The market for cigarettes Figure 1: Price elasticity of demand - a comparison between tobacco and e-cigarettes Price of packet of 20 Price of tobacco cigarettes e-cigarette kit £7.70–£9.50 £9.99–£19.99 Average price per Single cigarette equivalent tobacco cigarette price of an e-cigarette 48p 7p Price elasticity of demand Price elasticity of demand for tobacco cigarettes for e-cigarettes –0.35 –1.9 (Source: adapted from https://www.blucigs.co.uk/united-kingdom/kits/all-kits) Extract A Government intervention on tobacco There was a time when smoking was fashionable. Television and magazine advertisements glorified smoking. Everyone from your dad to your doctor smoked in all places – cars, restaurants and even hospitals. Tobacco is still the single biggest cause of cancer in the world and the leading cause of preventable deaths. Nearly 80% of the 1 billion smokers worldwide live in low- and 5 middle-income countries. Bans on tobacco advertising, promotion and sponsorship can reduce tobacco consumption. Comprehensive smoking bans covering indoor workplaces, public places and public transport have been introduced in 48 countries. Tobacco taxes are the most cost-effective way to reduce tobacco use, especially among 10 the young and people in low-income groups. A tax increase that raises tobacco prices by 10% decreases tobacco consumption by 4% in high-income countries and 5% in low- and middle-income countries. However, some 8 million people are expected to die each year by 2030 – because they have smoked tobacco or have been exposed to passive smoking. The use of alternative 15 products such as electronic cigarettes (e-cigarettes) are gaining in popularity but information about their effects is uncertain. Little research has yet been done about the long-term health effects of e-cigarettes and the nicotine dispensed by e-cigarettes is highly addictive. The illegal tobacco market still counts for 1 in every 10 cigarettes consumed globally. In addition, tobacco companies still spend tens of billions of dollars 20 each year on advertising and promoting tobacco products and sponsoring events. They continuously challenge the regulatory measures governments are taking. (Source: adapted from http://www.who.int/topics/tobacco/en/ and http://www.who.int/ mediacentre/commentaries/reducing-tobacco-use/en/) Extract B Free market approach Are free markets incompatible with good health? If the solution to every problem involves banning advertising, raising prices and restricting availability, you might easily conclude that the free market is the disease and government regulation is the cure. From this perspective, the providers of food, alcohol and tobacco are determined to push the most unhealthy products on the public at the lowest prices. 5 Contrary to this viewpoint, the profit motive is not unhealthy. Businesses have an obvious incentive to keep their customers alive and customers have a strong incentive to seek out healthier options. Any company that can make a scientifically sound health claim gains a competitive advantage over its rivals. Health sells. In contrast, government regulation can lead to negative health outcomes. Markets can correct themselves long before 10 government failures are even acknowledged. Over a million Britons, almost all of whom are smokers or ex-smokers, use e-cigarettes, as a less hazardous product than cigarettes and yet e-cigarettes face increased regulations and in many countries they are banned. It is neither consistent nor ethical to prevent smokers from switching to much safer alternatives. Efforts to regulate e-cigarettes are a far greater threat to public health than 15 the products themselves. We argue that the interests of consumers are nearly always better advanced by the provision of accurate information and free choice than by prohibitions and regulations. The government policy of small but steady tax rises on tobacco and ever-larger warning labels is becoming less effective and leads to unintended consequences. 20 (Source: adapted from http://www.iea.org.uk/blog/free-market-solutions-in-health- should-be-allowed-to-flourish, Christopher Snowdon, 11th July 2013)
(a) Explain why ‘bans on tobacco advertising’ (Extract A, line 7) may result in a decrease in the revenue of tobacco firms. Include a supply and demand diagram in your answer. (5)
June 2017 · AS Paper 1 · Q6(b) 10 marks AO1=2, AO2=2, AO3=2, AO4=4 10-mark response rational decision making and behavioural economics
Data and extracts for question 6The market for cigarettes Figure 1: Price elasticity of demand - a comparison between tobacco and e-cigarettes Price of packet of 20 Price of tobacco cigarettes e-cigarette kit £7.70–£9.50 £9.99–£19.99 Average price per Single cigarette equivalent tobacco cigarette price of an e-cigarette 48p 7p Price elasticity of demand Price elasticity of demand for tobacco cigarettes for e-cigarettes –0.35 –1.9 (Source: adapted from https://www.blucigs.co.uk/united-kingdom/kits/all-kits) Extract A Government intervention on tobacco There was a time when smoking was fashionable. Television and magazine advertisements glorified smoking. Everyone from your dad to your doctor smoked in all places – cars, restaurants and even hospitals. Tobacco is still the single biggest cause of cancer in the world and the leading cause of preventable deaths. Nearly 80% of the 1 billion smokers worldwide live in low- and 5 middle-income countries. Bans on tobacco advertising, promotion and sponsorship can reduce tobacco consumption. Comprehensive smoking bans covering indoor workplaces, public places and public transport have been introduced in 48 countries. Tobacco taxes are the most cost-effective way to reduce tobacco use, especially among 10 the young and people in low-income groups. A tax increase that raises tobacco prices by 10% decreases tobacco consumption by 4% in high-income countries and 5% in low- and middle-income countries. However, some 8 million people are expected to die each year by 2030 – because they have smoked tobacco or have been exposed to passive smoking. The use of alternative 15 products such as electronic cigarettes (e-cigarettes) are gaining in popularity but information about their effects is uncertain. Little research has yet been done about the long-term health effects of e-cigarettes and the nicotine dispensed by e-cigarettes is highly addictive. The illegal tobacco market still counts for 1 in every 10 cigarettes consumed globally. In addition, tobacco companies still spend tens of billions of dollars 20 each year on advertising and promoting tobacco products and sponsoring events. They continuously challenge the regulatory measures governments are taking. (Source: adapted from http://www.who.int/topics/tobacco/en/ and http://www.who.int/ mediacentre/commentaries/reducing-tobacco-use/en/) Extract B Free market approach Are free markets incompatible with good health? If the solution to every problem involves banning advertising, raising prices and restricting availability, you might easily conclude that the free market is the disease and government regulation is the cure. From this perspective, the providers of food, alcohol and tobacco are determined to push the most unhealthy products on the public at the lowest prices. 5 Contrary to this viewpoint, the profit motive is not unhealthy. Businesses have an obvious incentive to keep their customers alive and customers have a strong incentive to seek out healthier options. Any company that can make a scientifically sound health claim gains a competitive advantage over its rivals. Health sells. In contrast, government regulation can lead to negative health outcomes. Markets can correct themselves long before 10 government failures are even acknowledged. Over a million Britons, almost all of whom are smokers or ex-smokers, use e-cigarettes, as a less hazardous product than cigarettes and yet e-cigarettes face increased regulations and in many countries they are banned. It is neither consistent nor ethical to prevent smokers from switching to much safer alternatives. Efforts to regulate e-cigarettes are a far greater threat to public health than 15 the products themselves. We argue that the interests of consumers are nearly always better advanced by the provision of accurate information and free choice than by prohibitions and regulations. The government policy of small but steady tax rises on tobacco and ever-larger warning labels is becoming less effective and leads to unintended consequences. 20 (Source: adapted from http://www.iea.org.uk/blog/free-market-solutions-in-health- should-be-allowed-to-flourish, Christopher Snowdon, 11th July 2013)
(b) With reference to the information provided and your own knowledge, assess the view that tobacco consumers switching to e-cigarettes is an example of rational behaviour. (10)
June 2017 · AS Paper 1 · Q6(c) 6 marks AO1=2, AO2=2, AO3=2 Short answer price elasticity of demand
Data and extracts for question 6The market for cigarettes Figure 1: Price elasticity of demand - a comparison between tobacco and e-cigarettes Price of packet of 20 Price of tobacco cigarettes e-cigarette kit £7.70–£9.50 £9.99–£19.99 Average price per Single cigarette equivalent tobacco cigarette price of an e-cigarette 48p 7p Price elasticity of demand Price elasticity of demand for tobacco cigarettes for e-cigarettes –0.35 –1.9 (Source: adapted from https://www.blucigs.co.uk/united-kingdom/kits/all-kits) Extract A Government intervention on tobacco There was a time when smoking was fashionable. Television and magazine advertisements glorified smoking. Everyone from your dad to your doctor smoked in all places – cars, restaurants and even hospitals. Tobacco is still the single biggest cause of cancer in the world and the leading cause of preventable deaths. Nearly 80% of the 1 billion smokers worldwide live in low- and 5 middle-income countries. Bans on tobacco advertising, promotion and sponsorship can reduce tobacco consumption. Comprehensive smoking bans covering indoor workplaces, public places and public transport have been introduced in 48 countries. Tobacco taxes are the most cost-effective way to reduce tobacco use, especially among 10 the young and people in low-income groups. A tax increase that raises tobacco prices by 10% decreases tobacco consumption by 4% in high-income countries and 5% in low- and middle-income countries. However, some 8 million people are expected to die each year by 2030 – because they have smoked tobacco or have been exposed to passive smoking. The use of alternative 15 products such as electronic cigarettes (e-cigarettes) are gaining in popularity but information about their effects is uncertain. Little research has yet been done about the long-term health effects of e-cigarettes and the nicotine dispensed by e-cigarettes is highly addictive. The illegal tobacco market still counts for 1 in every 10 cigarettes consumed globally. In addition, tobacco companies still spend tens of billions of dollars 20 each year on advertising and promoting tobacco products and sponsoring events. They continuously challenge the regulatory measures governments are taking. (Source: adapted from http://www.who.int/topics/tobacco/en/ and http://www.who.int/ mediacentre/commentaries/reducing-tobacco-use/en/) Extract B Free market approach Are free markets incompatible with good health? If the solution to every problem involves banning advertising, raising prices and restricting availability, you might easily conclude that the free market is the disease and government regulation is the cure. From this perspective, the providers of food, alcohol and tobacco are determined to push the most unhealthy products on the public at the lowest prices. 5 Contrary to this viewpoint, the profit motive is not unhealthy. Businesses have an obvious incentive to keep their customers alive and customers have a strong incentive to seek out healthier options. Any company that can make a scientifically sound health claim gains a competitive advantage over its rivals. Health sells. In contrast, government regulation can lead to negative health outcomes. Markets can correct themselves long before 10 government failures are even acknowledged. Over a million Britons, almost all of whom are smokers or ex-smokers, use e-cigarettes, as a less hazardous product than cigarettes and yet e-cigarettes face increased regulations and in many countries they are banned. It is neither consistent nor ethical to prevent smokers from switching to much safer alternatives. Efforts to regulate e-cigarettes are a far greater threat to public health than 15 the products themselves. We argue that the interests of consumers are nearly always better advanced by the provision of accurate information and free choice than by prohibitions and regulations. The government policy of small but steady tax rises on tobacco and ever-larger warning labels is becoming less effective and leads to unintended consequences. 20 (Source: adapted from http://www.iea.org.uk/blog/free-market-solutions-in-health- should-be-allowed-to-flourish, Christopher Snowdon, 11th July 2013)
Tobacco cigarettes and e-cigarettes are considered to be substitutes. (c) Explain how changes in the price of tobacco cigarettes may affect the demand for e-cigarettes over time. (6)
June 2017 · AS Paper 1 · Q6(d) 4 marks AO1=2, AO2=2 Calculation price elasticity of demand
Data and extracts for question 6The market for cigarettes Figure 1: Price elasticity of demand - a comparison between tobacco and e-cigarettes Price of packet of 20 Price of tobacco cigarettes e-cigarette kit £7.70–£9.50 £9.99–£19.99 Average price per Single cigarette equivalent tobacco cigarette price of an e-cigarette 48p 7p Price elasticity of demand Price elasticity of demand for tobacco cigarettes for e-cigarettes –0.35 –1.9 (Source: adapted from https://www.blucigs.co.uk/united-kingdom/kits/all-kits) Extract A Government intervention on tobacco There was a time when smoking was fashionable. Television and magazine advertisements glorified smoking. Everyone from your dad to your doctor smoked in all places – cars, restaurants and even hospitals. Tobacco is still the single biggest cause of cancer in the world and the leading cause of preventable deaths. Nearly 80% of the 1 billion smokers worldwide live in low- and 5 middle-income countries. Bans on tobacco advertising, promotion and sponsorship can reduce tobacco consumption. Comprehensive smoking bans covering indoor workplaces, public places and public transport have been introduced in 48 countries. Tobacco taxes are the most cost-effective way to reduce tobacco use, especially among 10 the young and people in low-income groups. A tax increase that raises tobacco prices by 10% decreases tobacco consumption by 4% in high-income countries and 5% in low- and middle-income countries. However, some 8 million people are expected to die each year by 2030 – because they have smoked tobacco or have been exposed to passive smoking. The use of alternative 15 products such as electronic cigarettes (e-cigarettes) are gaining in popularity but information about their effects is uncertain. Little research has yet been done about the long-term health effects of e-cigarettes and the nicotine dispensed by e-cigarettes is highly addictive. The illegal tobacco market still counts for 1 in every 10 cigarettes consumed globally. In addition, tobacco companies still spend tens of billions of dollars 20 each year on advertising and promoting tobacco products and sponsoring events. They continuously challenge the regulatory measures governments are taking. (Source: adapted from http://www.who.int/topics/tobacco/en/ and http://www.who.int/ mediacentre/commentaries/reducing-tobacco-use/en/) Extract B Free market approach Are free markets incompatible with good health? If the solution to every problem involves banning advertising, raising prices and restricting availability, you might easily conclude that the free market is the disease and government regulation is the cure. From this perspective, the providers of food, alcohol and tobacco are determined to push the most unhealthy products on the public at the lowest prices. 5 Contrary to this viewpoint, the profit motive is not unhealthy. Businesses have an obvious incentive to keep their customers alive and customers have a strong incentive to seek out healthier options. Any company that can make a scientifically sound health claim gains a competitive advantage over its rivals. Health sells. In contrast, government regulation can lead to negative health outcomes. Markets can correct themselves long before 10 government failures are even acknowledged. Over a million Britons, almost all of whom are smokers or ex-smokers, use e-cigarettes, as a less hazardous product than cigarettes and yet e-cigarettes face increased regulations and in many countries they are banned. It is neither consistent nor ethical to prevent smokers from switching to much safer alternatives. Efforts to regulate e-cigarettes are a far greater threat to public health than 15 the products themselves. We argue that the interests of consumers are nearly always better advanced by the provision of accurate information and free choice than by prohibitions and regulations. The government policy of small but steady tax rises on tobacco and ever-larger warning labels is becoming less effective and leads to unintended consequences. 20 (Source: adapted from http://www.iea.org.uk/blog/free-market-solutions-in-health- should-be-allowed-to-flourish, Christopher Snowdon, 11th July 2013)
(d) With reference to Extract A, lines 11–13, calculate the price elasticity of demand for tobacco cigarettes in high-income countries and in low-middle-income countries. You are advised to show your working. (4)
June 2017 · AS Paper 1 · Q6(e) 15 marks AO1=3, AO2=3, AO3=3, AO4=6 15-mark response price elasticity of demand
Data and extracts for question 6The market for cigarettes Figure 1: Price elasticity of demand - a comparison between tobacco and e-cigarettes Price of packet of 20 Price of tobacco cigarettes e-cigarette kit £7.70–£9.50 £9.99–£19.99 Average price per Single cigarette equivalent tobacco cigarette price of an e-cigarette 48p 7p Price elasticity of demand Price elasticity of demand for tobacco cigarettes for e-cigarettes –0.35 –1.9 (Source: adapted from https://www.blucigs.co.uk/united-kingdom/kits/all-kits) Extract A Government intervention on tobacco There was a time when smoking was fashionable. Television and magazine advertisements glorified smoking. Everyone from your dad to your doctor smoked in all places – cars, restaurants and even hospitals. Tobacco is still the single biggest cause of cancer in the world and the leading cause of preventable deaths. Nearly 80% of the 1 billion smokers worldwide live in low- and 5 middle-income countries. Bans on tobacco advertising, promotion and sponsorship can reduce tobacco consumption. Comprehensive smoking bans covering indoor workplaces, public places and public transport have been introduced in 48 countries. Tobacco taxes are the most cost-effective way to reduce tobacco use, especially among 10 the young and people in low-income groups. A tax increase that raises tobacco prices by 10% decreases tobacco consumption by 4% in high-income countries and 5% in low- and middle-income countries. However, some 8 million people are expected to die each year by 2030 – because they have smoked tobacco or have been exposed to passive smoking. The use of alternative 15 products such as electronic cigarettes (e-cigarettes) are gaining in popularity but information about their effects is uncertain. Little research has yet been done about the long-term health effects of e-cigarettes and the nicotine dispensed by e-cigarettes is highly addictive. The illegal tobacco market still counts for 1 in every 10 cigarettes consumed globally. In addition, tobacco companies still spend tens of billions of dollars 20 each year on advertising and promoting tobacco products and sponsoring events. They continuously challenge the regulatory measures governments are taking. (Source: adapted from http://www.who.int/topics/tobacco/en/ and http://www.who.int/ mediacentre/commentaries/reducing-tobacco-use/en/) Extract B Free market approach Are free markets incompatible with good health? If the solution to every problem involves banning advertising, raising prices and restricting availability, you might easily conclude that the free market is the disease and government regulation is the cure. From this perspective, the providers of food, alcohol and tobacco are determined to push the most unhealthy products on the public at the lowest prices. 5 Contrary to this viewpoint, the profit motive is not unhealthy. Businesses have an obvious incentive to keep their customers alive and customers have a strong incentive to seek out healthier options. Any company that can make a scientifically sound health claim gains a competitive advantage over its rivals. Health sells. In contrast, government regulation can lead to negative health outcomes. Markets can correct themselves long before 10 government failures are even acknowledged. Over a million Britons, almost all of whom are smokers or ex-smokers, use e-cigarettes, as a less hazardous product than cigarettes and yet e-cigarettes face increased regulations and in many countries they are banned. It is neither consistent nor ethical to prevent smokers from switching to much safer alternatives. Efforts to regulate e-cigarettes are a far greater threat to public health than 15 the products themselves. We argue that the interests of consumers are nearly always better advanced by the provision of accurate information and free choice than by prohibitions and regulations. The government policy of small but steady tax rises on tobacco and ever-larger warning labels is becoming less effective and leads to unintended consequences. 20 (Source: adapted from http://www.iea.org.uk/blog/free-market-solutions-in-health- should-be-allowed-to-flourish, Christopher Snowdon, 11th July 2013)
(e) With reference to Figure 1, assess the likely reasons for the difference in price elasticity of demand for tobacco cigarettes and e-cigarettes. (15)
June 2017 · AS Paper 1 · Q6(f) 20 marks AO1=4, AO2=4, AO3=6, AO4=6 20-mark essay Either/or price mechanism and surpluseconomic systems
Data and extracts for question 6The market for cigarettes Figure 1: Price elasticity of demand - a comparison between tobacco and e-cigarettes Price of packet of 20 Price of tobacco cigarettes e-cigarette kit £7.70–£9.50 £9.99–£19.99 Average price per Single cigarette equivalent tobacco cigarette price of an e-cigarette 48p 7p Price elasticity of demand Price elasticity of demand for tobacco cigarettes for e-cigarettes –0.35 –1.9 (Source: adapted from https://www.blucigs.co.uk/united-kingdom/kits/all-kits) Extract A Government intervention on tobacco There was a time when smoking was fashionable. Television and magazine advertisements glorified smoking. Everyone from your dad to your doctor smoked in all places – cars, restaurants and even hospitals. Tobacco is still the single biggest cause of cancer in the world and the leading cause of preventable deaths. Nearly 80% of the 1 billion smokers worldwide live in low- and 5 middle-income countries. Bans on tobacco advertising, promotion and sponsorship can reduce tobacco consumption. Comprehensive smoking bans covering indoor workplaces, public places and public transport have been introduced in 48 countries. Tobacco taxes are the most cost-effective way to reduce tobacco use, especially among 10 the young and people in low-income groups. A tax increase that raises tobacco prices by 10% decreases tobacco consumption by 4% in high-income countries and 5% in low- and middle-income countries. However, some 8 million people are expected to die each year by 2030 – because they have smoked tobacco or have been exposed to passive smoking. The use of alternative 15 products such as electronic cigarettes (e-cigarettes) are gaining in popularity but information about their effects is uncertain. Little research has yet been done about the long-term health effects of e-cigarettes and the nicotine dispensed by e-cigarettes is highly addictive. The illegal tobacco market still counts for 1 in every 10 cigarettes consumed globally. In addition, tobacco companies still spend tens of billions of dollars 20 each year on advertising and promoting tobacco products and sponsoring events. They continuously challenge the regulatory measures governments are taking. (Source: adapted from http://www.who.int/topics/tobacco/en/ and http://www.who.int/ mediacentre/commentaries/reducing-tobacco-use/en/) Extract B Free market approach Are free markets incompatible with good health? If the solution to every problem involves banning advertising, raising prices and restricting availability, you might easily conclude that the free market is the disease and government regulation is the cure. From this perspective, the providers of food, alcohol and tobacco are determined to push the most unhealthy products on the public at the lowest prices. 5 Contrary to this viewpoint, the profit motive is not unhealthy. Businesses have an obvious incentive to keep their customers alive and customers have a strong incentive to seek out healthier options. Any company that can make a scientifically sound health claim gains a competitive advantage over its rivals. Health sells. In contrast, government regulation can lead to negative health outcomes. Markets can correct themselves long before 10 government failures are even acknowledged. Over a million Britons, almost all of whom are smokers or ex-smokers, use e-cigarettes, as a less hazardous product than cigarettes and yet e-cigarettes face increased regulations and in many countries they are banned. It is neither consistent nor ethical to prevent smokers from switching to much safer alternatives. Efforts to regulate e-cigarettes are a far greater threat to public health than 15 the products themselves. We argue that the interests of consumers are nearly always better advanced by the provision of accurate information and free choice than by prohibitions and regulations. The government policy of small but steady tax rises on tobacco and ever-larger warning labels is becoming less effective and leads to unintended consequences. 20 (Source: adapted from http://www.iea.org.uk/blog/free-market-solutions-in-health- should-be-allowed-to-flourish, Christopher Snowdon, 11th July 2013)
(f) Evaluate the possible advantages of a free market approach to cigarette consumption. (20)
June 2017 · AS Paper 1 · Q6(g) 20 marks AO1=4, AO2=4, AO3=6, AO4=6 20-mark essay Either/or government intervention in marketsgovernment failure
Data and extracts for question 6The market for cigarettes Figure 1: Price elasticity of demand - a comparison between tobacco and e-cigarettes Price of packet of 20 Price of tobacco cigarettes e-cigarette kit £7.70–£9.50 £9.99–£19.99 Average price per Single cigarette equivalent tobacco cigarette price of an e-cigarette 48p 7p Price elasticity of demand Price elasticity of demand for tobacco cigarettes for e-cigarettes –0.35 –1.9 (Source: adapted from https://www.blucigs.co.uk/united-kingdom/kits/all-kits) Extract A Government intervention on tobacco There was a time when smoking was fashionable. Television and magazine advertisements glorified smoking. Everyone from your dad to your doctor smoked in all places – cars, restaurants and even hospitals. Tobacco is still the single biggest cause of cancer in the world and the leading cause of preventable deaths. Nearly 80% of the 1 billion smokers worldwide live in low- and 5 middle-income countries. Bans on tobacco advertising, promotion and sponsorship can reduce tobacco consumption. Comprehensive smoking bans covering indoor workplaces, public places and public transport have been introduced in 48 countries. Tobacco taxes are the most cost-effective way to reduce tobacco use, especially among 10 the young and people in low-income groups. A tax increase that raises tobacco prices by 10% decreases tobacco consumption by 4% in high-income countries and 5% in low- and middle-income countries. However, some 8 million people are expected to die each year by 2030 – because they have smoked tobacco or have been exposed to passive smoking. The use of alternative 15 products such as electronic cigarettes (e-cigarettes) are gaining in popularity but information about their effects is uncertain. Little research has yet been done about the long-term health effects of e-cigarettes and the nicotine dispensed by e-cigarettes is highly addictive. The illegal tobacco market still counts for 1 in every 10 cigarettes consumed globally. In addition, tobacco companies still spend tens of billions of dollars 20 each year on advertising and promoting tobacco products and sponsoring events. They continuously challenge the regulatory measures governments are taking. (Source: adapted from http://www.who.int/topics/tobacco/en/ and http://www.who.int/ mediacentre/commentaries/reducing-tobacco-use/en/) Extract B Free market approach Are free markets incompatible with good health? If the solution to every problem involves banning advertising, raising prices and restricting availability, you might easily conclude that the free market is the disease and government regulation is the cure. From this perspective, the providers of food, alcohol and tobacco are determined to push the most unhealthy products on the public at the lowest prices. 5 Contrary to this viewpoint, the profit motive is not unhealthy. Businesses have an obvious incentive to keep their customers alive and customers have a strong incentive to seek out healthier options. Any company that can make a scientifically sound health claim gains a competitive advantage over its rivals. Health sells. In contrast, government regulation can lead to negative health outcomes. Markets can correct themselves long before 10 government failures are even acknowledged. Over a million Britons, almost all of whom are smokers or ex-smokers, use e-cigarettes, as a less hazardous product than cigarettes and yet e-cigarettes face increased regulations and in many countries they are banned. It is neither consistent nor ethical to prevent smokers from switching to much safer alternatives. Efforts to regulate e-cigarettes are a far greater threat to public health than 15 the products themselves. We argue that the interests of consumers are nearly always better advanced by the provision of accurate information and free choice than by prohibitions and regulations. The government policy of small but steady tax rises on tobacco and ever-larger warning labels is becoming less effective and leads to unintended consequences. 20 (Source: adapted from http://www.iea.org.uk/blog/free-market-solutions-in-health- should-be-allowed-to-flourish, Christopher Snowdon, 11th July 2013)
(g) Evaluate the impact of government intervention in the cigarette market. (20)
June 2017 · AS Paper 2 · Q1(a) 2 marks AO2=2 Calculation inflation
Data and extracts for question 11 UK Consumer Prices Index (the base year 2005=100) September 2013 126.8 September 2014 128.4 September 2015 128.2 (Source: http://www.ons.gov.uk/ons/publications/re-reference- tables.html?edition=tcm%3A77-323657)
(a) Calculate the percentage change in the UK Consumer Prices Index from September 2014 to September 2015. You are advised to show your working. (2)
June 2017 · AS Paper 2 · Q2(a) 3 marks AO1=1, AO2=1, AO3=1 Short answer unemployment
Data and extracts for question 22 Between 2008 and 2014 the number of people in the UK looking to work longer hours and therefore receive more total pay increased from 76 482 to 142 788. Over the same period the unemployment rate fell to 5.7%. (Sources: https://www.gov.uk/government/statistics/numbers-of-part-timers- seeking-full-time-employment and http://www.ons.gov.uk/ons/ taxonomy/index.html?nscl=Unemployment+Rates#tab-data-tables)
(a) With reference to the statement above, explain the term ‘under-employment’. (3)
June 2017 · AS Paper 2 · Q4(a) 2 marks AO2=2 Diagram national income and the multiplierfiscal and monetary policy
Data and extracts for question 44 The Chancellor announced in the 2015 Budget that the personal allowance (the annual income that can be earned before starting to pay income tax) would increase from £10 600 to £11 000 in April 2016. This means most consumers will pay less income tax. (Source: adapted from http://www.telegraph.co.uk/finance/personalfinance/ how-budget-affect-me/11721785/Budget-2015-what-to-expect- for-income-tax-and-the-personal-allowance.html)
(a) Annotate the aggregate demand and aggregate supply diagram below to show the likely impact of the increase in the personal allowance on the UK’s price level and real output. (2)
June 2017 · AS Paper 2 · Q5(a) 3 marks AO1=1, AO2=1, AO3=1 Short answer aggregate demand
Data and extracts for question 55 The chart below shows the results from a survey of UK consumers’ confidence in their financial situation. A negative balance means that, on average, consumers reported their financial situation got worse, a positive balance means they reported it improved and a zero balance indicates no change. This is recorded on a scale from –100 to +100. UK consumer confidence 20 15 10 5 0 –5 –10 –15 –20 –25 –30 2008 2009 2010 2011 2012 2013 2014 2015 (Source: http://www.ons.gov.uk/ons/dcp171778_418064.pdf)
(a) Explain one likely reason for the change in consumer confidence between 2012 and 2015. (3)
June 2017 · AS Paper 2 · Q6(a) 4 marks AO1=2, AO2=2 Short answer aggregate demand
Data and extracts for question 6UK economic recovery Figure 1: Components of aggregate demand in selected countries 2014 Government Exports - Country Consumption Investment spending Imports UK 66% 14% 21% –2% Germany 57% 17% 19% 6% France 57% 20% 25% –2% China 34% 49% 14% 3% NB: Figures may not add up to 100% due to rounding calculations. (Source: World Bank 2014) Figure 2: Nominal GDP per capita at Purchasing Power Parities (PPPs) (the base year 2000=100) 150 140 130 120 110 100 90 0 2000 2002 2004 2006 2008 2010 2012 2014 France Germany United Kingdom (Source: https://www.imf.org) Extract A The UK economy – a strange recovery At the Autumn Statement in November 2015, the Chancellor of the Exchequer had good reason to cheer his economic record. The UK economy appeared to have returned towards its long-term trend in the rate of economic growth. GDP growth has remained strong, with output rising at the highest rate in the G7 group of seven major industrialised countries. Unemployment continued to drop and business 5 investment grew by 5%. However, a number of concerns remain, particularly in relation to the UK’s current account deficit, which reached a record high of 6% of GDP in the third quarter of 2014. This was primarily a result of a sharp decline in the rate of return on UK investments overseas. Low export growth meant that the UK’s trade deficit persisted. 10 In 2012, the Chancellor had announced a target for the UK to export £1 trillion of goods and services by 2020, which would require an annual growth rate of 8%. However, the annual growth in UK exports had reached just 2.7%. The Office for Budget Responsibility (OBR) forecast that UK exports will only reach £630 billion by 2020 – a third lower than the government’s target. 15 Exports in services continued to grow in 2015, but the UK’s goods industries were struggling. It was particularly concerning that data showed output in the UK’s construction and manufacturing industries falling. Indeed, the output of the manufacturing sector remained 6.3% below its pre-recession peak. Households, meanwhile, are set to become even more indebted over the coming years. 20 It is projected that the household gross debt to income ratio will rise by 26 percentage points between 2015 to 2020, returning to levels last seen before the Global Financial Crisis. The economy did not appear to be rebalancing away from consumer driven growth towards export-led growth, making another recession almost inevitable. Fundamental to this problem is the UK’s low productivity, which in 2015 remains 25 around 20 percentage points below the average for the rest of the G7. It is vital that the government tackles this problem, particularly in the sectors that are currently facing difficulties. This will require relaxing the planning system to promote more house-building, the removal of burdens on UK manufacturers such as carbon taxes, finally getting shale gas exploration going, and reforming apprenticeships to rapidly 30 improve skills in construction, manufacturing and technology. (Source: adapted from http://www.cityam.com/229481/chancellor-beware- uk-not-out-woods-yet, 25 November 2015 by Daniel Mahoney)
(a) With reference to Figure 1, explain the term ‘net trade’. (4)
June 2017 · AS Paper 2 · Q6(b) 10 marks AO1=2, AO2=2, AO3=2, AO4=4 10-mark response balance of paymentsaggregate demand
Data and extracts for question 6UK economic recovery Figure 1: Components of aggregate demand in selected countries 2014 Government Exports - Country Consumption Investment spending Imports UK 66% 14% 21% –2% Germany 57% 17% 19% 6% France 57% 20% 25% –2% China 34% 49% 14% 3% NB: Figures may not add up to 100% due to rounding calculations. (Source: World Bank 2014) Figure 2: Nominal GDP per capita at Purchasing Power Parities (PPPs) (the base year 2000=100) 150 140 130 120 110 100 90 0 2000 2002 2004 2006 2008 2010 2012 2014 France Germany United Kingdom (Source: https://www.imf.org) Extract A The UK economy – a strange recovery At the Autumn Statement in November 2015, the Chancellor of the Exchequer had good reason to cheer his economic record. The UK economy appeared to have returned towards its long-term trend in the rate of economic growth. GDP growth has remained strong, with output rising at the highest rate in the G7 group of seven major industrialised countries. Unemployment continued to drop and business 5 investment grew by 5%. However, a number of concerns remain, particularly in relation to the UK’s current account deficit, which reached a record high of 6% of GDP in the third quarter of 2014. This was primarily a result of a sharp decline in the rate of return on UK investments overseas. Low export growth meant that the UK’s trade deficit persisted. 10 In 2012, the Chancellor had announced a target for the UK to export £1 trillion of goods and services by 2020, which would require an annual growth rate of 8%. However, the annual growth in UK exports had reached just 2.7%. The Office for Budget Responsibility (OBR) forecast that UK exports will only reach £630 billion by 2020 – a third lower than the government’s target. 15 Exports in services continued to grow in 2015, but the UK’s goods industries were struggling. It was particularly concerning that data showed output in the UK’s construction and manufacturing industries falling. Indeed, the output of the manufacturing sector remained 6.3% below its pre-recession peak. Households, meanwhile, are set to become even more indebted over the coming years. 20 It is projected that the household gross debt to income ratio will rise by 26 percentage points between 2015 to 2020, returning to levels last seen before the Global Financial Crisis. The economy did not appear to be rebalancing away from consumer driven growth towards export-led growth, making another recession almost inevitable. Fundamental to this problem is the UK’s low productivity, which in 2015 remains 25 around 20 percentage points below the average for the rest of the G7. It is vital that the government tackles this problem, particularly in the sectors that are currently facing difficulties. This will require relaxing the planning system to promote more house-building, the removal of burdens on UK manufacturers such as carbon taxes, finally getting shale gas exploration going, and reforming apprenticeships to rapidly 30 improve skills in construction, manufacturing and technology. (Source: adapted from http://www.cityam.com/229481/chancellor-beware- uk-not-out-woods-yet, 25 November 2015 by Daniel Mahoney)
(b) With reference to the information provided and your own knowledge, assess the likely causes of the UK’s trade deficit. (10)
June 2017 · AS Paper 2 · Q6(c) 5 marks AO1=1, AO2=2, AO3=2 Short answer aggregate demand
Data and extracts for question 6UK economic recovery Figure 1: Components of aggregate demand in selected countries 2014 Government Exports - Country Consumption Investment spending Imports UK 66% 14% 21% –2% Germany 57% 17% 19% 6% France 57% 20% 25% –2% China 34% 49% 14% 3% NB: Figures may not add up to 100% due to rounding calculations. (Source: World Bank 2014) Figure 2: Nominal GDP per capita at Purchasing Power Parities (PPPs) (the base year 2000=100) 150 140 130 120 110 100 90 0 2000 2002 2004 2006 2008 2010 2012 2014 France Germany United Kingdom (Source: https://www.imf.org) Extract A The UK economy – a strange recovery At the Autumn Statement in November 2015, the Chancellor of the Exchequer had good reason to cheer his economic record. The UK economy appeared to have returned towards its long-term trend in the rate of economic growth. GDP growth has remained strong, with output rising at the highest rate in the G7 group of seven major industrialised countries. Unemployment continued to drop and business 5 investment grew by 5%. However, a number of concerns remain, particularly in relation to the UK’s current account deficit, which reached a record high of 6% of GDP in the third quarter of 2014. This was primarily a result of a sharp decline in the rate of return on UK investments overseas. Low export growth meant that the UK’s trade deficit persisted. 10 In 2012, the Chancellor had announced a target for the UK to export £1 trillion of goods and services by 2020, which would require an annual growth rate of 8%. However, the annual growth in UK exports had reached just 2.7%. The Office for Budget Responsibility (OBR) forecast that UK exports will only reach £630 billion by 2020 – a third lower than the government’s target. 15 Exports in services continued to grow in 2015, but the UK’s goods industries were struggling. It was particularly concerning that data showed output in the UK’s construction and manufacturing industries falling. Indeed, the output of the manufacturing sector remained 6.3% below its pre-recession peak. Households, meanwhile, are set to become even more indebted over the coming years. 20 It is projected that the household gross debt to income ratio will rise by 26 percentage points between 2015 to 2020, returning to levels last seen before the Global Financial Crisis. The economy did not appear to be rebalancing away from consumer driven growth towards export-led growth, making another recession almost inevitable. Fundamental to this problem is the UK’s low productivity, which in 2015 remains 25 around 20 percentage points below the average for the rest of the G7. It is vital that the government tackles this problem, particularly in the sectors that are currently facing difficulties. This will require relaxing the planning system to promote more house-building, the removal of burdens on UK manufacturers such as carbon taxes, finally getting shale gas exploration going, and reforming apprenticeships to rapidly 30 improve skills in construction, manufacturing and technology. (Source: adapted from http://www.cityam.com/229481/chancellor-beware- uk-not-out-woods-yet, 25 November 2015 by Daniel Mahoney)
(c) With reference to Extract A, paragraph 2, explain one likely influence on UK investment. (5)
June 2017 · AS Paper 2 · Q6(d) 6 marks AO1=2, AO2=2, AO3=2 Short answer measuring economic growth
Data and extracts for question 6UK economic recovery Figure 1: Components of aggregate demand in selected countries 2014 Government Exports - Country Consumption Investment spending Imports UK 66% 14% 21% –2% Germany 57% 17% 19% 6% France 57% 20% 25% –2% China 34% 49% 14% 3% NB: Figures may not add up to 100% due to rounding calculations. (Source: World Bank 2014) Figure 2: Nominal GDP per capita at Purchasing Power Parities (PPPs) (the base year 2000=100) 150 140 130 120 110 100 90 0 2000 2002 2004 2006 2008 2010 2012 2014 France Germany United Kingdom (Source: https://www.imf.org) Extract A The UK economy – a strange recovery At the Autumn Statement in November 2015, the Chancellor of the Exchequer had good reason to cheer his economic record. The UK economy appeared to have returned towards its long-term trend in the rate of economic growth. GDP growth has remained strong, with output rising at the highest rate in the G7 group of seven major industrialised countries. Unemployment continued to drop and business 5 investment grew by 5%. However, a number of concerns remain, particularly in relation to the UK’s current account deficit, which reached a record high of 6% of GDP in the third quarter of 2014. This was primarily a result of a sharp decline in the rate of return on UK investments overseas. Low export growth meant that the UK’s trade deficit persisted. 10 In 2012, the Chancellor had announced a target for the UK to export £1 trillion of goods and services by 2020, which would require an annual growth rate of 8%. However, the annual growth in UK exports had reached just 2.7%. The Office for Budget Responsibility (OBR) forecast that UK exports will only reach £630 billion by 2020 – a third lower than the government’s target. 15 Exports in services continued to grow in 2015, but the UK’s goods industries were struggling. It was particularly concerning that data showed output in the UK’s construction and manufacturing industries falling. Indeed, the output of the manufacturing sector remained 6.3% below its pre-recession peak. Households, meanwhile, are set to become even more indebted over the coming years. 20 It is projected that the household gross debt to income ratio will rise by 26 percentage points between 2015 to 2020, returning to levels last seen before the Global Financial Crisis. The economy did not appear to be rebalancing away from consumer driven growth towards export-led growth, making another recession almost inevitable. Fundamental to this problem is the UK’s low productivity, which in 2015 remains 25 around 20 percentage points below the average for the rest of the G7. It is vital that the government tackles this problem, particularly in the sectors that are currently facing difficulties. This will require relaxing the planning system to promote more house-building, the removal of burdens on UK manufacturers such as carbon taxes, finally getting shale gas exploration going, and reforming apprenticeships to rapidly 30 improve skills in construction, manufacturing and technology. (Source: adapted from http://www.cityam.com/229481/chancellor-beware- uk-not-out-woods-yet, 25 November 2015 by Daniel Mahoney)
(d) With reference to Figure 2 and Extract A, explain two likely reasons why the growth of the UK’s nominal GDP per capita at PPPs was slower than that of Germany after 2010. (6)
June 2017 · AS Paper 2 · Q6(e) 15 marks AO1=3, AO2=3, AO3=3, AO4=6 15-mark response supply side policies
Data and extracts for question 6UK economic recovery Figure 1: Components of aggregate demand in selected countries 2014 Government Exports - Country Consumption Investment spending Imports UK 66% 14% 21% –2% Germany 57% 17% 19% 6% France 57% 20% 25% –2% China 34% 49% 14% 3% NB: Figures may not add up to 100% due to rounding calculations. (Source: World Bank 2014) Figure 2: Nominal GDP per capita at Purchasing Power Parities (PPPs) (the base year 2000=100) 150 140 130 120 110 100 90 0 2000 2002 2004 2006 2008 2010 2012 2014 France Germany United Kingdom (Source: https://www.imf.org) Extract A The UK economy – a strange recovery At the Autumn Statement in November 2015, the Chancellor of the Exchequer had good reason to cheer his economic record. The UK economy appeared to have returned towards its long-term trend in the rate of economic growth. GDP growth has remained strong, with output rising at the highest rate in the G7 group of seven major industrialised countries. Unemployment continued to drop and business 5 investment grew by 5%. However, a number of concerns remain, particularly in relation to the UK’s current account deficit, which reached a record high of 6% of GDP in the third quarter of 2014. This was primarily a result of a sharp decline in the rate of return on UK investments overseas. Low export growth meant that the UK’s trade deficit persisted. 10 In 2012, the Chancellor had announced a target for the UK to export £1 trillion of goods and services by 2020, which would require an annual growth rate of 8%. However, the annual growth in UK exports had reached just 2.7%. The Office for Budget Responsibility (OBR) forecast that UK exports will only reach £630 billion by 2020 – a third lower than the government’s target. 15 Exports in services continued to grow in 2015, but the UK’s goods industries were struggling. It was particularly concerning that data showed output in the UK’s construction and manufacturing industries falling. Indeed, the output of the manufacturing sector remained 6.3% below its pre-recession peak. Households, meanwhile, are set to become even more indebted over the coming years. 20 It is projected that the household gross debt to income ratio will rise by 26 percentage points between 2015 to 2020, returning to levels last seen before the Global Financial Crisis. The economy did not appear to be rebalancing away from consumer driven growth towards export-led growth, making another recession almost inevitable. Fundamental to this problem is the UK’s low productivity, which in 2015 remains 25 around 20 percentage points below the average for the rest of the G7. It is vital that the government tackles this problem, particularly in the sectors that are currently facing difficulties. This will require relaxing the planning system to promote more house-building, the removal of burdens on UK manufacturers such as carbon taxes, finally getting shale gas exploration going, and reforming apprenticeships to rapidly 30 improve skills in construction, manufacturing and technology. (Source: adapted from http://www.cityam.com/229481/chancellor-beware- uk-not-out-woods-yet, 25 November 2015 by Daniel Mahoney)
(e) Evaluate policies the government could use to increase the UK’s productivity. (15)
June 2017 · AS Paper 2 · Q6(f) 20 marks AO1=4, AO2=4, AO3=6, AO4=6 20-mark essay Either/or economic growth and the trade cycle
Data and extracts for question 6UK economic recovery Figure 1: Components of aggregate demand in selected countries 2014 Government Exports - Country Consumption Investment spending Imports UK 66% 14% 21% –2% Germany 57% 17% 19% 6% France 57% 20% 25% –2% China 34% 49% 14% 3% NB: Figures may not add up to 100% due to rounding calculations. (Source: World Bank 2014) Figure 2: Nominal GDP per capita at Purchasing Power Parities (PPPs) (the base year 2000=100) 150 140 130 120 110 100 90 0 2000 2002 2004 2006 2008 2010 2012 2014 France Germany United Kingdom (Source: https://www.imf.org) Extract A The UK economy – a strange recovery At the Autumn Statement in November 2015, the Chancellor of the Exchequer had good reason to cheer his economic record. The UK economy appeared to have returned towards its long-term trend in the rate of economic growth. GDP growth has remained strong, with output rising at the highest rate in the G7 group of seven major industrialised countries. Unemployment continued to drop and business 5 investment grew by 5%. However, a number of concerns remain, particularly in relation to the UK’s current account deficit, which reached a record high of 6% of GDP in the third quarter of 2014. This was primarily a result of a sharp decline in the rate of return on UK investments overseas. Low export growth meant that the UK’s trade deficit persisted. 10 In 2012, the Chancellor had announced a target for the UK to export £1 trillion of goods and services by 2020, which would require an annual growth rate of 8%. However, the annual growth in UK exports had reached just 2.7%. The Office for Budget Responsibility (OBR) forecast that UK exports will only reach £630 billion by 2020 – a third lower than the government’s target. 15 Exports in services continued to grow in 2015, but the UK’s goods industries were struggling. It was particularly concerning that data showed output in the UK’s construction and manufacturing industries falling. Indeed, the output of the manufacturing sector remained 6.3% below its pre-recession peak. Households, meanwhile, are set to become even more indebted over the coming years. 20 It is projected that the household gross debt to income ratio will rise by 26 percentage points between 2015 to 2020, returning to levels last seen before the Global Financial Crisis. The economy did not appear to be rebalancing away from consumer driven growth towards export-led growth, making another recession almost inevitable. Fundamental to this problem is the UK’s low productivity, which in 2015 remains 25 around 20 percentage points below the average for the rest of the G7. It is vital that the government tackles this problem, particularly in the sectors that are currently facing difficulties. This will require relaxing the planning system to promote more house-building, the removal of burdens on UK manufacturers such as carbon taxes, finally getting shale gas exploration going, and reforming apprenticeships to rapidly 30 improve skills in construction, manufacturing and technology. (Source: adapted from http://www.cityam.com/229481/chancellor-beware- uk-not-out-woods-yet, 25 November 2015 by Daniel Mahoney)
(f) Evaluate the benefits of economic growth to the UK given that ‘a number of concerns remain’ in the UK economy (Extract A, line 7). (20)
June 2017 · AS Paper 2 · Q6(g) 20 marks AO1=4, AO2=4, AO3=6, AO4=6 20-mark essay Either/or economic growth and the trade cycle
Data and extracts for question 6UK economic recovery Figure 1: Components of aggregate demand in selected countries 2014 Government Exports - Country Consumption Investment spending Imports UK 66% 14% 21% –2% Germany 57% 17% 19% 6% France 57% 20% 25% –2% China 34% 49% 14% 3% NB: Figures may not add up to 100% due to rounding calculations. (Source: World Bank 2014) Figure 2: Nominal GDP per capita at Purchasing Power Parities (PPPs) (the base year 2000=100) 150 140 130 120 110 100 90 0 2000 2002 2004 2006 2008 2010 2012 2014 France Germany United Kingdom (Source: https://www.imf.org) Extract A The UK economy – a strange recovery At the Autumn Statement in November 2015, the Chancellor of the Exchequer had good reason to cheer his economic record. The UK economy appeared to have returned towards its long-term trend in the rate of economic growth. GDP growth has remained strong, with output rising at the highest rate in the G7 group of seven major industrialised countries. Unemployment continued to drop and business 5 investment grew by 5%. However, a number of concerns remain, particularly in relation to the UK’s current account deficit, which reached a record high of 6% of GDP in the third quarter of 2014. This was primarily a result of a sharp decline in the rate of return on UK investments overseas. Low export growth meant that the UK’s trade deficit persisted. 10 In 2012, the Chancellor had announced a target for the UK to export £1 trillion of goods and services by 2020, which would require an annual growth rate of 8%. However, the annual growth in UK exports had reached just 2.7%. The Office for Budget Responsibility (OBR) forecast that UK exports will only reach £630 billion by 2020 – a third lower than the government’s target. 15 Exports in services continued to grow in 2015, but the UK’s goods industries were struggling. It was particularly concerning that data showed output in the UK’s construction and manufacturing industries falling. Indeed, the output of the manufacturing sector remained 6.3% below its pre-recession peak. Households, meanwhile, are set to become even more indebted over the coming years. 20 It is projected that the household gross debt to income ratio will rise by 26 percentage points between 2015 to 2020, returning to levels last seen before the Global Financial Crisis. The economy did not appear to be rebalancing away from consumer driven growth towards export-led growth, making another recession almost inevitable. Fundamental to this problem is the UK’s low productivity, which in 2015 remains 25 around 20 percentage points below the average for the rest of the G7. It is vital that the government tackles this problem, particularly in the sectors that are currently facing difficulties. This will require relaxing the planning system to promote more house-building, the removal of burdens on UK manufacturers such as carbon taxes, finally getting shale gas exploration going, and reforming apprenticeships to rapidly 30 improve skills in construction, manufacturing and technology. (Source: adapted from http://www.cityam.com/229481/chancellor-beware- uk-not-out-woods-yet, 25 November 2015 by Daniel Mahoney)
(g) Evaluate the view that another recession is ‘inevitable’ in the UK (Extract A, line 24). (20)
June 2017 · Paper 1 · Q1(a) 4 marks AO1=2, AO2=2 Calculation supply and demand
Data and extracts for question 11 The table shows market data for e-cigarette kits. The original equilibrium price is £23. Quantity Quantity New quantity New quantity Price demanded per supplied per demanded per supplied per £ month (000) month (000) month (000) month (000) 25 5 9 24 6 8 23 7 7 22 8 6 21 9 5 As a result of a successful advertising campaign, demand increased by 3 000 e-cigarette kits at all prices. At the same time production costs fell leading to an increase in supply of 1 000 e-cigarette kits at all prices.
(a) Calculate the new equilibrium price and quantity following the successful advertising campaign and the fall in production costs. Use the last two columns for your working. (4)
June 2017 · Paper 1 · Q2(a) 2 marks AO2=2 Calculation price elasticity of demand
Data and extracts for question 22 Between 2010 and 2015 the average price of tea in the UK increased from £7.20 per kilo to £8.48 per kilo. Over the same period the quantity of tea purchased fell from 97 million kilos to 76 million kilos. (Source: http://www.theguardian.com/lifeandstyle/shortcuts/2015/aug/05/brew-do- you-think-you-are-why-tea-needs-to-copy-coffee-in-order-to-survive)
(a) Assume that the change in the quantity of tea purchased was only caused by the change in the price of tea. Calculate the price elasticity of demand for tea in response to the rise in its price. You are advised to show your working. (2)
June 2017 · Paper 1 · Q2(b) 2 marks AO1=1, AO3=1 Calculation price elasticity of demand
Data and extracts for question 22 Between 2010 and 2015 the average price of tea in the UK increased from £7.20 per kilo to £8.48 per kilo. Over the same period the quantity of tea purchased fell from 97 million kilos to 76 million kilos. (Source: http://www.theguardian.com/lifeandstyle/shortcuts/2015/aug/05/brew-do- you-think-you-are-why-tea-needs-to-copy-coffee-in-order-to-survive)
(b) Calculate the change in total sales revenue for UK tea retailers between 2010 and 2015. You are advised to show your working. (2)
June 2017 · Paper 1 · Q3(a) 2 marks AO2=2 Calculation indirect taxes and subsidies
Data and extracts for question 33 The Indian government has introduced a subsidy on domestic cooking gas cylinders in the city of Mumbai. The diagram below shows the effect following the introduction of the subsidy. Price per cylinder (Rupees) S S1 1023 526 455 D 0 1.5 1.8 Quantity of gas cylinders, daily (million) (Source: https://www.iocl.com/products/indanegas.aspx and http://indianexpress.com/article/business/business-others/lpg- subsidy-fixed-at-rs-568-price-to-change-after-march/)
(a) Calculate the total domestic cooking gas subsidy paid daily by the Indian government. You are advised to show your working. (2)
June 2017 · Paper 1 · Q3(b)(i) 1 mark Calculation indirect taxes and subsidies
Data and extracts for question 33 The Indian government has introduced a subsidy on domestic cooking gas cylinders in the city of Mumbai. The diagram below shows the effect following the introduction of the subsidy. Price per cylinder (Rupees) S S1 1023 526 455 D 0 1.5 1.8 Quantity of gas cylinders, daily (million) (Source: https://www.iocl.com/products/indanegas.aspx and http://indianexpress.com/article/business/business-others/lpg- subsidy-fixed-at-rs-568-price-to-change-after-march/)
(b) Calculate the percentage share of the total subsidy received by: (i) consumers (1)
June 2017 · Paper 1 · Q3(b)(ii) 1 mark Calculation indirect taxes and subsidies
Data and extracts for question 33 The Indian government has introduced a subsidy on domestic cooking gas cylinders in the city of Mumbai. The diagram below shows the effect following the introduction of the subsidy. Price per cylinder (Rupees) S S1 1023 526 455 D 0 1.5 1.8 Quantity of gas cylinders, daily (million) (Source: https://www.iocl.com/products/indanegas.aspx and http://indianexpress.com/article/business/business-others/lpg- subsidy-fixed-at-rs-568-price-to-change-after-march/)
(b) Calculate the percentage share of the total subsidy received by: (ii) producers (1)
June 2017 · Paper 1 · Q4(a) 4 marks AO1=2, AO2=2 Diagram revenues costs and profits
Data and extracts for question 44 In 2015 JCB, the construction equipment manufacturer, experienced a 6% fall in revenue. This resulted from a reduction in sales of construction equipment to emerging markets.
(a) Draw a cost and revenue diagram to show the likely impact of a reduction in sales of construction equipment on JCB’s profits. (4)
June 2017 · Paper 1 · Q5(c) 2 marks AO2=2 Calculation revenues costs and profits
Data and extracts for question 55 Figure 1 shows the distribution of the revenue received from the sale of a Starbucks cappuccino drink priced at £2.27 in 2015. Figure 1 Coffee 4% Milk 4% Packaging 8% Rent/rates 15% Admin/ overheads 15% Labour 24% VAT 17% Profit 13% (Source: adapted from Allegra strategies research and analysis, reported in The Times, 27th January 2015)
(c) With reference to Figure 1, calculate the profit (in pence) for a cappuccino drink. You are advised to show your working. (2)
June 2017 · Paper 1 · Q6(a) 5 marks AO1=1, AO2=1, AO3=3 Calculation oligopoly
Data and extracts for question 6Supermarket price war, food waste and possible mergers Figure 1: Market shares by total revenue in the UK supermarket sector, 2010 and 2015 2010 2015 Others Others Lidl Lidl 7.7% 6.7% Aldi 2.2% Aldi 4.0% 2.8% 5.5% Tesco Tesco 30.8% 28.6% Waitrose Waitrose 4.1% 5.1% Co-op Co-op 7.1% 6.2% Morrisons Morrisons Asda Asda 11.6% 10.9% 17.6% 16.5% Sainbury’s Sainbury’s 16.1% 16.5% (Source: Kantar worldpanel, http://www.kantarworldpanel.com/en/ grocery-market-share/great-britain/snapshot/11.10.15/) Figure 2: Proportion of food suppliers reporting that the following supermarkets fail to meet the Groceries Code of Conduct, 2015. Aldi Sainsbury’s Lidl Waitrose Asda Co-op Morrisons Tesco 0 5 10 15 20 25 30 35 % (Source: YouGov poll of more than 1100 food suppliers to supermarkets. Reported in The Times, 23 June 2015) Extract A Supermarket price war puts pressure on their food suppliers The number of food suppliers (to supermarkets) struggling to remain in business has increased by more than 50% over the past year as supermarkets engage in an intense price war. It has never been tougher for the UK’s food suppliers according to a study by accountants Begbies Traynor. It blames aggressive price-cutting by the supermarkets 5 and delays in payments to food suppliers as the main causes of the difficulties. Further problems include food suppliers being forced to pay excessive amounts for packaging specified by supermarkets and funding in-store promotions. Almost 90% of struggling food suppliers are small and medium-sized businesses. The price war has contributed to food prices paid by consumers falling by 1.7% over the 10 past two years. The market shares of the big four supermarkets – Tesco, Asda, Sainsbury’s and Morrisons – are under pressure as shopping habits change. Many consumers are switching from one main weekly shop to shopping more frequently at local discount stores such as Aldi and Lidl or purchasing goods online from other grocery retailers. 15 The big four supermarkets have responded by putting more pressure on their suppliers despite an investigation by the Groceries Code Adjudicator (GCA). The GCA has the power to fine supermarkets up to 1% of their annual sales revenue if they break the Groceries Code of Conduct. A YouGov study found considerable differences between the supermarkets in meeting the Code with Aldi performing well but Tesco badly. Despite 20 the Groceries Code, many food suppliers are reluctant to complain for fear of losing contracts with the supermarkets. (Source: adapted from ‘Supermarket price war takes toll on UK food suppliers’. Rupert Jones, The Guardian, 20th July 2015) Extract B Food waste in the supply chain A report from the British Retail Consortium reveals that supermarkets are directly responsible for around 0.2 million tonnes of food waste every year. This is due to the expiry of use-by-dates and poor handling of stock. However, 4.1 million tonnes of food waste occurs annually in the food supply chain 5 before it even reaches the supermarkets, indicating the existence of information gaps. The supermarkets are cooperating with food suppliers and farmers to try to reduce this waste. This involves improving forecasts for supply and demand of food and increasing the reliability of transportation and storage. Consumers, the final stage of the supply chain, waste a further 7 million tonnes of 10 food each year. This suggests irrational behaviour. Supermarkets are also working with consumers to reduce the waste by providing advice on how to store and use leftover food. The development of packaging designs to keep food fresher for longer is one of the innovations under way to reduce waste. (Source: adapted from ‘Supermarkets tally up food waste bill’. Will Nicholls, in Businessgreen, 19th January 2015. http://www.businessgreen.com/ bg/news/2390792/supermarkets-tally-up-food-waste-bill) Extract C Proposed merger activity in the supermarket sector Analysts at Société Générale, an investment bank, have recommended a merger between Sainsbury’s and Morrisons. They claim it would lead to increased economies of scale and market power for the combined business. Such a merger between the third and fourth largest supermarkets in Britain would have been unrealistic a few years ago due 5 to concerns of its impact in reducing competition. However, the chances of getting permission from the Competition and Markets Authority have increased following the growth of Aldi and Lidl. Giant mergers have been approved in other sectors such as Lloyds-HBOS (banking) and British Telecom-EE (telecommunications). The suggested merger would have its challenges. There is considerable overlap between 10 the locations of the stores and the enlarged company would require the rationalisation and co-ordination of hundreds of thousands of employees. A new expensive IT system is likely to be required and the underlying difficult market trends would remain in the food retailing industry. (Source: adapted from ‘Tesco-bury and AS-Morrisons. Could Britain’s supermarkets be about to merge?’ Graham Ruddick, in The Telegraph, 16th December, 2015. http://www.telegraph. co.uk/finance/newsbysector/retailandconsumer/11699724/Tesco-burys-and-AS-Morrisons.- Could-Britains-supermarkets-be-about-to-merge.html)
(a) With reference to Figure 1 and Extract A, explain one likely reason for the change in the four-firm concentration ratio of the supermarket sector between 2010 and 2015. (5)
June 2017 · Paper 1 · Q6(b) 12 marks AO1=2, AO2=2, AO3=4, AO4=4 12-mark response monopsony and contestability
Data and extracts for question 6Supermarket price war, food waste and possible mergers Figure 1: Market shares by total revenue in the UK supermarket sector, 2010 and 2015 2010 2015 Others Others Lidl Lidl 7.7% 6.7% Aldi 2.2% Aldi 4.0% 2.8% 5.5% Tesco Tesco 30.8% 28.6% Waitrose Waitrose 4.1% 5.1% Co-op Co-op 7.1% 6.2% Morrisons Morrisons Asda Asda 11.6% 10.9% 17.6% 16.5% Sainbury’s Sainbury’s 16.1% 16.5% (Source: Kantar worldpanel, http://www.kantarworldpanel.com/en/ grocery-market-share/great-britain/snapshot/11.10.15/) Figure 2: Proportion of food suppliers reporting that the following supermarkets fail to meet the Groceries Code of Conduct, 2015. Aldi Sainsbury’s Lidl Waitrose Asda Co-op Morrisons Tesco 0 5 10 15 20 25 30 35 % (Source: YouGov poll of more than 1100 food suppliers to supermarkets. Reported in The Times, 23 June 2015) Extract A Supermarket price war puts pressure on their food suppliers The number of food suppliers (to supermarkets) struggling to remain in business has increased by more than 50% over the past year as supermarkets engage in an intense price war. It has never been tougher for the UK’s food suppliers according to a study by accountants Begbies Traynor. It blames aggressive price-cutting by the supermarkets 5 and delays in payments to food suppliers as the main causes of the difficulties. Further problems include food suppliers being forced to pay excessive amounts for packaging specified by supermarkets and funding in-store promotions. Almost 90% of struggling food suppliers are small and medium-sized businesses. The price war has contributed to food prices paid by consumers falling by 1.7% over the 10 past two years. The market shares of the big four supermarkets – Tesco, Asda, Sainsbury’s and Morrisons – are under pressure as shopping habits change. Many consumers are switching from one main weekly shop to shopping more frequently at local discount stores such as Aldi and Lidl or purchasing goods online from other grocery retailers. 15 The big four supermarkets have responded by putting more pressure on their suppliers despite an investigation by the Groceries Code Adjudicator (GCA). The GCA has the power to fine supermarkets up to 1% of their annual sales revenue if they break the Groceries Code of Conduct. A YouGov study found considerable differences between the supermarkets in meeting the Code with Aldi performing well but Tesco badly. Despite 20 the Groceries Code, many food suppliers are reluctant to complain for fear of losing contracts with the supermarkets. (Source: adapted from ‘Supermarket price war takes toll on UK food suppliers’. Rupert Jones, The Guardian, 20th July 2015) Extract B Food waste in the supply chain A report from the British Retail Consortium reveals that supermarkets are directly responsible for around 0.2 million tonnes of food waste every year. This is due to the expiry of use-by-dates and poor handling of stock. However, 4.1 million tonnes of food waste occurs annually in the food supply chain 5 before it even reaches the supermarkets, indicating the existence of information gaps. The supermarkets are cooperating with food suppliers and farmers to try to reduce this waste. This involves improving forecasts for supply and demand of food and increasing the reliability of transportation and storage. Consumers, the final stage of the supply chain, waste a further 7 million tonnes of 10 food each year. This suggests irrational behaviour. Supermarkets are also working with consumers to reduce the waste by providing advice on how to store and use leftover food. The development of packaging designs to keep food fresher for longer is one of the innovations under way to reduce waste. (Source: adapted from ‘Supermarkets tally up food waste bill’. Will Nicholls, in Businessgreen, 19th January 2015. http://www.businessgreen.com/ bg/news/2390792/supermarkets-tally-up-food-waste-bill) Extract C Proposed merger activity in the supermarket sector Analysts at Société Générale, an investment bank, have recommended a merger between Sainsbury’s and Morrisons. They claim it would lead to increased economies of scale and market power for the combined business. Such a merger between the third and fourth largest supermarkets in Britain would have been unrealistic a few years ago due 5 to concerns of its impact in reducing competition. However, the chances of getting permission from the Competition and Markets Authority have increased following the growth of Aldi and Lidl. Giant mergers have been approved in other sectors such as Lloyds-HBOS (banking) and British Telecom-EE (telecommunications). The suggested merger would have its challenges. There is considerable overlap between 10 the locations of the stores and the enlarged company would require the rationalisation and co-ordination of hundreds of thousands of employees. A new expensive IT system is likely to be required and the underlying difficult market trends would remain in the food retailing industry. (Source: adapted from ‘Tesco-bury and AS-Morrisons. Could Britain’s supermarkets be about to merge?’ Graham Ruddick, in The Telegraph, 16th December, 2015. http://www.telegraph. co.uk/finance/newsbysector/retailandconsumer/11699724/Tesco-burys-and-AS-Morrisons.- Could-Britains-supermarkets-be-about-to-merge.html)
(b) With reference to Figure 2 and Extract A, discuss the possible impact of supermarket monopsony power on both food suppliers and consumers. (12)
June 2017 · Paper 1 · Q6(c) 8 marks AO1=2, AO2=2, AO3=2, AO4=2 8-mark response competition policy and regulation
Data and extracts for question 6Supermarket price war, food waste and possible mergers Figure 1: Market shares by total revenue in the UK supermarket sector, 2010 and 2015 2010 2015 Others Others Lidl Lidl 7.7% 6.7% Aldi 2.2% Aldi 4.0% 2.8% 5.5% Tesco Tesco 30.8% 28.6% Waitrose Waitrose 4.1% 5.1% Co-op Co-op 7.1% 6.2% Morrisons Morrisons Asda Asda 11.6% 10.9% 17.6% 16.5% Sainbury’s Sainbury’s 16.1% 16.5% (Source: Kantar worldpanel, http://www.kantarworldpanel.com/en/ grocery-market-share/great-britain/snapshot/11.10.15/) Figure 2: Proportion of food suppliers reporting that the following supermarkets fail to meet the Groceries Code of Conduct, 2015. Aldi Sainsbury’s Lidl Waitrose Asda Co-op Morrisons Tesco 0 5 10 15 20 25 30 35 % (Source: YouGov poll of more than 1100 food suppliers to supermarkets. Reported in The Times, 23 June 2015) Extract A Supermarket price war puts pressure on their food suppliers The number of food suppliers (to supermarkets) struggling to remain in business has increased by more than 50% over the past year as supermarkets engage in an intense price war. It has never been tougher for the UK’s food suppliers according to a study by accountants Begbies Traynor. It blames aggressive price-cutting by the supermarkets 5 and delays in payments to food suppliers as the main causes of the difficulties. Further problems include food suppliers being forced to pay excessive amounts for packaging specified by supermarkets and funding in-store promotions. Almost 90% of struggling food suppliers are small and medium-sized businesses. The price war has contributed to food prices paid by consumers falling by 1.7% over the 10 past two years. The market shares of the big four supermarkets – Tesco, Asda, Sainsbury’s and Morrisons – are under pressure as shopping habits change. Many consumers are switching from one main weekly shop to shopping more frequently at local discount stores such as Aldi and Lidl or purchasing goods online from other grocery retailers. 15 The big four supermarkets have responded by putting more pressure on their suppliers despite an investigation by the Groceries Code Adjudicator (GCA). The GCA has the power to fine supermarkets up to 1% of their annual sales revenue if they break the Groceries Code of Conduct. A YouGov study found considerable differences between the supermarkets in meeting the Code with Aldi performing well but Tesco badly. Despite 20 the Groceries Code, many food suppliers are reluctant to complain for fear of losing contracts with the supermarkets. (Source: adapted from ‘Supermarket price war takes toll on UK food suppliers’. Rupert Jones, The Guardian, 20th July 2015) Extract B Food waste in the supply chain A report from the British Retail Consortium reveals that supermarkets are directly responsible for around 0.2 million tonnes of food waste every year. This is due to the expiry of use-by-dates and poor handling of stock. However, 4.1 million tonnes of food waste occurs annually in the food supply chain 5 before it even reaches the supermarkets, indicating the existence of information gaps. The supermarkets are cooperating with food suppliers and farmers to try to reduce this waste. This involves improving forecasts for supply and demand of food and increasing the reliability of transportation and storage. Consumers, the final stage of the supply chain, waste a further 7 million tonnes of 10 food each year. This suggests irrational behaviour. Supermarkets are also working with consumers to reduce the waste by providing advice on how to store and use leftover food. The development of packaging designs to keep food fresher for longer is one of the innovations under way to reduce waste. (Source: adapted from ‘Supermarkets tally up food waste bill’. Will Nicholls, in Businessgreen, 19th January 2015. http://www.businessgreen.com/ bg/news/2390792/supermarkets-tally-up-food-waste-bill) Extract C Proposed merger activity in the supermarket sector Analysts at Société Générale, an investment bank, have recommended a merger between Sainsbury’s and Morrisons. They claim it would lead to increased economies of scale and market power for the combined business. Such a merger between the third and fourth largest supermarkets in Britain would have been unrealistic a few years ago due 5 to concerns of its impact in reducing competition. However, the chances of getting permission from the Competition and Markets Authority have increased following the growth of Aldi and Lidl. Giant mergers have been approved in other sectors such as Lloyds-HBOS (banking) and British Telecom-EE (telecommunications). The suggested merger would have its challenges. There is considerable overlap between 10 the locations of the stores and the enlarged company would require the rationalisation and co-ordination of hundreds of thousands of employees. A new expensive IT system is likely to be required and the underlying difficult market trends would remain in the food retailing industry. (Source: adapted from ‘Tesco-bury and AS-Morrisons. Could Britain’s supermarkets be about to merge?’ Graham Ruddick, in The Telegraph, 16th December, 2015. http://www.telegraph. co.uk/finance/newsbysector/retailandconsumer/11699724/Tesco-burys-and-AS-Morrisons.- Could-Britains-supermarkets-be-about-to-merge.html)
(c) Examine measures the government might use to restrict the monopsony power of supermarkets. (8)
June 2017 · Paper 1 · Q6(d) 10 marks AO1=2, AO2=2, AO3=2, AO4=4 10-mark response Hard public goods and information gapsrational decision making and behavioural economics
Data and extracts for question 6Supermarket price war, food waste and possible mergers Figure 1: Market shares by total revenue in the UK supermarket sector, 2010 and 2015 2010 2015 Others Others Lidl Lidl 7.7% 6.7% Aldi 2.2% Aldi 4.0% 2.8% 5.5% Tesco Tesco 30.8% 28.6% Waitrose Waitrose 4.1% 5.1% Co-op Co-op 7.1% 6.2% Morrisons Morrisons Asda Asda 11.6% 10.9% 17.6% 16.5% Sainbury’s Sainbury’s 16.1% 16.5% (Source: Kantar worldpanel, http://www.kantarworldpanel.com/en/ grocery-market-share/great-britain/snapshot/11.10.15/) Figure 2: Proportion of food suppliers reporting that the following supermarkets fail to meet the Groceries Code of Conduct, 2015. Aldi Sainsbury’s Lidl Waitrose Asda Co-op Morrisons Tesco 0 5 10 15 20 25 30 35 % (Source: YouGov poll of more than 1100 food suppliers to supermarkets. Reported in The Times, 23 June 2015) Extract A Supermarket price war puts pressure on their food suppliers The number of food suppliers (to supermarkets) struggling to remain in business has increased by more than 50% over the past year as supermarkets engage in an intense price war. It has never been tougher for the UK’s food suppliers according to a study by accountants Begbies Traynor. It blames aggressive price-cutting by the supermarkets 5 and delays in payments to food suppliers as the main causes of the difficulties. Further problems include food suppliers being forced to pay excessive amounts for packaging specified by supermarkets and funding in-store promotions. Almost 90% of struggling food suppliers are small and medium-sized businesses. The price war has contributed to food prices paid by consumers falling by 1.7% over the 10 past two years. The market shares of the big four supermarkets – Tesco, Asda, Sainsbury’s and Morrisons – are under pressure as shopping habits change. Many consumers are switching from one main weekly shop to shopping more frequently at local discount stores such as Aldi and Lidl or purchasing goods online from other grocery retailers. 15 The big four supermarkets have responded by putting more pressure on their suppliers despite an investigation by the Groceries Code Adjudicator (GCA). The GCA has the power to fine supermarkets up to 1% of their annual sales revenue if they break the Groceries Code of Conduct. A YouGov study found considerable differences between the supermarkets in meeting the Code with Aldi performing well but Tesco badly. Despite 20 the Groceries Code, many food suppliers are reluctant to complain for fear of losing contracts with the supermarkets. (Source: adapted from ‘Supermarket price war takes toll on UK food suppliers’. Rupert Jones, The Guardian, 20th July 2015) Extract B Food waste in the supply chain A report from the British Retail Consortium reveals that supermarkets are directly responsible for around 0.2 million tonnes of food waste every year. This is due to the expiry of use-by-dates and poor handling of stock. However, 4.1 million tonnes of food waste occurs annually in the food supply chain 5 before it even reaches the supermarkets, indicating the existence of information gaps. The supermarkets are cooperating with food suppliers and farmers to try to reduce this waste. This involves improving forecasts for supply and demand of food and increasing the reliability of transportation and storage. Consumers, the final stage of the supply chain, waste a further 7 million tonnes of 10 food each year. This suggests irrational behaviour. Supermarkets are also working with consumers to reduce the waste by providing advice on how to store and use leftover food. The development of packaging designs to keep food fresher for longer is one of the innovations under way to reduce waste. (Source: adapted from ‘Supermarkets tally up food waste bill’. Will Nicholls, in Businessgreen, 19th January 2015. http://www.businessgreen.com/ bg/news/2390792/supermarkets-tally-up-food-waste-bill) Extract C Proposed merger activity in the supermarket sector Analysts at Société Générale, an investment bank, have recommended a merger between Sainsbury’s and Morrisons. They claim it would lead to increased economies of scale and market power for the combined business. Such a merger between the third and fourth largest supermarkets in Britain would have been unrealistic a few years ago due 5 to concerns of its impact in reducing competition. However, the chances of getting permission from the Competition and Markets Authority have increased following the growth of Aldi and Lidl. Giant mergers have been approved in other sectors such as Lloyds-HBOS (banking) and British Telecom-EE (telecommunications). The suggested merger would have its challenges. There is considerable overlap between 10 the locations of the stores and the enlarged company would require the rationalisation and co-ordination of hundreds of thousands of employees. A new expensive IT system is likely to be required and the underlying difficult market trends would remain in the food retailing industry. (Source: adapted from ‘Tesco-bury and AS-Morrisons. Could Britain’s supermarkets be about to merge?’ Graham Ruddick, in The Telegraph, 16th December, 2015. http://www.telegraph. co.uk/finance/newsbysector/retailandconsumer/11699724/Tesco-burys-and-AS-Morrisons.- Could-Britains-supermarkets-be-about-to-merge.html)
(d) Assess the extent to which ‘information gaps’ (Extract B, lines 5 and 6) and ‘irrational behaviour’ (Extract B, line 11) are the main causes of food waste in the UK. (10)
June 2017 · Paper 1 · Q6(e) 15 marks AO1=3, AO2=3, AO3=3, AO4=6 15-mark response business growth and objectivescompetition policy and regulation
Data and extracts for question 6Supermarket price war, food waste and possible mergers Figure 1: Market shares by total revenue in the UK supermarket sector, 2010 and 2015 2010 2015 Others Others Lidl Lidl 7.7% 6.7% Aldi 2.2% Aldi 4.0% 2.8% 5.5% Tesco Tesco 30.8% 28.6% Waitrose Waitrose 4.1% 5.1% Co-op Co-op 7.1% 6.2% Morrisons Morrisons Asda Asda 11.6% 10.9% 17.6% 16.5% Sainbury’s Sainbury’s 16.1% 16.5% (Source: Kantar worldpanel, http://www.kantarworldpanel.com/en/ grocery-market-share/great-britain/snapshot/11.10.15/) Figure 2: Proportion of food suppliers reporting that the following supermarkets fail to meet the Groceries Code of Conduct, 2015. Aldi Sainsbury’s Lidl Waitrose Asda Co-op Morrisons Tesco 0 5 10 15 20 25 30 35 % (Source: YouGov poll of more than 1100 food suppliers to supermarkets. Reported in The Times, 23 June 2015) Extract A Supermarket price war puts pressure on their food suppliers The number of food suppliers (to supermarkets) struggling to remain in business has increased by more than 50% over the past year as supermarkets engage in an intense price war. It has never been tougher for the UK’s food suppliers according to a study by accountants Begbies Traynor. It blames aggressive price-cutting by the supermarkets 5 and delays in payments to food suppliers as the main causes of the difficulties. Further problems include food suppliers being forced to pay excessive amounts for packaging specified by supermarkets and funding in-store promotions. Almost 90% of struggling food suppliers are small and medium-sized businesses. The price war has contributed to food prices paid by consumers falling by 1.7% over the 10 past two years. The market shares of the big four supermarkets – Tesco, Asda, Sainsbury’s and Morrisons – are under pressure as shopping habits change. Many consumers are switching from one main weekly shop to shopping more frequently at local discount stores such as Aldi and Lidl or purchasing goods online from other grocery retailers. 15 The big four supermarkets have responded by putting more pressure on their suppliers despite an investigation by the Groceries Code Adjudicator (GCA). The GCA has the power to fine supermarkets up to 1% of their annual sales revenue if they break the Groceries Code of Conduct. A YouGov study found considerable differences between the supermarkets in meeting the Code with Aldi performing well but Tesco badly. Despite 20 the Groceries Code, many food suppliers are reluctant to complain for fear of losing contracts with the supermarkets. (Source: adapted from ‘Supermarket price war takes toll on UK food suppliers’. Rupert Jones, The Guardian, 20th July 2015) Extract B Food waste in the supply chain A report from the British Retail Consortium reveals that supermarkets are directly responsible for around 0.2 million tonnes of food waste every year. This is due to the expiry of use-by-dates and poor handling of stock. However, 4.1 million tonnes of food waste occurs annually in the food supply chain 5 before it even reaches the supermarkets, indicating the existence of information gaps. The supermarkets are cooperating with food suppliers and farmers to try to reduce this waste. This involves improving forecasts for supply and demand of food and increasing the reliability of transportation and storage. Consumers, the final stage of the supply chain, waste a further 7 million tonnes of 10 food each year. This suggests irrational behaviour. Supermarkets are also working with consumers to reduce the waste by providing advice on how to store and use leftover food. The development of packaging designs to keep food fresher for longer is one of the innovations under way to reduce waste. (Source: adapted from ‘Supermarkets tally up food waste bill’. Will Nicholls, in Businessgreen, 19th January 2015. http://www.businessgreen.com/ bg/news/2390792/supermarkets-tally-up-food-waste-bill) Extract C Proposed merger activity in the supermarket sector Analysts at Société Générale, an investment bank, have recommended a merger between Sainsbury’s and Morrisons. They claim it would lead to increased economies of scale and market power for the combined business. Such a merger between the third and fourth largest supermarkets in Britain would have been unrealistic a few years ago due 5 to concerns of its impact in reducing competition. However, the chances of getting permission from the Competition and Markets Authority have increased following the growth of Aldi and Lidl. Giant mergers have been approved in other sectors such as Lloyds-HBOS (banking) and British Telecom-EE (telecommunications). The suggested merger would have its challenges. There is considerable overlap between 10 the locations of the stores and the enlarged company would require the rationalisation and co-ordination of hundreds of thousands of employees. A new expensive IT system is likely to be required and the underlying difficult market trends would remain in the food retailing industry. (Source: adapted from ‘Tesco-bury and AS-Morrisons. Could Britain’s supermarkets be about to merge?’ Graham Ruddick, in The Telegraph, 16th December, 2015. http://www.telegraph. co.uk/finance/newsbysector/retailandconsumer/11699724/Tesco-burys-and-AS-Morrisons.- Could-Britains-supermarkets-be-about-to-merge.html)
(e) Discuss the likely problems for Sainsbury’s and Morrisons if the suggested merger between them goes ahead. Refer to Figure 1, Extract C and your own knowledge in your answer. (15)
June 2017 · Paper 2 · Q1(b) 4 marks AO1=2, AO2=1, AO3=1 Short answer national income and the multiplier
Data and extracts for question 11 The chart below shows the UK unemployment rate, seasonally adjusted, from 2008 to 2015 9.0 8.0 7.0 6.0 % of all 5.0 economically 4.0 active 3.0 2.0 1.0 0.0 Year (Source: http://www.ons.gov.uk/ons/rel/lms/labour-market-statistics/december-2015/ statistical-bulletin.html#tab-8--Unemployment)
(b) Explain the likely effects on the circular flow of income of the change in unemployment between 2013 and 2015. (4)
June 2017 · Paper 2 · Q2(a) 2 marks AO1=2 Short answer aggregate demand
Data and extracts for question 22 The table below shows marginal propensity to save data for an economy. Marginal propensity Year to save (mps) 2010 0.11 2011 0.09 2012 0.07 2013 0.05 2014 0.05 2015 0.04
(a) Explain one possible reason for the changes in the marginal propensity to save as shown in the table. (2)
June 2017 · Paper 2 · Q3(b) 4 marks AO1=2, AO2=1, AO3=1 Short answer inflation
Data and extracts for question 33 The chart below shows UK inflation as measured by the Consumer Prices Index (CPI), 2011 to 2015. 6.0 5.0 4.0 Annual 3.0 percentage change 2.0 in prices 1.0 0.0 –1.0 –2.0 Year CPI Food and fuel Other goods and services (Source: http://www.ons.gov.uk/ons/dcp171780_427182.pdf)
(b) With reference to the data provided, explain the process of calculating the rate of inflation in the UK using the Consumer Prices Index. Refer to the concept of weights in your answer. (4)
June 2017 · Paper 2 · Q4(a) 4 marks AO2=3, AO3=1 Short answer poverty and inequality
Data and extracts for question 44 The chart below shows the UK Gini coefficient of incomes, 2007 to 2013. 0.40 0.38 0.36 0.34 0.32 Gini 0.30 coefficient 0.28 0.26 0.24 0.22 0.20 0 Year (Source: adapted from https://www.equalitytrust.org.uk/how-has-inequality-changed)
(a) Explain one likely reason for the change in UK income inequality since 2007. (4)
June 2017 · Paper 2 · Q5(b) 4 marks AO1=2, AO2=1, AO3=1 Short answer emerging and developing economies
Data and extracts for question 55 The table shows the selected economic data in 2014 for Vietnam and India. Gross National Human Income per Development capita Index (HDI) value (2011 PPPs) Vietnam 5 092 0.666 India 5 497 0.609 (Source: www.hdr.undp.org/en/composite/HDI)
(b) With reference to the data provided, explain two limitations of using the HDI to compare levels of development between countries and over time. (4)
June 2017 · Paper 2 · Q6(a) 5 marks AO1=1, AO2=2, AO3=2 Calculation exchange rates
Data and extracts for question 6The Eurozone economy Figure 1: Exchange rate of the euro (€) to the British pound (£) 1.00 0.95 0.90 price of 0.85 one euro in pounds 0.80 0.75 0.70 0 2007 2008 2009 2010 2011 2012 2013 2014 2015 2016 Year (Source: https://www.ecb.europa.eu/stats/exchange/eurofxref/html/ eurofxref-graph-gbp.en.html#) Figure 2: Eurozone inflation rate as measured by the Consumer Prices Index (CPI) 3.25 3 2.75 2.5 2.25 Annual 2 percentage change 1.75 in prices 1.5 1.25 1 0.75 0.5 0.25 0 2011 2012 2013 2014 2015 Year (Source: adapted from http://www.imf.org/external/pubs/ft/weo/ 2015/02/weodata/download.aspx) Extract A European Central Bank disappoints markets with weaker than expected stimulus Mario Draghi, president of the European Central Bank (ECB), surprised financial markets in November 2015 with a less ambitious package of monetary stimulus than many had anticipated. The ECB cut its base interest rate by 0.1% to minus 0.3% in order to encourage private 5 banks to lend funds to companies and households rather than deposit them at the central bank. The central bank agreed to extend its €60 billion (£45 billion) monthly bond-buying quantitative easing (QE) programme for a further six months. The ECB’s €1.1 trillion QE scheme had originally been due to end in September 2016. “We are doing more because it works,” Mr Draghi said. Yet the ECB did not increase the 10 size of its monthly asset purchases and also disappointed those expecting that it would cut interest rates more aggressively. The euro rose almost 3% against the dollar to $1.08 after the announcement. Italian and Spanish bond yields both jumped by 0.27% to 1.62% and 1.72% respectively. The ECB’s economists reduced their inflation forecasts for the next two years. They now 15 predict consumer prices in the Eurozone rising by just 1% in 2016 and 1.6% in 2017 – still below the central bank’s ceiling of 2%. In November 2015, the inflation rate was just 0.1% and core inflation, excluding volatile items such as fuel and food, dropped to 0.9%. Mr Draghi stressed again that monetary policy alone could not restore the Eurozone to economic health. He called for looser fiscal policy among member states to support 20 aggregate demand and more rapid implementation of supply-side reforms. “In order to reap the full benefits from our monetary policy measures, other policy areas must contribute decisively,” he said. (Source: http://www.independent.co.uk/news/business/news/ecb-disappoints-traders -with-weaker-than-expected-stimulus-a6759786.html, 4th December 2015)
(a) With reference to Figure 1, calculate the percentage change in the value of the euro in pounds from the start of 2009 to the start of 2015. (5)
June 2017 · Paper 2 · Q6(b) 8 marks AO1=2, AO2=2, AO3=2, AO4=2 8-mark response inflation
Data and extracts for question 6The Eurozone economy Figure 1: Exchange rate of the euro (€) to the British pound (£) 1.00 0.95 0.90 price of 0.85 one euro in pounds 0.80 0.75 0.70 0 2007 2008 2009 2010 2011 2012 2013 2014 2015 2016 Year (Source: https://www.ecb.europa.eu/stats/exchange/eurofxref/html/ eurofxref-graph-gbp.en.html#) Figure 2: Eurozone inflation rate as measured by the Consumer Prices Index (CPI) 3.25 3 2.75 2.5 2.25 Annual 2 percentage change 1.75 in prices 1.5 1.25 1 0.75 0.5 0.25 0 2011 2012 2013 2014 2015 Year (Source: adapted from http://www.imf.org/external/pubs/ft/weo/ 2015/02/weodata/download.aspx) Extract A European Central Bank disappoints markets with weaker than expected stimulus Mario Draghi, president of the European Central Bank (ECB), surprised financial markets in November 2015 with a less ambitious package of monetary stimulus than many had anticipated. The ECB cut its base interest rate by 0.1% to minus 0.3% in order to encourage private 5 banks to lend funds to companies and households rather than deposit them at the central bank. The central bank agreed to extend its €60 billion (£45 billion) monthly bond-buying quantitative easing (QE) programme for a further six months. The ECB’s €1.1 trillion QE scheme had originally been due to end in September 2016. “We are doing more because it works,” Mr Draghi said. Yet the ECB did not increase the 10 size of its monthly asset purchases and also disappointed those expecting that it would cut interest rates more aggressively. The euro rose almost 3% against the dollar to $1.08 after the announcement. Italian and Spanish bond yields both jumped by 0.27% to 1.62% and 1.72% respectively. The ECB’s economists reduced their inflation forecasts for the next two years. They now 15 predict consumer prices in the Eurozone rising by just 1% in 2016 and 1.6% in 2017 – still below the central bank’s ceiling of 2%. In November 2015, the inflation rate was just 0.1% and core inflation, excluding volatile items such as fuel and food, dropped to 0.9%. Mr Draghi stressed again that monetary policy alone could not restore the Eurozone to economic health. He called for looser fiscal policy among member states to support 20 aggregate demand and more rapid implementation of supply-side reforms. “In order to reap the full benefits from our monetary policy measures, other policy areas must contribute decisively,” he said. (Source: http://www.independent.co.uk/news/business/news/ecb-disappoints-traders -with-weaker-than-expected-stimulus-a6759786.html, 4th December 2015)
(b) With reference to the information provided and your own knowledge, examine two factors which might explain the change in the rate of Eurozone inflation as shown in Figure 2. (8)
June 2017 · Paper 2 · Q6(d) 12 marks AO1=2, AO2=2, AO3=4, AO4=4 12-mark response fiscal and monetary policymacroeconomic policy in a global context
Data and extracts for question 6The Eurozone economy Figure 1: Exchange rate of the euro (€) to the British pound (£) 1.00 0.95 0.90 price of 0.85 one euro in pounds 0.80 0.75 0.70 0 2007 2008 2009 2010 2011 2012 2013 2014 2015 2016 Year (Source: https://www.ecb.europa.eu/stats/exchange/eurofxref/html/ eurofxref-graph-gbp.en.html#) Figure 2: Eurozone inflation rate as measured by the Consumer Prices Index (CPI) 3.25 3 2.75 2.5 2.25 Annual 2 percentage change 1.75 in prices 1.5 1.25 1 0.75 0.5 0.25 0 2011 2012 2013 2014 2015 Year (Source: adapted from http://www.imf.org/external/pubs/ft/weo/ 2015/02/weodata/download.aspx) Extract A European Central Bank disappoints markets with weaker than expected stimulus Mario Draghi, president of the European Central Bank (ECB), surprised financial markets in November 2015 with a less ambitious package of monetary stimulus than many had anticipated. The ECB cut its base interest rate by 0.1% to minus 0.3% in order to encourage private 5 banks to lend funds to companies and households rather than deposit them at the central bank. The central bank agreed to extend its €60 billion (£45 billion) monthly bond-buying quantitative easing (QE) programme for a further six months. The ECB’s €1.1 trillion QE scheme had originally been due to end in September 2016. “We are doing more because it works,” Mr Draghi said. Yet the ECB did not increase the 10 size of its monthly asset purchases and also disappointed those expecting that it would cut interest rates more aggressively. The euro rose almost 3% against the dollar to $1.08 after the announcement. Italian and Spanish bond yields both jumped by 0.27% to 1.62% and 1.72% respectively. The ECB’s economists reduced their inflation forecasts for the next two years. They now 15 predict consumer prices in the Eurozone rising by just 1% in 2016 and 1.6% in 2017 – still below the central bank’s ceiling of 2%. In November 2015, the inflation rate was just 0.1% and core inflation, excluding volatile items such as fuel and food, dropped to 0.9%. Mr Draghi stressed again that monetary policy alone could not restore the Eurozone to economic health. He called for looser fiscal policy among member states to support 20 aggregate demand and more rapid implementation of supply-side reforms. “In order to reap the full benefits from our monetary policy measures, other policy areas must contribute decisively,” he said. (Source: http://www.independent.co.uk/news/business/news/ecb-disappoints-traders -with-weaker-than-expected-stimulus-a6759786.html, 4th December 2015)
(d) Discuss the likely success of the ECB’s quantitative easing programme in moving Eurozone inflation closer to ‘the central bank’s ceiling of 2%’ (Extract A, line 17). (12)
June 2017 · Paper 2 · Q6(e) 15 marks AO1=3, AO2=3, AO3=3, AO4=6 15-mark response fiscal and monetary policysupply side policies
Data and extracts for question 6The Eurozone economy Figure 1: Exchange rate of the euro (€) to the British pound (£) 1.00 0.95 0.90 price of 0.85 one euro in pounds 0.80 0.75 0.70 0 2007 2008 2009 2010 2011 2012 2013 2014 2015 2016 Year (Source: https://www.ecb.europa.eu/stats/exchange/eurofxref/html/ eurofxref-graph-gbp.en.html#) Figure 2: Eurozone inflation rate as measured by the Consumer Prices Index (CPI) 3.25 3 2.75 2.5 2.25 Annual 2 percentage change 1.75 in prices 1.5 1.25 1 0.75 0.5 0.25 0 2011 2012 2013 2014 2015 Year (Source: adapted from http://www.imf.org/external/pubs/ft/weo/ 2015/02/weodata/download.aspx) Extract A European Central Bank disappoints markets with weaker than expected stimulus Mario Draghi, president of the European Central Bank (ECB), surprised financial markets in November 2015 with a less ambitious package of monetary stimulus than many had anticipated. The ECB cut its base interest rate by 0.1% to minus 0.3% in order to encourage private 5 banks to lend funds to companies and households rather than deposit them at the central bank. The central bank agreed to extend its €60 billion (£45 billion) monthly bond-buying quantitative easing (QE) programme for a further six months. The ECB’s €1.1 trillion QE scheme had originally been due to end in September 2016. “We are doing more because it works,” Mr Draghi said. Yet the ECB did not increase the 10 size of its monthly asset purchases and also disappointed those expecting that it would cut interest rates more aggressively. The euro rose almost 3% against the dollar to $1.08 after the announcement. Italian and Spanish bond yields both jumped by 0.27% to 1.62% and 1.72% respectively. The ECB’s economists reduced their inflation forecasts for the next two years. They now 15 predict consumer prices in the Eurozone rising by just 1% in 2016 and 1.6% in 2017 – still below the central bank’s ceiling of 2%. In November 2015, the inflation rate was just 0.1% and core inflation, excluding volatile items such as fuel and food, dropped to 0.9%. Mr Draghi stressed again that monetary policy alone could not restore the Eurozone to economic health. He called for looser fiscal policy among member states to support 20 aggregate demand and more rapid implementation of supply-side reforms. “In order to reap the full benefits from our monetary policy measures, other policy areas must contribute decisively,” he said. (Source: http://www.independent.co.uk/news/business/news/ecb-disappoints-traders -with-weaker-than-expected-stimulus-a6759786.html, 4th December 2015)
(e) Discuss ‘looser fiscal policy’ and ‘supply-side reforms’ (Extract A, lines 20 and 21) that may be used by governments of Eurozone countries to increase economic growth. (15)
June 2017 · Paper 3 · Q1(a) 5 marks AO1=2, AO2=2, AO3=1 Short answer exchange rates
Data and extracts for question 1Chile Figure 1: Copper prices, US dollars per tonne, 2007–2015 10000 US dollars per tonne 5000 0 2007 2008 2009 2010 2011 2012 2014 2015 2013 (Source: adapted from http://www.indexmundi.com/commodities/ ?commodity=copper&months=120) Figure 2: US dollar per 100 Chile pesos exchange rate, 2007–2015 0.24 0.22 Price of 100 Chile 0.20 pesos in 0.18 US dollars 0.16 0.14 0 2007 2008 2009 2010 2011 2012 2013 2014 2015 (Source: https://www.google.co.uk/finance?q=CLPUSD&ei=OGEvVun-AouIU6awjugF) Figure 3: Chile: copper output and real GDP growth, 2007–2015 10 GDP 5 Annual 0 % change –5 Copper output –10 2013 2007 2008 2009 2010 2011 2012 2014 2015 (Source: adapted from FT.com sources below) Extract A Chile’s economic outlook brightens Chile has been hit hard by a worldwide fall in commodity prices since 2011. Copper accounts for 20% of Chile’s GDP and 60% of its exports; one third of the world’s copper is produced by Chile. China purchased 40% of the world’s copper, so a slowdown in China combined with increased global over-supply has meant copper prices have 5 collapsed (see Figure 1). Chilean government income from copper exports had reached $11.5 billion a year before copper prices fell, but now tax revenues from this source have fallen drastically. Growing numbers of copper mines struggle to break even at current prices. Chile’s GDP is now growing, helped by a weak currency that has boosted export 10 industries outside the mining sector, such as its successful wine and salmon industries. There are strengths in tourism and high-tech products. Public services are good in Chile, and poverty rates have been falling fast. On top of this, a large and diversified financial sector with high domestic savings provides a useful safety net, given high levels of corporate debt and the government’s need to finance a fiscal deficit of 3% of GDP. 15 Chile’s economy is often regarded as the best run in the region. This is attributed to the credibility of its financial institutions, relatively low levels of national debt (about 15% of GDP) and its free-trade model, which is unrestricted by government interventionism that has distorted the economies of countries such as Argentina and Venezuela. “Chile is an example of how credible institutions can smooth the economic cycle and make 20 adjustments less traumatic,” said Mr Valdés, the minister of finance in Chile, pointing to its widely respected and independent central bank and a well-established fiscal rule that give officials the freedom to implement counter-cyclical policies. However, there are worries that without enough spare capacity in the economy, expansionary fiscal and monetary policies could end up increasing inflation rather than 25 economic growth. Meanwhile monetary policy is restricted by inflation that has reached 5%, well outside the central bank’s 2–4% target range, fuelled by a weaker exchange rate. Crucially, investment remains low because of uncertainty over the outcome of the Prime Minister’s reforms, which are aimed at reducing inequality. A recent rise in corporation tax from 20% to 25% and labour market reforms that strengthen the power of trade 30 unions may have a negative effect on business confidence. Despite a “mildly contractionary” budget, Valdés insisted that the government would continue with costly reforms. Increased taxes on those on higher incomes are considered by the government to be necessary to sustain economic development in Chile. “We do want to change society, while recognising all the good things that have been done in 35 the past 25 years,” said Mr Valdés, referring to an average growth rate of 5.3% over the past three decades, but under 2% in 2015. There is broad consensus that investment in education is the key to unlocking Chile’s growth potential. (Sources: adapted from http://www.ft.com/cms/s/0/89926ce8-df96-11e4-a6c400144feab7de html#axzz3pCnzT3PC FT 20 April 2015 and http://www.ft.com/cms/s/0/d60ac2b2-7453- 11e5-a129-3fcc4f641d98.html?siteedition=uk#axzz3pCnzT3PC FT 19 October 2015 and http://www.ft.com/cms/s/0/d60ac2b2-7453-11e5-a129-3fcc4f641d98.html?siteedition= uk#axzz3pCnzT3PC FT 19 October 2015 all by Benedict Mander) Extract B Chile’s copper mining on a downward track There was a time when investing in Chilean mining meant guaranteed success. After 1990, when military rule was replaced by an elected government, market reforms and restored relations with the US and UK meant foreign companies were keen to exploit vast copper reserves. The existence of large copper reserves in a stable country with a 5 business-friendly government is rare, making Chile much more attractive to investors than countries such as Zambia. By mid-2015, however, the copper price hit a six-year low. Chilean mines are becoming less productive. After 20 years of heavy digging, the ore is lower grade, and much further down. The deeper pits take longer to mine, and use more fuel. Wages are high, and trade 10 unions are powerful. A mining truck driver earns $70 000 a year, $10 000 more than the US equivalent. Many mining projects that were planned are being postponed, and investors are looking to Peru; even the US copper mining industry is becoming more competitive. Energy supply is also a worry as Chile produces virtually no fossil fuels and relies on 15 imported coal and liquid natural gas to power its mines. Energy costs account for 18% of the cost of copper production. Water supply is also becoming a major problem. Farmers and communities accuse mining companies of causing water shortages to keep their operations running. A prolonged drought has not helped. Mining firms are turning to desalination plants 20 or using untreated seawater. However pumping water 200 kilometres from the Pacific Ocean to the copper mines is costly. Chile’s environmentalist movement has forced the government to tighten regulations. In 2001, it took 236 days to get an environmental impact assessment of a new mine approved. By 2013, this had increased to 506 days. 25 (Source: adapted from http://www.ft.com/cms/s/0/ea060ef4-6ae2-11e5-8171- ba1968cf791a.html#axzz3p20if45k Gideon Long September 27, 2015)
(a) With reference to Figure 2, explain one likely reason for the change in the Chile peso exchange rate between 2013 and 2015. (5)
June 2017 · Paper 3 · Q1(b) 8 marks AO1=2, AO2=2, AO3=2, AO4=2 8-mark response externalities
Data and extracts for question 1Chile Figure 1: Copper prices, US dollars per tonne, 2007–2015 10000 US dollars per tonne 5000 0 2007 2008 2009 2010 2011 2012 2014 2015 2013 (Source: adapted from http://www.indexmundi.com/commodities/ ?commodity=copper&months=120) Figure 2: US dollar per 100 Chile pesos exchange rate, 2007–2015 0.24 0.22 Price of 100 Chile 0.20 pesos in 0.18 US dollars 0.16 0.14 0 2007 2008 2009 2010 2011 2012 2013 2014 2015 (Source: https://www.google.co.uk/finance?q=CLPUSD&ei=OGEvVun-AouIU6awjugF) Figure 3: Chile: copper output and real GDP growth, 2007–2015 10 GDP 5 Annual 0 % change –5 Copper output –10 2013 2007 2008 2009 2010 2011 2012 2014 2015 (Source: adapted from FT.com sources below) Extract A Chile’s economic outlook brightens Chile has been hit hard by a worldwide fall in commodity prices since 2011. Copper accounts for 20% of Chile’s GDP and 60% of its exports; one third of the world’s copper is produced by Chile. China purchased 40% of the world’s copper, so a slowdown in China combined with increased global over-supply has meant copper prices have 5 collapsed (see Figure 1). Chilean government income from copper exports had reached $11.5 billion a year before copper prices fell, but now tax revenues from this source have fallen drastically. Growing numbers of copper mines struggle to break even at current prices. Chile’s GDP is now growing, helped by a weak currency that has boosted export 10 industries outside the mining sector, such as its successful wine and salmon industries. There are strengths in tourism and high-tech products. Public services are good in Chile, and poverty rates have been falling fast. On top of this, a large and diversified financial sector with high domestic savings provides a useful safety net, given high levels of corporate debt and the government’s need to finance a fiscal deficit of 3% of GDP. 15 Chile’s economy is often regarded as the best run in the region. This is attributed to the credibility of its financial institutions, relatively low levels of national debt (about 15% of GDP) and its free-trade model, which is unrestricted by government interventionism that has distorted the economies of countries such as Argentina and Venezuela. “Chile is an example of how credible institutions can smooth the economic cycle and make 20 adjustments less traumatic,” said Mr Valdés, the minister of finance in Chile, pointing to its widely respected and independent central bank and a well-established fiscal rule that give officials the freedom to implement counter-cyclical policies. However, there are worries that without enough spare capacity in the economy, expansionary fiscal and monetary policies could end up increasing inflation rather than 25 economic growth. Meanwhile monetary policy is restricted by inflation that has reached 5%, well outside the central bank’s 2–4% target range, fuelled by a weaker exchange rate. Crucially, investment remains low because of uncertainty over the outcome of the Prime Minister’s reforms, which are aimed at reducing inequality. A recent rise in corporation tax from 20% to 25% and labour market reforms that strengthen the power of trade 30 unions may have a negative effect on business confidence. Despite a “mildly contractionary” budget, Valdés insisted that the government would continue with costly reforms. Increased taxes on those on higher incomes are considered by the government to be necessary to sustain economic development in Chile. “We do want to change society, while recognising all the good things that have been done in 35 the past 25 years,” said Mr Valdés, referring to an average growth rate of 5.3% over the past three decades, but under 2% in 2015. There is broad consensus that investment in education is the key to unlocking Chile’s growth potential. (Sources: adapted from http://www.ft.com/cms/s/0/89926ce8-df96-11e4-a6c400144feab7de html#axzz3pCnzT3PC FT 20 April 2015 and http://www.ft.com/cms/s/0/d60ac2b2-7453- 11e5-a129-3fcc4f641d98.html?siteedition=uk#axzz3pCnzT3PC FT 19 October 2015 and http://www.ft.com/cms/s/0/d60ac2b2-7453-11e5-a129-3fcc4f641d98.html?siteedition= uk#axzz3pCnzT3PC FT 19 October 2015 all by Benedict Mander) Extract B Chile’s copper mining on a downward track There was a time when investing in Chilean mining meant guaranteed success. After 1990, when military rule was replaced by an elected government, market reforms and restored relations with the US and UK meant foreign companies were keen to exploit vast copper reserves. The existence of large copper reserves in a stable country with a 5 business-friendly government is rare, making Chile much more attractive to investors than countries such as Zambia. By mid-2015, however, the copper price hit a six-year low. Chilean mines are becoming less productive. After 20 years of heavy digging, the ore is lower grade, and much further down. The deeper pits take longer to mine, and use more fuel. Wages are high, and trade 10 unions are powerful. A mining truck driver earns $70 000 a year, $10 000 more than the US equivalent. Many mining projects that were planned are being postponed, and investors are looking to Peru; even the US copper mining industry is becoming more competitive. Energy supply is also a worry as Chile produces virtually no fossil fuels and relies on 15 imported coal and liquid natural gas to power its mines. Energy costs account for 18% of the cost of copper production. Water supply is also becoming a major problem. Farmers and communities accuse mining companies of causing water shortages to keep their operations running. A prolonged drought has not helped. Mining firms are turning to desalination plants 20 or using untreated seawater. However pumping water 200 kilometres from the Pacific Ocean to the copper mines is costly. Chile’s environmentalist movement has forced the government to tighten regulations. In 2001, it took 236 days to get an environmental impact assessment of a new mine approved. By 2013, this had increased to 506 days. 25 (Source: adapted from http://www.ft.com/cms/s/0/ea060ef4-6ae2-11e5-8171- ba1968cf791a.html#axzz3p20if45k Gideon Long September 27, 2015)
(b) Examine the likely impact of externalities of copper mining on firms and communities within Chile. (8)
June 2017 · Paper 3 · Q1(c) 12 marks AO1=2, AO2=2, AO3=4, AO4=4 12-mark response emerging and developing economies
Data and extracts for question 1Chile Figure 1: Copper prices, US dollars per tonne, 2007–2015 10000 US dollars per tonne 5000 0 2007 2008 2009 2010 2011 2012 2014 2015 2013 (Source: adapted from http://www.indexmundi.com/commodities/ ?commodity=copper&months=120) Figure 2: US dollar per 100 Chile pesos exchange rate, 2007–2015 0.24 0.22 Price of 100 Chile 0.20 pesos in 0.18 US dollars 0.16 0.14 0 2007 2008 2009 2010 2011 2012 2013 2014 2015 (Source: https://www.google.co.uk/finance?q=CLPUSD&ei=OGEvVun-AouIU6awjugF) Figure 3: Chile: copper output and real GDP growth, 2007–2015 10 GDP 5 Annual 0 % change –5 Copper output –10 2013 2007 2008 2009 2010 2011 2012 2014 2015 (Source: adapted from FT.com sources below) Extract A Chile’s economic outlook brightens Chile has been hit hard by a worldwide fall in commodity prices since 2011. Copper accounts for 20% of Chile’s GDP and 60% of its exports; one third of the world’s copper is produced by Chile. China purchased 40% of the world’s copper, so a slowdown in China combined with increased global over-supply has meant copper prices have 5 collapsed (see Figure 1). Chilean government income from copper exports had reached $11.5 billion a year before copper prices fell, but now tax revenues from this source have fallen drastically. Growing numbers of copper mines struggle to break even at current prices. Chile’s GDP is now growing, helped by a weak currency that has boosted export 10 industries outside the mining sector, such as its successful wine and salmon industries. There are strengths in tourism and high-tech products. Public services are good in Chile, and poverty rates have been falling fast. On top of this, a large and diversified financial sector with high domestic savings provides a useful safety net, given high levels of corporate debt and the government’s need to finance a fiscal deficit of 3% of GDP. 15 Chile’s economy is often regarded as the best run in the region. This is attributed to the credibility of its financial institutions, relatively low levels of national debt (about 15% of GDP) and its free-trade model, which is unrestricted by government interventionism that has distorted the economies of countries such as Argentina and Venezuela. “Chile is an example of how credible institutions can smooth the economic cycle and make 20 adjustments less traumatic,” said Mr Valdés, the minister of finance in Chile, pointing to its widely respected and independent central bank and a well-established fiscal rule that give officials the freedom to implement counter-cyclical policies. However, there are worries that without enough spare capacity in the economy, expansionary fiscal and monetary policies could end up increasing inflation rather than 25 economic growth. Meanwhile monetary policy is restricted by inflation that has reached 5%, well outside the central bank’s 2–4% target range, fuelled by a weaker exchange rate. Crucially, investment remains low because of uncertainty over the outcome of the Prime Minister’s reforms, which are aimed at reducing inequality. A recent rise in corporation tax from 20% to 25% and labour market reforms that strengthen the power of trade 30 unions may have a negative effect on business confidence. Despite a “mildly contractionary” budget, Valdés insisted that the government would continue with costly reforms. Increased taxes on those on higher incomes are considered by the government to be necessary to sustain economic development in Chile. “We do want to change society, while recognising all the good things that have been done in 35 the past 25 years,” said Mr Valdés, referring to an average growth rate of 5.3% over the past three decades, but under 2% in 2015. There is broad consensus that investment in education is the key to unlocking Chile’s growth potential. (Sources: adapted from http://www.ft.com/cms/s/0/89926ce8-df96-11e4-a6c400144feab7de html#axzz3pCnzT3PC FT 20 April 2015 and http://www.ft.com/cms/s/0/d60ac2b2-7453- 11e5-a129-3fcc4f641d98.html?siteedition=uk#axzz3pCnzT3PC FT 19 October 2015 and http://www.ft.com/cms/s/0/d60ac2b2-7453-11e5-a129-3fcc4f641d98.html?siteedition= uk#axzz3pCnzT3PC FT 19 October 2015 all by Benedict Mander) Extract B Chile’s copper mining on a downward track There was a time when investing in Chilean mining meant guaranteed success. After 1990, when military rule was replaced by an elected government, market reforms and restored relations with the US and UK meant foreign companies were keen to exploit vast copper reserves. The existence of large copper reserves in a stable country with a 5 business-friendly government is rare, making Chile much more attractive to investors than countries such as Zambia. By mid-2015, however, the copper price hit a six-year low. Chilean mines are becoming less productive. After 20 years of heavy digging, the ore is lower grade, and much further down. The deeper pits take longer to mine, and use more fuel. Wages are high, and trade 10 unions are powerful. A mining truck driver earns $70 000 a year, $10 000 more than the US equivalent. Many mining projects that were planned are being postponed, and investors are looking to Peru; even the US copper mining industry is becoming more competitive. Energy supply is also a worry as Chile produces virtually no fossil fuels and relies on 15 imported coal and liquid natural gas to power its mines. Energy costs account for 18% of the cost of copper production. Water supply is also becoming a major problem. Farmers and communities accuse mining companies of causing water shortages to keep their operations running. A prolonged drought has not helped. Mining firms are turning to desalination plants 20 or using untreated seawater. However pumping water 200 kilometres from the Pacific Ocean to the copper mines is costly. Chile’s environmentalist movement has forced the government to tighten regulations. In 2001, it took 236 days to get an environmental impact assessment of a new mine approved. By 2013, this had increased to 506 days. 25 (Source: adapted from http://www.ft.com/cms/s/0/ea060ef4-6ae2-11e5-8171- ba1968cf791a.html#axzz3p20if45k Gideon Long September 27, 2015)
(c) Apart from externalities, discuss the problems that Chile faces as a result of dependency on copper mining. (12)
June 2017 · Paper 3 · Q1(d) 25 marks AO1=4, AO2=4, AO3=8, AO4=9 25-mark essay Either/or emerging and developing economiessupply side policies
Data and extracts for question 1Chile Figure 1: Copper prices, US dollars per tonne, 2007–2015 10000 US dollars per tonne 5000 0 2007 2008 2009 2010 2011 2012 2014 2015 2013 (Source: adapted from http://www.indexmundi.com/commodities/ ?commodity=copper&months=120) Figure 2: US dollar per 100 Chile pesos exchange rate, 2007–2015 0.24 0.22 Price of 100 Chile 0.20 pesos in 0.18 US dollars 0.16 0.14 0 2007 2008 2009 2010 2011 2012 2013 2014 2015 (Source: https://www.google.co.uk/finance?q=CLPUSD&ei=OGEvVun-AouIU6awjugF) Figure 3: Chile: copper output and real GDP growth, 2007–2015 10 GDP 5 Annual 0 % change –5 Copper output –10 2013 2007 2008 2009 2010 2011 2012 2014 2015 (Source: adapted from FT.com sources below) Extract A Chile’s economic outlook brightens Chile has been hit hard by a worldwide fall in commodity prices since 2011. Copper accounts for 20% of Chile’s GDP and 60% of its exports; one third of the world’s copper is produced by Chile. China purchased 40% of the world’s copper, so a slowdown in China combined with increased global over-supply has meant copper prices have 5 collapsed (see Figure 1). Chilean government income from copper exports had reached $11.5 billion a year before copper prices fell, but now tax revenues from this source have fallen drastically. Growing numbers of copper mines struggle to break even at current prices. Chile’s GDP is now growing, helped by a weak currency that has boosted export 10 industries outside the mining sector, such as its successful wine and salmon industries. There are strengths in tourism and high-tech products. Public services are good in Chile, and poverty rates have been falling fast. On top of this, a large and diversified financial sector with high domestic savings provides a useful safety net, given high levels of corporate debt and the government’s need to finance a fiscal deficit of 3% of GDP. 15 Chile’s economy is often regarded as the best run in the region. This is attributed to the credibility of its financial institutions, relatively low levels of national debt (about 15% of GDP) and its free-trade model, which is unrestricted by government interventionism that has distorted the economies of countries such as Argentina and Venezuela. “Chile is an example of how credible institutions can smooth the economic cycle and make 20 adjustments less traumatic,” said Mr Valdés, the minister of finance in Chile, pointing to its widely respected and independent central bank and a well-established fiscal rule that give officials the freedom to implement counter-cyclical policies. However, there are worries that without enough spare capacity in the economy, expansionary fiscal and monetary policies could end up increasing inflation rather than 25 economic growth. Meanwhile monetary policy is restricted by inflation that has reached 5%, well outside the central bank’s 2–4% target range, fuelled by a weaker exchange rate. Crucially, investment remains low because of uncertainty over the outcome of the Prime Minister’s reforms, which are aimed at reducing inequality. A recent rise in corporation tax from 20% to 25% and labour market reforms that strengthen the power of trade 30 unions may have a negative effect on business confidence. Despite a “mildly contractionary” budget, Valdés insisted that the government would continue with costly reforms. Increased taxes on those on higher incomes are considered by the government to be necessary to sustain economic development in Chile. “We do want to change society, while recognising all the good things that have been done in 35 the past 25 years,” said Mr Valdés, referring to an average growth rate of 5.3% over the past three decades, but under 2% in 2015. There is broad consensus that investment in education is the key to unlocking Chile’s growth potential. (Sources: adapted from http://www.ft.com/cms/s/0/89926ce8-df96-11e4-a6c400144feab7de html#axzz3pCnzT3PC FT 20 April 2015 and http://www.ft.com/cms/s/0/d60ac2b2-7453- 11e5-a129-3fcc4f641d98.html?siteedition=uk#axzz3pCnzT3PC FT 19 October 2015 and http://www.ft.com/cms/s/0/d60ac2b2-7453-11e5-a129-3fcc4f641d98.html?siteedition= uk#axzz3pCnzT3PC FT 19 October 2015 all by Benedict Mander) Extract B Chile’s copper mining on a downward track There was a time when investing in Chilean mining meant guaranteed success. After 1990, when military rule was replaced by an elected government, market reforms and restored relations with the US and UK meant foreign companies were keen to exploit vast copper reserves. The existence of large copper reserves in a stable country with a 5 business-friendly government is rare, making Chile much more attractive to investors than countries such as Zambia. By mid-2015, however, the copper price hit a six-year low. Chilean mines are becoming less productive. After 20 years of heavy digging, the ore is lower grade, and much further down. The deeper pits take longer to mine, and use more fuel. Wages are high, and trade 10 unions are powerful. A mining truck driver earns $70 000 a year, $10 000 more than the US equivalent. Many mining projects that were planned are being postponed, and investors are looking to Peru; even the US copper mining industry is becoming more competitive. Energy supply is also a worry as Chile produces virtually no fossil fuels and relies on 15 imported coal and liquid natural gas to power its mines. Energy costs account for 18% of the cost of copper production. Water supply is also becoming a major problem. Farmers and communities accuse mining companies of causing water shortages to keep their operations running. A prolonged drought has not helped. Mining firms are turning to desalination plants 20 or using untreated seawater. However pumping water 200 kilometres from the Pacific Ocean to the copper mines is costly. Chile’s environmentalist movement has forced the government to tighten regulations. In 2001, it took 236 days to get an environmental impact assessment of a new mine approved. By 2013, this had increased to 506 days. 25 (Source: adapted from http://www.ft.com/cms/s/0/ea060ef4-6ae2-11e5-8171- ba1968cf791a.html#axzz3p20if45k Gideon Long September 27, 2015)
(d) With reference to the information provided and your own knowledge, evaluate the microeconomic and macroeconomic effects of policies that could be used to stimulate economic growth and development in Chile. (25)
June 2017 · Paper 3 · Q1(e) 25 marks AO1=4, AO2=4, AO3=8, AO4=9 25-mark essay Either/or aggregate demandnational income and the multiplier
Data and extracts for question 1Chile Figure 1: Copper prices, US dollars per tonne, 2007–2015 10000 US dollars per tonne 5000 0 2007 2008 2009 2010 2011 2012 2014 2015 2013 (Source: adapted from http://www.indexmundi.com/commodities/ ?commodity=copper&months=120) Figure 2: US dollar per 100 Chile pesos exchange rate, 2007–2015 0.24 0.22 Price of 100 Chile 0.20 pesos in 0.18 US dollars 0.16 0.14 0 2007 2008 2009 2010 2011 2012 2013 2014 2015 (Source: https://www.google.co.uk/finance?q=CLPUSD&ei=OGEvVun-AouIU6awjugF) Figure 3: Chile: copper output and real GDP growth, 2007–2015 10 GDP 5 Annual 0 % change –5 Copper output –10 2013 2007 2008 2009 2010 2011 2012 2014 2015 (Source: adapted from FT.com sources below) Extract A Chile’s economic outlook brightens Chile has been hit hard by a worldwide fall in commodity prices since 2011. Copper accounts for 20% of Chile’s GDP and 60% of its exports; one third of the world’s copper is produced by Chile. China purchased 40% of the world’s copper, so a slowdown in China combined with increased global over-supply has meant copper prices have 5 collapsed (see Figure 1). Chilean government income from copper exports had reached $11.5 billion a year before copper prices fell, but now tax revenues from this source have fallen drastically. Growing numbers of copper mines struggle to break even at current prices. Chile’s GDP is now growing, helped by a weak currency that has boosted export 10 industries outside the mining sector, such as its successful wine and salmon industries. There are strengths in tourism and high-tech products. Public services are good in Chile, and poverty rates have been falling fast. On top of this, a large and diversified financial sector with high domestic savings provides a useful safety net, given high levels of corporate debt and the government’s need to finance a fiscal deficit of 3% of GDP. 15 Chile’s economy is often regarded as the best run in the region. This is attributed to the credibility of its financial institutions, relatively low levels of national debt (about 15% of GDP) and its free-trade model, which is unrestricted by government interventionism that has distorted the economies of countries such as Argentina and Venezuela. “Chile is an example of how credible institutions can smooth the economic cycle and make 20 adjustments less traumatic,” said Mr Valdés, the minister of finance in Chile, pointing to its widely respected and independent central bank and a well-established fiscal rule that give officials the freedom to implement counter-cyclical policies. However, there are worries that without enough spare capacity in the economy, expansionary fiscal and monetary policies could end up increasing inflation rather than 25 economic growth. Meanwhile monetary policy is restricted by inflation that has reached 5%, well outside the central bank’s 2–4% target range, fuelled by a weaker exchange rate. Crucially, investment remains low because of uncertainty over the outcome of the Prime Minister’s reforms, which are aimed at reducing inequality. A recent rise in corporation tax from 20% to 25% and labour market reforms that strengthen the power of trade 30 unions may have a negative effect on business confidence. Despite a “mildly contractionary” budget, Valdés insisted that the government would continue with costly reforms. Increased taxes on those on higher incomes are considered by the government to be necessary to sustain economic development in Chile. “We do want to change society, while recognising all the good things that have been done in 35 the past 25 years,” said Mr Valdés, referring to an average growth rate of 5.3% over the past three decades, but under 2% in 2015. There is broad consensus that investment in education is the key to unlocking Chile’s growth potential. (Sources: adapted from http://www.ft.com/cms/s/0/89926ce8-df96-11e4-a6c400144feab7de html#axzz3pCnzT3PC FT 20 April 2015 and http://www.ft.com/cms/s/0/d60ac2b2-7453- 11e5-a129-3fcc4f641d98.html?siteedition=uk#axzz3pCnzT3PC FT 19 October 2015 and http://www.ft.com/cms/s/0/d60ac2b2-7453-11e5-a129-3fcc4f641d98.html?siteedition= uk#axzz3pCnzT3PC FT 19 October 2015 all by Benedict Mander) Extract B Chile’s copper mining on a downward track There was a time when investing in Chilean mining meant guaranteed success. After 1990, when military rule was replaced by an elected government, market reforms and restored relations with the US and UK meant foreign companies were keen to exploit vast copper reserves. The existence of large copper reserves in a stable country with a 5 business-friendly government is rare, making Chile much more attractive to investors than countries such as Zambia. By mid-2015, however, the copper price hit a six-year low. Chilean mines are becoming less productive. After 20 years of heavy digging, the ore is lower grade, and much further down. The deeper pits take longer to mine, and use more fuel. Wages are high, and trade 10 unions are powerful. A mining truck driver earns $70 000 a year, $10 000 more than the US equivalent. Many mining projects that were planned are being postponed, and investors are looking to Peru; even the US copper mining industry is becoming more competitive. Energy supply is also a worry as Chile produces virtually no fossil fuels and relies on 15 imported coal and liquid natural gas to power its mines. Energy costs account for 18% of the cost of copper production. Water supply is also becoming a major problem. Farmers and communities accuse mining companies of causing water shortages to keep their operations running. A prolonged drought has not helped. Mining firms are turning to desalination plants 20 or using untreated seawater. However pumping water 200 kilometres from the Pacific Ocean to the copper mines is costly. Chile’s environmentalist movement has forced the government to tighten regulations. In 2001, it took 236 days to get an environmental impact assessment of a new mine approved. By 2013, this had increased to 506 days. 25 (Source: adapted from http://www.ft.com/cms/s/0/ea060ef4-6ae2-11e5-8171- ba1968cf791a.html#axzz3p20if45k Gideon Long September 27, 2015)
(e) With reference to the information provided and your own knowledge, evaluate the microeconomic and macroeconomic impact on Chile’s economy of changes in the level of investment. (25)
June 2017 · Paper 3 · Q2(a) 5 marks AO1=2, AO2=2, AO3=1 Diagram economic growth and the trade cycle
Data and extracts for question 2The UK economy Figure 4: UK national debt as a percentage of GDP 90 Forecast 80 70 60 % of 50 GDP 40 30 20 10 0 (Source: http://budgetresponsibility.org.uk/docs/dlm_uploads/BriefGuide_020511.pdf) Figure 5: UK fiscal deficit, public sector net borrowing (PSNB) 80 Forecast 40 £ billion 0 –40 –80 –120 –160 (Source: http://budgetresponsibility.org.uk/docs/dlm_uploads/BriefGuide_020511.pdf) Figure 6: Labour productivity per head, selected countries UK Spain France Indices: 2008 Q1(base) = 100 120 115 110 105 100 Index 95 90 85 80 75 1999 2001 2003 2005 2007 2009 2011 2013 (Source: http://www.bankofengland.co.uk/publications/Documents/ quarterlybulletin/2014/qb14q201.pdf) Extract C The National Living Wage (NLW) The Government has announced that from 2016 it will introduce a Living Wage Premium that will apply on top of the National Minimum Wage (NMW) for employees aged 25 and over to deliver a National Living Wage (NLW) for those people. The main NMW will continue to be set for all employees aged 21 and over, so that those aged 21 to 24 will 5 continue to be subject only to that rate. The effective minimum wage for the 25+ age group will therefore be over 13% higher in 2020 than would otherwise have been the case, and result in a 0.3% increase in wage costs overall. Further impacts on real GDP are estimated to be higher productivity (+0.3%) but lower average hours worked (-0.2%) and higher unemployment. Overall real 10 GDP is forecast to fall by 0.1% as a result of the NLW. However these forecasts depend on estimates of the likely elasticity of demand for labour. Academic evidence suggests that changes to the NMW since 1999 have led to only limited effects on demand for labour in the UK. The types of work that will be affected are relatively labour intensive, which may limit the scope for firms to substitute towards 15 using capital. Firms may also be expected to shift demand in favour of the under-25s given that they will not be subject to the NLW, which all else being equal would lead to a smaller reduction in overall labour demand. Some of the reduction in employees could also be partially offset by a rise in self-employment. But increasing the NLW to a higher proportion of median earnings may lead to bigger effects than have been experienced in 20 the past. (Sources: adapted from http://cdn.budgetresponsibility.independent.gov.uk/ July-2015-EFO-234224.pdf and http://budgetresponsibility.independent.gov.uk/) Extract D The productivity puzzle in the UK Since the onset of the 2007–2008 financial crisis, labour productivity growth in the UK has been exceptionally weak. Despite some modest improvements in 2013, whole-economy output per hour remains around 16% below the level implied by its pre-crisis trend. Even taking into account possible measurement issues and changes 5 in the size of the service sector, this shortfall is large and is often referred to as the ‘productivity puzzle’. Measures of productivity can be used to inform estimates of an economy’s ability to grow without generating excessive inflationary pressure, which makes understanding recent movements important for the conduct of monetary policy. During the initial phases 10 of the recession, companies appear to have acted flexibly by holding on to labour and lowering levels of capacity utilisation in response to weak demand conditions. But the protracted weakness in productivity and the strength in employment growth over the past two years suggest that other factors are likely to be having a more persistent impact on the level of productivity. These factors are reduced investment in both physical and 15 intangible capital, such as innovation and training, and failings in the labour market such as immobility of labour and under-employment of skilled workers. Some economists explain this by using the concept of an output gap. (Source: adapted from http://www.bankofengland.co.uk/publications/ Documents/quarterlybulletin/2014/qb14q201.pdf)
(a) With reference to Extract D (line 18), explain the meaning of the term ‘output gap’. Use an aggregate demand and aggregate supply diagram in your answer. (5)
June 2017 · Paper 3 · Q2(b) 8 marks AO1=2, AO2=2, AO3=2, AO4=2 8-mark response Hard public finances and taxation
Data and extracts for question 2The UK economy Figure 4: UK national debt as a percentage of GDP 90 Forecast 80 70 60 % of 50 GDP 40 30 20 10 0 (Source: http://budgetresponsibility.org.uk/docs/dlm_uploads/BriefGuide_020511.pdf) Figure 5: UK fiscal deficit, public sector net borrowing (PSNB) 80 Forecast 40 £ billion 0 –40 –80 –120 –160 (Source: http://budgetresponsibility.org.uk/docs/dlm_uploads/BriefGuide_020511.pdf) Figure 6: Labour productivity per head, selected countries UK Spain France Indices: 2008 Q1(base) = 100 120 115 110 105 100 Index 95 90 85 80 75 1999 2001 2003 2005 2007 2009 2011 2013 (Source: http://www.bankofengland.co.uk/publications/Documents/ quarterlybulletin/2014/qb14q201.pdf) Extract C The National Living Wage (NLW) The Government has announced that from 2016 it will introduce a Living Wage Premium that will apply on top of the National Minimum Wage (NMW) for employees aged 25 and over to deliver a National Living Wage (NLW) for those people. The main NMW will continue to be set for all employees aged 21 and over, so that those aged 21 to 24 will 5 continue to be subject only to that rate. The effective minimum wage for the 25+ age group will therefore be over 13% higher in 2020 than would otherwise have been the case, and result in a 0.3% increase in wage costs overall. Further impacts on real GDP are estimated to be higher productivity (+0.3%) but lower average hours worked (-0.2%) and higher unemployment. Overall real 10 GDP is forecast to fall by 0.1% as a result of the NLW. However these forecasts depend on estimates of the likely elasticity of demand for labour. Academic evidence suggests that changes to the NMW since 1999 have led to only limited effects on demand for labour in the UK. The types of work that will be affected are relatively labour intensive, which may limit the scope for firms to substitute towards 15 using capital. Firms may also be expected to shift demand in favour of the under-25s given that they will not be subject to the NLW, which all else being equal would lead to a smaller reduction in overall labour demand. Some of the reduction in employees could also be partially offset by a rise in self-employment. But increasing the NLW to a higher proportion of median earnings may lead to bigger effects than have been experienced in 20 the past. (Sources: adapted from http://cdn.budgetresponsibility.independent.gov.uk/ July-2015-EFO-234224.pdf and http://budgetresponsibility.independent.gov.uk/) Extract D The productivity puzzle in the UK Since the onset of the 2007–2008 financial crisis, labour productivity growth in the UK has been exceptionally weak. Despite some modest improvements in 2013, whole-economy output per hour remains around 16% below the level implied by its pre-crisis trend. Even taking into account possible measurement issues and changes 5 in the size of the service sector, this shortfall is large and is often referred to as the ‘productivity puzzle’. Measures of productivity can be used to inform estimates of an economy’s ability to grow without generating excessive inflationary pressure, which makes understanding recent movements important for the conduct of monetary policy. During the initial phases 10 of the recession, companies appear to have acted flexibly by holding on to labour and lowering levels of capacity utilisation in response to weak demand conditions. But the protracted weakness in productivity and the strength in employment growth over the past two years suggest that other factors are likely to be having a more persistent impact on the level of productivity. These factors are reduced investment in both physical and 15 intangible capital, such as innovation and training, and failings in the labour market such as immobility of labour and under-employment of skilled workers. Some economists explain this by using the concept of an output gap. (Source: adapted from http://www.bankofengland.co.uk/publications/ Documents/quarterlybulletin/2014/qb14q201.pdf)
(b) With reference to Figures 4 and 5 and your own knowledge, examine the relationship between the national debt as a proportion of GDP and the fiscal deficit. (8)
June 2017 · Paper 3 · Q2(c) 12 marks AO1=2, AO2=2, AO3=4, AO4=4 12-mark response revenues costs and profits
Data and extracts for question 2The UK economy Figure 4: UK national debt as a percentage of GDP 90 Forecast 80 70 60 % of 50 GDP 40 30 20 10 0 (Source: http://budgetresponsibility.org.uk/docs/dlm_uploads/BriefGuide_020511.pdf) Figure 5: UK fiscal deficit, public sector net borrowing (PSNB) 80 Forecast 40 £ billion 0 –40 –80 –120 –160 (Source: http://budgetresponsibility.org.uk/docs/dlm_uploads/BriefGuide_020511.pdf) Figure 6: Labour productivity per head, selected countries UK Spain France Indices: 2008 Q1(base) = 100 120 115 110 105 100 Index 95 90 85 80 75 1999 2001 2003 2005 2007 2009 2011 2013 (Source: http://www.bankofengland.co.uk/publications/Documents/ quarterlybulletin/2014/qb14q201.pdf) Extract C The National Living Wage (NLW) The Government has announced that from 2016 it will introduce a Living Wage Premium that will apply on top of the National Minimum Wage (NMW) for employees aged 25 and over to deliver a National Living Wage (NLW) for those people. The main NMW will continue to be set for all employees aged 21 and over, so that those aged 21 to 24 will 5 continue to be subject only to that rate. The effective minimum wage for the 25+ age group will therefore be over 13% higher in 2020 than would otherwise have been the case, and result in a 0.3% increase in wage costs overall. Further impacts on real GDP are estimated to be higher productivity (+0.3%) but lower average hours worked (-0.2%) and higher unemployment. Overall real 10 GDP is forecast to fall by 0.1% as a result of the NLW. However these forecasts depend on estimates of the likely elasticity of demand for labour. Academic evidence suggests that changes to the NMW since 1999 have led to only limited effects on demand for labour in the UK. The types of work that will be affected are relatively labour intensive, which may limit the scope for firms to substitute towards 15 using capital. Firms may also be expected to shift demand in favour of the under-25s given that they will not be subject to the NLW, which all else being equal would lead to a smaller reduction in overall labour demand. Some of the reduction in employees could also be partially offset by a rise in self-employment. But increasing the NLW to a higher proportion of median earnings may lead to bigger effects than have been experienced in 20 the past. (Sources: adapted from http://cdn.budgetresponsibility.independent.gov.uk/ July-2015-EFO-234224.pdf and http://budgetresponsibility.independent.gov.uk/) Extract D The productivity puzzle in the UK Since the onset of the 2007–2008 financial crisis, labour productivity growth in the UK has been exceptionally weak. Despite some modest improvements in 2013, whole-economy output per hour remains around 16% below the level implied by its pre-crisis trend. Even taking into account possible measurement issues and changes 5 in the size of the service sector, this shortfall is large and is often referred to as the ‘productivity puzzle’. Measures of productivity can be used to inform estimates of an economy’s ability to grow without generating excessive inflationary pressure, which makes understanding recent movements important for the conduct of monetary policy. During the initial phases 10 of the recession, companies appear to have acted flexibly by holding on to labour and lowering levels of capacity utilisation in response to weak demand conditions. But the protracted weakness in productivity and the strength in employment growth over the past two years suggest that other factors are likely to be having a more persistent impact on the level of productivity. These factors are reduced investment in both physical and 15 intangible capital, such as innovation and training, and failings in the labour market such as immobility of labour and under-employment of skilled workers. Some economists explain this by using the concept of an output gap. (Source: adapted from http://www.bankofengland.co.uk/publications/ Documents/quarterlybulletin/2014/qb14q201.pdf)
(c) Discuss the likely impact of the National Living Wage on the profitability of firms. Use a cost and revenue diagram in your answer. (12)
June 2017 · Paper 3 · Q2(d) 25 marks AO1=4, AO2=4, AO3=8, AO4=9 25-mark essay Either/or international competitiveness
Data and extracts for question 2The UK economy Figure 4: UK national debt as a percentage of GDP 90 Forecast 80 70 60 % of 50 GDP 40 30 20 10 0 (Source: http://budgetresponsibility.org.uk/docs/dlm_uploads/BriefGuide_020511.pdf) Figure 5: UK fiscal deficit, public sector net borrowing (PSNB) 80 Forecast 40 £ billion 0 –40 –80 –120 –160 (Source: http://budgetresponsibility.org.uk/docs/dlm_uploads/BriefGuide_020511.pdf) Figure 6: Labour productivity per head, selected countries UK Spain France Indices: 2008 Q1(base) = 100 120 115 110 105 100 Index 95 90 85 80 75 1999 2001 2003 2005 2007 2009 2011 2013 (Source: http://www.bankofengland.co.uk/publications/Documents/ quarterlybulletin/2014/qb14q201.pdf) Extract C The National Living Wage (NLW) The Government has announced that from 2016 it will introduce a Living Wage Premium that will apply on top of the National Minimum Wage (NMW) for employees aged 25 and over to deliver a National Living Wage (NLW) for those people. The main NMW will continue to be set for all employees aged 21 and over, so that those aged 21 to 24 will 5 continue to be subject only to that rate. The effective minimum wage for the 25+ age group will therefore be over 13% higher in 2020 than would otherwise have been the case, and result in a 0.3% increase in wage costs overall. Further impacts on real GDP are estimated to be higher productivity (+0.3%) but lower average hours worked (-0.2%) and higher unemployment. Overall real 10 GDP is forecast to fall by 0.1% as a result of the NLW. However these forecasts depend on estimates of the likely elasticity of demand for labour. Academic evidence suggests that changes to the NMW since 1999 have led to only limited effects on demand for labour in the UK. The types of work that will be affected are relatively labour intensive, which may limit the scope for firms to substitute towards 15 using capital. Firms may also be expected to shift demand in favour of the under-25s given that they will not be subject to the NLW, which all else being equal would lead to a smaller reduction in overall labour demand. Some of the reduction in employees could also be partially offset by a rise in self-employment. But increasing the NLW to a higher proportion of median earnings may lead to bigger effects than have been experienced in 20 the past. (Sources: adapted from http://cdn.budgetresponsibility.independent.gov.uk/ July-2015-EFO-234224.pdf and http://budgetresponsibility.independent.gov.uk/) Extract D The productivity puzzle in the UK Since the onset of the 2007–2008 financial crisis, labour productivity growth in the UK has been exceptionally weak. Despite some modest improvements in 2013, whole-economy output per hour remains around 16% below the level implied by its pre-crisis trend. Even taking into account possible measurement issues and changes 5 in the size of the service sector, this shortfall is large and is often referred to as the ‘productivity puzzle’. Measures of productivity can be used to inform estimates of an economy’s ability to grow without generating excessive inflationary pressure, which makes understanding recent movements important for the conduct of monetary policy. During the initial phases 10 of the recession, companies appear to have acted flexibly by holding on to labour and lowering levels of capacity utilisation in response to weak demand conditions. But the protracted weakness in productivity and the strength in employment growth over the past two years suggest that other factors are likely to be having a more persistent impact on the level of productivity. These factors are reduced investment in both physical and 15 intangible capital, such as innovation and training, and failings in the labour market such as immobility of labour and under-employment of skilled workers. Some economists explain this by using the concept of an output gap. (Source: adapted from http://www.bankofengland.co.uk/publications/ Documents/quarterlybulletin/2014/qb14q201.pdf)
(d) With reference to the information provided and your own knowledge, evaluate the likely microeconomic and macroeconomic influences on the UK’s international competitiveness. (25)
June 2017 · Paper 3 · Q2(e) 25 marks AO1=4, AO2=4, AO3=8, AO4=9 25-mark essay Either/or public finances and taxation
Data and extracts for question 2The UK economy Figure 4: UK national debt as a percentage of GDP 90 Forecast 80 70 60 % of 50 GDP 40 30 20 10 0 (Source: http://budgetresponsibility.org.uk/docs/dlm_uploads/BriefGuide_020511.pdf) Figure 5: UK fiscal deficit, public sector net borrowing (PSNB) 80 Forecast 40 £ billion 0 –40 –80 –120 –160 (Source: http://budgetresponsibility.org.uk/docs/dlm_uploads/BriefGuide_020511.pdf) Figure 6: Labour productivity per head, selected countries UK Spain France Indices: 2008 Q1(base) = 100 120 115 110 105 100 Index 95 90 85 80 75 1999 2001 2003 2005 2007 2009 2011 2013 (Source: http://www.bankofengland.co.uk/publications/Documents/ quarterlybulletin/2014/qb14q201.pdf) Extract C The National Living Wage (NLW) The Government has announced that from 2016 it will introduce a Living Wage Premium that will apply on top of the National Minimum Wage (NMW) for employees aged 25 and over to deliver a National Living Wage (NLW) for those people. The main NMW will continue to be set for all employees aged 21 and over, so that those aged 21 to 24 will 5 continue to be subject only to that rate. The effective minimum wage for the 25+ age group will therefore be over 13% higher in 2020 than would otherwise have been the case, and result in a 0.3% increase in wage costs overall. Further impacts on real GDP are estimated to be higher productivity (+0.3%) but lower average hours worked (-0.2%) and higher unemployment. Overall real 10 GDP is forecast to fall by 0.1% as a result of the NLW. However these forecasts depend on estimates of the likely elasticity of demand for labour. Academic evidence suggests that changes to the NMW since 1999 have led to only limited effects on demand for labour in the UK. The types of work that will be affected are relatively labour intensive, which may limit the scope for firms to substitute towards 15 using capital. Firms may also be expected to shift demand in favour of the under-25s given that they will not be subject to the NLW, which all else being equal would lead to a smaller reduction in overall labour demand. Some of the reduction in employees could also be partially offset by a rise in self-employment. But increasing the NLW to a higher proportion of median earnings may lead to bigger effects than have been experienced in 20 the past. (Sources: adapted from http://cdn.budgetresponsibility.independent.gov.uk/ July-2015-EFO-234224.pdf and http://budgetresponsibility.independent.gov.uk/) Extract D The productivity puzzle in the UK Since the onset of the 2007–2008 financial crisis, labour productivity growth in the UK has been exceptionally weak. Despite some modest improvements in 2013, whole-economy output per hour remains around 16% below the level implied by its pre-crisis trend. Even taking into account possible measurement issues and changes 5 in the size of the service sector, this shortfall is large and is often referred to as the ‘productivity puzzle’. Measures of productivity can be used to inform estimates of an economy’s ability to grow without generating excessive inflationary pressure, which makes understanding recent movements important for the conduct of monetary policy. During the initial phases 10 of the recession, companies appear to have acted flexibly by holding on to labour and lowering levels of capacity utilisation in response to weak demand conditions. But the protracted weakness in productivity and the strength in employment growth over the past two years suggest that other factors are likely to be having a more persistent impact on the level of productivity. These factors are reduced investment in both physical and 15 intangible capital, such as innovation and training, and failings in the labour market such as immobility of labour and under-employment of skilled workers. Some economists explain this by using the concept of an output gap. (Source: adapted from http://www.bankofengland.co.uk/publications/ Documents/quarterlybulletin/2014/qb14q201.pdf)
(e) With reference to the information provided and your own knowledge, evaluate the microeconomic and macroeconomic effects of a government policy of cutting public expenditure rather than raising taxes as a means of reducing a fiscal deficit. (25)
June 2016 · AS Paper 1 · Q3(b) 3 marks AO1=1, AO2=2 Short answer government intervention in markets
Data and extracts for question 33 The area around Lake Naivasha in Kenya supplies 70% of the UK cut-rose flower market. Much of the water which the flower farms are dependent on is extracted from the lake. This has resulted in damage to fish stocks and increasing competition for water. (Source: adapted from ‘Flower Struggles’, Matthew Wilson, House and Home, Financial Times, 28 February/1 March 2015)
(b) Explain one measure the Kenyan government could use to reduce the impact of water extraction from Lake Naivasha. (3)
June 2016 · AS Paper 1 · Q4(a) 3 marks AO1=1, AO2=2 Short answer supply and demand
Data and extracts for question 44 A restaurant in London offers an “all you can eat buffet for £8.99”. At this price you can refill your plate as many times as you like.
(a) With reference to the statement above explain what is meant by ‘diminishing marginal utility’. (3)
June 2016 · AS Paper 1 · Q5(b) 3 marks AO1=1, AO2=2 Short answer price elasticity of demand
Data and extracts for question 55 “Since peaking at 132p a litre in July 2014, petrol prices have fallen by 20%”. (Source: adapted from UK petrol prices cut again, L Elliott, The Guardian 12-1-15 http://www.theguardian.com/business/2015/jan/12/oil-slump-uk-petrol-prices-fall)
(b) The price elasticity of demand for petrol is –0.2. Explain the change to the total revenue of petrol stations as a result of cutting their prices. (3)
June 2016 · AS Paper 1 · Q6(a) 5 marks AO1=1, AO2=2, AO3=2 Short answer elasticity of supply
Data and extracts for question 6The market for housing Figure 1 – Estimates of the price elasticity of supply of new housing, selected countries 2.5 2.0 1.5 Price elasticity of supply 1.0 0.5 0.0 (Source: adapted from Caldera Sánchez, A. and Å. Johansson (2011), “The Price Responsiveness of Housing Supply in OECD Countries”, Figure 3, OECD Economics Department Working Papers, No. 837, OECD Publishing. http://dx.doi.org/10.1787/5kgk9qhrnn33-en) Figure 2 – Index of UK house prices (1993 = 100) 400 375 350 325 300 275 250 225 200 Q3 Q1 Q3 Q1 Q3 Q1 Q3 Q1 Q3 Q1 Q3 Q1 Q3 Q1 Q3 Q1 2007 2008 2008 2009 2009 2010 2010 2011 2011 2012 2012 2013 2013 2014 2014 2015 (Source: http://www.nationwide.co.uk/about/house-price-index/download-data#~ ) Extract A Problems facing UK first time buyers Over a third of aspiring first time buyers in the UK have given up hope of ever being able to save for a deposit to buy a property, new research has found. A deposit is the minimum amount that must be paid upfront when buying a property, which is a proportion of the price of the property. The UK Government has a Help to Buy scheme designed to help people buy a home. The 5 government subsidises the mortgage (loan) needed to buy a property, so buyers require a smaller amount saved as a deposit. Under this scheme, first time buyers need as little as a 5% deposit to qualify for a mortgage. This is due to end in the first few months of 2017. The research from mortgage insurer Genworth says this will mean a return to 20% deposits, which would see the average time needed to save for a deposit rise from three 10 years to over 10 years. “Trying to buy your first home in the current climate is like chasing a runaway train. Even with good salaries that could comfortably support a mortgage, thousands of aspiring first time buyers can only save modest sums, especially those who are already paying rent. This deposit trap is why many feel they are left with the all or nothing choice of 15 borrowing from family or waving goodbye to ever owning a home,” said Simon Crone, a vice president at Genworth. “Help to Buy has significantly improved access to mortgages with deposits that are actually realistic to save. The numbers using the scheme may be modest, but it has made significant inroads in the short-term to boost access at the lower end of the property 20 market,” he pointed out. (Source: adapted from http://www.propertywire.com/news/europe/ uk-first-time-buyers-201409309641.html September 2014) Extract B Housing and flood defences A radical new approach to housing and a £2.3 billion of investment in flood defences were announced as part of the UK Government’s new National Infrastructure Plan 2014. One key proposal is for the government to plan, build and sell homes. An initial programme on a government-owned former airfield near Cambridge will see the development of 10 000 homes. This approach will fast track the development by 5 providing certainty and making new homes available more quickly. The government will make the initial investment but expects that later costs will be met through the sale of land and homes. It will also evaluate the feasibility and economic effects of rolling out this model on a wider scale, to support and accelerate housing supply. The plan also commits to £2.3 billion of capital investment to over 1400 flood defence 10 projects in a 6-year programme of investment. As a result, over 300 000 homes will be better protected and over £30 billion of economic damages prevented. Major projects that will benefit include £42 million for the Oxford Flood Alleviation Scheme, £80 million for the Humber Estuary and over £17 million for Tonbridge, Yalding and the surrounding communities. 15 (Source: adapted from https://www.gov.uk/government/news/ambitious-plans-for-housing-flood-defence- and-roads-set-out-in-national-infrastructure-plan-2014)
(a) With reference to Figure 1, explain one possible reason for the differences in price elasticity of supply of new housing between countries. (5)
June 2016 · AS Paper 1 · Q6(b) 10 marks AO1=2, AO2=2, AO3=2, AO4=4 10-mark response price elasticity of demandsupply and demand
Data and extracts for question 6The market for housing Figure 1 – Estimates of the price elasticity of supply of new housing, selected countries 2.5 2.0 1.5 Price elasticity of supply 1.0 0.5 0.0 (Source: adapted from Caldera Sánchez, A. and Å. Johansson (2011), “The Price Responsiveness of Housing Supply in OECD Countries”, Figure 3, OECD Economics Department Working Papers, No. 837, OECD Publishing. http://dx.doi.org/10.1787/5kgk9qhrnn33-en) Figure 2 – Index of UK house prices (1993 = 100) 400 375 350 325 300 275 250 225 200 Q3 Q1 Q3 Q1 Q3 Q1 Q3 Q1 Q3 Q1 Q3 Q1 Q3 Q1 Q3 Q1 2007 2008 2008 2009 2009 2010 2010 2011 2011 2012 2012 2013 2013 2014 2014 2015 (Source: http://www.nationwide.co.uk/about/house-price-index/download-data#~ ) Extract A Problems facing UK first time buyers Over a third of aspiring first time buyers in the UK have given up hope of ever being able to save for a deposit to buy a property, new research has found. A deposit is the minimum amount that must be paid upfront when buying a property, which is a proportion of the price of the property. The UK Government has a Help to Buy scheme designed to help people buy a home. The 5 government subsidises the mortgage (loan) needed to buy a property, so buyers require a smaller amount saved as a deposit. Under this scheme, first time buyers need as little as a 5% deposit to qualify for a mortgage. This is due to end in the first few months of 2017. The research from mortgage insurer Genworth says this will mean a return to 20% deposits, which would see the average time needed to save for a deposit rise from three 10 years to over 10 years. “Trying to buy your first home in the current climate is like chasing a runaway train. Even with good salaries that could comfortably support a mortgage, thousands of aspiring first time buyers can only save modest sums, especially those who are already paying rent. This deposit trap is why many feel they are left with the all or nothing choice of 15 borrowing from family or waving goodbye to ever owning a home,” said Simon Crone, a vice president at Genworth. “Help to Buy has significantly improved access to mortgages with deposits that are actually realistic to save. The numbers using the scheme may be modest, but it has made significant inroads in the short-term to boost access at the lower end of the property 20 market,” he pointed out. (Source: adapted from http://www.propertywire.com/news/europe/ uk-first-time-buyers-201409309641.html September 2014) Extract B Housing and flood defences A radical new approach to housing and a £2.3 billion of investment in flood defences were announced as part of the UK Government’s new National Infrastructure Plan 2014. One key proposal is for the government to plan, build and sell homes. An initial programme on a government-owned former airfield near Cambridge will see the development of 10 000 homes. This approach will fast track the development by 5 providing certainty and making new homes available more quickly. The government will make the initial investment but expects that later costs will be met through the sale of land and homes. It will also evaluate the feasibility and economic effects of rolling out this model on a wider scale, to support and accelerate housing supply. The plan also commits to £2.3 billion of capital investment to over 1400 flood defence 10 projects in a 6-year programme of investment. As a result, over 300 000 homes will be better protected and over £30 billion of economic damages prevented. Major projects that will benefit include £42 million for the Oxford Flood Alleviation Scheme, £80 million for the Humber Estuary and over £17 million for Tonbridge, Yalding and the surrounding communities. 15 (Source: adapted from https://www.gov.uk/government/news/ambitious-plans-for-housing-flood-defence- and-roads-set-out-in-national-infrastructure-plan-2014)
(b) With reference to Extract A, assess the likely impact of the Help to Buy scheme on the market for rented properties in the UK. (10)
June 2016 · AS Paper 1 · Q6(d) 4 marks AO1=2, AO2=2 Calculation supply and demand
Data and extracts for question 6The market for housing Figure 1 – Estimates of the price elasticity of supply of new housing, selected countries 2.5 2.0 1.5 Price elasticity of supply 1.0 0.5 0.0 (Source: adapted from Caldera Sánchez, A. and Å. Johansson (2011), “The Price Responsiveness of Housing Supply in OECD Countries”, Figure 3, OECD Economics Department Working Papers, No. 837, OECD Publishing. http://dx.doi.org/10.1787/5kgk9qhrnn33-en) Figure 2 – Index of UK house prices (1993 = 100) 400 375 350 325 300 275 250 225 200 Q3 Q1 Q3 Q1 Q3 Q1 Q3 Q1 Q3 Q1 Q3 Q1 Q3 Q1 Q3 Q1 2007 2008 2008 2009 2009 2010 2010 2011 2011 2012 2012 2013 2013 2014 2014 2015 (Source: http://www.nationwide.co.uk/about/house-price-index/download-data#~ ) Extract A Problems facing UK first time buyers Over a third of aspiring first time buyers in the UK have given up hope of ever being able to save for a deposit to buy a property, new research has found. A deposit is the minimum amount that must be paid upfront when buying a property, which is a proportion of the price of the property. The UK Government has a Help to Buy scheme designed to help people buy a home. The 5 government subsidises the mortgage (loan) needed to buy a property, so buyers require a smaller amount saved as a deposit. Under this scheme, first time buyers need as little as a 5% deposit to qualify for a mortgage. This is due to end in the first few months of 2017. The research from mortgage insurer Genworth says this will mean a return to 20% deposits, which would see the average time needed to save for a deposit rise from three 10 years to over 10 years. “Trying to buy your first home in the current climate is like chasing a runaway train. Even with good salaries that could comfortably support a mortgage, thousands of aspiring first time buyers can only save modest sums, especially those who are already paying rent. This deposit trap is why many feel they are left with the all or nothing choice of 15 borrowing from family or waving goodbye to ever owning a home,” said Simon Crone, a vice president at Genworth. “Help to Buy has significantly improved access to mortgages with deposits that are actually realistic to save. The numbers using the scheme may be modest, but it has made significant inroads in the short-term to boost access at the lower end of the property 20 market,” he pointed out. (Source: adapted from http://www.propertywire.com/news/europe/ uk-first-time-buyers-201409309641.html September 2014) Extract B Housing and flood defences A radical new approach to housing and a £2.3 billion of investment in flood defences were announced as part of the UK Government’s new National Infrastructure Plan 2014. One key proposal is for the government to plan, build and sell homes. An initial programme on a government-owned former airfield near Cambridge will see the development of 10 000 homes. This approach will fast track the development by 5 providing certainty and making new homes available more quickly. The government will make the initial investment but expects that later costs will be met through the sale of land and homes. It will also evaluate the feasibility and economic effects of rolling out this model on a wider scale, to support and accelerate housing supply. The plan also commits to £2.3 billion of capital investment to over 1400 flood defence 10 projects in a 6-year programme of investment. As a result, over 300 000 homes will be better protected and over £30 billion of economic damages prevented. Major projects that will benefit include £42 million for the Oxford Flood Alleviation Scheme, £80 million for the Humber Estuary and over £17 million for Tonbridge, Yalding and the surrounding communities. 15 (Source: adapted from https://www.gov.uk/government/news/ambitious-plans-for-housing-flood-defence- and-roads-set-out-in-national-infrastructure-plan-2014)
(d) With reference to Figure 2, calculate the percentage change in house prices between the first quarter of 2009 and the first quarter of 2015. You are advised to show your working. (4)
June 2016 · AS Paper 1 · Q6(e) 15 marks AO1=3, AO2=3, AO3=3, AO4=6 15-mark response price mechanism and surplus
Data and extracts for question 6The market for housing Figure 1 – Estimates of the price elasticity of supply of new housing, selected countries 2.5 2.0 1.5 Price elasticity of supply 1.0 0.5 0.0 (Source: adapted from Caldera Sánchez, A. and Å. Johansson (2011), “The Price Responsiveness of Housing Supply in OECD Countries”, Figure 3, OECD Economics Department Working Papers, No. 837, OECD Publishing. http://dx.doi.org/10.1787/5kgk9qhrnn33-en) Figure 2 – Index of UK house prices (1993 = 100) 400 375 350 325 300 275 250 225 200 Q3 Q1 Q3 Q1 Q3 Q1 Q3 Q1 Q3 Q1 Q3 Q1 Q3 Q1 Q3 Q1 2007 2008 2008 2009 2009 2010 2010 2011 2011 2012 2012 2013 2013 2014 2014 2015 (Source: http://www.nationwide.co.uk/about/house-price-index/download-data#~ ) Extract A Problems facing UK first time buyers Over a third of aspiring first time buyers in the UK have given up hope of ever being able to save for a deposit to buy a property, new research has found. A deposit is the minimum amount that must be paid upfront when buying a property, which is a proportion of the price of the property. The UK Government has a Help to Buy scheme designed to help people buy a home. The 5 government subsidises the mortgage (loan) needed to buy a property, so buyers require a smaller amount saved as a deposit. Under this scheme, first time buyers need as little as a 5% deposit to qualify for a mortgage. This is due to end in the first few months of 2017. The research from mortgage insurer Genworth says this will mean a return to 20% deposits, which would see the average time needed to save for a deposit rise from three 10 years to over 10 years. “Trying to buy your first home in the current climate is like chasing a runaway train. Even with good salaries that could comfortably support a mortgage, thousands of aspiring first time buyers can only save modest sums, especially those who are already paying rent. This deposit trap is why many feel they are left with the all or nothing choice of 15 borrowing from family or waving goodbye to ever owning a home,” said Simon Crone, a vice president at Genworth. “Help to Buy has significantly improved access to mortgages with deposits that are actually realistic to save. The numbers using the scheme may be modest, but it has made significant inroads in the short-term to boost access at the lower end of the property 20 market,” he pointed out. (Source: adapted from http://www.propertywire.com/news/europe/ uk-first-time-buyers-201409309641.html September 2014) Extract B Housing and flood defences A radical new approach to housing and a £2.3 billion of investment in flood defences were announced as part of the UK Government’s new National Infrastructure Plan 2014. One key proposal is for the government to plan, build and sell homes. An initial programme on a government-owned former airfield near Cambridge will see the development of 10 000 homes. This approach will fast track the development by 5 providing certainty and making new homes available more quickly. The government will make the initial investment but expects that later costs will be met through the sale of land and homes. It will also evaluate the feasibility and economic effects of rolling out this model on a wider scale, to support and accelerate housing supply. The plan also commits to £2.3 billion of capital investment to over 1400 flood defence 10 projects in a 6-year programme of investment. As a result, over 300 000 homes will be better protected and over £30 billion of economic damages prevented. Major projects that will benefit include £42 million for the Oxford Flood Alleviation Scheme, £80 million for the Humber Estuary and over £17 million for Tonbridge, Yalding and the surrounding communities. 15 (Source: adapted from https://www.gov.uk/government/news/ambitious-plans-for-housing-flood-defence- and-roads-set-out-in-national-infrastructure-plan-2014)
(e) With reference to Figures 1 and 2 and your own knowledge, discuss the functions of the price mechanism in allocating housing. (15)
June 2016 · AS Paper 1 · Q6(f) 20 marks AO1=4, AO2=4, AO3=6, AO4=6 20-mark essay Either/or government intervention in marketsgovernment failure
Data and extracts for question 6The market for housing Figure 1 – Estimates of the price elasticity of supply of new housing, selected countries 2.5 2.0 1.5 Price elasticity of supply 1.0 0.5 0.0 (Source: adapted from Caldera Sánchez, A. and Å. Johansson (2011), “The Price Responsiveness of Housing Supply in OECD Countries”, Figure 3, OECD Economics Department Working Papers, No. 837, OECD Publishing. http://dx.doi.org/10.1787/5kgk9qhrnn33-en) Figure 2 – Index of UK house prices (1993 = 100) 400 375 350 325 300 275 250 225 200 Q3 Q1 Q3 Q1 Q3 Q1 Q3 Q1 Q3 Q1 Q3 Q1 Q3 Q1 Q3 Q1 2007 2008 2008 2009 2009 2010 2010 2011 2011 2012 2012 2013 2013 2014 2014 2015 (Source: http://www.nationwide.co.uk/about/house-price-index/download-data#~ ) Extract A Problems facing UK first time buyers Over a third of aspiring first time buyers in the UK have given up hope of ever being able to save for a deposit to buy a property, new research has found. A deposit is the minimum amount that must be paid upfront when buying a property, which is a proportion of the price of the property. The UK Government has a Help to Buy scheme designed to help people buy a home. The 5 government subsidises the mortgage (loan) needed to buy a property, so buyers require a smaller amount saved as a deposit. Under this scheme, first time buyers need as little as a 5% deposit to qualify for a mortgage. This is due to end in the first few months of 2017. The research from mortgage insurer Genworth says this will mean a return to 20% deposits, which would see the average time needed to save for a deposit rise from three 10 years to over 10 years. “Trying to buy your first home in the current climate is like chasing a runaway train. Even with good salaries that could comfortably support a mortgage, thousands of aspiring first time buyers can only save modest sums, especially those who are already paying rent. This deposit trap is why many feel they are left with the all or nothing choice of 15 borrowing from family or waving goodbye to ever owning a home,” said Simon Crone, a vice president at Genworth. “Help to Buy has significantly improved access to mortgages with deposits that are actually realistic to save. The numbers using the scheme may be modest, but it has made significant inroads in the short-term to boost access at the lower end of the property 20 market,” he pointed out. (Source: adapted from http://www.propertywire.com/news/europe/ uk-first-time-buyers-201409309641.html September 2014) Extract B Housing and flood defences A radical new approach to housing and a £2.3 billion of investment in flood defences were announced as part of the UK Government’s new National Infrastructure Plan 2014. One key proposal is for the government to plan, build and sell homes. An initial programme on a government-owned former airfield near Cambridge will see the development of 10 000 homes. This approach will fast track the development by 5 providing certainty and making new homes available more quickly. The government will make the initial investment but expects that later costs will be met through the sale of land and homes. It will also evaluate the feasibility and economic effects of rolling out this model on a wider scale, to support and accelerate housing supply. The plan also commits to £2.3 billion of capital investment to over 1400 flood defence 10 projects in a 6-year programme of investment. As a result, over 300 000 homes will be better protected and over £30 billion of economic damages prevented. Major projects that will benefit include £42 million for the Oxford Flood Alleviation Scheme, £80 million for the Humber Estuary and over £17 million for Tonbridge, Yalding and the surrounding communities. 15 (Source: adapted from https://www.gov.uk/government/news/ambitious-plans-for-housing-flood-defence- and-roads-set-out-in-national-infrastructure-plan-2014)
(f) Evaluate the likely microeconomic effects of government intervention in the UK housing market. (20)
June 2016 · AS Paper 1 · Q6(g) 20 marks AO1=4, AO2=4, AO3=6, AO4=6 20-mark essay Either/or public goods and information gapsgovernment intervention in markets
Data and extracts for question 6The market for housing Figure 1 – Estimates of the price elasticity of supply of new housing, selected countries 2.5 2.0 1.5 Price elasticity of supply 1.0 0.5 0.0 (Source: adapted from Caldera Sánchez, A. and Å. Johansson (2011), “The Price Responsiveness of Housing Supply in OECD Countries”, Figure 3, OECD Economics Department Working Papers, No. 837, OECD Publishing. http://dx.doi.org/10.1787/5kgk9qhrnn33-en) Figure 2 – Index of UK house prices (1993 = 100) 400 375 350 325 300 275 250 225 200 Q3 Q1 Q3 Q1 Q3 Q1 Q3 Q1 Q3 Q1 Q3 Q1 Q3 Q1 Q3 Q1 2007 2008 2008 2009 2009 2010 2010 2011 2011 2012 2012 2013 2013 2014 2014 2015 (Source: http://www.nationwide.co.uk/about/house-price-index/download-data#~ ) Extract A Problems facing UK first time buyers Over a third of aspiring first time buyers in the UK have given up hope of ever being able to save for a deposit to buy a property, new research has found. A deposit is the minimum amount that must be paid upfront when buying a property, which is a proportion of the price of the property. The UK Government has a Help to Buy scheme designed to help people buy a home. The 5 government subsidises the mortgage (loan) needed to buy a property, so buyers require a smaller amount saved as a deposit. Under this scheme, first time buyers need as little as a 5% deposit to qualify for a mortgage. This is due to end in the first few months of 2017. The research from mortgage insurer Genworth says this will mean a return to 20% deposits, which would see the average time needed to save for a deposit rise from three 10 years to over 10 years. “Trying to buy your first home in the current climate is like chasing a runaway train. Even with good salaries that could comfortably support a mortgage, thousands of aspiring first time buyers can only save modest sums, especially those who are already paying rent. This deposit trap is why many feel they are left with the all or nothing choice of 15 borrowing from family or waving goodbye to ever owning a home,” said Simon Crone, a vice president at Genworth. “Help to Buy has significantly improved access to mortgages with deposits that are actually realistic to save. The numbers using the scheme may be modest, but it has made significant inroads in the short-term to boost access at the lower end of the property 20 market,” he pointed out. (Source: adapted from http://www.propertywire.com/news/europe/ uk-first-time-buyers-201409309641.html September 2014) Extract B Housing and flood defences A radical new approach to housing and a £2.3 billion of investment in flood defences were announced as part of the UK Government’s new National Infrastructure Plan 2014. One key proposal is for the government to plan, build and sell homes. An initial programme on a government-owned former airfield near Cambridge will see the development of 10 000 homes. This approach will fast track the development by 5 providing certainty and making new homes available more quickly. The government will make the initial investment but expects that later costs will be met through the sale of land and homes. It will also evaluate the feasibility and economic effects of rolling out this model on a wider scale, to support and accelerate housing supply. The plan also commits to £2.3 billion of capital investment to over 1400 flood defence 10 projects in a 6-year programme of investment. As a result, over 300 000 homes will be better protected and over £30 billion of economic damages prevented. Major projects that will benefit include £42 million for the Oxford Flood Alleviation Scheme, £80 million for the Humber Estuary and over £17 million for Tonbridge, Yalding and the surrounding communities. 15 (Source: adapted from https://www.gov.uk/government/news/ambitious-plans-for-housing-flood-defence- and-roads-set-out-in-national-infrastructure-plan-2014)
(g) Evaluate the case for government provision of goods and services such as flood defence schemes or housing. (20)
June 2016 · AS Paper 2 · Q3(b) 2 marks AO2=2 Calculation unemployment
Data and extracts for question 33 The table below shows claimant count data for the UK. Number of Claimants August 2014 961 149 September 2014 923 240 October 2014 887 771 November 2014 848 085 December 2014 823 880 January 2015 852 934 February 2015 858 344 (Source: http://www.nomisweb.co.uk/query/construct/submit.asp?forward=yes&menuopt=201&subcomp=)
(b) Calculate the percentage change in the claimant count from August 2014 to February 2015. (2)
June 2016 · AS Paper 2 · Q4(b) 3 marks AO1=1, AO2=1, AO3=1 Short answer balance of paymentsaggregate demand
Data and extracts for question 44 Figure 1 shows data on the UK’s balance of trade. Figure 1 – UK’s balance of trade January 2013 to January 2015 £ billion, seasonally adjusted 10 8 6 4 2 0 -2 -4 -6 -8 -10 -12 Balance of Trade in Goods Balance of Trade in Services Balance of Total UK Trade (Source: http://www.ons.gov.uk/ons/rel/uktrade/uk-trade/january-2015/ summ-uk-trade--january-2015.html)
(b) Explain one likely reason for the reduction in the total UK trade deficit in January 2015. (3)
June 2016 · AS Paper 2 · Q5(a) 3 marks AO1=1, AO2=2 Calculation national income and the multiplier
Data and extracts for question 55 In 2014 the Bank of England estimated the marginal propensity to consume of UK consumers to be 0.5. In 2014 the Chancellor of the Exchequer announced a £15 billion investment programme into UK road infrastructure. (Sources: http://www.bankofengland.co.uk/publications/Documents/quarterlybulletin/ 2014/qb14q405.pdf and https://www.gov.uk/government/news/ autumn-statement-2014-16-things-you-should-know)
(a) Using the information above, calculate the total increase in national income, resulting from the £15 billion investment. (3)
June 2016 · AS Paper 2 · Q6(a) 4 marks AO1=2, AO2=2 Short answer measuring economic growth
Data and extracts for question 6UK incomes, inflation and monetary policy Figure 1 – UK average weekly household real income 700 680 660 640 £ 620 600 580 2006 2007 2008 2009 2010 2011 2012 2013 (Source: http://www.ons.gov.uk/ons/rel/family-spending/family-spending/ 2014-edition/rft-a44-final-2013.xls) Figure 2 – UK inflation rate as measured by percentage changes in the Consumer Price Index (CPI) 6.0 5.0 4.0 % 3.0 2.0 1.0 0.0 (Source: http://www.bankofengland.co.uk/publications/Pages/inflationreport/2015/feb.aspx) Extract A Britons should not fear rise in interest rates The Monetary Policy Committee (MPC) of the Bank of England is prepared to raise interest rates “in the near future” if inflation increases, one of its senior policymakers has warned. Kristin Forbes, a member of the MPC, said a rise in borrowing costs would also be necessary should household debt reach unhealthy levels. However, she stressed that this was not yet a cause for concern. 5 With the UK’s base rate of interest at 0.5% and inflation at a record low and expected to be negative, the MPC is currently under no pressure to raise interest rates, despite Britain’s economic recovery. UK inflation is being driven lower by the slump in global oil prices, which have roughly halved since summer 2014, and the Bank’s governor Mark Carney warned earlier this 10 month that a strong domestic economy would translate into higher UK inflation over the medium term. “The most likely next move in monetary policy is an increase in interest rates. The message is clear,” Carney said. Forbes said that “even the more lagged effects of the rise in the value of the pound will likely peak in the first part of this year and also gradually fade. Inflation will then most 15 likely bounce back. “Since interest rates take well over a year to be fully effective, they should be adjusted to respond to inflationary risks at that time horizon – when all of these effects have diminished – rather than respond to today’s inflation.” (Source: adapted from http://www.theguardian.com/money/2015/feb/24/ britons-should-not-fear-rise-in-interest-rates- when-they-come-says-boe-member) Extract B Deflation is bad news The problem with deflation is that once you have it you can’t get rid of it. Central banks know what to do about inflation but they do not have the policy tools to deal with deflation when interest rates are almost as low as they can go. Just look at Japan, which had deflation in nine separate years from 1999-2012, with two additional years at zero, averaging minus 0.3%. The highest in any single year was minus 1.3% in 2013. 5 In the European Union (EU) in 2008, at the start of the financial crisis, there were fears of deflation but at that time central banks had the ability to cut interest rates by nearly 5 percentage points. Those fears may now be coming true, with the EU experiencing deflation of 0.5% in 2015. This was driven primarily by declines in energy prices, but there was also deflation 10 in non-energy industrial goods and telecommunications. The collapse in the cost of shipping goods potentially suggests something deeper is going on and may lead to a more persistent form of deflation than Mark Carney has currently claimed. (Source: adapted from http://www.independent.co.uk/news/business/comment/david-blanchflower/ david-blanchflower-deflation-is-bad-news--and-britain-is-likely-to-be-next-to-get-it-10078832.html)
(a) With reference to Figure 1, explain the term ‘real income’. (4)
June 2016 · AS Paper 2 · Q6(b) 10 marks AO1=2, AO2=2, AO3=2, AO4=4 10-mark response aggregate demand
Data and extracts for question 6UK incomes, inflation and monetary policy Figure 1 – UK average weekly household real income 700 680 660 640 £ 620 600 580 2006 2007 2008 2009 2010 2011 2012 2013 (Source: http://www.ons.gov.uk/ons/rel/family-spending/family-spending/ 2014-edition/rft-a44-final-2013.xls) Figure 2 – UK inflation rate as measured by percentage changes in the Consumer Price Index (CPI) 6.0 5.0 4.0 % 3.0 2.0 1.0 0.0 (Source: http://www.bankofengland.co.uk/publications/Pages/inflationreport/2015/feb.aspx) Extract A Britons should not fear rise in interest rates The Monetary Policy Committee (MPC) of the Bank of England is prepared to raise interest rates “in the near future” if inflation increases, one of its senior policymakers has warned. Kristin Forbes, a member of the MPC, said a rise in borrowing costs would also be necessary should household debt reach unhealthy levels. However, she stressed that this was not yet a cause for concern. 5 With the UK’s base rate of interest at 0.5% and inflation at a record low and expected to be negative, the MPC is currently under no pressure to raise interest rates, despite Britain’s economic recovery. UK inflation is being driven lower by the slump in global oil prices, which have roughly halved since summer 2014, and the Bank’s governor Mark Carney warned earlier this 10 month that a strong domestic economy would translate into higher UK inflation over the medium term. “The most likely next move in monetary policy is an increase in interest rates. The message is clear,” Carney said. Forbes said that “even the more lagged effects of the rise in the value of the pound will likely peak in the first part of this year and also gradually fade. Inflation will then most 15 likely bounce back. “Since interest rates take well over a year to be fully effective, they should be adjusted to respond to inflationary risks at that time horizon – when all of these effects have diminished – rather than respond to today’s inflation.” (Source: adapted from http://www.theguardian.com/money/2015/feb/24/ britons-should-not-fear-rise-in-interest-rates- when-they-come-says-boe-member) Extract B Deflation is bad news The problem with deflation is that once you have it you can’t get rid of it. Central banks know what to do about inflation but they do not have the policy tools to deal with deflation when interest rates are almost as low as they can go. Just look at Japan, which had deflation in nine separate years from 1999-2012, with two additional years at zero, averaging minus 0.3%. The highest in any single year was minus 1.3% in 2013. 5 In the European Union (EU) in 2008, at the start of the financial crisis, there were fears of deflation but at that time central banks had the ability to cut interest rates by nearly 5 percentage points. Those fears may now be coming true, with the EU experiencing deflation of 0.5% in 2015. This was driven primarily by declines in energy prices, but there was also deflation 10 in non-energy industrial goods and telecommunications. The collapse in the cost of shipping goods potentially suggests something deeper is going on and may lead to a more persistent form of deflation than Mark Carney has currently claimed. (Source: adapted from http://www.independent.co.uk/news/business/comment/david-blanchflower/ david-blanchflower-deflation-is-bad-news--and-britain-is-likely-to-be-next-to-get-it-10078832.html)
(b) Assess the likely impact of falling real incomes on UK consumers. (10)
June 2016 · AS Paper 2 · Q6(c) 5 marks AO1=1, AO2=2, AO3=2 Short answer aggregate demand
Data and extracts for question 6UK incomes, inflation and monetary policy Figure 1 – UK average weekly household real income 700 680 660 640 £ 620 600 580 2006 2007 2008 2009 2010 2011 2012 2013 (Source: http://www.ons.gov.uk/ons/rel/family-spending/family-spending/ 2014-edition/rft-a44-final-2013.xls) Figure 2 – UK inflation rate as measured by percentage changes in the Consumer Price Index (CPI) 6.0 5.0 4.0 % 3.0 2.0 1.0 0.0 (Source: http://www.bankofengland.co.uk/publications/Pages/inflationreport/2015/feb.aspx) Extract A Britons should not fear rise in interest rates The Monetary Policy Committee (MPC) of the Bank of England is prepared to raise interest rates “in the near future” if inflation increases, one of its senior policymakers has warned. Kristin Forbes, a member of the MPC, said a rise in borrowing costs would also be necessary should household debt reach unhealthy levels. However, she stressed that this was not yet a cause for concern. 5 With the UK’s base rate of interest at 0.5% and inflation at a record low and expected to be negative, the MPC is currently under no pressure to raise interest rates, despite Britain’s economic recovery. UK inflation is being driven lower by the slump in global oil prices, which have roughly halved since summer 2014, and the Bank’s governor Mark Carney warned earlier this 10 month that a strong domestic economy would translate into higher UK inflation over the medium term. “The most likely next move in monetary policy is an increase in interest rates. The message is clear,” Carney said. Forbes said that “even the more lagged effects of the rise in the value of the pound will likely peak in the first part of this year and also gradually fade. Inflation will then most 15 likely bounce back. “Since interest rates take well over a year to be fully effective, they should be adjusted to respond to inflationary risks at that time horizon – when all of these effects have diminished – rather than respond to today’s inflation.” (Source: adapted from http://www.theguardian.com/money/2015/feb/24/ britons-should-not-fear-rise-in-interest-rates- when-they-come-says-boe-member) Extract B Deflation is bad news The problem with deflation is that once you have it you can’t get rid of it. Central banks know what to do about inflation but they do not have the policy tools to deal with deflation when interest rates are almost as low as they can go. Just look at Japan, which had deflation in nine separate years from 1999-2012, with two additional years at zero, averaging minus 0.3%. The highest in any single year was minus 1.3% in 2013. 5 In the European Union (EU) in 2008, at the start of the financial crisis, there were fears of deflation but at that time central banks had the ability to cut interest rates by nearly 5 percentage points. Those fears may now be coming true, with the EU experiencing deflation of 0.5% in 2015. This was driven primarily by declines in energy prices, but there was also deflation 10 in non-energy industrial goods and telecommunications. The collapse in the cost of shipping goods potentially suggests something deeper is going on and may lead to a more persistent form of deflation than Mark Carney has currently claimed. (Source: adapted from http://www.independent.co.uk/news/business/comment/david-blanchflower/ david-blanchflower-deflation-is-bad-news--and-britain-is-likely-to-be-next-to-get-it-10078832.html)
(c) With reference to Extract A, explain the likely effect of a rise in the value of the pound on aggregate demand. (5)
June 2016 · AS Paper 2 · Q6(d) 6 marks AO1=2, AO2=2, AO3=2 Short answer inflation
Data and extracts for question 6UK incomes, inflation and monetary policy Figure 1 – UK average weekly household real income 700 680 660 640 £ 620 600 580 2006 2007 2008 2009 2010 2011 2012 2013 (Source: http://www.ons.gov.uk/ons/rel/family-spending/family-spending/ 2014-edition/rft-a44-final-2013.xls) Figure 2 – UK inflation rate as measured by percentage changes in the Consumer Price Index (CPI) 6.0 5.0 4.0 % 3.0 2.0 1.0 0.0 (Source: http://www.bankofengland.co.uk/publications/Pages/inflationreport/2015/feb.aspx) Extract A Britons should not fear rise in interest rates The Monetary Policy Committee (MPC) of the Bank of England is prepared to raise interest rates “in the near future” if inflation increases, one of its senior policymakers has warned. Kristin Forbes, a member of the MPC, said a rise in borrowing costs would also be necessary should household debt reach unhealthy levels. However, she stressed that this was not yet a cause for concern. 5 With the UK’s base rate of interest at 0.5% and inflation at a record low and expected to be negative, the MPC is currently under no pressure to raise interest rates, despite Britain’s economic recovery. UK inflation is being driven lower by the slump in global oil prices, which have roughly halved since summer 2014, and the Bank’s governor Mark Carney warned earlier this 10 month that a strong domestic economy would translate into higher UK inflation over the medium term. “The most likely next move in monetary policy is an increase in interest rates. The message is clear,” Carney said. Forbes said that “even the more lagged effects of the rise in the value of the pound will likely peak in the first part of this year and also gradually fade. Inflation will then most 15 likely bounce back. “Since interest rates take well over a year to be fully effective, they should be adjusted to respond to inflationary risks at that time horizon – when all of these effects have diminished – rather than respond to today’s inflation.” (Source: adapted from http://www.theguardian.com/money/2015/feb/24/ britons-should-not-fear-rise-in-interest-rates- when-they-come-says-boe-member) Extract B Deflation is bad news The problem with deflation is that once you have it you can’t get rid of it. Central banks know what to do about inflation but they do not have the policy tools to deal with deflation when interest rates are almost as low as they can go. Just look at Japan, which had deflation in nine separate years from 1999-2012, with two additional years at zero, averaging minus 0.3%. The highest in any single year was minus 1.3% in 2013. 5 In the European Union (EU) in 2008, at the start of the financial crisis, there were fears of deflation but at that time central banks had the ability to cut interest rates by nearly 5 percentage points. Those fears may now be coming true, with the EU experiencing deflation of 0.5% in 2015. This was driven primarily by declines in energy prices, but there was also deflation 10 in non-energy industrial goods and telecommunications. The collapse in the cost of shipping goods potentially suggests something deeper is going on and may lead to a more persistent form of deflation than Mark Carney has currently claimed. (Source: adapted from http://www.independent.co.uk/news/business/comment/david-blanchflower/ david-blanchflower-deflation-is-bad-news--and-britain-is-likely-to-be-next-to-get-it-10078832.html)
(d) With reference to the data, explain two likely reasons for the UK’s falling inflation rate. (6)
June 2016 · AS Paper 2 · Q6(e) 15 marks AO1=3, AO2=3, AO3=3, AO4=6 15-mark response inflationfiscal and monetary policy
Data and extracts for question 6UK incomes, inflation and monetary policy Figure 1 – UK average weekly household real income 700 680 660 640 £ 620 600 580 2006 2007 2008 2009 2010 2011 2012 2013 (Source: http://www.ons.gov.uk/ons/rel/family-spending/family-spending/ 2014-edition/rft-a44-final-2013.xls) Figure 2 – UK inflation rate as measured by percentage changes in the Consumer Price Index (CPI) 6.0 5.0 4.0 % 3.0 2.0 1.0 0.0 (Source: http://www.bankofengland.co.uk/publications/Pages/inflationreport/2015/feb.aspx) Extract A Britons should not fear rise in interest rates The Monetary Policy Committee (MPC) of the Bank of England is prepared to raise interest rates “in the near future” if inflation increases, one of its senior policymakers has warned. Kristin Forbes, a member of the MPC, said a rise in borrowing costs would also be necessary should household debt reach unhealthy levels. However, she stressed that this was not yet a cause for concern. 5 With the UK’s base rate of interest at 0.5% and inflation at a record low and expected to be negative, the MPC is currently under no pressure to raise interest rates, despite Britain’s economic recovery. UK inflation is being driven lower by the slump in global oil prices, which have roughly halved since summer 2014, and the Bank’s governor Mark Carney warned earlier this 10 month that a strong domestic economy would translate into higher UK inflation over the medium term. “The most likely next move in monetary policy is an increase in interest rates. The message is clear,” Carney said. Forbes said that “even the more lagged effects of the rise in the value of the pound will likely peak in the first part of this year and also gradually fade. Inflation will then most 15 likely bounce back. “Since interest rates take well over a year to be fully effective, they should be adjusted to respond to inflationary risks at that time horizon – when all of these effects have diminished – rather than respond to today’s inflation.” (Source: adapted from http://www.theguardian.com/money/2015/feb/24/ britons-should-not-fear-rise-in-interest-rates- when-they-come-says-boe-member) Extract B Deflation is bad news The problem with deflation is that once you have it you can’t get rid of it. Central banks know what to do about inflation but they do not have the policy tools to deal with deflation when interest rates are almost as low as they can go. Just look at Japan, which had deflation in nine separate years from 1999-2012, with two additional years at zero, averaging minus 0.3%. The highest in any single year was minus 1.3% in 2013. 5 In the European Union (EU) in 2008, at the start of the financial crisis, there were fears of deflation but at that time central banks had the ability to cut interest rates by nearly 5 percentage points. Those fears may now be coming true, with the EU experiencing deflation of 0.5% in 2015. This was driven primarily by declines in energy prices, but there was also deflation 10 in non-energy industrial goods and telecommunications. The collapse in the cost of shipping goods potentially suggests something deeper is going on and may lead to a more persistent form of deflation than Mark Carney has currently claimed. (Source: adapted from http://www.independent.co.uk/news/business/comment/david-blanchflower/ david-blanchflower-deflation-is-bad-news--and-britain-is-likely-to-be-next-to-get-it-10078832.html)
(e) With reference to Extracts A and B and your own knowledge, discuss whether the MPC should be concerned about the risk of deflation in the UK economy. (15)
June 2016 · AS Paper 2 · Q6(f) 20 marks AO1=4, AO2=4, AO3=6, AO4=6 20-mark essay Either/or fiscal and monetary policyinflation
Data and extracts for question 6UK incomes, inflation and monetary policy Figure 1 – UK average weekly household real income 700 680 660 640 £ 620 600 580 2006 2007 2008 2009 2010 2011 2012 2013 (Source: http://www.ons.gov.uk/ons/rel/family-spending/family-spending/ 2014-edition/rft-a44-final-2013.xls) Figure 2 – UK inflation rate as measured by percentage changes in the Consumer Price Index (CPI) 6.0 5.0 4.0 % 3.0 2.0 1.0 0.0 (Source: http://www.bankofengland.co.uk/publications/Pages/inflationreport/2015/feb.aspx) Extract A Britons should not fear rise in interest rates The Monetary Policy Committee (MPC) of the Bank of England is prepared to raise interest rates “in the near future” if inflation increases, one of its senior policymakers has warned. Kristin Forbes, a member of the MPC, said a rise in borrowing costs would also be necessary should household debt reach unhealthy levels. However, she stressed that this was not yet a cause for concern. 5 With the UK’s base rate of interest at 0.5% and inflation at a record low and expected to be negative, the MPC is currently under no pressure to raise interest rates, despite Britain’s economic recovery. UK inflation is being driven lower by the slump in global oil prices, which have roughly halved since summer 2014, and the Bank’s governor Mark Carney warned earlier this 10 month that a strong domestic economy would translate into higher UK inflation over the medium term. “The most likely next move in monetary policy is an increase in interest rates. The message is clear,” Carney said. Forbes said that “even the more lagged effects of the rise in the value of the pound will likely peak in the first part of this year and also gradually fade. Inflation will then most 15 likely bounce back. “Since interest rates take well over a year to be fully effective, they should be adjusted to respond to inflationary risks at that time horizon – when all of these effects have diminished – rather than respond to today’s inflation.” (Source: adapted from http://www.theguardian.com/money/2015/feb/24/ britons-should-not-fear-rise-in-interest-rates- when-they-come-says-boe-member) Extract B Deflation is bad news The problem with deflation is that once you have it you can’t get rid of it. Central banks know what to do about inflation but they do not have the policy tools to deal with deflation when interest rates are almost as low as they can go. Just look at Japan, which had deflation in nine separate years from 1999-2012, with two additional years at zero, averaging minus 0.3%. The highest in any single year was minus 1.3% in 2013. 5 In the European Union (EU) in 2008, at the start of the financial crisis, there were fears of deflation but at that time central banks had the ability to cut interest rates by nearly 5 percentage points. Those fears may now be coming true, with the EU experiencing deflation of 0.5% in 2015. This was driven primarily by declines in energy prices, but there was also deflation 10 in non-energy industrial goods and telecommunications. The collapse in the cost of shipping goods potentially suggests something deeper is going on and may lead to a more persistent form of deflation than Mark Carney has currently claimed. (Source: adapted from http://www.independent.co.uk/news/business/comment/david-blanchflower/ david-blanchflower-deflation-is-bad-news--and-britain-is-likely-to-be-next-to-get-it-10078832.html)
(f) Evaluate whether the MPC has been successful in controlling the UK’s inflation rate since 2011. (20)

Work with an Edexcel economics tutor

Essays stuck in Level 2, or losing the easy marks in Section A? Book a trial session with Lianne, a former Edexcel examiner.
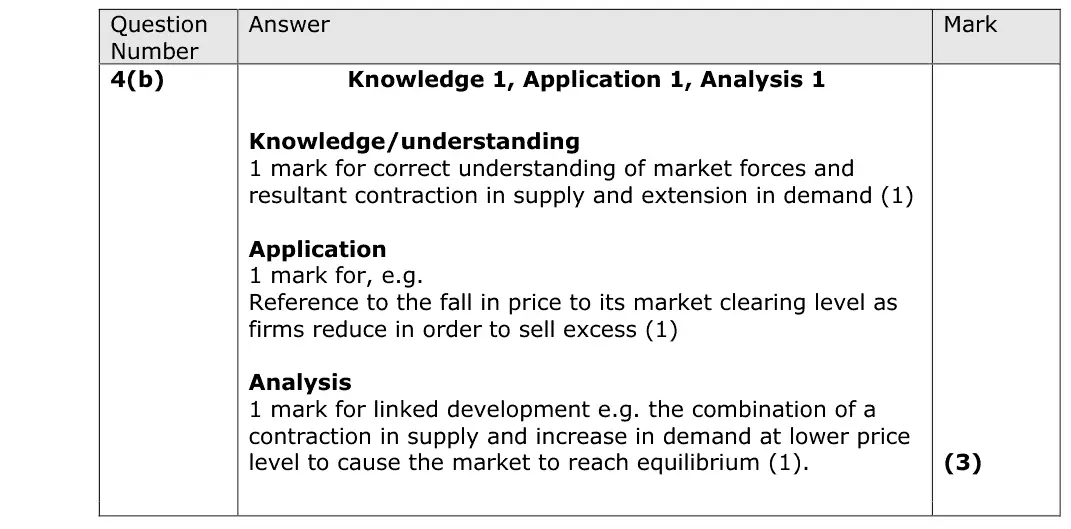

Prefer email? Send an enquiry

If you are under 18, please include a parent's contact details. Enquiries go to enquiries@economicsaleveltutor.com and are deleted once handled. All tutoring is online.