Notes and key-term cards for this topic are being written by our tutors. The past-paper questions below are ready now.
Specification statements
2.4.1National income: a) The circular flow of income b) The distinction between income and wealthAS
2.4.2Injections and withdrawals: a) The impact of injections into, and withdrawals from, the circular flow of incomeAS
2.4.3Equilibrium levels of real national output: a) The concept of equilibrium real national output b) The use of AD/AS diagrams to show how shifts in AD or AS cause changes in the equilibrium price level and real national outputAS
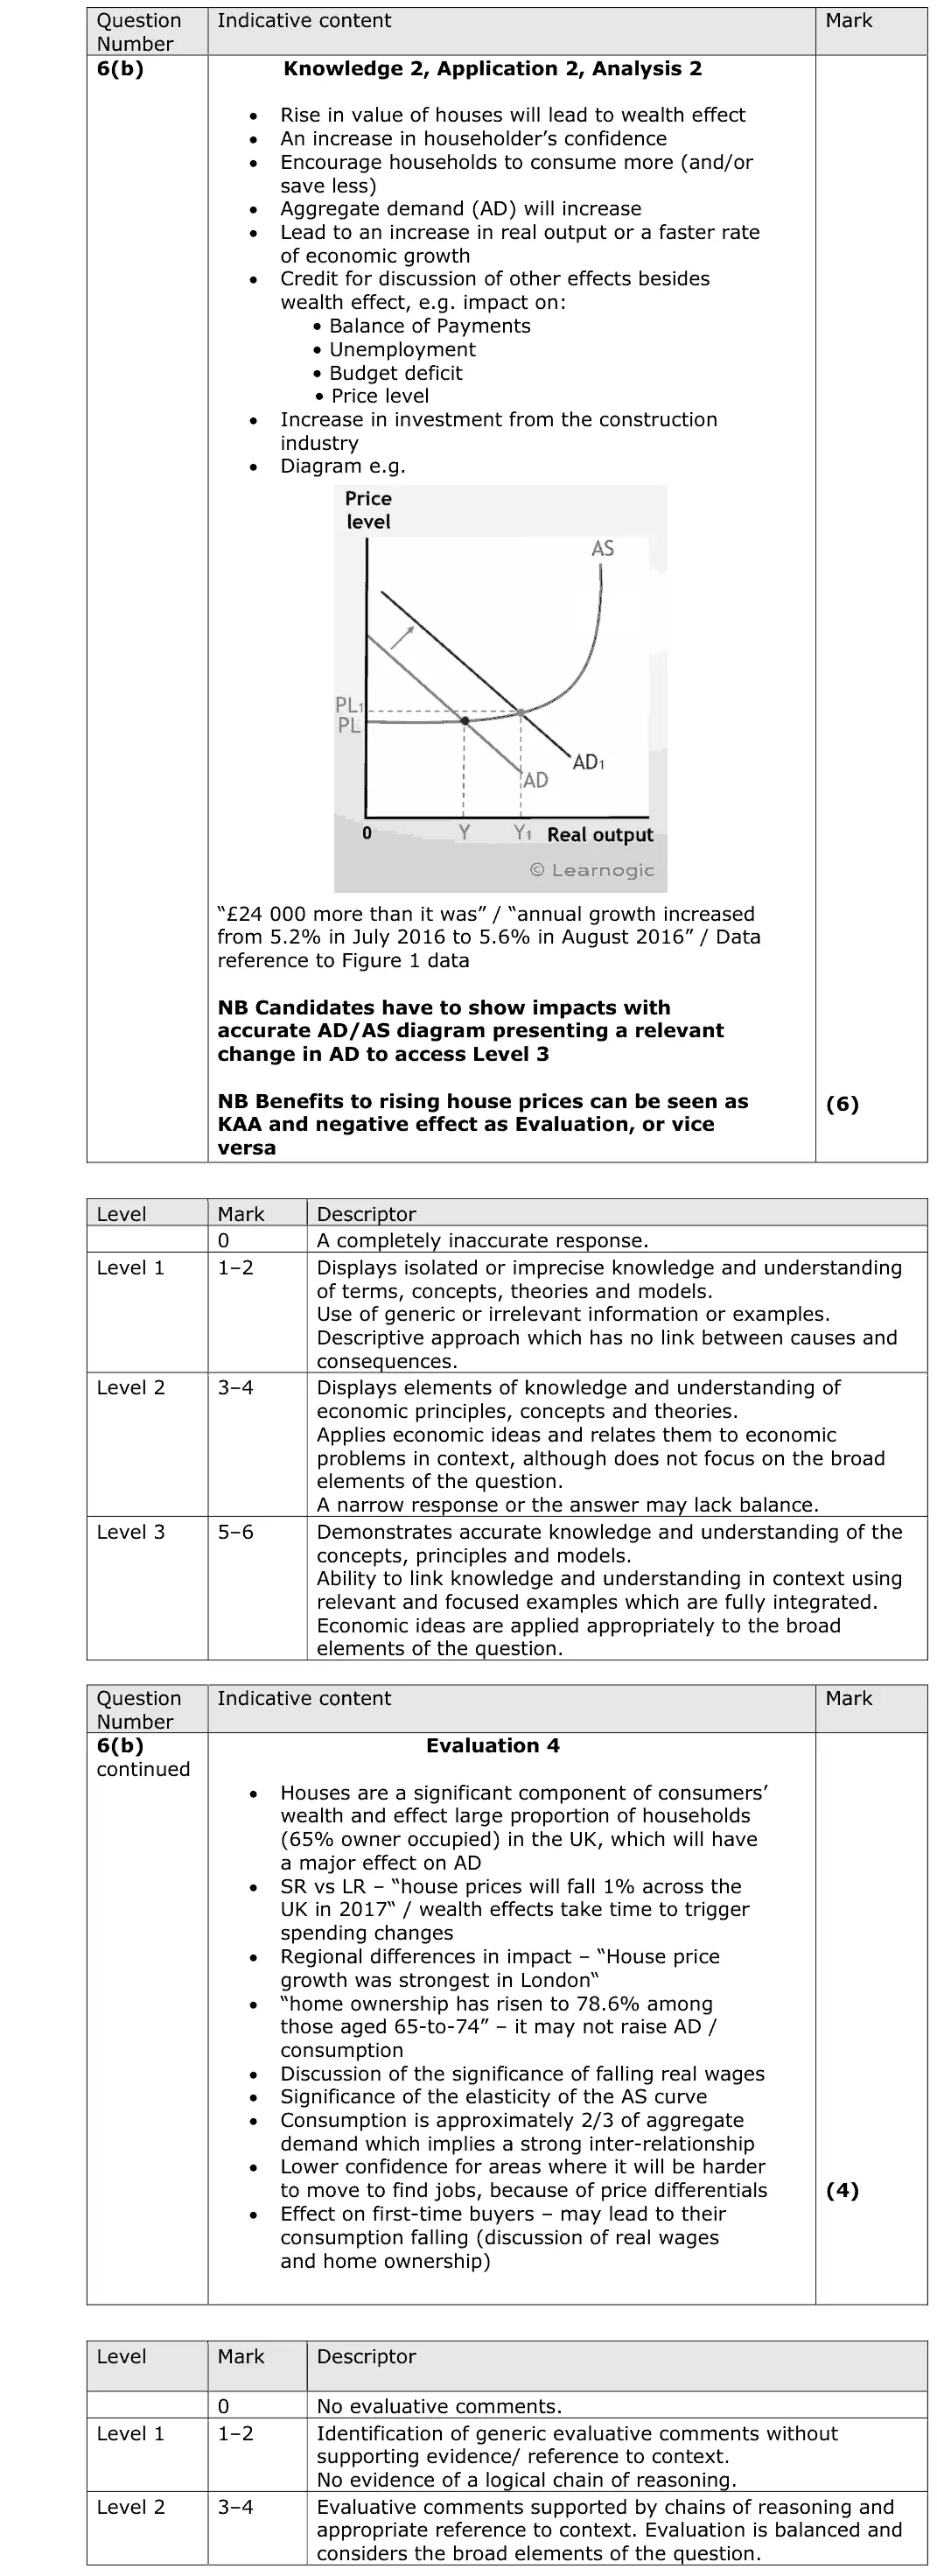
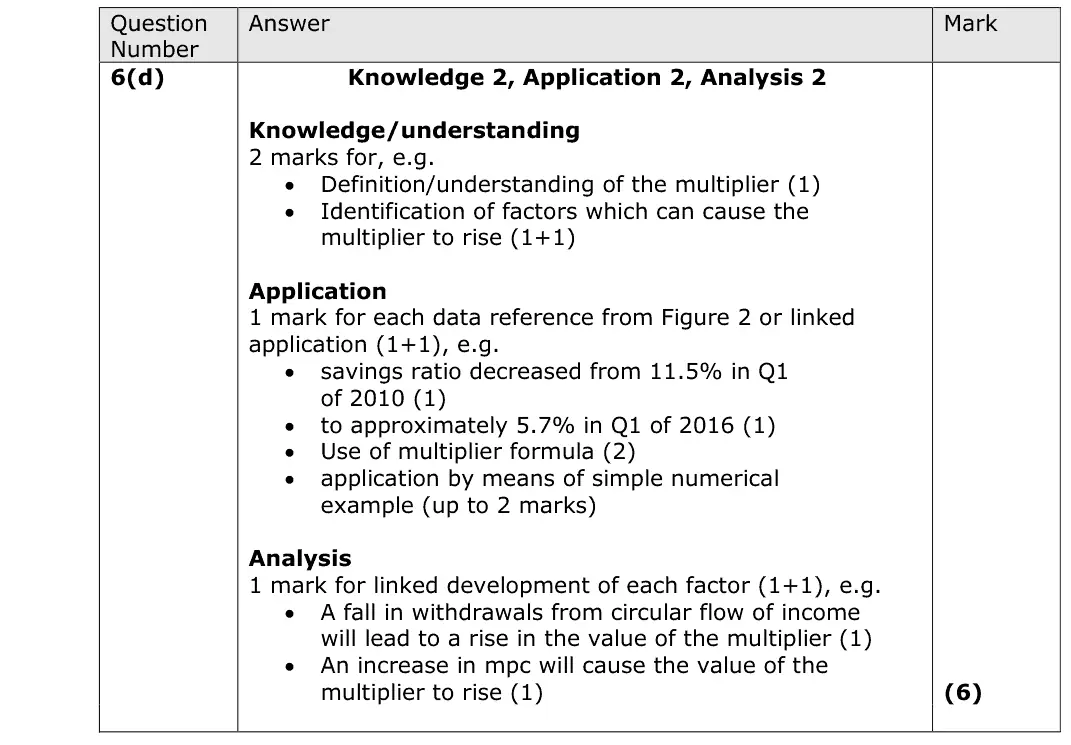
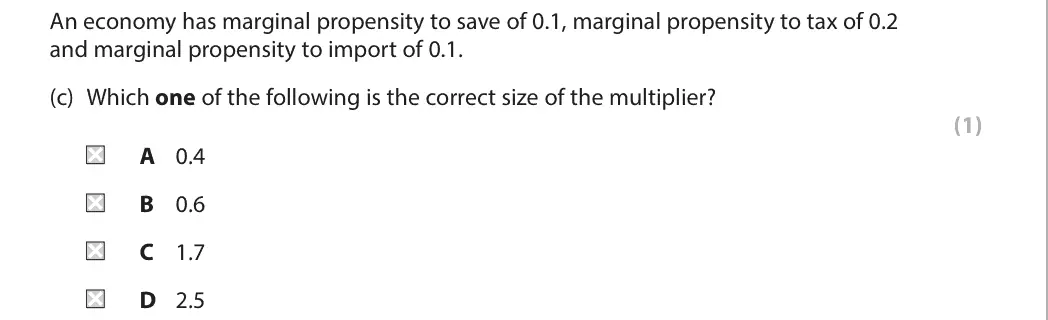
2.4.4The multiplier: a) The multiplier ratio b) The multiplier process c) Effects of the multiplier on the economy d) Understanding of marginal propensities and their effects on the multiplier: • the marginal propensity to consume (MPC) • the marginal propensity to save (MPS) • the marginal propensity to tax (MPT) • the marginal propensity to import (MPM) e) Calculations of the multiplier using the formulae 1/(1-MPC) and 1/MPW, where MPW=MPS+MPT+MPM f) The significance of the multiplier for shifts in ADAS
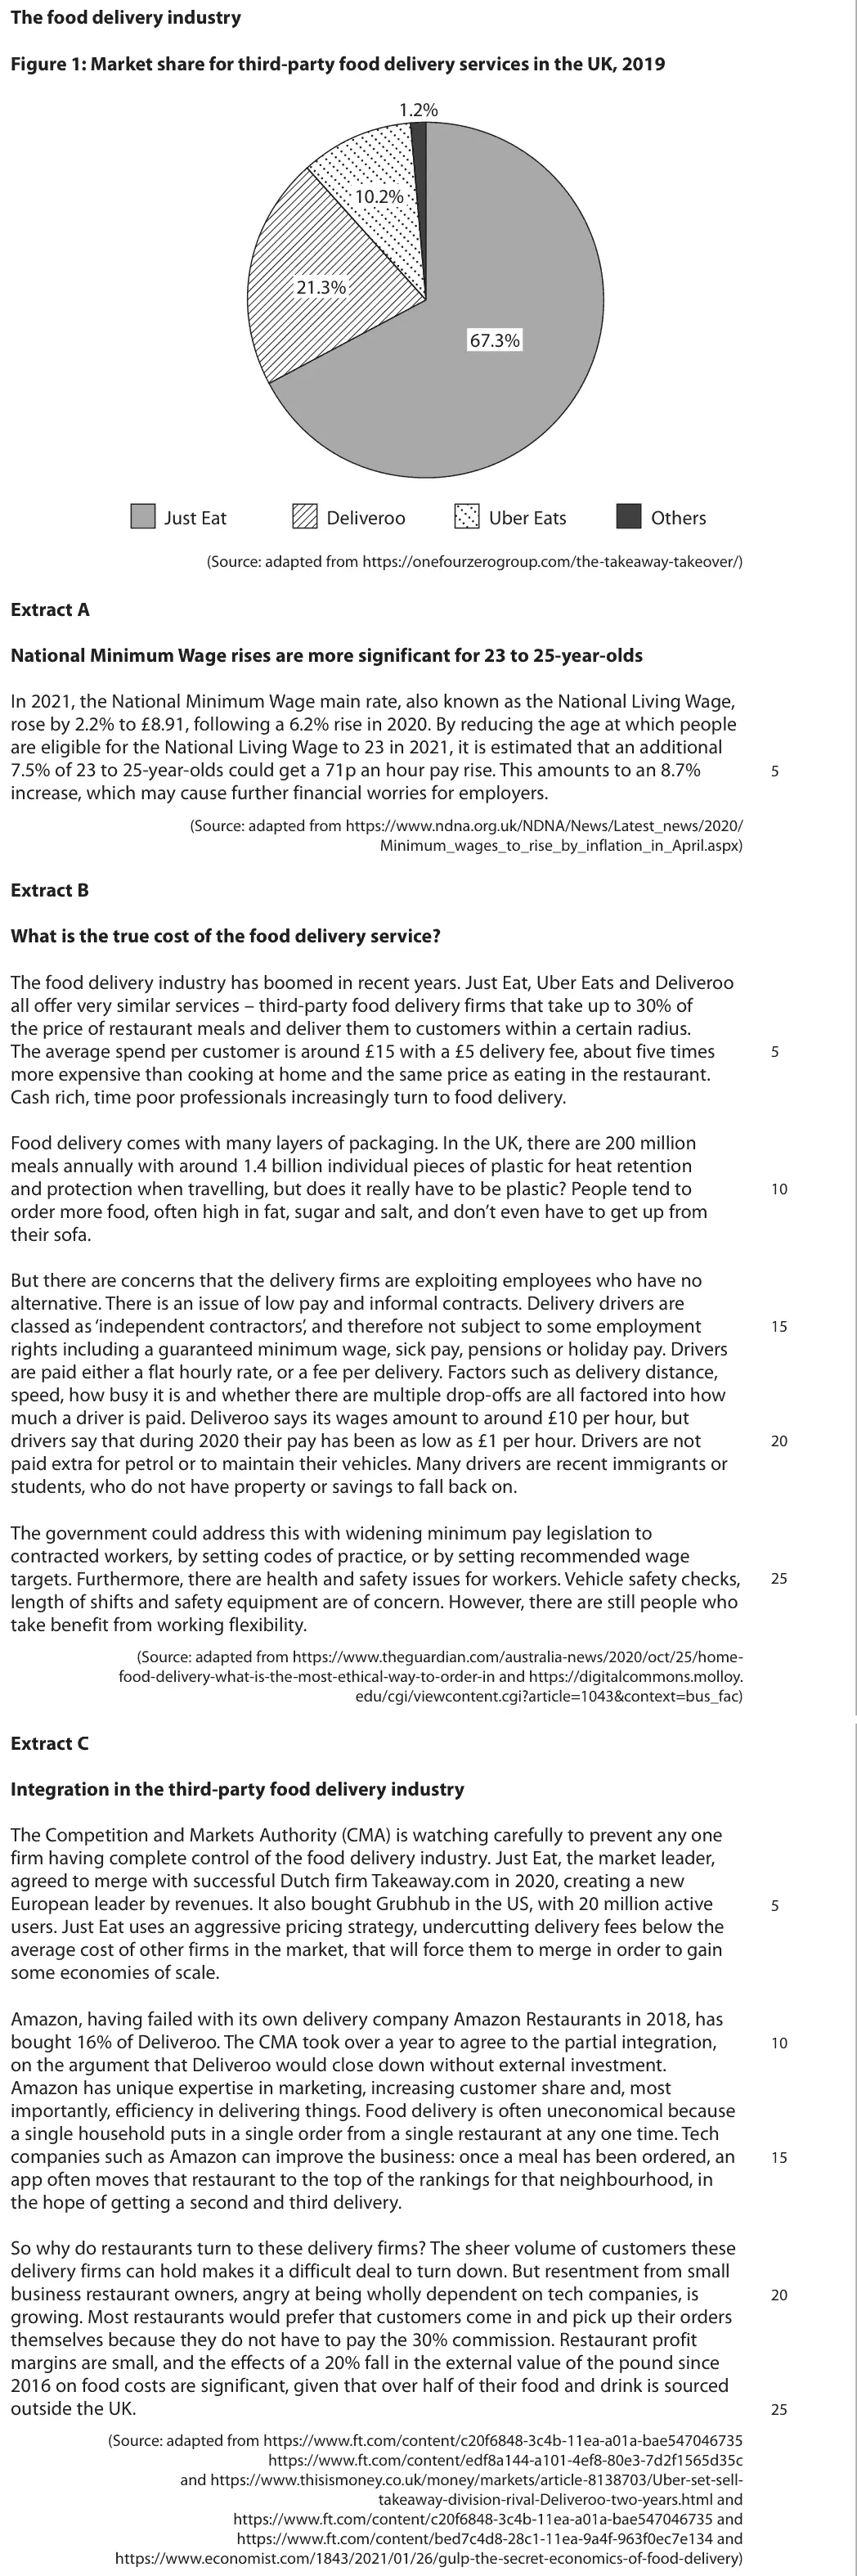
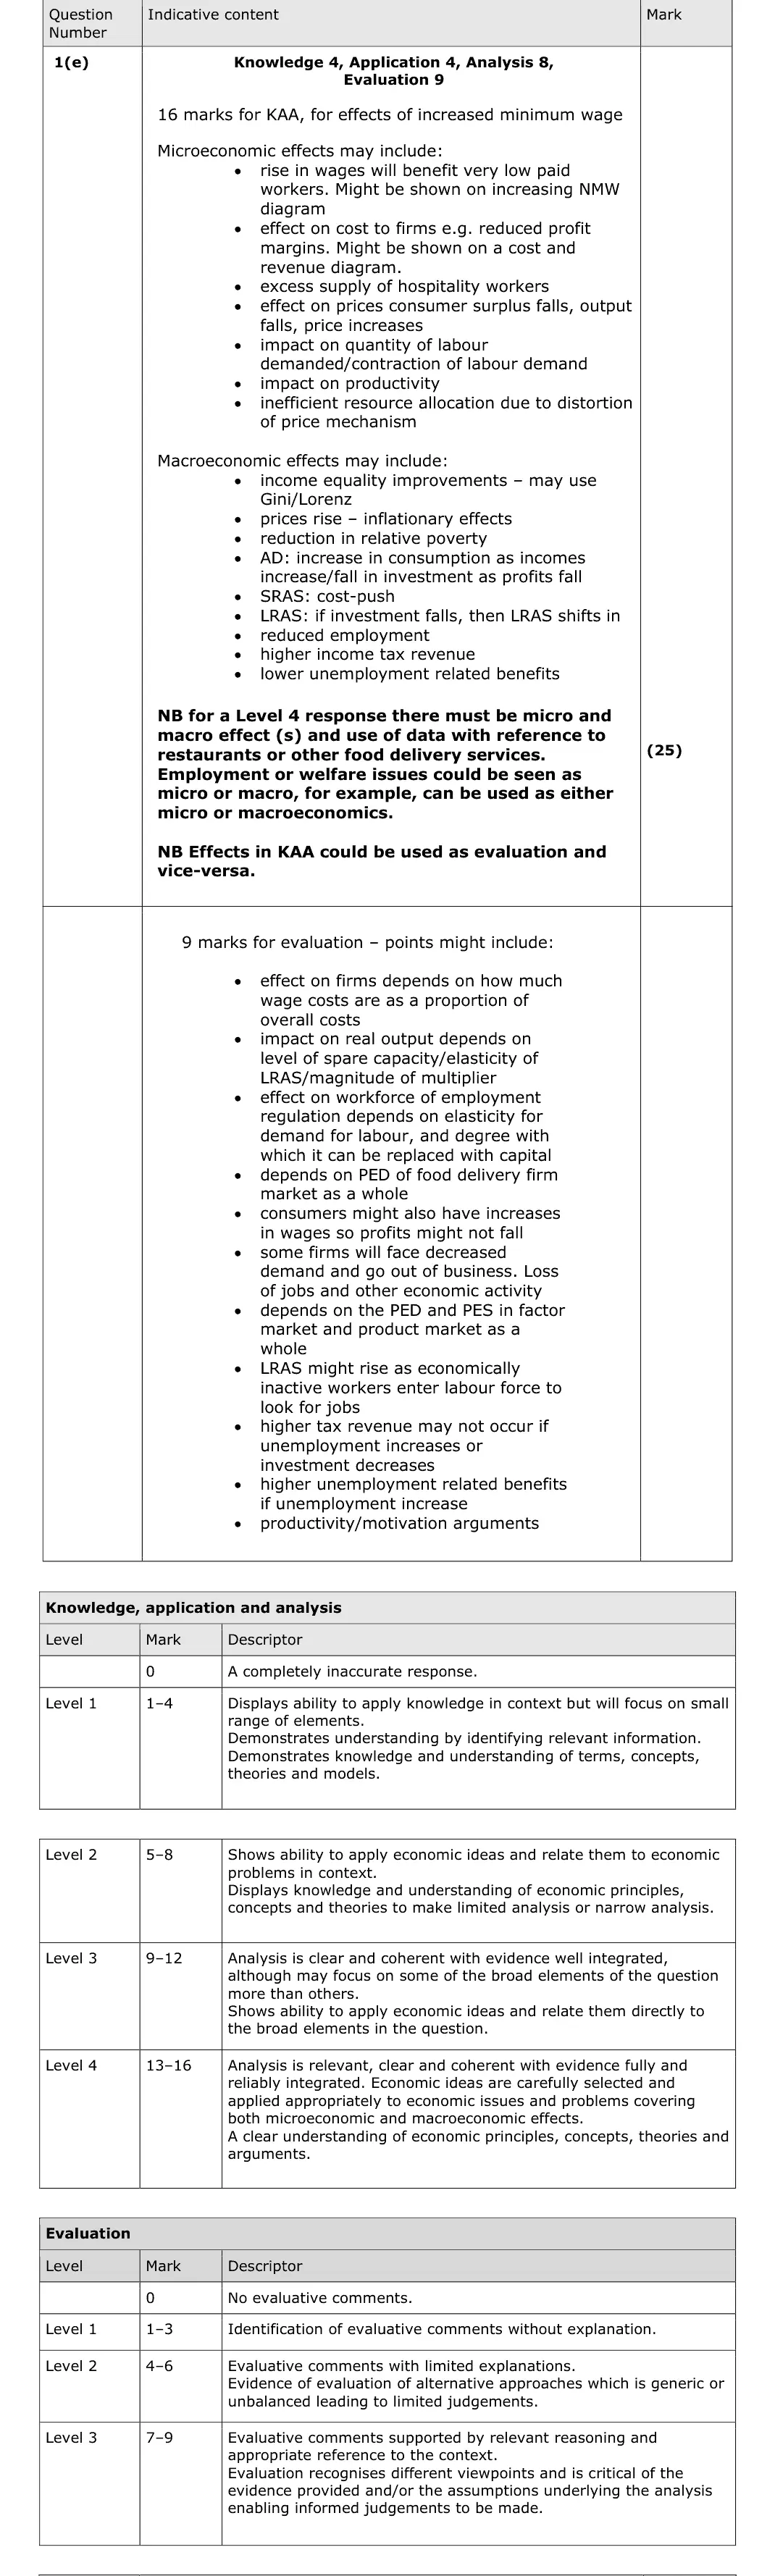
Evaluate the microeconomic and macroeconomic effects of significant increases in the minimum wage. Refer to restaurants or other food delivery services in your answer.
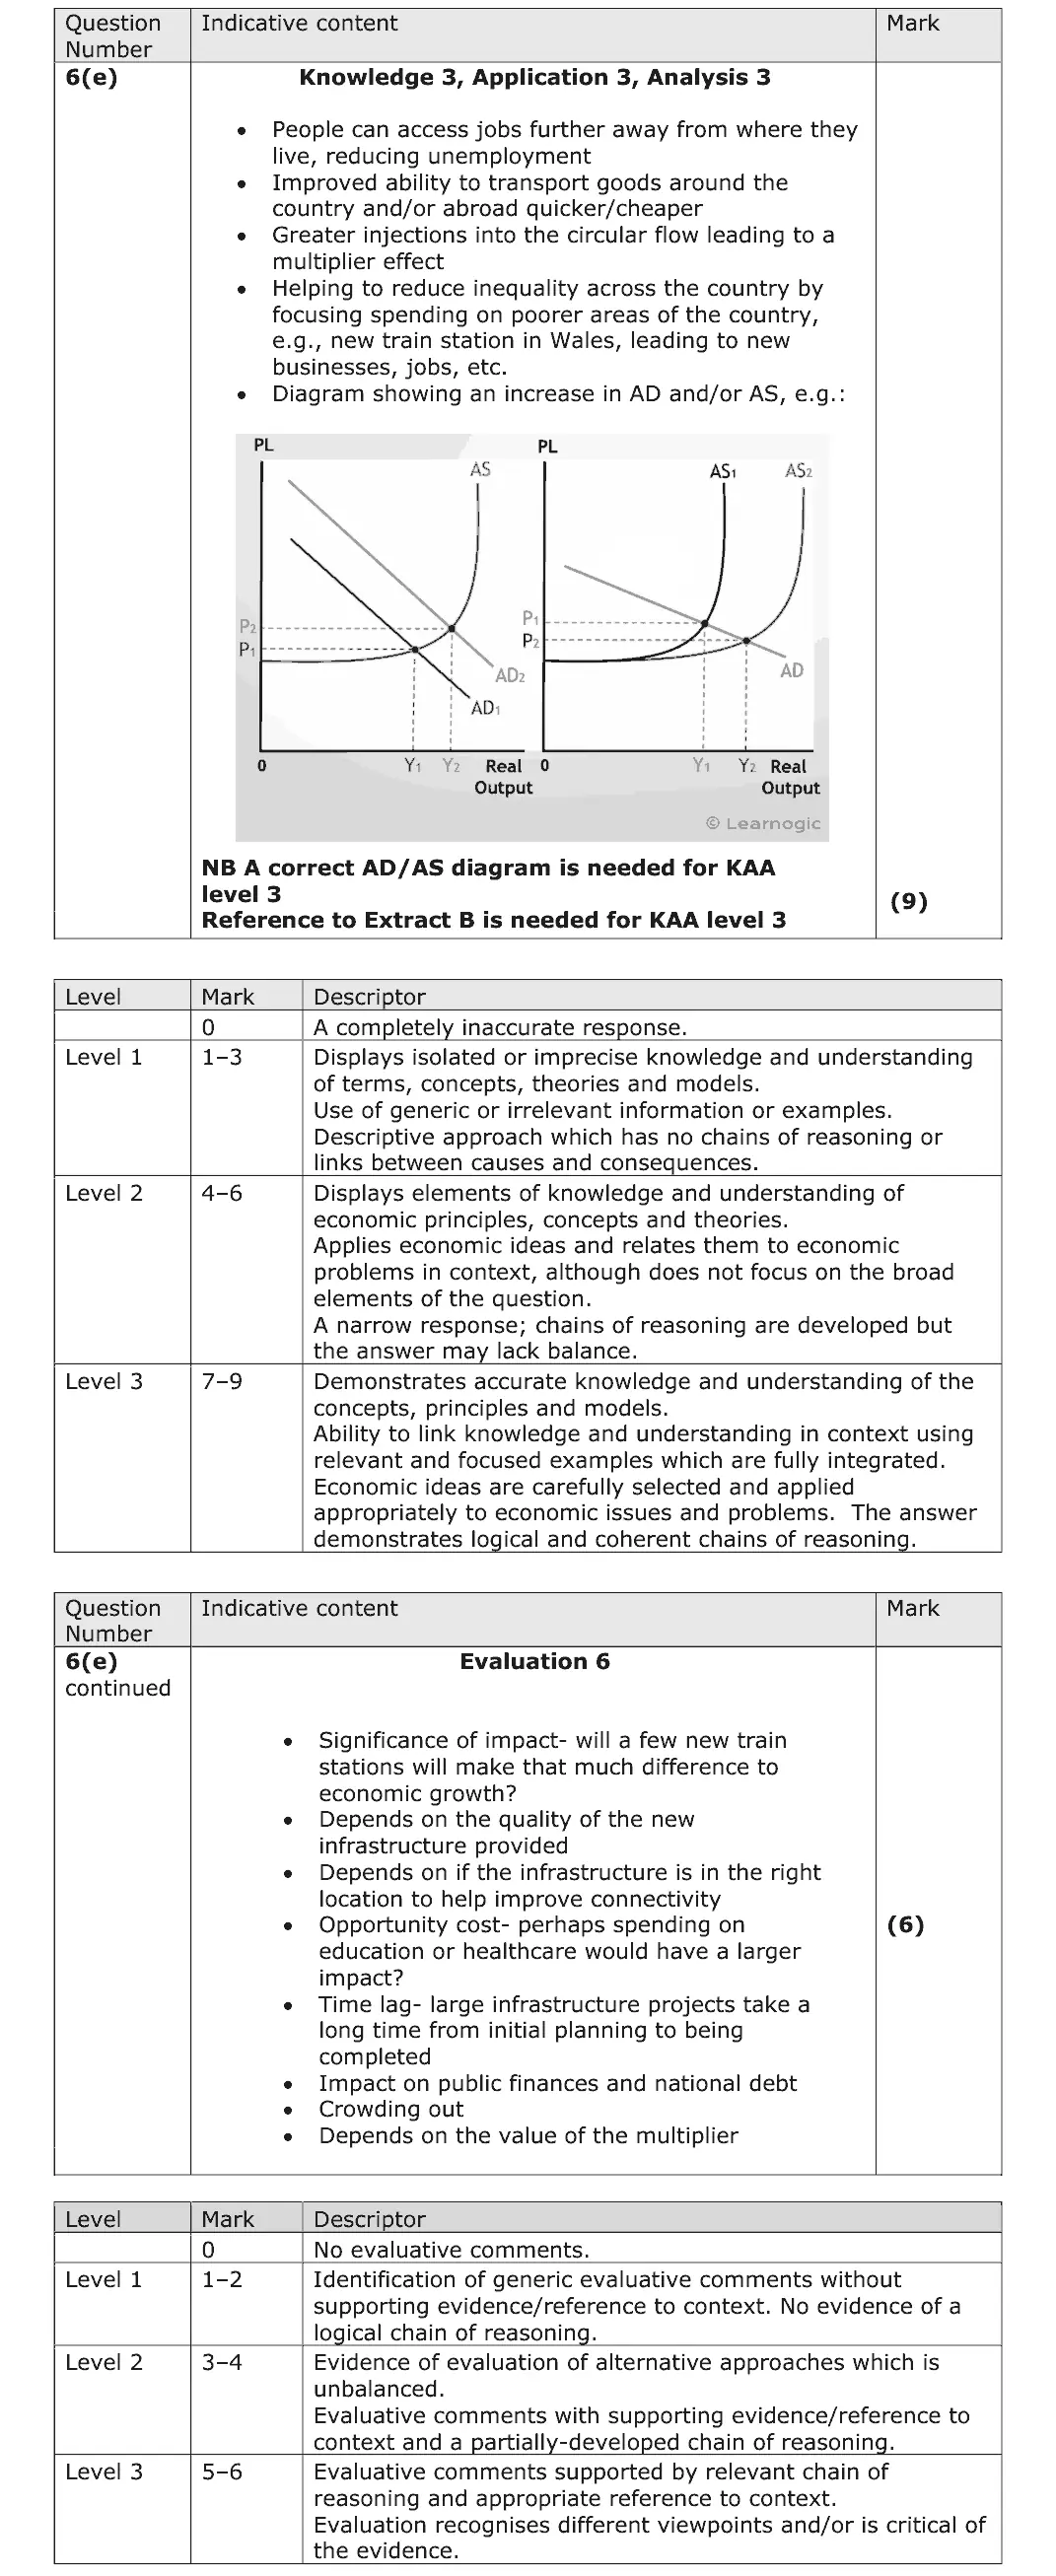
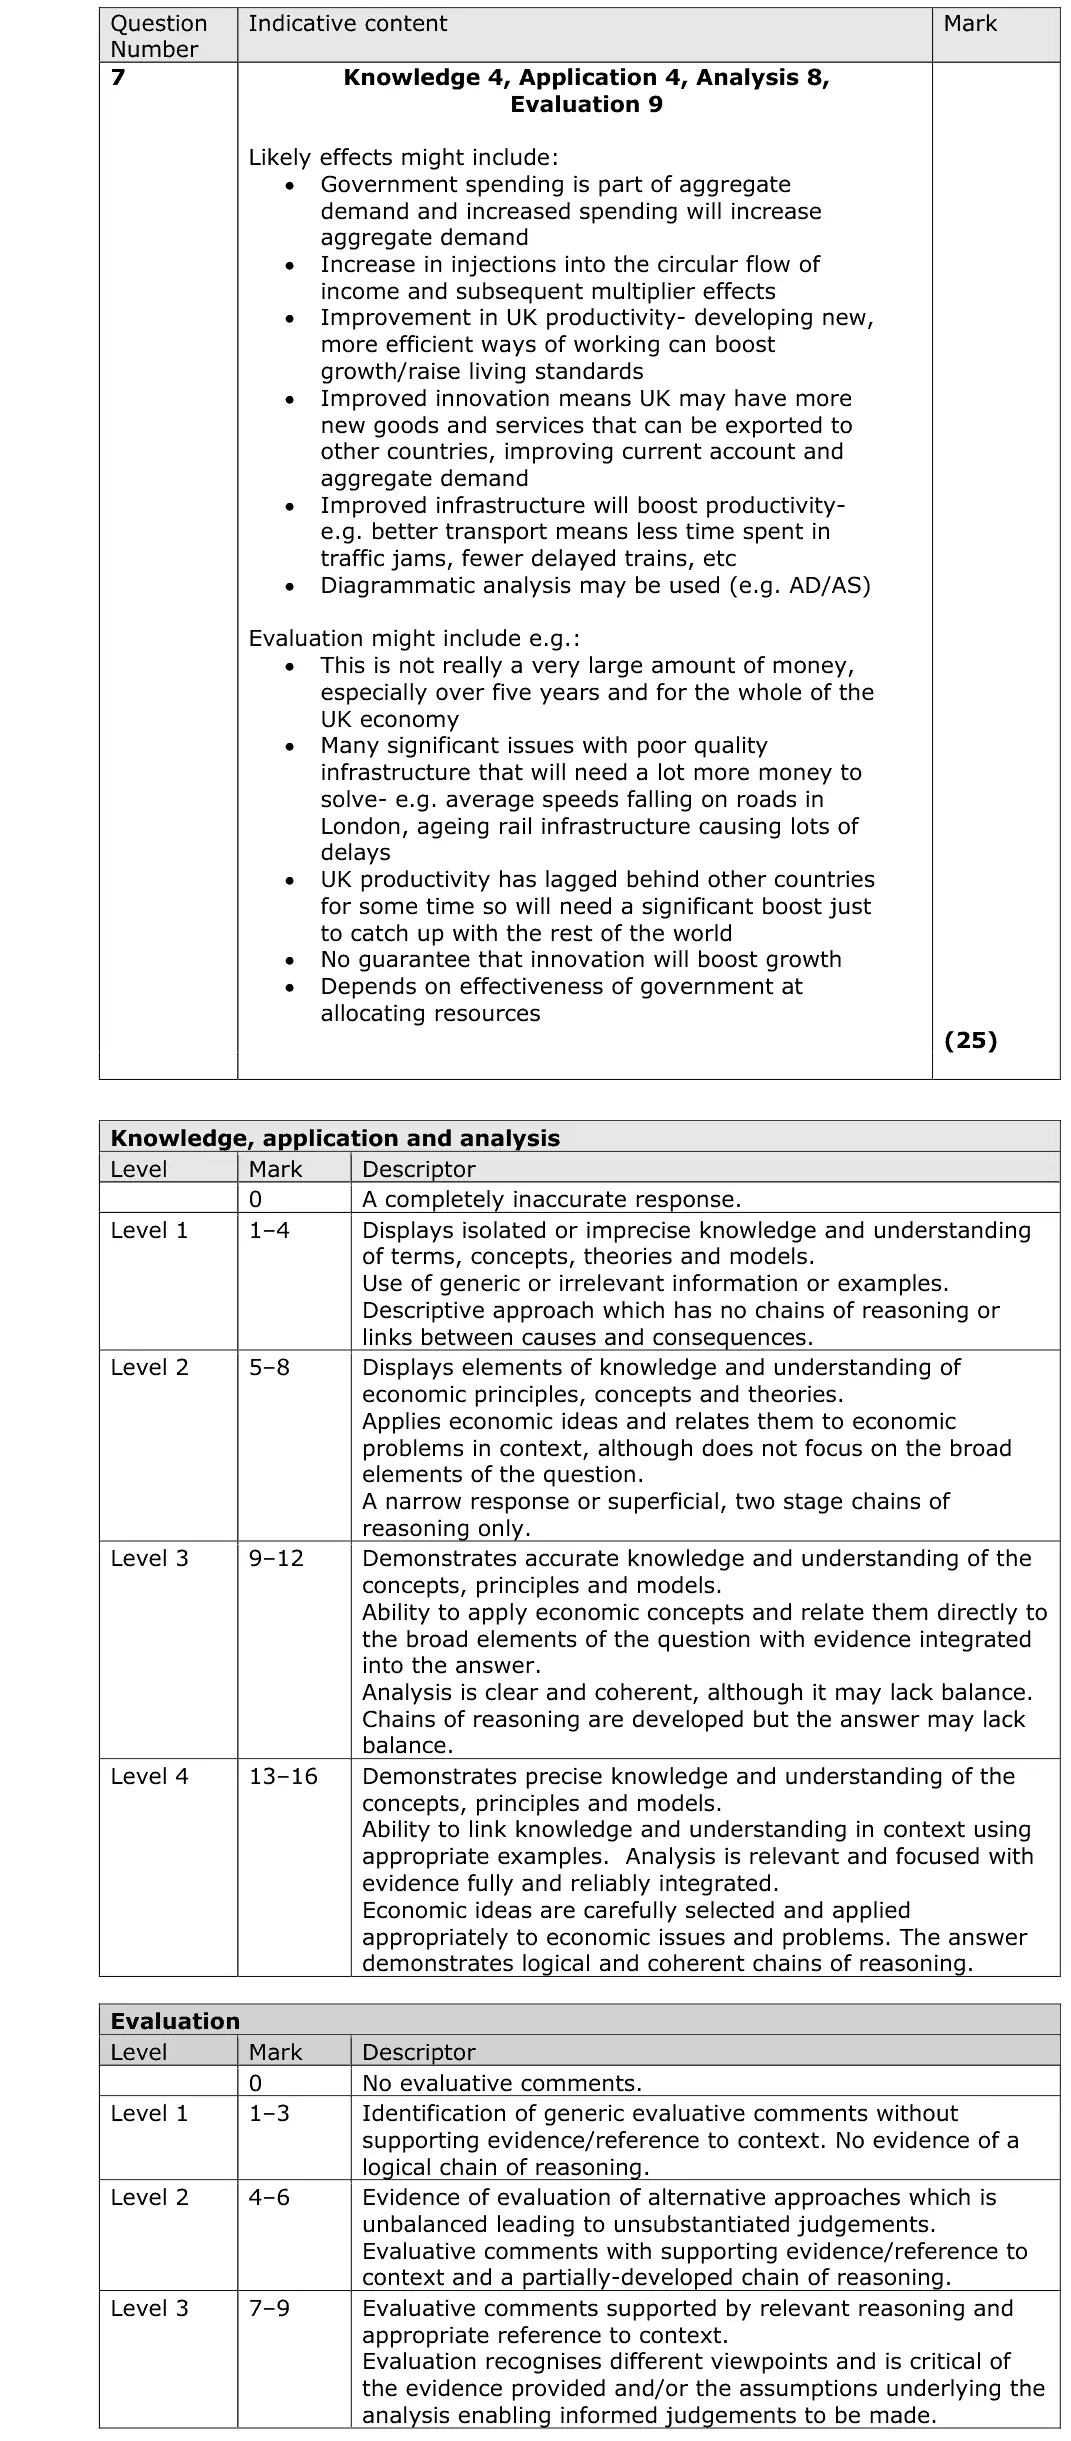
In 2016 the UK Chancellor of the Exchequer announced that the government would spend an extra £23 billion on innovation and infrastructure over the following five years. Evaluate the likely economic effects of this planned increase in government expenditure.
With reference to the information provided and your own knowledge, evaluate the microeconomic and macroeconomic effects of increased UK demand for coffee at branded coffee shops.
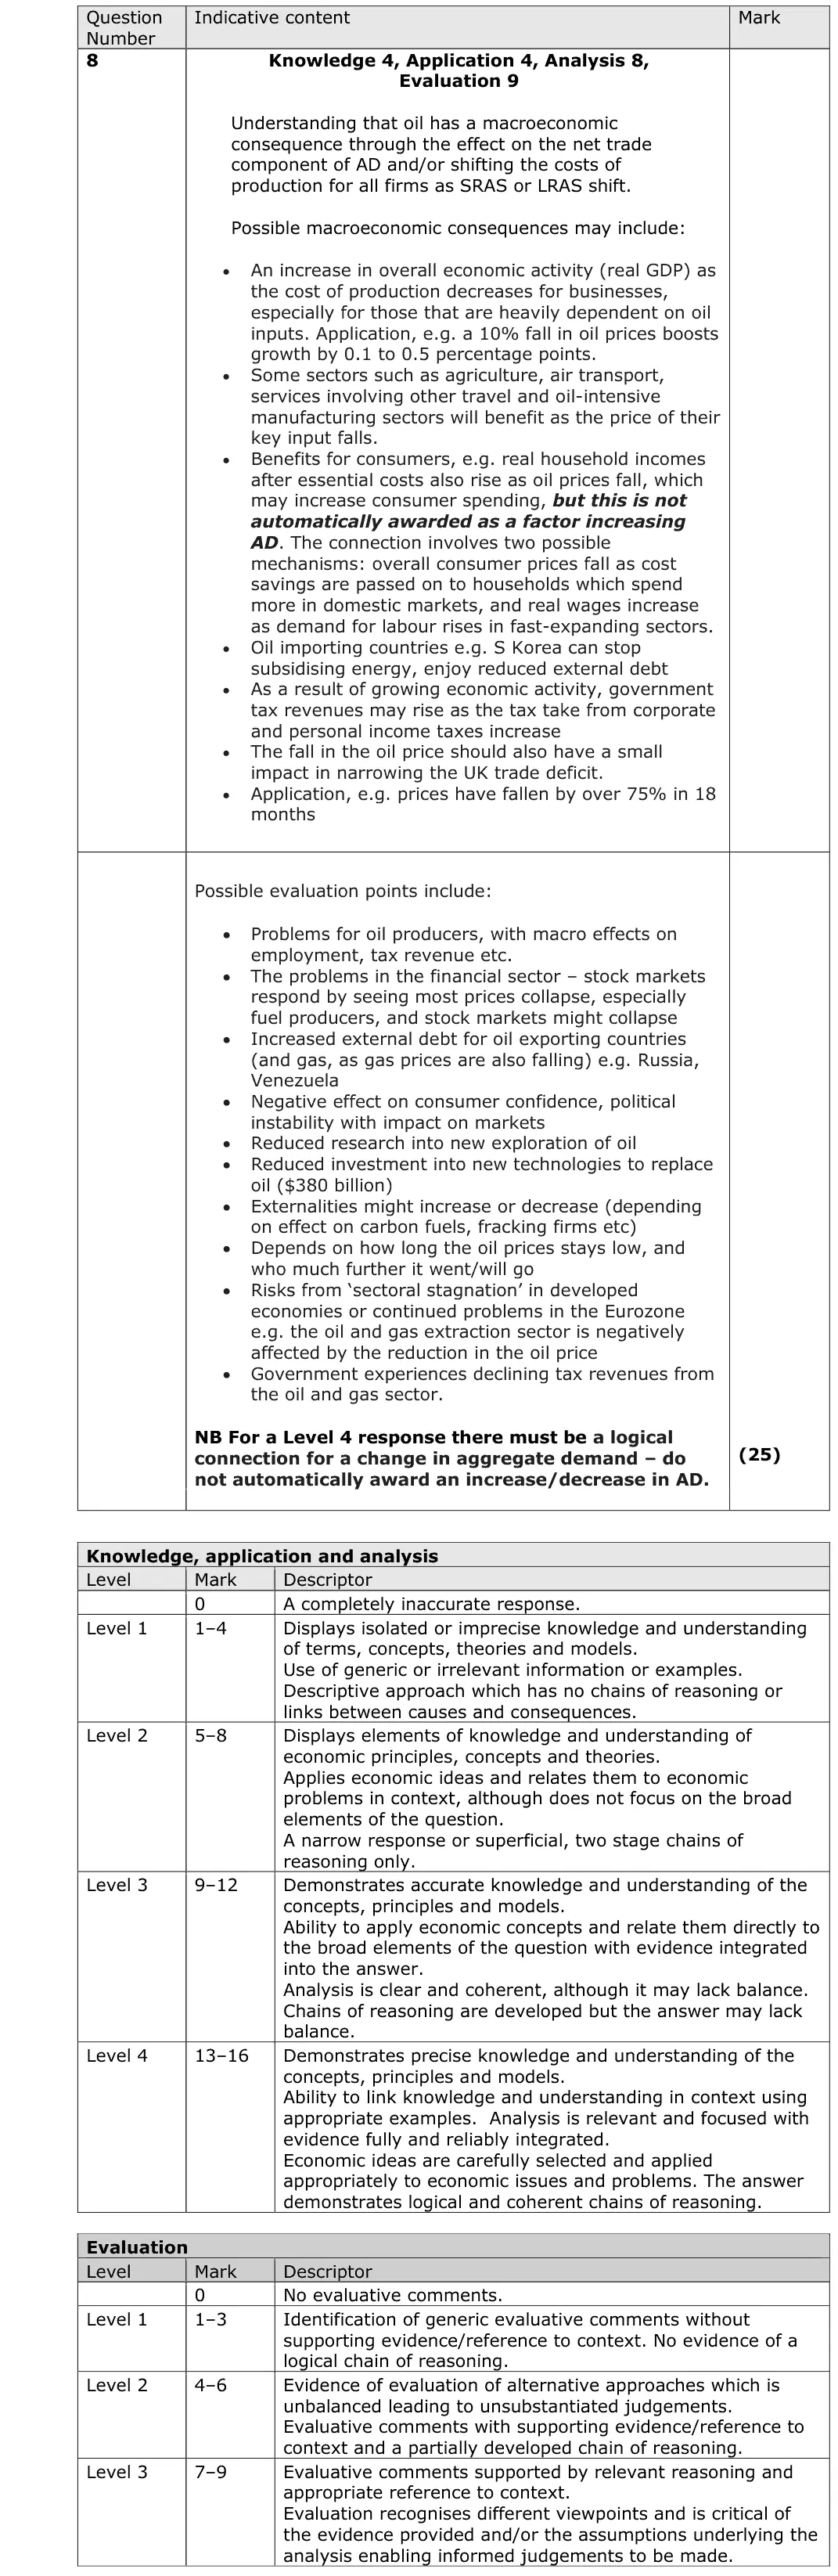
Global oil prices fell from a 2008 peak of $147 a barrel to $27 in 2016. Evaluate the likely macroeconomic consequences of a significant fall in global oil prices.
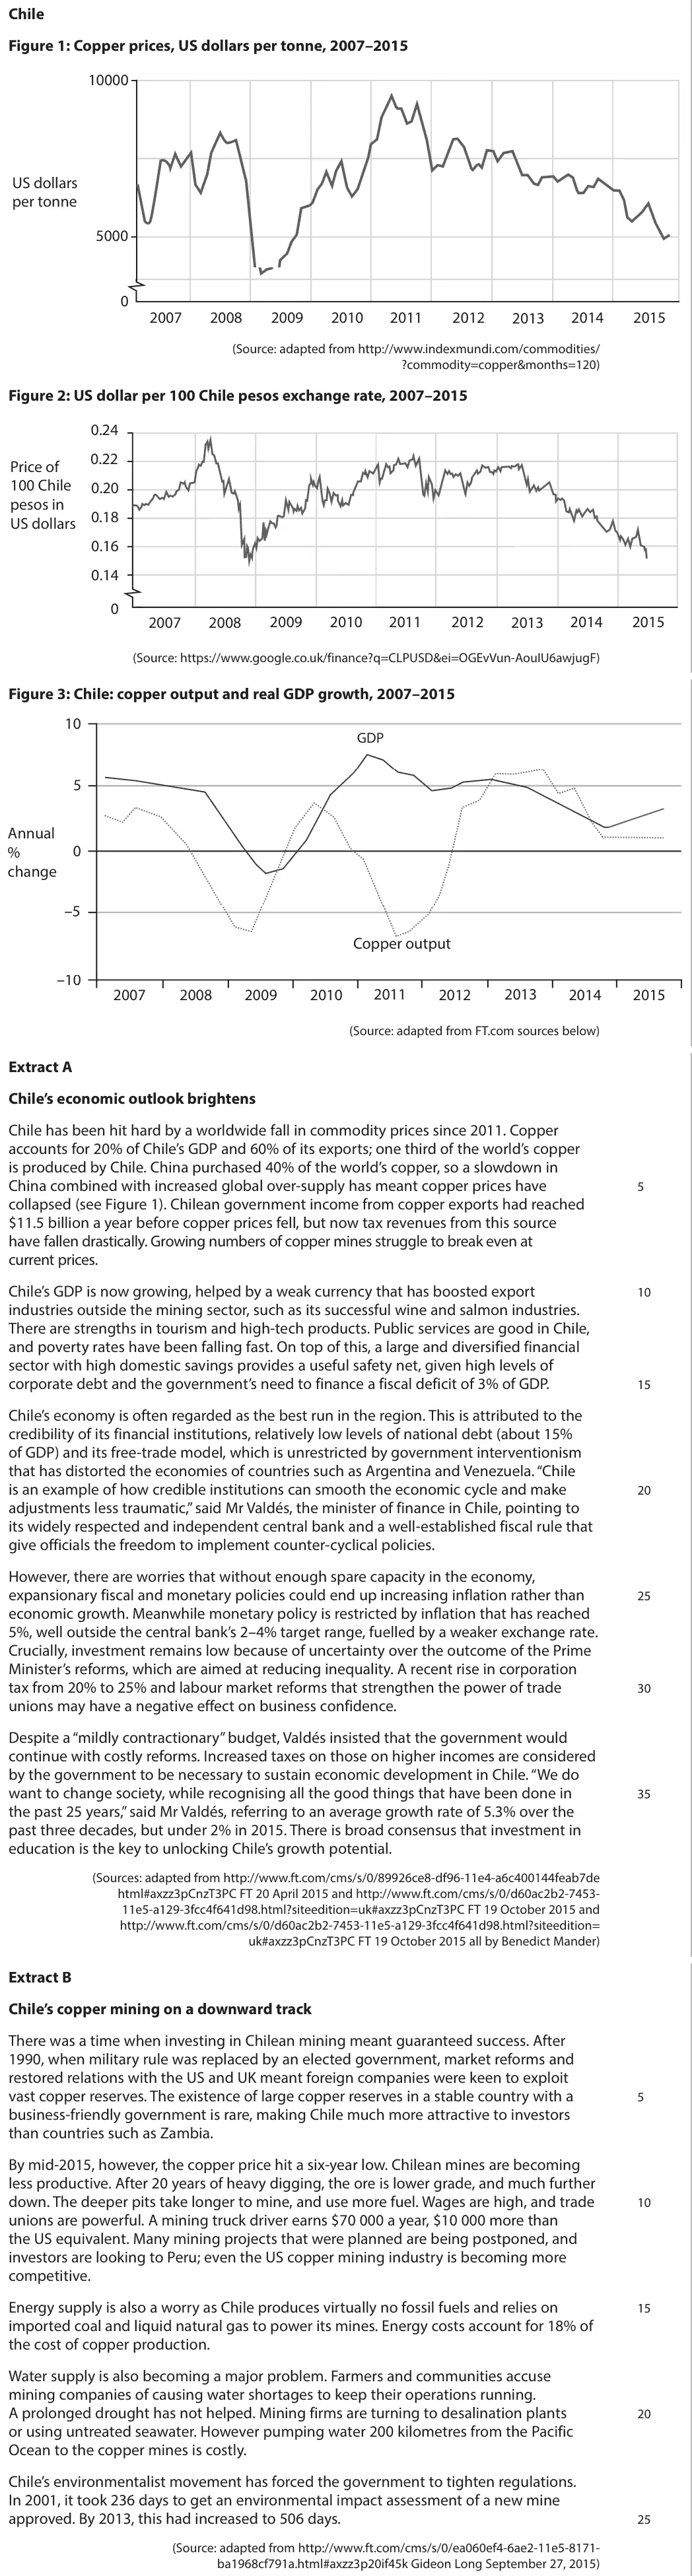
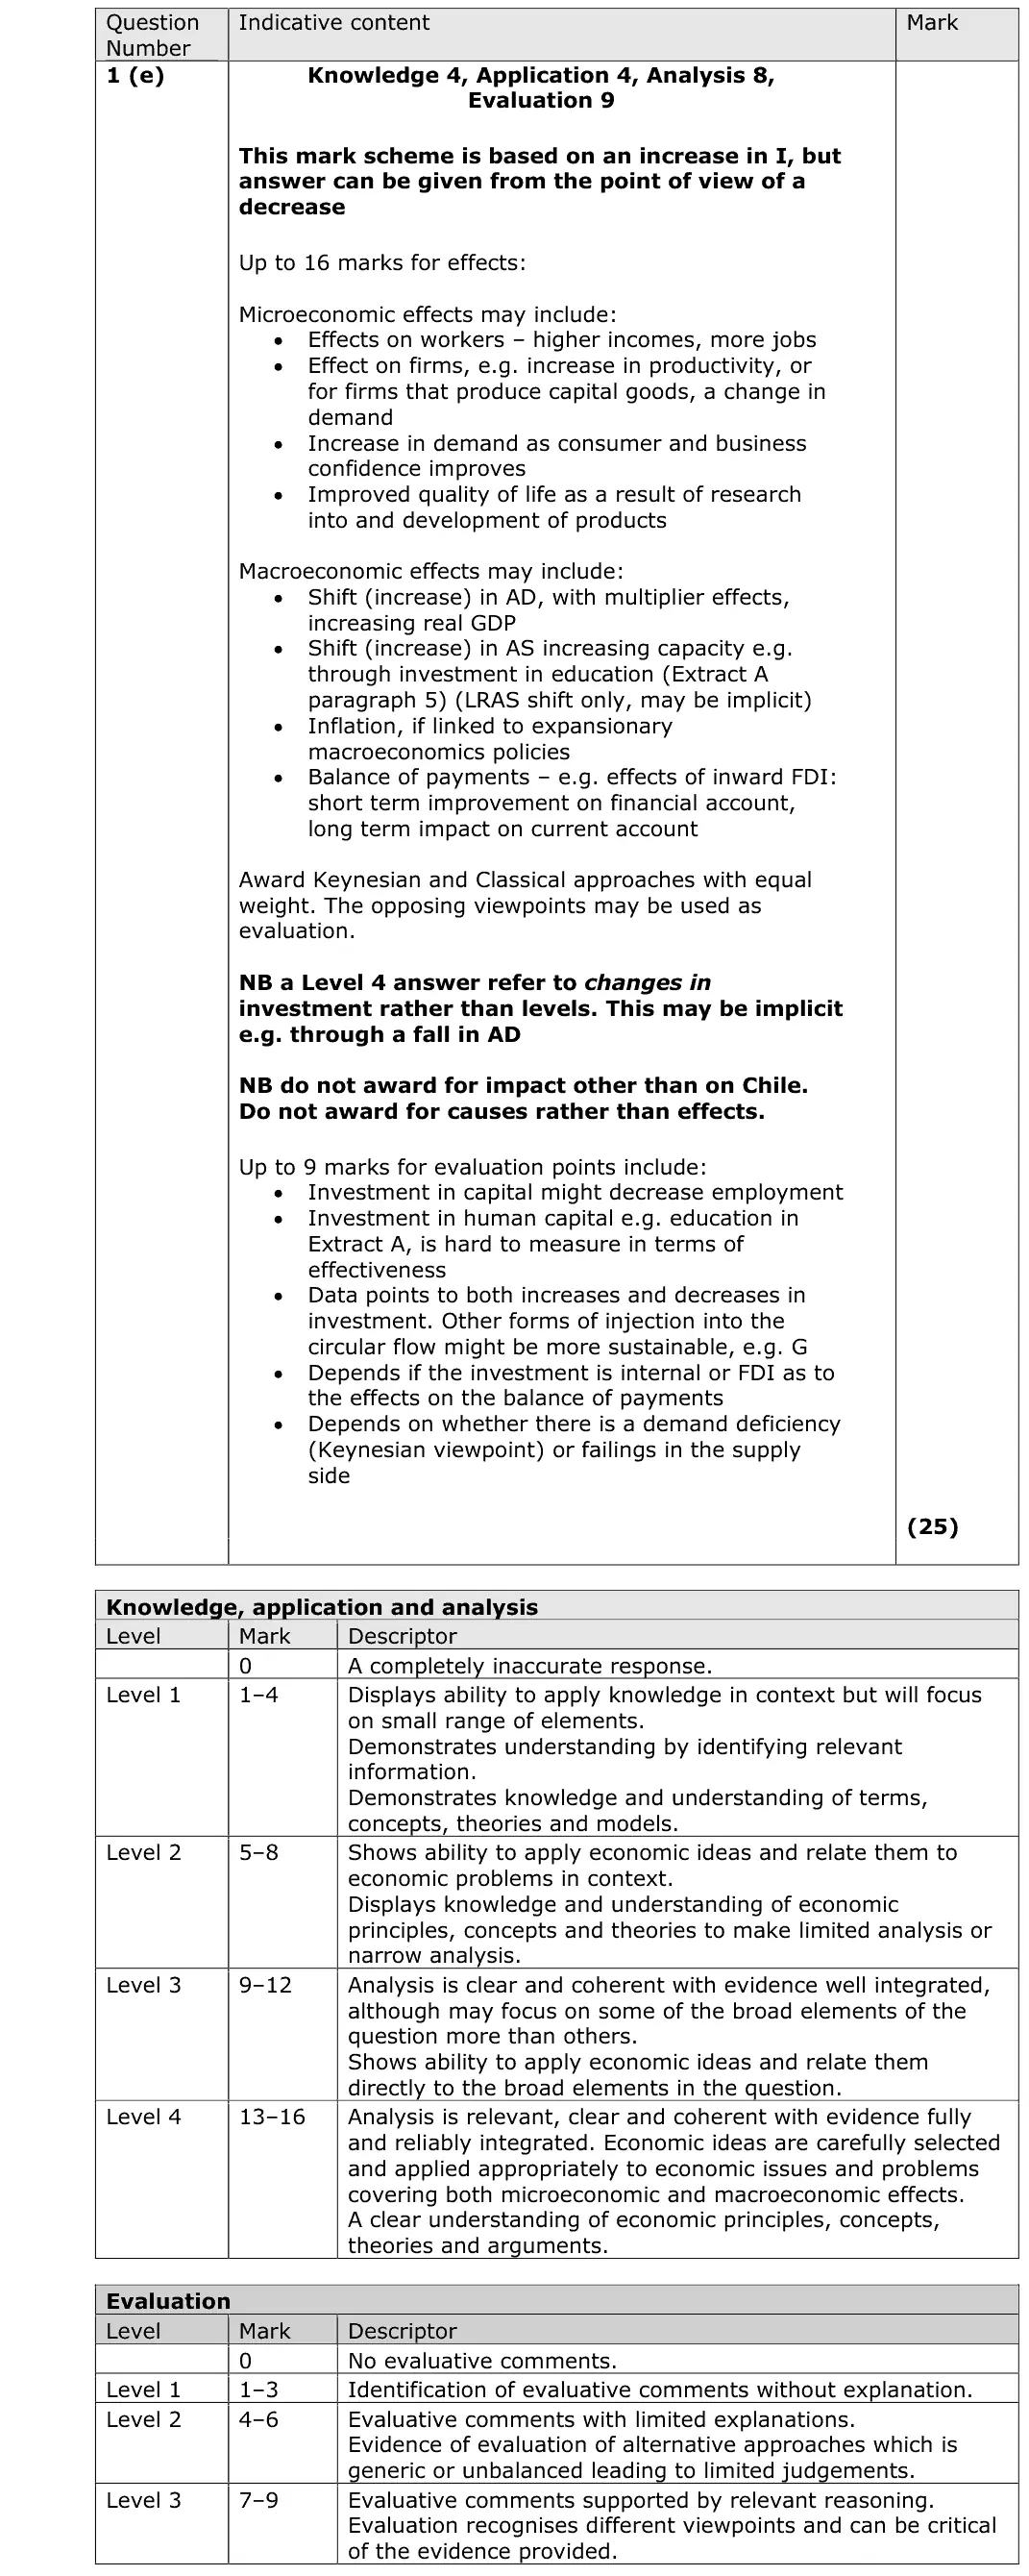
With reference to the information provided and your own knowledge, evaluate the microeconomic and macroeconomic impact on Chile’s economy of changes in the level of investment.
Tap a question to zoom it. The data and extracts fold out above each question; the mark scheme and examiner's comment open underneath.
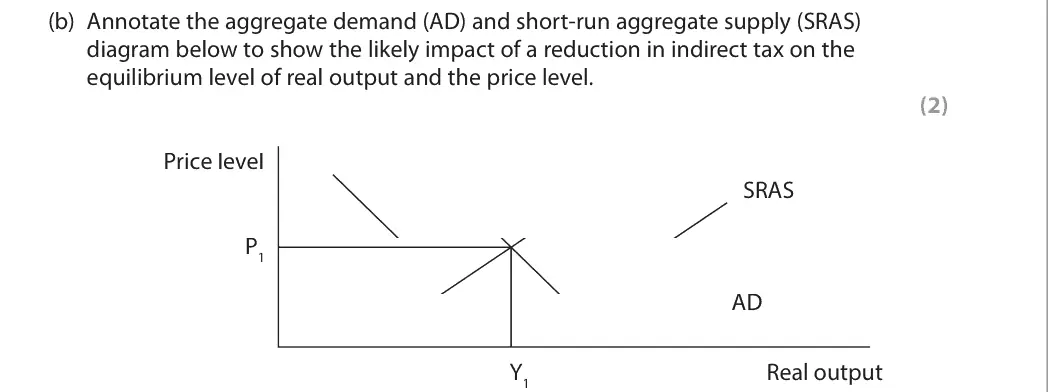
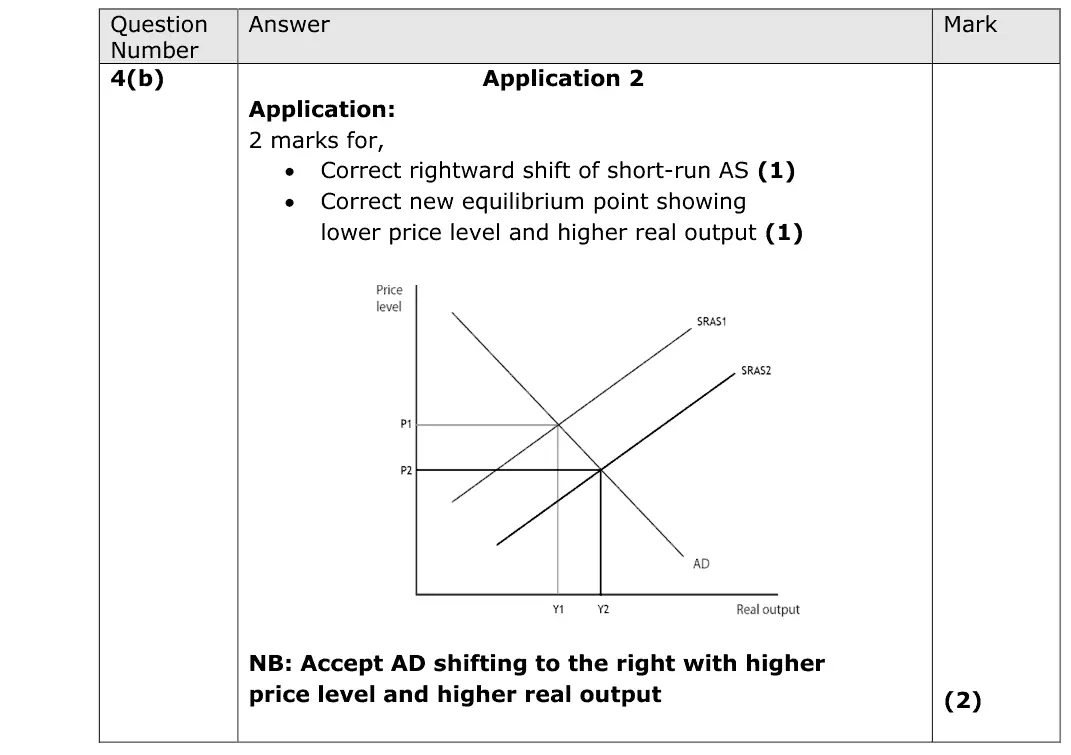
June 2025 · AS Paper 2 · Q4(b)2 marksAO2=2Diagram
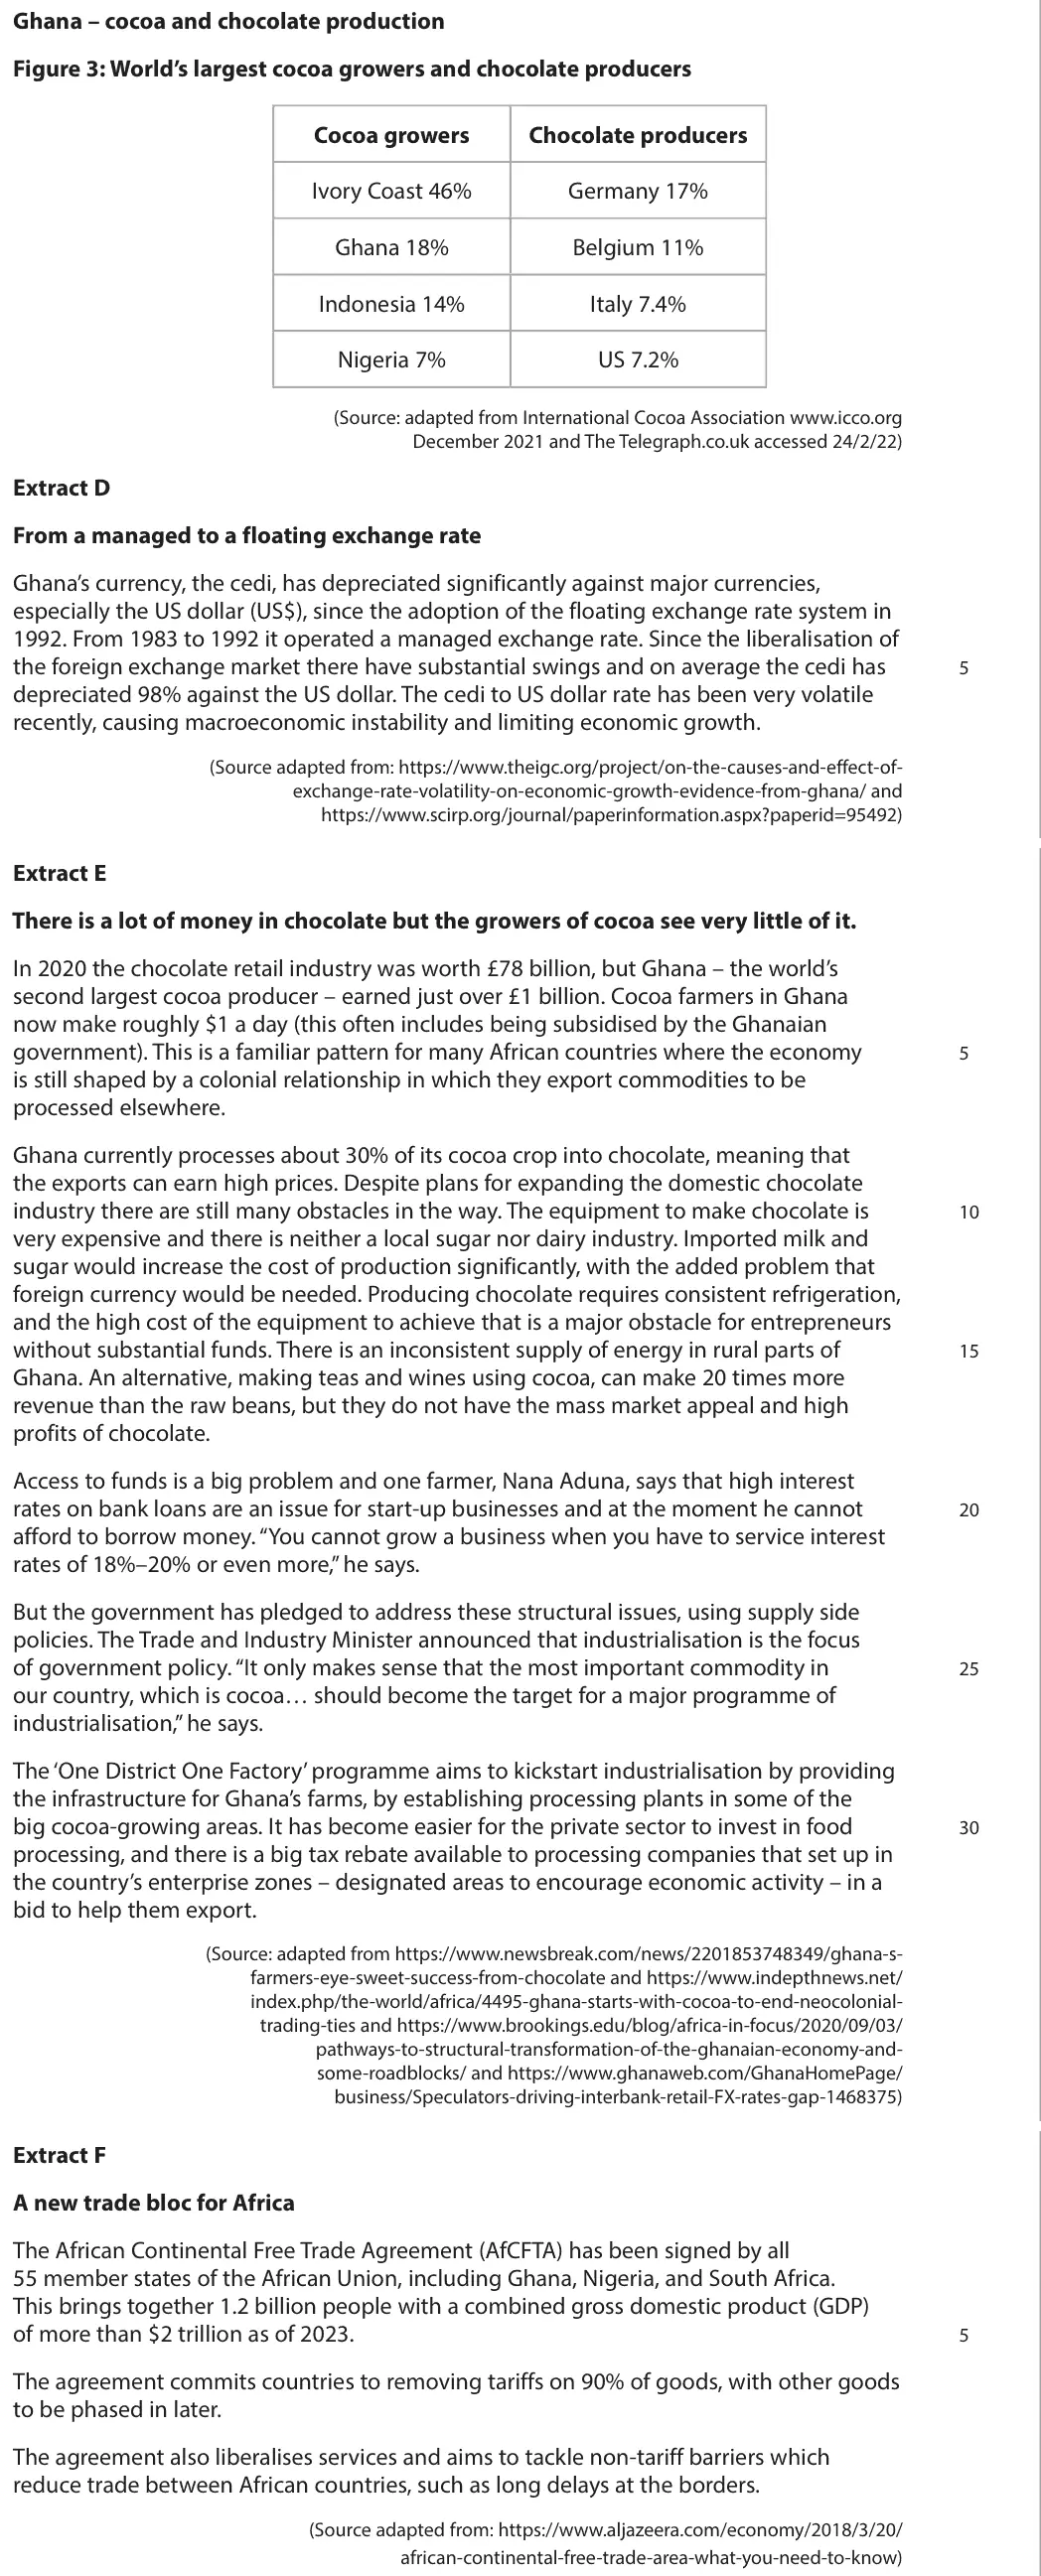
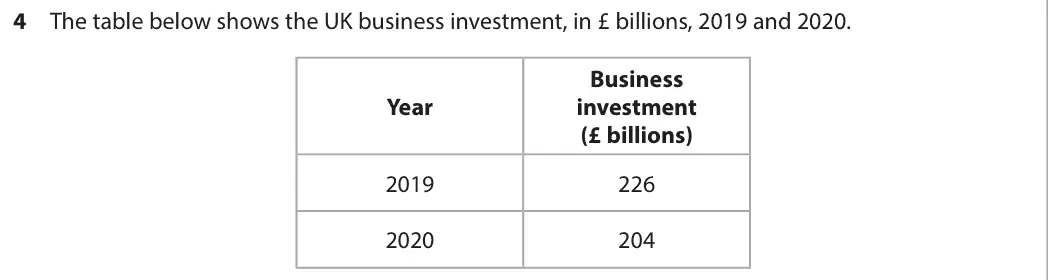
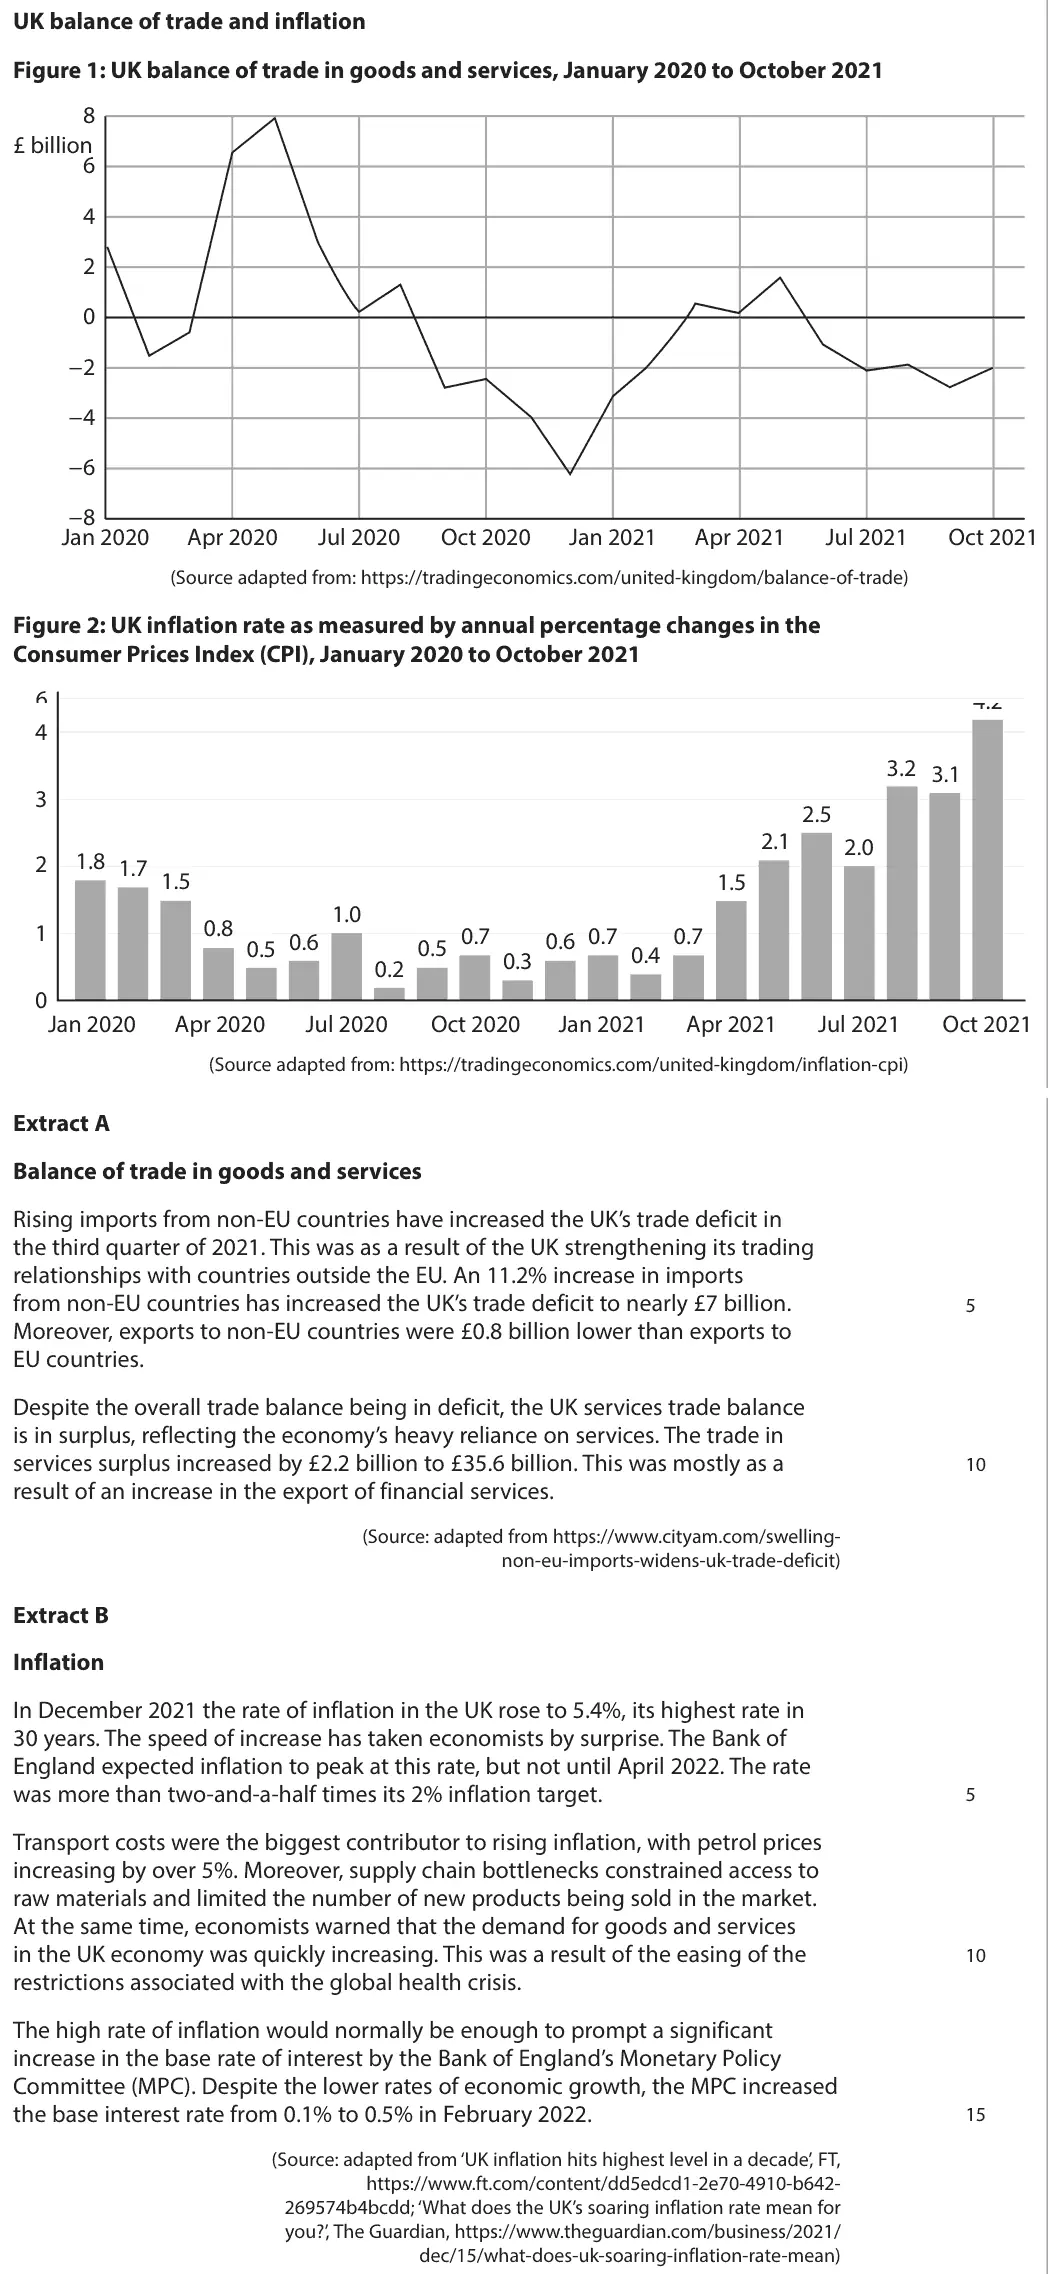
Data and extracts for question 4
Mark scheme
Examiner's comment
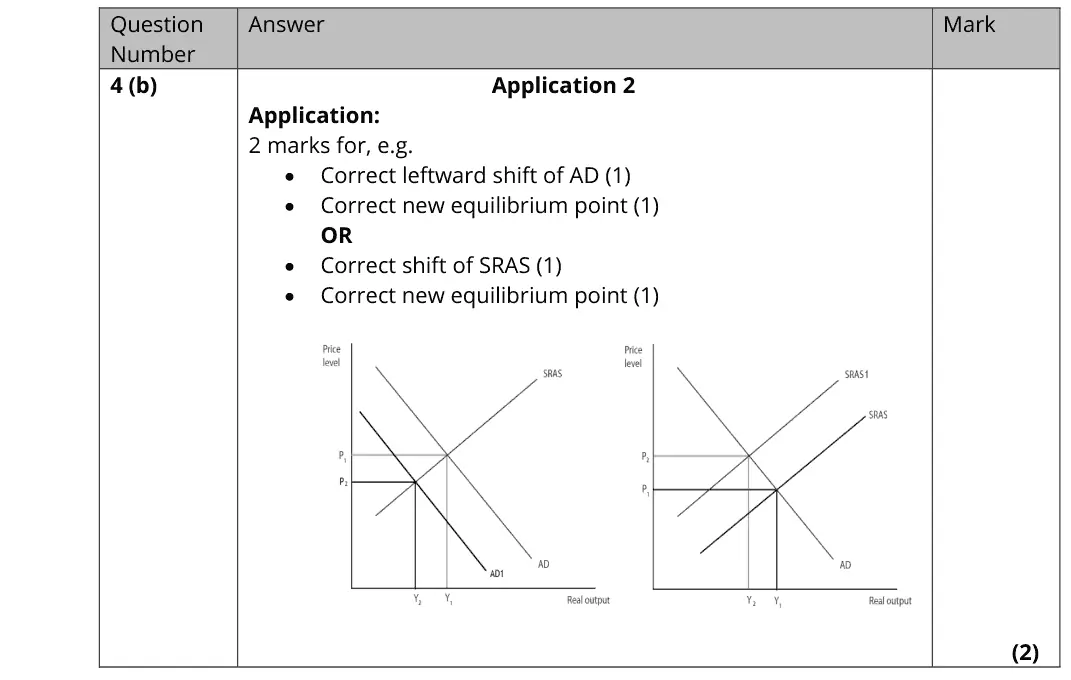
This question required candidates to show/draw the likely impact of a reduction in indirect tax in the context of an AD/AS diagram. Marks were awarded as 1 mark for a rightward shift in AD/SRAS and 1 mark for equilibrium showing new price level and new real output. Most candidates achieved the 2 marks on this question.
Notes from the mark scheme and report
lower indirect tax cuts firms' costs so SRAS shifts right: lower price level, higher real output (AD shifting right also accepted)
Quantitative skills: QS 4 (construct and interpret a range of standard graphical forms)
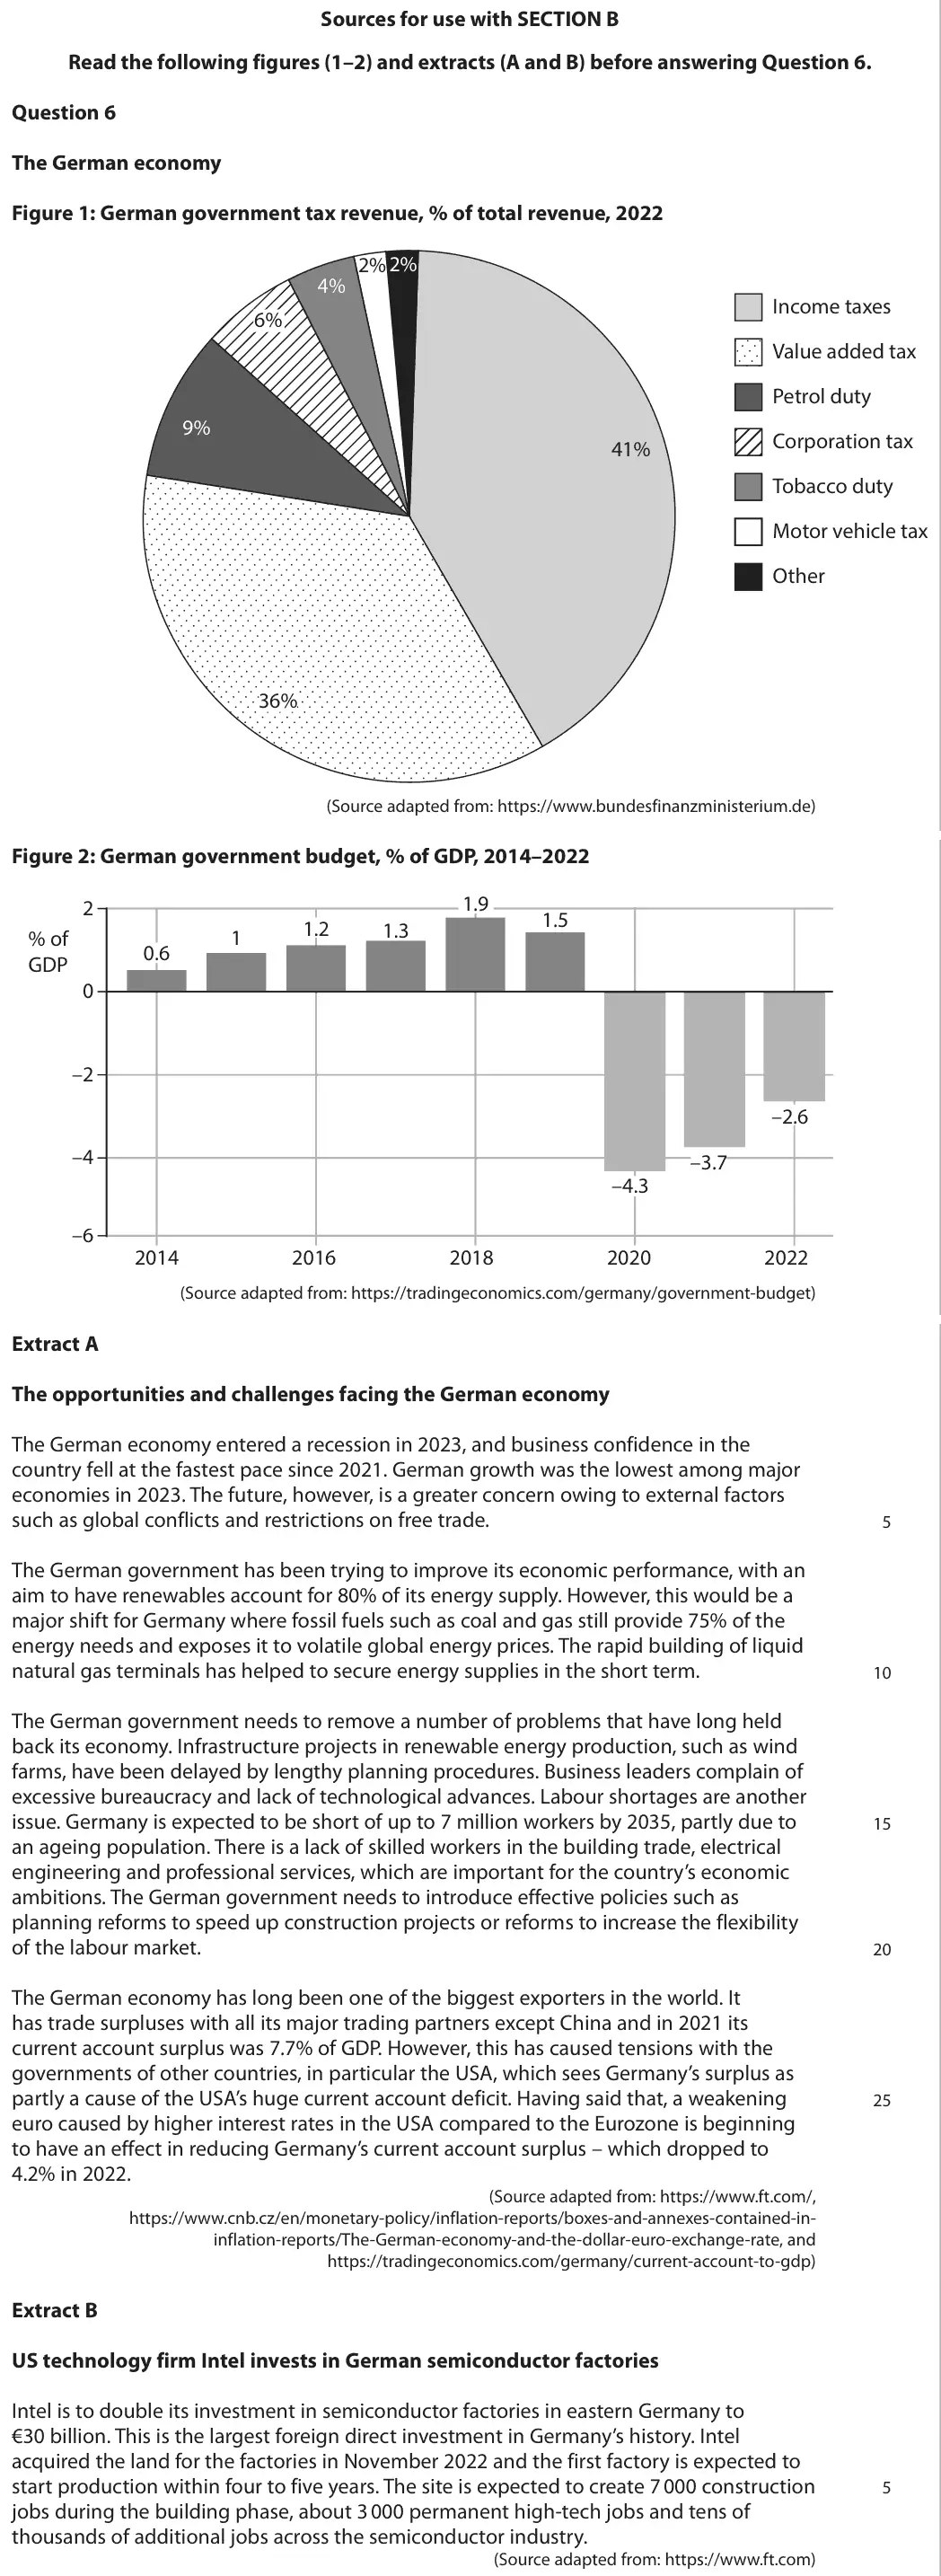
June 2025 · Paper 2 · Q6(d)12 marksAO1=2, AO2=2, AO3=4, AO4=412-mark response
Data and extracts for question 6
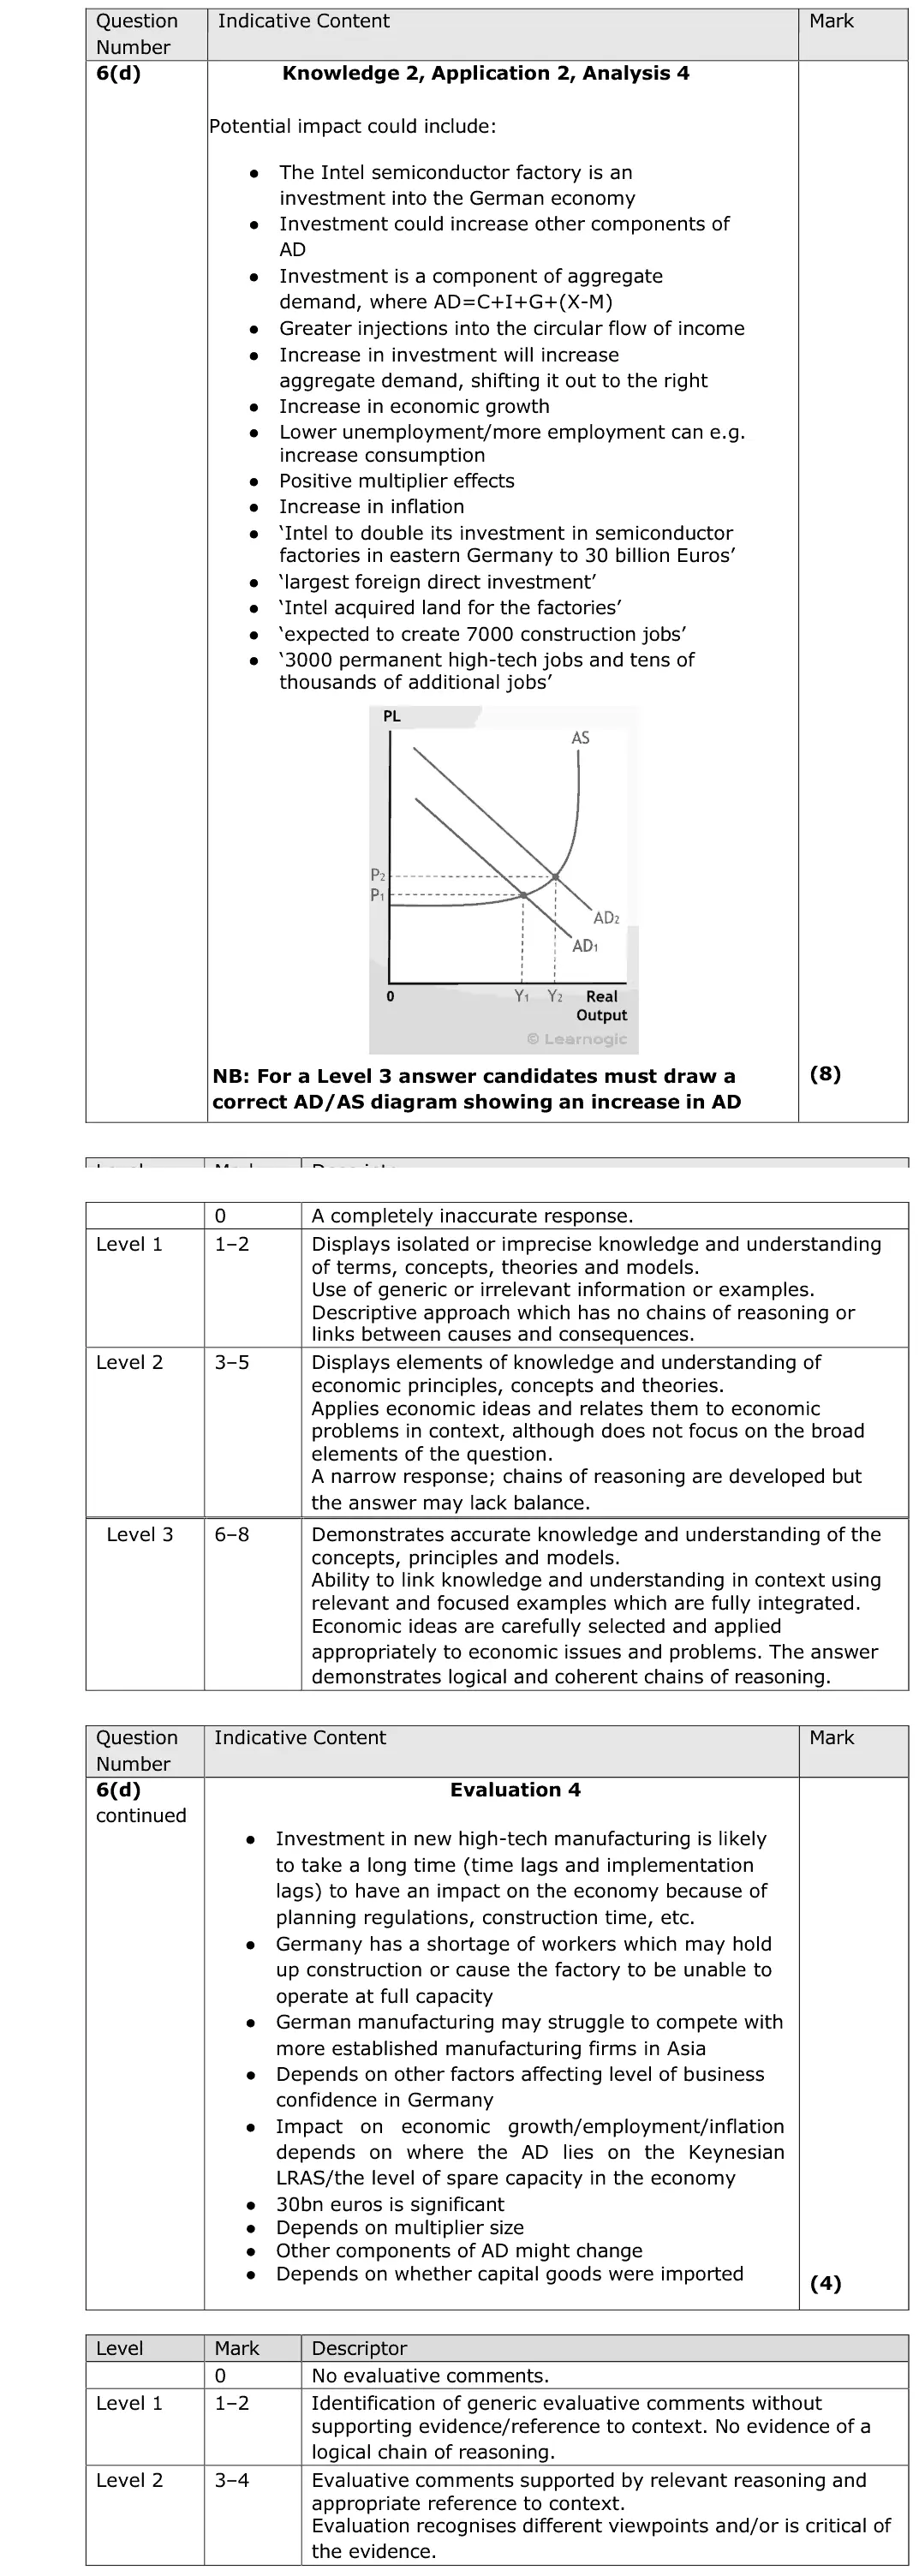
Mark scheme, including the levels grid and indicative content
Examiner's comment
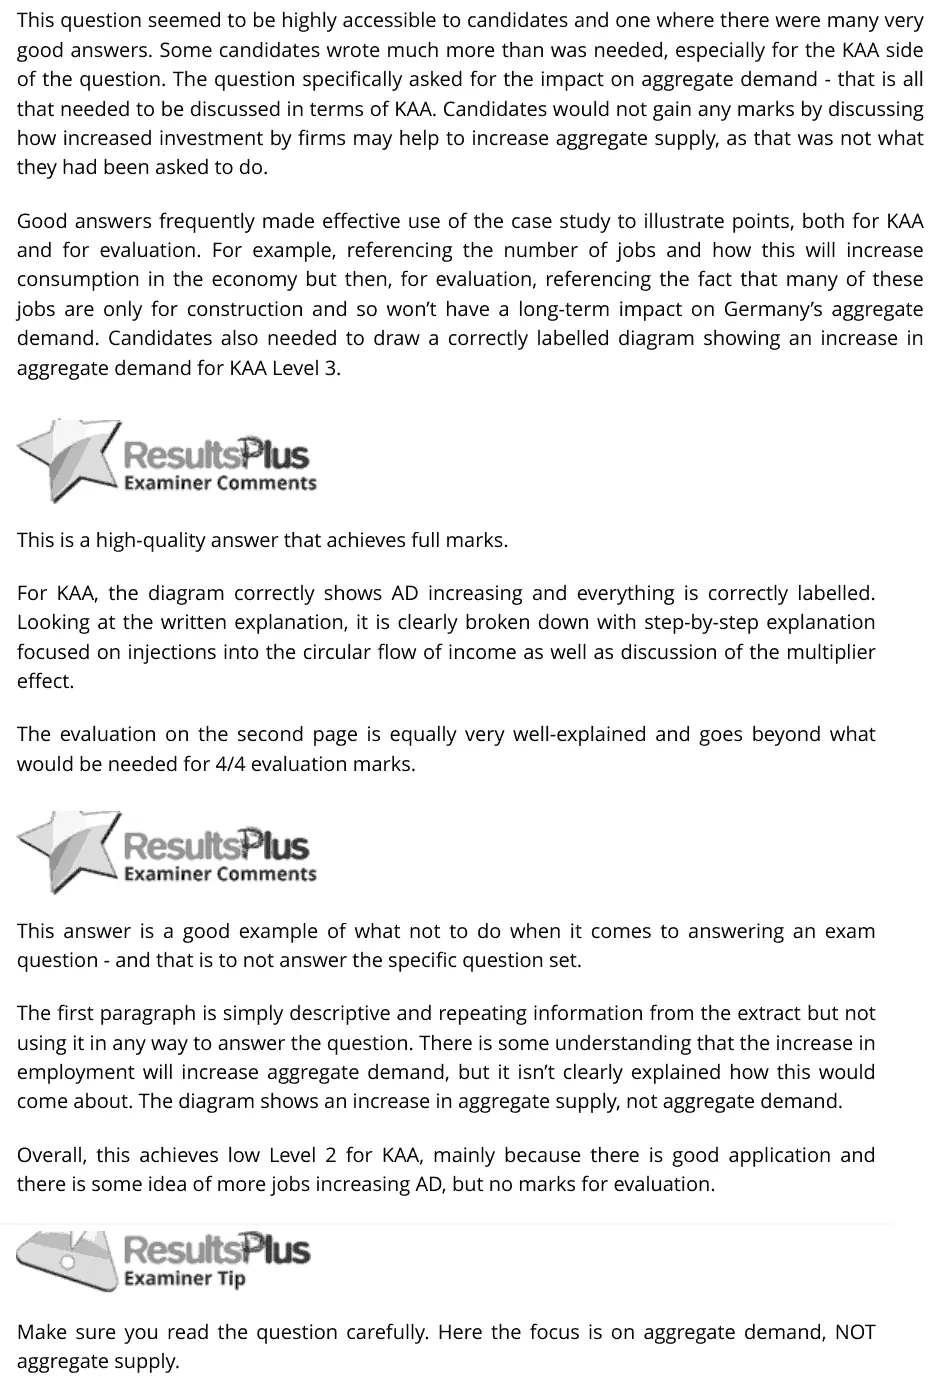
This question seemed to be highly accessible to candidates and one where there were many very good answers. Some candidates wrote much more than was needed, especially for the KAA side of the question. The question specifically asked for the impact on aggregate demand - that is all that needed to be discussed in terms of KAA. Candidates would not gain any marks by discussing how increased investment by firms may help to increase aggregate supply, as that was not what they had been asked to do. Good answers frequently made effective use of the case study to illustrate points, both for KAA and for evaluation. For example, referencing the number of jobs and how this will increase consumption in the economy but then, for evaluation, referencing the fact that many of these jobs are only for construction and so won’t have a long-term impact on Germany’s aggregate demand. Candidates also needed to draw a correctly labelled diagram showing an increase in aggregate demand for KAA Level 3. This is a high-quality answer that achieves full marks. For KAA, the diagram correctly shows AD increasing and everything is correctly labelled. Looking at the written explanation, it is clearly broken down with step-by-step explanation focused on injections into the circular flow of income as well as discussion of the multiplier effect. The evaluation on the second page is equally very well-explained and goes beyond what would be needed for 4/4 evaluation marks. This answer is a good example of what not to do when it comes to answering an exam question - and that is to not answer the specific question set. The first paragraph is simply descriptive and repeating information from the extract but not using it in any way to answer the question. There is some understanding that the increase in employment will increase aggregate demand, but it isn’t clearly explained how this would come about. The diagram shows an increase in aggregate supply, not aggregate demand. Overall, this achieves low Level 2 for KAA, mainly because there is good application and there is some idea of more jobs increasing AD, but no marks for evaluation. Make sure you read the question carefully. Here the focus is on aggregate demand, NOT aggregate supply.
Notes from the mark scheme and report
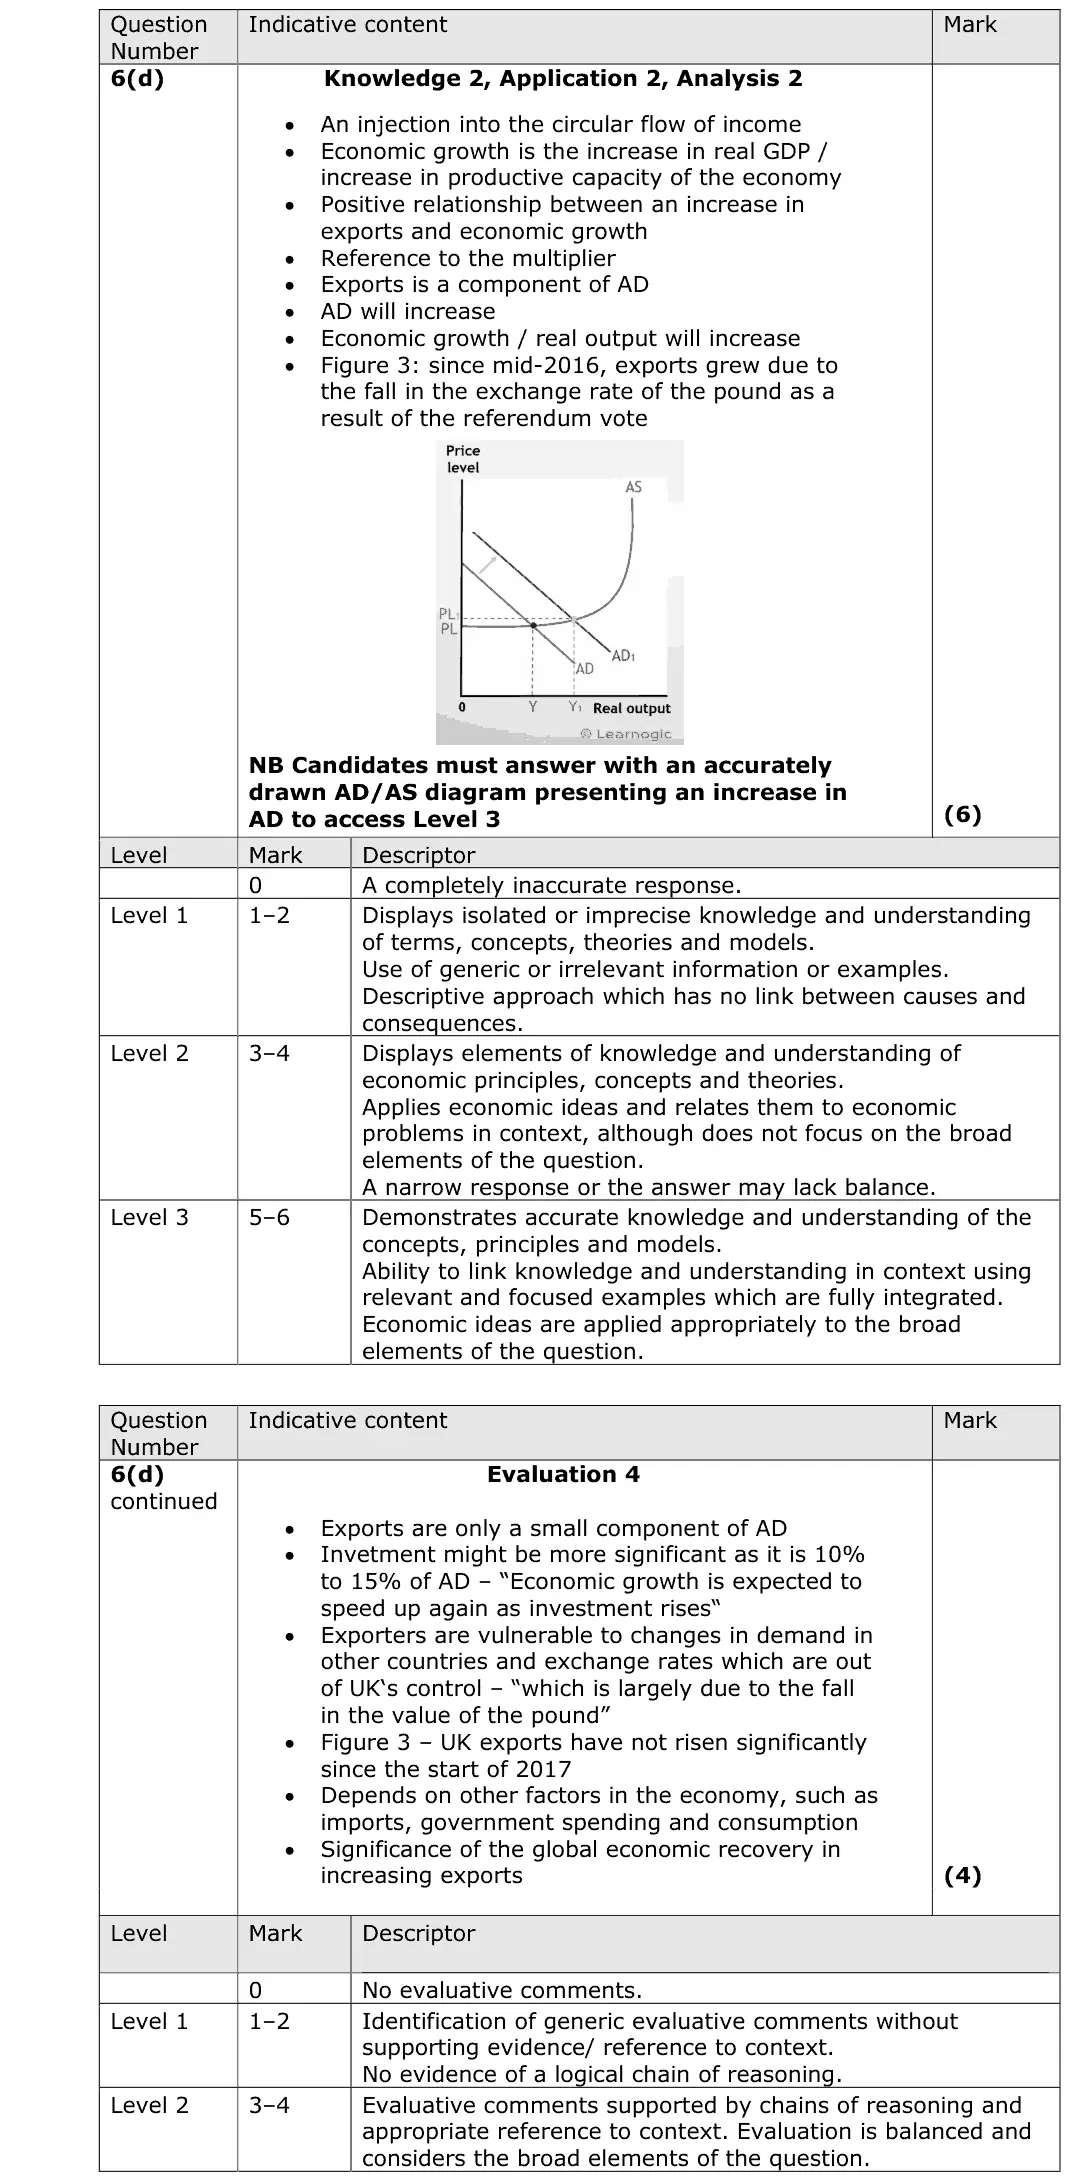
Intel's €30bn FDI is investment (I in AD = C + I + G + X - M): AD shifts right, multiplier from 7 000 construction and 3 000 permanent jobs
Level 3 needs a correctly labelled AD/AS diagram
evaluate: construction jobs are temporary, size relative to GDP, imports leak
report: discussing AS earned nothing
Quantitative skills: QS 4 (construct and interpret a range of standard graphical forms)
June 2025 · AS Paper 2 · Q6(e)15 marks15-mark response
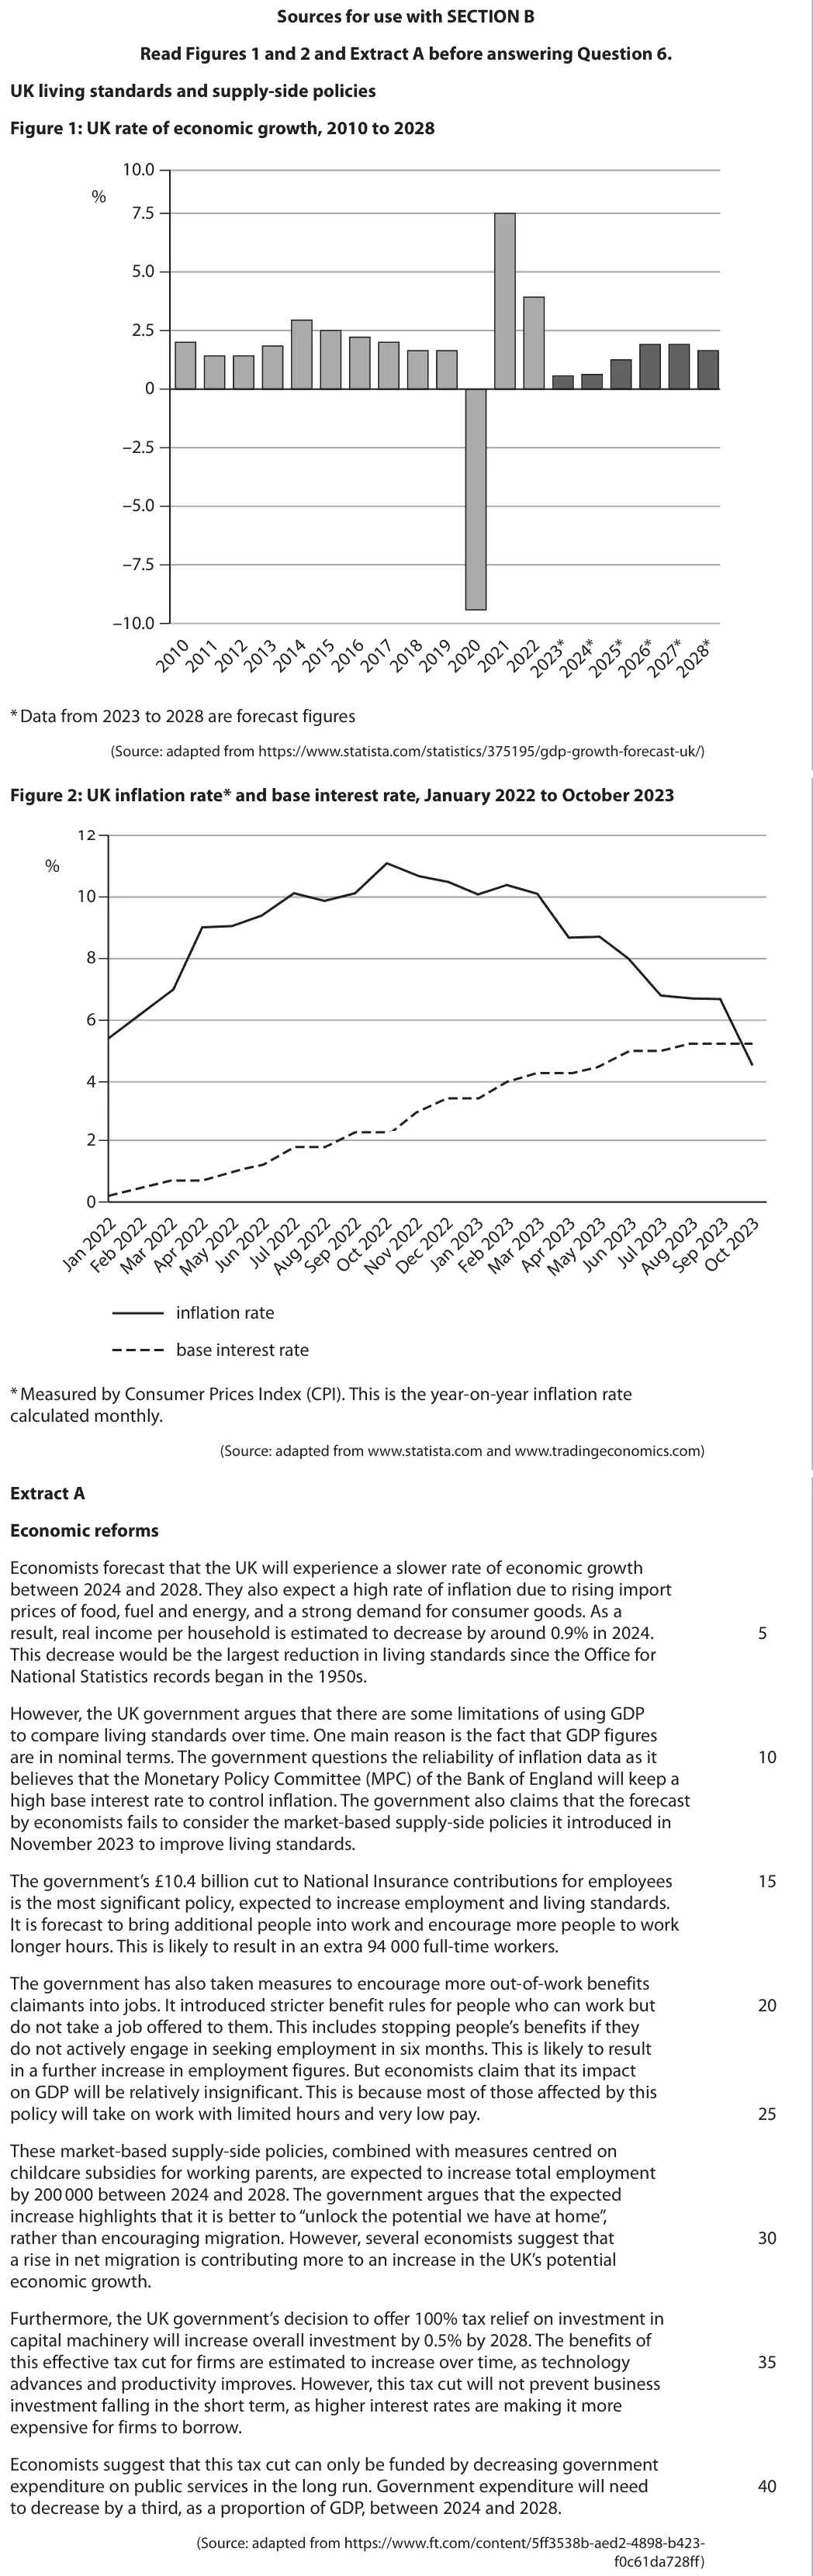
Data and extracts for question 6
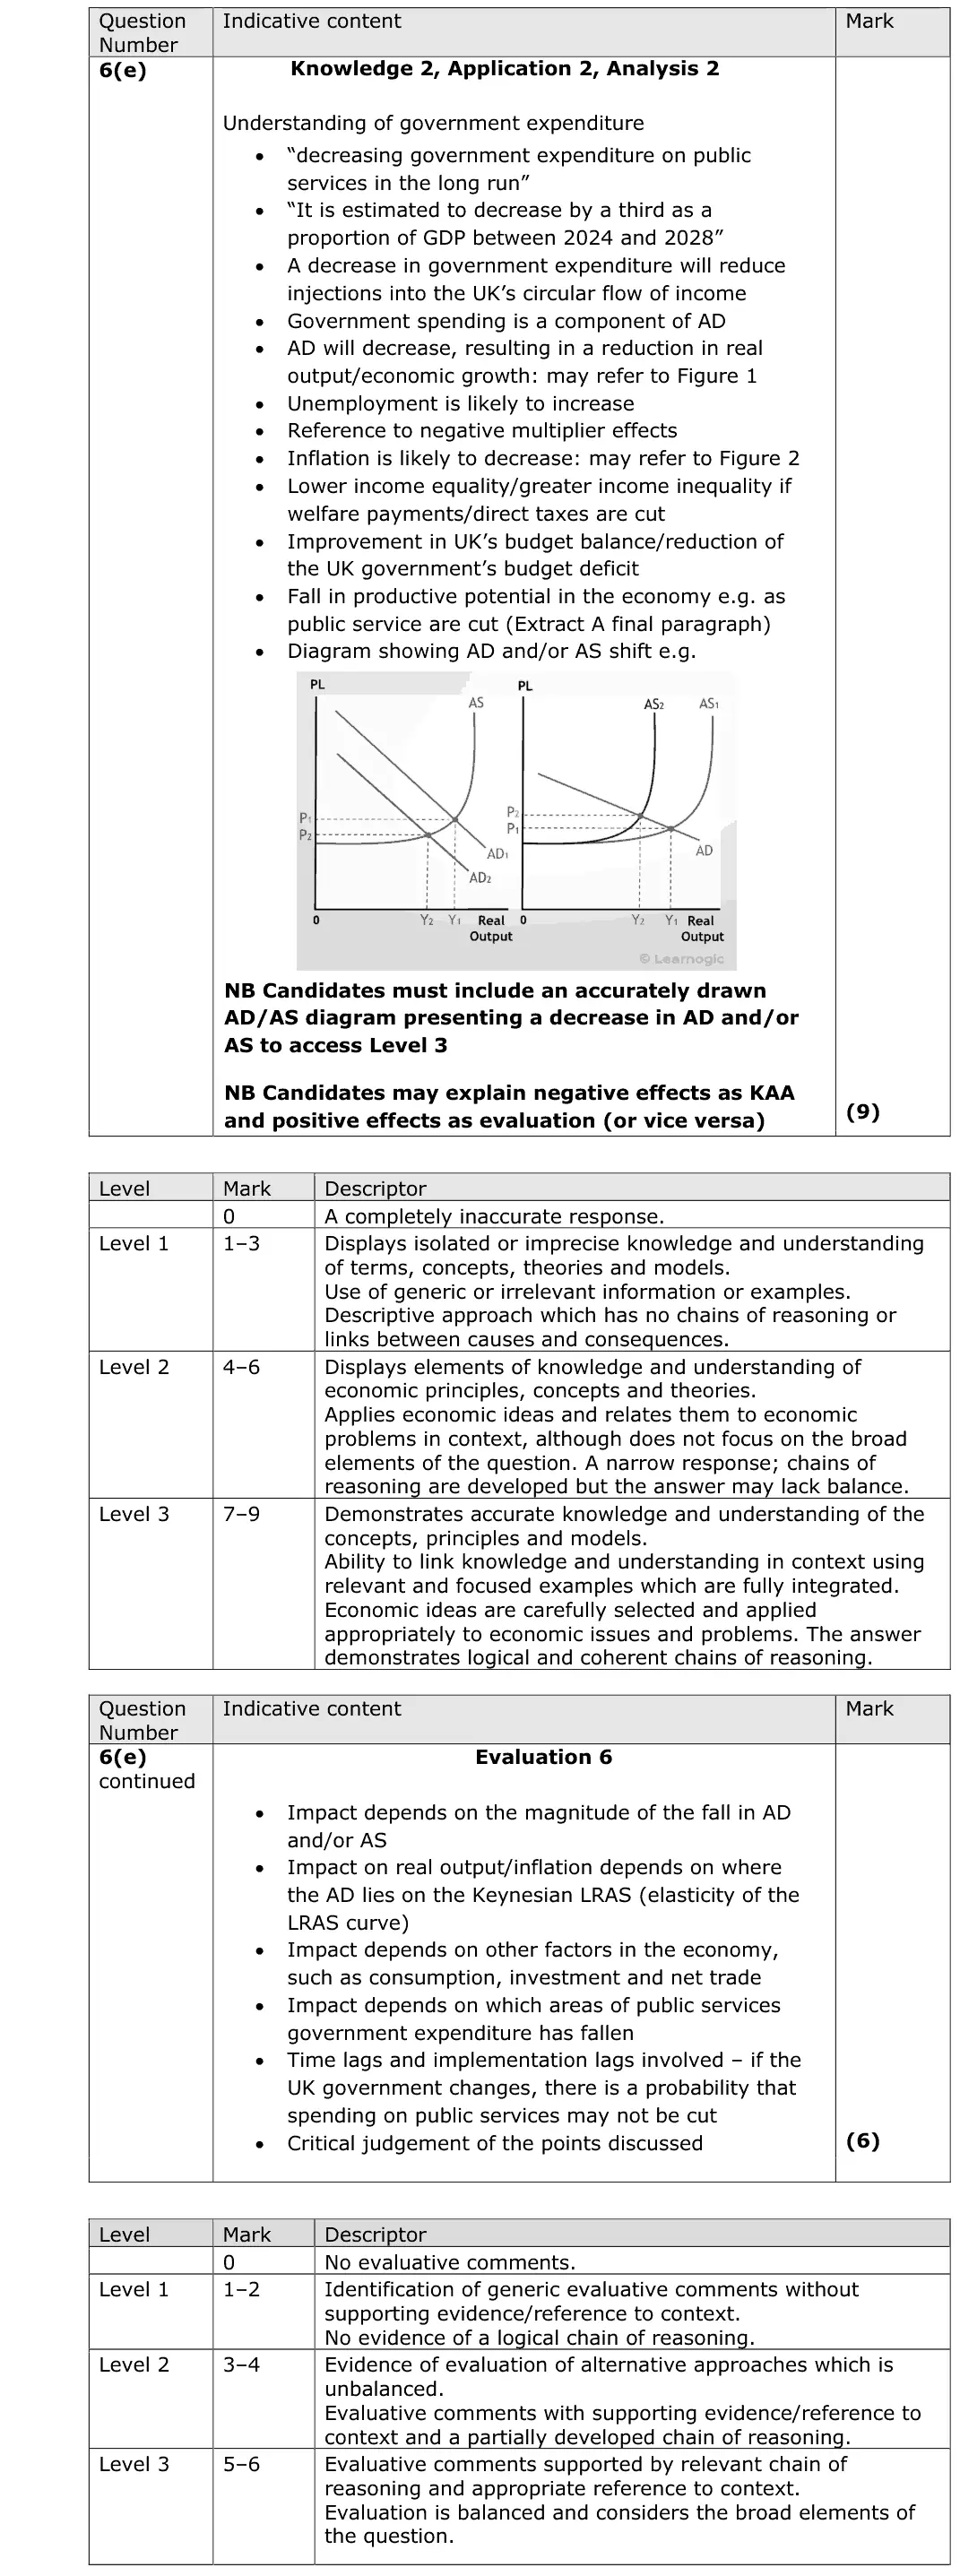
Mark scheme, including the levels grid and indicative content
Examiner's comment
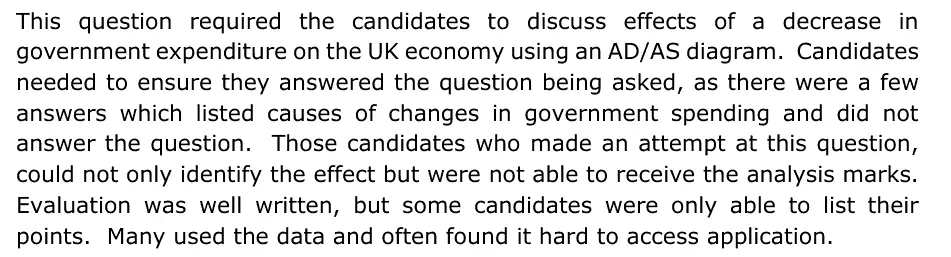
This question required the candidates to discuss effects of a decrease in government expenditure on the UK economy using an AD/AS diagram. Candidates needed to ensure they answered the question being asked, as there were a few answers which listed causes of changes in government spending and did not answer the question. Those candidates who made an attempt at this question, could not only identify the effect but were not able to receive the analysis marks. Evaluation was well written, but some candidates were only able to list their points. Many used the data and often found it hard to access application.
Notes from the mark scheme and report
Level 3 needs an accurate AD/AS diagram showing AD (and/or AS) shifting
less G lowers AD via the multiplier: output, unemployment, inflation, budget deficit, poorer public services (cut by a third of GDP 2024-28)
evaluate with size of the cut, spare capacity, crowding in, time lags
Quantitative skills: QS 4 (construct and interpret a range of standard graphical forms)
June 2024 · AS Paper 2 · Q2(a)1 markAO1=1DefinitionHard
Data and extracts for question 2
Mark scheme
Examiner's comment
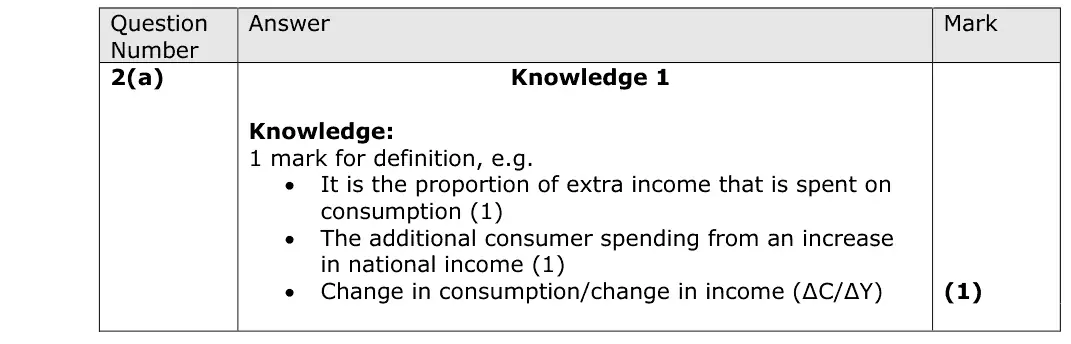
This question requires a precise definition of marginal propensity to consume. It is important that candidates are clear in their answers. Candidates could access marks through a range of approaches. Not many students accessed the knowledge mark for the definition.
Notes from the mark scheme and report
the proportion of each extra pound of income spent on consumption (change in C / change in Y)
report: "Not many students accessed the knowledge mark for the definition"
June 2024 · AS Paper 2 · Q2(c)1 markMultiple choice
Data and extracts for question 2
Answer
D
Mark scheme
Notes from the mark scheme and report
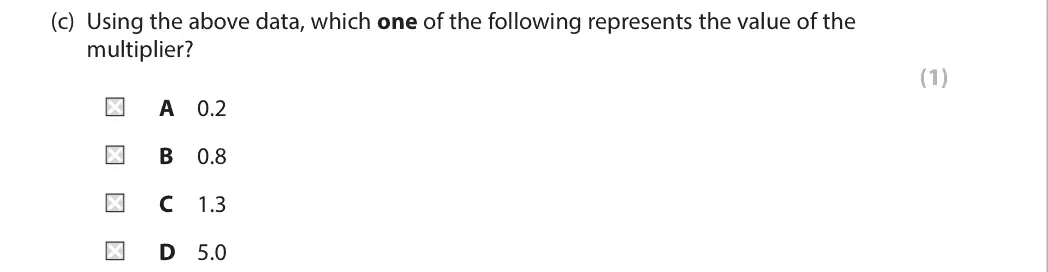
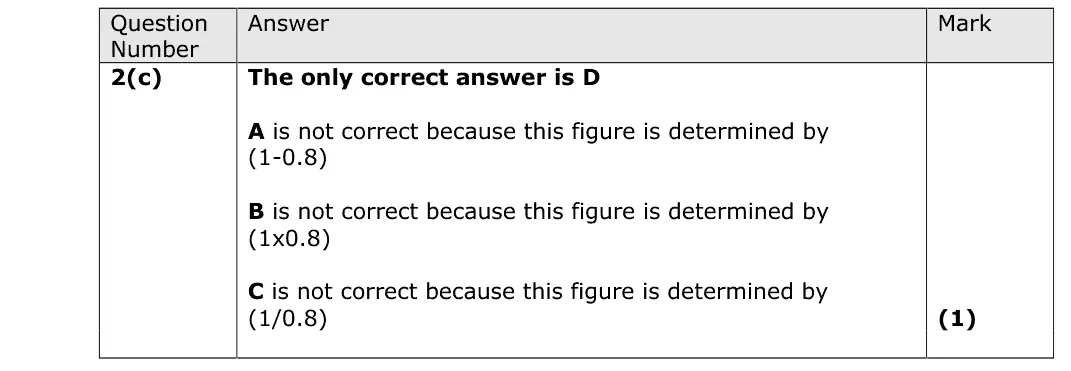
multiplier = 1 / (1 - MPC) = 1 / 0.2 = 5 (D)
A is 1 - 0.8, B is the MPC, C is 1 / 0.8
Quantitative skills: QS 1 (calculate, use and understand ratios and fractions)
June 2024 · AS Paper 2 · Q4(b)2 marksAO2=2Diagram
Data and extracts for question 4
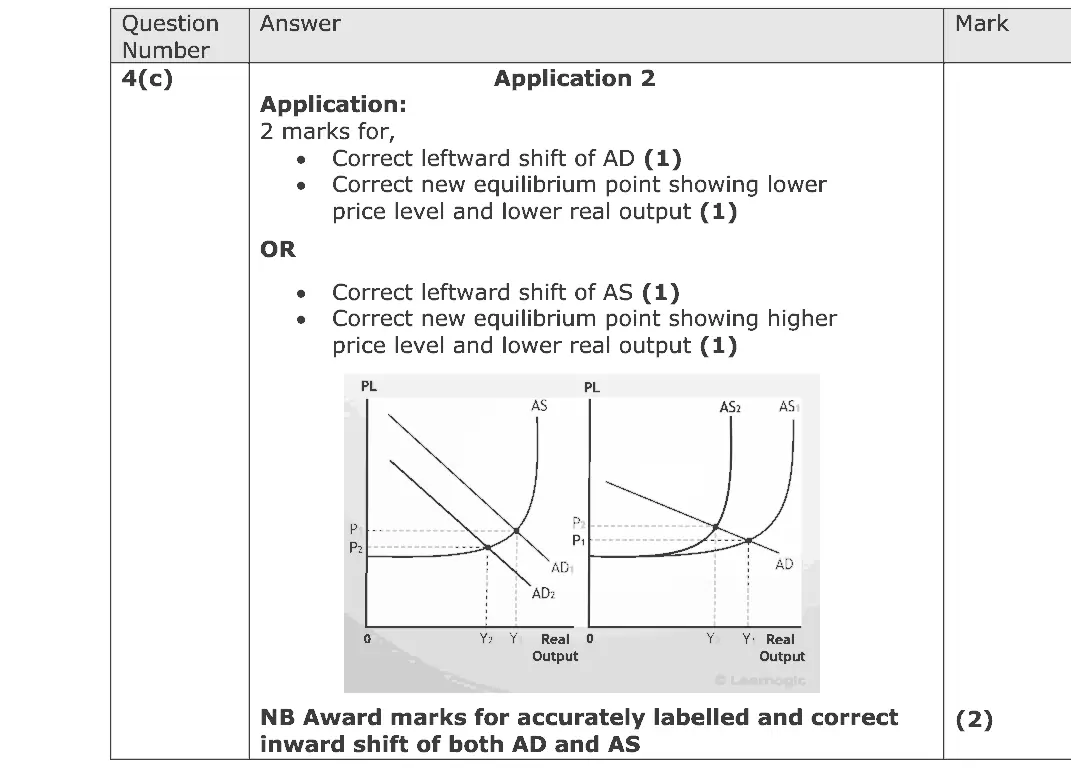
Mark scheme
Examiner's comment
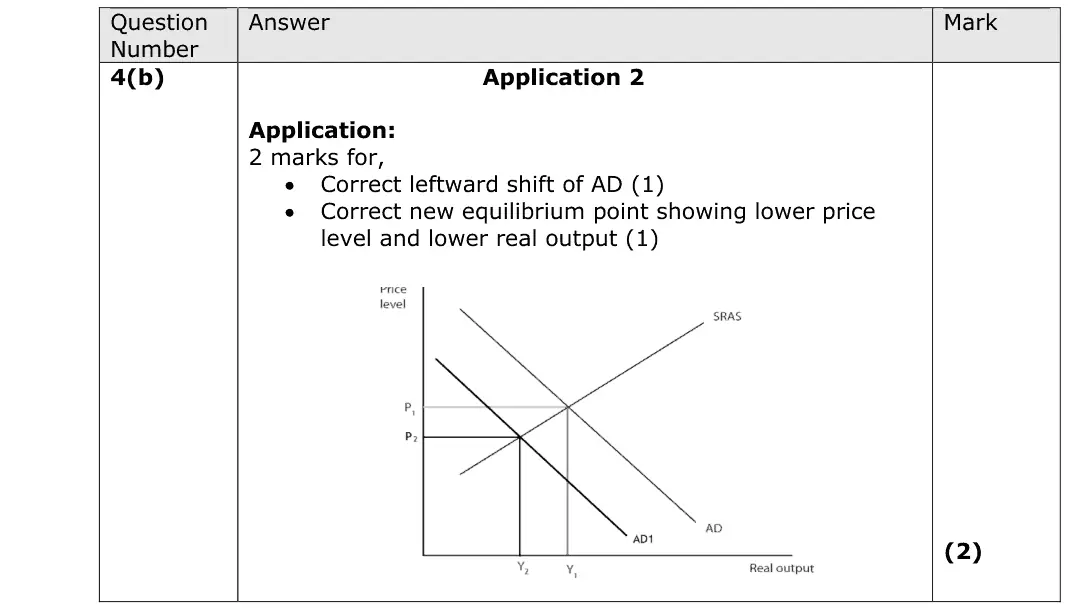
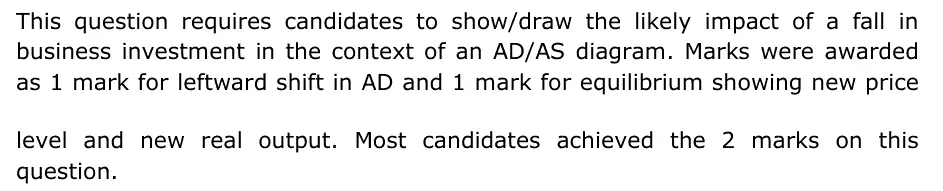
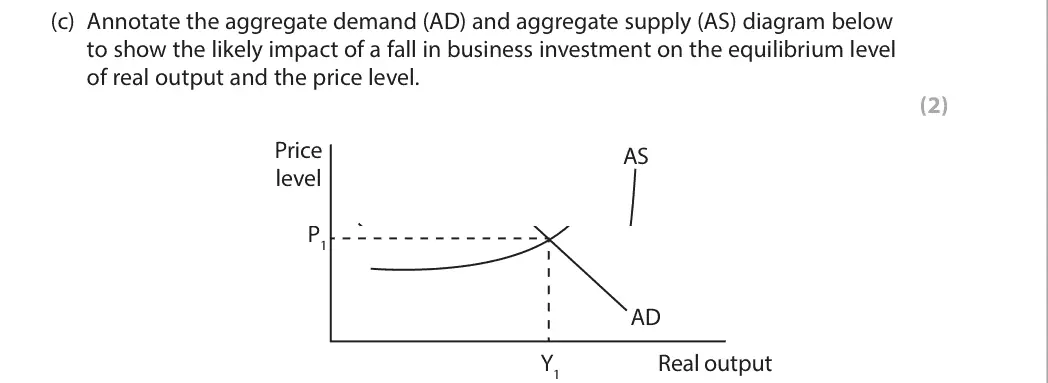
This question requires candidates to show/draw the likely impact of a fall in business investment in the context of an AD/AS diagram. Marks were awarded as 1 mark for leftward shift in AD and 1 mark for equilibrium showing new price level and new real output. Most candidates achieved the 2 marks on this question.
Notes from the mark scheme and report
shift AD left and mark the new equilibrium with lower price level and lower real output
Quantitative skills: QS 4 (construct and interpret a range of standard graphical forms)
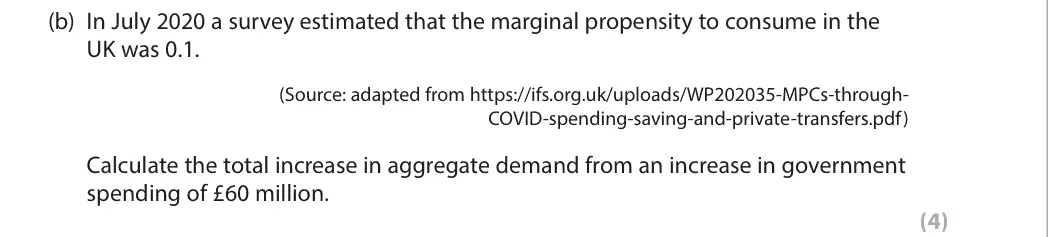
June 2024 · Paper 2 · Q4(b)4 marksAO1=2, AO2=2Calculation
Data and extracts for question 4
Mark scheme
Examiner's comment
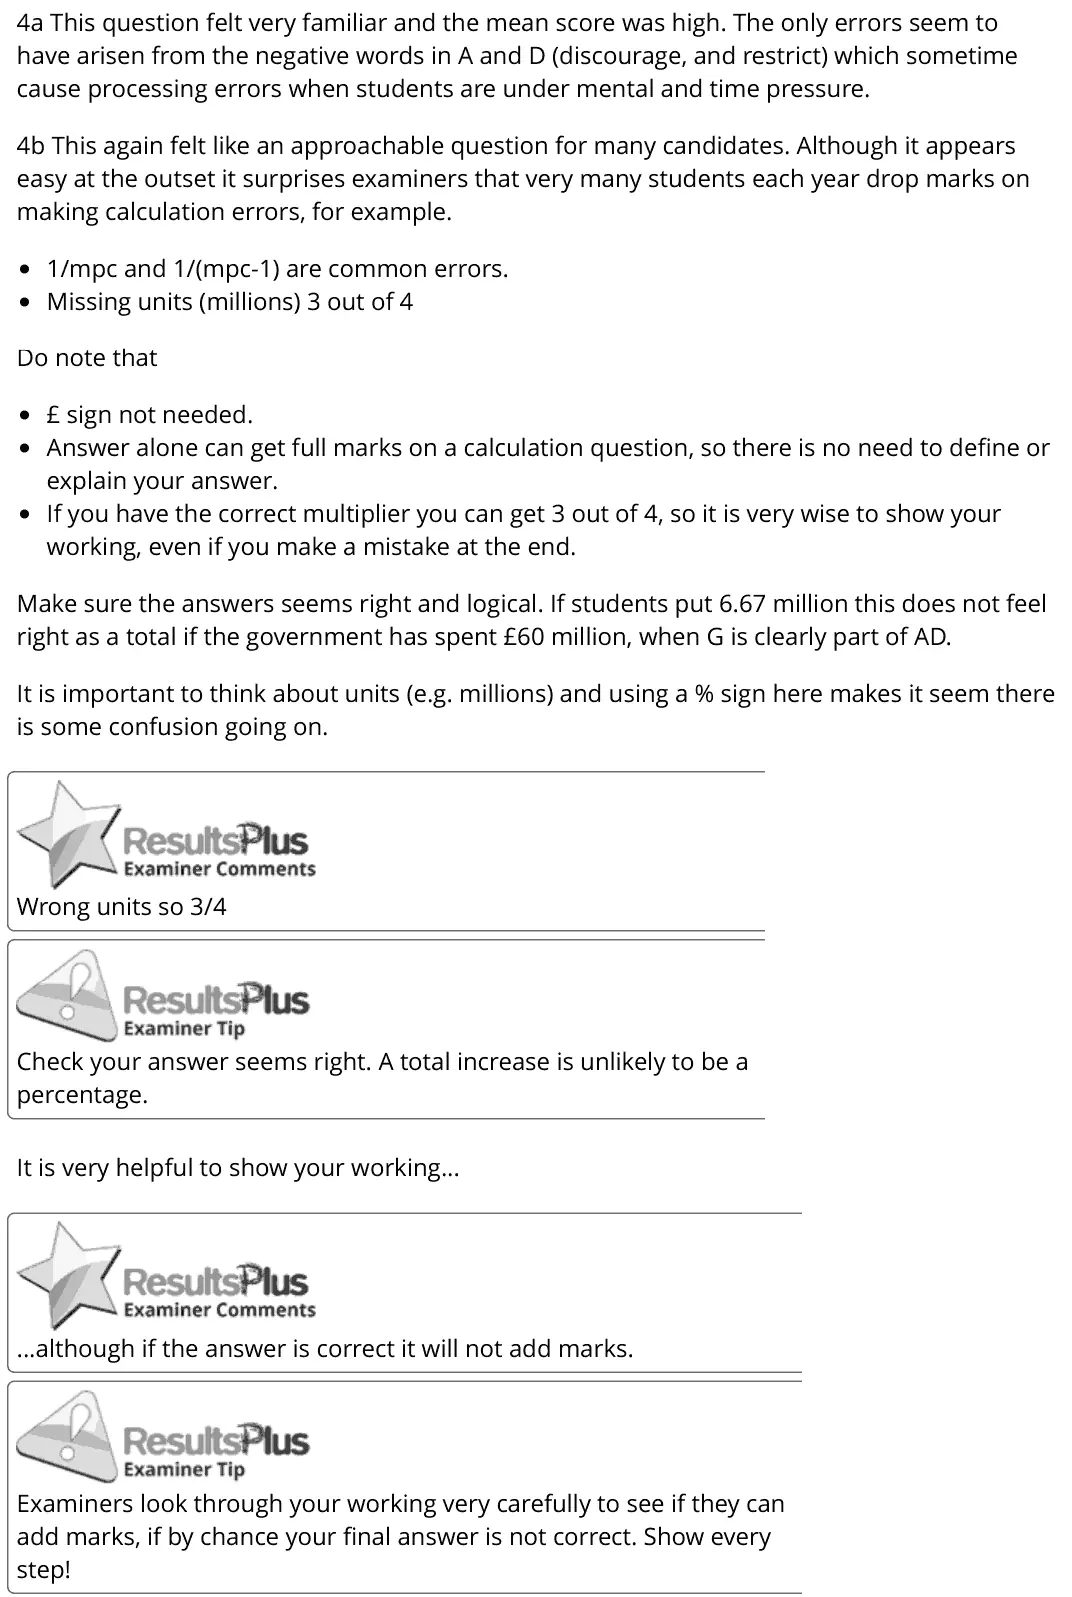
4a This question felt very familiar and the mean score was high. The only errors seem to have arisen from the negative words in A and D (discourage, and restrict) which sometime cause processing errors when students are under mental and time pressure. 4b This again felt like an approachable question for many candidates. Although it appears easy at the outset it surprises examiners that very many students each year drop marks on making calculation errors, for example. 1/mpc and 1/(mpc-1) are common errors. Missing units (millions) 3 out of 4 Do note that £ sign not needed. Answer alone can get full marks on a calculation question, so there is no need to define or explain your answer. If you have the correct multiplier you can get 3 out of 4, so it is very wise to show your working, even if you make a mistake at the end. Make sure the answers seems right and logical. If students put 6.67 million this does not feel right as a total if the government has spent £60 million, when G is clearly part of AD. It is important to think about units (e.g. millions) and using a % sign here makes it seem there is some confusion going on. Wrong units so 3/4 Check your answer seems right. A total increase is unlikely to be a percentage. It is very helpful to show your working... ...although if the answer is correct it will not add marks. Examiners look through your working very carefully to see if they can add marks, if by chance your final answer is not correct. Show every step!
Notes from the mark scheme and report
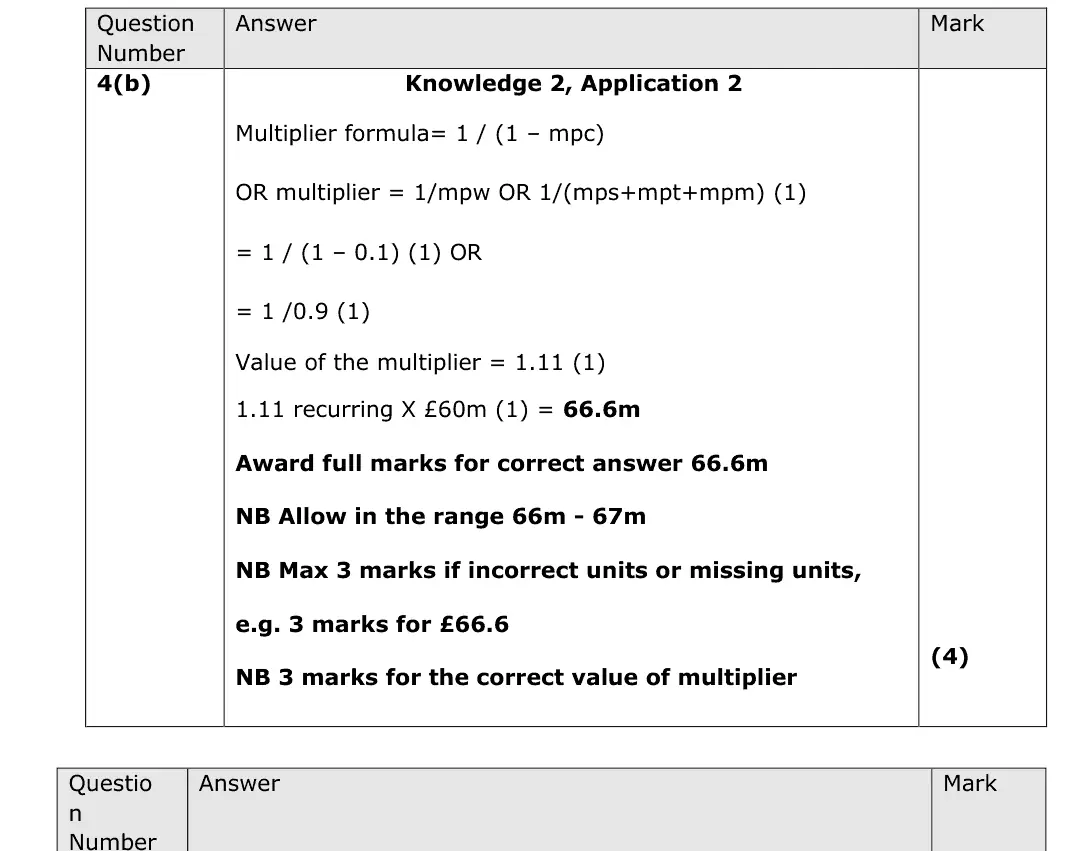
multiplier = 1 / (1 - 0.1) = 1.11
1.11 x £60m = £66.6m to £66.7m
report: 1/MPC and 1/(MPC - 1) are common errors
missing "million" scores 3 of 4
a total below £60m cannot be right
Quantitative skills: QS 1 (calculate, use and understand ratios and fractions)
June 2024 · AS Paper 2 · Q6(b)10 marksAO1=2, AO2=2, AO3=2, AO4=410-mark response
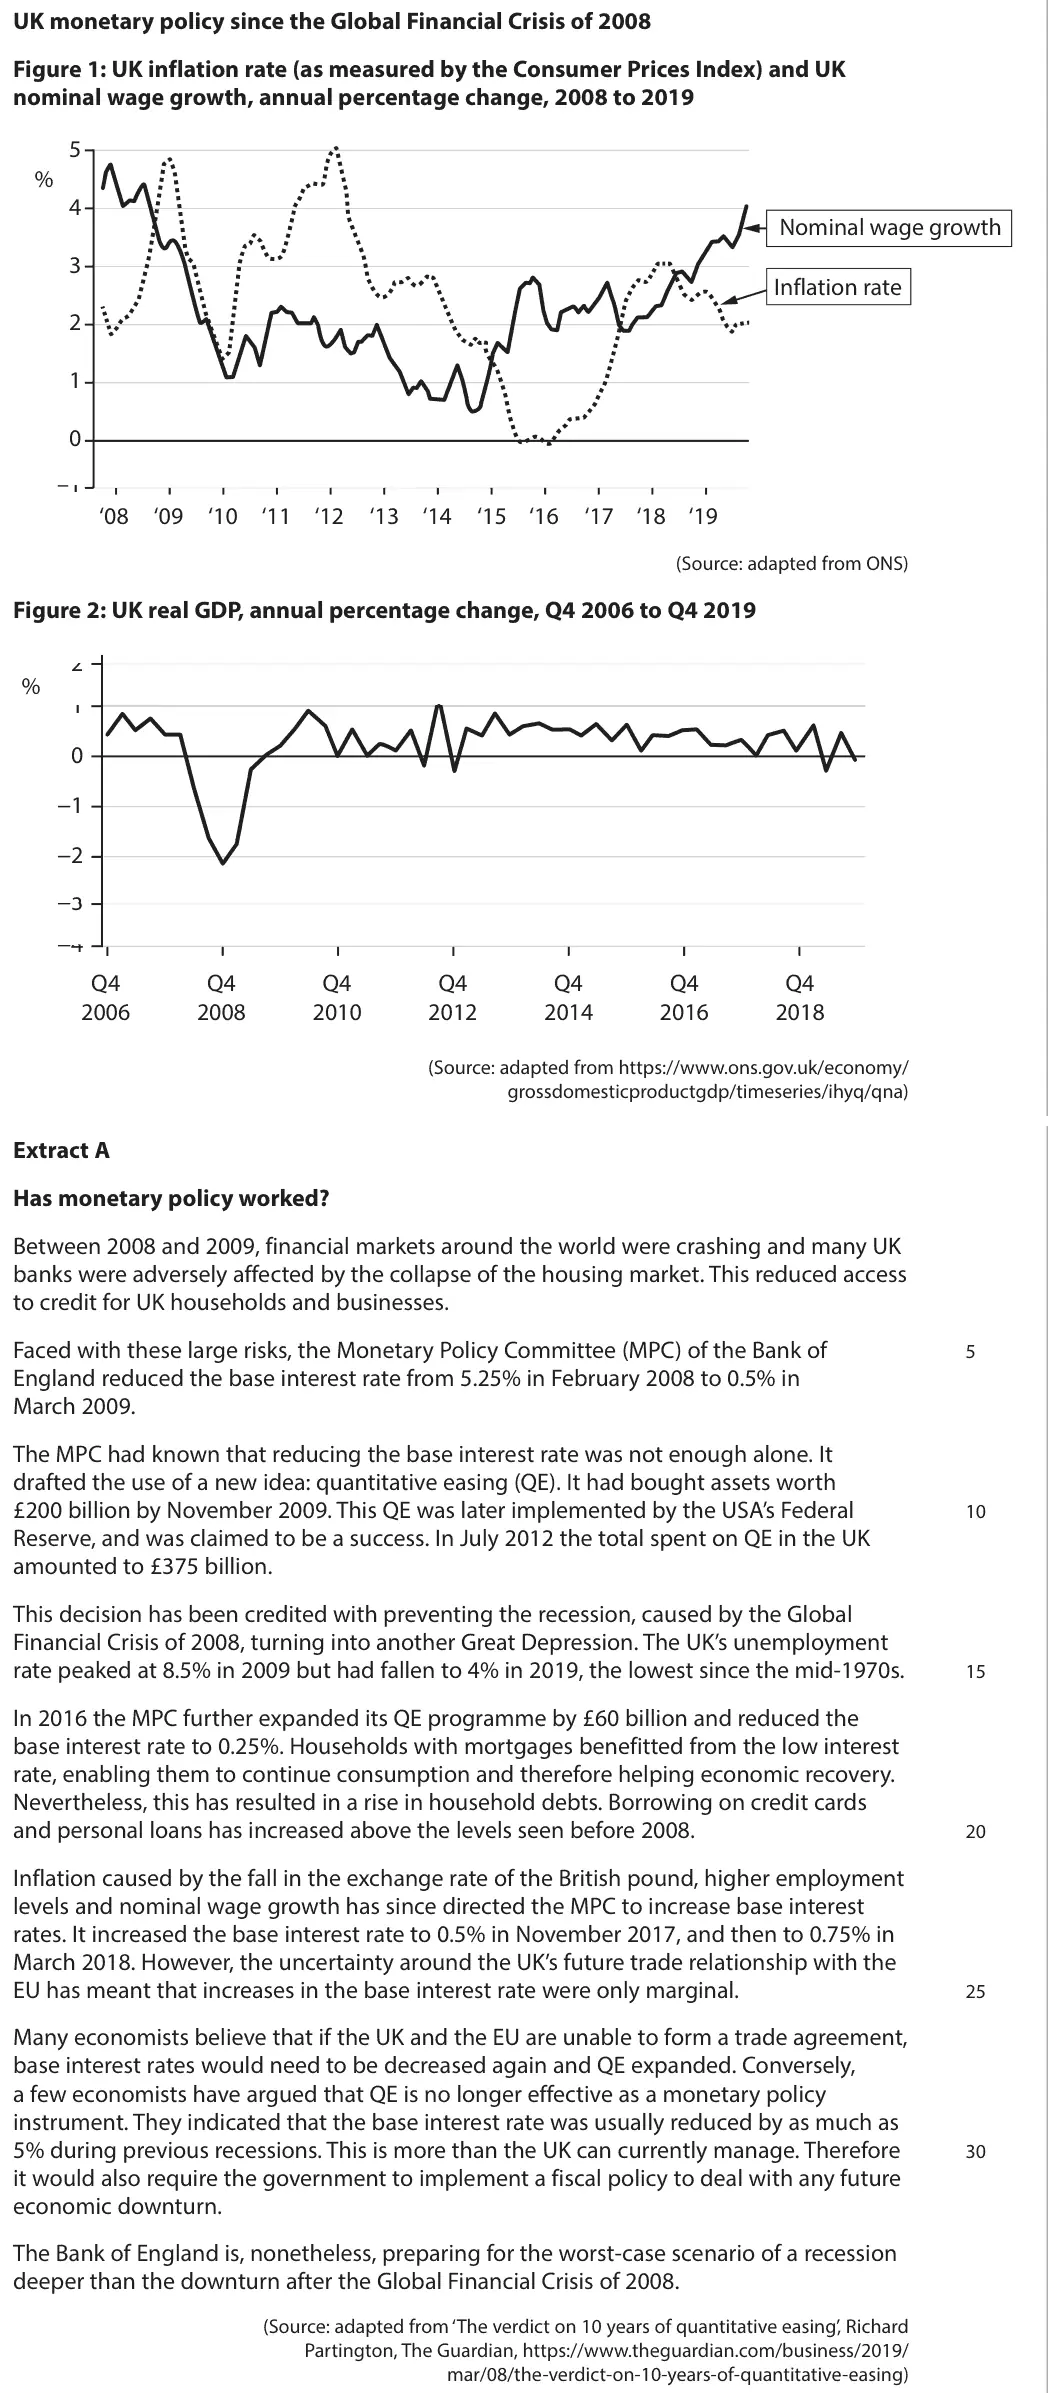
Data and extracts for question 6
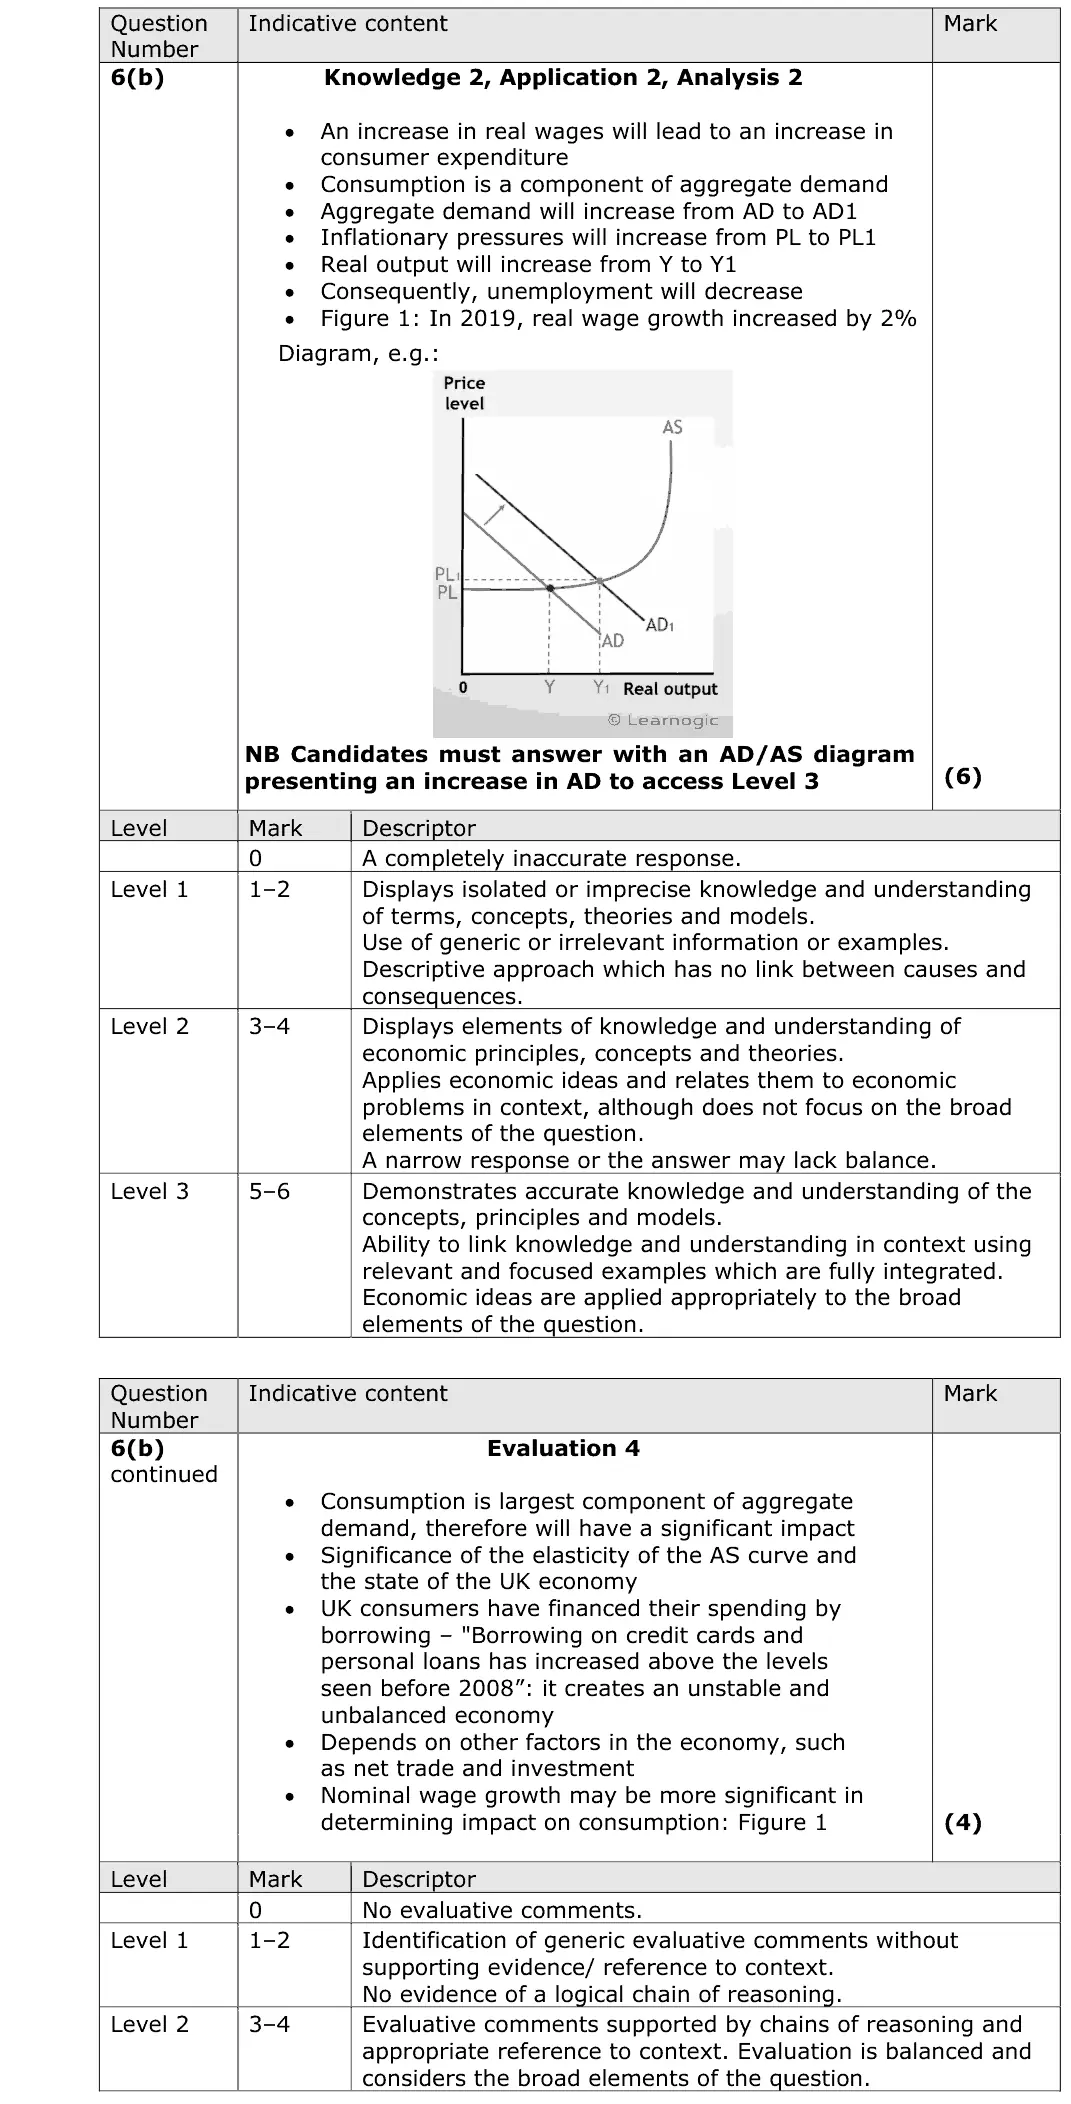
Mark scheme, including the levels grid and indicative content
Examiner's comment
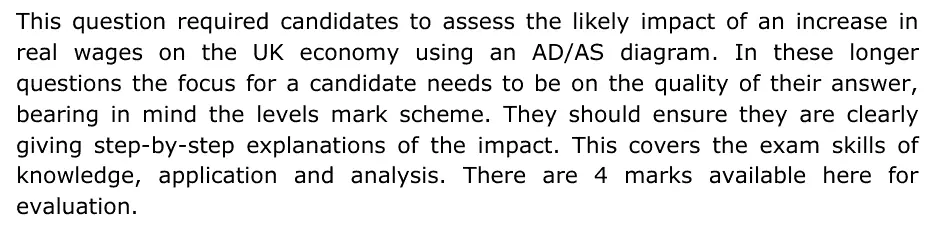
This question required candidates to assess the likely impact of an increase in real wages on the UK economy using an AD/AS diagram. In these longer questions the focus for a candidate needs to be on the quality of their answer, bearing in mind the levels mark scheme. They should ensure they are clearly giving step-by-step explanations of the impact. This covers the exam skills of knowledge, application and analysis. There are 4 marks available here for evaluation.
Notes from the mark scheme and report
Level 3 needs an AD/AS diagram with AD shifting right (higher consumption, real output and price level, lower unemployment)
evaluate with spare capacity, saving, imports, cost-push effects on SRAS
Quantitative skills: QS 4 (construct and interpret a range of standard graphical forms)
June 2024 · Paper 3 · Q2(c)12 marksAO1=2, AO2=2, AO3=4, AO4=412-mark response
Data and extracts for question 2
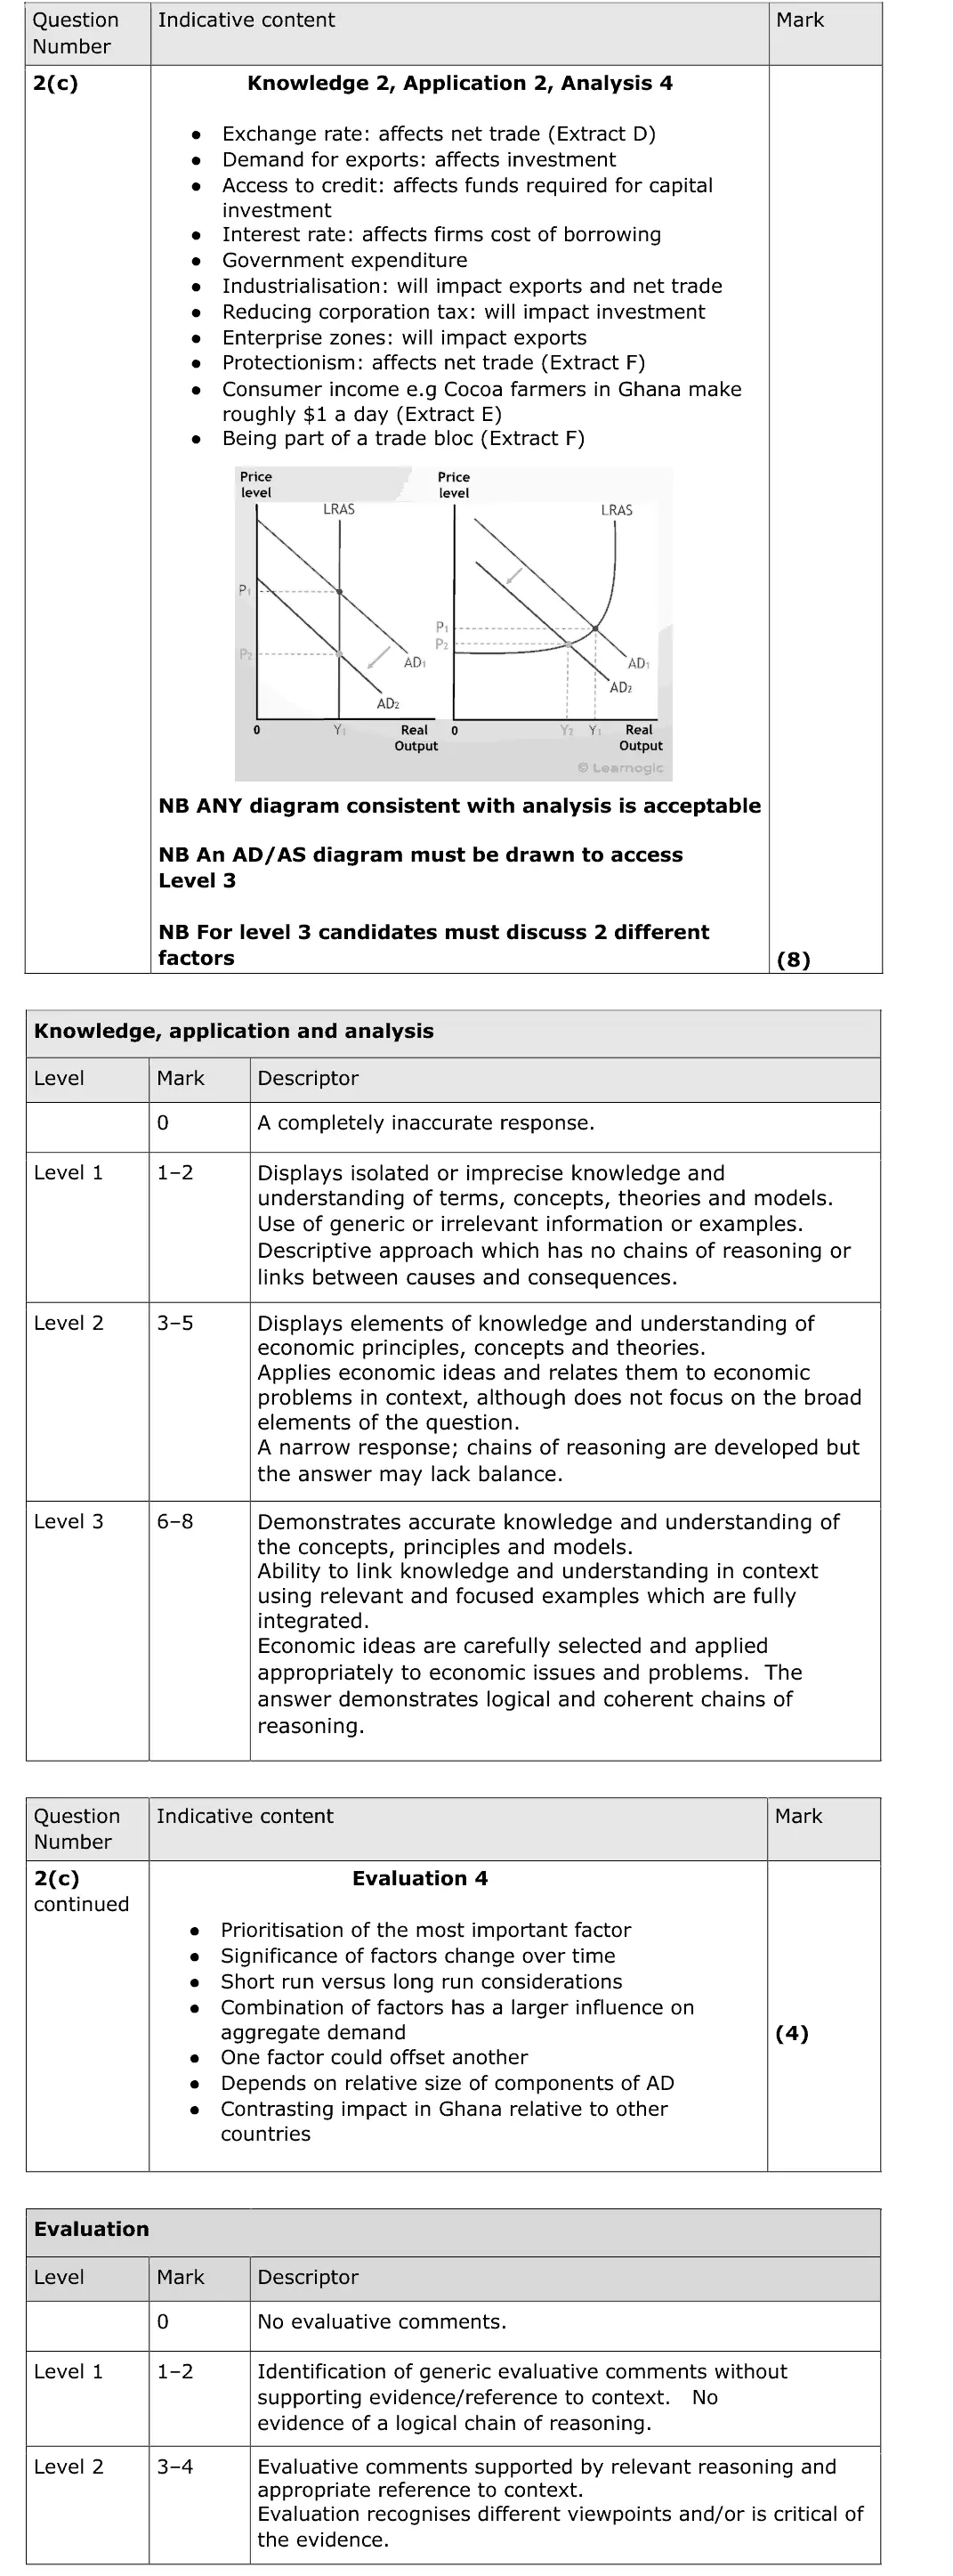
Mark scheme, including the levels grid and indicative content
Examiner's comment
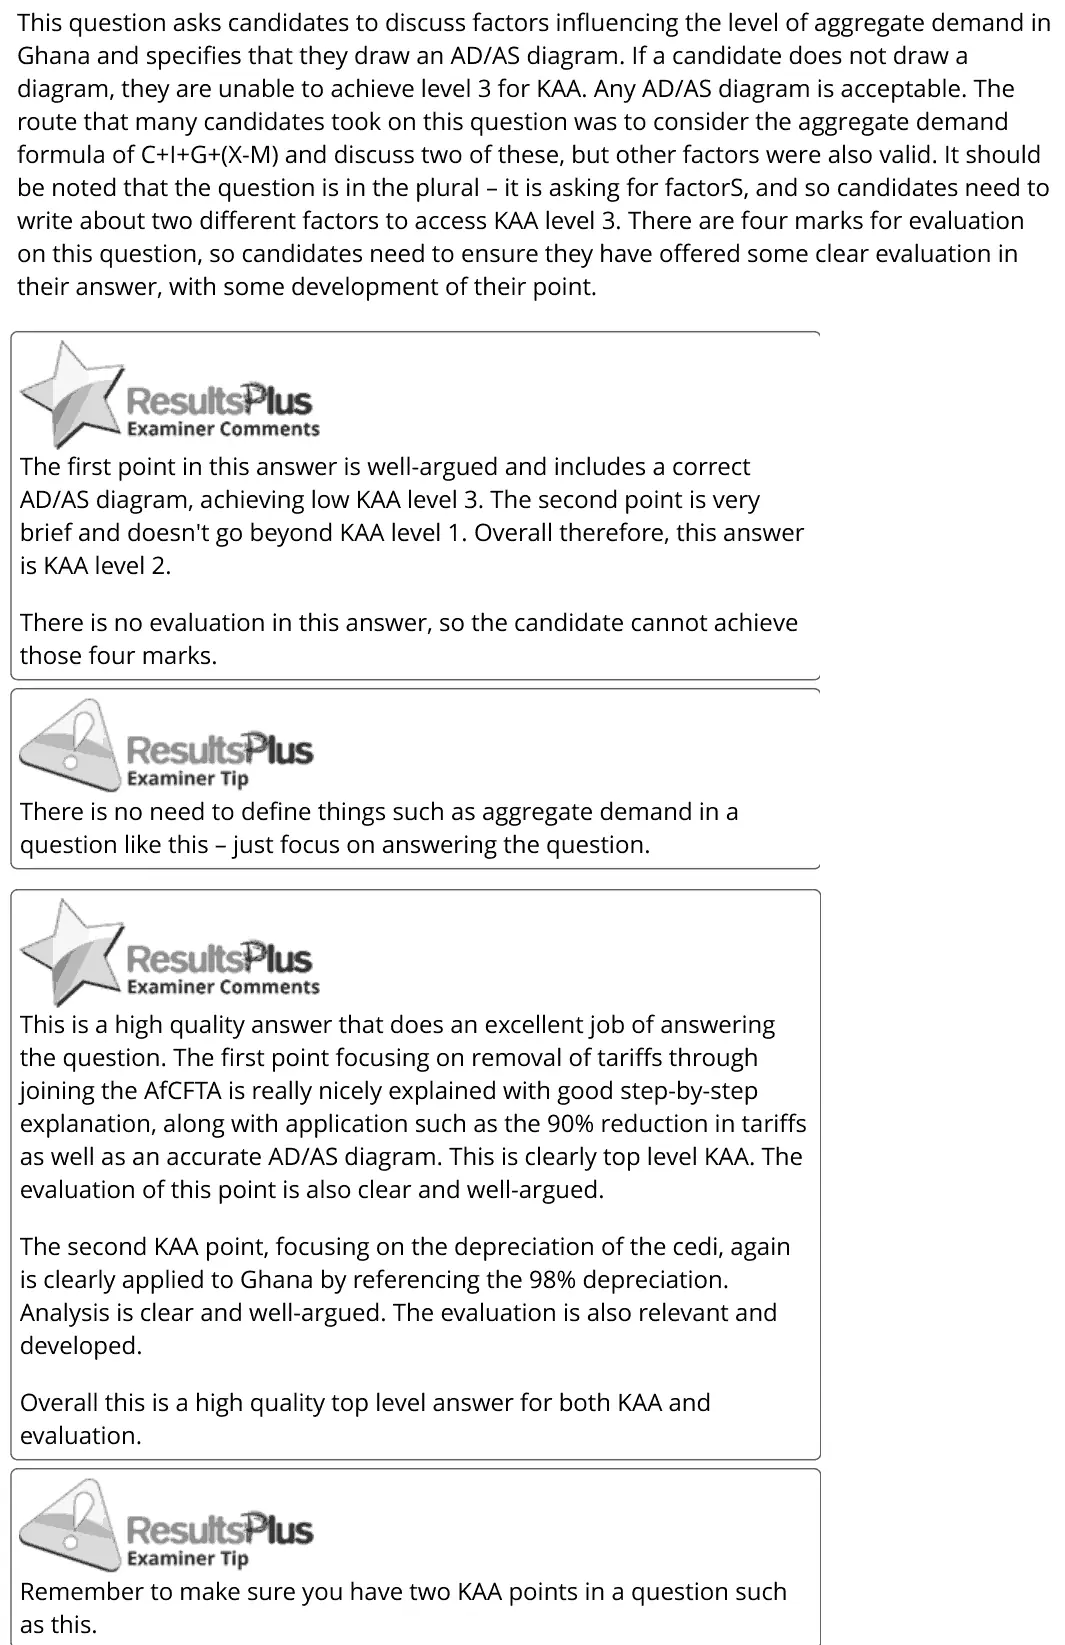
This question asks candidates to discuss factors influencing the level of aggregate demand in Ghana and specifies that they draw an AD/AS diagram. If a candidate does not drawa diagram, they are unable to achieve level 3 for KAA. Any AD/AS diagram is acceptable. The route that many candidates took on this question was to consider the aggregate demand formula of C+I+G+(X-M) and discuss two of these, but other factors were also valid. It should be noted that the question is in the plural - it is asking for factorS, and so candidates need to write about two different factors to access KAA level 3. There are four marks for evaluation on this question, so candidates need to ensure they have offered some clear evaluation in their answer, with some development of their point. <p BesultsPtus The first point in this answer is well-argued and includes a correct AD/AS diagram, achieving low KAA level 3. The second point is very brief and doesn't go beyond KAA level 1. Overall therefore, this answer is KAA level 2. There is no evaluation in this answer, so the candidate cannot achieve those four marks. G4, ResultsPius ~~) Examiner Tip There is no need to define things such as aggregate demand ina question like this - just focus on answering the question. KkResultsPlus This is a high quality answer that does an excellent job of answering the question. The first point focusing on removal of tariffs through joining the AfCFTA is really nicely explained with good step-by-step explanation, along with application such as the 90% reduction in tariffs as well as an accurate AD/AS diagram. This is clearly top level KAA. The evaluation of this point is also clear and well-argued. The second KAA point, focusing on the depreciation of the cedi, again is clearly applied to Ghana by referencing the 98% depreciation. Analysis is clear and well-argued. The evaluation is also relevant and developed. Overall this is a high quality top level answer for both KAA and evaluation. G4, ResultsPius ~~) Examiner Tip Remember to make sure you have two KAA points in a question such as this.
Notes from the mark scheme and report
Level 3 KAA needs an AD/AS diagram and two different factors (exchange rate and net trade, interest rates and access to credit, government spending, tax rebates, AfCFTA)
no need to define AD
evaluate relative size of components, time lags
Quantitative skills: QS 4 (construct and interpret a range of standard graphical forms)
June 2023 · Paper 2 · Q1(a)4 marksAO1=2, AO2=2Diagram
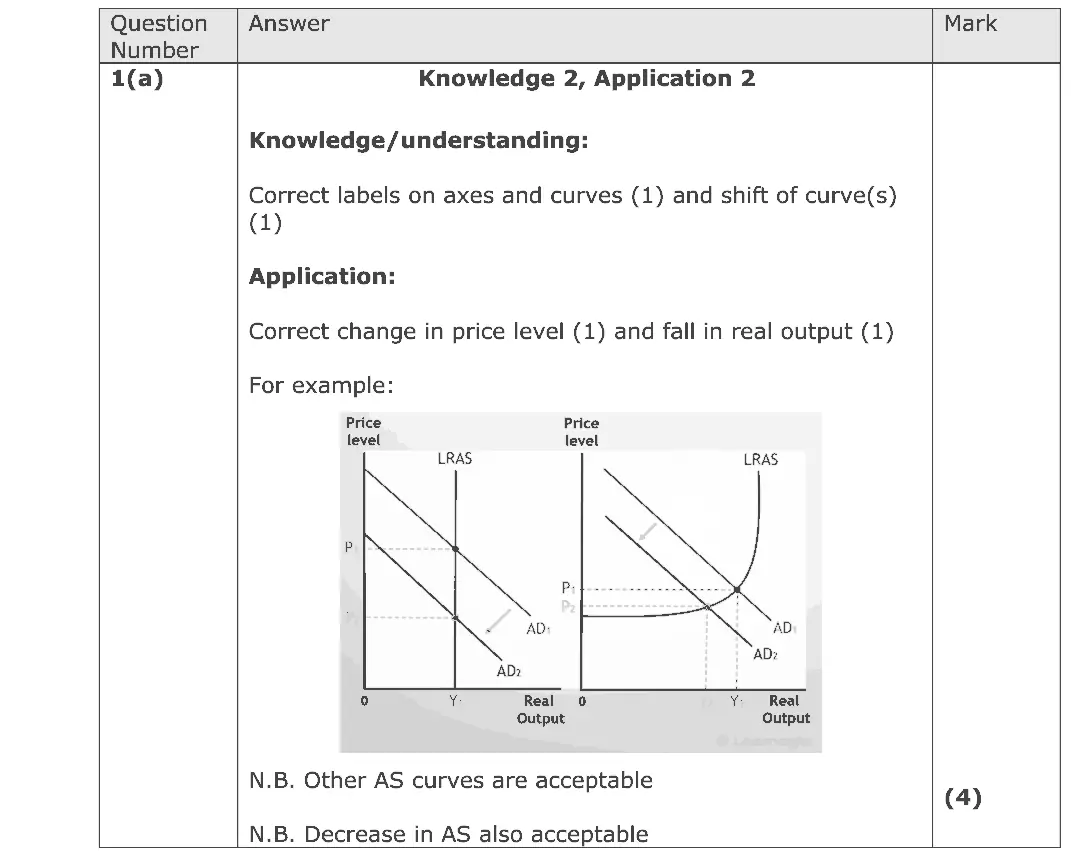
Data and extracts for question 1
Mark scheme
Examiner's comment
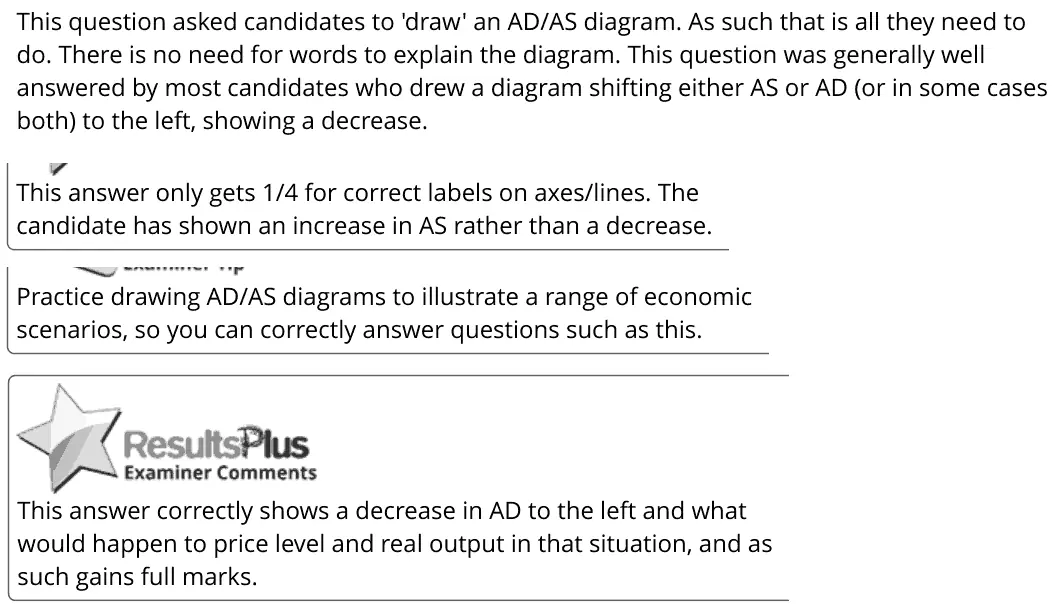
This question asked candidates to 'draw' an AD/AS diagram. As such that is all they need to do. There is no need for words to explain the diagram. This question was generally well answered by most candidates who drew a diagram shifting either AS or AD (or in some cases both) to the left, showing a decrease. This answer only gets 1/4 for correct labels on axes/lines. The candidate has shown an increase in AS rather than a decrease. Practice drawing AD/AS diagrams to illustrate a range of economic scenarios, so you can correctly answer questions such as this. This answer correctly shows a decrease in AD to the left and what would happen to price level and real output in that situation, and as such gains full marks.
Notes from the mark scheme and report
higher interest rate shifts AD left: lower price level and real output (a fall in AS also accepted)
shifting AS right scores only the label mark
no written explanation needed
Quantitative skills: QS 4 (construct and interpret a range of standard graphical forms)
June 2023 · Paper 2 · Q4(b)4 marksAO2=3, AO3=1Short answer
Data and extracts for question 4
Mark scheme
Examiner's comment
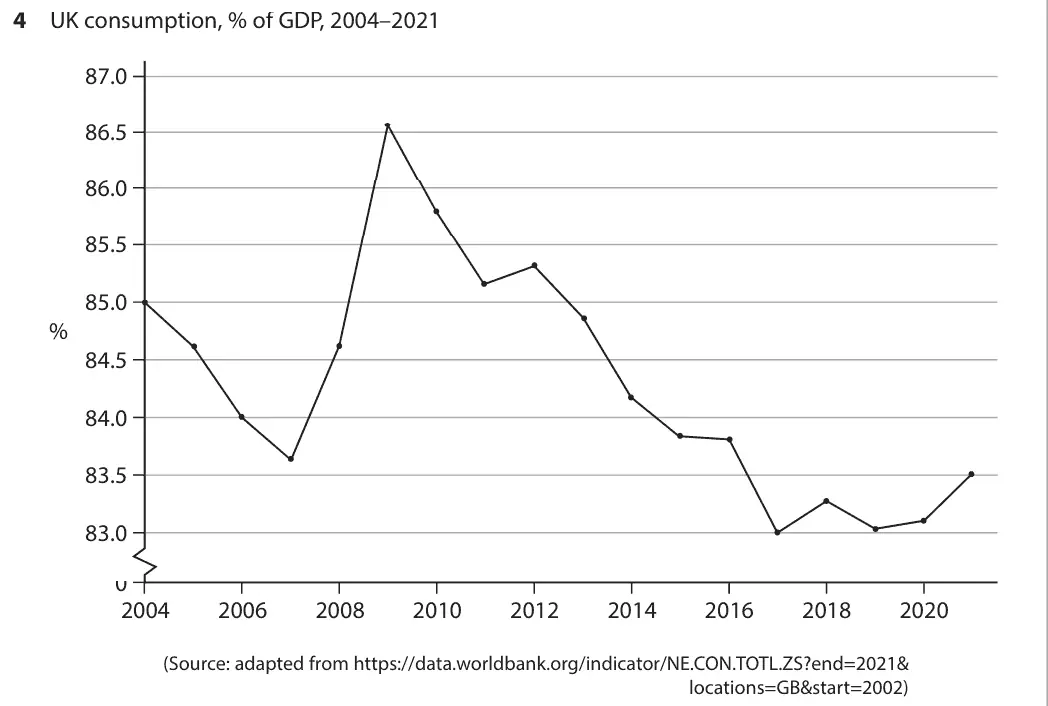
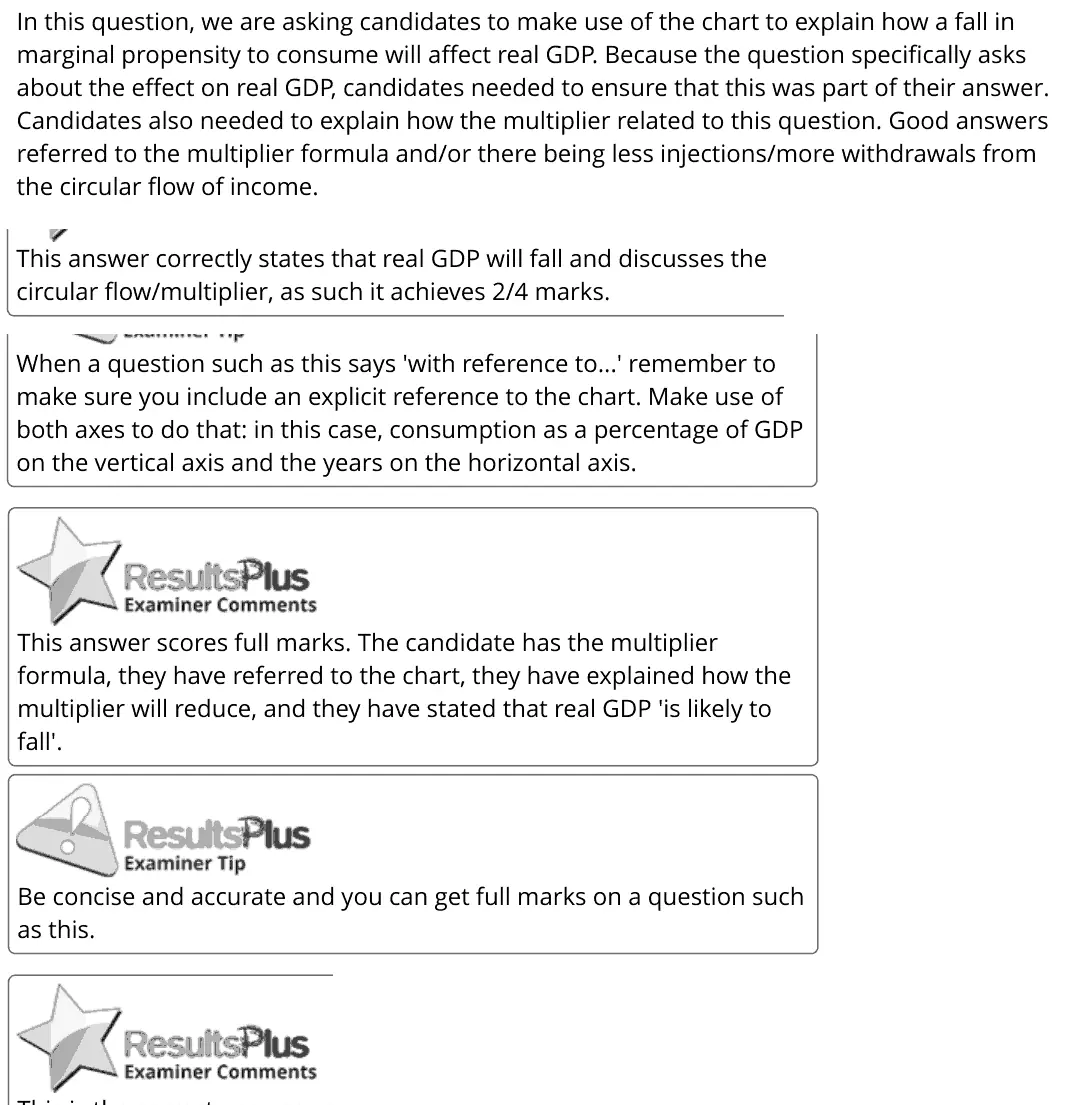
In this question, we are asking candidates to make use of the chart to explain how a fall in marginal propensity to consume will affect real GDP. Because the question specifically asks about the effect on real GDP, candidates needed to ensure that this was part of their answer. Candidates also needed to explain how the multiplier related to this question. Good answers referred to the multiplier formula and/or there being less injections/more withdrawals from the circular flow of income. This answer correctly states that real GDP will fall and discusses the circular flow/multiplier, as such it achieves 2/4 marks. When a question such as this says 'with reference to...' remember to make sure you include an explicit reference to the chart. Make use of both axes to do that: in this case, consumption as a percentage of GDP on the vertical axis and the years on the horizontal axis. This answer scores full marks. The candidate has the multiplier formula, they have referred to the chart, they have explained how the multiplier will reduce, and they have stated that real GDP 'is likely to fall'. Be concise and accurate and you can get full marks on a question such as this.
Notes from the mark scheme and report
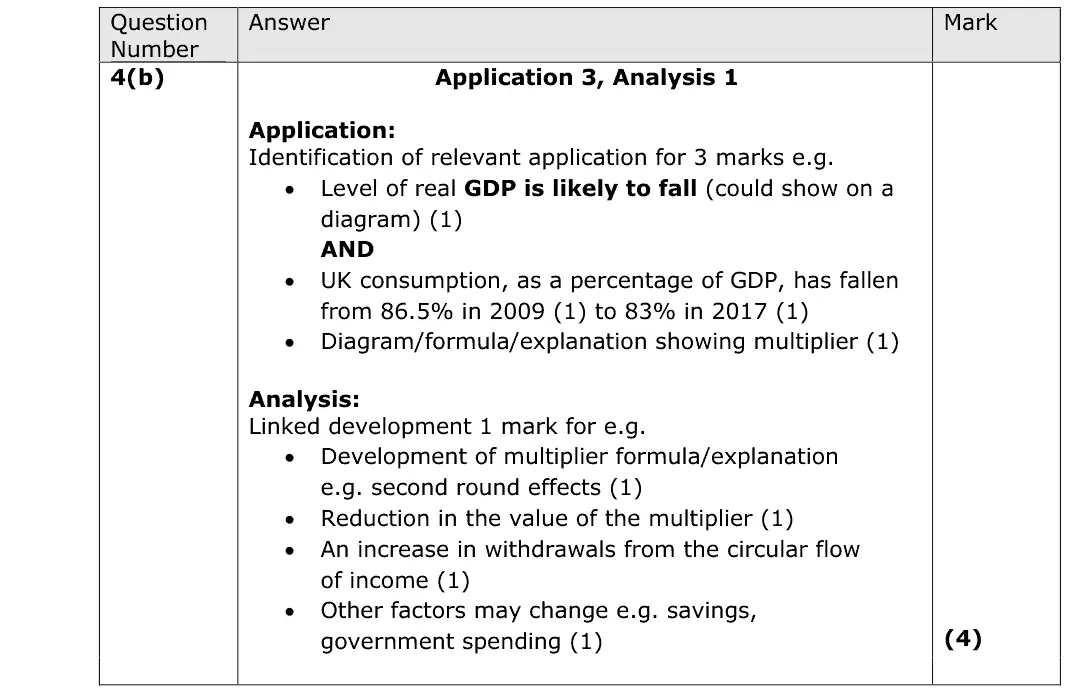
lower mpc means more withdrawals, a smaller multiplier, so real GDP falls
quote the chart (86.5% in 2009 to 83% in 2017) using both axes
answers must state the effect on real GDP
Quantitative skills: QS 9 (interpret, apply and analyse information in written, graphical tabular and numerical forms)
June 2023 · AS Paper 2 · Q4(c)2 marksAO2=2Diagram
Data and extracts for question 4
Mark scheme
Examiner's comment
This question requires candidates to show/draw the likely impact of a fall in business investment in the context of an AD/AS diagram. Marks were awarded as 1 mark for leftward shift in AD/AS and 1 mark for equilibrium showing new price level and new real output. Most candidates achieved the 2 marks on this question.
Notes from the mark scheme and report
lower investment shifts AD left: lower price level and real output at the new equilibrium (a leftward AS shift with higher price was also accepted)
Quantitative skills: QS 4 (construct and interpret a range of standard graphical forms)
June 2023 · AS Paper 2 · Q6(c)10 marksAO1=2, AO2=2, AO3=2, AO4=410-mark response
Data and extracts for question 6
Mark scheme, including the levels grid and indicative content
Examiner's comment
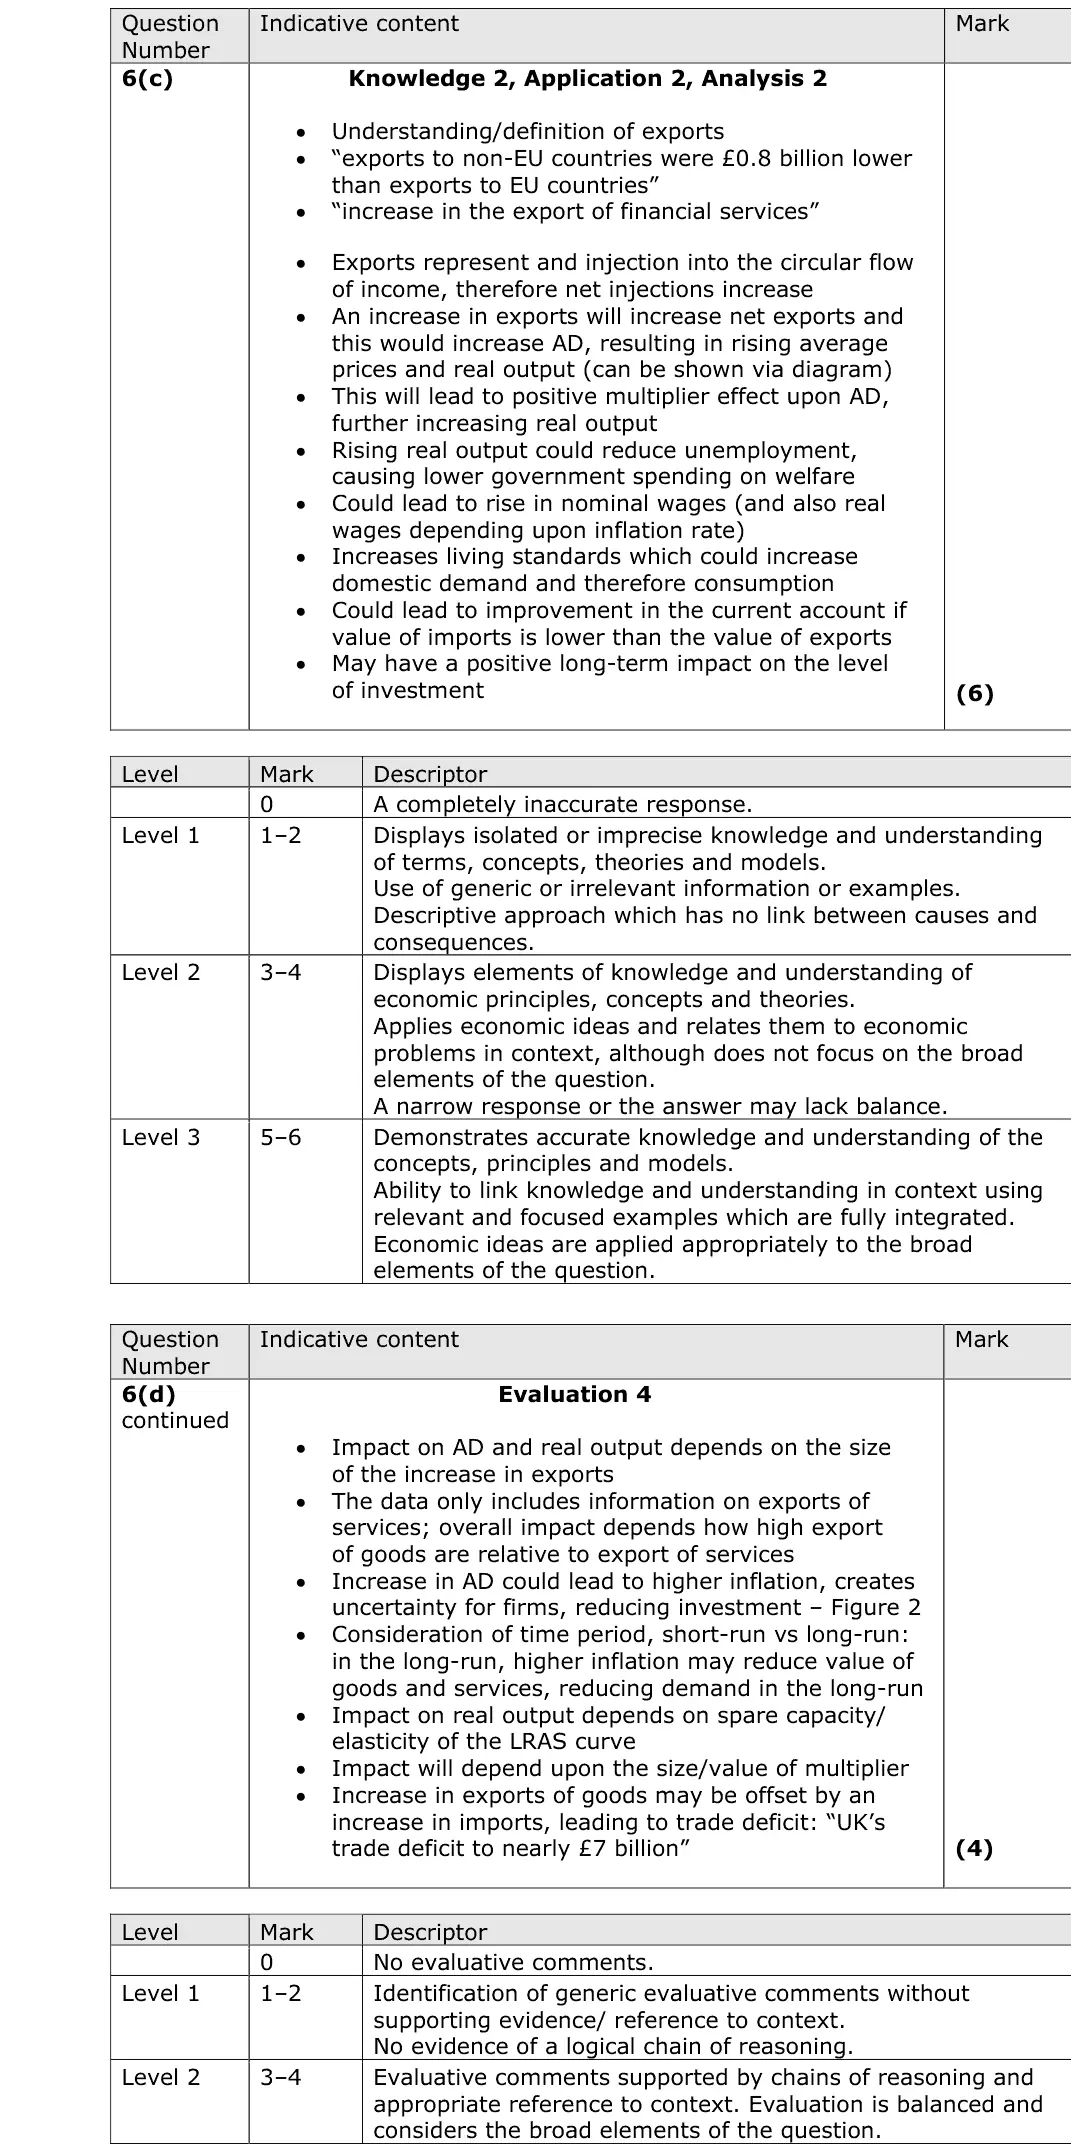
This question required candidates to assess likely impact of a rise in the value of exports on the UK economy. In these longer questions the focus for a candidate needs to be on the quality of their answer, bearing in mind the levels mark scheme. They should ensure they are clearly giving step-by-step explanations of the impact. This would cover the exam skills of knowledge, application, and analysis. There are 4 marks available here for evaluation.
Notes from the mark scheme and report
exports are an injection: higher AD, multiplier, real output, employment and current account
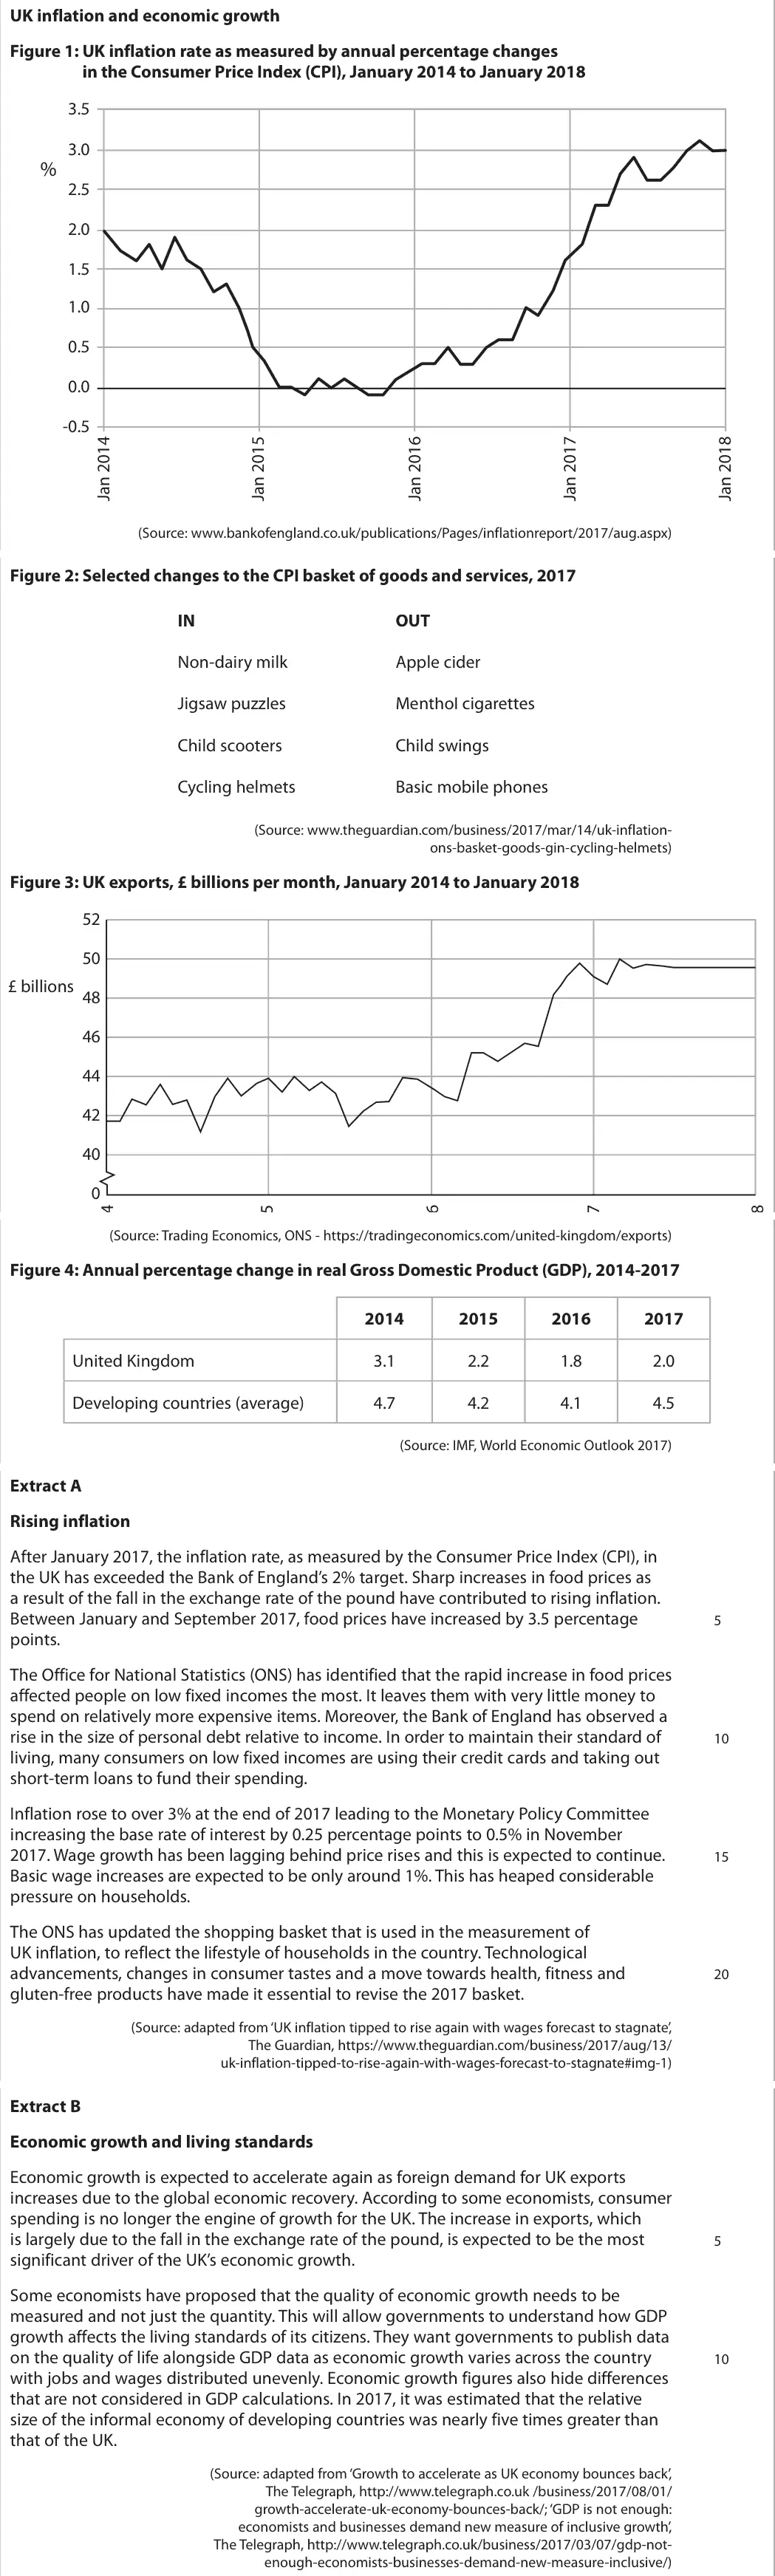
apply Extract A (services surplus £35.6bn, exports to non-EU £0.8bn lower)
evaluate with size of the rise, imports, inflation at full capacity
June 2022 · Paper 2 · Q1(a)4 marksAO2=3, AO3=1Calculation
Data and extracts for question 1
Mark scheme
Examiner's comment
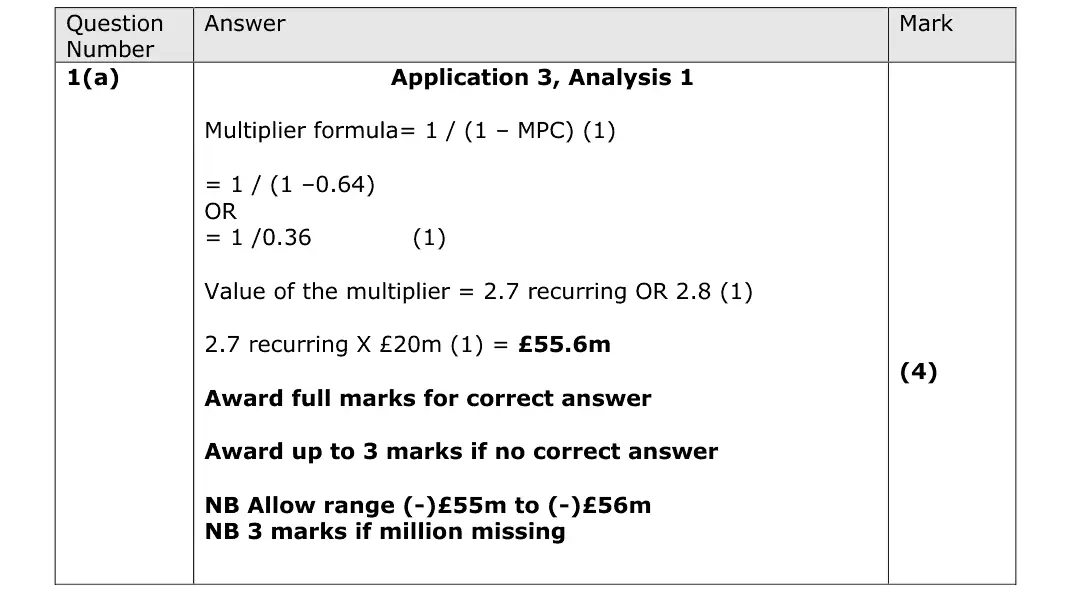
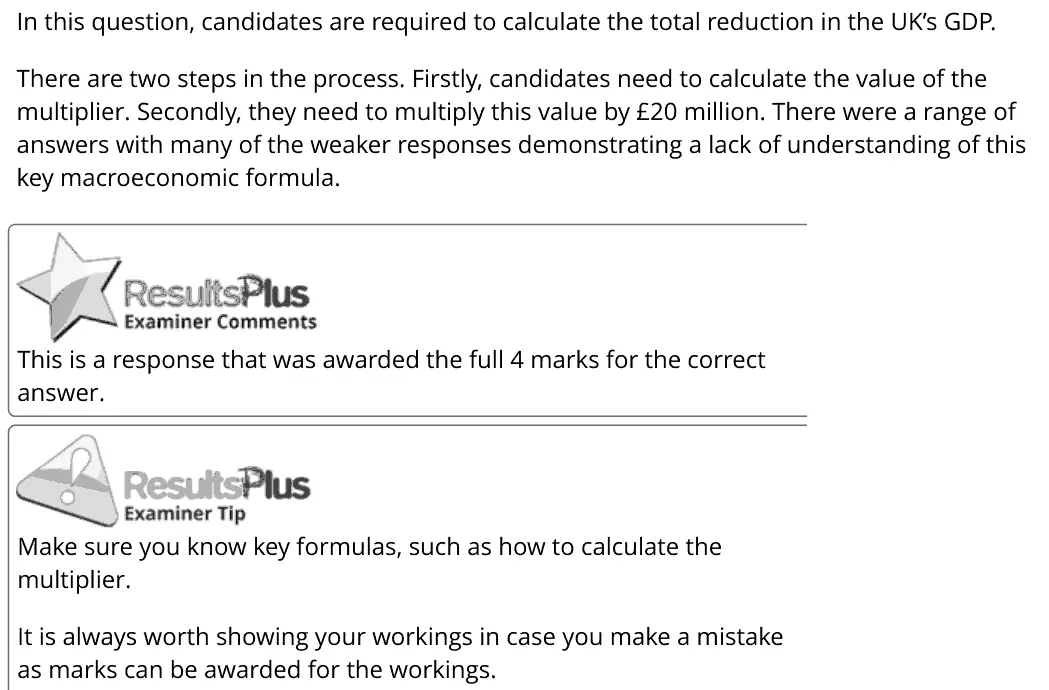
In this question, candidates are required to calculate the total reduction in the UK’s GDP. There are two steps in the process. Firstly, candidates need to calculate the value of the multiplier. Secondly, they need to multiply this value by £20 million. There were a range of answers with many of the weaker responses demonstrating a lack of understanding of this key macroeconomic formula. This is a response that was awarded the full 4 marks for the correct answer. Make sure you know key formulas, such as how to calculate the multiplier. It is always worth showing your workings in case you make a mistake as marks can be awarded for the workings.
Notes from the mark scheme and report
multiplier = 1/(1 - MPC) = 1/0.36 = 2.78
2.78 x £20m = £55.6m (allow £55m to £56m)
3 marks if 'million' is missing
show working
weaker answers did not know the multiplier formula
Quantitative skills: QS 1 (calculate, use and understand ratios and fractions); QS 9 (interpret, apply and analyse information in written, graphical tabular and numerical forms)
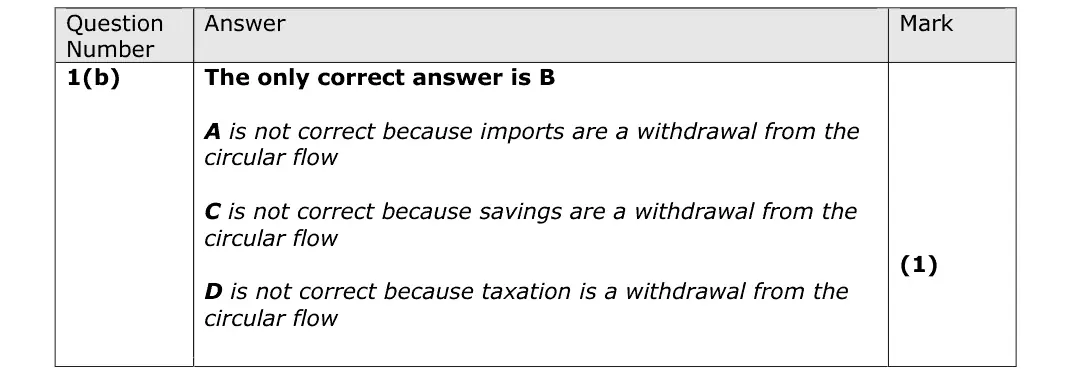
June 2022 · Paper 2 · Q1(b)1 markMultiple choice
Data and extracts for question 1
Answer
B
Mark scheme
Notes from the mark scheme and report
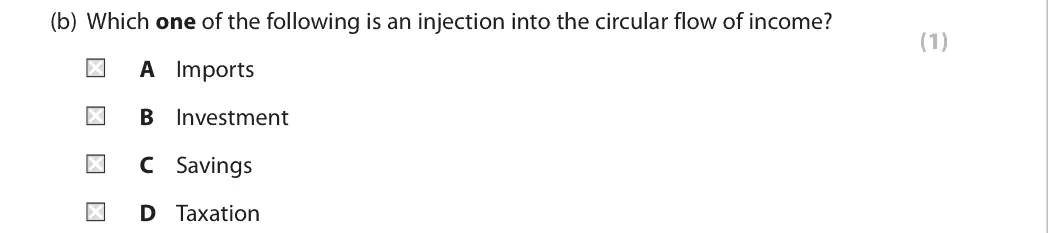
investment is an injection (B)
imports, savings and taxation are all withdrawals from the circular flow
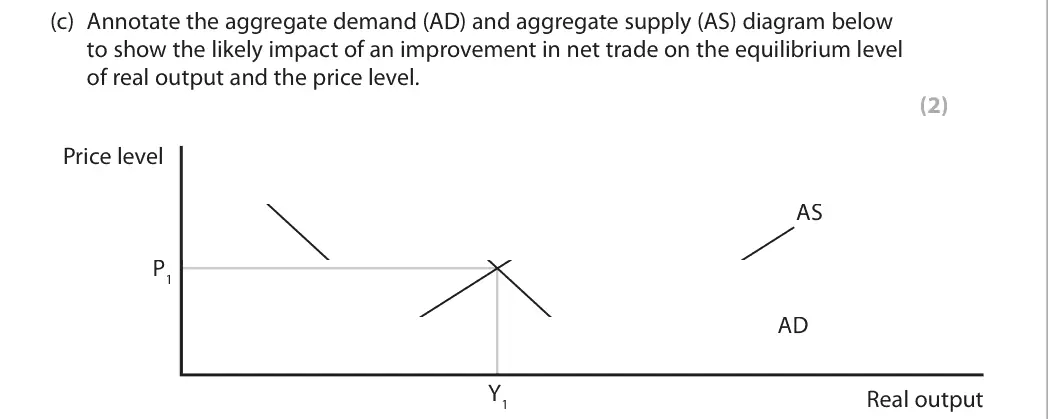
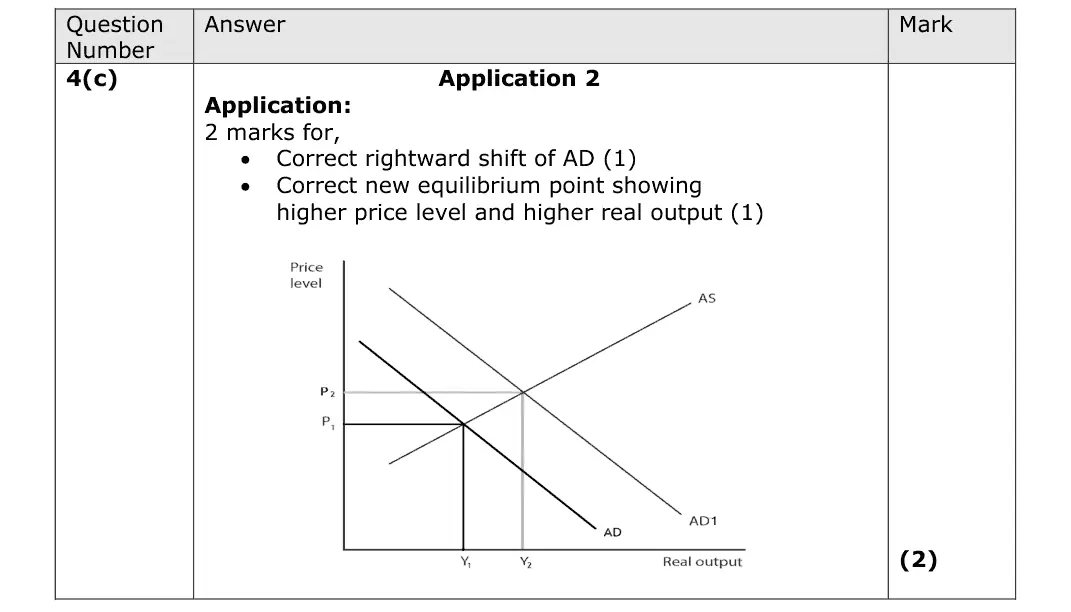
June 2022 · AS Paper 2 · Q4(c)2 marksAO2=2Diagram
Data and extracts for question 4
Mark scheme
Examiner's comment
This question requires candidates to show/draw the likely impact of an improvement in net trade in context of an AD/AS diagram. Marks were awarded as 1 mark for rightward shift in AD and 1 mark for a new equilibrium showing higher price level and higher real output. Most candidates achieved the 2 marks on this question.
Notes from the mark scheme and report
improved net trade shifts AD right
mark the new equilibrium with a higher price level and higher real output
Quantitative skills: QS 4 (construct and interpret a range of standard graphical forms)
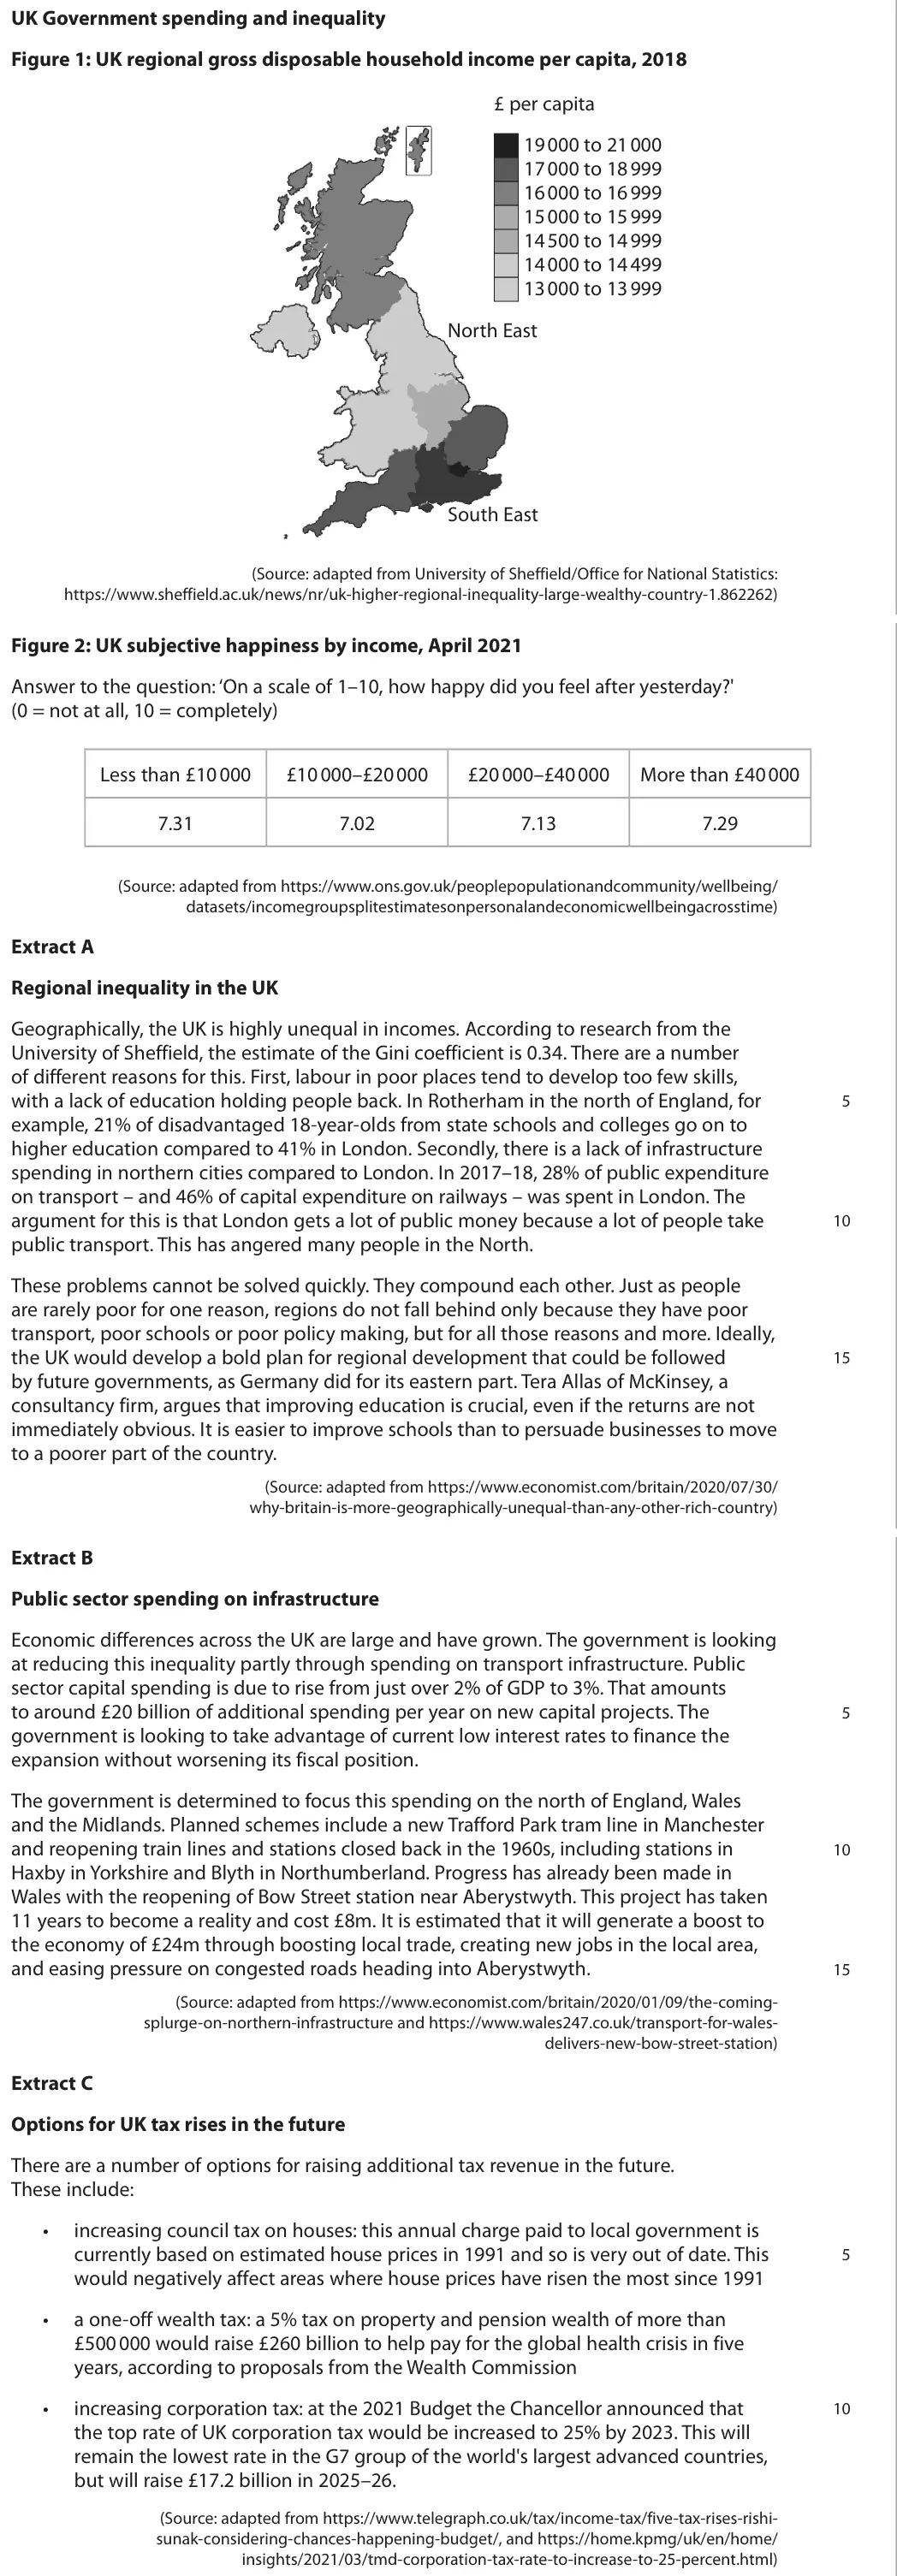
June 2022 · Paper 2 · Q6(e)15 marksAO1=3, AO2=3, AO3=3, AO4=615-mark response
Data and extracts for question 6
Mark scheme, including the levels grid and indicative content
Examiner's comment
In this question there are 9 marks for KAA and 6 marks for evaluation. The question specifies that candidates need to draw a diagram, which is a requirement in order to achieve highly at level 3 for KAA. Some of the better responses were able to clearly analyse and evaluate the benefits and downsides of increased spending on infrastructure. They also often used the information in the case study, such as the new station at Bow Street, to illustrate their argument. Evaluative arguments could discuss the significance of one small station or the long timespan of UK infrastructure projects. This is a response that was awarded 8 marks and achieved level 2 for KAA and level 1 for evaluation. The candidate knows the basics of the discussion provided in the answer but lacks a sufficiently detailed and step-by-step explanation to go beyond these levels. If a question asks you to draw a diagram, make sure you do so. However, the diagram alone is not enough to get you into the top levels of the marking criteria. This is an excellent answer which gained top level for both KAA and evaluation and was awarded 14 marks. The benefits are clearly discussed in terms of both aggregate demand and aggregate supply as well as the downsides. There is application and there is good use made of correctly drawn AD/AS diagrams. Remember to relate your answer to the real world by using the extract and/or your own knowledge.
Notes from the mark scheme and report
Level 3 KAA needs a correct AD/AS diagram (AD and/or LRAS shift right) and reference to Extract B (e.g. Bow Street station, £8m cost, £24m boost)
evaluate significance of small projects, time lags, opportunity cost, crowding out, national debt, size of the multiplier
Quantitative skills: QS 4 (construct and interpret a range of standard graphical forms)
June 2022 · Paper 3 · Q1(e)25 marksAO1=4, AO2=4, AO3=8, AO4=925-mark essayEither/or
Data and extracts for question 1
Mark scheme, including the levels grid and indicative content
Notes from the mark scheme and report
micro: minimum wage above equilibrium (a line below equilibrium has no effect) causes excess supply of labour, higher costs and lower profit margins for restaurants
macro: consumption and AD, cost-push inflation, less inequality and poverty
evaluate with elasticity of demand for labour and wage share of costs
avoid pre-learned essays
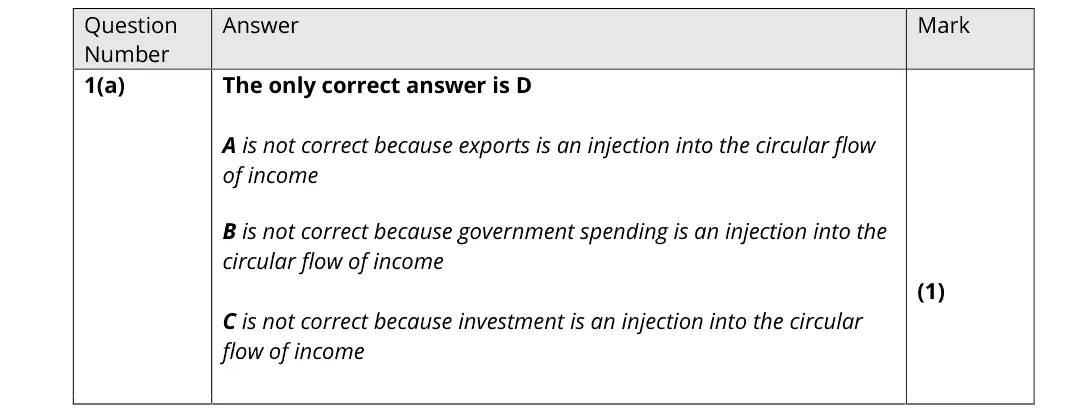
November 2021 · Paper 2 · Q1(a)1 markMultiple choice
Data and extracts for question 1
Answer
D
Mark scheme
Notes from the mark scheme and report
taxation is a withdrawal (D)
exports, government spending and investment are injections
November 2021 · Paper 2 · Q1(b)2 marksAO2=2Calculation
Data and extracts for question 1
Mark scheme
Notes from the mark scheme and report
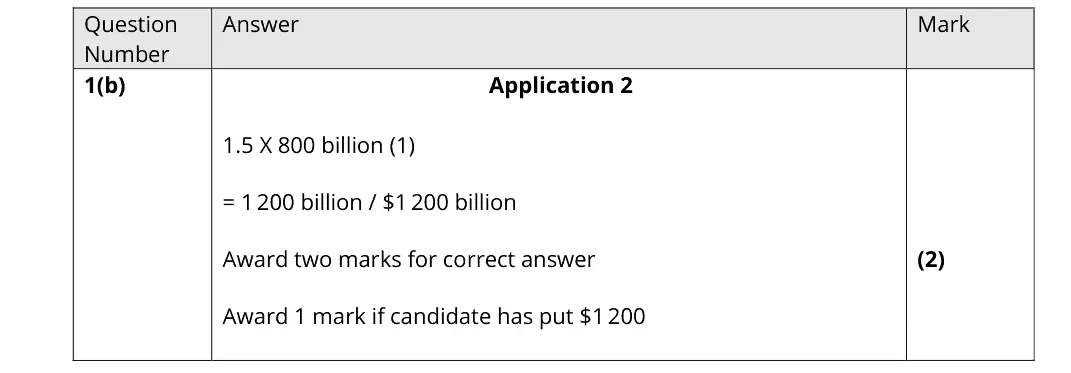
final increase in AD = multiplier x injection = 1.5 x $800bn = $1 200 billion
1 mark only if units are wrong ($1 200)
Quantitative skills: QS 1 (calculate, use and understand ratios and fractions)
November 2021 · Paper 2 · Q2(a)1 markMultiple choice
Answer
A
Mark scheme
Notes from the mark scheme and report
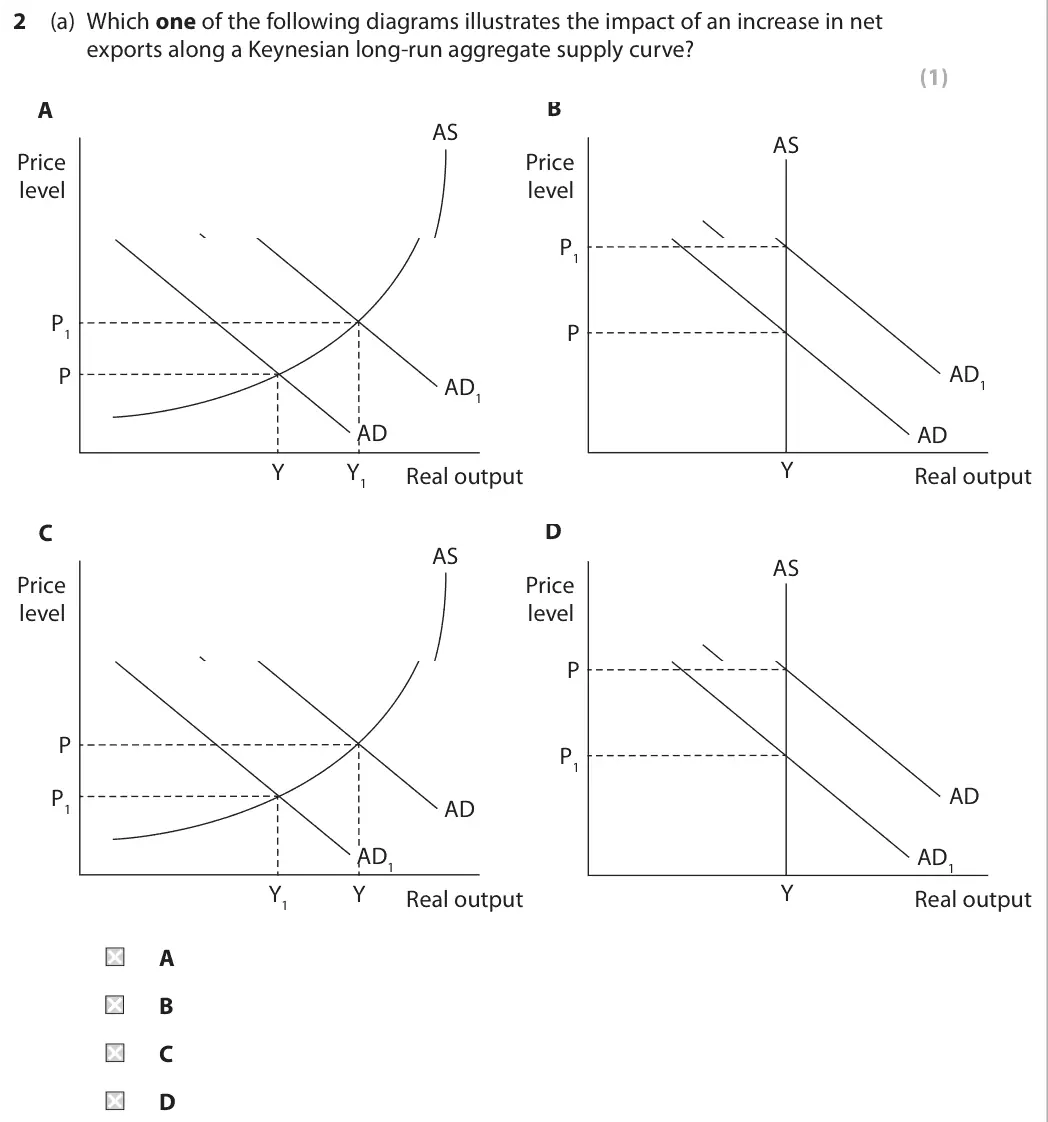
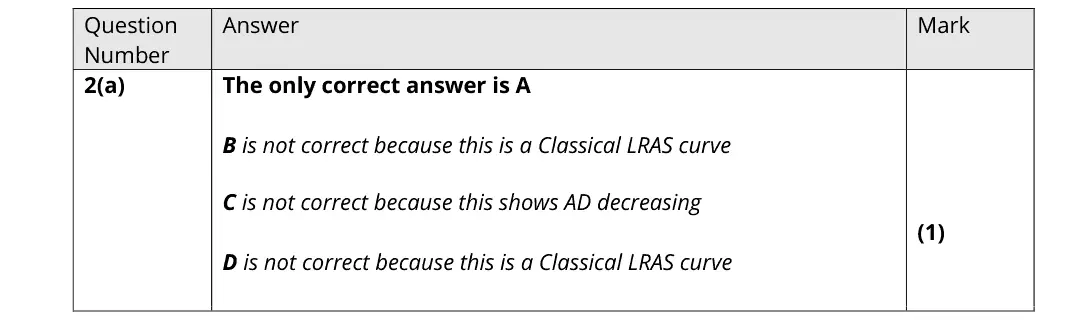
higher net exports shift AD right along a Keynesian LRAS, raising real output (and the price level near full capacity) (A)
B and D draw a classical vertical LRAS, C shows AD falling
Quantitative skills: QS 4 (construct and interpret a range of standard graphical forms)
October 2020 · Paper 2 · Q2(a)1 markMultiple choice
Data and extracts for question 2
Answer
C
Mark scheme
Examiner's comment
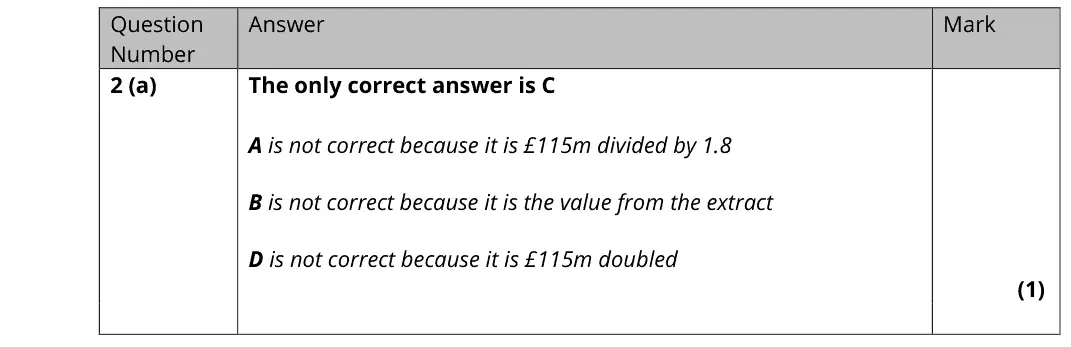
Question 2 was focused on the multiplier effect and whilst the majority of students could correctly answer the multiple-choice question, they found it harder to put the multiplier effect into words using the case study provided. Having said that, most students were able to demonstrate some understanding of what the multiplier process is and how it works. In question 3 students were asked to explain the role of the IMF in providing financial assistance. Similar to question 2, most students had some understanding of how the IMF could assist countries such as Argentina but some struggled to fully articulate it in order to achieve full marks. Having said that, there were some good answers that did this very effectively. Whilst the majority of students did correctly answer this multiple-choice question about capital flight and exchange rate systems, this multiple-choice question was the one students found hardest out of the 5. The first part of question 4 asks students to calculate the percentage change, and they scored significantly higher on this question compared to the calculation in question 1. In part b, most students could identify a relevant reason, and the majority were also able to earn the second mark for explaining their reason.
Notes from the mark scheme and report
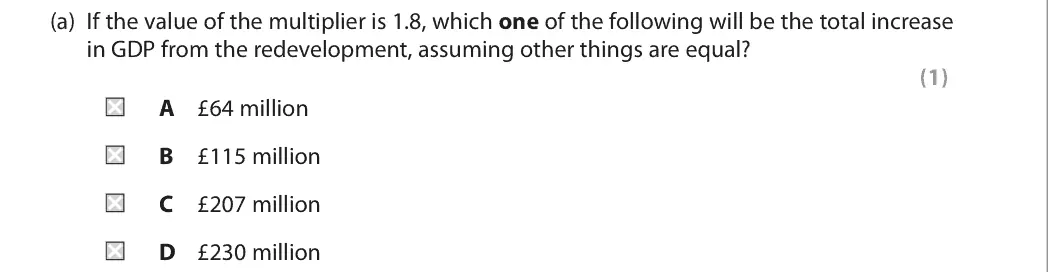
final increase = multiplier x injection = 1.8 x £115m = £207m (C)
A divides by 1.8, B is just the initial £115m, D doubles it
Quantitative skills: QS 9 (interpret, apply and analyse information in written, graphical tabular and numerical forms)
October 2020 · Paper 2 · Q2(b)4 marksAO1=2, AO2=1, AO3=1Short answer
Data and extracts for question 2
Mark scheme
Examiner's comment
Question 2 was focused on the multiplier effect and whilst the majority of students could correctly answer the multiple-choice question, they found it harder to put the multiplier effect into words using the case study provided. Having said that, most students were able to demonstrate some understanding of what the multiplier process is and how it works. In question 3 students were asked to explain the role of the IMF in providing financial assistance. Similar to question 2, most students had some understanding of how the IMF could assist countries such as Argentina but some struggled to fully articulate it in order to achieve full marks. Having said that, there were some good answers that did this very effectively. Whilst the majority of students did correctly answer this multiple-choice question about capital flight and exchange rate systems, this multiple-choice question was the one students found hardest out of the 5. The first part of question 4 asks students to calculate the percentage change, and they scored significantly higher on this question compared to the calculation in question 1. In part b, most students could identify a relevant reason, and the majority were also able to earn the second mark for explaining their reason.
Notes from the mark scheme and report
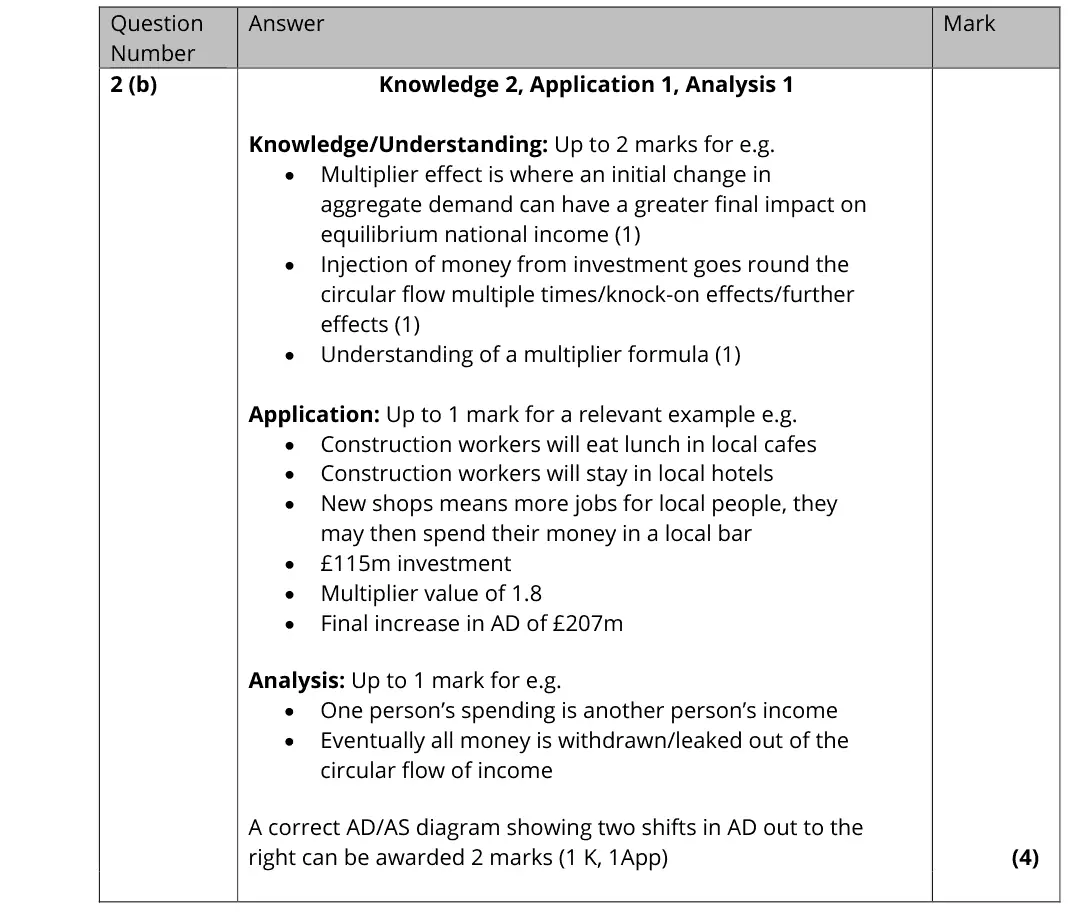
initial injection passes round the circular flow: one person's spending is another's income
apply to Dover (construction workers spending in local cafés, new jobs, £115m x 1.8 = £207m)
a diagram with two rightward AD shifts can earn 2
report: many found it hard to put the multiplier process into words
October 2020 · AS Paper 2 · Q4(b)2 marksAO2=2Diagram
Data and extracts for question 4
Mark scheme
Examiner's comment
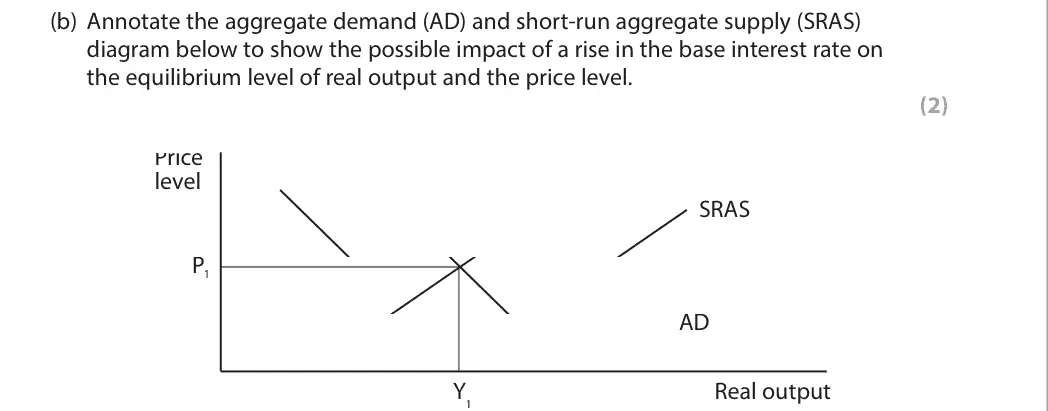
This question requires candidates to draw the likely impact of a rise in the base interest rate in context of an AD/AS diagram. Marks were awarded as 1 mark for the leftward shift in AD/SRAS and 1 mark for a new equilibrium. Most candidates achieved the 2 marks on this question.
Notes from the mark scheme and report
shift AD left (a SRAS shift is also accepted) and mark the new equilibrium with lower real output and price level
Quantitative skills: QS 4 (construct and interpret a range of standard graphical forms)
October 2020 · Paper 2 · Q5(a)4 marksAO1=2, AO2=2Diagram
Data and extracts for question 5
Mark scheme
Examiner's comment
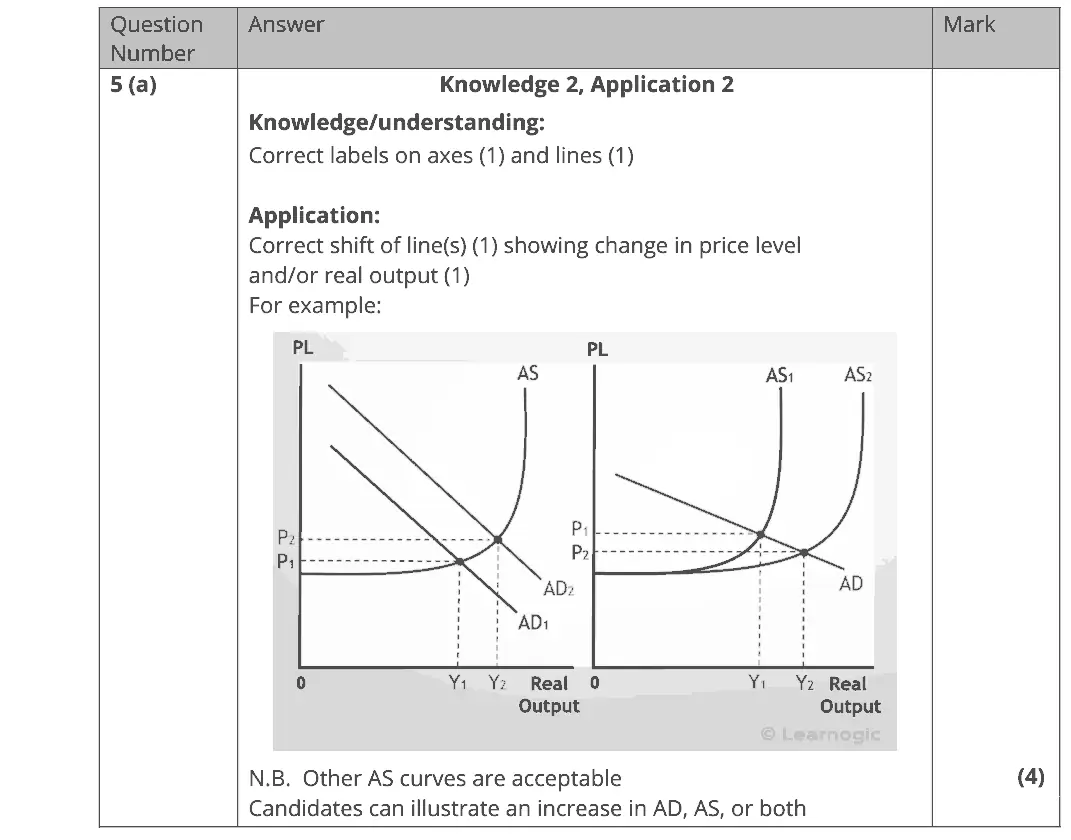
Question 5 consists mainly of a draw question, and the vast majority of students demonstrated a very good understanding of what an AD/AS diagram should look like, and what should be happening on it in this case study- i.e. an increase in either aggregate supply and/or aggregate demand. Section B, the data response section, is based on information provided in the exam paper about trade and development issues in Africa. This includes 2 figures and 2 extracts on different issues.
Notes from the mark scheme and report
labels on axes (price level, real output) and curves for 2 marks
government-funded infrastructure can shift AD right, LRAS right or both
show the new price level and real output
Quantitative skills: QS 4 (construct and interpret a range of standard graphical forms)
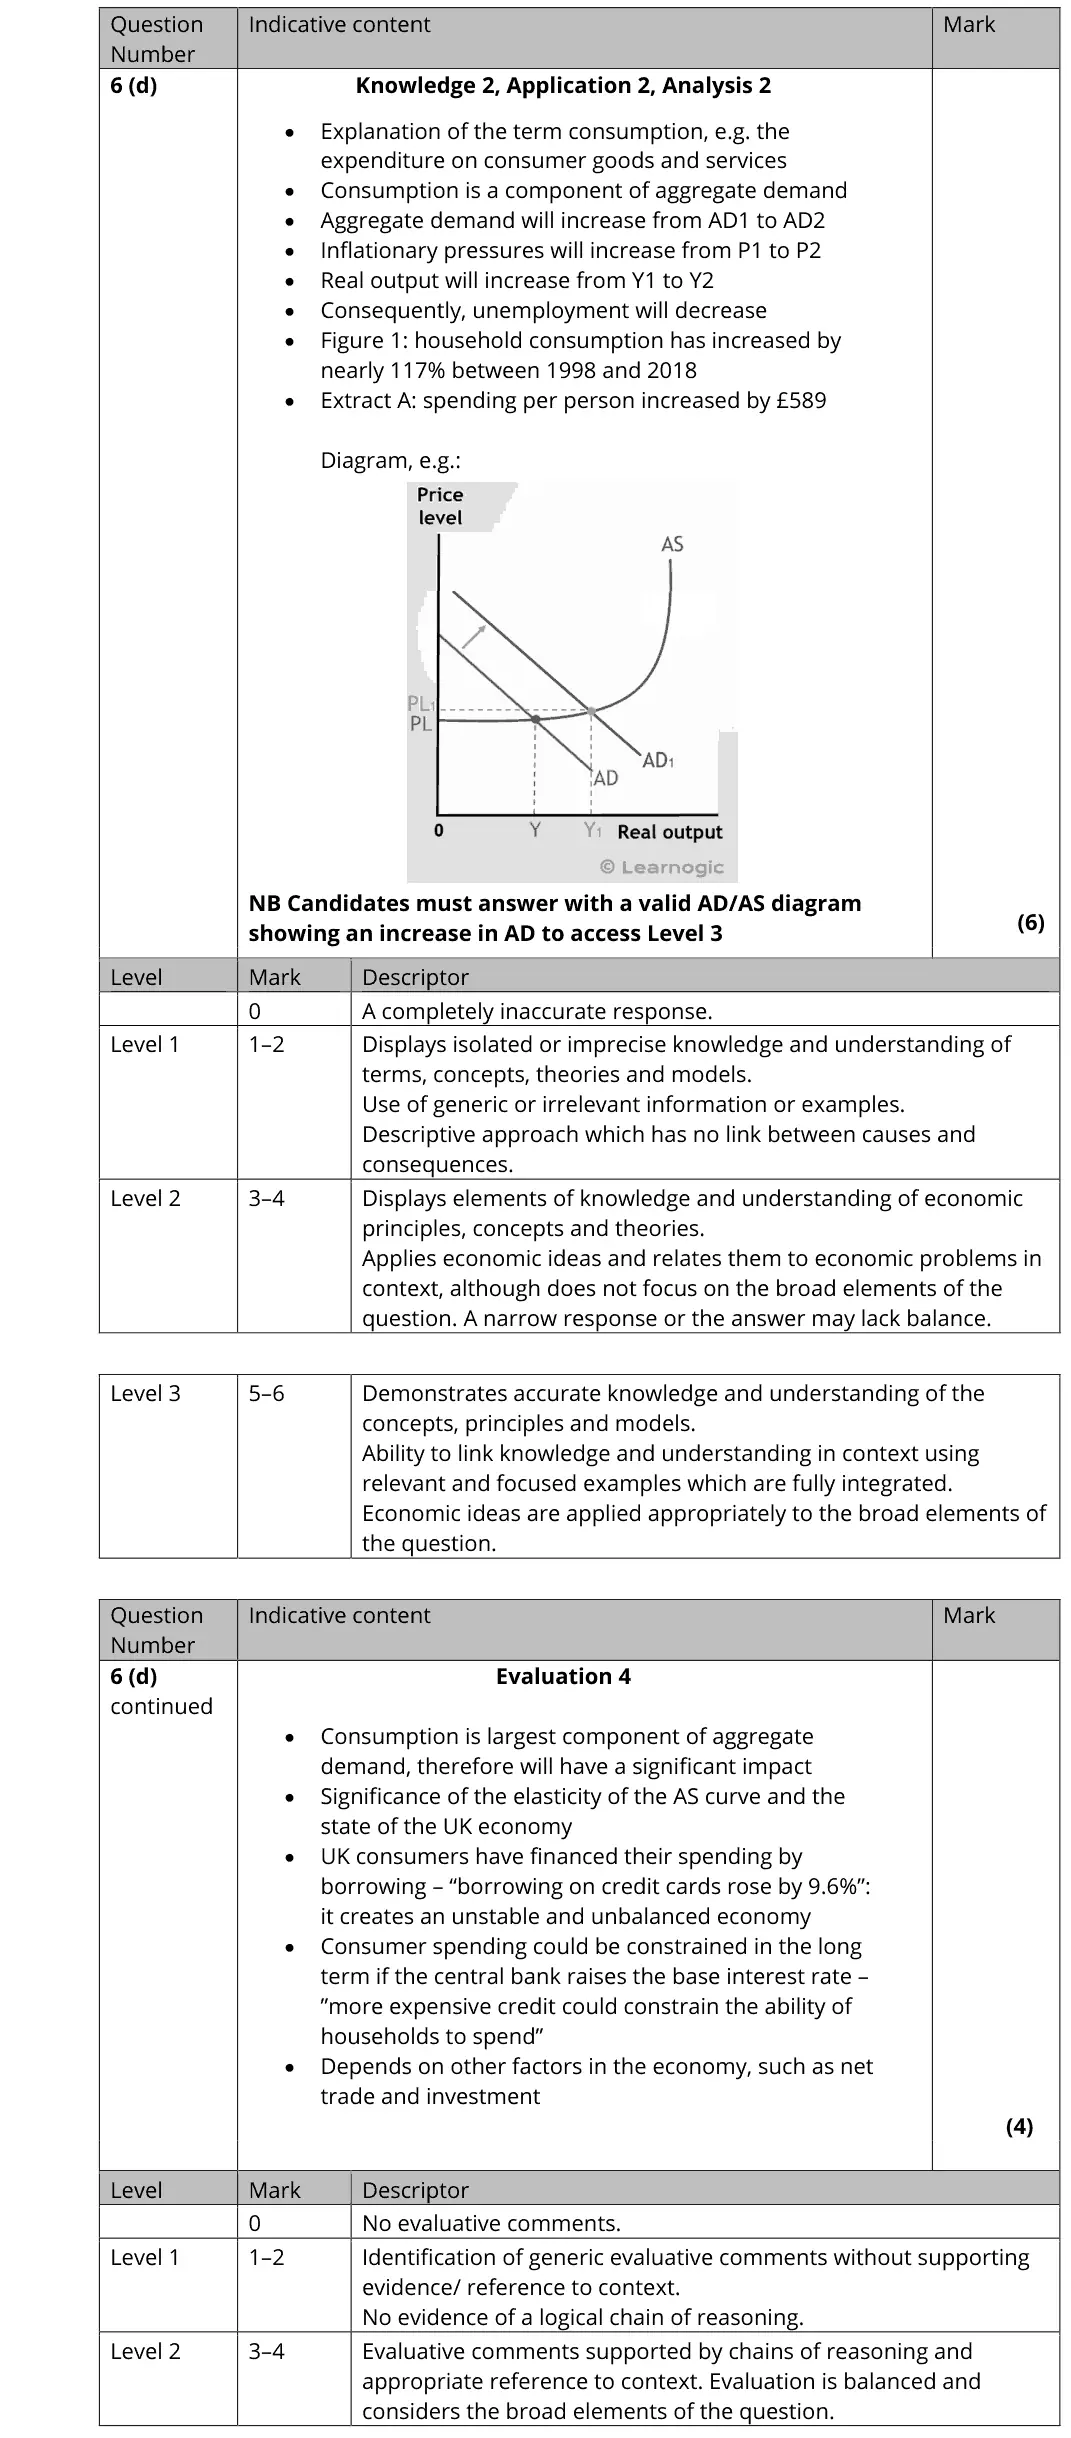
October 2020 · AS Paper 2 · Q6(d)10 marksAO1=2, AO2=2, AO3=2, AO4=410-mark response
Data and extracts for question 6
Mark scheme, including the levels grid and indicative content
Examiner's comment
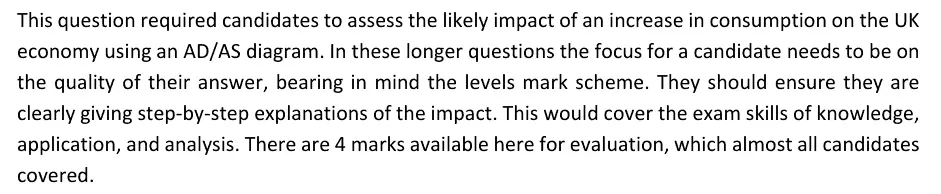
This question required candidates to assess the likely impact of an increase in consumption on the UK economy using an AD/AS diagram. In these longer questions the focus for a candidate needs to be on the quality of their answer, bearing in mind the levels mark scheme. They should ensure they are clearly giving step-by-step explanations of the impact. This would cover the exam skills of knowledge, application, and analysis. There are 4 marks available here for evaluation, which almost all candidates covered.
Notes from the mark scheme and report
Level 3 needs a valid AD/AS diagram with AD shifting right (higher real output and price level, lower unemployment)
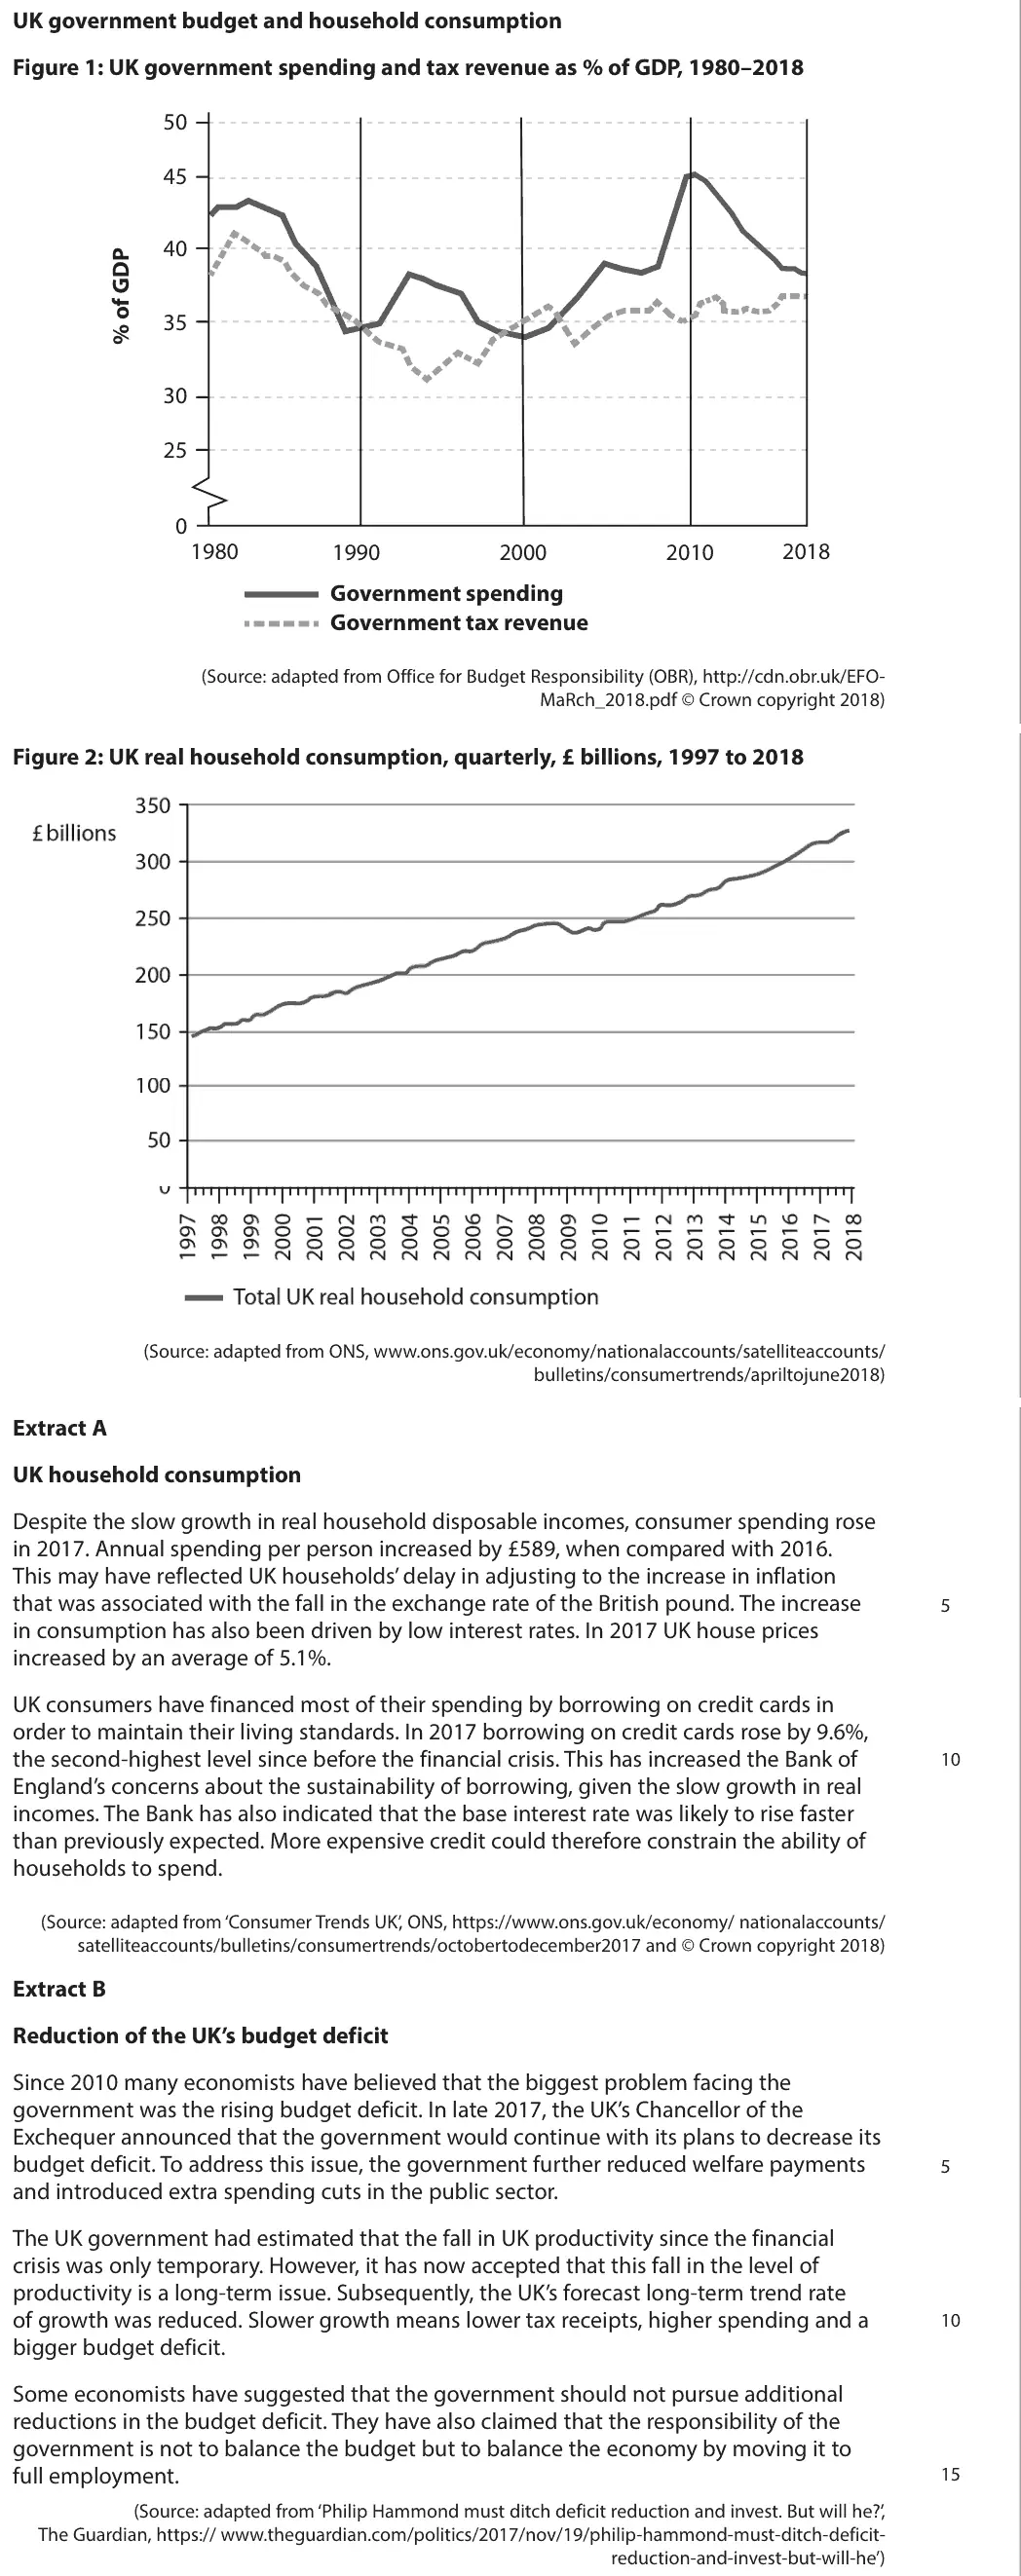
evaluate with spare capacity, debt-financed spending (credit card borrowing up 9.6%), rising interest rates, imports
Quantitative skills: QS 4 (construct and interpret a range of standard graphical forms)
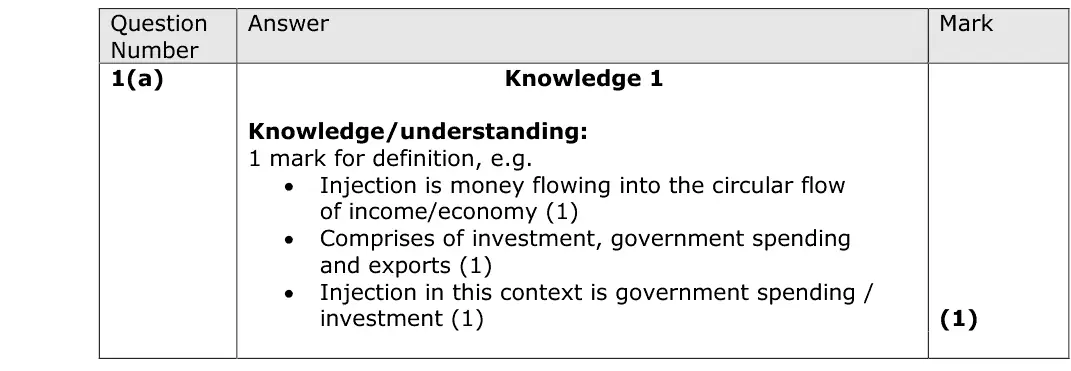
June 2019 · AS Paper 2 · Q1(a)1 markAO1=1Definition
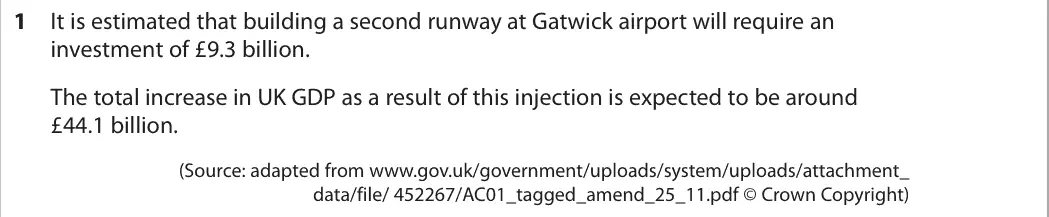
Data and extracts for question 1
Mark scheme
Examiner's comment
This question requires a short but precise definition of injection. It is important that candidates are clear in their answers. Candidates could access marks through a range of approaches.
Notes from the mark scheme and report
money entering the circular flow of income (investment, government spending, exports)
in this context the £9.3 billion runway investment
June 2019 · AS Paper 2 · Q1(b)2 marksAO2=2Calculation
Data and extracts for question 1
Mark scheme
Examiner's comment
This is a multiplier calculation question that candidates were able to answer relatively easily, and the majority were able to do this. Candidates also need to be careful to read the question and the data carefully, as some candidates lost marks because they didn’t understand the requirements of the question.
Notes from the mark scheme and report
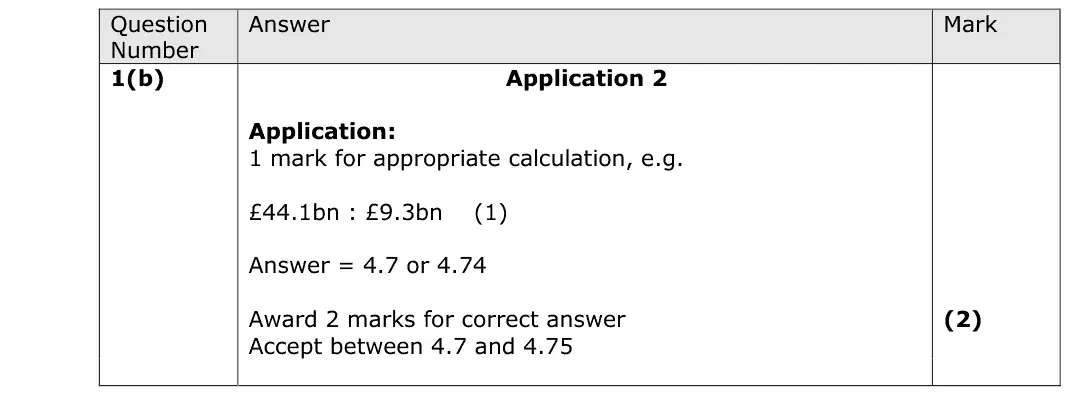
multiplier = change in GDP / injection = £44.1bn / £9.3bn = 4.74
report: some misread what the question required
Quantitative skills: QS 1 (calculate, use and understand ratios and fractions)
June 2019 · AS Paper 2 · Q1(c)1 markMultiple choice
Data and extracts for question 1
Answer
D
Mark scheme
Notes from the mark scheme and report
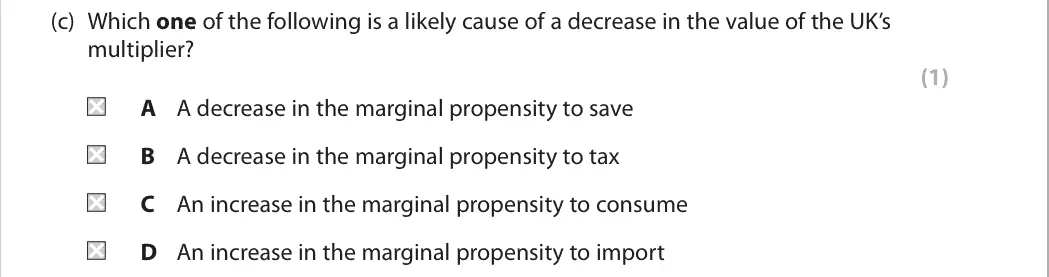
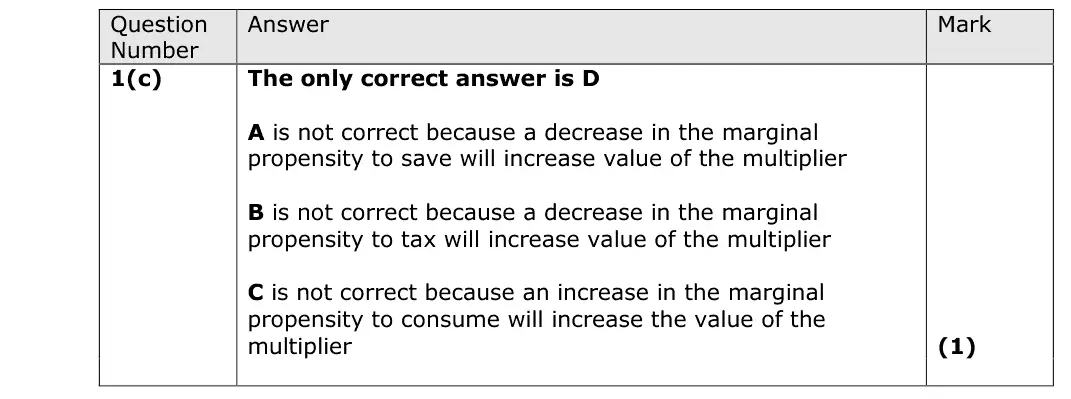
a higher MPM raises the leakages (MPW) so the multiplier 1/MPW falls (D)
A, B and C each raise the multiplier
June 2019 · Paper 2 · Q2(a)4 marksAO1=2, AO2=2Diagram
Data and extracts for question 2
Mark scheme
Examiner's comment
This question was generally answered well, with many candidates able to accurately draw a diagram showing either AD or AS increasing, or both. The main reason for candidates scoring 3/4 marks as opposed to 4/4 marks was labelling the vertical axis as price rather than price level. This answer scores the full 4 marks - it clearly shows AS shifting out to the right and the resultant effect on price level and real output. Everything is also correctly labelled - all axes and lines. There is no need to write anything for these questions - just draw the diagram. This answer also scores 4/4 marks. This time the candidate has shifted out AD, showing an increase in price level and real GDP. Again everything is correctly labelled.
Notes from the mark scheme and report
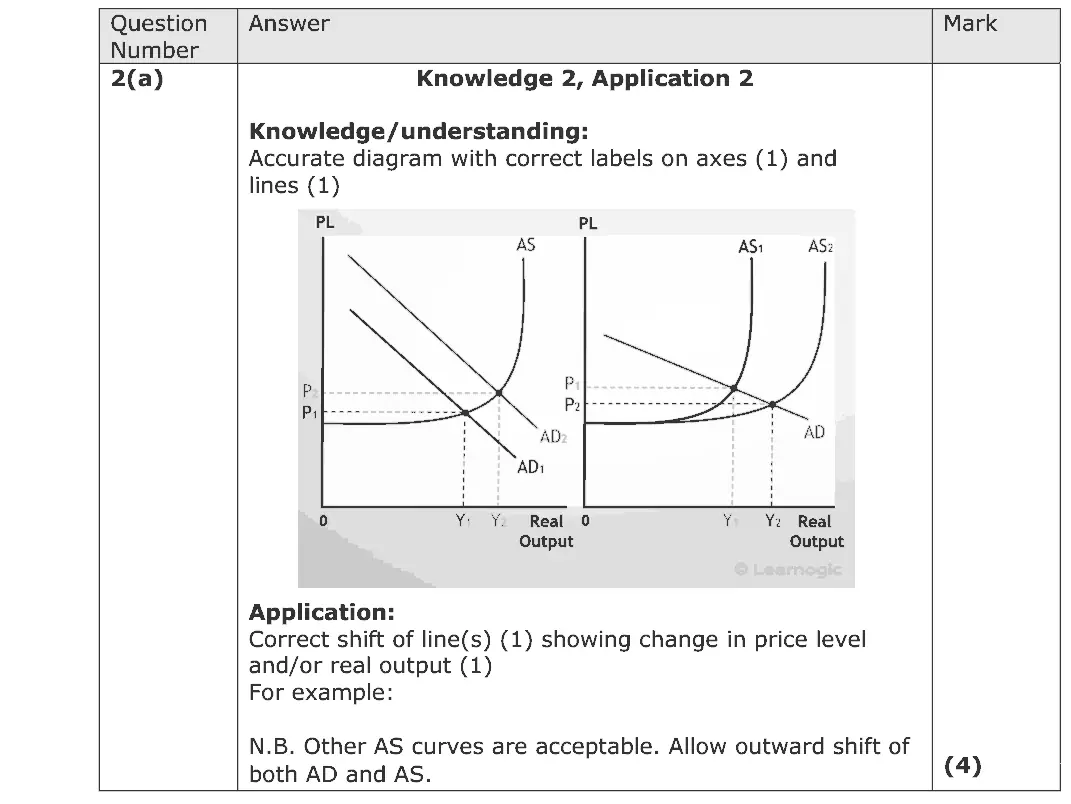
AD shifts right (and/or LRAS shifts right) with new price level and real output marked
the usual lost mark was labelling the vertical axis 'price' not 'price level'
no writing needed
Quantitative skills: QS 4 (construct and interpret a range of standard graphical forms)
June 2019 · AS Paper 2 · Q4(b)2 marksAO2=2Diagram
Data and extracts for question 4
Mark scheme
Examiner's comment
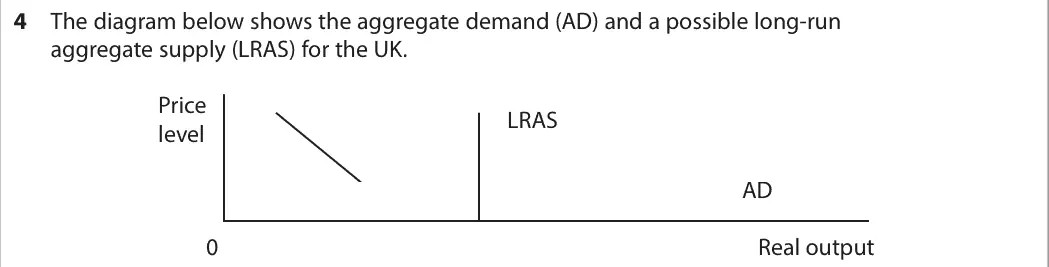
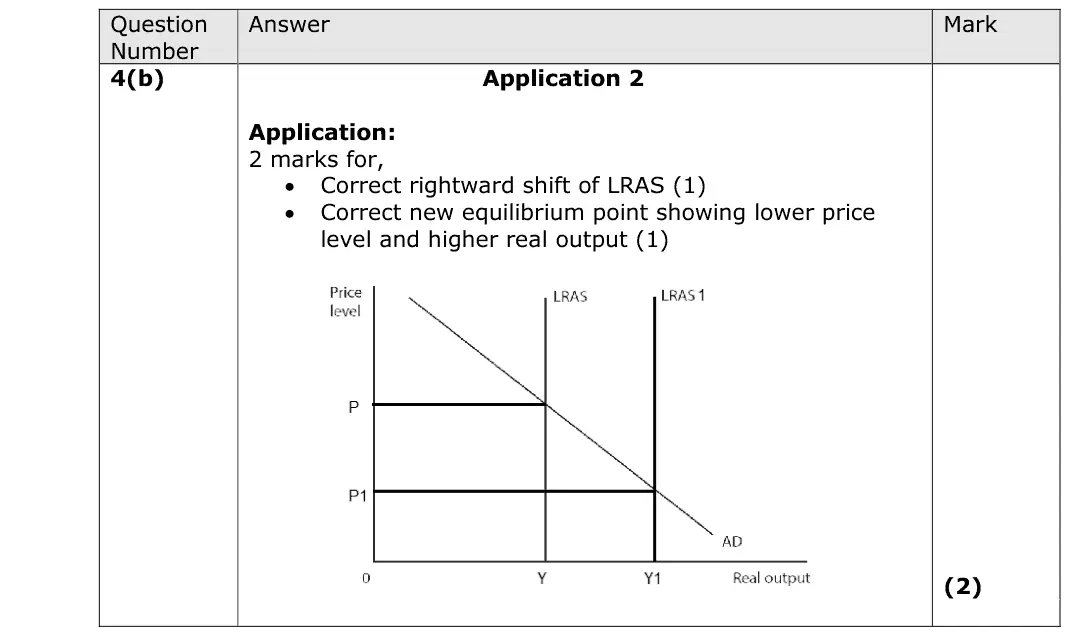
This question requires candidates to draw the likely impact of government policy to promote business competition in context of an AD/AS diagram. Marks were awarded as 1 mark for the rightward shift in LRAS and 1 mark for a new equilibrium showing lower price level and higher real output. Most candidates achieved the 2 marks on this question.
Notes from the mark scheme and report
competition policy shifts LRAS right
the new equilibrium has a lower price level and higher real output
Quantitative skills: QS 4 (construct and interpret a range of standard graphical forms)
June 2019 · Paper 2 · Q5(a)2 marksAO1=2Short answer
Data and extracts for question 5
Mark scheme
Examiner's comment
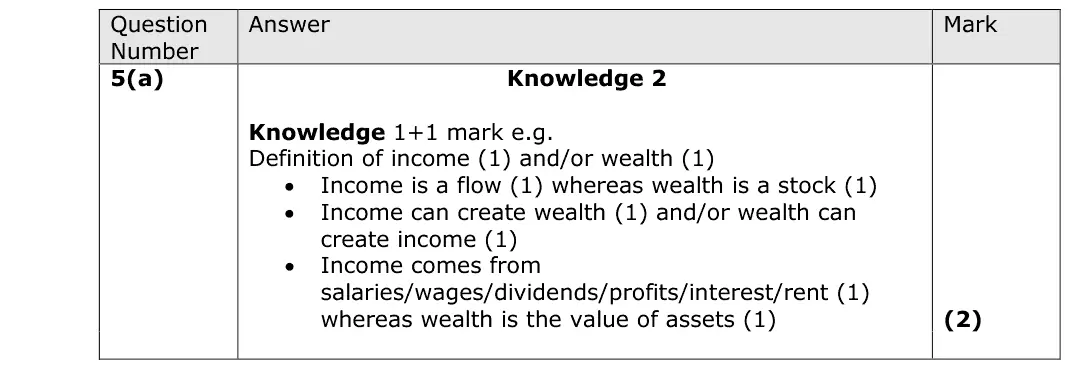
This question was answered well, with most candidates able to distinguish between the two - for example referring to income as a flow whereas wealth is a stock. Many candidates also described income as earnings/salary or similar and wealth as assets or similar. This is a clear and straightforward full marks answer, with a clear explanation of both income and wealth. This answer also scores 2/2 marks for accurate explanations of income and wealth. You will notice that this answer is longer than the previous one - however it will still only get the maximum 2 marks. Candidates need to avoid wasting time doing things like providing application (as in this example) when they haven't been asked to. The last sentence here isn't answering the question and so it doesn't gain the candidate any marks.
Notes from the mark scheme and report
income is a flow (wages, rent, interest, profits), wealth is a stock of assets
no application needed
June 2019 · AS Paper 2 · Q6(d)10 marksAO1=2, AO2=2, AO3=2, AO4=410-mark response
Data and extracts for question 6
Mark scheme, including the levels grid and indicative content
Examiner's comment
This question required candidates to assess the likely impact of the change in the value of exports, on the economic growth of the UK using an AD/AS diagram. In these longer questions the focus for a candidate needs to be on the quality of their answer, bearing in mind the levels mark scheme. They should ensure they are clearly giving step-by-step explanations of the impact. This would cover the exam skills of knowledge, application, and analysis. There are 4 marks available here for evaluation.
Notes from the mark scheme and report
Level 3 needs an accurate AD/AS diagram with AD shifting right
exports rose from about £43bn to £50bn a month after the 2016 depreciation, an injection with multiplier effects raising real GDP
evaluate with import content, spare capacity and size relative to GDP
Quantitative skills: QS 4 (construct and interpret a range of standard graphical forms); QS 9 (interpret, apply and analyse information in written, graphical tabular and numerical forms)
June 2018 · Paper 2 · Q2(b)4 marksAO1=2, AO2=2Diagram
Mark scheme
Examiner's comment
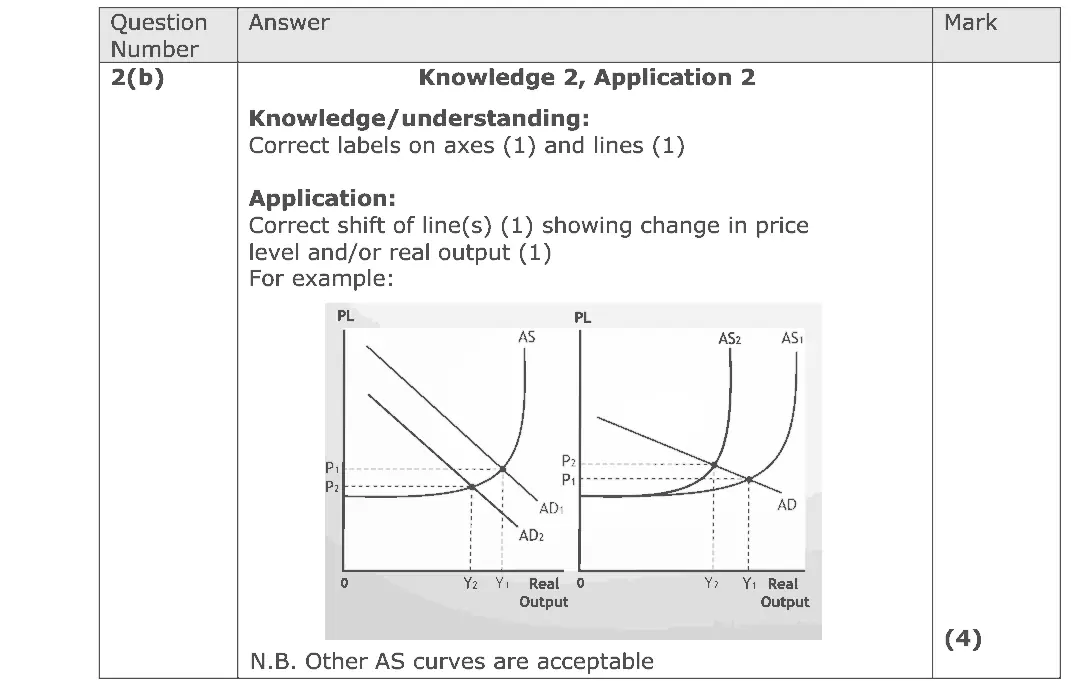
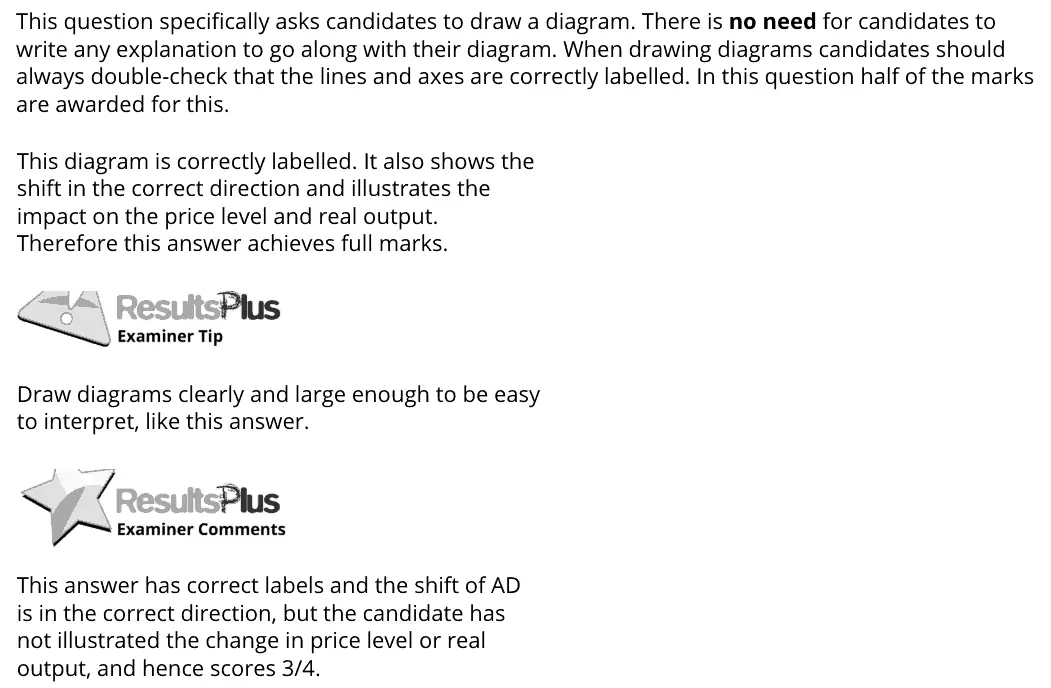
This question specifically asks candidates to draw a diagram. There is no need for candidates to write any explanation to go along with their diagram. When drawing diagrams candidates should always double-check that the lines and axes are correctly labelled. In this question half of the marks are awarded for this. This diagram is correctly labelled. It also shows the shift in the correct direction and illustrates the impact on the price level and real output. Therefore this answer achieves full marks. Draw diagrams clearly and large enough to be easy to interpret, like this answer. This answer has correct labels and the shift of AD is in the correct direction, but the candidate has not illustrated the change in price level or real output, and hence scores 3/4.
Notes from the mark scheme and report
half the marks are for labels on axes (PL, real output) and curves
shift AD left and show the fall in price level and/or real output
showing the shift without marking the new PL or Y scored 3 of 4
no written explanation needed
Quantitative skills: QS 4 (construct and interpret a range of standard graphical forms)
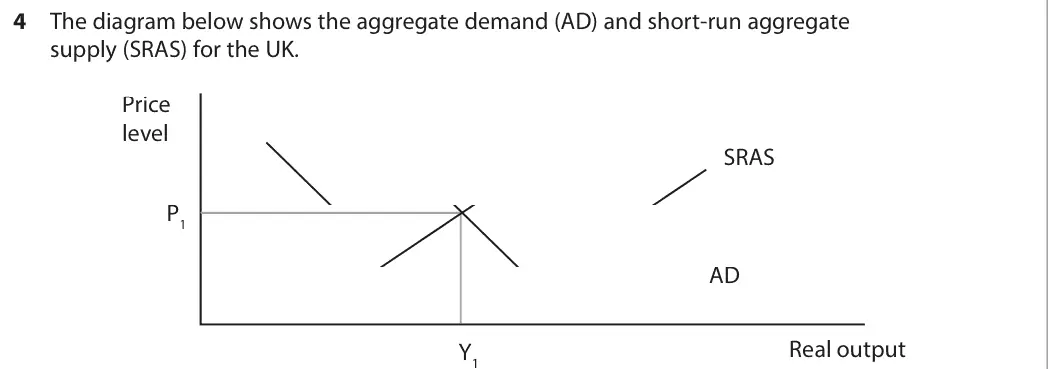
June 2018 · AS Paper 2 · Q4(b)2 marksAO2=2Diagram
Data and extracts for question 4
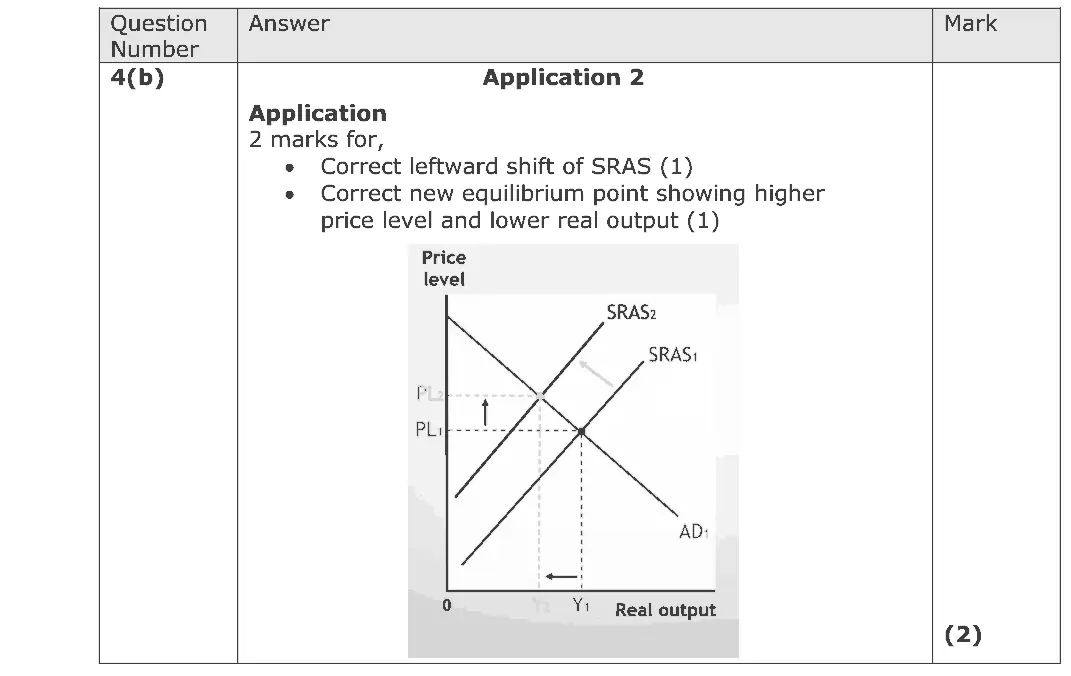
Mark scheme
Examiner's comment
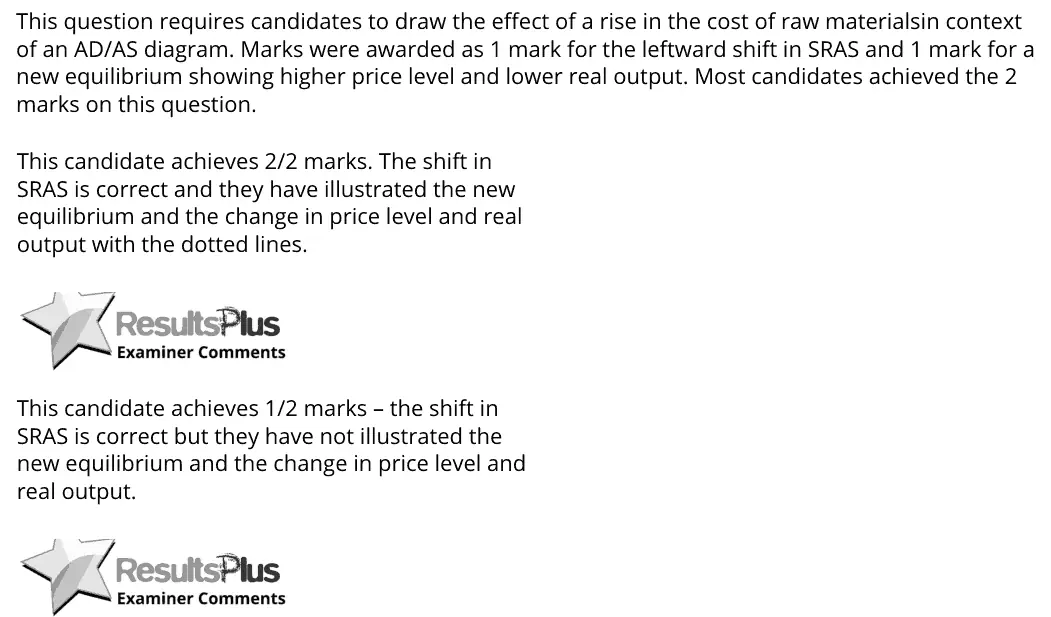
This question requires candidates to draw the effect of a rise in the cost of raw materialsin context of an AD/AS diagram. Marks were awarded as 1 mark for the leftward shift in SRAS and 1 mark for a new equilibrium showing higher price level and lower real output. Most candidates achieved the 2 marks on this question. This candidate achieves 2/2 marks. The shift in SRAS is correct and they have illustrated the new equilibrium and the change in price level and real output with the dotted lines. This candidate achieves 1/2 marks – the shift in SRAS is correct but they have not illustrated the new equilibrium and the change in price level and real output.
Notes from the mark scheme and report
shift SRAS left and mark the new equilibrium with a higher price level and lower real output
missing the new equilibrium loses a mark
Quantitative skills: QS 4 (construct and interpret a range of standard graphical forms)
June 2018 · AS Paper 2 · Q6(b)10 marksAO1=2, AO2=2, AO3=2, AO4=410-mark response
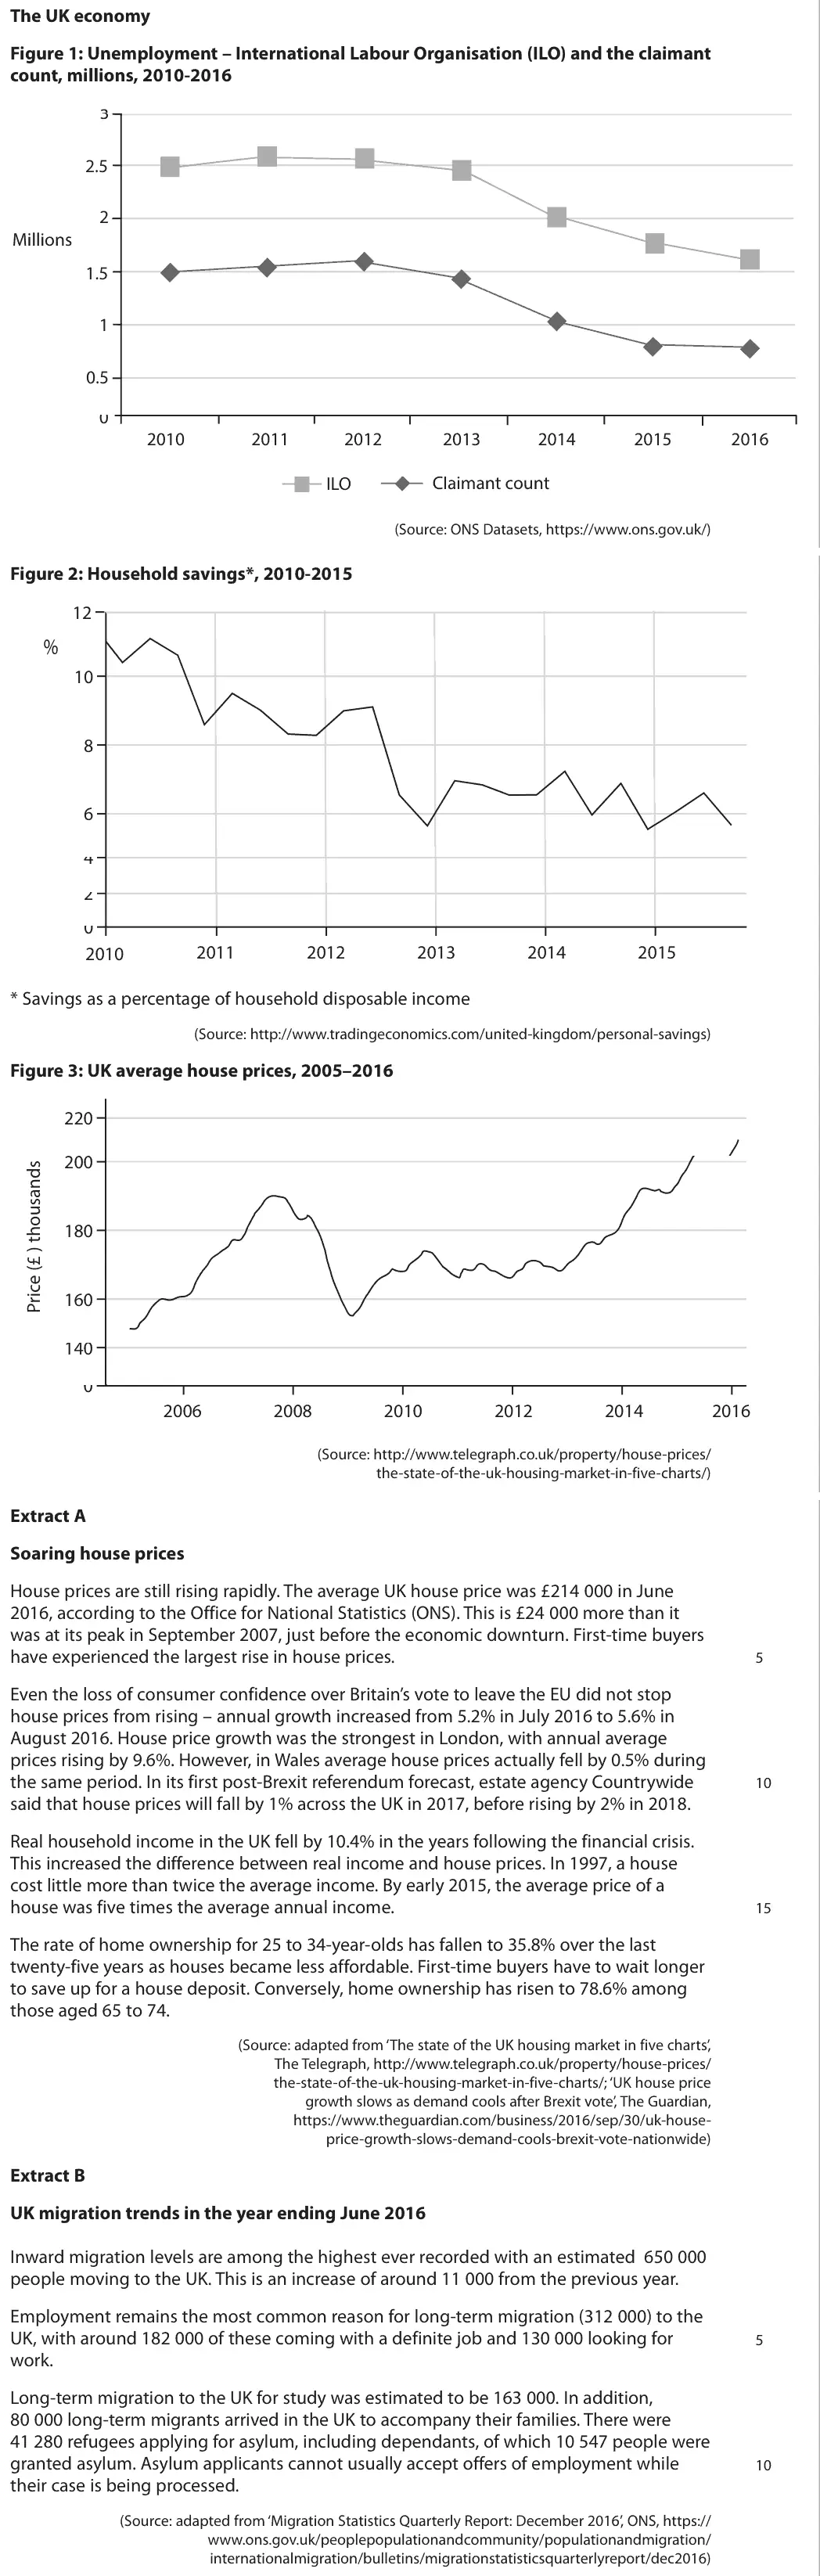
Data and extracts for question 6
Mark scheme, including the levels grid and indicative content
Examiner's comment
This question required candidates to assess the likely macroeconomic effects of increase in house prices using an AD/AS diagram. In these longer questions the focus for a candidate needs to be on the quality of their answer, bearing in mind the levels mark scheme. They should ensure they are clearly giving step-by-step explanations for their reasons. This would cover the exam skills of knowledge, application, and analysis (KAA). There are also 4 marks available here for evaluation. Popular comments revolved around the wealth effect for existing home owners and the effect on inflation, coupled with the impact on first time buyers as evaluation. This is a more able response, scoring the full 10 marks. It clearly and logically explains different effects of an increase in house prices and also offers two relevant evaluations of these points. The candidate uses the data from the extract to support their arguments. This answer scores 3 marks in total. There is no evaluation and so the highest mark possible is 6/10 marks. In terms of KAA, only one relevant point has been explained - government spending on helping people to buy homes. This however could have been further developed and hence only fits with the criteria for Level 2. Keep the levels in mind – in this case you are aiming for KAA Level 3 and Evaluation Level 2.
Notes from the mark scheme and report
wealth effect and confidence raise consumption, AD shifts right, higher real output and price level
Level 3 needs an accurate AD/AS diagram
evaluate with first-time buyers, regional differences, size of the effect, falling real incomes
Quantitative skills: QS 4 (construct and interpret a range of standard graphical forms)
June 2018 · AS Paper 2 · Q6(d)6 marksAO1=2, AO2=2, AO3=2Short answer
Data and extracts for question 6
Mark scheme
Examiner's comment
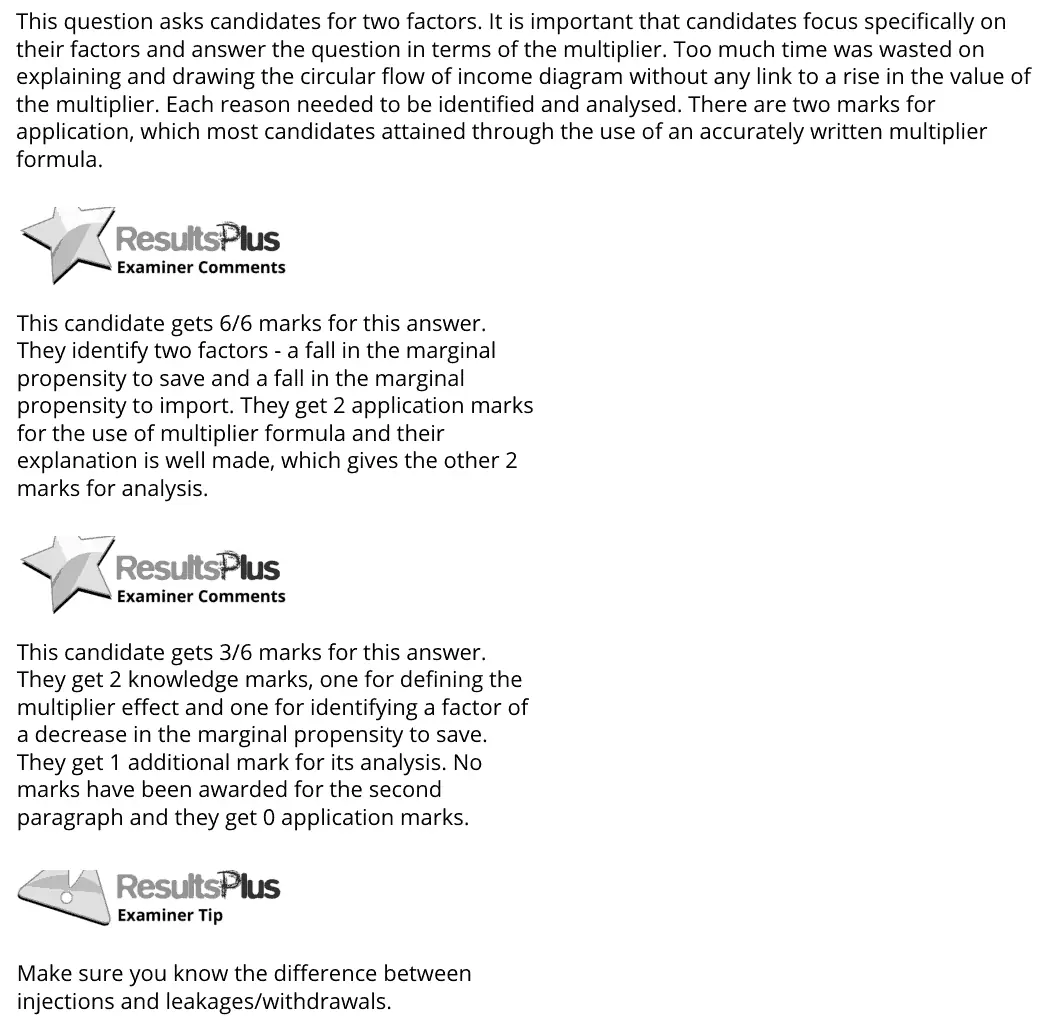
This question asks candidates for two factors. It is important that candidates focus specifically on their factors and answer the question in terms of the multiplier. Too much time was wasted on explaining and drawing the circular flow of income diagram without any link to a rise in the value of the multiplier. Each reason needed to be identified and analysed. There are two marks for application, which most candidates attained through the use of an accurately written multiplier formula. This candidate gets 6/6 marks for this answer. They identify two factors - a fall in the marginal propensity to save and a fall in the marginal propensity to import. They get 2 application marks for the use of multiplier formula and their explanation is well made, which gives the other 2 marks for analysis. This candidate gets 3/6 marks for this answer. They get 2 knowledge marks, one for defining the multiplier effect and one for identifying a factor of a decrease in the marginal propensity to save. They get 1 additional mark for its analysis. No marks have been awarded for the second paragraph and they get 0 application marks. Make sure you know the difference between injections and leakages/withdrawals.
Notes from the mark scheme and report
two factors (fall in mps, mpt or mpm, i.e. fewer withdrawals) each analysed
multiplier formula or Figure 2 savings data for application
drawing the circular flow without linking to the multiplier wasted time
Quantitative skills: QS 1 (calculate, use and understand ratios and fractions); QS 9 (interpret, apply and analyse information in written, graphical tabular and numerical forms)
June 2018 · Paper 2 · Q725 marksAO1=4, AO2=4, AO3=8, AO4=925-mark essayEither/or
Mark scheme, including the levels grid and indicative content
Examiner's comment
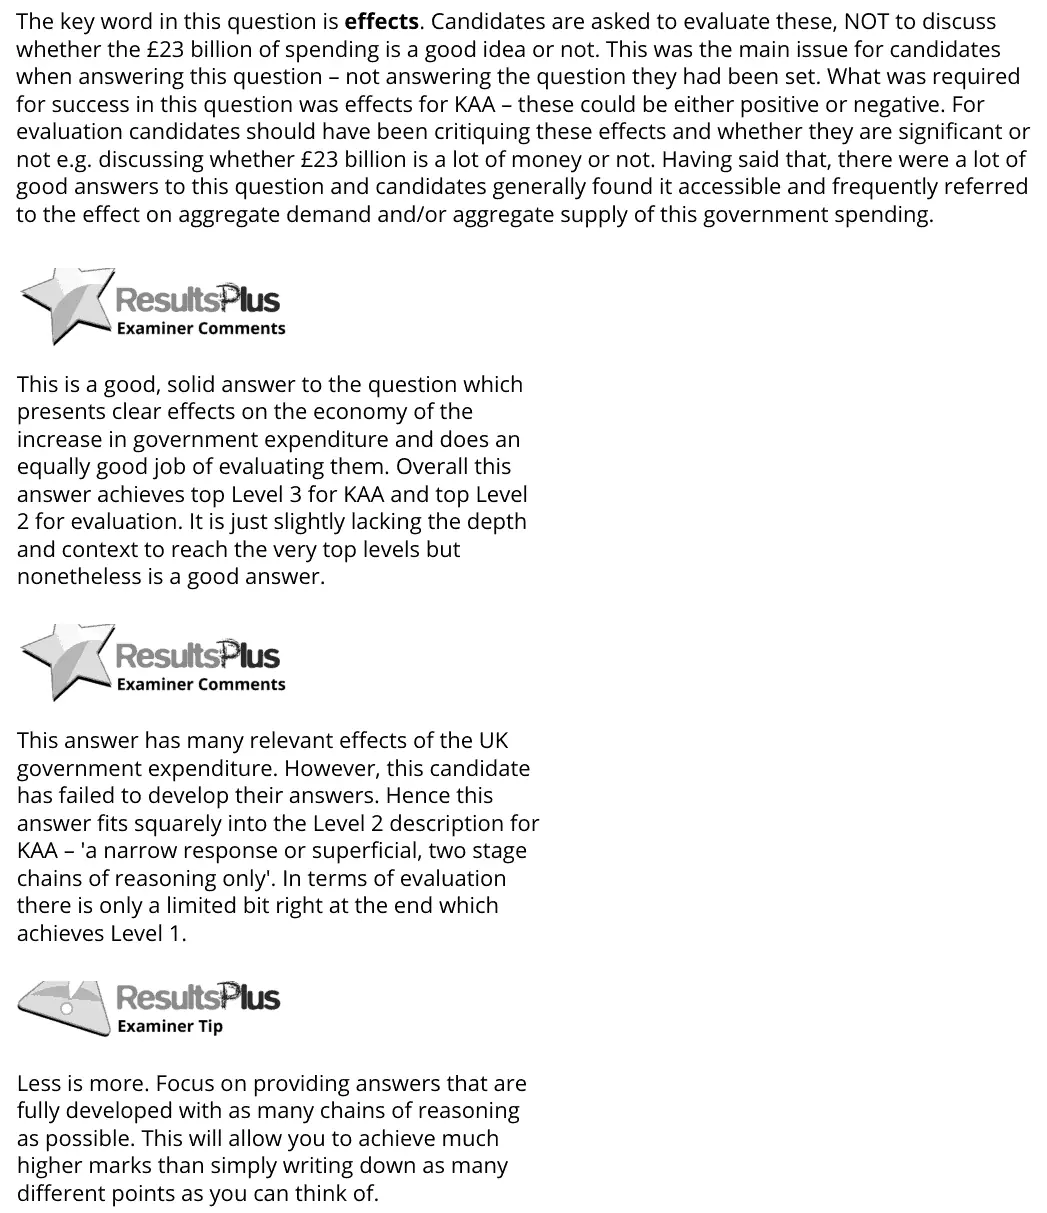
The key word in this question is effects. Candidates are asked to evaluate these, NOT to discuss whether the £23 billion of spending is a good idea or not. This was the main issue for candidates when answering this question – not answering the question they had been set. What was required for success in this question was effects for KAA – these could be either positive or negative. For evaluation candidates should have been critiquing these effects and whether they are significant or not e.g. discussing whether £23 billion is a lot of money or not. Having said that, there were a lot of good answers to this question and candidates generally found it accessible and frequently referred to the effect on aggregate demand and/or aggregate supply of this government spending. This is a good, solid answer to the question which presents clear effects on the economy of the increase in government expenditure and does an equally good job of evaluating them. Overall this answer achieves top Level 3 for KAA and top Level 2 for evaluation. It is just slightly lacking the depth and context to reach the very top levels but nonetheless is a good answer. This answer has many relevant effects of the UK government expenditure. However, this candidate has failed to develop their answers. Hence this answer fits squarely into the Level 2 description for KAA – 'a narrow response or superficial, two stage chains of reasoning only'. In terms of evaluation there is only a limited bit right at the end which achieves Level 1. Less is more. Focus on providing answers that are fully developed with as many chains of reasoning as possible. This will allow you to achieve much higher marks than simply writing down as many different points as you can think of.
Notes from the mark scheme and report
evaluate the effects (AD and multiplier, productivity and LRAS, exports), not whether the spending is a good idea
evaluate size of £23 billion over five years, time lags, government efficiency in allocating resources
a diagram may be used but is not required
June 2018 · Paper 3 · Q1(e)25 marksAO1=4, AO2=4, AO3=8, AO4=925-mark essayEither/or
Data and extracts for question 1
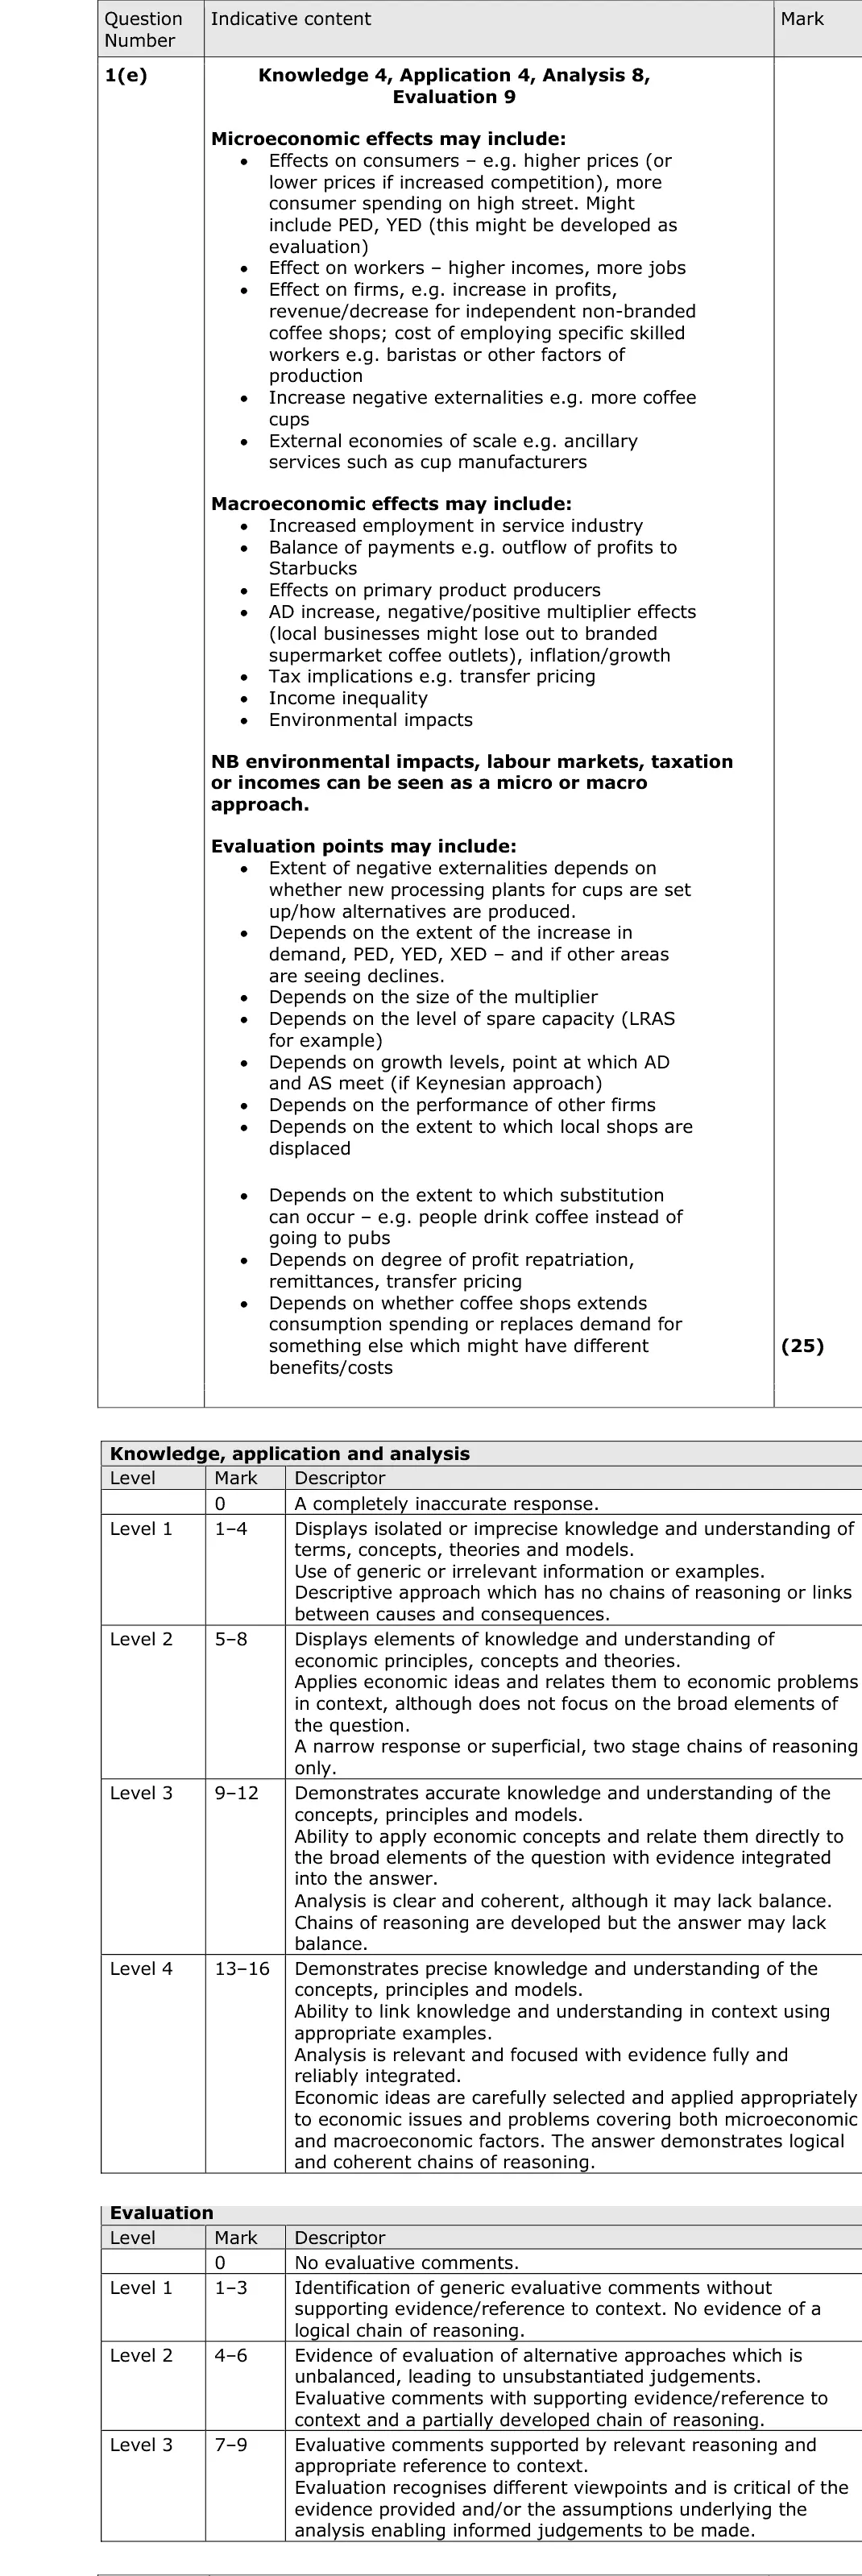
Mark scheme, including the levels grid and indicative content
Examiner's comment
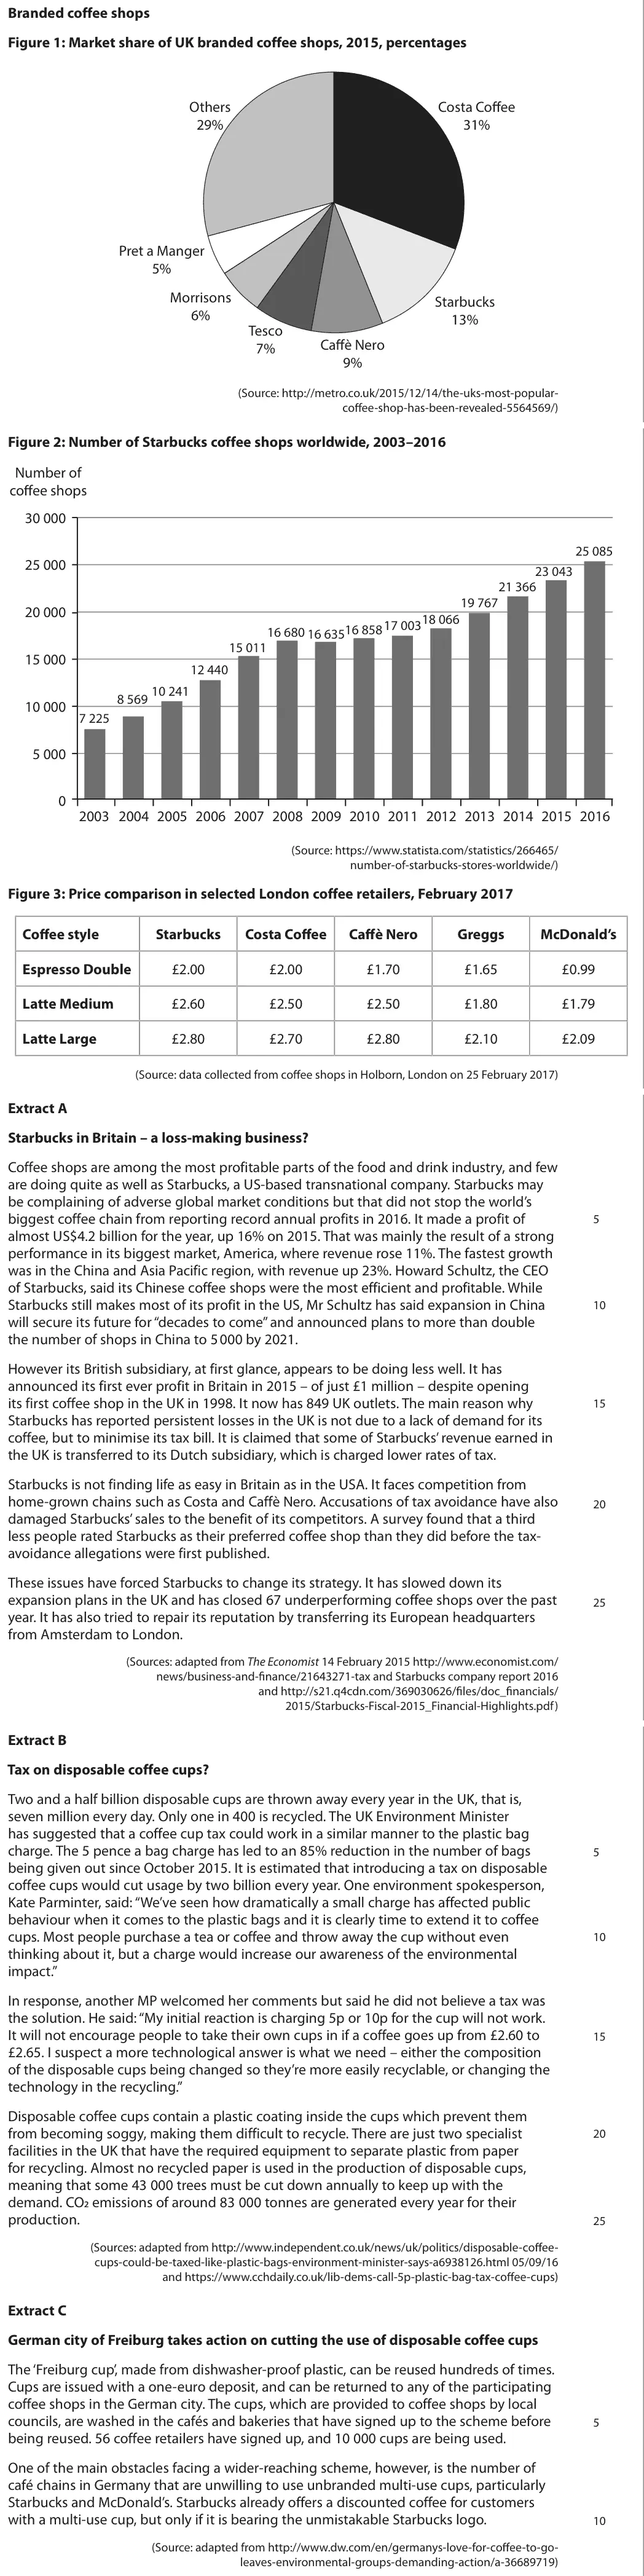
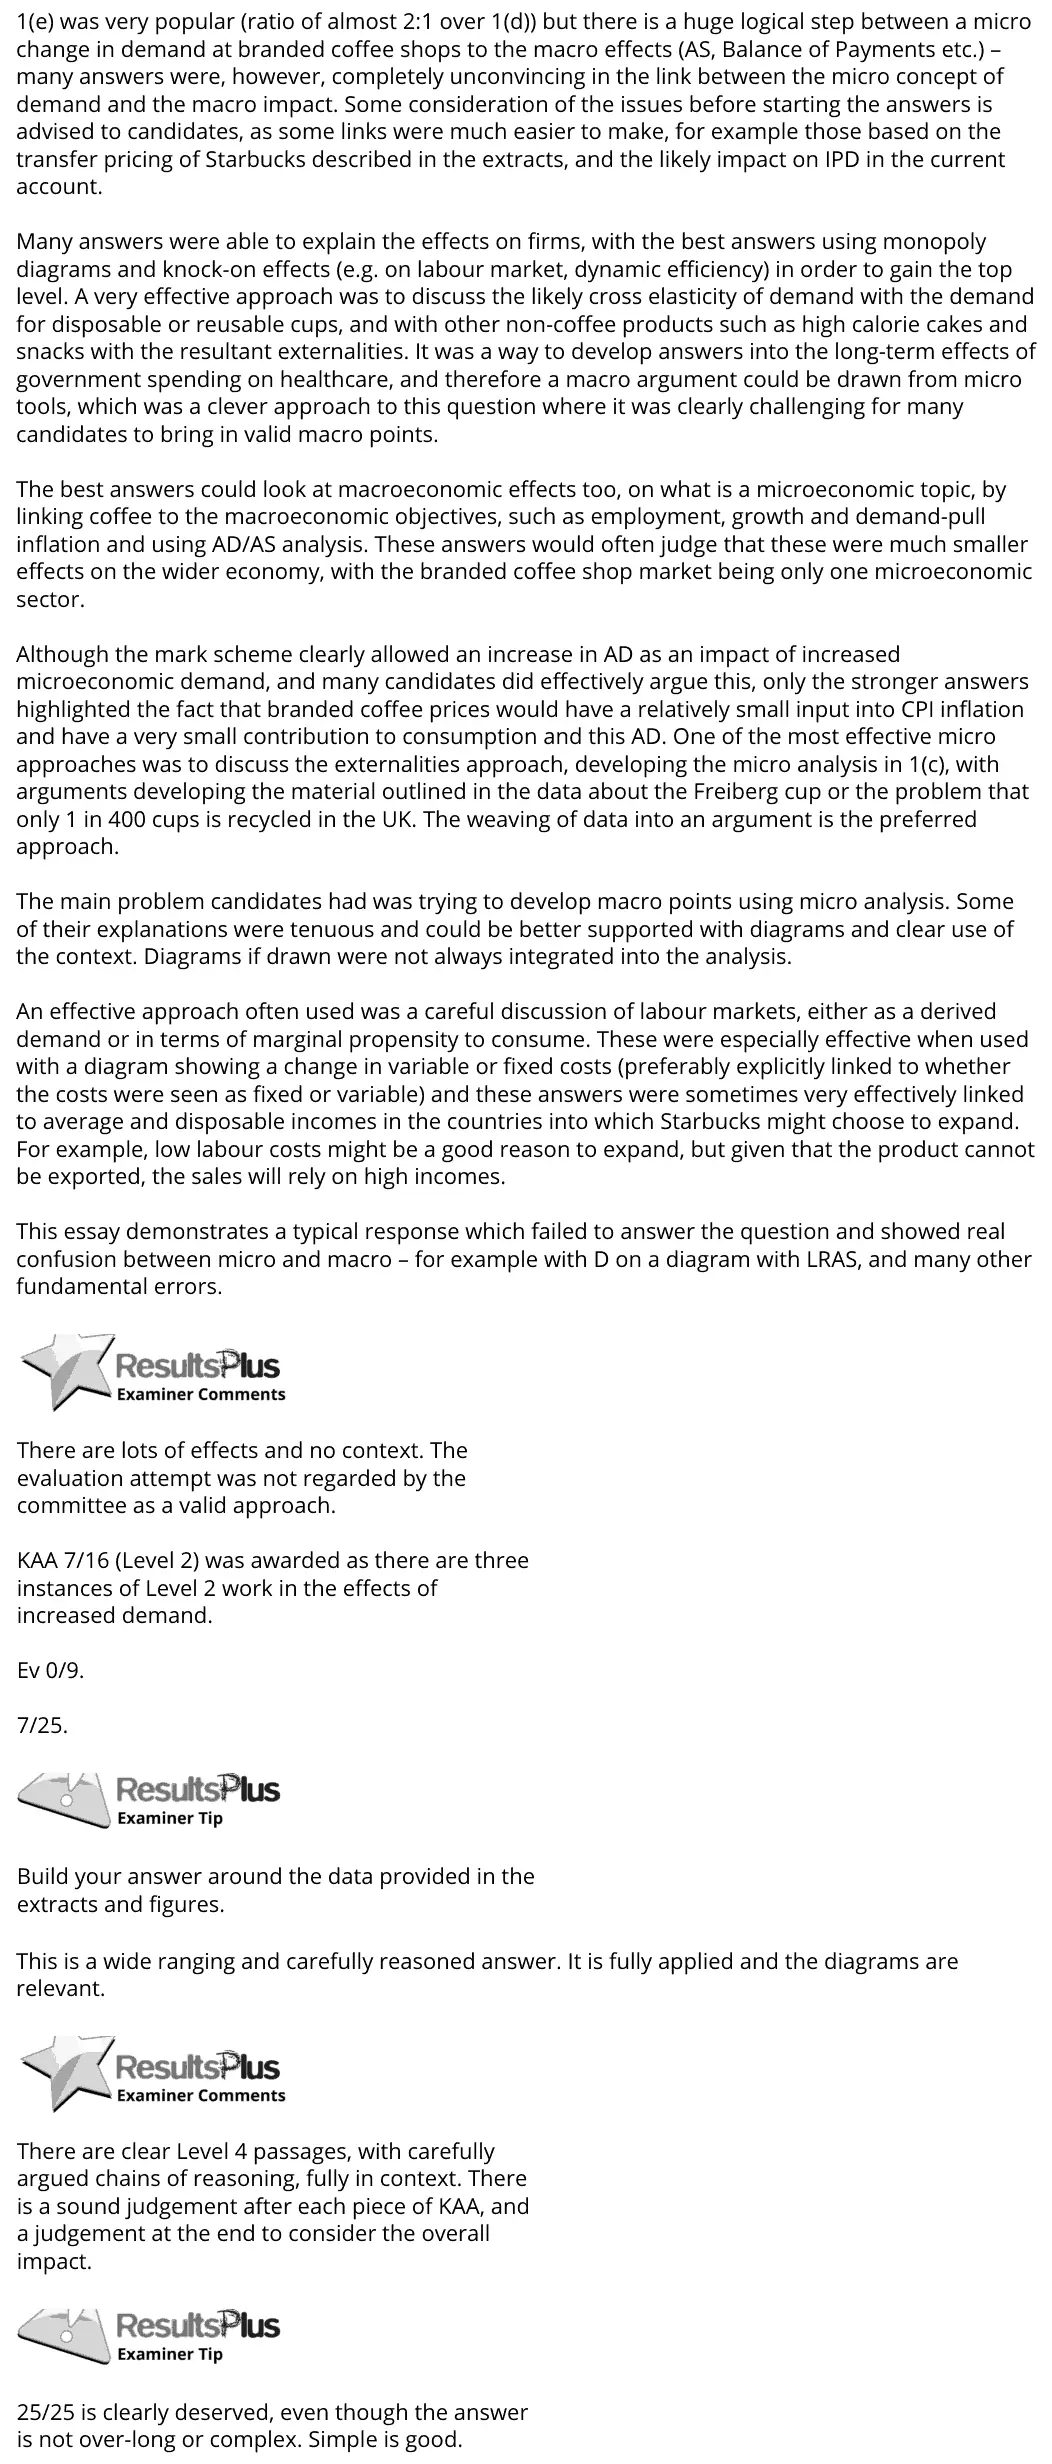
1(e) was very popular (ratio of almost 2:1 over 1(d)) but there is a huge logical step between a micro change in demand at branded coffee shops to the macro effects (AS, Balance of Payments etc.) – many answers were, however, completely unconvincing in the link between the micro concept of demand and the macro impact. Some consideration of the issues before starting the answers is advised to candidates, as some links were much easier to make, for example those based on the transfer pricing of Starbucks described in the extracts, and the likely impact on IPD in the current account. Many answers were able to explain the effects on firms, with the best answers using monopoly diagrams and knock-on effects (e.g. on labour market, dynamic efficiency) in order to gain the top level. A very effective approach was to discuss the likely cross elasticity of demand with the demand for disposable or reusable cups, and with other non-coffee products such as high calorie cakes and snacks with the resultant externalities. It was a way to develop answers into the long-term effects of government spending on healthcare, and therefore a macro argument could be drawn from micro tools, which was a clever approach to this question where it was clearly challenging for many candidates to bring in valid macro points. The best answers could look at macroeconomic effects too, on what is a microeconomic topic, by linking coffee to the macroeconomic objectives, such as employment, growth and demand-pull inflation and using AD/AS analysis. These answers would often judge that these were much smaller effects on the wider economy, with the branded coffee shop market being only one microeconomic sector. Although the mark scheme clearly allowed an increase in AD as an impact of increased microeconomic demand, and many candidates did effectively argue this, only the stronger answers highlighted the fact that branded coffee prices would have a relatively small input into CPI inflation and have a very small contribution to consumption and this AD. One of the most effective micro approaches was to discuss the externalities approach, developing the micro analysis in 1(c), with arguments developing the material outlined in the data about the Freiberg cup or the problem that only 1 in 400 cups is recycled in the UK. The weaving of data into an argument is the preferred approach. The main problem candidates had was trying to develop macro points using micro analysis. Some of their explanations were tenuous and could be better supported with diagrams and clear use of the context. Diagrams if drawn were not always integrated into the analysis. An effective approach often used was a careful discussion of labour markets, either as a derived demand or in terms of marginal propensity to consume. These were especially effective when used with a diagram showing a change in variable or fixed costs (preferably explicitly linked to whether the costs were seen as fixed or variable) and these answers were sometimes very effectively linked to average and disposable incomes in the countries into which Starbucks might choose to expand. For example, low labour costs might be a good reason to expand, but given that the product cannot be exported, the sales will rely on high incomes. This essay demonstrates a typical response which failed to answer the question and showed real confusion between micro and macro – for example with D on a diagram with LRAS, and many other fundamental errors. There are lots of effects and no context. The evaluation attempt was not regarded by the committee as a valid approach. KAA 7/16 (Level 2) was awarded as there are three instances of Level 2 work in the effects of increased demand. Ev 0/9. 7/25. Build your answer around the data provided in the extracts and figures. This is a wide ranging and carefully reasoned answer. It is fully applied and the diagrams are relevant. There are clear Level 4 passages, with carefully argued chains of reasoning, fully in context. There is a sound judgement after each piece of KAA, and a judgement at the end to consider the overall impact. 25/25 is clearly deserved, even though the answer is not over-long or complex. Simple is good.
Notes from the mark scheme and report
the step from a micro demand rise to macro effects must be argued convincingly (small share of AD and CPI, transfer pricing and the current account)
externalities from disposable cups and labour market effects work well
avoid putting D on an LRAS diagram
June 2017 · Paper 2 · Q1(b)4 marksAO1=2, AO2=1, AO3=1Short answer
Data and extracts for question 1
Mark scheme
Examiner's comment
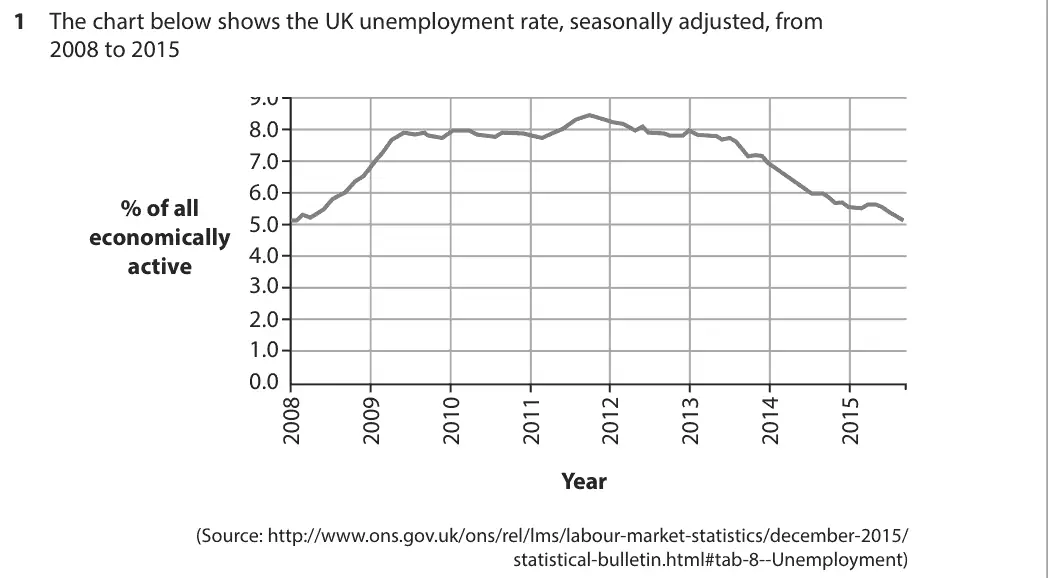
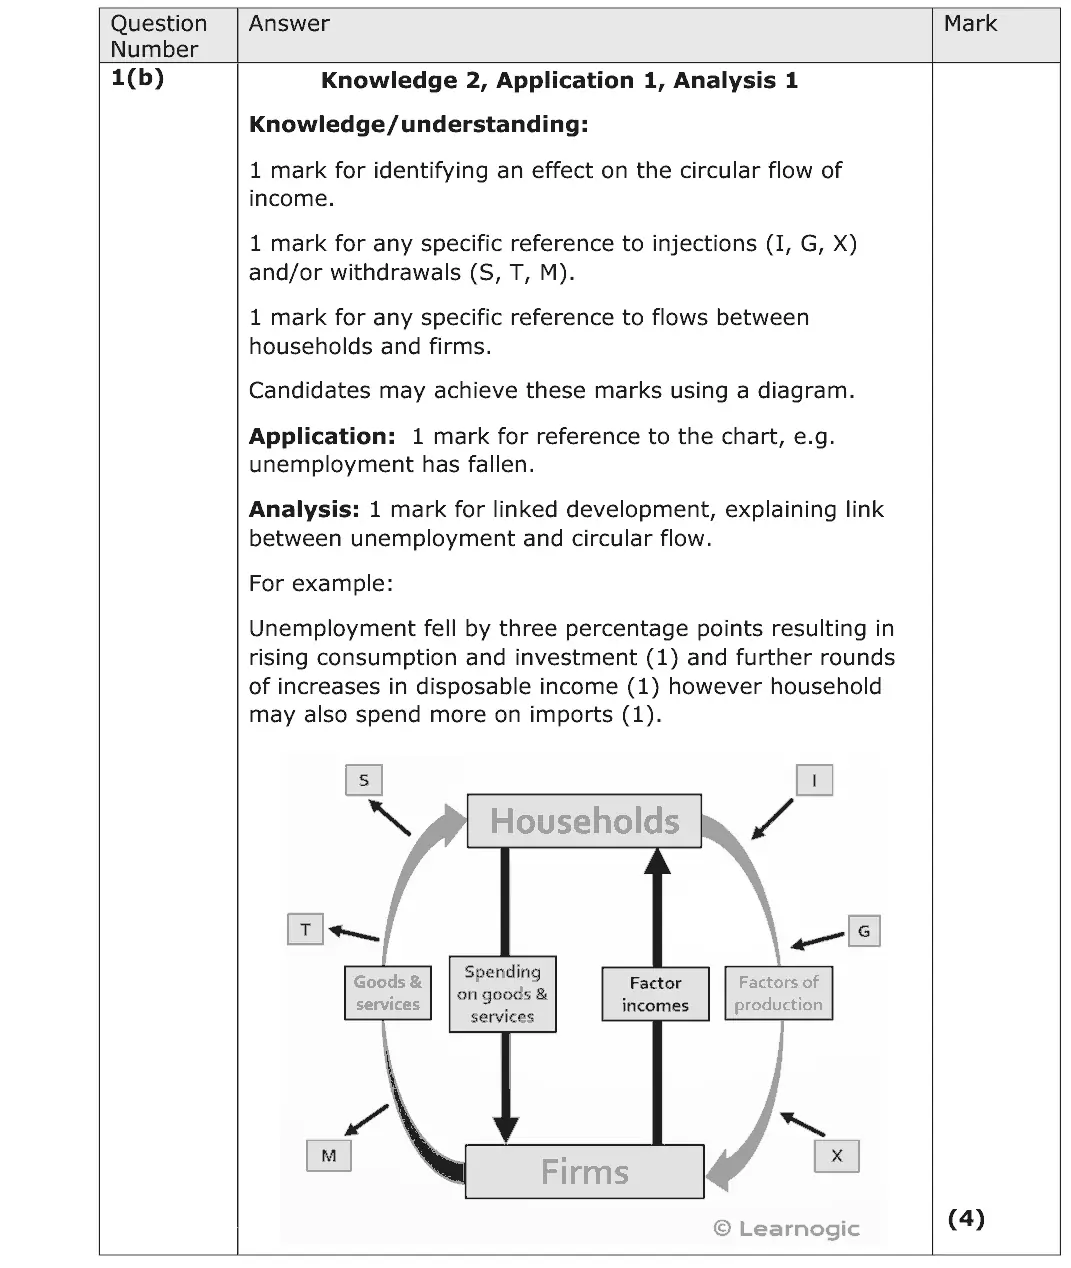
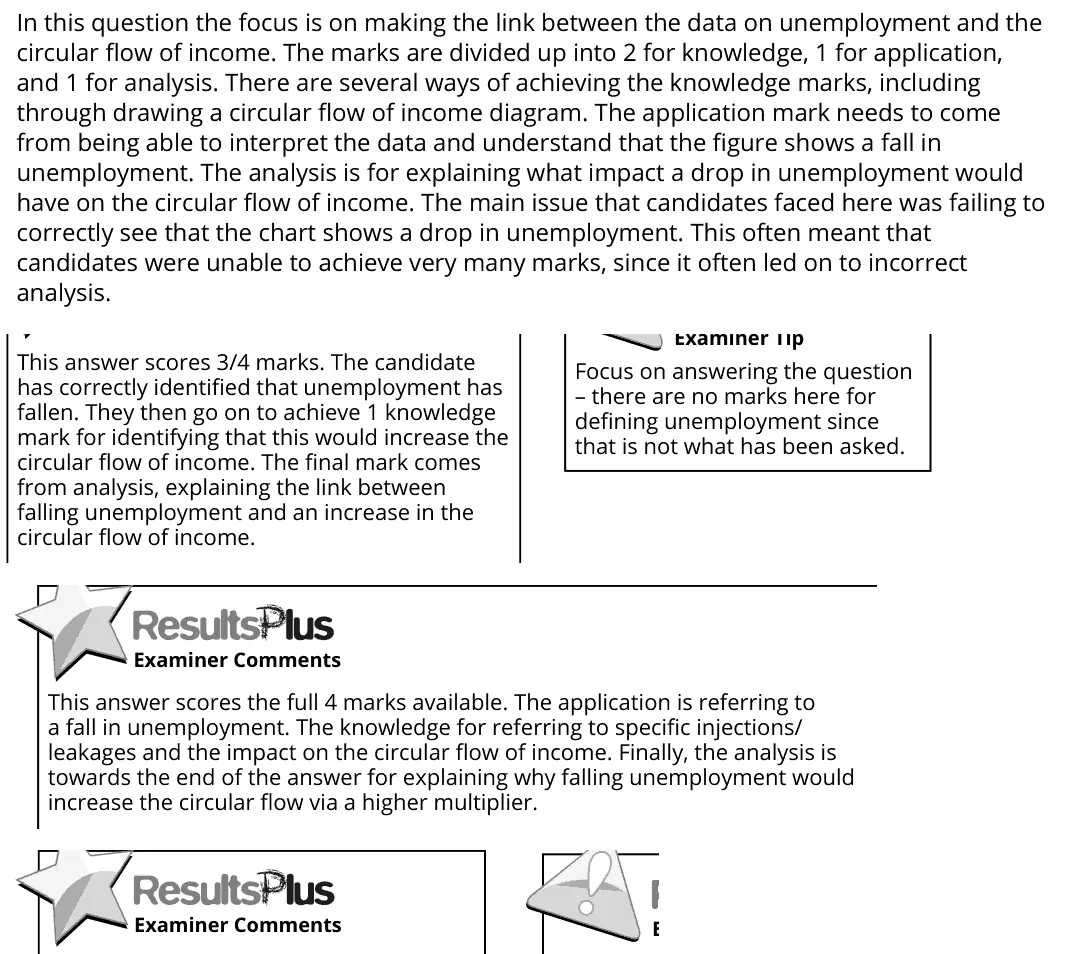
In this question the focus is on making the link between the data on unemployment and the circular flow of income. The marks are divided up into 2 for knowledge, 1 for application, and 1 for analysis. There are several ways of achieving the knowledge marks, including through drawing a circular flow of income diagram. The application mark needs to come from being able to interpret the data and understand that the figure shows a fall in unemployment. The analysis is for explaining what impact a drop in unemployment would have on the circular flow of income. The main issue that candidates faced here was failing to correctly see that the chart shows a drop in unemployment. This often meant that candidates were unable to achieve very many marks, since it often led on to incorrect analysis. This answer scores 3/4 marks. The candidate has correctly identified that unemployment has fallen. They then go on to achieve 1 knowledge mark for identifying that this would increase the circular flow of income. The final mark comes from analysis, explaining the link between falling unemployment and an increase in the circular flow of income. Focus on answering the question – there are no marks here for defining unemployment since that is not what has been asked. This answer scores the full 4 marks available. The application is referring to a fall in unemployment. The knowledge for referring to specific injections/ leakages and the impact on the circular flow of income. Finally, the analysis is towards the end of the answer for explaining why falling unemployment would increase the circular flow via a higher multiplier.
Notes from the mark scheme and report
unemployment FELL 2013-2015 (about 8% to 5%)
misreading it as a rise wrecked many answers
refer to specific injections/withdrawals and household-firm flows
no marks for defining unemployment
Quantitative skills: QS 9 (interpret, apply and analyse information in written, graphical tabular and numerical forms)
June 2017 · Paper 2 · Q2(b)2 marksAO1=2Short answer
Data and extracts for question 2
Mark scheme
Examiner's comment
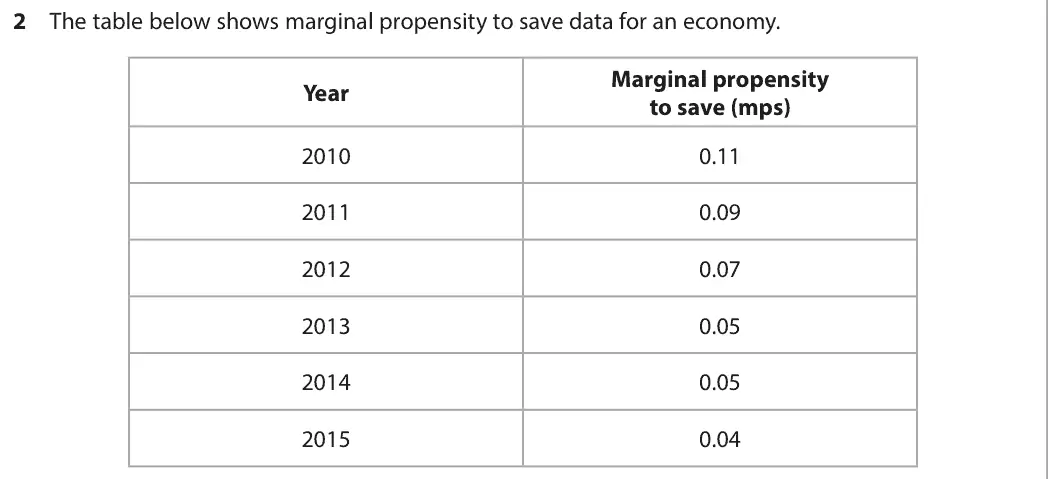
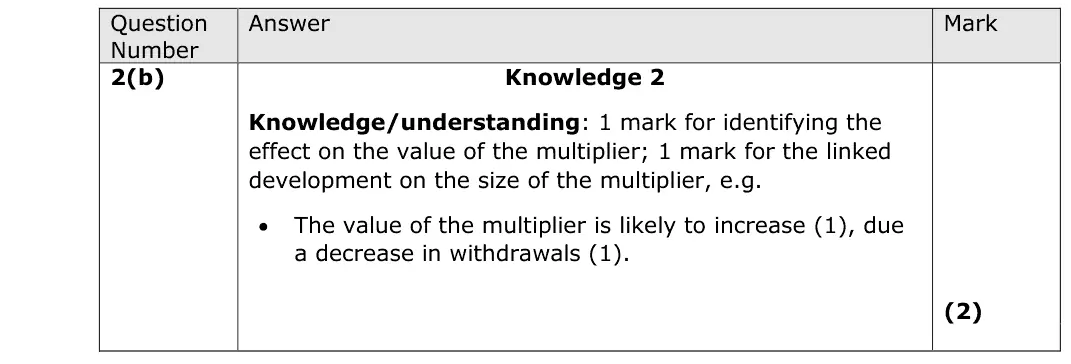
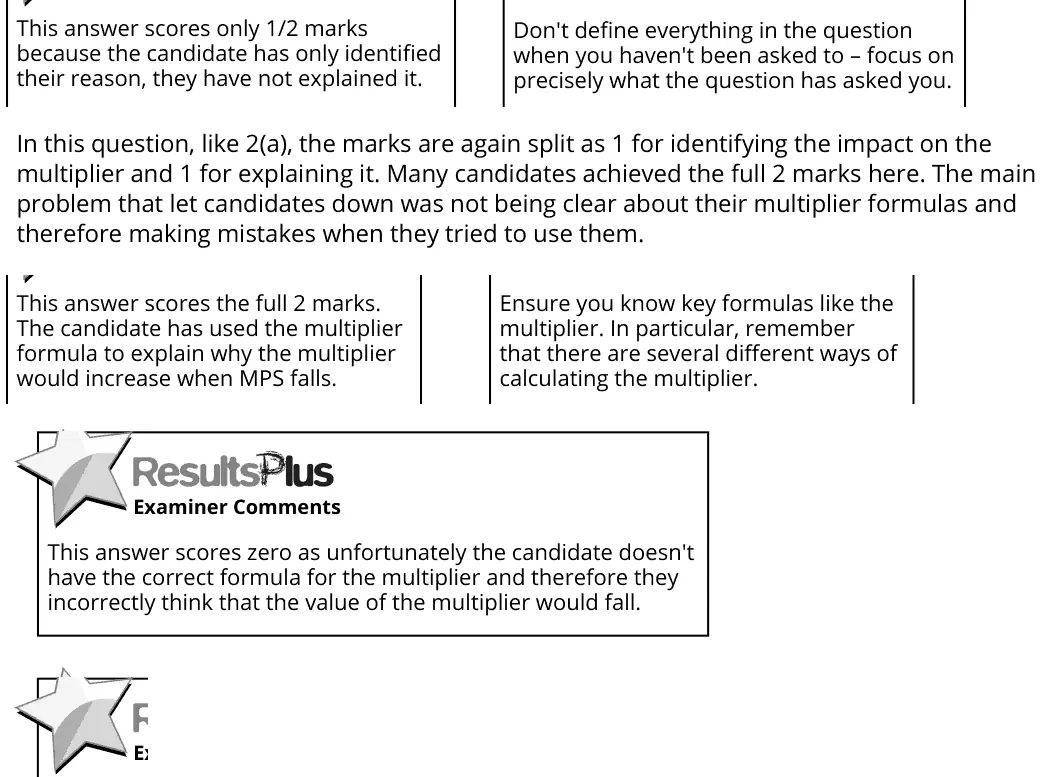
In this question, like 2(a), the marks are again split as 1 for identifying the impact on the multiplier and 1 for explaining it. Many candidates achieved the full 2 marks here. The main problem that let candidates down was not being clear about their multiplier formulas and therefore making mistakes when they tried to use them. This answer scores only 1/2 marks because the candidate has only identified their reason, they have not explained it. Don't define everything in the question when you haven't been asked to – focus on precisely what the question has asked you. This answer scores the full 2 marks. The candidate has used the multiplier formula to explain why the multiplier would increase when MPS falls. Ensure you know key formulas like the multiplier. In particular, remember that there are several different ways of calculating the multiplier. 9EC0_02_Q02b_1291573_01.png This answer scores zero as unfortunately the candidate doesn't have the correct formula for the multiplier and therefore they incorrectly think that the value of the multiplier would fall.
Notes from the mark scheme and report
fall in mps reduces withdrawals so the multiplier increases
candidates with the wrong multiplier formula said it would fall
use the mps/mpt/mpm given in the part, not the table
Quantitative skills: QS 1 (calculate, use and understand ratios and fractions)
June 2017 · AS Paper 2 · Q4(a)2 marksAO2=2Diagram
Data and extracts for question 4
Mark scheme
Examiner's comment
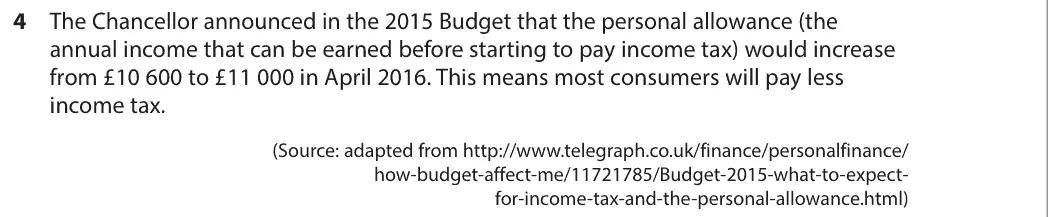
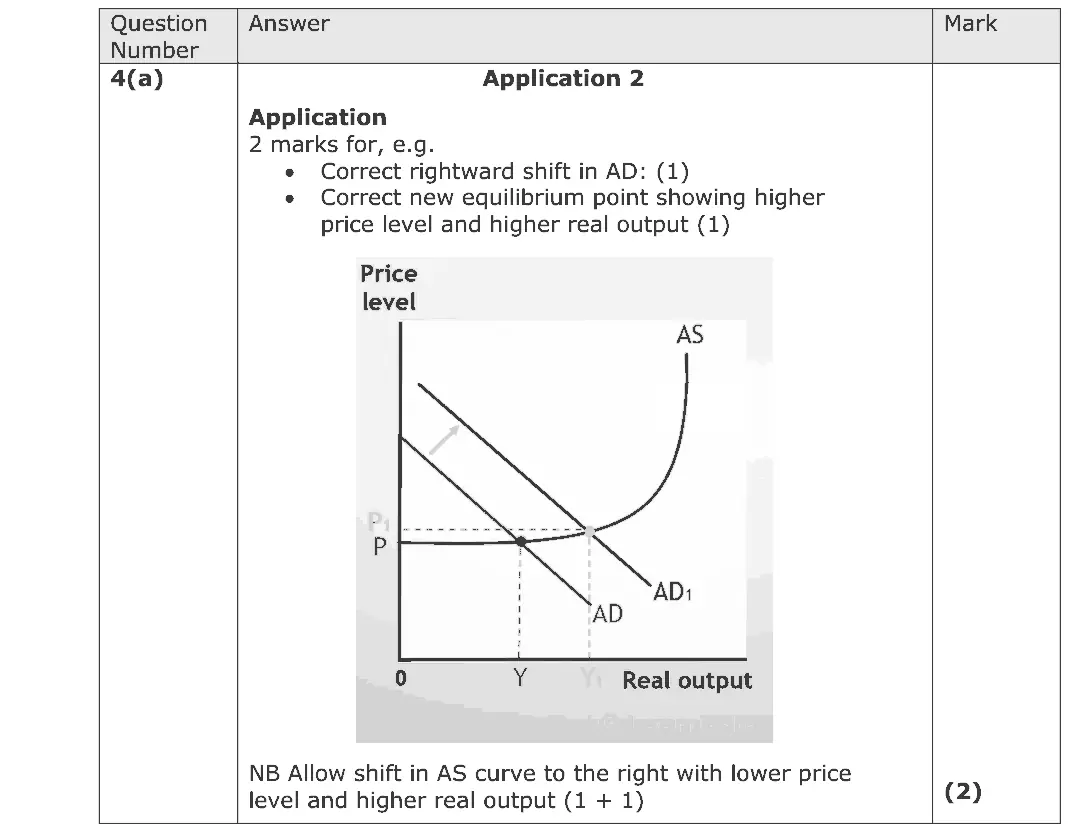
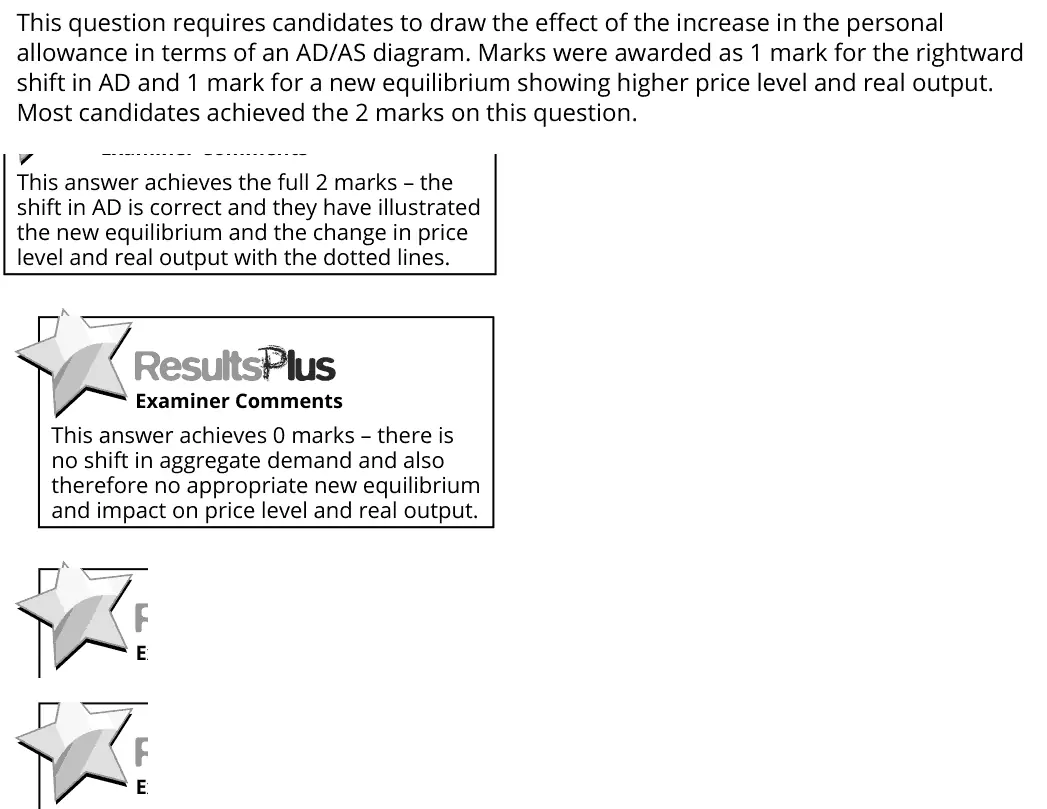
This question requires candidates to draw the effect of the increase in the personal allowance in terms of an AD/AS diagram. Marks were awarded as 1 mark for the rightward shift in AD and 1 mark for a new equilibrium showing higher price level and real output. Most candidates achieved the 2 marks on this question. This answer achieves the full 2 marks – the shift in AD is correct and they have illustrated the new equilibrium and the change in price level and real output with the dotted lines. This answer achieves 0 marks – there is no shift in aggregate demand and also therefore no appropriate new equilibrium and impact on price level and real output.
Notes from the mark scheme and report
a higher personal allowance raises disposable income and consumption so AD shifts right
show the new equilibrium with higher price level and real output (an AS shift right is also allowed)
Quantitative skills: QS 4 (construct and interpret a range of standard graphical forms)
June 2017 · AS Paper 2 · Q5(b)1 markMultiple choice
Data and extracts for question 5
Answer
D
Mark scheme
Notes from the mark scheme and report
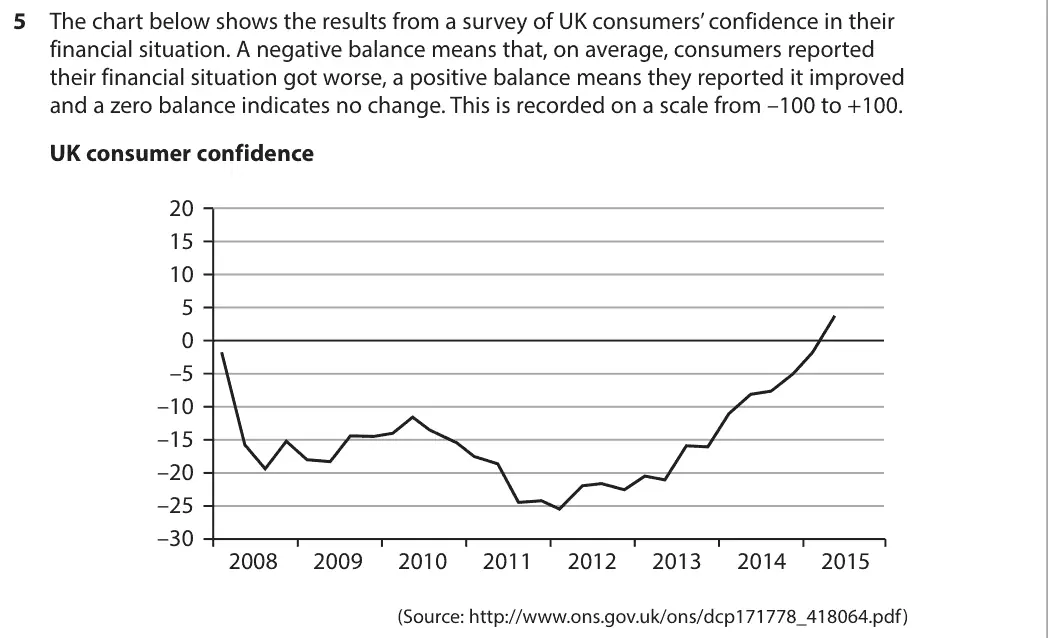
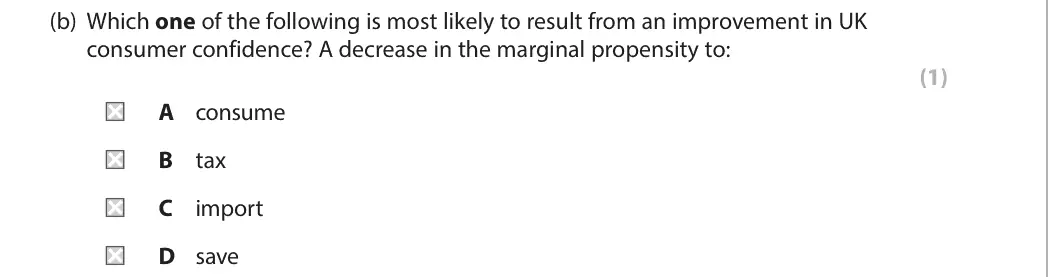
more confident consumers save a smaller share of extra income, so MPS falls (D)
MPC would rise, MPT and MPM are not driven by confidence
June 2017 · Paper 2 · Q825 marksAO1=4, AO2=4, AO3=8, AO4=925-mark essayEither/or
Mark scheme, including the levels grid and indicative content
Examiner's comment
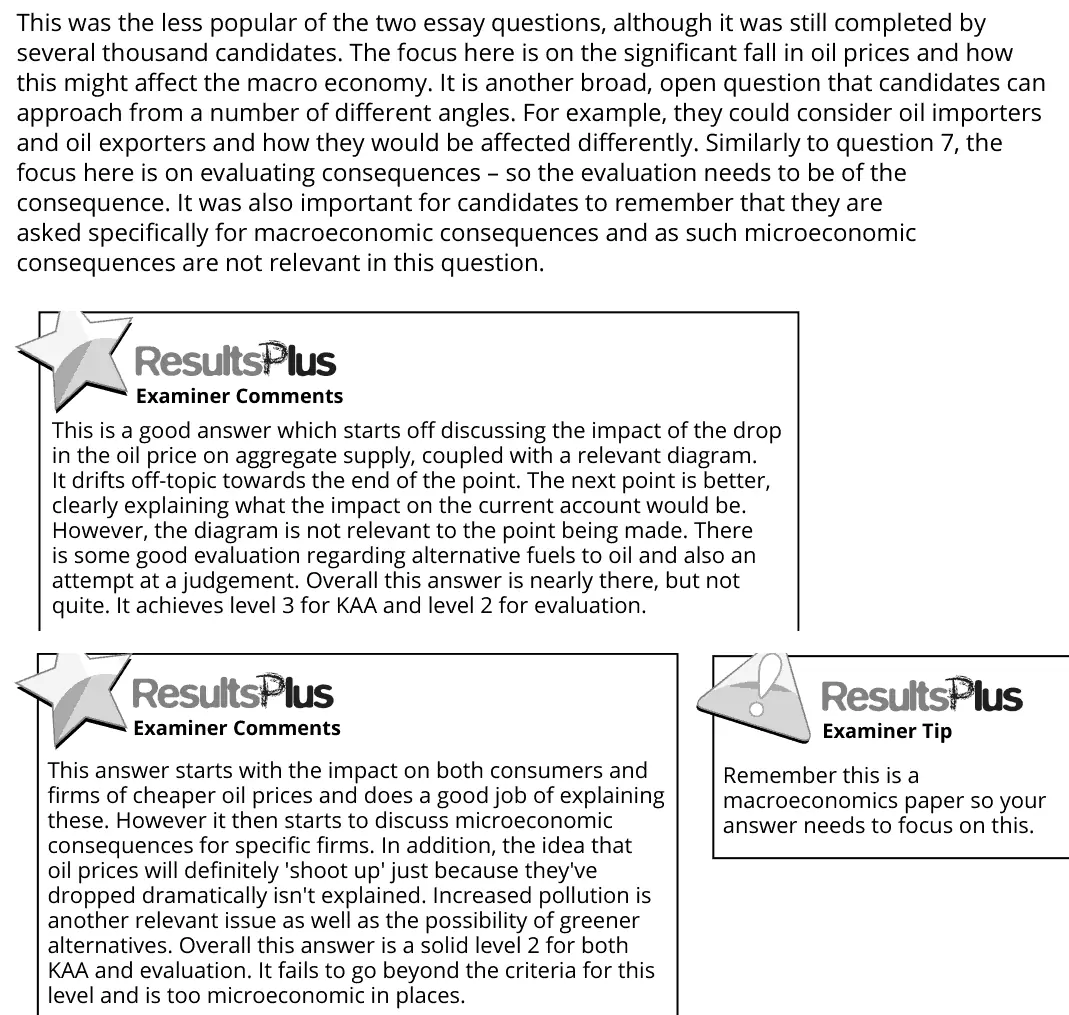
This was the less popular of the two essay questions, although it was still completed by several thousand candidates. The focus here is on the significant fall in oil prices and how this might affect the macro economy. It is another broad, open question that candidates can approach from a number of different angles. For example, they could consider oil importers and oil exporters and how they would be affected differently. Similarly to question 7, the focus here is on evaluating consequences – so the evaluation needs to be of the consequence. It was also important for candidates to remember that they are asked specifically for macroeconomic consequences and as such microeconomic consequences are not relevant in this question. This is a good answer which starts off discussing the impact of the drop in the oil price on aggregate supply, coupled with a relevant diagram. It drifts off-topic towards the end of the point. The next point is better, clearly explaining what the impact on the current account would be. However, the diagram is not relevant to the point being made. There is some good evaluation regarding alternative fuels to oil and also an attempt at a judgement. Overall this answer is nearly there, but not quite. It achieves level 3 for KAA and level 2 for evaluation. This answer starts with the impact on both consumers and firms of cheaper oil prices and does a good job of explaining these. However it then starts to discuss microeconomic consequences for specific firms. In addition, the idea that oil prices will definitely 'shoot up' just because they've dropped dramatically isn't explained. Increased pollution is another relevant issue as well as the possibility of greener alternatives. Overall this answer is a solid level 2 for both KAA and evaluation. It fails to go beyond the criteria for this level and is too microeconomic in places. Remember this is a macroeconomics paper so your answer needs to focus on this.
Notes from the mark scheme and report
lower oil prices shift SRAS right (lower inflation, higher real GDP) and affect net trade
oil importers vs exporters differ
macro consequences only, micro effects on specific firms earn little
Level 4 needs a logical link to changes in AD/AS
June 2017 · Paper 3 · Q1(e)25 marksAO1=4, AO2=4, AO3=8, AO4=925-mark essayEither/or
Data and extracts for question 1
Mark scheme, including the levels grid and indicative content
Examiner's comment
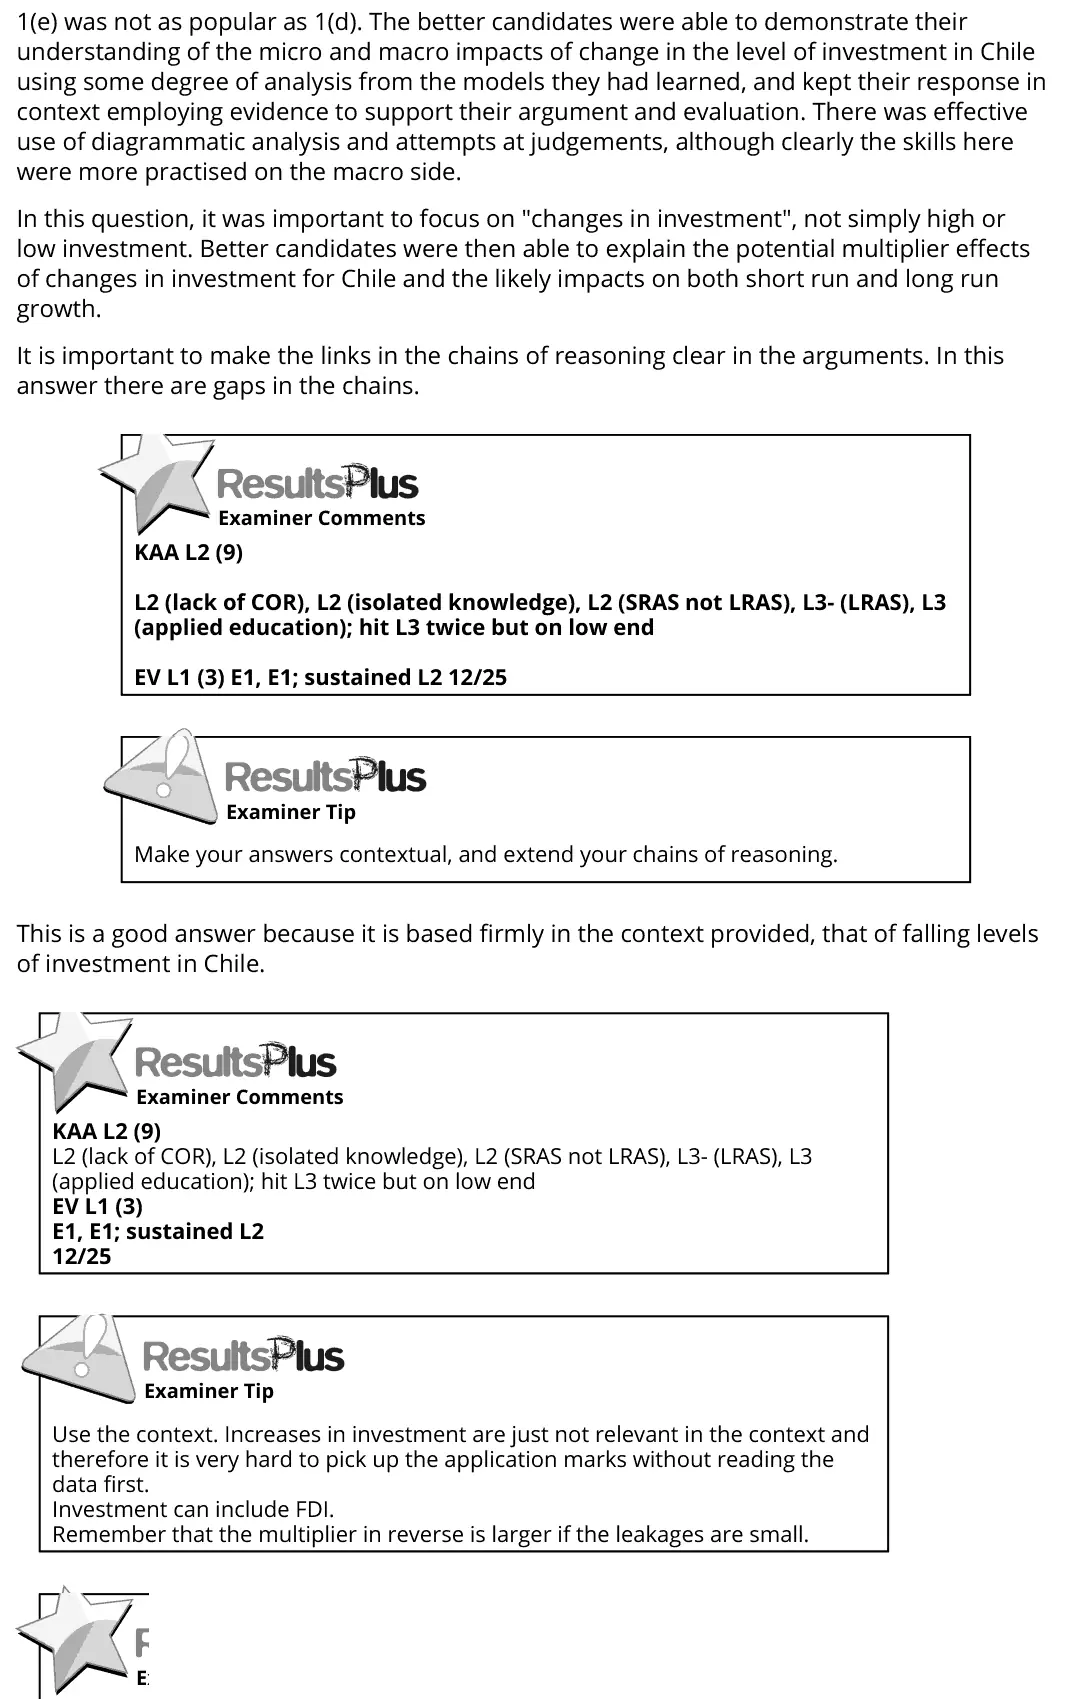
1(e) was not as popular as 1(d). The better candidates were able to demonstrate their understanding of the micro and macro impacts of change in the level of investment in Chile using some degree of analysis from the models they had learned, and kept their response in context employing evidence to support their argument and evaluation. There was effective use of diagrammatic analysis and attempts at judgements, although clearly the skills here were more practised on the macro side. In this question, it was important to focus on "changes in investment", not simply high or low investment. Better candidates were then able to explain the potential multiplier effects of changes in investment for Chile and the likely impacts on both short run and long run growth. It is important to make the links in the chains of reasoning clear in the arguments. In this answer there are gaps in the chains. This is a good answer because it is based firmly in the context provided, that of falling levels of investment in Chile. KAA L2 (9) L2 (lack of COR), L2 (isolated knowledge), L2 (SRAS not LRAS), L3- (LRAS), L3 (applied education); hit L3 twice but on low end EV L1 (3) E1, E1; sustained L2 12/25 Make your answers contextual, and extend your chains of reasoning. KAA L2 (9) L2 (lack of COR), L2 (isolated knowledge), L2 (SRAS not LRAS), L3- (LRAS), L3 (applied education); hit L3 twice but on low end EV L1 (3) E1, E1; sustained L2 12/25 Use the context. Increases in investment are just not relevant in the context and therefore it is very hard to pick up the application marks without reading the data first. Investment can include FDI. Remember that the multiplier in reverse is larger if the leakages are small.
Notes from the mark scheme and report
focus on changes in investment, not high or low levels
AD shift with multiplier and LRAS shift from capacity (e.g. education)
micro effects on workers and firms
effects only on Chile, not causes of investment
evaluate Keynesian v classical view, FDI and the balance of payments
June 2016 · AS Paper 2 · Q1(a)1 markAO1=1Definition
Mark scheme
Examiner's comment
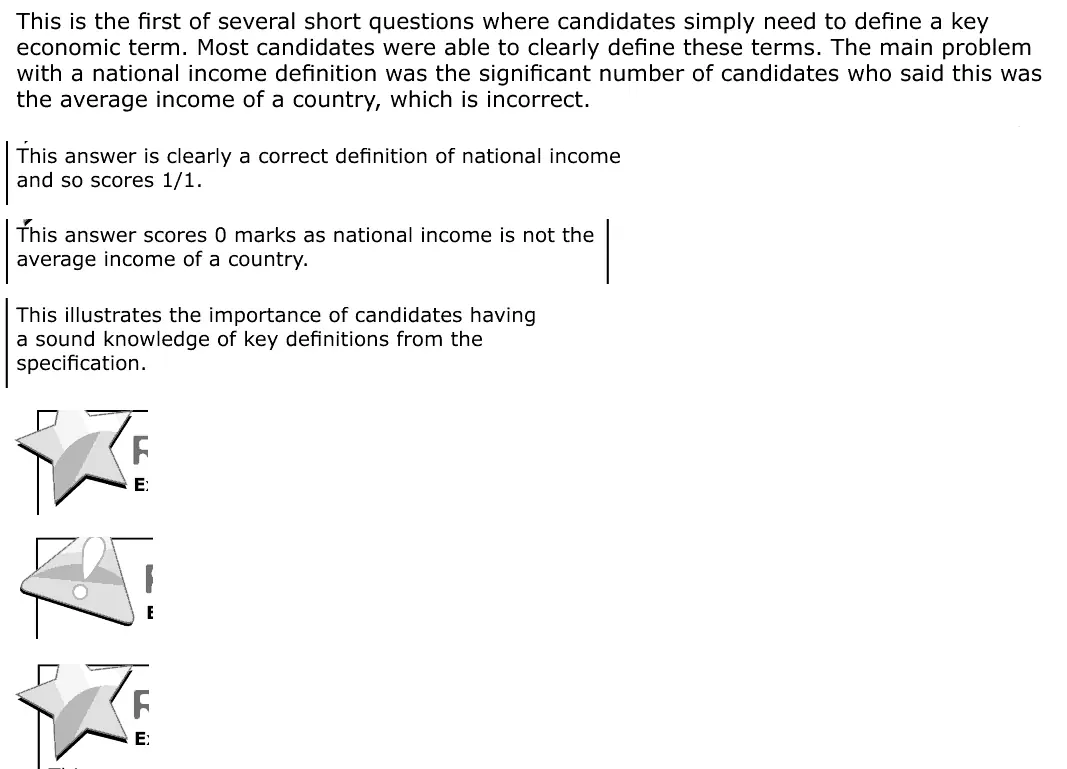
This is the first of several short questions where candidates simply need to define a key economic term. Most candidates were able to clearly define these terms. The main problem with a national income definition was the significant number of candidates who said this was the average income of a country, which is incorrect. This answer is clearly a correct definition of national income and so scores 1/1. This answer scores 0 marks as national income is not the average income of a country. This illustrates the importance of candidates having a sound knowledge of key definitions from the specification.
Notes from the mark scheme and report
total income (or output or spending) of a whole economy over a period
report: many wrongly said the average income of a country
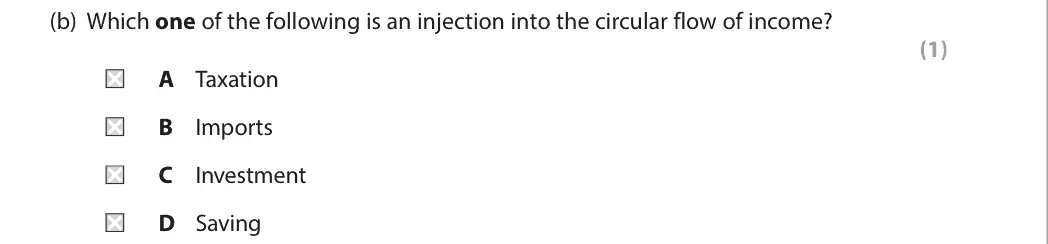
June 2016 · AS Paper 2 · Q1(b)1 markMultiple choice
Answer
C
Mark scheme
Notes from the mark scheme and report
injections are investment, government spending and exports (C)
savings, taxation and imports are withdrawals
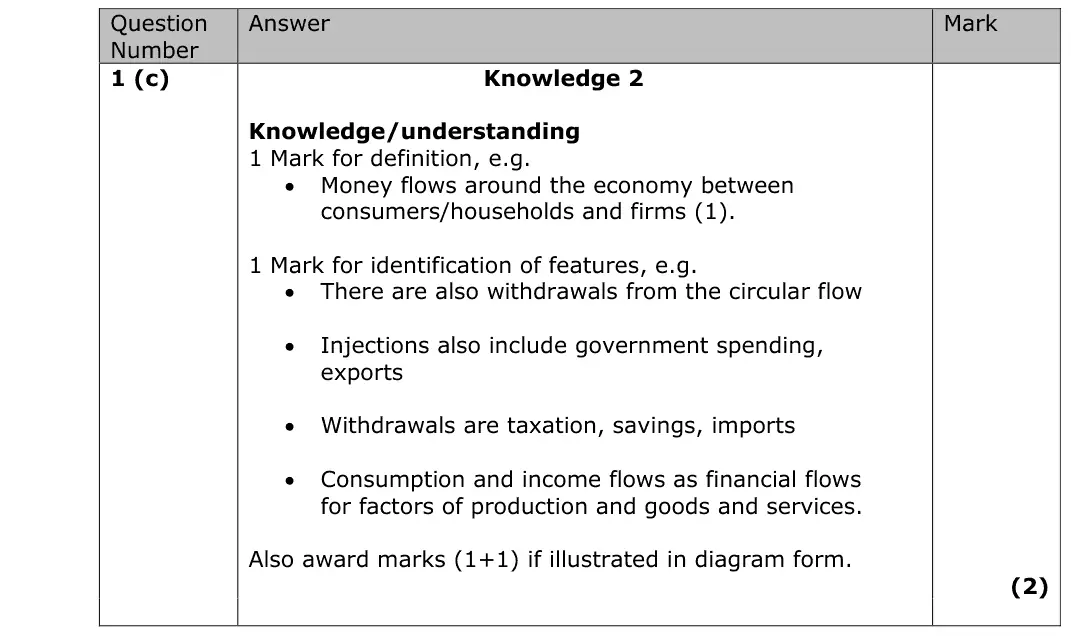
June 2016 · AS Paper 2 · Q1(c)2 marksAO1=2Definition
Mark scheme
Examiner's comment
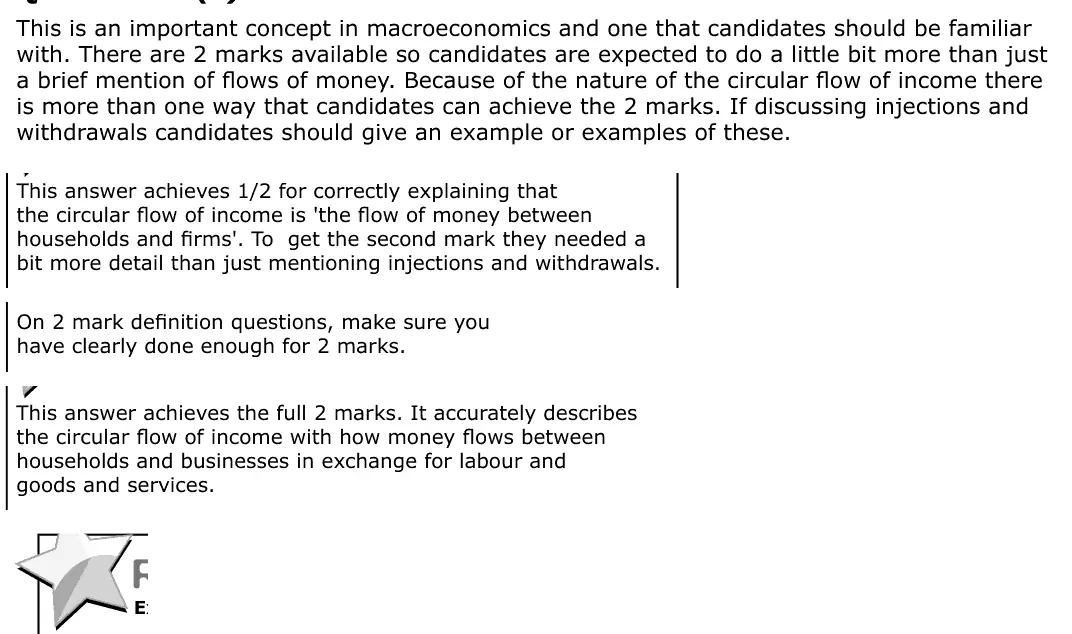
This is an important concept in macroeconomics and one that candidates should be familiar with. There are 2 marks available so candidates are expected to do a little bit more than just a brief mention of flows of money. Because of the nature of the circular flow of income there is more than one way that candidates can achieve the 2 marks. If discussing injections and withdrawals candidates should give an example or examples of these. This answer achieves 1/2 for correctly explaining that the circular flow of income is 'the flow of money between households and firms'. To get the second mark they needed a bit more detail than just mentioning injections and withdrawals. On 2 mark definition questions, make sure you have clearly done enough for 2 marks. This answer achieves the full 2 marks. It accurately describes the circular flow of income with how money flows between households and businesses in exchange for labour and goods and services.
Notes from the mark scheme and report
money flowing between households and firms in exchange for factor services and goods
second mark needs a feature, e.g. injections and withdrawals WITH examples
June 2016 · AS Paper 2 · Q2(c)1 markAO1=1Diagram
Data and extracts for question 2
Mark scheme
Examiner's comment
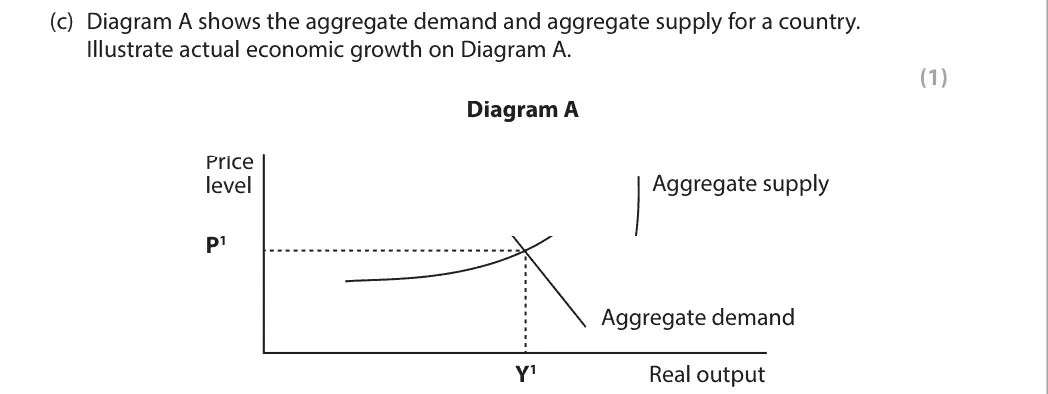
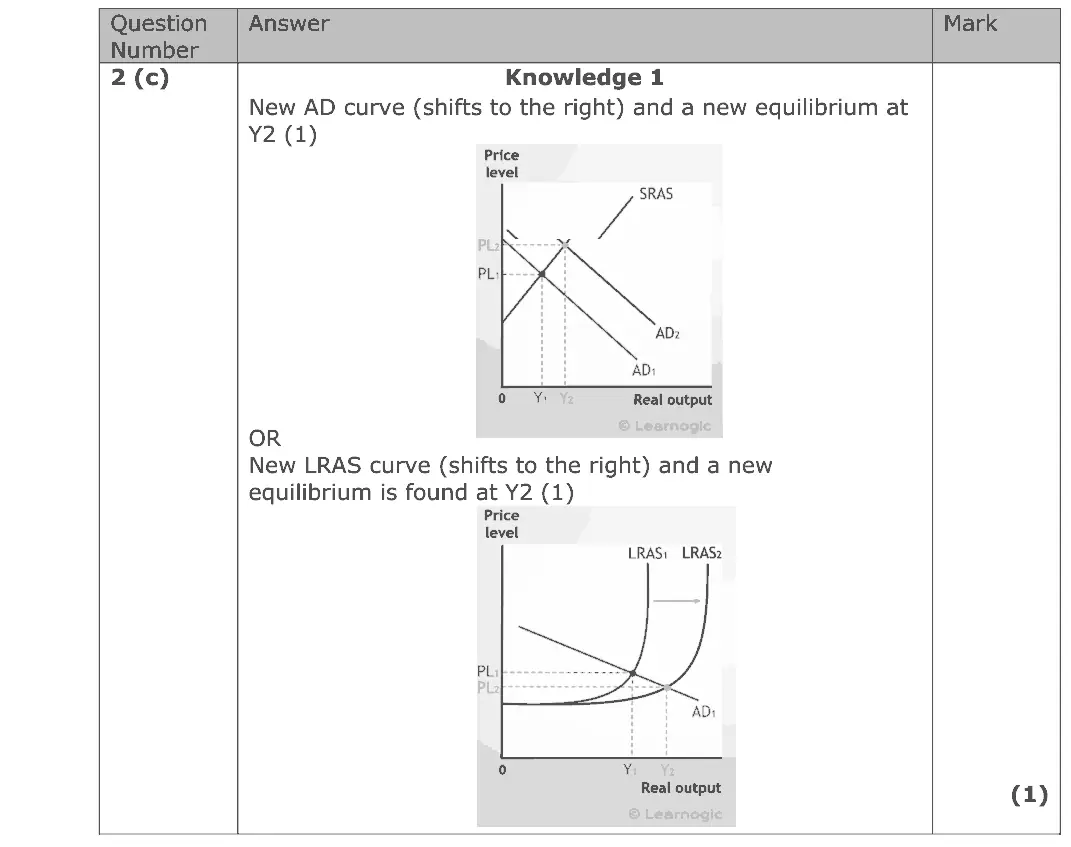
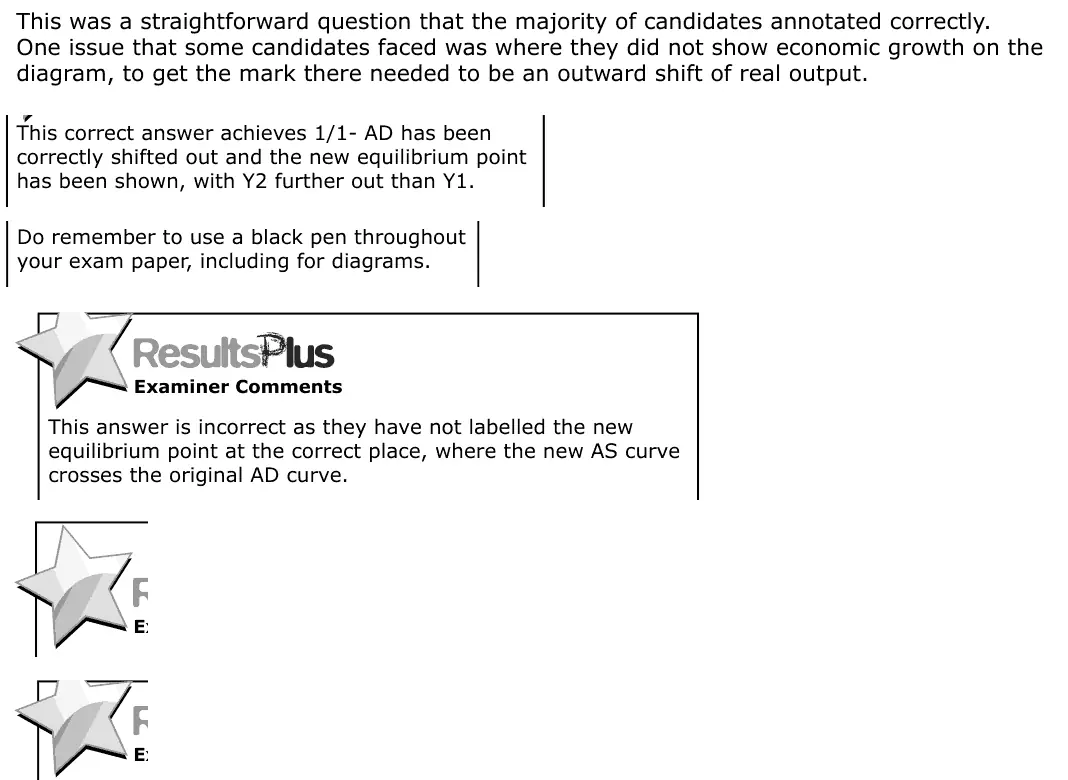
This was a straightforward question that the majority of candidates annotated correctly. One issue that some candidates faced was where they did not show economic growth on the diagram, to get the mark there needed to be an outward shift of real output. This correct answer achieves 1/1- AD has been correctly shifted out and the new equilibrium point has been shown, with Y2 further out than Y1. Do remember to use a black pen throughout your exam paper, including for diagrams. This answer is incorrect as they have not labelled the new equilibrium point at the correct place, where the new AS curve crosses the original AD curve.
Notes from the mark scheme and report
shift AD (or LRAS) right and mark the new equilibrium with real output Y2 beyond Y1
report: some placed the new equilibrium wrongly
Quantitative skills: QS 4 (construct and interpret a range of standard graphical forms)
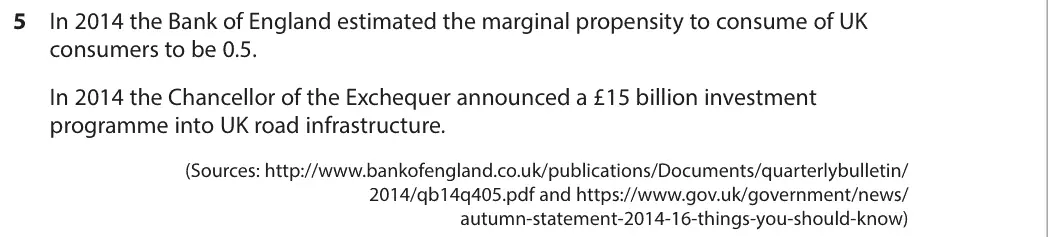
June 2016 · AS Paper 2 · Q5(a)3 marksAO1=1, AO2=2Calculation
Data and extracts for question 5
Mark scheme
Examiner's comment
In this question it was clear who knew their multiplier formula and who did not. Candidates need to be practicing such key calculations as part of their exam preparation. This candidate has the correct answer of '£30bn' and so achieves all 3 marks. This candidate achieves 2/3 as they have correctly identified the multiplier formula and worked out that the multiplier is 2. Unfortunately the candidate fails to multiply it by £15 billion. Always show your working out in calculation questions. That way even if you get the wrong answer at the end (or fail to include it like here) you can still get marks for your working out.
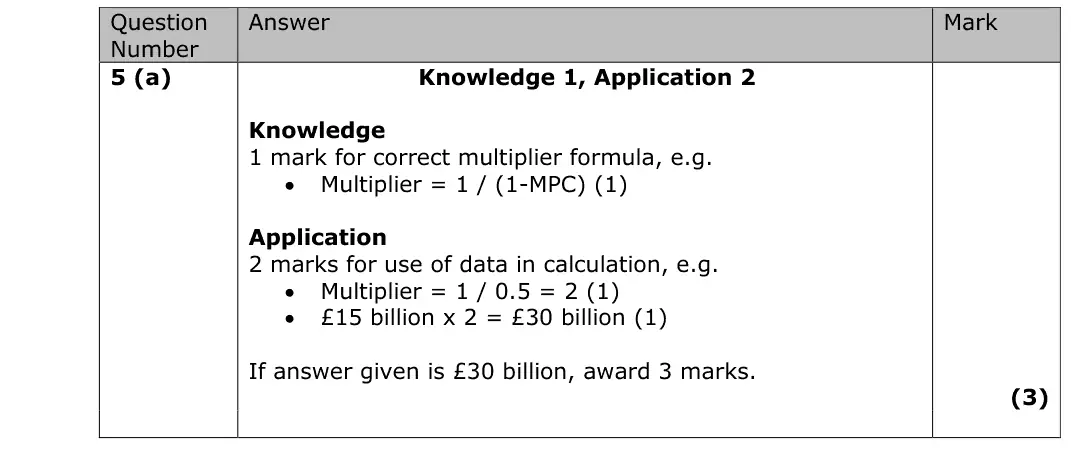
Notes from the mark scheme and report
multiplier = 1 / (1 - MPC) = 1 / 0.5 = 2
£15 billion x 2 = £30 billion
some found the multiplier but did not multiply by £15 billion
Quantitative skills: QS 1 (calculate, use and understand ratios and fractions)
Work with an Edexcel economics tutor
Essays stuck in Level 2, or losing the easy marks in Section A? Book a trial session with Lianne, a former Edexcel examiner.