Notes and key-term cards for this topic are being written by our tutors. The past-paper questions below are ready now.
Specification statements
4.1.1Globalisation: a) Characteristics of globalisation b) Factors contributing to globalisation in the last 50 years c) Impacts of globalisation and global companies on individual countries, governments, producers and consumers, workers and the environment
4.1.2Specialisation and trade: a) Absolute and comparative advantage (numerical and diagrammatic): assumptions and limitations relating to the theory of comparative advantage b) Advantages and disadvantages of specialisation and trade in an international context
4.1.3Pattern of trade: a) Factors influencing the pattern of trade between countries and changes in trade flows between countries: • comparative advantage • impact of emerging economies • growth of trading blocs and bilateral trading agreements • changes in relative exchange rates
4.1.4Terms of trade: a) Calculation of terms of trade b) Factors influencing a country's terms of trade c) Impact of changes in a country's terms of trade
In 2020, exports as a share of world GDP were 12% higher than in 2000, almost twice as high as 50 years ago. (Source adapted from: https://www.dhl.com/content/dam/dhl/global/dhl-spotlight/ documents/pdf/2021-gci-update-report.pdf) Evaluate the possible factors contributing to globalisation.
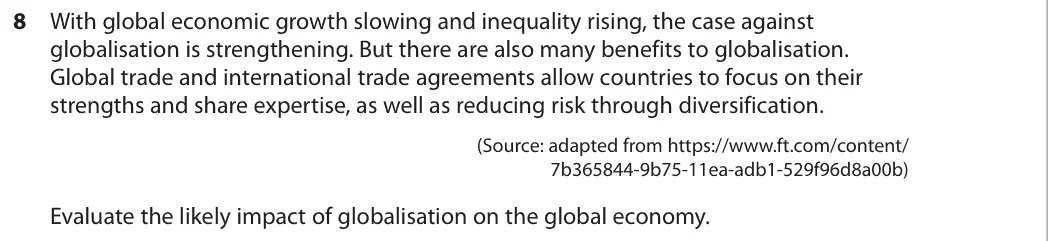
With global economic growth slowing and inequality rising, the case against globalisation is strengthening. But there are also many benefits to globalisation. Global trade and international trade agreements allow countries to focus on their strengths and share expertise, as well as reducing risk through diversification. (Source: adapted from https://www.ft.com/content/ 7b365844-9b75-11ea-adb1-529f96d8a00b) Evaluate the likely impact of globalisation on the global economy.
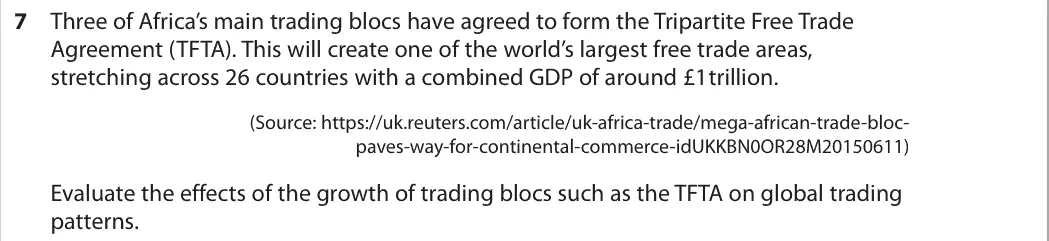
Three of Africa’s main trading blocs have agreed to form the Tripartite Free Trade Agreement (TFTA). This will create one of the world’s largest free trade areas, stretching across 26 countries with a combined GDP of around £1 trillion. (Source: https://uk.reuters.com/article/uk-africa-trade/mega-african-trade-bloc- paves-way-for-continental-commerce-idUKKBN0OR28M20150611) Evaluate the effects of the growth of trading blocs such as the TFTA on global trading patterns.
Since the global financial crisis of 2008 there have been over 5 700 increases in tariffs, quotas and administrative controls on international trade. Evaluate the likely effects of an increase in protectionism on the economy of a developing country of your choice.
Tap a question to zoom it. The data and extracts fold out above each question; the mark scheme and examiner's comment open underneath.
June 2025 · Paper 2 · Q4(a)2 marksAO1=2Short answerHard
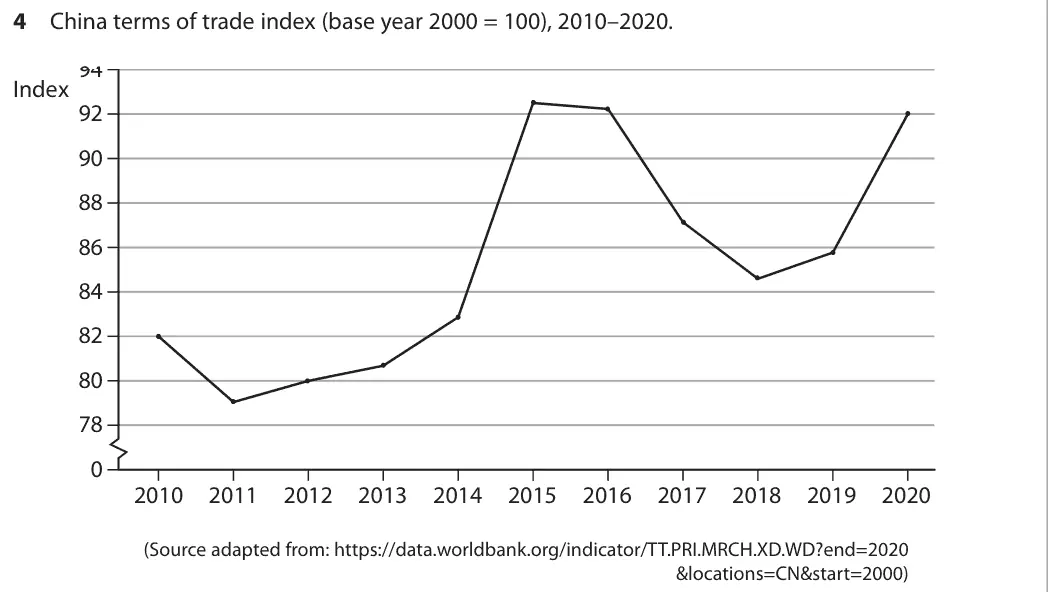
Data and extracts for question 4
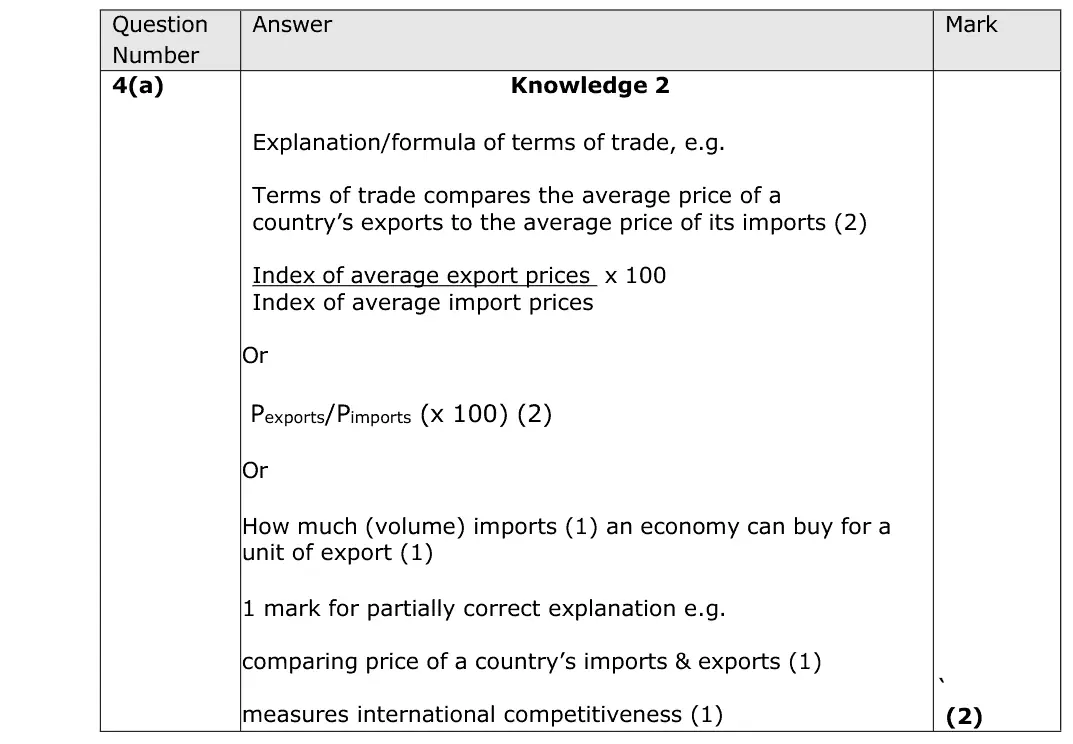
Mark scheme
Examiner's comment
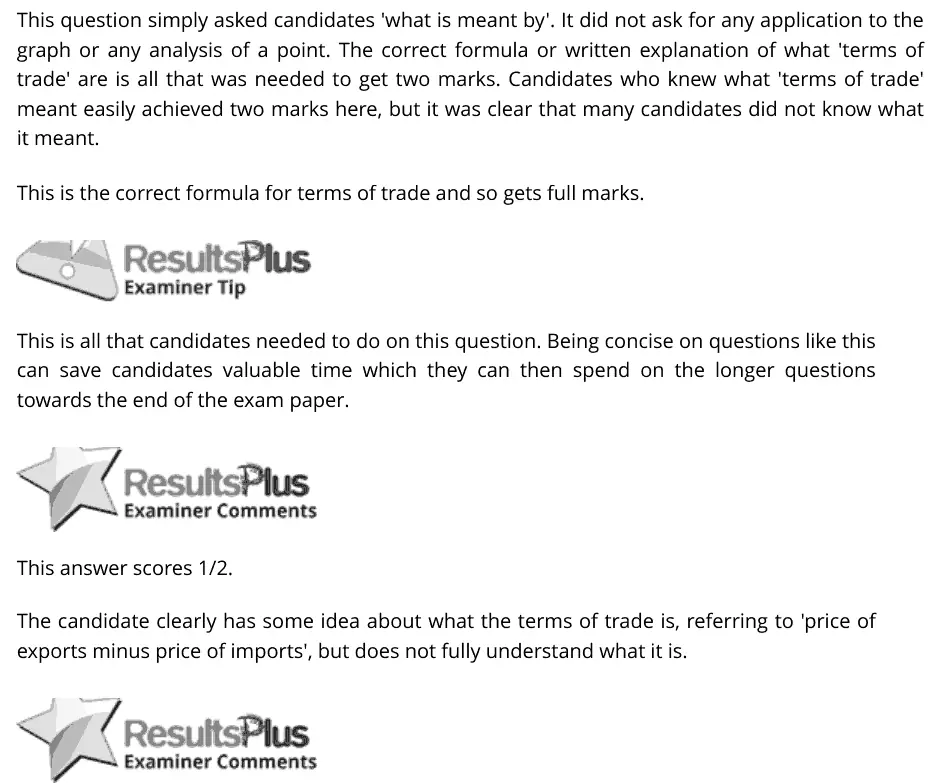
This question simply asked candidates 'what is meant by'. It did not ask for any application to the graph or any analysis of a point. The correct formula or written explanation of what 'terms of trade' are is all that was needed to get two marks. Candidates who knew what 'terms of trade' meant easily achieved two marks here, but it was clear that many candidates did not know what it meant. This is the correct formula for terms of trade and so gets full marks. This is all that candidates needed to do on this question. Being concise on questions like this can save candidates valuable time which they can then spend on the longer questions towards the end of the exam paper. This answer scores 1/2. The candidate clearly has some idea about what the terms of trade is, referring to 'price of exports minus price of imports', but does not fully understand what it is.
Notes from the mark scheme and report
terms of trade = index of average export prices / index of average import prices x 100
no application needed
report: "it was clear that many candidates did not know what it meant"
Quantitative skills: QS 5 (calculate and interpret index numbers)
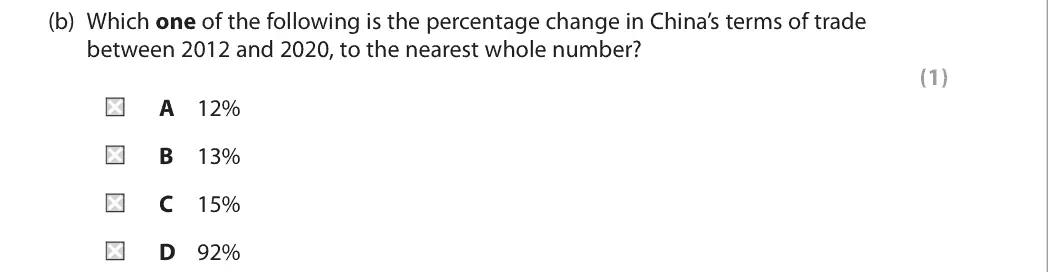
June 2025 · Paper 2 · Q4(b)1 markMultiple choice
Data and extracts for question 4
Answer
C
Mark scheme
Notes from the mark scheme and report
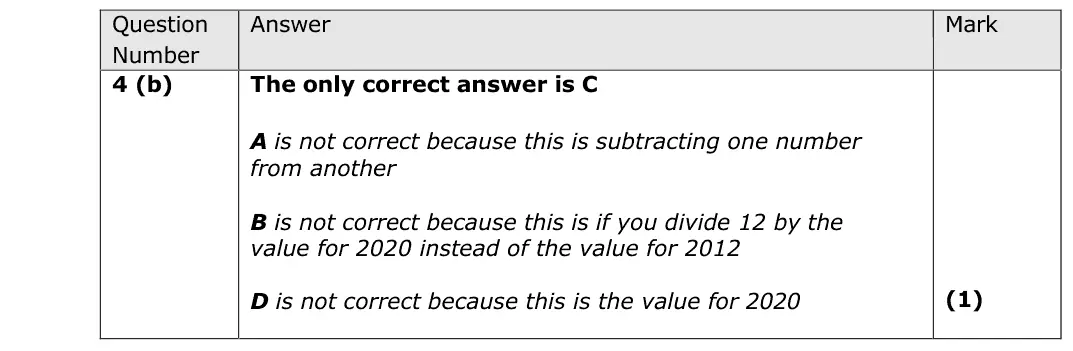
(92 - 80) / 80 x 100 = 15% (C)
A is the 12-point change, B divides 12 by the 2020 value 92, D is the 2020 index
Quantitative skills: QS 2 (calculate, use and understand percentages, percentage changes and percentage point changes); QS 5 (calculate and interpret index numbers); QS 9 (interpret, apply and analyse information in written, graphical tabular and numerical forms)
June 2025 · Paper 2 · Q4(c)2 marksAO1=1, AO3=1Short answerHard
Data and extracts for question 4
Mark scheme
Examiner's comment
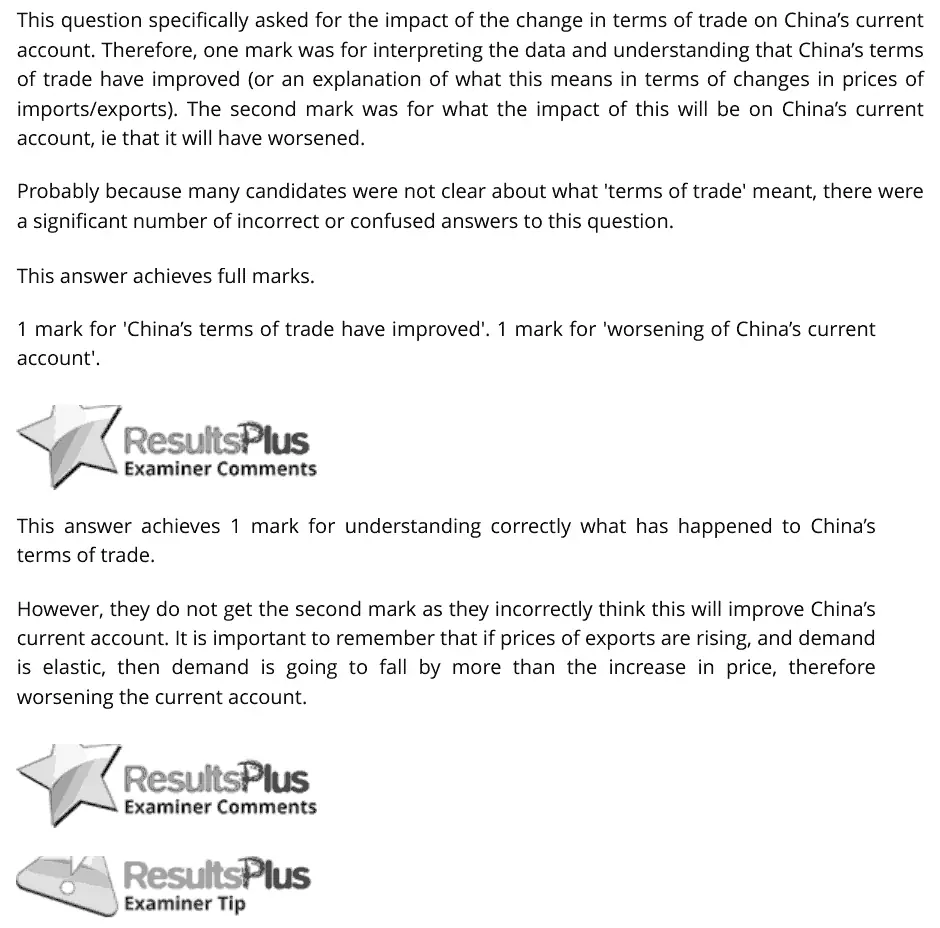
This question specifically asked for the impact of the change in terms of trade on China’s current account. Therefore, one mark was for interpreting the data and understanding that China’s terms of trade have improved (or an explanation of what this means in terms of changes in prices of imports/exports). The second mark was for what the impact of this will be on China’s current account, ie that it will have worsened. Probably because many candidates were not clear about what 'terms of trade' meant, there were a significant number of incorrect or confused answers to this question. This answer achieves full marks. 1 mark for 'China’s terms of trade have improved'. 1 mark for 'worsening of China’s current account'. This answer achieves 1 mark for understanding correctly what has happened to China’s terms of trade. However, they do not get the second mark as they incorrectly think this will improve China’s current account. It is important to remember that if prices of exports are rising, and demand is elastic, then demand is going to fall by more than the increase in price, therefore worsening the current account.
Notes from the mark scheme and report
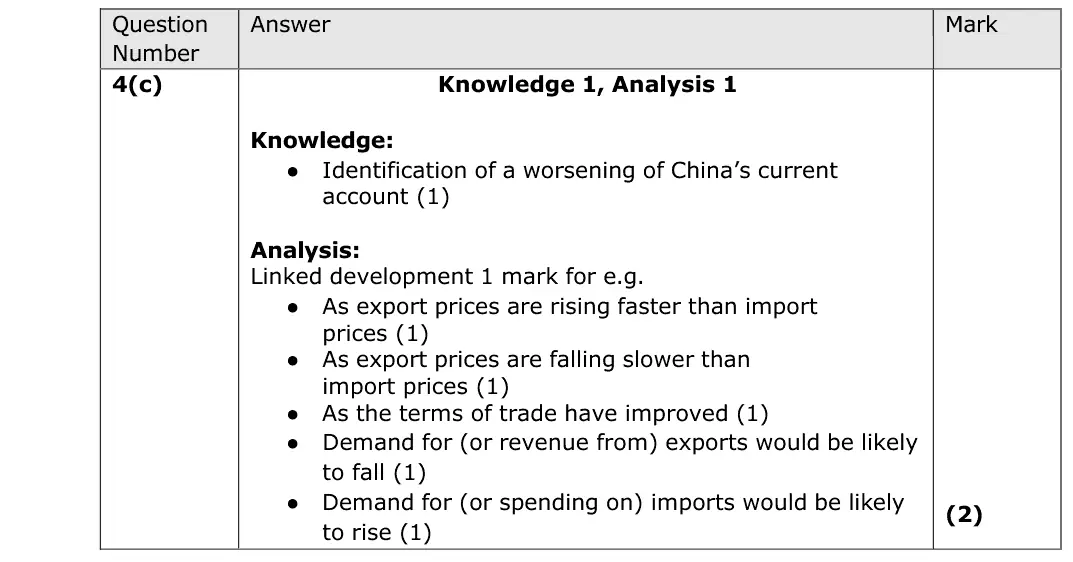
terms of trade improved (export prices rose relative to import prices)
with price elastic demand export revenue falls and import spending rises, so the current account worsens
report: "a significant number of incorrect or confused answers", many thought it would improve
Quantitative skills: QS 9 (interpret, apply and analyse information in written, graphical tabular and numerical forms)
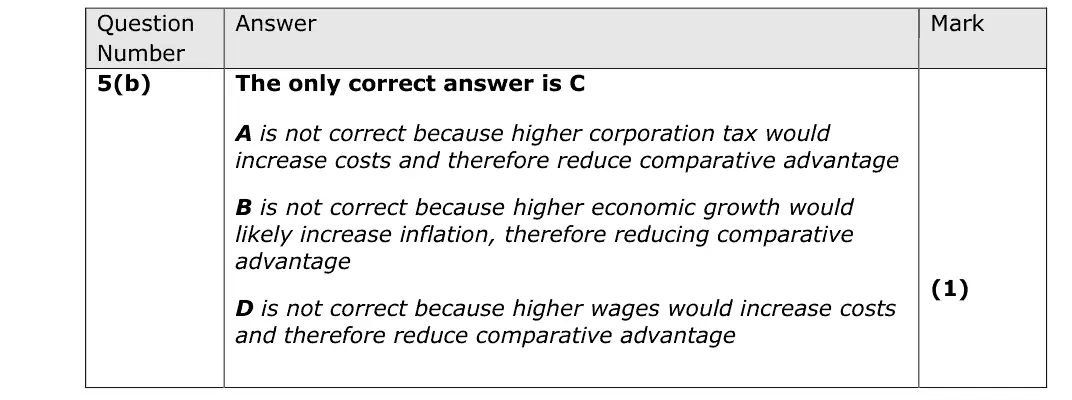
June 2024 · Paper 2 · Q5(b)1 markMultiple choice
Data and extracts for question 5
Answer
C
Mark scheme
Notes from the mark scheme and report
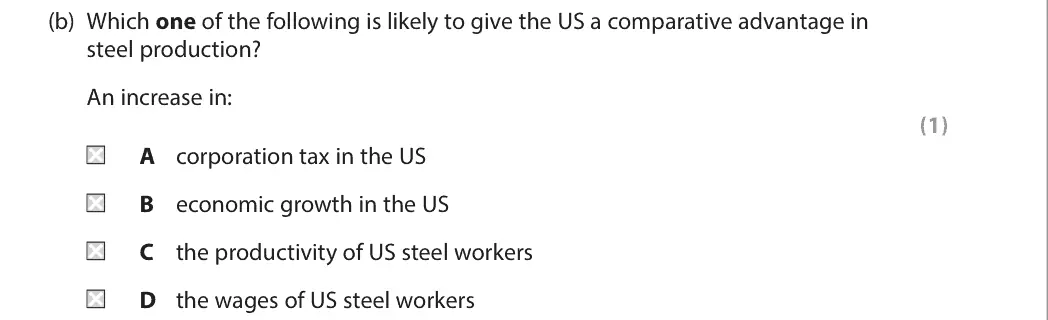
higher productivity of US steel workers lowers the opportunity cost of steel (C)
A higher corporation tax and D higher wages raise costs
B growth may raise inflation
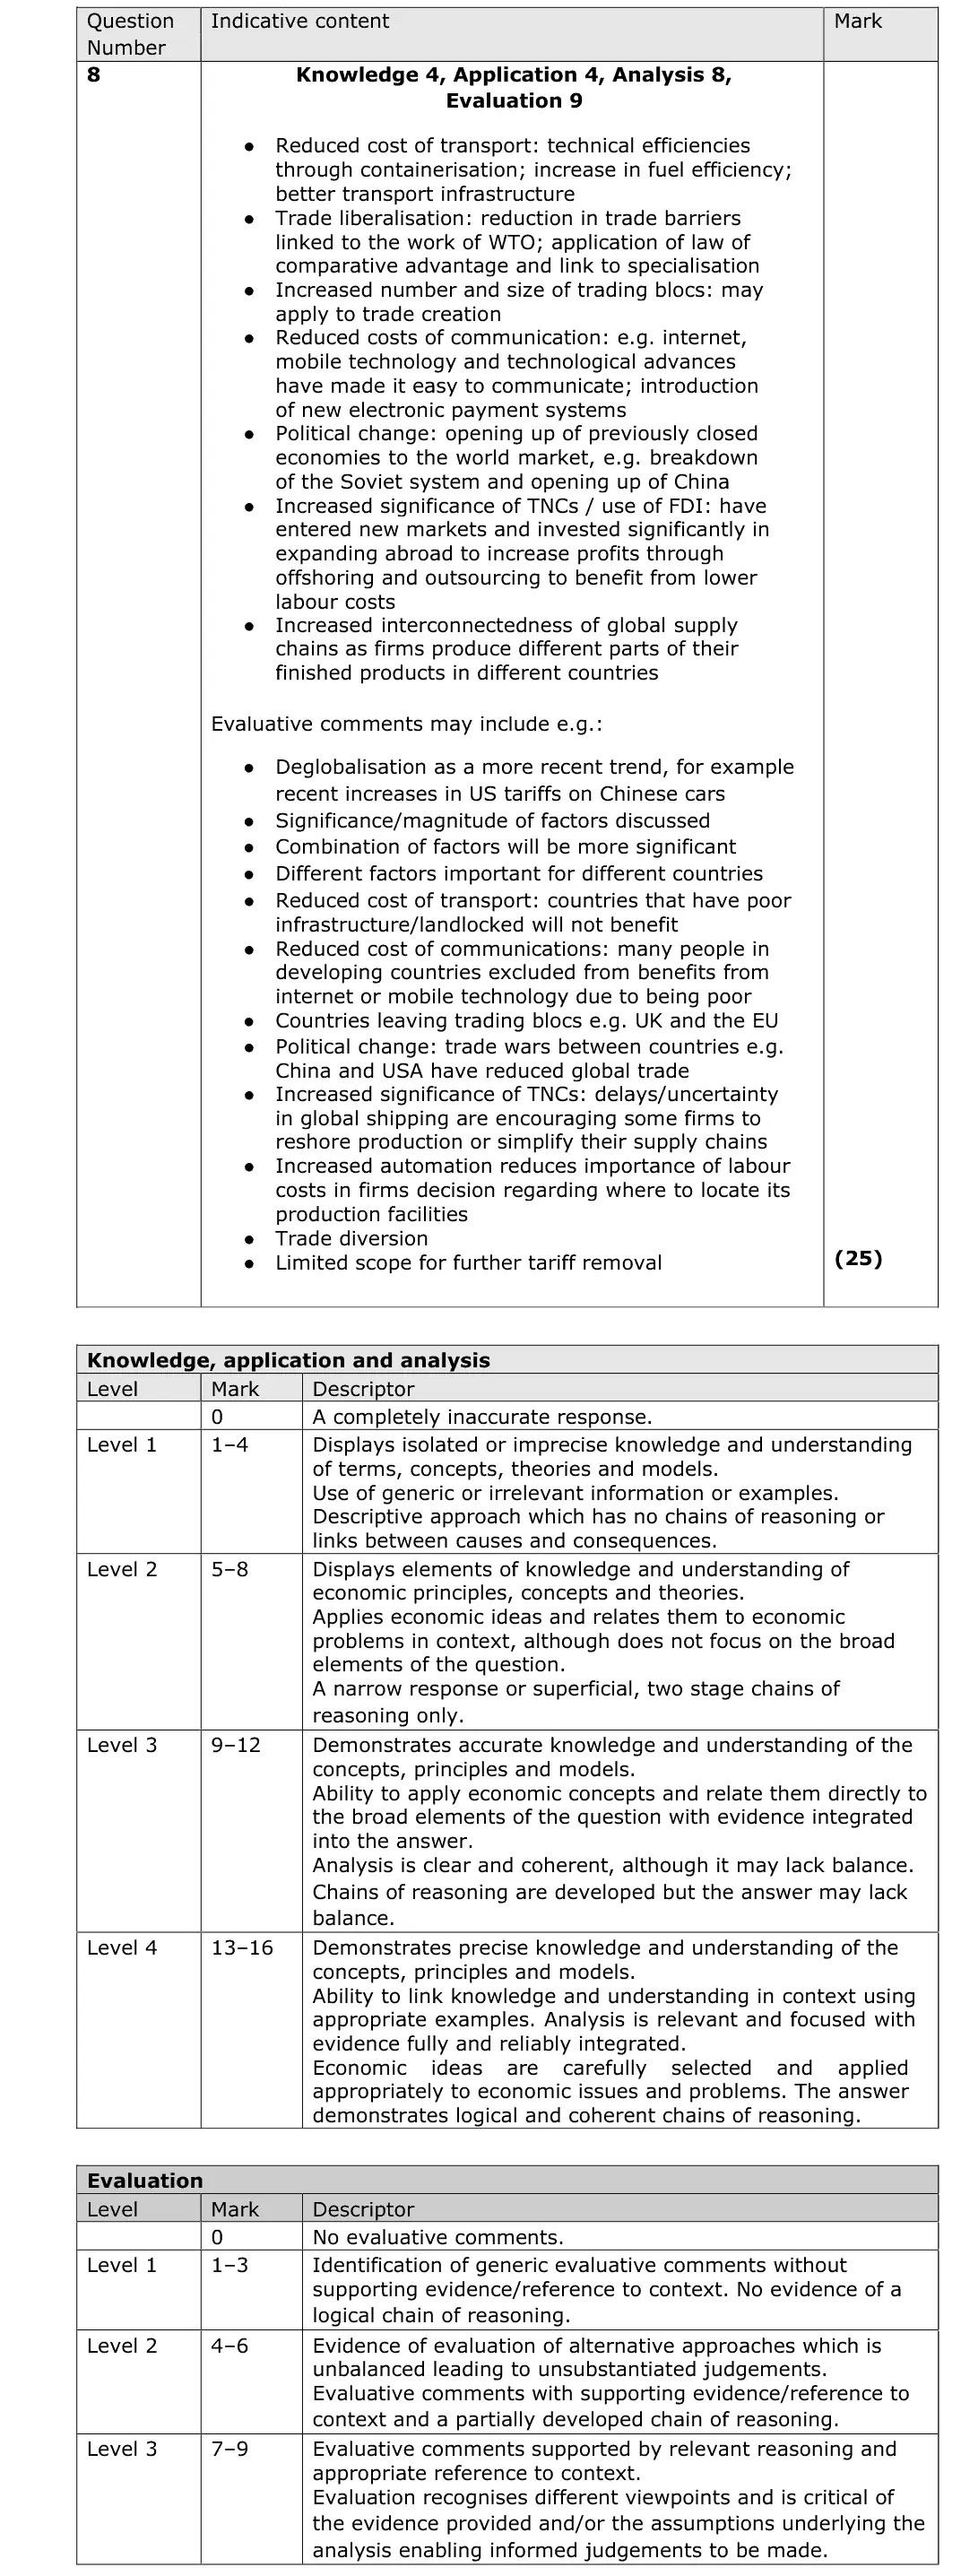
June 2024 · Paper 2 · Q825 marksAO1=4, AO2=4, AO3=8, AO4=925-mark essayEither/or
Mark scheme, including the levels grid and indicative content
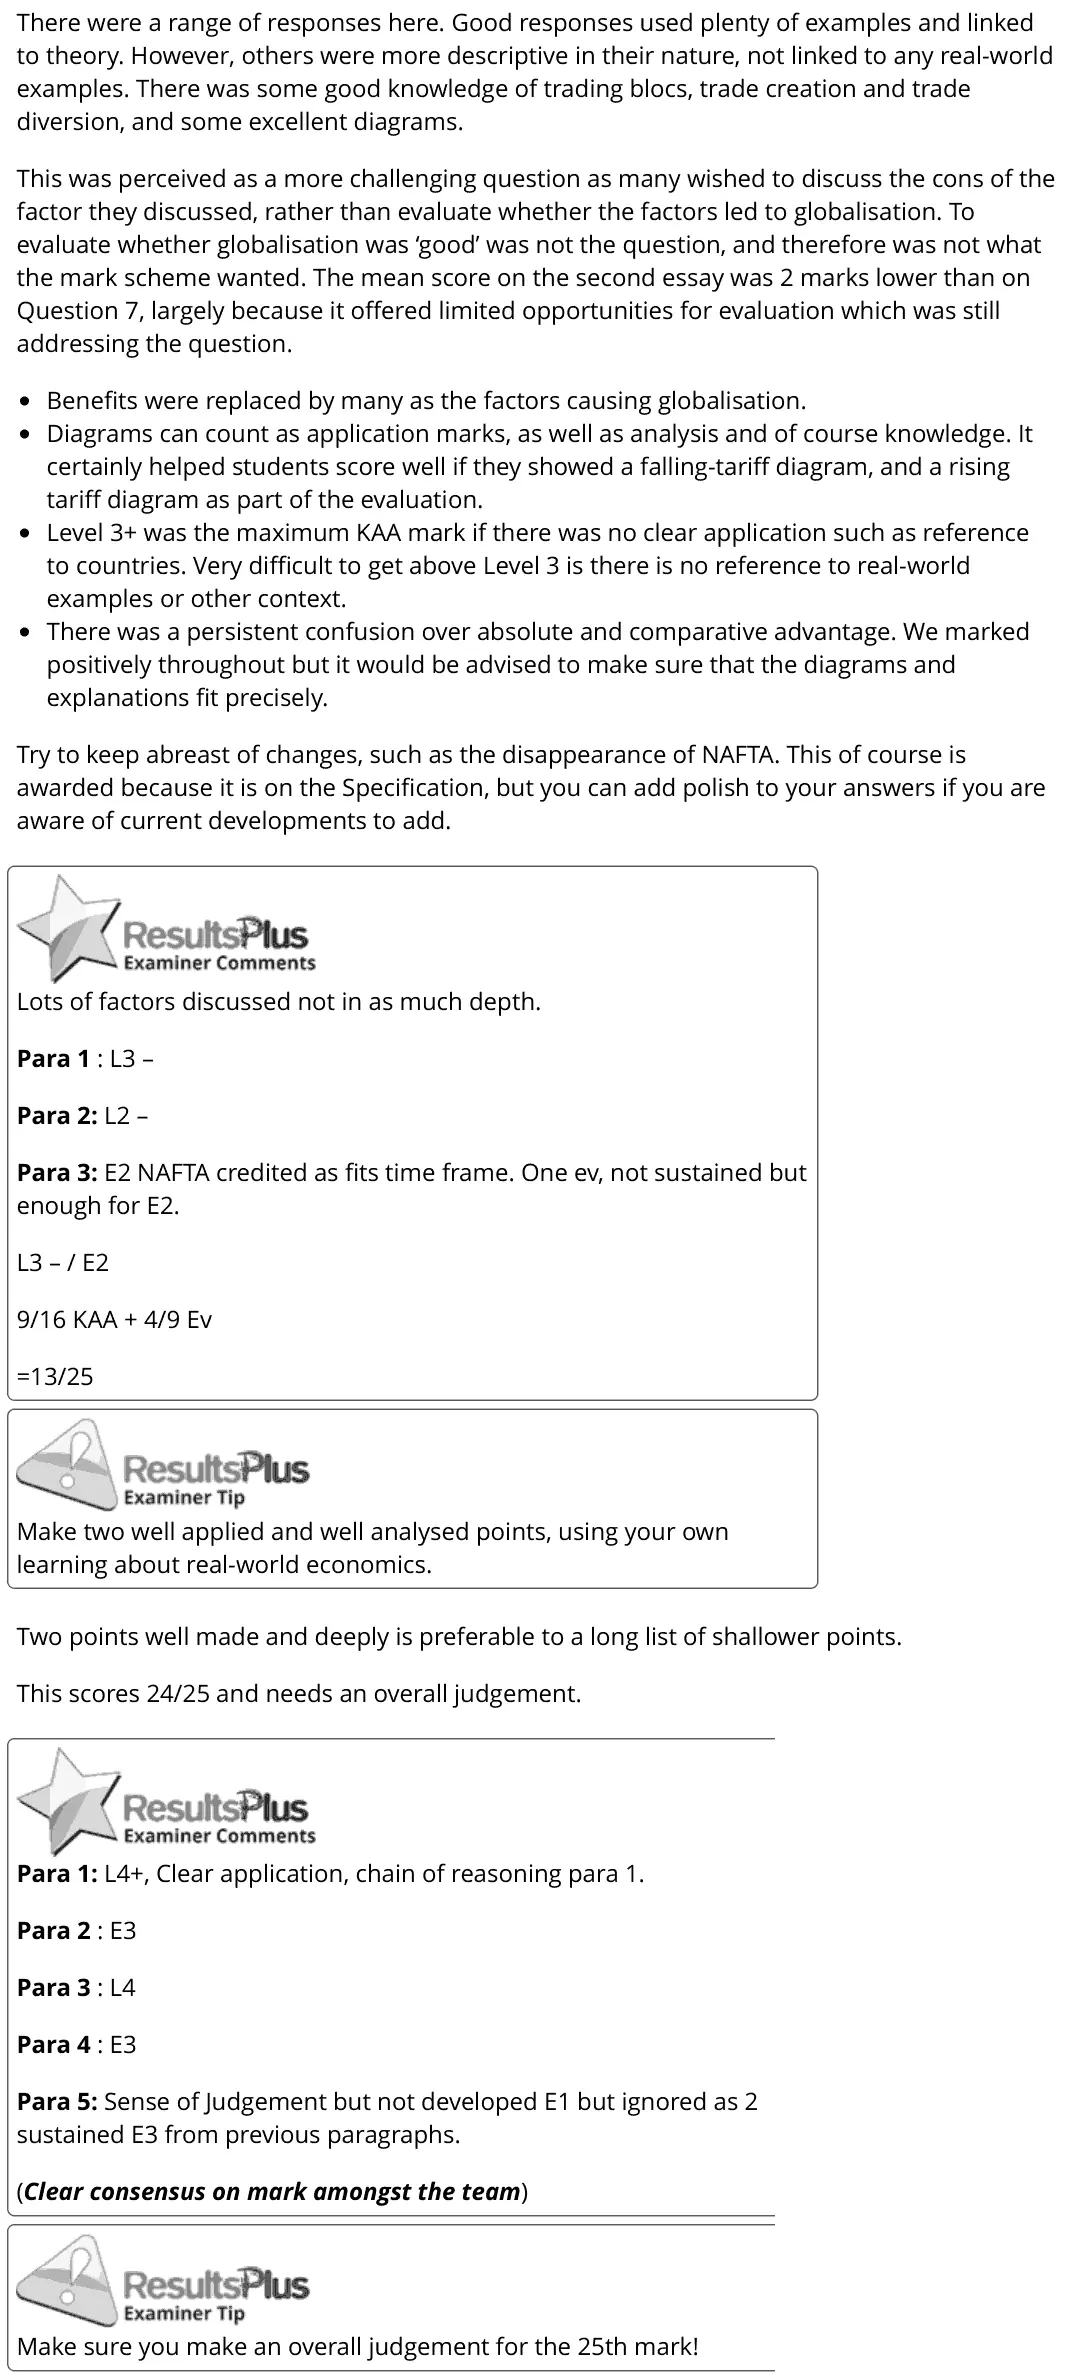
Examiner's comment
There were a range of responses here. Good responses used plenty of examples and linked to theory. However, others were more descriptive in their nature, not linked to any real-world examples. There was some good knowledge of trading blocs, trade creation and trade diversion, and some excellent diagrams. This was perceived as a more challenging question as many wished to discuss the cons of the factor they discussed, rather than evaluate whether the factors led to globalisation. To evaluate whether globalisation was ‘good’ was not the question, and therefore was not what the mark scheme wanted. The mean score on the second essay was 2 marks lower than on Question 7, largely because it offered limited opportunities for evaluation which was still addressing the question. Benefits were replaced by many as the factors causing globalisation. Diagrams can count as application marks, as well as analysis and of course knowledge. It certainly helped students score well if they showed a falling-tariff diagram, and a rising tariff diagram as part of the evaluation. Level 3+ was the maximum KAA mark if there was no clear application such as reference to countries. Very difficult to get above Level 3 is there is no reference to real-world examples or other context. There was a persistent confusion over absolute and comparative advantage. We marked positively throughout but it would be advised to make sure that the diagrams and explanations fit precisely. Try to keep abreast of changes, such as the disappearance of NAFTA. This of course is awarded because it is on the Specification, but you can add polish to your answers if you are aware of current developments to add. Lots of factors discussed not in as much depth. Para 1 : L3 – Para 2: L2 – Para 3: E2 NAFTA credited as fits time frame. One ev, not sustained but enough for E2. L3 – / E2 9/16 KAA + 4/9 Ev =13/25 Make two well applied and well analysed points, using your own learning about real-world economics. Two points well made and deeply is preferable to a long list of shallower points. This scores 24/25 and needs an overall judgement. Para 1: L4+, Clear application, chain of reasoning para 1. Para 2 : E3 Para 3 : L4 Para 4 : E3 Para 5: Sense of Judgement but not developed E1 but ignored as 2 sustained E3 from previous paragraphs. (Clear consensus on mark amongst the team) Make sure you make an overall judgement for the 25th mark!
Notes from the mark scheme and report
factors: lower transport and communication costs, trade liberalisation and the WTO, trading blocs, TNCs and FDI, opening of China and former Soviet economies
evaluate the significance of each factor and deglobalisation, NOT whether globalisation is good
report: mean 2 marks lower than Q7 as many discussed the costs of globalisation
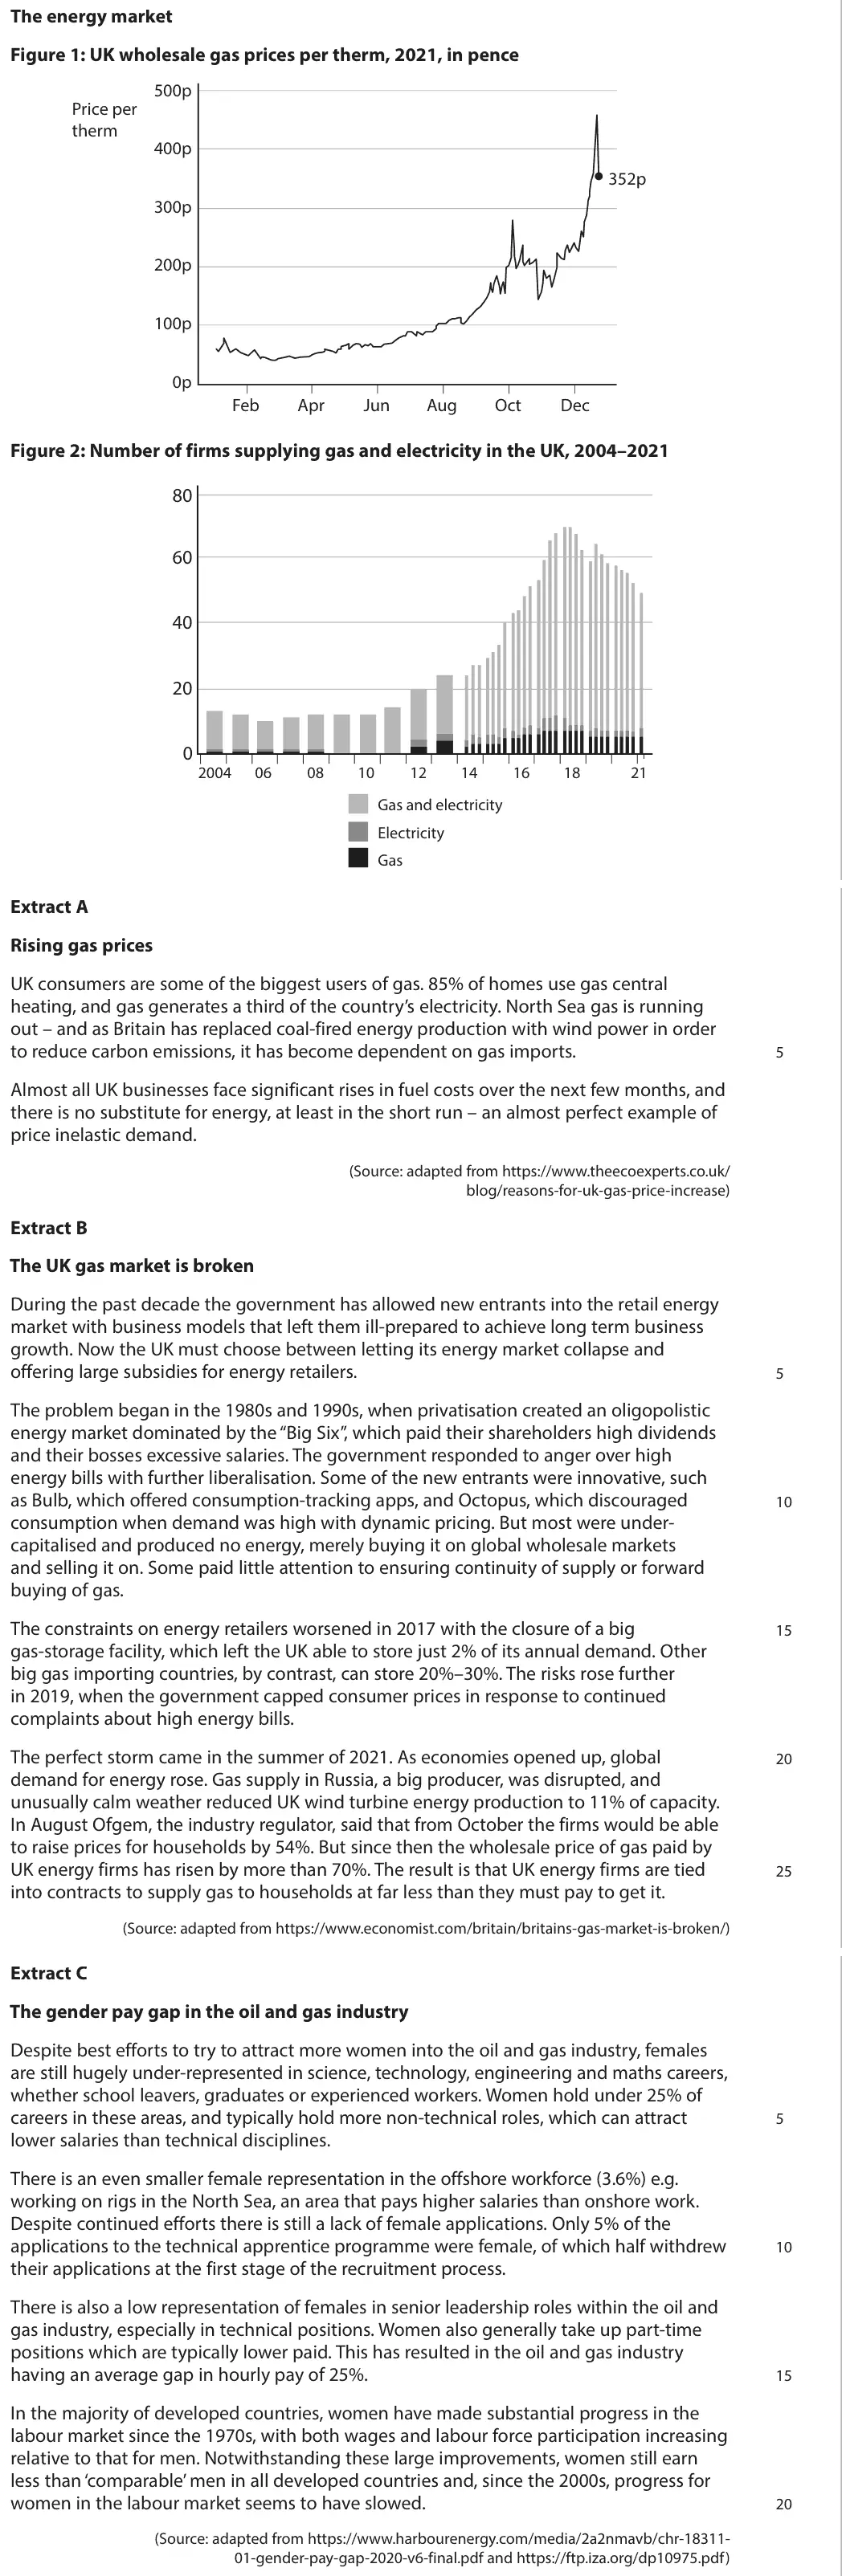
June 2024 · Paper 3 · Q1(e)25 marksAO1=4, AO2=4, AO3=8, AO4=925-mark essayEither/or
Data and extracts for question 1
Mark scheme, including the levels grid and indicative content
Examiner's comment
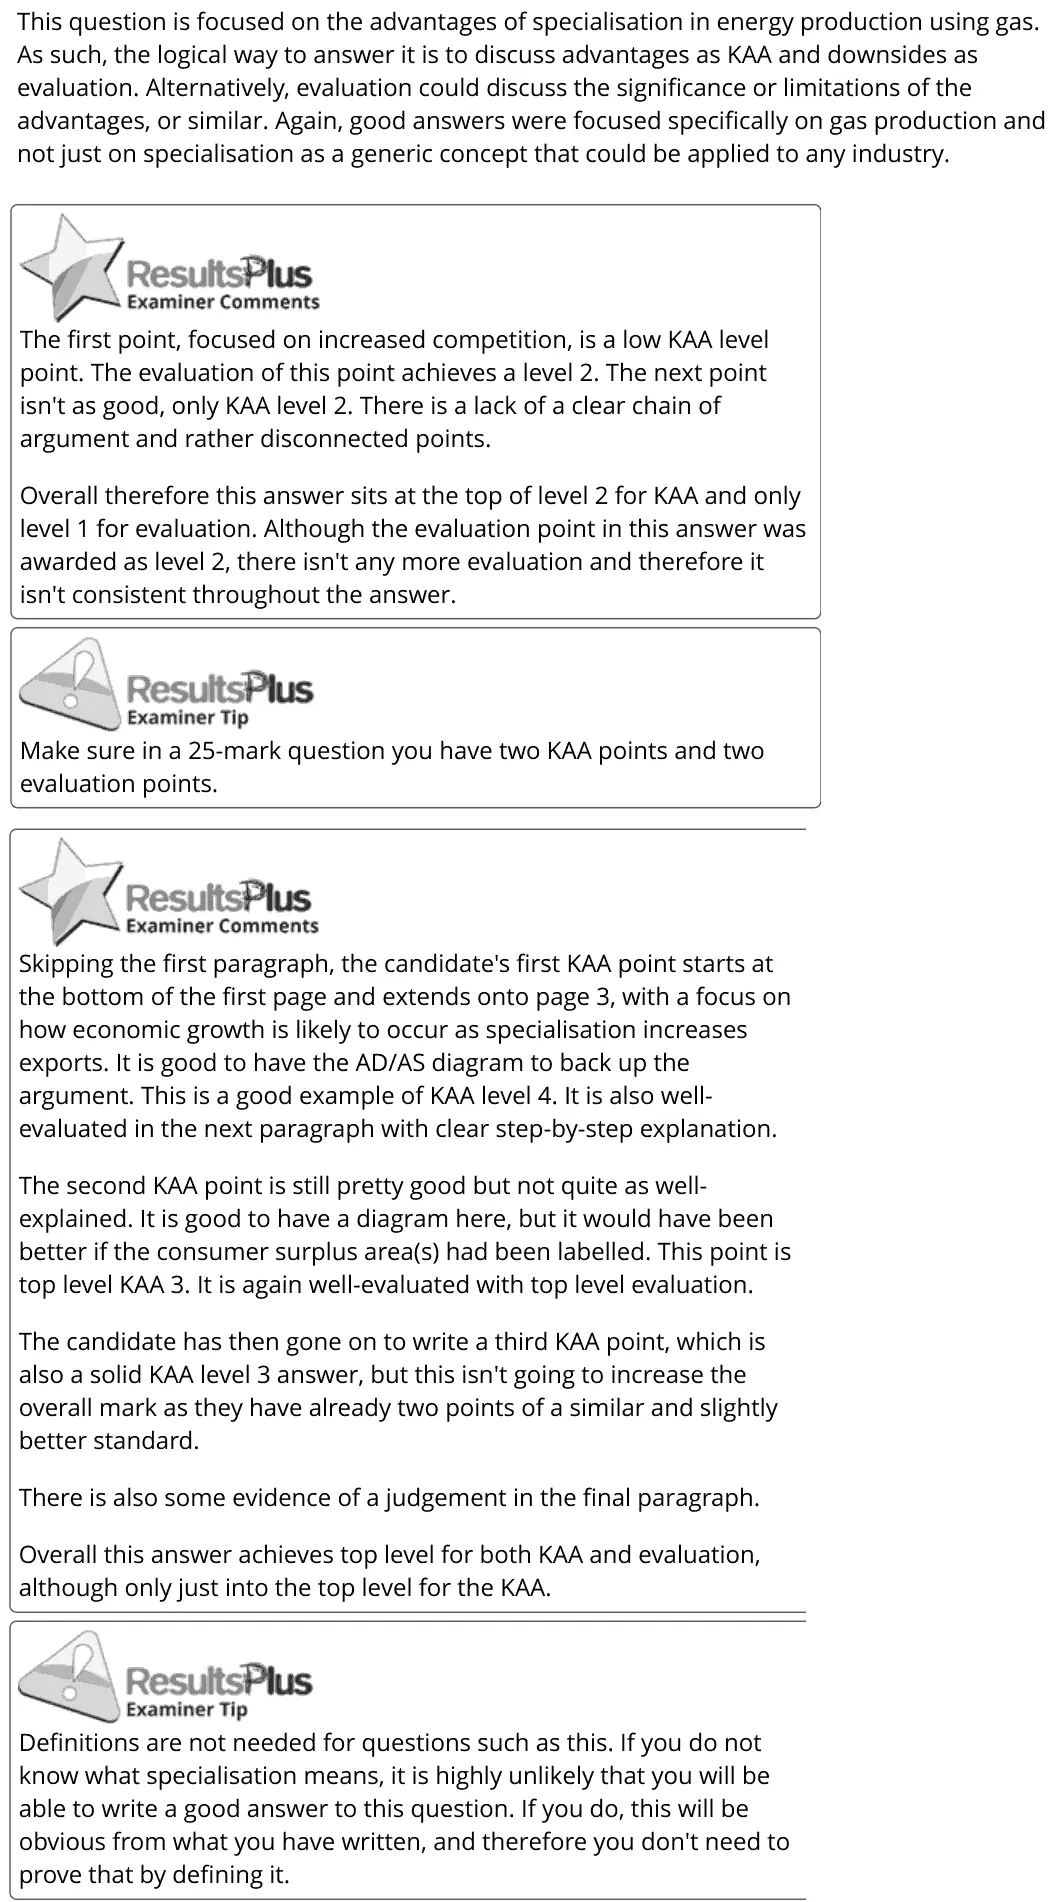
This question is focused on the advantages of specialisation in energy production using gas. As such, the logical way to answer it is to discuss advantages as KAA and downsides as evaluation. Alternatively, evaluation could discuss the significance or limitations of the advantages, or similar. Again, good answers were focused specifically on gas production and not just on specialisation as a generic concept that could be applied to any industry. <6ResultsPlus The first point, focused on increased competition, is a low KAA level point. The evaluation of this point achieves a level 2. The next point isn't as good, only KAA level 2. There is a lack of a clear chain of argument and rather disconnected points. Overall therefore this answer sits at the top of level 2 for KAA and only level 1 for evaluation. Although the evaluation point in this answer was awarded as level 2, there isn't any more evaluation and therefore it isn't consistent throughout the answer. GEG ResultsPlus Make sure in a 25-mark question you have two KAA points and two evaluation points. <p BesultsPtus Skipping the first paragraph, the candidate's first KAA point starts at the bottom of the first page and extends onto page 3, with a focus on how economic growth is likely to occur as specialisation increases exports. It is good to have the AD/AS diagram to back up the argument. This is a good example of KAA level 4. It is also well- evaluated in the next paragraph with clear step-by-step explanation. The second KAA point is still pretty good but not quite as well- explained. It is good to have a diagram here, but it would have been better if the consumer surplus area(s) had been labelled. This point is top level KAA 3. It is again well-evaluated with top level evaluation. The candidate has then gone on to write a third KAA point, which is also a solid KAA level 3 answer, but this isn't going to increase the overall mark as they have already two points of a similar and slightly better standard. There is also some evidence of a judgement in the final paragraph. Overall this answer achieves top level for both KAA and evaluation, although only just into the top level for the KAA. GM) | Examiner Tip Definitions are not needed for questions such as this. If you do not know what specialisation means, it is highly unlikely that you will be able to write a good answer to this question. If you do, this will be obvious from what you have written, and therefore you don't need to prove that by defining it.
Notes from the mark scheme and report
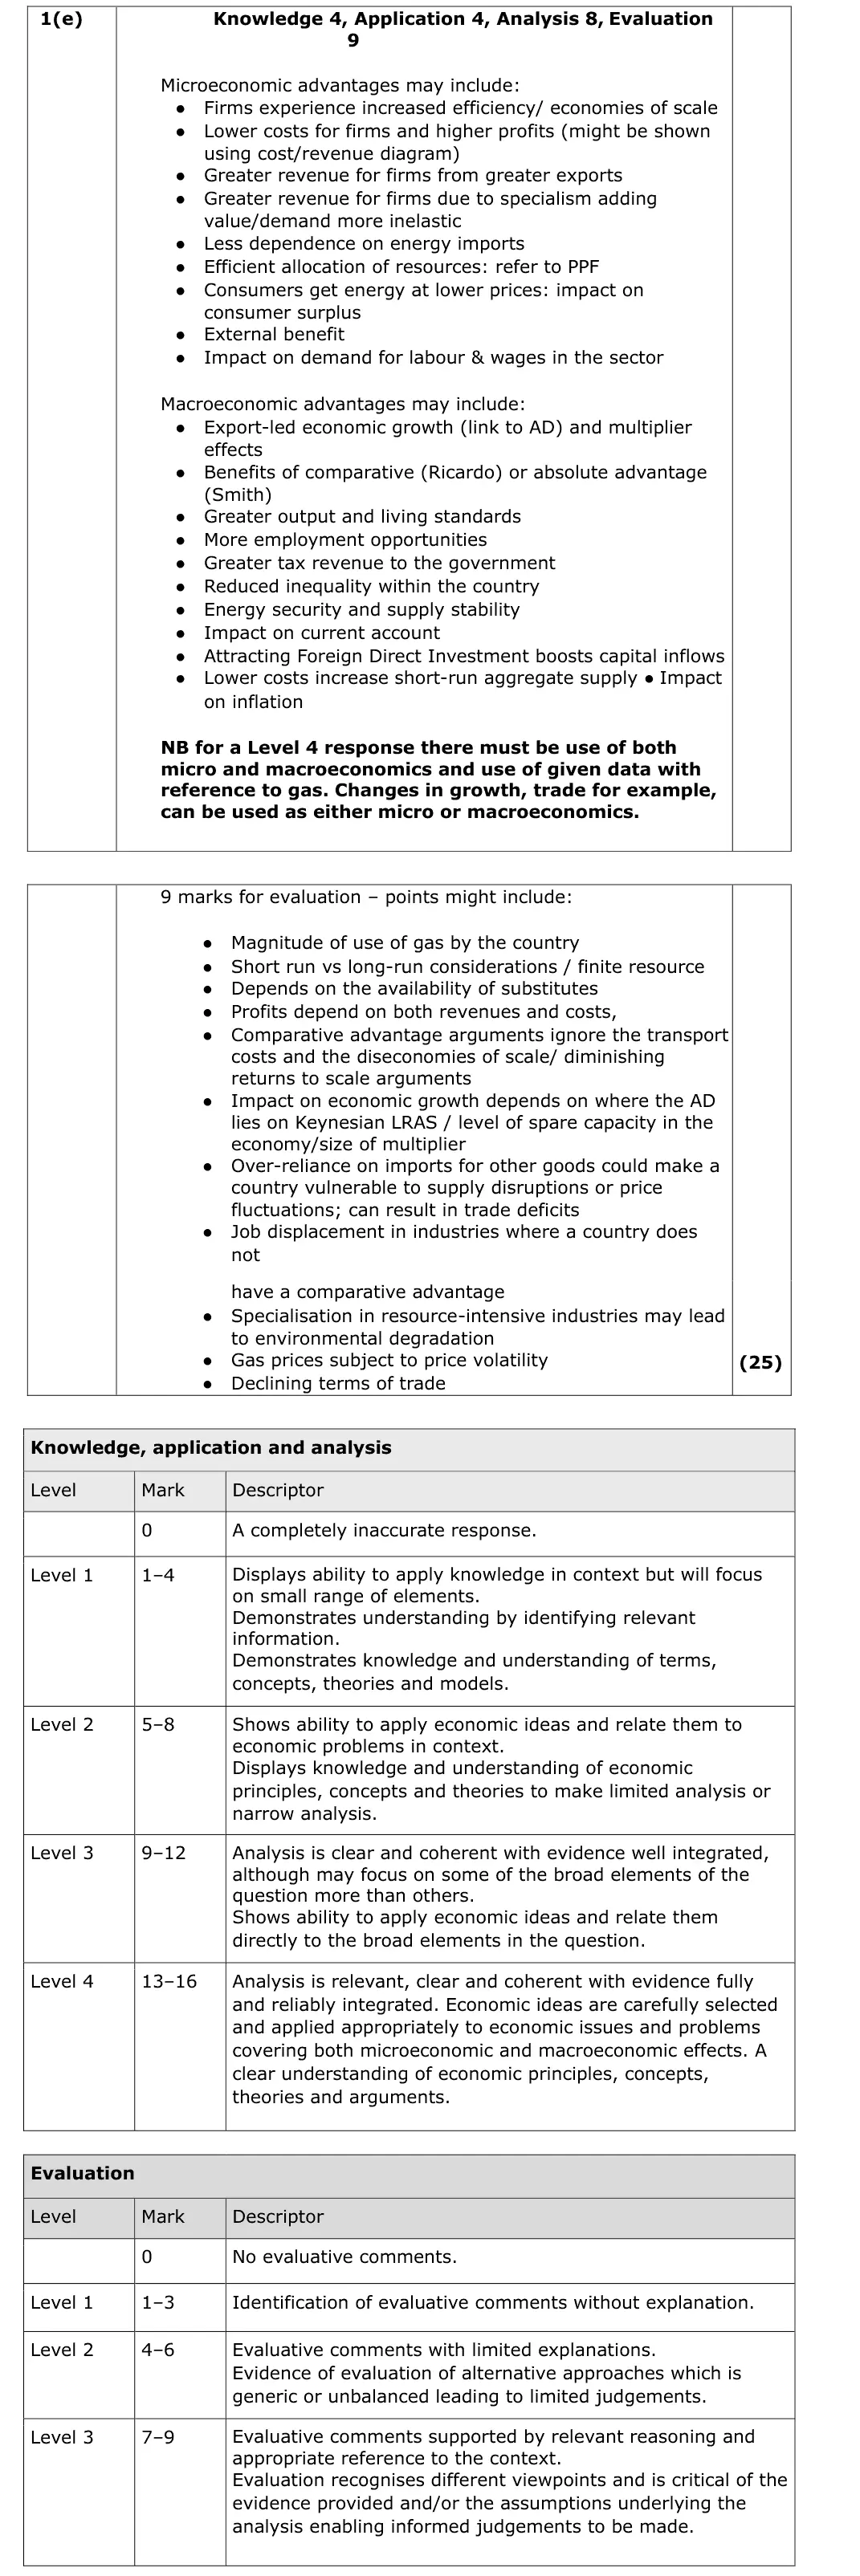
micro: economies of scale, lower costs and higher profits, exports
macro: export-led growth and multiplier, comparative advantage, jobs, tax revenue, energy security
Level 4 needs both micro and macro applied to gas
evaluate with finite resource, price volatility, over-dependence, environmental damage
June 2022 · Paper 2 · Q825 marksAO1=4, AO2=4, AO3=8, AO4=925-mark essayEither/or
Mark scheme, including the levels grid and indicative content
Examiner's comment
The focus in this question was on the impact of globalisation on the global economy. Comparative advantage was frequently discussed by candidates, although many struggled to properly explain how it worked or provided plausible real-world examples. In terms of evaluation of comparative advantage, some of the better responses clearly critiqued it whilst still keeping their focus on globalisation. Weaker responses tended to lose focus and discussed the impact of protectionism on comparative advantage. Other benefits included higher economic growth, more jobs, and more competition between firms leading to lower prices and/or better quality. This is an excellent, high-quality response that was awarded 23 marks and met the criteria for the top levels of both KAA and evaluation. There are excellent chains of argument throughout, earning full marks for KAA. The evaluation is also of a high quality, although there is a lack of an overall judgement which prevents it from gaining full marks for evaluation. This answer is shorter than the exemplar of a top-levels candidate response in question 7, but they both demonstrate what is expected to achieve these levels. Focus on the quality of the argument when reading this example.
Notes from the mark scheme and report
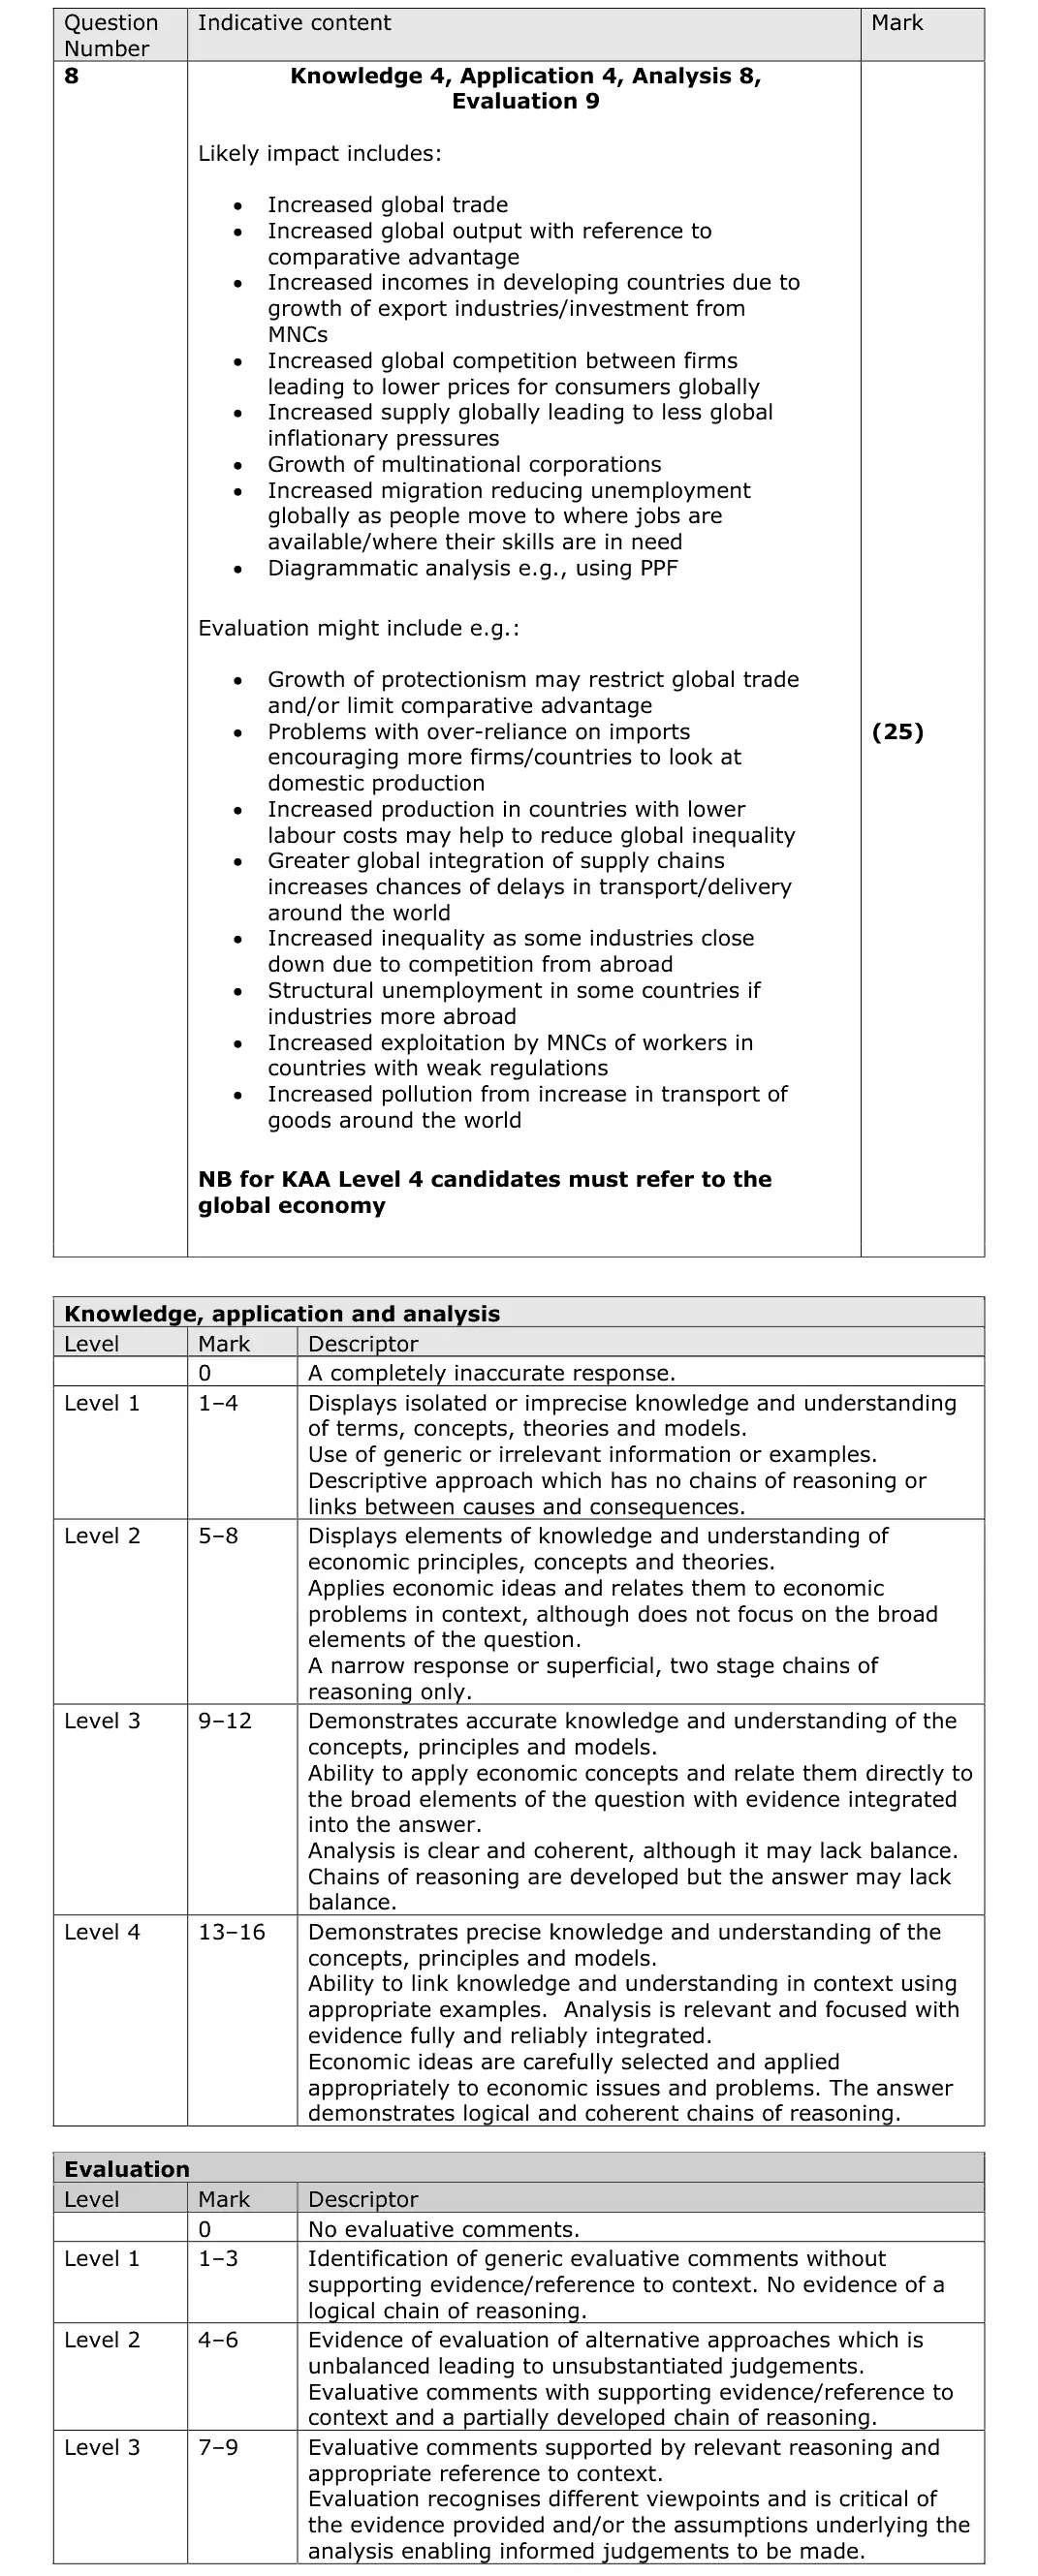
more trade and output via comparative advantage, MNC investment, lower prices, migration
KAA Level 4 must refer to the global economy
many struggled to explain comparative advantage with plausible examples
evaluate with inequality, structural unemployment, exploitation, pollution, supply chain risk
June 2022 · Paper 3 · Q2(c)12 marksAO1=2, AO2=2, AO3=4, AO4=412-mark responseHard
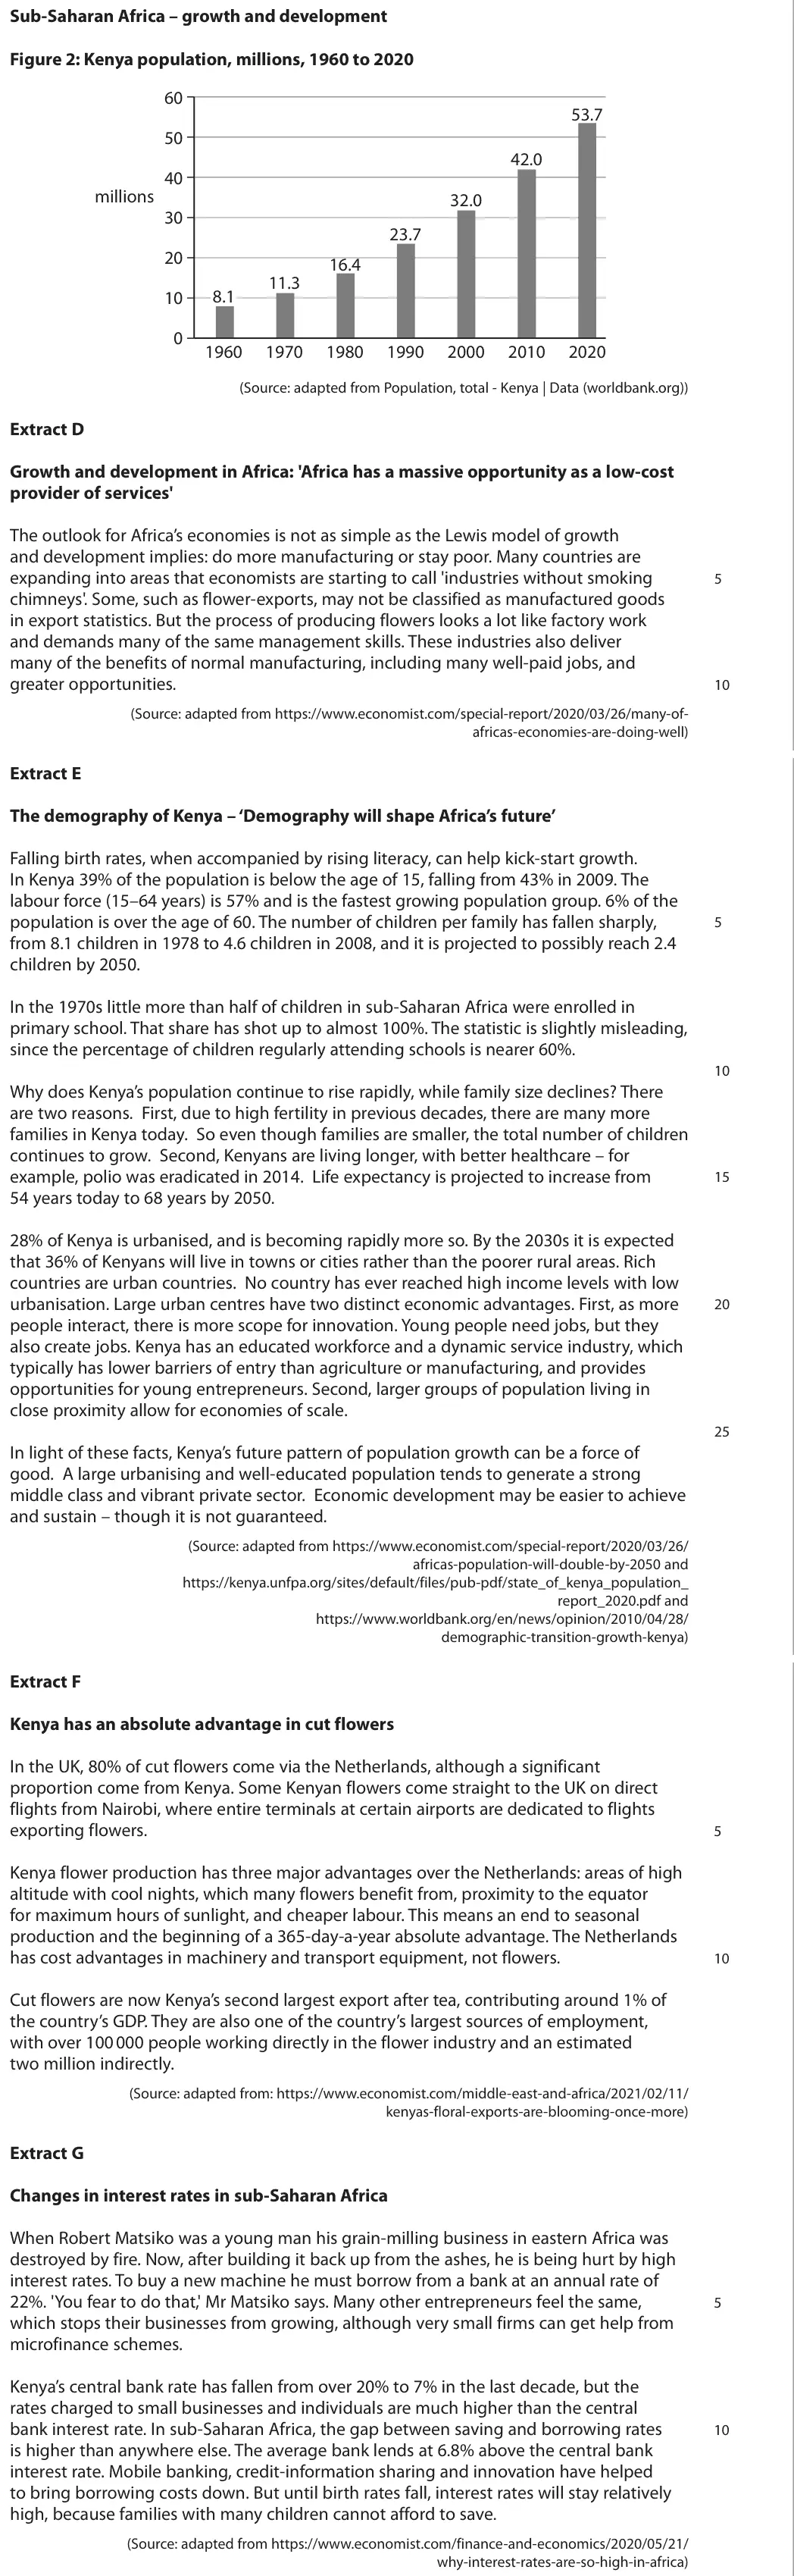
Data and extracts for question 2
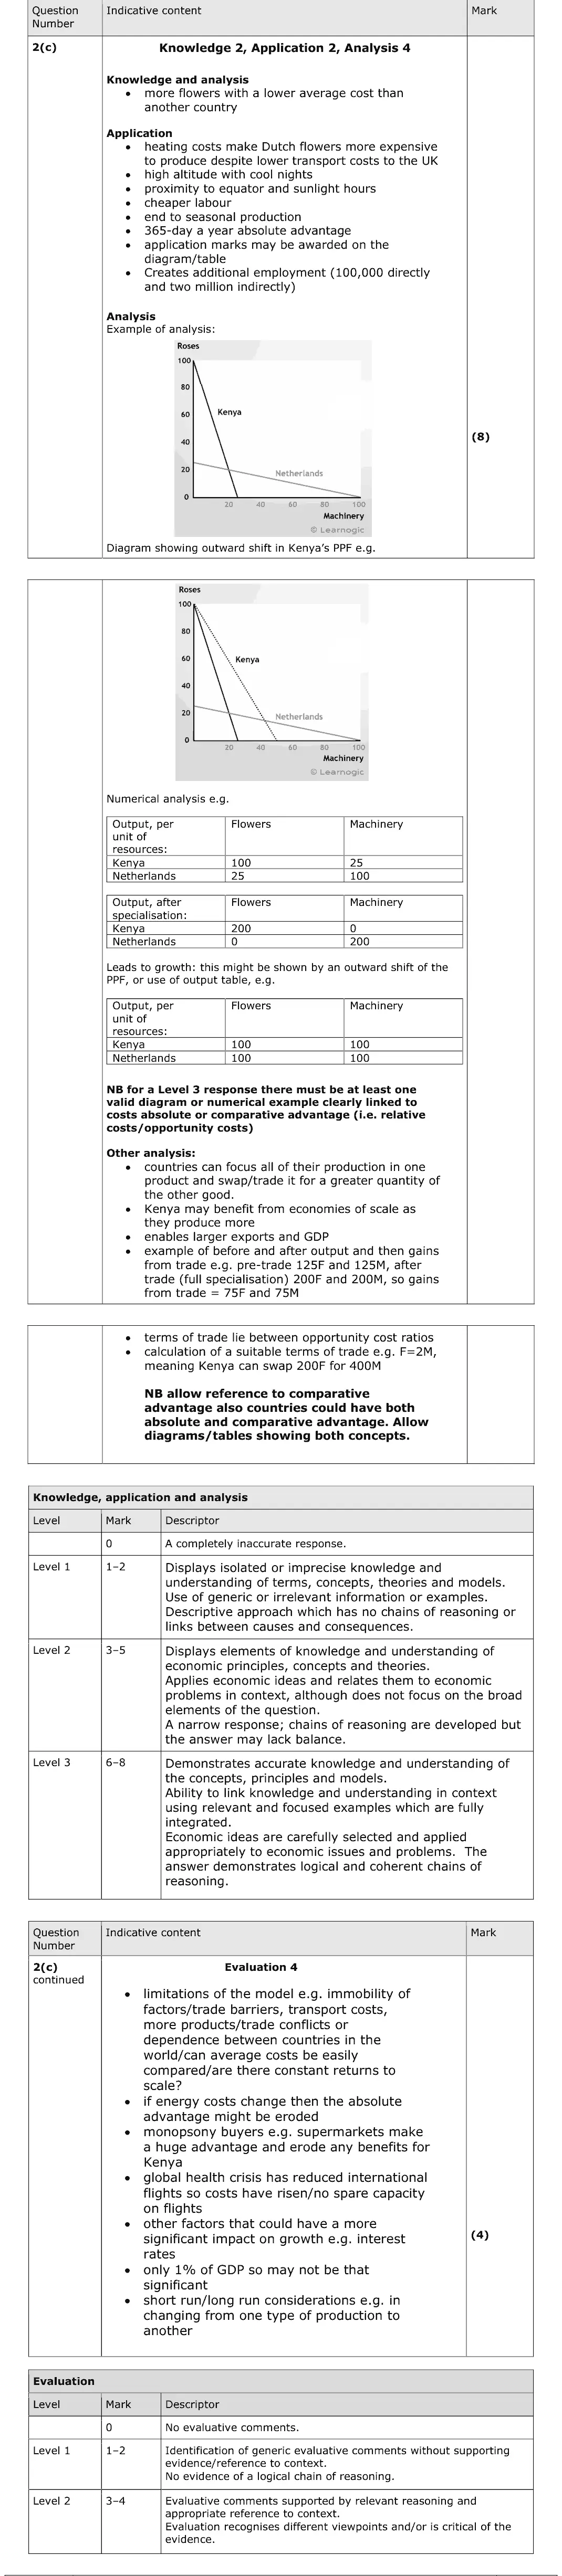
Mark scheme, including the levels grid and indicative content
Examiner's comment
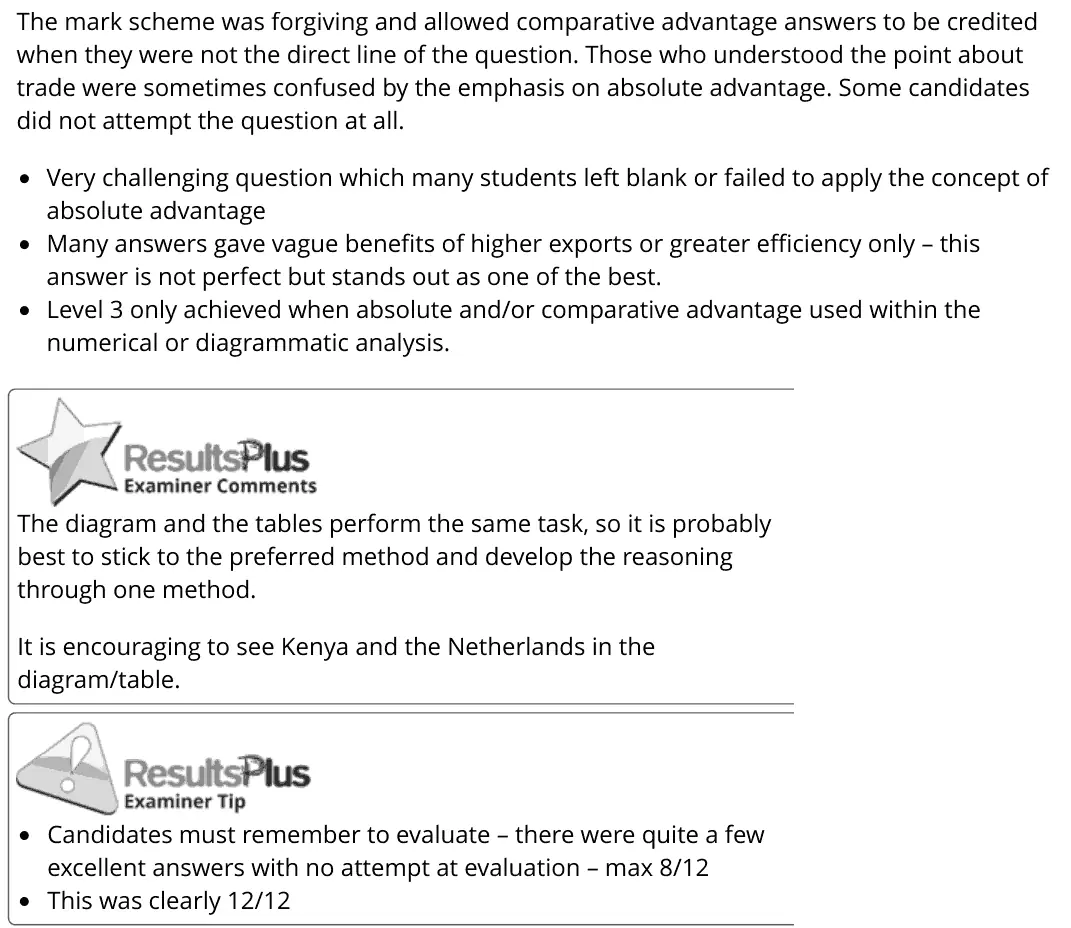
The mark scheme was forgiving and allowed comparative advantage answers to be credited when they were not the direct line of the question. Those who understood the point about trade were sometimes confused by the emphasis on absolute advantage. Some candidates did not attempt the question at all. Very challenging question which many students left blank or failed to apply the concept of absolute advantage Many answers gave vague benefits of higher exports or greater efficiency only – this answer is not perfect but stands out as one of the best. Level 3 only achieved when absolute and/or comparative advantage used within the numerical or diagrammatic analysis. The diagram and the tables perform the same task, so it is probably best to stick to the preferred method and develop the reasoning through one method. It is encouraging to see Kenya and the Netherlands in the diagram/table. Candidates must remember to evaluate – there were quite a few excellent answers with no attempt at evaluation – max 8/12 This was clearly 12/12
Notes from the mark scheme and report
Level 3 needs a numerical table or PPF diagram showing Kenya and the Netherlands specialising and gaining from trade (comparative advantage also credited)
use Extract F reasons (altitude, sunlight, cheap labour, no heating costs)
report: "Very challenging question which many students left blank or failed to apply the concept of absolute advantage"
Quantitative skills: QS 9 (interpret, apply and analyse information in written, graphical tabular and numerical forms)
October 2020 · Paper 2 · Q6(c)12 marksAO1=2, AO2=2, AO3=4, AO4=412-mark response
Data and extracts for question 6
Mark scheme, including the levels grid and indicative content
Examiner's comment
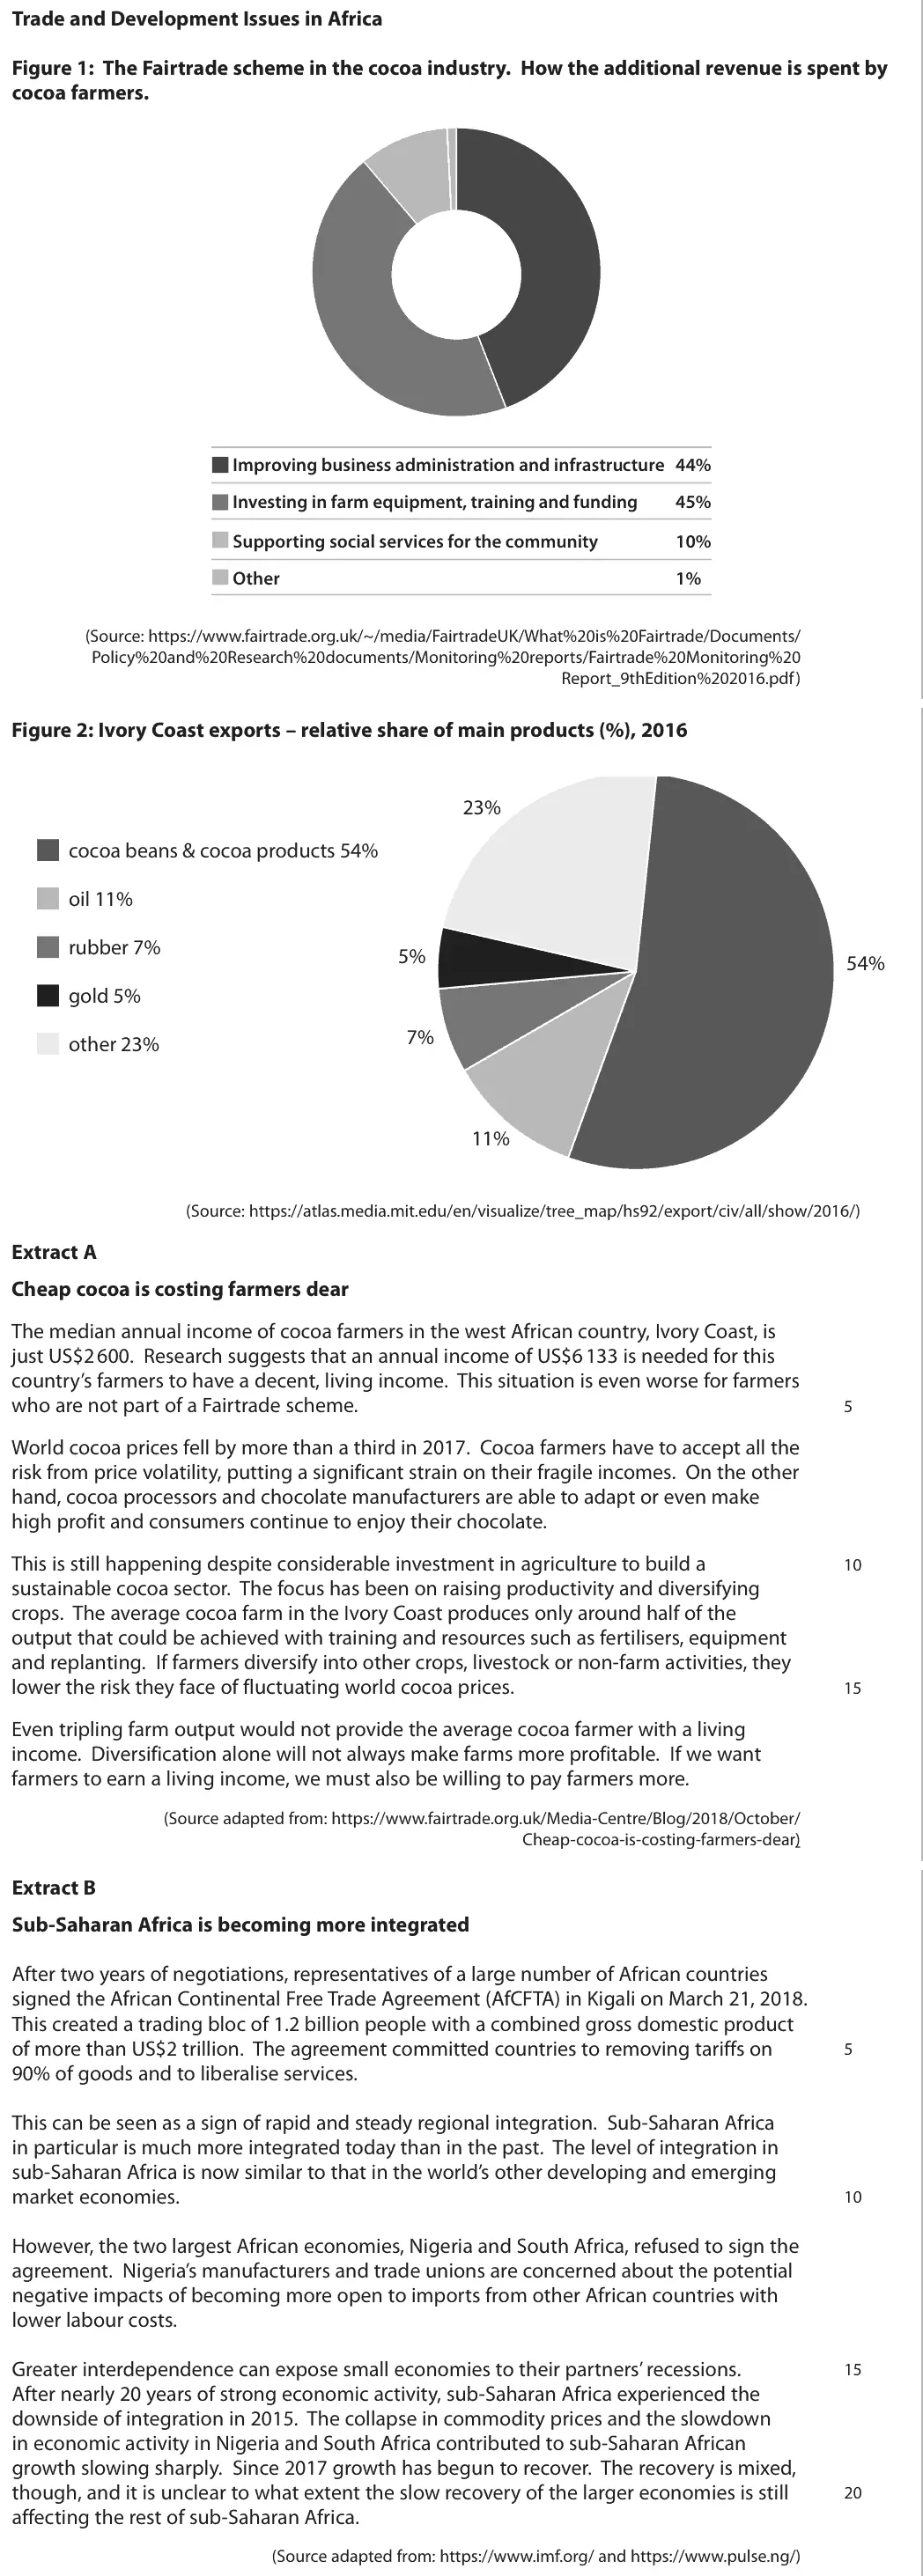
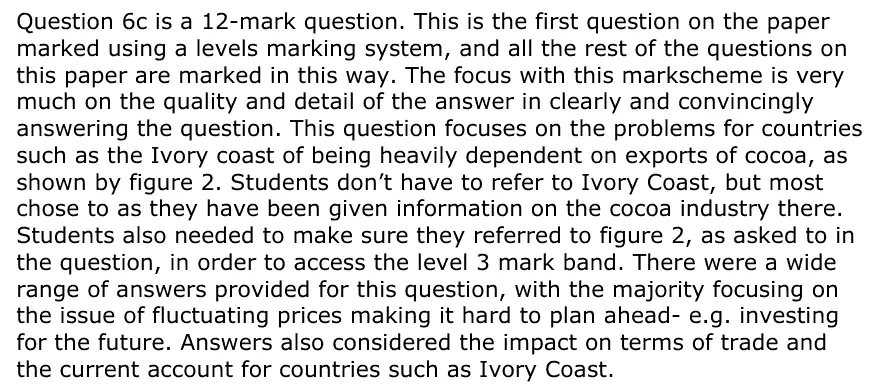
Question 6c is a 12-mark question. This is the first question on the paper marked using a levels marking system, and all the rest of the questions on this paper are marked in this way. The focus with this markscheme is very much on the quality and detail of the answer in clearly and convincingly answering the question. This question focuses on the problems for countries such as the Ivory coast of being heavily dependent on exports of cocoa, as shown by figure 2. Students don’t have to refer to Ivory Coast, but most chose to as they have been given information on the cocoa industry there. Students also needed to make sure they referred to figure 2, as asked to in the question, in order to access the level 3 mark band. There were a wide range of answers provided for this question, with the majority focusing on the issue of fluctuating prices making it hard to plan ahead- e.g. investing for the future. Answers also considered the impact on terms of trade and the current account for countries such as Ivory Coast.
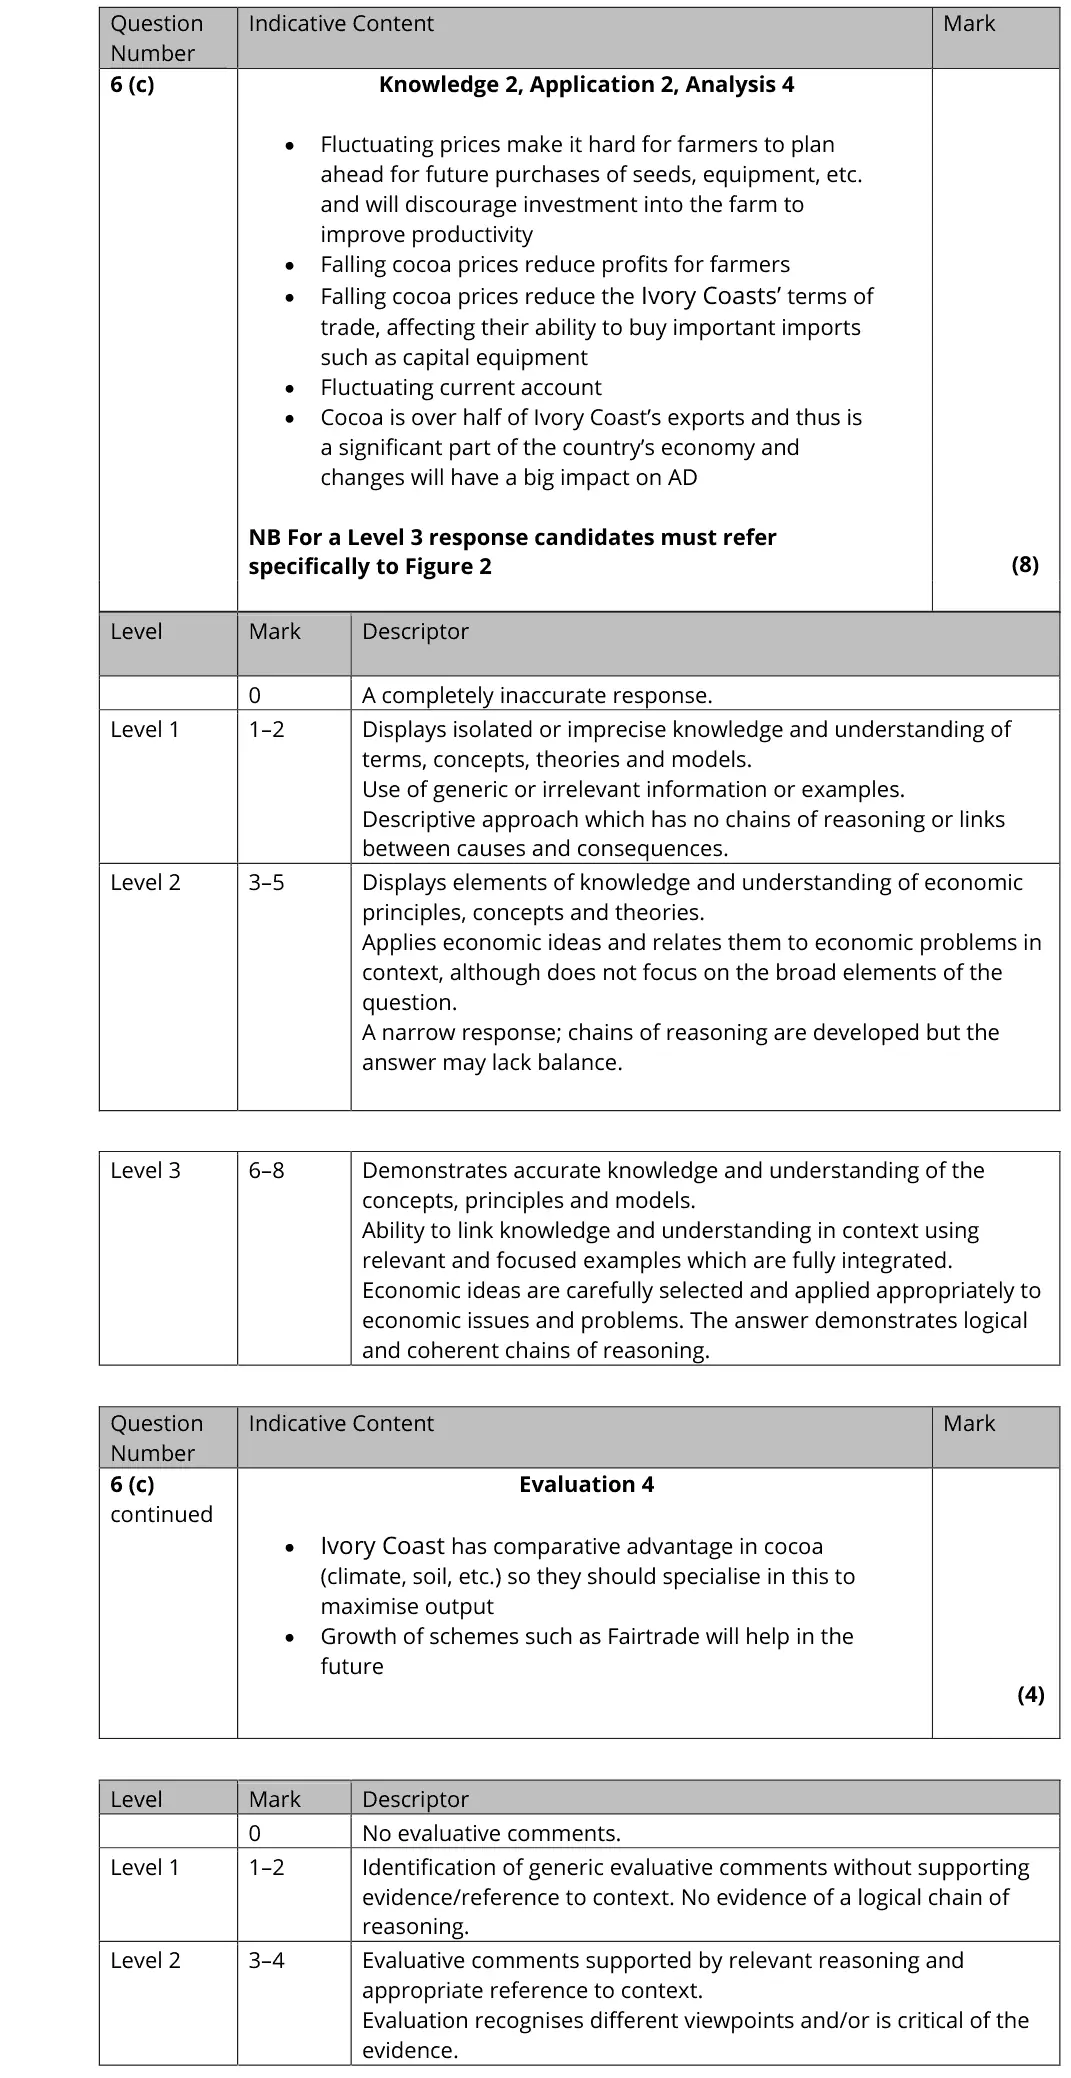
Notes from the mark scheme and report
volatile prices deter investment and planning
falling cocoa prices worsen the terms of trade and current account
Level 3 needs specific reference to Figure 2 (cocoa 54% of exports)
evaluate with comparative advantage in cocoa, Fairtrade
Quantitative skills: QS 9 (interpret, apply and analyse information in written, graphical tabular and numerical forms)
October 2020 · Paper 2 · Q6(e)15 marksAO1=3, AO2=3, AO3=3, AO4=615-mark response
Data and extracts for question 6
Mark scheme, including the levels grid and indicative content
Notes from the mark scheme and report
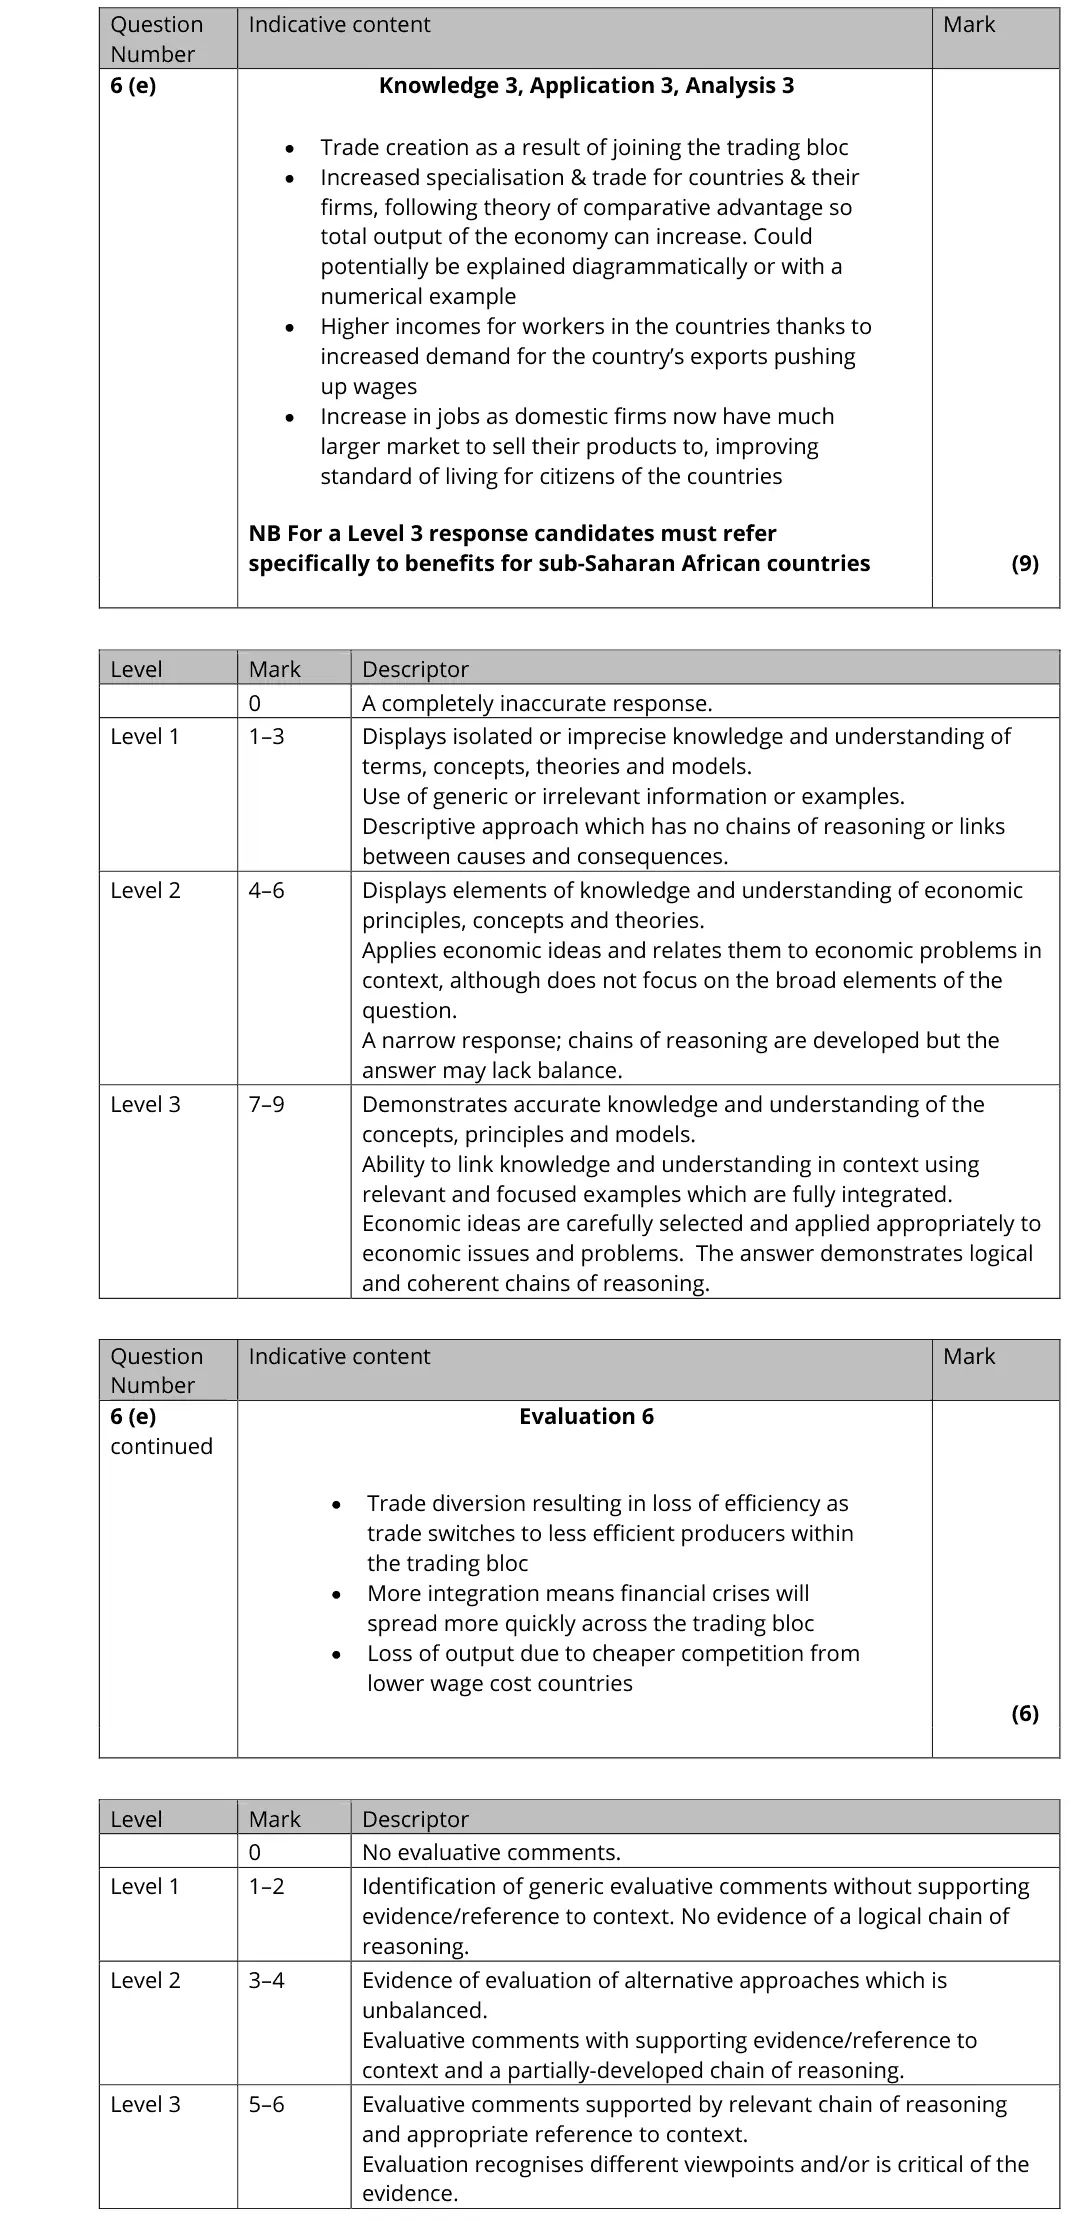
trade creation, specialisation by comparative advantage, larger market, more jobs and higher wages
Level 3 needs specific reference to sub-Saharan African countries
evaluate with trade diversion, contagion of recessions and financial crises, competition from lower-wage members
June 2019 · Paper 2 · Q725 marksAO1=4, AO2=4, AO3=8, AO4=925-mark essayEither/or
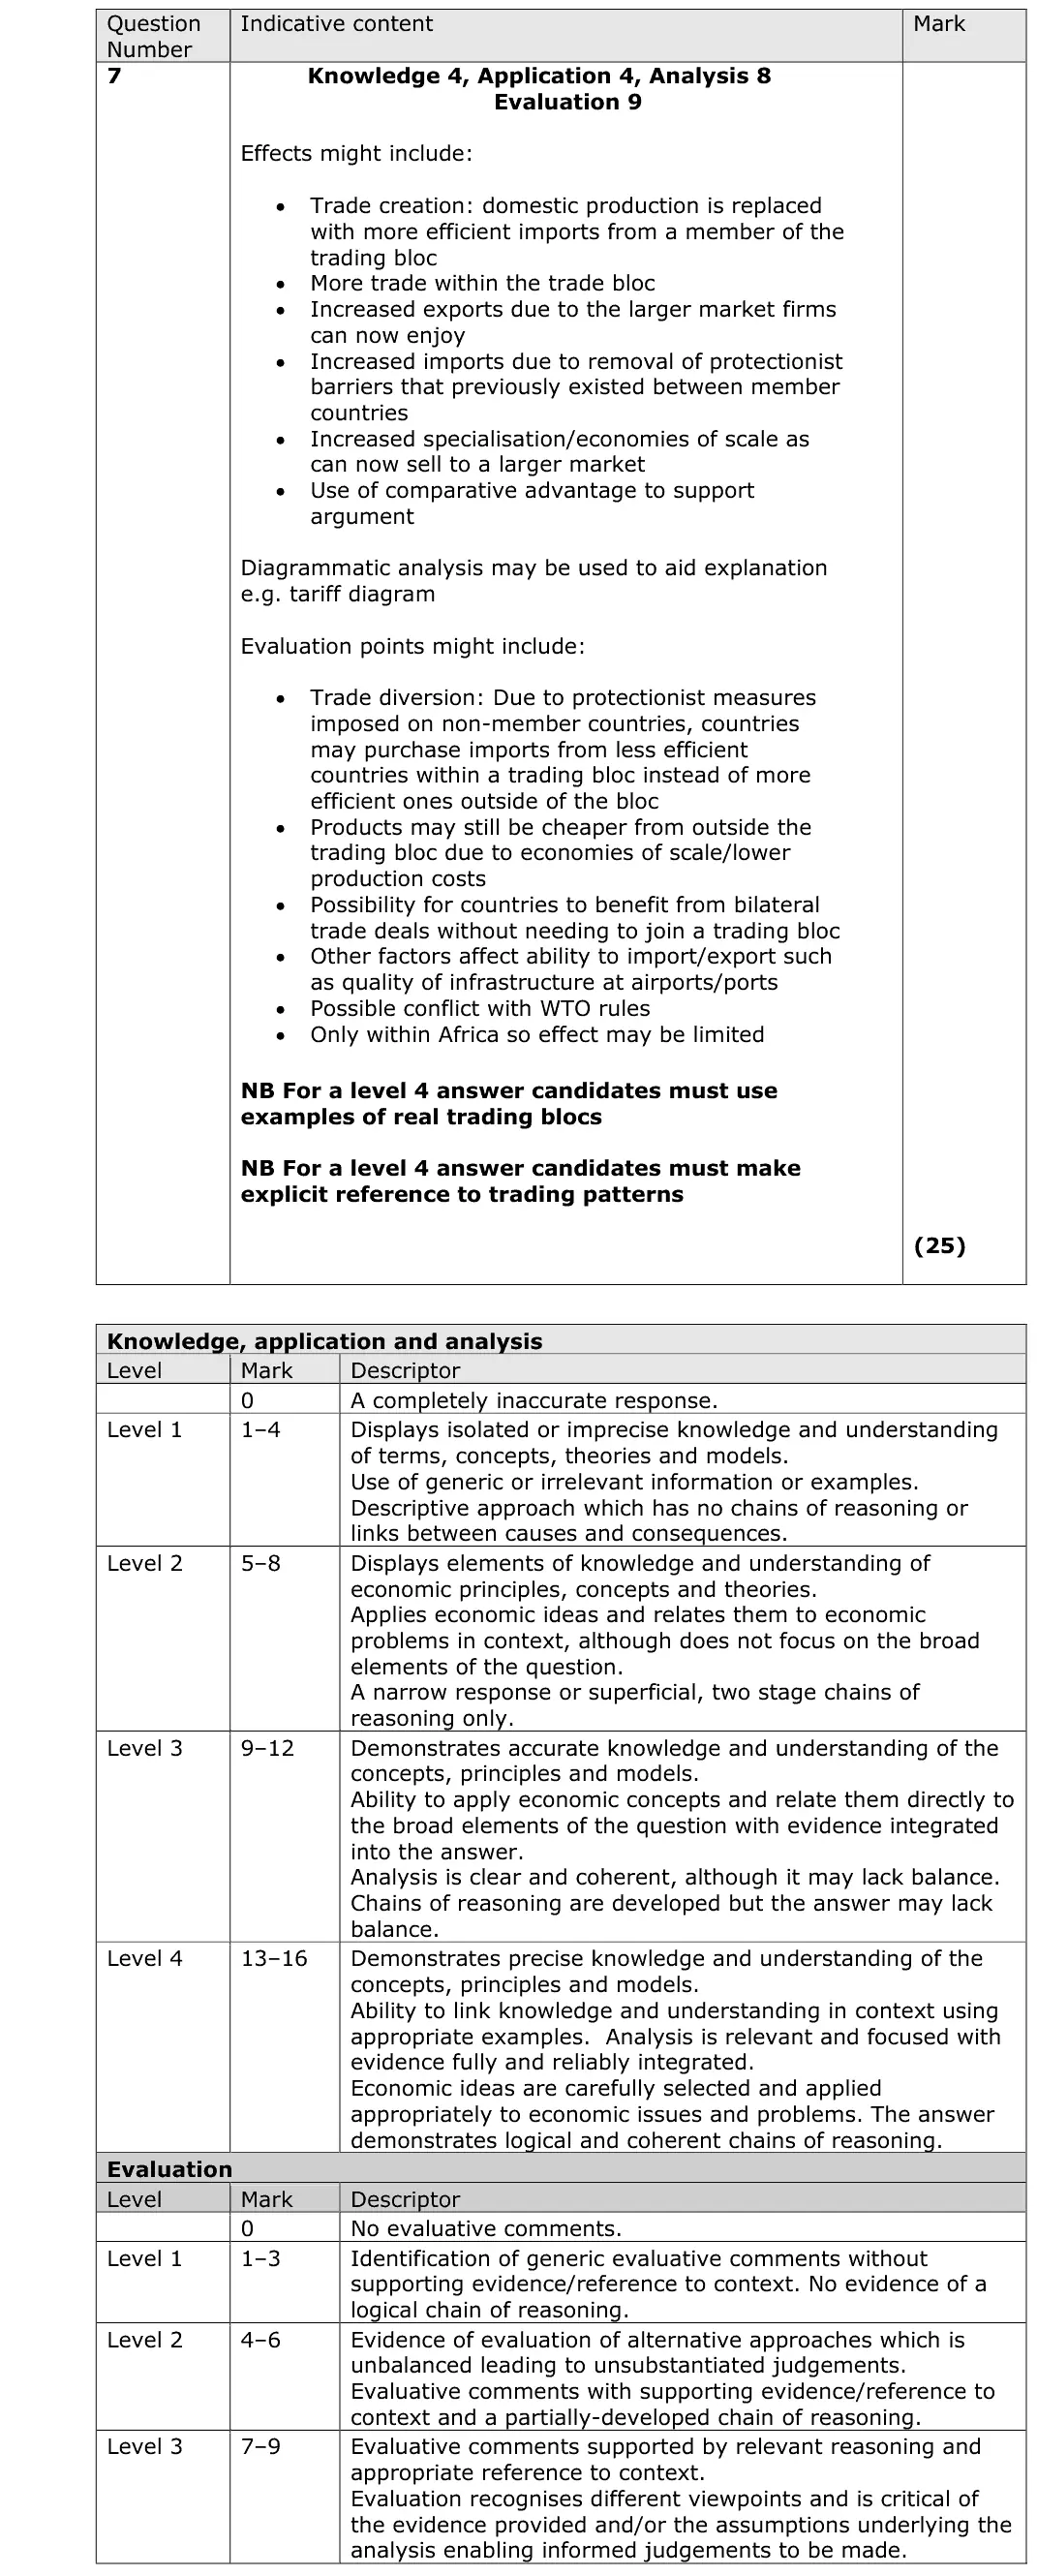
Mark scheme, including the levels grid and indicative content
Examiner's comment
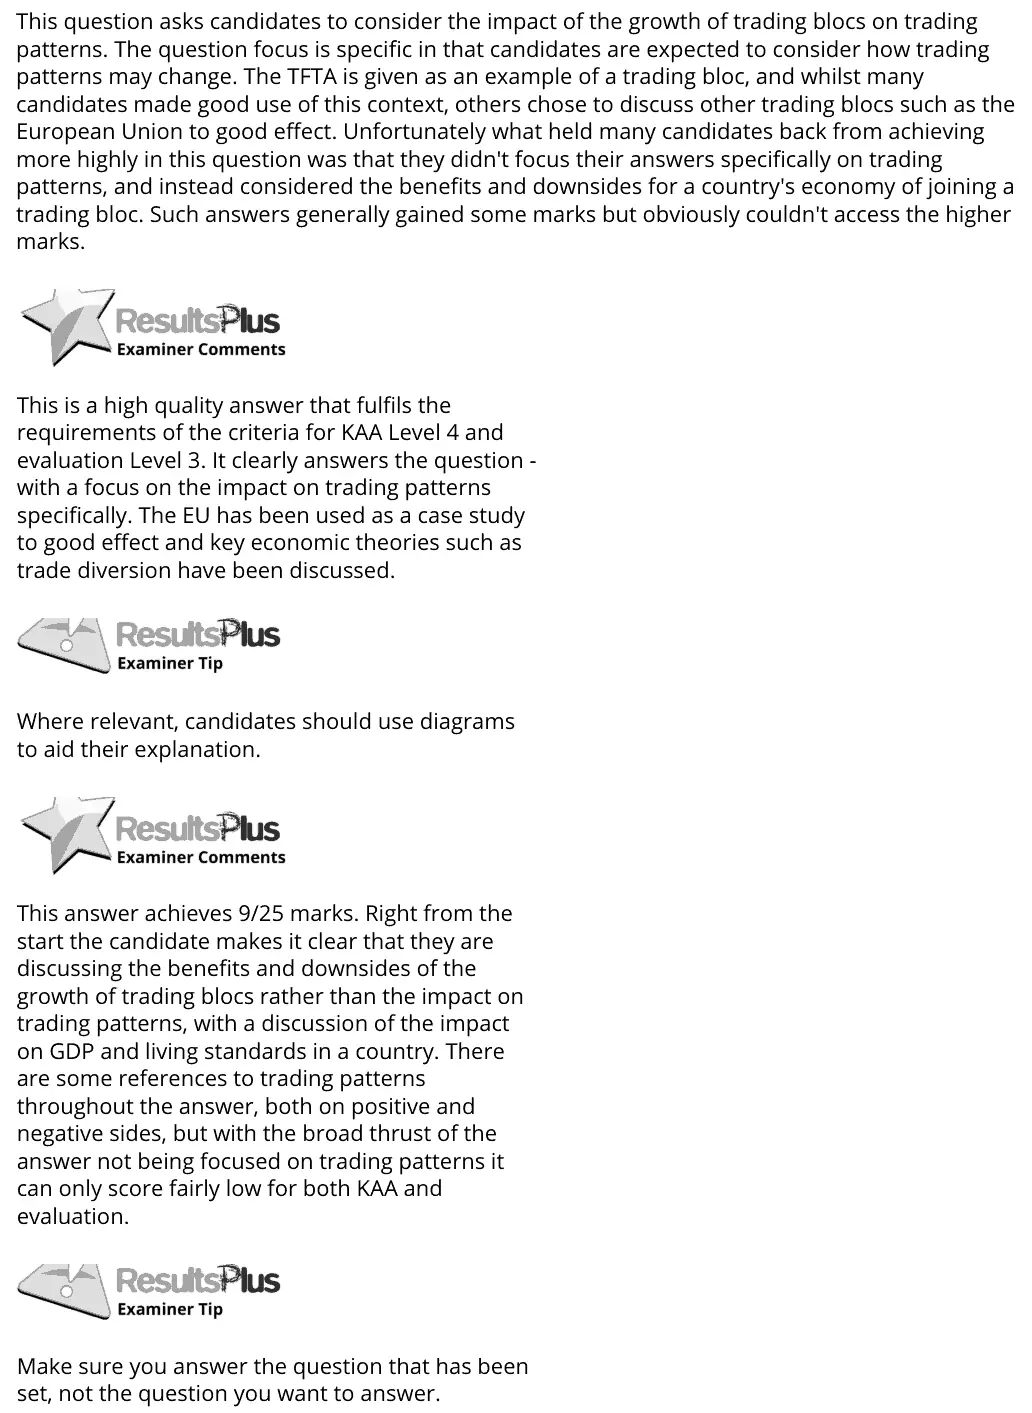
This question asks candidates to consider the impact of the growth of trading blocs on trading patterns. The question focus is specific in that candidates are expected to consider how trading patterns may change. The TFTA is given as an example of a trading bloc, and whilst many candidates made good use of this context, others chose to discuss other trading blocs such as the European Union to good effect. Unfortunately what held many candidates back from achieving more highly in this question was that they didn't focus their answers specifically on trading patterns, and instead considered the benefits and downsides for a country's economy of joining a trading bloc. Such answers generally gained some marks but obviously couldn't access the higher marks. This is a high quality answer that fulfils the requirements of the criteria for KAA Level 4 and evaluation Level 3. It clearly answers the question - with a focus on the impact on trading patterns specifically. The EU has been used as a case study to good effect and key economic theories such as trade diversion have been discussed. Where relevant, candidates should use diagrams to aid their explanation. This answer achieves 9/25 marks. Right from the start the candidate makes it clear that they are discussing the benefits and downsides of the growth of trading blocs rather than the impact on trading patterns, with a discussion of the impact on GDP and living standards in a country. There are some references to trading patterns throughout the answer, both on positive and negative sides, but with the broad thrust of the answer not being focused on trading patterns it can only score fairly low for both KAA and evaluation. Make sure you answer the question that has been set, not the question you want to answer.
Notes from the mark scheme and report
focus on trading patterns: trade creation and trade diversion, more trade within the bloc
many wrote about the costs and benefits of joining a bloc instead and could not reach the top levels
Level 4 needs real trading bloc examples
June 2018 · Paper 2 · Q1(b)4 marksAO1=2, AO2=1, AO3=1Short answer
Data and extracts for question 1
Mark scheme
Examiner's comment
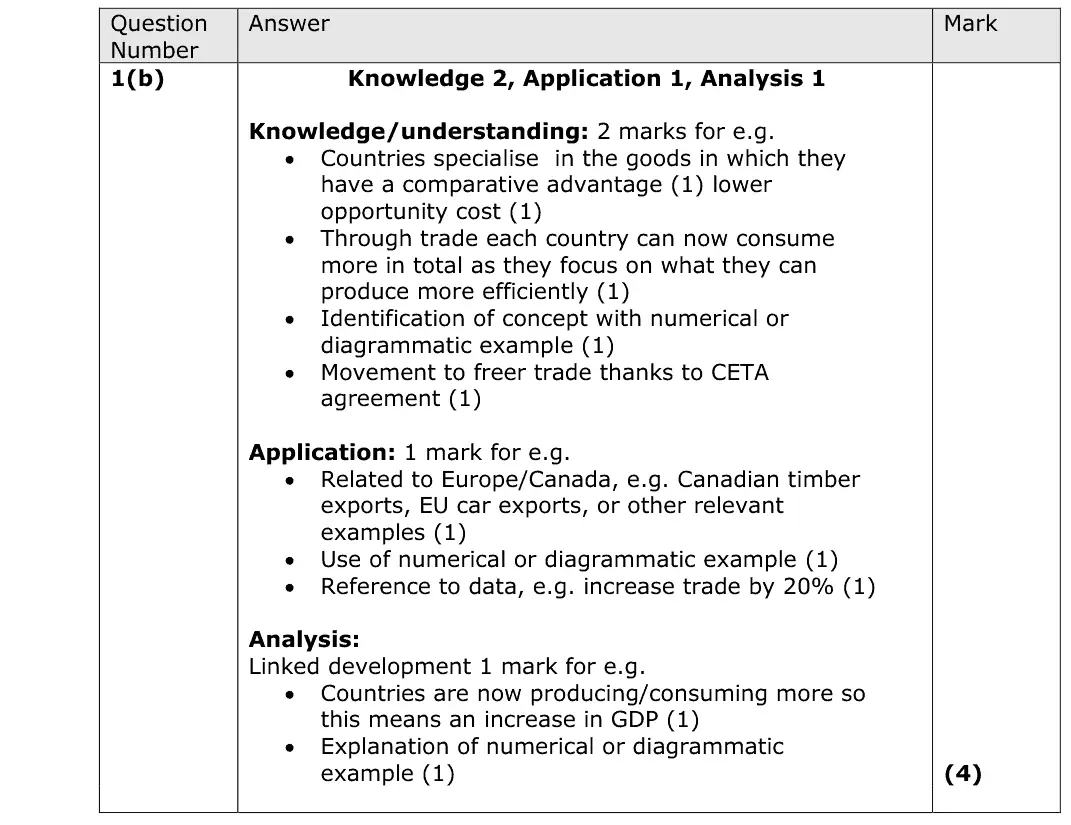
The marks for this question are divided into two marks for knowledge, one for application, and one for analysis. Knowledge marks can come from a definition of comparative advantage or other relevant points. Application could come either from the data or the candidate's own knowledge. Analysis generally involved explaining the link to an increase in GDP/output. This answer achieves only one mark for application about 12 billion euros. The rest of the answer is too vague/imprecise to achieve any marks. Be clear and accurate when it comes to defining or explaining things like comparative advantage. This answer achieves 3/4. In terms of knowledge there is one mark for lower opportunity cost and one for a reference to specialisation. There is then one further mark for the diagram.
Notes from the mark scheme and report
specialise where opportunity cost is lower
a numerical or diagrammatic example earns marks
application from Canadian/EU exports or the 20% increase in trade / 12 billion euros
analysis must link to higher output and GDP
vague definitions of comparative advantage scored nothing
Quantitative skills: QS 9 (interpret, apply and analyse information in written, graphical tabular and numerical forms)
June 2018 · Paper 2 · Q6(c)12 marksAO1=2, AO2=2, AO3=4, AO4=412-mark response
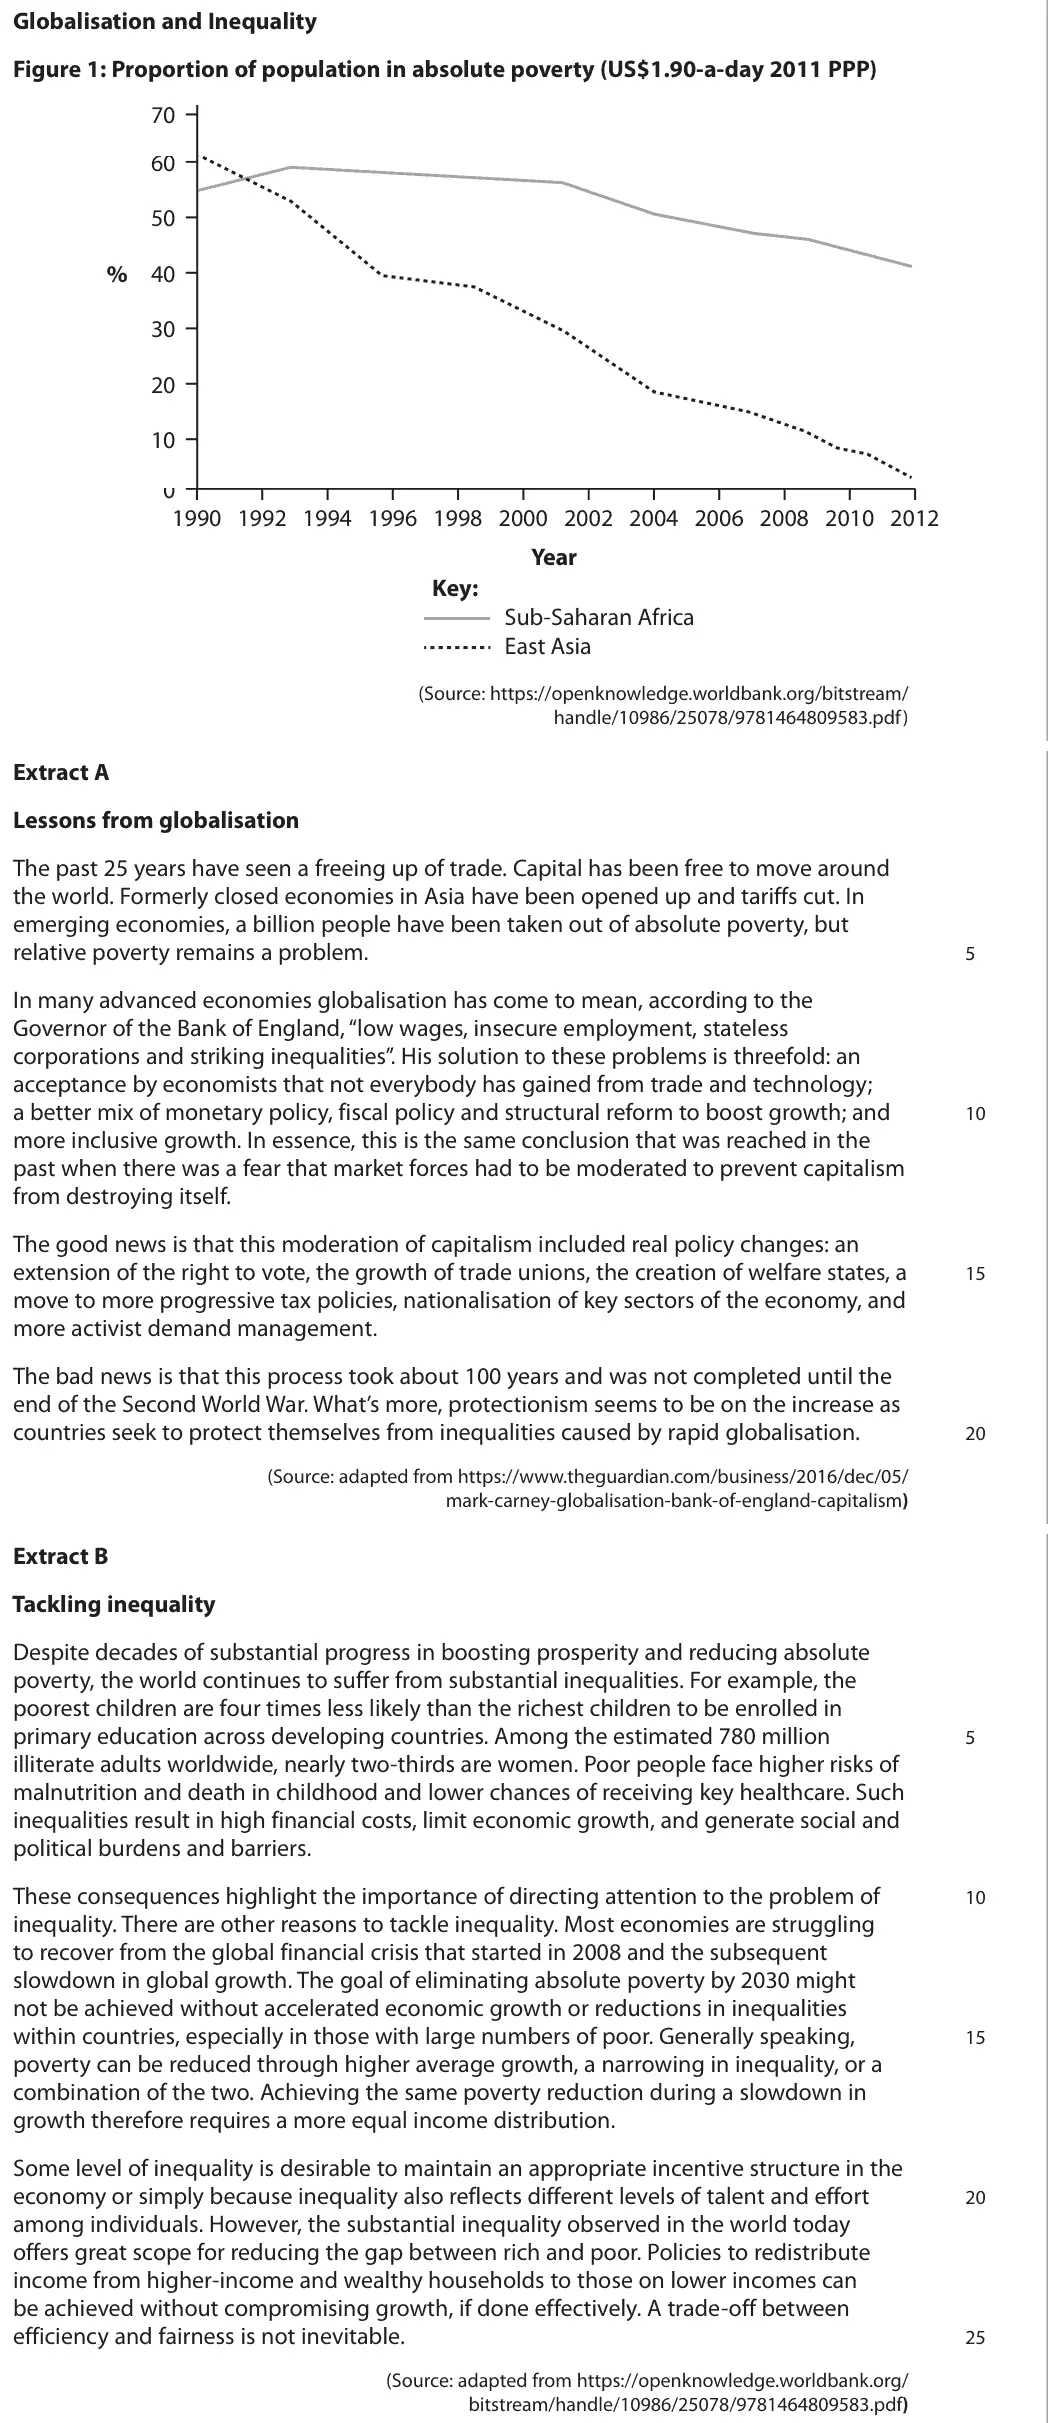
Data and extracts for question 6
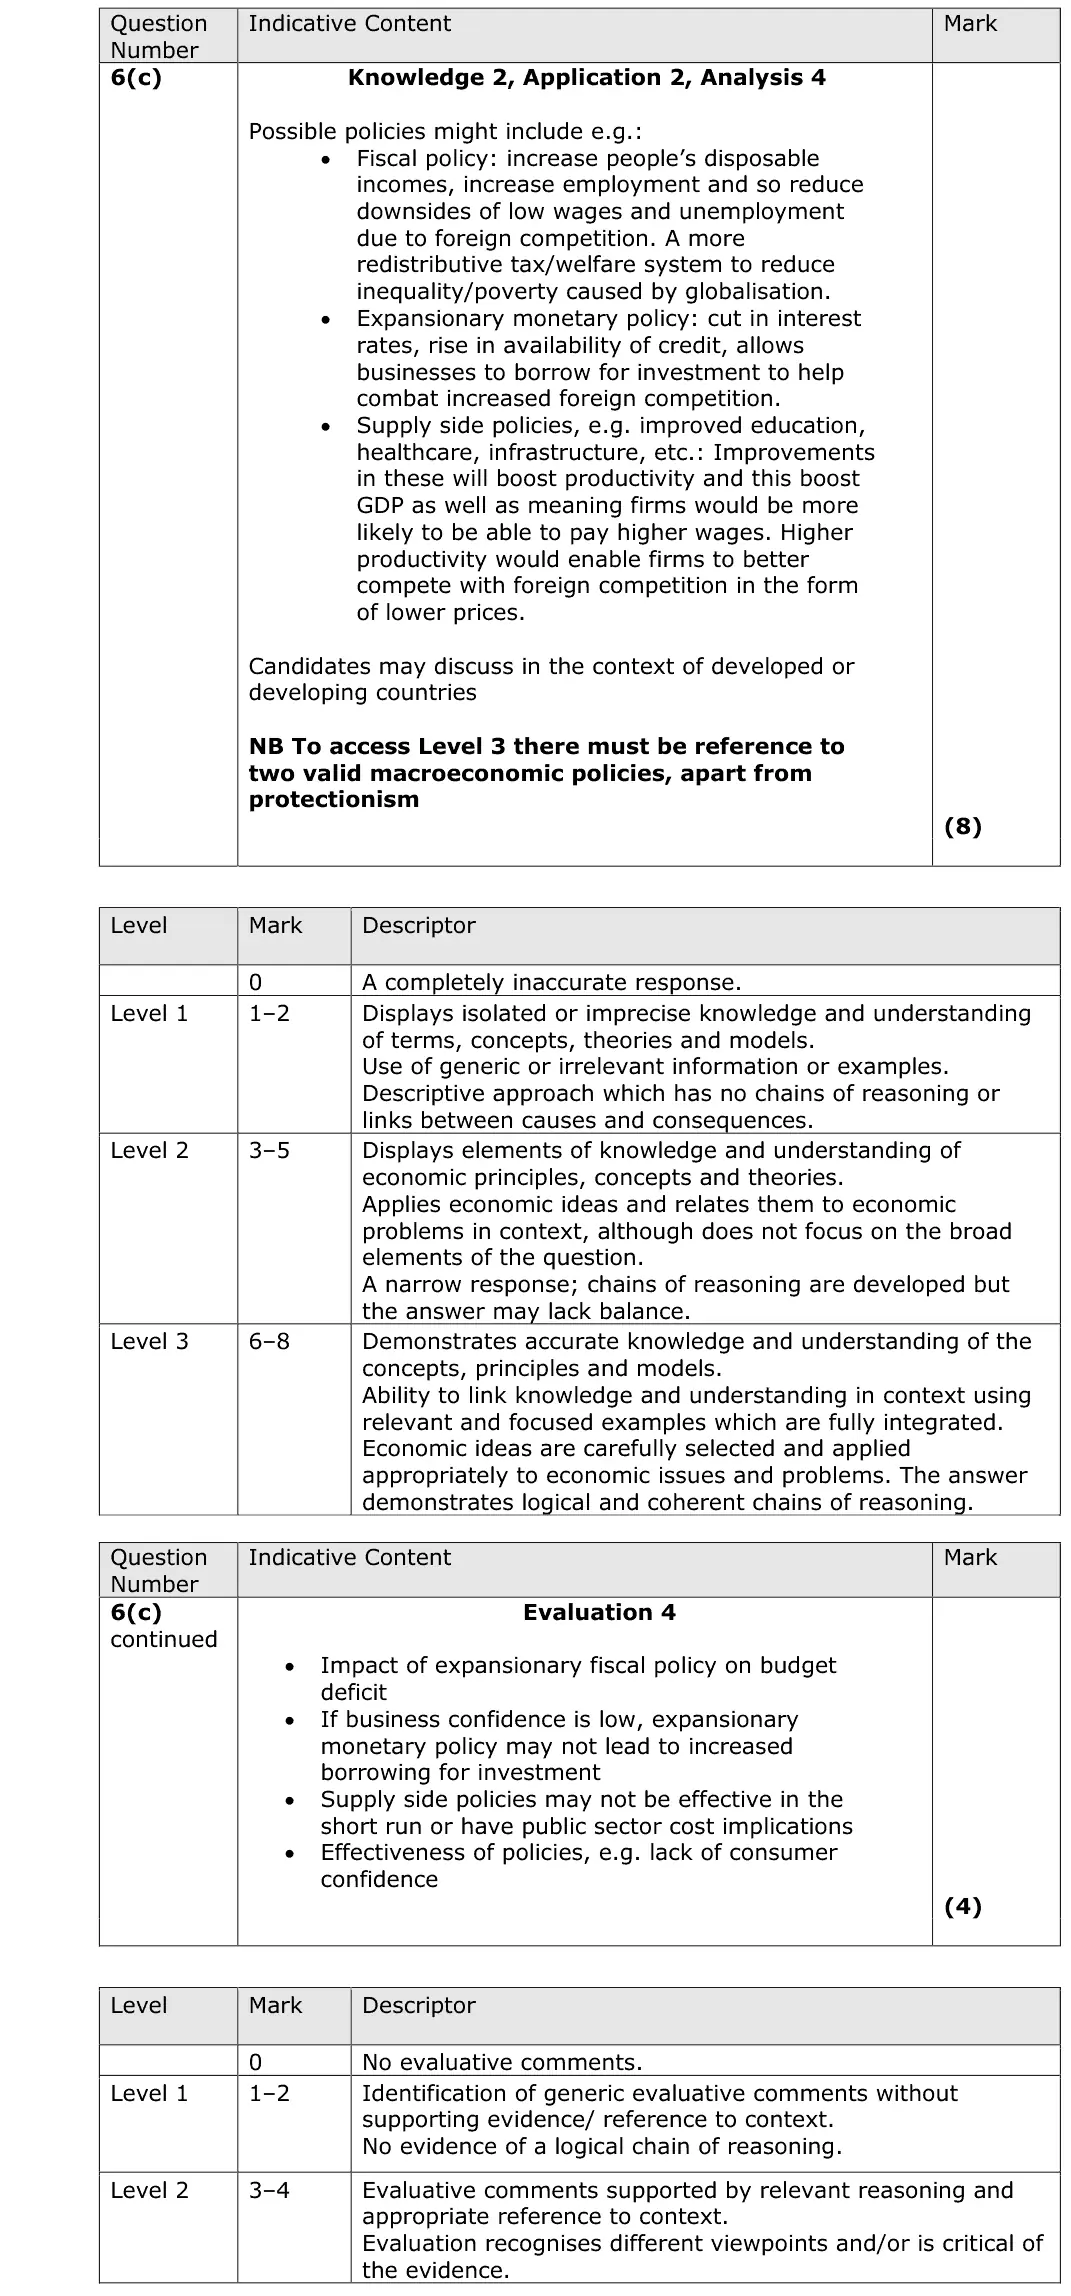
Mark scheme, including the levels grid and indicative content
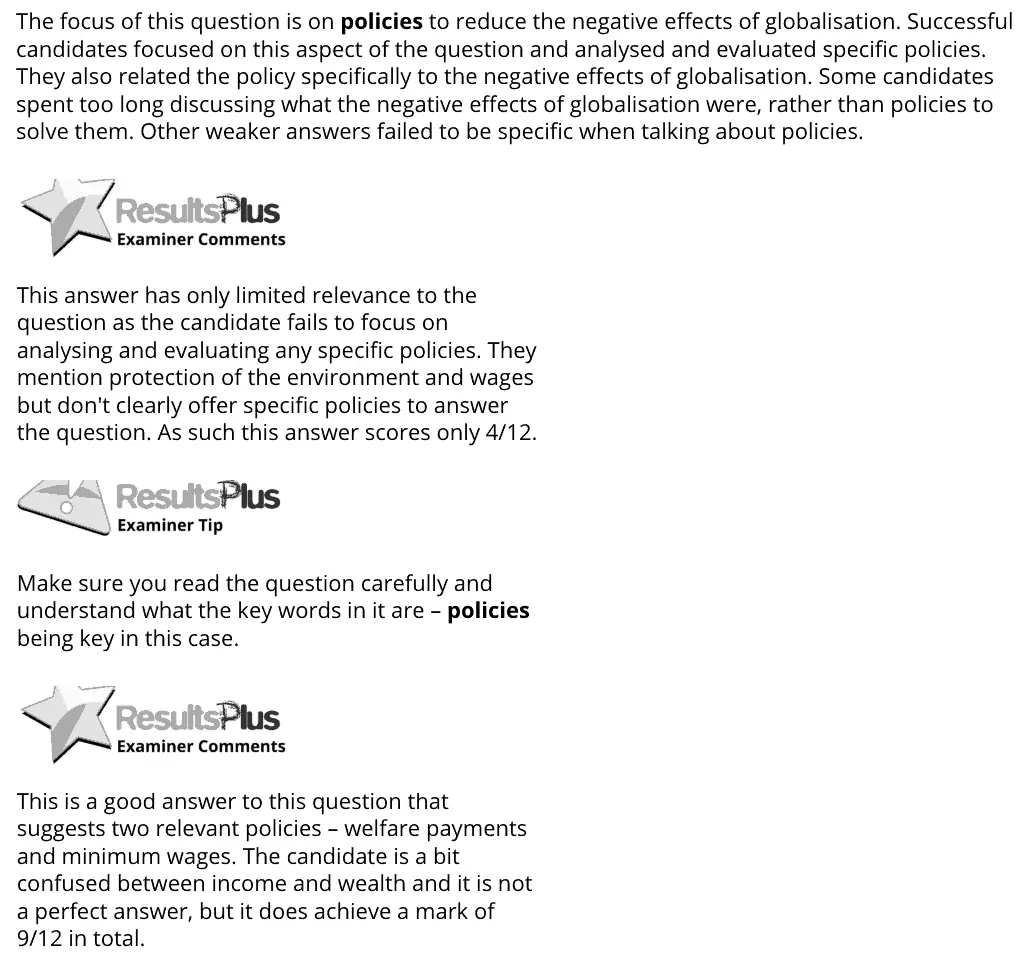
Examiner's comment
The focus of this question is on policies to reduce the negative effects of globalisation. Successful candidates focused on this aspect of the question and analysed and evaluated specific policies. They also related the policy specifically to the negative effects of globalisation. Some candidates spent too long discussing what the negative effects of globalisation were, rather than policies to solve them. Other weaker answers failed to be specific when talking about policies. This answer has only limited relevance to the question as the candidate fails to focus on analysing and evaluating any specific policies. They mention protection of the environment and wages but don't clearly offer specific policies to answer the question. As such this answer scores only 4/12. Make sure you read the question carefully and understand what the key words in it are – policies being key in this case. This is a good answer to this question that suggests two relevant policies – welfare payments and minimum wages. The candidate is a bit confused between income and wealth and it is not a perfect answer, but it does achieve a mark of 9/12 in total.
Notes from the mark scheme and report
Level 3 needs two valid macroeconomic policies apart from protectionism (redistributive fiscal policy, expansionary monetary policy, supply-side education and infrastructure)
focus on policies, not describing the negative effects of globalisation
evaluate e.g. budget deficit, low confidence, time lags
June 2018 · Paper 3 · Q1(d)25 marksAO1=4, AO2=4, AO3=8, AO4=925-mark essayEither/or
Data and extracts for question 1
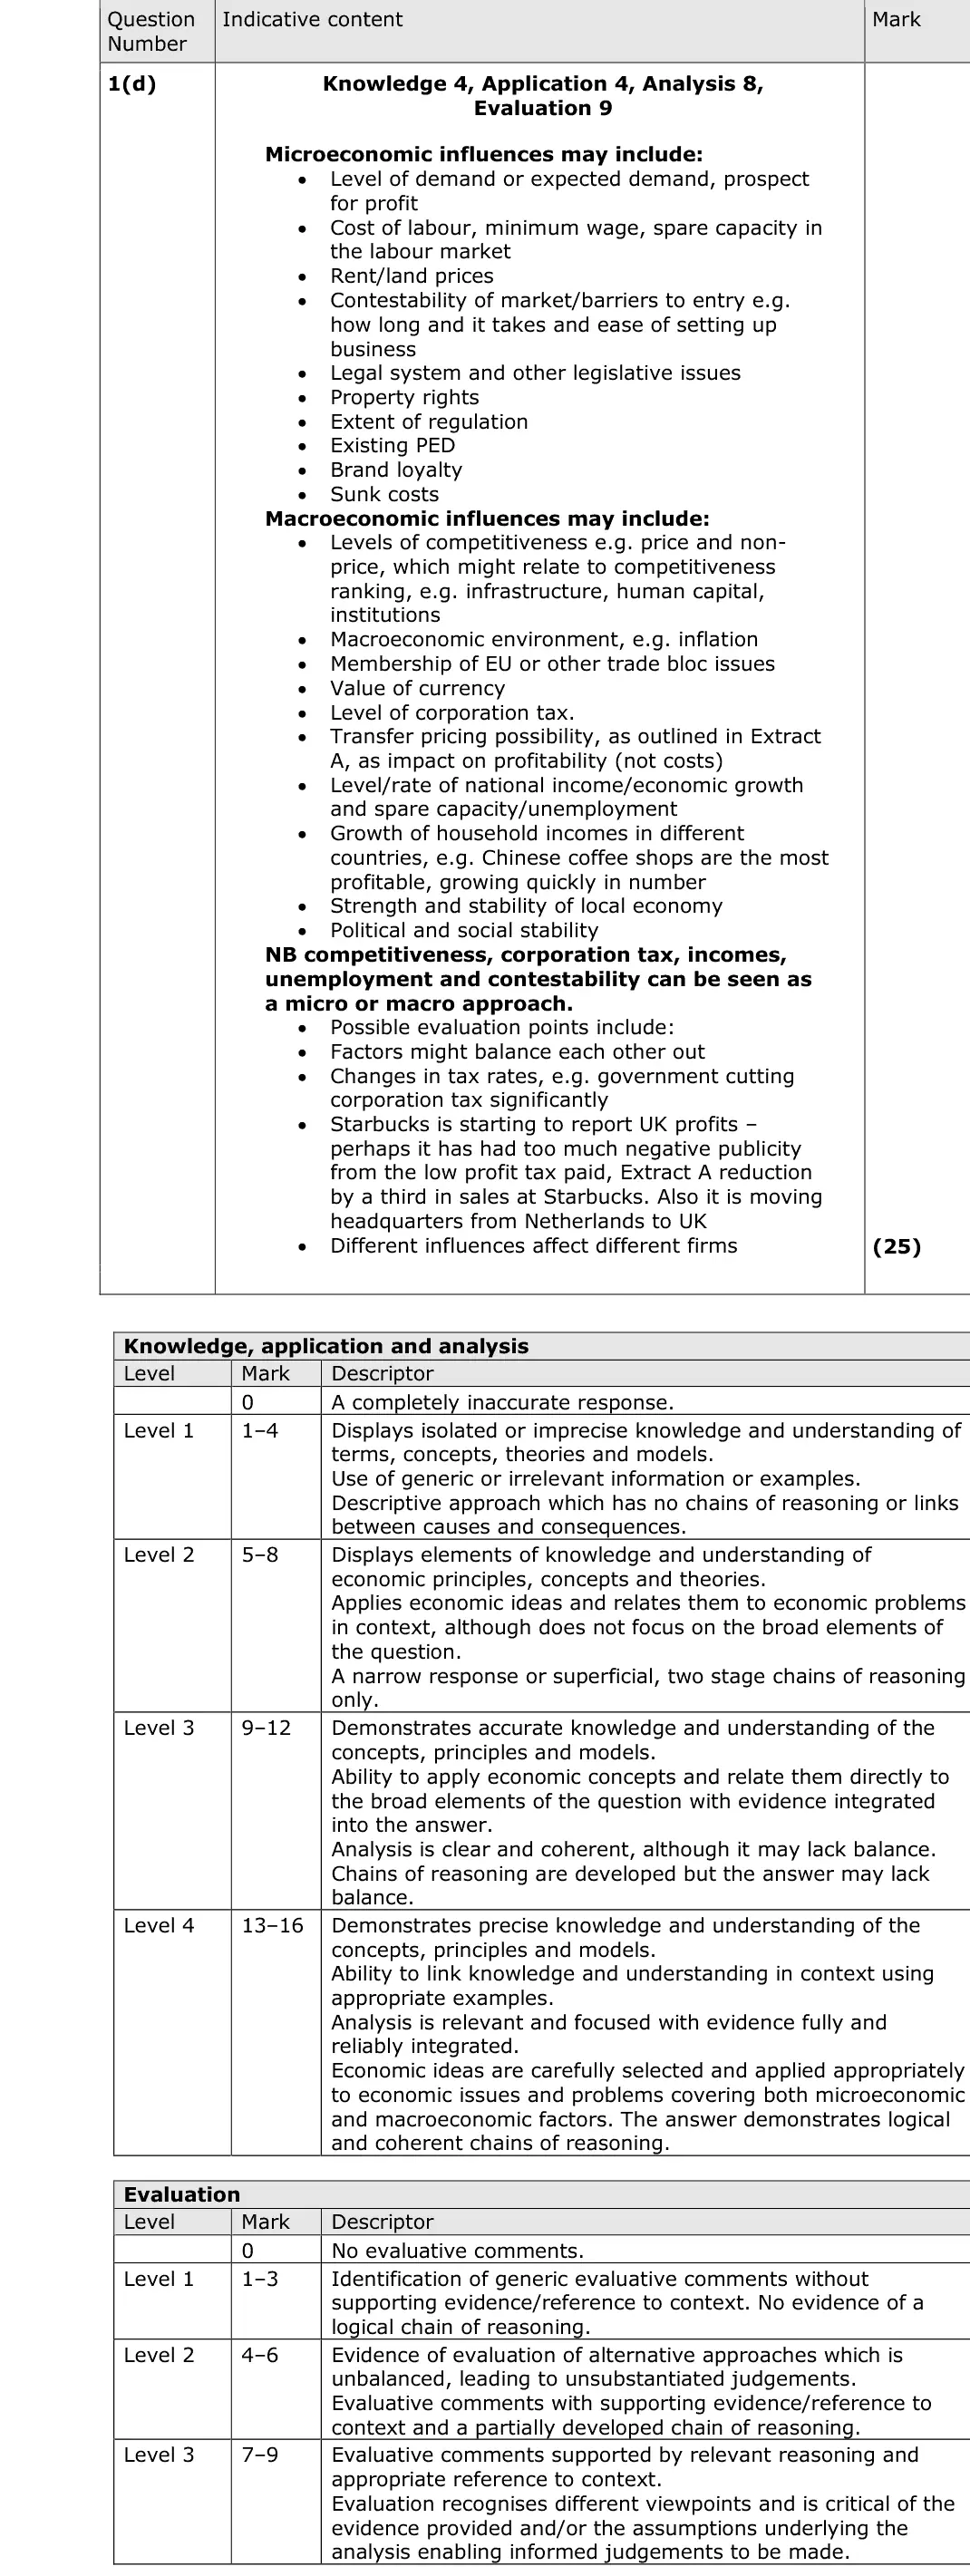
Mark scheme, including the levels grid and indicative content
Examiner's comment
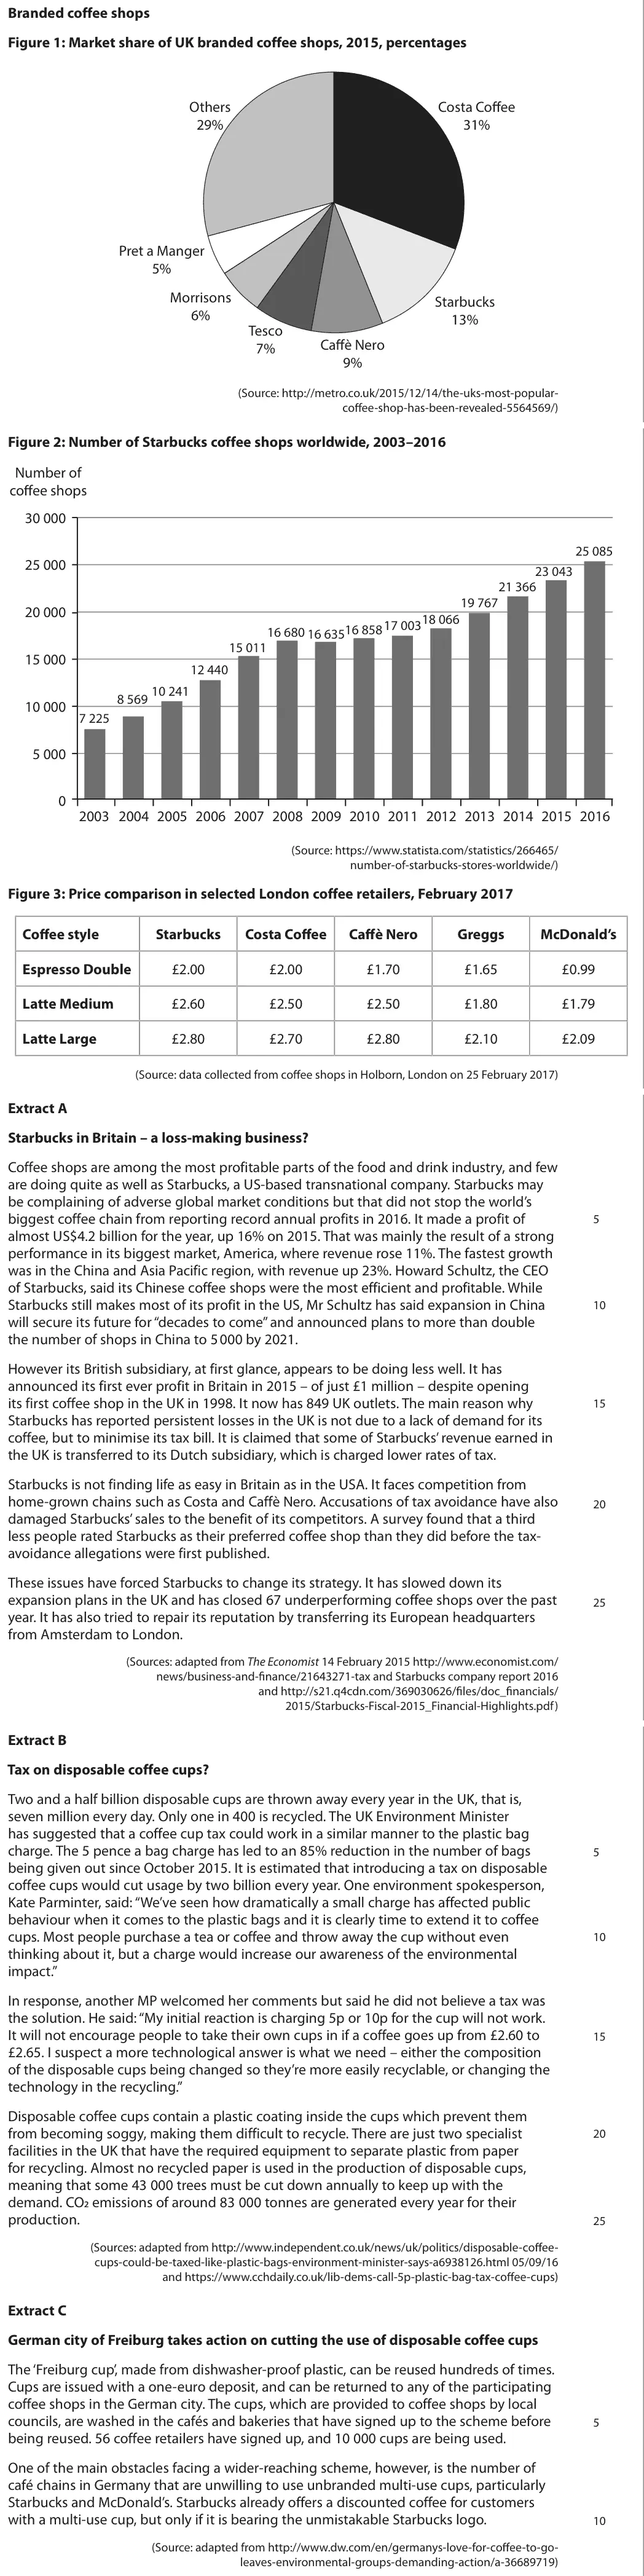
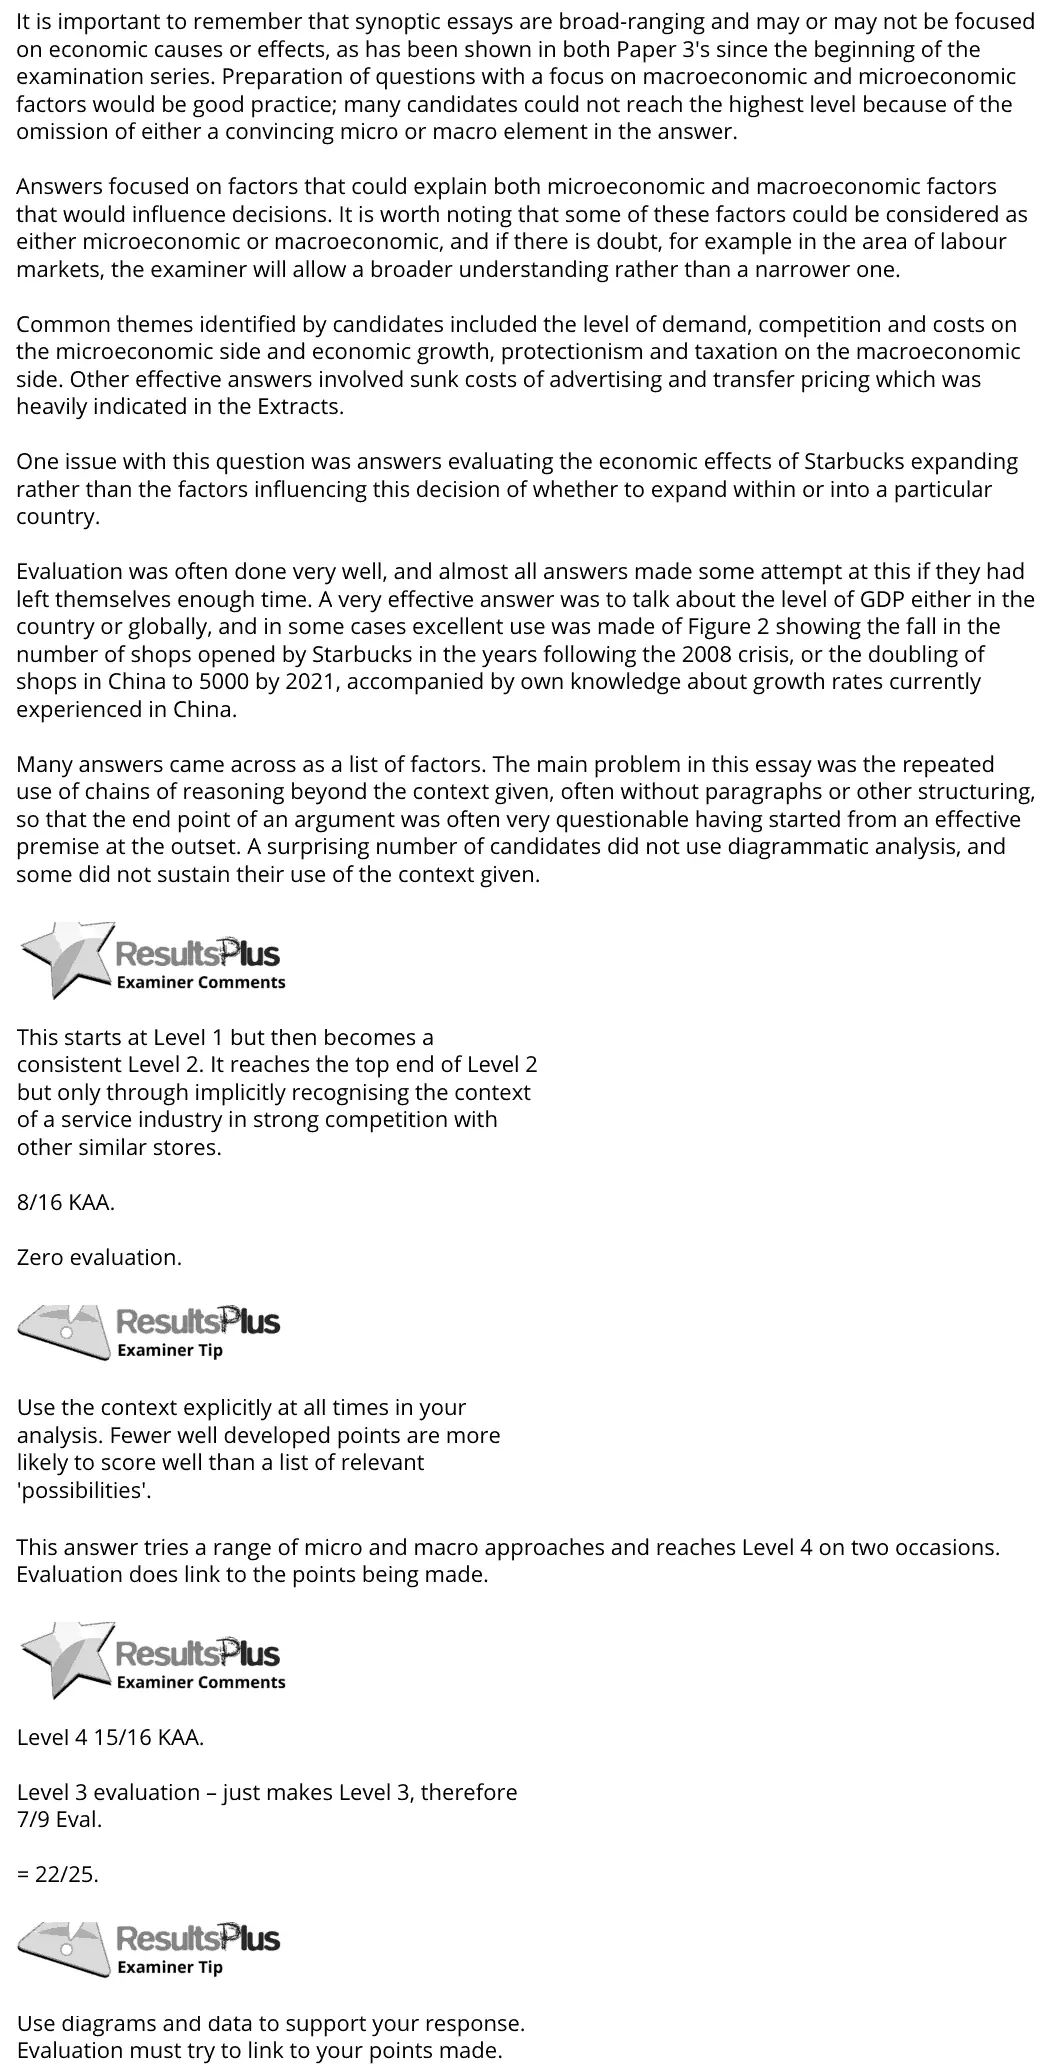
It is important to remember that synoptic essays are broad-ranging and may or may not be focused on economic causes or effects, as has been shown in both Paper 3's since the beginning of the examination series. Preparation of questions with a focus on macroeconomic and microeconomic factors would be good practice; many candidates could not reach the highest level because of the omission of either a convincing micro or macro element in the answer. Answers focused on factors that could explain both microeconomic and macroeconomic factors that would influence decisions. It is worth noting that some of these factors could be considered as either microeconomic or macroeconomic, and if there is doubt, for example in the area of labour markets, the examiner will allow a broader understanding rather than a narrower one. Common themes identified by candidates included the level of demand, competition and costs on the microeconomic side and economic growth, protectionism and taxation on the macroeconomic side. Other effective answers involved sunk costs of advertising and transfer pricing which was heavily indicated in the Extracts. One issue with this question was answers evaluating the economic effects of Starbucks expanding rather than the factors influencing this decision of whether to expand within or into a particular country. Evaluation was often done very well, and almost all answers made some attempt at this if they had left themselves enough time. A very effective answer was to talk about the level of GDP either in the country or globally, and in some cases excellent use was made of Figure 2 showing the fall in the number of shops opened by Starbucks in the years following the 2008 crisis, or the doubling of shops in China to 5000 by 2021, accompanied by own knowledge about growth rates currently experienced in China. Many answers came across as a list of factors. The main problem in this essay was the repeated use of chains of reasoning beyond the context given, often without paragraphs or other structuring, so that the end point of an argument was often very questionable having started from an effective premise at the outset. A surprising number of candidates did not use diagrammatic analysis, and some did not sustain their use of the context given. This starts at Level 1 but then becomes a consistent Level 2. It reaches the top end of Level 2 but only through implicitly recognising the context of a service industry in strong competition with other similar stores. 8/16 KAA. Zero evaluation. Use the context explicitly at all times in your analysis. Fewer well developed points are more likely to score well than a list of relevant 'possibilities'. This answer tries a range of micro and macro approaches and reaches Level 4 on two occasions. Evaluation does link to the points being made. Level 4 15/16 KAA. Level 3 evaluation – just makes Level 3, therefore 7/9 Eval. = 22/25. Use diagrams and data to support your response. Evaluation must try to link to your points made.
Notes from the mark scheme and report
factors influencing the decision to expand (demand, costs, barriers to entry, corporation tax and transfer pricing, growth and incomes), not the effects of Starbucks expanding
both micro and macro factors needed for the top level
use Figure 2 (fewer openings after 2008, China expansion)
Quantitative skills: QS 9 (interpret, apply and analyse information in written, graphical tabular and numerical forms)
June 2018 · Paper 3 · Q2(a)5 marksAO1=2, AO2=2, AO3=1Short answer
Data and extracts for question 2
Mark scheme
Examiner's comment
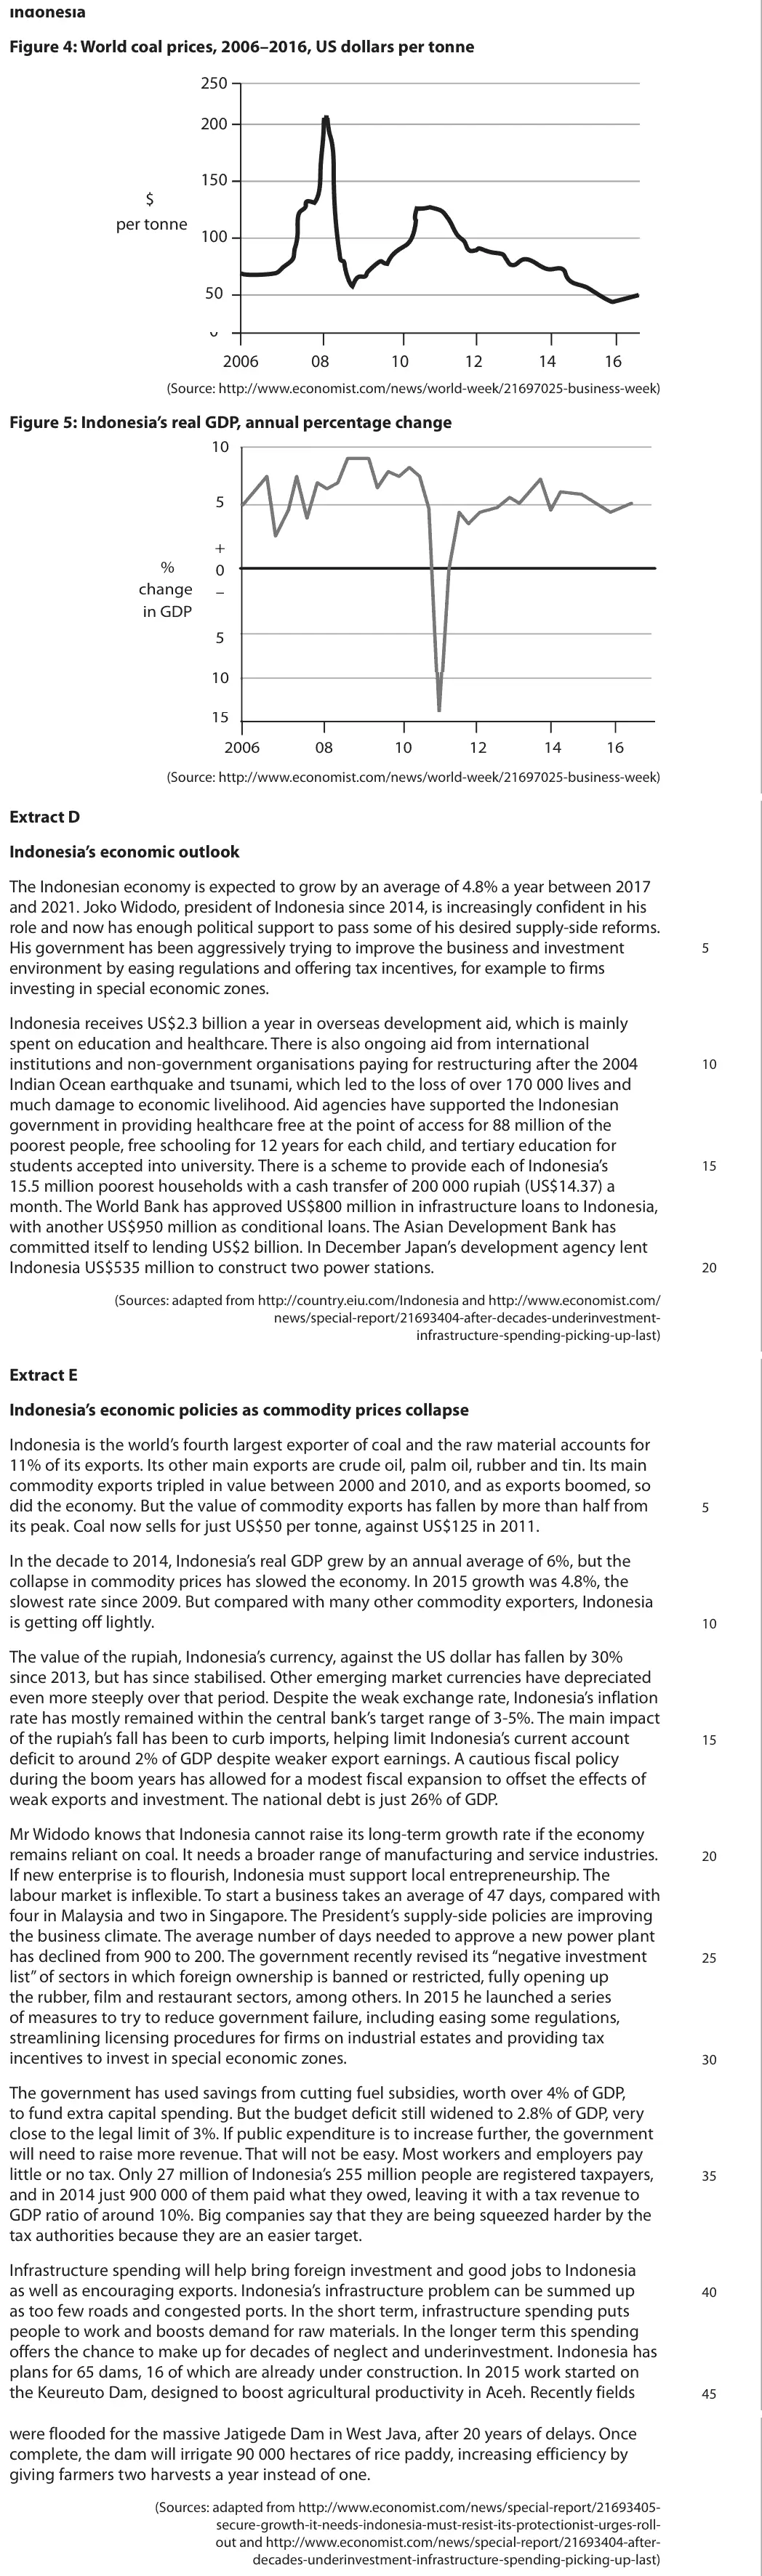
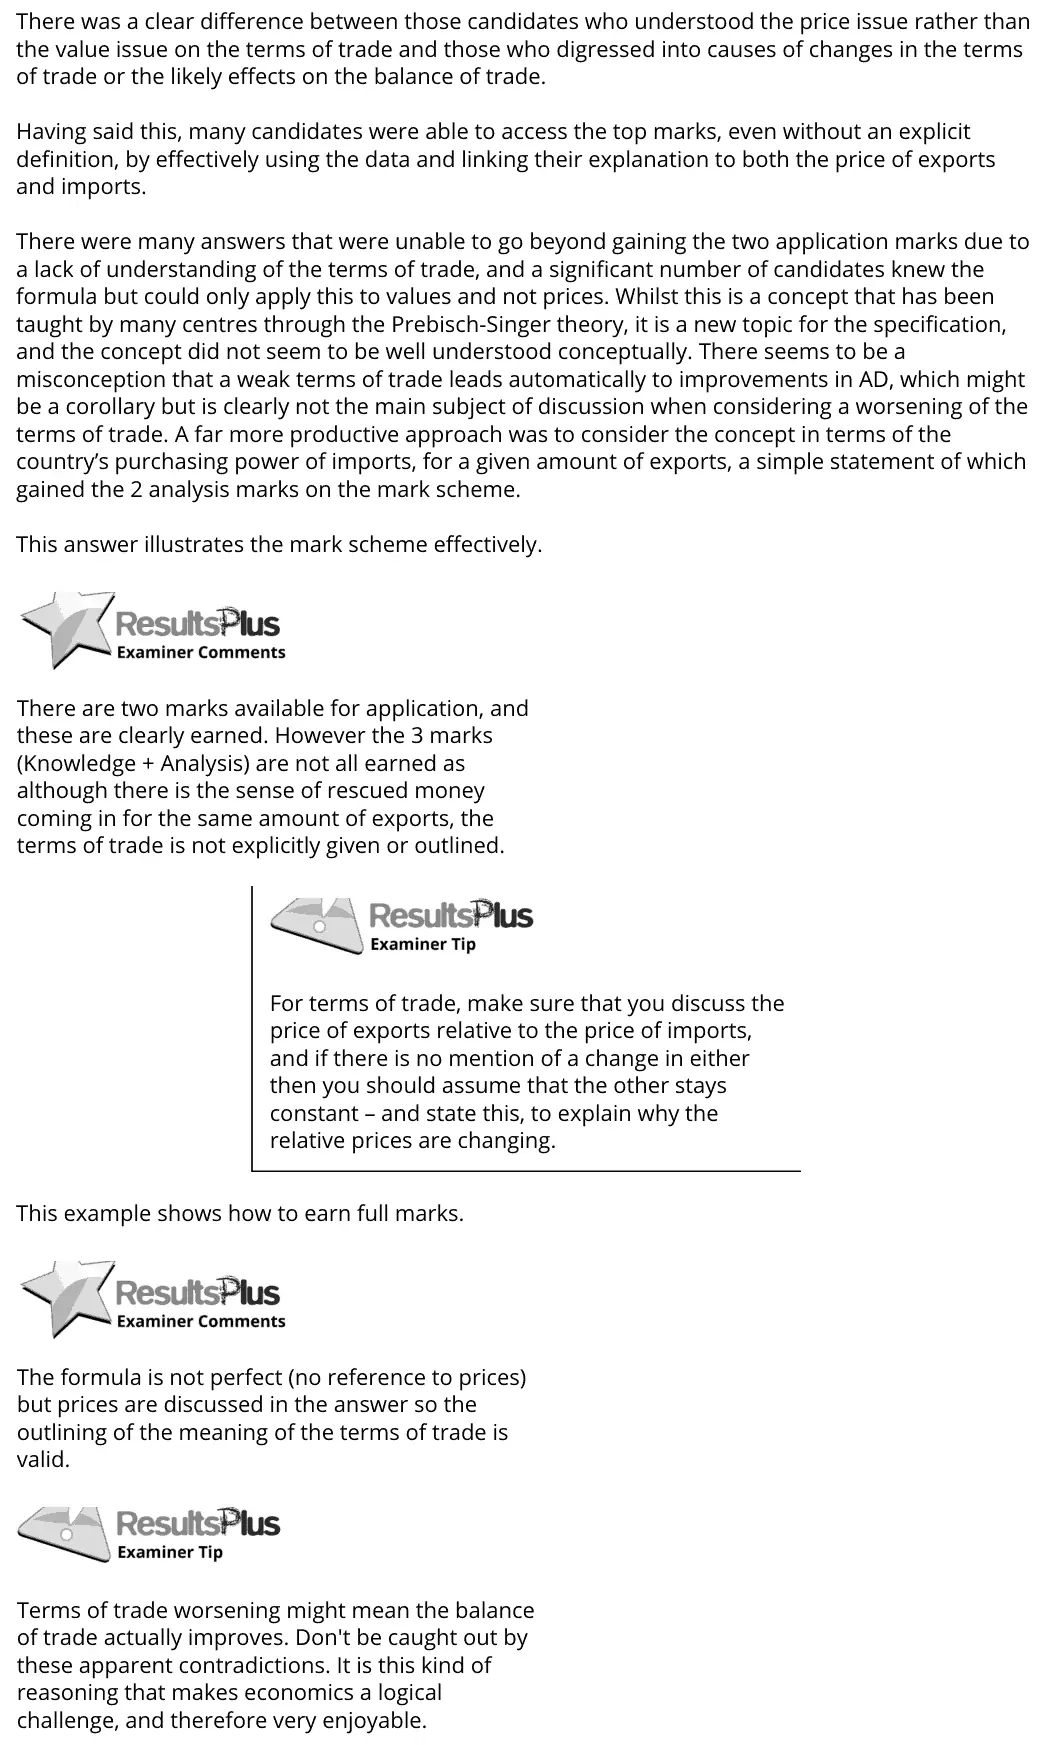
There was a clear difference between those candidates who understood the price issue rather than the value issue on the terms of trade and those who digressed into causes of changes in the terms of trade or the likely effects on the balance of trade. Having said this, many candidates were able to access the top marks, even without an explicit definition, by effectively using the data and linking their explanation to both the price of exports and imports. There were many answers that were unable to go beyond gaining the two application marks due to a lack of understanding of the terms of trade, and a significant number of candidates knew the formula but could only apply this to values and not prices. Whilst this is a concept that has been taught by many centres through the Prebisch-Singer theory, it is a new topic for the specification, and the concept did not seem to be well understood conceptually. There seems to be a misconception that a weak terms of trade leads automatically to improvements in AD, which might be a corollary but is clearly not the main subject of discussion when considering a worsening of the terms of trade. A far more productive approach was to consider the concept in terms of the country’s purchasing power of imports, for a given amount of exports, a simple statement of which gained the 2 analysis marks on the mark scheme. This answer illustrates the mark scheme effectively. There are two marks available for application, and these are clearly earned. However the 3 marks (Knowledge + Analysis) are not all earned as although there is the sense of rescued money coming in for the same amount of exports, the terms of trade is not explicitly given or outlined. For terms of trade, make sure that you discuss the price of exports relative to the price of imports, and if there is no mention of a change in either then you should assume that the other stays constant – and state this, to explain why the relative prices are changing. This example shows how to earn full marks. The formula is not perfect (no reference to prices) but prices are discussed in the answer so the outlining of the meaning of the terms of trade is valid. Terms of trade worsening might mean the balance of trade actually improves. Don't be caught out by these apparent contradictions. It is this kind of reasoning that makes economics a logical challenge, and therefore very enjoyable.
Notes from the mark scheme and report
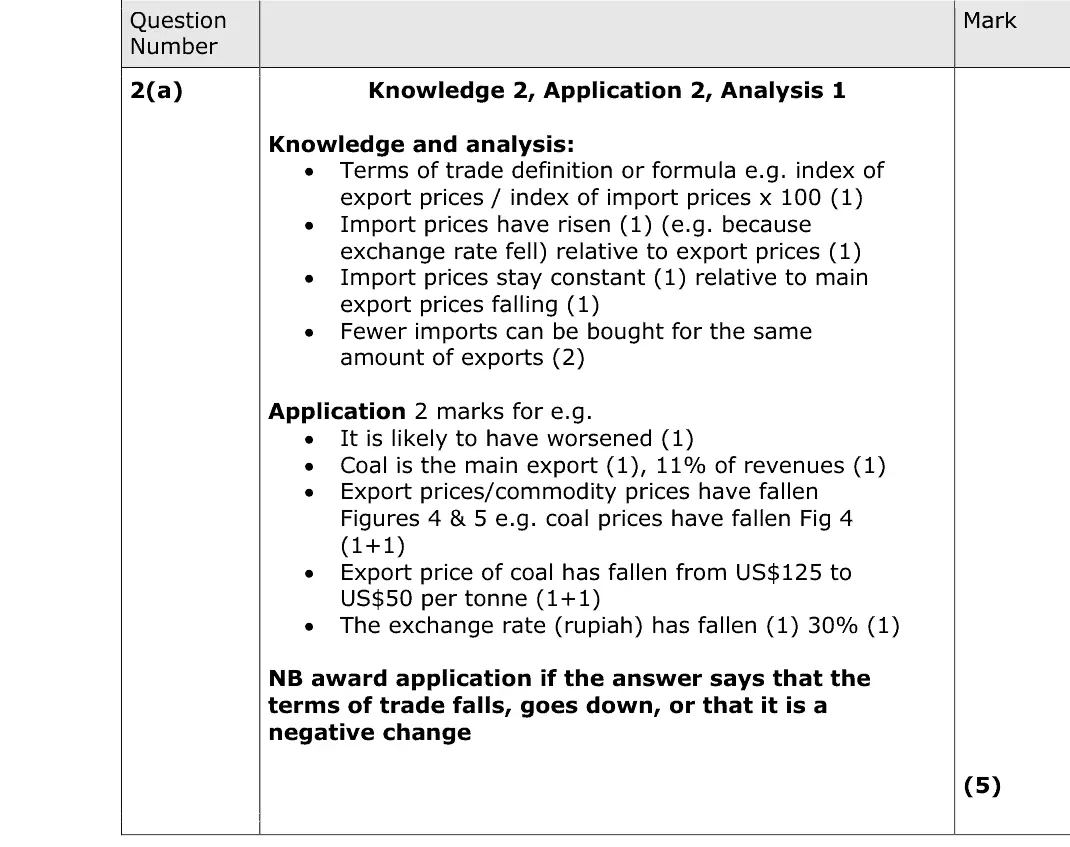
terms of trade = index of export prices / index of import prices x 100: it is about prices, not values or the balance of trade
coal price fell from US$125 to US$50 so the terms of trade worsened
fewer imports for a given amount of exports
Quantitative skills: QS 9 (interpret, apply and analyse information in written, graphical tabular and numerical forms)
June 2017 · Paper 2 · Q725 marksAO1=4, AO2=4, AO3=8, AO4=925-mark essayEither/or
Mark scheme, including the levels grid and indicative content
Examiner's comment
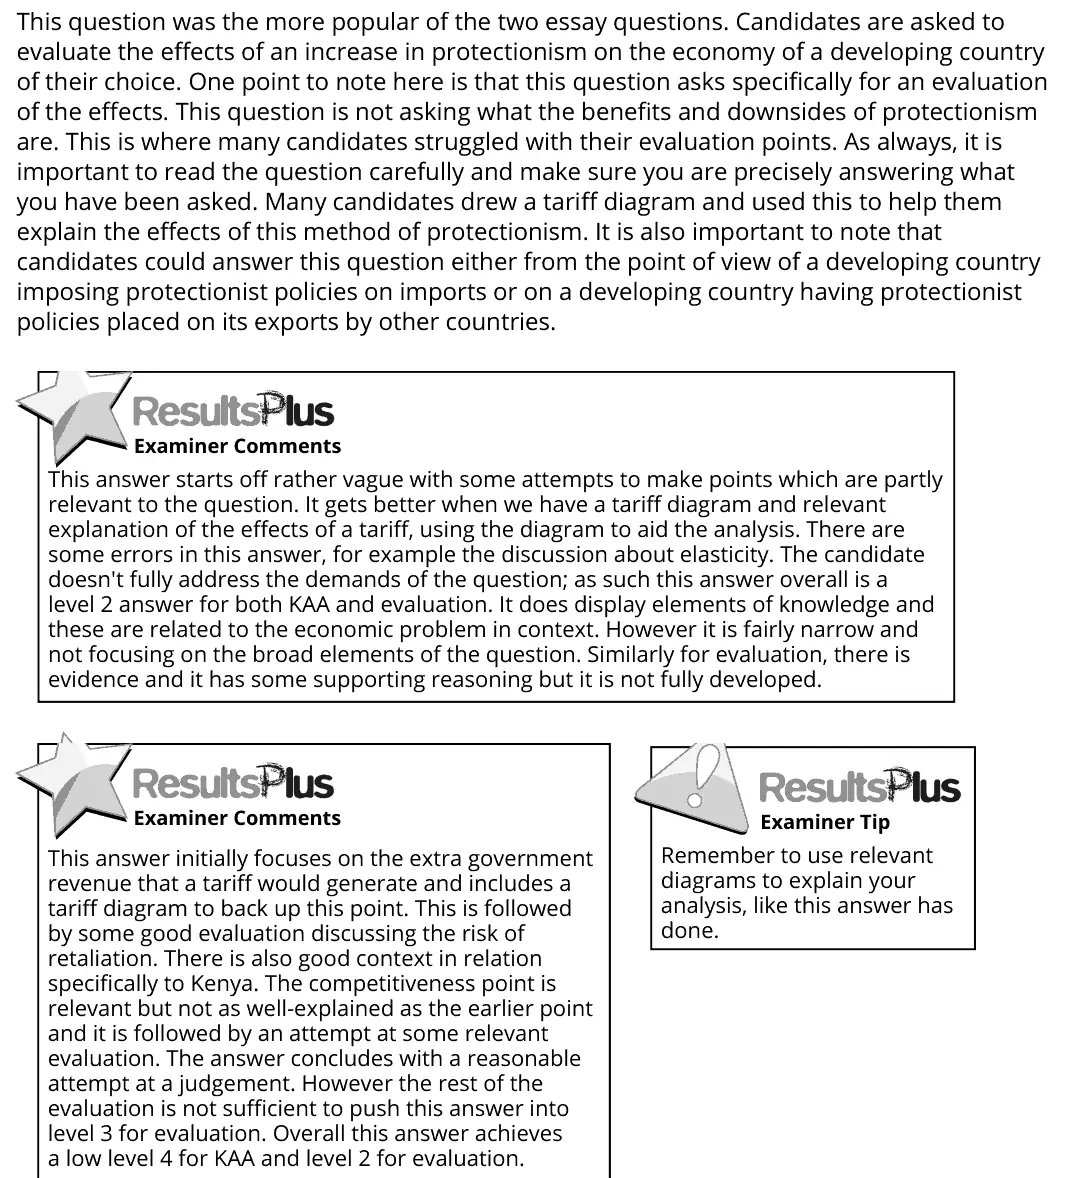
This question was the more popular of the two essay questions. Candidates are asked to evaluate the effects of an increase in protectionism on the economy of a developing country of their choice. One point to note here is that this question asks specifically for an evaluation of the effects. This question is not asking what the benefits and downsides of protectionism are. This is where many candidates struggled with their evaluation points. As always, it is important to read the question carefully and make sure you are precisely answering what you have been asked. Many candidates drew a tariff diagram and used this to help them explain the effects of this method of protectionism. It is also important to note that candidates could answer this question either from the point of view of a developing country imposing protectionist policies on imports or on a developing country having protectionist policies placed on its exports by other countries. 9EC0_02_Q07_1291601_0429_003750899_030.png This answer starts off rather vague with some attempts to make points which are partly relevant to the question. It gets better when we have a tariff diagram and relevant explanation of the effects of a tariff, using the diagram to aid the analysis. There are some errors in this answer, for example the discussion about elasticity. The candidate doesn't fully address the demands of the question; as such this answer overall is a level 2 answer for both KAA and evaluation. It does display elements of knowledge and these are related to the economic problem in context. However it is fairly narrow and not focusing on the broad elements of the question. Similarly for evaluation, there is evidence and it has some supporting reasoning but it is not fully developed. This answer initially focuses on the extra government revenue that a tariff would generate and includes a tariff diagram to back up this point. This is followed by some good evaluation discussing the risk of retaliation. There is also good context in relation specifically to Kenya. The competitiveness point is relevant but not as well-explained as the earlier point and it is followed by an attempt at some relevant evaluation. The answer concludes with a reasonable attempt at a judgement. However the rest of the evaluation is not sufficient to push this answer into level 3 for evaluation. Overall this answer achieves a low level 4 for KAA and level 2 for evaluation. Remember to use relevant diagrams to explain your analysis, like this answer has done.
Notes from the mark scheme and report
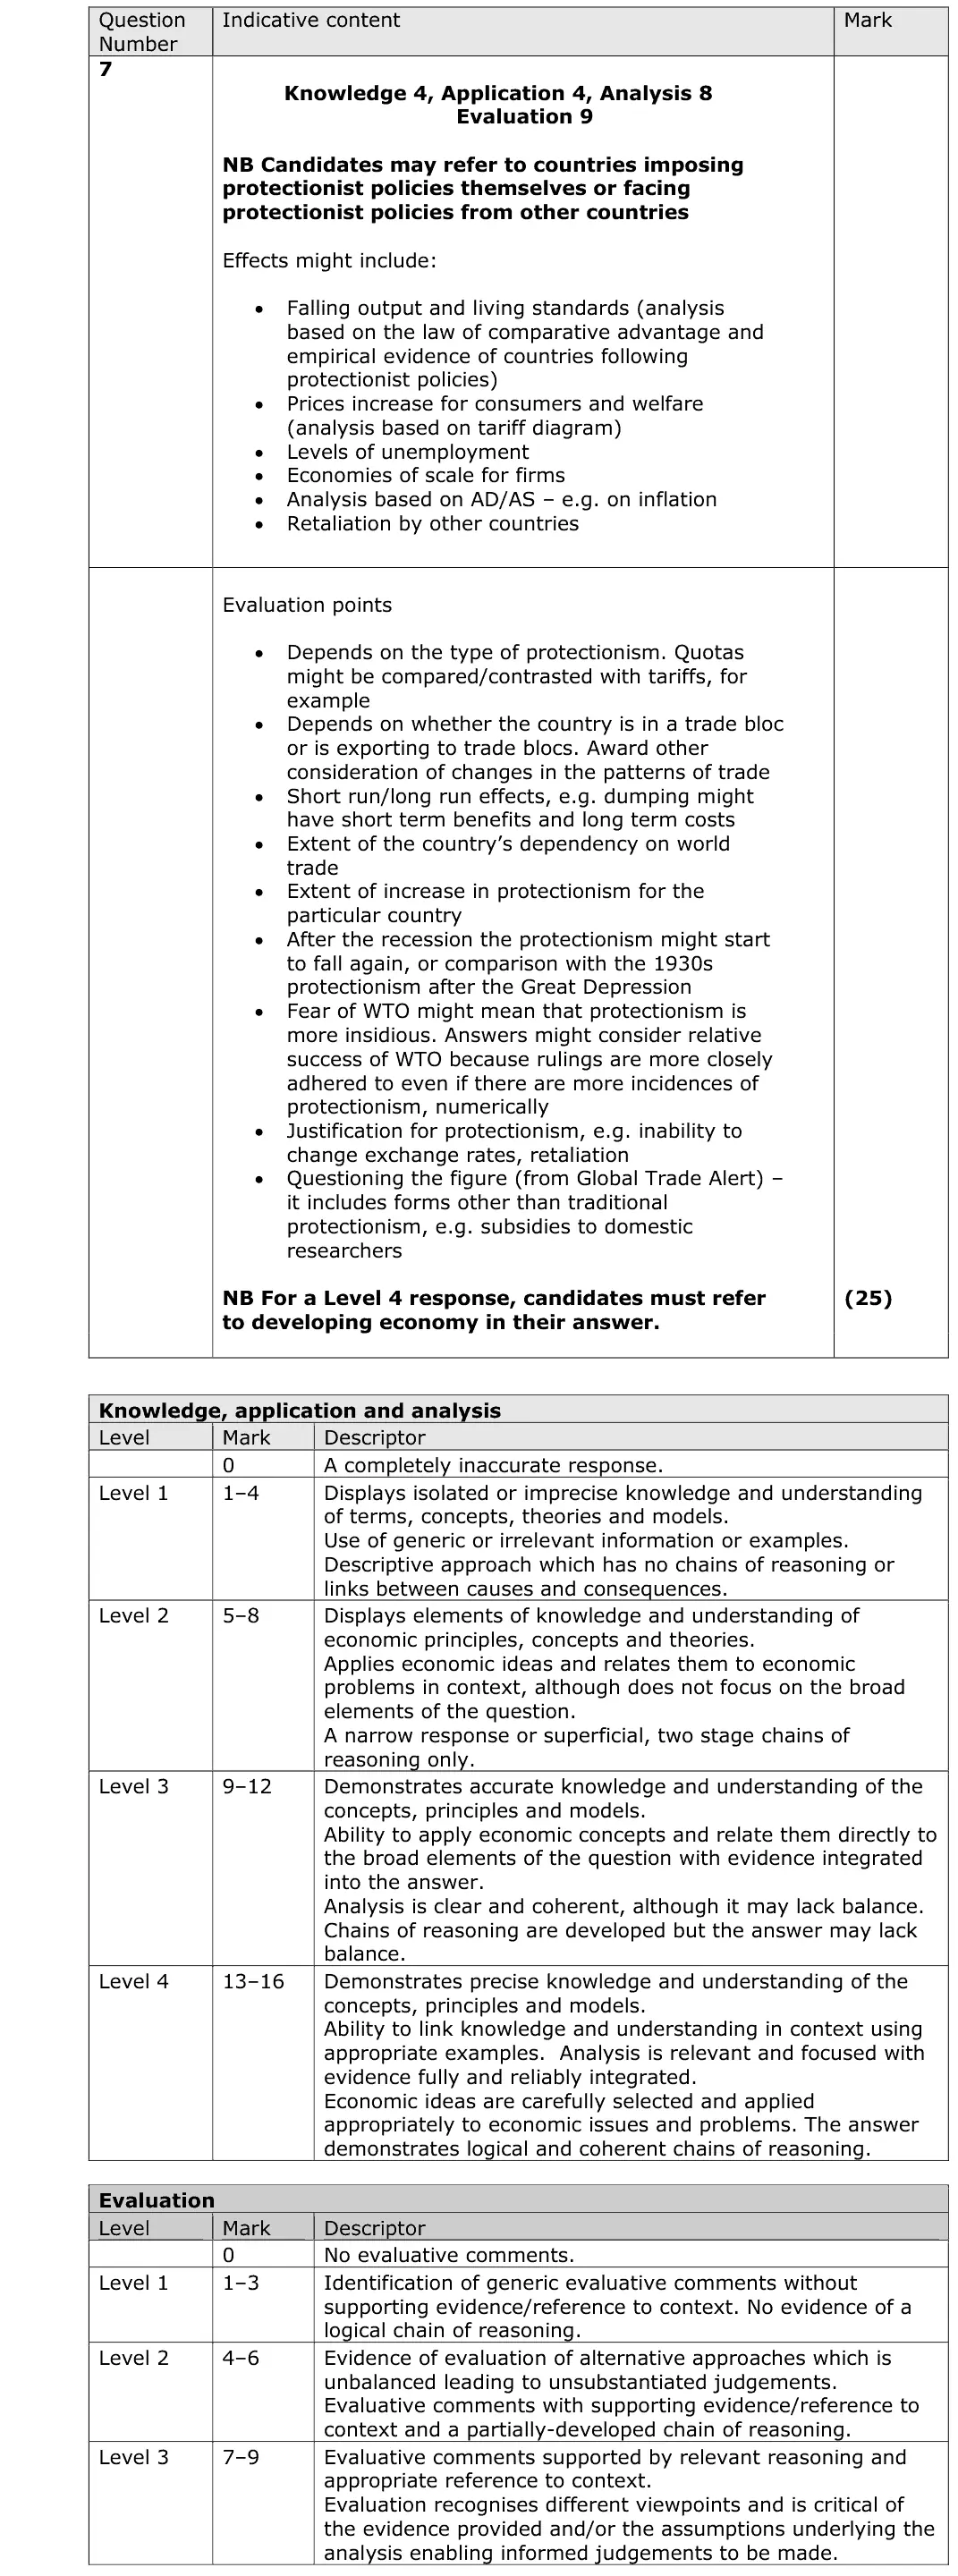
can be a developing country imposing protection or facing it from others