Notes and key-term cards for this topic are being written by our tutors. The past-paper questions below are ready now.
Specification statements
2.1.3Employment and unemployment: a) Measures of unemployment: • the claimant count • the International Labour Organisation (ILO) and the UK Labour Force Survey b) The distinction between unemployment and under-employment c) The significance of changes in the rates of: • employment • unemployment • inactivity d) The causes of unemployment: • structural unemployment • frictional unemployment • seasonal unemployment • demand deficiency and cyclical unemployment • real wage inflexibility e) The significance of migration and skills for employment and unemployment f) The effects of unemployment on consumers, firms, workers, the government and societyAS
Tap a question to zoom it. The data and extracts fold out above each question; the mark scheme and examiner's comment open underneath.
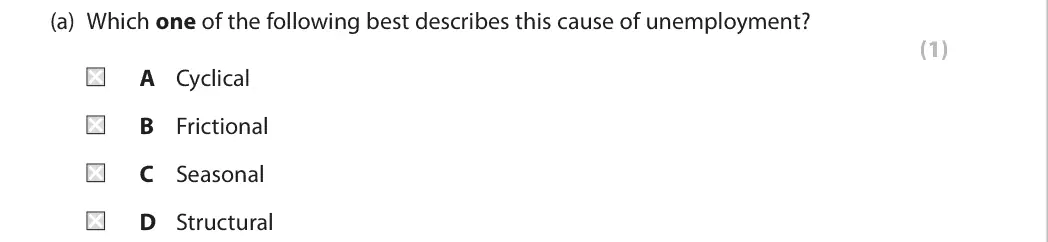
June 2025 · AS Paper 2 · Q1(a)1 markMultiple choice
Data and extracts for question 1
Answer
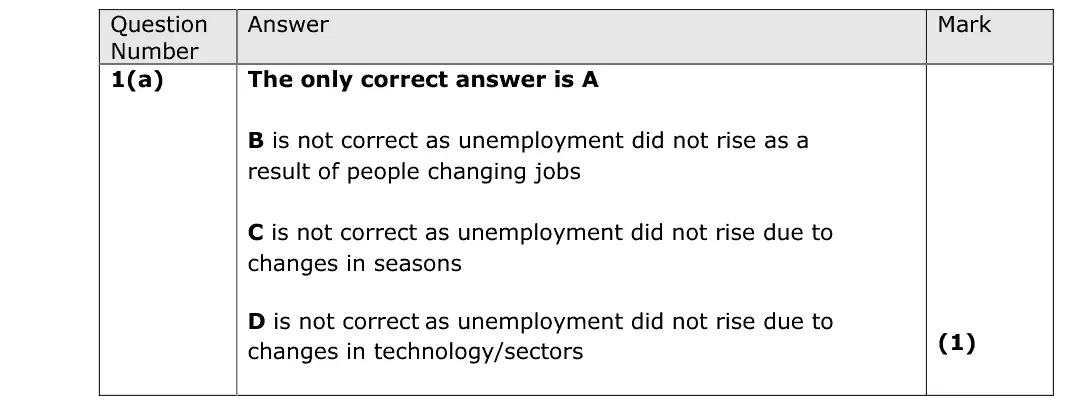
A
Mark scheme
Notes from the mark scheme and report
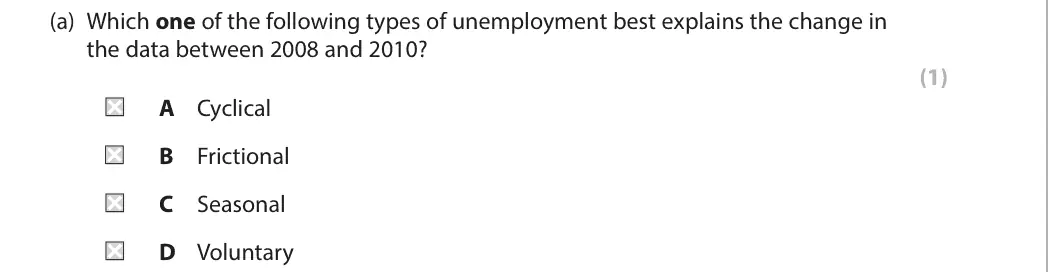
unemployment rising in a recession = cyclical (demand-deficient) (A)
not caused by changing jobs (frictional), seasons, or changes in technology/sectors (structural)
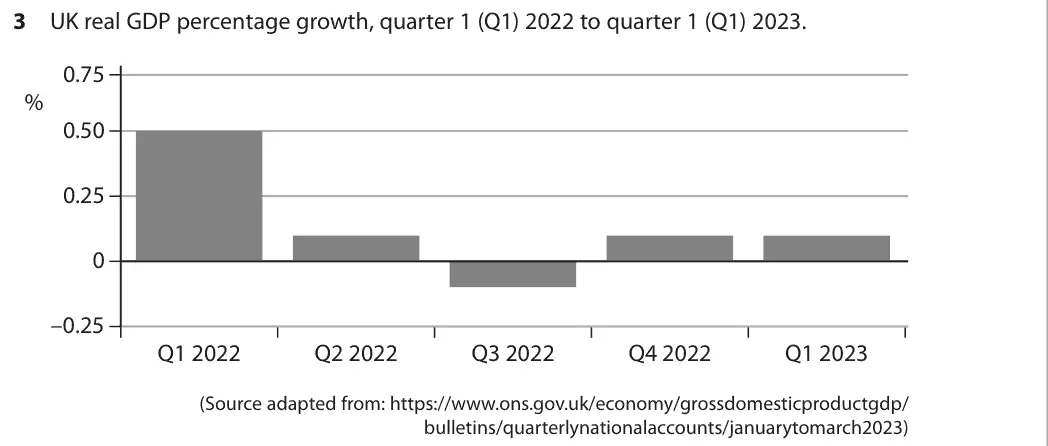
June 2025 · Paper 2 · Q3(b)(i)2 marksAO1=1, AO3=1Short answer
Data and extracts for question 3
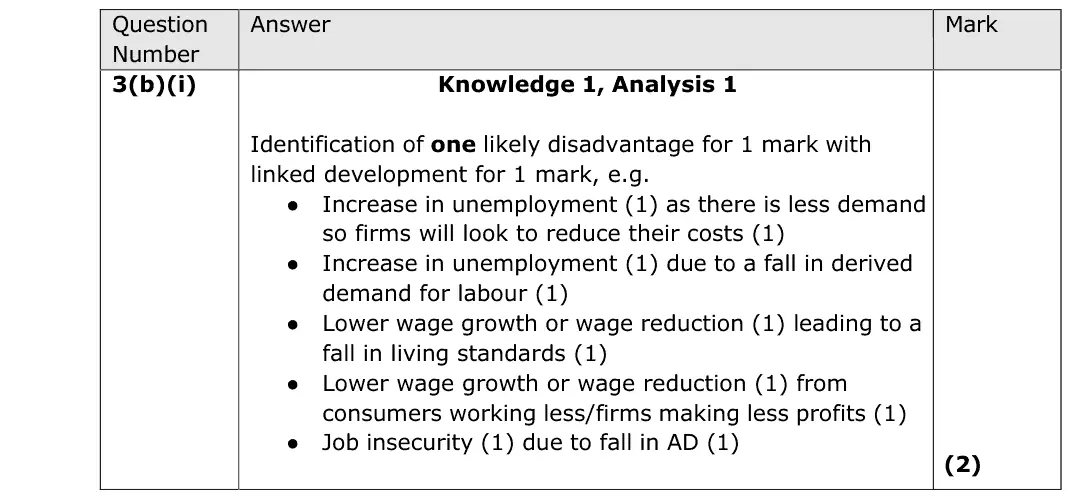
Mark scheme
Examiner's comment
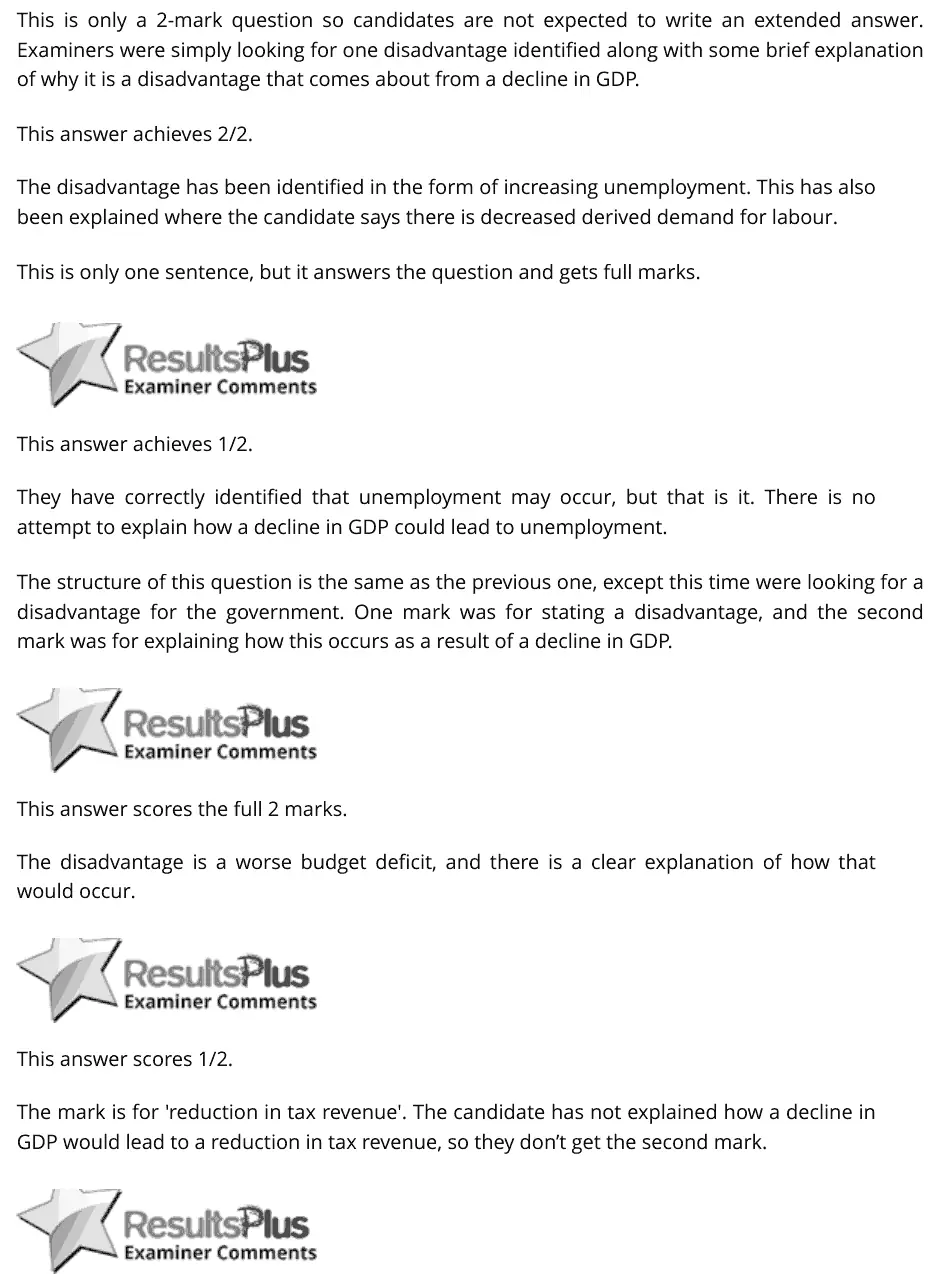
This is only a 2-mark question so candidates are not expected to write an extended answer. Examiners were simply looking for one disadvantage identified along with some brief explanation of why it is a disadvantage that comes about from a decline in GDP. This answer achieves 2/2. The disadvantage has been identified in the form of increasing unemployment. This has also been explained where the candidate says there is decreased derived demand for labour. This is only one sentence, but it answers the question and gets full marks. This answer achieves 1/2. They have correctly identified that unemployment may occur, but that is it. There is no attempt to explain how a decline in GDP could lead to unemployment. The structure of this question is the same as the previous one, except this time were looking for a disadvantage for the government. One mark was for stating a disadvantage, and the second mark was for explaining how this occurs as a result of a decline in GDP. This answer scores the full 2 marks. The disadvantage is a worse budget deficit, and there is a clear explanation of how that would occur. This answer scores 1/2. The mark is for 'reduction in tax revenue'. The candidate has not explained how a decline in GDP would lead to a reduction in tax revenue, so they don’t get the second mark.
Notes from the mark scheme and report
one disadvantage of falling GDP for workers with a linked development: higher unemployment as derived demand for labour falls, lower wage growth, job insecurity
June 2025 · Paper 2 · Q5(a)2 marksAO2=2Calculation
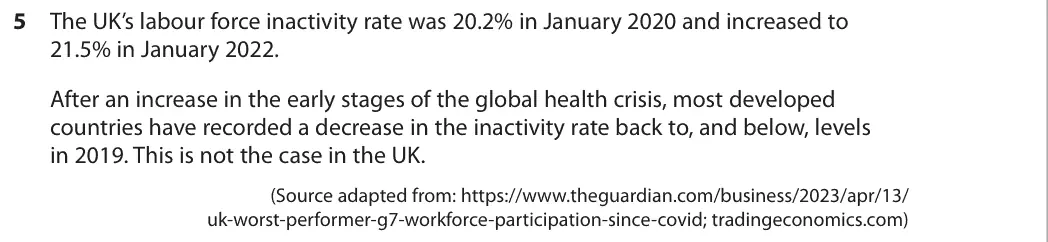
Data and extracts for question 5
Mark scheme
Examiner's comment
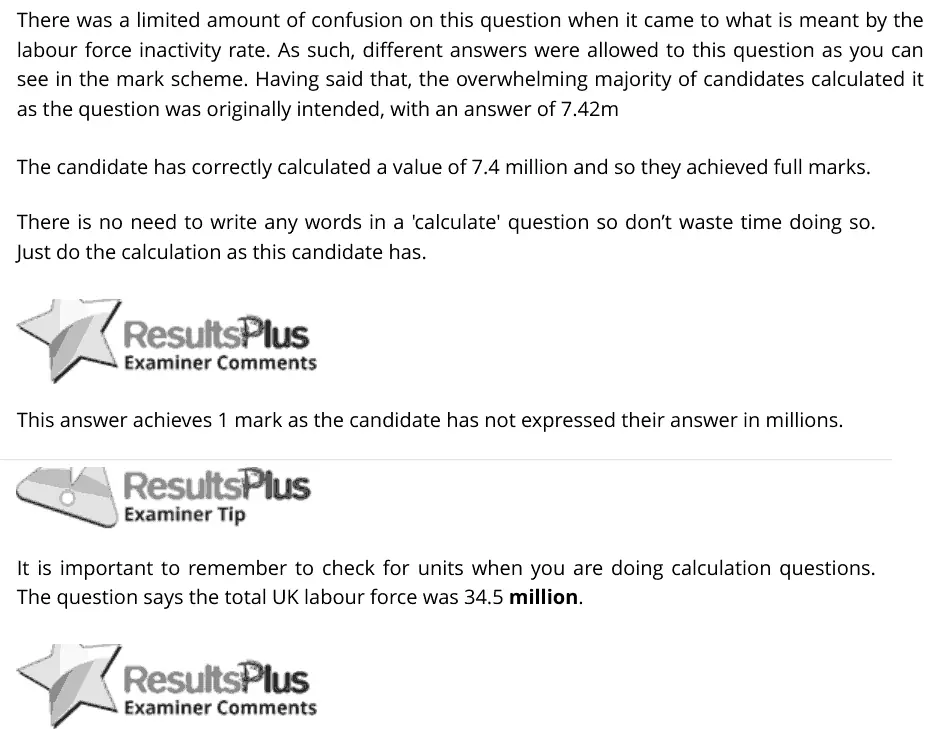
There was a limited amount of confusion on this question when it came to what is meant by the labour force inactivity rate. As such, different answers were allowed to this question as you can see in the mark scheme. Having said that, the overwhelming majority of candidates calculated it as the question was originally intended, with an answer of 7.42m The candidate has correctly calculated a value of 7.4 million and so they achieved full marks. There is no need to write any words in a 'calculate' question so don’t waste time doing so. Just do the calculation as this candidate has. This answer achieves 1 mark as the candidate has not expressed their answer in millions. It is important to remember to check for units when you are doing calculation questions. The question says the total UK labour force was 34.5 million.
Notes from the mark scheme and report
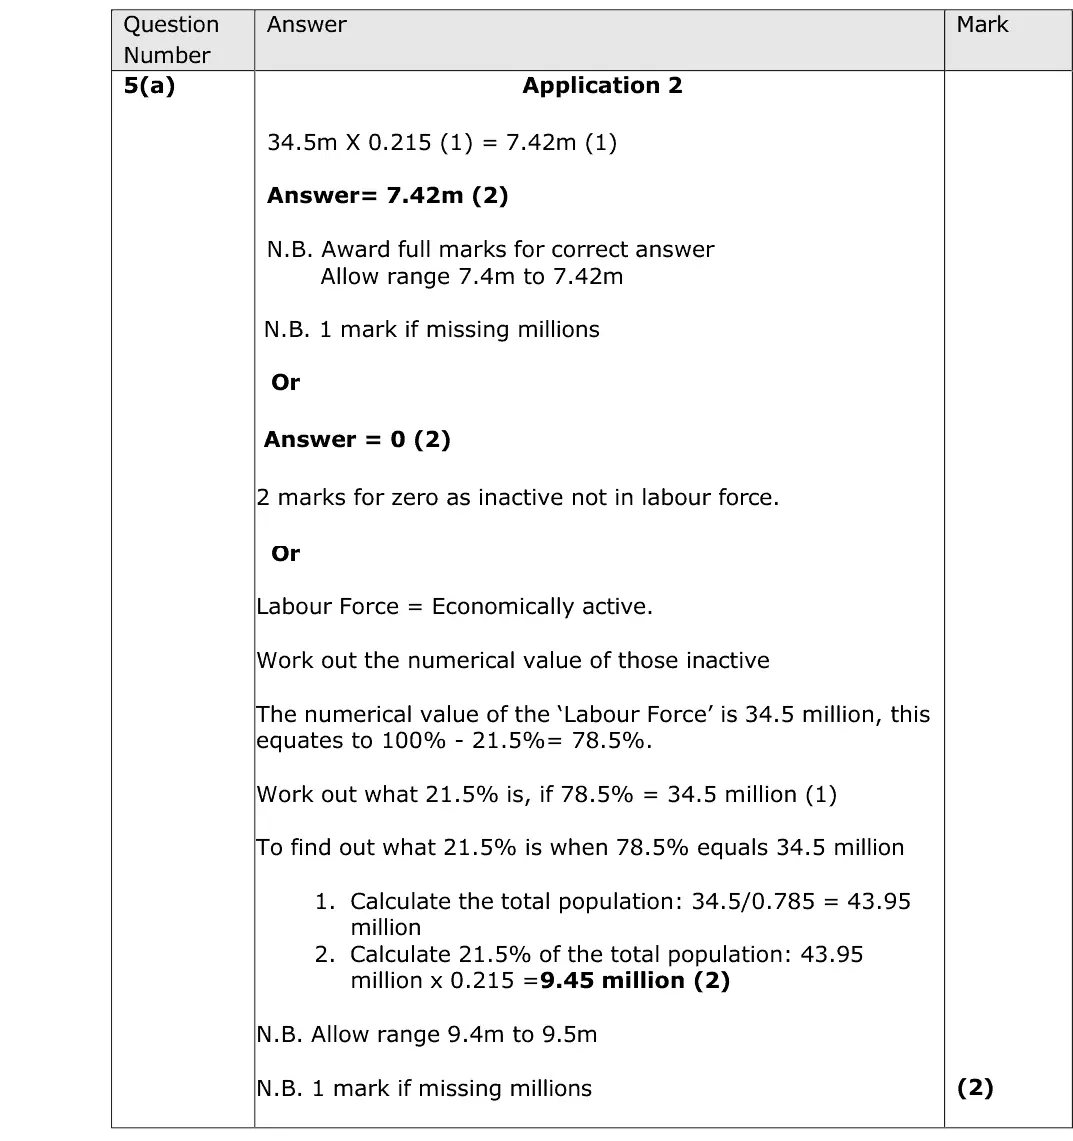
34.5m x 0.215 = 7.42 million
leaving out "million" loses a mark
alternative interpretations accepted by the mark scheme (0, as the labour force excludes the inactive)
Quantitative skills: QS 2 (calculate, use and understand percentages, percentage changes and percentage point changes)
June 2025 · Paper 2 · Q5(b)2 marksAO1=1, AO3=1Short answer
Data and extracts for question 5
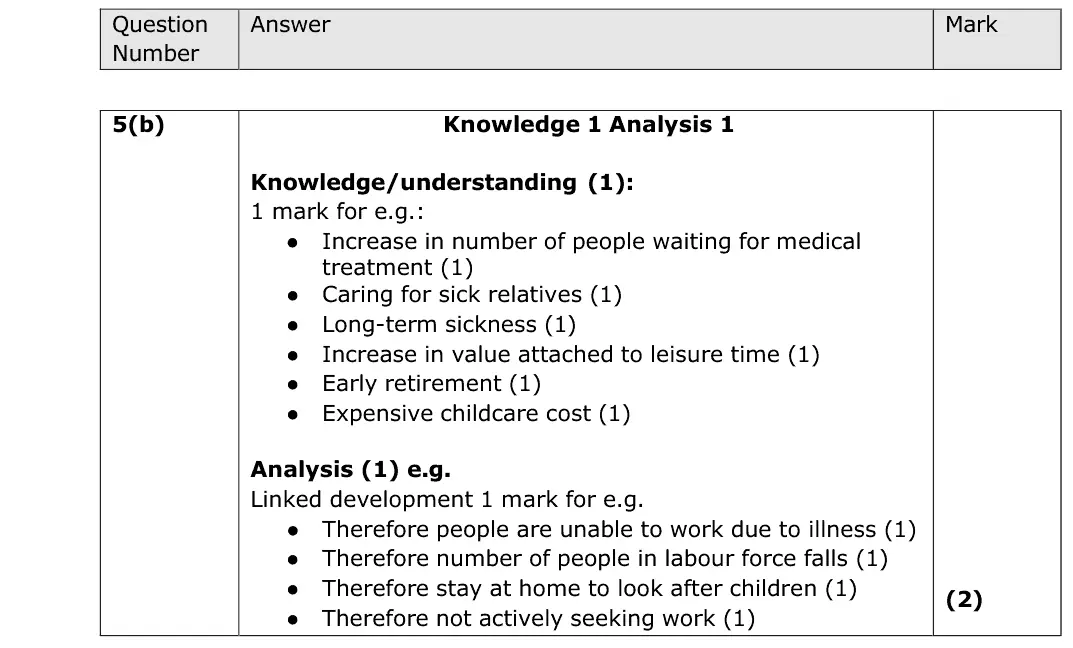
Mark scheme
Examiner's comment
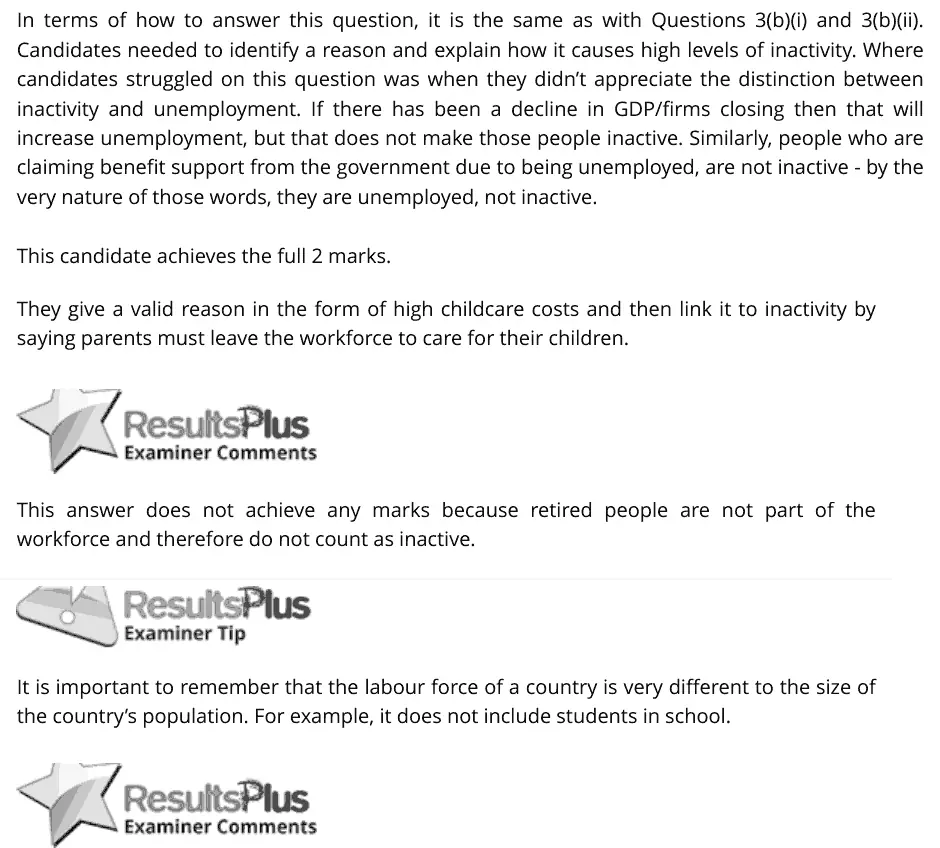
In terms of how to answer this question, it is the same as with Questions 3(b)(i) and 3(b)(ii). Candidates needed to identify a reason and explain how it causes high levels of inactivity. Where candidates struggled on this question was when they didn’t appreciate the distinction between inactivity and unemployment. If there has been a decline in GDP/firms closing then that will increase unemployment, but that does not make those people inactive. Similarly, people who are claiming benefit support from the government due to being unemployed, are not inactive - by the very nature of those words, they are unemployed, not inactive. This candidate achieves the full 2 marks. They give a valid reason in the form of high childcare costs and then link it to inactivity by saying parents must leave the workforce to care for their children. This answer does not achieve any marks because retired people are not part of the workforce and therefore do not count as inactive. It is important to remember that the labour force of a country is very different to the size of the country’s population. For example, it does not include students in school.
Notes from the mark scheme and report
reason for inactivity (long-term sickness, NHS waiting lists, caring, early retirement, childcare costs) linked to leaving the labour force
report: candidates struggled when they confused inactivity with unemployment
June 2025 · Paper 2 · Q5(c)1 markMultiple choice
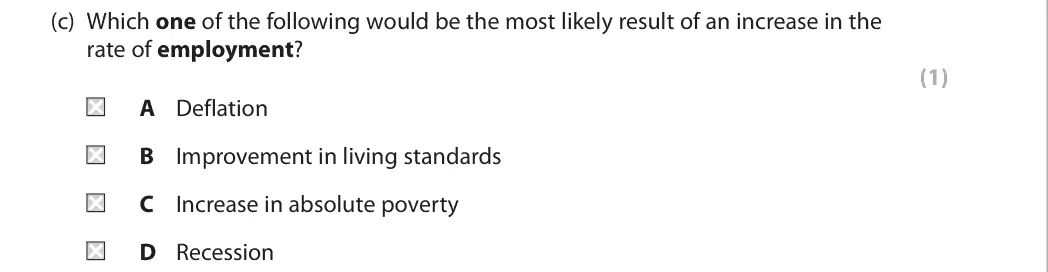
Data and extracts for question 5
Answer
B
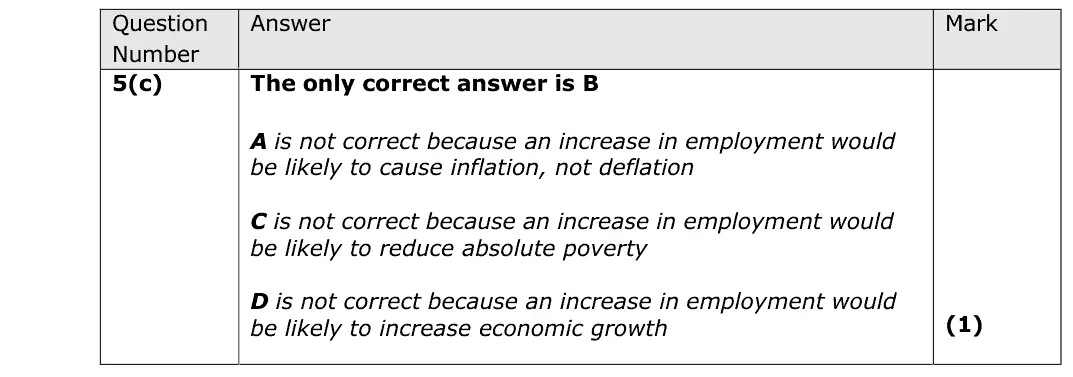
Mark scheme
Notes from the mark scheme and report
more employment raises incomes and living standards (B)
it is more likely to cause inflation not deflation, reduce absolute poverty and raise growth rather than cause recession
June 2024 · AS Paper 2 · Q3(a)1 markMultiple choice
Data and extracts for question 3
Answer
C
Mark scheme
Notes from the mark scheme and report
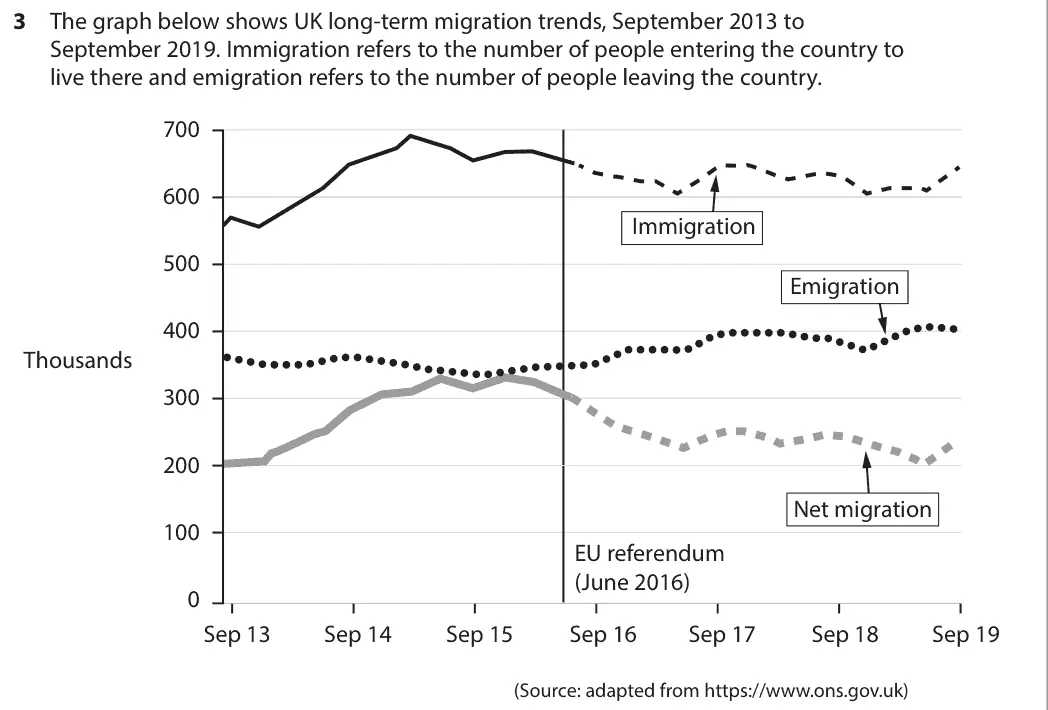
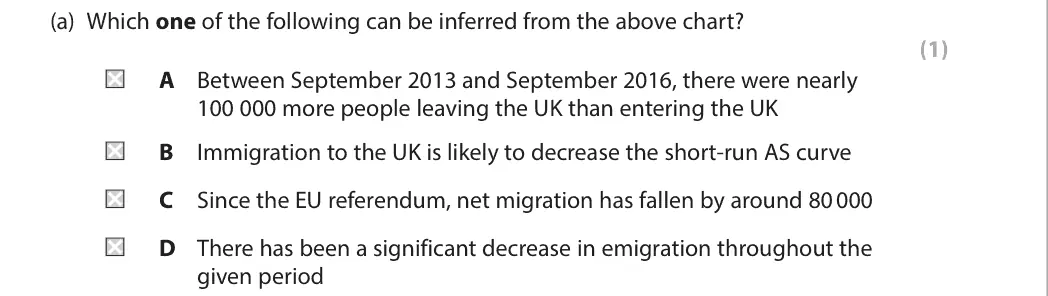
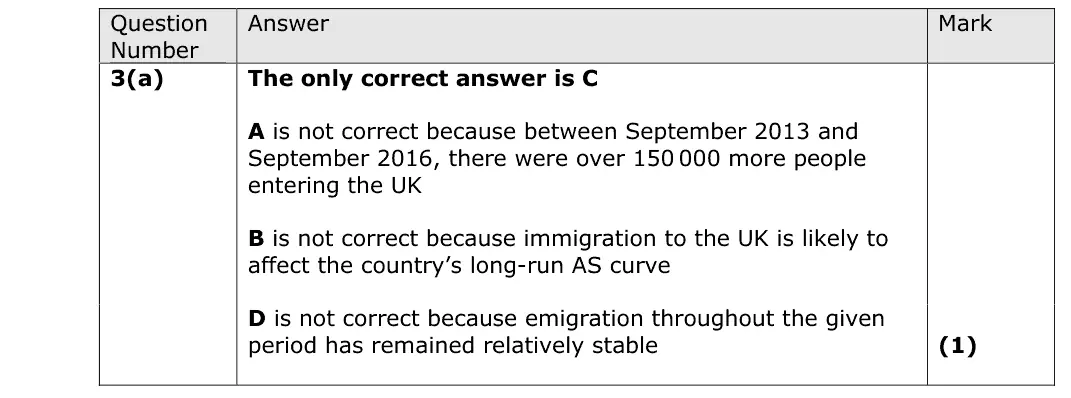
net migration fell from about 300 000 to about 220 000 after the referendum (C)
A more people entered than left
B migration affects LRAS, not a fall in SRAS
D emigration was fairly stable
Quantitative skills: QS 9 (interpret, apply and analyse information in written, graphical tabular and numerical forms)
June 2024 · AS Paper 2 · Q3(b)3 marksAO1=1, AO2=1, AO3=1Short answerHard
Data and extracts for question 3
Mark scheme
Examiner's comment
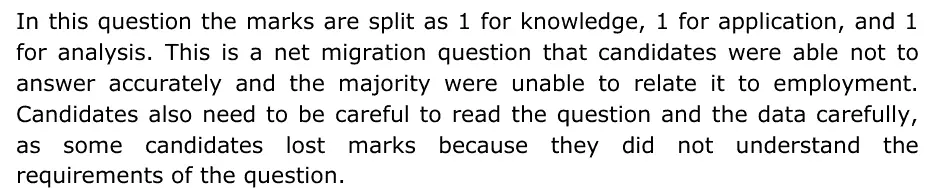
In this question the marks are split as 1 for knowledge, 1 for application, and 1 for analysis. This is a net migration question that candidates were able not to answer accurately and the majority were unable to relate it to employment. Candidates also need to be careful to read the question and the data carefully, as some candidates lost marks because they did not understand the requirements of the question.
Notes from the mark scheme and report
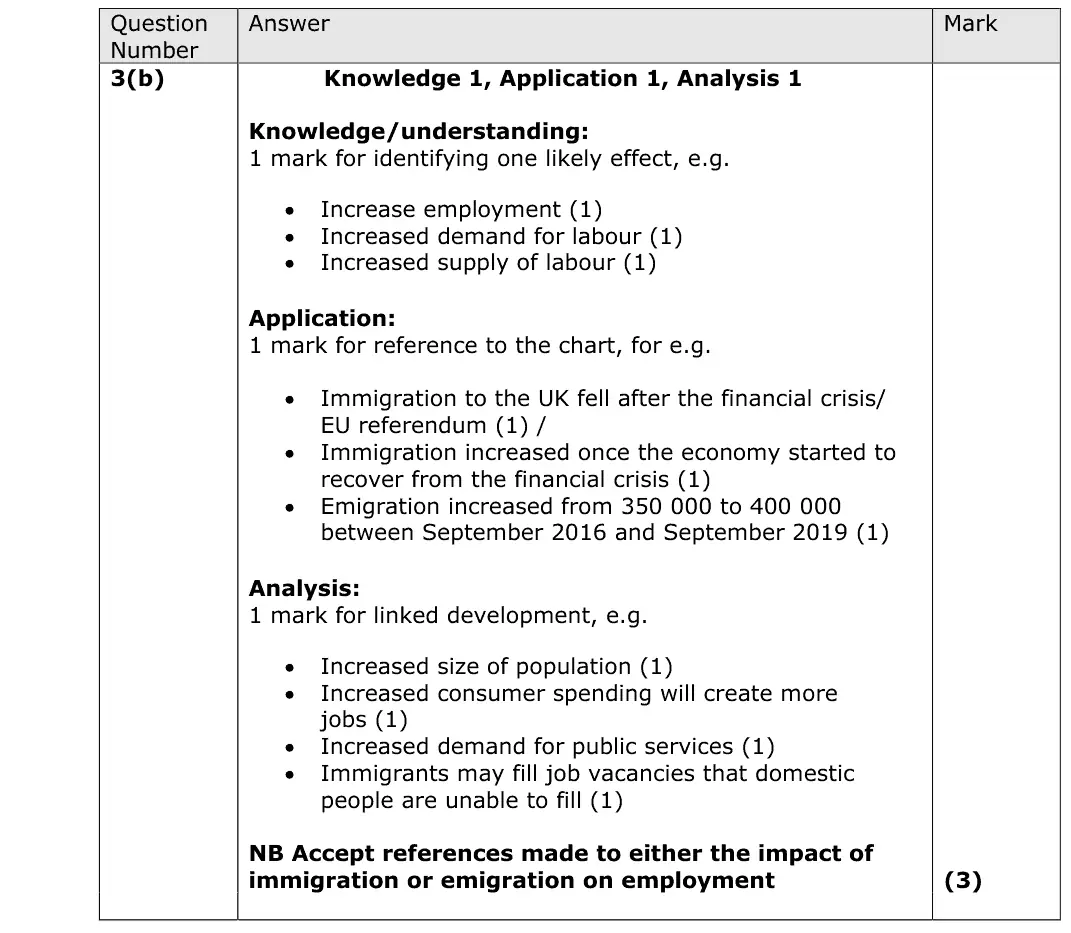
link migration to employment: more labour supply fills vacancies, and more spending creates jobs
quote the chart (immigration fell after the 2016 referendum, emigration rose from 350 000 to 400 000)
report: the majority "were unable to relate it to employment"
Quantitative skills: QS 9 (interpret, apply and analyse information in written, graphical tabular and numerical forms)
June 2023 · Paper 2 · Q2(a)1 markMultiple choice
Data and extracts for question 2
Answer
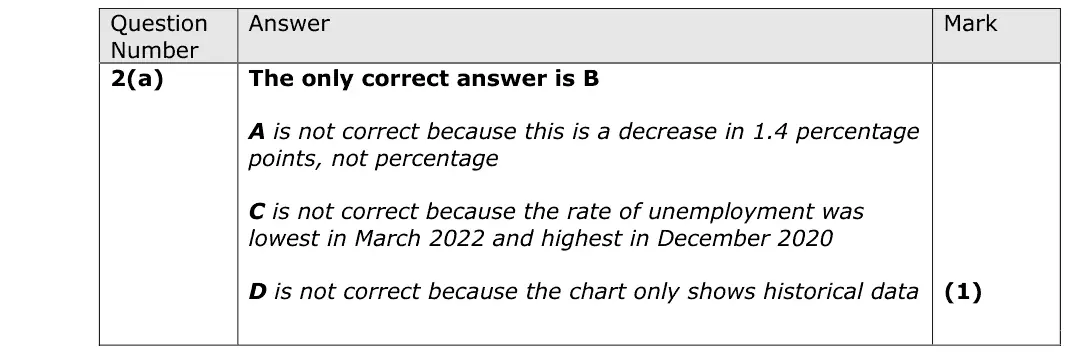
B
Mark scheme
Notes from the mark scheme and report
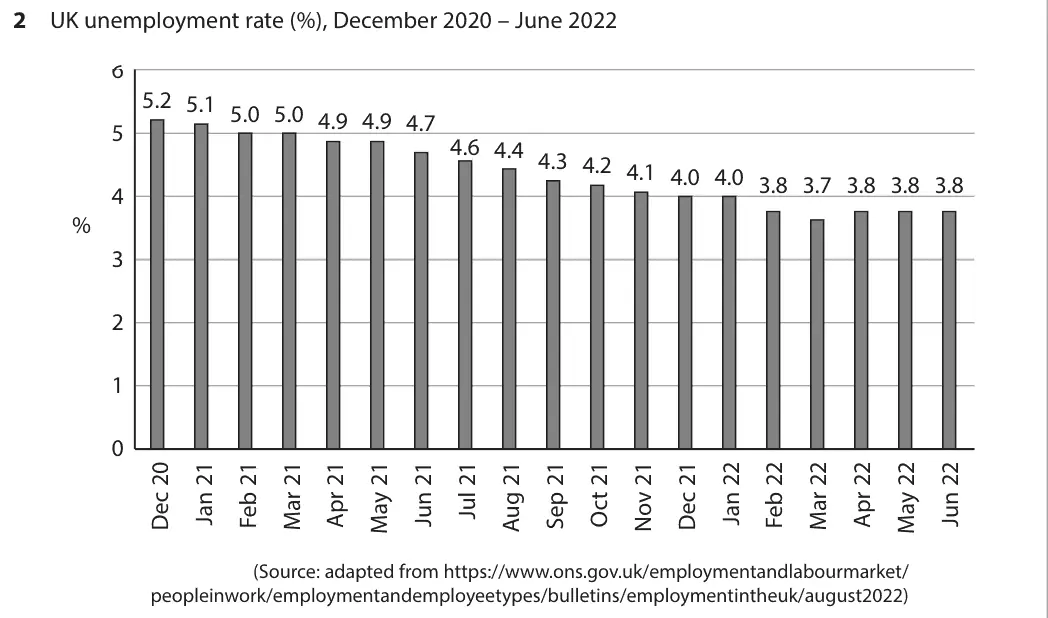
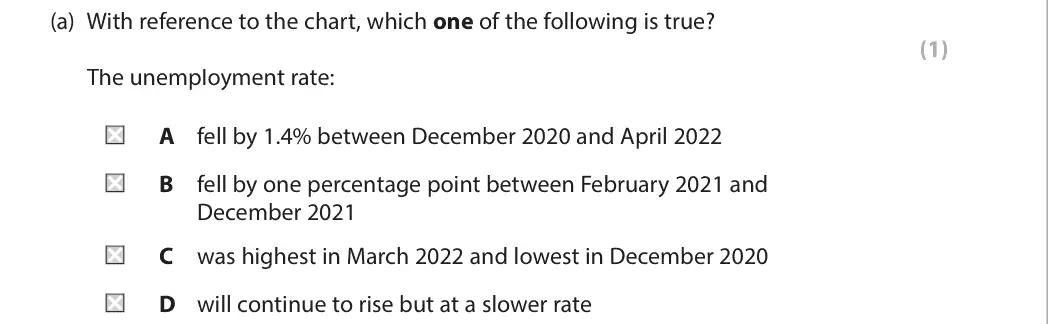
5.0% (Feb 21) to 4.0% (Dec 21) is a fall of one percentage point (B)
A confuses 1.4 percentage points with 1.4%
C reverses the highest and lowest months
D is a forecast the chart cannot show
Quantitative skills: QS 10 (distinguish between changes in the level of a variable, and the rate of change); QS 2 (calculate, use and understand percentages, percentage changes and percentage point changes); QS 9 (interpret, apply and analyse information in written, graphical tabular and numerical forms)
June 2023 · Paper 2 · Q2(b)4 marksAO1=2, AO2=1, AO3=1Short answer
Data and extracts for question 2
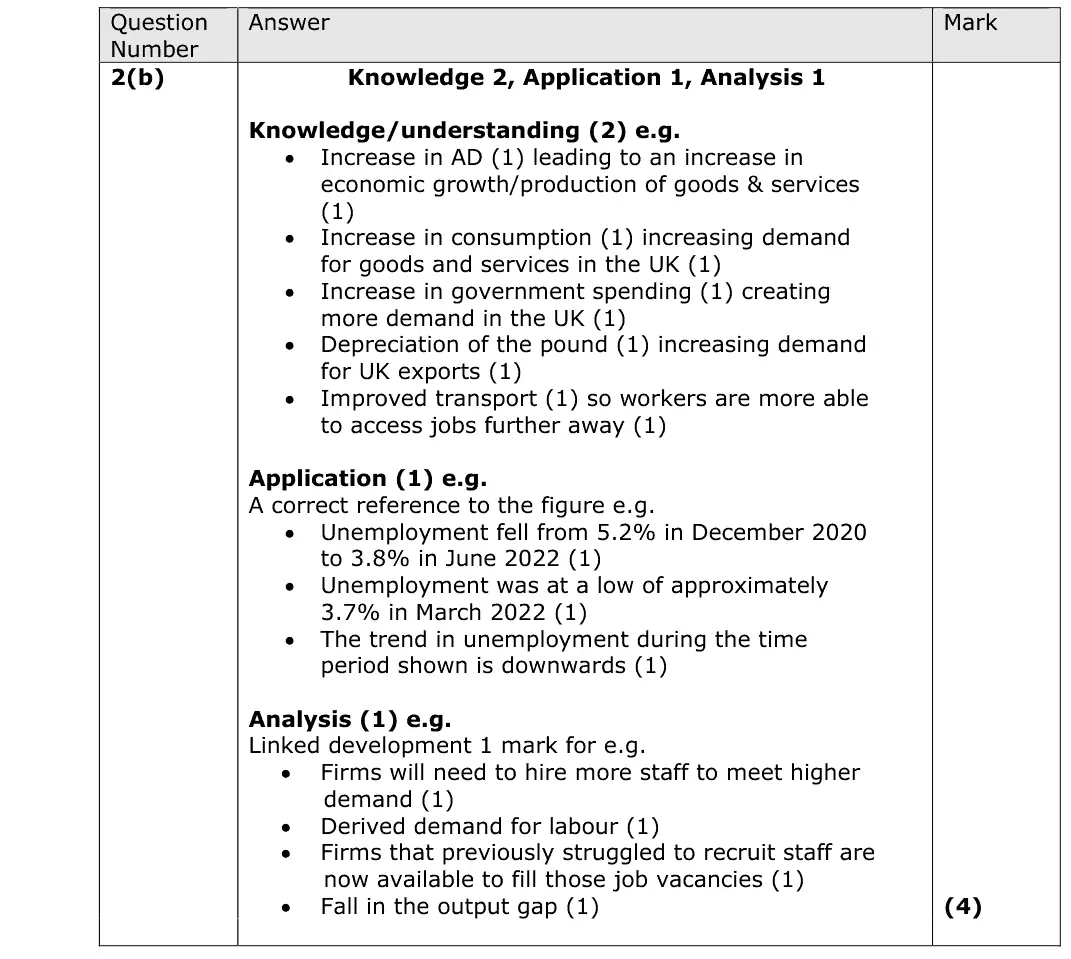
Mark scheme
Examiner's comment
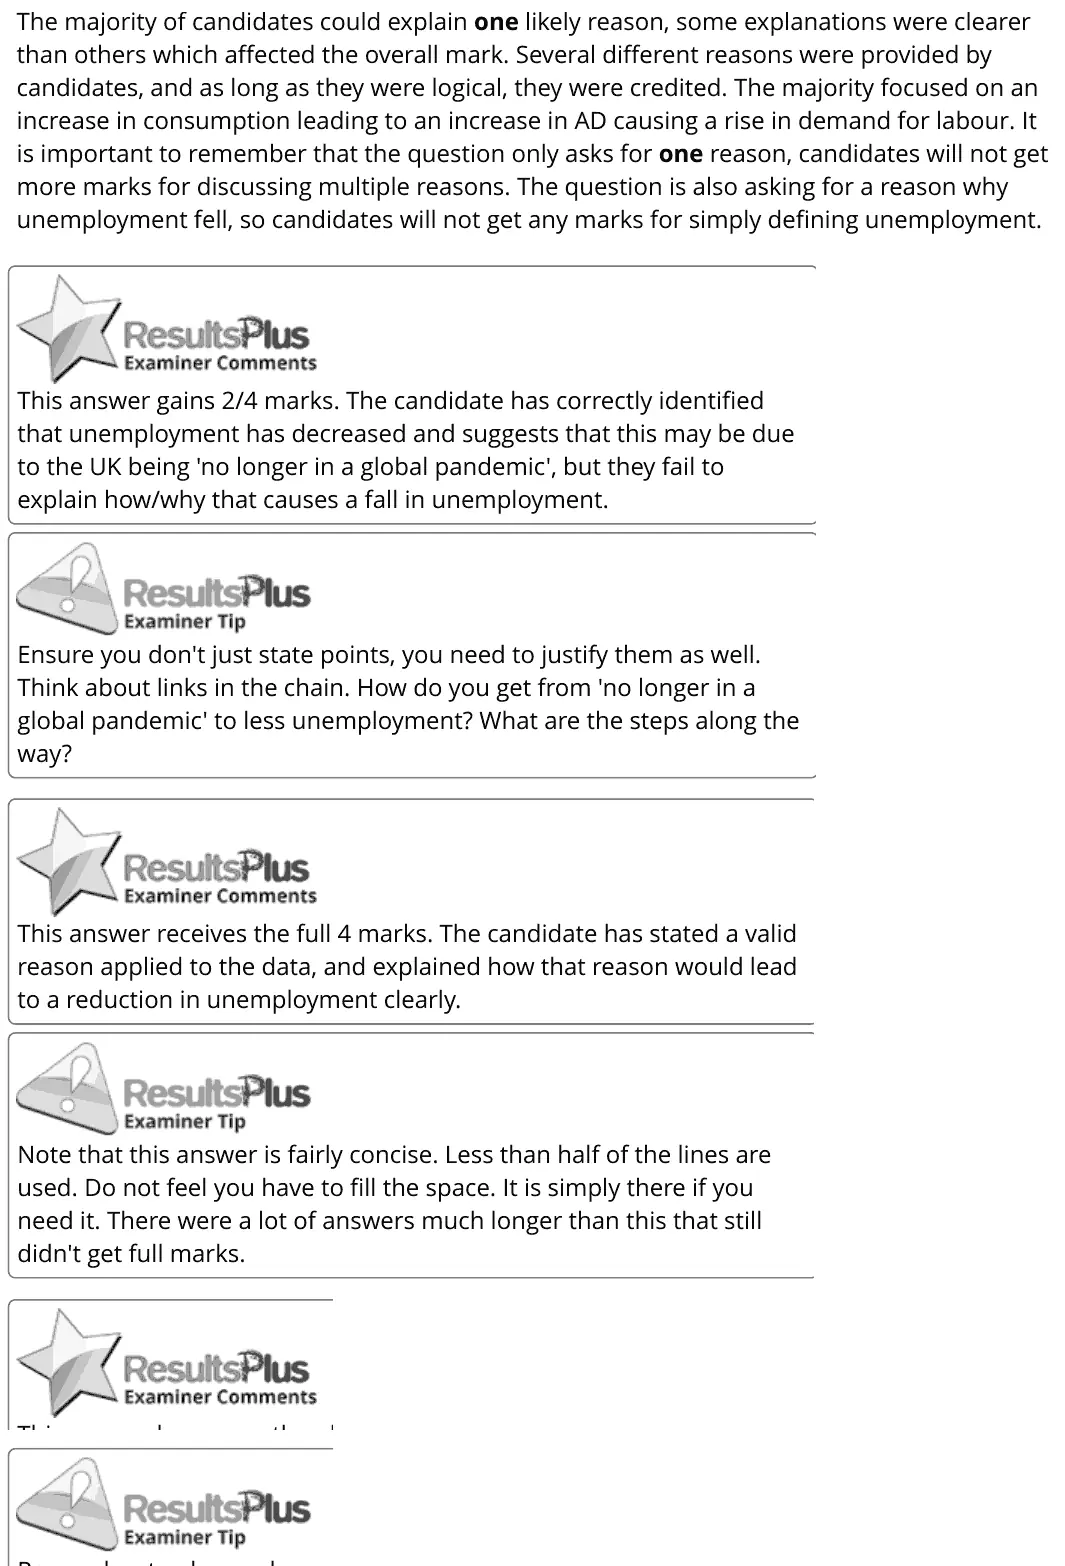
The majority of candidates could explain one likely reason, some explanations were clearer than others which affected the overall mark. Several different reasons were provided by candidates, and as long as they were logical, they were credited. The majority focused on an increase in consumption leading to an increase in AD causing a rise in demand for labour. It is important to remember that the question only asks for one reason, candidates will not get more marks for discussing multiple reasons. The question is also asking for a reason why unemployment fell, so candidates will not get any marks for simply defining unemployment. This answer gains 2/4 marks. The candidate has correctly identified that unemployment has decreased and suggests that this may be due to the UK being 'no longer in a global pandemic', but they fail to explain how/why that causes a fall in unemployment. Ensure you don't just state points, you need to justify them as well. Think about links in the chain. How do you get from 'no longer in a global pandemic' to less unemployment? What are the steps along the way? This answer receives the full 4 marks. The candidate has stated a valid reason applied to the data, and explained how that reason would lead to a reduction in unemployment clearly. Note that this answer is fairly concise. Less than half of the lines are used. Do not feel you have to fill the space. It is simply there if you need it. There were a lot of answers much longer than this that still didn't get full marks.
Notes from the mark scheme and report
unemployment fell from 5.2% (Dec 2020) to 3.8% (June 2022)
one reason (rising consumption/AD, derived demand for labour) developed
explain only one reason
do not just define unemployment
Quantitative skills: QS 9 (interpret, apply and analyse information in written, graphical tabular and numerical forms)
November 2021 · Paper 3 · Q2(b)8 marksAO1=2, AO2=2, AO3=2, AO4=28-mark response
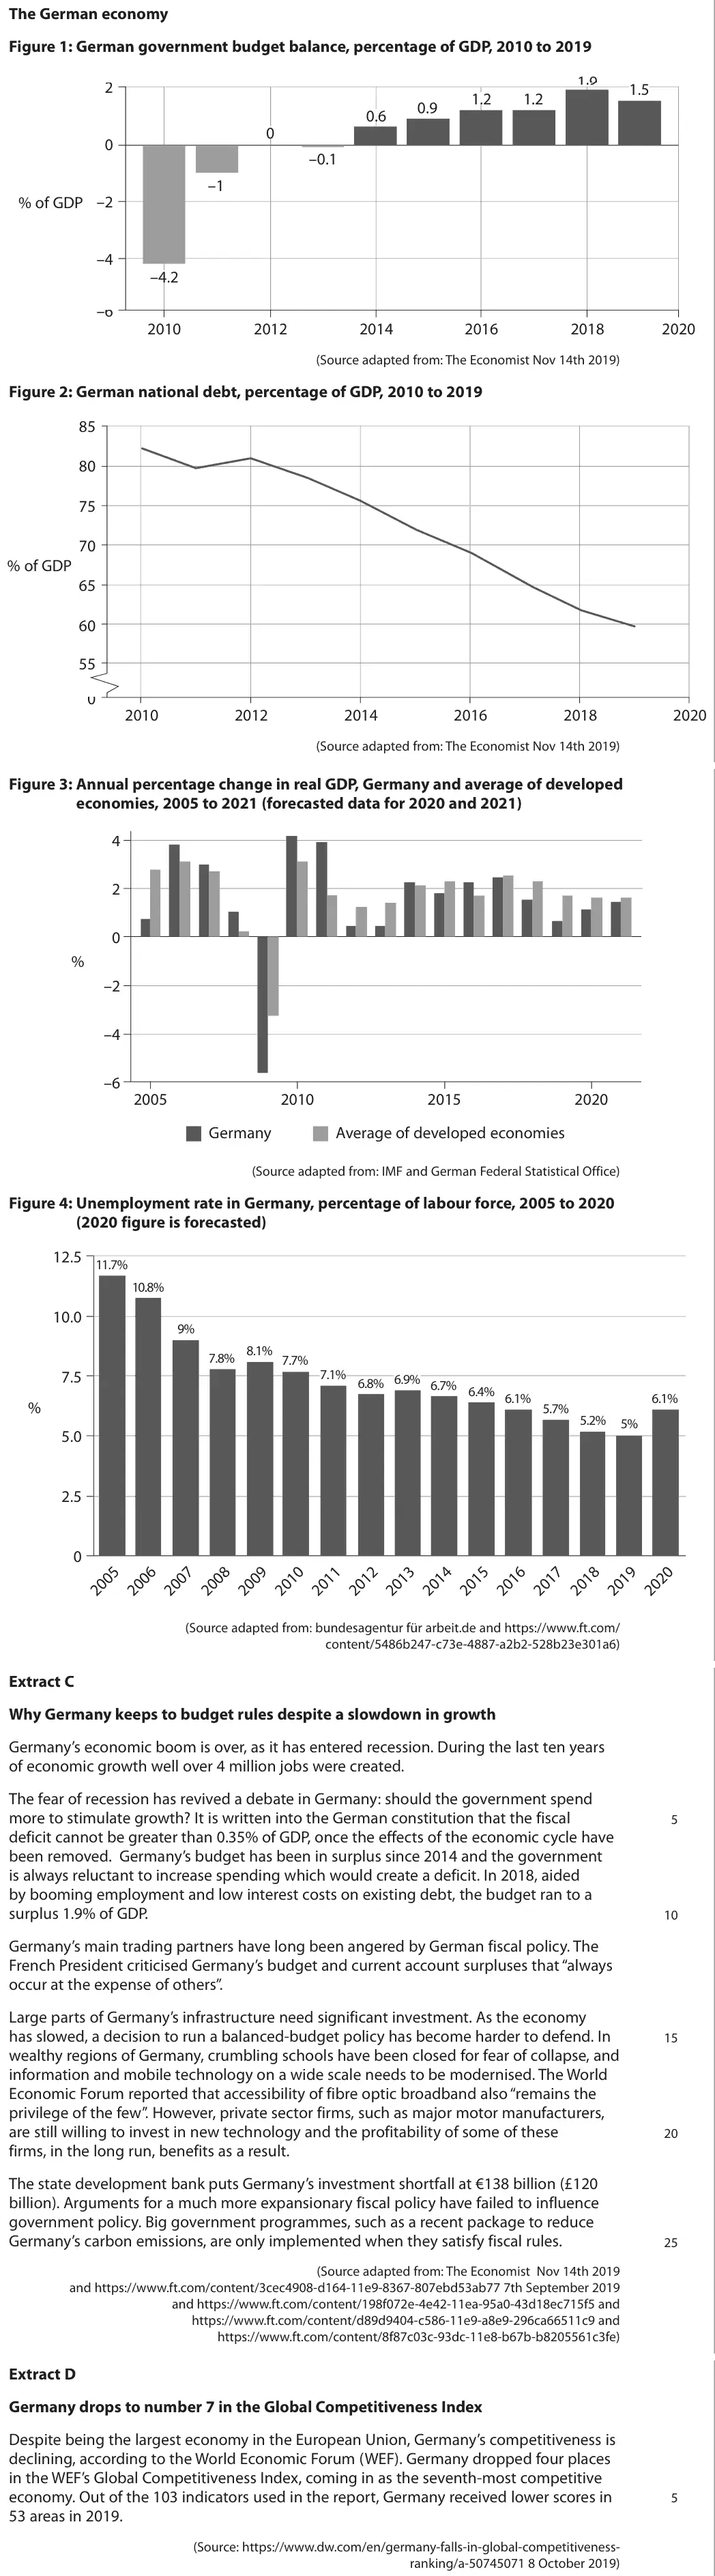
Data and extracts for question 2
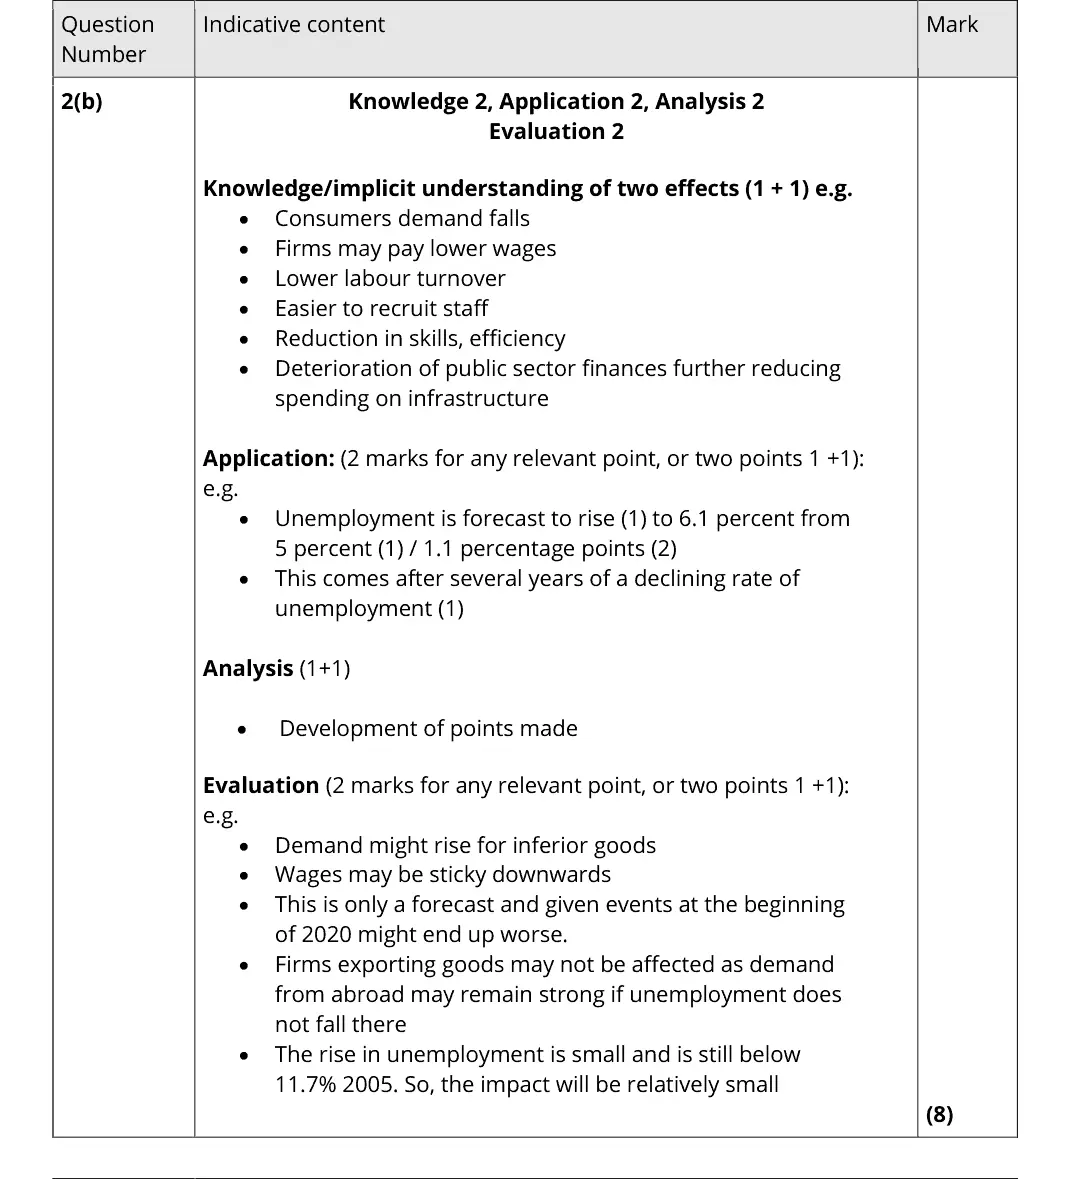
Mark scheme, including the levels grid and indicative content
Examiner's comment
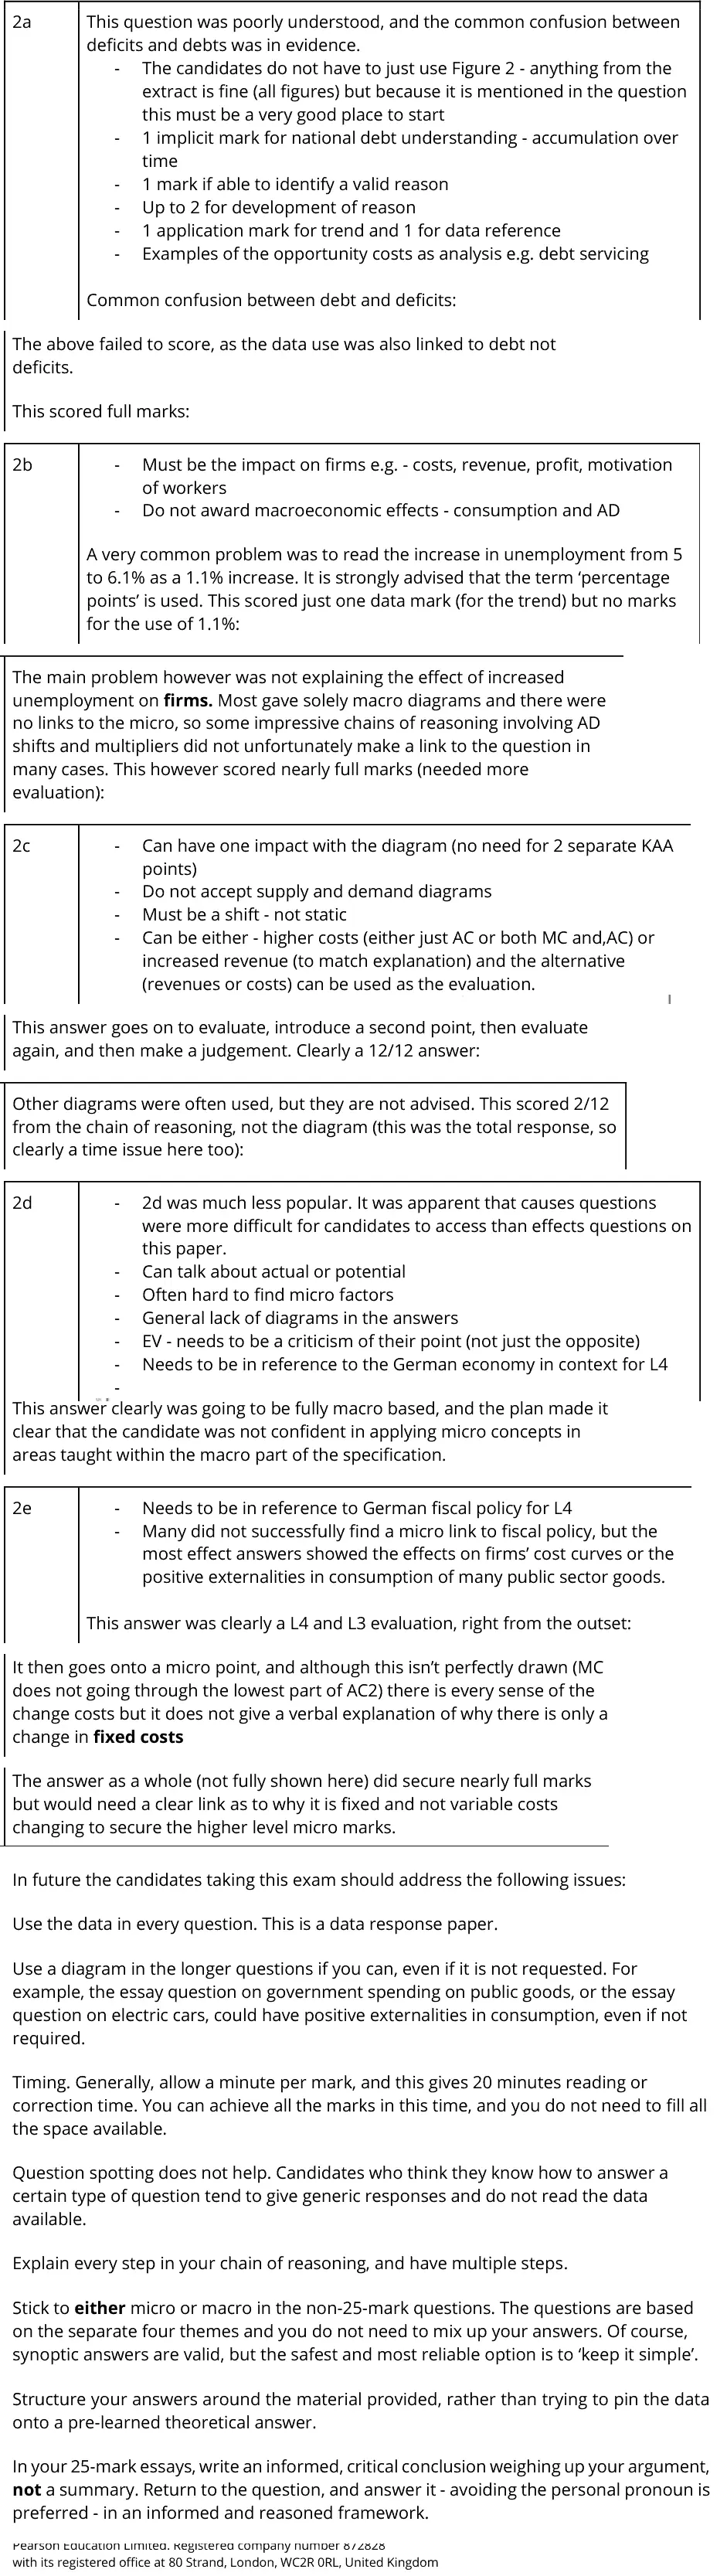
2a This question was poorly understood, and the common confusion between deficits and debts was in evidence. - The candidates do not have to just use Figure 2 - anything from the extract is fine (all figures) but because it is mentioned in the question this must be a very good place to start - 1 implicit mark for national debt understanding - accumulation over time - 1 mark if able to identify a valid reason - Up to 2 for development of reason - 1 application mark for trend and 1 for data reference - Examples of the opportunity costs as analysis e.g. debt servicing Common confusion between debt and deficits: The above failed to score, as the data use was also linked to debt not deficits. This scored full marks: 2b - Must be the impact on firms e.g. - costs, revenue, profit, motivation of workers - Do not award macroeconomic effects - consumption and AD A very common problem was to read the increase in unemployment from 5 to 6.1% as a 1.1% increase. It is strongly advised that the term ‘percentage points’ is used. This scored just one data mark (for the trend) but no marks for the use of 1.1%: The main problem however was not explaining the effect of increased unemployment on firms. Most gave solely macro diagrams and there were no links to the micro, so some impressive chains of reasoning involving AD shifts and multipliers did not unfortunately make a link to the question in many cases. This however scored nearly full marks (needed more evaluation): 2c - Can have one impact with the diagram (no need for 2 separate KAA points) - Do not accept supply and demand diagrams - Must be a shift - not static - Can be either - higher costs (either just AC or both MC and,AC) or increased revenue (to match explanation) and the alternative (revenues or costs) can be used as the evaluation. This answer goes on to evaluate, introduce a second point, then evaluate again, and then make a judgement. Clearly a 12/12 answer: Other diagrams were often used, but they are not advised. This scored 2/12 from the chain of reasoning, not the diagram (this was the total response, so clearly a time issue here too): 2d - 2d was much less popular. It was apparent that causes questions were more difficult for candidates to access than effects questions on this paper. - Can talk about actual or potential - Often hard to find micro factors - General lack of diagrams in the answers - EV - needs to be a criticism of their point (not just the opposite) - Needs to be in reference to the German economy in context for L4 - This answer clearly was going to be fully macro based, and the plan made it clear that the candidate was not confident in applying micro concepts in areas taught within the macro part of the specification. 2e - Needs to be in reference to German fiscal policy for L4 - Many did not successfully find a micro link to fiscal policy, but the most effect answers showed the effects on firms’ cost curves or the positive externalities in consumption of many public sector goods. This answer was clearly a L4 and L3 evaluation, right from the outset: It then goes onto a micro point, and although this isn’t perfectly drawn (MC does not going through the lowest part of AC2) there is every sense of the change costs but it does not give a verbal explanation of why there is only a change in fixed costs The answer as a whole (not fully shown here) did secure nearly full marks but would need a clear link as to why it is fixed and not variable costs changing to secure the higher level micro marks. In future the candidates taking this exam should address the following issues: Use the data in every question. This is a data response paper. Use a diagram in the longer questions if you can, even if it is not requested. For example, the essay question on government spending on public goods, or the essay question on electric cars, could have positive externalities in consumption, even if not required. Timing. Generally, allow a minute per mark, and this gives 20 minutes reading or correction time. You can achieve all the marks in this time, and you do not need to fill all the space available. Question spotting does not help. Candidates who think they know how to answer a certain type of question tend to give generic responses and do not read the data available. Explain every step in your chain of reasoning, and have multiple steps. Stick to either micro or macro in the non-25-mark questions. The questions are based on the separate four themes and you do not need to mix up your answers. Of course, synoptic answers are valid, but the safest and most reliable option is to ‘keep it simple’. Structure your answers around the material provided, rather than trying to pin the data onto a pre-learned theoretical answer. In your 25-mark essays, write an informed, critical conclusion weighing up your argument, not a summary. Return to the question, and answer it - avoiding the personal pronoun is preferred - in an informed and reasoned framework. with its registered office at 80 Strand, London, WC2R 0RL, United Kingdom
Notes from the mark scheme and report
5% to 6.1% is a 1.1 percentage point rise, not a 1.1% increase
effects on firms (lower demand, easier recruitment, lower wages), not macro AD and multiplier chains
evaluate: only a forecast, still below 11.7% in 2005
Quantitative skills: QS 10 (distinguish between changes in the level of a variable, and the rate of change); QS 2 (calculate, use and understand percentages, percentage changes and percentage point changes); QS 9 (interpret, apply and analyse information in written, graphical tabular and numerical forms)
October 2020 · Paper 2 · Q4(a)2 marksAO2=2Calculation
Data and extracts for question 4
Mark scheme
Notes from the mark scheme and report
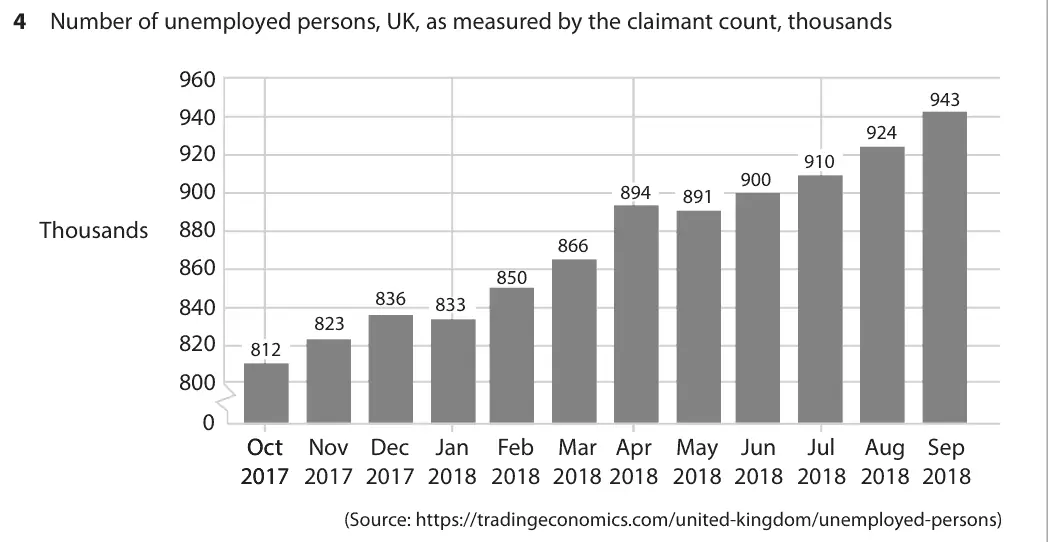
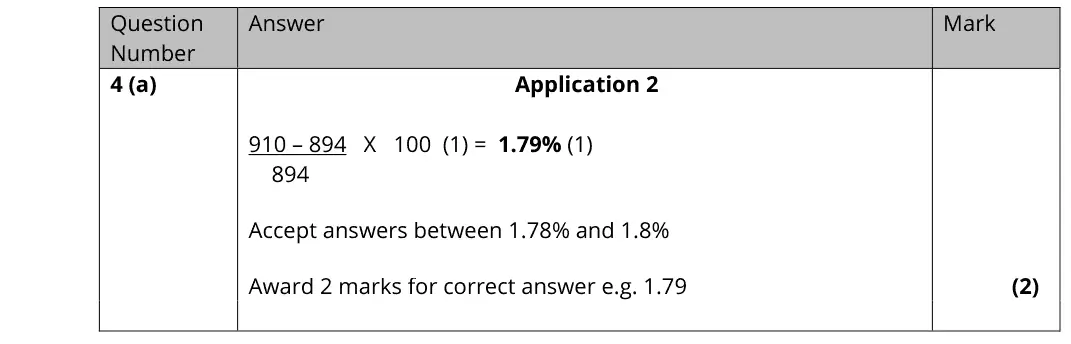
(910 - 894) / 894 x 100 = 1.79% (accept 1.78 to 1.8)
divide by the April figure
Quantitative skills: QS 2 (calculate, use and understand percentages, percentage changes and percentage point changes); QS 9 (interpret, apply and analyse information in written, graphical tabular and numerical forms)
October 2020 · Paper 2 · Q4(b)2 marksAO1=1, AO3=1Short answer
Data and extracts for question 4
Mark scheme
Notes from the mark scheme and report
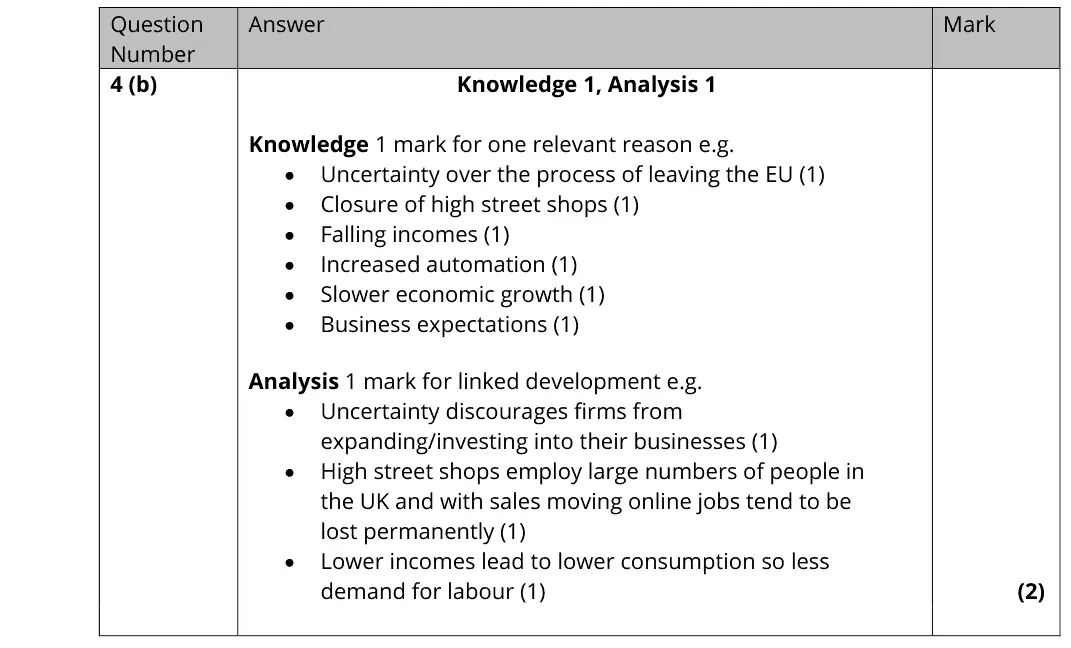
identify a reason (Brexit uncertainty, high street closures, automation, slower growth) then develop it (firms stop expanding, jobs lost as sales move online, lower consumption means less derived demand for labour)
October 2020 · Paper 2 · Q4(c)1 markMultiple choice
Data and extracts for question 4
Answer
D
Mark scheme
Notes from the mark scheme and report
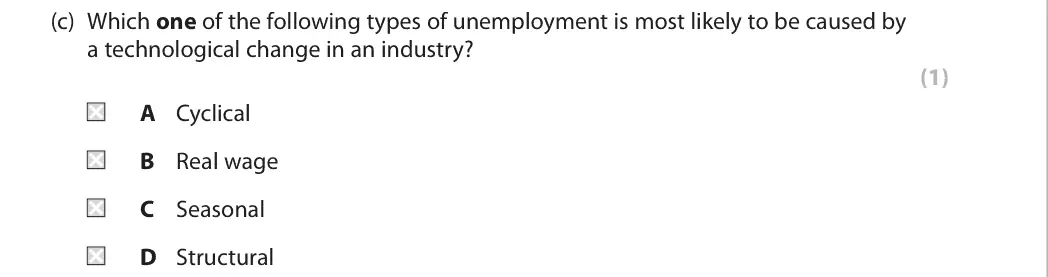
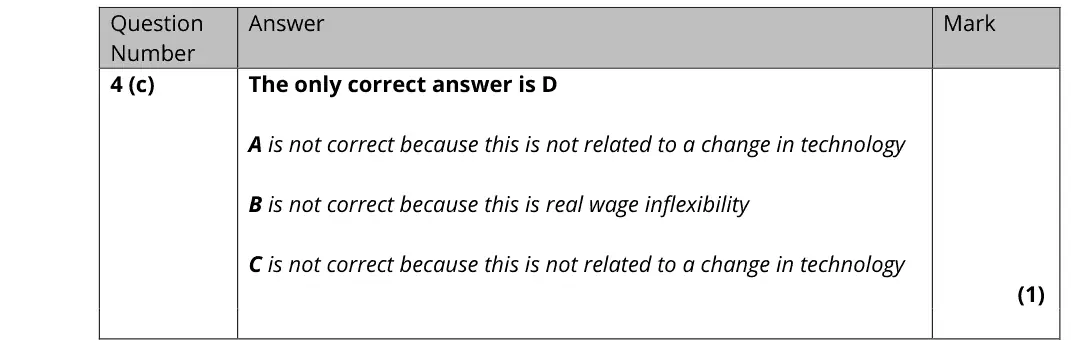
technological change makes skills obsolete in an industry, causing structural unemployment (D)
cyclical and seasonal unemployment are not caused by technology
real wage unemployment is from real wage inflexibility
June 2019 · AS Paper 2 · Q3(a)3 marksAO1=1, AO2=1, AO3=1Short answer
Data and extracts for question 3
Mark scheme
Examiner's comment
In this question the marks are split as 1 for knowledge, 1 for application, and 1 for analysis. The knowledge comes from identifying one effect, the application for explaining the data, and analysis for development building on the knowledge. Most candidates were able to access application marks.
Notes from the mark scheme and report
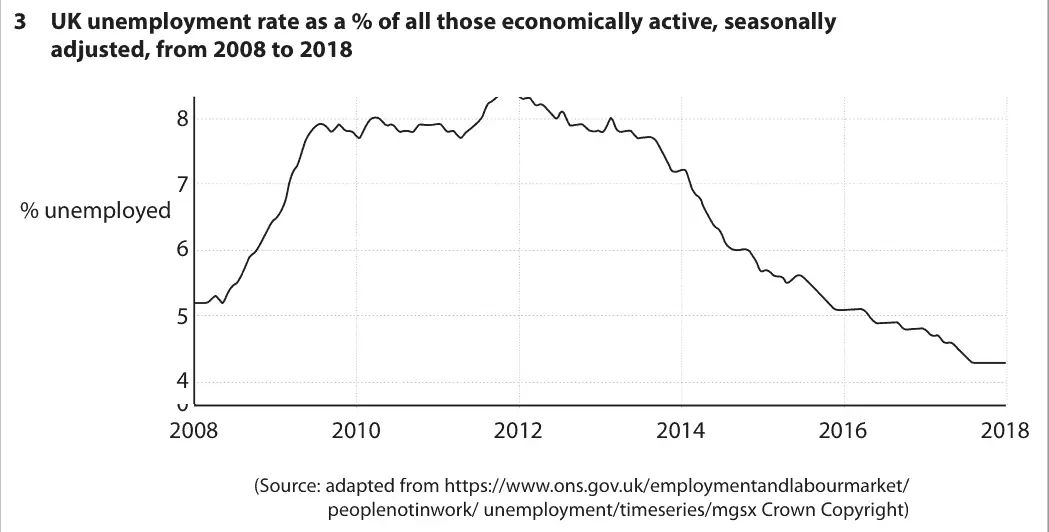
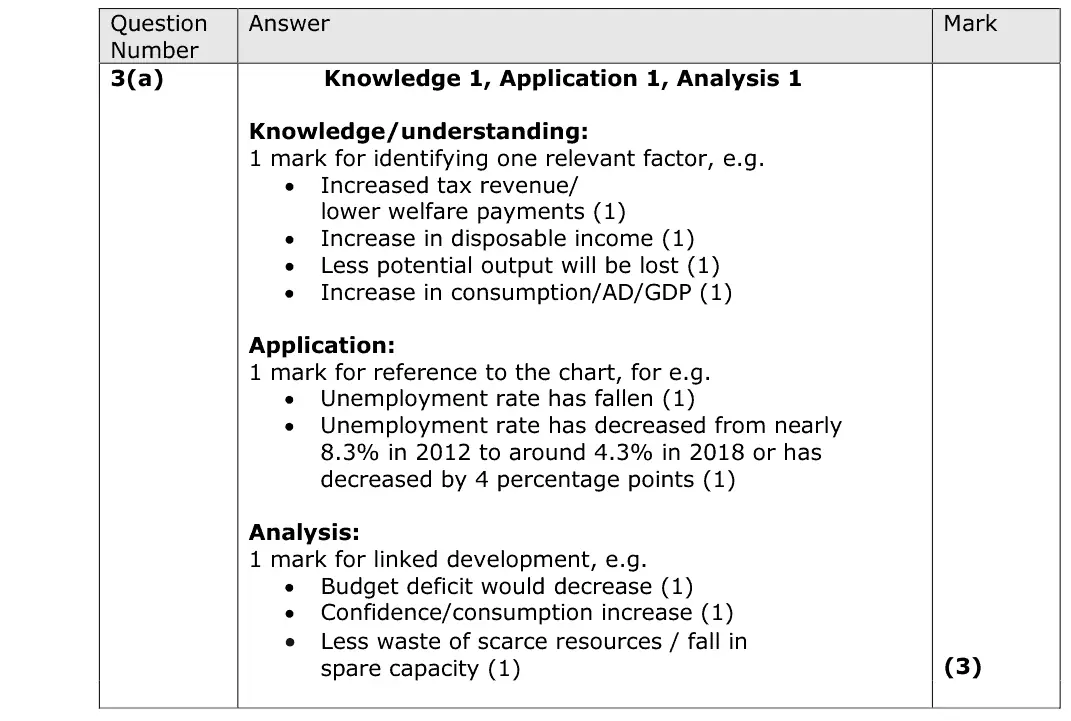
quote the fall from about 8.3% in 2012 to about 4.3% in 2018 (4 percentage points)
one effect (higher tax revenue, lower benefit spending, more income and consumption) with linked development
Quantitative skills: QS 10 (distinguish between changes in the level of a variable, and the rate of change); QS 12 (understand the meaning of seasonally adjusted figures); QS 9 (interpret, apply and analyse information in written, graphical tabular and numerical forms)
June 2018 · AS Paper 2 · Q6(a)4 marksAO1=2, AO2=2Short answer
Data and extracts for question 6
Mark scheme
Examiner's comment
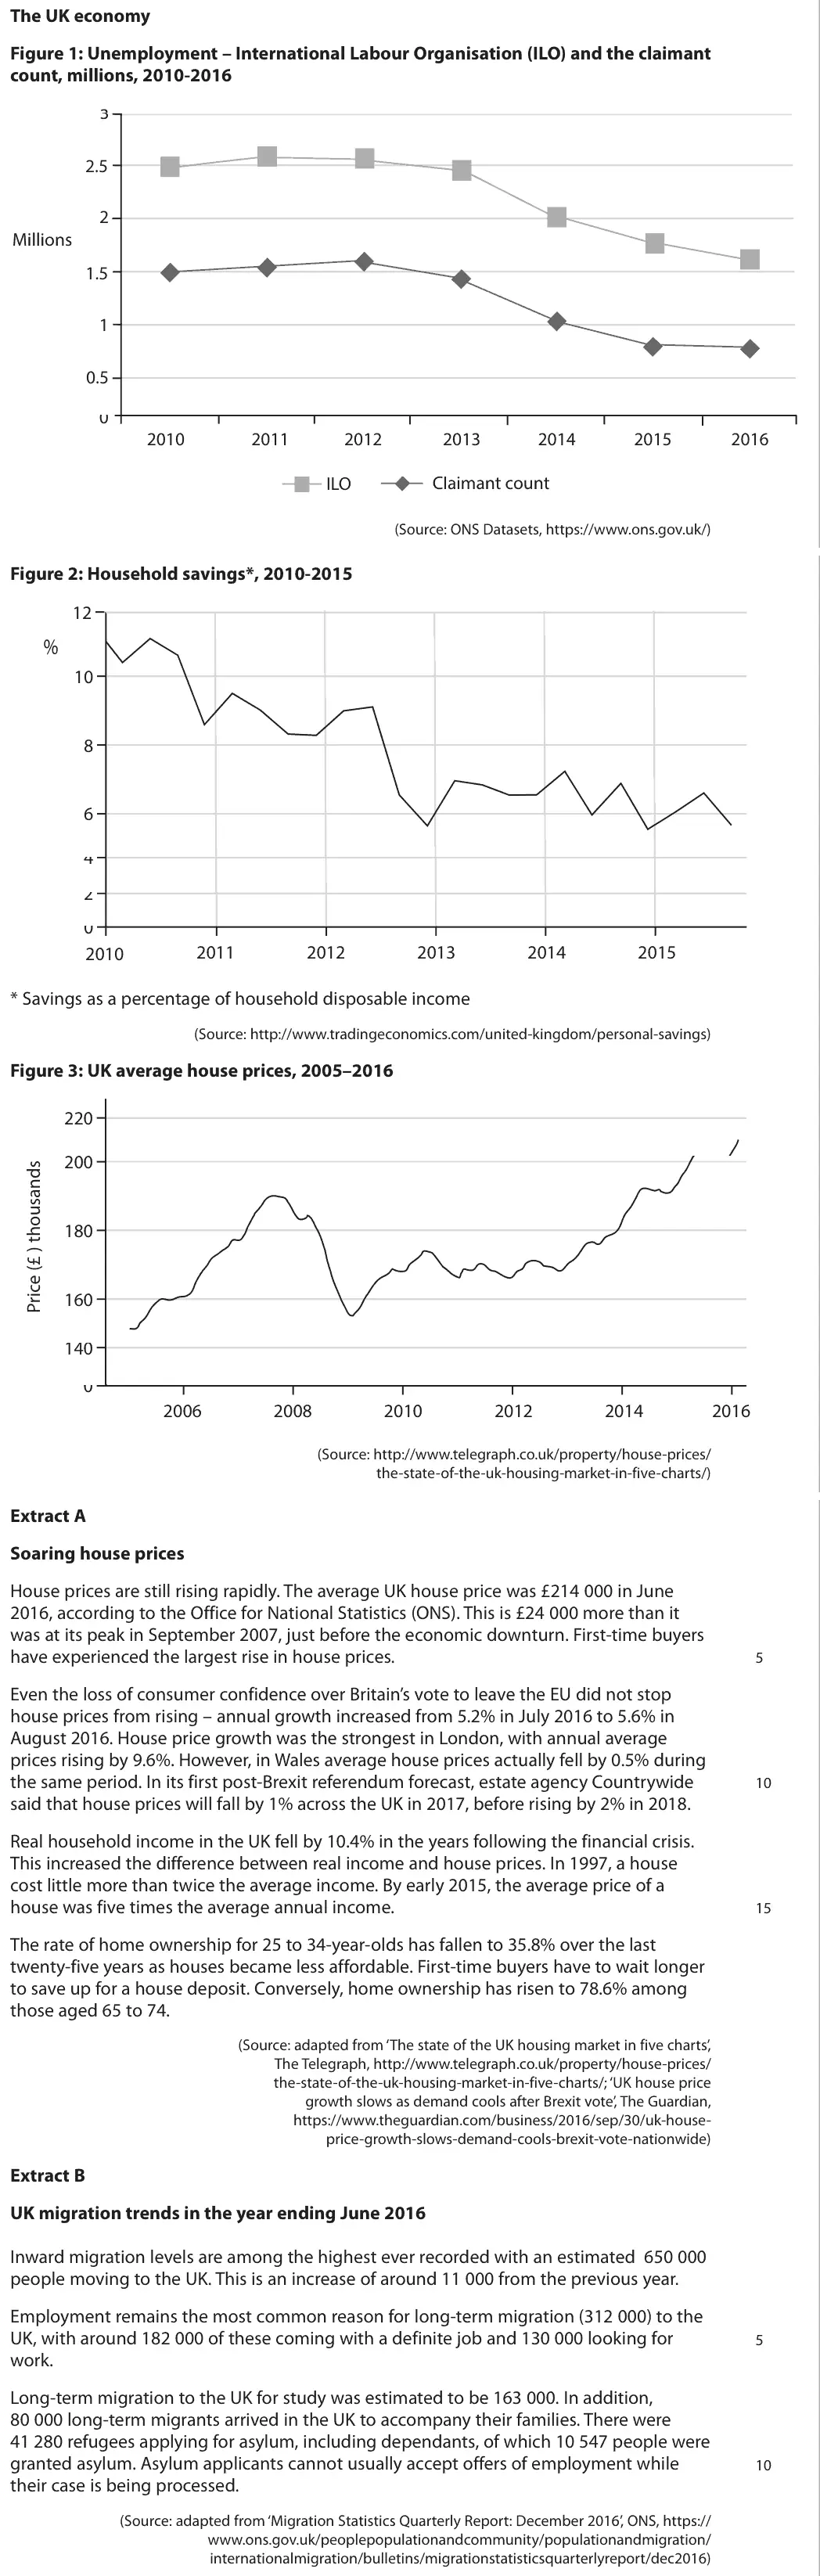
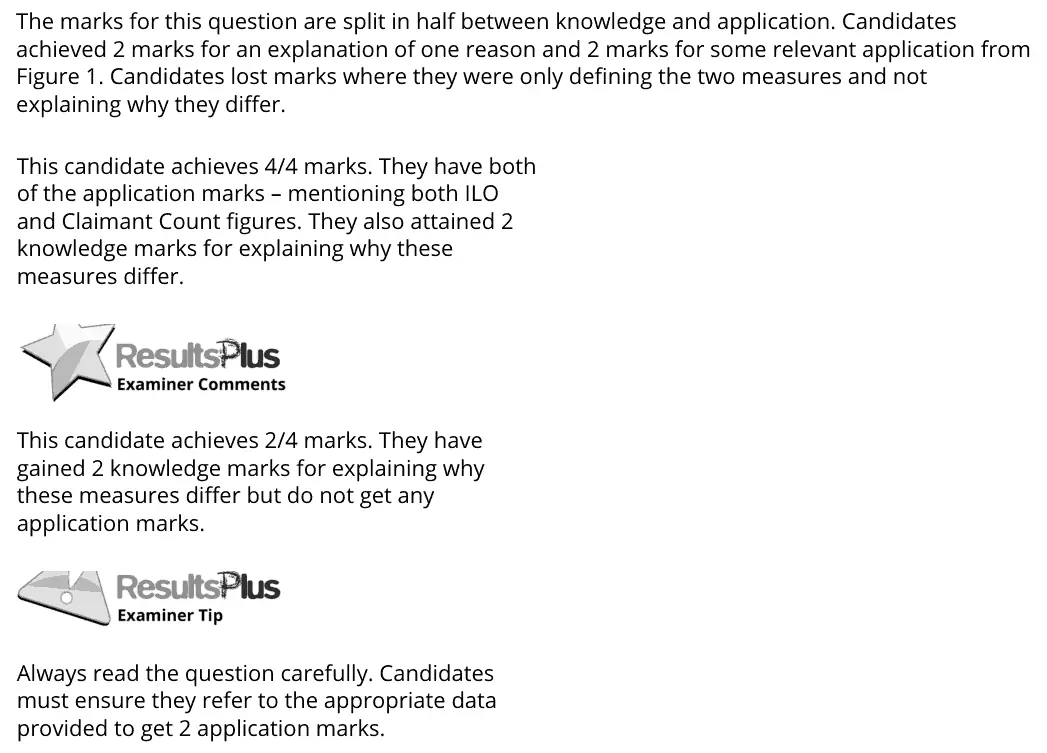
The marks for this question are split in half between knowledge and application. Candidates achieved 2 marks for an explanation of one reason and 2 marks for some relevant application from Figure 1. Candidates lost marks where they were only defining the two measures and not explaining why they differ. This candidate achieves 4/4 marks. They have both of the application marks – mentioning both ILO and Claimant Count figures. They also attained 2 knowledge marks for explaining why these measures differ. This candidate achieves 2/4 marks. They have gained 2 knowledge marks for explaining why these measures differ but do not get any application marks. Always read the question carefully. Candidates must ensure they refer to the appropriate data provided to get 2 application marks.
Notes from the mark scheme and report
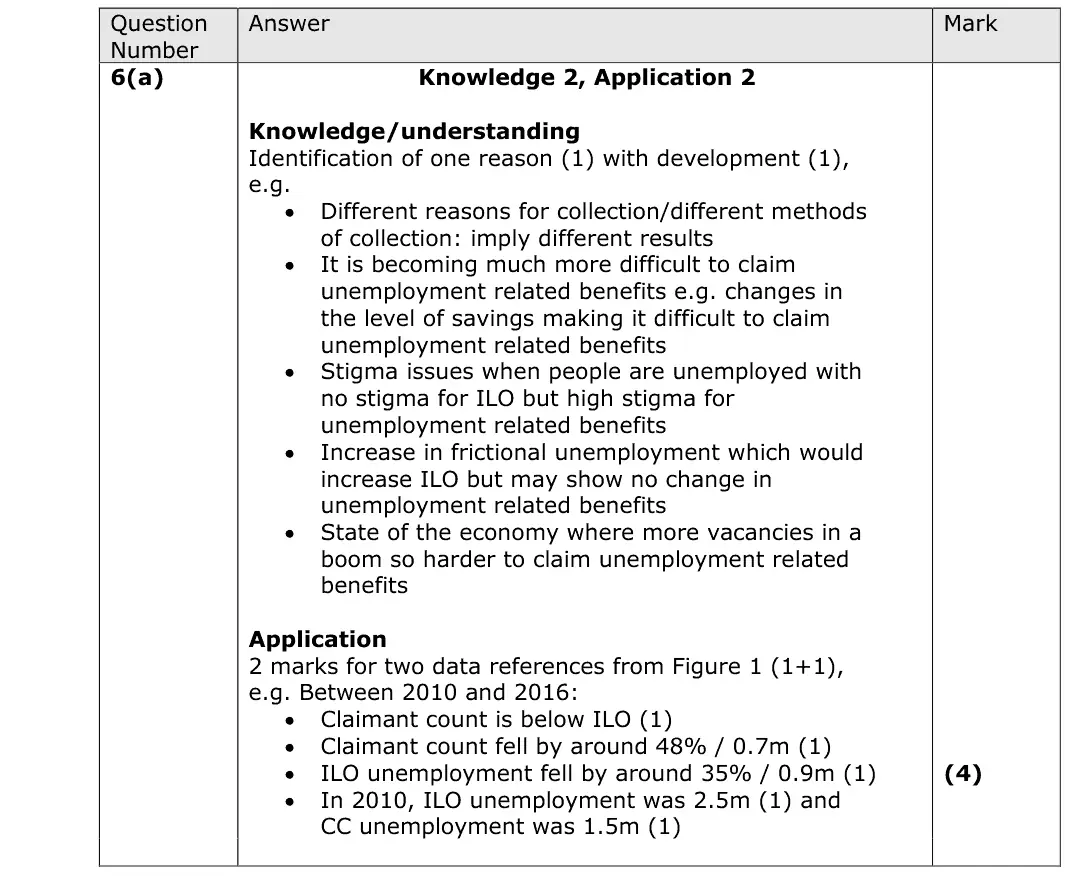
different methods: claimant count only counts those claiming benefits, ILO Labour Force Survey counts all seeking and available for work
quote both measures from Figure 1 (e.g. 2.5m ILO vs 1.5m claimant count in 2010)
defining the measures is not explaining why they differ
Quantitative skills: QS 9 (interpret, apply and analyse information in written, graphical tabular and numerical forms)
June 2018 · AS Paper 2 · Q6(e)15 marksAO1=3, AO2=3, AO3=3, AO4=615-mark response
Data and extracts for question 6
Mark scheme, including the levels grid and indicative content
Examiner's comment
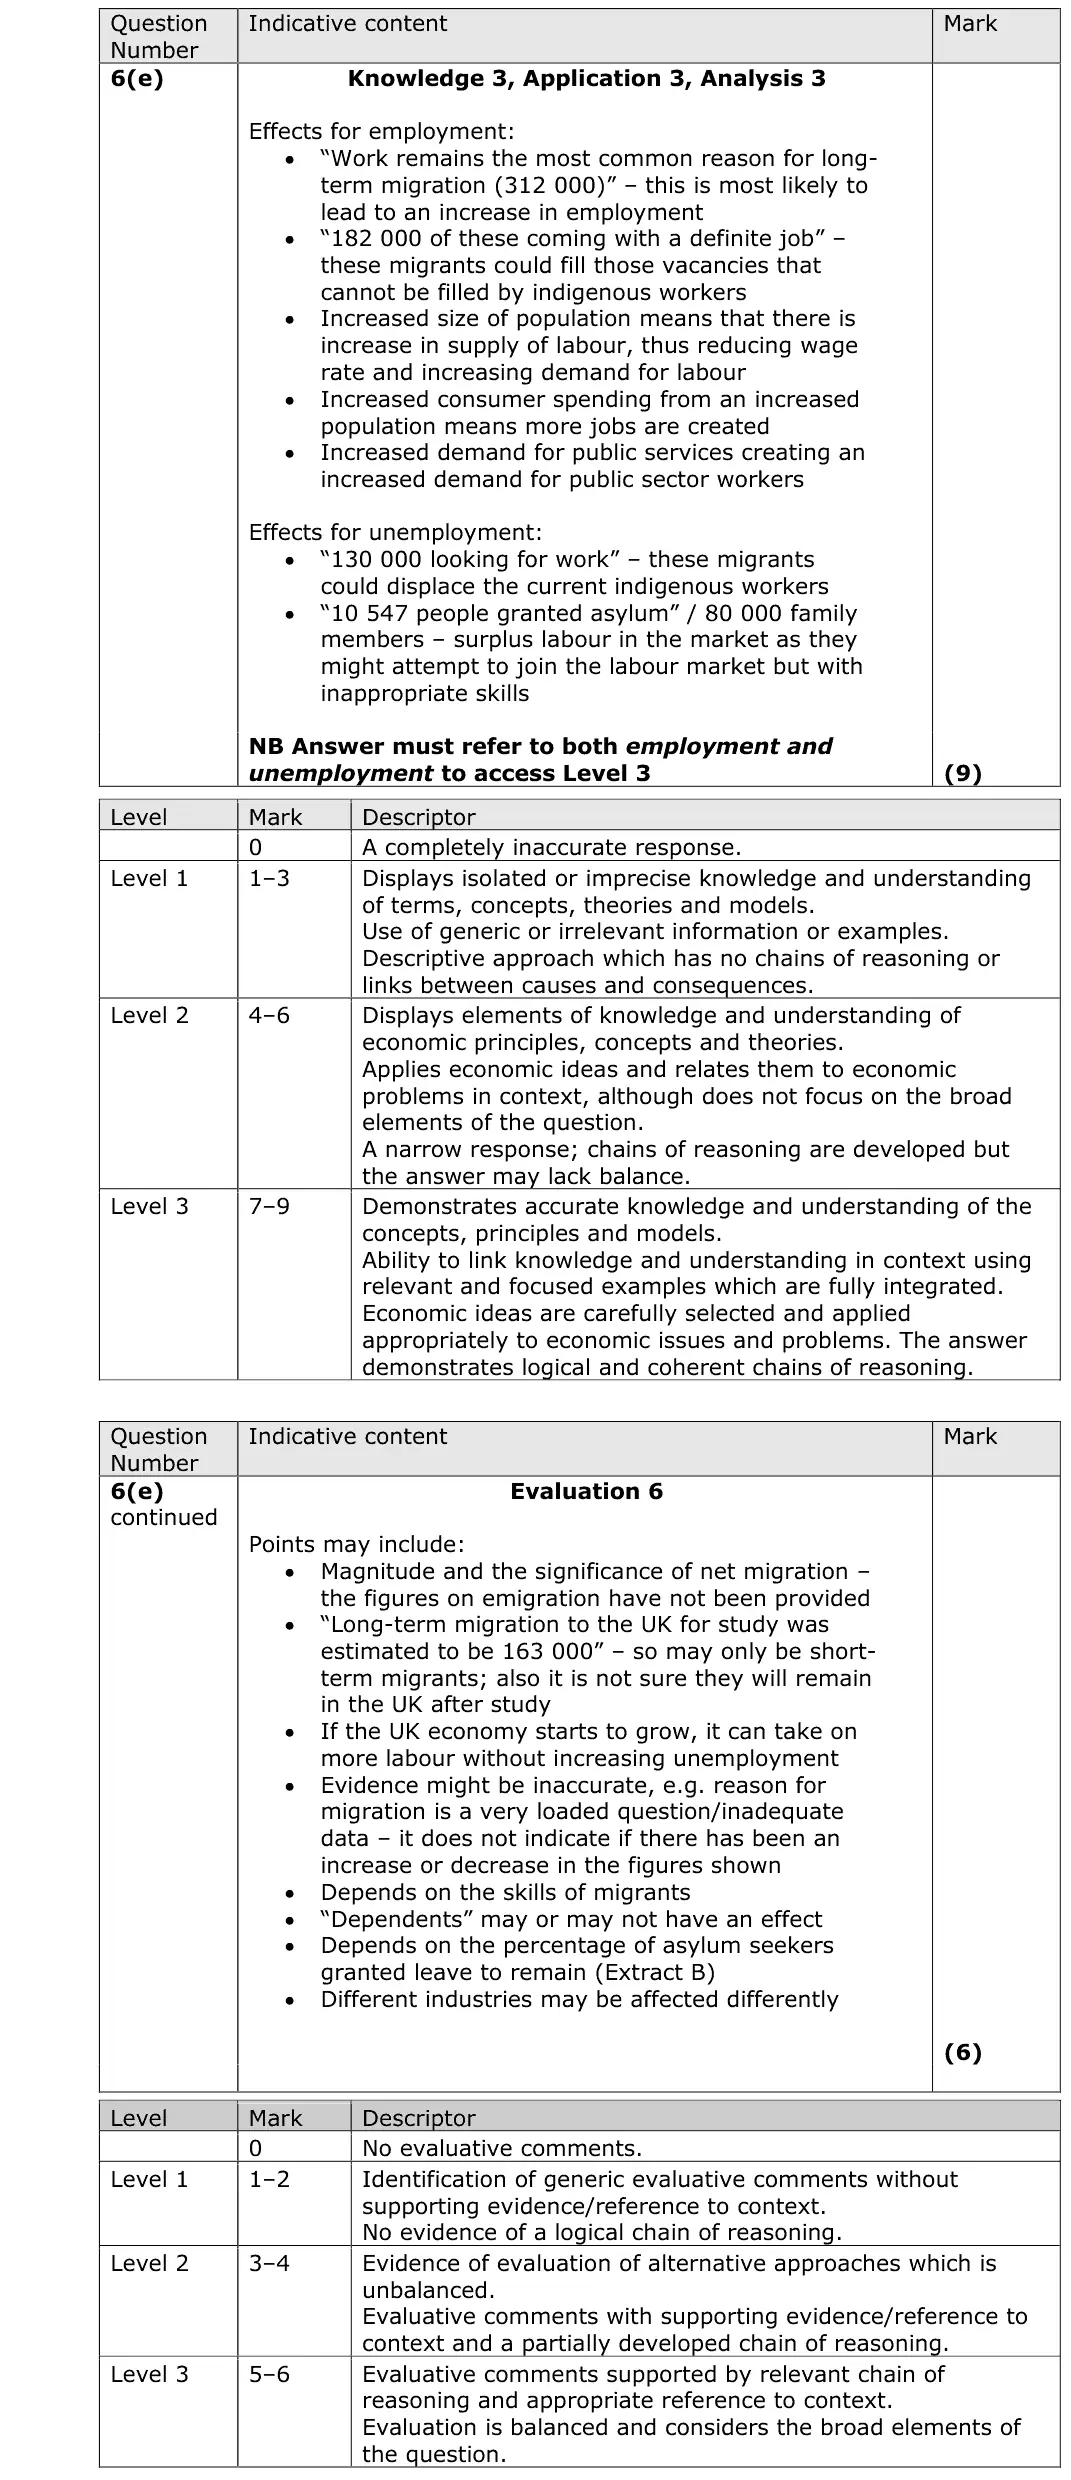
This question required the candidates to discuss the likely impact of migration on employment and unemployment in the UK. Candidates needed to ensure they answered the question being asked, as there were a few candidates who explained the impact on employment as analysis and the impact on unemployment as evaluation. This was credited as analysis and consequently, they were not able to receive any evaluation marks. There was good use of data in this question. This candidate gets 15/15 marks and is a high quality answer. With highly developed points that are clearly focused on employment and unemployment, as well as evaluation that clearly critiques these analysis points this answer is worthy of the top Level 3 for both KAA and Evaluation. They also use relevant data from the extract to extend their arguments. The analysis is not as well developed as the previous answer, and in parts, lacks fully coherent chains of reasoning. The point on employment on the first page is not as detailed as the point on unemployment on the second page. There is no evaluation. Overall this is a low Level 3 for KAA. There is no need for a conclusion in this question, remember to focus your time only on what is going to get you marks.
Notes from the mark scheme and report
discuss both employment and unemployment with Extract B data (312 000 for work, 182 000 with a definite job, 130 000 looking)
employment as KAA and unemployment as 'evaluation' counts only as KAA
evaluate with skills, vacancies and wages
Quantitative skills: QS 9 (interpret, apply and analyse information in written, graphical tabular and numerical forms)
June 2017 · Paper 2 · Q1(a)1 markMultiple choice
Data and extracts for question 1
Answer
A
Mark scheme
Notes from the mark scheme and report
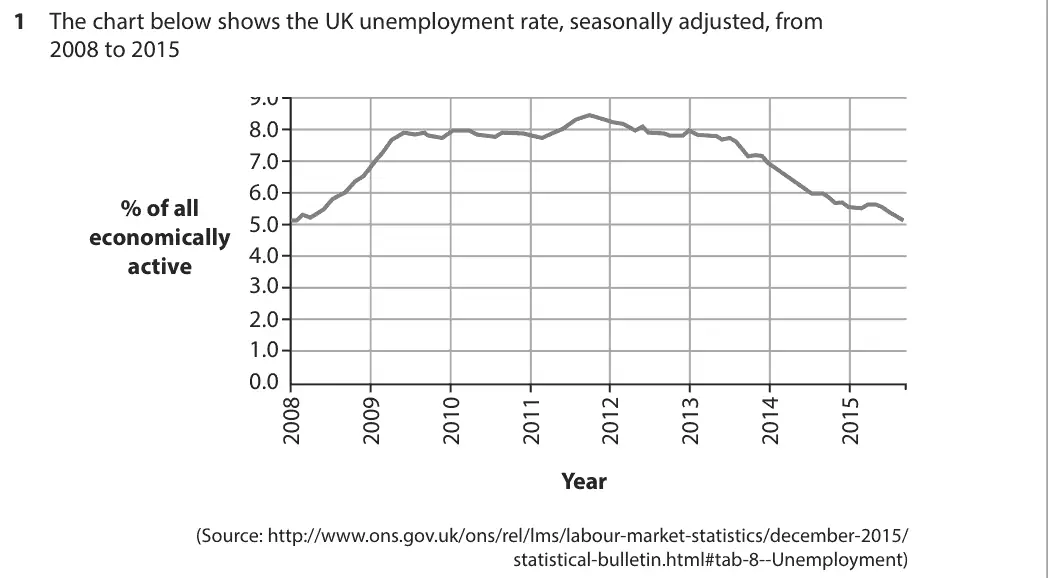
unemployment rose sharply from about 5% to 8% during the 2008-09 recession = cyclical (A)
frictional and voluntary do not explain a sharp rise
seasonal is ruled out as the data are seasonally adjusted
Quantitative skills: QS 9 (interpret, apply and analyse information in written, graphical tabular and numerical forms)
June 2017 · AS Paper 2 · Q2(a)3 marksAO1=1, AO2=1, AO3=1Short answer
Data and extracts for question 2
Mark scheme
Examiner's comment
In this question the marks are split as 1 for knowledge, 1 for application, and 1 for analysis. The knowledge comes from explaining what under-employment is, the application for discussing the numbers, and analysis for some development building on the knowledge. This answer scores 2/3 marks. There is a correct definition of under-employment and also application that it has increased by 86.7%. There is no analysis of their answer. This candidate scores full marks. They have explained what under-employment is, applied it to the information provided, and also analysed this in terms of falling unemployment and zero hours contracts.
Notes from the mark scheme and report
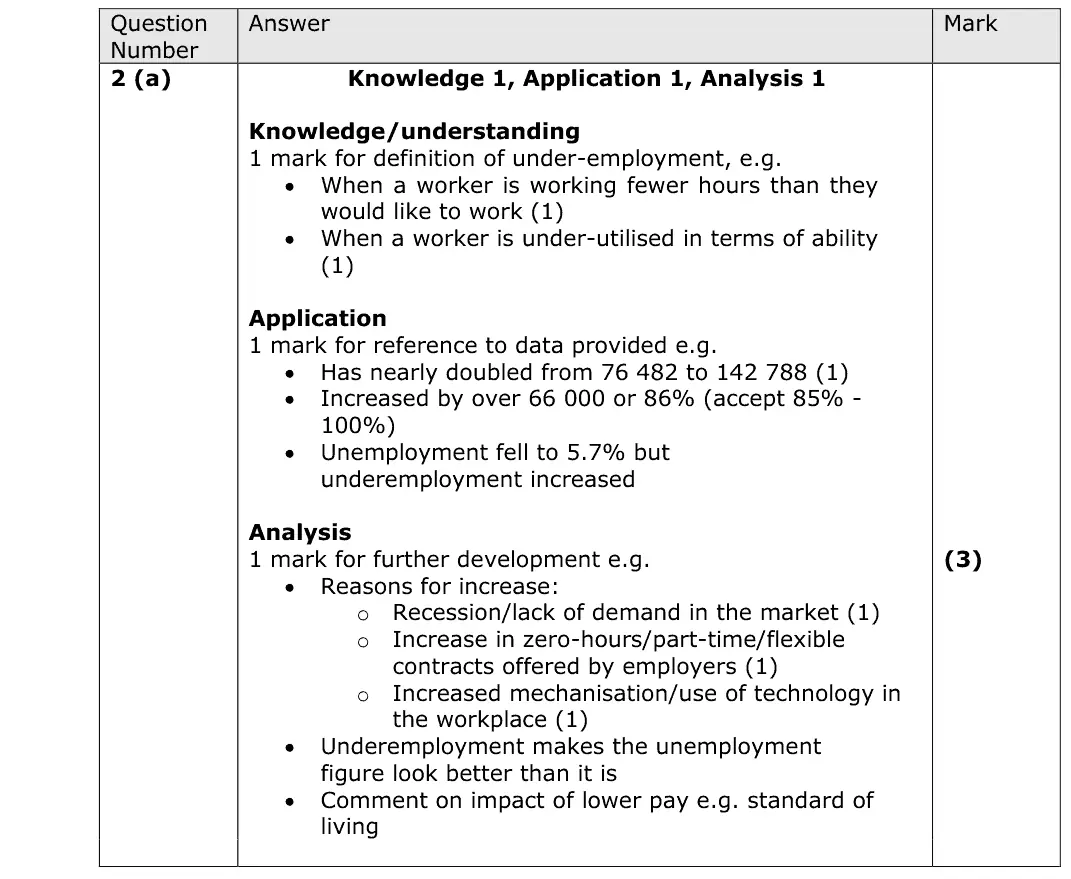
working fewer hours than wanted (or below one's skills)
data: rose from 76 482 to 142 788 (about 87%) while unemployment fell to 5.7%
analysis e.g. zero-hours and part-time contracts, flatters the unemployment figure
Quantitative skills: QS 2 (calculate, use and understand percentages, percentage changes and percentage point changes); QS 9 (interpret, apply and analyse information in written, graphical tabular and numerical forms)
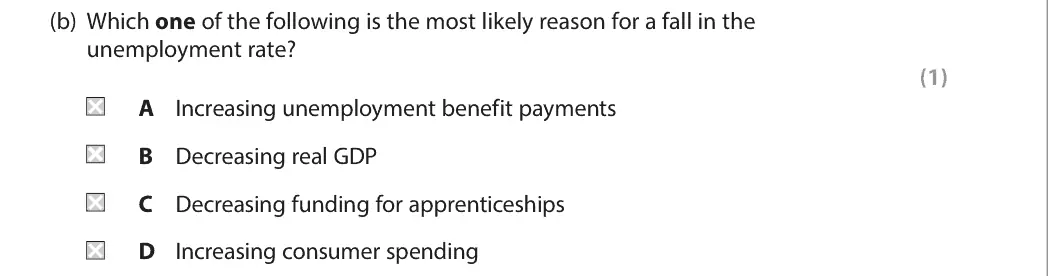
June 2017 · AS Paper 2 · Q2(b)1 markMultiple choice
Data and extracts for question 2
Answer
D
Mark scheme
Notes from the mark scheme and report
higher consumer spending raises AD and the derived demand for labour (D)
higher benefits, falling real GDP and less apprenticeship funding would raise unemployment
June 2016 · AS Paper 2 · Q3(a)1 markAO1=1Definition
Data and extracts for question 3
Mark scheme
Examiner's comment
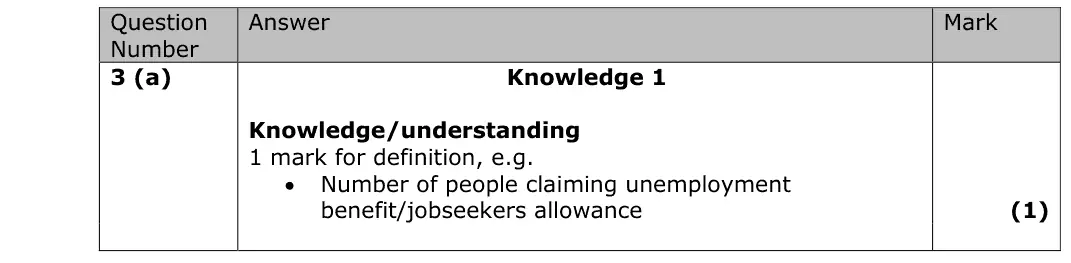
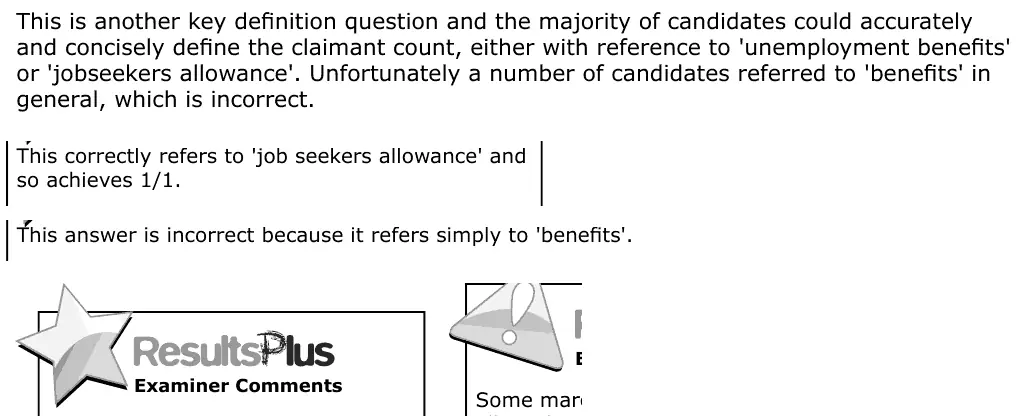
This is another key definition question and the majority of candidates could accurately and concisely define the claimant count, either with reference to 'unemployment benefits' or 'jobseekers allowance'. Unfortunately a number of candidates referred to 'benefits' in general, which is incorrect. This correctly refers to 'job seekers allowance' and so achieves 1/1. This answer is incorrect because it refers simply to 'benefits'.
Notes from the mark scheme and report
number of people claiming unemployment-related benefit (Jobseeker's Allowance)
just "benefits" is wrong
June 2016 · AS Paper 2 · Q3(b)2 marksAO2=2Calculation
Data and extracts for question 3
Mark scheme
Examiner's comment
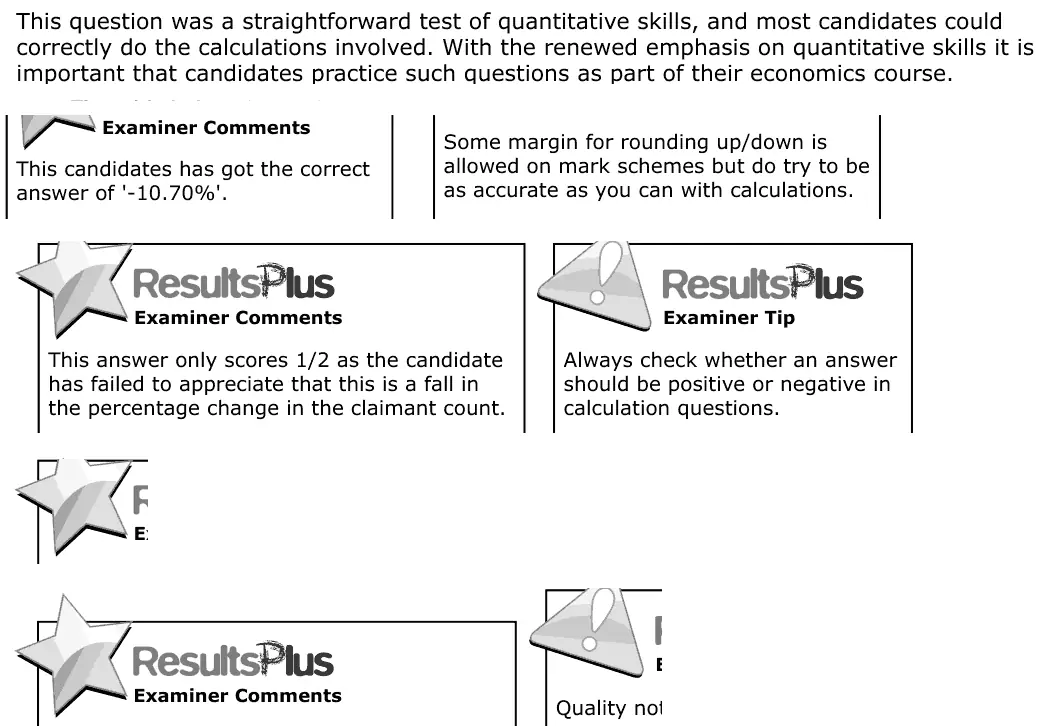
This question was a straightforward test of quantitative skills, and most candidates could correctly do the calculations involved. With the renewed emphasis on quantitative skills it is important that candidates practice such questions as part of their economics course. This candidates has got the correct answer of '-10.70%'. Some margin for rounding up/down is allowed on mark schemes but do try to be as accurate as you can with calculations. This answer only scores 1/2 as the candidate has failed to appreciate that this is a fall in the percentage change in the claimant count. Always check whether an answer should be positive or negative in calculation questions.
Notes from the mark scheme and report
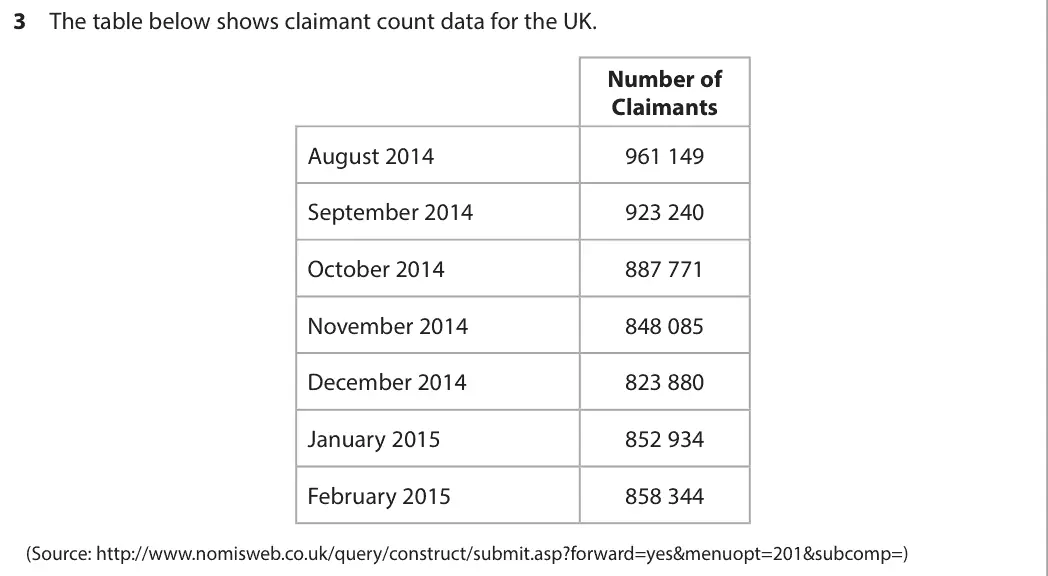
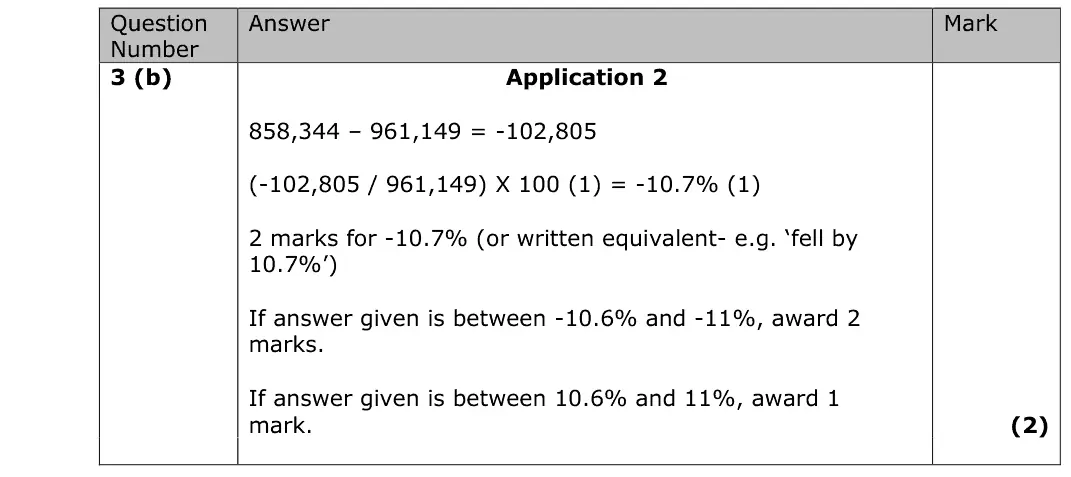
(858 344 - 961 149) / 961 149 x 100 = -10.7%
giving +10.7% scores 1
check the sign of the answer
Quantitative skills: QS 2 (calculate, use and understand percentages, percentage changes and percentage point changes); QS 9 (interpret, apply and analyse information in written, graphical tabular and numerical forms)
June 2016 · AS Paper 2 · Q3(c)1 markMultiple choice
Data and extracts for question 3
Answer
B
Mark scheme
Notes from the mark scheme and report
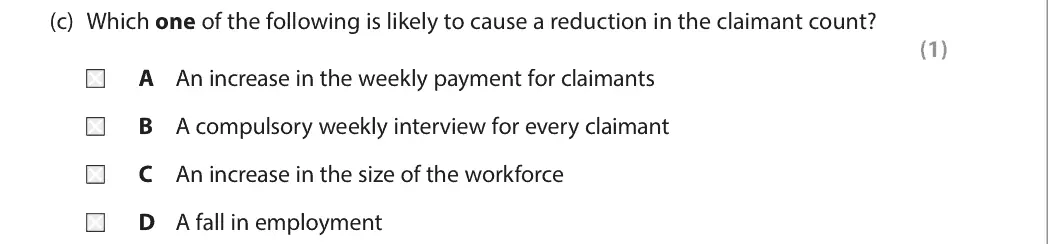
a compulsory weekly interview raises the cost of claiming and pushes claimants into work or off benefit (B)
A raises the incentive to claim
C and D are likely to raise the count
Work with an Edexcel economics tutor
Essays stuck in Level 2, or losing the easy marks in Section A? Book a trial session with Lianne, a former Edexcel examiner.