Notes and key-term cards for this topic are being written by our tutors. The past-paper questions below are ready now.
Specification statements
2.1.4Balance of payments: a) Components of the balance of payments, with particular reference to the current account, and the balance of trade in goods and services b) Current account deficits and surpluses c) The relationship between current account imbalances and other macroeconomic objectives d) The interconnectedness of economies through international tradeAS
4.1.7Balance of payments: a) Components of the balance of payments: • the current account • the capital and financial accounts b) Causes of deficits and surpluses on the current account c) Measures to reduce a country's imbalance on the current account d) Significance of global trade imbalances
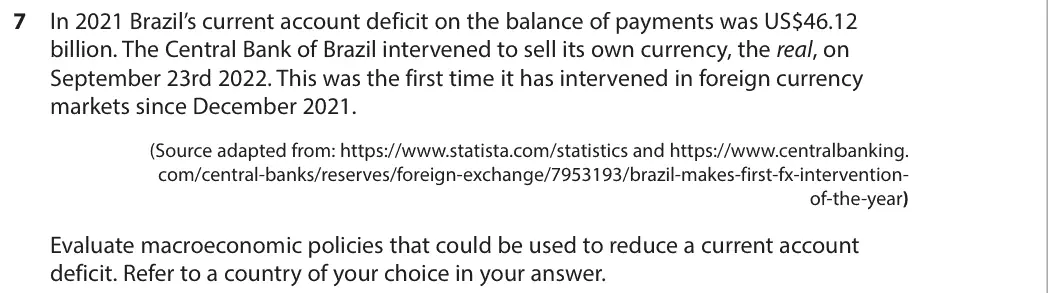
In 2021 Brazil’s current account deficit on the balance of payments was US$46.12 billion. The Central Bank of Brazil intervened to sell its own currency, the real, on September 23rd 2022. This was the first time it has intervened in foreign currency markets since December 2021. (Source adapted from: https://www.statista.com/statistics and https://www.centralbanking. com/central-banks/reserves/foreign-exchange/7953193/brazil-makes-first-fx-intervention- of-the-year) Evaluate macroeconomic policies that could be used to reduce a current account deficit. Refer to a country of your choice in your answer.
Tap a question to zoom it. The data and extracts fold out above each question; the mark scheme and examiner's comment open underneath.
June 2025 · Paper 2 · Q2(a)1 markMultiple choice
Data and extracts for question 2
Answer
B
Mark scheme
Notes from the mark scheme and report
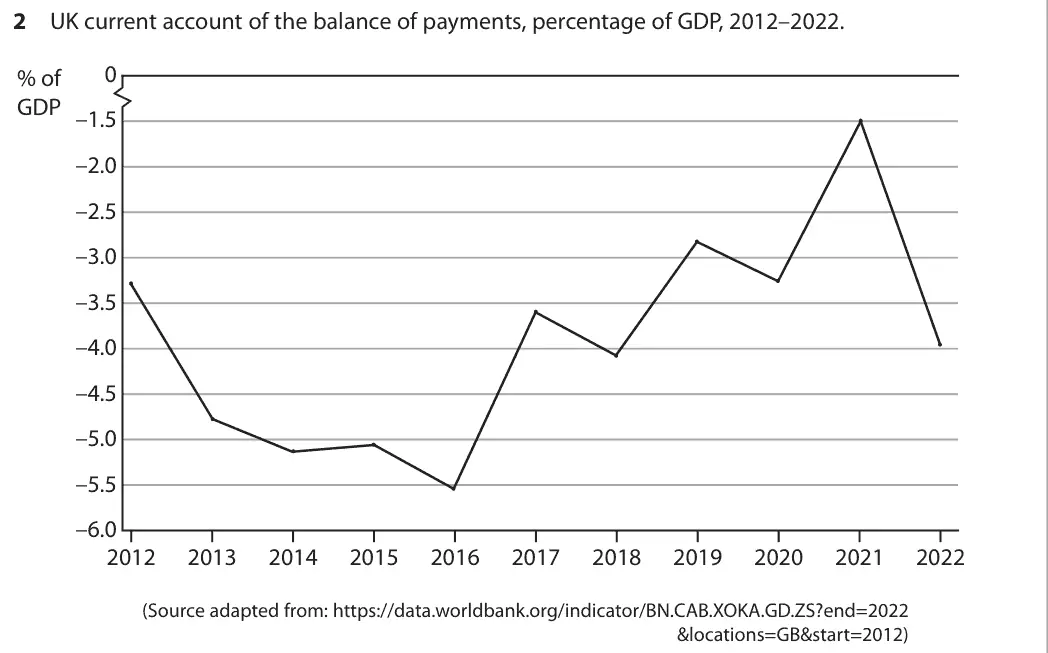
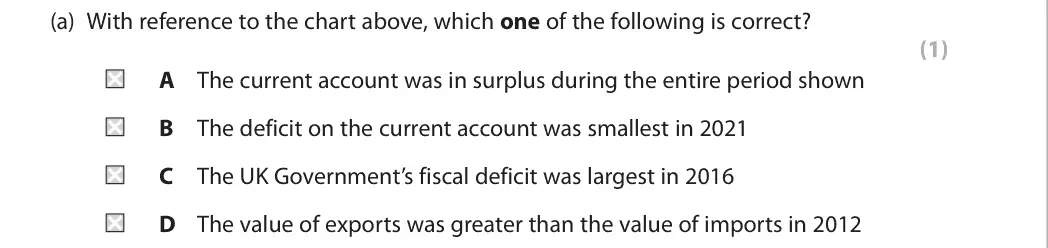
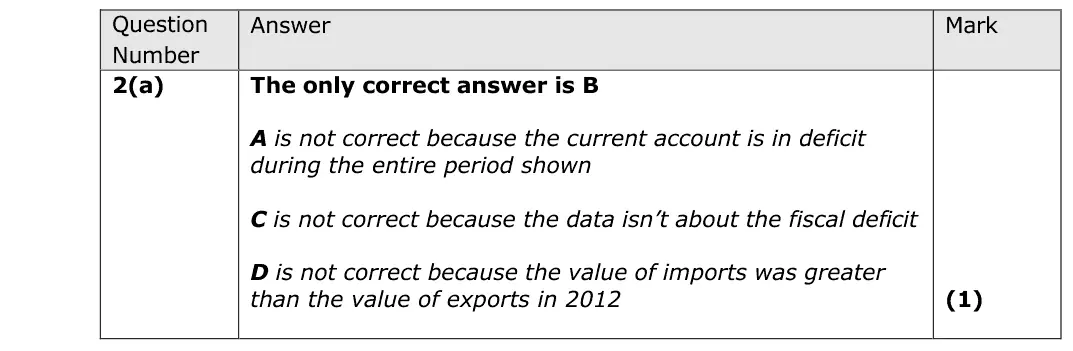
the deficit was smallest (-1.5% of GDP) in 2021 (B)
the current account was in deficit throughout, so A and D are wrong
C confuses the current account with the fiscal deficit
Quantitative skills: QS 9 (interpret, apply and analyse information in written, graphical tabular and numerical forms)
June 2025 · Paper 2 · Q2(b)4 marksAO1=2, AO2=1, AO3=1Short answer
Data and extracts for question 2
Mark scheme
Examiner's comment
This question is marked in a similar way to the previous one, Question 1(b). Candidates should remember that in 4-mark questions such as this that they needed to offer a mixture of knowledge, application, and analysis. Again, there needed to be reference to the chart provided in the exam paper and candidates were asked for just ONE reason. The majority of answers explained how a depreciation in the pound would lead to an improvement in the UK’s current account, but there were some answers that explained other possible answers. The UK’s departure from the EU was used in several answers as well, sometimes to better effect than others. This answer scored 3/4. There is a mark for saying that marginal propensity to import fell and that the UK therefore exported more in comparison to imports. There is also an application mark for saying that the current account had improved. However, there isn’t any explanation of how/why marginal propensity to import has fallen. In a question like this, make sure you give a clear reason as to how/why there has been a change in consumer/business behaviour. This candidate achieves the full 4 marks. They state a reason being a depreciation of the pound. They explain the impact on imports and exports. They also say that there has been a reduction in the current account deficit. Look at how concise this answer to the question is, yet it achieves full marks. You do not need to write lots on questions such as this; you just need to accurately answer the question.
Notes from the mark scheme and report
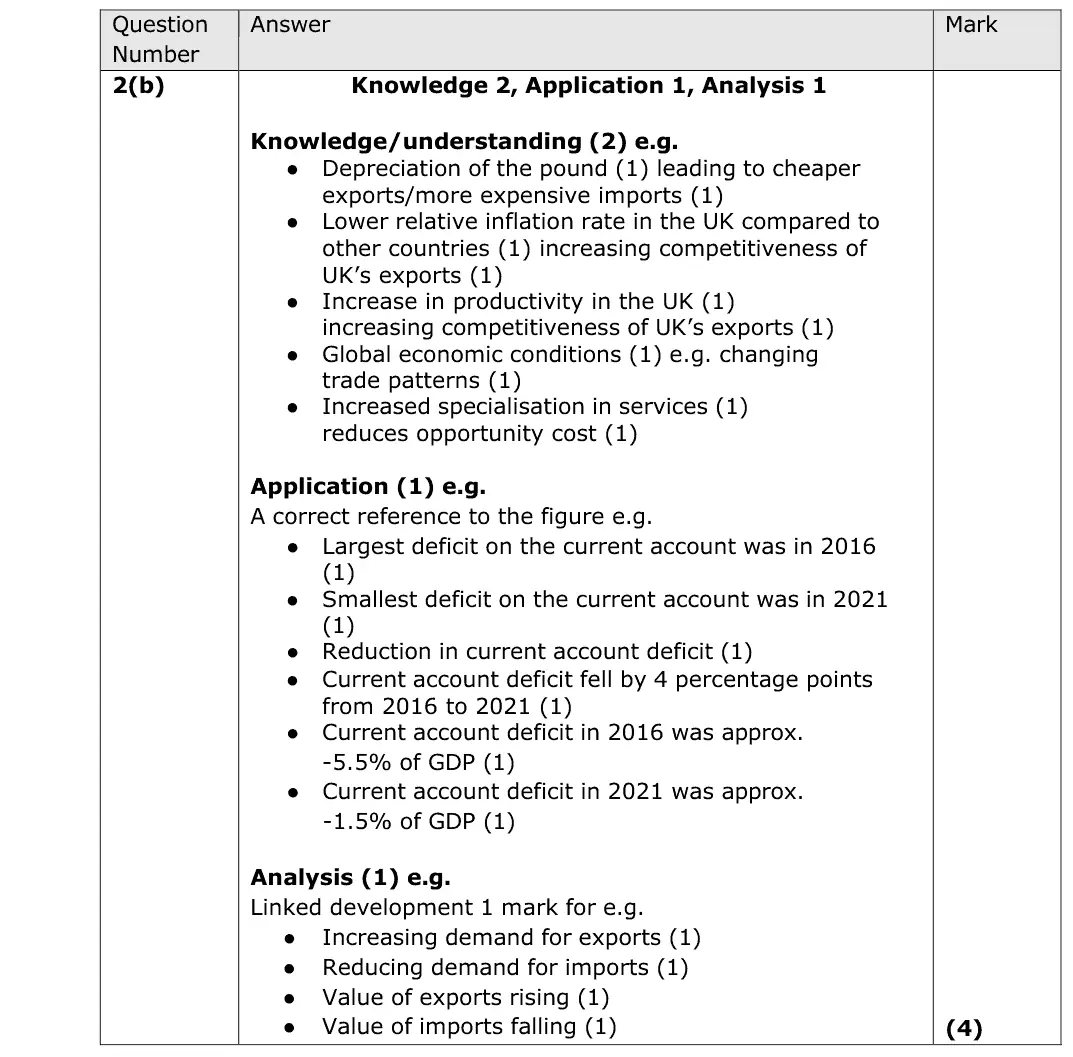
one reason the deficit narrowed from about -5.5% to -1.5%: depreciation of the pound after 2016 (cheaper exports, dearer imports), lower relative inflation, falling demand for imports
report: most used depreciation
explain how or why behaviour changes
Quantitative skills: QS 9 (interpret, apply and analyse information in written, graphical tabular and numerical forms)
June 2025 · Paper 2 · Q4(c)2 marksAO1=1, AO3=1Short answerHard
Data and extracts for question 4
Mark scheme
Examiner's comment
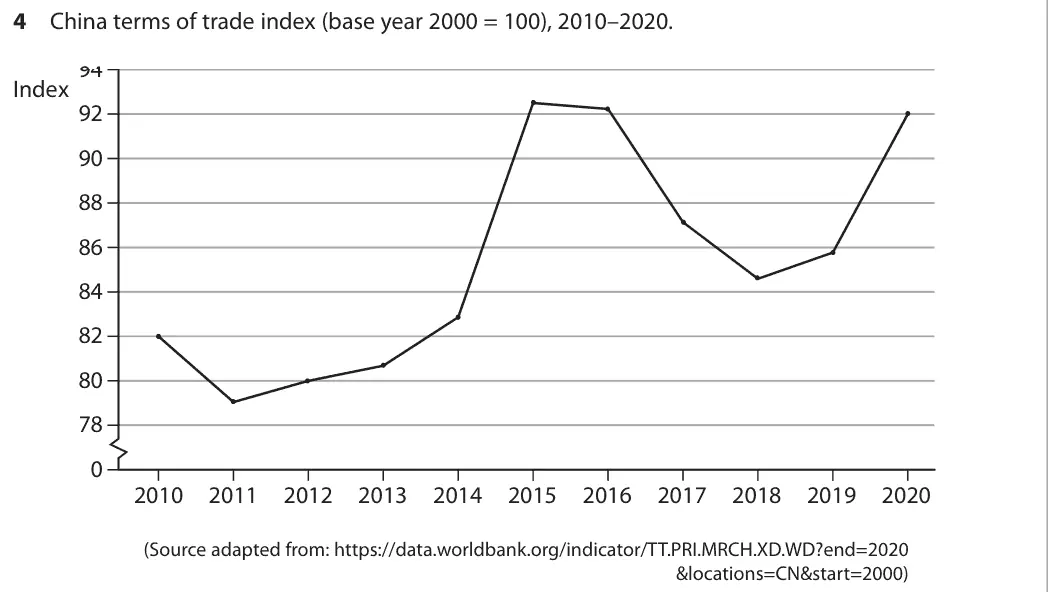
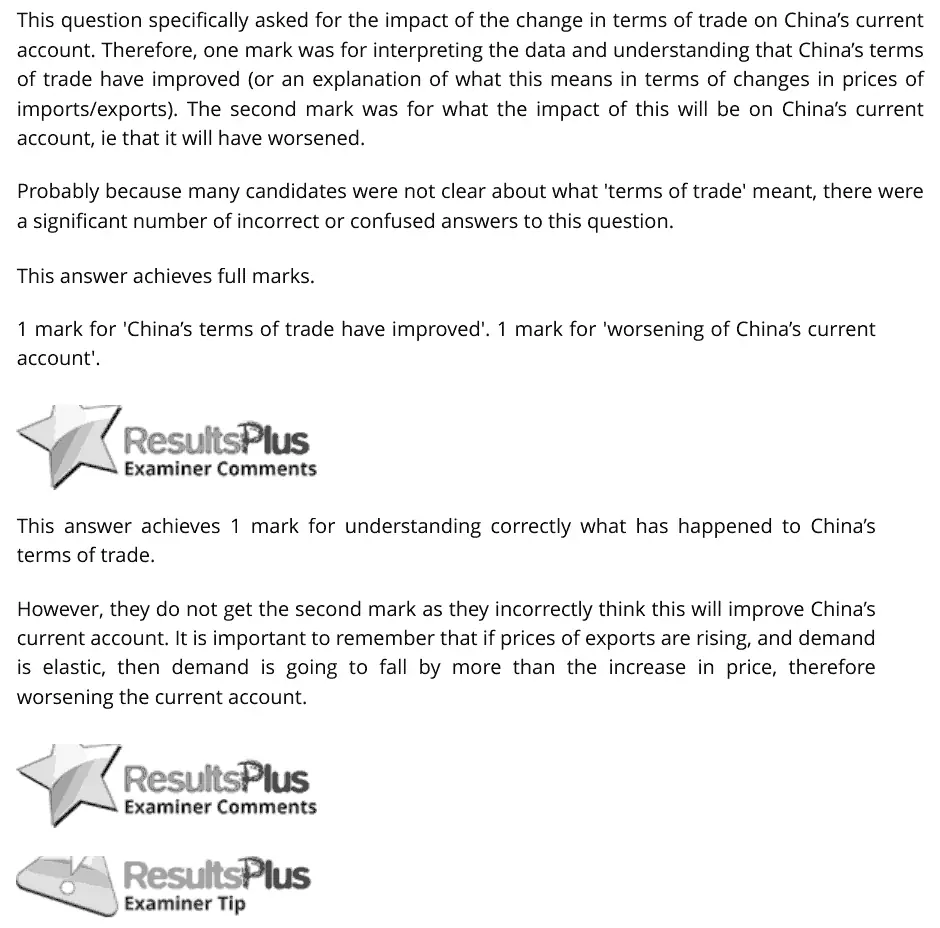
This question specifically asked for the impact of the change in terms of trade on China’s current account. Therefore, one mark was for interpreting the data and understanding that China’s terms of trade have improved (or an explanation of what this means in terms of changes in prices of imports/exports). The second mark was for what the impact of this will be on China’s current account, ie that it will have worsened. Probably because many candidates were not clear about what 'terms of trade' meant, there were a significant number of incorrect or confused answers to this question. This answer achieves full marks. 1 mark for 'China’s terms of trade have improved'. 1 mark for 'worsening of China’s current account'. This answer achieves 1 mark for understanding correctly what has happened to China’s terms of trade. However, they do not get the second mark as they incorrectly think this will improve China’s current account. It is important to remember that if prices of exports are rising, and demand is elastic, then demand is going to fall by more than the increase in price, therefore worsening the current account.
Notes from the mark scheme and report
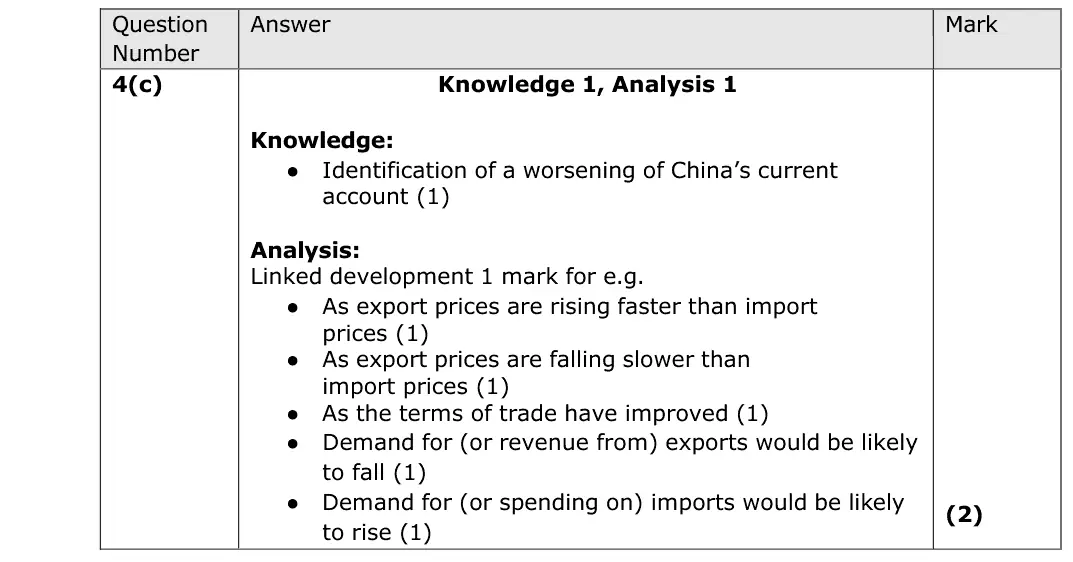
terms of trade improved (export prices rose relative to import prices)
with price elastic demand export revenue falls and import spending rises, so the current account worsens
report: "a significant number of incorrect or confused answers", many thought it would improve
Quantitative skills: QS 9 (interpret, apply and analyse information in written, graphical tabular and numerical forms)
June 2025 · AS Paper 2 · Q5(a)1 markMultiple choice
Data and extracts for question 5
Answer
C
Mark scheme
Notes from the mark scheme and report
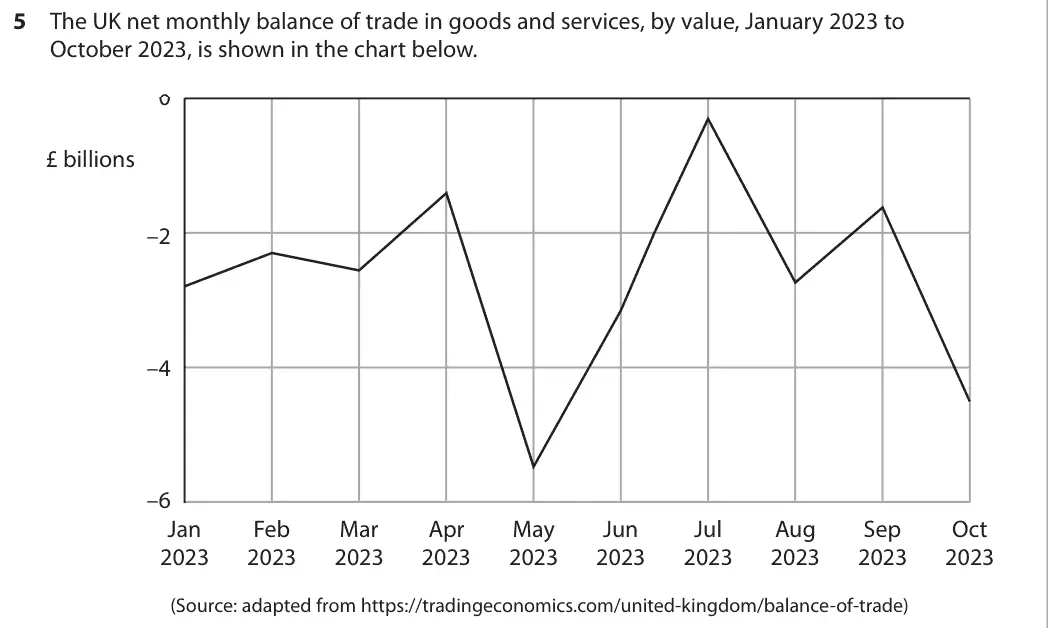
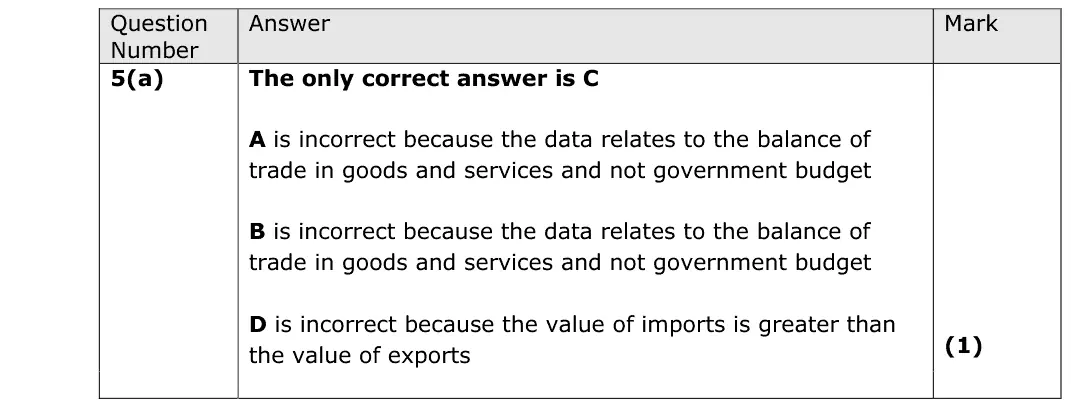
the trade balance is negative every month so imports exceed exports (C)
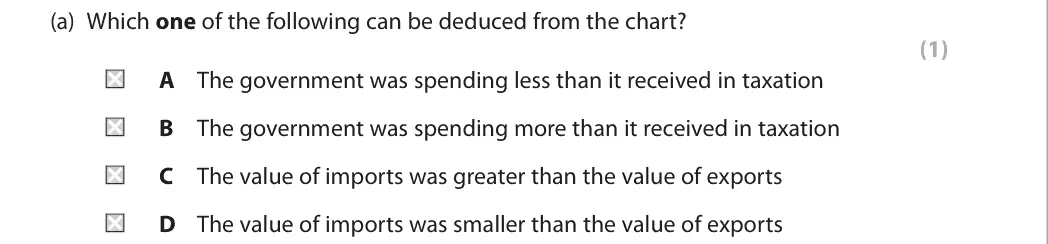
A and B are about the government budget, not trade
Quantitative skills: QS 9 (interpret, apply and analyse information in written, graphical tabular and numerical forms)
June 2025 · AS Paper 2 · Q5(b)3 marksAO1=1, AO2=1, AO3=1Short answer
Data and extracts for question 5
Mark scheme
Examiner's comment
This question asked candidates to explain one reason for the deficit in balance of goods and services. Many candidates found this question easy to answer. The marks are split as 1 for knowledge, 1 for application, and 1 for analysis. The knowledge comes from identifying one reason, the application for using the data, and analysis for development building on the knowledge. Some candidates were able to access knowledge and application marks, but were unable to develop the point identified.
Notes from the mark scheme and report
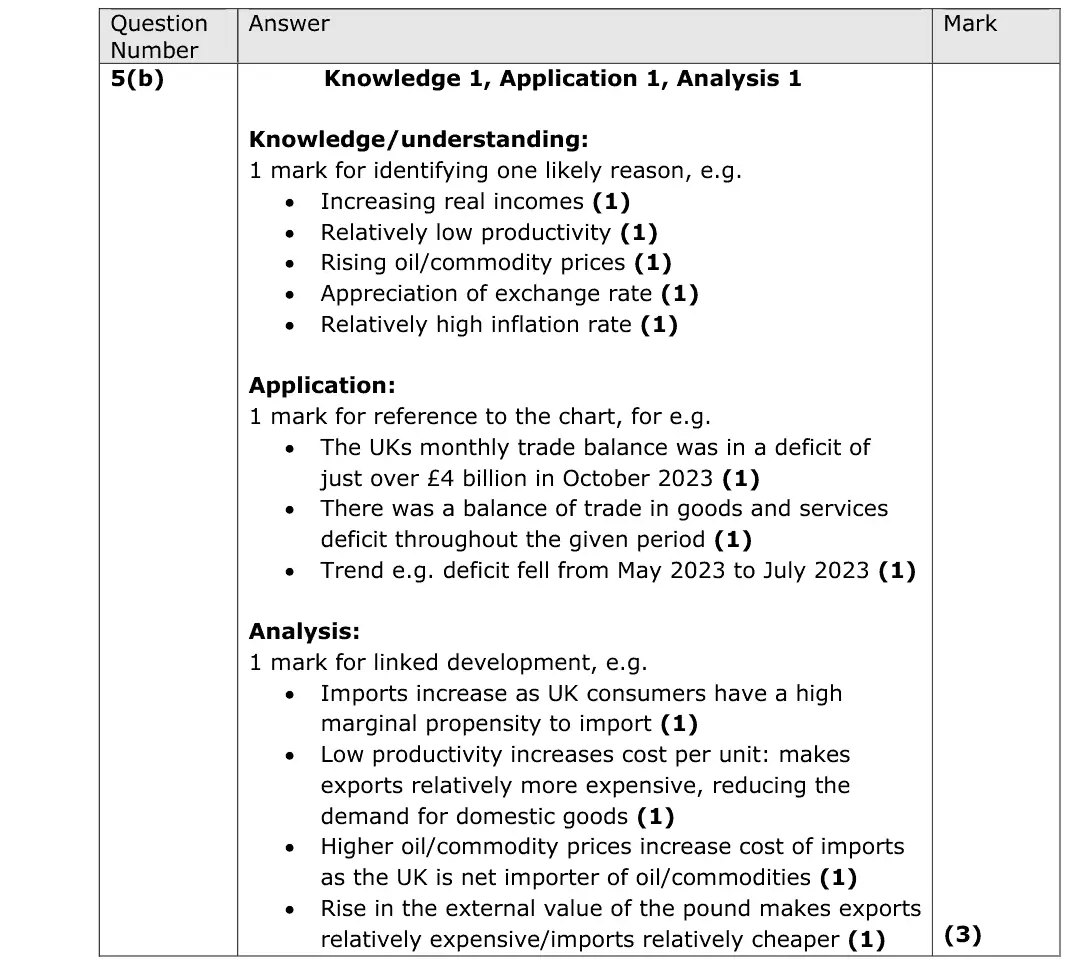
one reason (rising real incomes and mpm, low productivity, high oil/commodity prices, strong pound, relatively high inflation) developed
chart reference e.g. deficit throughout, just over £4bn in October 2023
many did not develop the point
Quantitative skills: QS 9 (interpret, apply and analyse information in written, graphical tabular and numerical forms)
June 2024 · Paper 2 · Q725 marksAO1=4, AO2=4, AO3=8, AO4=925-mark essayEither/or
Mark scheme, including the levels grid and indicative content
Examiner's comment
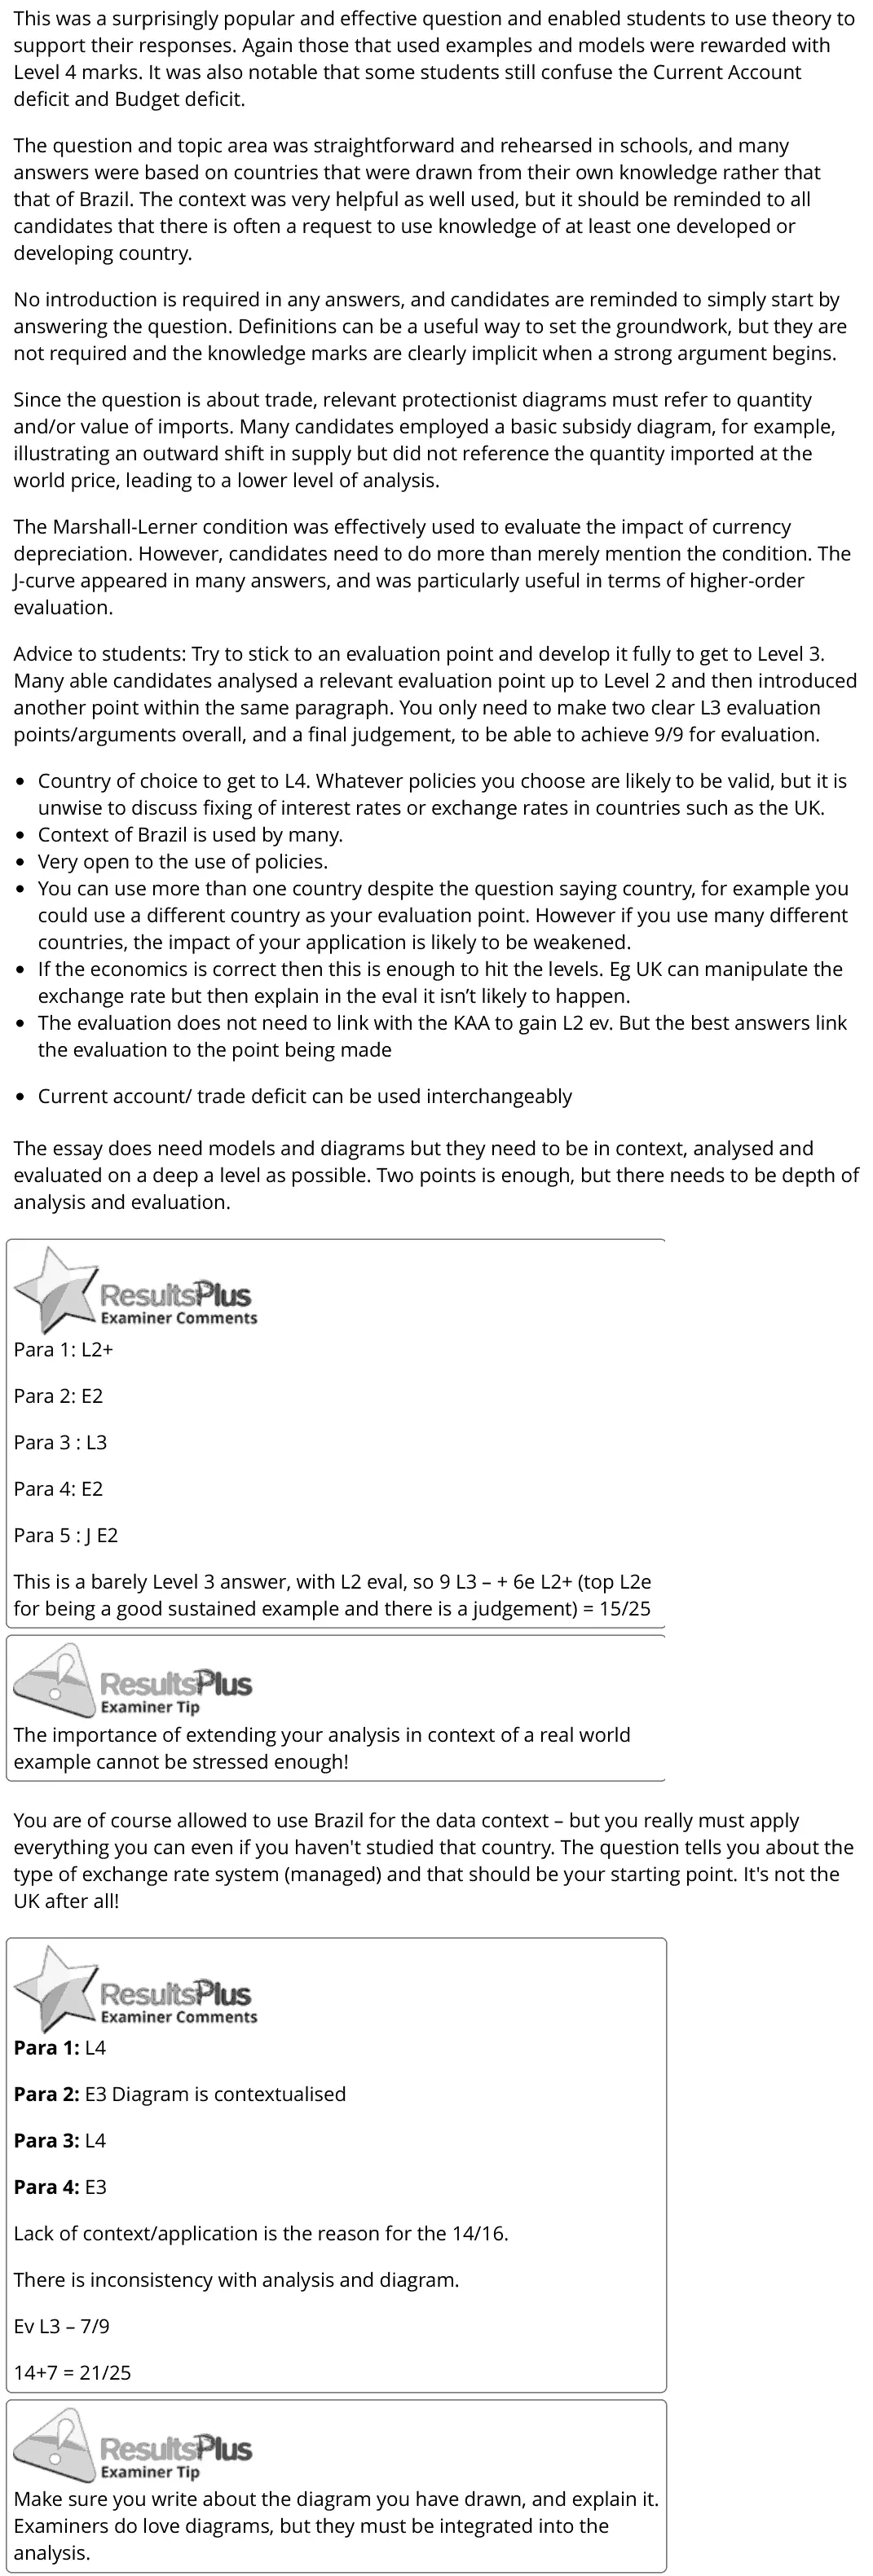
This was a surprisingly popular and effective question and enabled students to use theory to support their responses. Again those that used examples and models were rewarded with Level 4 marks. It was also notable that some students still confuse the Current Account deficit and Budget deficit. The question and topic area was straightforward and rehearsed in schools, and many answers were based on countries that were drawn from their own knowledge rather that that of Brazil. The context was very helpful as well used, but it should be reminded to all candidates that there is often a request to use knowledge of at least one developed or developing country. No introduction is required in any answers, and candidates are reminded to simply start by answering the question. Definitions can be a useful way to set the groundwork, but they are not required and the knowledge marks are clearly implicit when a strong argument begins. Since the question is about trade, relevant protectionist diagrams must refer to quantity and/or value of imports. Many candidates employed a basic subsidy diagram, for example, illustrating an outward shift in supply but did not reference the quantity imported at the world price, leading to a lower level of analysis. The Marshall-Lerner condition was effectively used to evaluate the impact of currency depreciation. However, candidates need to do more than merely mention the condition. The J-curve appeared in many answers, and was particularly useful in terms of higher-order evaluation. Advice to students: Try to stick to an evaluation point and develop it fully to get to Level 3. Many able candidates analysed a relevant evaluation point up to Level 2 and then introduced another point within the same paragraph. You only need to make two clear L3 evaluation points/arguments overall, and a final judgement, to be able to achieve 9/9 for evaluation. Country of choice to get to L4. Whatever policies you choose are likely to be valid, but it is unwise to discuss fixing of interest rates or exchange rates in countries such as the UK. Context of Brazil is used by many. Very open to the use of policies. You can use more than one country despite the question saying country, for example you could use a different country as your evaluation point. However if you use many different countries, the impact of your application is likely to be weakened. If the economics is correct then this is enough to hit the levels. Eg UK can manipulate the exchange rate but then explain in the eval it isn’t likely to happen. The evaluation does not need to link with the KAA to gain L2 ev. But the best answers link the evaluation to the point being made Current account/ trade deficit can be used interchangeably The essay does need models and diagrams but they need to be in context, analysed and evaluated on a deep a level as possible. Two points is enough, but there needs to be depth of analysis and evaluation. Para 1: L2+ Para 2: E2 Para 3 : L3 Para 4: E2 Para 5 : J E2 This is a barely Level 3 answer, with L2 eval, so 9 L3 – + 6e L2+ (top L2e for being a good sustained example and there is a judgement) = 15/25 The importance of extending your analysis in context of a real world example cannot be stressed enough! You are of course allowed to use Brazil for the data context – but you really must apply everything you can even if you haven't studied that country. The question tells you about the type of exchange rate system (managed) and that should be your starting point. It's not the UK after all! Para 1: L4 Para 2: E3 Diagram is contextualised Para 3: L4 Para 4: E3 Lack of context/application is the reason for the 14/16. There is inconsistency with analysis and diagram. Ev L3 – 7/9 14+7 = 21/25 Make sure you write about the diagram you have drawn, and explain it. Examiners do love diagrams, but they must be integrated into the analysis.
Notes from the mark scheme and report
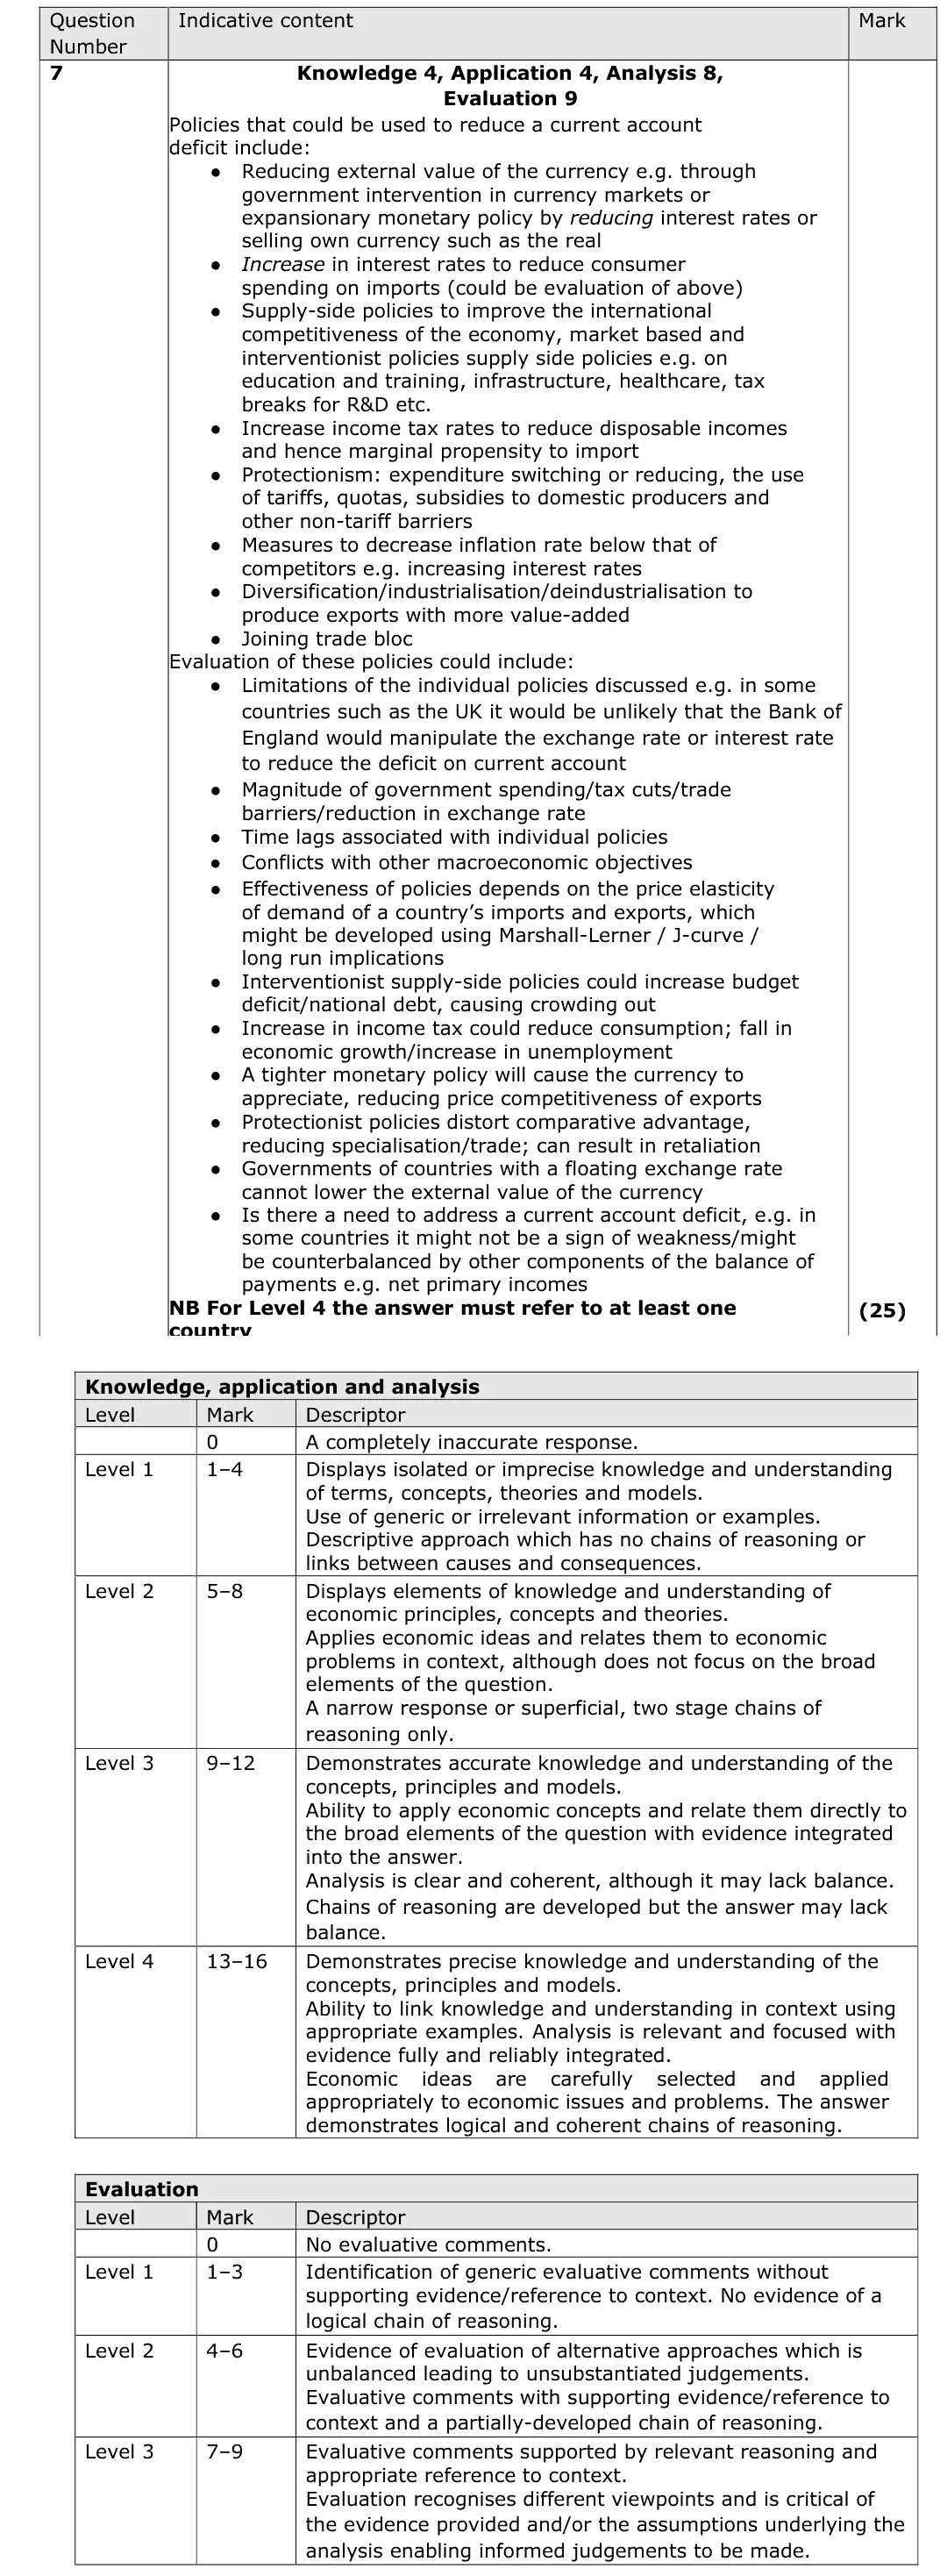
policies: depreciation via intervention or lower rates (Marshall-Lerner, J-curve), deflationary fiscal policy, supply-side policies for competitiveness, protectionism
refer to a country of choice
report: some still confuse the current account deficit with the budget deficit
protection diagrams must show the effect on imports
June 2023 · AS Paper 2 · Q6(a)4 marksAO1=2, AO2=2Short answer
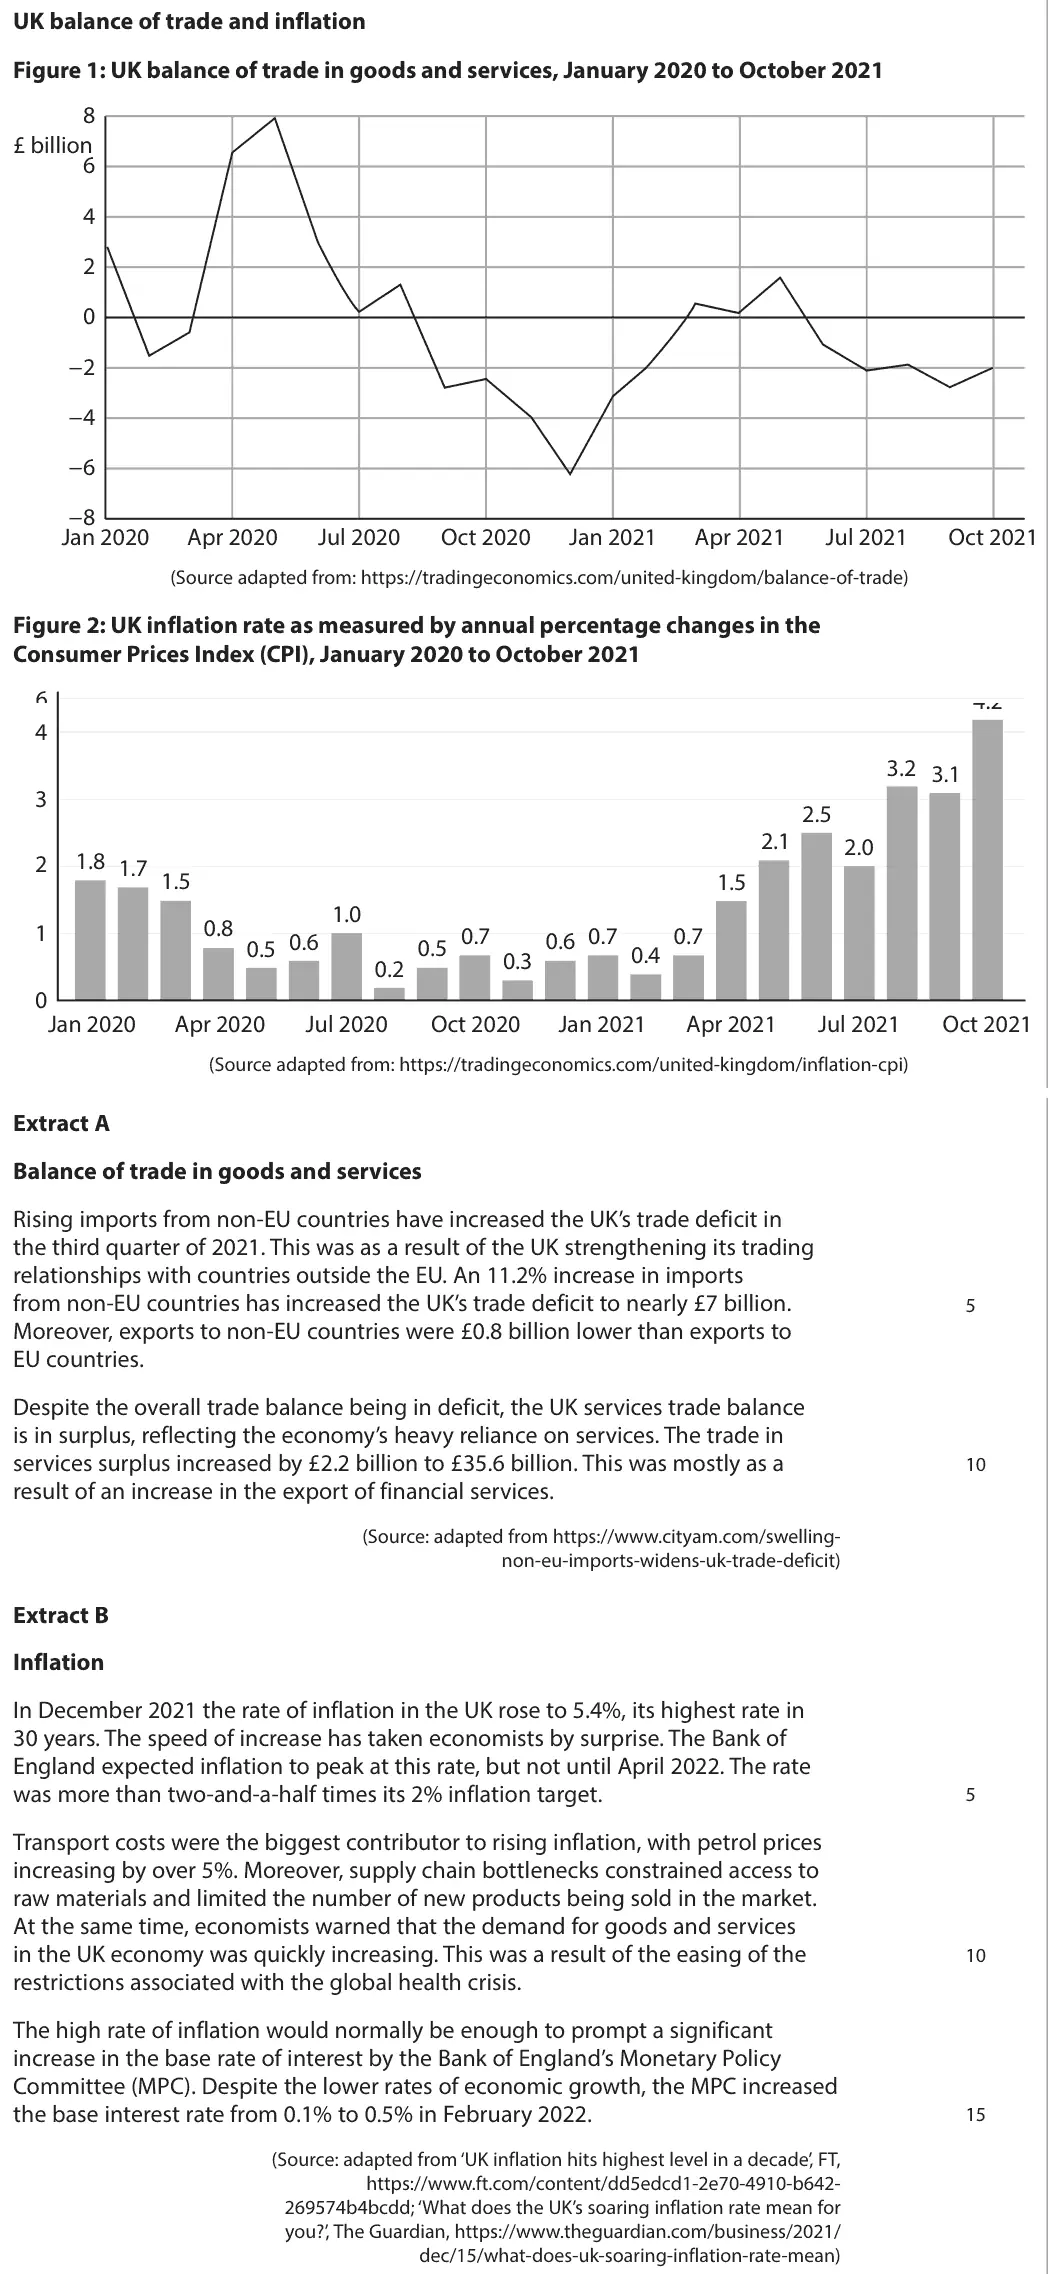
Data and extracts for question 6
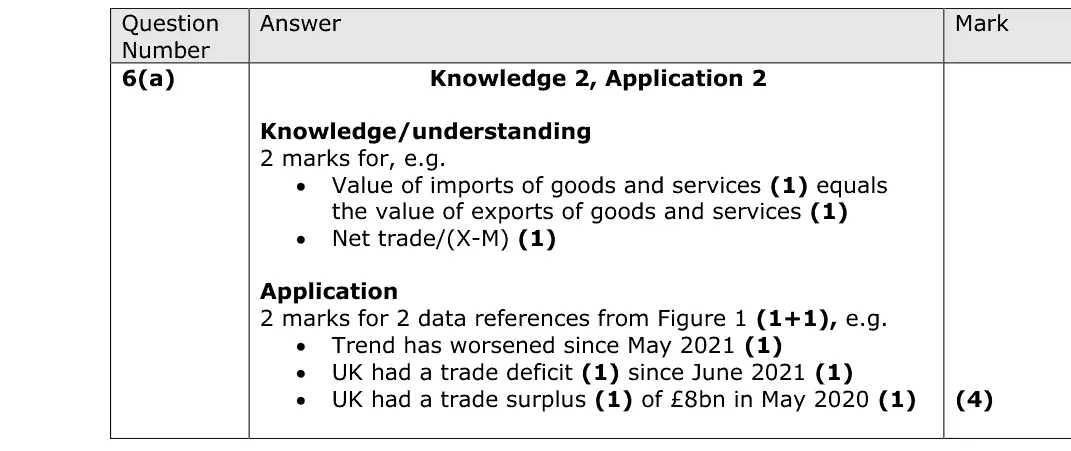
Mark scheme
Examiner's comment
The four marks for this question are split in half between knowledge and application. Candidates achieved 2 marks for explanation of the term balance of trade in goods and services and 2 marks for relevant application from Figure 1 only.
Notes from the mark scheme and report
the value of exports minus imports of goods and services (net trade)
two references to Figure 1, e.g. surplus of about £8bn in May 2020, deficit since mid-2021
Quantitative skills: QS 9 (interpret, apply and analyse information in written, graphical tabular and numerical forms)
June 2023 · AS Paper 2 · Q6(f)20 marksAO1=4, AO2=4, AO3=6, AO4=620-mark essayEither/orHard
Data and extracts for question 6
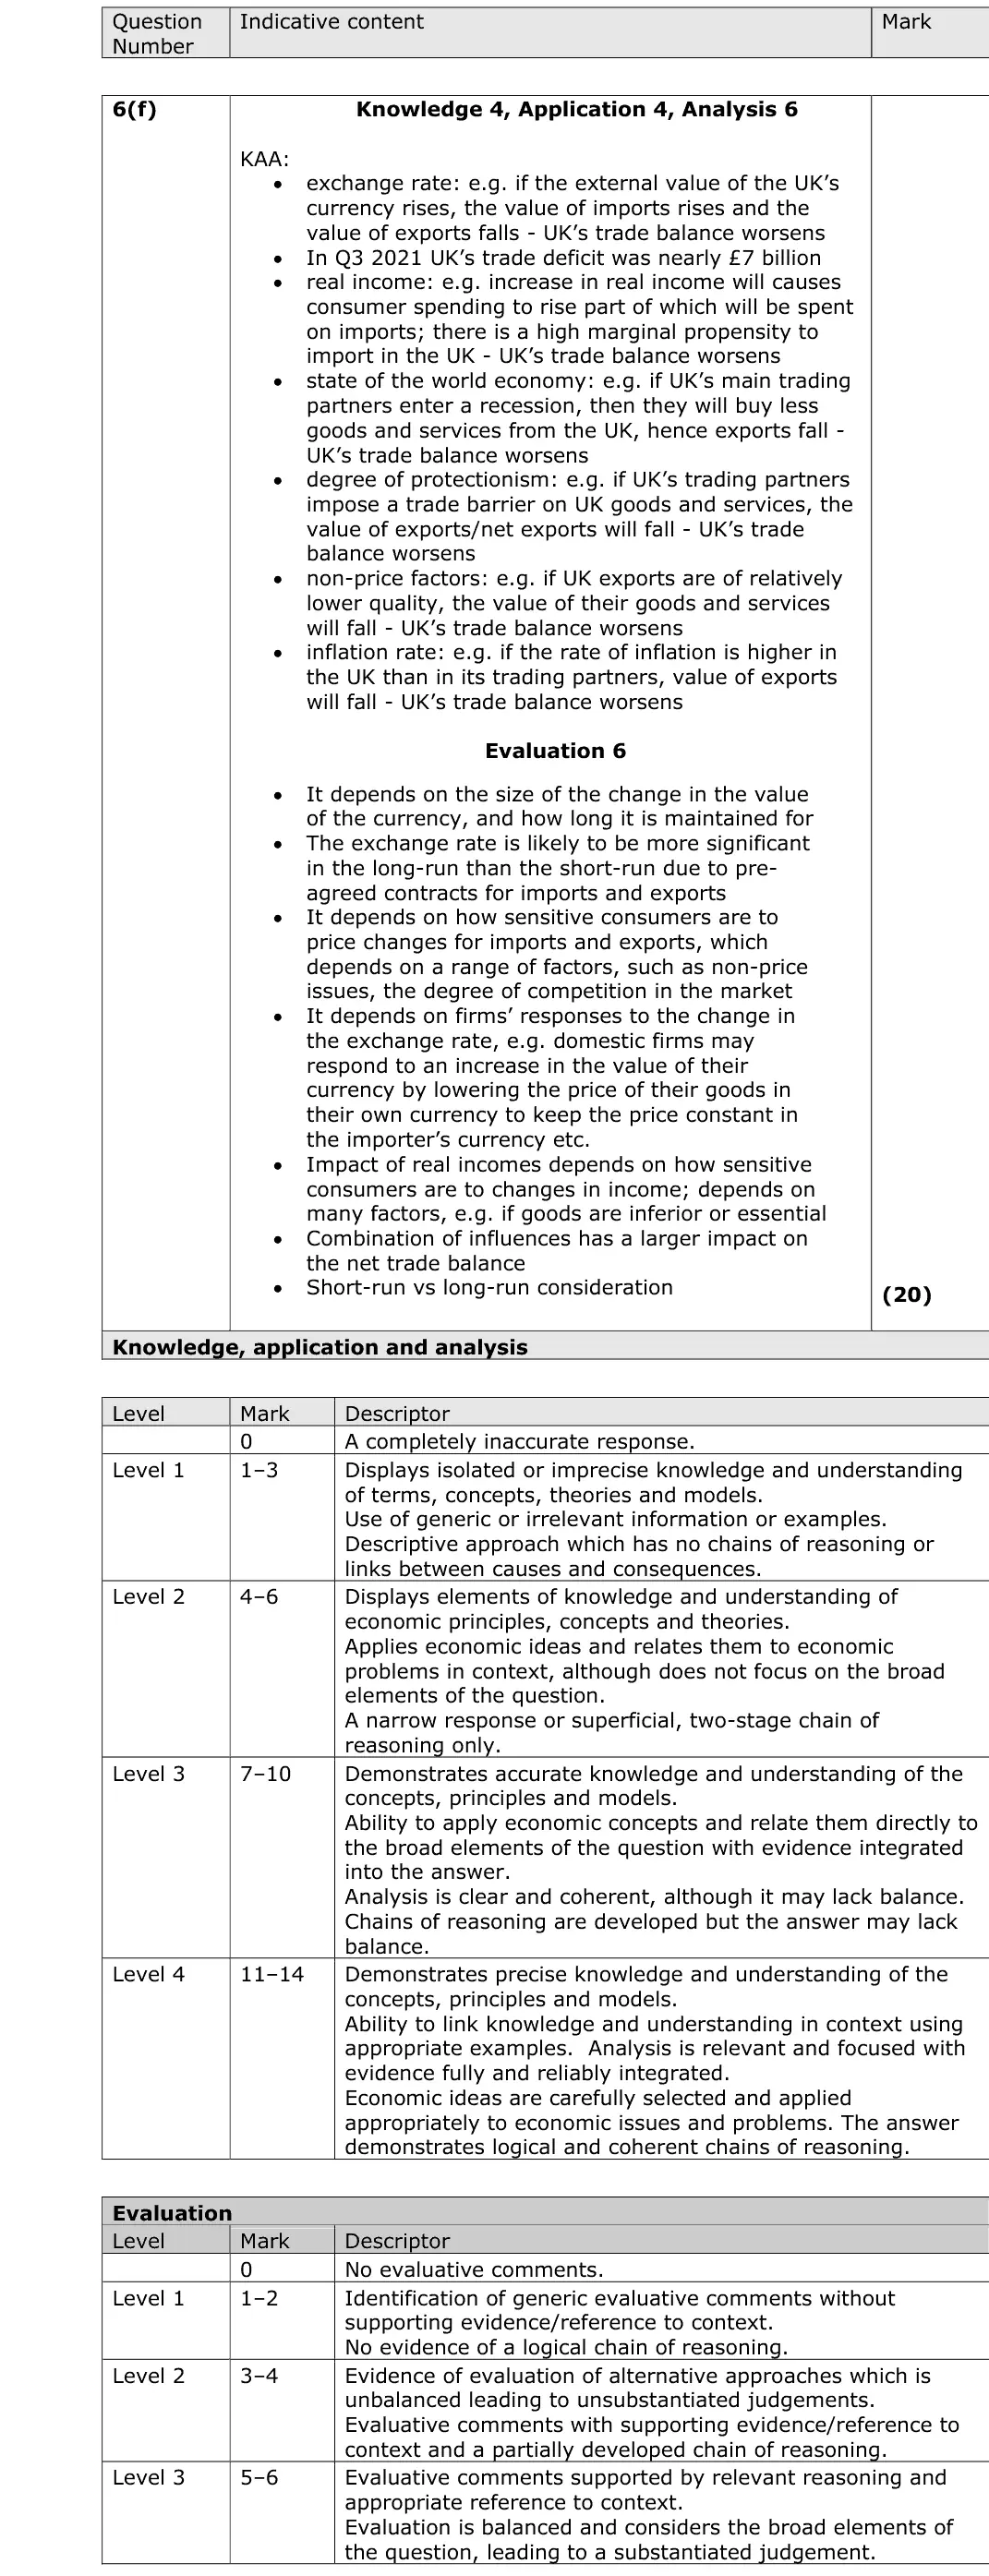
Mark scheme, including the levels grid and indicative content
Examiner's comment
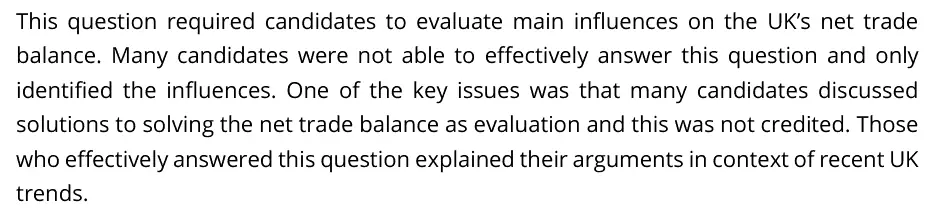
This question required candidates to evaluate main influences on the UK’s net trade balance. Many candidates were not able to effectively answer this question and only identified the influences. One of the key issues was that many candidates discussed solutions to solving the net trade balance as evaluation and this was not credited. Those who effectively answered this question explained their arguments in context of recent UK trends.
Notes from the mark scheme and report
influences: exchange rate, real income and high MPM, state of the world economy, protectionism, non-price factors
apply the near £7bn deficit
report: "Many candidates were not able to effectively answer this question and only identified the influences", and solutions to the deficit were not credited as evaluation
Quantitative skills: QS 9 (interpret, apply and analyse information in written, graphical tabular and numerical forms)
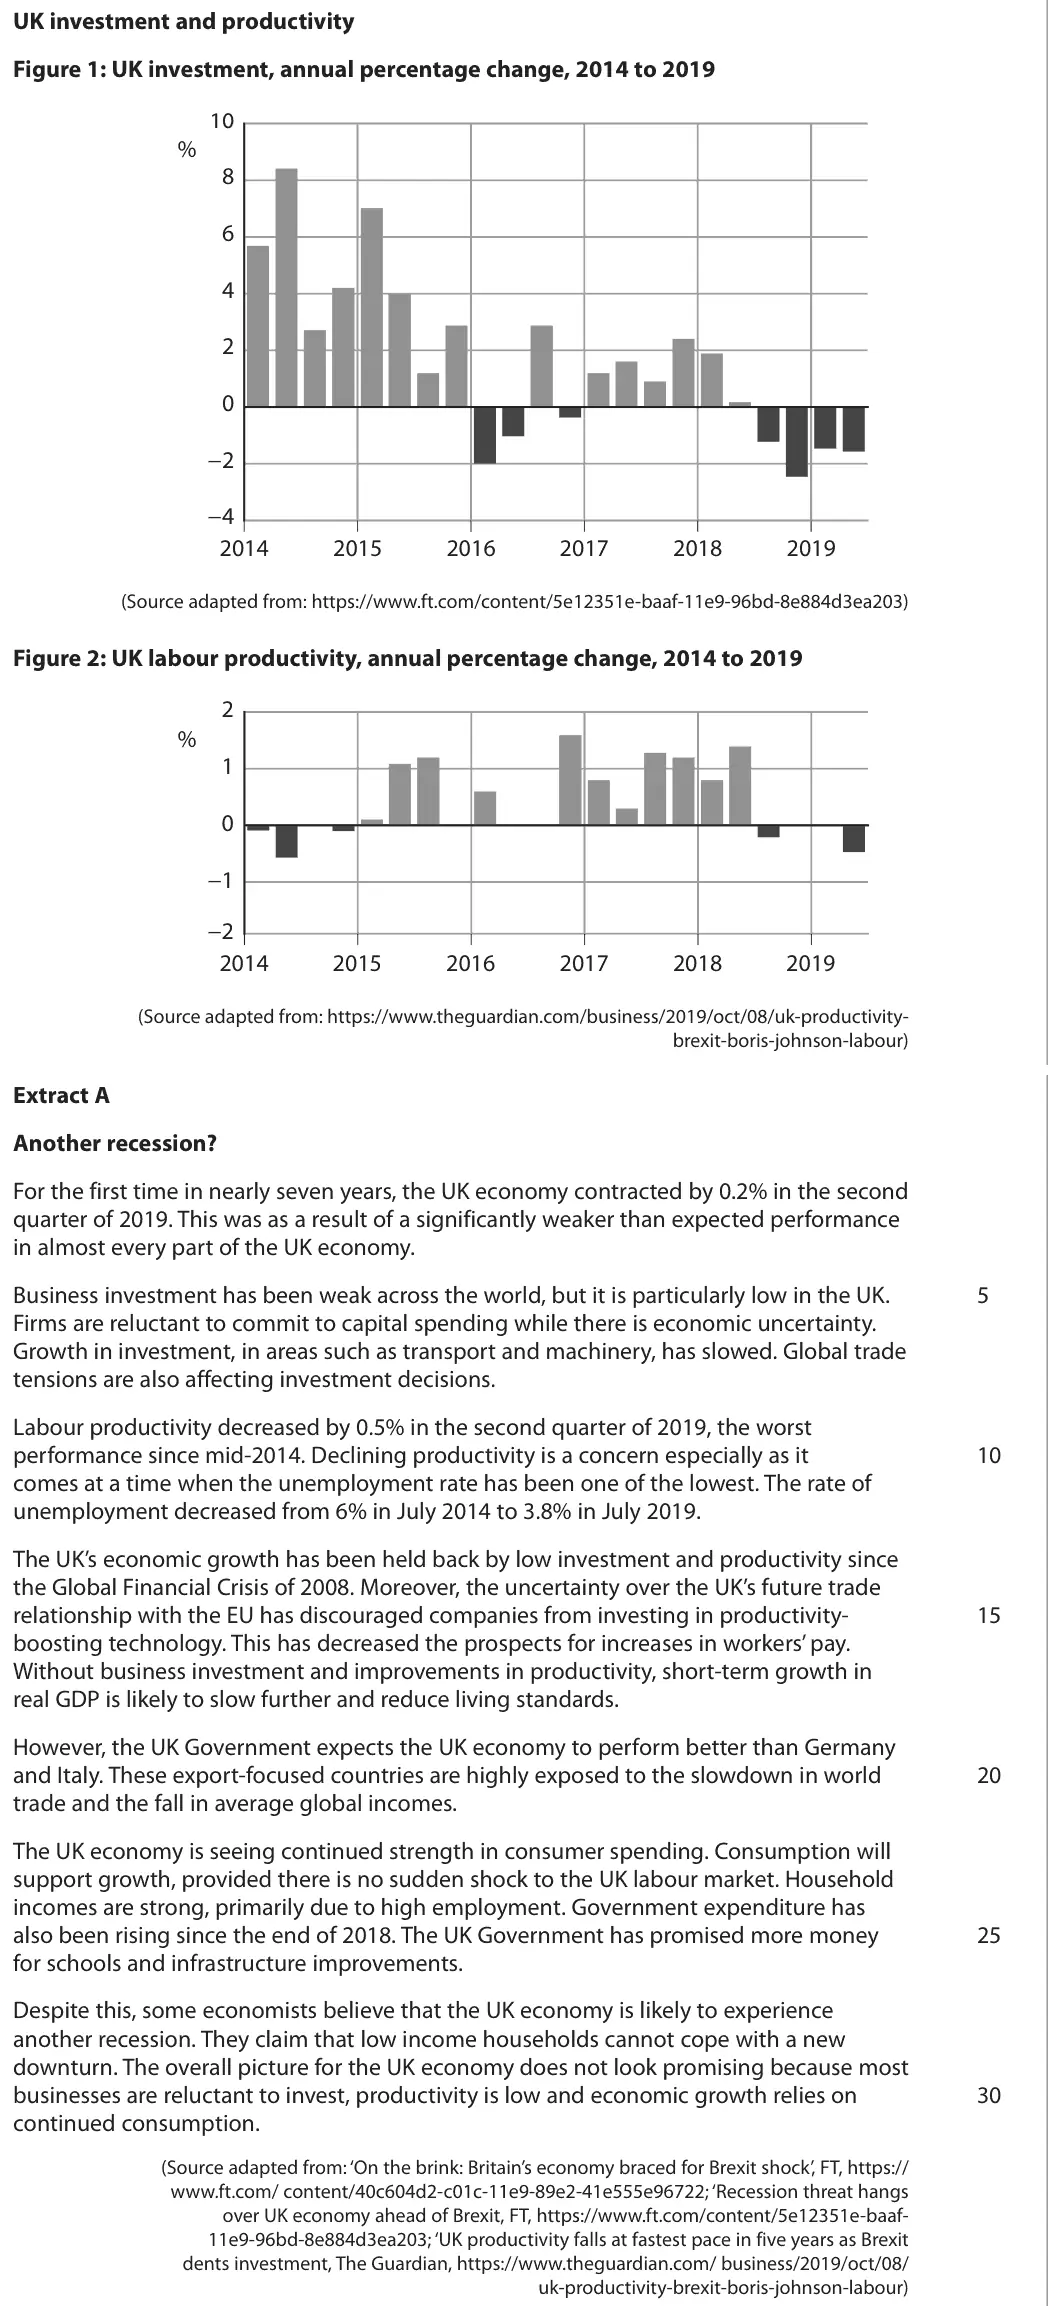
June 2022 · AS Paper 2 · Q6(d)5 marksAO1=1, AO2=2, AO3=2Short answer
Data and extracts for question 6
Mark scheme
Examiner's comment
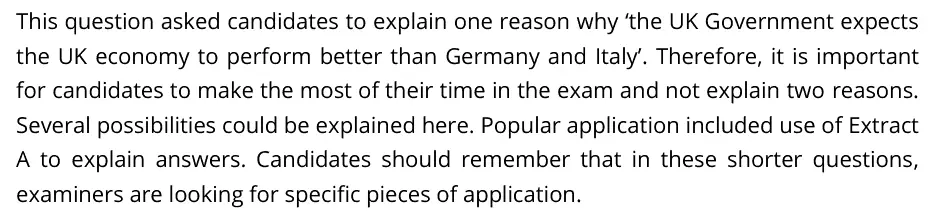
This question asked candidates to explain one reason why ‘the UK Government expects the UK economy to perform better than Germany and Italy’. Therefore, it is important for candidates to make the most of their time in the exam and not explain two reasons. Several possibilities could be explained here. Popular application included use of Extract A to explain answers. Candidates should remember that in these shorter questions, examiners are looking for specific pieces of application.
Notes from the mark scheme and report
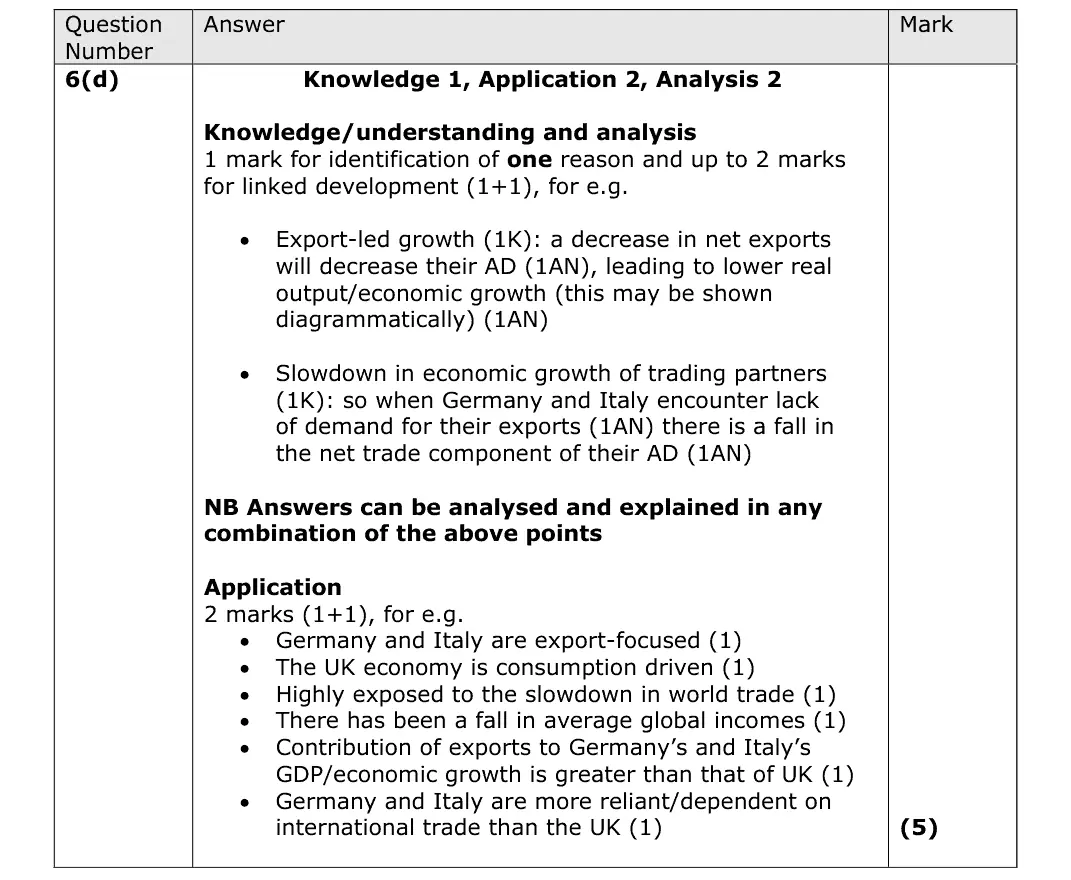
one reason: Germany and Italy are export-focused so the slowdown in world trade cuts their net exports and AD, while UK growth is consumption-driven
one reason only
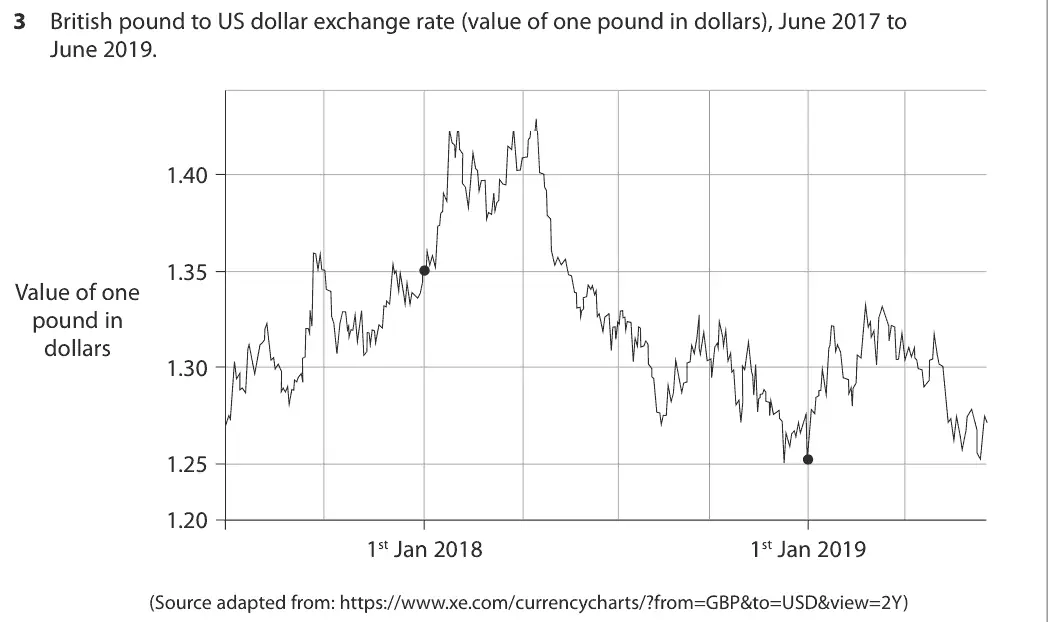
November 2021 · Paper 2 · Q3(b)4 marksAO1=2, AO2=1, AO3=1Short answer
Data and extracts for question 3
Mark scheme
Examiner's comment
Question 3b required candidates to explain the link between exchange rates and the current account. There were many good answers here that explained this link clearly, such as the example below. Some good answers lacked application, missing out on 1 of the marks.
Notes from the mark scheme and report
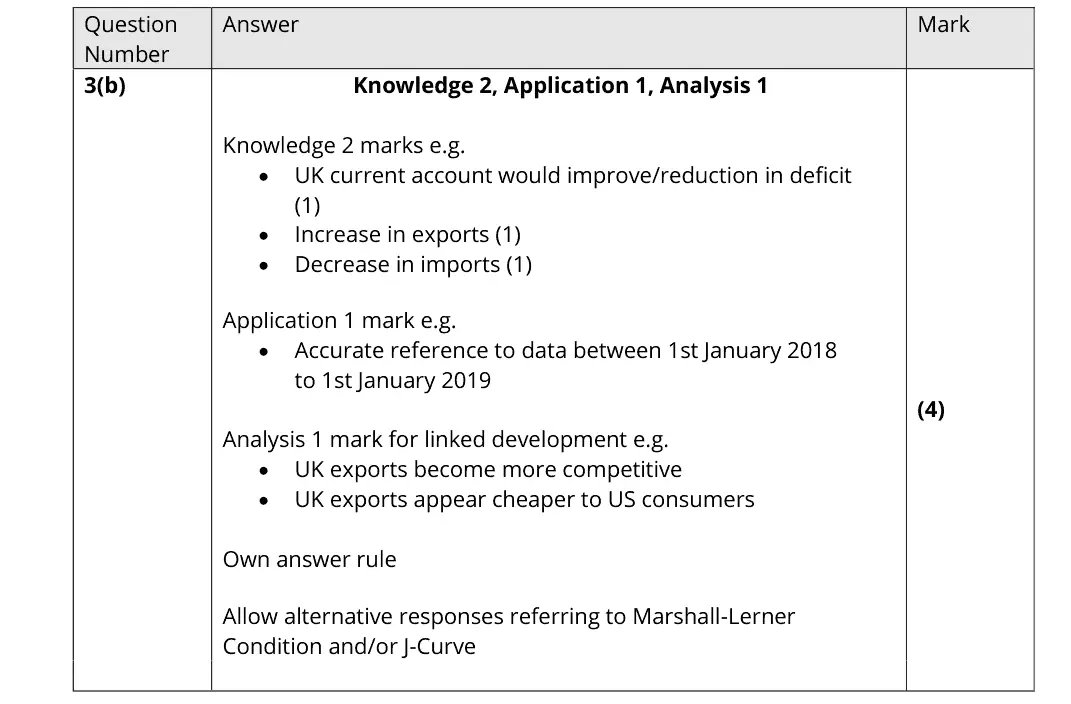
depreciation makes UK exports cheaper and imports dearer so the current account deficit narrows
quote the data (about $1.35 to $1.25) for the application mark, often missing
Marshall-Lerner/J-curve accepted
Quantitative skills: QS 9 (interpret, apply and analyse information in written, graphical tabular and numerical forms)
October 2020 · AS Paper 2 · Q3(a)1 markMultiple choice
Data and extracts for question 3
Answer
C
Mark scheme
Examiner's comment
In this question the marks are split as 1 for knowledge, 1 for application, and 1 for analysis. The knowledge comes from identifying one reason, the application for explaining the data, and analysis for development building on the knowledge. Most candidates were able to access application marks, correctly identifying a current account deficit.
Notes from the mark scheme and report
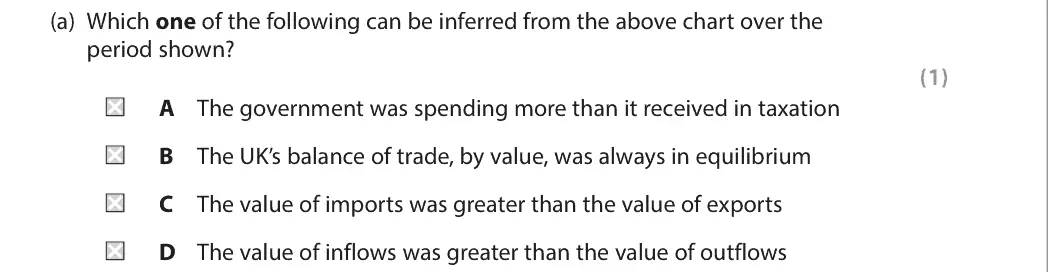
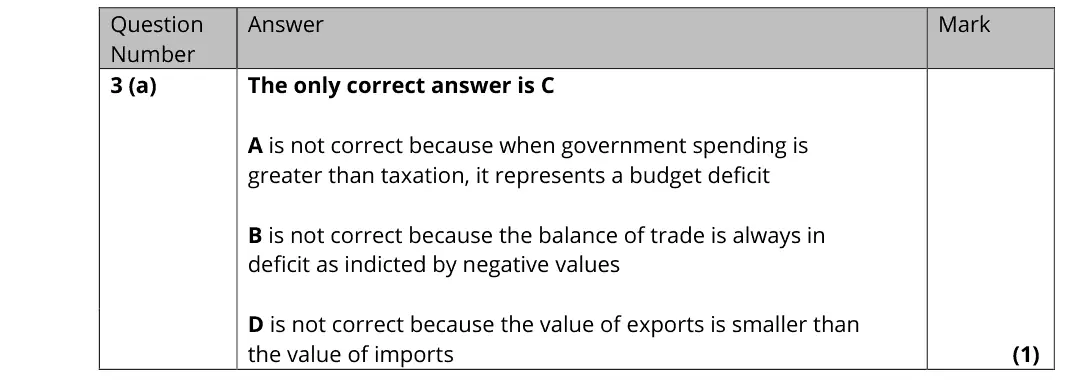
the balance is negative throughout, so imports exceeded exports by value (C)
A describes a budget deficit
B the balance was never zero
D inflows were smaller than outflows
Quantitative skills: QS 9 (interpret, apply and analyse information in written, graphical tabular and numerical forms)
October 2020 · AS Paper 2 · Q3(b)3 marksAO1=1, AO2=1, AO3=1Short answer
Data and extracts for question 3
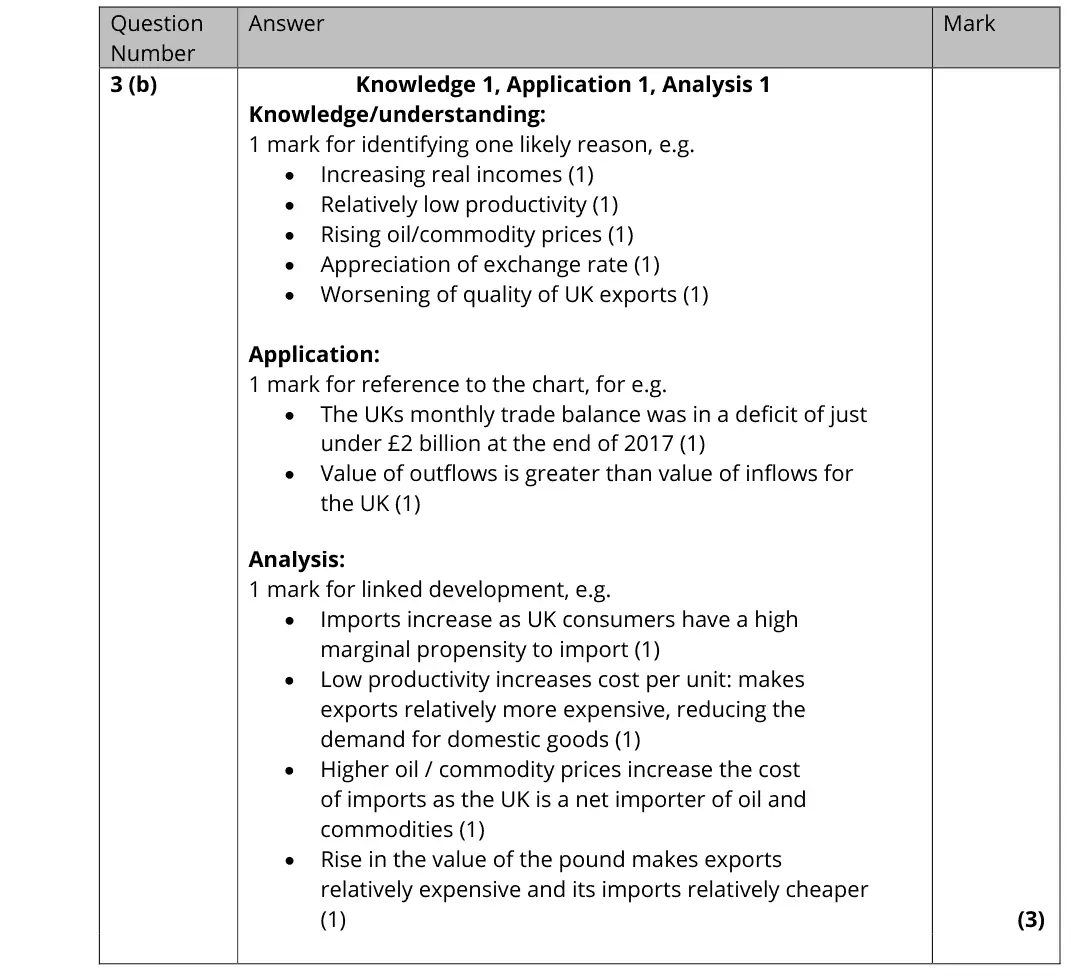
Mark scheme
Notes from the mark scheme and report
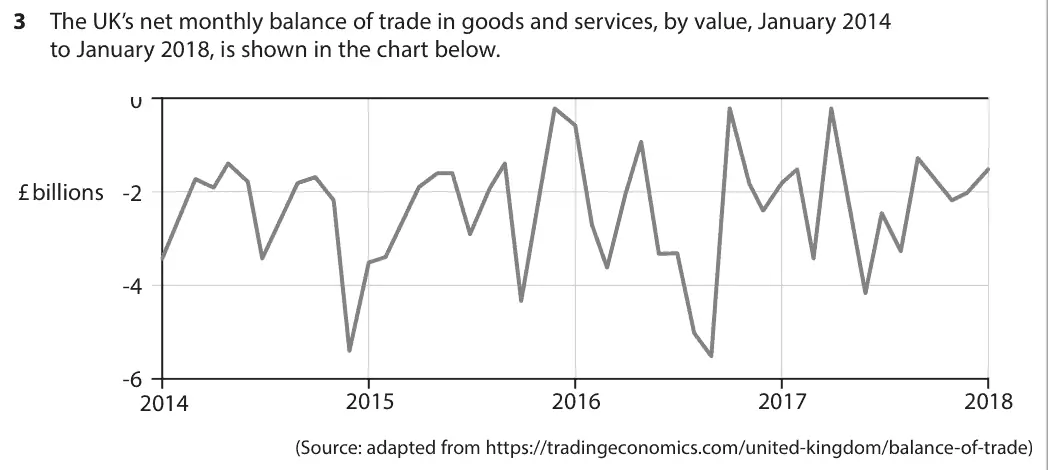
one reason (rising real incomes with a high propensity to import, low productivity, rising commodity prices, strong pound) with linked development
application from the chart e.g. a deficit of just under £2 billion a month at the end of 2017
Quantitative skills: QS 9 (interpret, apply and analyse information in written, graphical tabular and numerical forms)
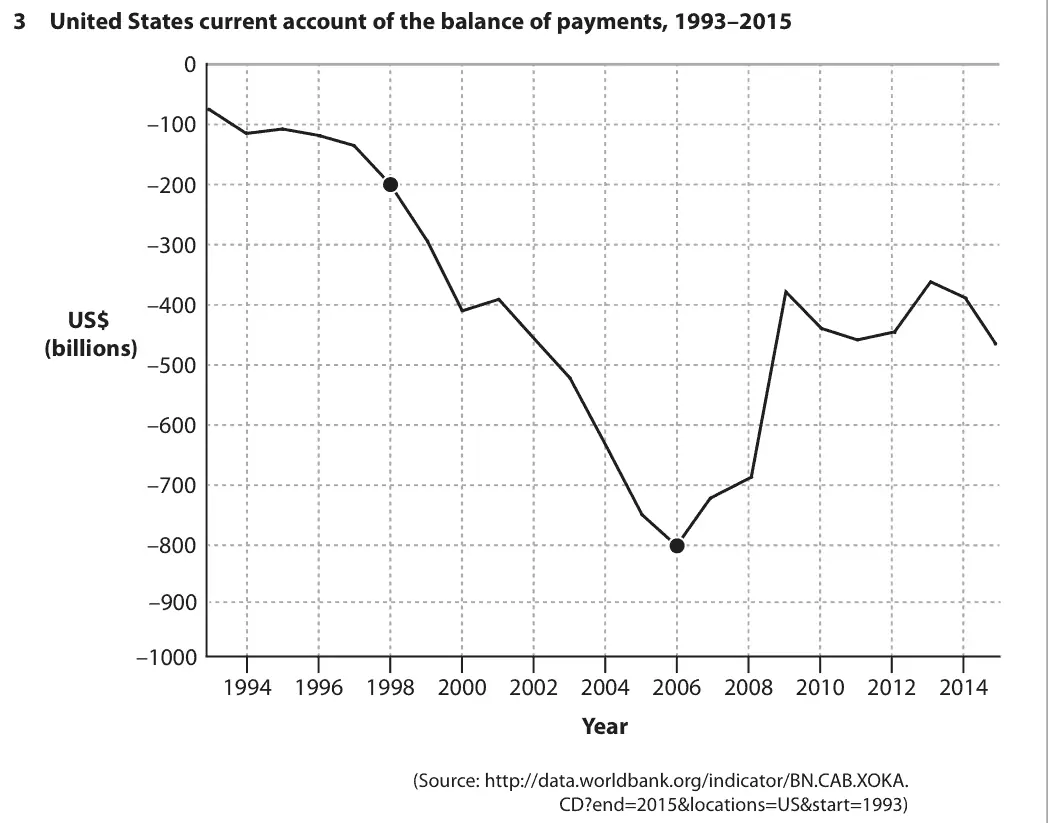
June 2018 · Paper 2 · Q3(a)2 marksAO2=2Calculation
Data and extracts for question 3
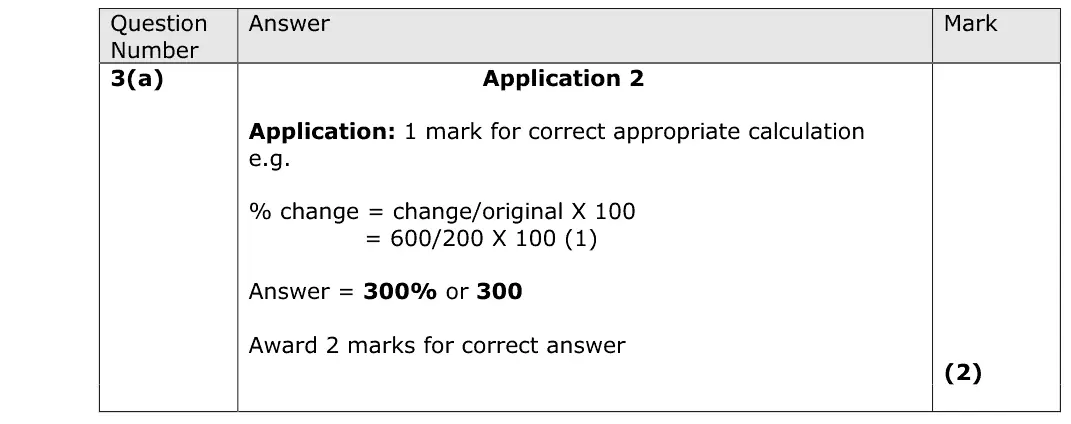
Mark scheme
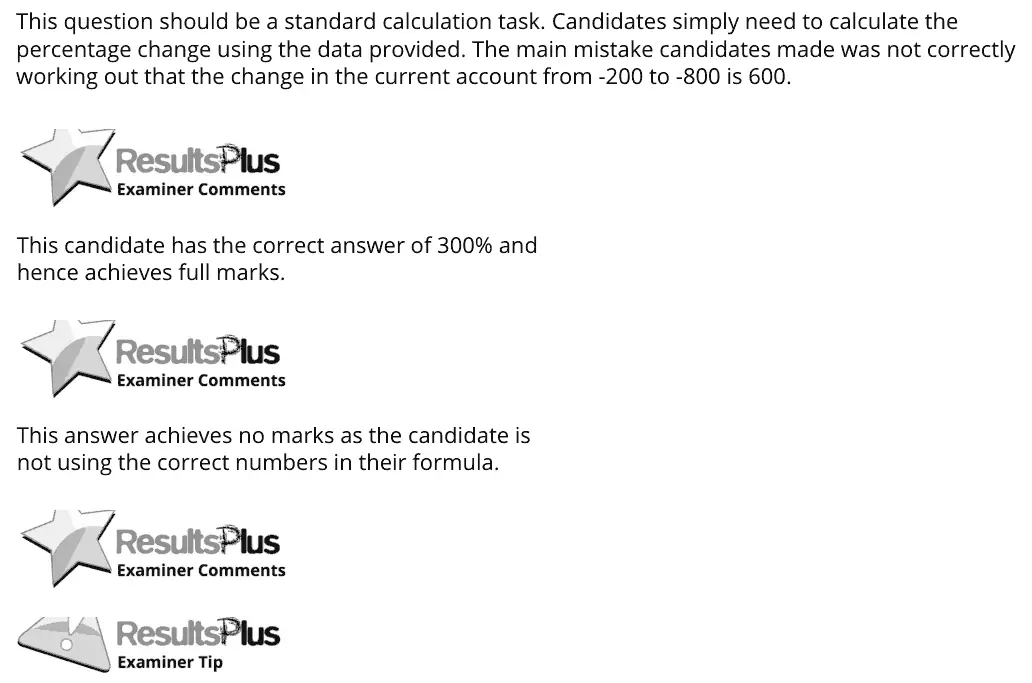
Examiner's comment
This question should be a standard calculation task. Candidates simply need to calculate the percentage change using the data provided. The main mistake candidates made was not correctly working out that the change in the current account from -200 to -800 is 600. This candidate has the correct answer of 300% and hence achieves full marks. This answer achieves no marks as the candidate is not using the correct numbers in their formula.
Notes from the mark scheme and report
deficit rose from 200 to 800 billion: 600/200 x 100 = 300%
main error was not reading the change from -200 to -800 as 600
Quantitative skills: QS 2 (calculate, use and understand percentages, percentage changes and percentage point changes); QS 9 (interpret, apply and analyse information in written, graphical tabular and numerical forms)
June 2018 · Paper 2 · Q3(b)2 marksAO1=2Short answer
Data and extracts for question 3
Mark scheme
Examiner's comment
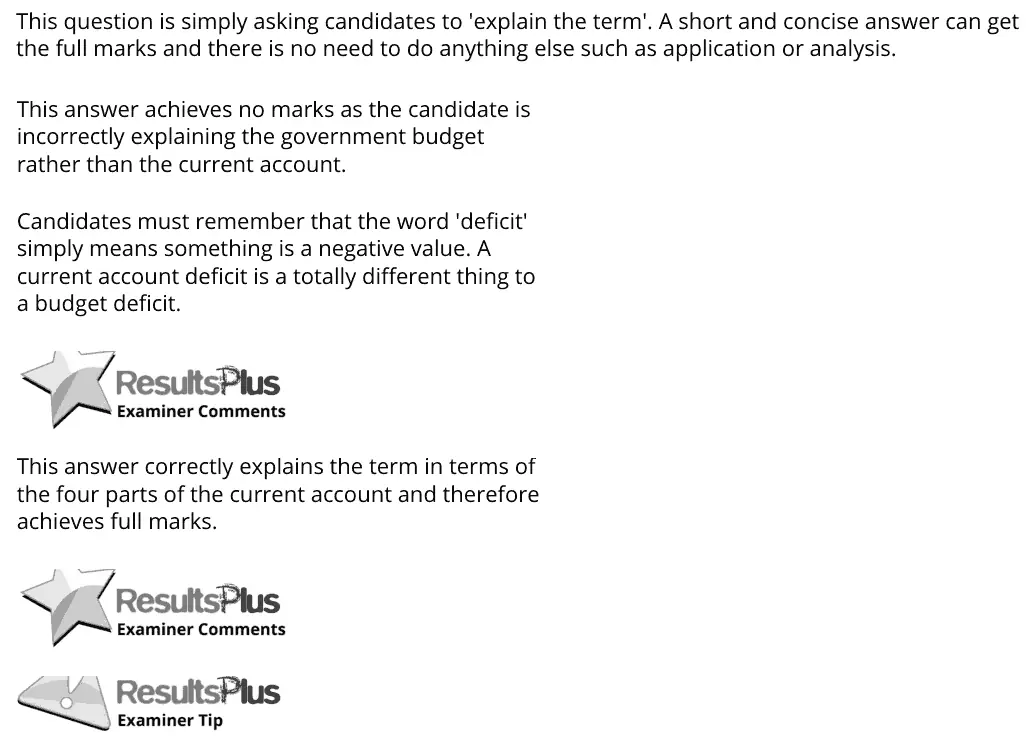
This question is simply asking candidates to 'explain the term'. A short and concise answer can get the full marks and there is no need to do anything else such as application or analysis. This answer achieves no marks as the candidate is incorrectly explaining the government budget rather than the current account. Candidates must remember that the word 'deficit' simply means something is a negative value. A current account deficit is a totally different thing to a budget deficit. This answer correctly explains the term in terms of the four parts of the current account and therefore achieves full marks.
Notes from the mark scheme and report
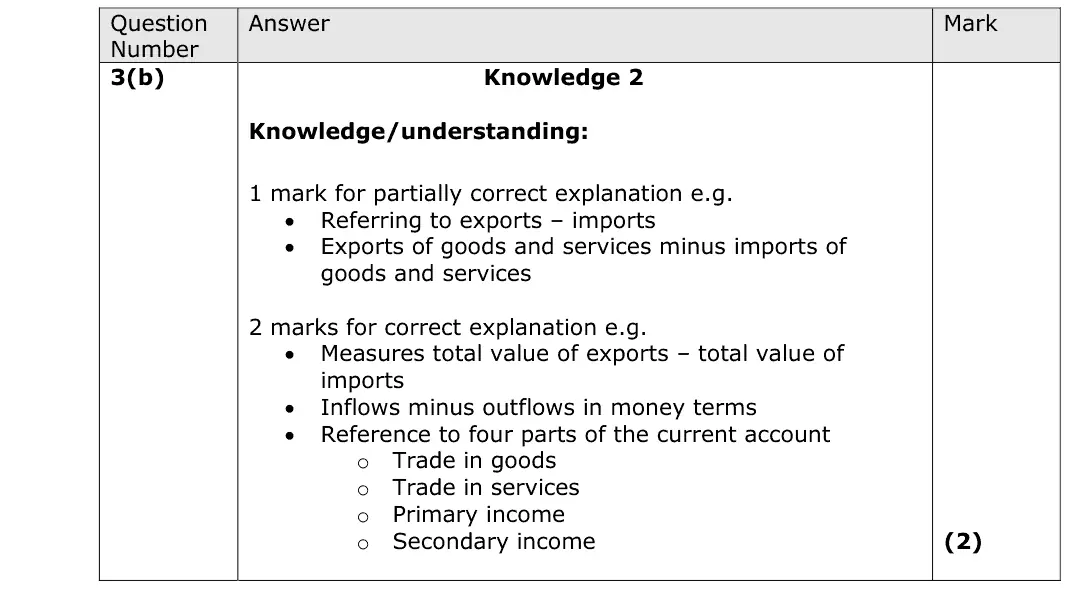
exports minus imports of goods and services for 1 mark
full marks for total value of exports minus imports or the four parts (trade in goods, services, primary and secondary income)
some explained the government budget instead
June 2018 · Paper 2 · Q3(c)1 markMultiple choice
Data and extracts for question 3
Answer
C
Mark scheme
Notes from the mark scheme and report
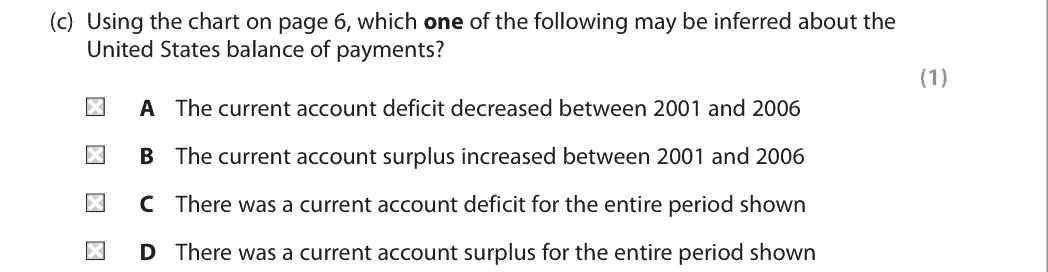
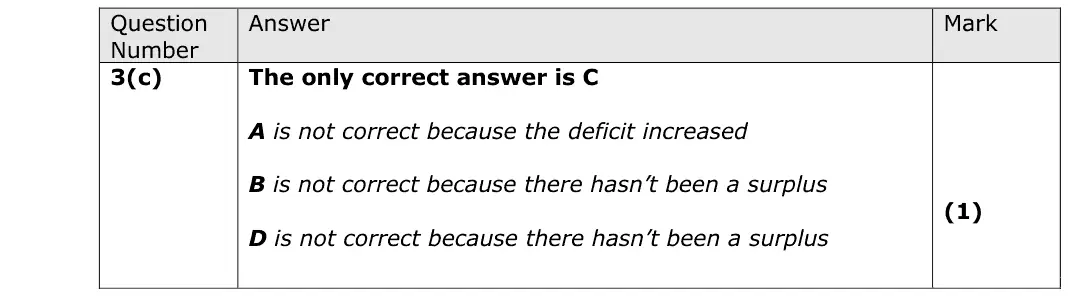
the line is below zero throughout 1993 to 2015, so a deficit for the whole period (C)
the deficit increased 2001 to 2006 (not A)
there was never a surplus (not B or D)
Quantitative skills: QS 9 (interpret, apply and analyse information in written, graphical tabular and numerical forms)
June 2017 · AS Paper 2 · Q6(b)10 marksAO1=2, AO2=2, AO3=2, AO4=410-mark response
Data and extracts for question 6
Mark scheme, including the levels grid and indicative content
Examiner's comment
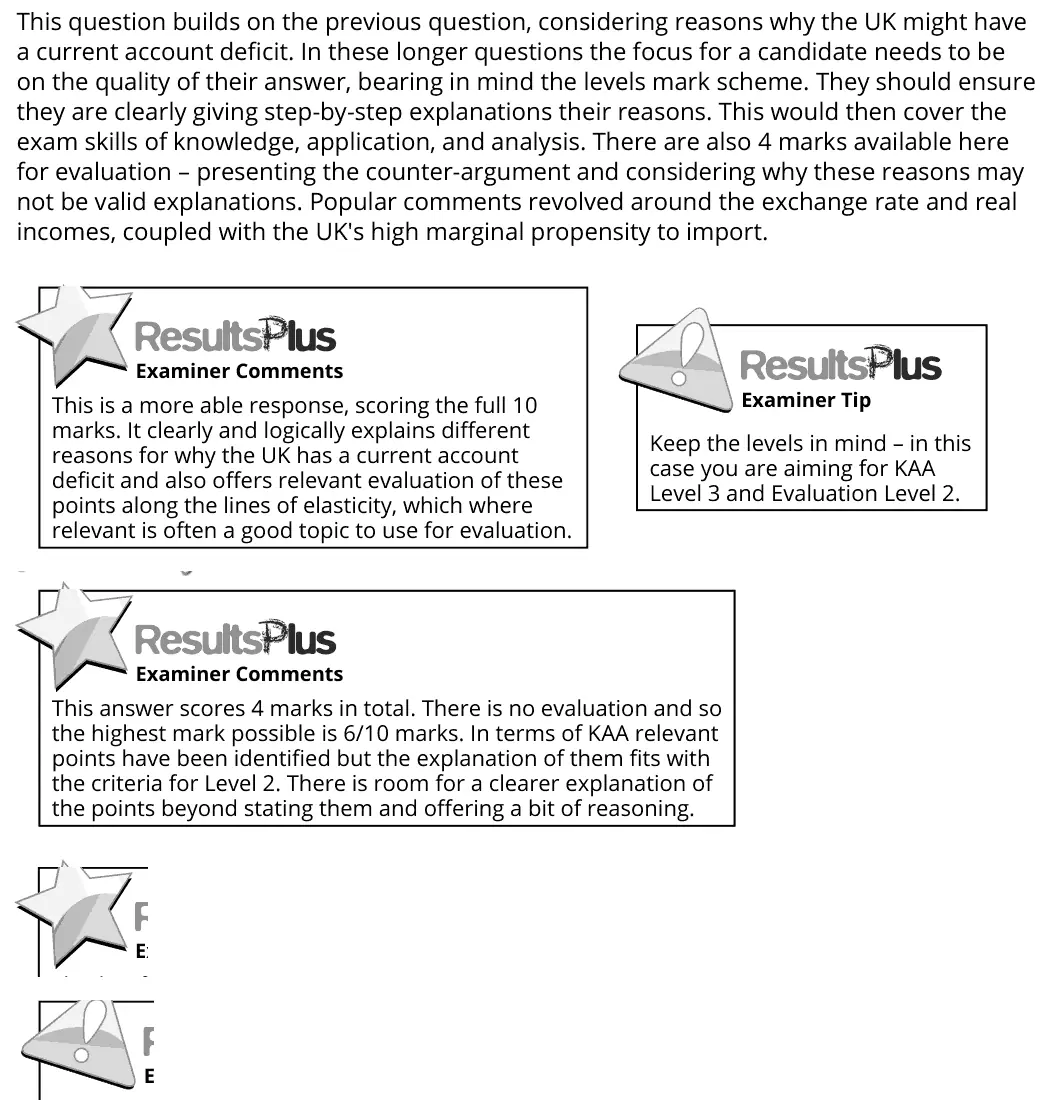
This question builds on the previous question, considering reasons why the UK might have a current account deficit. In these longer questions the focus for a candidate needs to be on the quality of their answer, bearing in mind the levels mark scheme. They should ensure they are clearly giving step-by-step explanations their reasons. This would then cover the exam skills of knowledge, application, and analysis. There are also 4 marks available here for evaluation – presenting the counter-argument and considering why these reasons may not be valid explanations. Popular comments revolved around the exchange rate and real incomes, coupled with the UK's high marginal propensity to import. Keep the levels in mind – in this case you are aiming for KAA Level 3 and Evaluation Level 2. This is a more able response, scoring the full 10 marks. It clearly and logically explains different reasons for why the UK has a current account deficit and also offers relevant evaluation of these points along the lines of elasticity, which where relevant is often a good topic to use for evaluation. This answer scores 4 marks in total. There is no evaluation and so the highest mark possible is 6/10 marks. In terms of KAA relevant points have been identified but the explanation of them fits with the criteria for Level 2. There is room for a clearer explanation of the points beyond stating them and offering a bit of reasoning.
Notes from the mark scheme and report
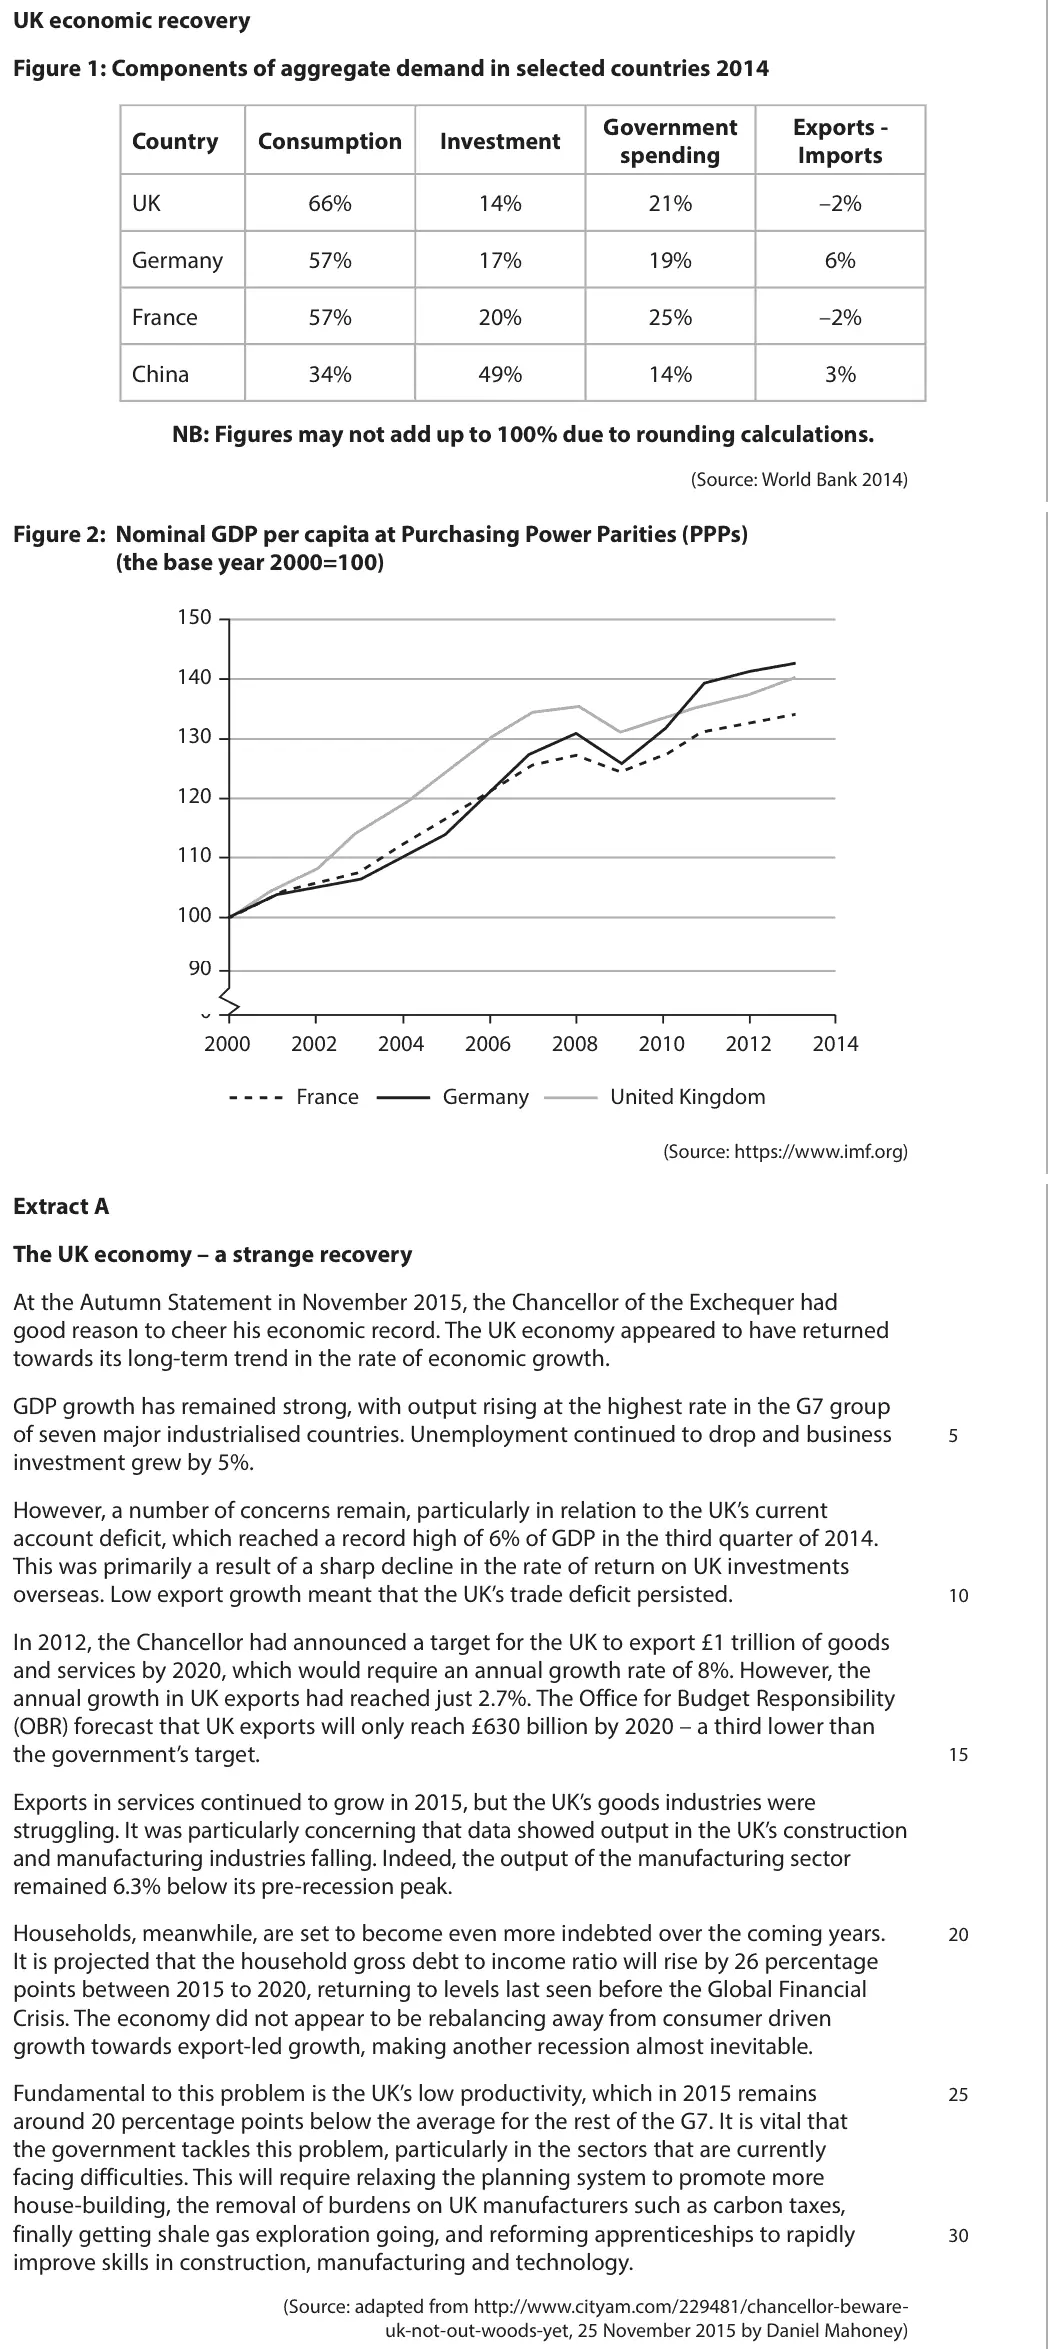
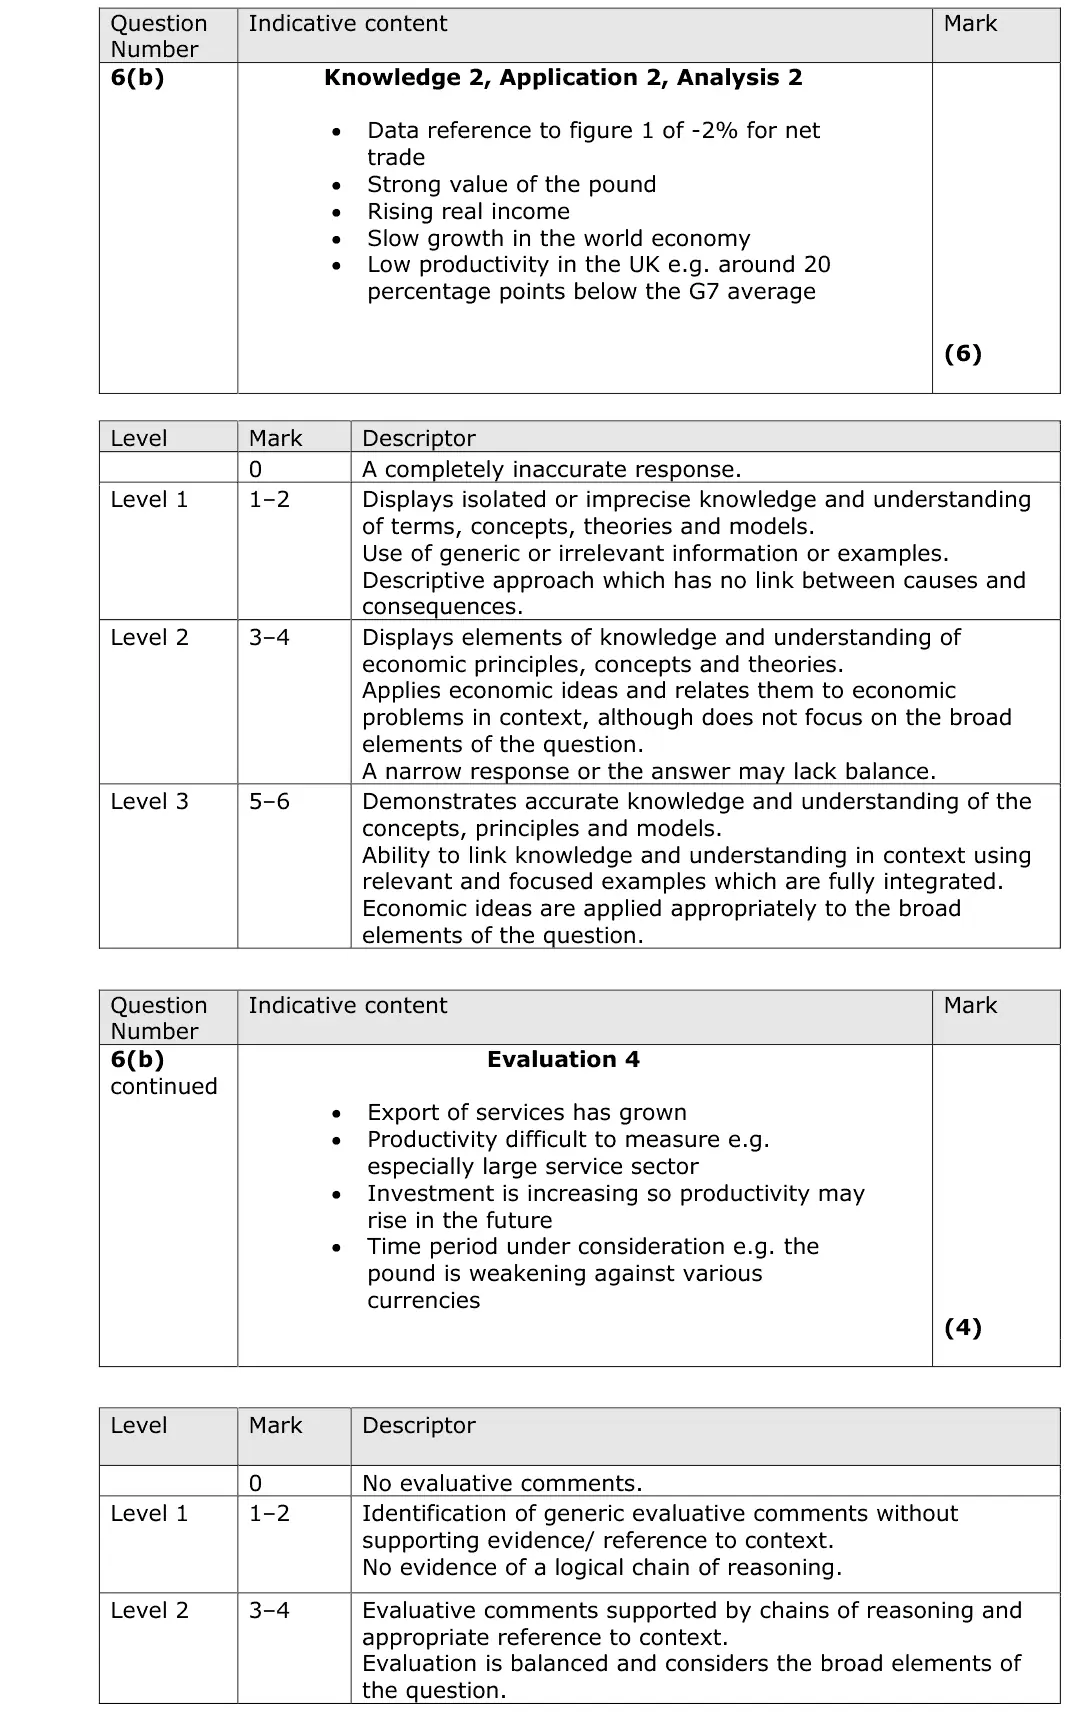
causes: strong pound, rising real incomes with a high propensity to import, slow world growth, low productivity (20 points below G7)
4 evaluation marks, e.g. elasticities
no evaluation caps the mark at 6
Quantitative skills: QS 9 (interpret, apply and analyse information in written, graphical tabular and numerical forms)
June 2017 · Paper 2 · Q6(c)10 marksAO1=2, AO2=2, AO3=2, AO4=410-mark response
Data and extracts for question 6
Mark scheme, including the levels grid and indicative content
Examiner's comment
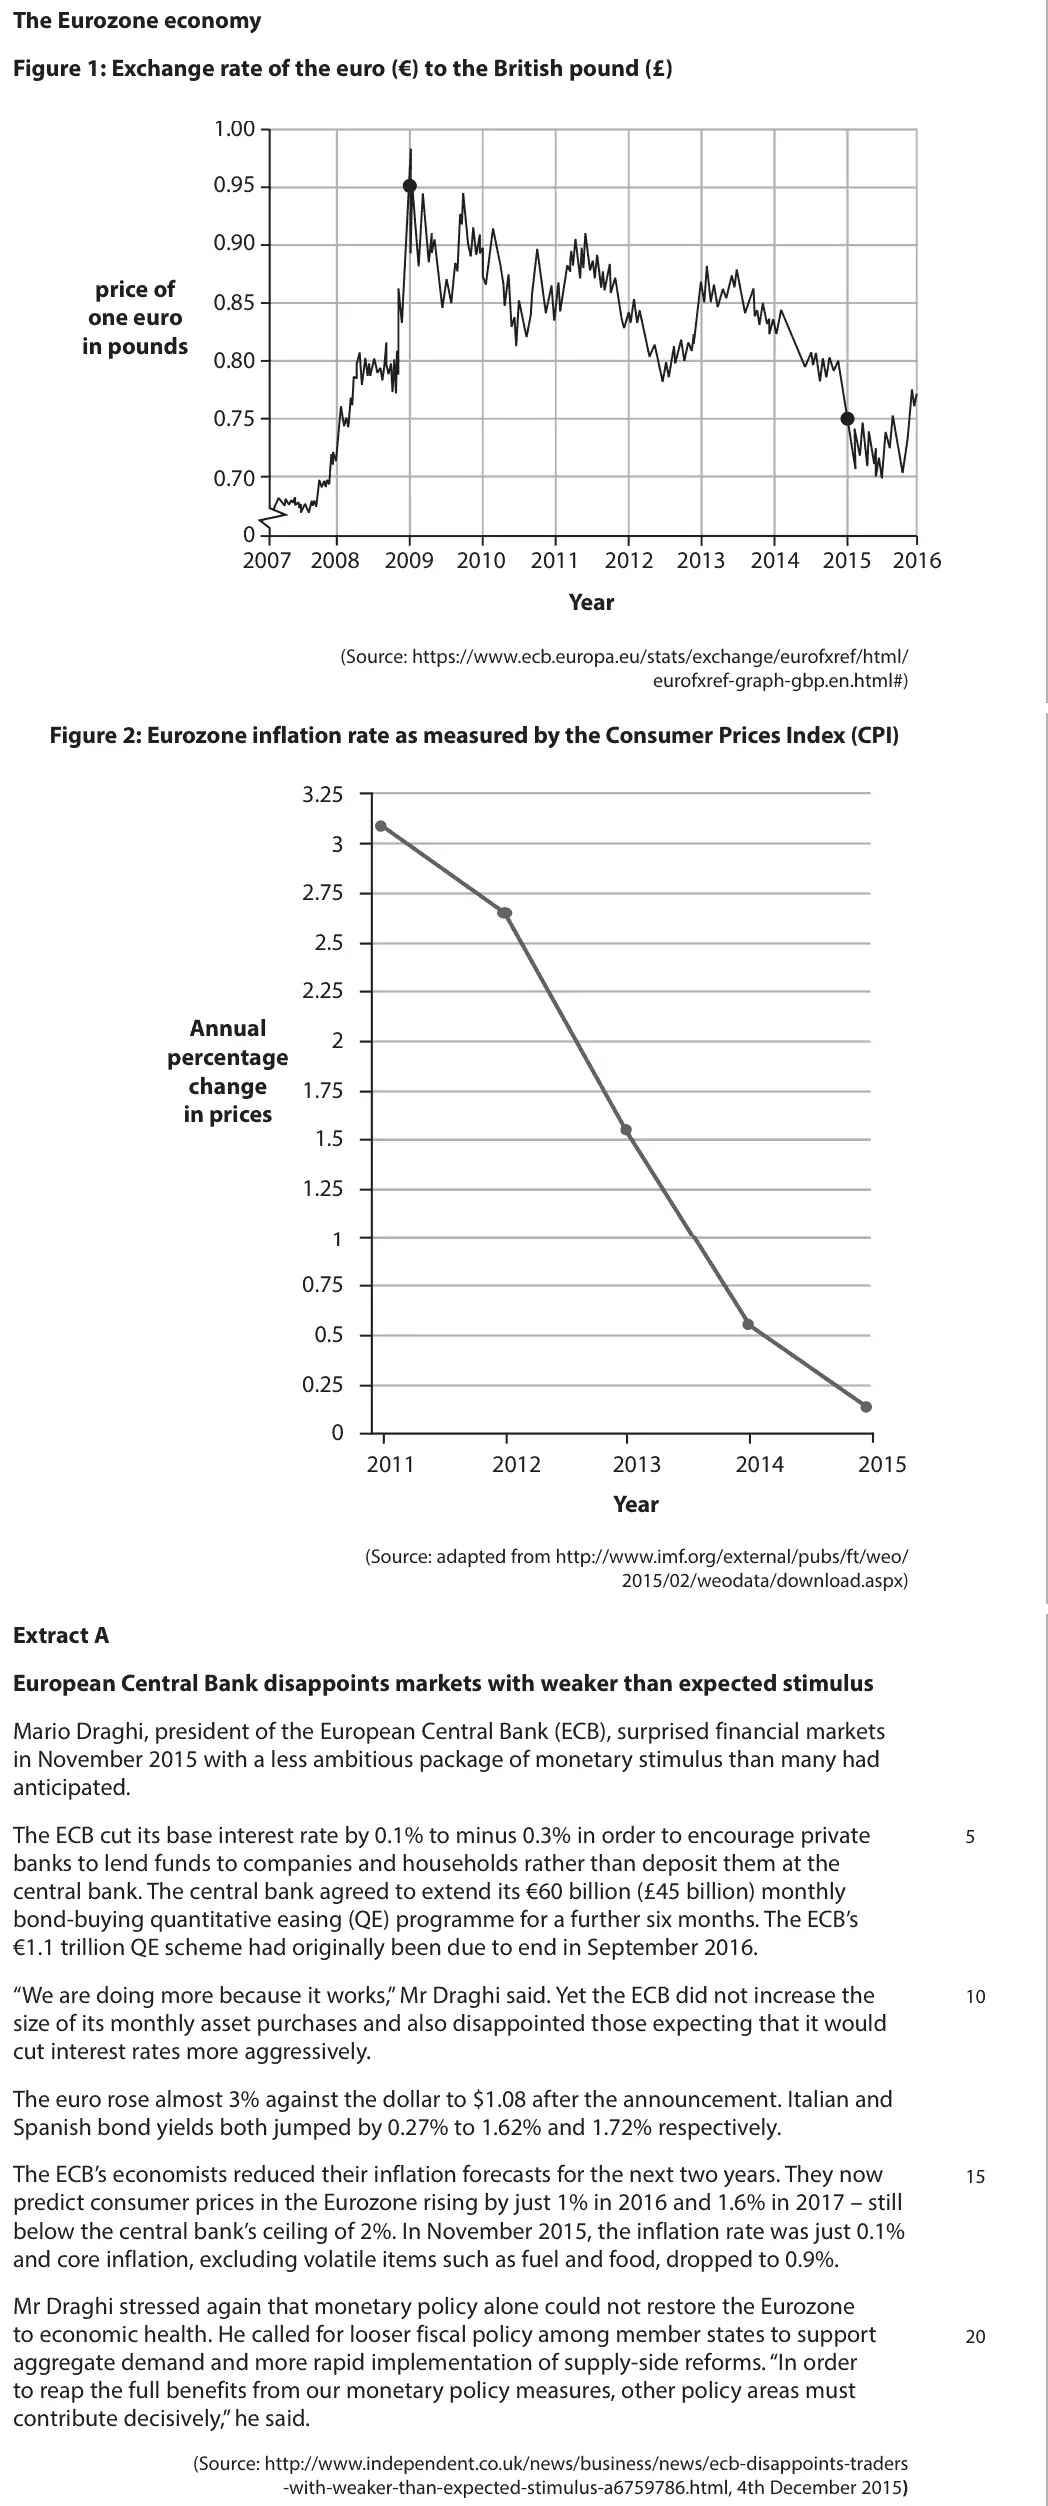
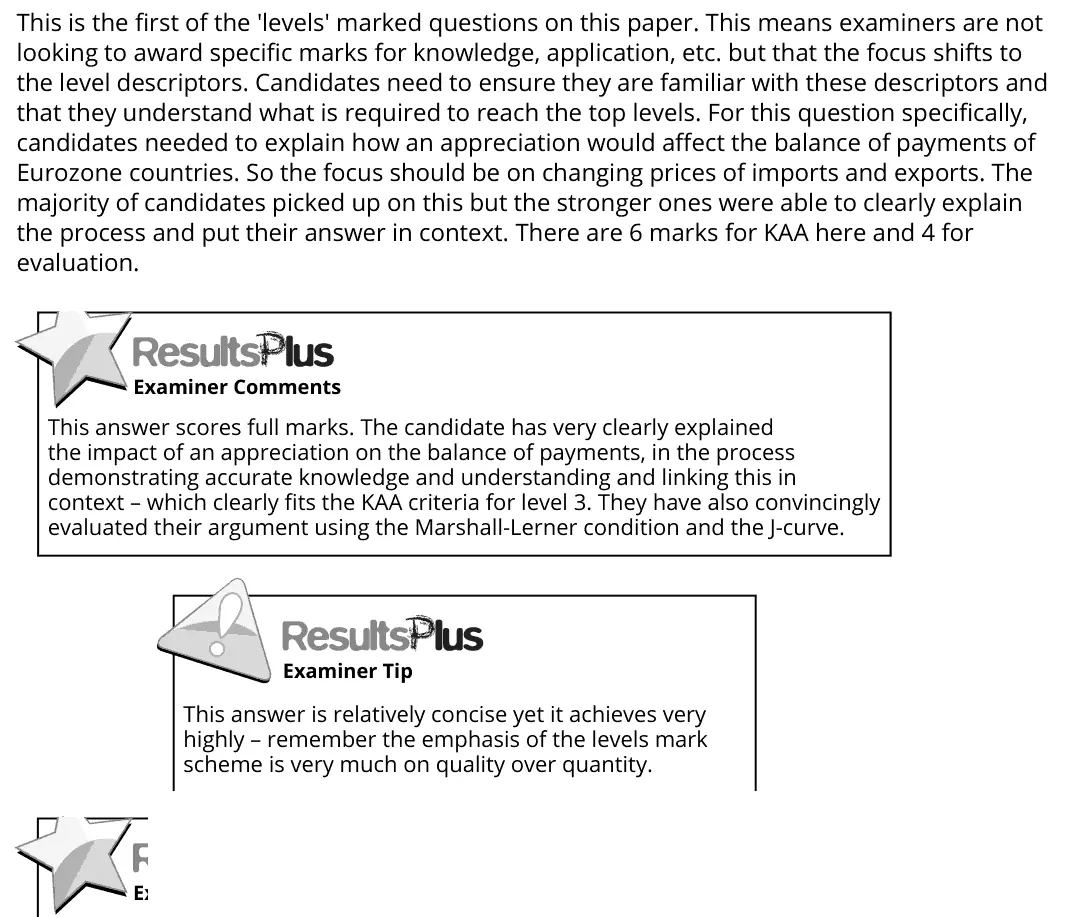
This is the first of the 'levels' marked questions on this paper. This means examiners are not looking to award specific marks for knowledge, application, etc. but that the focus shifts to the level descriptors. Candidates need to ensure they are familiar with these descriptors and that they understand what is required to reach the top levels. For this question specifically, candidates needed to explain how an appreciation would affect the balance of payments of Eurozone countries. So the focus should be on changing prices of imports and exports. The majority of candidates picked up on this but the stronger ones were able to clearly explain the process and put their answer in context. There are 6 marks for KAA here and 4 for evaluation. This answer scores full marks. The candidate has very clearly explained the impact of an appreciation on the balance of payments, in the process demonstrating accurate knowledge and understanding and linking this in context – which clearly fits the KAA criteria for level 3. They have also convincingly evaluated their argument using the Marshall-Lerner condition and the J-curve. This answer is relatively concise yet it achieves very highly – remember the emphasis of the levels mark scheme is very much on quality over quantity.
Notes from the mark scheme and report
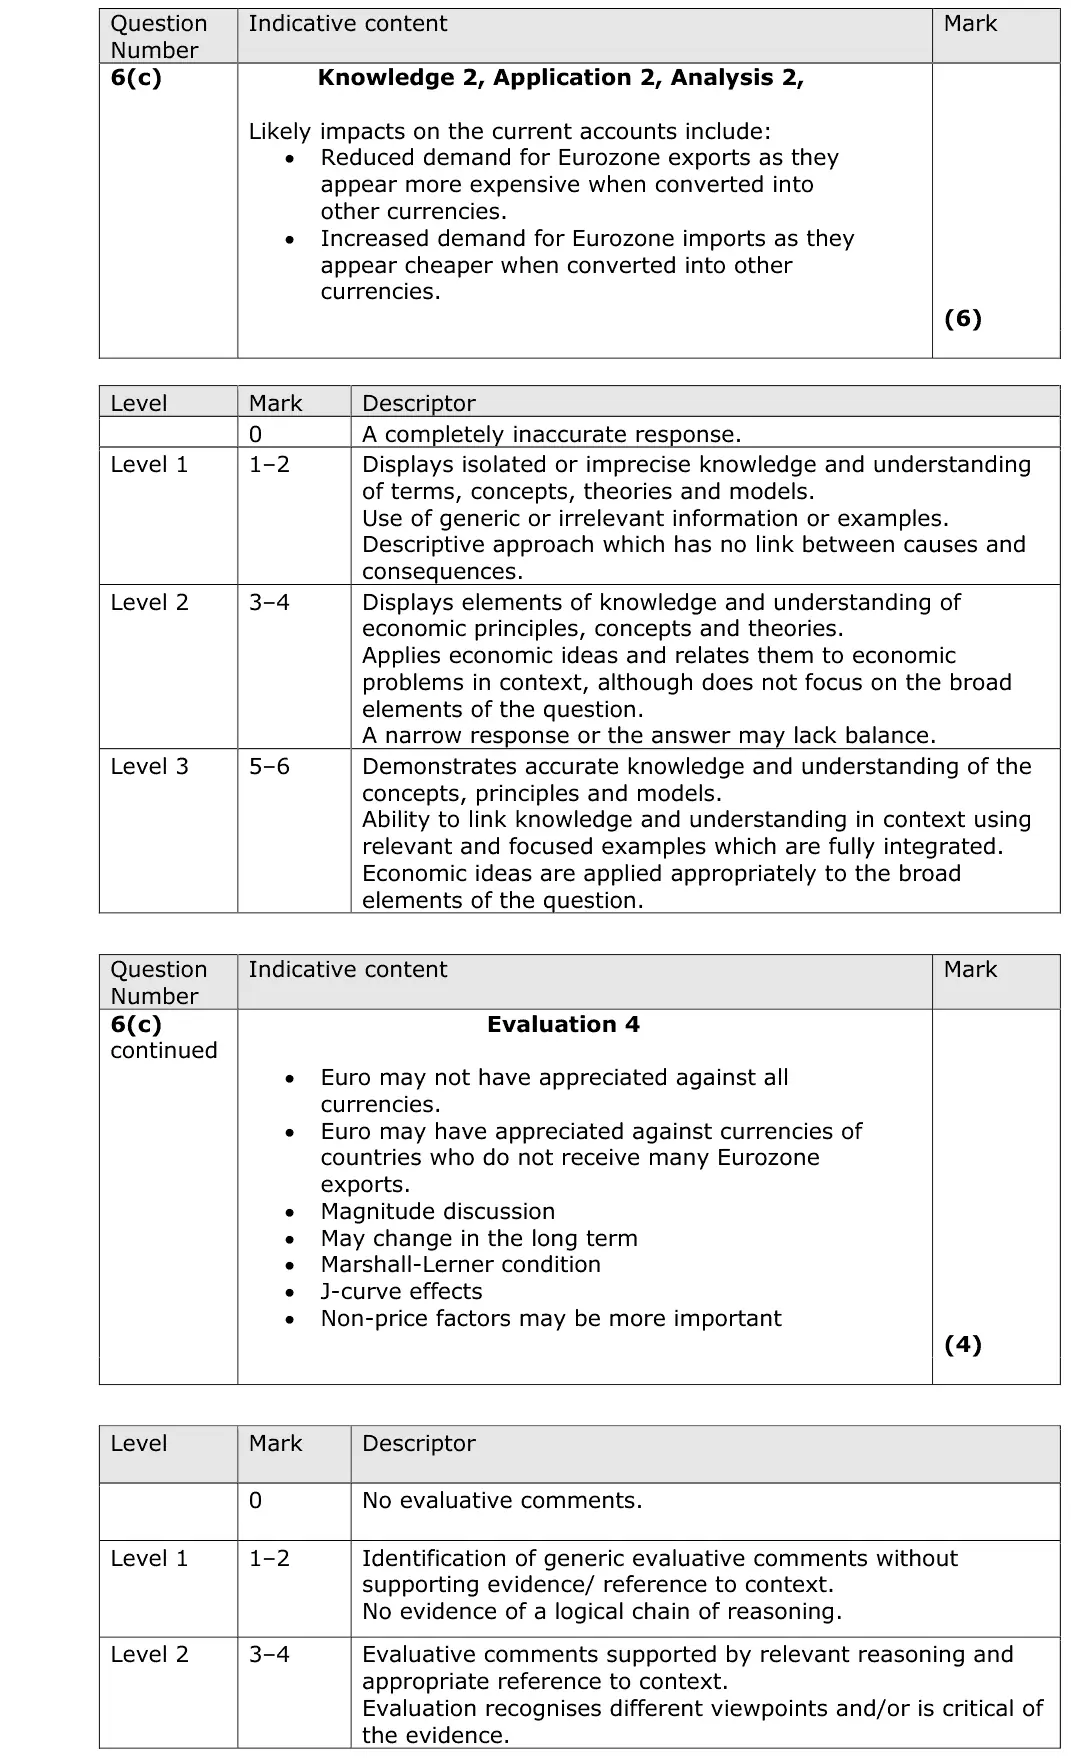
appreciation makes exports dearer and imports cheaper so the current account worsens
evaluate with the Marshall-Lerner condition, J-curve, price elasticities, non-price factors and which currencies it rose against
June 2016 · AS Paper 2 · Q4(a)1 markMultiple choice
Data and extracts for question 4
Answer
D
Mark scheme
Notes from the mark scheme and report
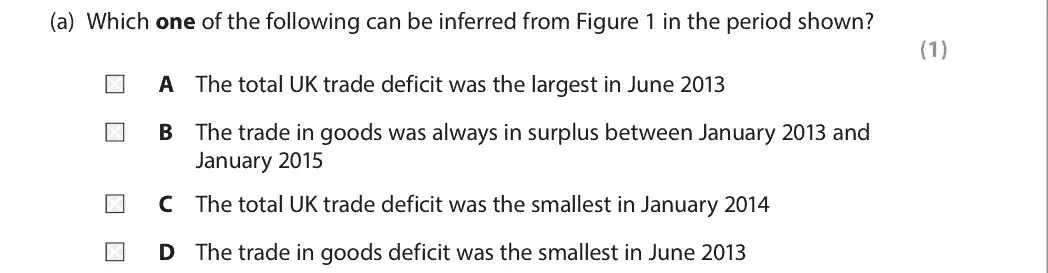
answer D (options not shown in the crop and the mark scheme gives only the letter)
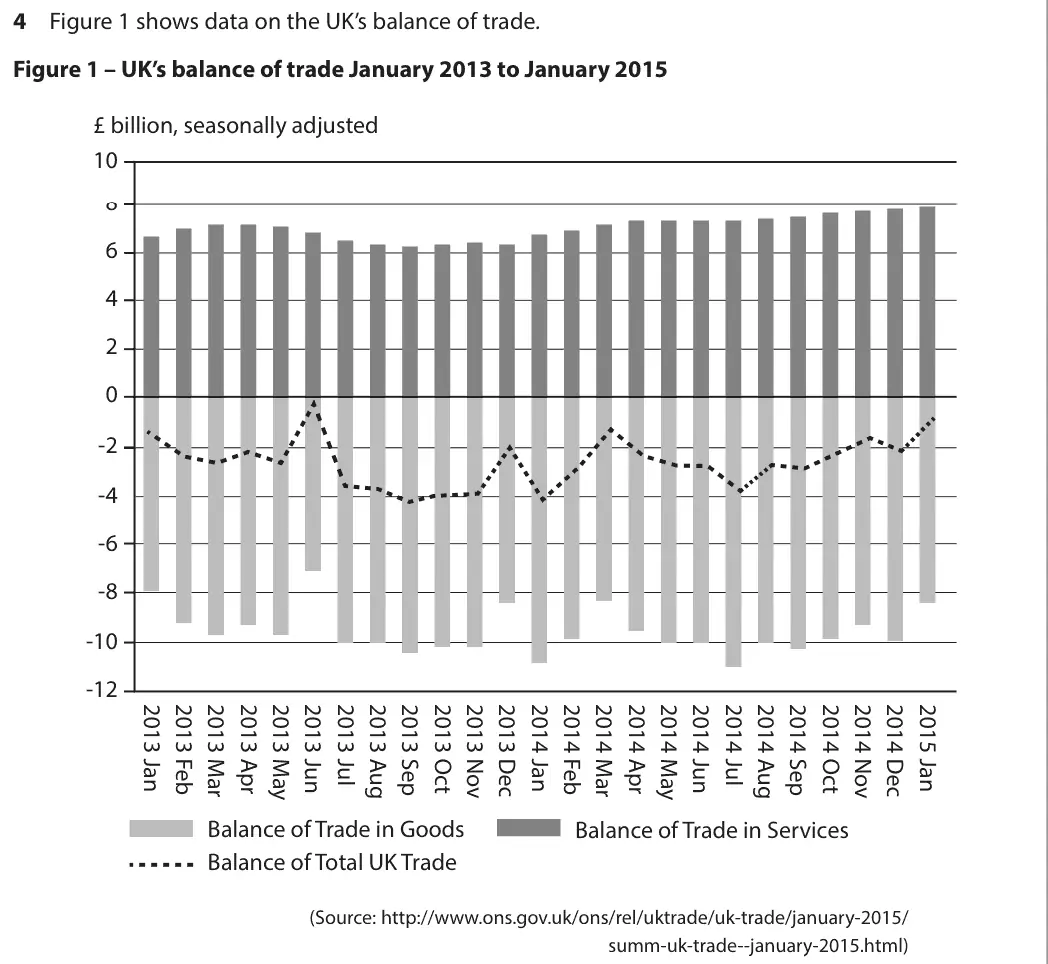
read the seasonally adjusted goods deficit, services surplus and total balance in Figure 1
Quantitative skills: QS 12 (understand the meaning of seasonally adjusted figures); QS 4 (construct and interpret a range of standard graphical forms); QS 9 (interpret, apply and analyse information in written, graphical tabular and numerical forms)
June 2016 · AS Paper 2 · Q4(b)3 marksAO1=1, AO2=1, AO3=1Short answer
Data and extracts for question 4
Mark scheme
Examiner's comment
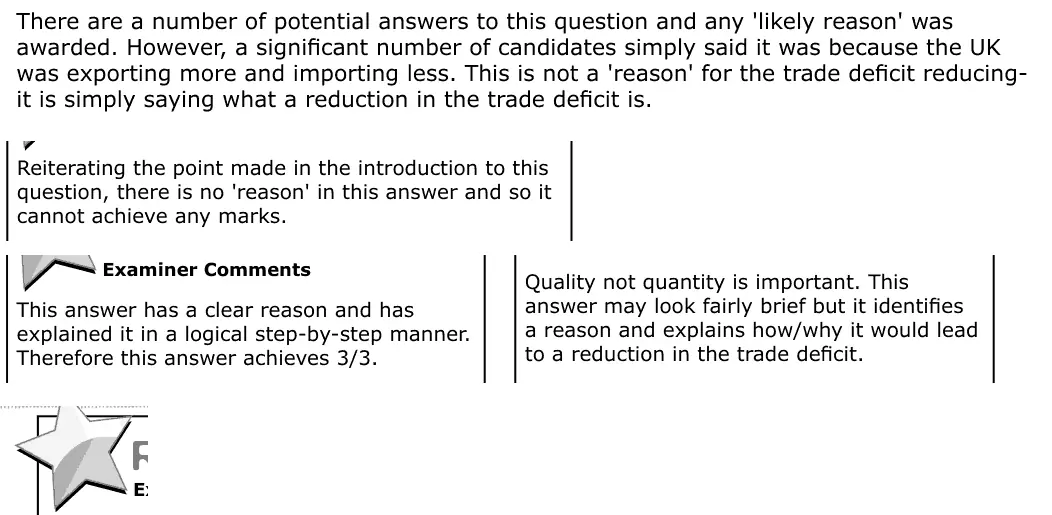
There are a number of potential answers to this question and any 'likely reason' was awarded. However, a significant number of candidates simply said it was because the UK was exporting more and importing less. This is not a 'reason' for the trade deficit reducing- it is simply saying what a reduction in the trade deficit is. Reiterating the point made in the introduction to this question, there is no 'reason' in this answer and so it cannot achieve any marks. This answer has a clear reason and has explained it in a logical step-by-step manner. Therefore this answer achieves 3/3. Quality not quantity is important. This answer may look fairly brief but it identifies a reason and explains how/why it would lead to a reduction in the trade deficit.
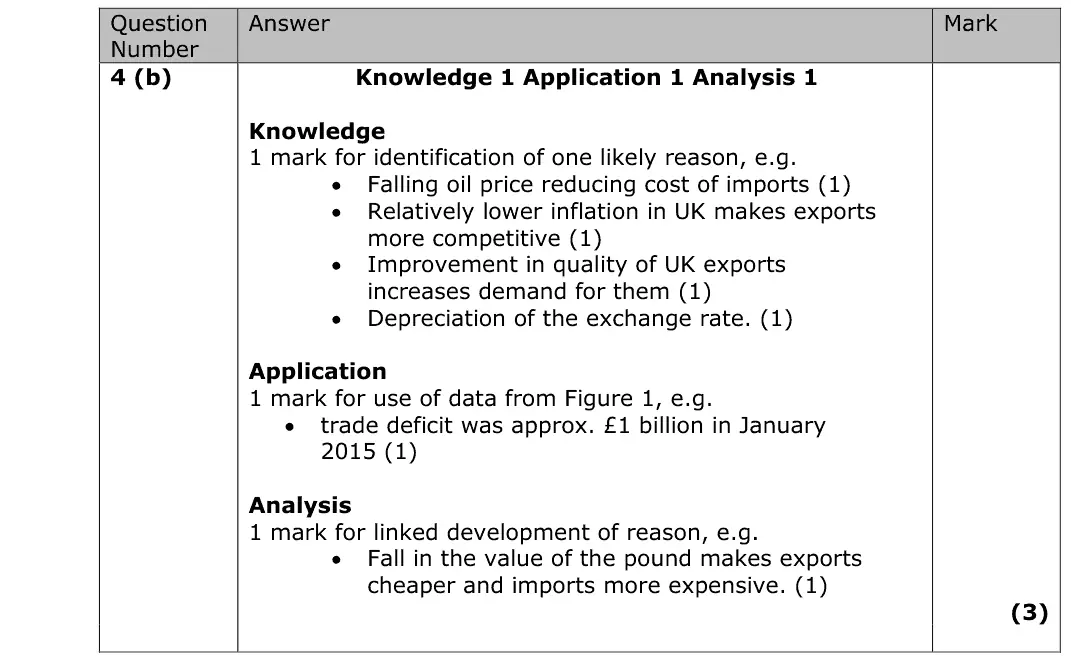
Notes from the mark scheme and report
a reason (falling oil price cutting import costs, relatively low UK inflation, depreciation, better export quality) explained step by step
quote the deficit of about £1 billion in January 2015
report: many just said exports rose and imports fell, which is a description not a reason
Quantitative skills: QS 9 (interpret, apply and analyse information in written, graphical tabular and numerical forms)
Work with an Edexcel economics tutor
Essays stuck in Level 2, or losing the easy marks in Section A? Book a trial session with Lianne, a former Edexcel examiner.