Notes and key-term cards for this topic are being written by our tutors. The past-paper questions below are ready now.
Specification statements
2.6.3Supply-side policies: a) Distinction between market-based and interventionist methods b) Market-based and interventionist policies: • to increase incentives • to promote competition • to reform the labour market • to improve skills and quality of the labour force • to improve infrastructure c) Use of AD/AS diagrams to illustrate supply-side policies d) Strengths and weaknesses of supply-side policiesAS
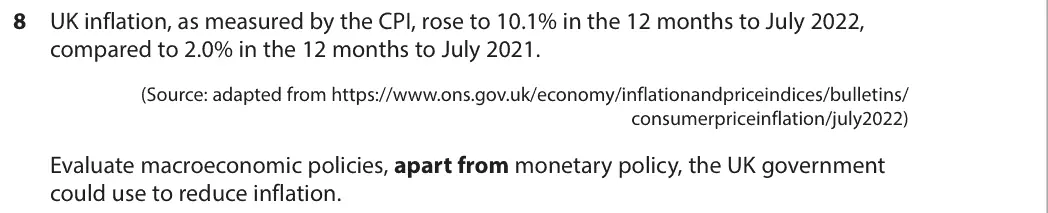
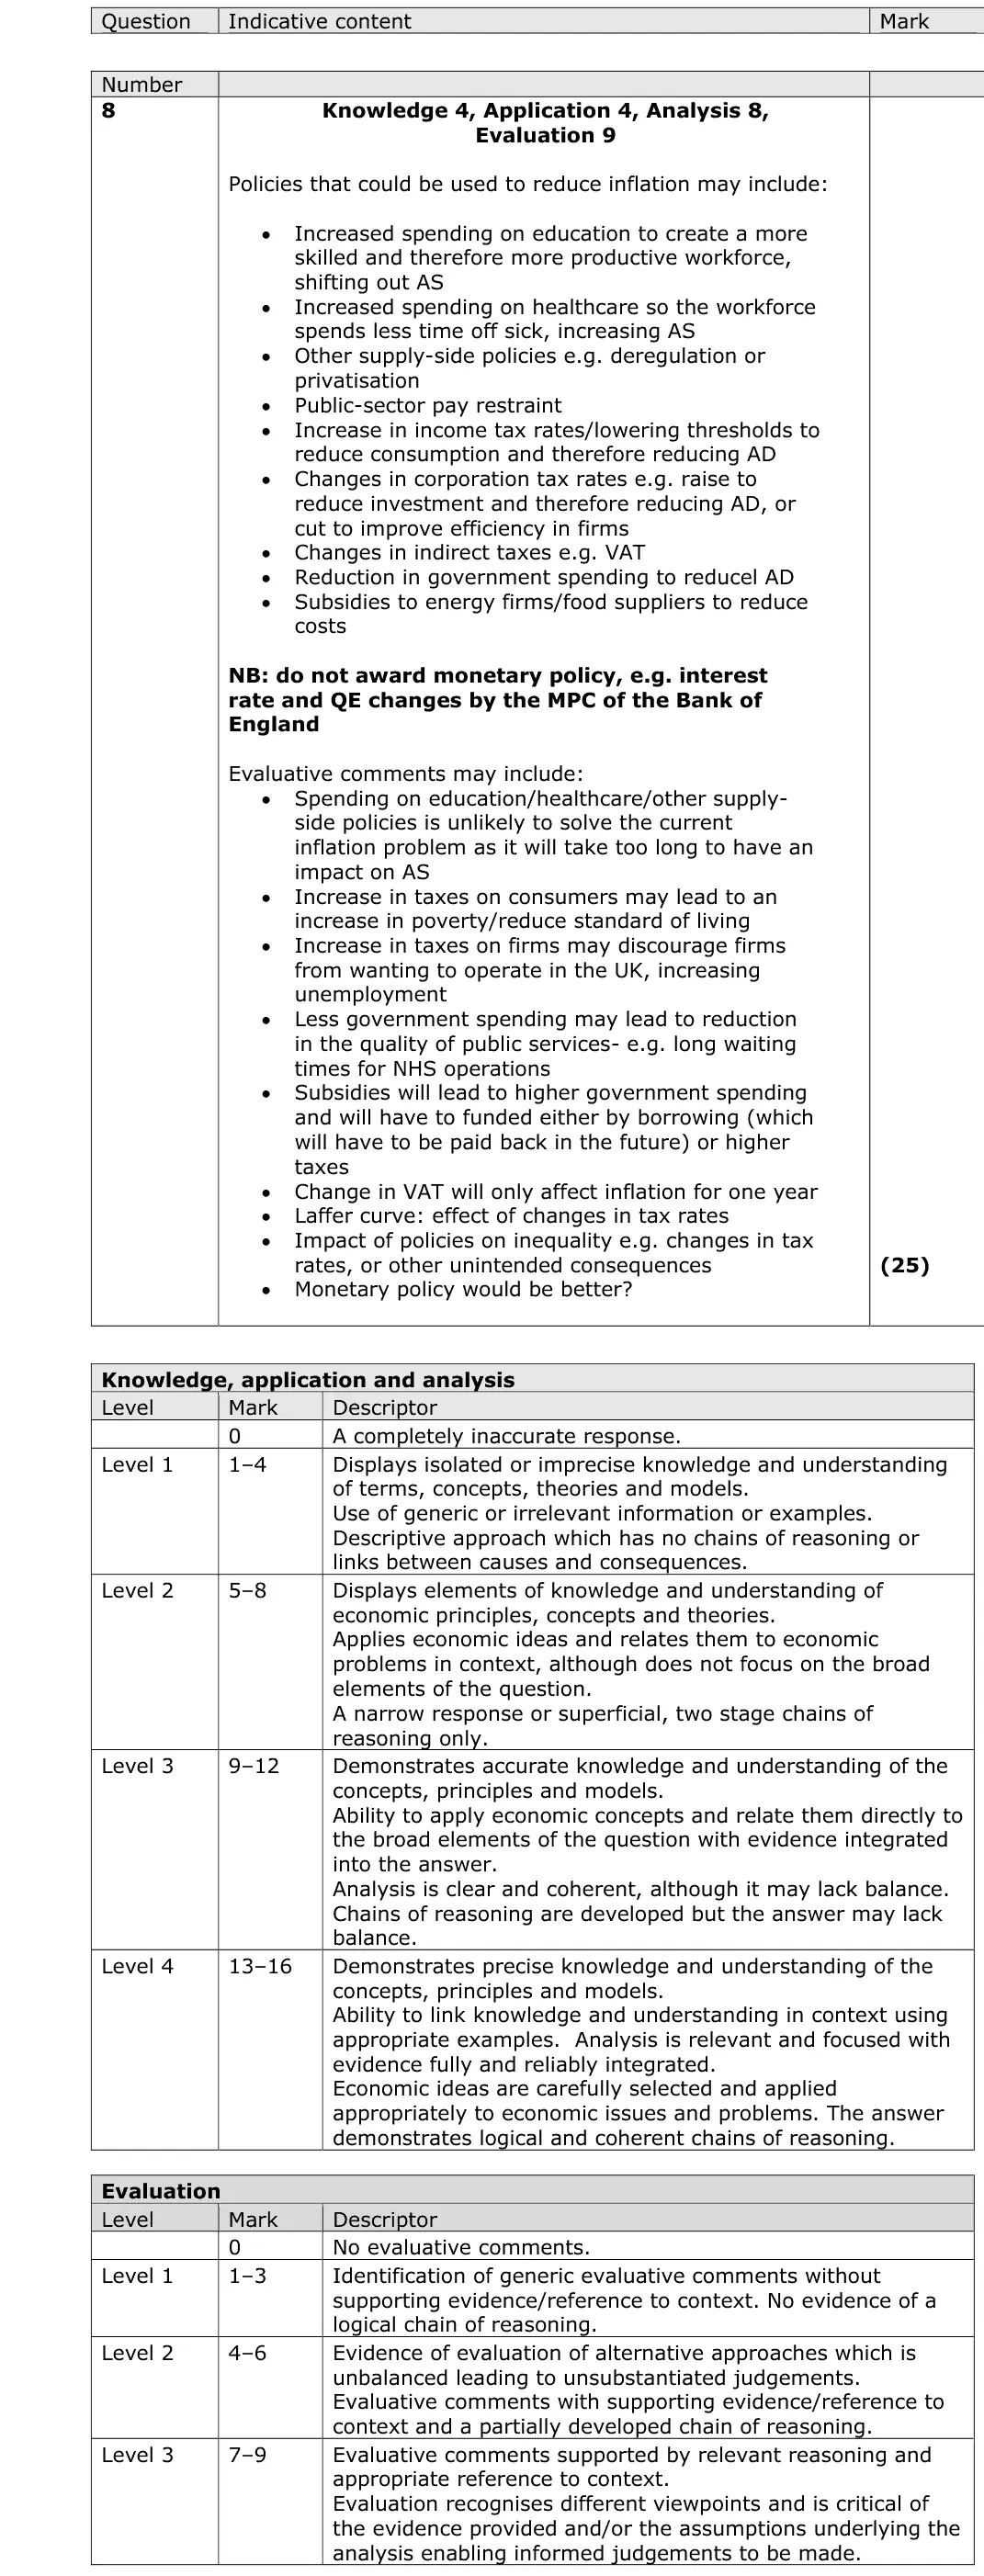
UK inflation, as measured by the CPI, rose to 10.1% in the 12 months to July 2022, compared to 2.0% in the 12 months to July 2021. (Source: adapted from https://www.ons.gov.uk/economy/inflationandpriceindices/bulletins/ consumerpriceinflation/july2022) Evaluate macroeconomic policies, apart from monetary policy, the UK government could use to reduce inflation.
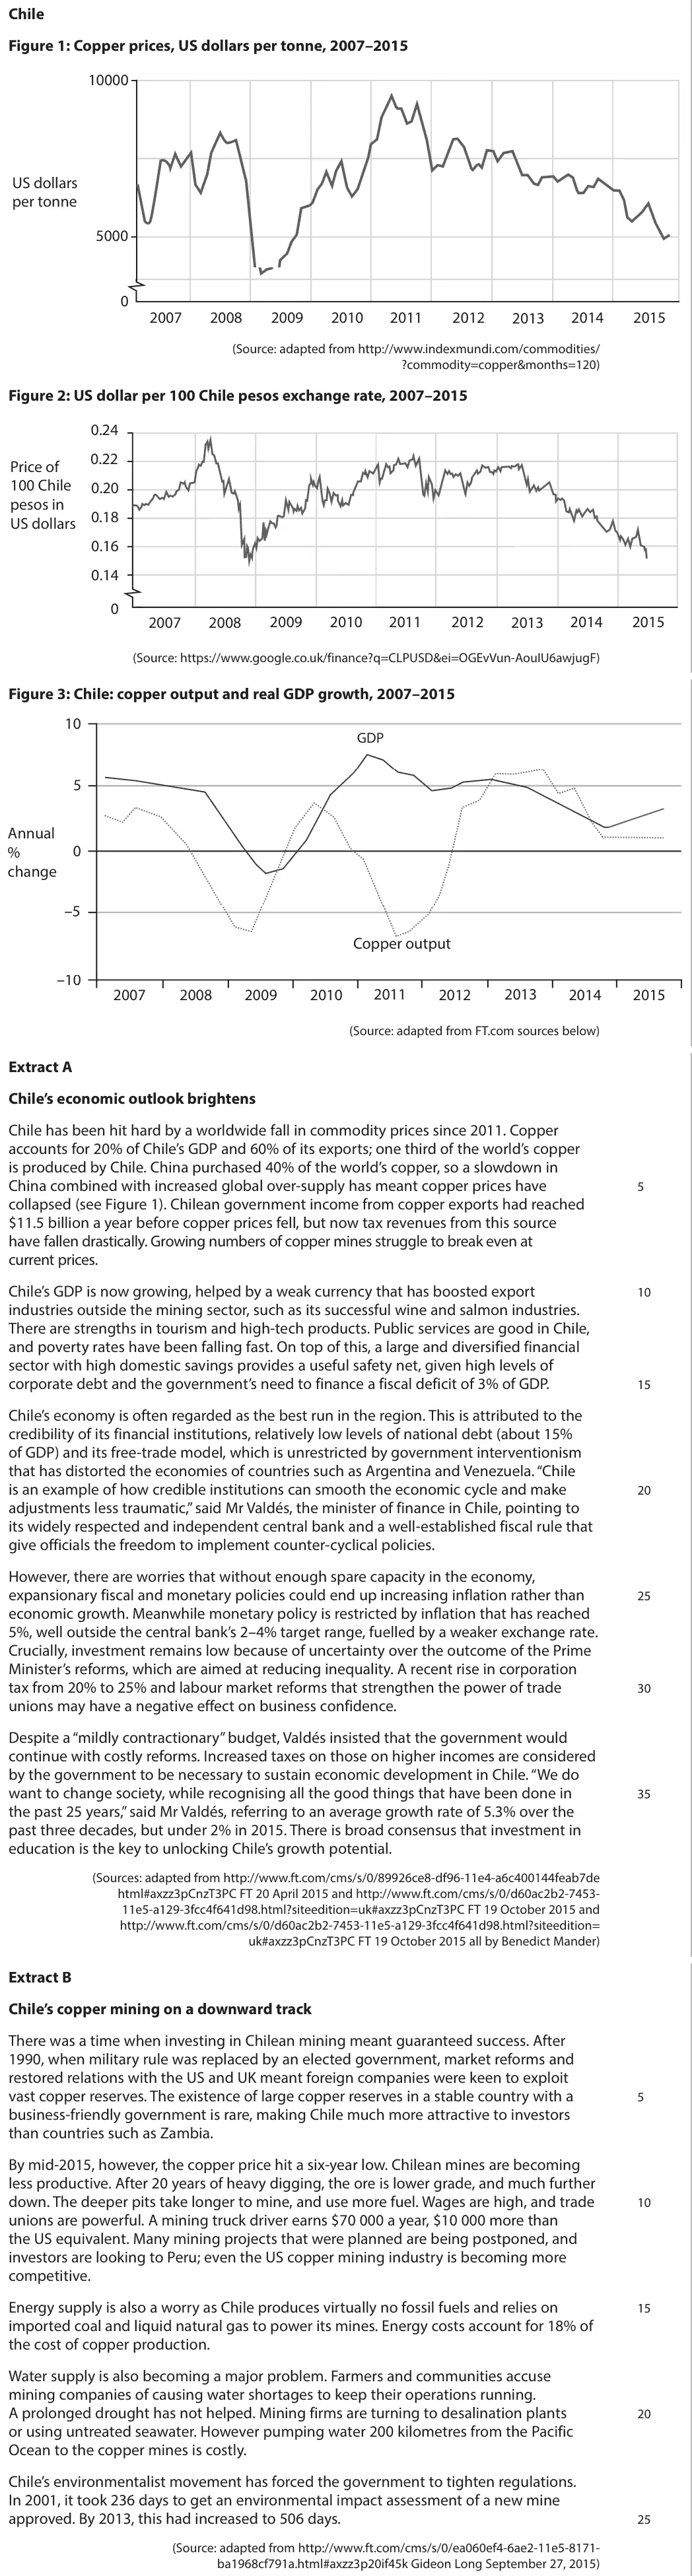
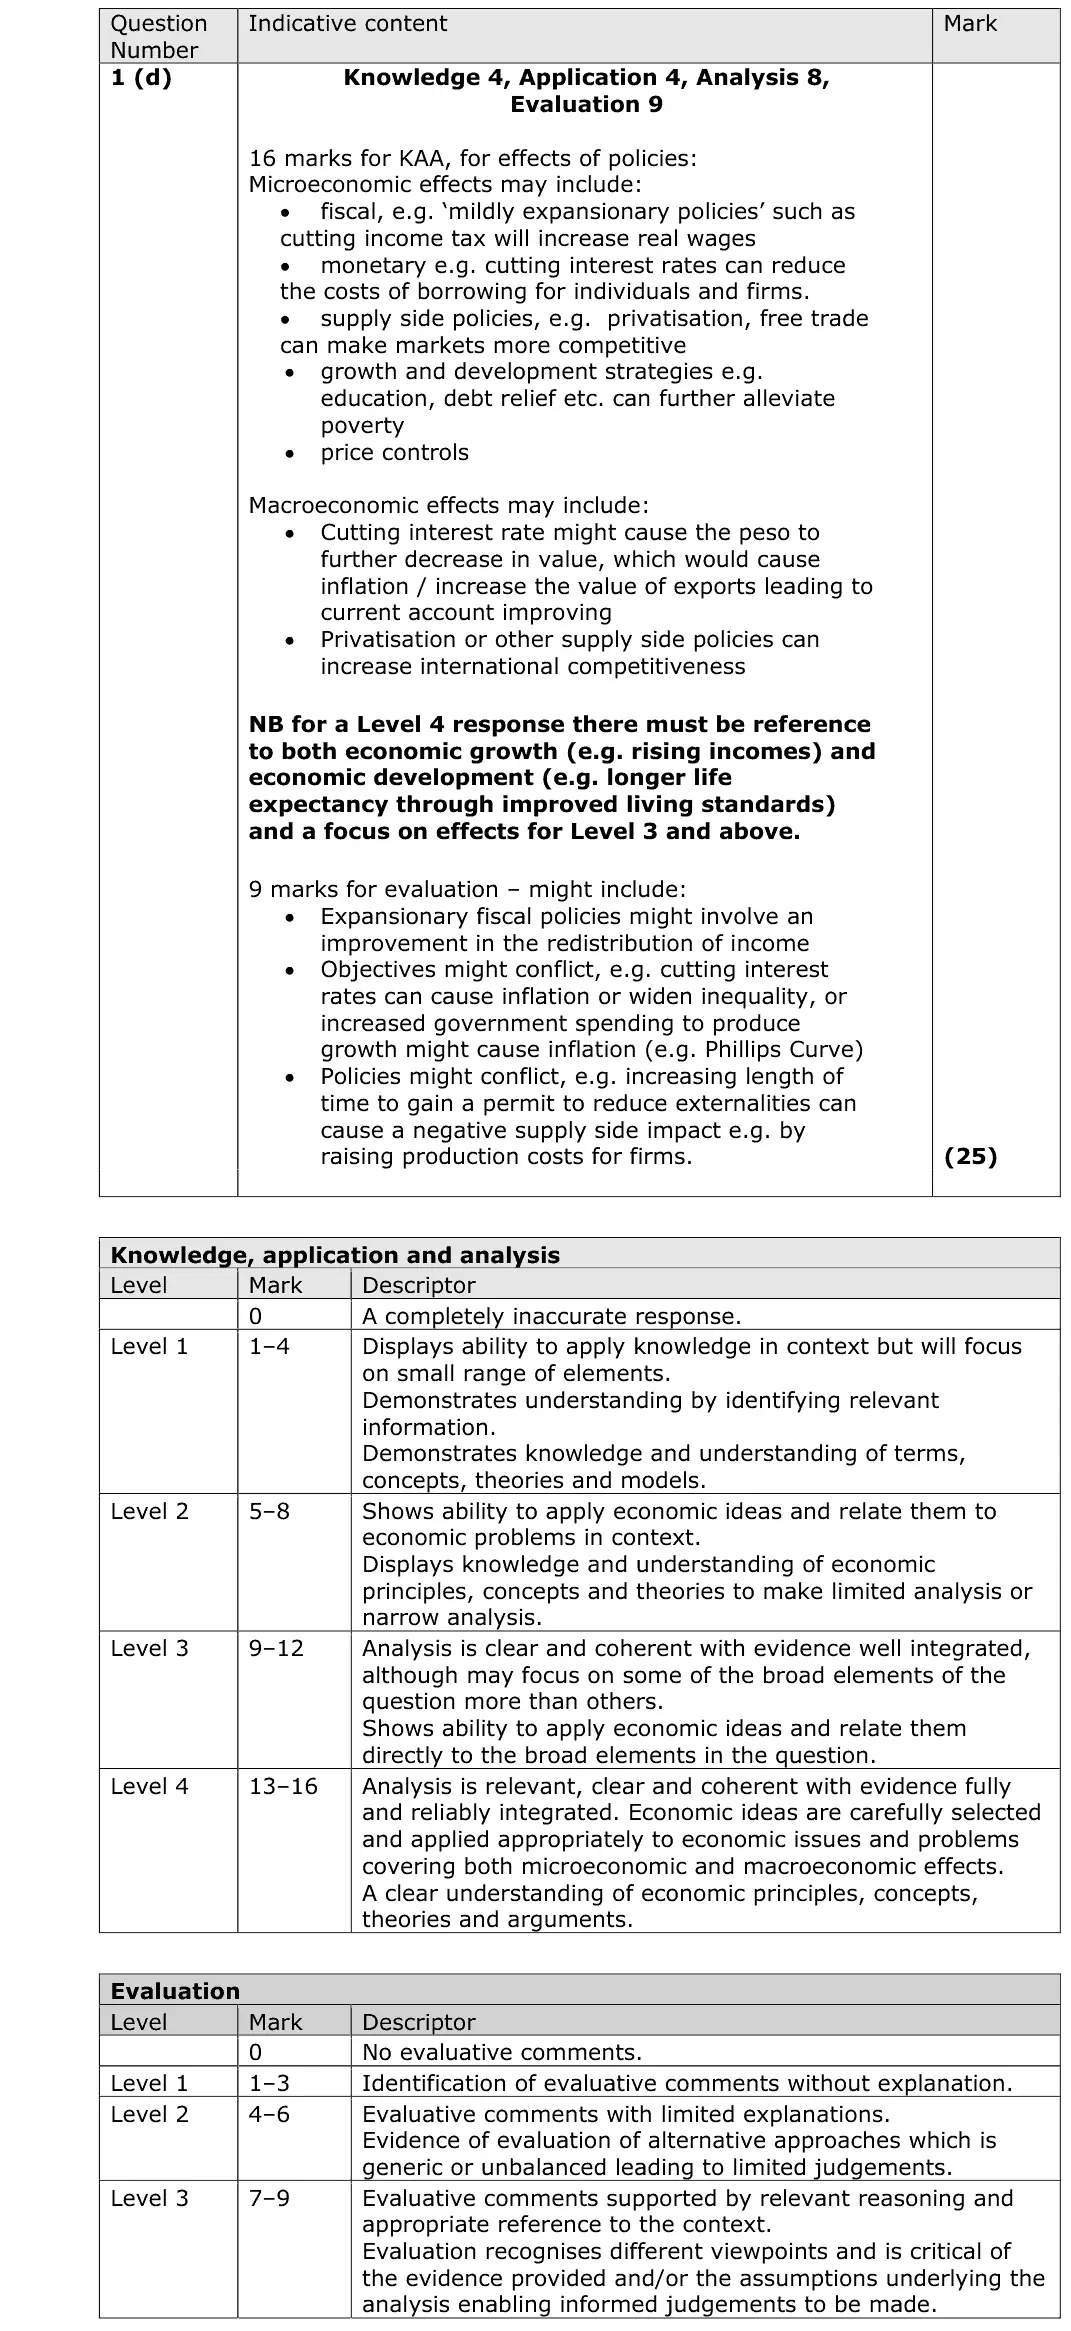
With reference to the information provided and your own knowledge, evaluate the microeconomic and macroeconomic effects of policies that could be used to stimulate economic growth and development in Chile.
Tap a question to zoom it. The data and extracts fold out above each question; the mark scheme and examiner's comment open underneath.
June 2025 · Paper 2 · Q6(e)15 marksAO1=3, AO2=3, AO3=3, AO4=615-mark response
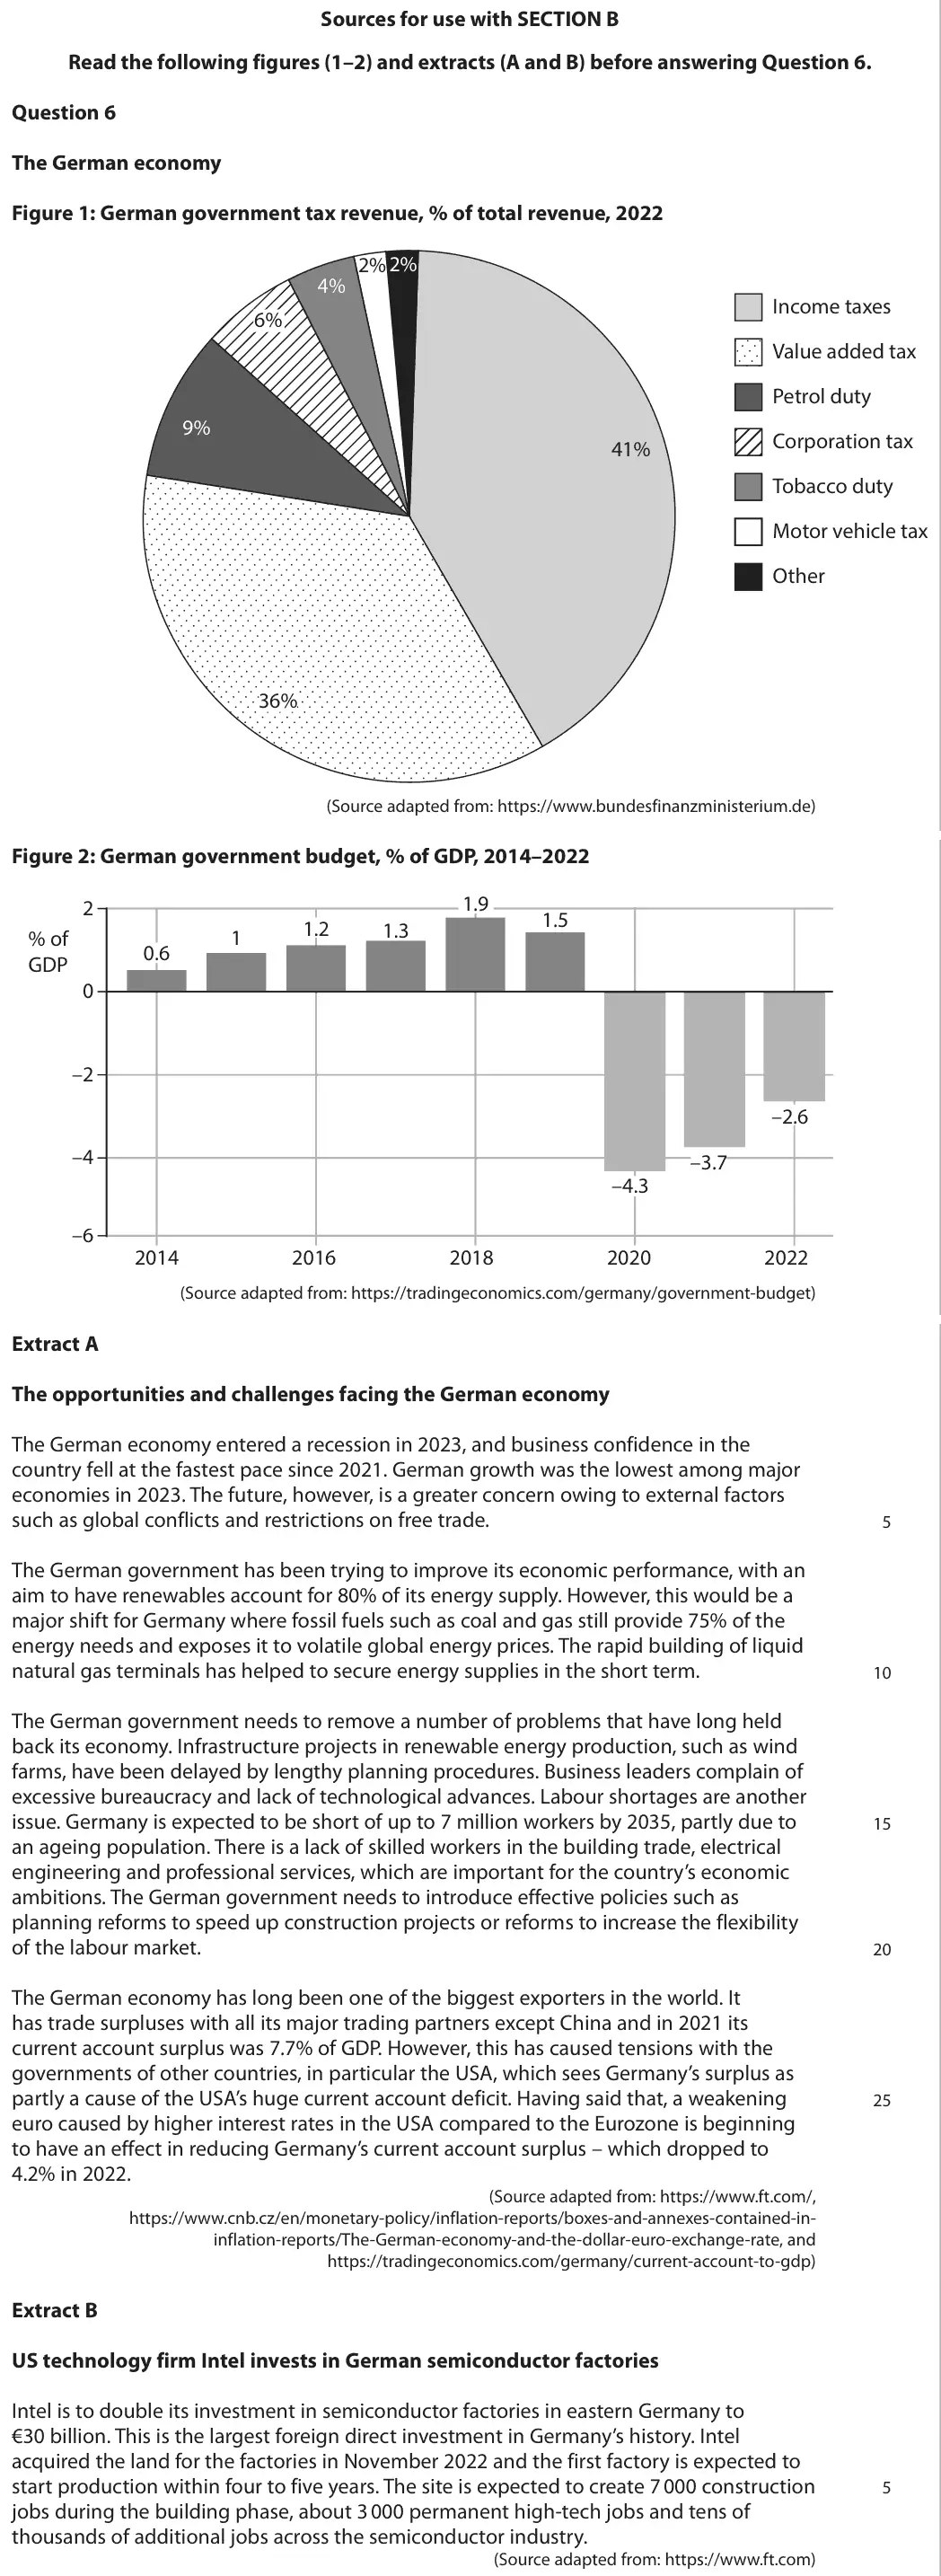
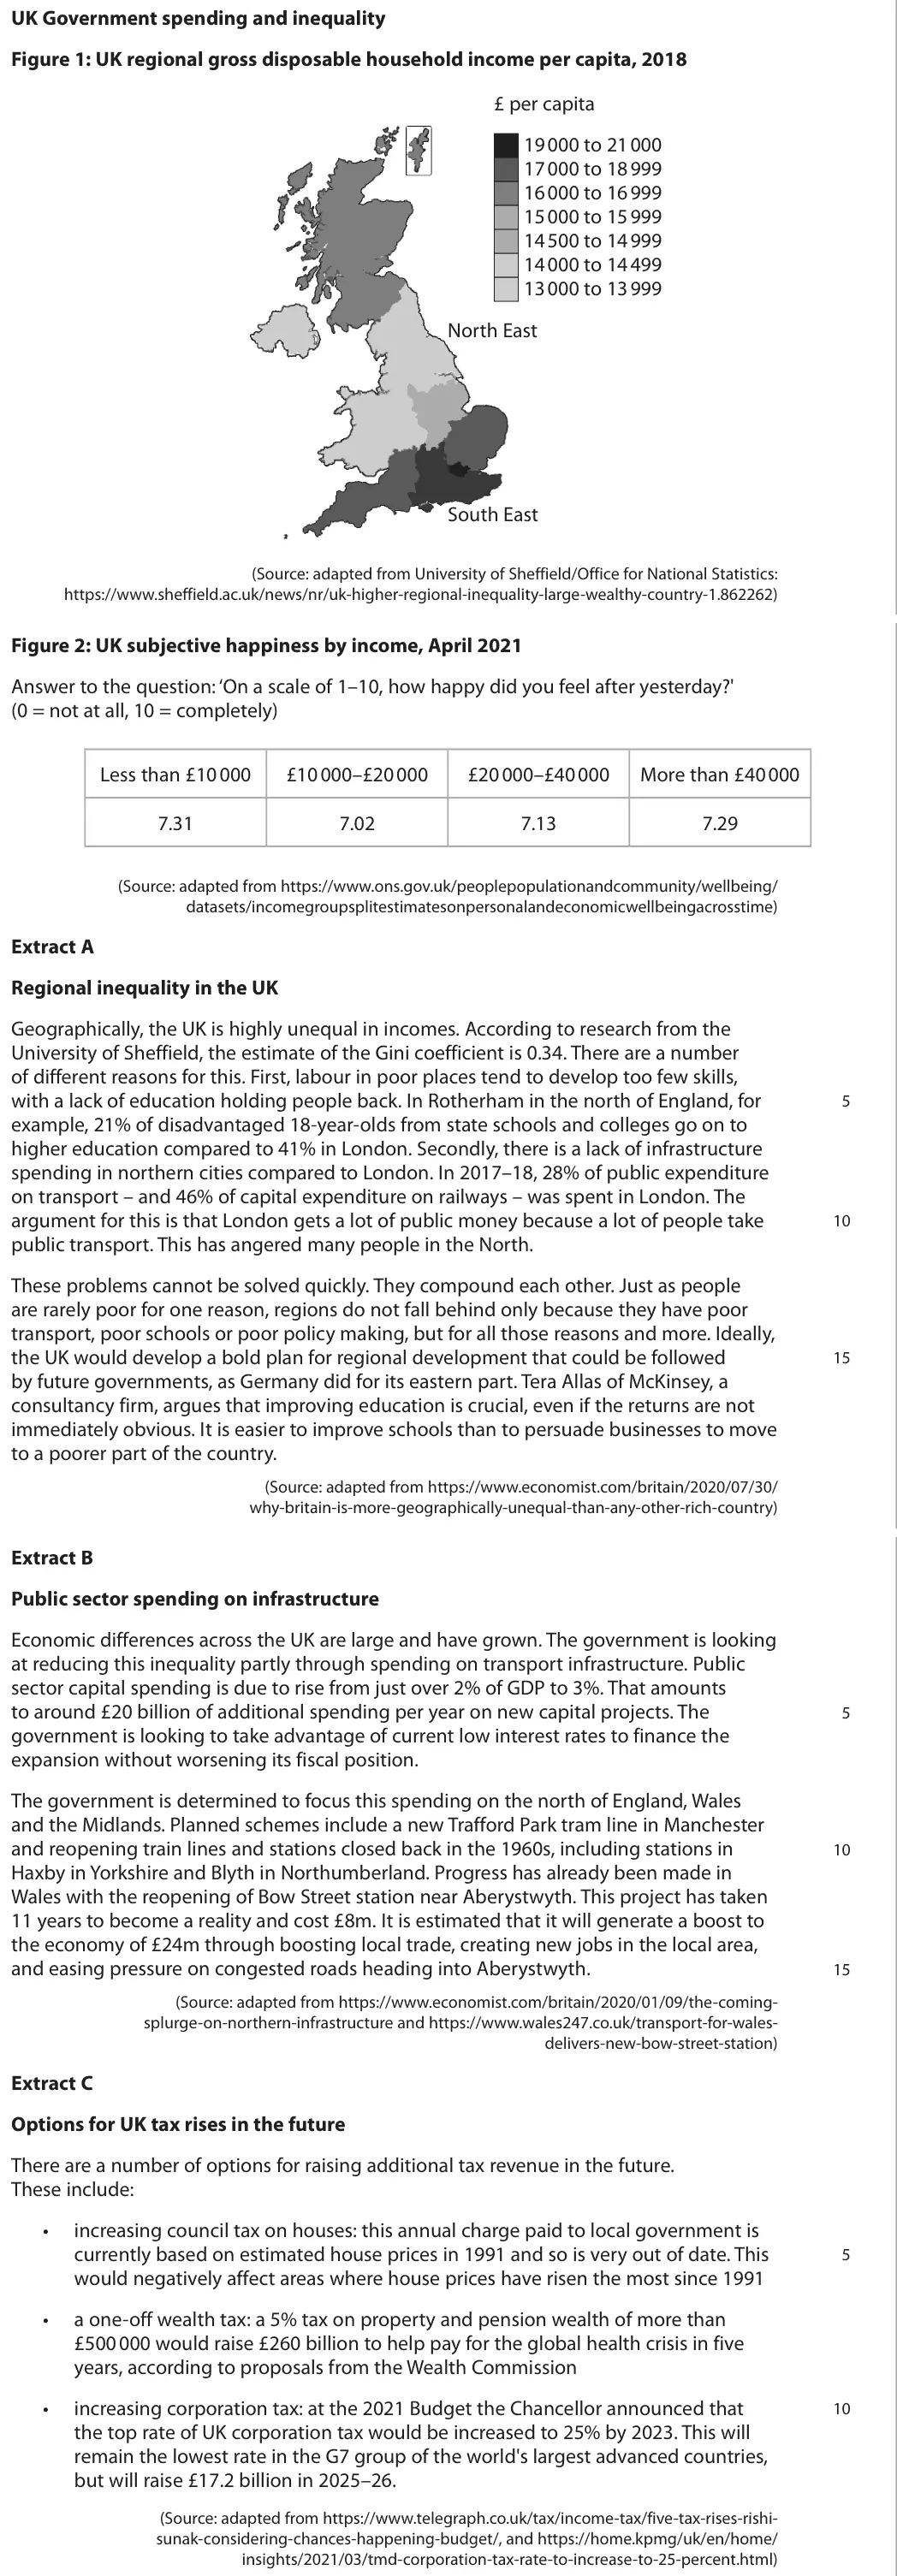
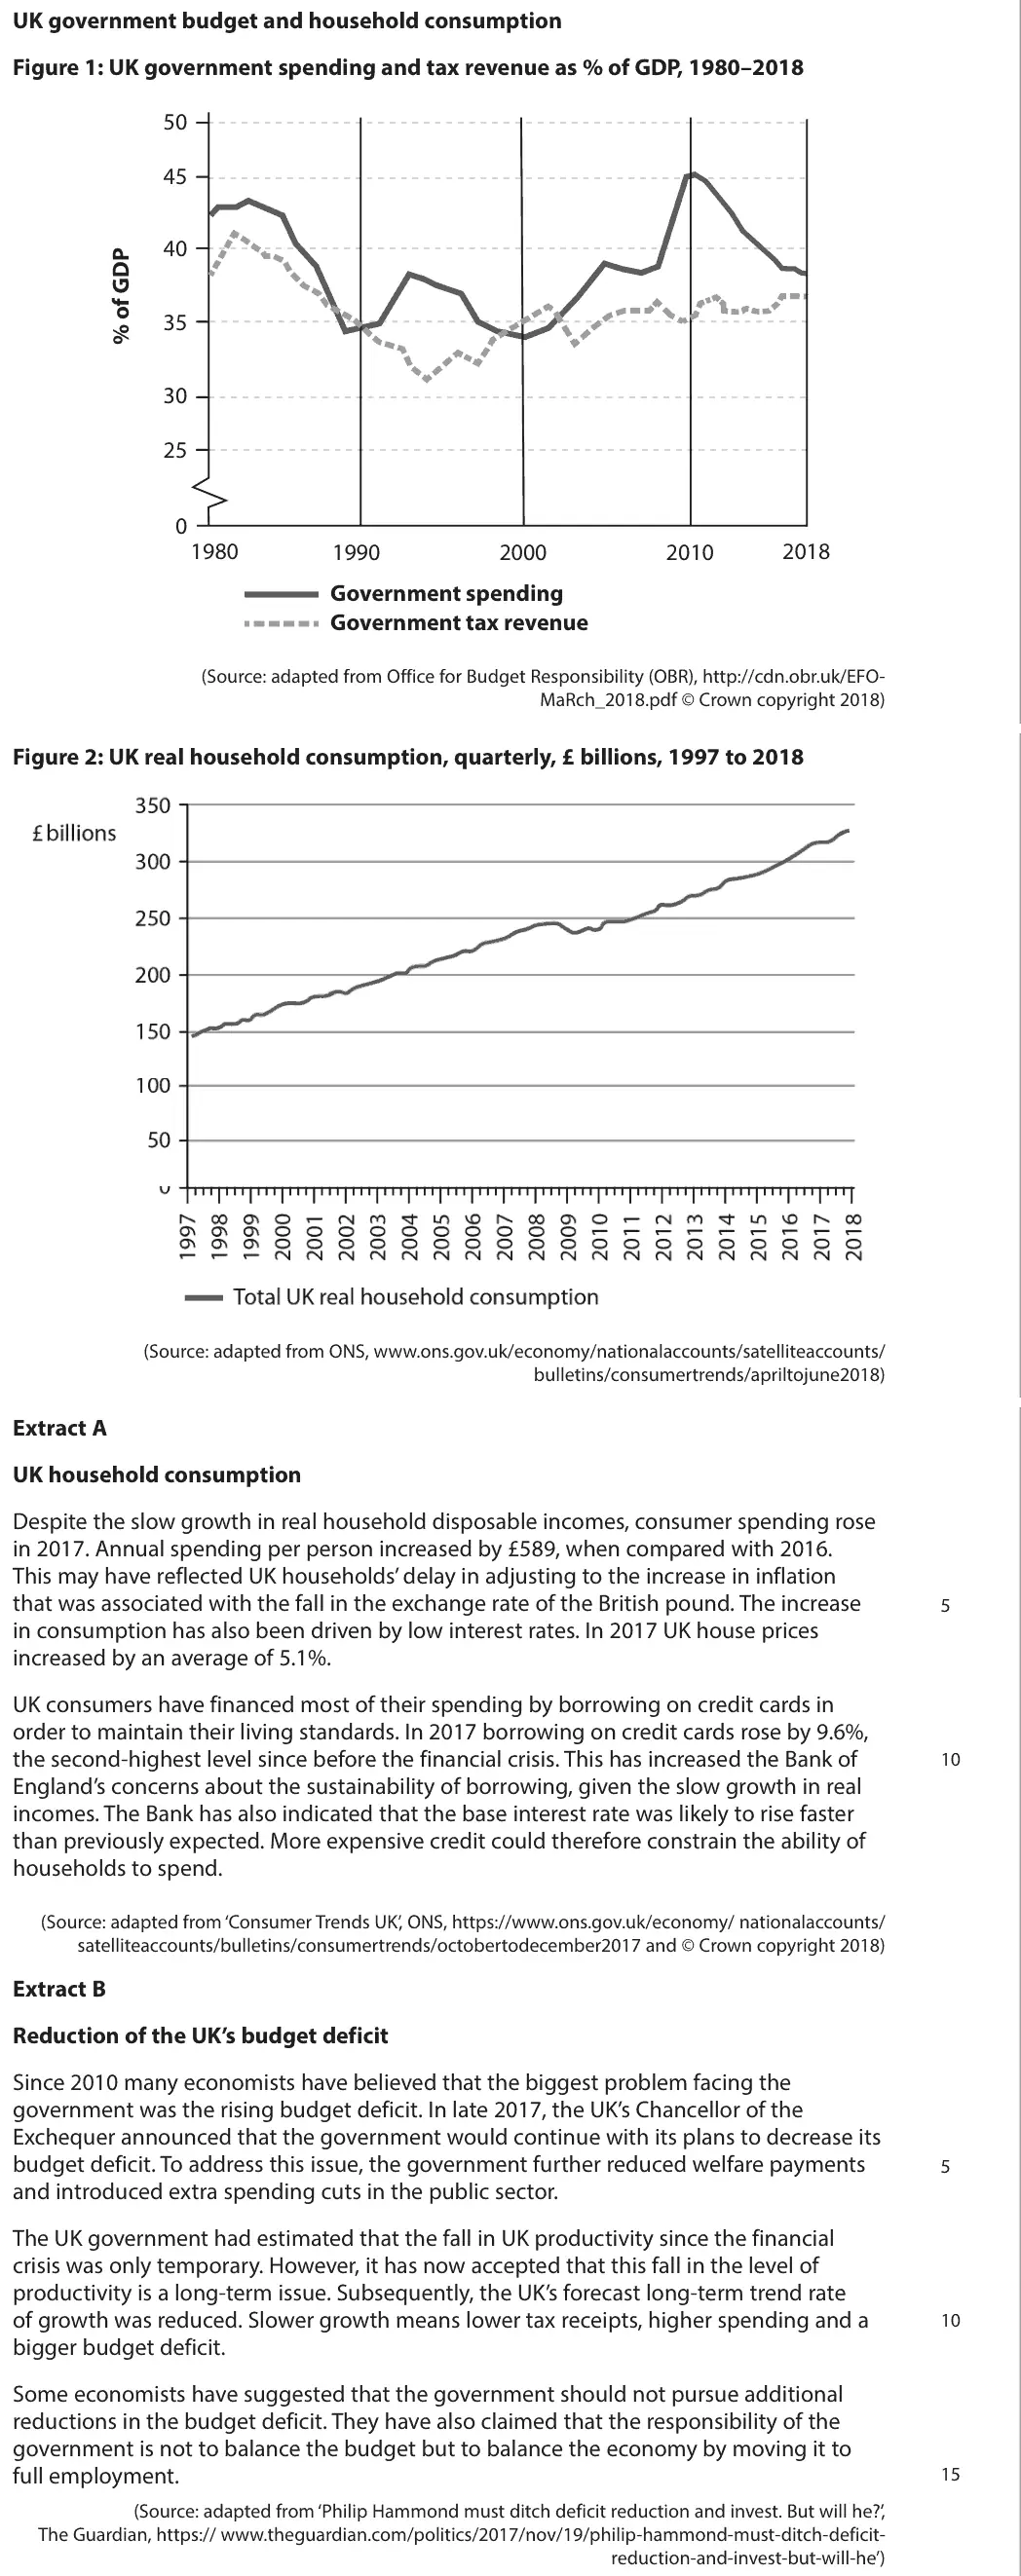
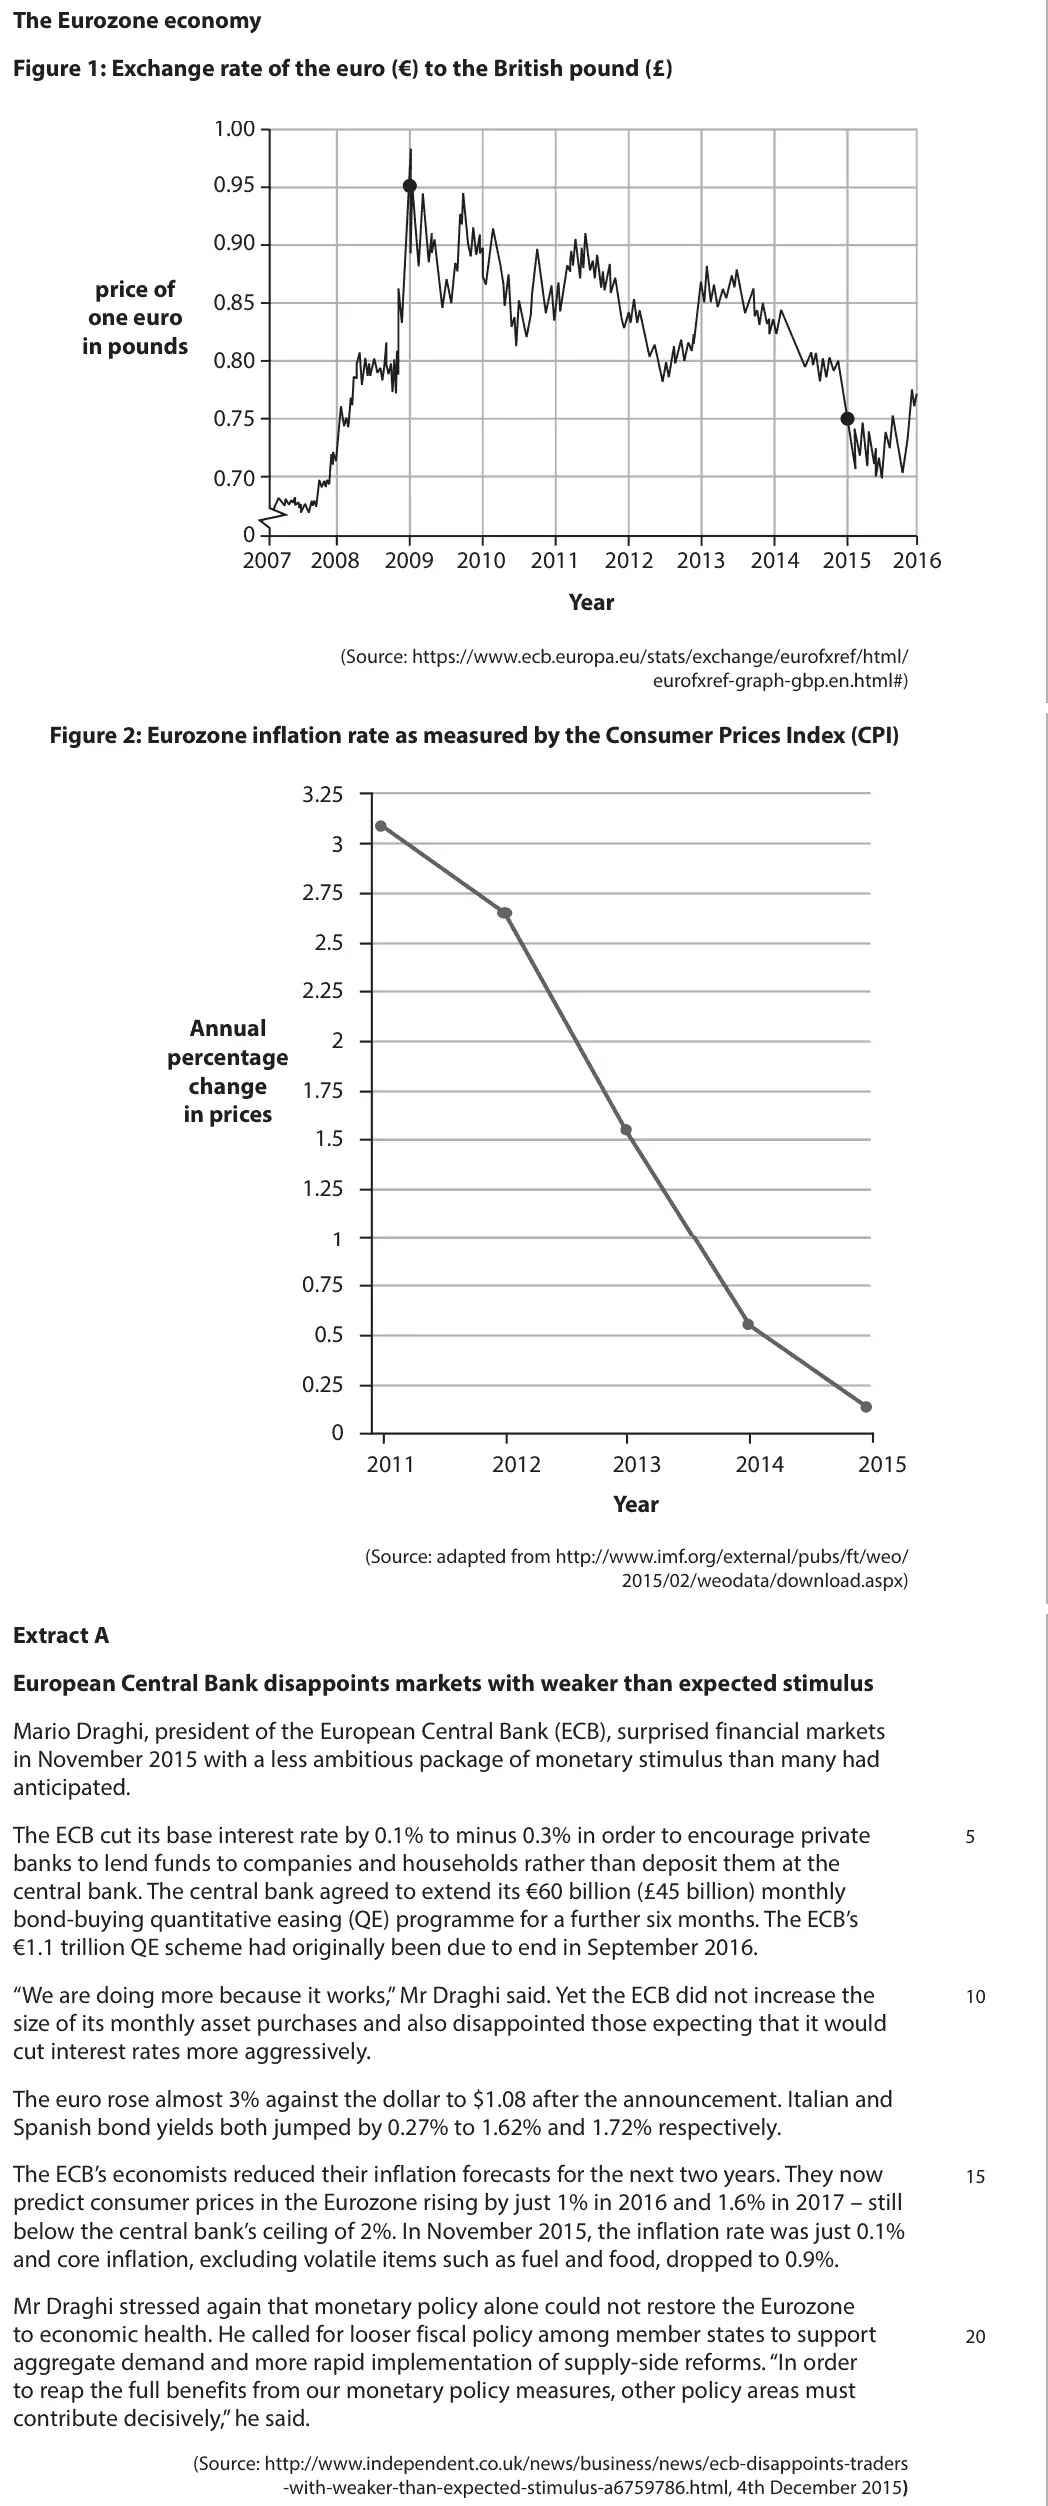
Data and extracts for question 6
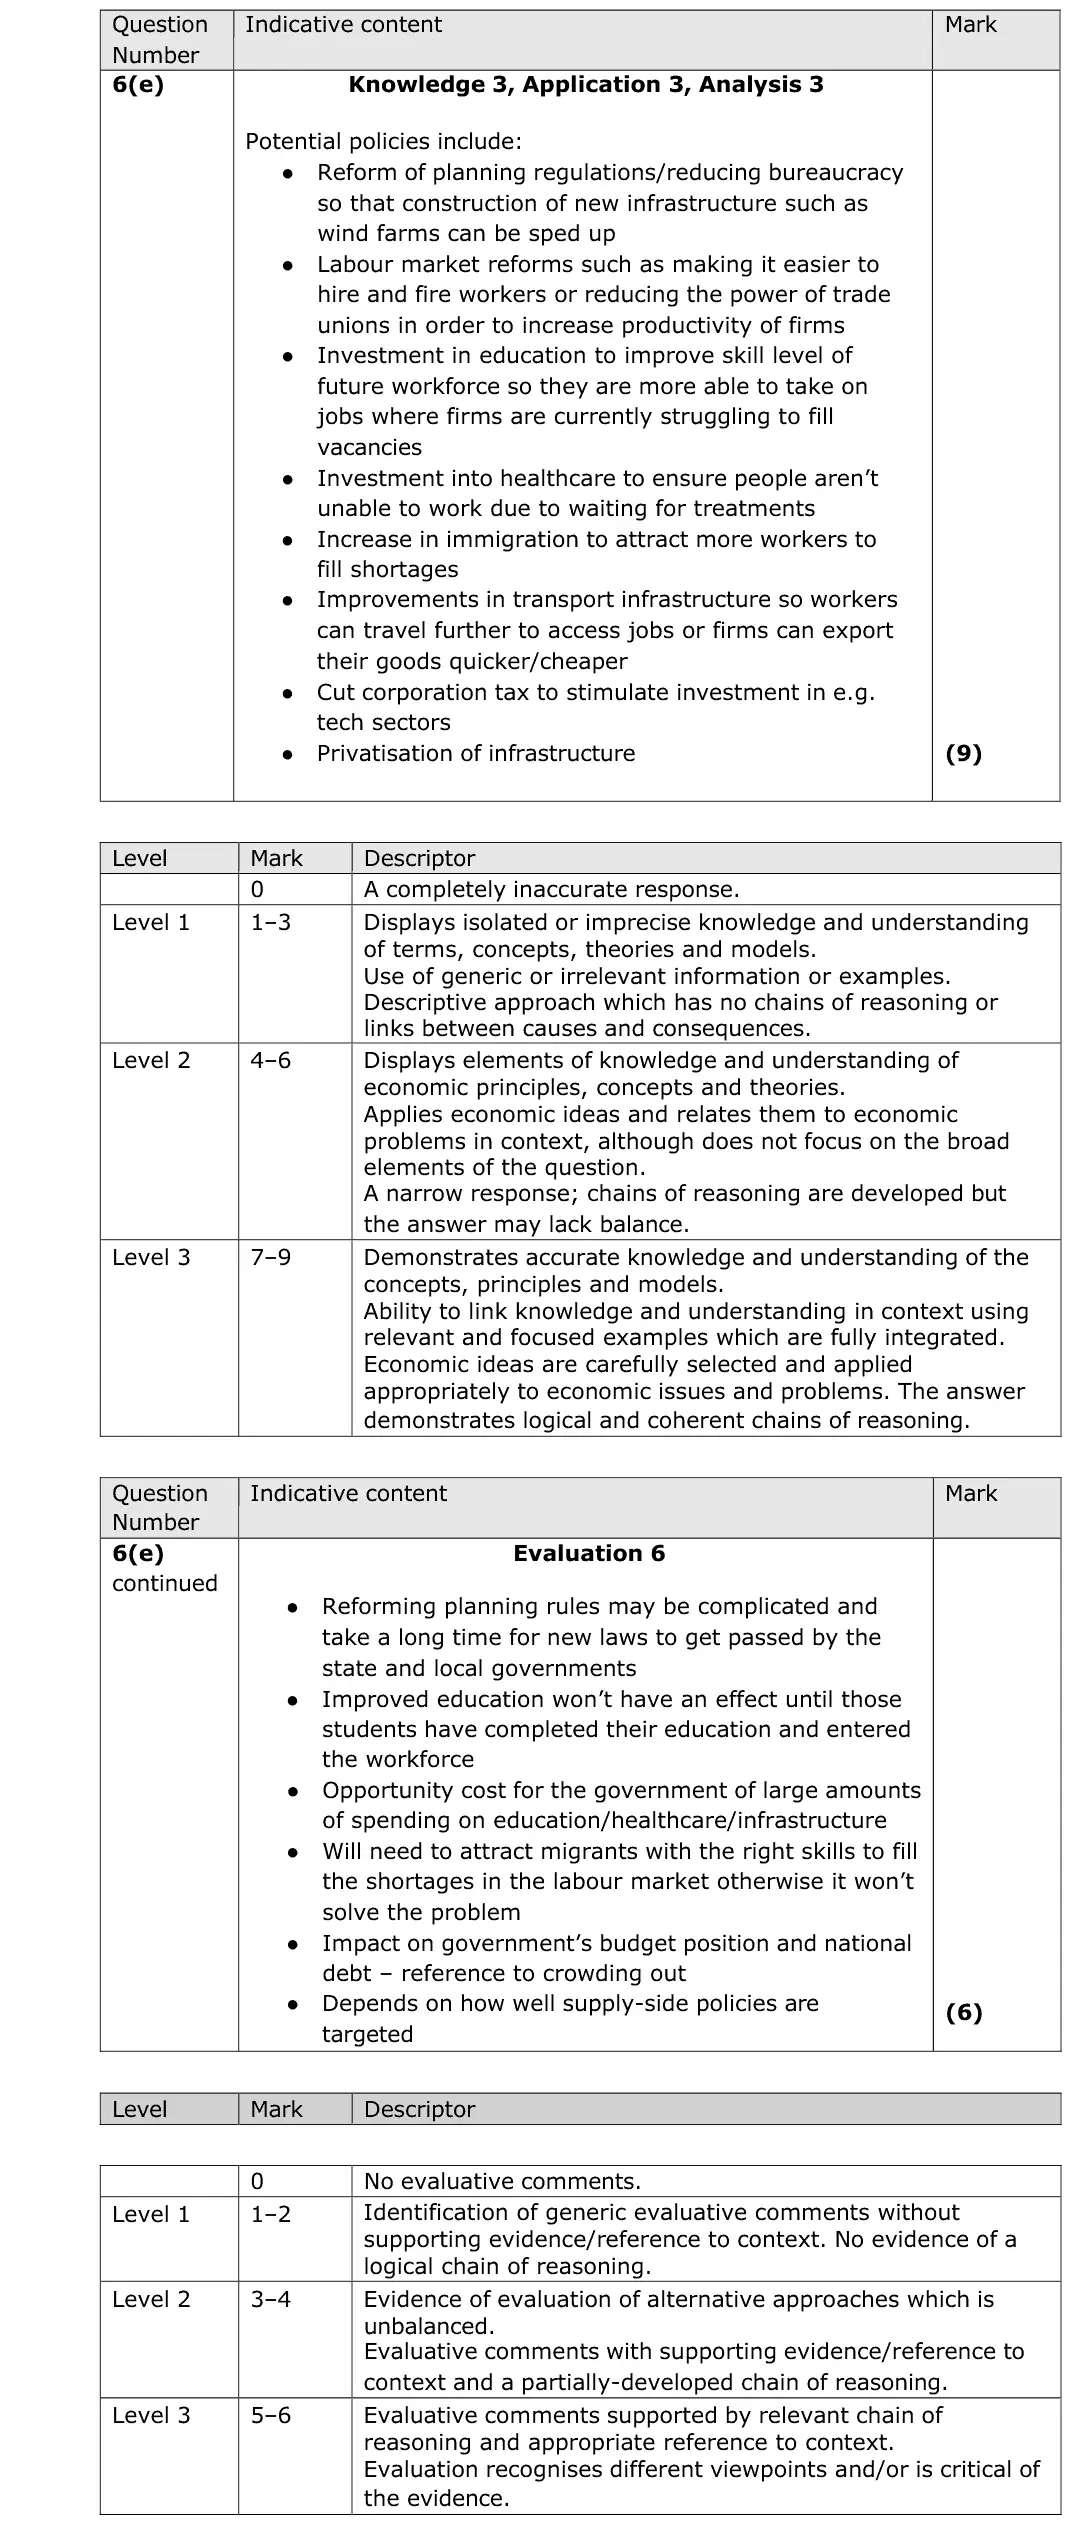
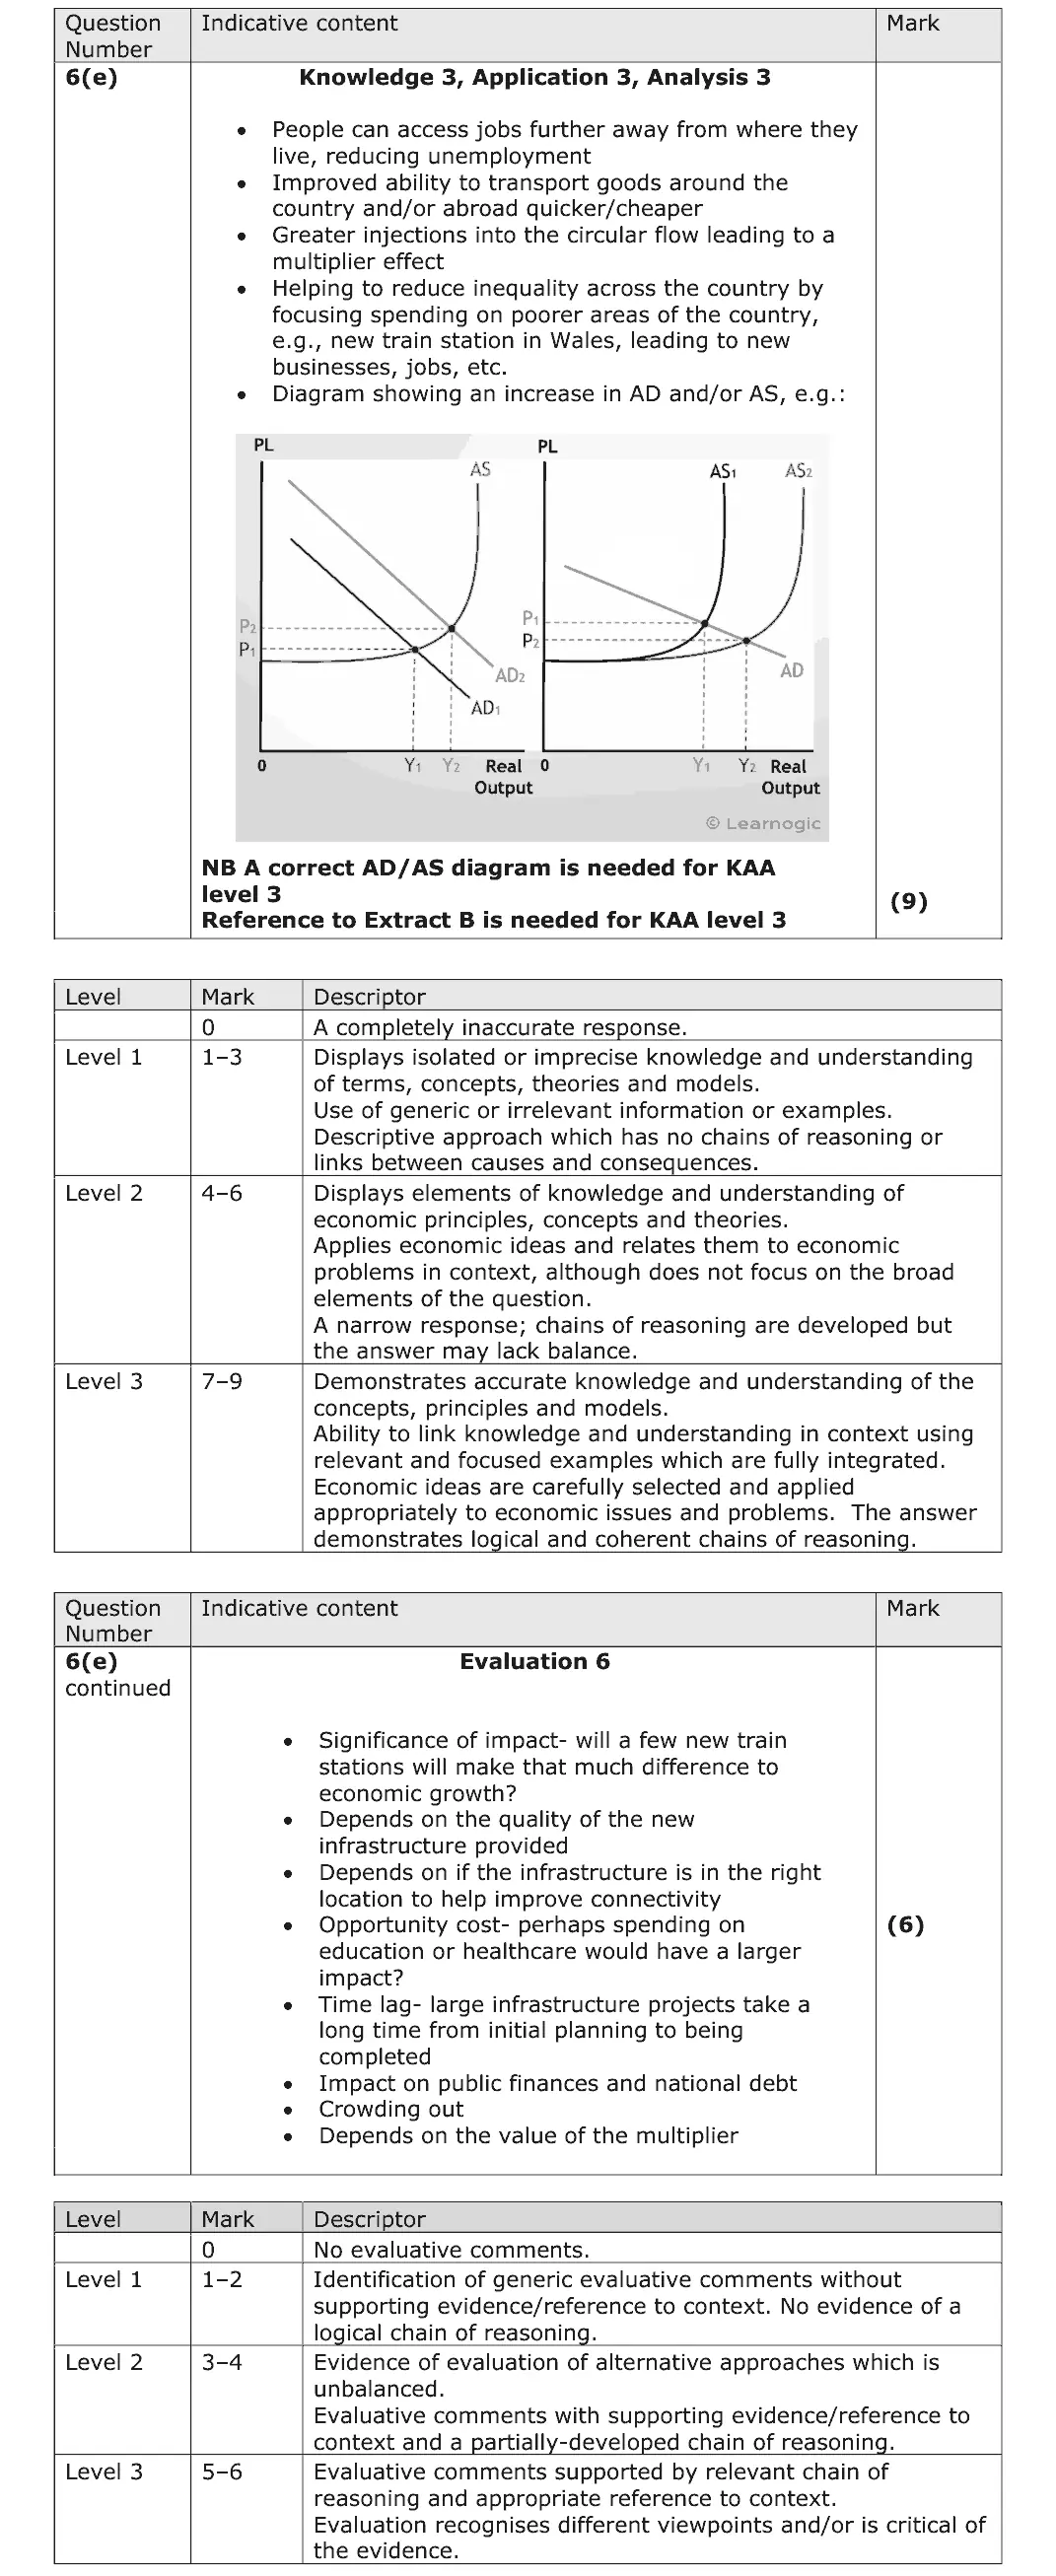
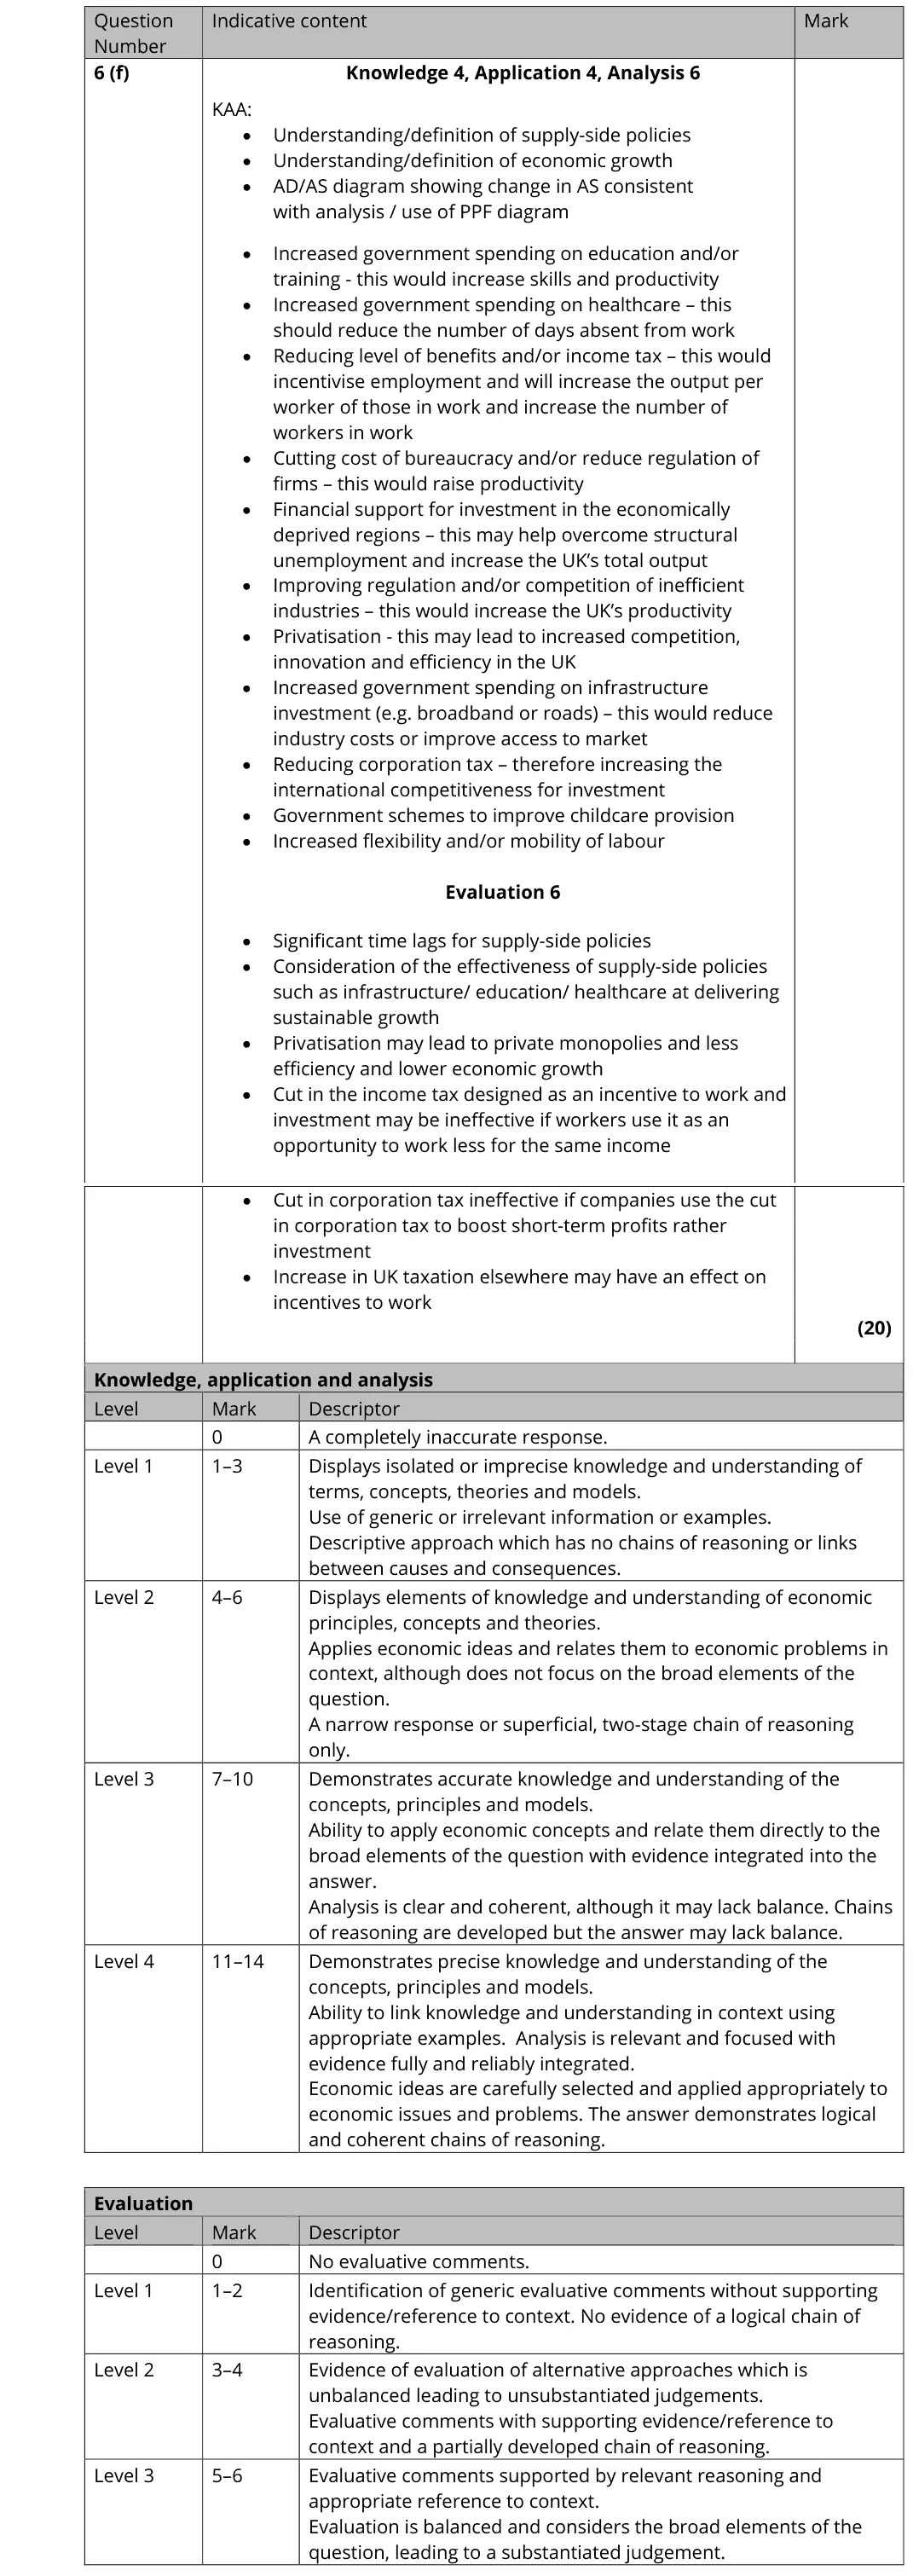
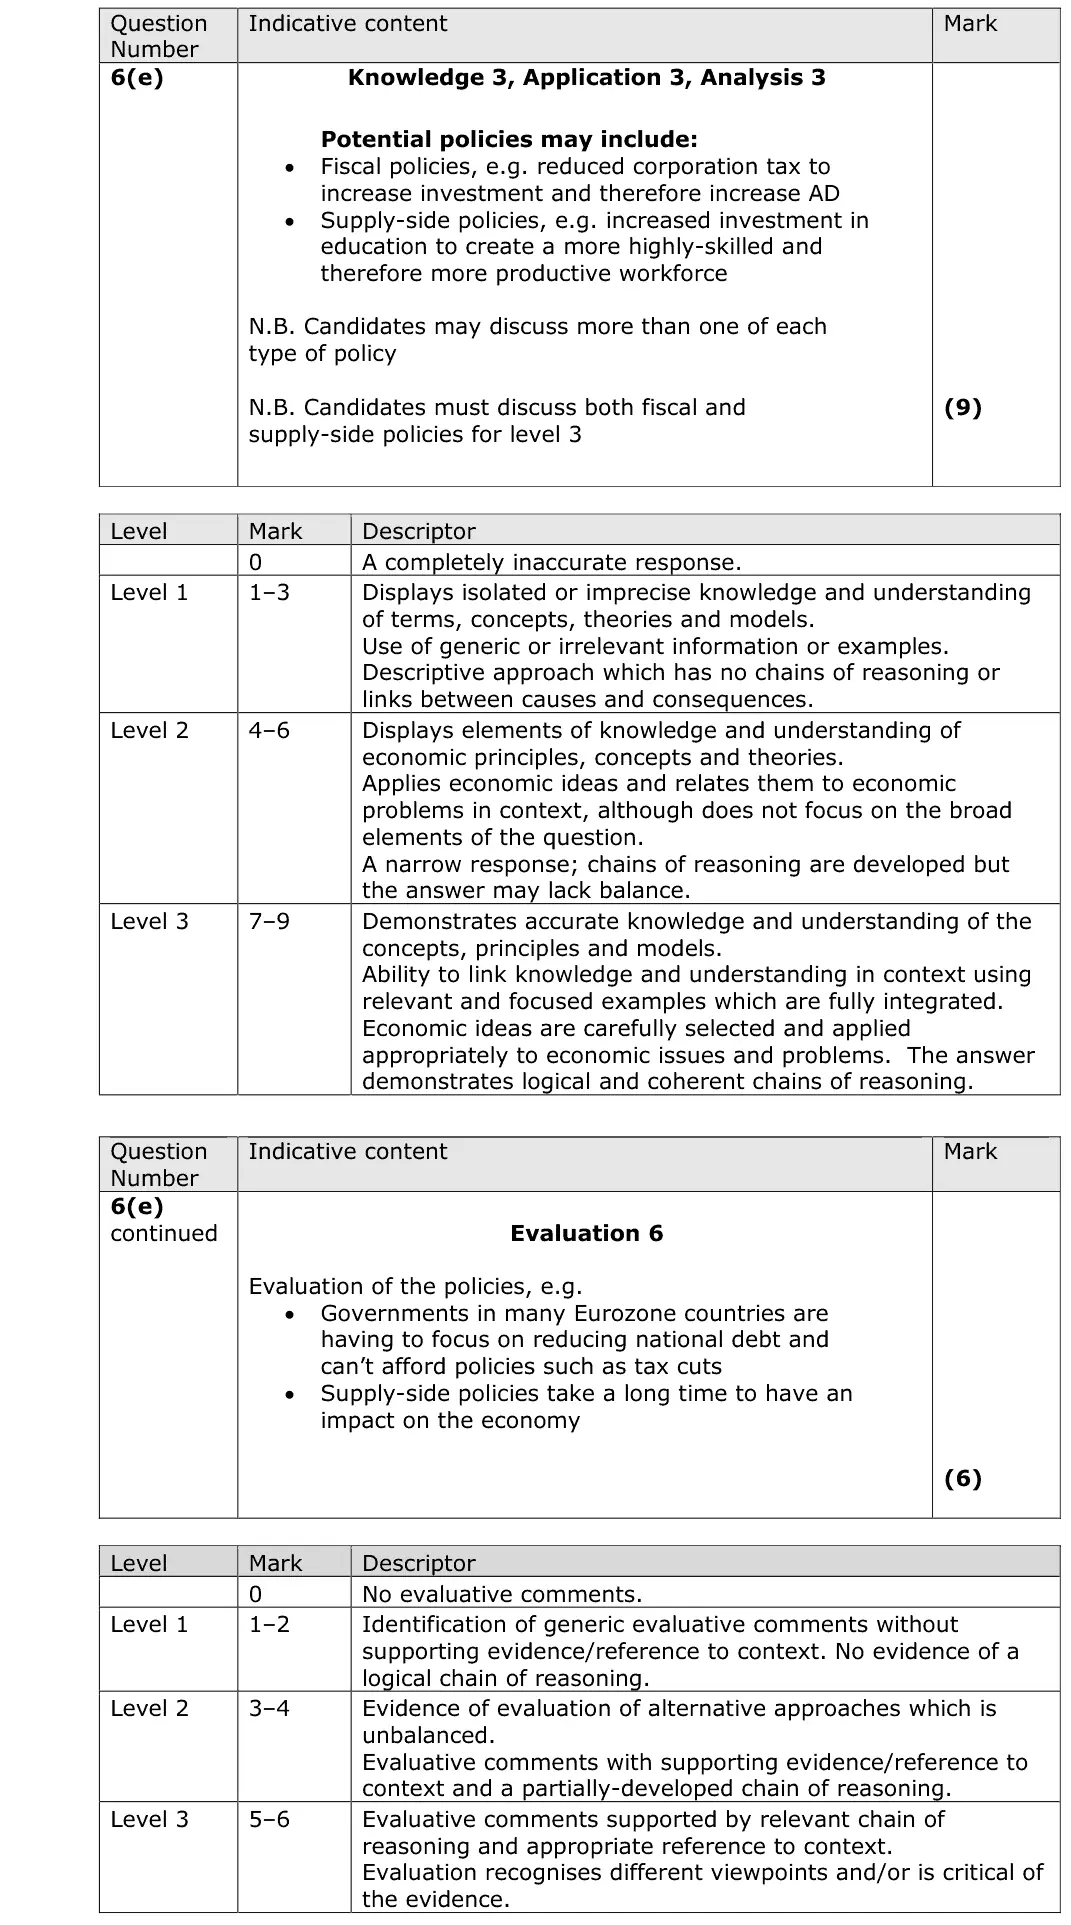
Mark scheme, including the levels grid and indicative content
Examiner's comment
This question is asking specifically about supply-side policies, and so that needs to be the focus of the answer. Any supply-side policies can count for example, improving education, healthcare, or infrastructure. Also, deregulation was discussed in many answers using the information in the extract. Marks would not be gained for discussion of policies that are not supply-side policies. The top-level answers for KAA generally did two things. Firstly, they made effective use of the case study to illustrate points: for example, the shortage of skilled workers or the bureaucracy delaying projects. Secondly, they explained clearly and in detail how the supply-side policy would work and what effect it would have on Germany’s economic performance. Many answers lacked sufficient detail of exactly how the policy would work to gain KAA Level 3: for example, when discussing education just writing in general terms about increased spending on education rather than giving specific examples like improved teacher training or more funding for apprenticeships in the areas where there are skills shortages as identified in the extract. Candidates who wrote about 'infrastructure' in general but never really got to saying exactly what aspect of infrastructure they were referring to similarly didn’t achieve top level. It is also worth candidates remembering that this question did not say anything about interventionist or market-based policies, so it did not matter which policies you choose to write about, and you were also not going to gain any marks for explaining the difference between the two or saying that investment in education is an interventionist policy. This is an excellent answer, achieving top level for both KAA and evaluation. The first point is focused on education and goes beyond a Level 2 answer to have both specific examples of how the investment in education could work in practice as well as having good application from the extract. This point is also effectively evaluated, not simply by saying there is an opportunity cost for the government, but by developing this line of evaluative argument with specific examples. The second point focuses on infrastructure and, again, offers good application and clear explanation of how this could work in the German economy. This is equally very well-evaluated, discussing the impact on interest rates in the wider economy of an increase in demand from the government for borrowing money. This answer has a very clear structure, with four paragraphs in total and each one laser- focused on a specific KAA or evaluation point. This is an excellent way to structure a 15-mark question. The first point this candidate makes is about education. This is reasonably well-explained but lacks specific examples of how the improvement in education might come about. The second point which is merged with this, about infrastructure, is of a similar standard. There is then some evaluation but only at low Level 2. The answer continues in a similar vein, with more supply-side policies discussed, again at KAA Level 2. Overall, there are several points here but all at Level 2 for KAA and only one limited piece of evaluation, which makes this answer Level 1 for evaluation overall. Do not try to write about lots of different supply-side policies. Focus on two specific ones and explain them in more depth. Remember the focus on all the levels-based questions is on depth, not breadth.
Notes from the mark scheme and report
supply-side policies only: planning reform and cutting bureaucracy, labour market flexibility, training and apprenticeships for skills shortages, migration, infrastructure, energy
evaluate cost, time lags, government failure
report: many lacked detail of exactly how the policy works for Level 3
June 2025 · AS Paper 2 · Q6(g)20 marksAO1=4, AO2=4, AO3=6, AO4=620-mark essayEither/or
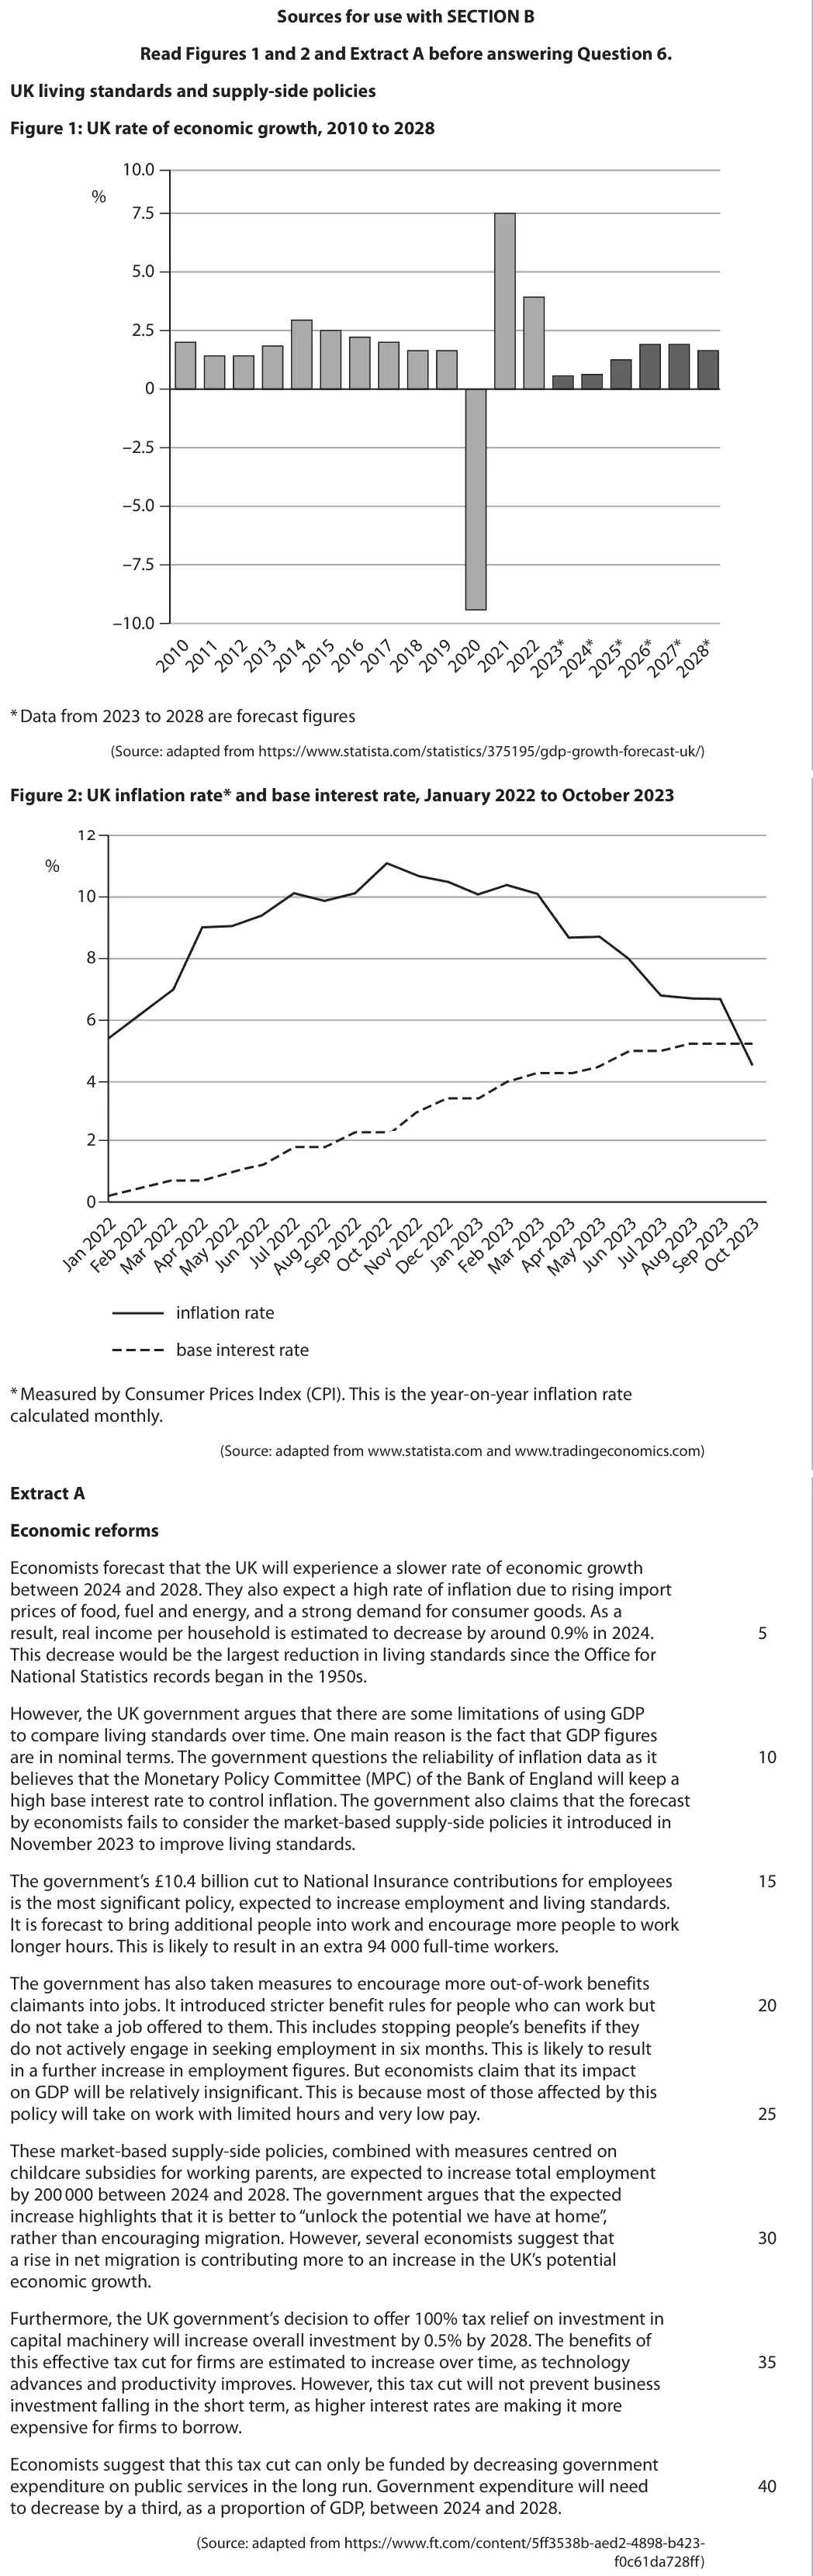
Data and extracts for question 6
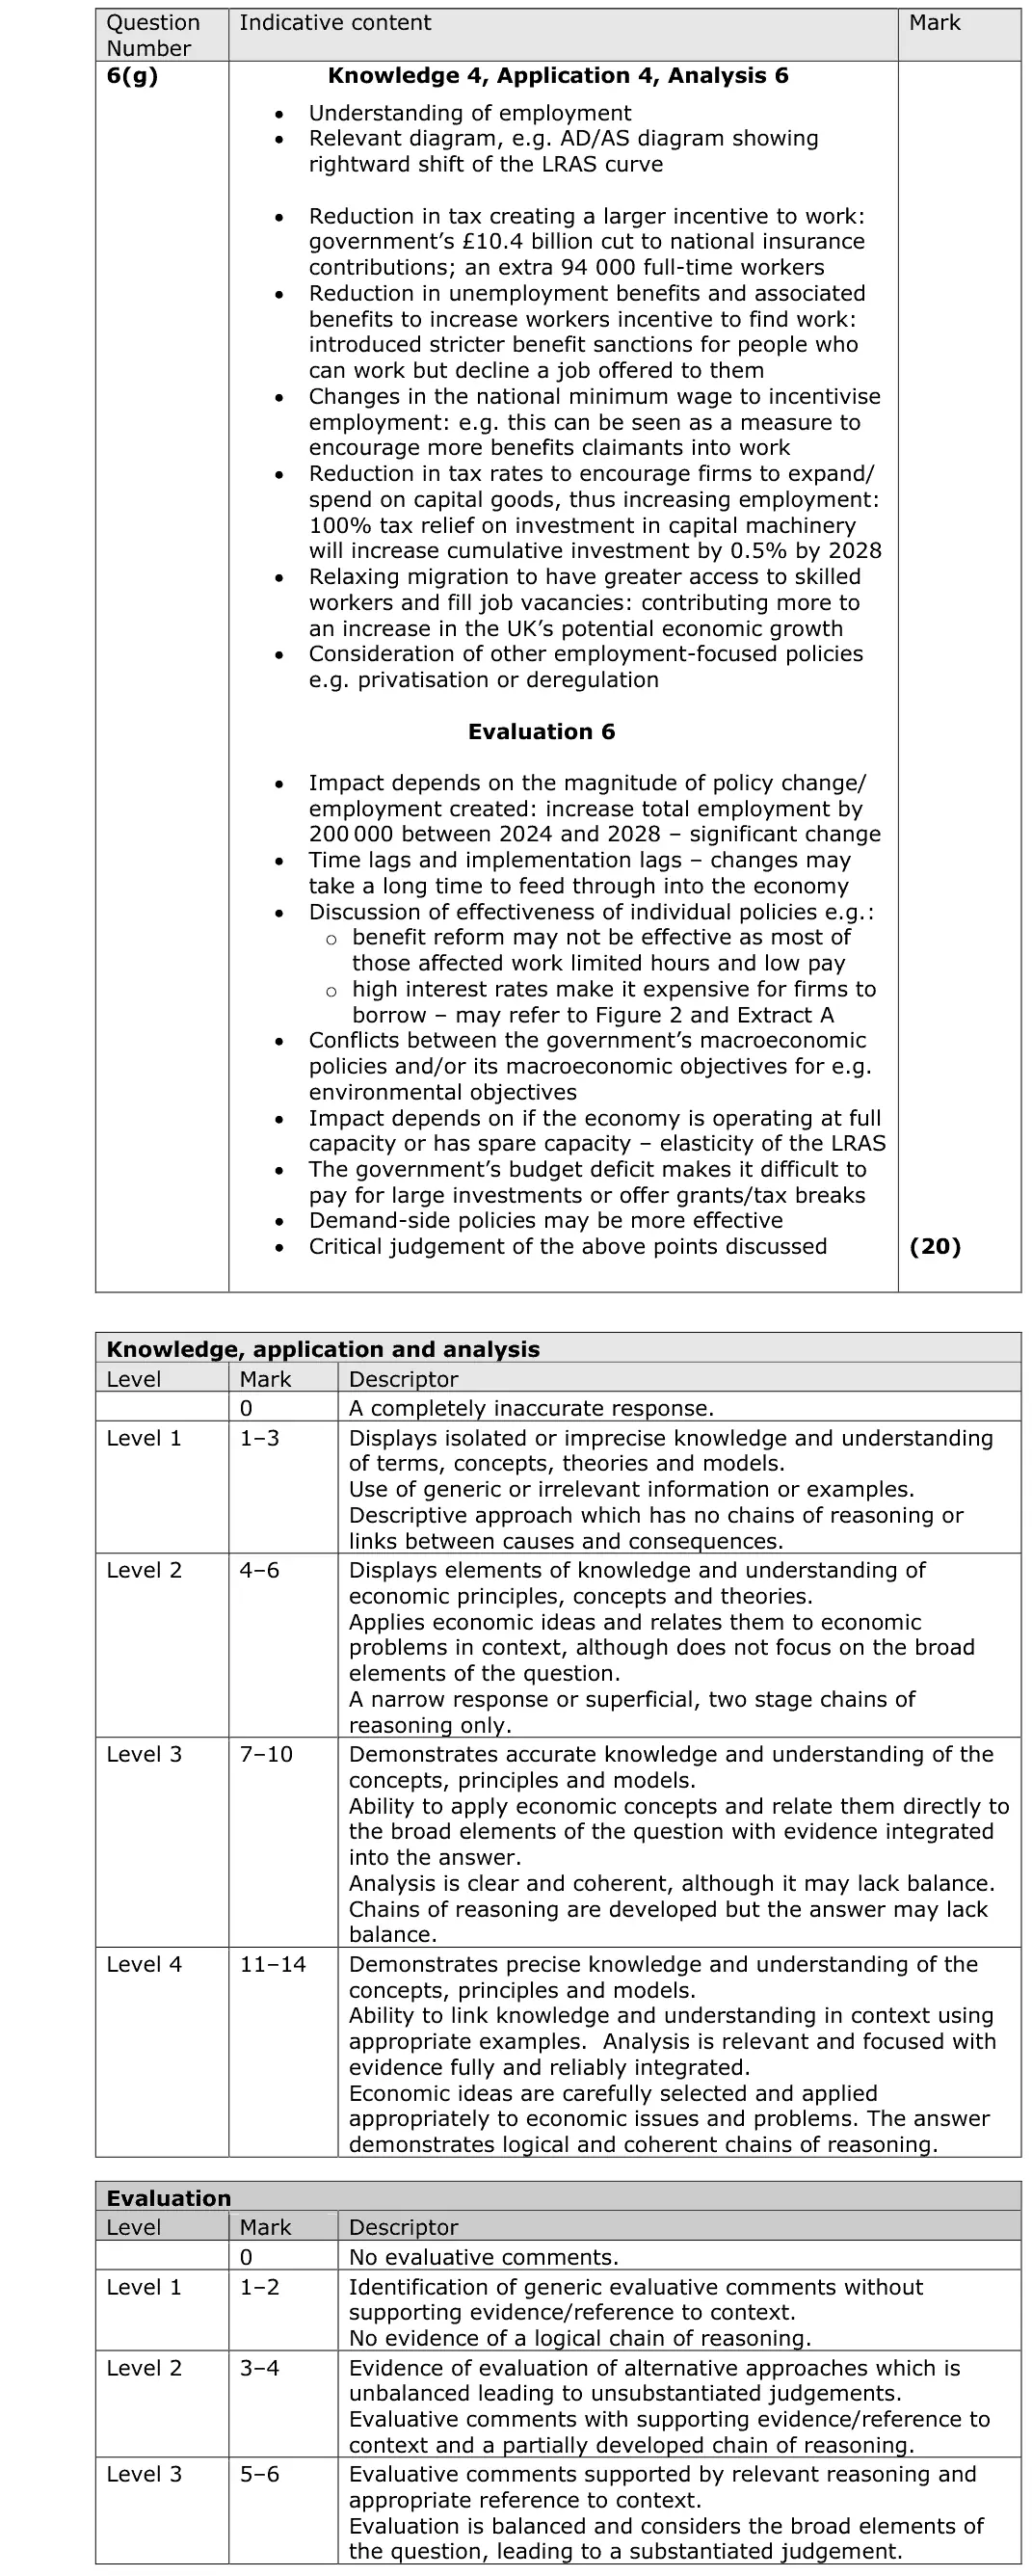
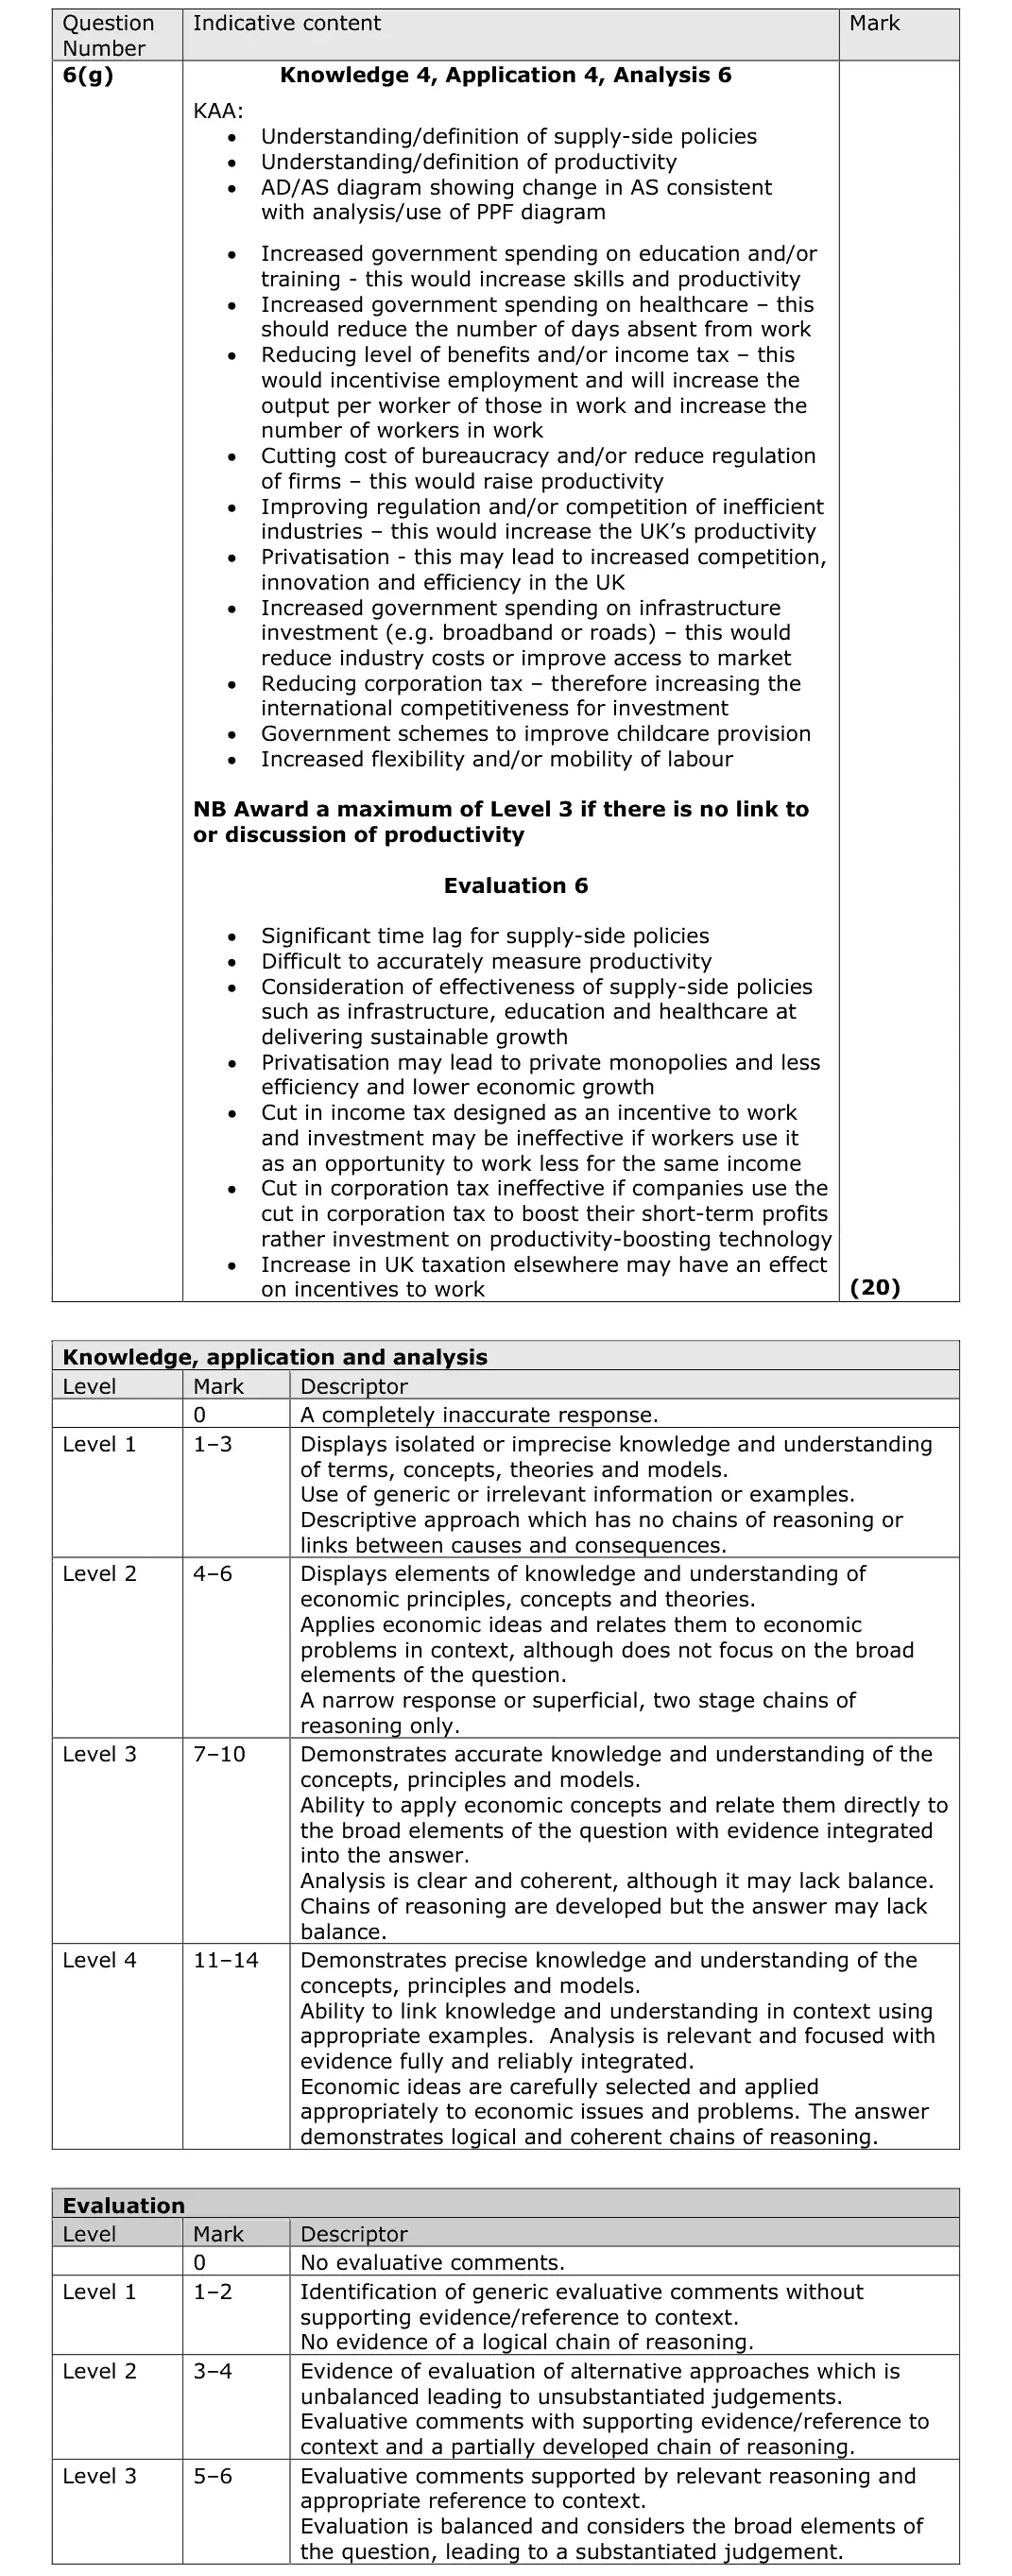
Mark scheme, including the levels grid and indicative content
Examiner's comment
This question required candidates to evaluate use of market-based supply-side policies to increase UK employment. Although candidates were able to analyse most of their arguments, they were not able to discuss them in detail. Some answered with interventionist supply-side policies and this was not credited. There were several evaluative comments made, but they lacked chains of reasoning to access higher levels.
Notes from the mark scheme and report
market-based policies only (NICs cut of £10.4bn and 94 000 extra workers, stricter benefit rules, deregulation, lower income tax)
interventionist policies are not credited
evaluate with low-paid part-time jobs, incentives, time lags, inequality
June 2024 · Paper 2 · Q6(e)15 marksAO1=3, AO2=3, AO3=3, AO4=615-mark response
Data and extracts for question 6
Mark scheme, including the levels grid and indicative content
Examiner's comment
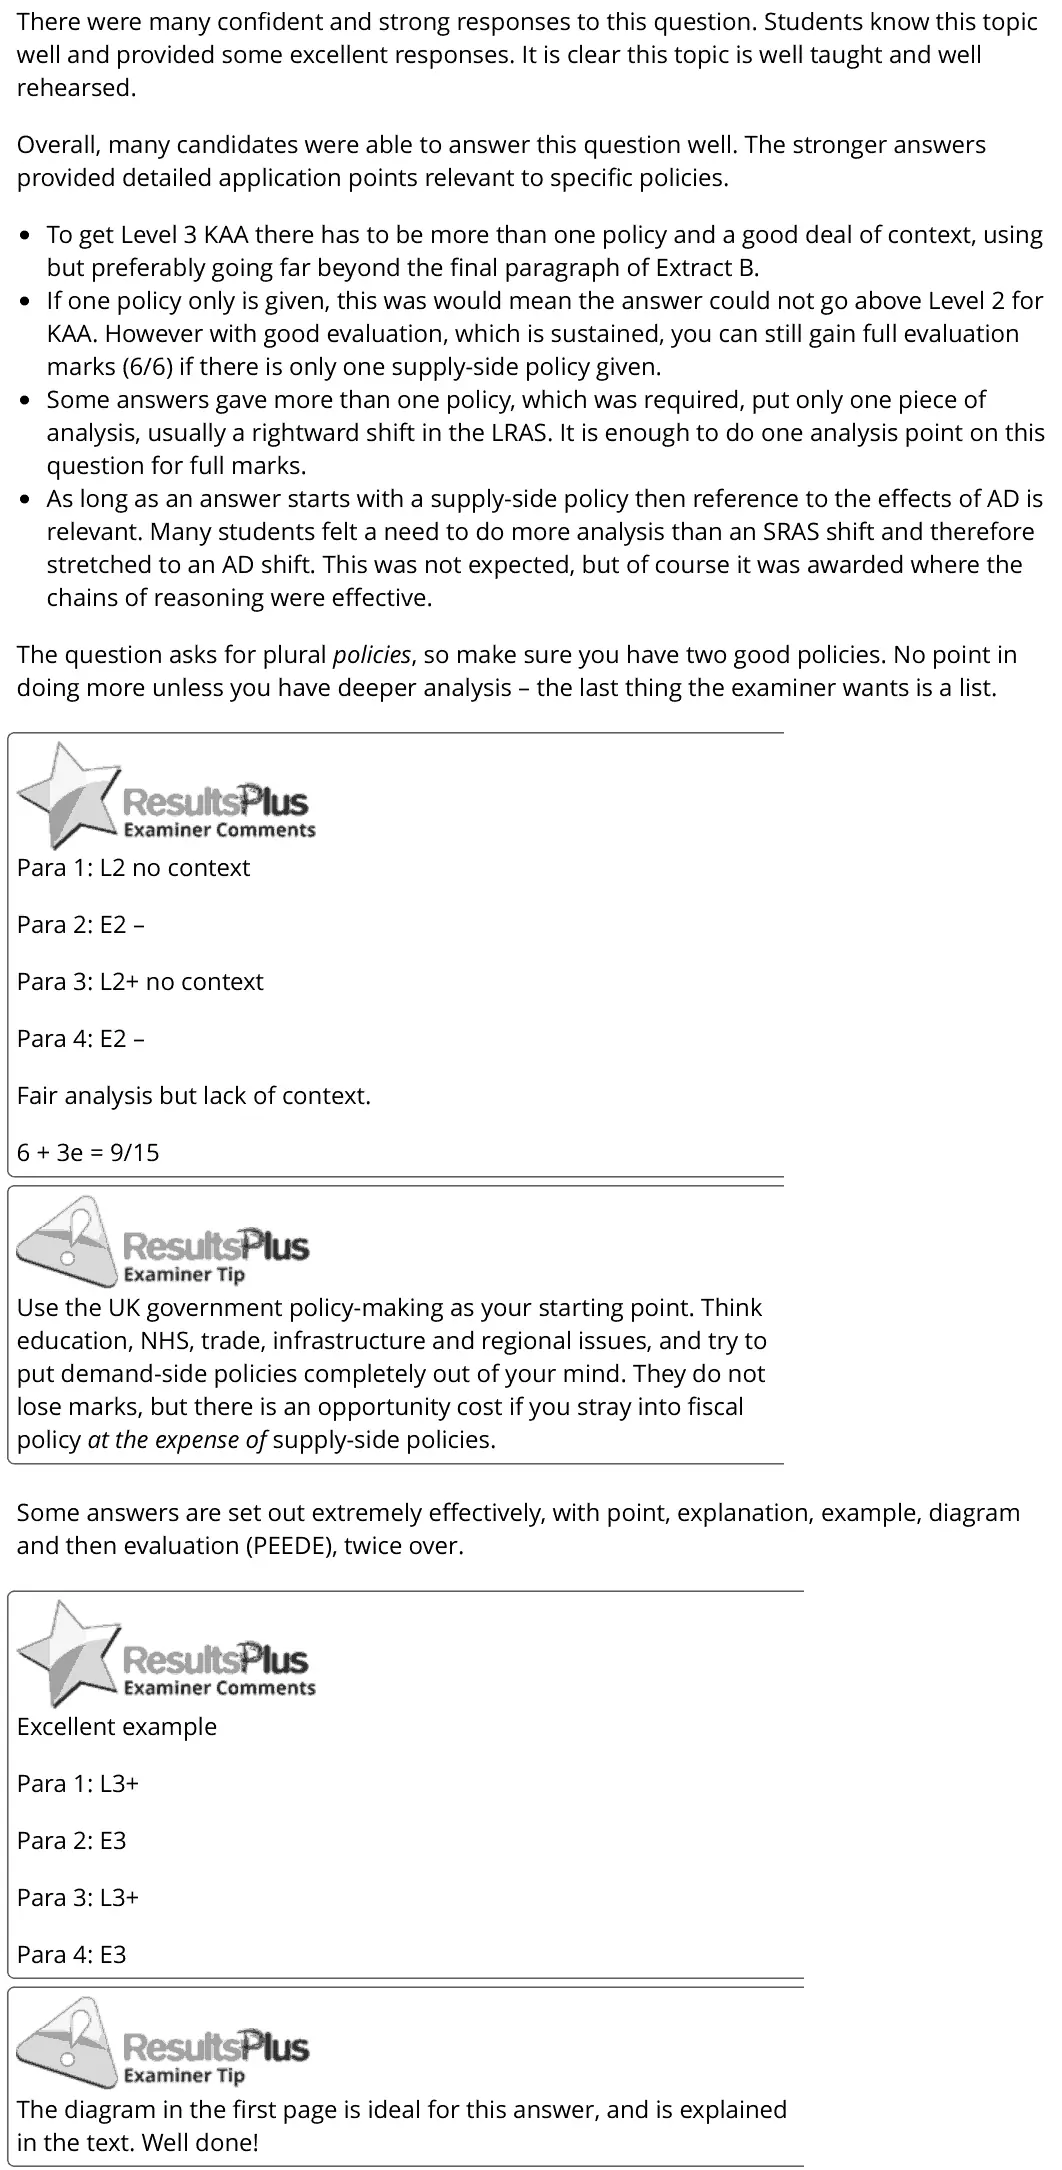
There were many confident and strong responses to this question. Students know this topic well and provided some excellent responses. It is clear this topic is well taught and well rehearsed. Overall, many candidates were able to answer this question well. The stronger answers provided detailed application points relevant to specific policies. To get Level 3 KAA there has to be more than one policy and a good deal of context, using but preferably going far beyond the final paragraph of Extract B. If one policy only is given, this was would mean the answer could not go above Level 2 for KAA. However with good evaluation, which is sustained, you can still gain full evaluation marks (6/6) if there is only one supply-side policy given. Some answers gave more than one policy, which was required, put only one piece of analysis, usually a rightward shift in the LRAS. It is enough to do one analysis point on this question for full marks. As long as an answer starts with a supply-side policy then reference to the effects of AD is relevant. Many students felt a need to do more analysis than an SRAS shift and therefore stretched to an AD shift. This was not expected, but of course it was awarded where the chains of reasoning were effective. The question asks for plural policies, so make sure you have two good policies. No point in doing more unless you have deeper analysis – the last thing the examiner wants is a list. Para 1: L2 no context Para 2: E2 – Para 3: L2+ no context Para 4: E2 – Fair analysis but lack of context. 6 + 3e = 9/15 Use the UK government policy-making as your starting point. Think education, NHS, trade, infrastructure and regional issues, and try to put demand-side policies completely out of your mind. They do not lose marks, but there is an opportunity cost if you stray into fiscal policy at the expense of supply-side policies. Some answers are set out extremely effectively, with point, explanation, example, diagram and then evaluation (PEEDE), twice over. Excellent example Para 1: L3+ Para 2: E3 Para 3: L3+ Para 4: E3 The diagram in the first page is ideal for this answer, and is explained in the text. Well done!
Notes from the mark scheme and report
Level 3 needs more than one supply-side policy (infrastructure, education and training, tax incentives, deregulation, labour market reform) shifting LRAS right
evaluate with time lags, cost, government failure and fiscal constraints
June 2023 · AS Paper 2 · Q1(a)3 marksAO1=1, AO2=1, AO3=1Short answer
Data and extracts for question 1
Mark scheme
Examiner's comment
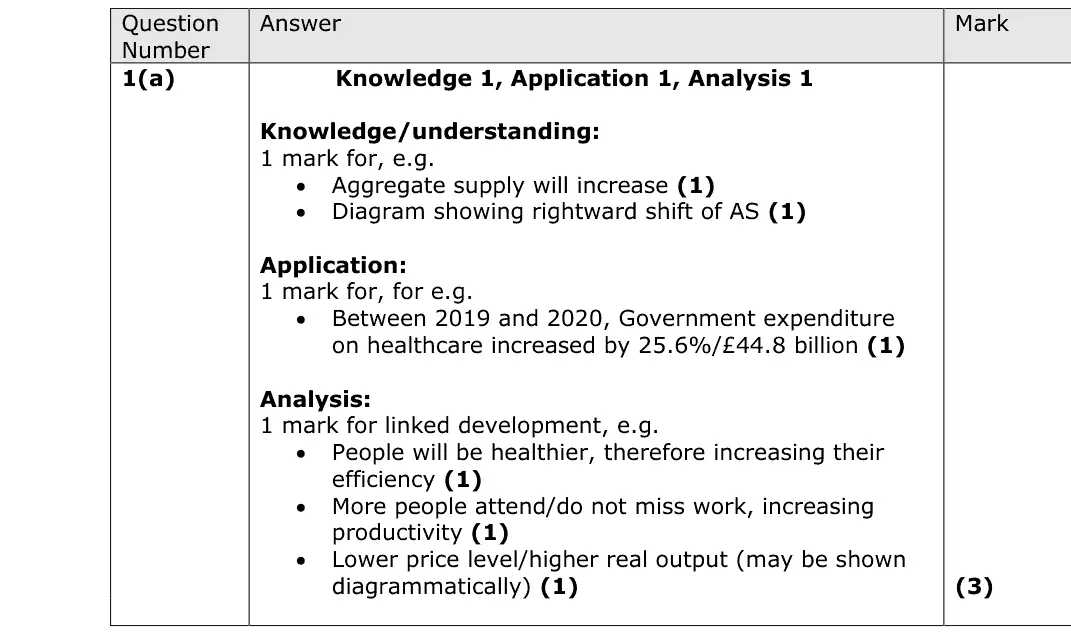
In this question the marks are split as 1 for knowledge, 1 for application, and 1 for analysis. The knowledge comes from identifying one impact, the application for explaining the data, and analysis for development building on the knowledge. Most candidates were able to access application marks.
Notes from the mark scheme and report
healthcare spending rose £44.8bn (25.6%), shifting LRAS right
develop via a healthier, more productive workforce and fewer days lost to sickness
Quantitative skills: QS 2 (calculate, use and understand percentages, percentage changes and percentage point changes); QS 9 (interpret, apply and analyse information in written, graphical tabular and numerical forms)
June 2023 · AS Paper 2 · Q1(b)1 markMultiple choice
Data and extracts for question 1
Answer
C
Mark scheme
Notes from the mark scheme and report
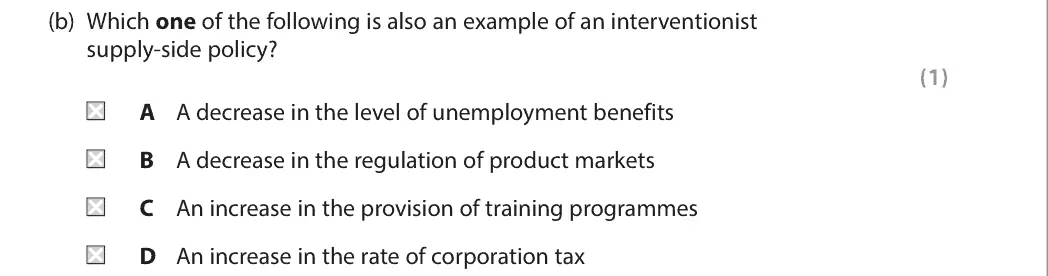
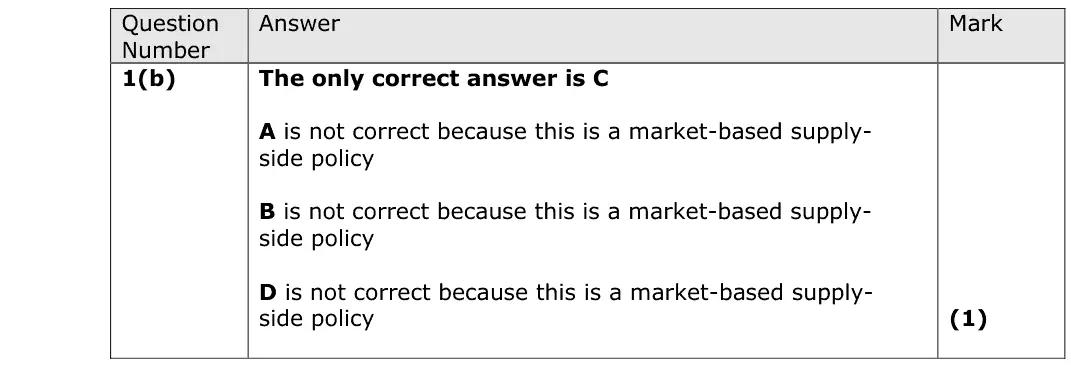
more training programmes is an interventionist supply-side policy (C)
A and B are market-based
D higher corporation tax reduces incentives
June 2023 · Paper 2 · Q825 marksAO1=4, AO2=4, AO3=8, AO4=925-mark essayEither/or
Mark scheme, including the levels grid and indicative content
evaluate with cost-push causes, time lags, effects on growth and unemployment
June 2022 · Paper 2 · Q6(e)15 marksAO1=3, AO2=3, AO3=3, AO4=615-mark response
Data and extracts for question 6
Mark scheme, including the levels grid and indicative content
Examiner's comment
In this question there are 9 marks for KAA and 6 marks for evaluation. The question specifies that candidates need to draw a diagram, which is a requirement in order to achieve highly at level 3 for KAA. Some of the better responses were able to clearly analyse and evaluate the benefits and downsides of increased spending on infrastructure. They also often used the information in the case study, such as the new station at Bow Street, to illustrate their argument. Evaluative arguments could discuss the significance of one small station or the long timespan of UK infrastructure projects. This is a response that was awarded 8 marks and achieved level 2 for KAA and level 1 for evaluation. The candidate knows the basics of the discussion provided in the answer but lacks a sufficiently detailed and step-by-step explanation to go beyond these levels. If a question asks you to draw a diagram, make sure you do so. However, the diagram alone is not enough to get you into the top levels of the marking criteria. This is an excellent answer which gained top level for both KAA and evaluation and was awarded 14 marks. The benefits are clearly discussed in terms of both aggregate demand and aggregate supply as well as the downsides. There is application and there is good use made of correctly drawn AD/AS diagrams. Remember to relate your answer to the real world by using the extract and/or your own knowledge.
Notes from the mark scheme and report
Level 3 KAA needs a correct AD/AS diagram (AD and/or LRAS shift right) and reference to Extract B (e.g. Bow Street station, £8m cost, £24m boost)
evaluate significance of small projects, time lags, opportunity cost, crowding out, national debt, size of the multiplier
Quantitative skills: QS 4 (construct and interpret a range of standard graphical forms)
June 2022 · AS Paper 2 · Q6(g)20 marksAO1=4, AO2=4, AO3=6, AO4=620-mark essayEither/orHard
Data and extracts for question 6
Mark scheme, including the levels grid and indicative content
Examiner's comment
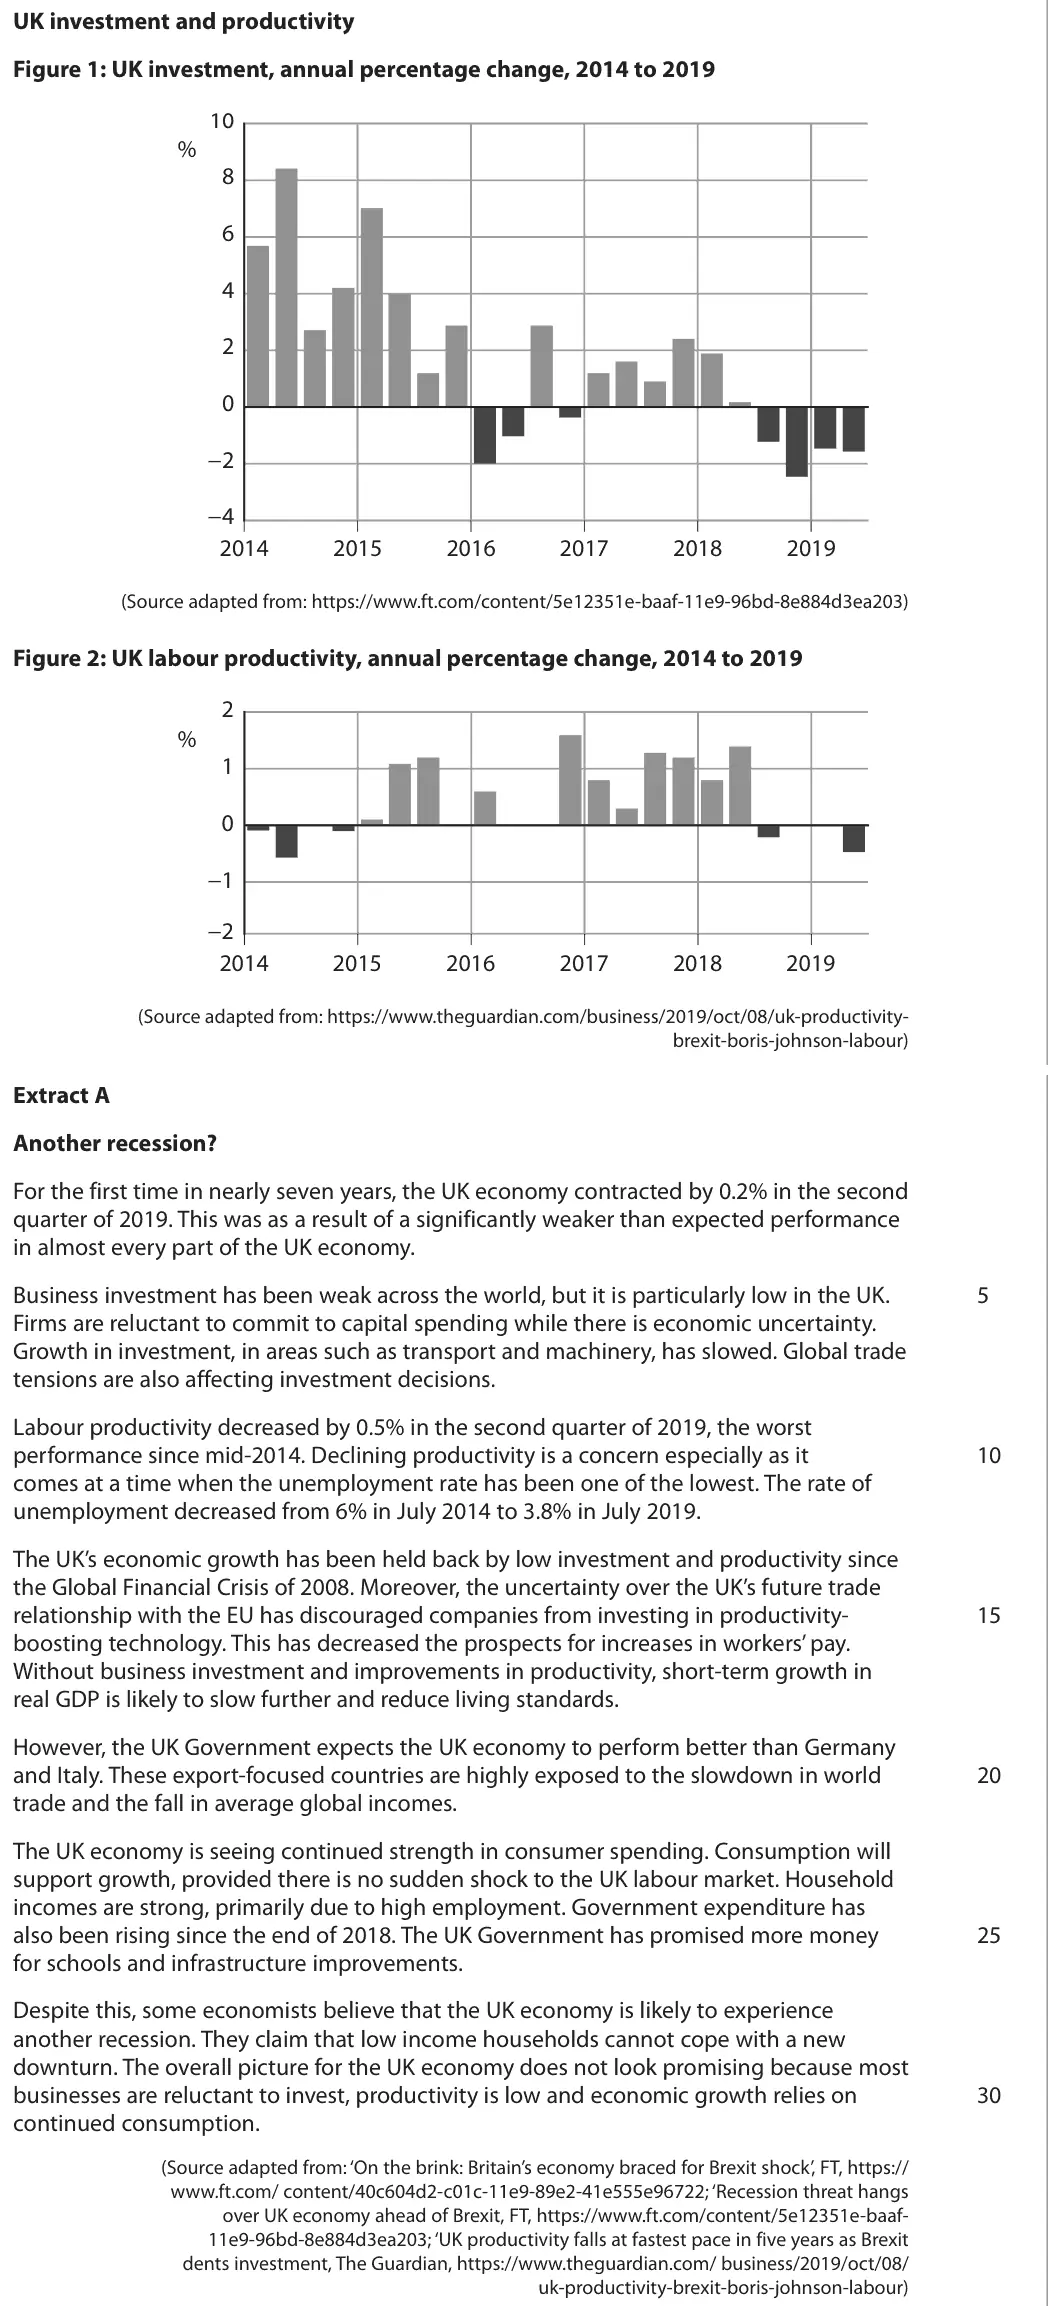
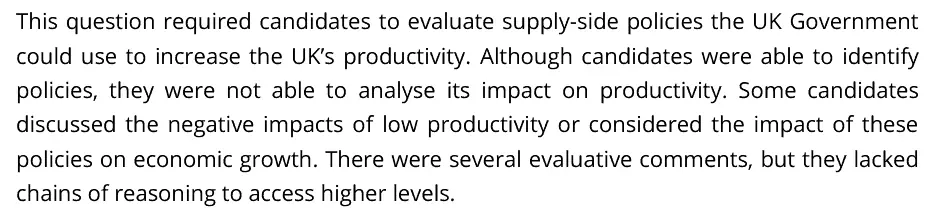
This question required candidates to evaluate supply-side policies the UK Government could use to increase the UK’s productivity. Although candidates were able to identify policies, they were not able to analyse its impact on productivity. Some candidates discussed the negative impacts of low productivity or considered the impact of these policies on economic growth. There were several evaluative comments, but they lacked chains of reasoning to access higher levels.
Notes from the mark scheme and report
supply-side policies (education and training, infrastructure, tax incentives for investment, deregulation) linked to productivity, not just growth
report: candidates could identify policies but "were not able to analyse its impact on productivity"
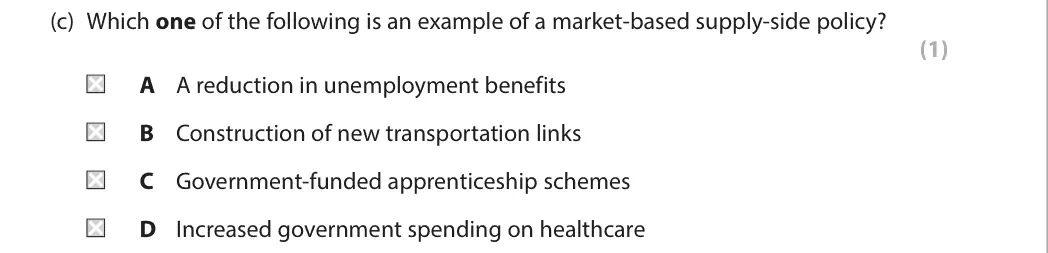
October 2020 · AS Paper 2 · Q2(c)1 markMultiple choice
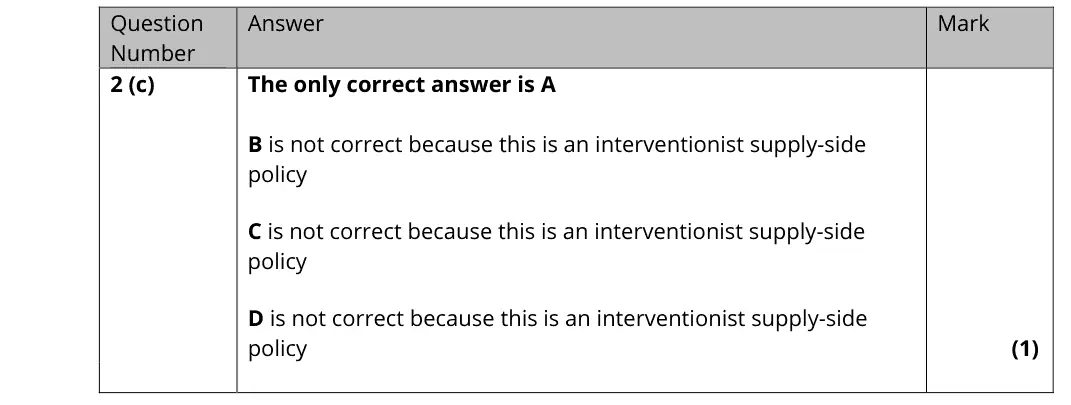
Answer
A
Mark scheme
Notes from the mark scheme and report
cutting unemployment benefits increases incentives to work through the market (A)
transport links, funded apprenticeships and health spending are interventionist
October 2020 · AS Paper 2 · Q6(f)20 marksAO1=4, AO2=4, AO3=6, AO4=620-mark essayEither/or
Data and extracts for question 6
Mark scheme, including the levels grid and indicative content
Examiner's comment
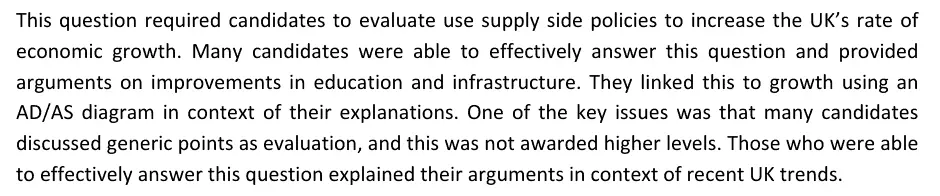
This question required candidates to evaluate use supply side policies to increase the UK’s rate of economic growth. Many candidates were able to effectively answer this question and provided arguments on improvements in education and infrastructure. They linked this to growth using an AD/AS diagram in context of their explanations. One of the key issues was that many candidates discussed generic points as evaluation, and this was not awarded higher levels. Those who were able to effectively answer this question explained their arguments in context of recent UK trends.
Notes from the mark scheme and report
supply-side policies (education and training, infrastructure, tax and benefit incentives, deregulation, privatisation) shown with an LRAS shift
evaluate in UK context (time lags, cost, budget deficit) rather than generic points
October 2020 · Paper 3 · Q1(e)25 marksAO1=4, AO2=4, AO3=8, AO4=925-mark essayEither/or
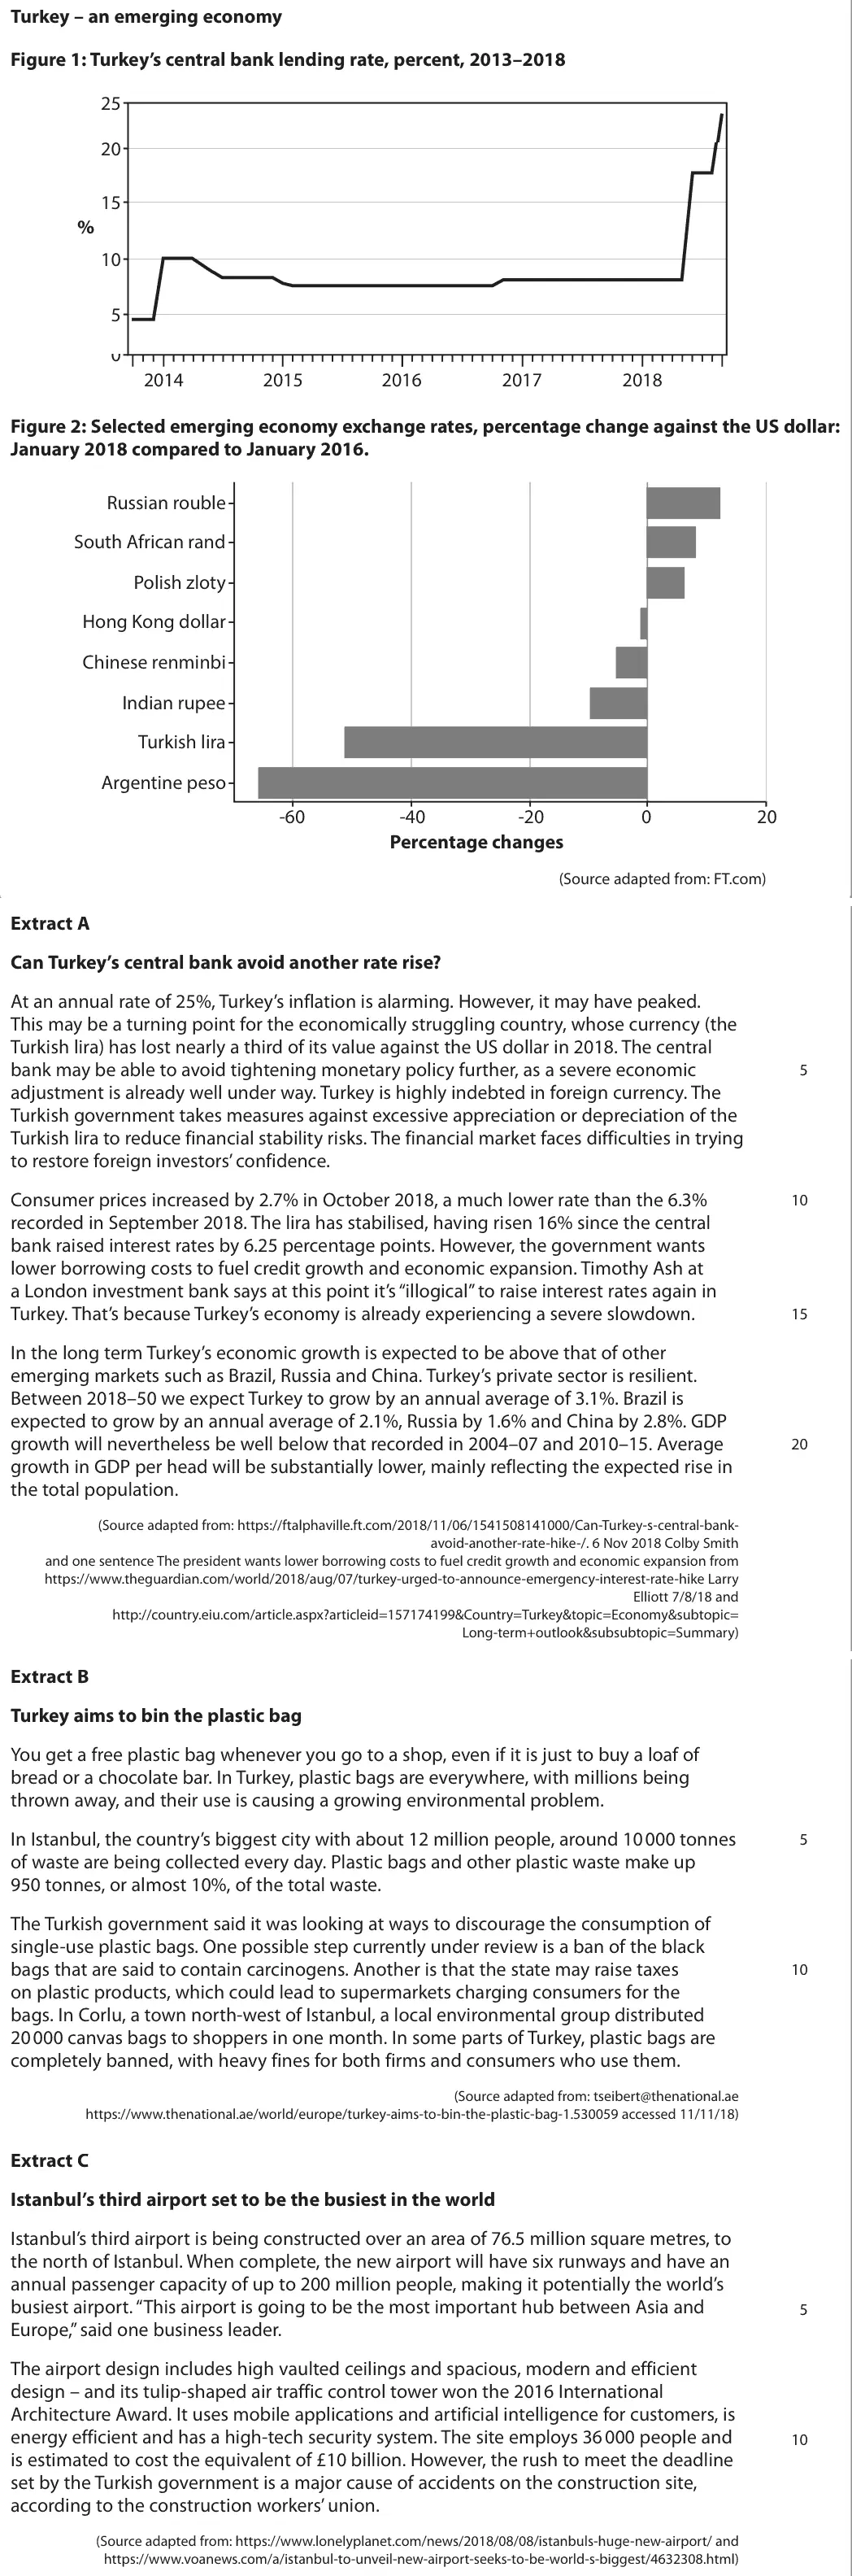
Data and extracts for question 1
Mark scheme, including the levels grid and indicative content
Notes from the mark scheme and report
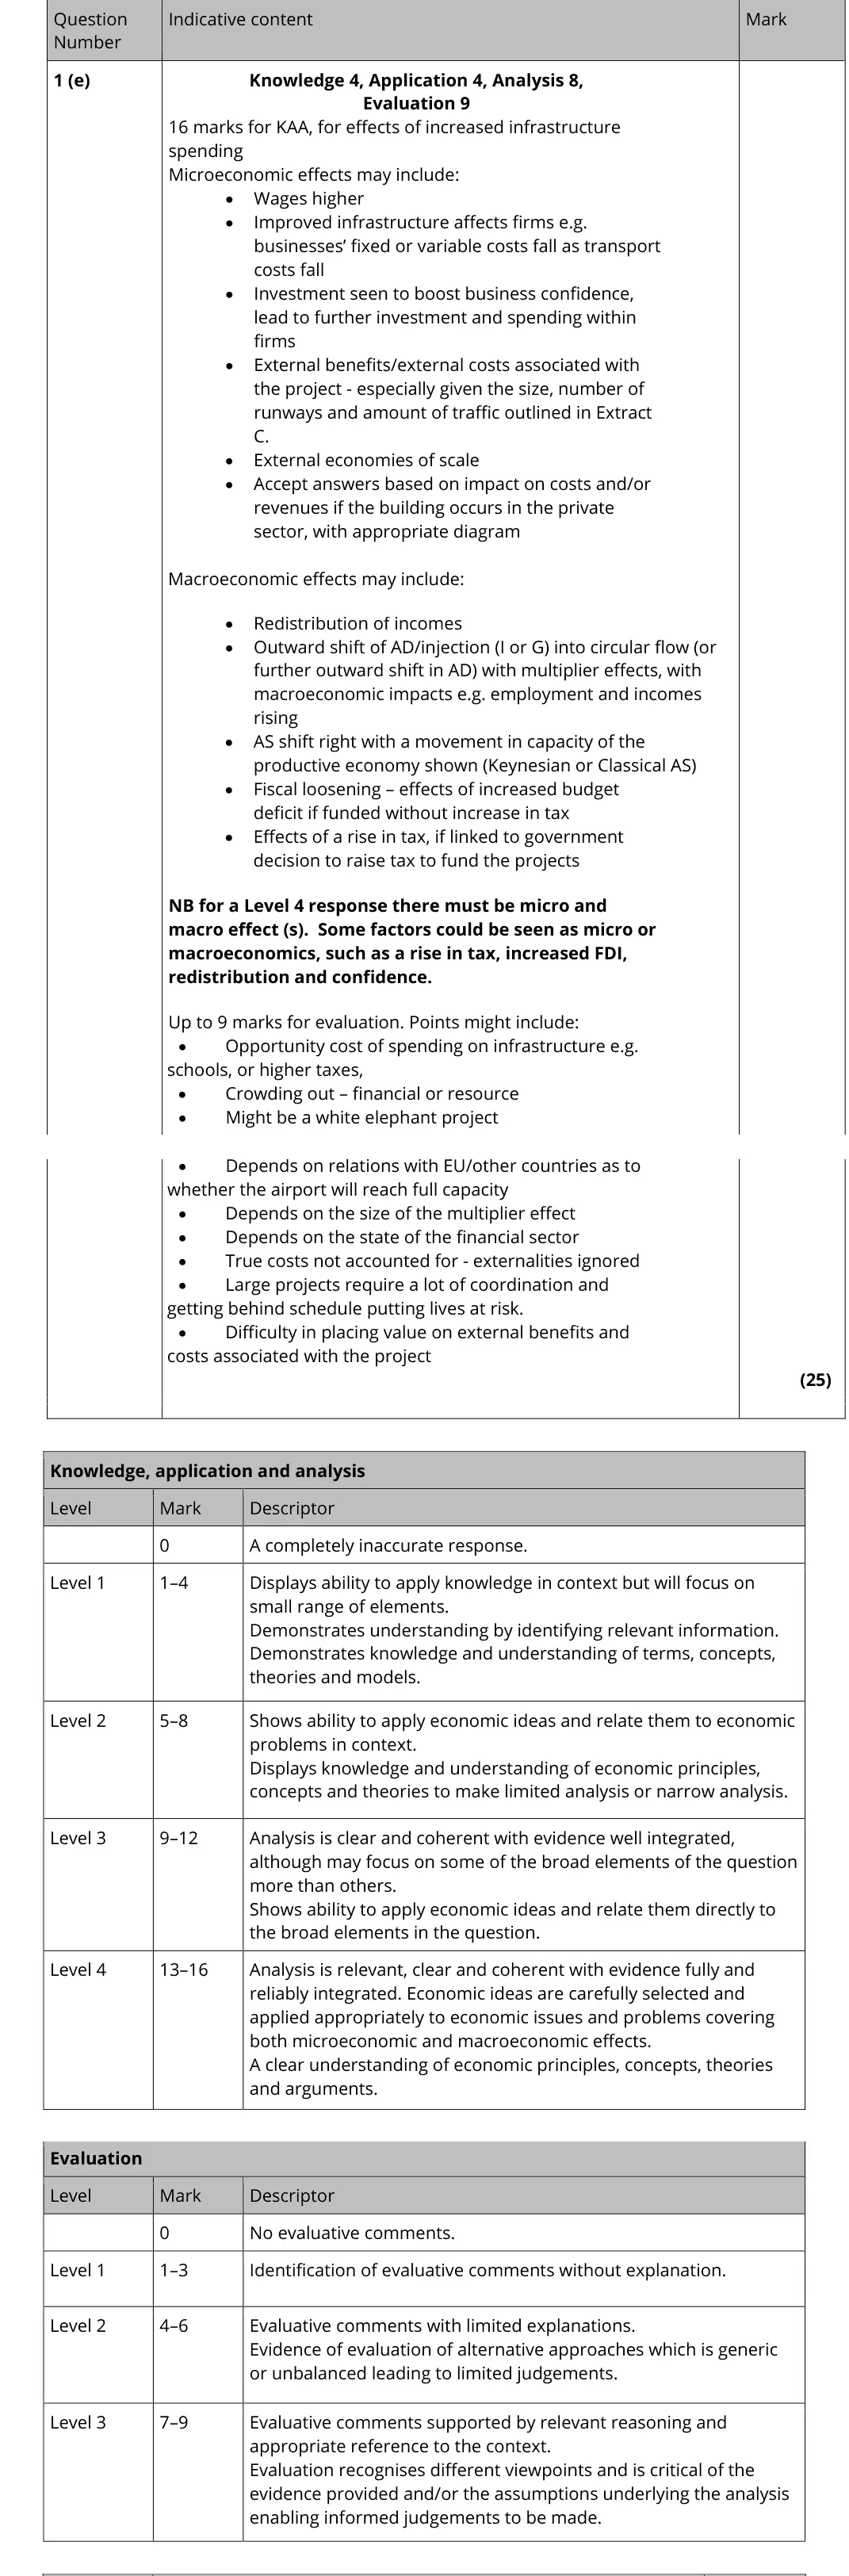
micro: lower transport costs for firms, external costs and benefits of the airport, external economies of scale
macro: AD up via I or G with the multiplier and LRAS shifting right
Level 4 needs both micro and macro
evaluate with opportunity cost, crowding out, white elephant risk, valuing externalities
Quantitative skills: QS 4 (construct and interpret a range of standard graphical forms)
October 2020 · Paper 3 · Q2(d)25 marksAO1=4, AO2=4, AO3=8, AO4=925-mark essayEither/or
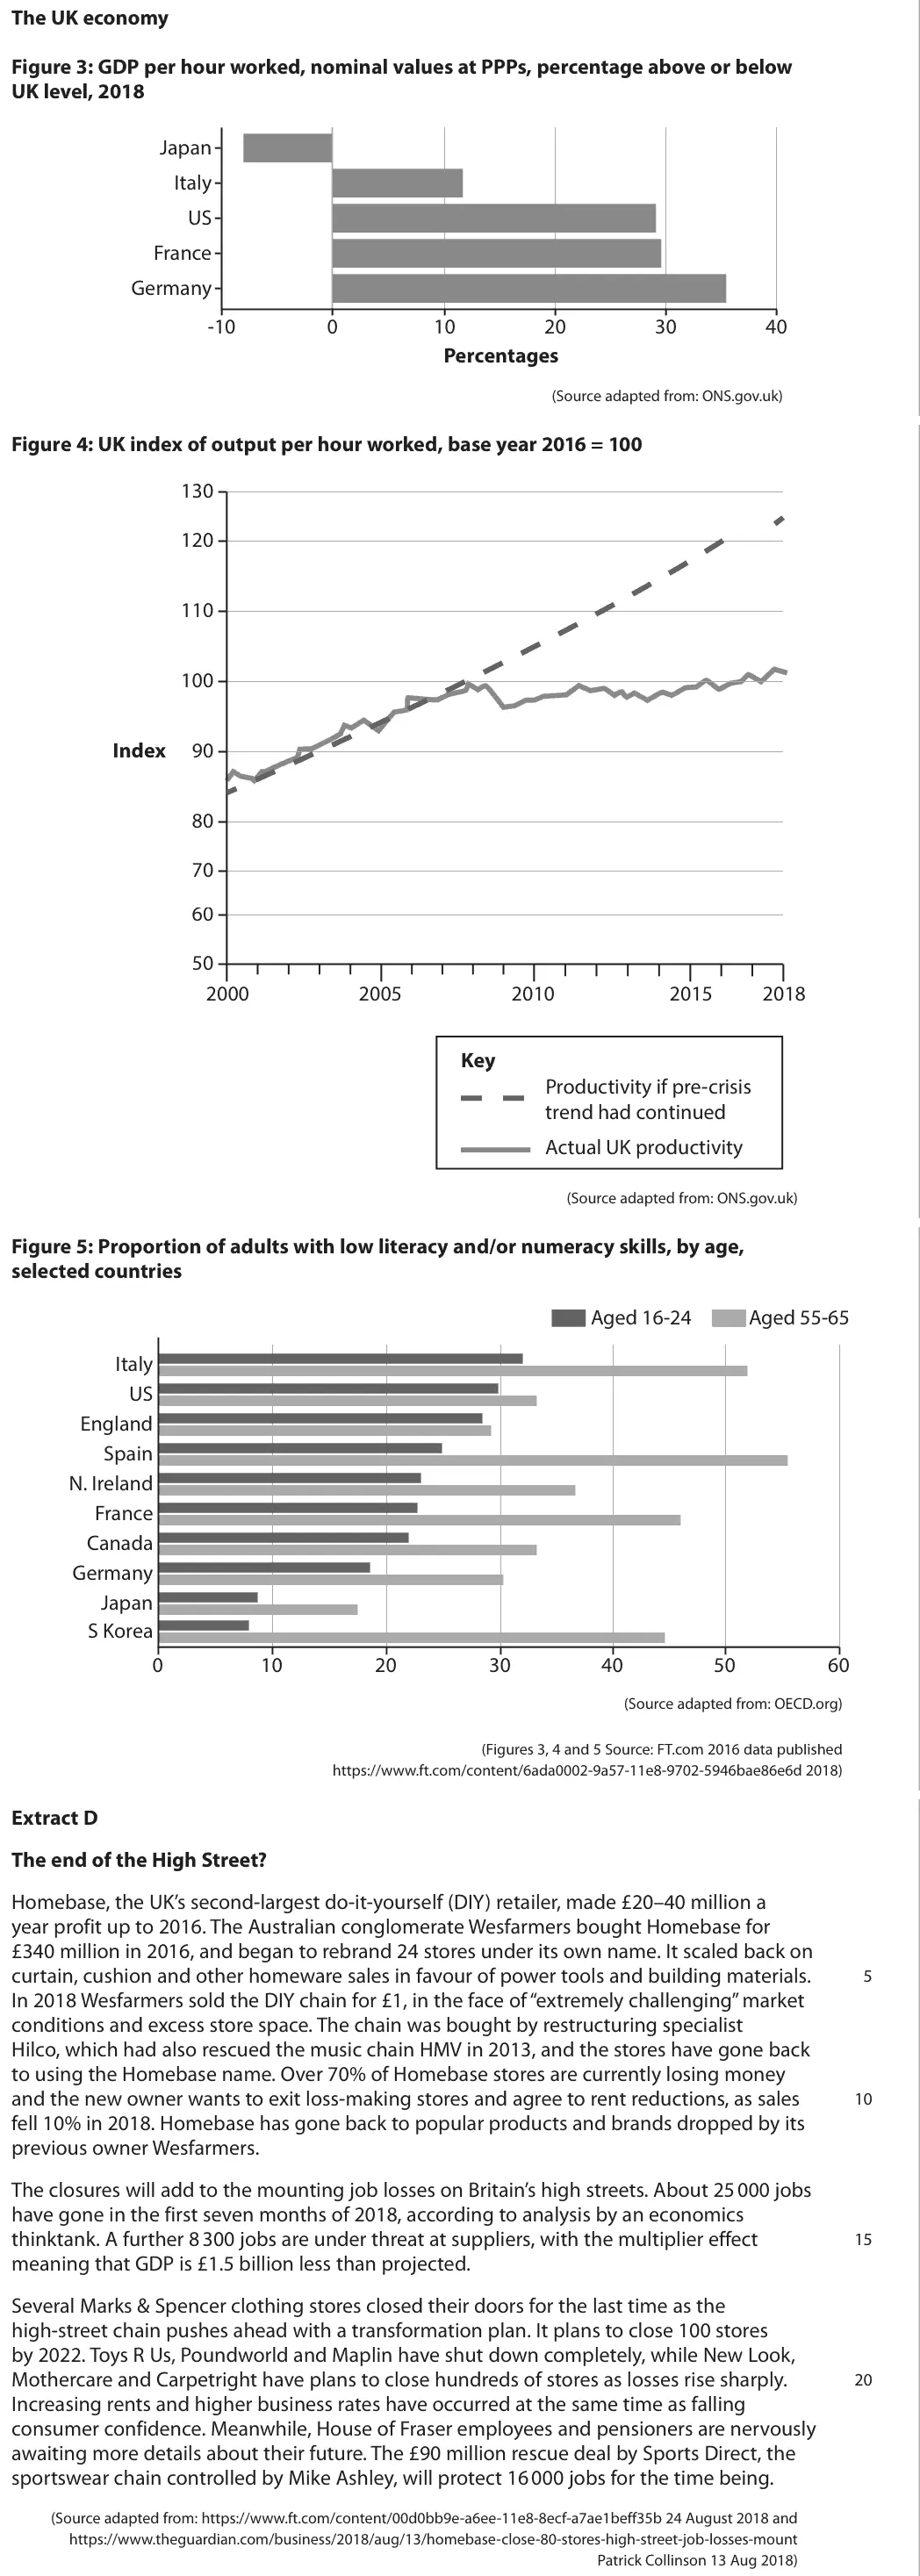
Data and extracts for question 2
Mark scheme, including the levels grid and indicative content
Examiner's comment
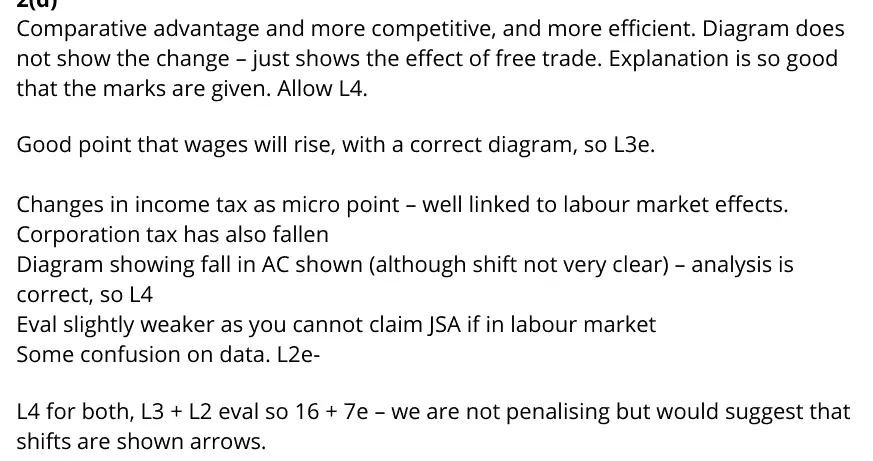
Comparative advantage and more competitive, and more efficient. Diagram does not show the change – just shows the effect of free trade. Explanation is so good that the marks are given. Allow L4. Good point that wages will rise, with a correct diagram, so L3e. Changes in income tax as micro point – well linked to labour market effects. Corporation tax has also fallen Diagram showing fall in AC shown (although shift not very clear) – analysis is correct, so L4 Eval slightly weaker as you cannot claim JSA if in labour market Some confusion on data. L2e- L4 for both, L3 + L2 eval so 16 + 7e – we are not penalising but would suggest that shifts are shown arrows.
Notes from the mark scheme and report
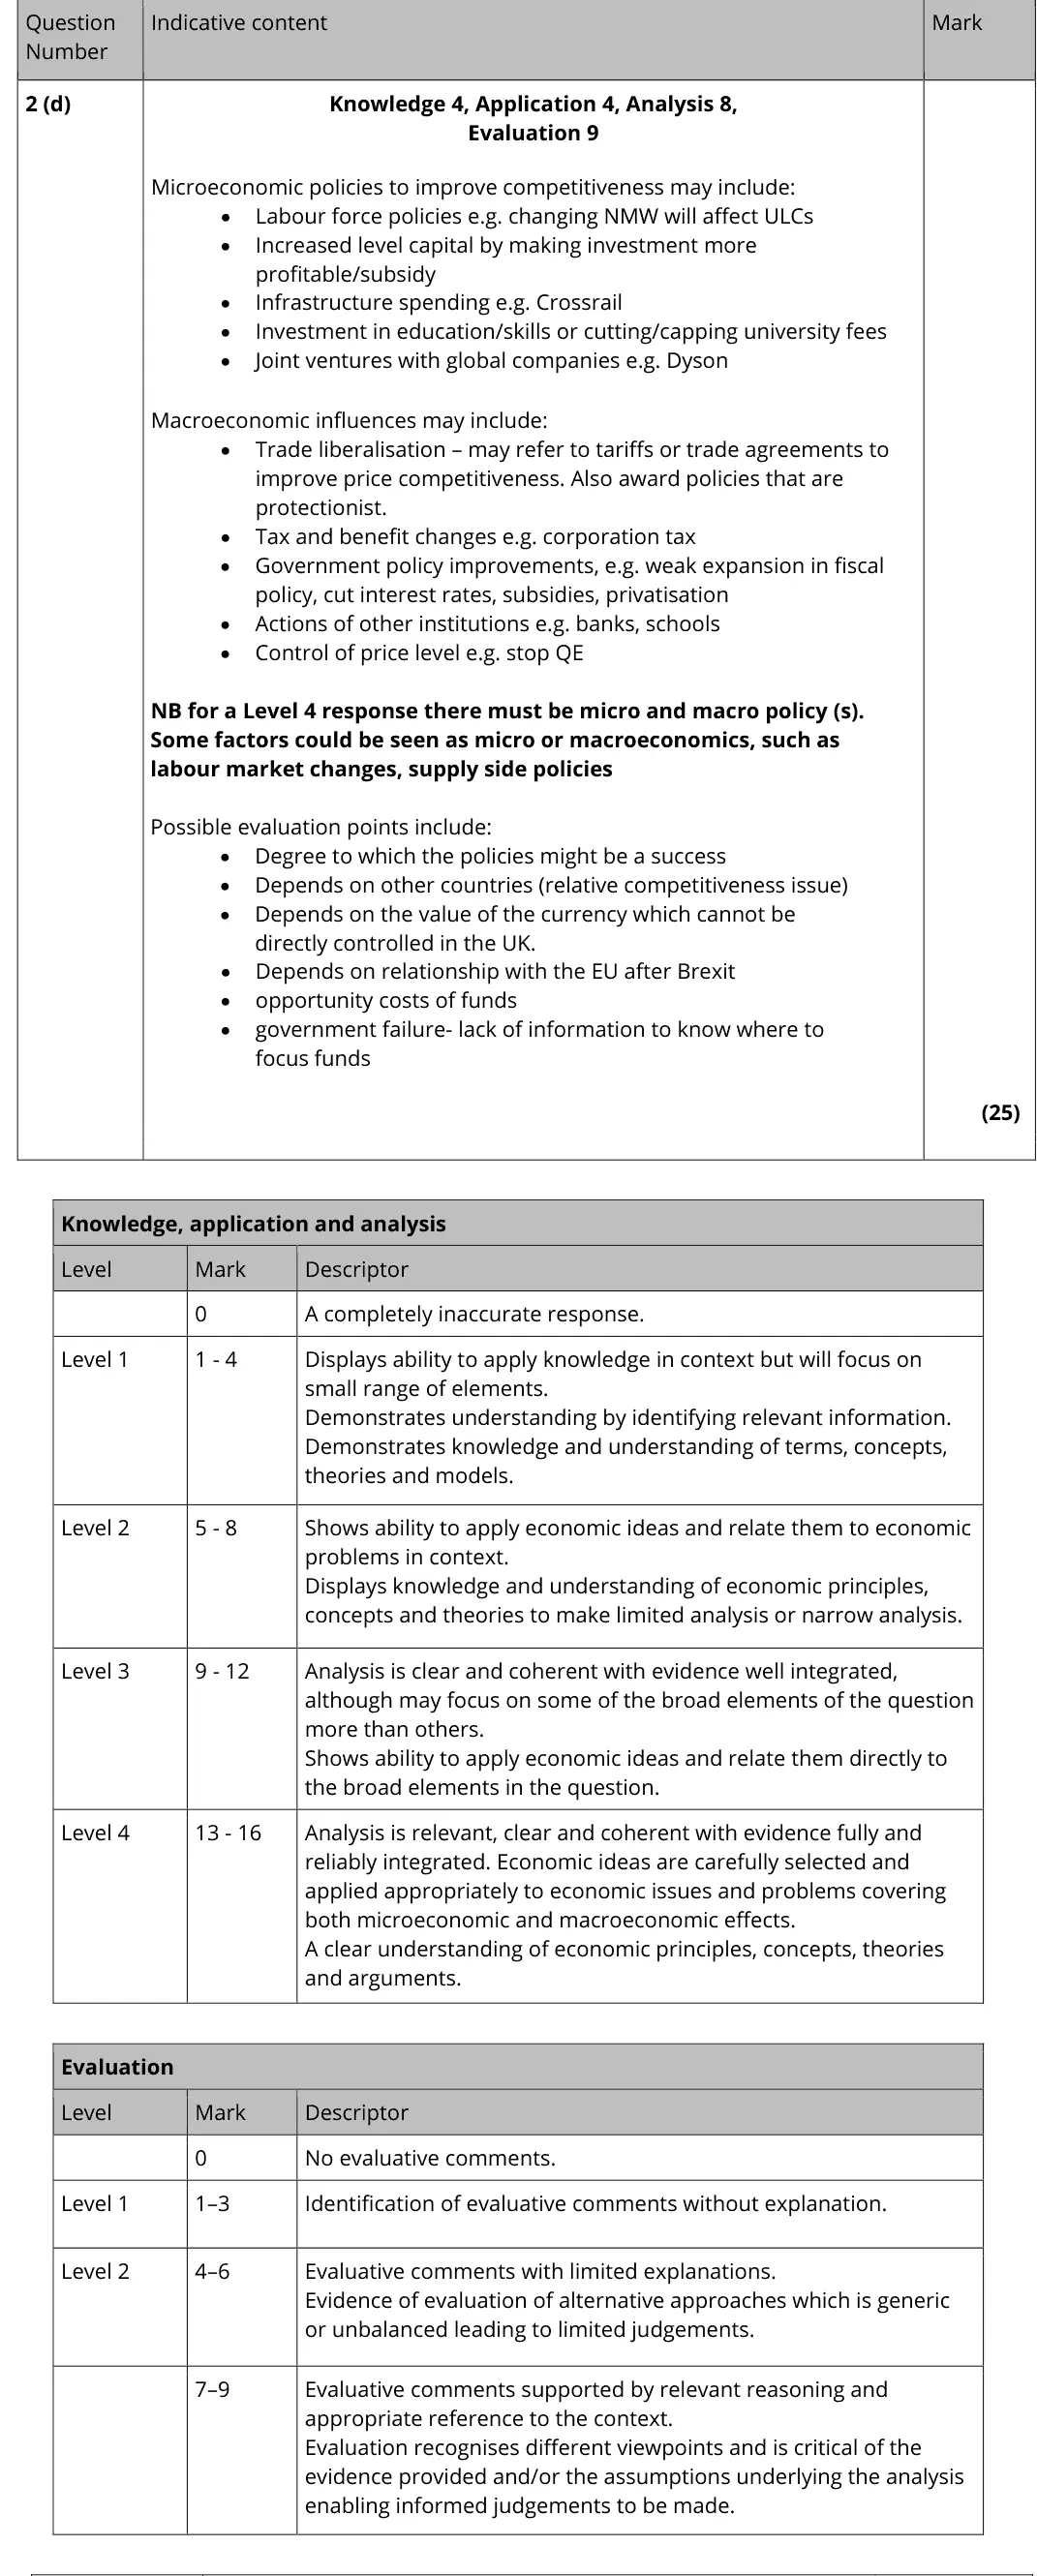
Level 4 needs both micro policies (labour costs and ULCs, investment subsidies, skills, infrastructure) and macro policies (trade liberalisation, tax changes, monetary policy)
show shifts with arrows on diagrams
evaluate with relative competitiveness, the exchange rate, Brexit, opportunity cost, government failure
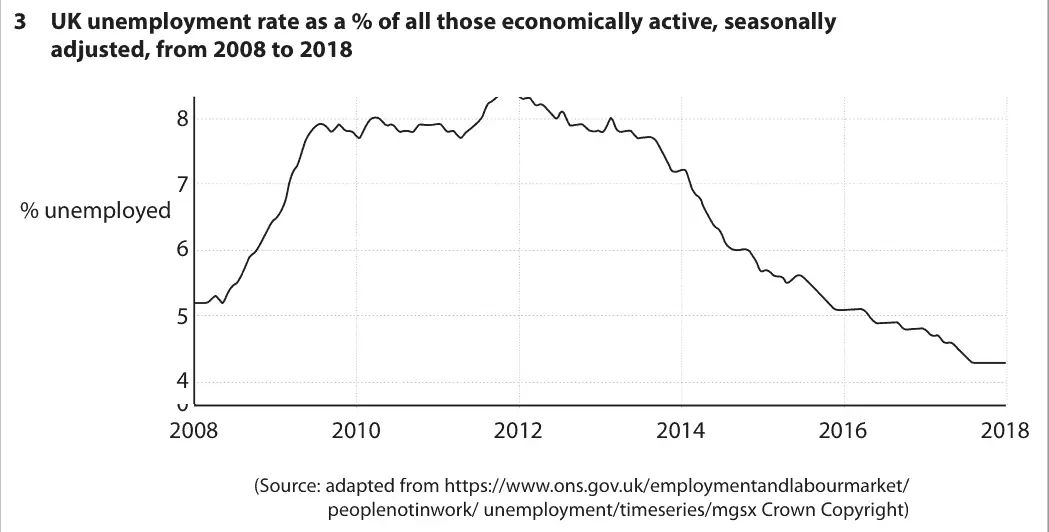
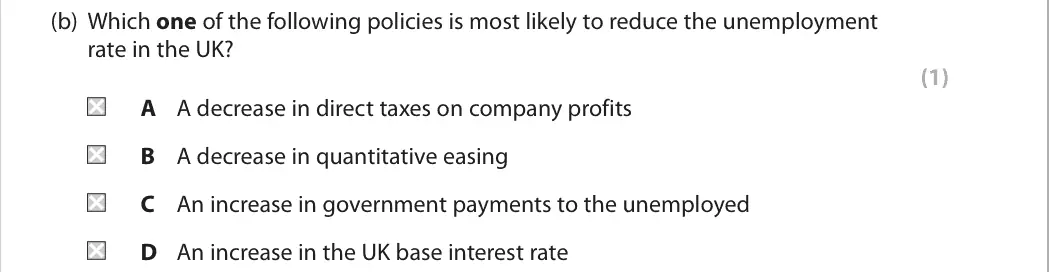
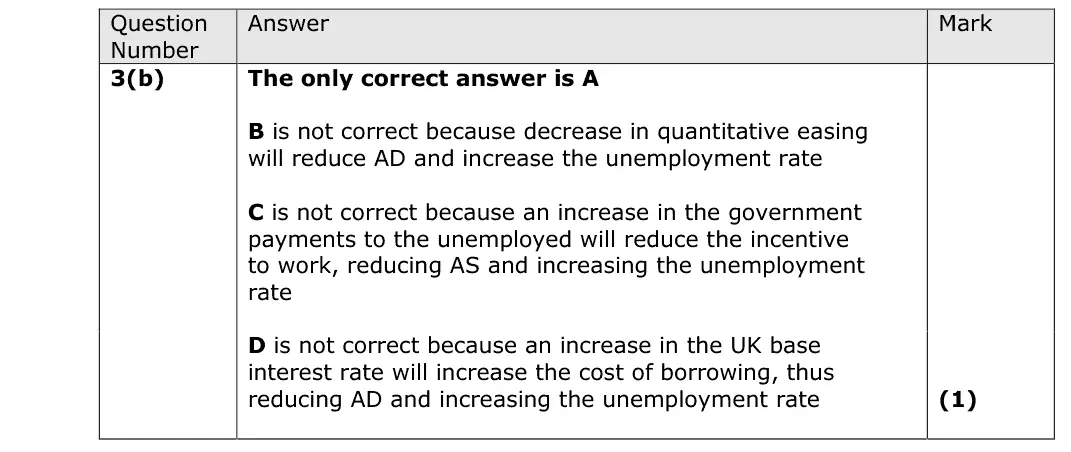
June 2019 · AS Paper 2 · Q3(b)1 markMultiple choice
Data and extracts for question 3
Answer
A
Mark scheme
Notes from the mark scheme and report
lower corporation tax raises the incentive to invest and hire, cutting unemployment (A)
B less QE and D a higher base rate reduce AD
C higher benefits reduce the incentive to work
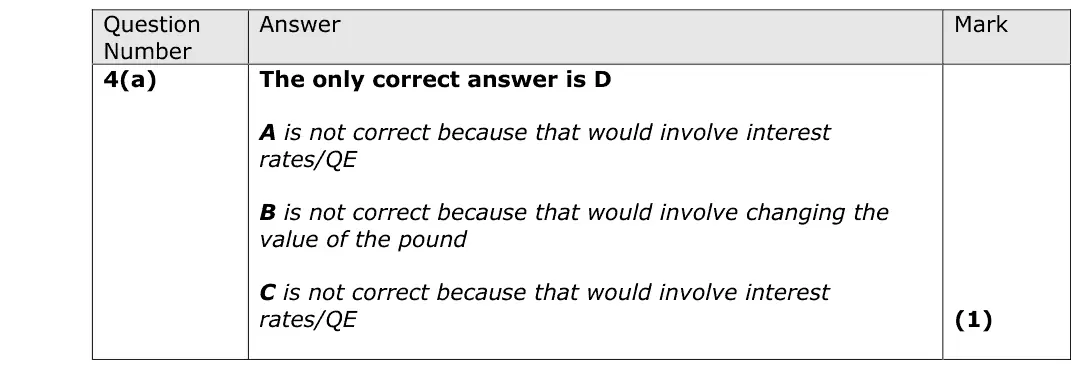
June 2019 · Paper 2 · Q4(a)1 markMultiple choice
Data and extracts for question 4
Answer
D
Mark scheme
Notes from the mark scheme and report
a cut in corporation tax to improve incentives is a supply-side policy (D)
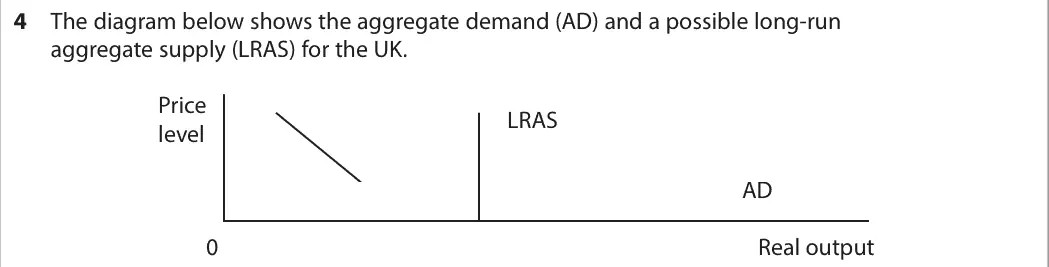
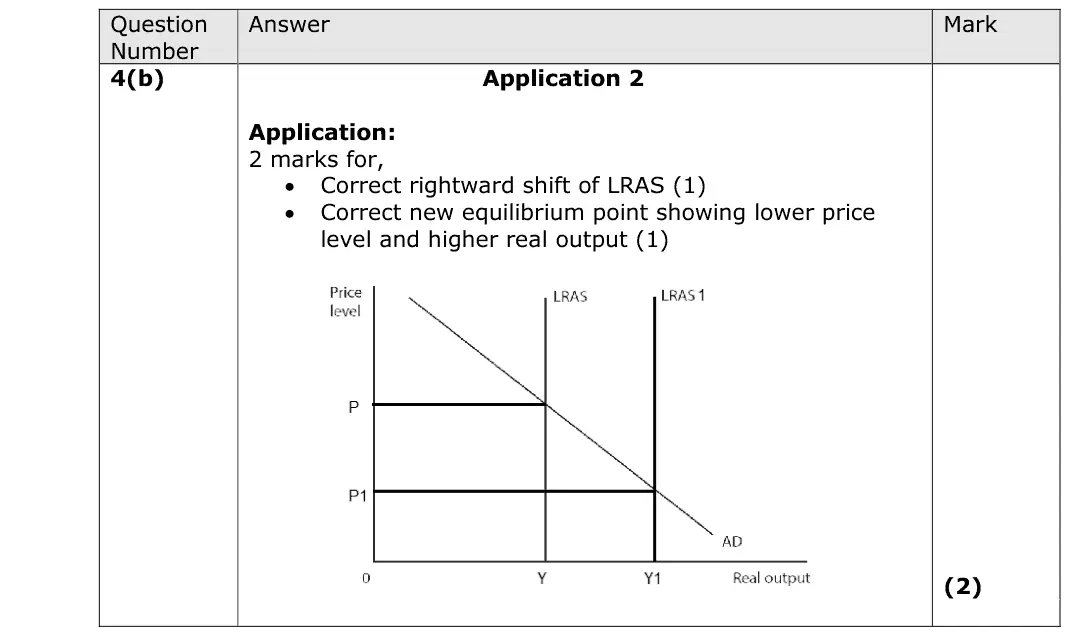
This question requires candidates to draw the likely impact of government policy to promote business competition in context of an AD/AS diagram. Marks were awarded as 1 mark for the rightward shift in LRAS and 1 mark for a new equilibrium showing lower price level and higher real output. Most candidates achieved the 2 marks on this question.
Notes from the mark scheme and report
competition policy shifts LRAS right
the new equilibrium has a lower price level and higher real output
Quantitative skills: QS 4 (construct and interpret a range of standard graphical forms)
June 2019 · AS Paper 2 · Q4(c)1 markMultiple choice
Data and extracts for question 4
Answer
A
Mark scheme
Notes from the mark scheme and report
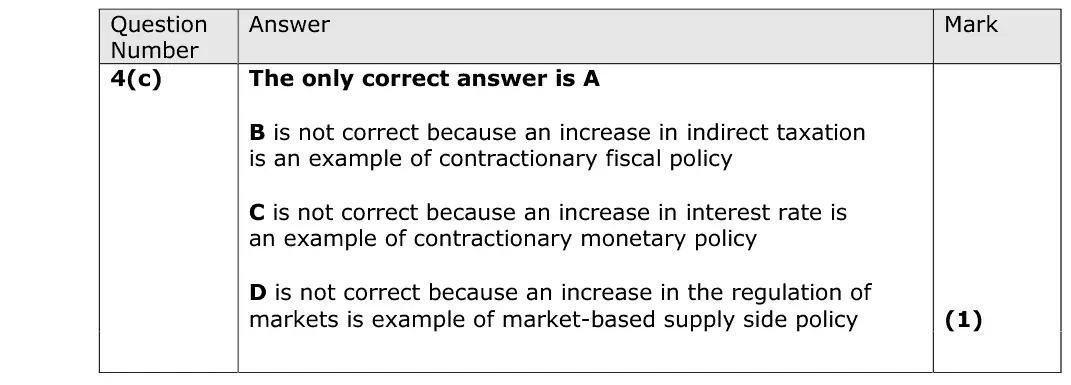
improving infrastructure is an interventionist supply-side policy (A)
B and C are contractionary demand-side policies
D more regulation is not market-based deregulation
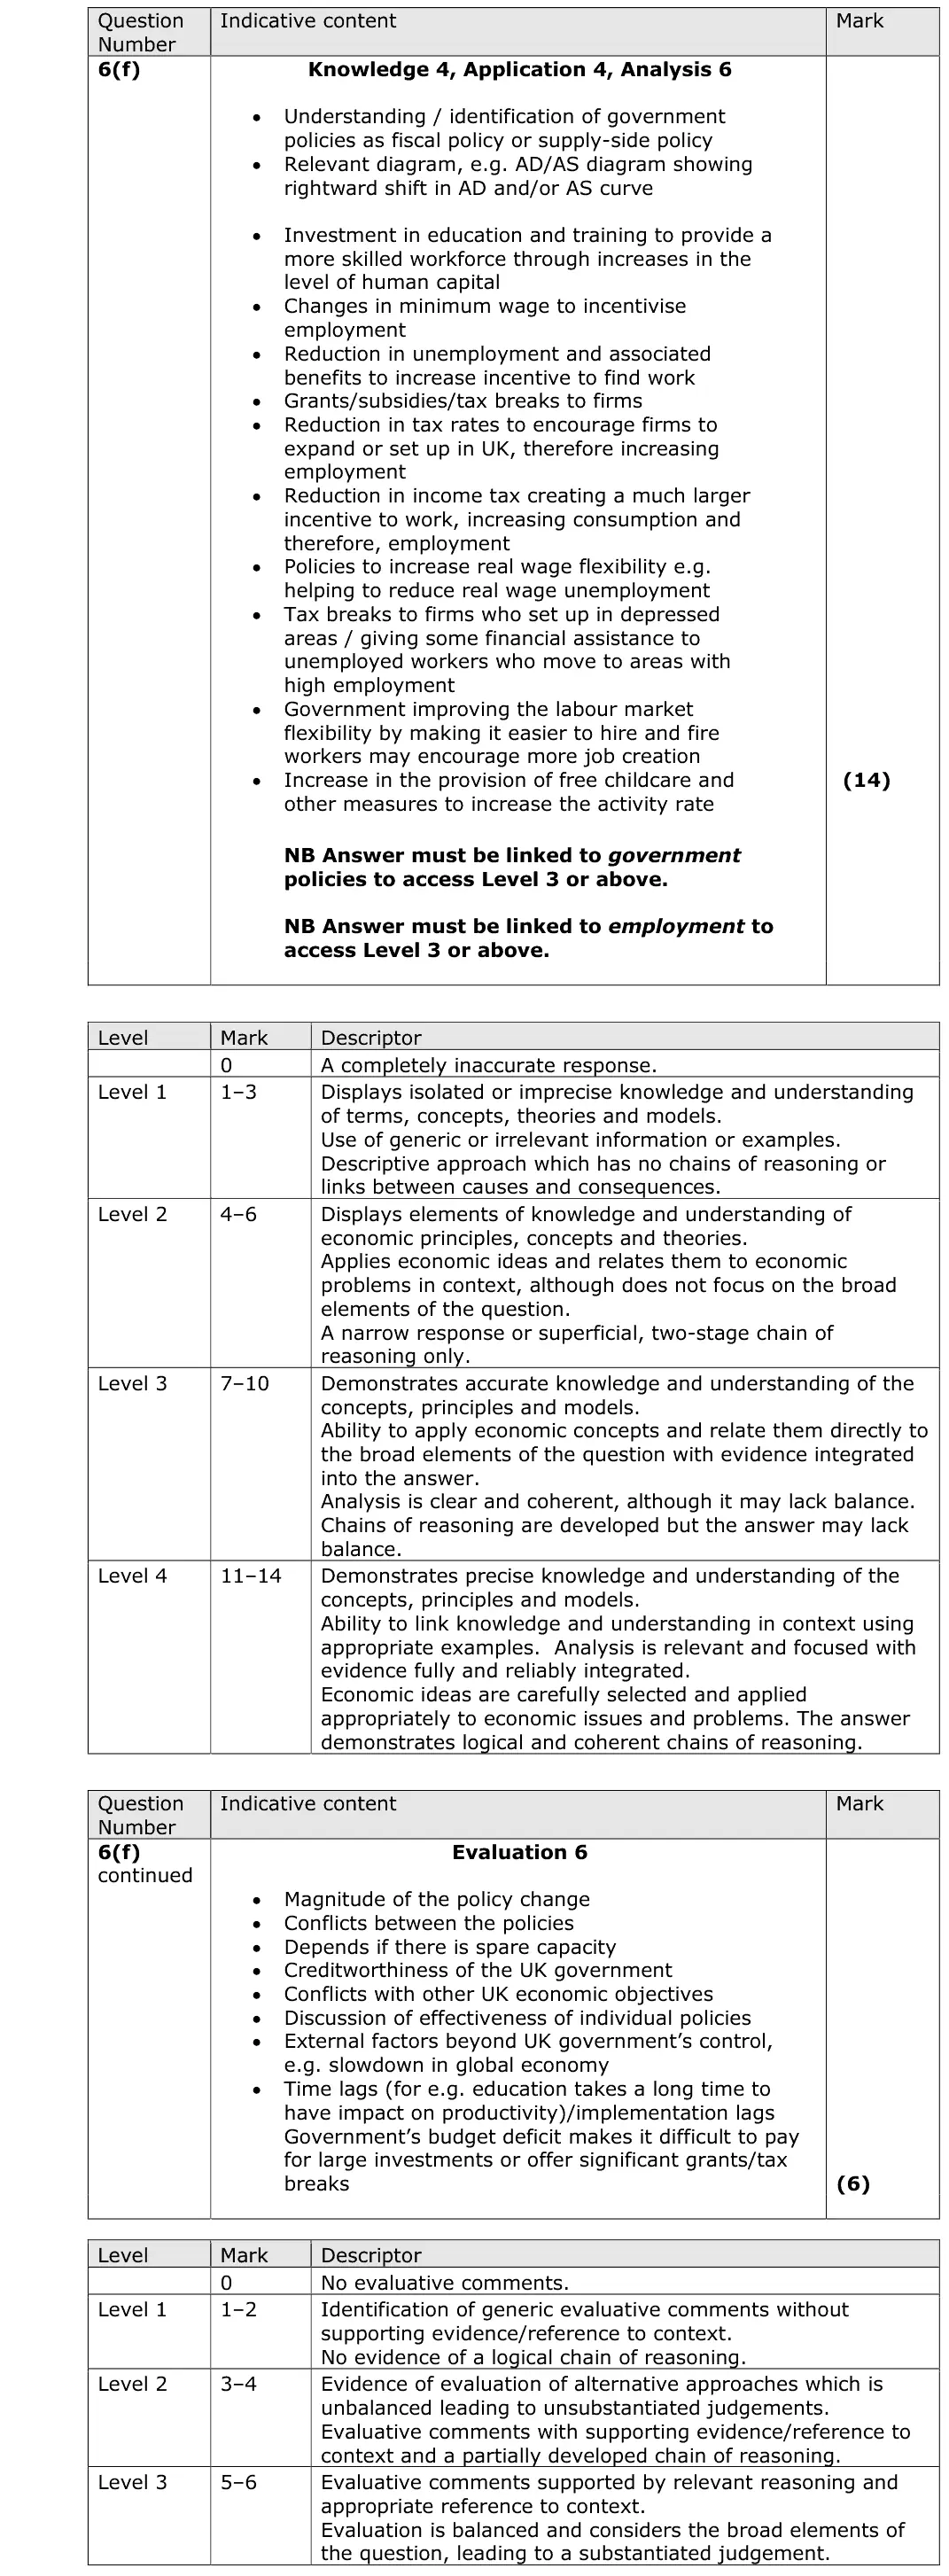
June 2018 · AS Paper 2 · Q6(f)20 marksAO1=4, AO2=4, AO3=6, AO4=620-mark essayEither/or
Data and extracts for question 6
Mark scheme, including the levels grid and indicative content
Examiner's comment
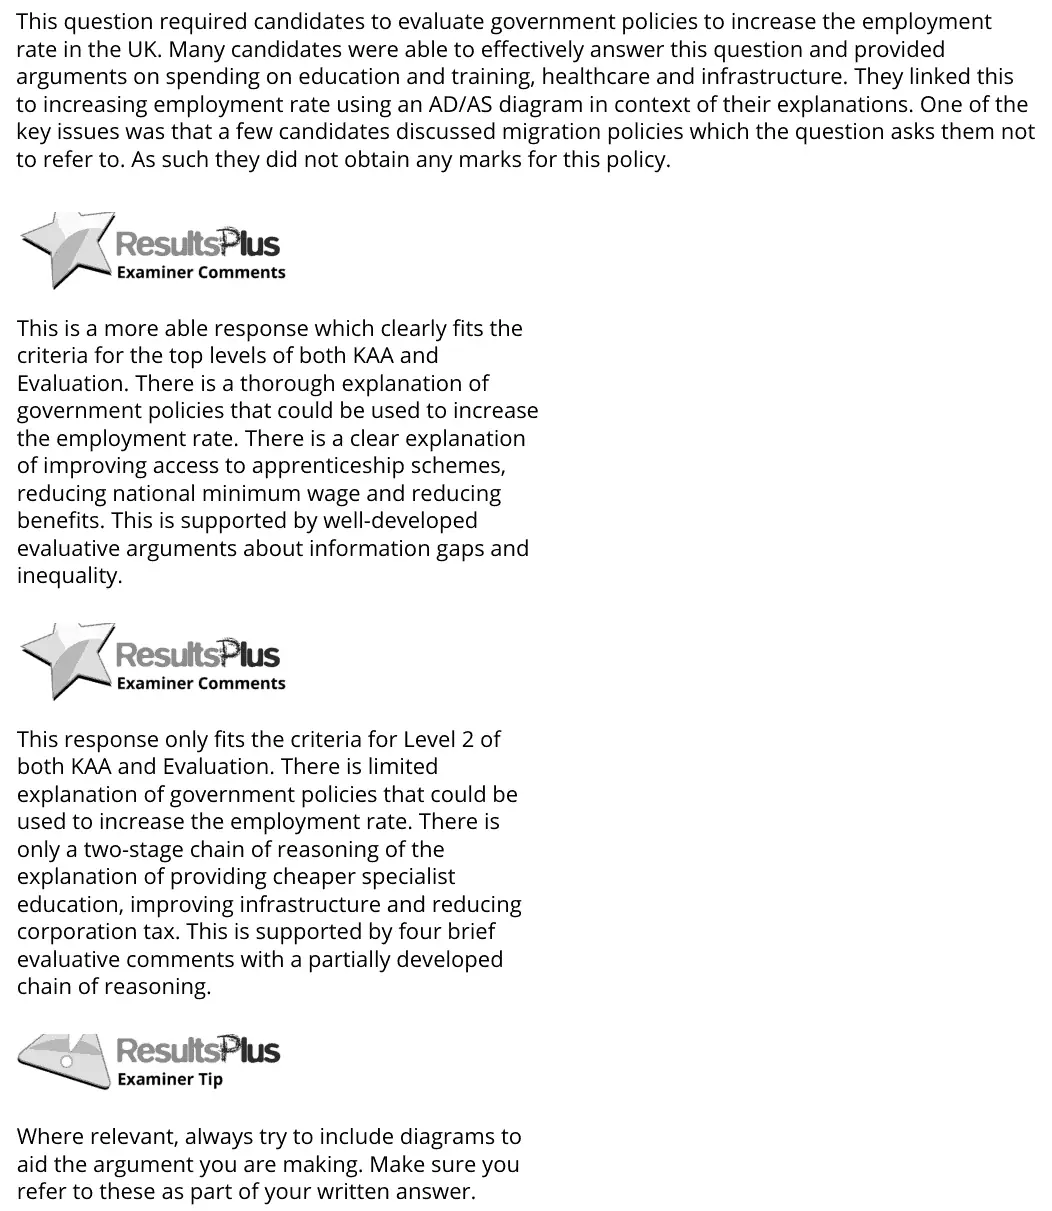
This question required candidates to evaluate government policies to increase the employment rate in the UK. Many candidates were able to effectively answer this question and provided arguments on spending on education and training, healthcare and infrastructure. They linked this to increasing employment rate using an AD/AS diagram in context of their explanations. One of the key issues was that a few candidates discussed migration policies which the question asks them not to refer to. As such they did not obtain any marks for this policy. This is a more able response which clearly fits the criteria for the top levels of both KAA and Evaluation. There is a thorough explanation of government policies that could be used to increase the employment rate. There is a clear explanation of improving access to apprenticeship schemes, reducing national minimum wage and reducing benefits. This is supported by well-developed evaluative arguments about information gaps and inequality. This response only fits the criteria for Level 2 of both KAA and Evaluation. There is limited explanation of government policies that could be used to increase the employment rate. There is only a two-stage chain of reasoning of the explanation of providing cheaper specialist education, improving infrastructure and reducing corporation tax. This is supported by four brief evaluative comments with a partially developed chain of reasoning. Where relevant, always try to include diagrams to aid the argument you are making. Make sure you refer to these as part of your written answer.
Notes from the mark scheme and report
migration policies earn nothing
education and training, apprenticeships, benefit reforms, infrastructure, fiscal stimulus with AD/AS diagrams
evaluate with cost, time lags, information gaps, inequality
June 2018 · Paper 3 · Q2(e)25 marksAO1=4, AO2=4, AO3=8, AO4=925-mark essayEither/or
Data and extracts for question 2
Mark scheme, including the levels grid and indicative content
Examiner's comment
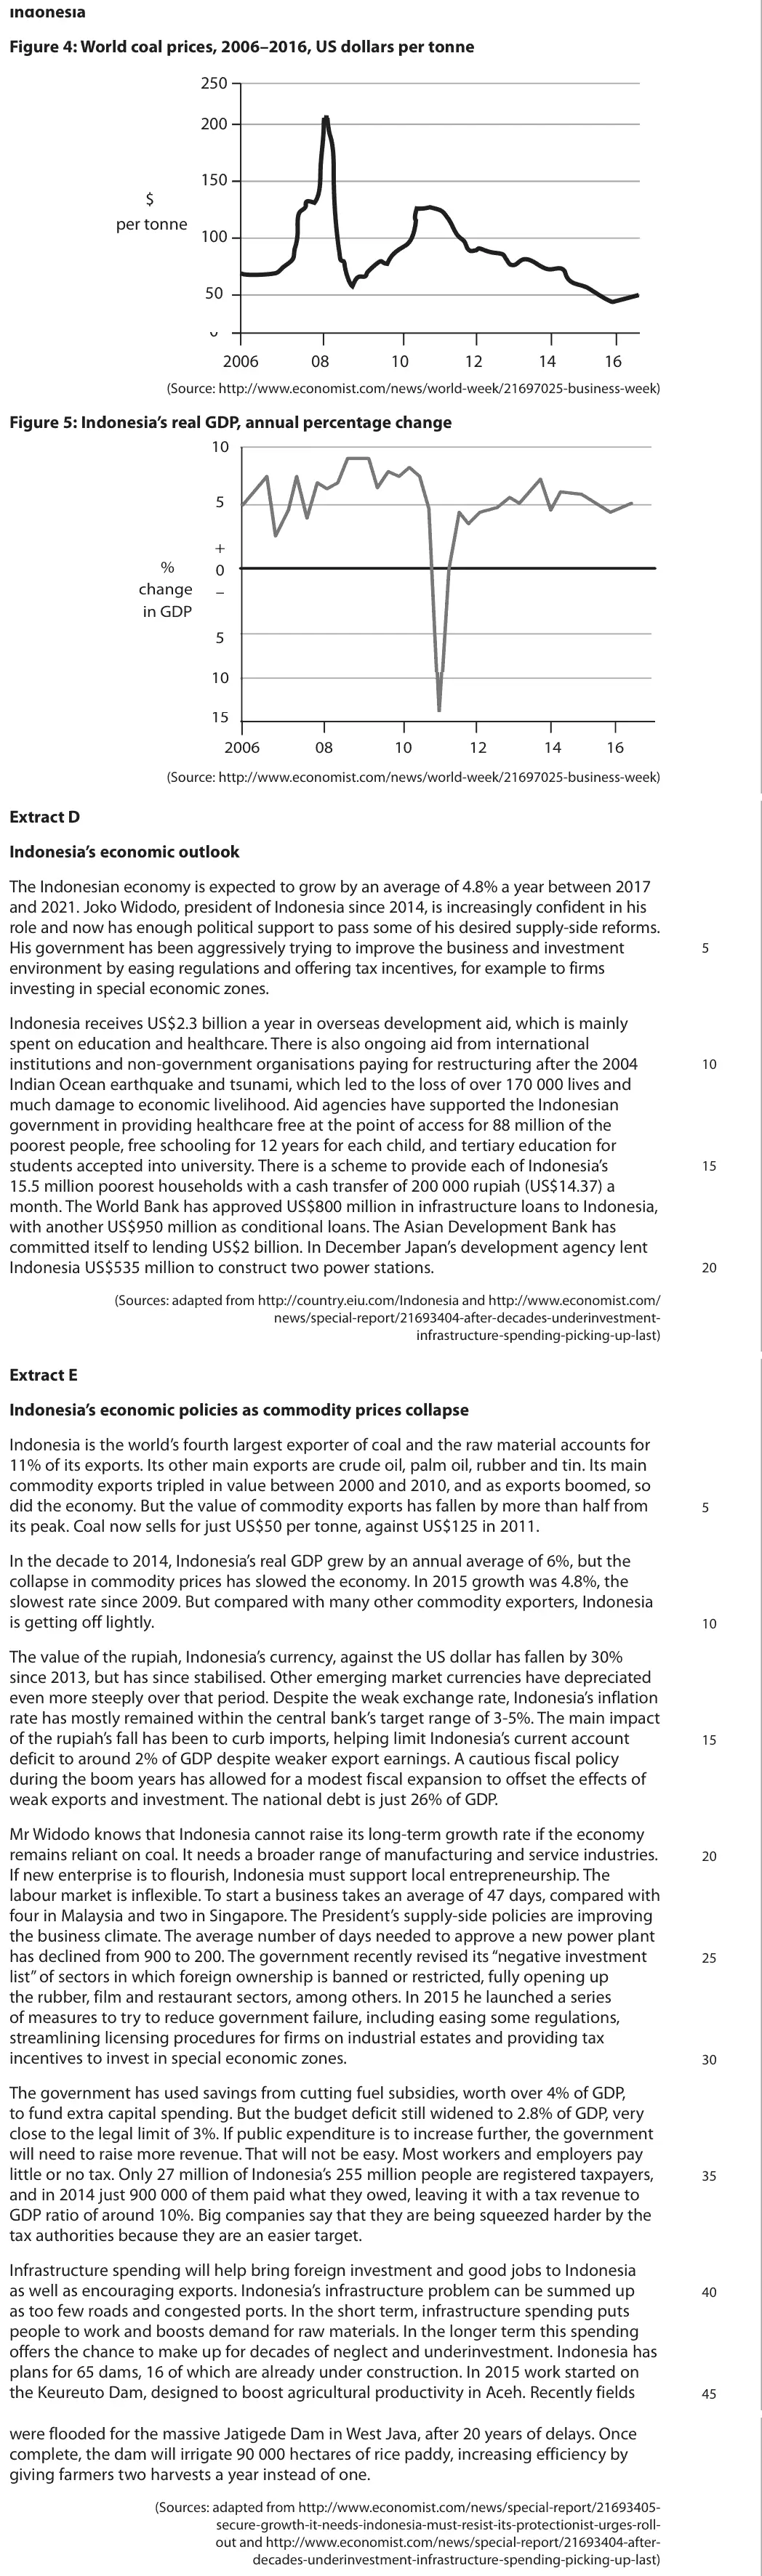
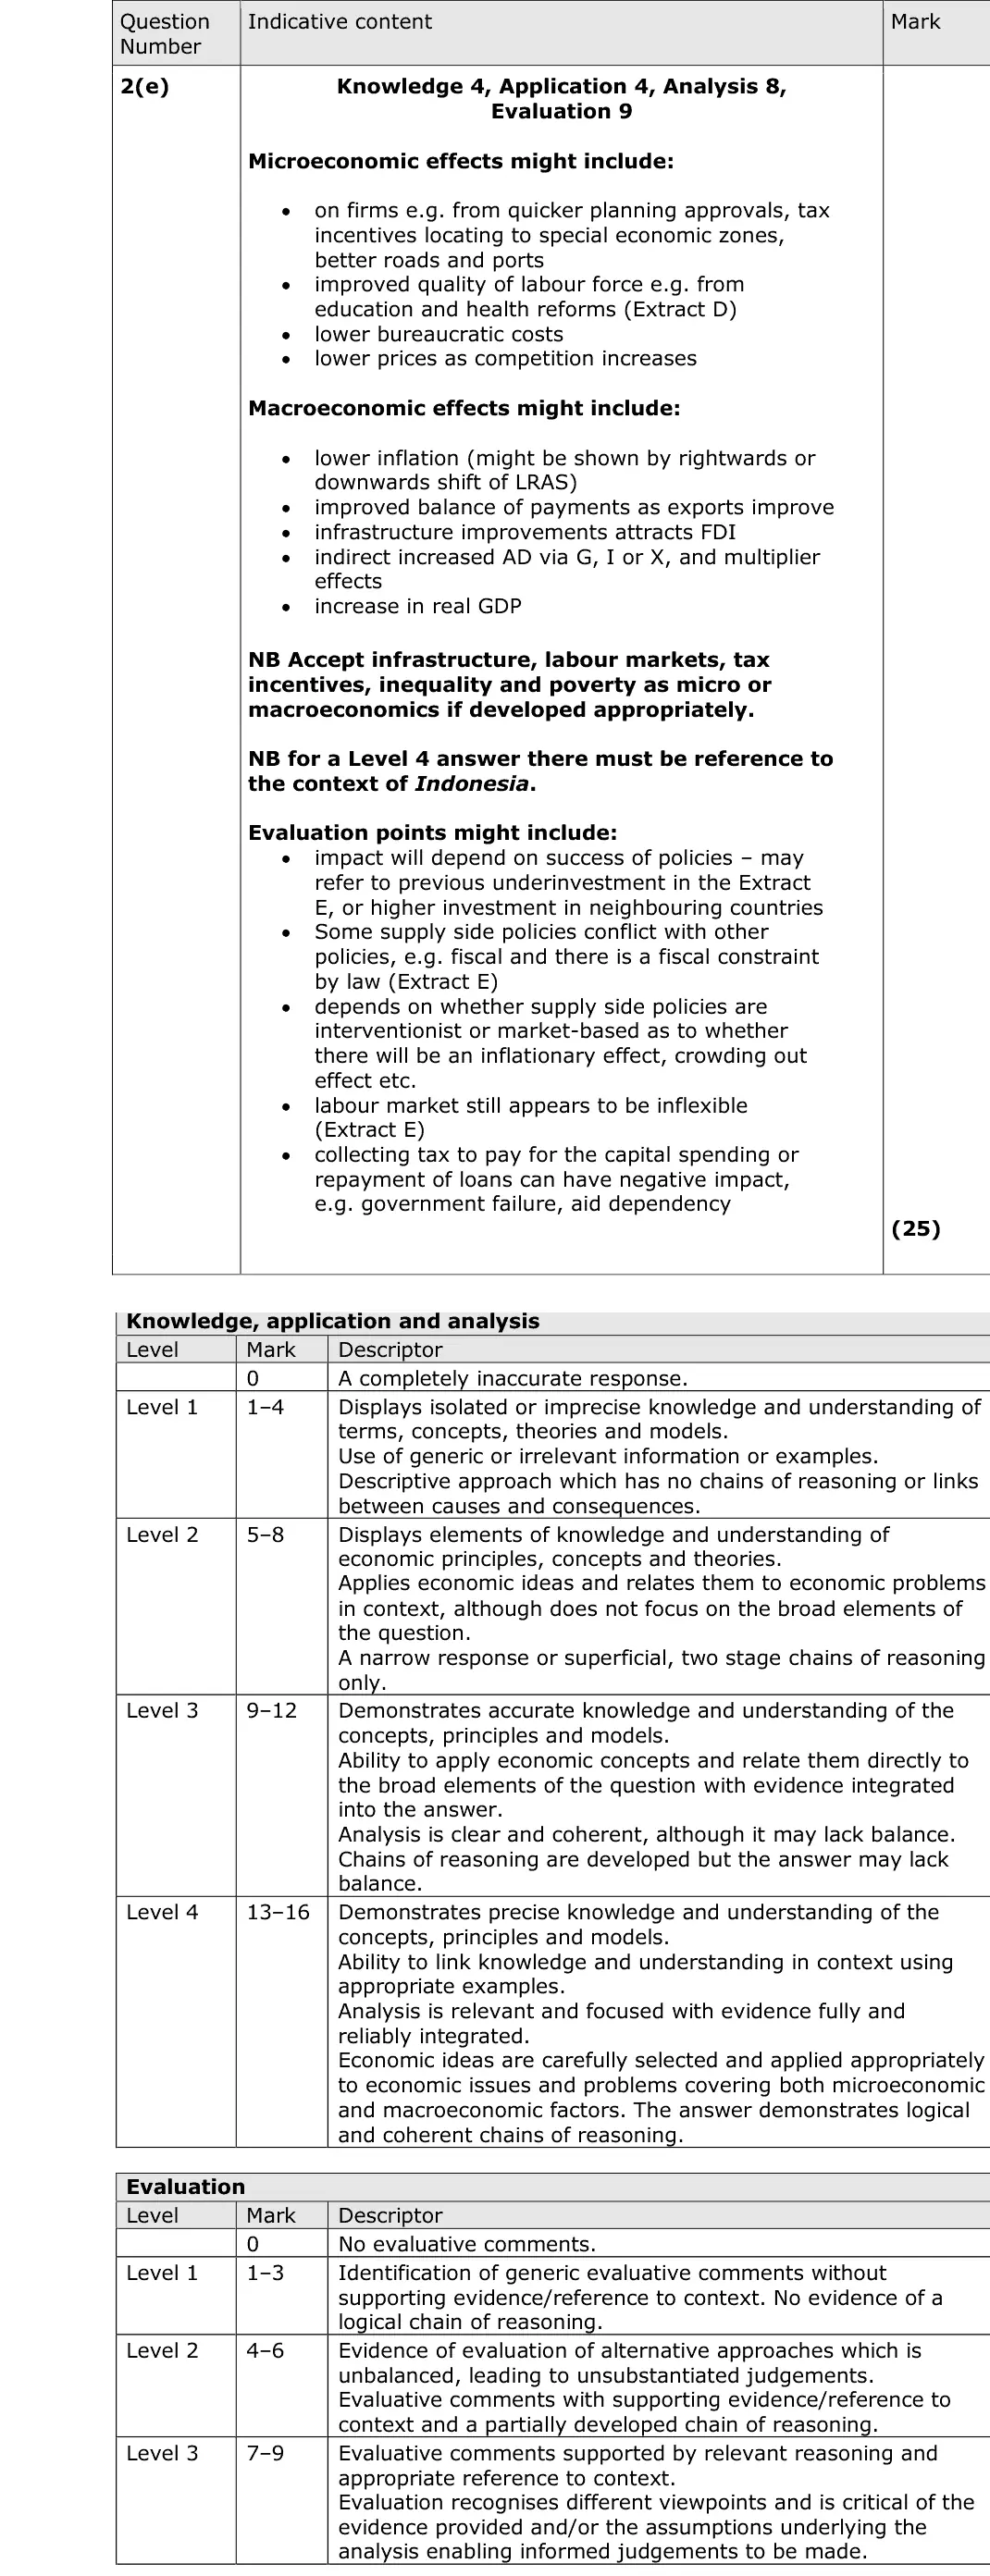
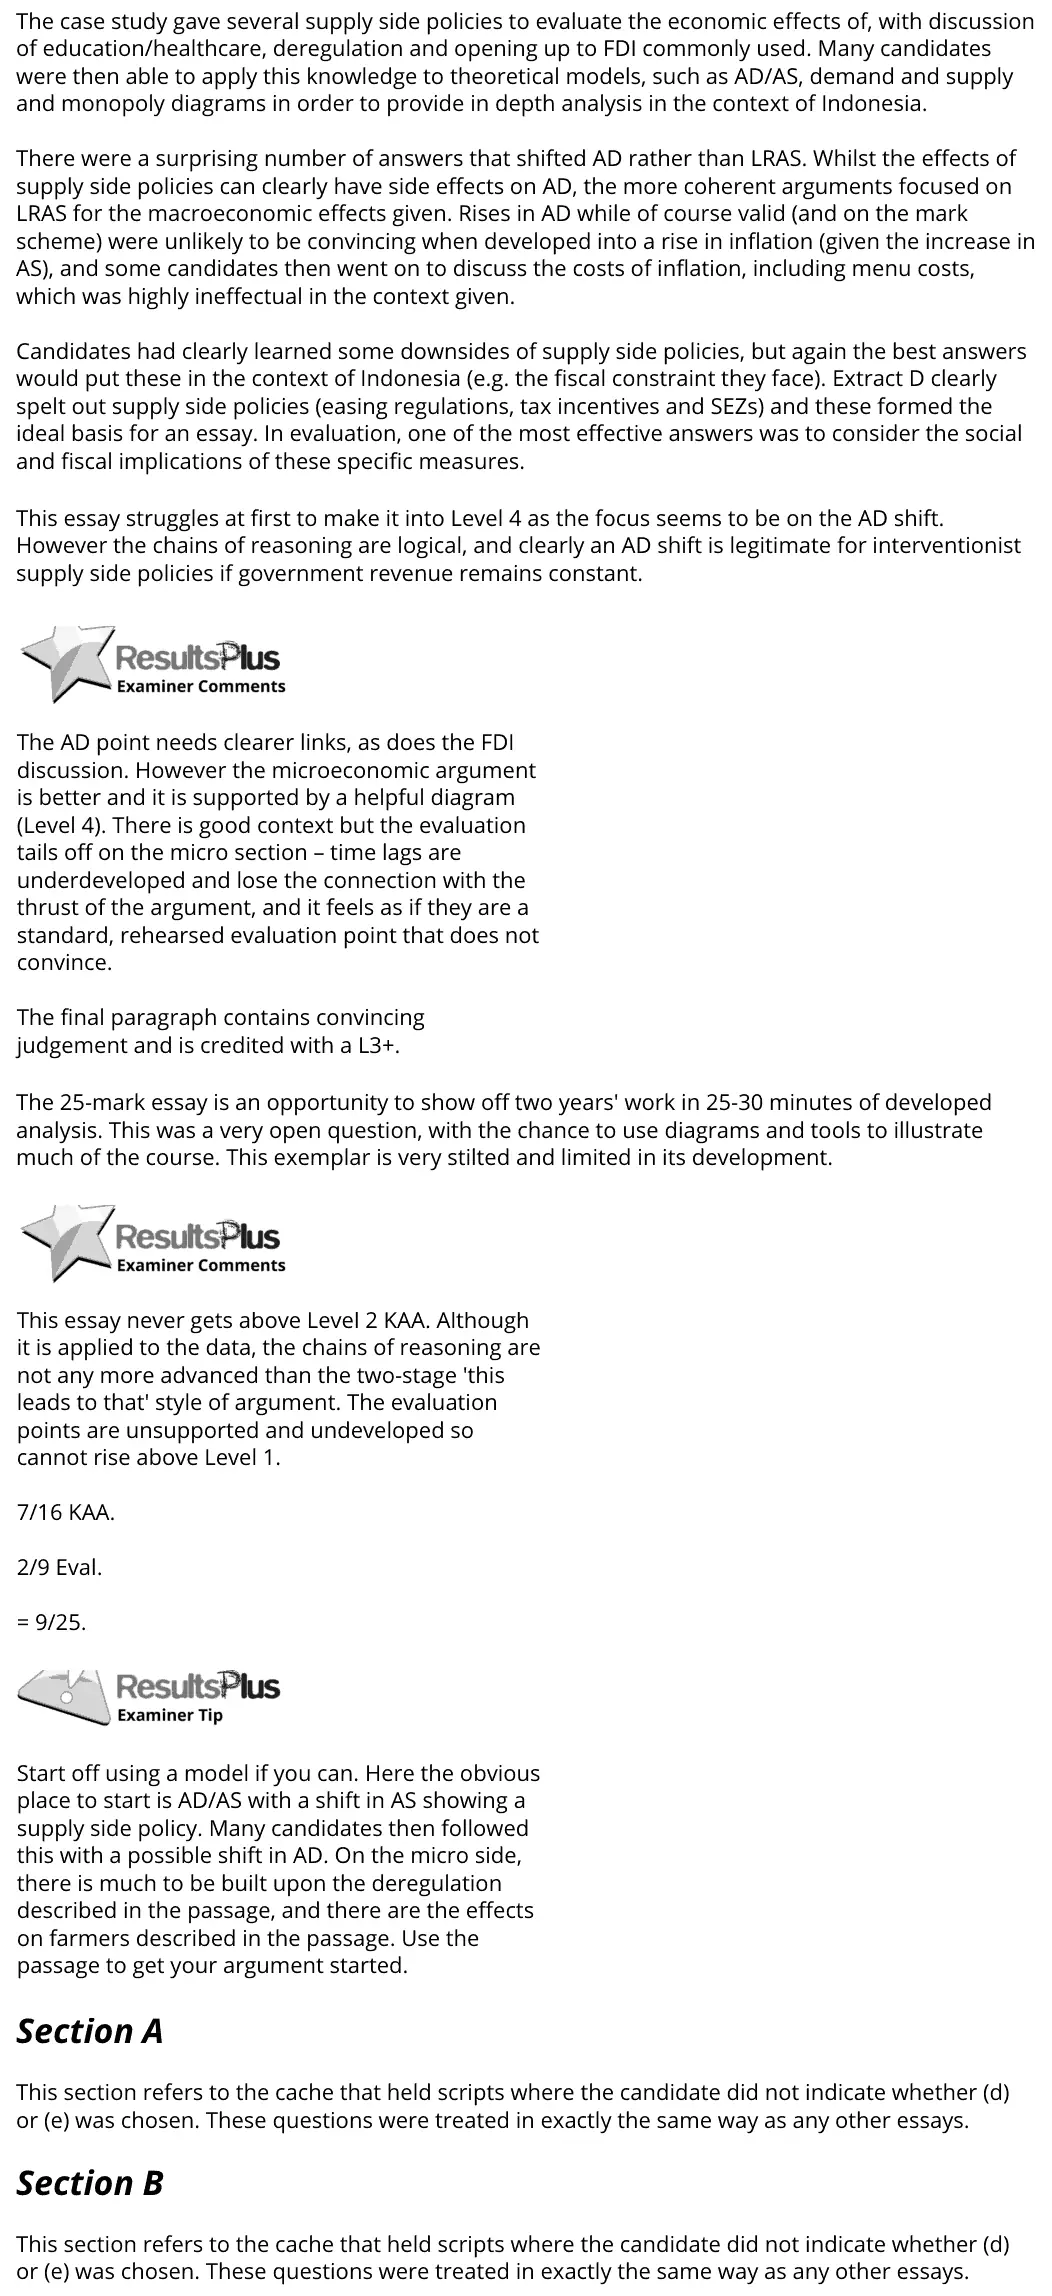
The case study gave several supply side policies to evaluate the economic effects of, with discussion of education/healthcare, deregulation and opening up to FDI commonly used. Many candidates were then able to apply this knowledge to theoretical models, such as AD/AS, demand and supply and monopoly diagrams in order to provide in depth analysis in the context of Indonesia. There were a surprising number of answers that shifted AD rather than LRAS. Whilst the effects of supply side policies can clearly have side effects on AD, the more coherent arguments focused on LRAS for the macroeconomic effects given. Rises in AD while of course valid (and on the mark scheme) were unlikely to be convincing when developed into a rise in inflation (given the increase in AS), and some candidates then went on to discuss the costs of inflation, including menu costs, which was highly ineffectual in the context given. Candidates had clearly learned some downsides of supply side policies, but again the best answers would put these in the context of Indonesia (e.g. the fiscal constraint they face). Extract D clearly spelt out supply side policies (easing regulations, tax incentives and SEZs) and these formed the ideal basis for an essay. In evaluation, one of the most effective answers was to consider the social and fiscal implications of these specific measures. This essay struggles at first to make it into Level 4 as the focus seems to be on the AD shift. However the chains of reasoning are logical, and clearly an AD shift is legitimate for interventionist supply side policies if government revenue remains constant. The AD point needs clearer links, as does the FDI discussion. However the microeconomic argument is better and it is supported by a helpful diagram (Level 4). There is good context but the evaluation tails off on the micro section – time lags are underdeveloped and lose the connection with the thrust of the argument, and it feels as if they are a standard, rehearsed evaluation point that does not convince. The final paragraph contains convincing judgement and is credited with a L3+. The 25-mark essay is an opportunity to show off two years' work in 25-30 minutes of developed analysis. This was a very open question, with the chance to use diagrams and tools to illustrate much of the course. This exemplar is very stilted and limited in its development. This essay never gets above Level 2 KAA. Although it is applied to the data, the chains of reasoning are not any more advanced than the two-stage 'this leads to that' style of argument. The evaluation points are unsupported and undeveloped so cannot rise above Level 1. 7/16 KAA. 2/9 Eval. = 9/25. Start off using a model if you can. Here the obvious place to start is AD/AS with a shift in AS showing a supply side policy. Many candidates then followed this with a possible shift in AD. On the micro side, there is much to be built upon the deregulation described in the passage, and there are the effects on farmers described in the passage. Use the passage to get your argument started. Section A This section refers to the cache that held scripts where the candidate did not indicate whether (d) or (e) was chosen. These questions were treated in exactly the same way as any other essays. Section B This section refers to the cache that held scripts where the candidate did not indicate whether (d) or (e) was chosen. These questions were treated in exactly the same way as any other essays.
Notes from the mark scheme and report
shift LRAS for the macro effects, not just AD (then arguing demand-pull inflation is weak)
micro effects of deregulation, tax incentives and special economic zones on firms' costs and competition
evaluate in Indonesia's context, e.g. the 3% fiscal deficit limit and inflexible labour market
June 2017 · AS Paper 2 · Q6(e)15 marksAO1=3, AO2=3, AO3=3, AO4=615-mark response
Data and extracts for question 6
Mark scheme, including the levels grid and indicative content
Examiner's comment
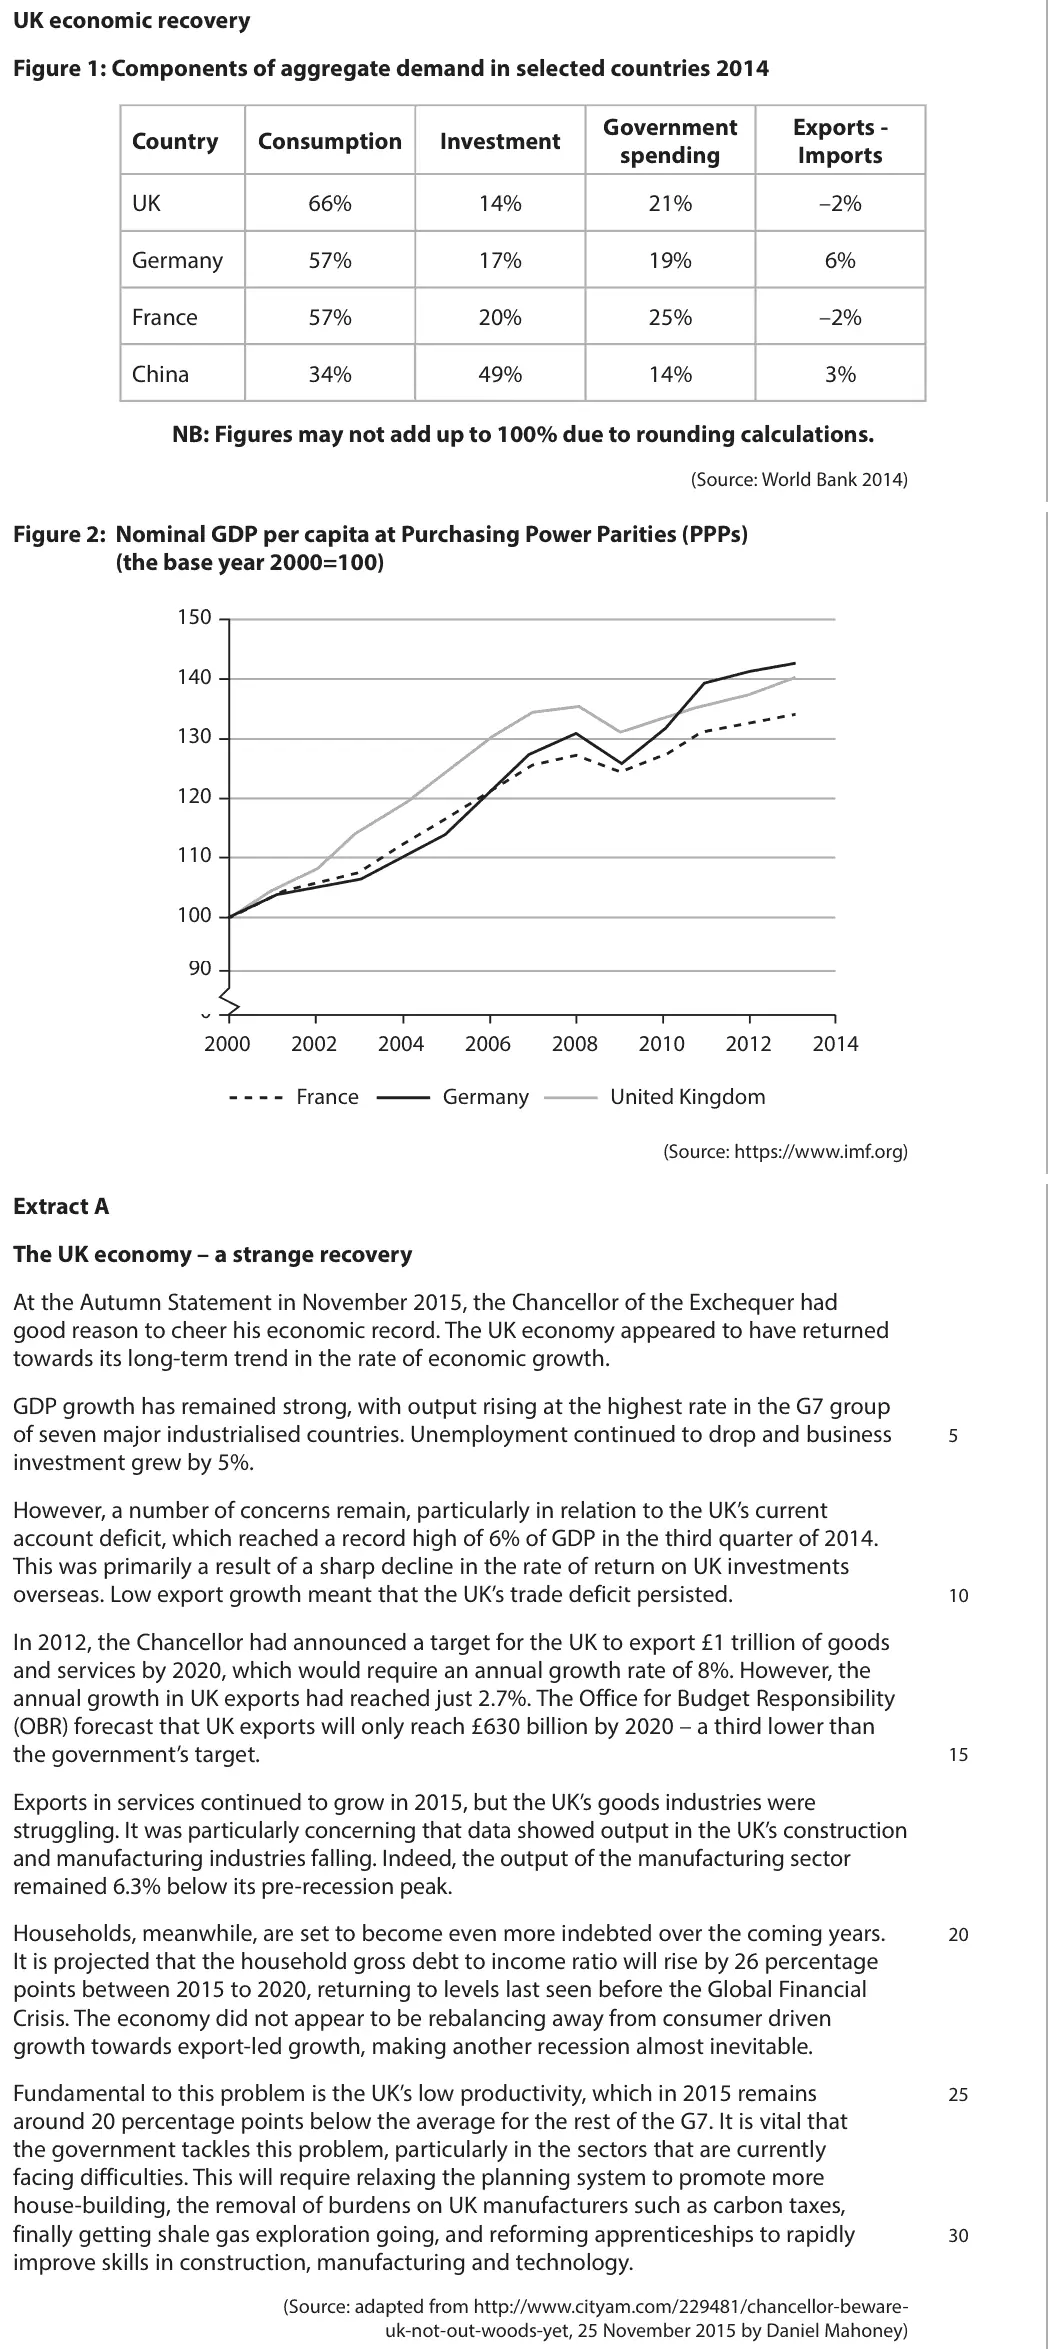
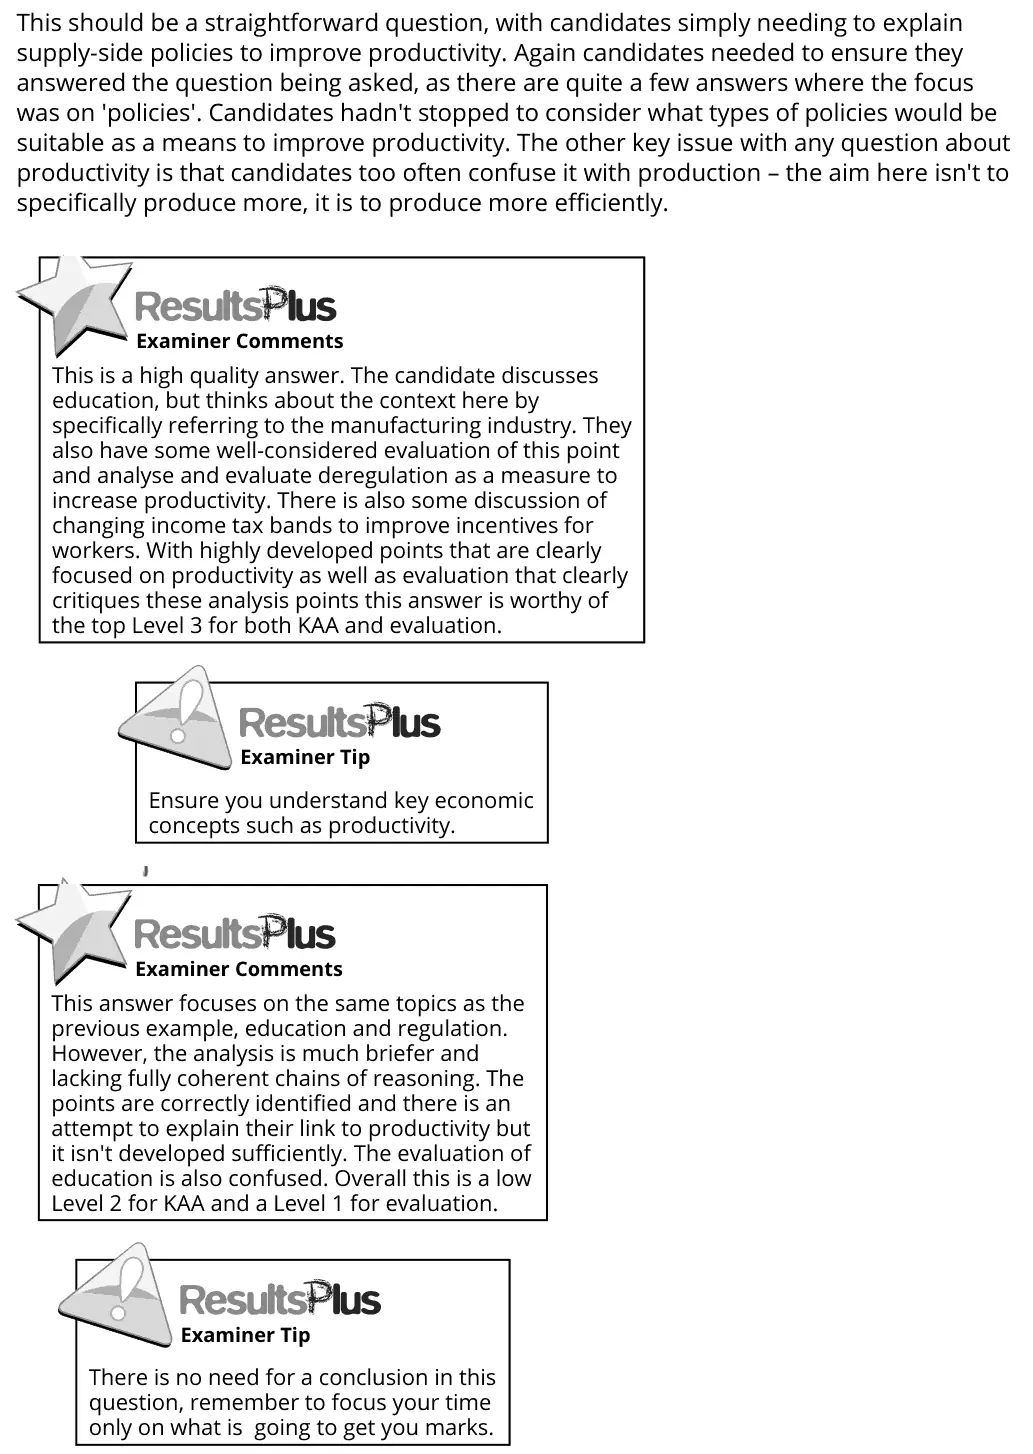
This should be a straightforward question, with candidates simply needing to explain supply-side policies to improve productivity. Again candidates needed to ensure they answered the question being asked, as there are quite a few answers where the focus was on 'policies'. Candidates hadn't stopped to consider what types of policies would be suitable as a means to improve productivity. The other key issue with any question about productivity is that candidates too often confuse it with production – the aim here isn't to specifically produce more, it is to produce more efficiently. This is a high quality answer. The candidate discusses education, but thinks about the context here by specifically referring to the manufacturing industry. They also have some well-considered evaluation of this point and analyse and evaluate deregulation as a measure to increase productivity. There is also some discussion of changing income tax bands to improve incentives for workers. With highly developed points that are clearly focused on productivity as well as evaluation that clearly critiques these analysis points this answer is worthy of the top Level 3 for both KAA and evaluation. Ensure you understand key economic concepts such as productivity. This answer focuses on the same topics as the previous example, education and regulation. However, the analysis is much briefer and lacking fully coherent chains of reasoning. The points are correctly identified and there is an attempt to explain their link to productivity but it isn't developed sufficiently. The evaluation of education is also confused. Overall this is a low Level 2 for KAA and a Level 1 for evaluation. There is no need for a conclusion in this question, remember to focus your time only on what is going to get you marks.
Notes from the mark scheme and report
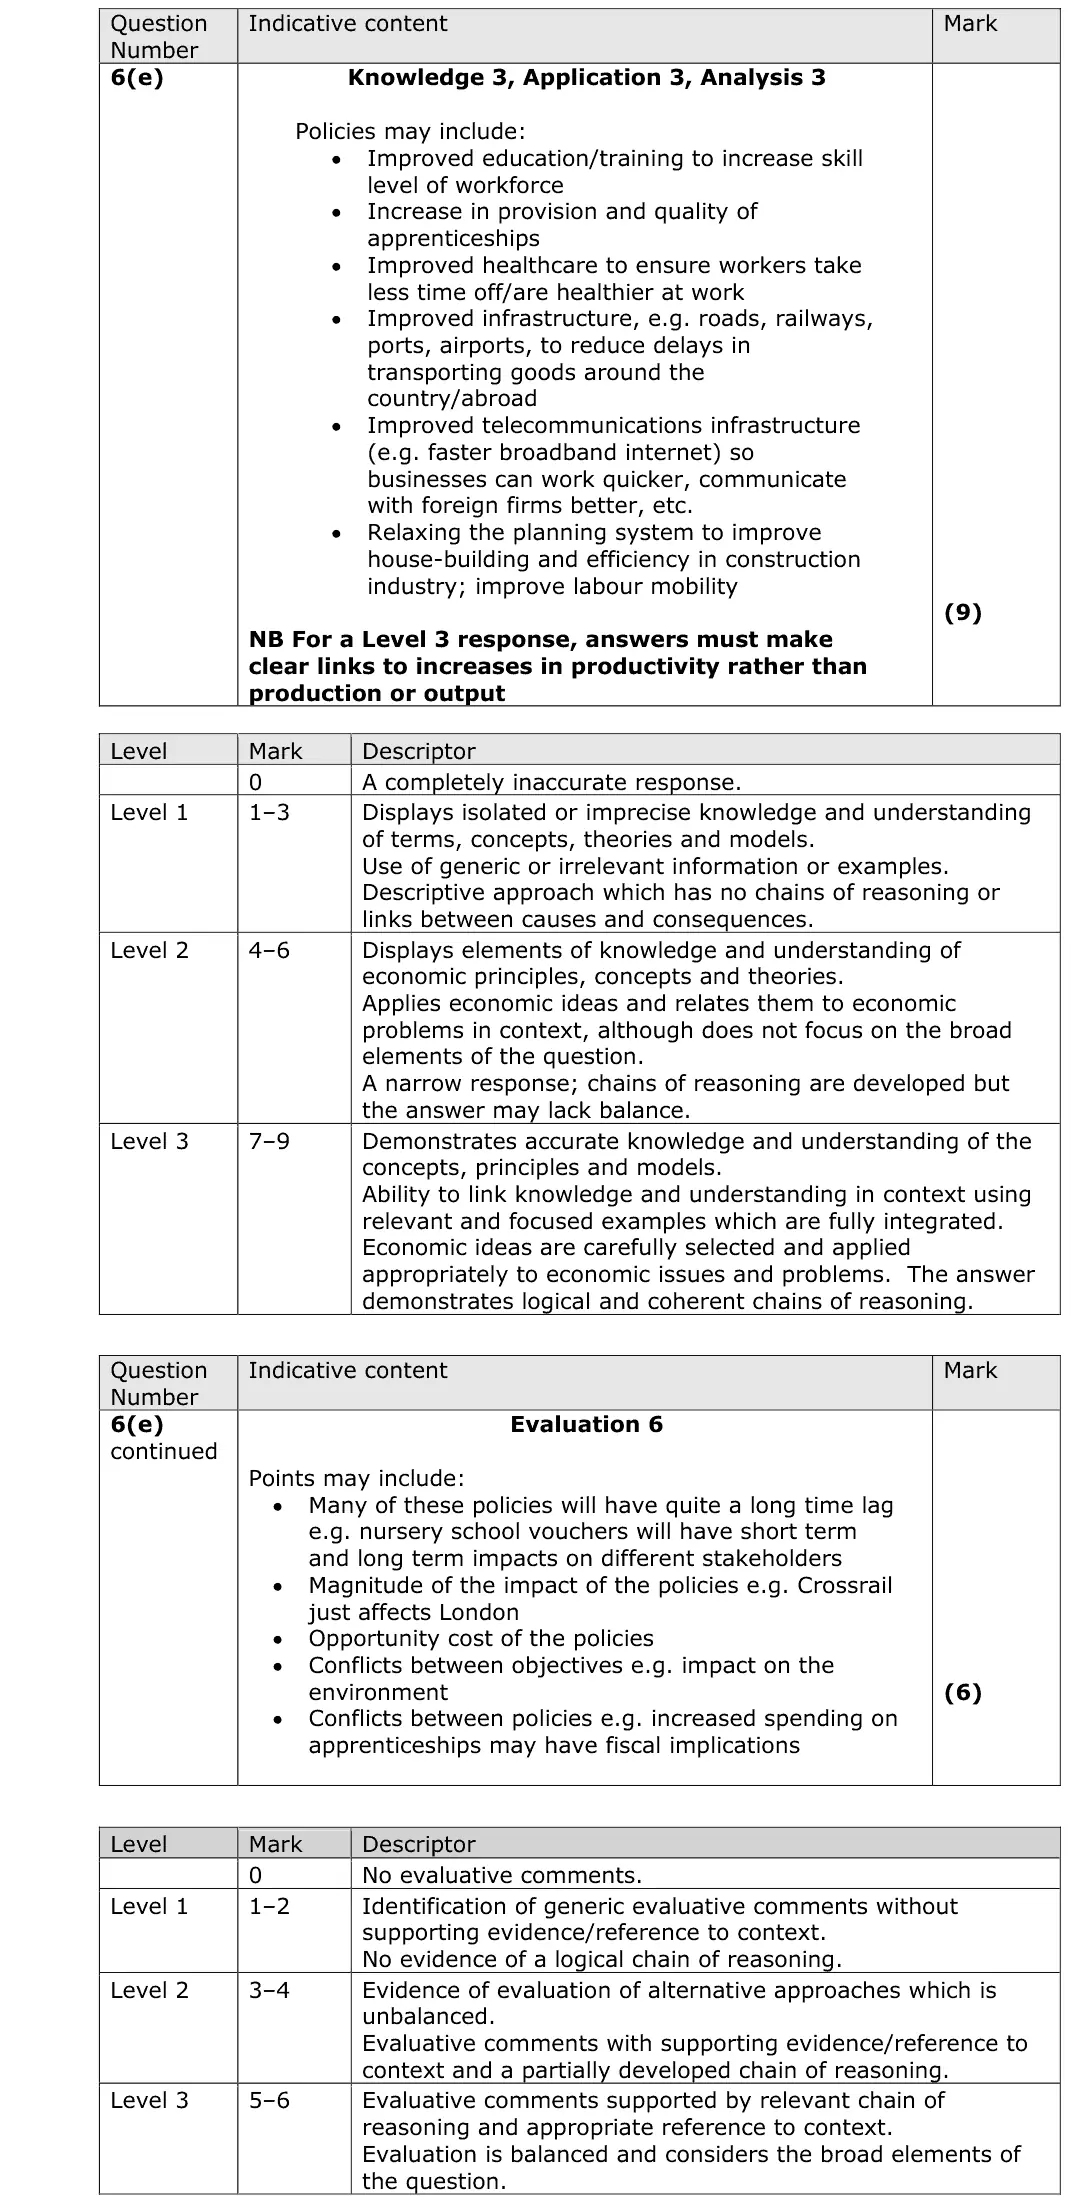
Level 3 needs clear links to productivity (output per worker), not just more production
education and apprenticeships, infrastructure, planning reform from Extract A
evaluate with cost, time lags, opportunity cost
June 2017 · Paper 2 · Q6(e)15 marksAO1=3, AO2=3, AO3=3, AO4=615-mark response
Data and extracts for question 6
Mark scheme, including the levels grid and indicative content
Examiner's comment
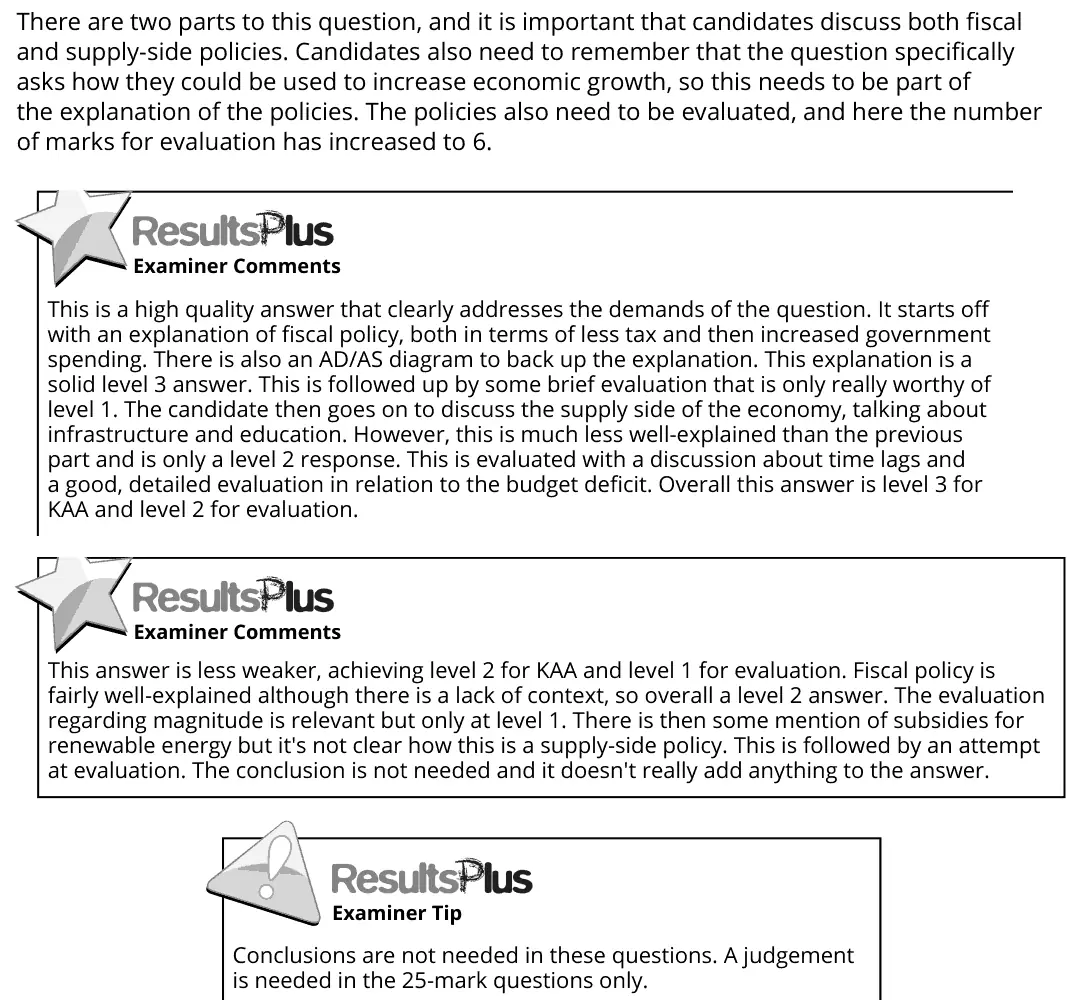
There are two parts to this question, and it is important that candidates discuss both fiscal and supply-side policies. Candidates also need to remember that the question specifically asks how they could be used to increase economic growth, so this needs to be part of the explanation of the policies. The policies also need to be evaluated, and here the number of marks for evaluation has increased to 6. This is a high quality answer that clearly addresses the demands of the question. It starts off with an explanation of fiscal policy, both in terms of less tax and then increased government spending. There is also an AD/AS diagram to back up the explanation. This explanation is a solid level 3 answer. This is followed up by some brief evaluation that is only really worthy of level 1. The candidate then goes on to discuss the supply side of the economy, talking about infrastructure and education. However, this is much less well-explained than the previous part and is only a level 2 response. This is evaluated with a discussion about time lags and a good, detailed evaluation in relation to the budget deficit. Overall this answer is level 3 for KAA and level 2 for evaluation. This answer is less weaker, achieving level 2 for KAA and level 1 for evaluation. Fiscal policy is fairly well-explained although there is a lack of context, so overall a level 2 answer. The evaluation regarding magnitude is relevant but only at level 1. There is then some mention of subsidies for renewable energy but it's not clear how this is a supply-side policy. This is followed by an attempt at evaluation. The conclusion is not needed and it doesn't really add anything to the answer. Conclusions are not needed in these questions. A judgement is needed in the 25-mark questions only.
Notes from the mark scheme and report
Level 3 KAA needs both fiscal and supply-side policies, linked to economic growth
AD/AS diagrams
evaluate with debt constraints on Eurozone governments and time lags of supply-side policies
June 2017 · Paper 3 · Q1(d)25 marksAO1=4, AO2=4, AO3=8, AO4=925-mark essayEither/or
Data and extracts for question 1
Mark scheme, including the levels grid and indicative content
Examiner's comment
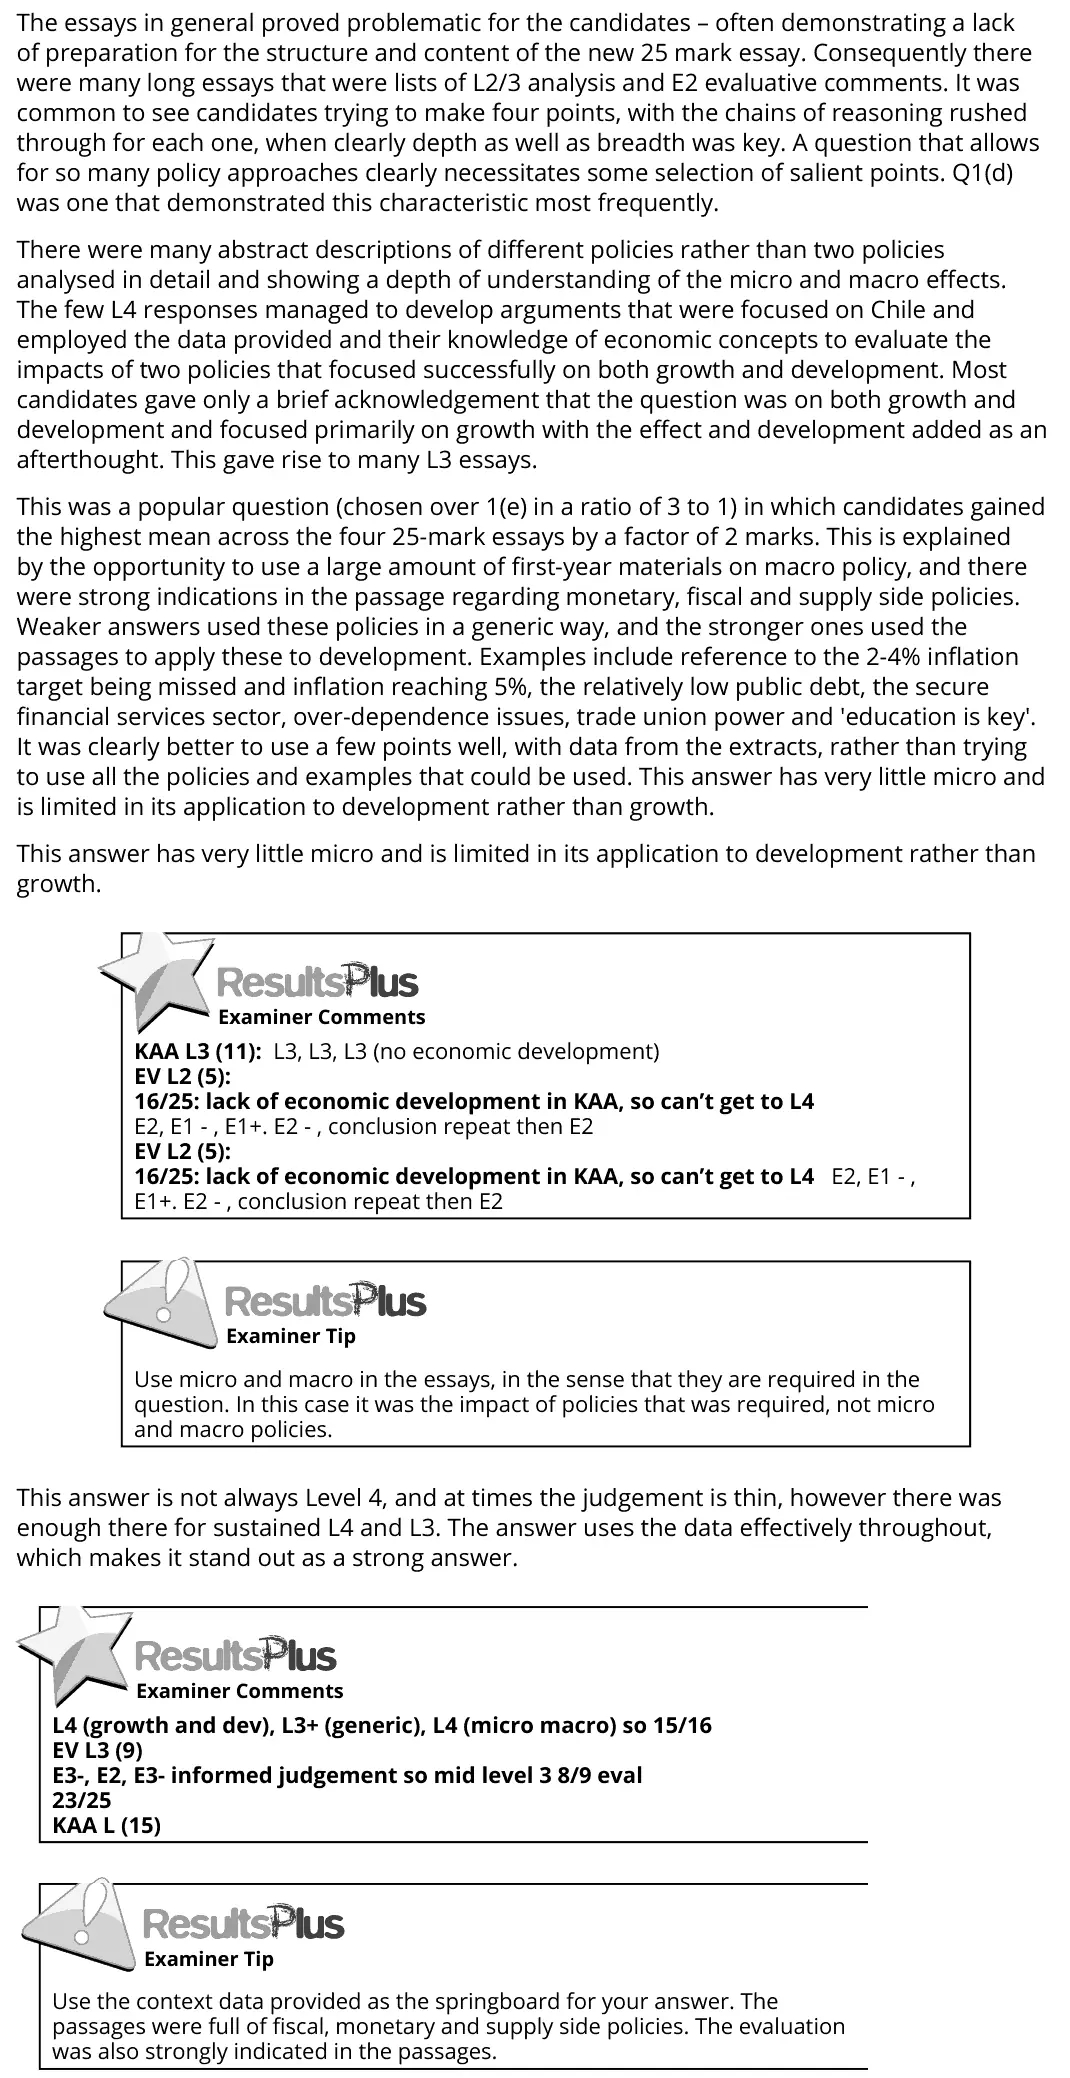
The essays in general proved problematic for the candidates – often demonstrating a lack of preparation for the structure and content of the new 25 mark essay. Consequently there were many long essays that were lists of L2/3 analysis and E2 evaluative comments. It was common to see candidates trying to make four points, with the chains of reasoning rushed through for each one, when clearly depth as well as breadth was key. A question that allows for so many policy approaches clearly necessitates some selection of salient points. Q1(d) was one that demonstrated this characteristic most frequently. There were many abstract descriptions of different policies rather than two policies analysed in detail and showing a depth of understanding of the micro and macro effects. The few L4 responses managed to develop arguments that were focused on Chile and employed the data provided and their knowledge of economic concepts to evaluate the impacts of two policies that focused successfully on both growth and development. Most candidates gave only a brief acknowledgement that the question was on both growth and development and focused primarily on growth with the effect and development added as an afterthought. This gave rise to many L3 essays. This was a popular question (chosen over 1(e) in a ratio of 3 to 1) in which candidates gained the highest mean across the four 25-mark essays by a factor of 2 marks. This is explained by the opportunity to use a large amount of first-year materials on macro policy, and there were strong indications in the passage regarding monetary, fiscal and supply side policies. Weaker answers used these policies in a generic way, and the stronger ones used the passages to apply these to development. Examples include reference to the 2-4% inflation target being missed and inflation reaching 5%, the relatively low public debt, the secure financial services sector, over-dependence issues, trade union power and 'education is key'. It was clearly better to use a few points well, with data from the extracts, rather than trying to use all the policies and examples that could be used. This answer has very little micro and is limited in its application to development rather than growth. This answer has very little micro and is limited in its application to development rather than growth. This answer is not always Level 4, and at times the judgement is thin, however there was enough there for sustained L4 and L3. The answer uses the data effectively throughout, which makes it stand out as a strong answer. KAA L3 (11): L3, L3, L3 (no economic development) EV L2 (5): 16/25: lack of economic development in KAA, so can’t get to L4 E2, E1 - , E1+. E2 - , conclusion repeat then E2 EV L2 (5): 16/25: lack of economic development in KAA, so can’t get to L4 E2, E1 - , E1+. E2 - , conclusion repeat then E2 Use micro and macro in the essays, in the sense that they are required in the question. In this case it was the impact of policies that was required, not micro and macro policies. L4 (growth and dev), L3+ (generic), L4 (micro macro) so 15/16 EV L3 (9) E3-, E2, E3- informed judgement so mid level 3 8/9 eval 23/25 KAA L (15) Use the context data provided as the springboard for your answer. The passages were full of fiscal, monetary and supply side policies. The evaluation was also strongly indicated in the passages.
Notes from the mark scheme and report
Level 4 needs effects on both growth and development and micro and macro effects
two policies analysed in depth beat a list of many
most answers treated development as an afterthought
evaluate with conflicts e.g. lower interest rates and inflation
Work with an Edexcel economics tutor
Essays stuck in Level 2, or losing the easy marks in Section A? Book a trial session with Lianne, a former Edexcel examiner.