2.1.2Inflation: a) Understanding of: • inflation • deflation • disinflation b) The process of calculating the rate of inflation in the UK using the Consumer Prices Index (CPI) c) The limitations of CPI in measuring the rate of inflation d) The Retail Prices Index (RPI) as an alternative measure of the rate of inflation e) Causes of inflation: • demand pull • cost push • growth of the money supply f) The effects of inflation on consumers, firms, the government and workersAS
Tap a question to zoom it. The data and extracts fold out above each question; the mark scheme and examiner's comment open underneath.
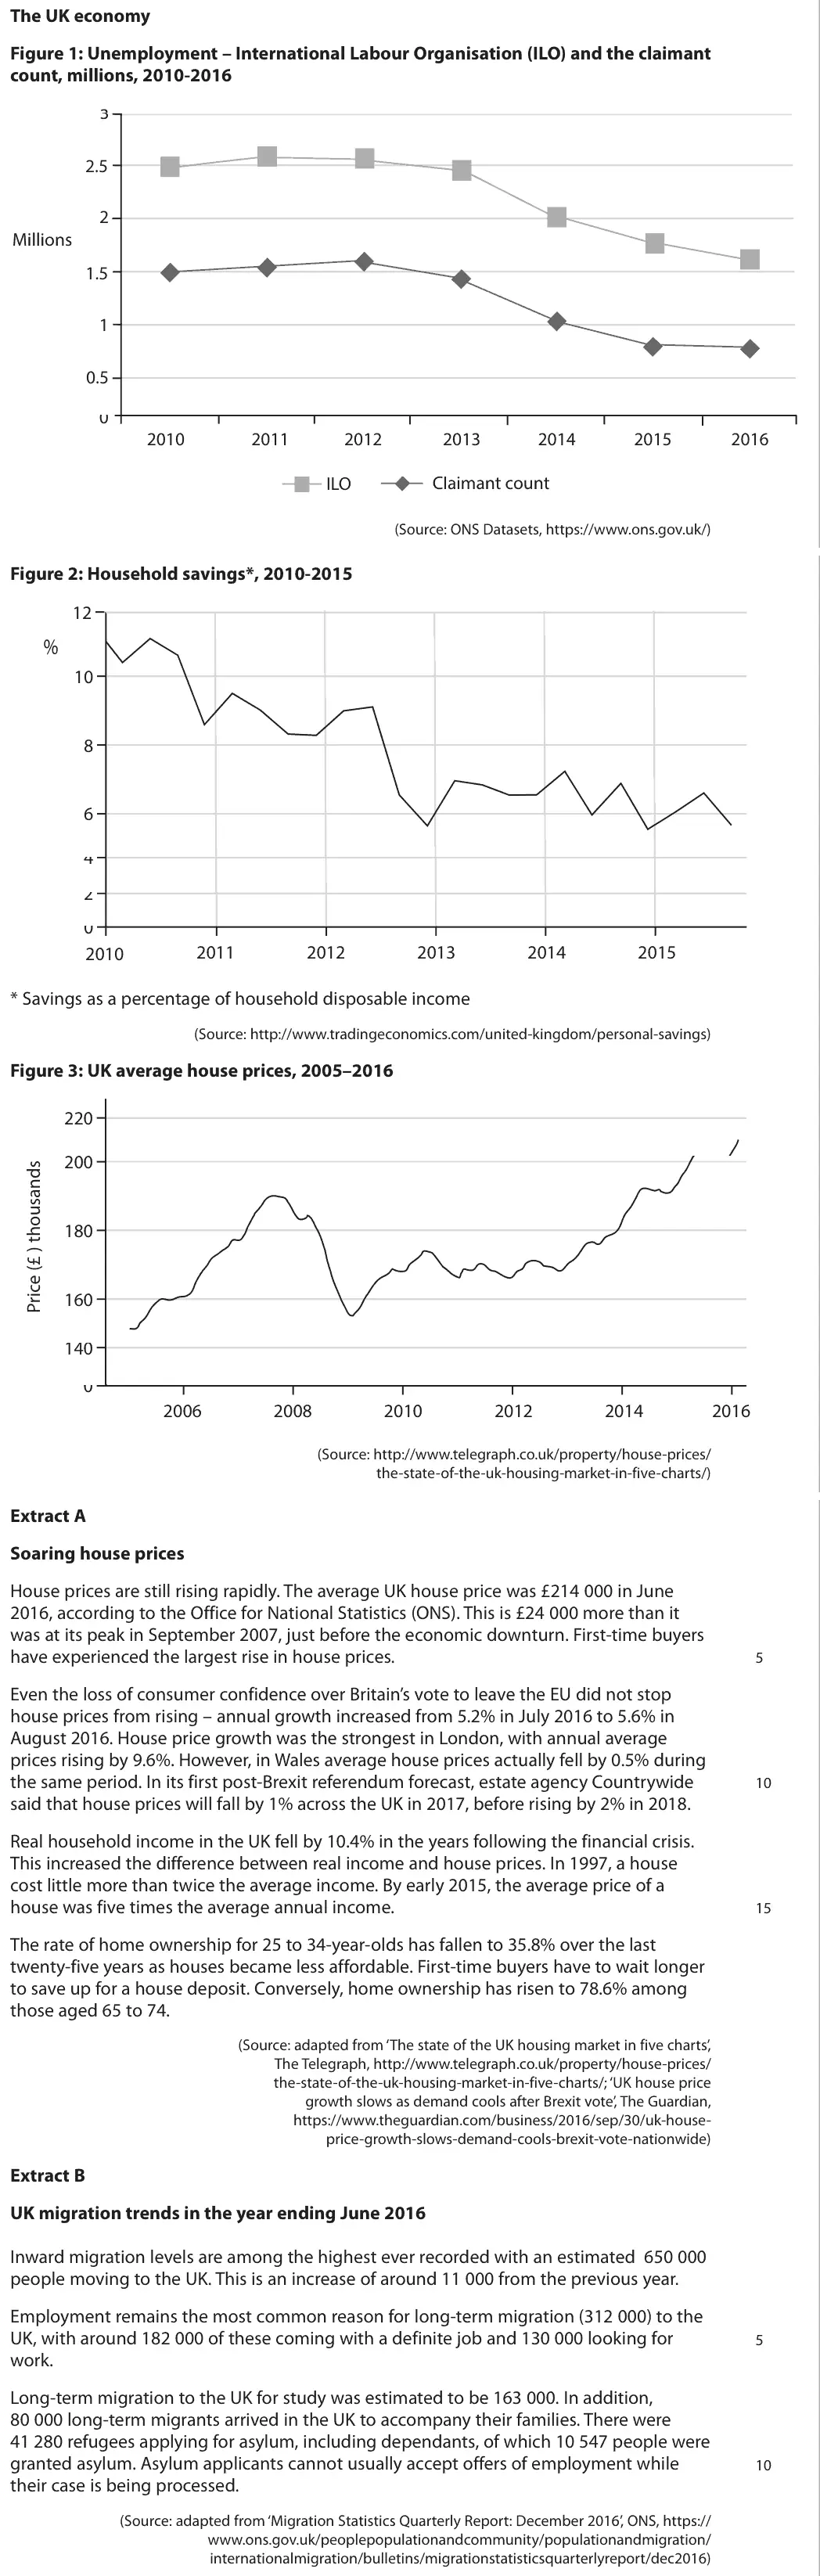
June 2025 · AS Paper 2 · Q6(f)20 marksAO1=4, AO2=4, AO3=6, AO4=620-mark essayEither/or
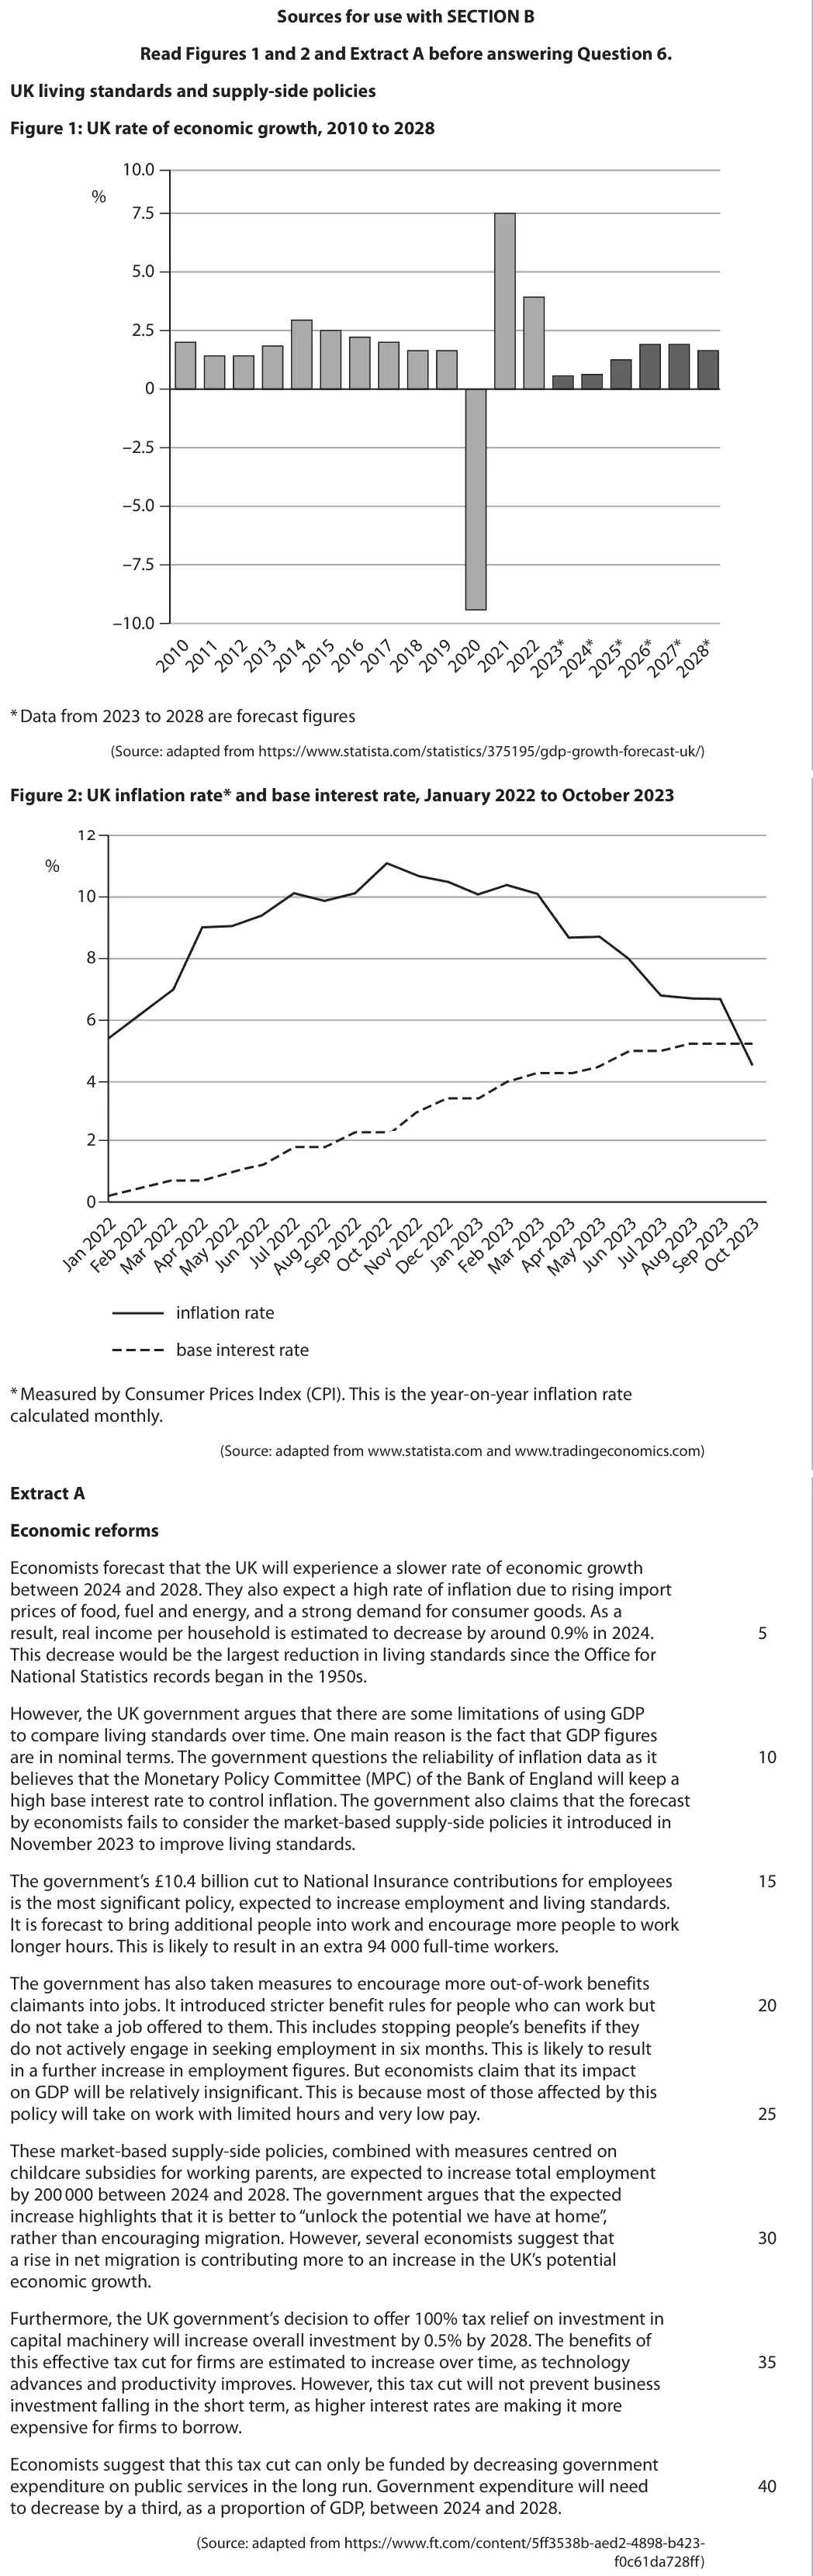
Data and extracts for question 6
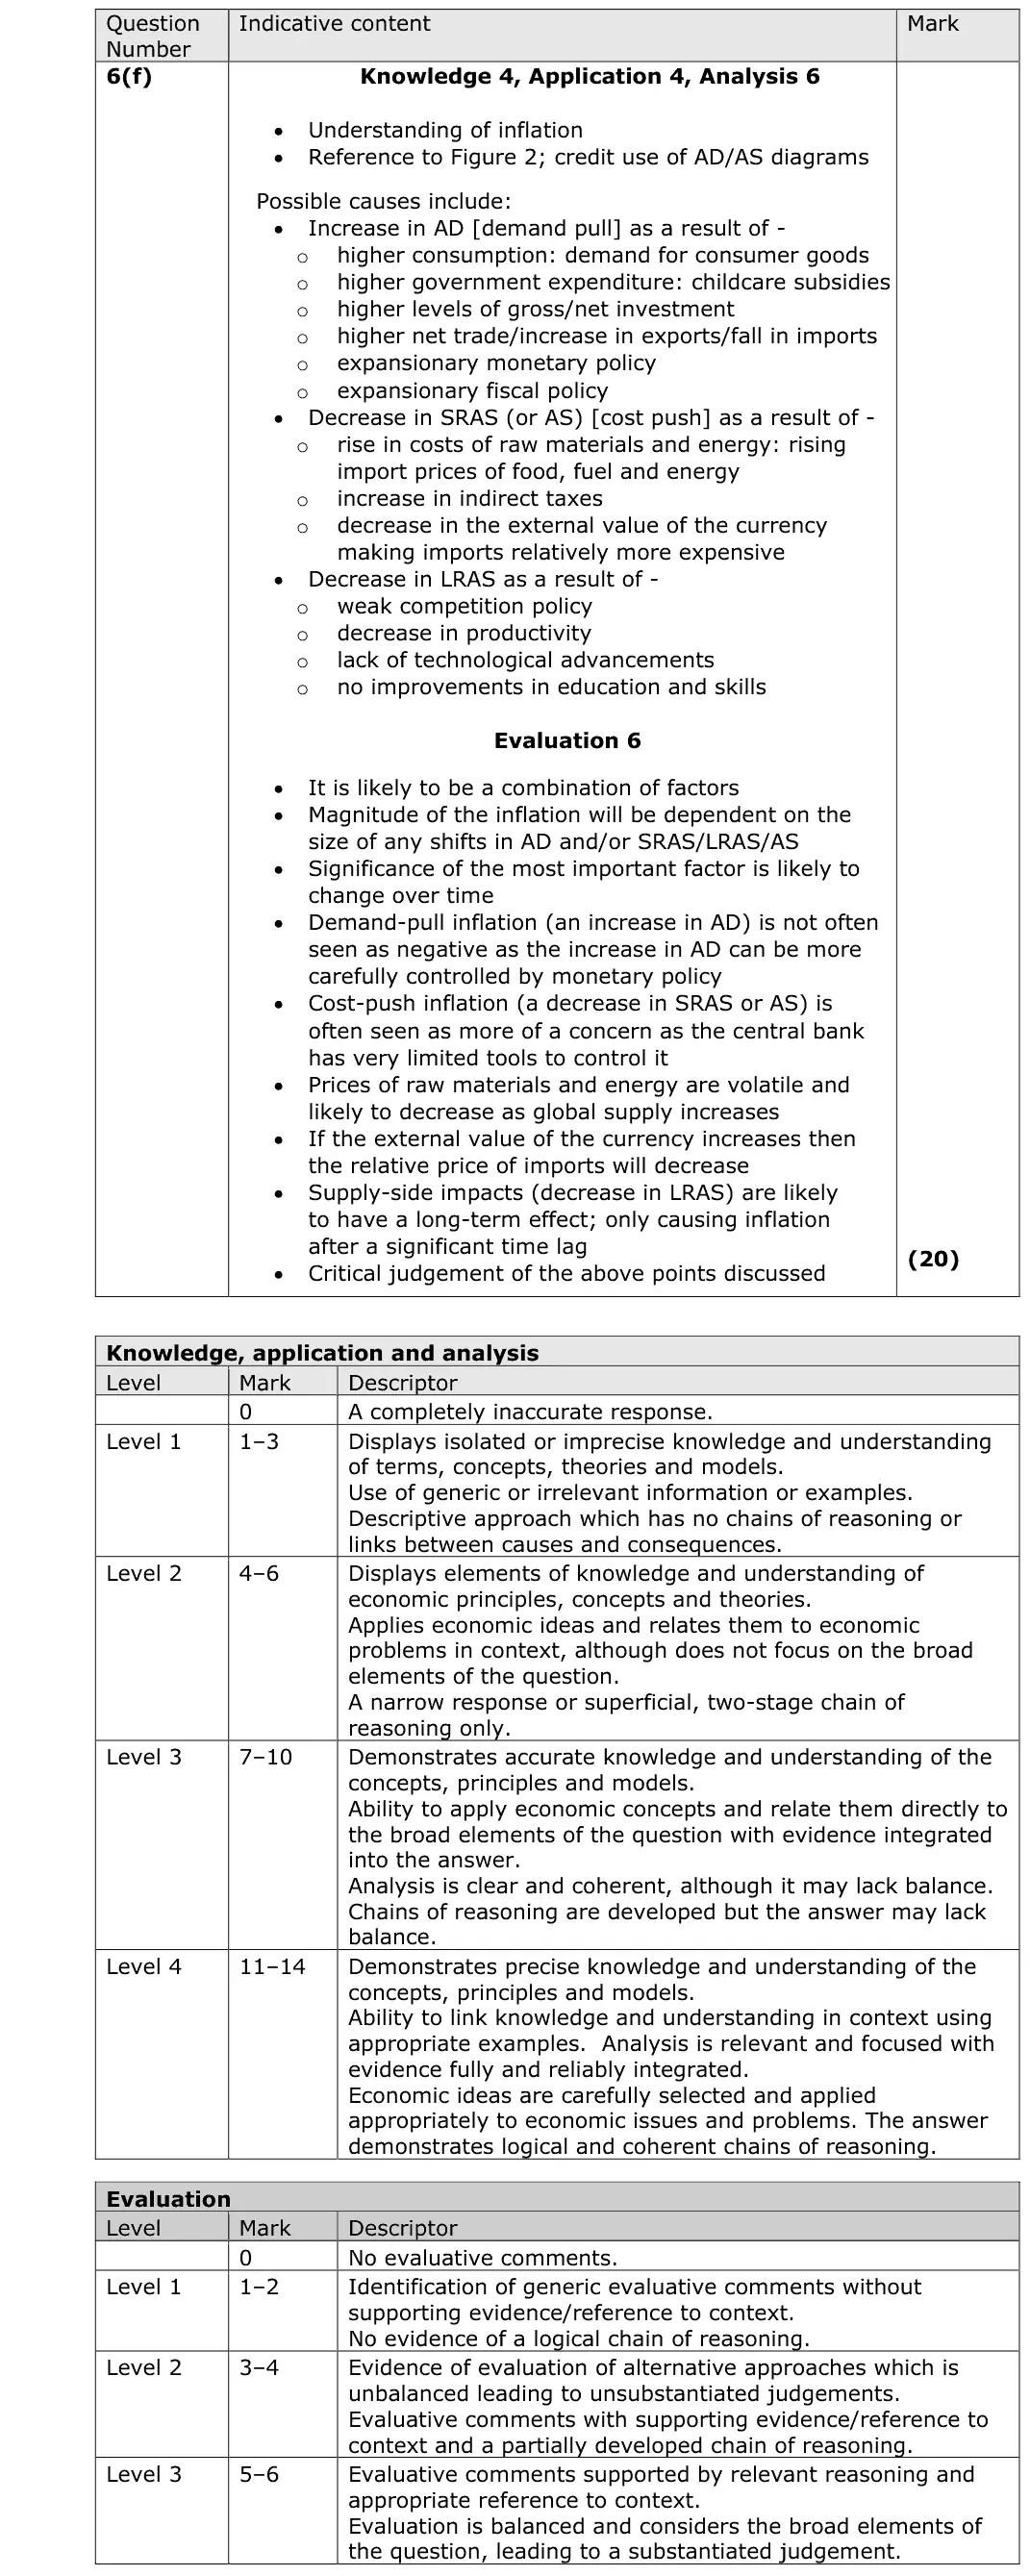
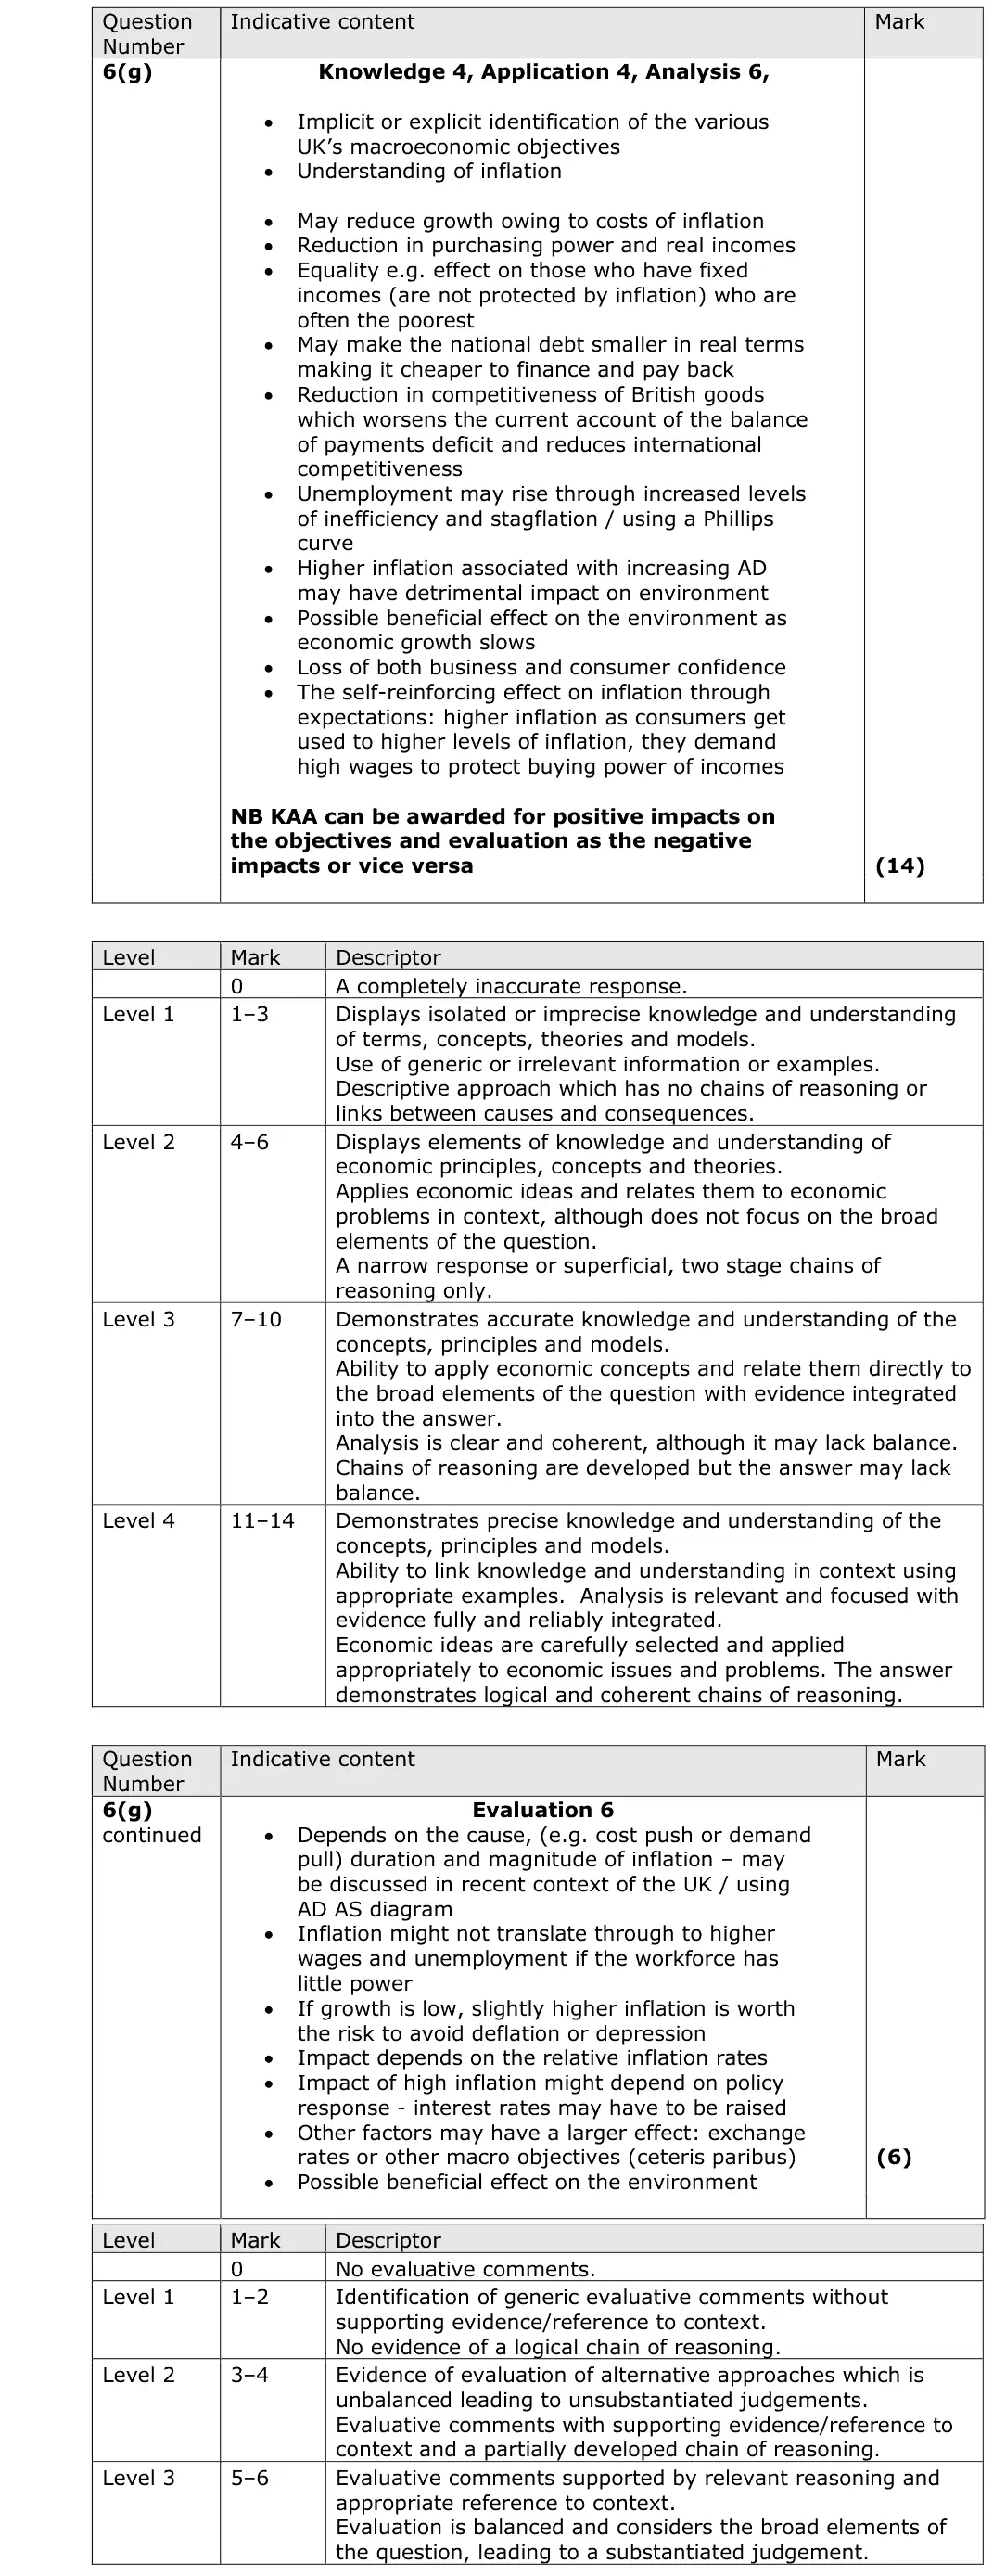
Mark scheme, including the levels grid and indicative content
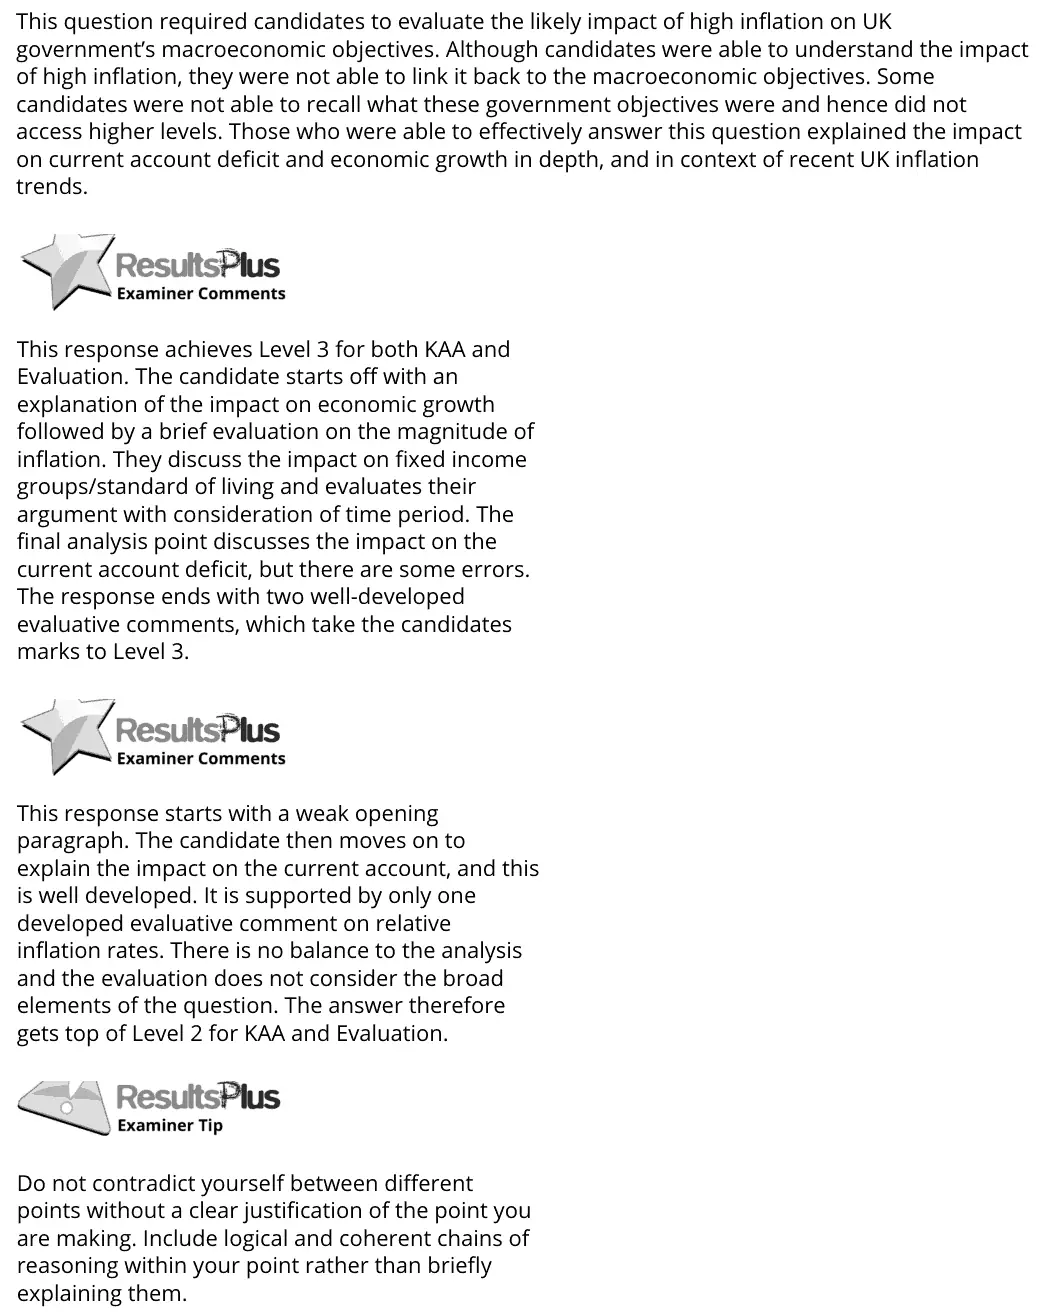
Examiner's comment
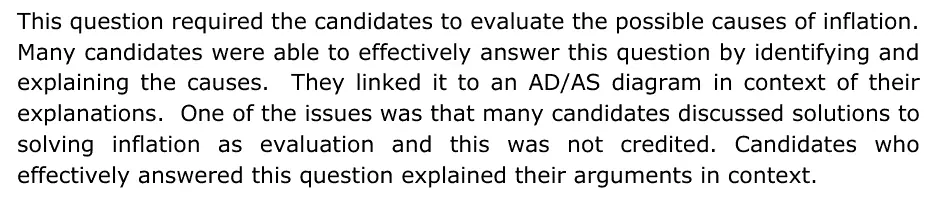
This question required the candidates to evaluate the possible causes of inflation. Many candidates were able to effectively answer this question by identifying and explaining the causes. They linked it to an AD/AS diagram in context of their explanations. One of the issues was that many candidates discussed solutions to solving inflation as evaluation and this was not credited. Candidates who effectively answered this question explained their arguments in context.
Notes from the mark scheme and report
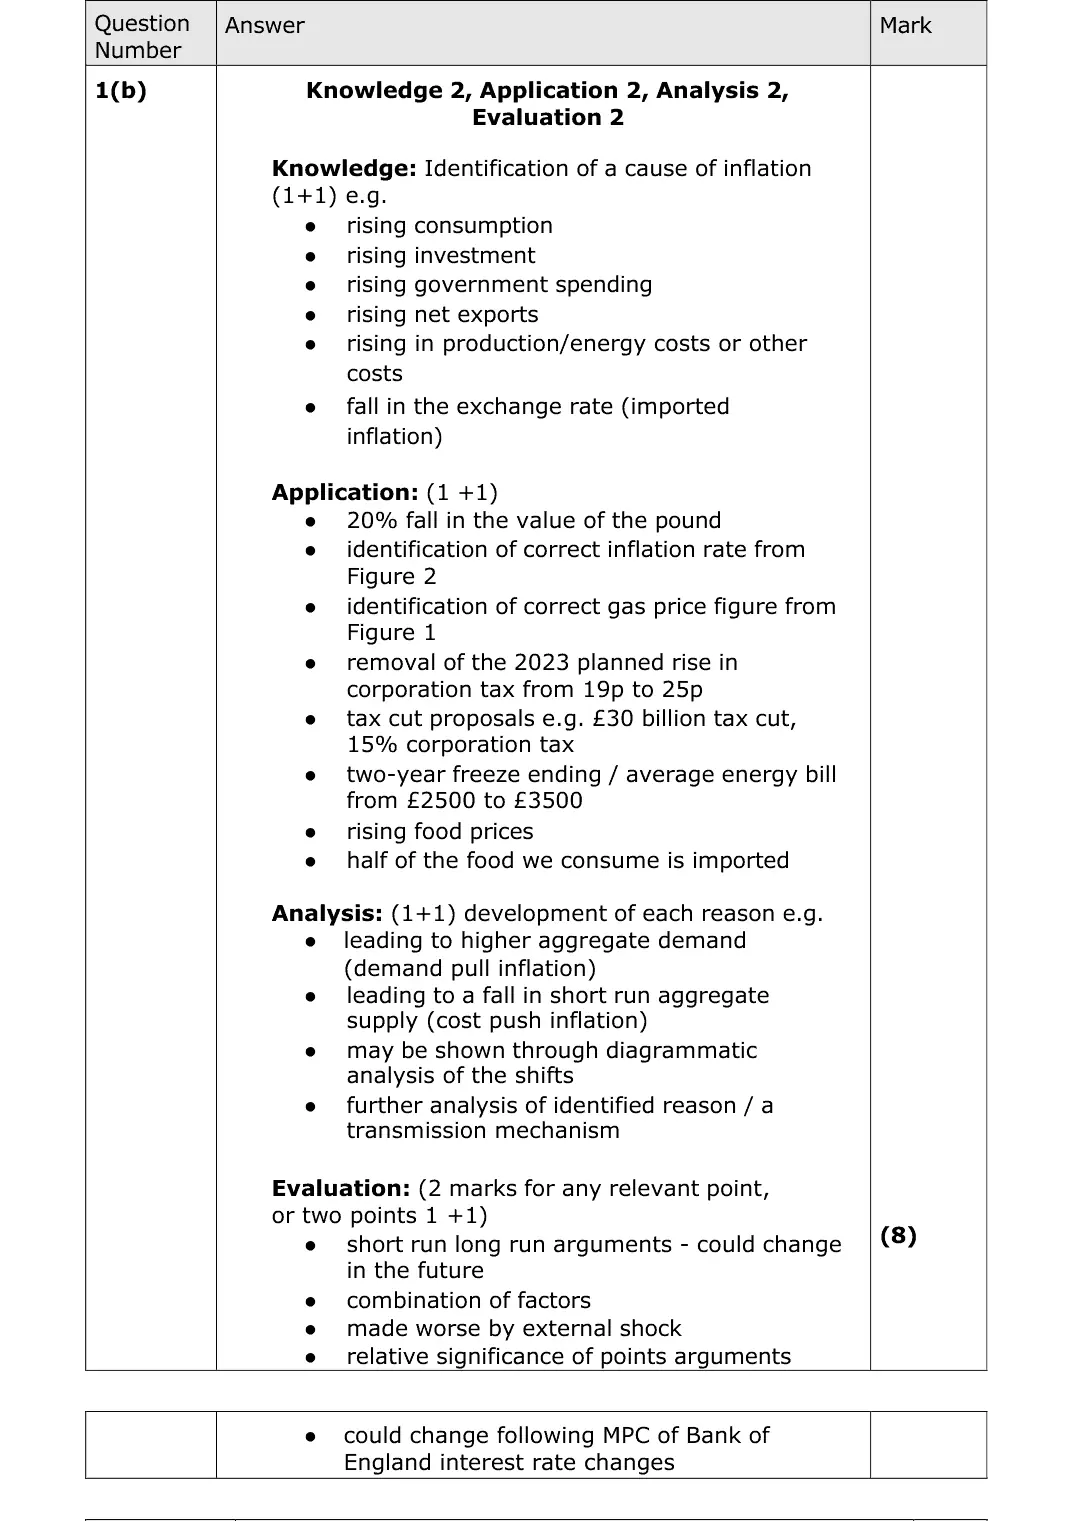
demand-pull vs cost-push (import, food, fuel and energy prices) and money supply growth, with AD/AS diagrams and Figure 2
solutions to inflation are not credited as evaluation
evaluate the relative importance of causes
Quantitative skills: QS 4 (construct and interpret a range of standard graphical forms)
June 2025 · Paper 3 · Q1(d)25 marksAO1=4, AO2=4, AO3=8, AO4=925-mark essayEither/or
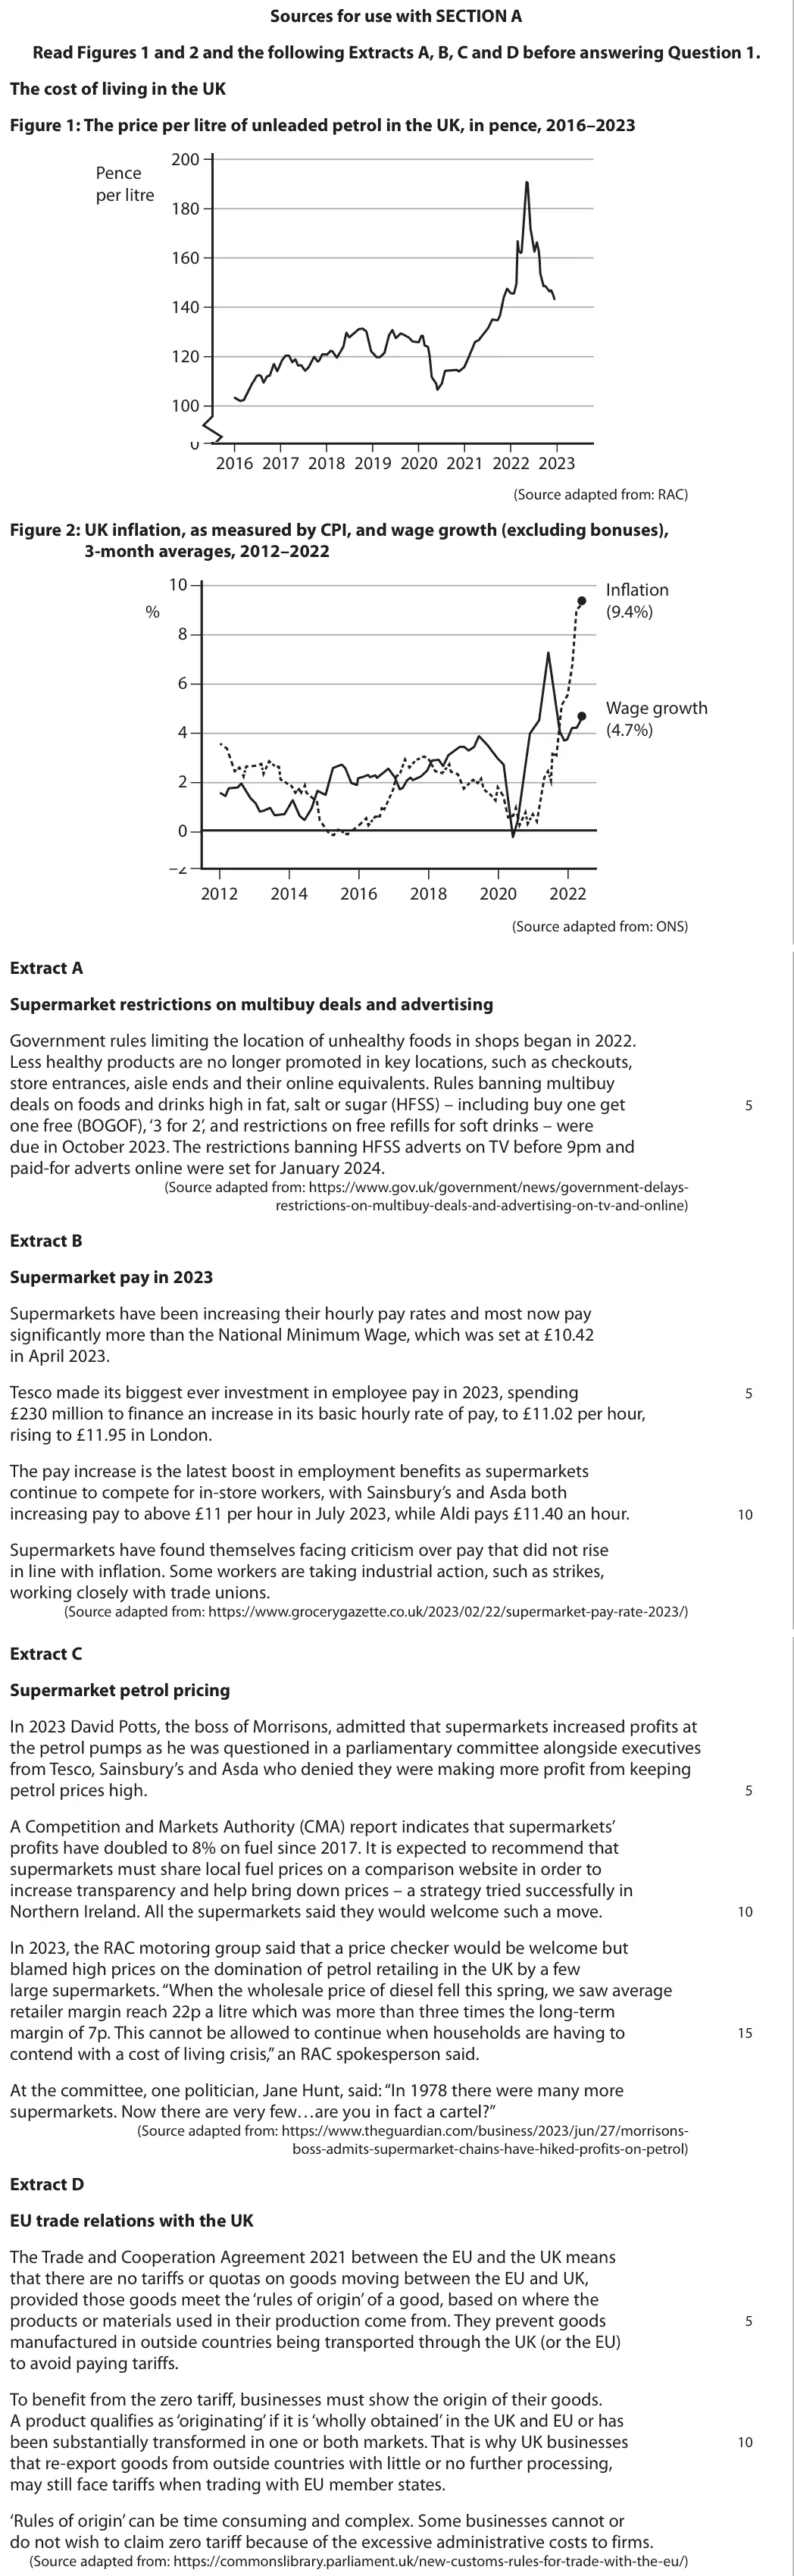
Data and extracts for question 1
Mark scheme, including the levels grid and indicative content
Examiner's comment
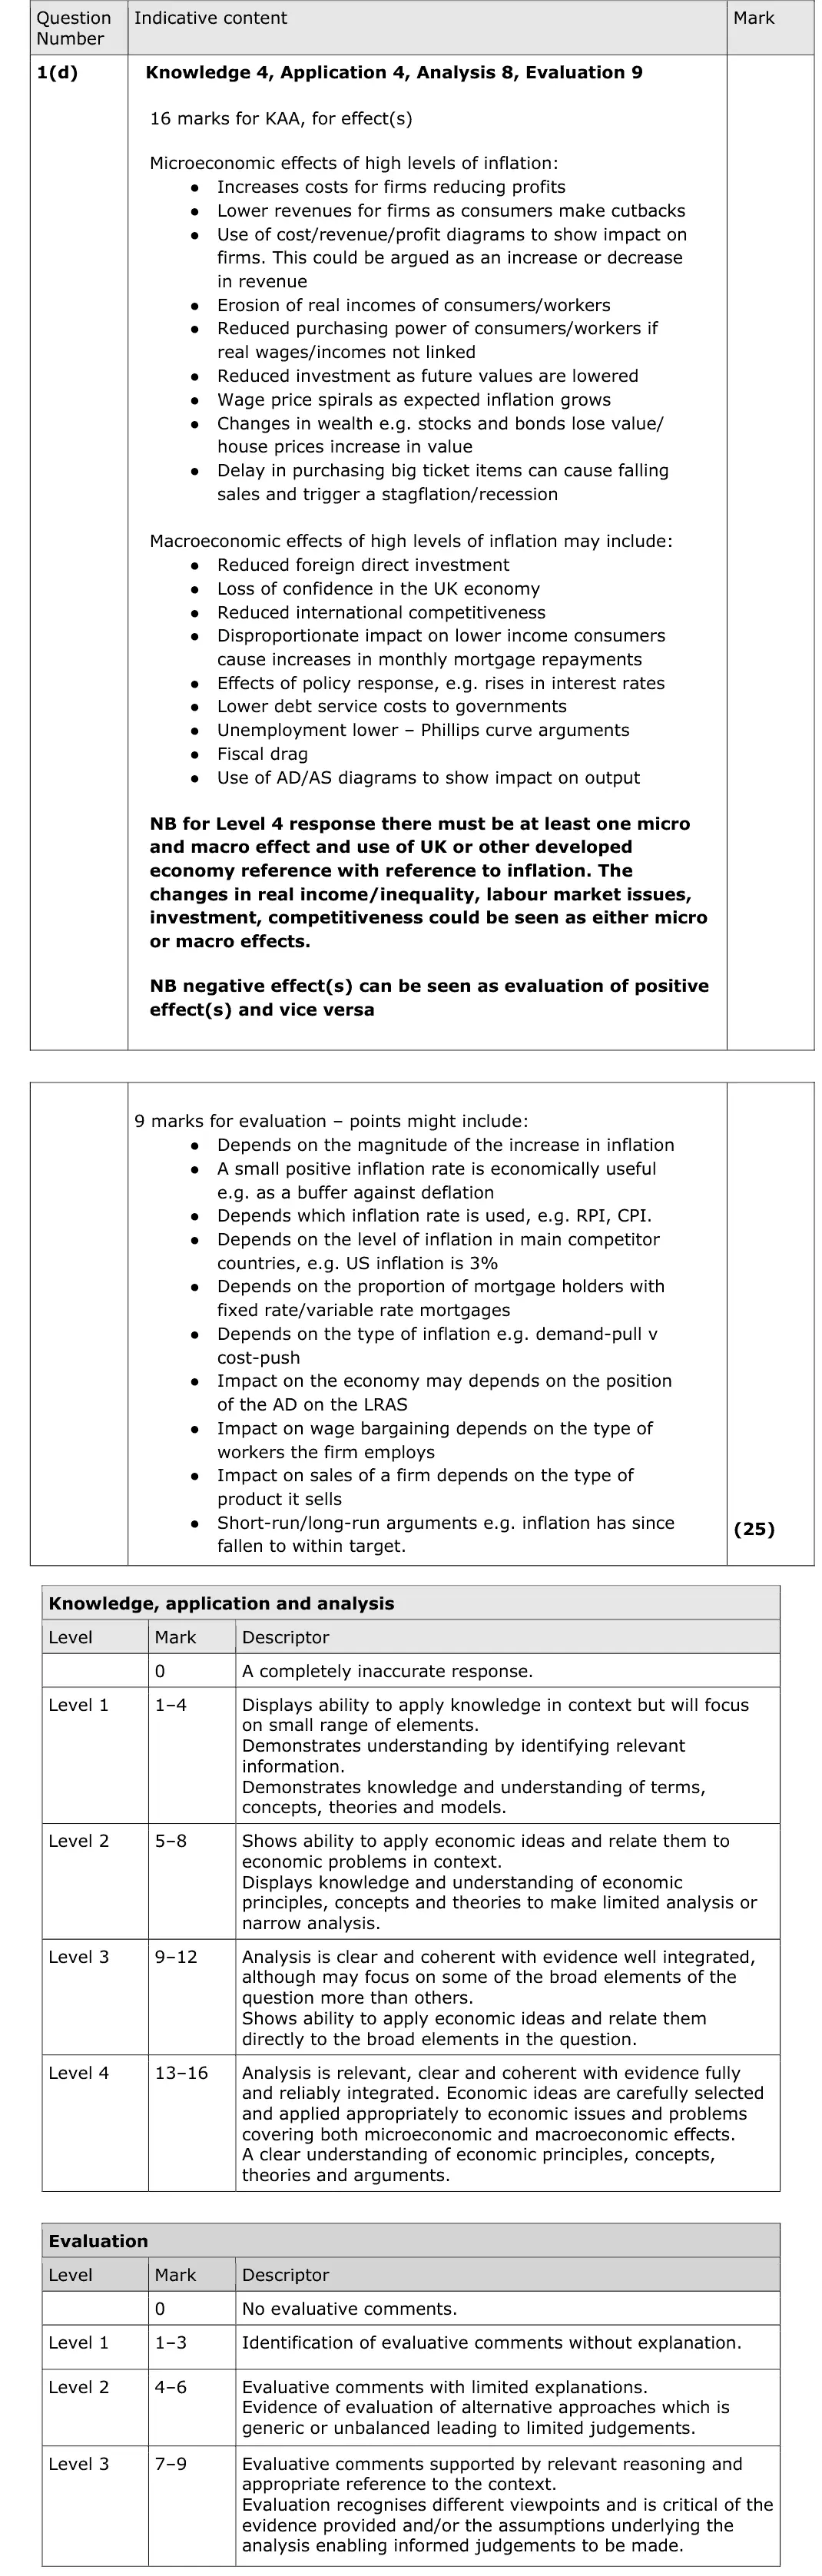
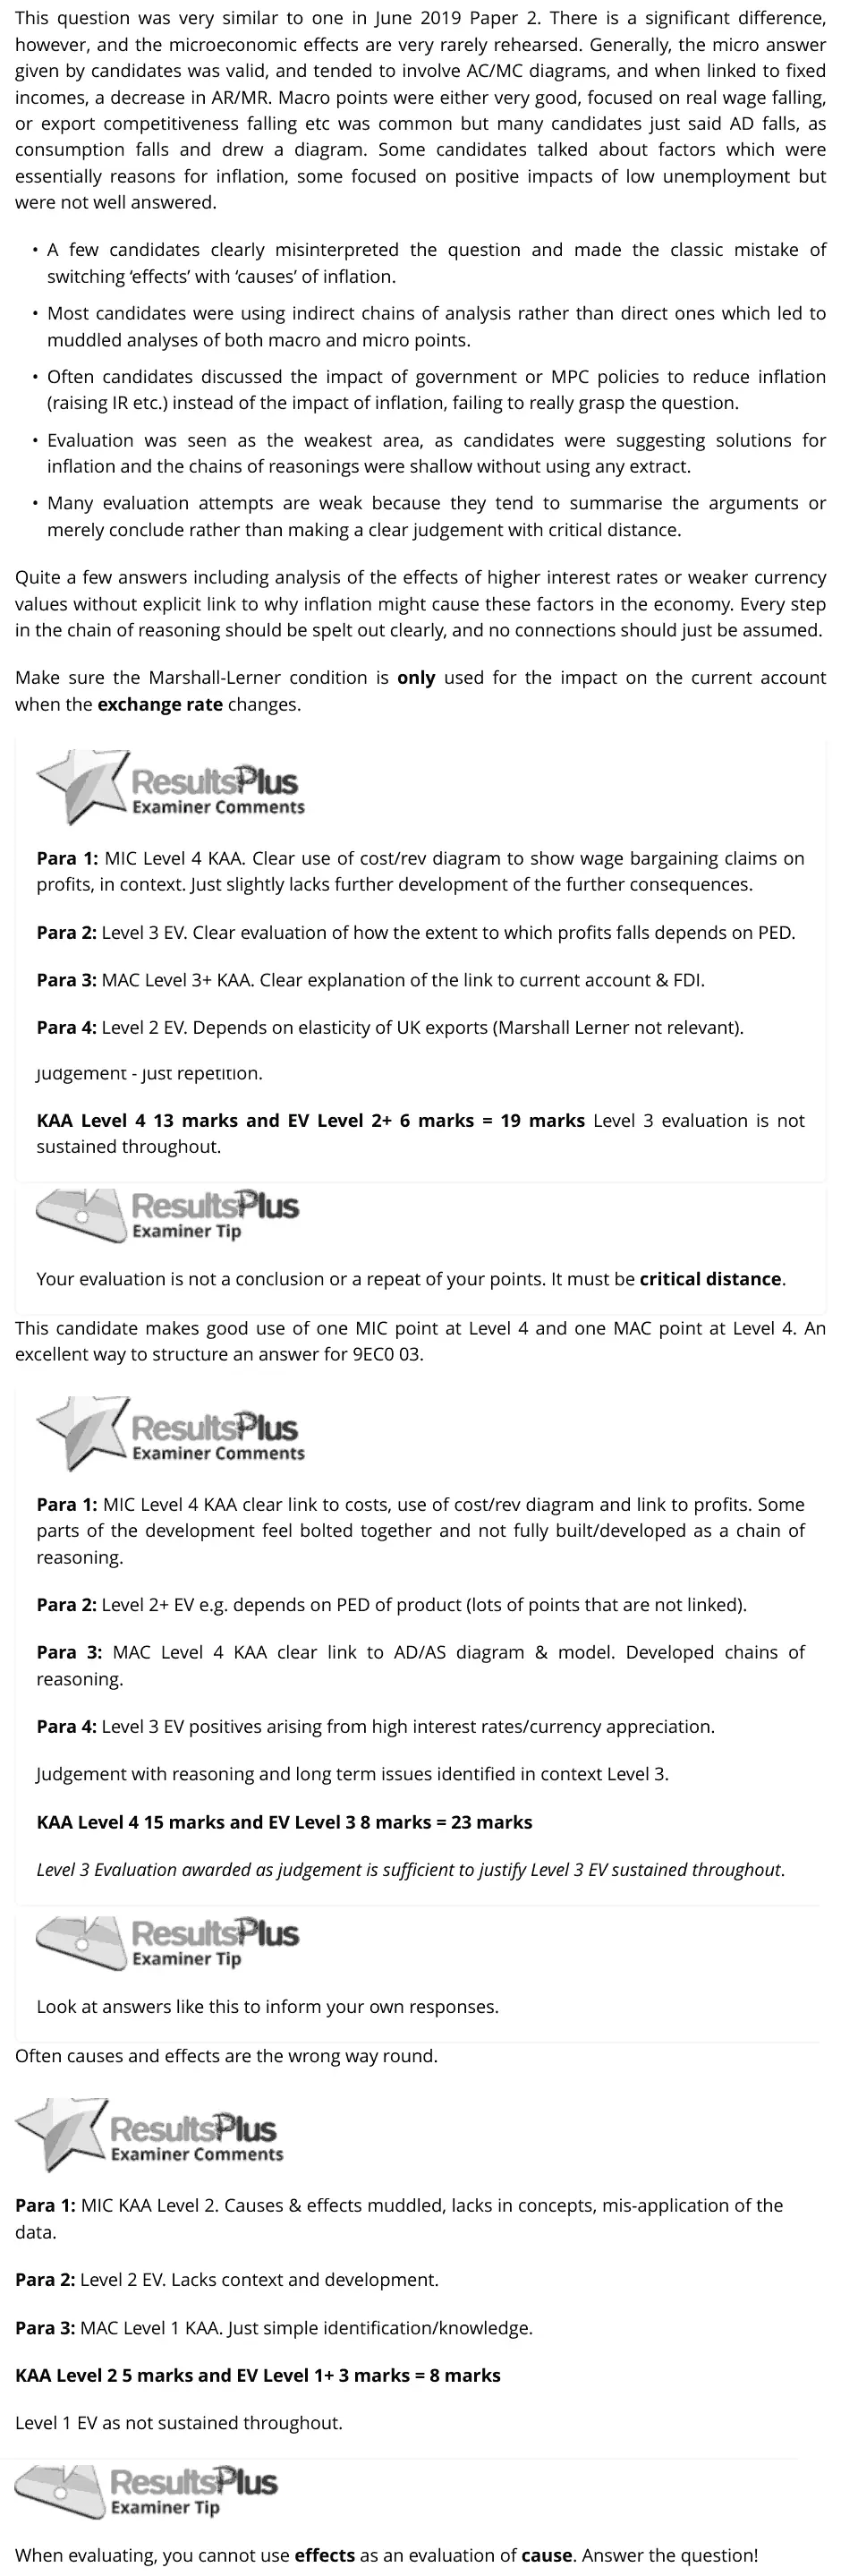
This question was very similar to one in June 2019 Paper 2. There is a significant difference, however, and the microeconomic effects are very rarely rehearsed. Generally, the micro answer given by candidates was valid, and tended to involve AC/MC diagrams, and when linked to fixed incomes, a decrease in AR/MR. Macro points were either very good, focused on real wage falling, or export competitiveness falling etc was common but many candidates just said AD falls, as consumption falls and drew a diagram. Some candidates talked about factors which were essentially reasons for inflation, some focused on positive impacts of low unemployment but were not well answered. • A few candidates clearly misinterpreted the question and made the classic mistake of switching ‘effects’ with ‘causes’ of inflation. • Most candidates were using indirect chains of analysis rather than direct ones which led to muddled analyses of both macro and micro points. • Often candidates discussed the impact of government or MPC policies to reduce inflation (raising IR etc.) instead of the impact of inflation, failing to really grasp the question. • Evaluation was seen as the weakest area, as candidates were suggesting solutions for inflation and the chains of reasonings were shallow without using any extract. • Many evaluation attempts are weak because they tend to summarise the arguments or merely conclude rather than making a clear judgement with critical distance. Quite a few answers including analysis of the effects of higher interest rates or weaker currency values without explicit link to why inflation might cause these factors in the economy. Every step in the chain of reasoning should be spelt out clearly, and no connections should just be assumed. Make sure the Marshall-Lerner condition is only used for the impact on the current account when the exchange rate changes. Para 1: MIC Level 4 KAA. Clear use of cost/rev diagram to show wage bargaining claims on profits, in context. Just slightly lacks further development of the further consequences. Para 2: Level 3 EV. Clear evaluation of how the extent to which profits falls depends on PED. Para 3: MAC Level 3+ KAA. Clear explanation of the link to current account & FDI. Para 4: Level 2 EV. Depends on elasticity of UK exports (Marshall Lerner not relevant). Judgement - just repetition. KAA Level 4 13 marks and EV Level 2+ 6 marks = 19 marks Level 3 evaluation is not sustained throughout. Your evaluation is not a conclusion or a repeat of your points. It must be critical distance. This candidate makes good use of one MIC point at Level 4 and one MAC point at Level 4. An excellent way to structure an answer for 9EC0 03. Para 1: MIC Level 4 KAA clear link to costs, use of cost/rev diagram and link to profits. Some parts of the development feel bolted together and not fully built/developed as a chain of reasoning. Para 2: Level 2+ EV e.g. depends on PED of product (lots of points that are not linked). Para 3: MAC Level 4 KAA clear link to AD/AS diagram & model. Developed chains of reasoning. Para 4: Level 3 EV positives arising from high interest rates/currency appreciation. Judgement with reasoning and long term issues identified in context Level 3. KAA Level 4 15 marks and EV Level 3 8 marks = 23 marks Level 3 Evaluation awarded as judgement is sufficient to justify Level 3 EV sustained throughout. Look at answers like this to inform your own responses. Often causes and effects are the wrong way round. Para 1: MIC KAA Level 2. Causes & effects muddled, lacks in concepts, mis-application of the data. Para 2: Level 2 EV. Lacks context and development. Para 3: MAC Level 1 KAA. Just simple identification/knowledge. KAA Level 2 5 marks and EV Level 1+ 3 marks = 8 marks Level 1 EV as not sustained throughout. When evaluating, you cannot use effects as an evaluation of cause. Answer the question!
Notes from the mark scheme and report
Level 4 needs at least one micro and one macro effect with reference to the UK or another developed economy
micro: costs, revenues and profits of firms
macro: real wages, competitiveness, uncertainty, investment
do not discuss causes of inflation or policies to reduce it
June 2024 · AS Paper 2 · Q6(a)4 marksAO1=2, AO2=2Short answer
Data and extracts for question 6
Mark scheme
Examiner's comment
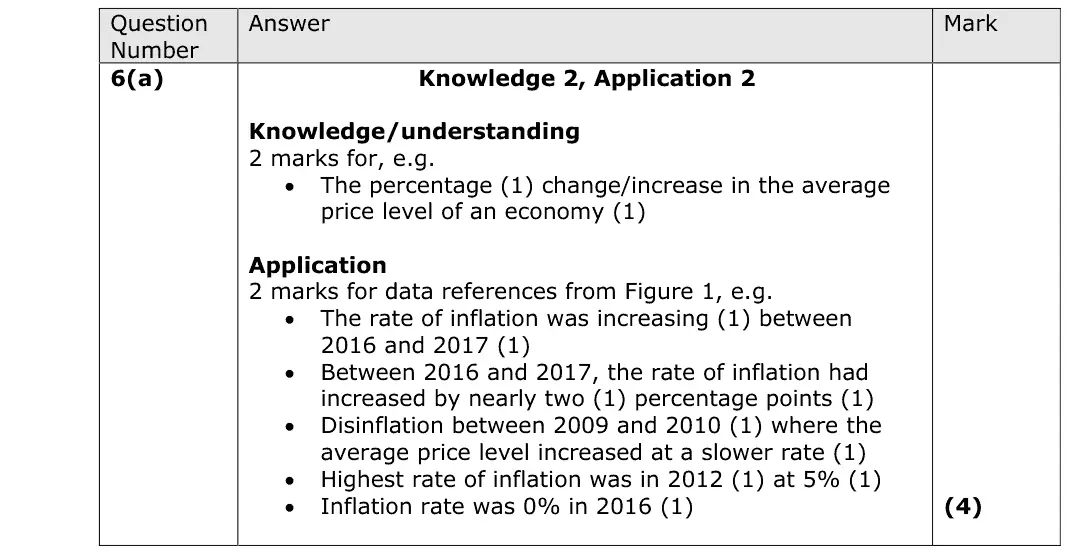
The four marks for this question are split in half between knowledge and application. Candidates achieved 2 marks for explanation of the term inflation rate and 2 marks for relevant application from Figure 1 only.
Notes from the mark scheme and report
the percentage change in the average price level over a year
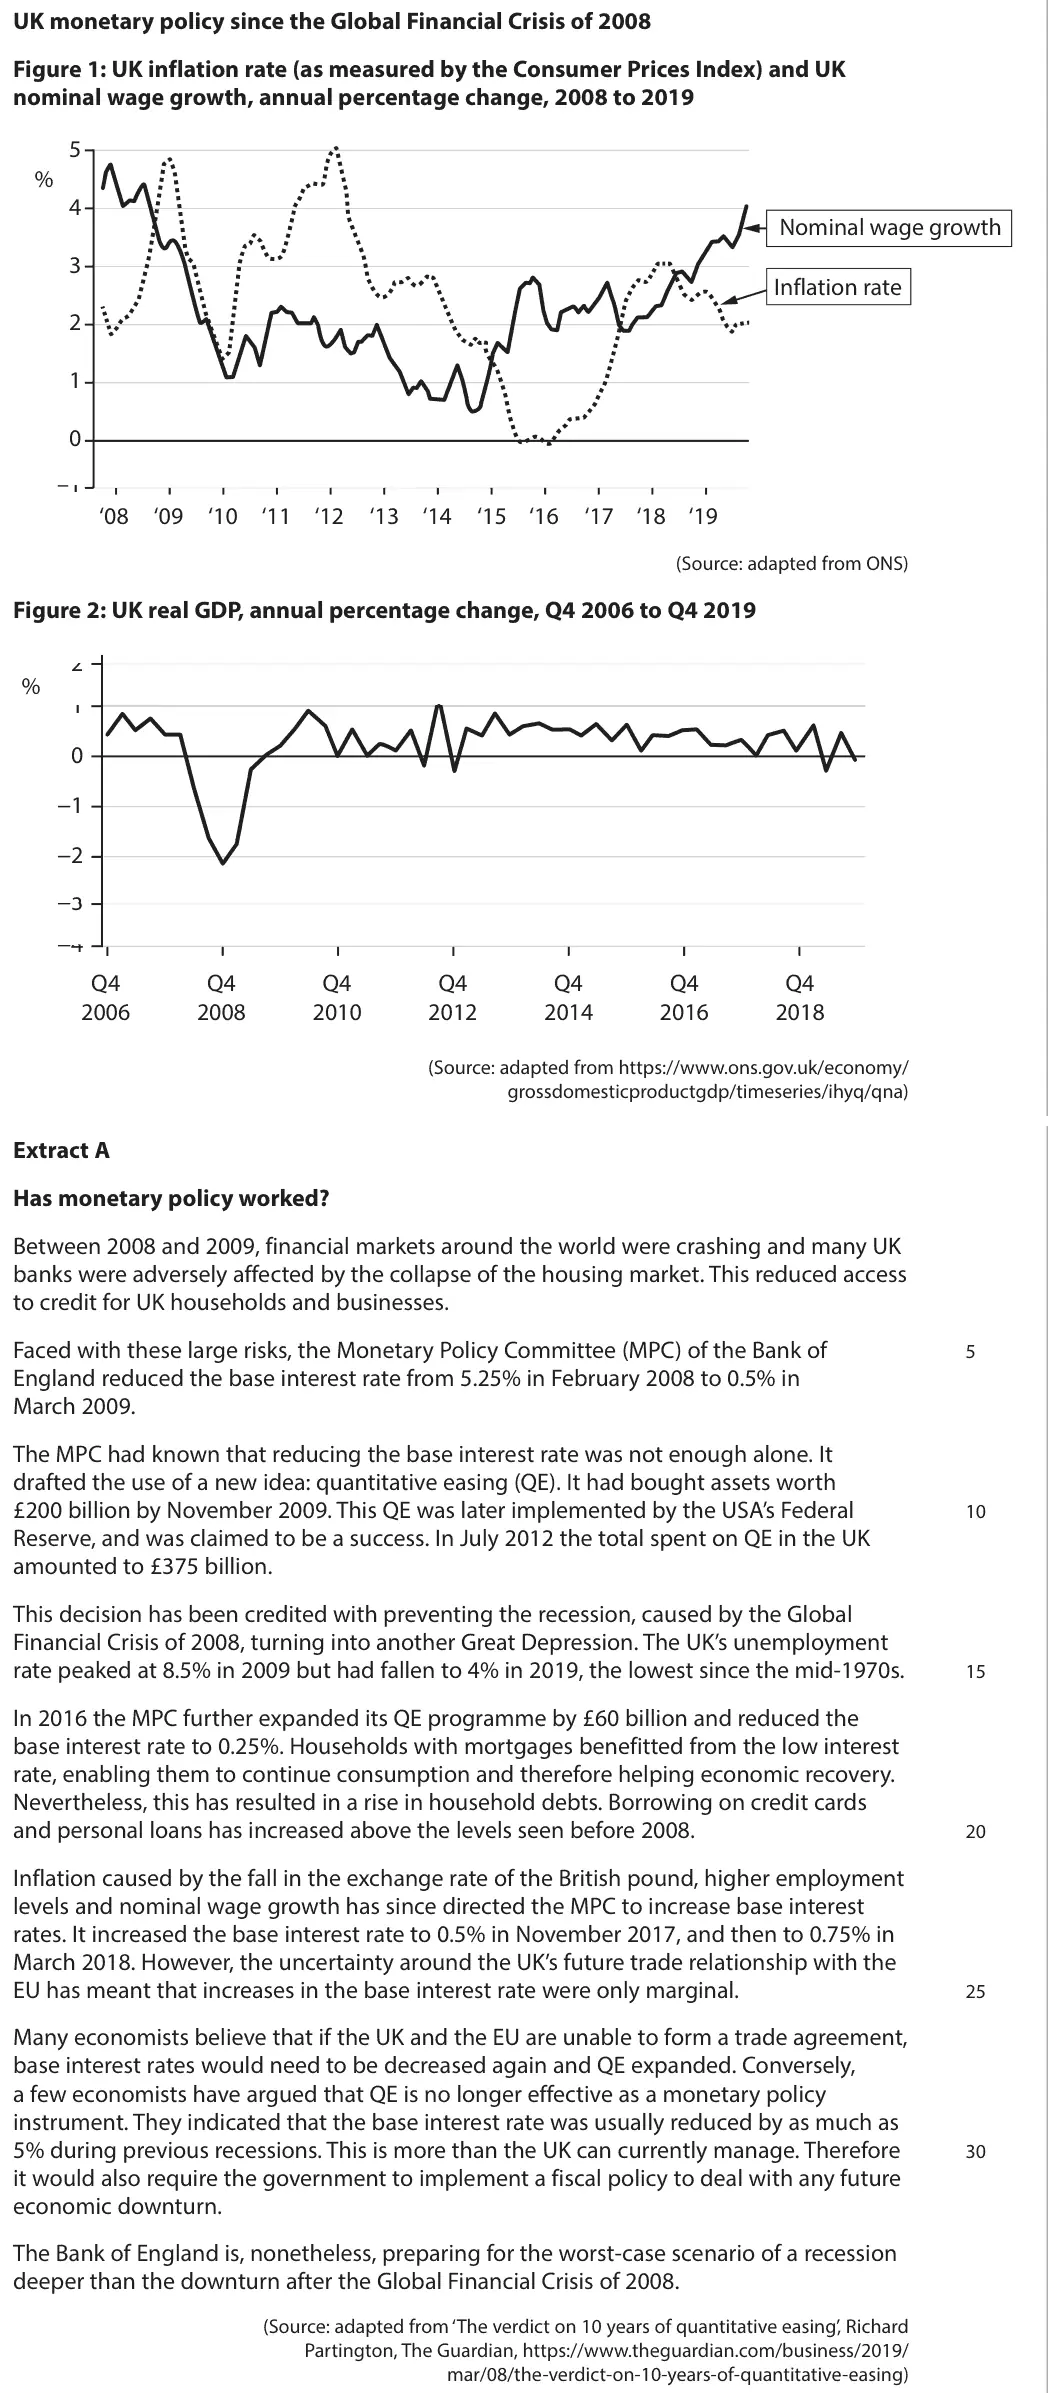
application from Figure 1 only, e.g. 0% in 2016 rising by nearly 2 percentage points by 2017, peak of 5% in 2012
Quantitative skills: QS 10 (distinguish between changes in the level of a variable, and the rate of change); QS 2 (calculate, use and understand percentages, percentage changes and percentage point changes); QS 9 (interpret, apply and analyse information in written, graphical tabular and numerical forms)
June 2024 · AS Paper 2 · Q6(d)5 marksAO1=1, AO2=2, AO3=2Short answer
Data and extracts for question 6
Mark scheme
Examiner's comment
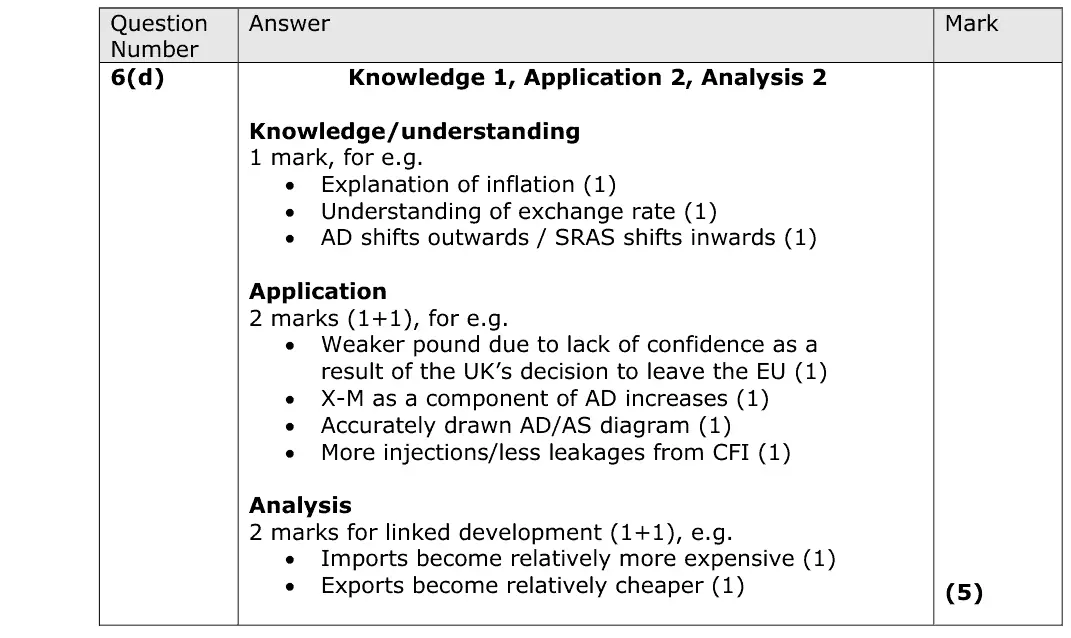
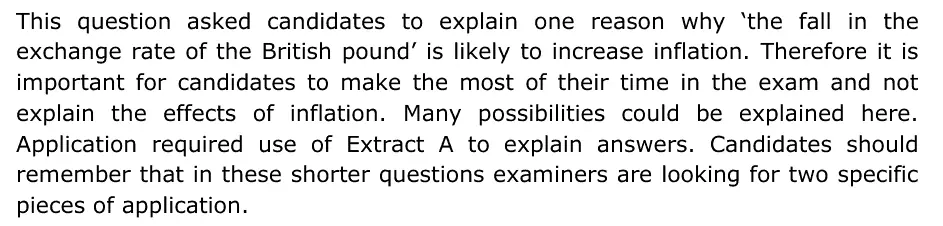
This question asked candidates to explain one reason why ‘the fall in the exchange rate of the British pound’ is likely to increase inflation. Therefore it is important for candidates to make the most of their time in the exam and not explain the effects of inflation. Many possibilities could be explained here. Application required use of Extract A to explain answers. Candidates should remember that in these shorter questions examiners are looking for two specific pieces of application.
Notes from the mark scheme and report
a weaker pound makes imports dearer (cost-push via SRAS) and exports cheaper (AD rises, demand-pull)
two application marks from Extract A e.g. Brexit uncertainty
do not explain the effects of inflation
June 2023 · AS Paper 2 · Q6(b)5 marksAO1=1, AO2=2, AO3=2Short answer
Data and extracts for question 6
Mark scheme
Examiner's comment
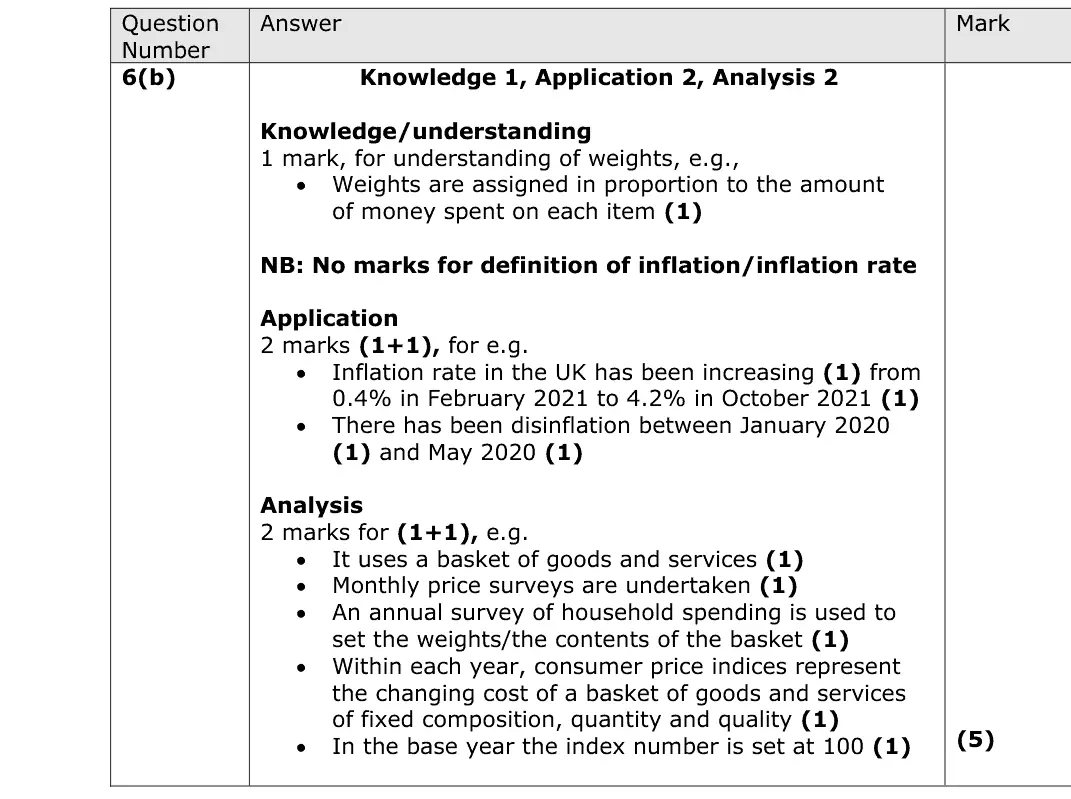
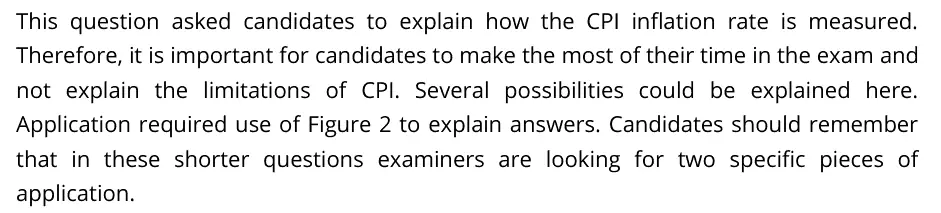
This question asked candidates to explain how the CPI inflation rate is measured. Therefore, it is important for candidates to make the most of their time in the exam and not explain the limitations of CPI. Several possibilities could be explained here. Application required use of Figure 2 to explain answers. Candidates should remember that in these shorter questions examiners are looking for two specific pieces of application.
Notes from the mark scheme and report
basket of goods and services, monthly price surveys, weights from the household spending survey in proportion to spending
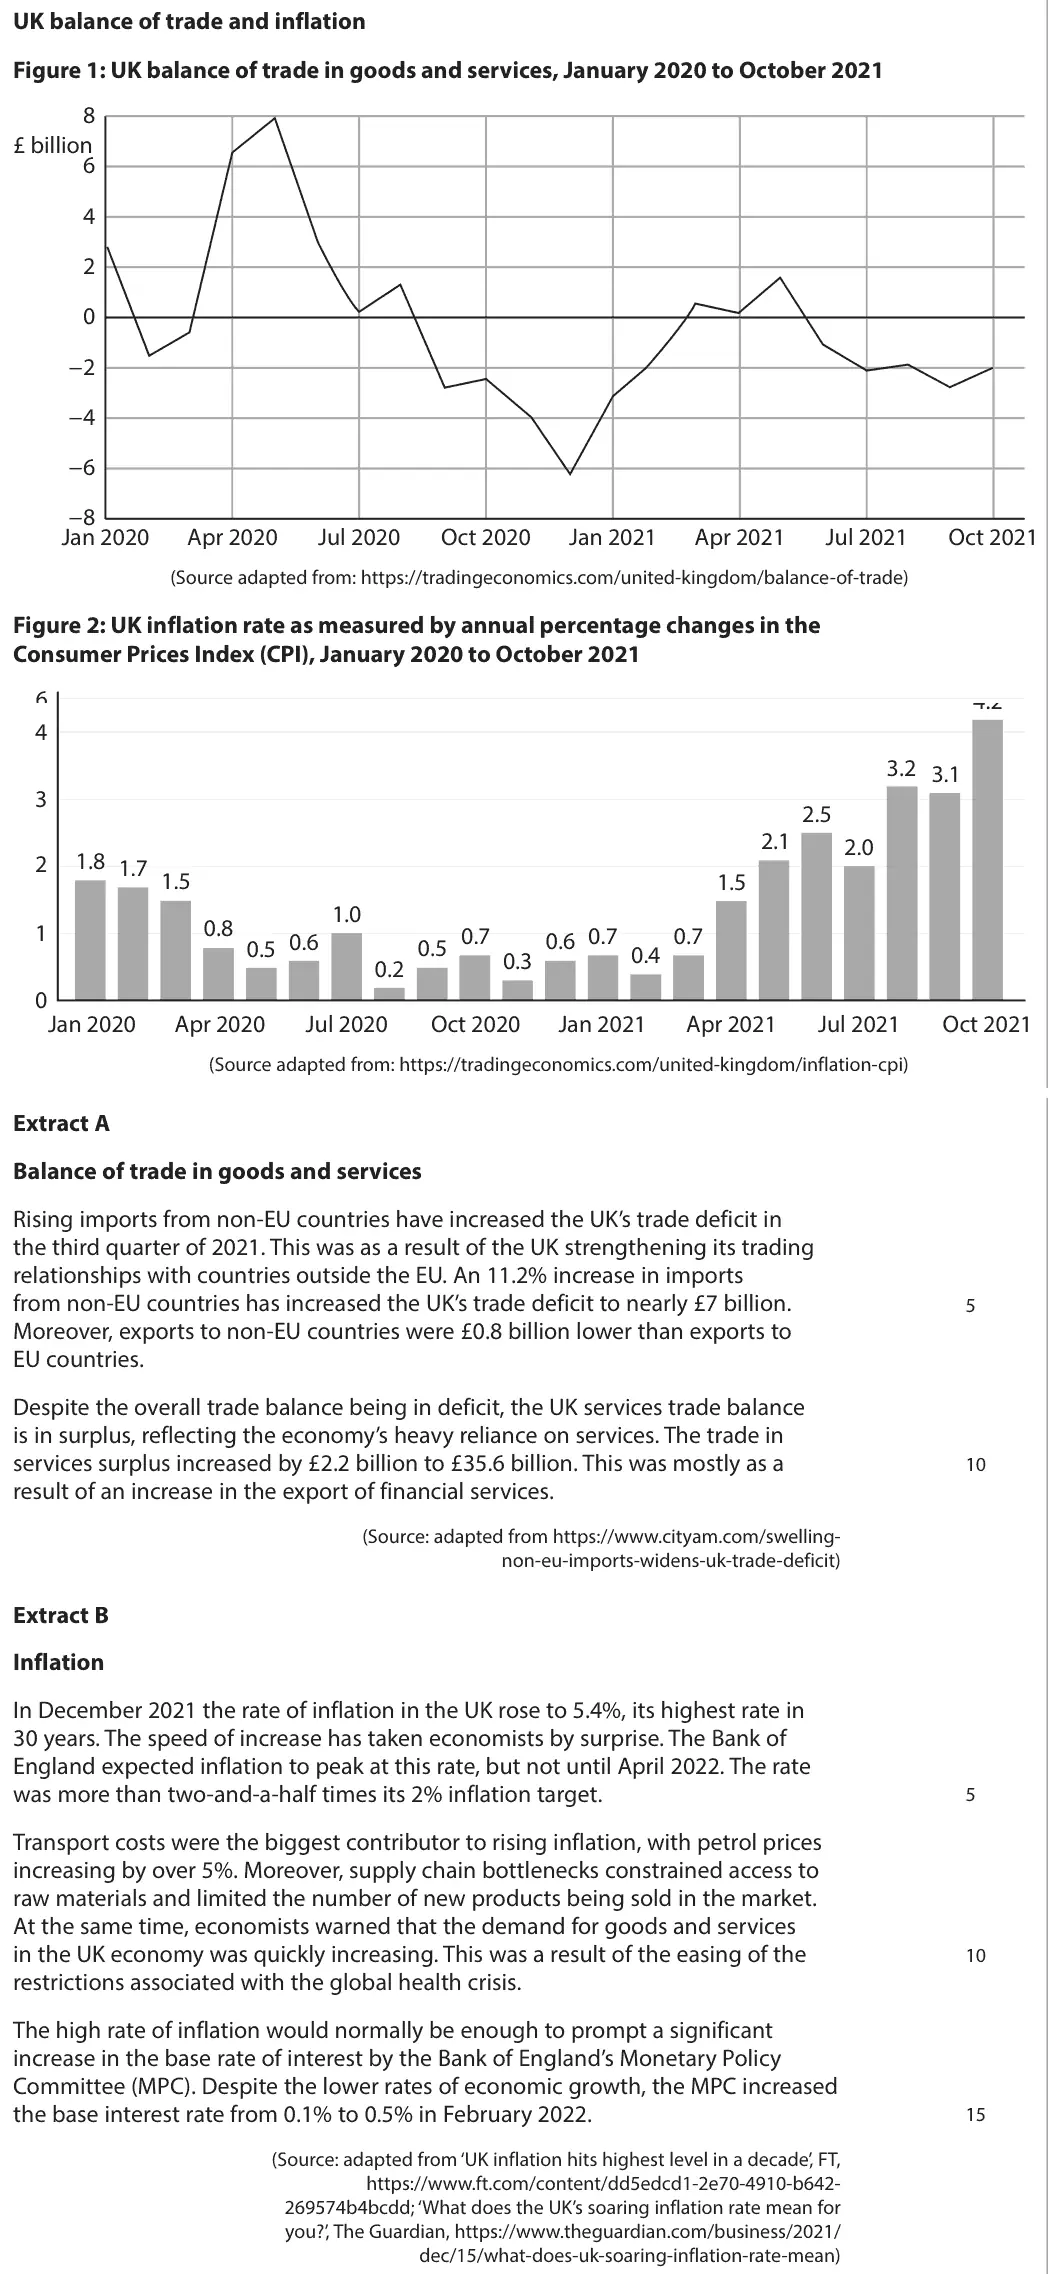
quote Figure 2 (0.4% Feb 2021 to 4.2% Oct 2021)
no marks for defining inflation
do not discuss CPI limitations
Quantitative skills: QS 5 (calculate and interpret index numbers); QS 9 (interpret, apply and analyse information in written, graphical tabular and numerical forms)
June 2023 · AS Paper 2 · Q6(d)6 marksAO1=2, AO2=2, AO3=2Short answer
Data and extracts for question 6
Mark scheme
Examiner's comment
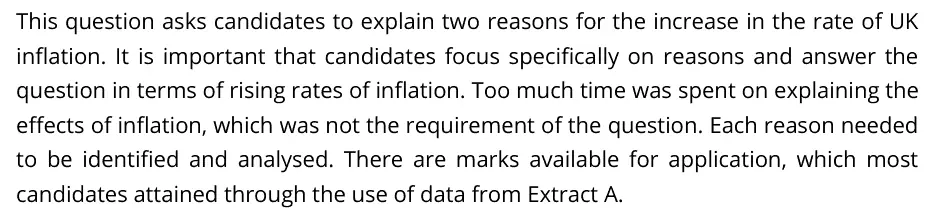
This question asks candidates to explain two reasons for the increase in the rate of UK inflation. It is important that candidates focus specifically on reasons and answer the question in terms of rising rates of inflation. Too much time was spent on explaining the effects of inflation, which was not the requirement of the question. Each reason needed to be identified and analysed. There are marks available for application, which most candidates attained through the use of data from Extract A.
Notes from the mark scheme and report
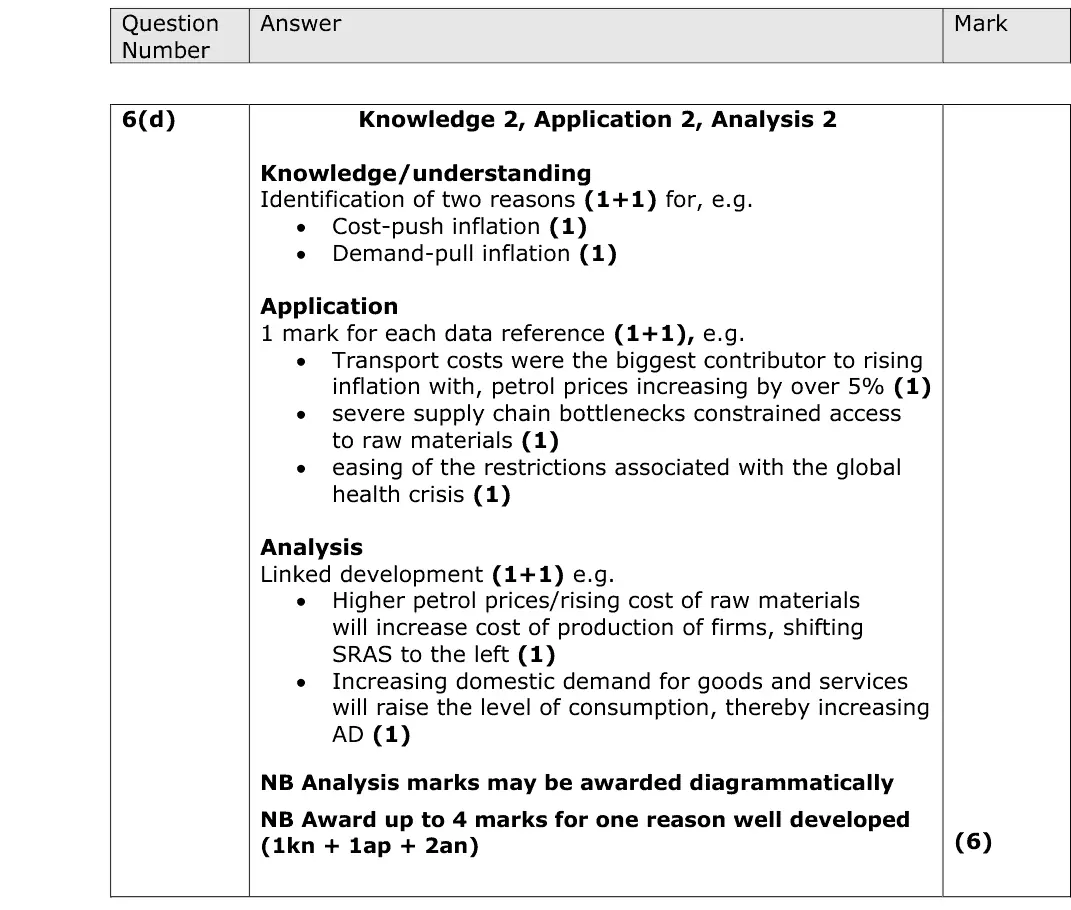
cost-push (petrol up over 5%, supply chain bottlenecks) and demand-pull (demand rising as restrictions eased), each developed
report: much time wasted on effects of inflation
Quantitative skills: QS 9 (interpret, apply and analyse information in written, graphical tabular and numerical forms)
June 2023 · AS Paper 2 · Q6(e)15 marksAO1=3, AO2=3, AO3=3, AO4=615-mark response
Data and extracts for question 6
Mark scheme, including the levels grid and indicative content
Examiner's comment
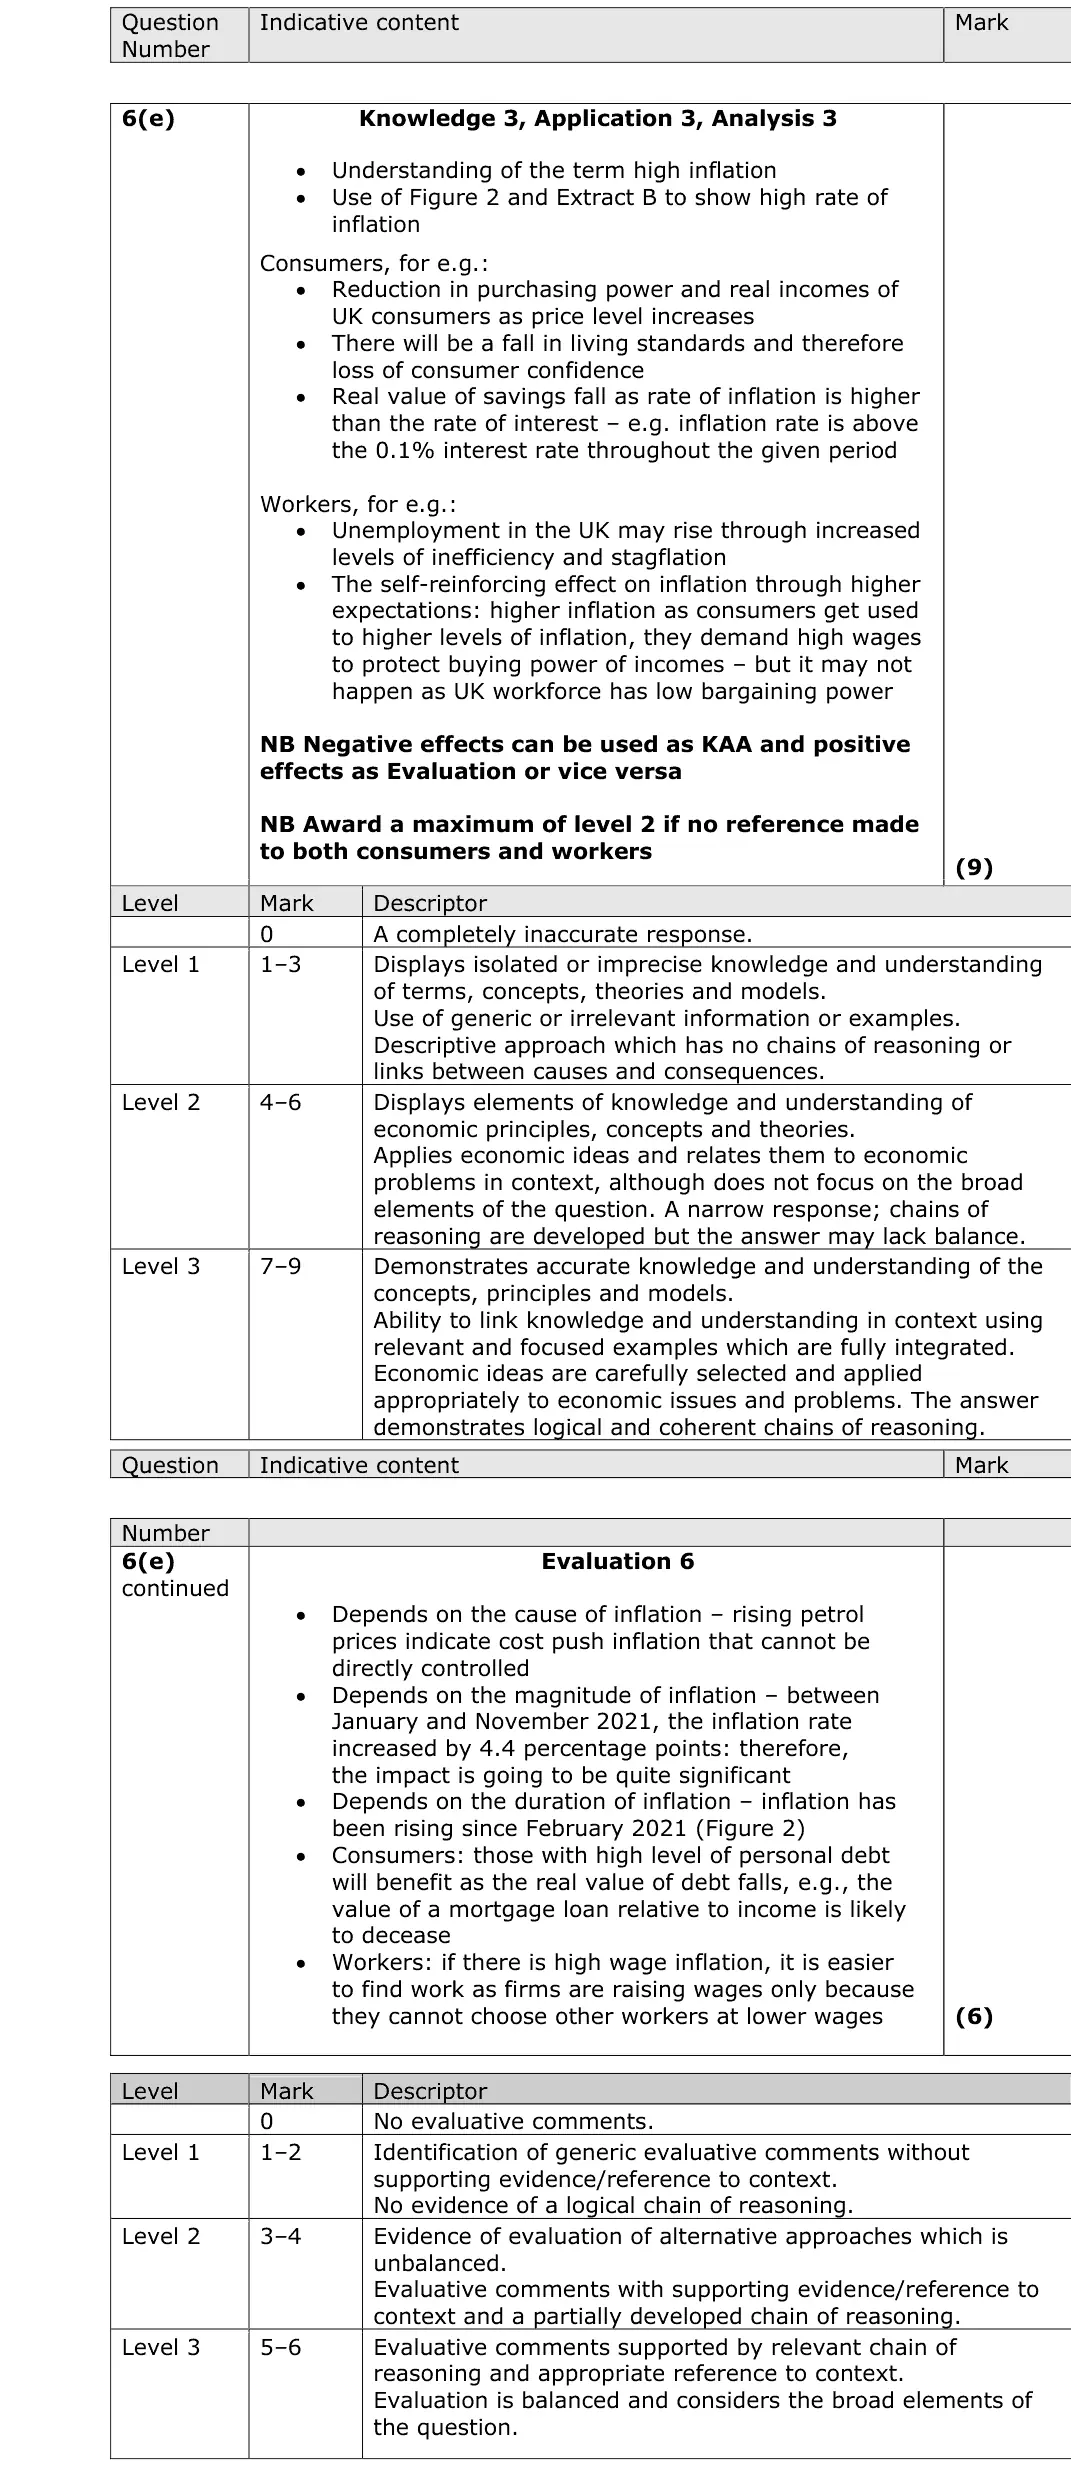
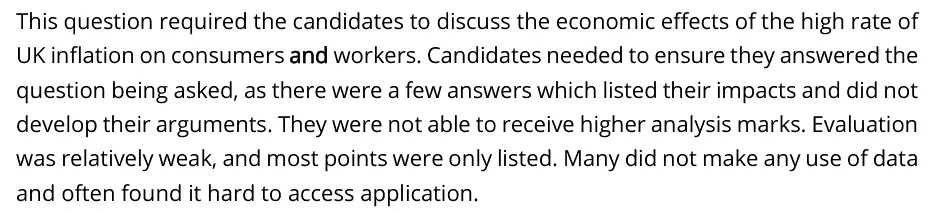
This question required the candidates to discuss the economic effects of the high rate of UK inflation on consumers and workers. Candidates needed to ensure they answered the question being asked, as there were a few answers which listed their impacts and did not develop their arguments. They were not able to receive higher analysis marks. Evaluation was relatively weak, and most points were only listed. Many did not make any use of data and often found it hard to access application.
Notes from the mark scheme and report
consumers: falling real incomes, purchasing power and value of savings (inflation above the 0.1% base rate), lower confidence
workers: real wage cuts, wage-price spiral, unemployment
report: effects listed not developed, weak evaluation, many ignored the data
Quantitative skills: QS 9 (interpret, apply and analyse information in written, graphical tabular and numerical forms)
June 2023 · AS Paper 2 · Q6(g)20 marksAO1=4, AO2=4, AO3=6, AO4=620-mark essayEither/or
Data and extracts for question 6
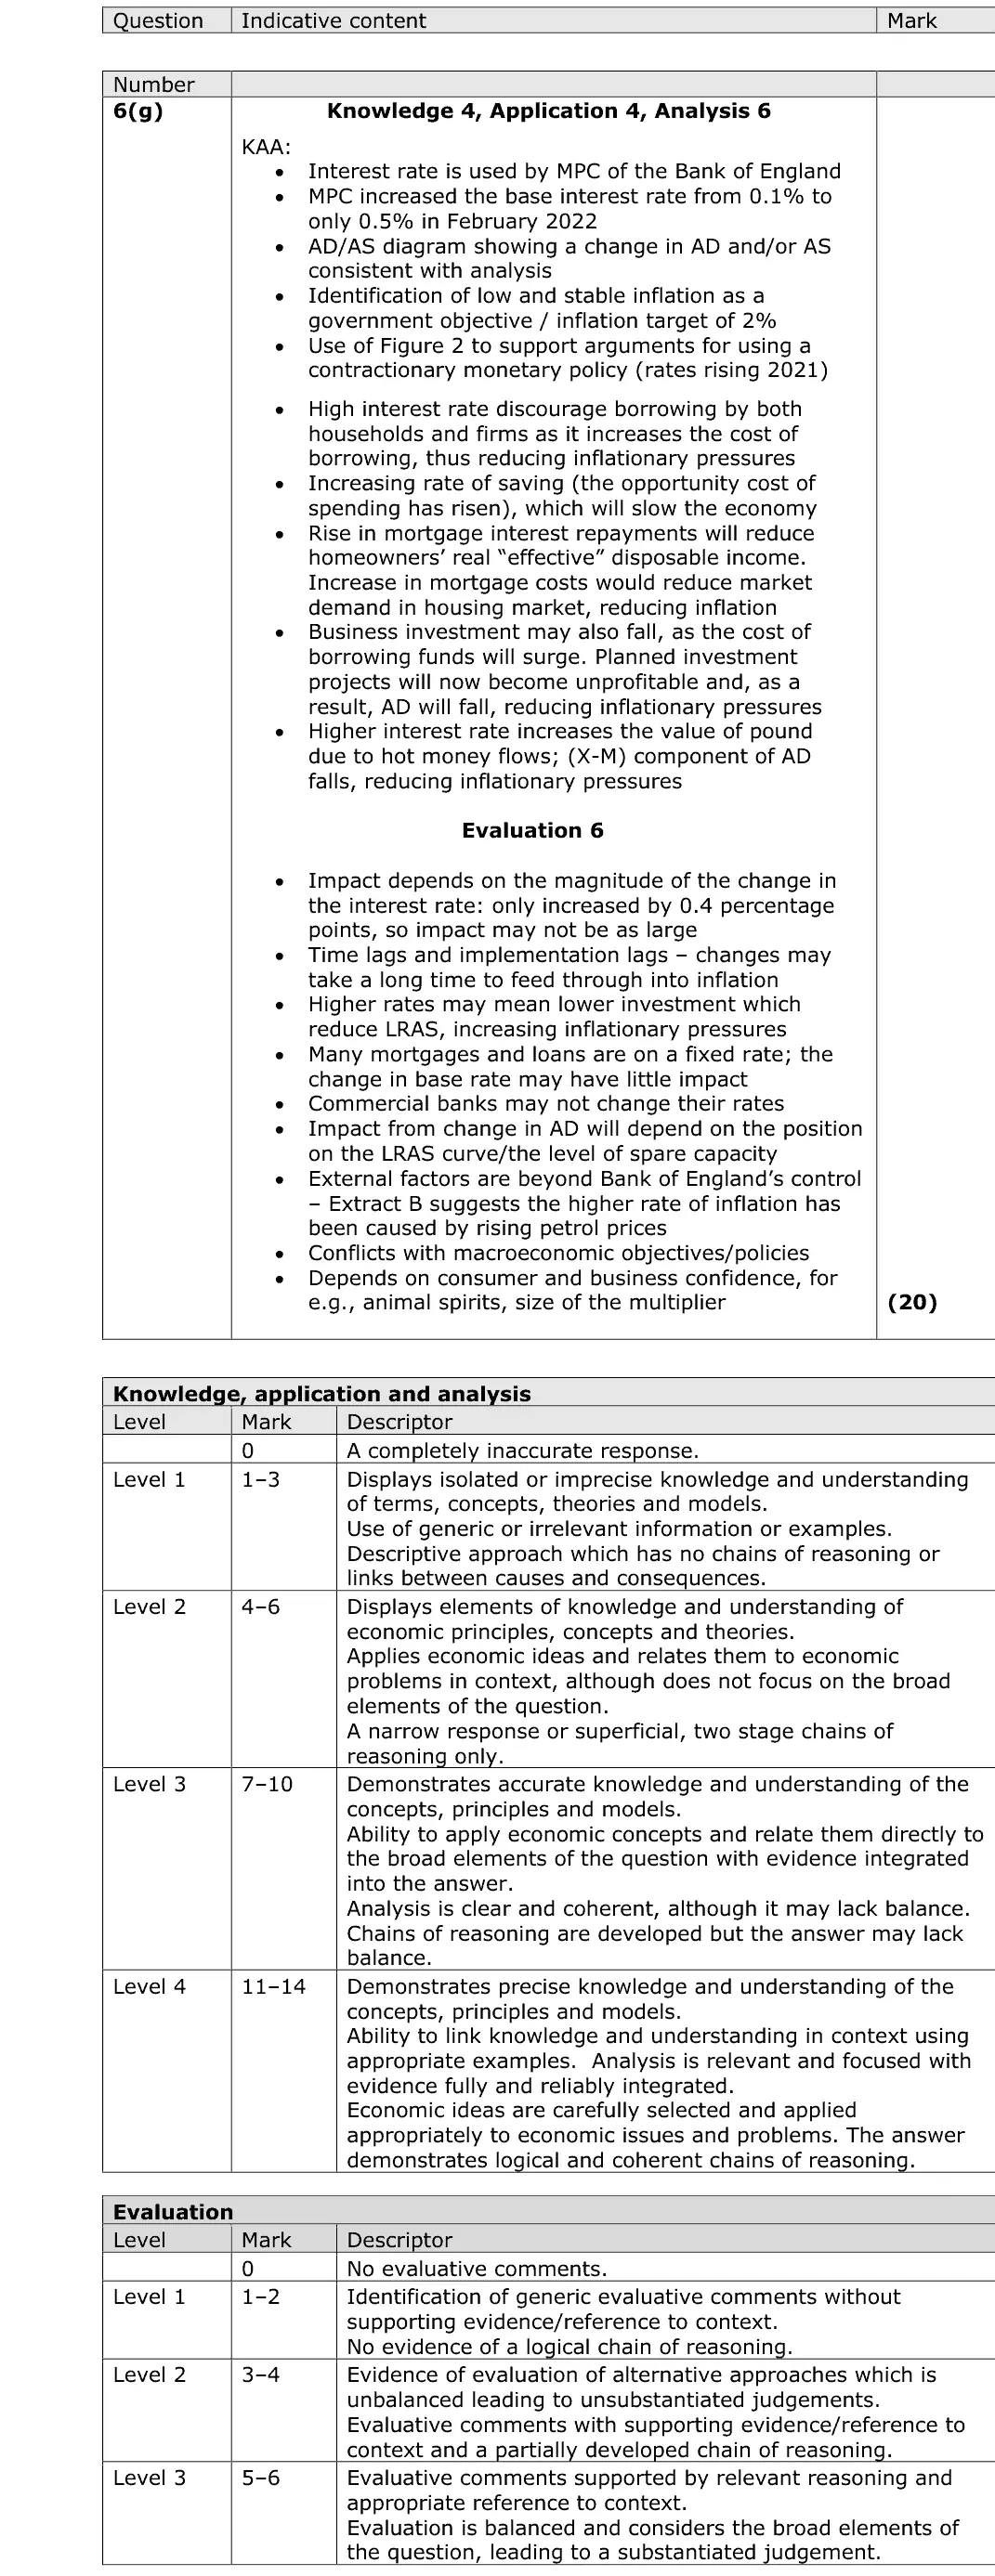
Mark scheme, including the levels grid and indicative content
Examiner's comment
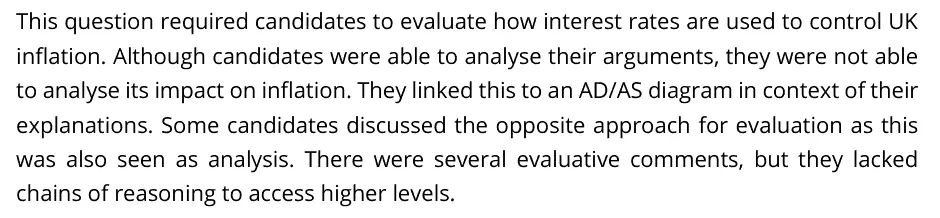
This question required candidates to evaluate how interest rates are used to control UK inflation. Although candidates were able to analyse their arguments, they were not able to analyse its impact on inflation. They linked this to an AD/AS diagram in context of their explanations. Some candidates discussed the opposite approach for evaluation as this was also seen as analysis. There were several evaluative comments, but they lacked chains of reasoning to access higher levels.
Notes from the mark scheme and report
Bank Rate rise (0.1% to 0.5% in Feb 2022) raises borrowing costs, saving and mortgage payments, cuts C and I and AD, and may raise the pound
evaluate cost-push causes, time lags, small rises
report: impact on inflation itself was not analysed and evaluation lacked chains of reasoning
Quantitative skills: QS 9 (interpret, apply and analyse information in written, graphical tabular and numerical forms)
June 2023 · Paper 3 · Q1(b)8 marksAO1=2, AO2=2, AO3=2, AO4=28-mark response
Data and extracts for question 1
Mark scheme, including the levels grid and indicative content
Examiner's comment
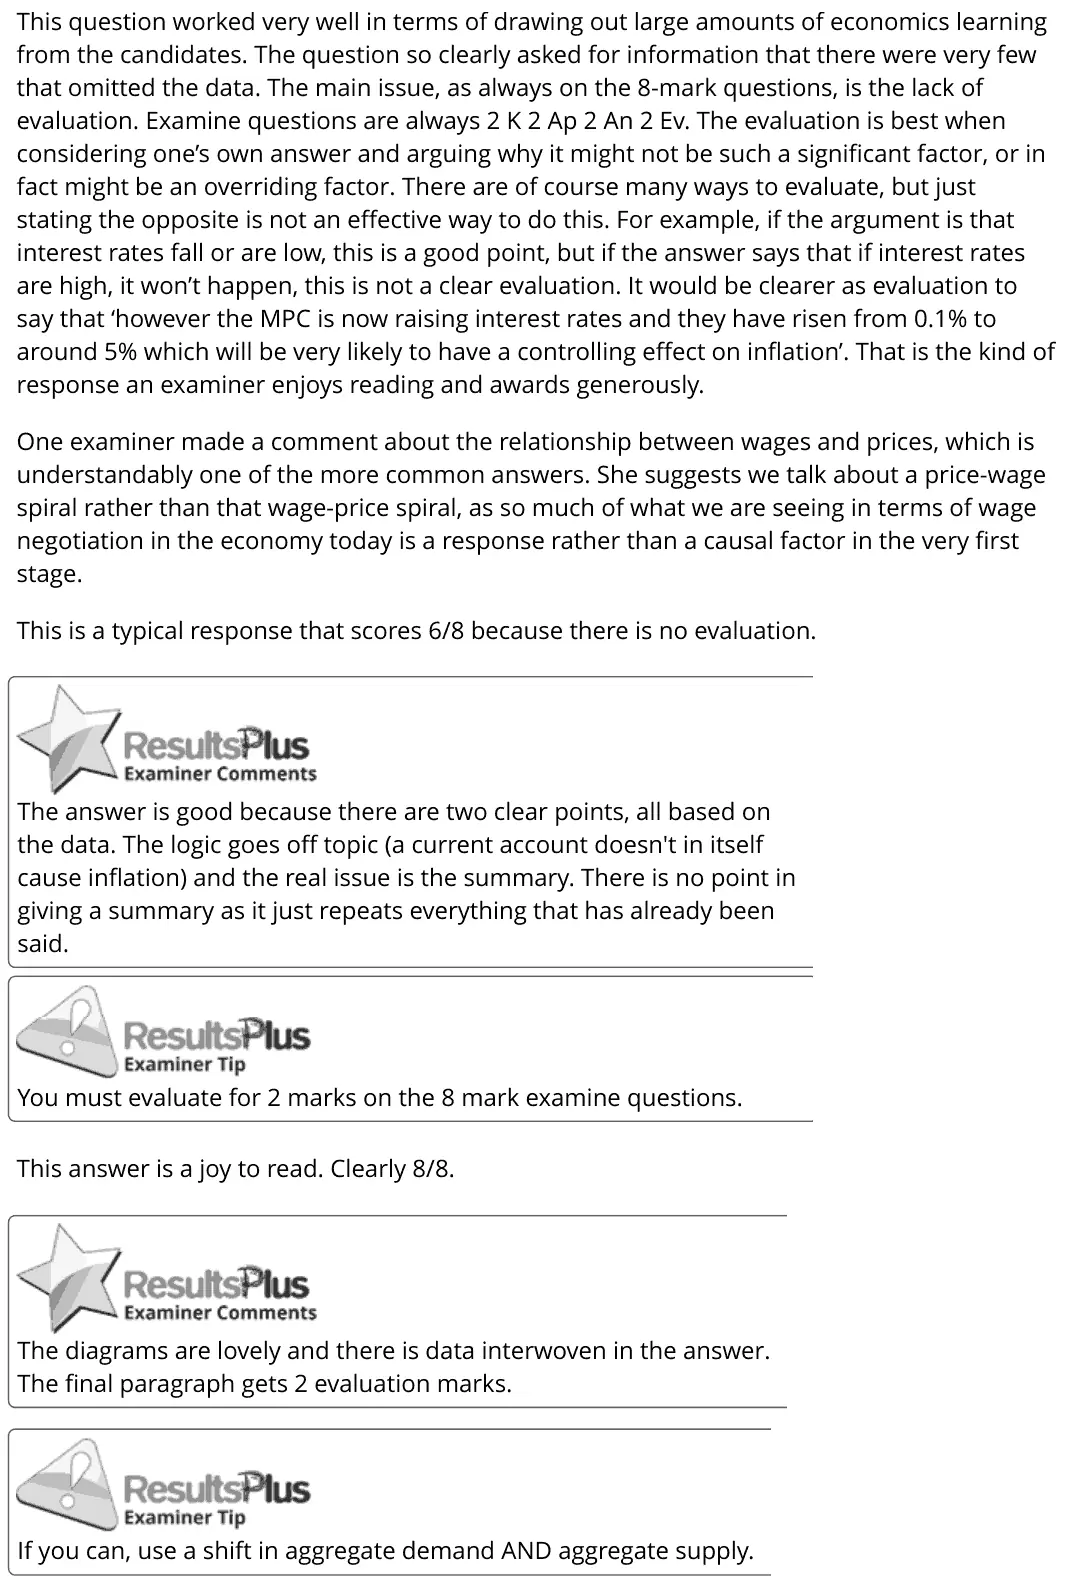
This question worked very well in terms of drawing out large amounts of economics learning from the candidates. The question so clearly asked for information that there were very few that omitted the data. The main issue, as always on the 8-mark questions, is the lack of evaluation. Examine questions are always 2 K 2 Ap 2 An 2 Ev. The evaluation is best when considering one’s own answer and arguing why it might not be such a significant factor, or in fact might be an overriding factor. There are of course many ways to evaluate, but just stating the opposite is not an effective way to do this. For example, if the argument is that interest rates fall or are low, this is a good point, but if the answer says that if interest rates are high, it won’t happen, this is not a clear evaluation. It would be clearer as evaluation to say that ‘however the MPC is now raising interest rates and they have risen from 0.1% to around 5% which will be very likely to have a controlling effect on inflation’. That is the kind of response an examiner enjoys reading and awards generously. One examiner made a comment about the relationship between wages and prices, which is understandably one of the more common answers. She suggests we talk about a price-wage spiral rather than that wage-price spiral, as so much of what we are seeing in terms of wage negotiation in the economy today is a response rather than a causal factor in the very first stage. This is a typical response that scores 6/8 because there is no evaluation. The answer is good because there are two clear points, all based on the data. The logic goes off topic (a current account doesn't in itself cause inflation) and the real issue is the summary. There is no point in giving a summary as it just repeats everything that has already been said. You must evaluate for 2 marks on the 8 mark examine questions. This answer is a joy to read. Clearly 8/8. The diagrams are lovely and there is data interwoven in the answer. The final paragraph gets 2 evaluation marks. If you can, use a shift in aggregate demand AND aggregate supply.
Notes from the mark scheme and report
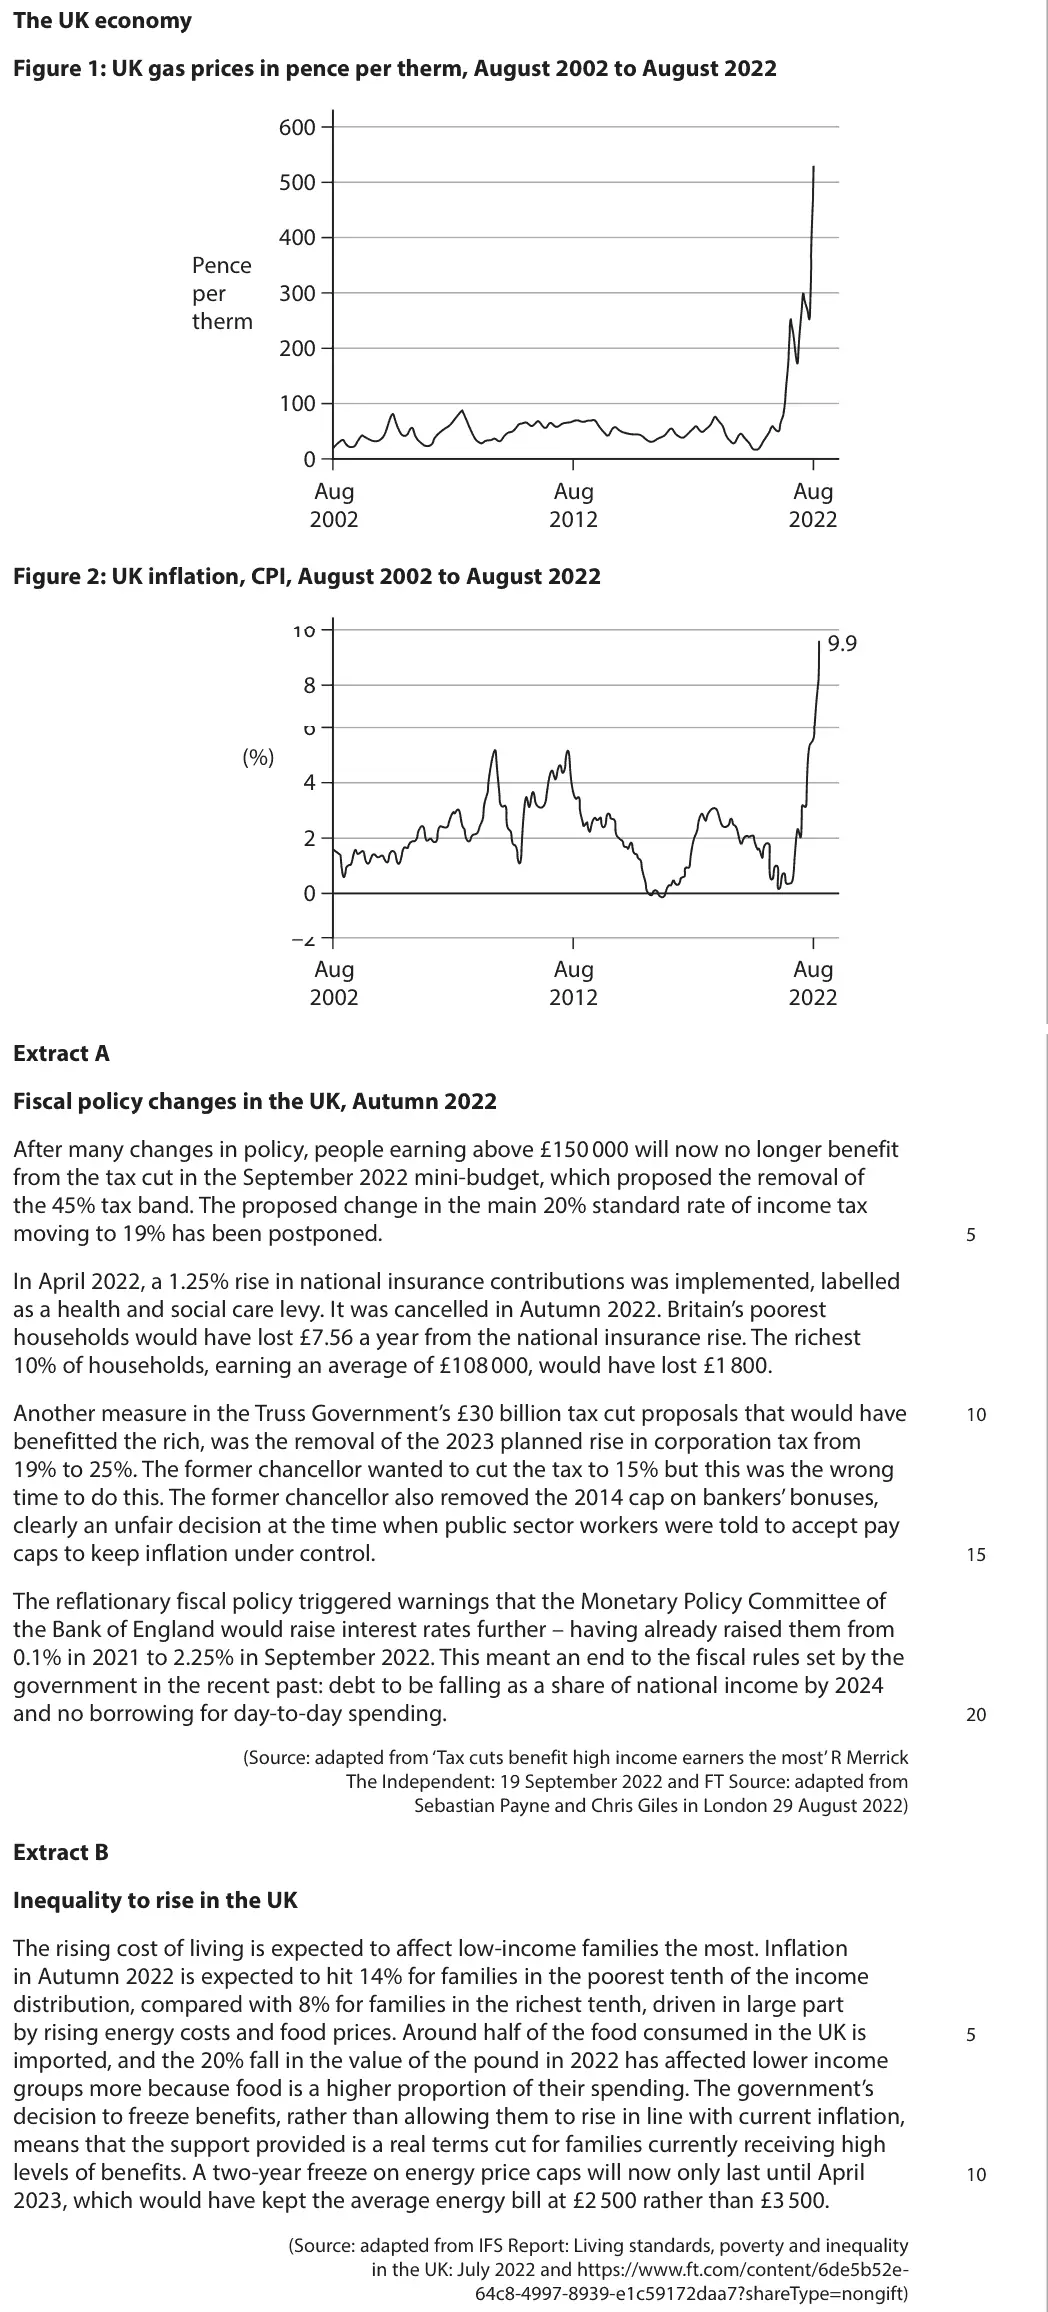
cost push (gas prices in Figure 1, 20% fall in the pound raising import prices) and demand pull (tax cuts)
quote figures, e.g. CPI 9.9%
evaluate by weighing your own point (e.g. MPC raising rates from 0.1%), not by stating the opposite
Quantitative skills: QS 9 (interpret, apply and analyse information in written, graphical tabular and numerical forms)
June 2023 · Paper 3 · Q2(e)25 marksAO1=4, AO2=4, AO3=8, AO4=925-mark essayEither/orHard
Data and extracts for question 2
Mark scheme, including the levels grid and indicative content
Examiner's comment
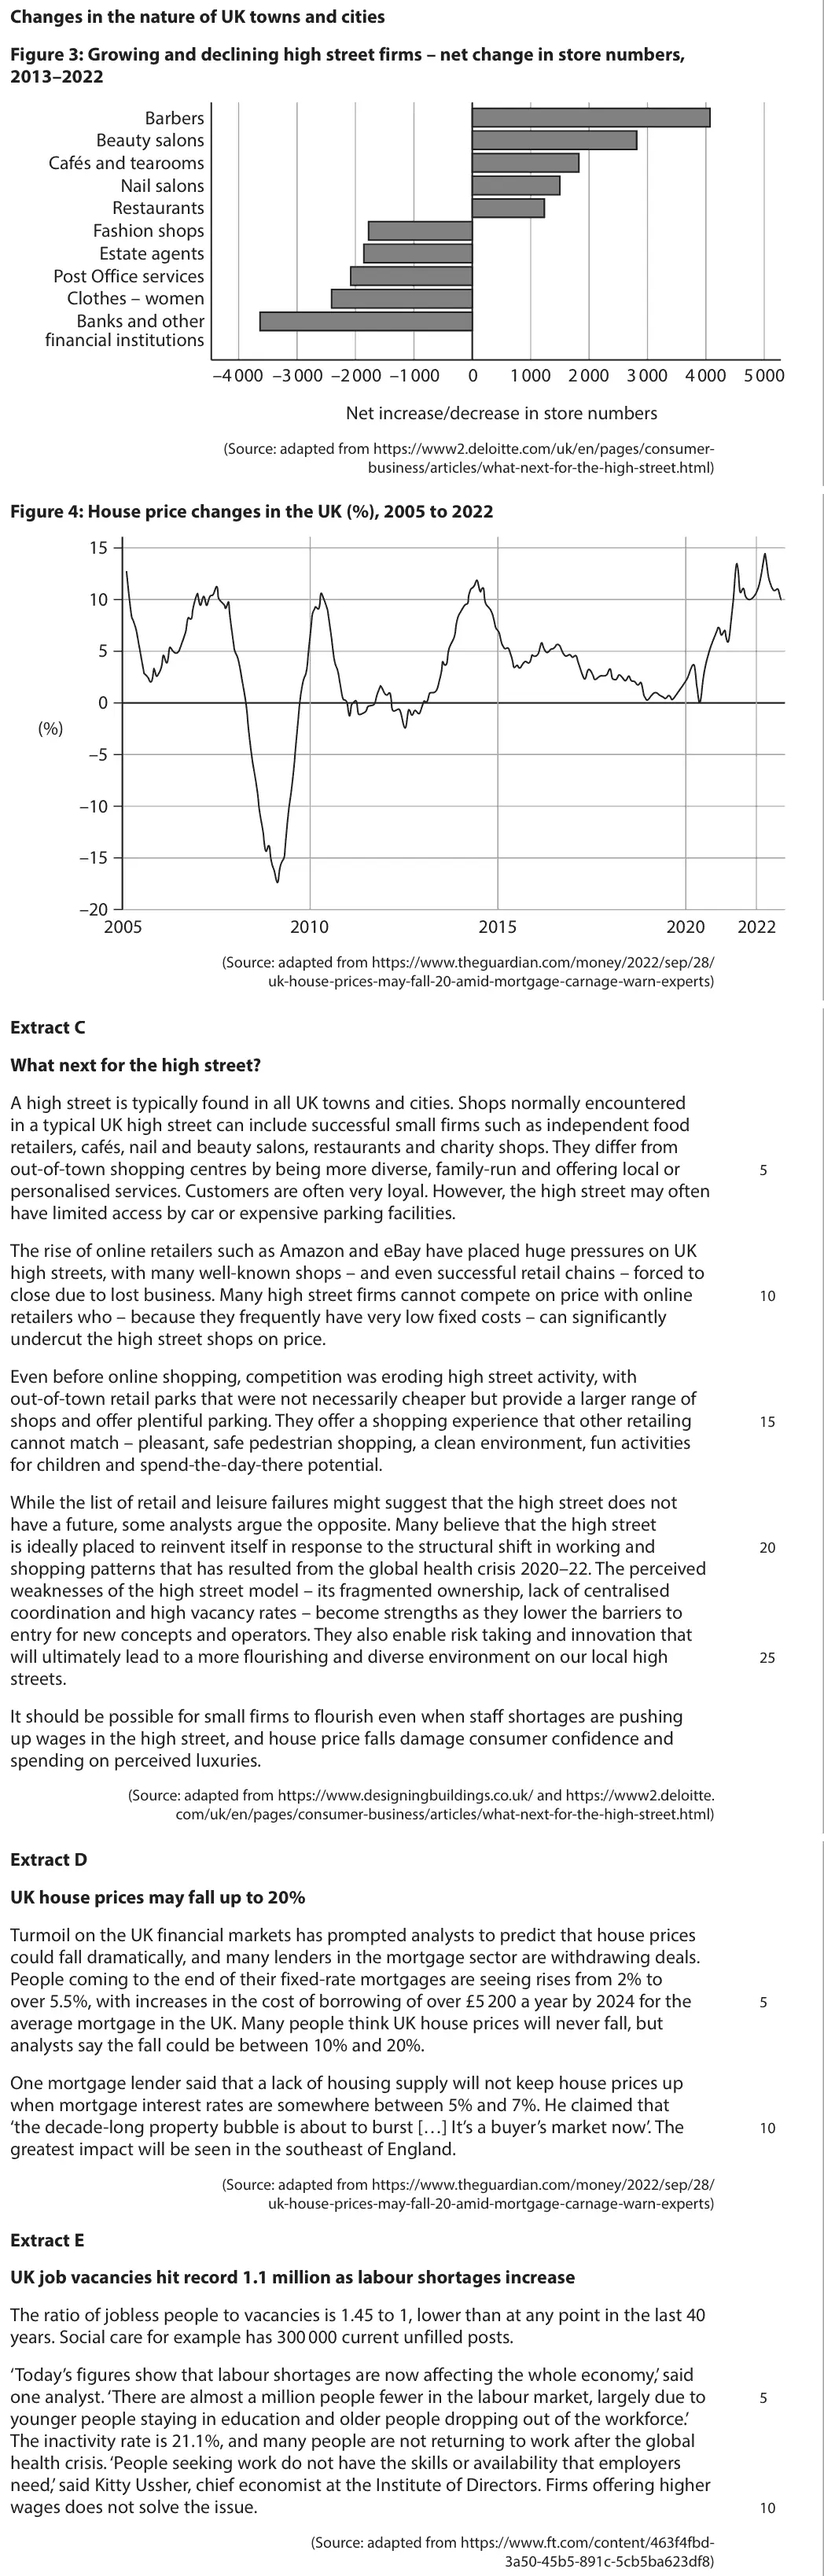
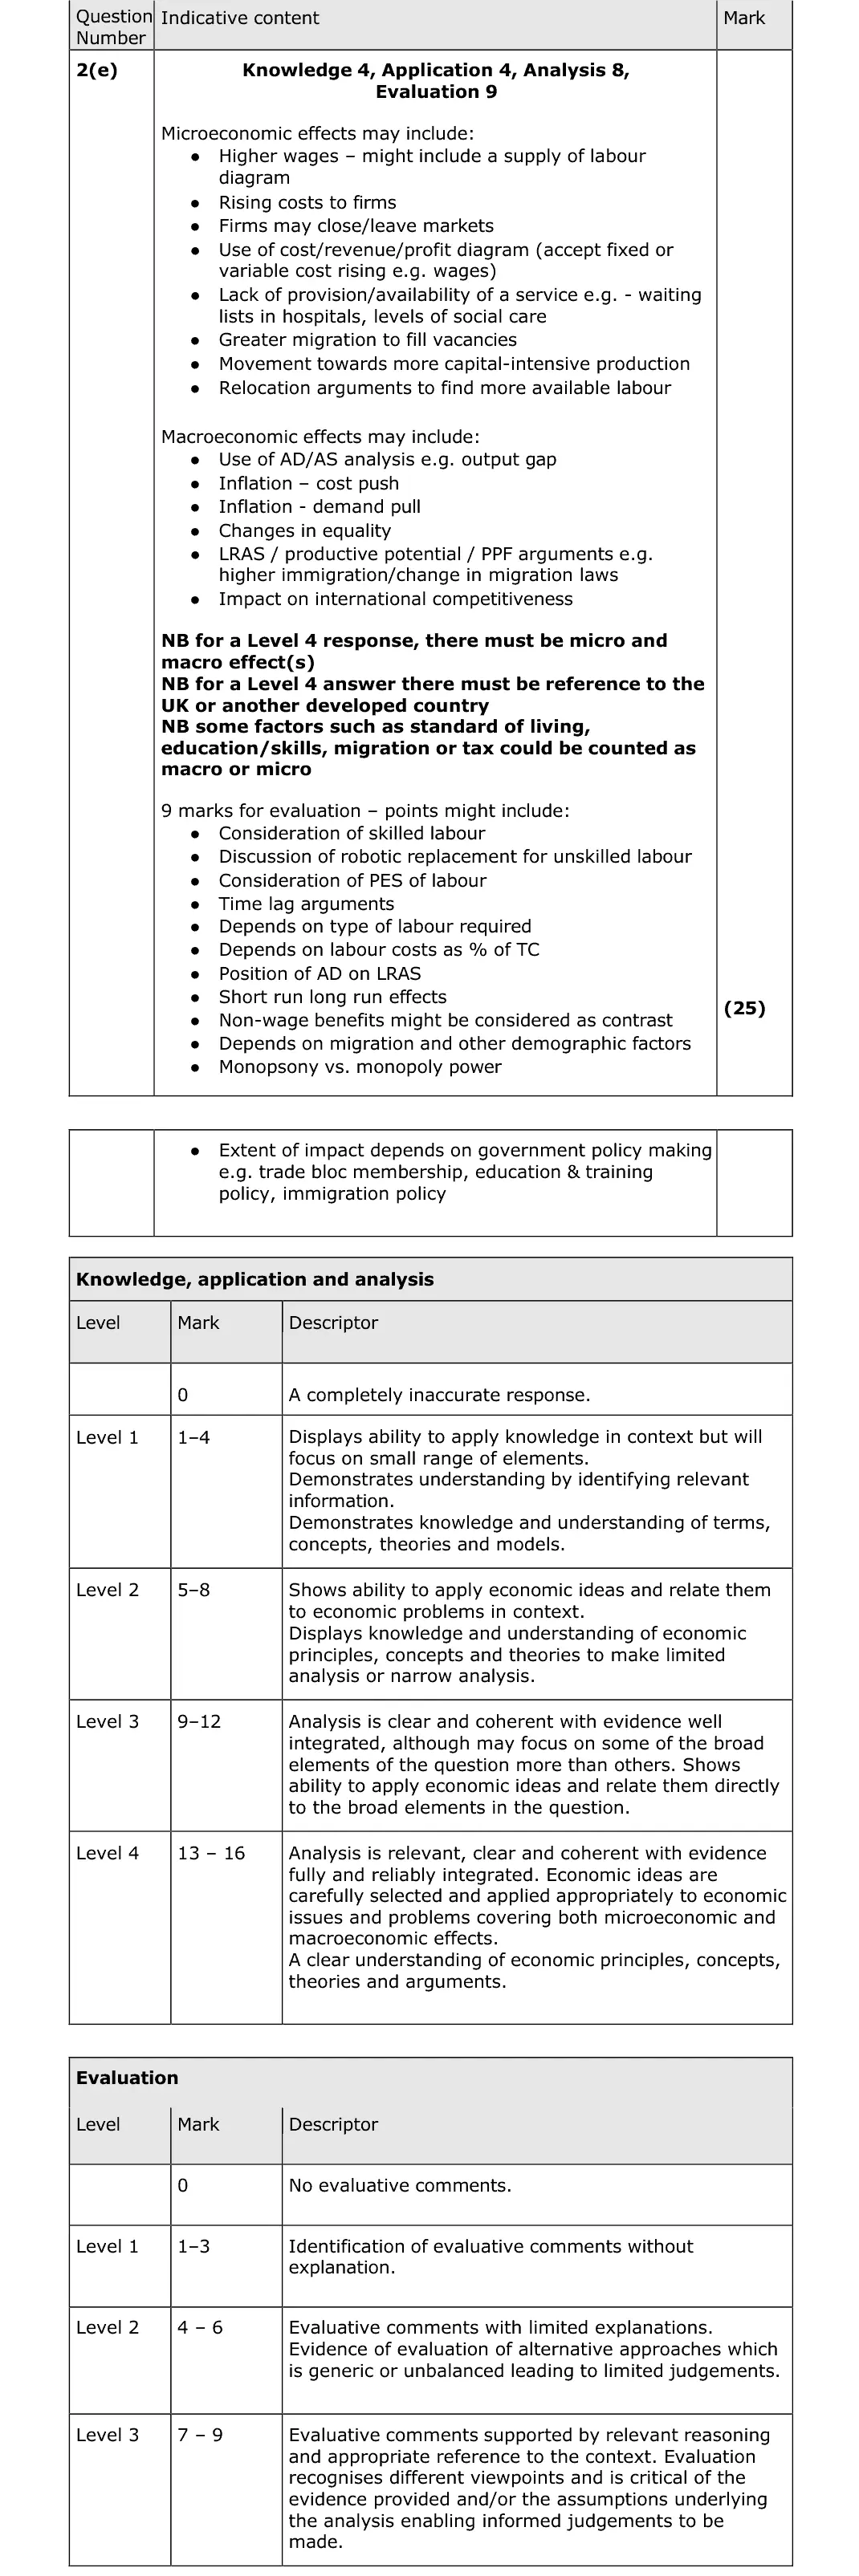
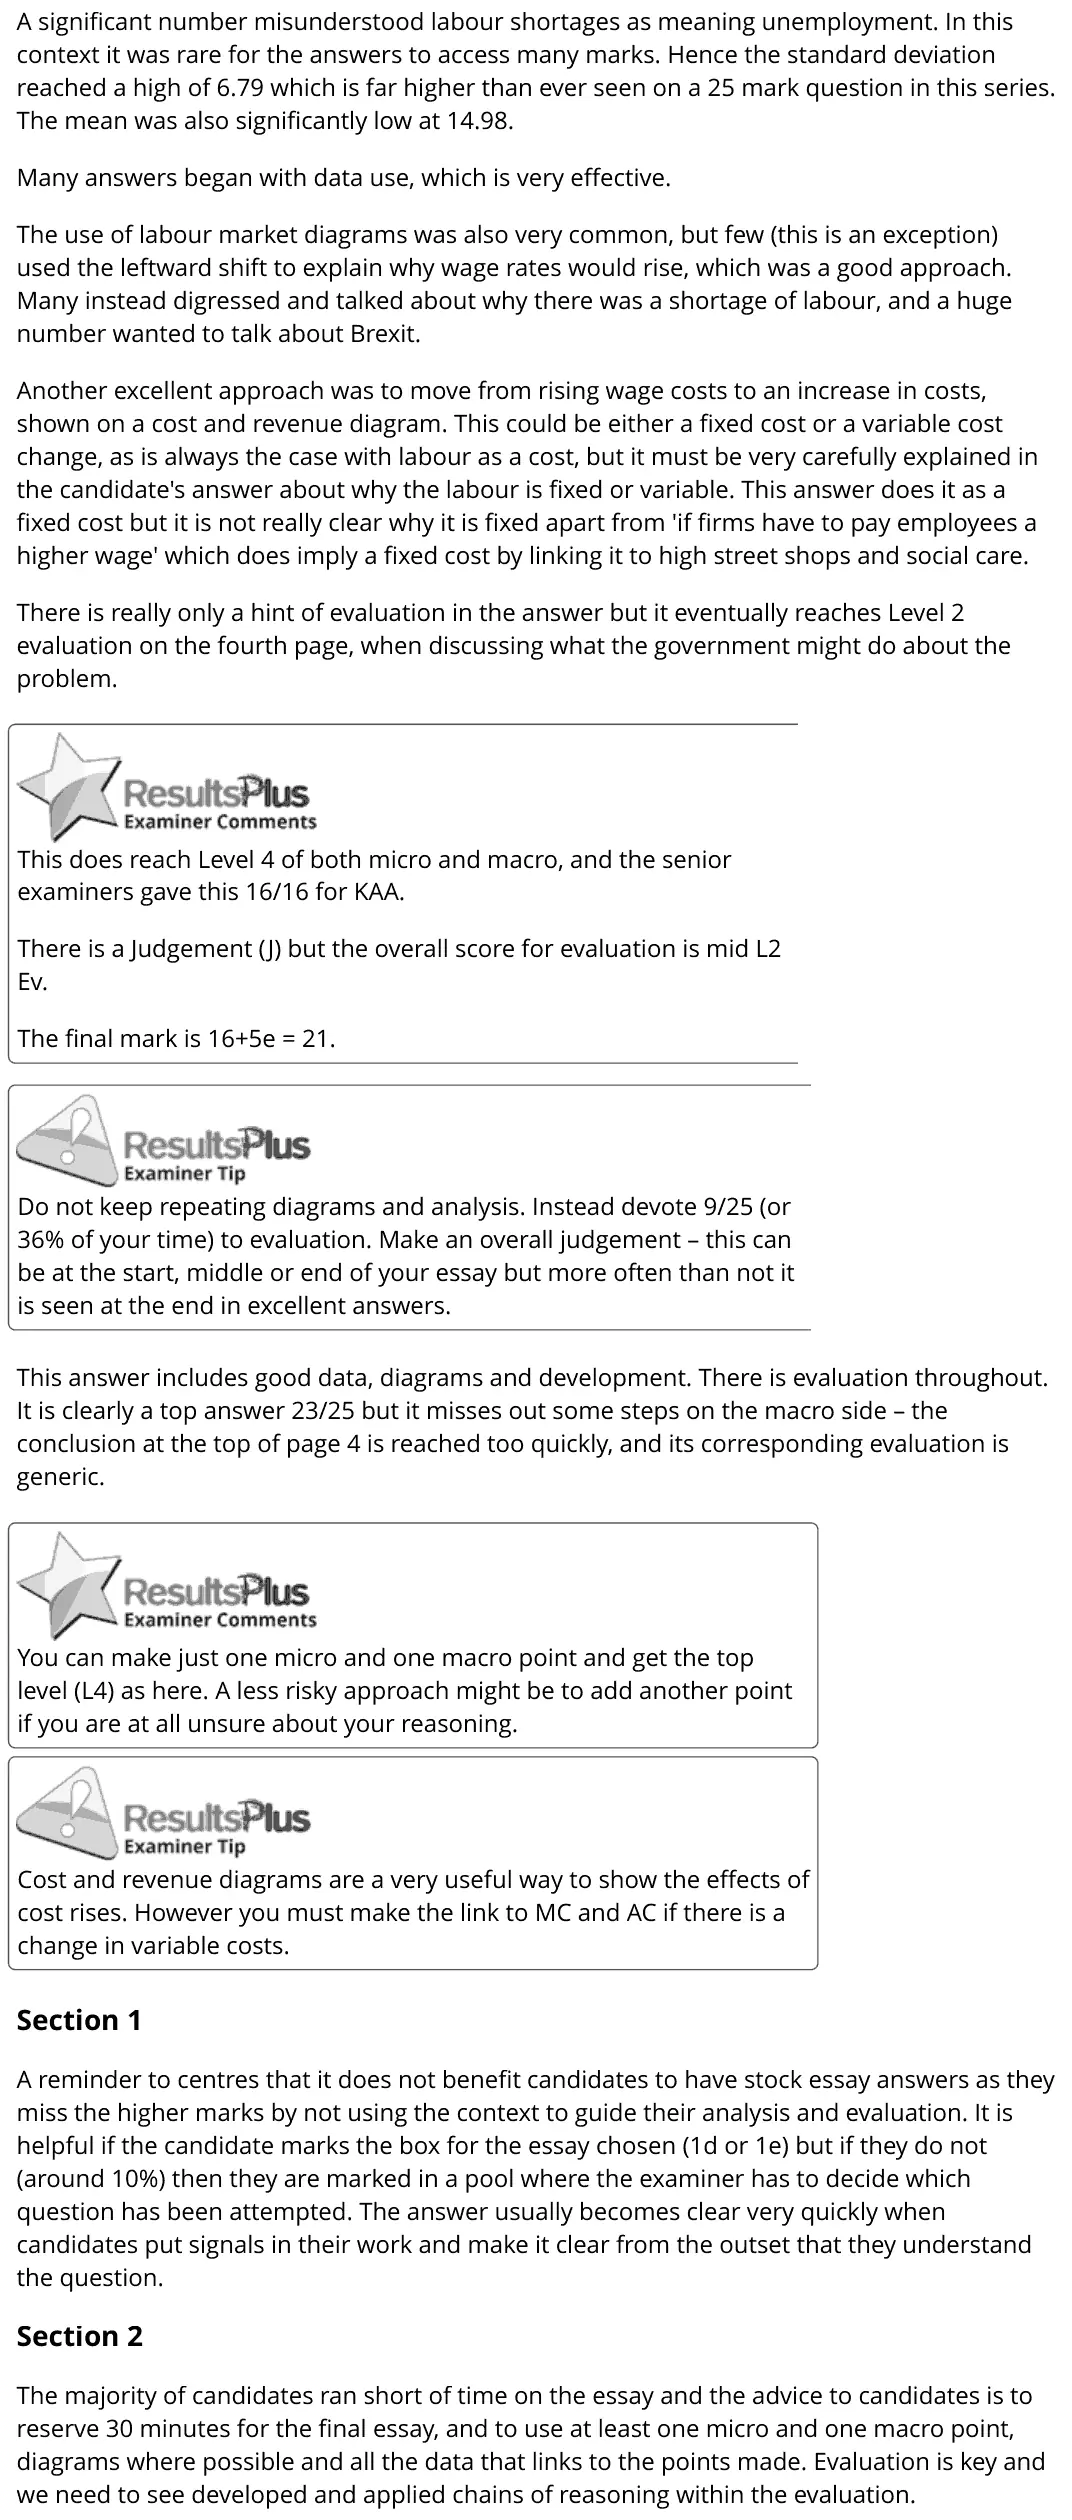
A significant number misunderstood labour shortages as meaning unemployment. In this context it was rare for the answers to access many marks. Hence the standard deviation reached a high of 6.79 which is far higher than ever seen on a 25 mark question in this series. The mean was also significantly low at 14.98. Many answers began with data use, which is very effective. The use of labour market diagrams was also very common, but few (this is an exception) used the leftward shift to explain why wage rates would rise, which was a good approach. Many instead digressed and talked about why there was a shortage of labour, and a huge number wanted to talk about Brexit. Another excellent approach was to move from rising wage costs to an increase in costs, shown on a cost and revenue diagram. This could be either a fixed cost or a variable cost change, as is always the case with labour as a cost, but it must be very carefully explained in the candidate's answer about why the labour is fixed or variable. This answer does it as a fixed cost but it is not really clear why it is fixed apart from 'if firms have to pay employees a higher wage' which does imply a fixed cost by linking it to high street shops and social care. There is really only a hint of evaluation in the answer but it eventually reaches Level 2 evaluation on the fourth page, when discussing what the government might do about the problem. This does reach Level 4 of both micro and macro, and the senior examiners gave this 16/16 for KAA. There is a Judgement (J) but the overall score for evaluation is mid L2 Ev. The final mark is 16+5e = 21. Do not keep repeating diagrams and analysis. Instead devote 9/25 (or 36% of your time) to evaluation. Make an overall judgement – this can be at the start, middle or end of your essay but more often than not it is seen at the end in excellent answers. This answer includes good data, diagrams and development. There is evaluation throughout. It is clearly a top answer 23/25 but it misses out some steps on the macro side – the conclusion at the top of page 4 is reached too quickly, and its corresponding evaluation is generic. You can make just one micro and one macro point and get the top level (L4) as here. A less risky approach might be to add another point if you are at all unsure about your reasoning. Cost and revenue diagrams are a very useful way to show the effects of cost rises. However you must make the link to MC and AC if there is a change in variable costs. Section 1 A reminder to centres that it does not benefit candidates to have stock essay answers as they miss the higher marks by not using the context to guide their analysis and evaluation. It is helpful if the candidate marks the box for the essay chosen (1d or 1e) but if they do not (around 10%) then they are marked in a pool where the examiner has to decide which question has been attempted. The answer usually becomes clear very quickly when candidates put signals in their work and make it clear from the outset that they understand the question. Section 2 The majority of candidates ran short of time on the essay and the advice to candidates is to reserve 30 minutes for the final essay, and to use at least one micro and one macro point, diagrams where possible and all the data that links to the points made. Evaluation is key and we need to see developed and applied chains of reasoning within the evaluation.
Notes from the mark scheme and report
labour shortages are not unemployment
supply of labour shifts left so wages rise, then costs rise on a cost and revenue diagram (explain fixed or variable)
macro: cost-push inflation, LRAS, competitiveness
focus on effects, not causes such as Brexit
report: "A significant number misunderstood labour shortages as meaning unemployment" and "the mean was also significantly low at 14.98"
Quantitative skills: QS 9 (interpret, apply and analyse information in written, graphical tabular and numerical forms)
June 2022 · AS Paper 2 · Q5(a)1 markMultiple choice
Data and extracts for question 5
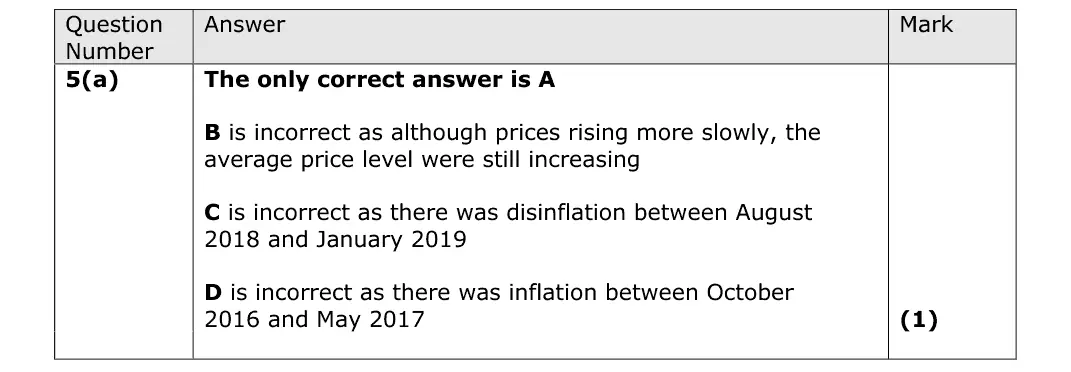
Answer
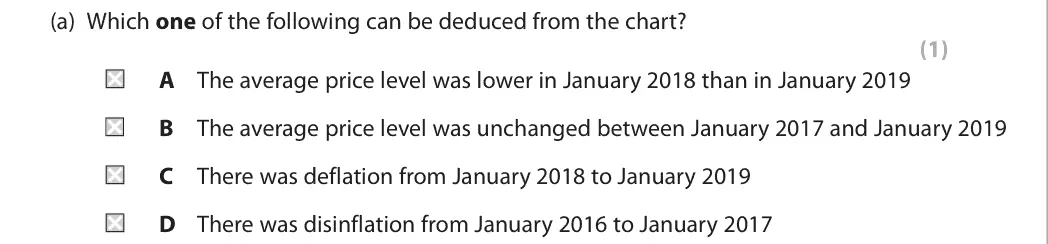
A
Mark scheme
Notes from the mark scheme and report
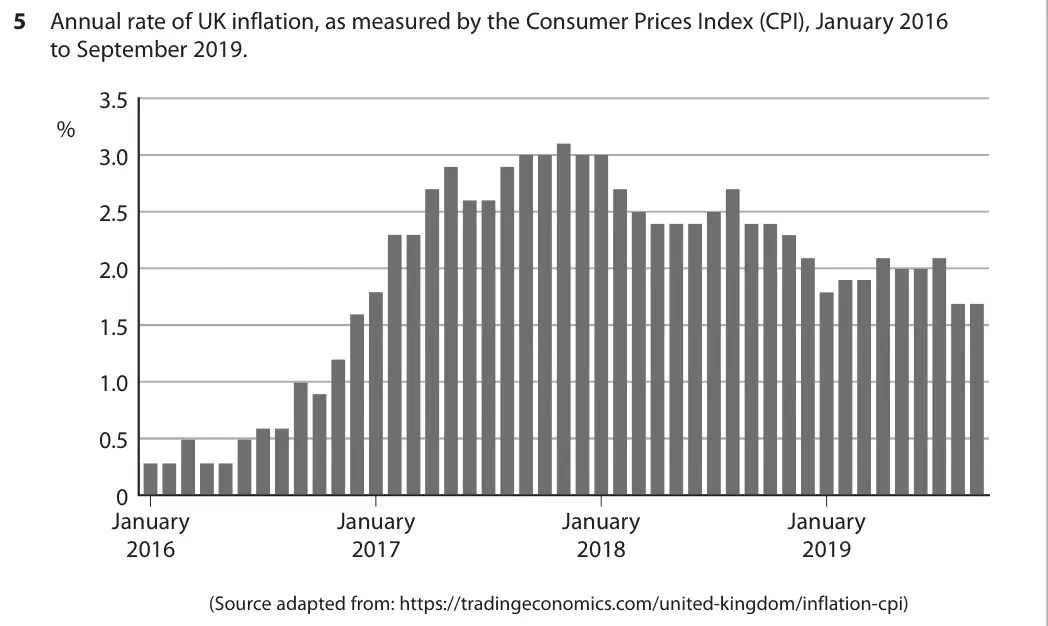
inflation stayed positive throughout, so the price level was lower in January 2018 than January 2019 (A)
positive but falling inflation is disinflation, not unchanged prices or deflation
inflation rose in 2016-17
Quantitative skills: QS 10 (distinguish between changes in the level of a variable, and the rate of change); QS 9 (interpret, apply and analyse information in written, graphical tabular and numerical forms)
June 2022 · AS Paper 2 · Q5(b)3 marksAO1=1, AO2=1, AO3=1Short answer
Data and extracts for question 5
Mark scheme
Examiner's comment
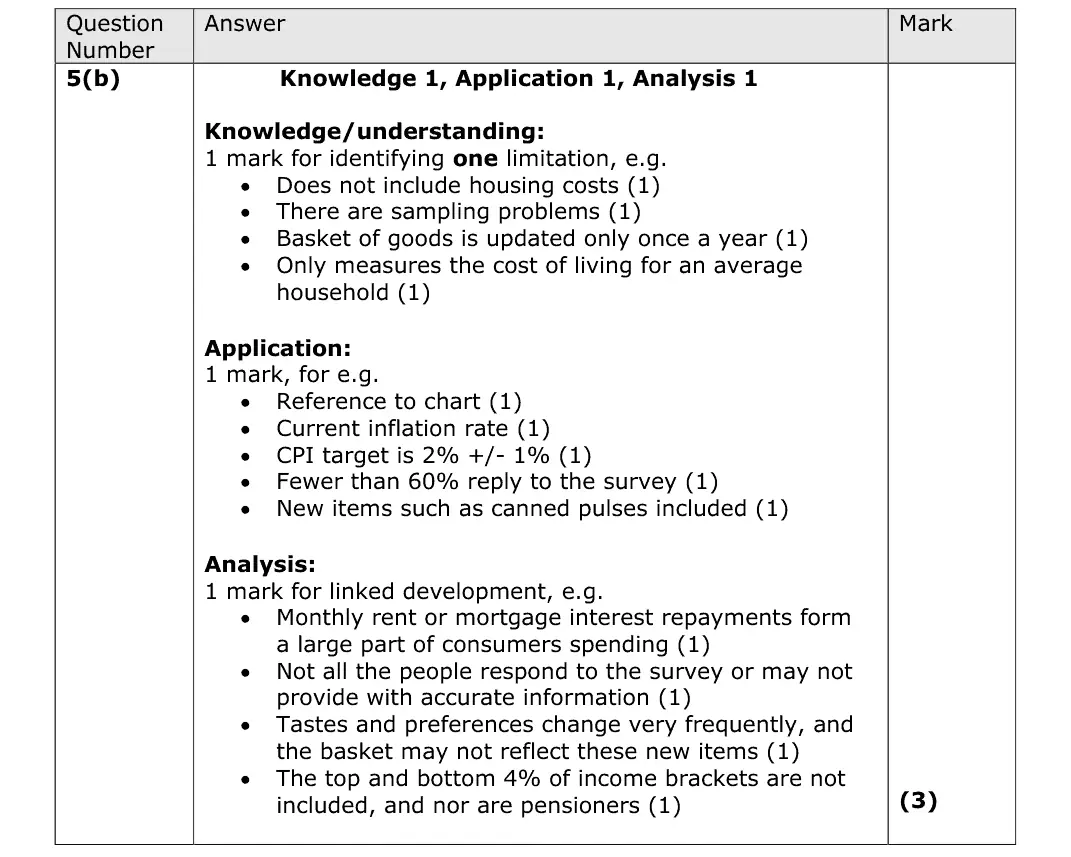
This question asked candidates to explain one limitation of CPI in measuring the rate of inflation. Many candidates found this question a little challenging to answer. However, some candidates lost application marks because they did not use the data provided or from their own knowledge.
Notes from the mark scheme and report
one limitation (excludes housing costs, sampling/survey response, basket updated once a year, average household only) developed
application from the chart or own knowledge (e.g. 2% target)
Quantitative skills: QS 5 (calculate and interpret index numbers)
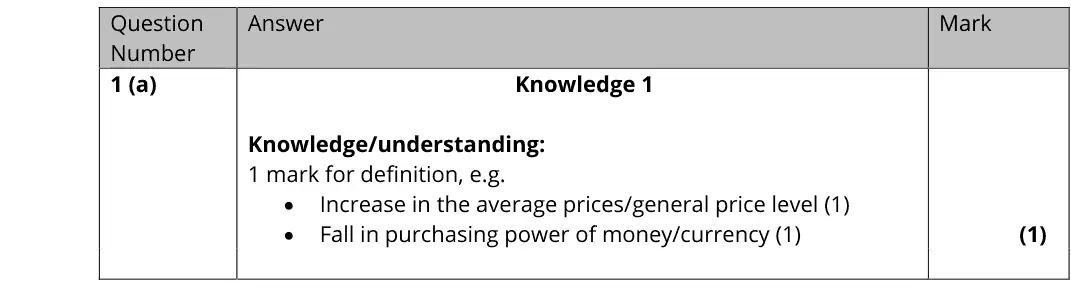
October 2020 · AS Paper 2 · Q1(a)1 markAO1=1Definition
Data and extracts for question 1
Mark scheme
Notes from the mark scheme and report
a sustained rise in the general (average) price level, or fall in the purchasing power of money
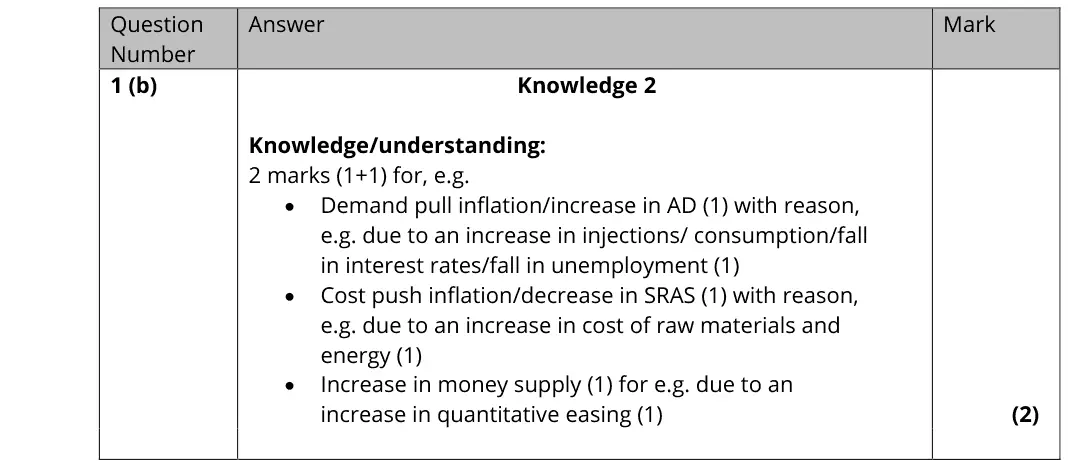
October 2020 · AS Paper 2 · Q1(b)2 marksAO1=2Short answer
Data and extracts for question 1
Mark scheme
Notes from the mark scheme and report
identify the type (demand-pull, cost-push or money supply growth) and give a reason for it, e.g. lower interest rates raising AD or higher energy costs cutting SRAS
October 2020 · AS Paper 2 · Q1(c)1 markMultiple choice
Data and extracts for question 1
Answer
D
Mark scheme
Notes from the mark scheme and report
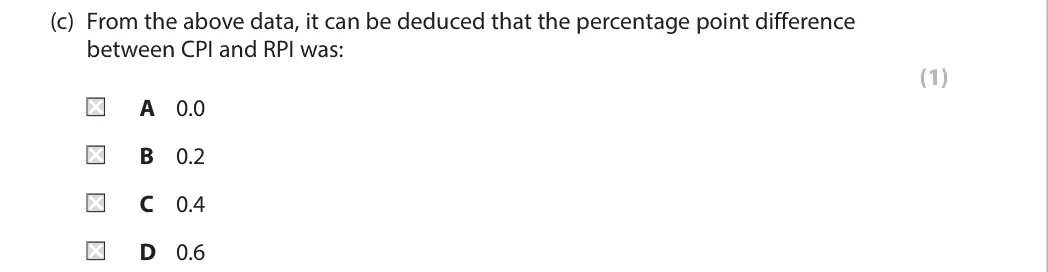
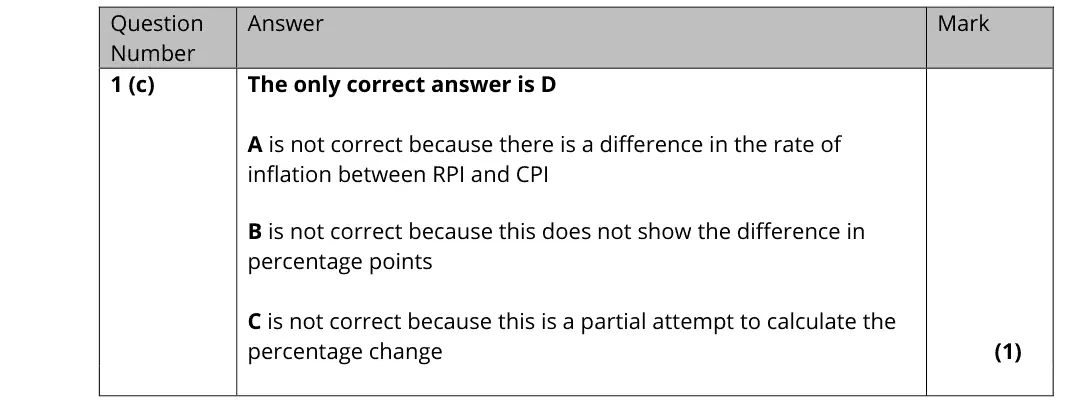
RPI 2.1% minus CPI 1.5% = 0.6 percentage points (D)
A ignores the difference
B and C are not the percentage point gap
Quantitative skills: QS 10 (distinguish between changes in the level of a variable, and the rate of change); QS 2 (calculate, use and understand percentages, percentage changes and percentage point changes)
June 2019 · Paper 2 · Q1(b)2 marksAO2=2Calculation
Data and extracts for question 1
Mark scheme
Examiner's comment
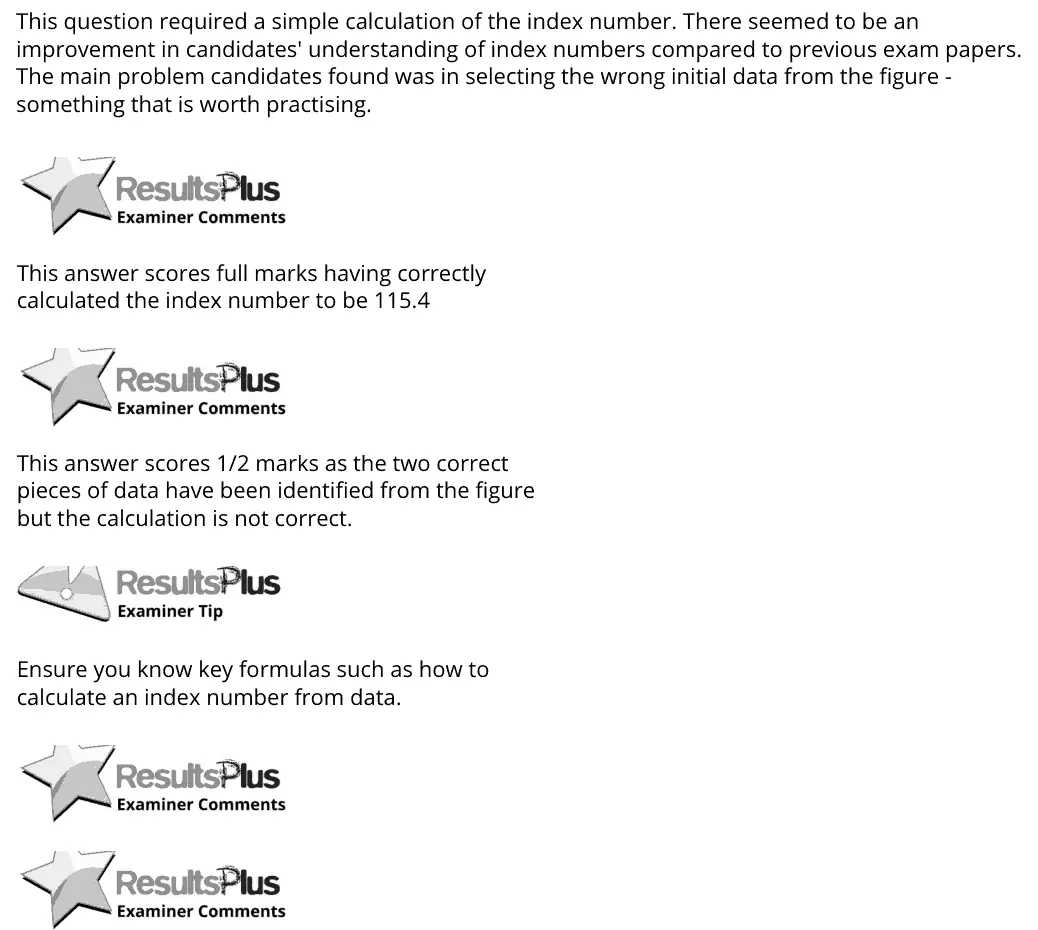
This question required a simple calculation of the index number. There seemed to be an improvement in candidates' understanding of index numbers compared to previous exam papers. The main problem candidates found was in selecting the wrong initial data from the figure - something that is worth practising. This answer scores full marks having correctly calculated the index number to be 115.4 This answer scores 1/2 marks as the two correct pieces of data have been identified from the figure but the calculation is not correct. Ensure you know key formulas such as how to calculate an index number from data.
Notes from the mark scheme and report
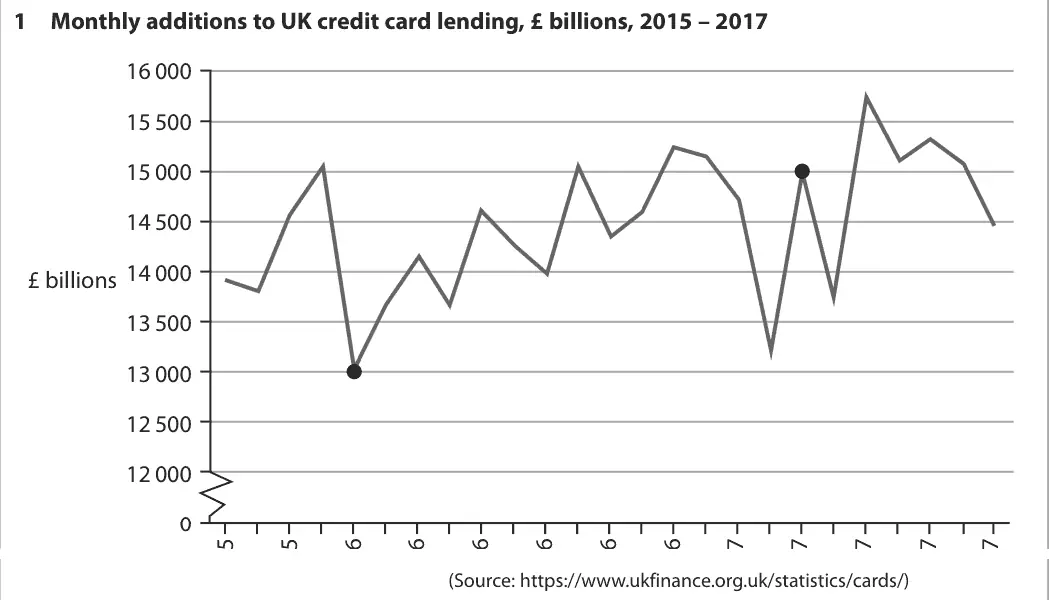
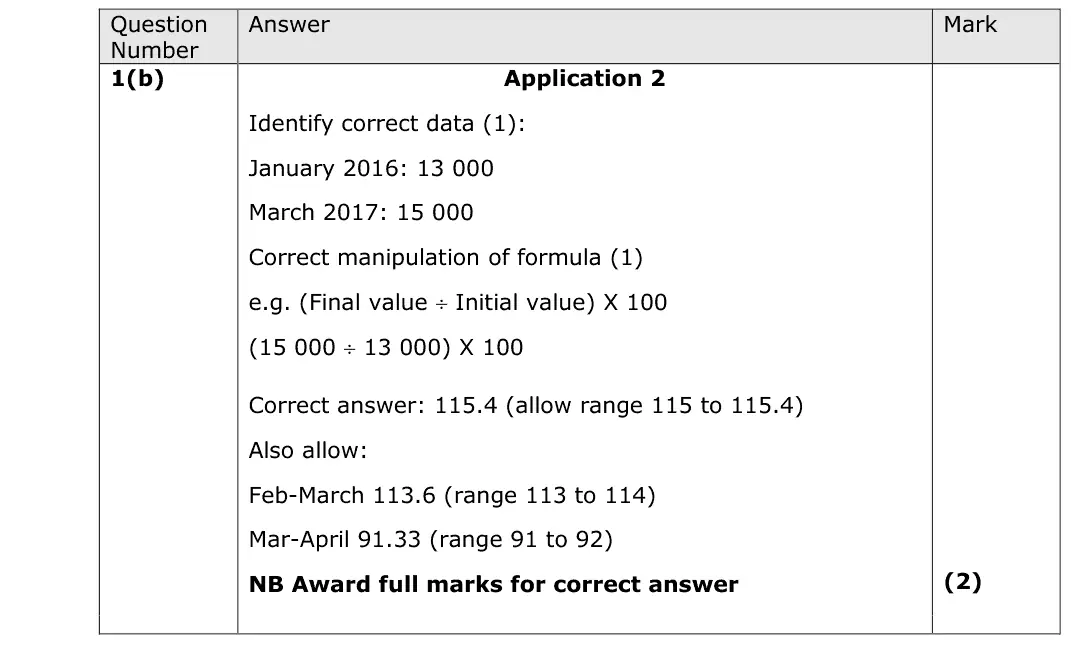
index = (March 2017 / January 2016) x 100 = (15 000 / 13 000) x 100 = 115.4
the common error was reading the wrong data from the chart
Quantitative skills: QS 5 (calculate and interpret index numbers); QS 9 (interpret, apply and analyse information in written, graphical tabular and numerical forms)
June 2019 · Paper 2 · Q1(c)2 marksAO1=1, AO2=1Short answer
Data and extracts for question 1
Mark scheme
Examiner's comment
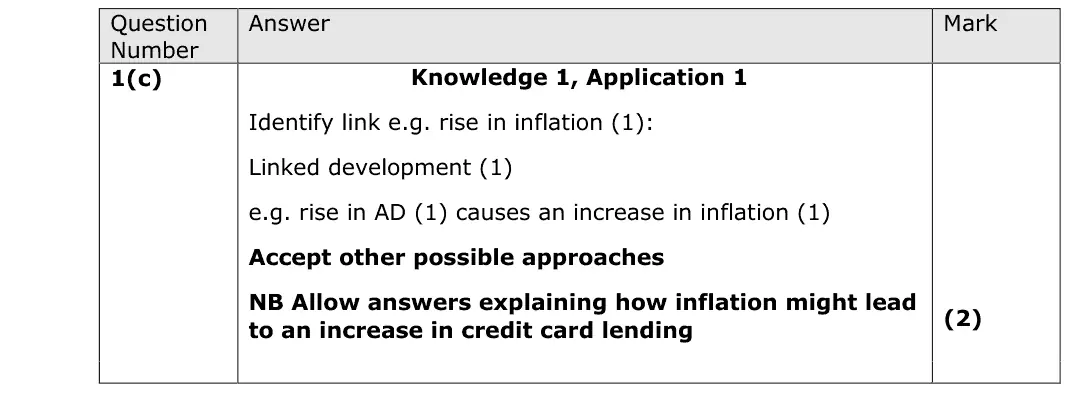
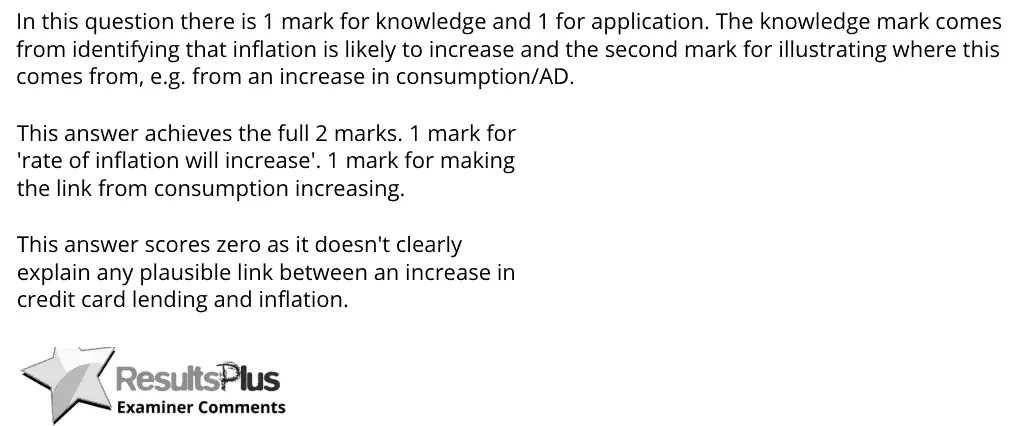
In this question there is 1 mark for knowledge and 1 for application. The knowledge mark comes from identifying that inflation is likely to increase and the second mark for illustrating where this comes from, e.g. from an increase in consumption/AD. This answer achieves the full 2 marks. 1 mark for 'rate of inflation will increase'. 1 mark for making the link from consumption increasing. This answer scores zero as it doesn't clearly explain any plausible link between an increase in credit card lending and inflation.
Notes from the mark scheme and report
more credit card lending raises consumption and AD, causing demand-pull inflation
reverse link (inflation causing more borrowing) also accepted
June 2019 · AS Paper 2 · Q4(a)1 markAO1=1DefinitionHard
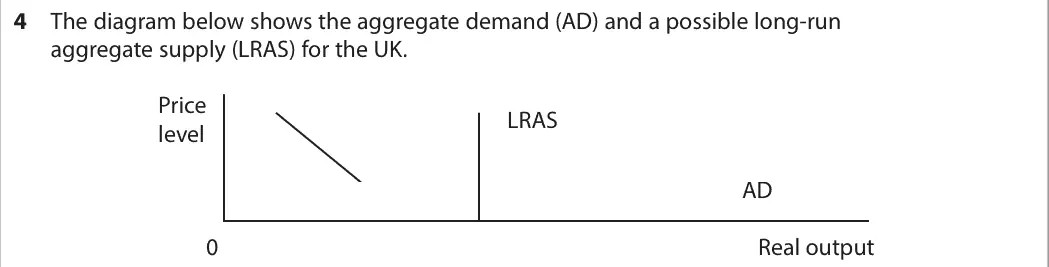
Data and extracts for question 4
Mark scheme
Examiner's comment
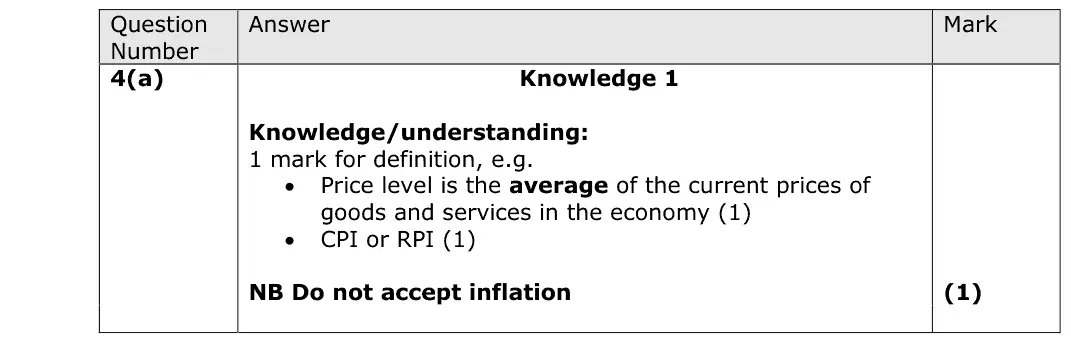
This question requires a clear definition of price level. Many were not able to provide an accurate definition and hence did not get the mark for this question.
Notes from the mark scheme and report
the average level of prices of goods and services in the economy (measured by CPI or RPI)
"inflation" is not accepted
report: "Many were not able to provide an accurate definition"
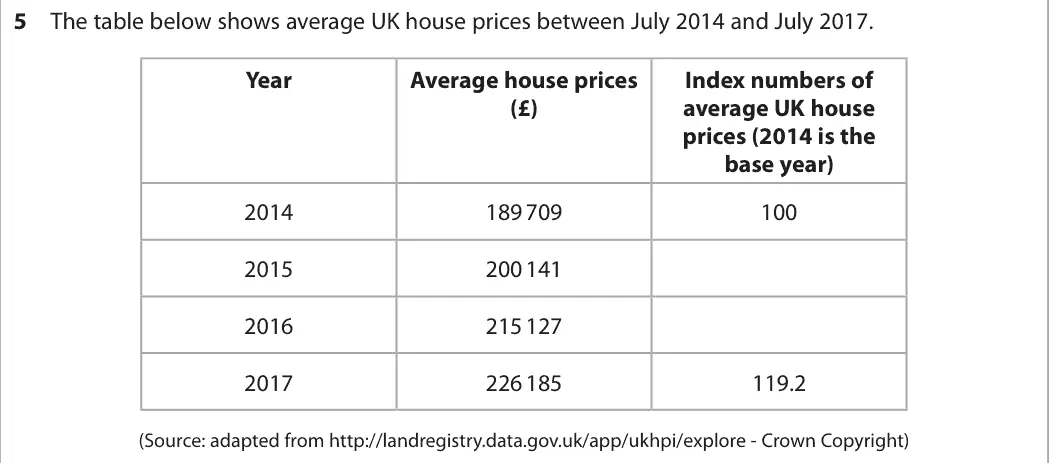
June 2019 · AS Paper 2 · Q5(b)2 marksAO2=2Calculation
Data and extracts for question 5
Mark scheme
Examiner's comment
This question asked candidates to calculate index numbers for 2015 and 2016. Many candidates were able to answer this question relatively easily. However, some candidates lost marks because they selected the wrong two pieces of data.
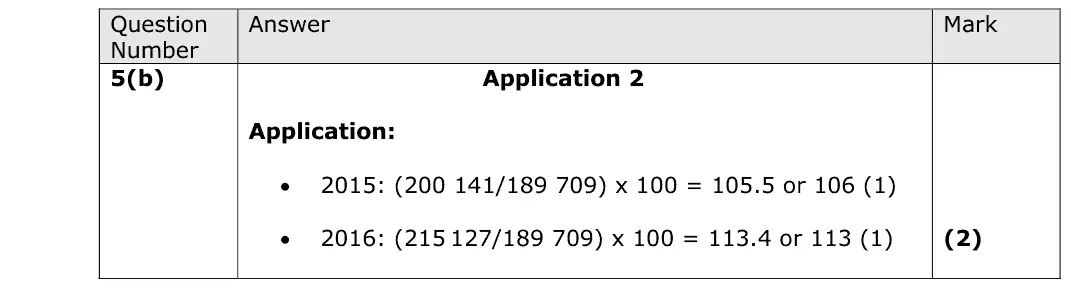
Notes from the mark scheme and report
2015: 200 141 / 189 709 x 100 = 105.5
2016: 215 127 / 189 709 x 100 = 113.4
report: some used the wrong pieces of data
Quantitative skills: QS 5 (calculate and interpret index numbers)
June 2019 · AS Paper 2 · Q5(c)1 markAO1=1Definition
Data and extracts for question 5
Mark scheme
Examiner's comment
This question requires a definition of an index number. Few candidates were not able to provide an accurate definition, as they confused index number with the base year, and hence did not get the mark for this question.
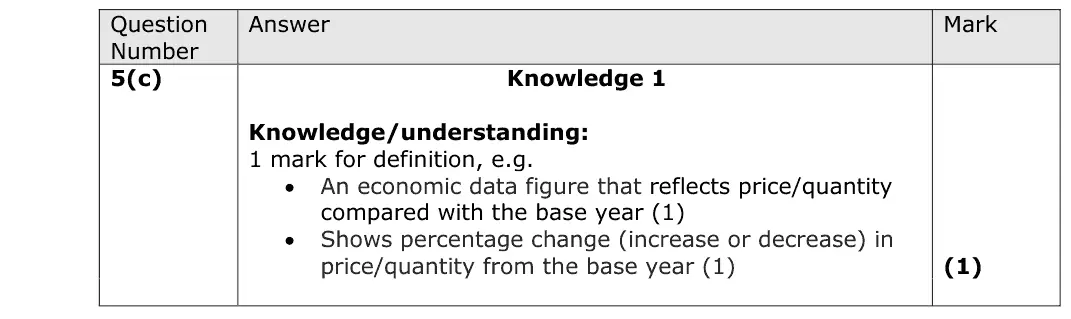
Notes from the mark scheme and report
a figure showing the value of a variable relative to a base year set at 100, so it shows the percentage change from the base
do not confuse with the base year itself
Quantitative skills: QS 5 (calculate and interpret index numbers)
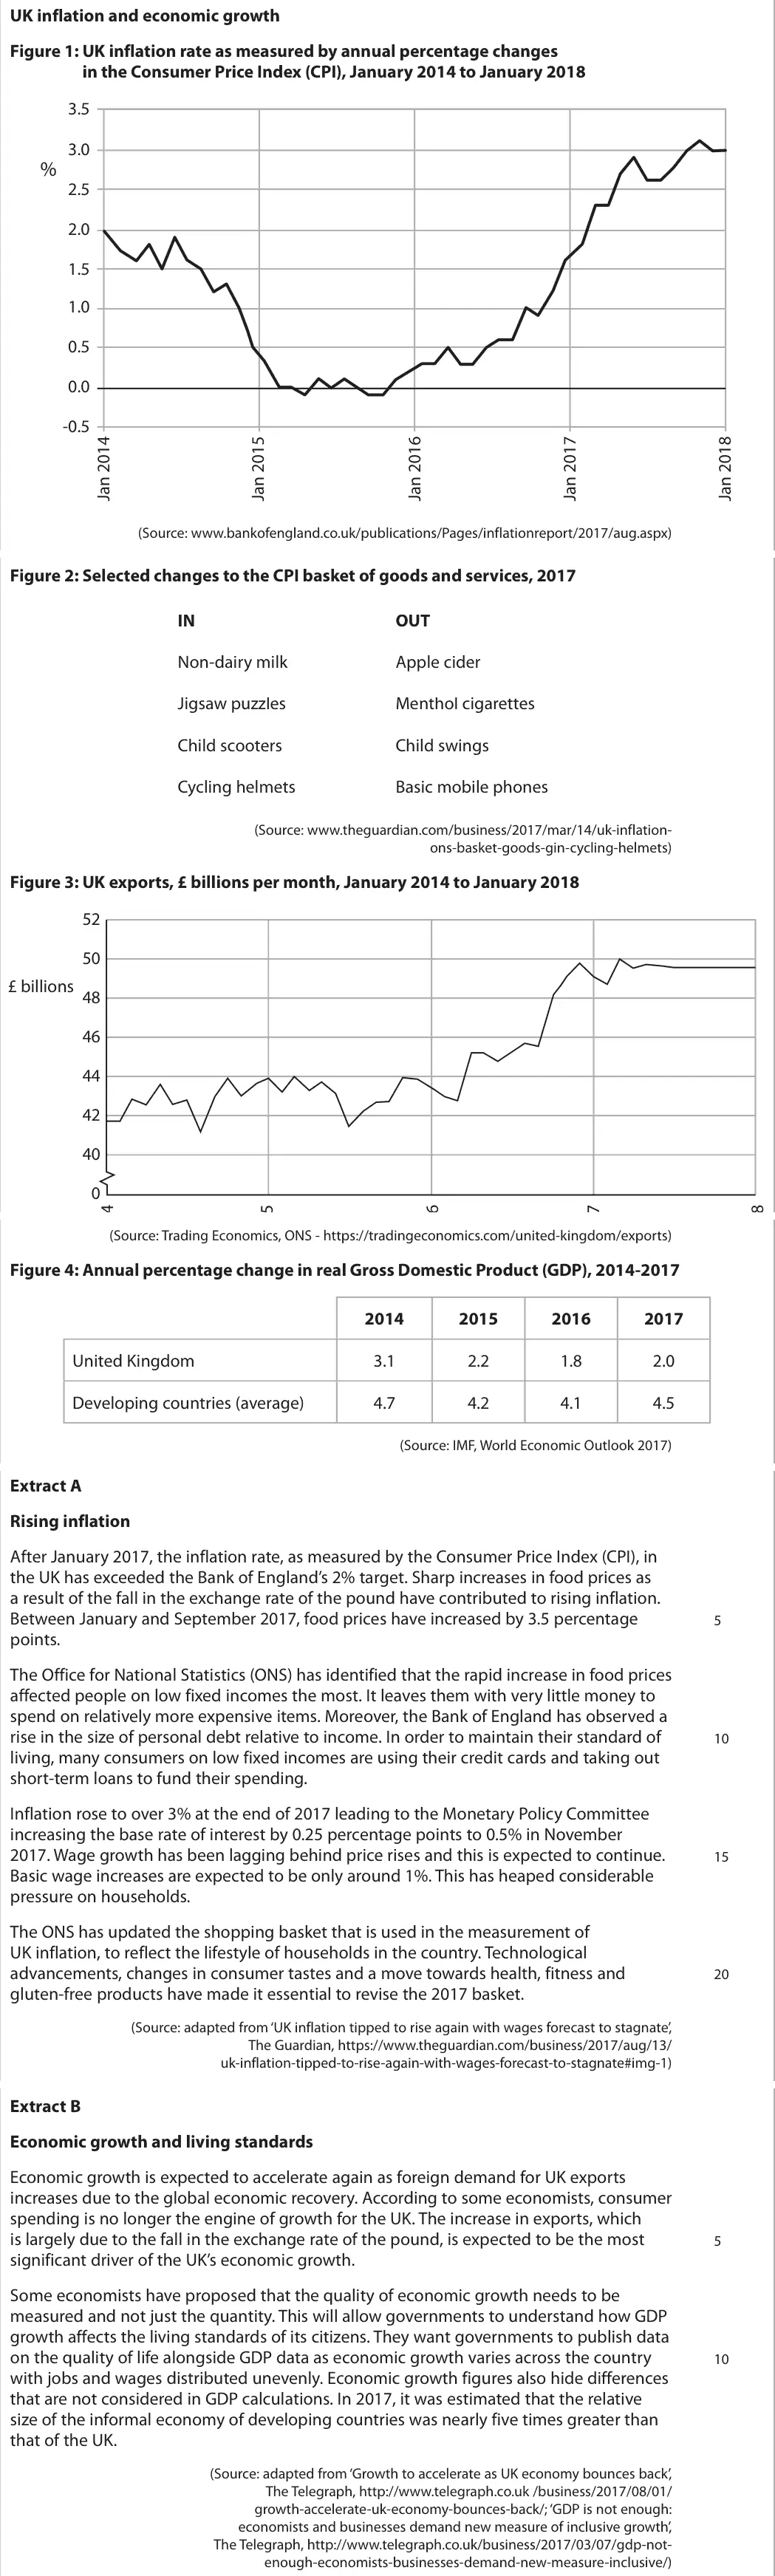
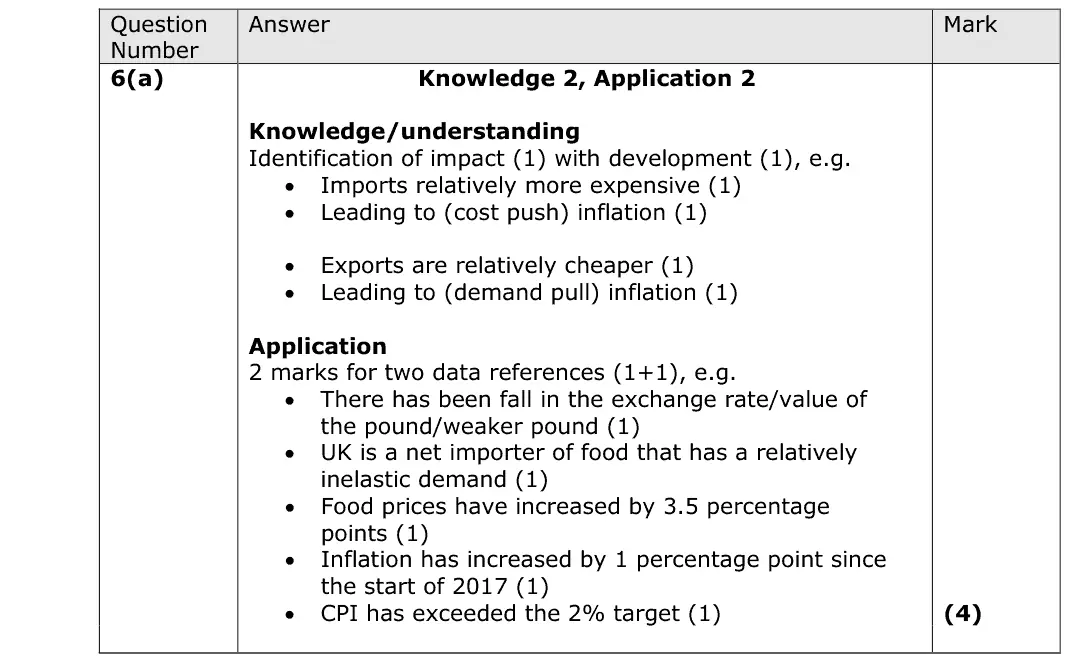
June 2019 · AS Paper 2 · Q6(a)4 marksAO1=2, AO2=2Short answer
Data and extracts for question 6
Mark scheme
Examiner's comment
The marks for this question are split in half between knowledge and application. Candidates achieved 2 marks for an explanation of how the change in the exchange rate of the pound has ‘contributed to rising inflation’ and 2 marks for relevant application from Figure 1 or Extract A.
Notes from the mark scheme and report
a fall in the pound makes imports dearer (cost-push) and exports cheaper (demand-pull)
two data references, e.g. CPI above the 2% target after Jan 2017, food prices up 3.5 percentage points
Quantitative skills: QS 9 (interpret, apply and analyse information in written, graphical tabular and numerical forms)
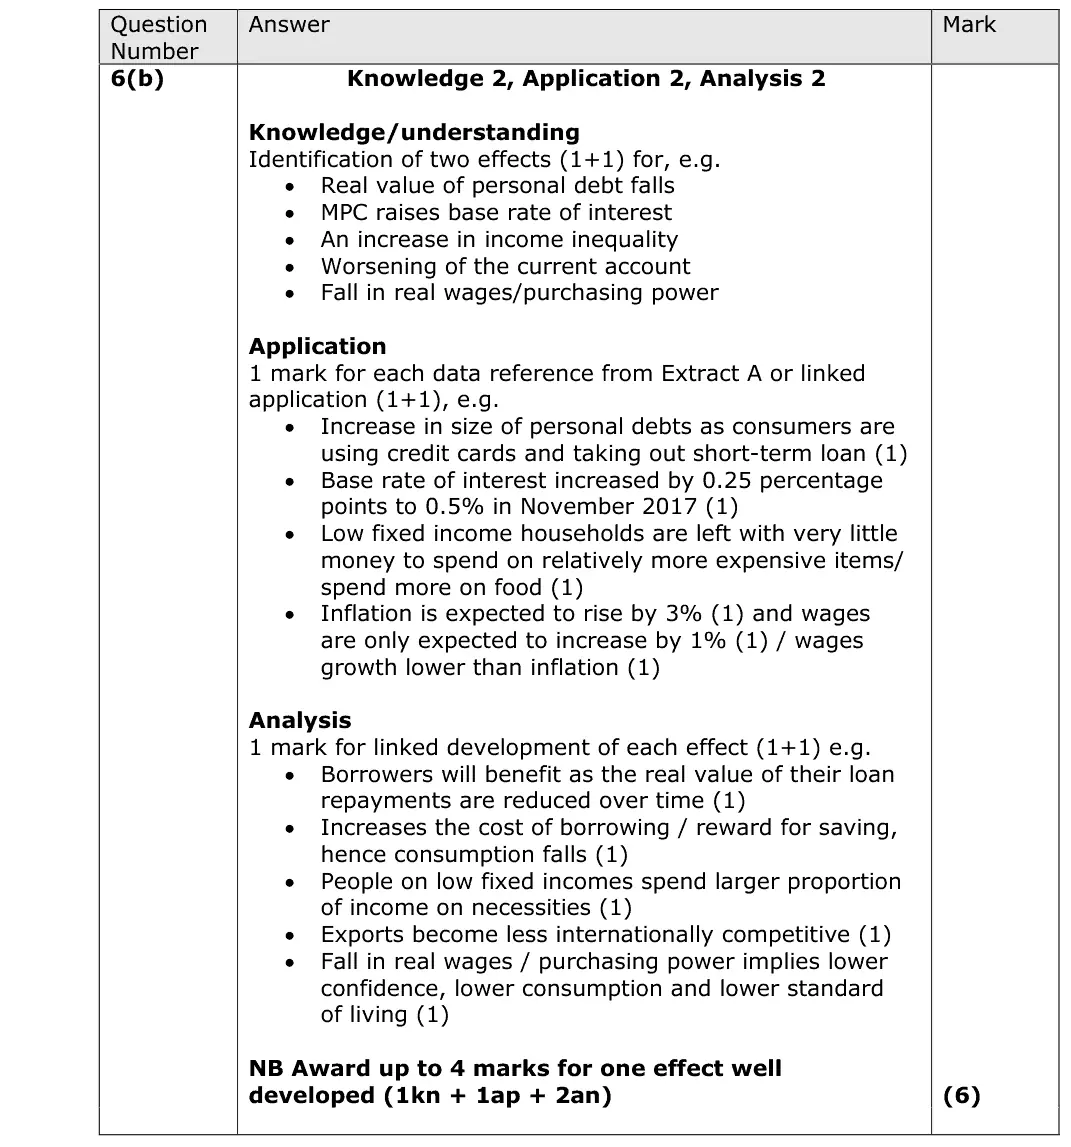
June 2019 · AS Paper 2 · Q6(b)6 marksAO1=2, AO2=2, AO3=2Short answer
Data and extracts for question 6
Mark scheme
Examiner's comment
This question asks candidates to explain two likely economic effects of the higher rate of UK inflation. It is important that candidates focus specifically on their effects and answer the question in terms of inflation. Too much time was wasted on explaining the causes of inflation, which was not the requirement of the question. Each reason needed to be identified and analysed. There are marks for application, which most candidates attained through the use of data from Extract A.
Notes from the mark scheme and report
two EFFECTS of inflation (falling real wages, lower real value of debt, Bank Rate rise to 0.5%, hits low fixed incomes, worse current account) each with data and development
report: much time wasted on causes of inflation
Quantitative skills: QS 9 (interpret, apply and analyse information in written, graphical tabular and numerical forms)
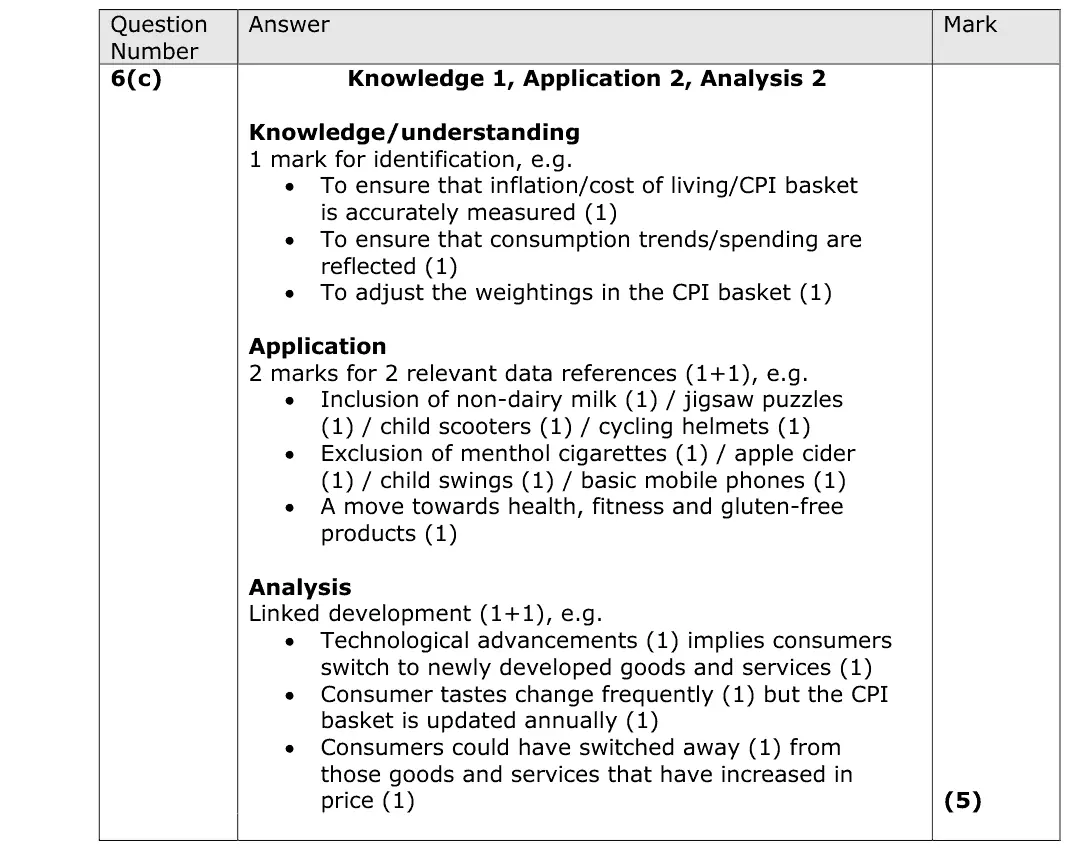
June 2019 · AS Paper 2 · Q6(c)5 marksAO1=1, AO2=2, AO3=2Short answer
Data and extracts for question 6
Mark scheme
Examiner's comment
This question asked candidates to explain one reason why it is necessary to regularly update the CPI basket of goods and services. Therefore, it is important for candidates to make the most of their time in the exam and not explain two factors. Several possibilities could be explained here. Popular application included the use of Figure 2 to explain answers. Candidates should remember that in these shorter questions examiners are looking for specific pieces of application.
Notes from the mark scheme and report
the basket must reflect current spending patterns and weights so CPI measures the cost of living accurately
quote Figure 2 items in and out (non-dairy milk in, basic mobile phones out)
explain only one reason
Quantitative skills: QS 9 (interpret, apply and analyse information in written, graphical tabular and numerical forms)
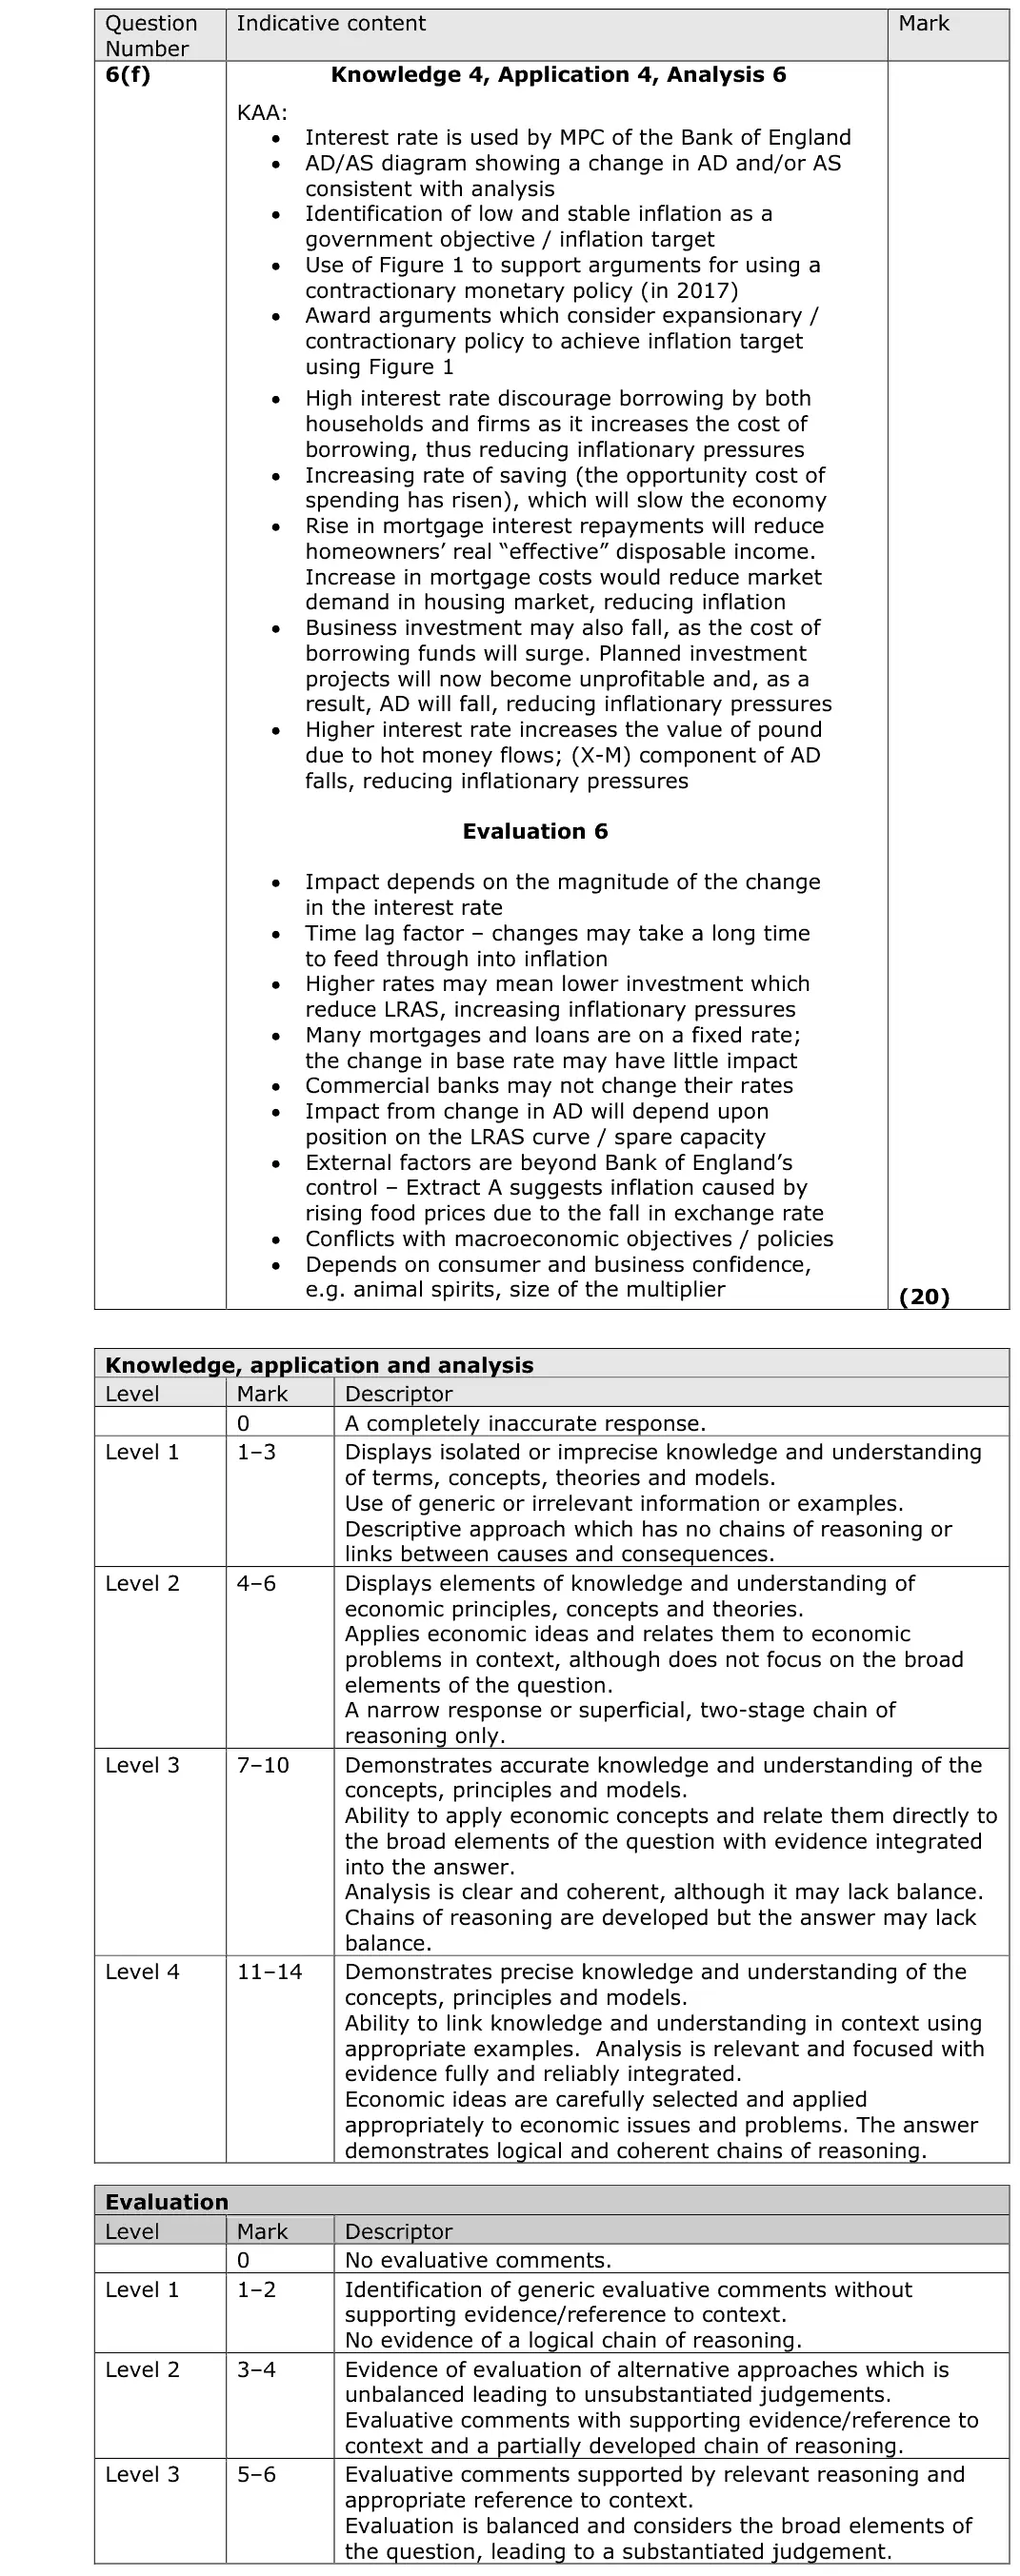
June 2019 · AS Paper 2 · Q6(f)20 marksAO1=4, AO2=4, AO3=6, AO4=620-mark essayEither/or
Data and extracts for question 6
Mark scheme, including the levels grid and indicative content
Examiner's comment
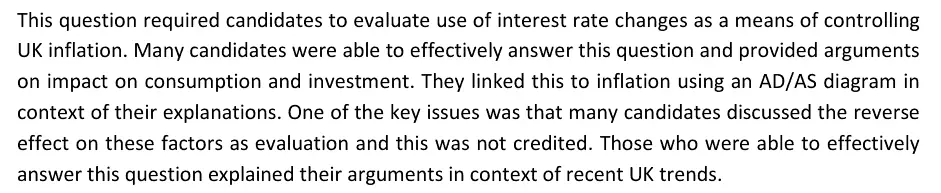
This question required candidates to evaluate use of interest rate changes as a means of controlling UK inflation. Many candidates were able to effectively answer this question and provided arguments on impact on consumption and investment. They linked this to inflation using an AD/AS diagram in context of their explanations. One of the key issues was that many candidates discussed the reverse effect on these factors as evaluation and this was not credited. Those who were able to effectively answer this question explained their arguments in context of recent UK trends.
Notes from the mark scheme and report
Bank Rate changes work through borrowing, saving, mortgages, investment and the exchange rate to shift AD
use Figure 1 (CPI above 3%, Bank Rate raised to 0.5%)
evaluate time lags, cost-push imported inflation, low rates already, confidence
report: the reverse effect was not credited as evaluation
Quantitative skills: QS 9 (interpret, apply and analyse information in written, graphical tabular and numerical forms)
June 2019 · Paper 3 · Q2(e)25 marksAO1=4, AO2=4, AO3=8, AO4=925-mark essayEither/orHard
Data and extracts for question 2
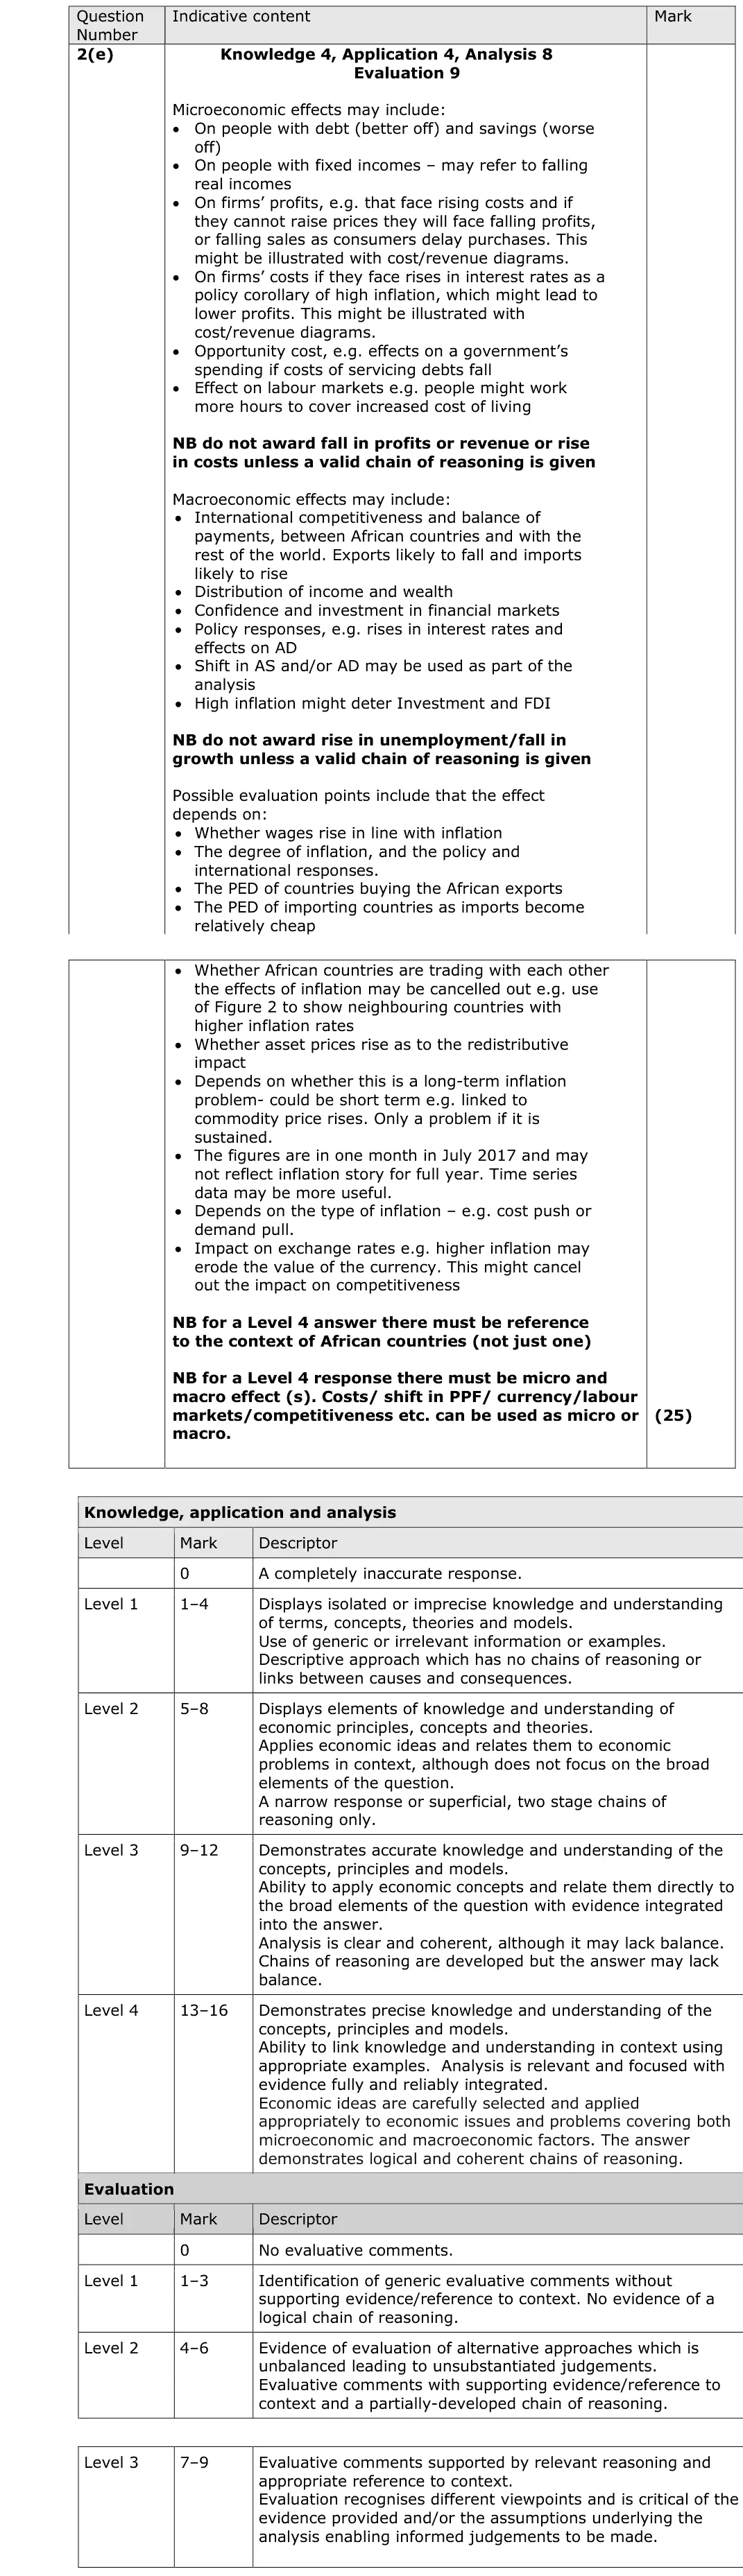
Mark scheme, including the levels grid and indicative content
Examiner's comment
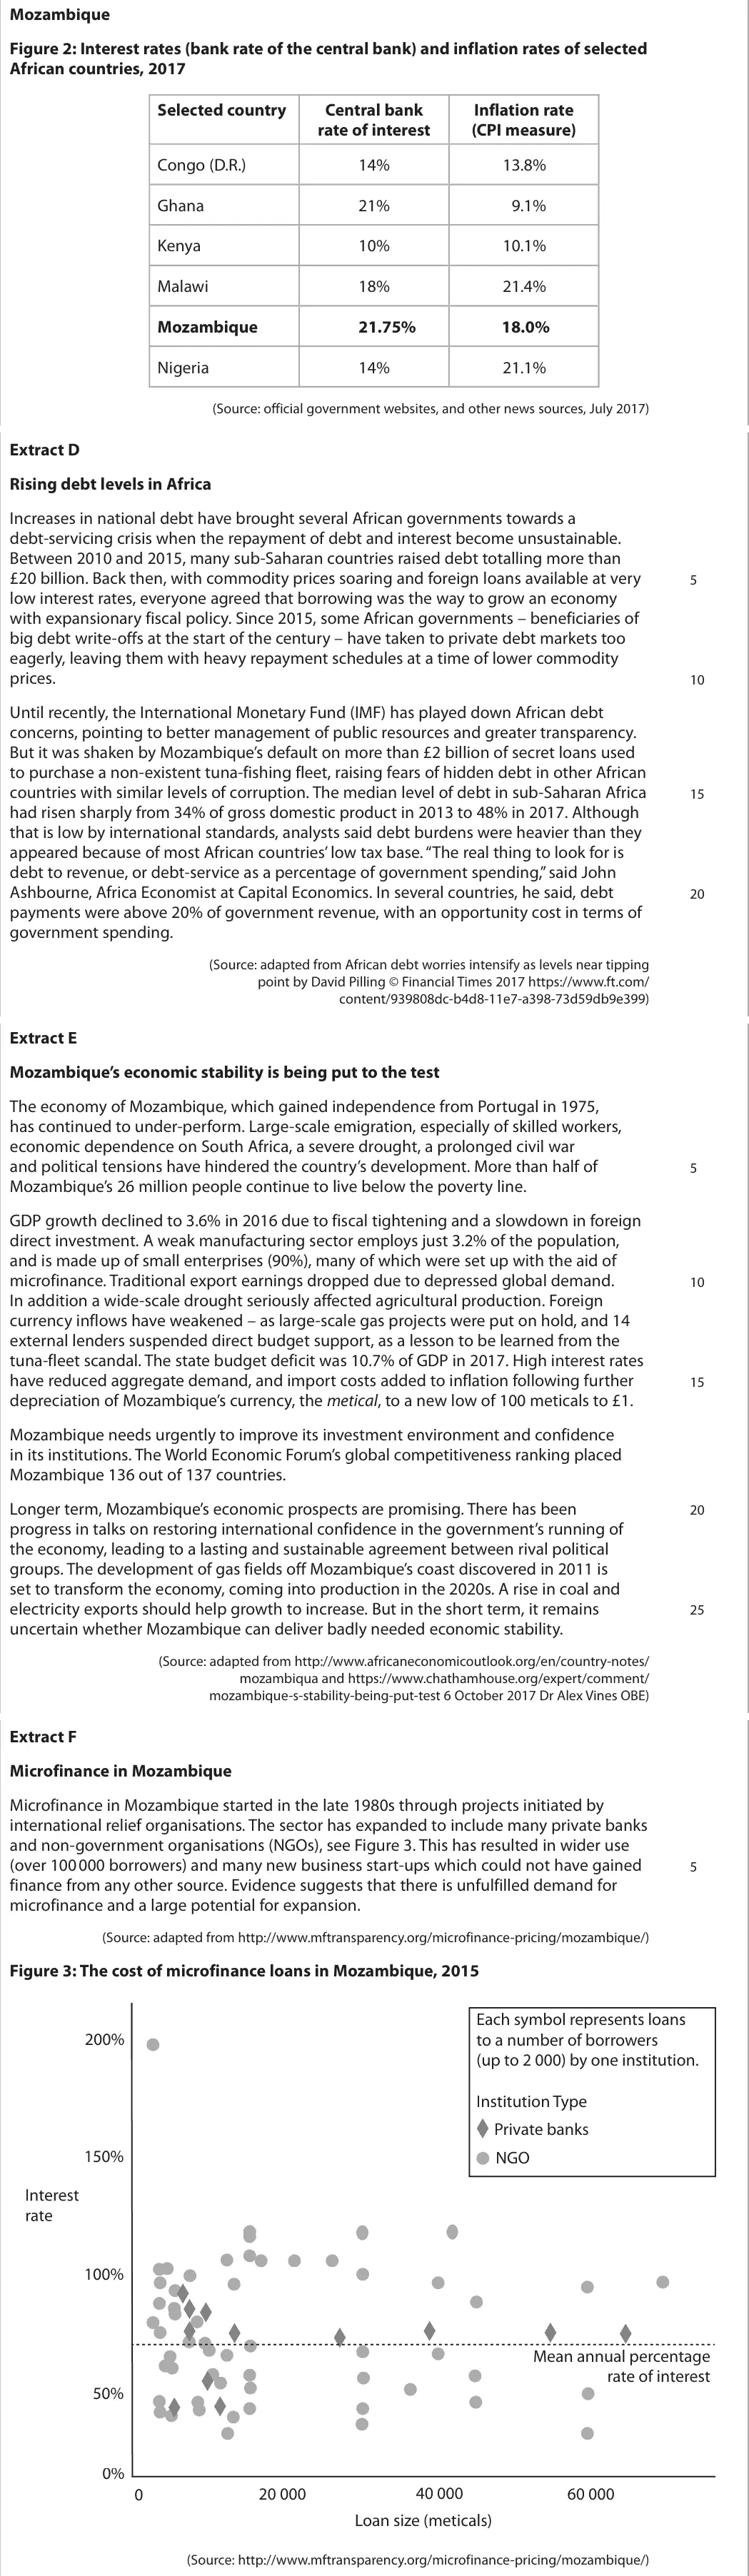
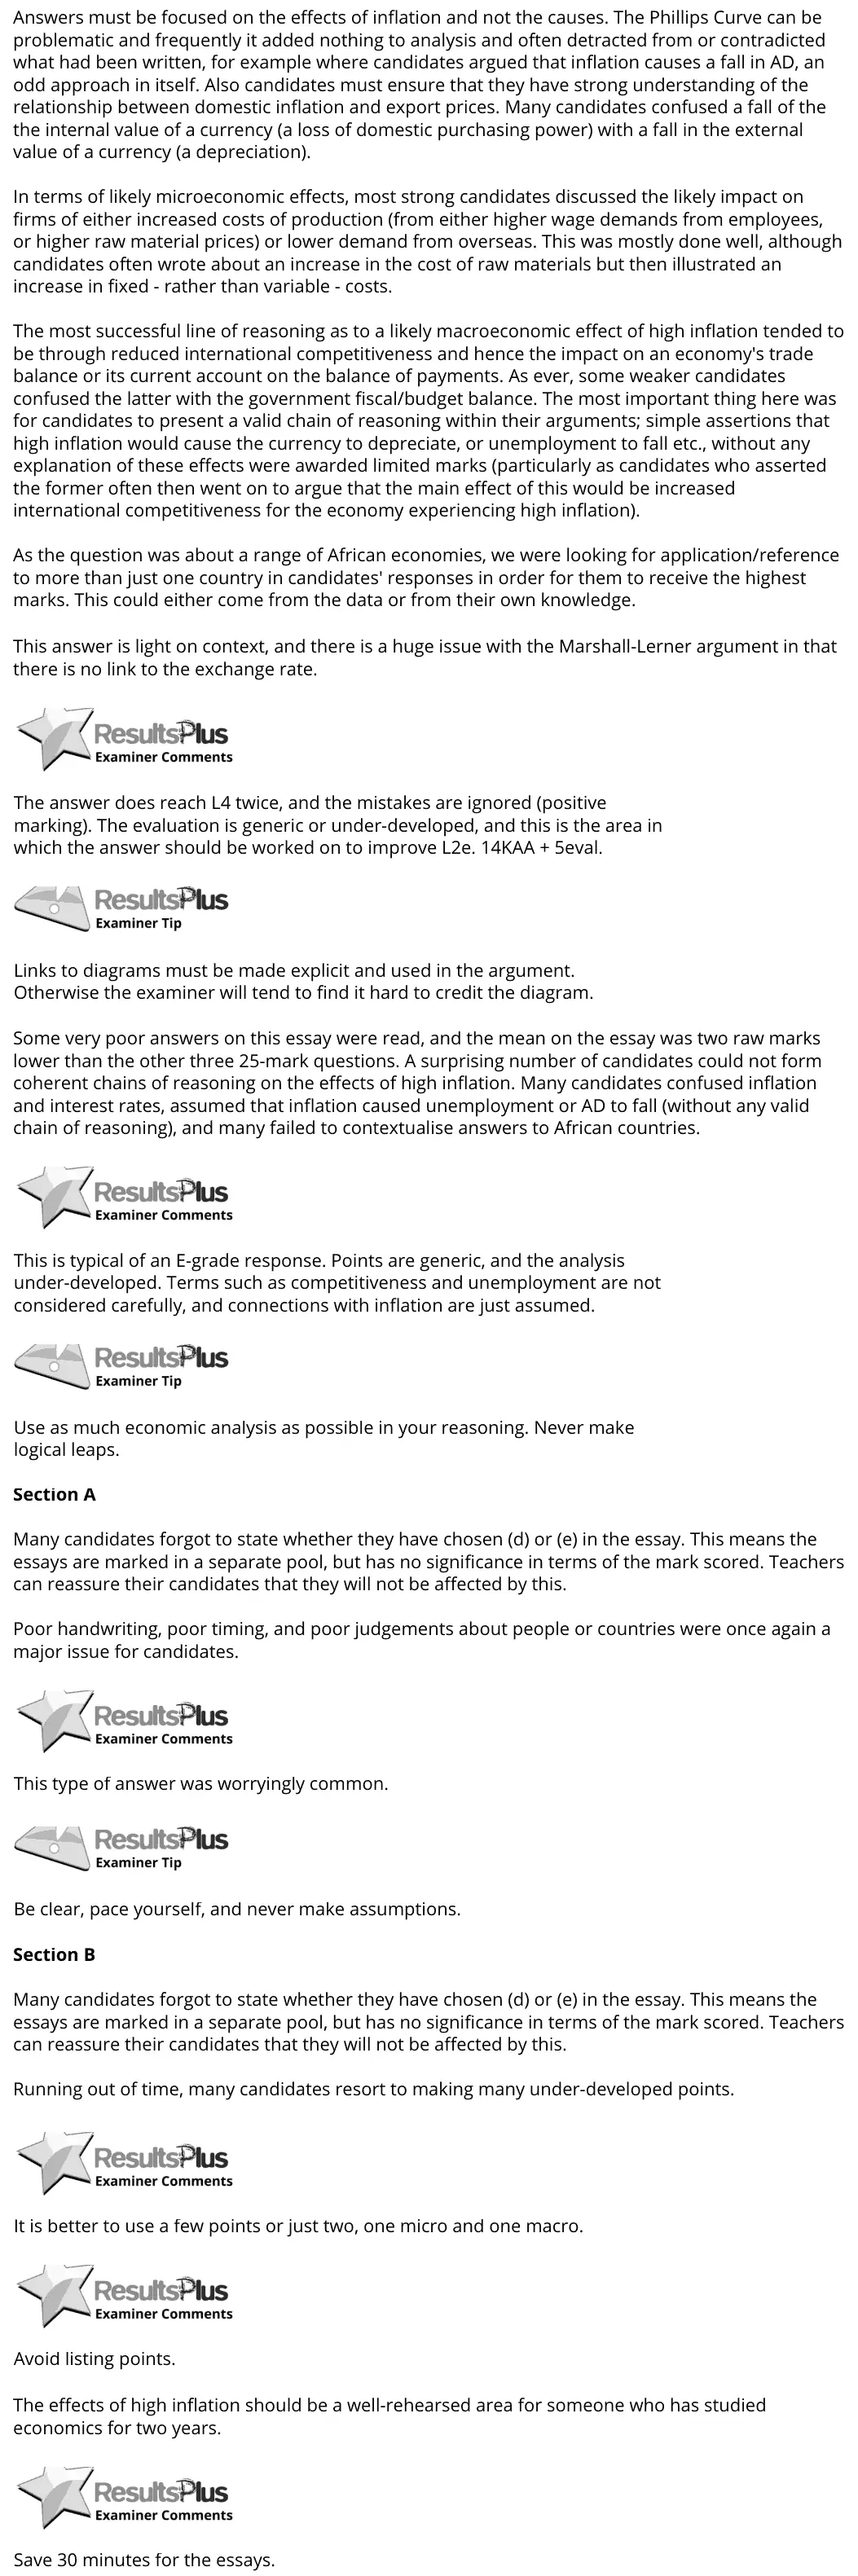
Answers must be focused on the effects of inflation and not the causes. The Phillips Curve can be problematic and frequently it added nothing to analysis and often detracted from or contradicted what had been written, for example where candidates argued that inflation causes a fall in AD, an odd approach in itself. Also candidates must ensure that they have strong understanding of the relationship between domestic inflation and export prices. Many candidates confused a fall of the the internal value of a currency (a loss of domestic purchasing power) with a fall in the external value of a currency (a depreciation). In terms of likely microeconomic effects, most strong candidates discussed the likely impact on firms of either increased costs of production (from either higher wage demands from employees, or higher raw material prices) or lower demand from overseas. This was mostly done well, although candidates often wrote about an increase in the cost of raw materials but then illustrated an increase in fixed - rather than variable - costs. The most successful line of reasoning as to a likely macroeconomic effect of high inflation tended to be through reduced international competitiveness and hence the impact on an economy's trade balance or its current account on the balance of payments. As ever, some weaker candidates confused the latter with the government fiscal/budget balance. The most important thing here was for candidates to present a valid chain of reasoning within their arguments; simple assertions that high inflation would cause the currency to depreciate, or unemployment to fall etc., without any explanation of these effects were awarded limited marks (particularly as candidates who asserted the former often then went on to argue that the main effect of this would be increased international competitiveness for the economy experiencing high inflation). As the question was about a range of African economies, we were looking for application/reference to more than just one country in candidates' responses in order for them to receive the highest marks. This could either come from the data or from their own knowledge. This answer is light on context, and there is a huge issue with the Marshall-Lerner argument in that there is no link to the exchange rate. The answer does reach L4 twice, and the mistakes are ignored (positive marking). The evaluation is generic or under-developed, and this is the area in which the answer should be worked on to improve L2e. 14KAA + 5eval. Links to diagrams must be made explicit and used in the argument. Otherwise the examiner will tend to find it hard to credit the diagram. Some very poor answers on this essay were read, and the mean on the essay was two raw marks lower than the other three 25-mark questions. A surprising number of candidates could not form coherent chains of reasoning on the effects of high inflation. Many candidates confused inflation and interest rates, assumed that inflation caused unemployment or AD to fall (without any valid chain of reasoning), and many failed to contextualise answers to African countries. This is typical of an E-grade response. Points are generic, and the analysis under-developed. Terms such as competitiveness and unemployment are not considered carefully, and connections with inflation are just assumed. Use as much economic analysis as possible in your reasoning. Never make logical leaps. Section A Many candidates forgot to state whether they have chosen (d) or (e) in the essay. This means the essays are marked in a separate pool, but has no significance in terms of the mark scored. Teachers can reassure their candidates that they will not be affected by this. Poor handwriting, poor timing, and poor judgements about people or countries were once again a major issue for candidates. This type of answer was worryingly common. Be clear, pace yourself, and never make assumptions. Section B Many candidates forgot to state whether they have chosen (d) or (e) in the essay. This means the essays are marked in a separate pool, but has no significance in terms of the mark scored. Teachers can reassure their candidates that they will not be affected by this. Running out of time, many candidates resort to making many under-developed points. It is better to use a few points or just two, one micro and one macro. Avoid listing points. The effects of high inflation should be a well-rehearsed area for someone who has studied economics for two years. Save 30 minutes for the essays.
Notes from the mark scheme and report
effects, not causes, of inflation
fixed incomes and savers lose, firms' costs rise, competitiveness and exports fall
do not confuse falling purchasing power with depreciation
Level 4 needs context of African countries
report: "Some very poor answers on this essay were read, and the mean on the essay was two raw marks lower than the other three 25-mark questions"
Quantitative skills: QS 9 (interpret, apply and analyse information in written, graphical tabular and numerical forms)
June 2018 · AS Paper 2 · Q6(g)20 marksAO1=4, AO2=4, AO3=6, AO4=620-mark essayEither/orHard
Data and extracts for question 6
Mark scheme, including the levels grid and indicative content
Examiner's comment
This question required candidates to evaluate the likely impact of high inflation on UK government’s macroeconomic objectives. Although candidates were able to understand the impact of high inflation, they were not able to link it back to the macroeconomic objectives. Some candidates were not able to recall what these government objectives were and hence did not access higher levels. Those who were able to effectively answer this question explained the impact on current account deficit and economic growth in depth, and in context of recent UK inflation trends. This response achieves Level 3 for both KAA and Evaluation. The candidate starts off with an explanation of the impact on economic growth followed by a brief evaluation on the magnitude of inflation. They discuss the impact on fixed income groups/standard of living and evaluates their argument with consideration of time period. The final analysis point discusses the impact on the current account deficit, but there are some errors. The response ends with two well-developed evaluative comments, which take the candidates marks to Level 3. This response starts with a weak opening paragraph. The candidate then moves on to explain the impact on the current account, and this is well developed. It is supported by only one developed evaluative comment on relative inflation rates. There is no balance to the analysis and the evaluation does not consider the broad elements of the question. The answer therefore gets top of Level 2 for KAA and Evaluation. Do not contradict yourself between different points without a clear justification of the point you are making. Include logical and coherent chains of reasoning within your point rather than briefly explaining them.
Notes from the mark scheme and report
link high inflation to each objective (growth, unemployment, current account, budget, equality)
report: candidates "were not able to link it back to the macroeconomic objectives" and some could not recall them
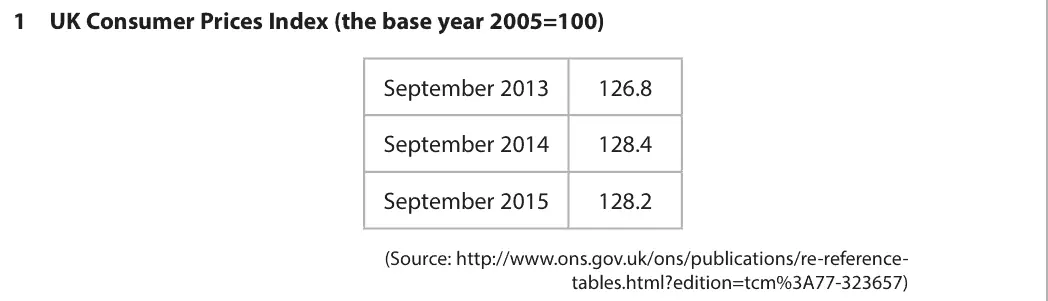
June 2017 · AS Paper 2 · Q1(a)2 marksAO2=2Calculation
Data and extracts for question 1
Mark scheme
Examiner's comment
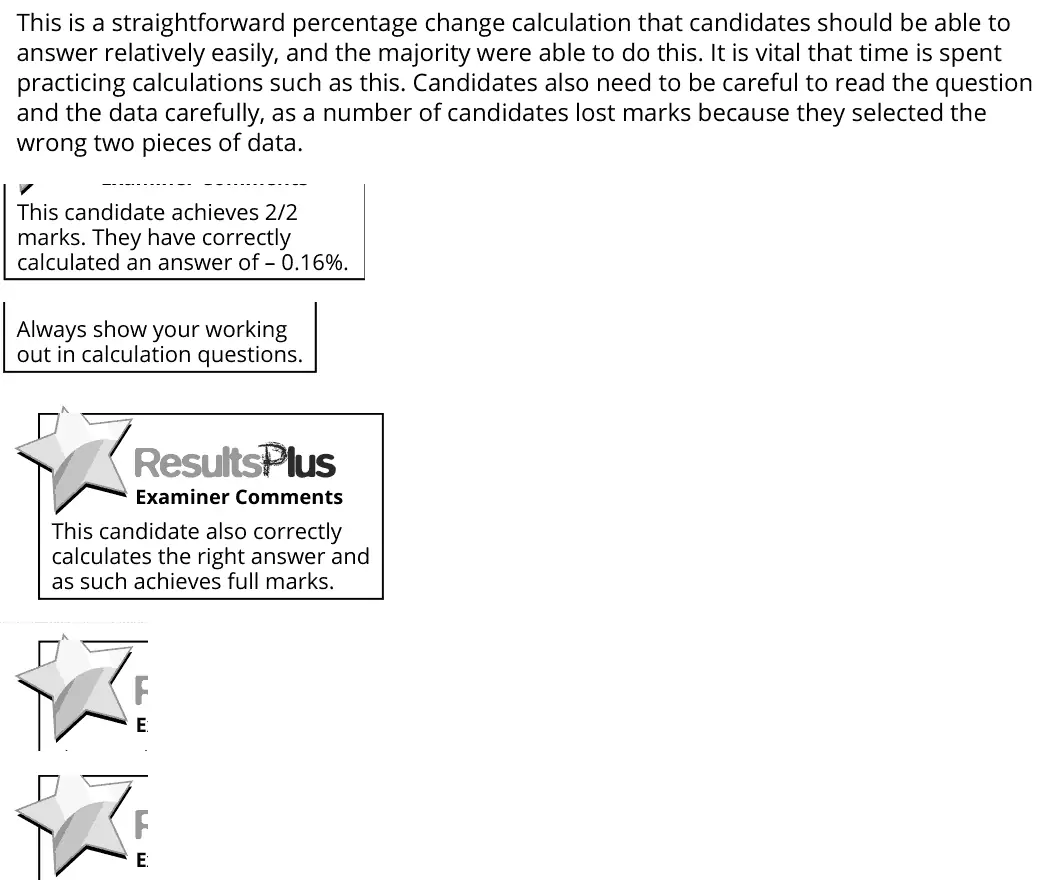
This is a straightforward percentage change calculation that candidates should be able to answer relatively easily, and the majority were able to do this. It is vital that time is spent practicing calculations such as this. Candidates also need to be careful to read the question and the data carefully, as a number of candidates lost marks because they selected the wrong two pieces of data. This candidate achieves 2/2 marks. They have correctly calculated an answer of – 0.16%. Always show your working out in calculation questions. This candidate also correctly calculates the right answer and as such achieves full marks.
Notes from the mark scheme and report
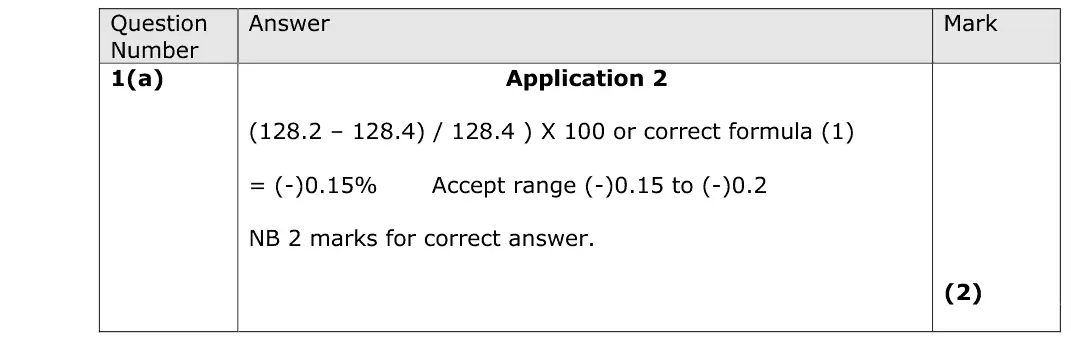
(128.2 - 128.4) / 128.4 x 100 = -0.16% (accept -0.15 to -0.2)
use the September 2014 and 2015 values, some picked the wrong pair
Quantitative skills: QS 2 (calculate, use and understand percentages, percentage changes and percentage point changes); QS 5 (calculate and interpret index numbers)
June 2017 · AS Paper 2 · Q1(b)1 markAO1=1Definition
Data and extracts for question 1
Mark scheme
Examiner's comment
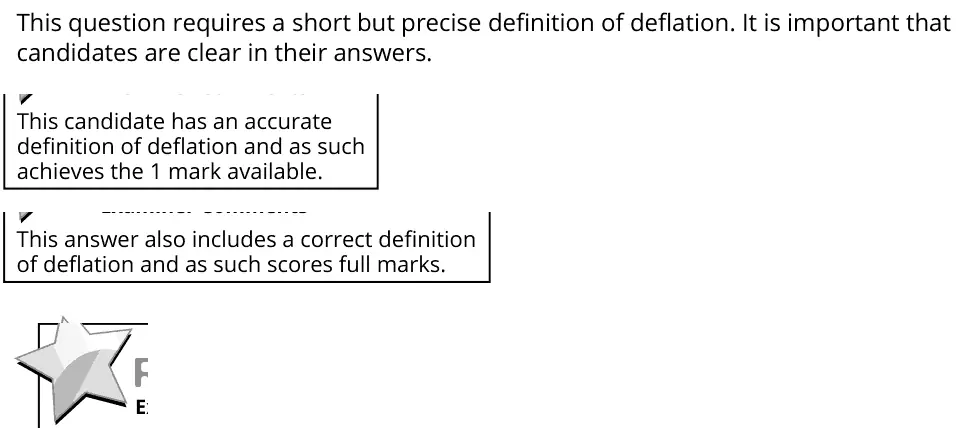
This question requires a short but precise definition of deflation. It is important that candidates are clear in their answers. This candidate has an accurate definition of deflation and as such achieves the 1 mark available. This answer also includes a correct definition of deflation and as such scores full marks.
Notes from the mark scheme and report
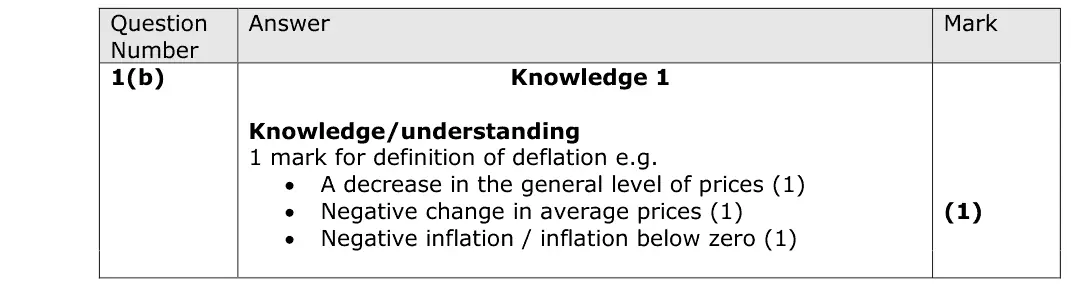
a fall in the general (average) price level, i.e. negative inflation
not a fall in the rate of inflation
June 2017 · AS Paper 2 · Q1(c)1 markMultiple choice
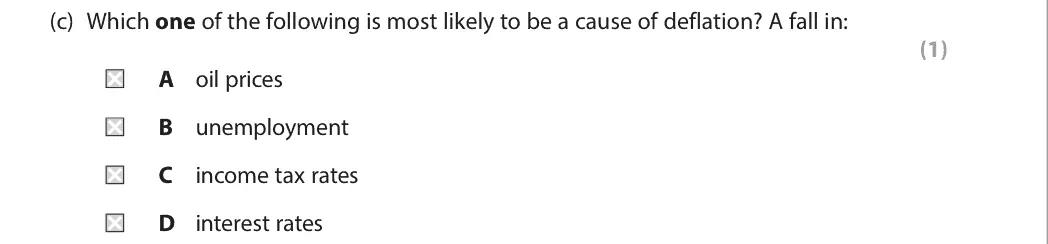
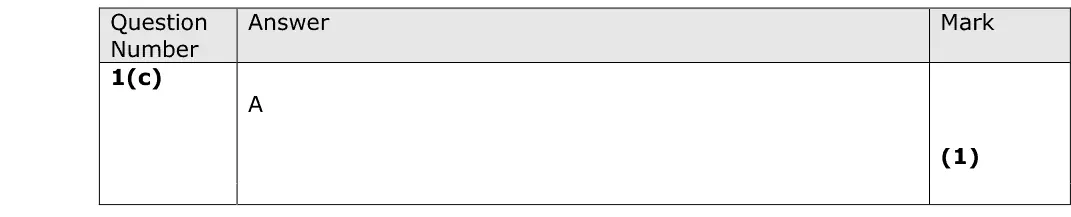
lower unemployment, income tax or interest rates all raise AD and push prices up
June 2017 · Paper 2 · Q3(a)1 markMultiple choice
Data and extracts for question 3
Answer
B
Mark scheme
Notes from the mark scheme and report
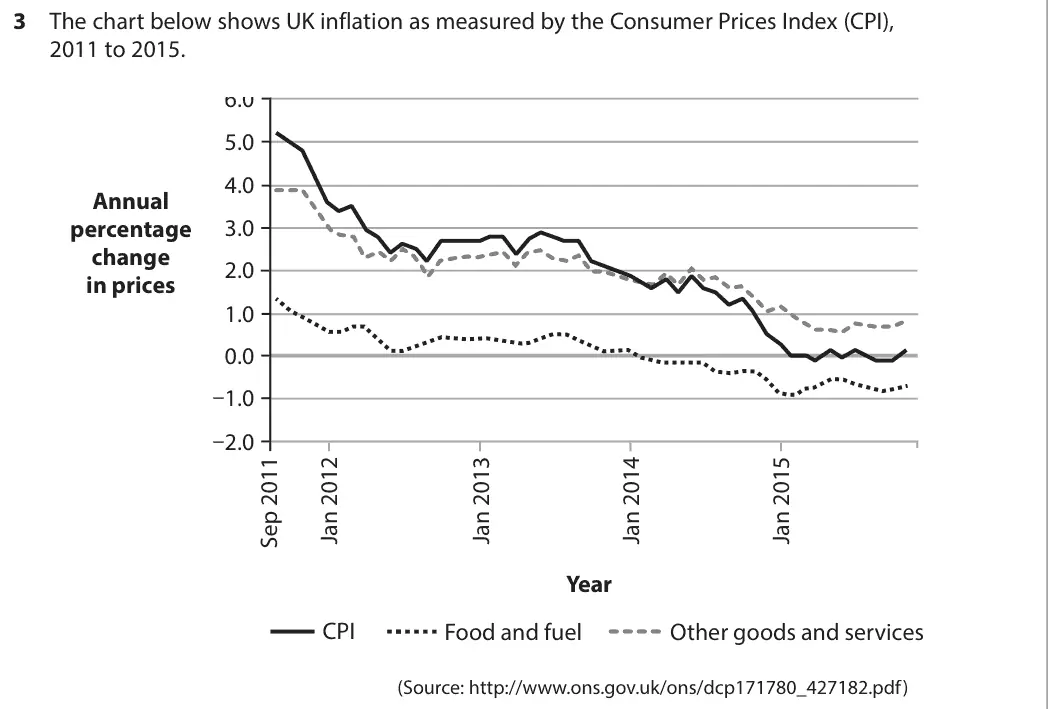
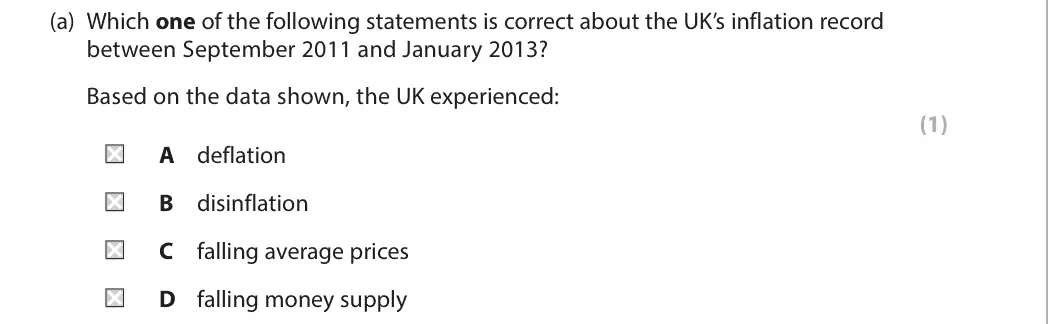
CPI inflation fell from about 5.2% to about 2.7% but stayed positive = disinflation (B)
deflation and falling average prices need a negative rate
the money supply is not shown
Quantitative skills: QS 10 (distinguish between changes in the level of a variable, and the rate of change); QS 9 (interpret, apply and analyse information in written, graphical tabular and numerical forms)
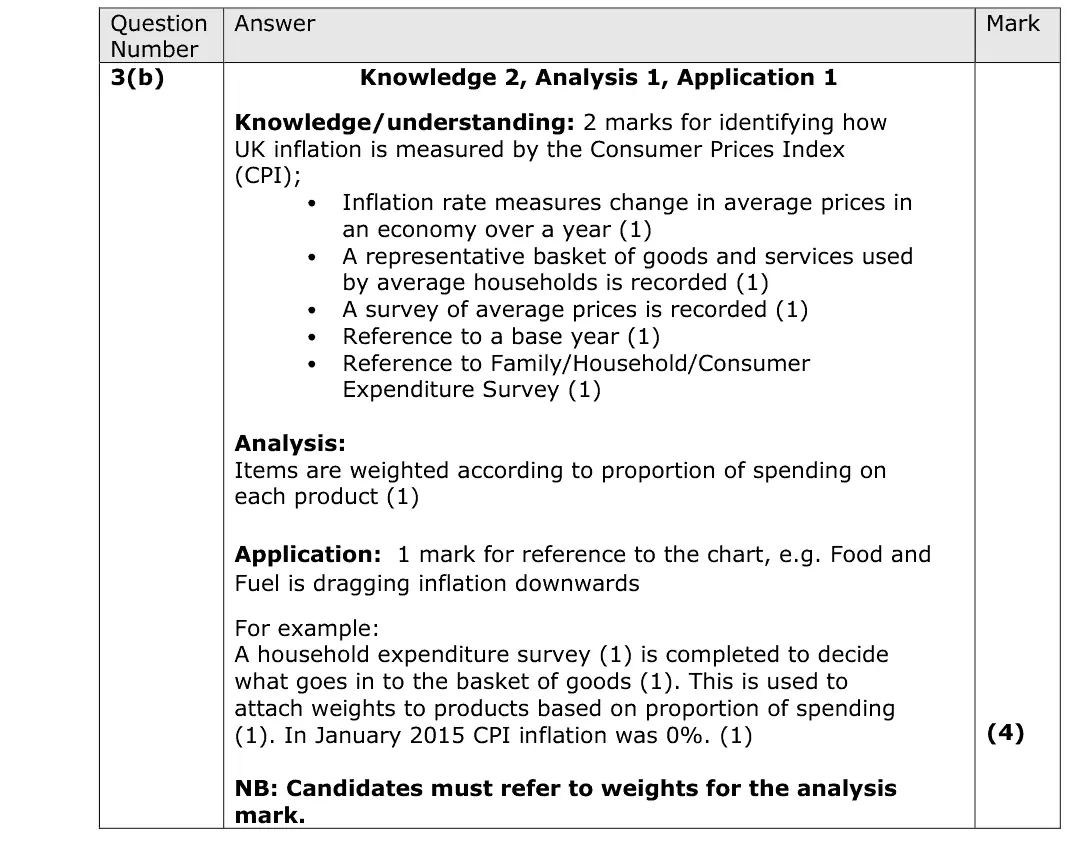
June 2017 · Paper 2 · Q3(b)4 marksAO1=2, AO2=1, AO3=1Short answer
Data and extracts for question 3
Mark scheme
Examiner's comment
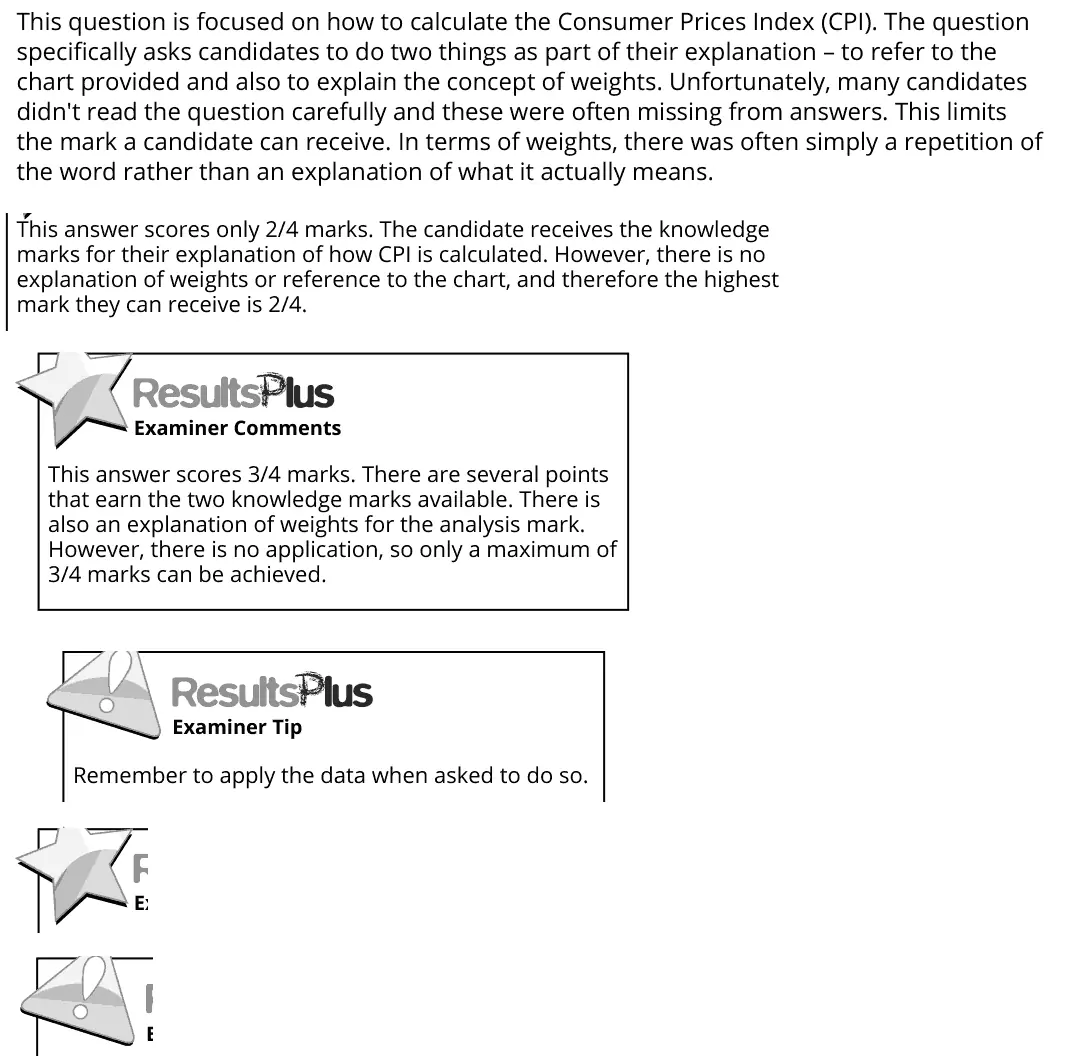
This question is focused on how to calculate the Consumer Prices Index (CPI). The question specifically asks candidates to do two things as part of their explanation – to refer to the chart provided and also to explain the concept of weights. Unfortunately, many candidates didn't read the question carefully and these were often missing from answers. This limits the mark a candidate can receive. In terms of weights, there was often simply a repetition of the word rather than an explanation of what it actually means. This answer scores only 2/4 marks. The candidate receives the knowledge marks for their explanation of how CPI is calculated. However, there is no explanation of weights or reference to the chart, and therefore the highest mark they can receive is 2/4. This answer scores 3/4 marks. There are several points that earn the two knowledge marks available. There is also an explanation of weights for the analysis mark. However, there is no application, so only a maximum of 3/4 marks can be achieved. Remember to apply the data when asked to do so.
Notes from the mark scheme and report
basket from the Household/Living Costs and Food Survey, prices surveyed, compared to a base year
weights = share of spending on each item (needed for the analysis mark)
many ignored weights or the chart (e.g. food and fuel dragging CPI down), capping marks at 2-3
Quantitative skills: QS 5 (calculate and interpret index numbers); QS 9 (interpret, apply and analyse information in written, graphical tabular and numerical forms)
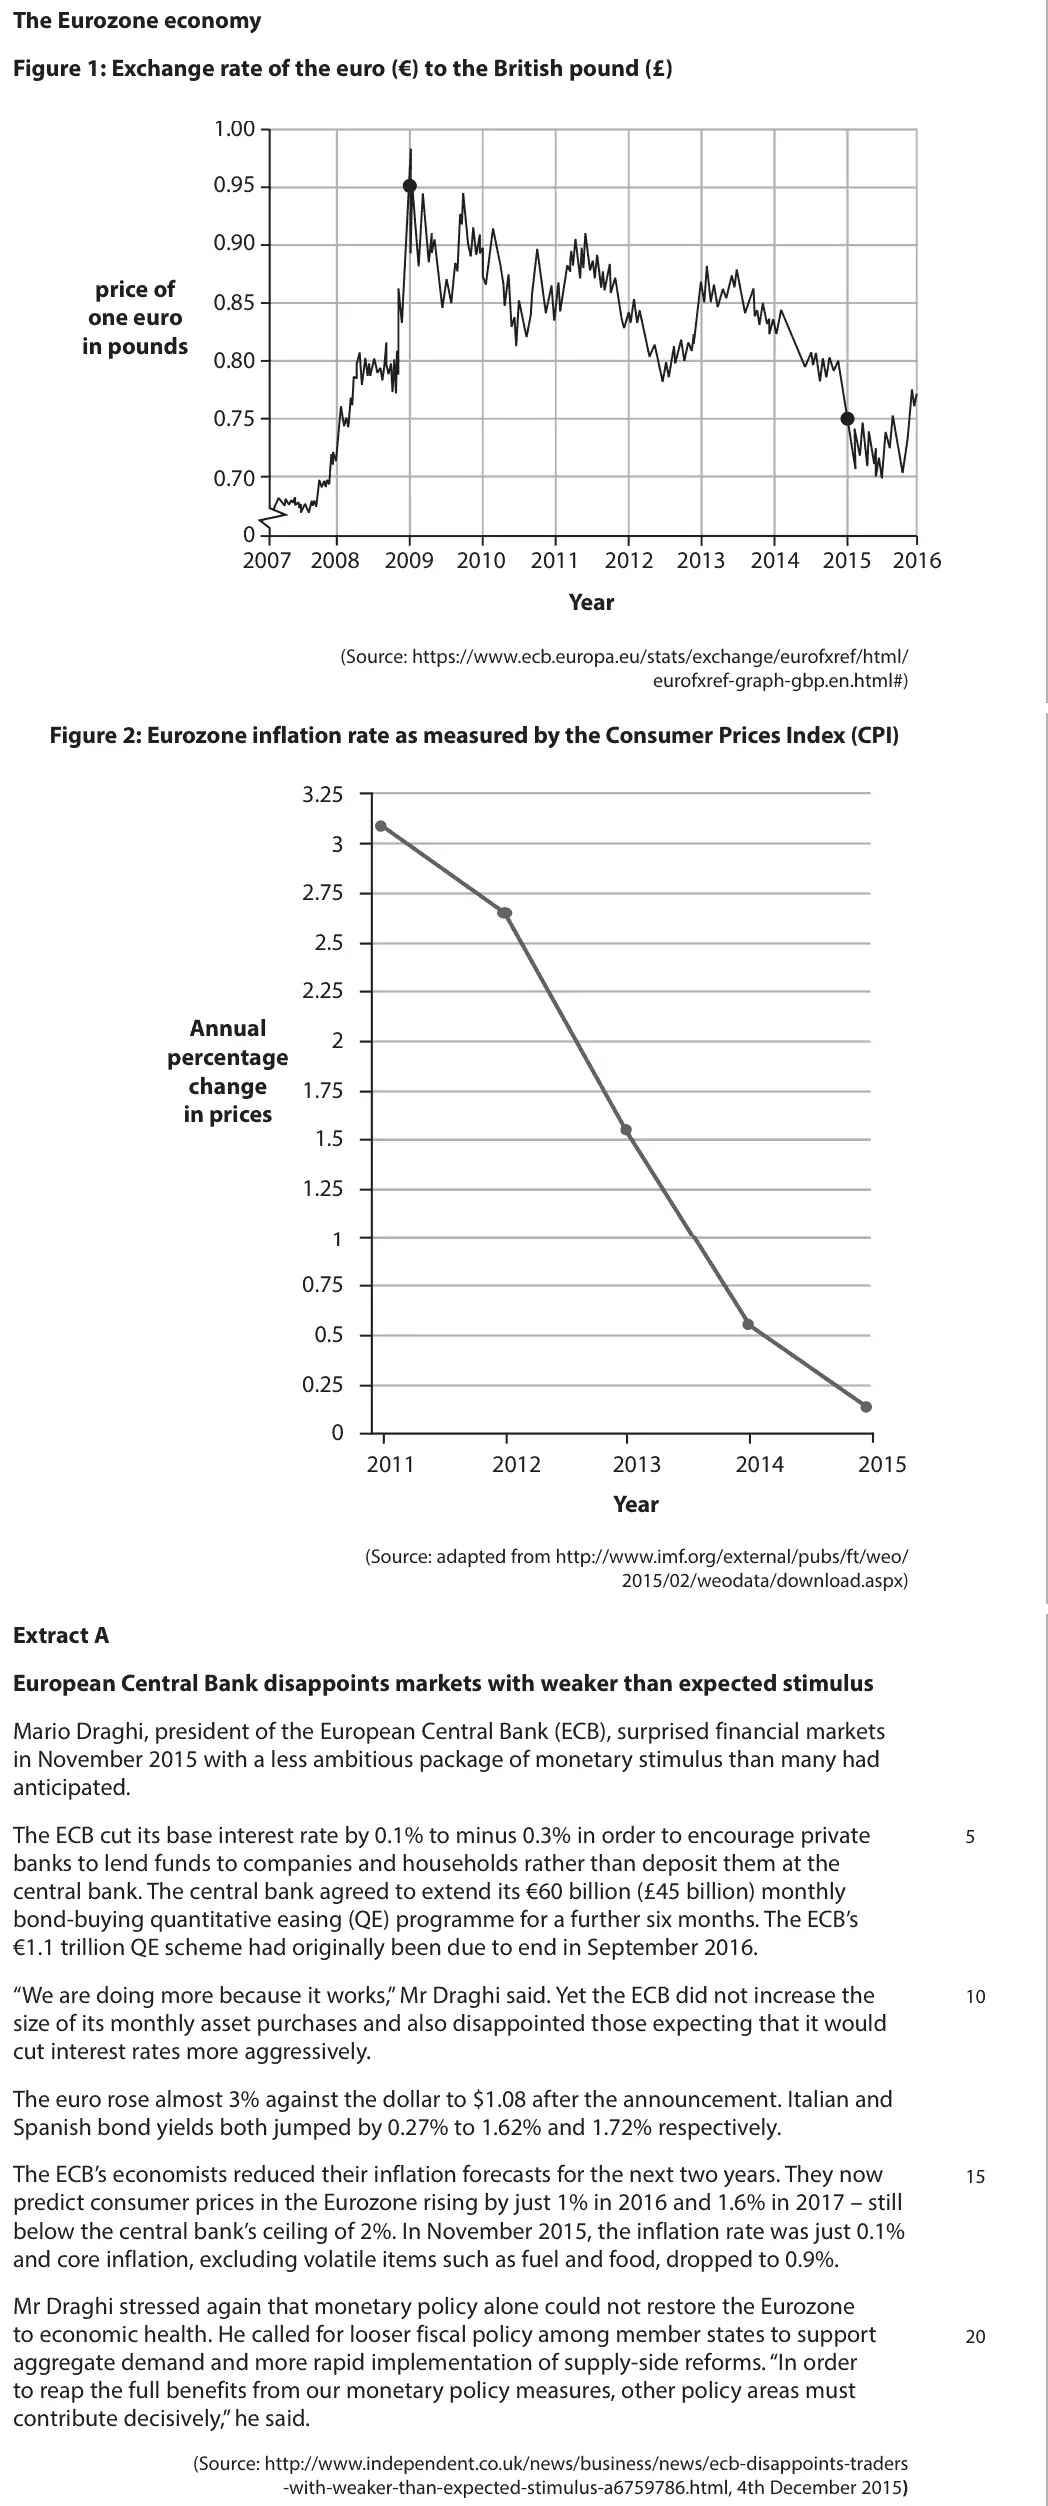
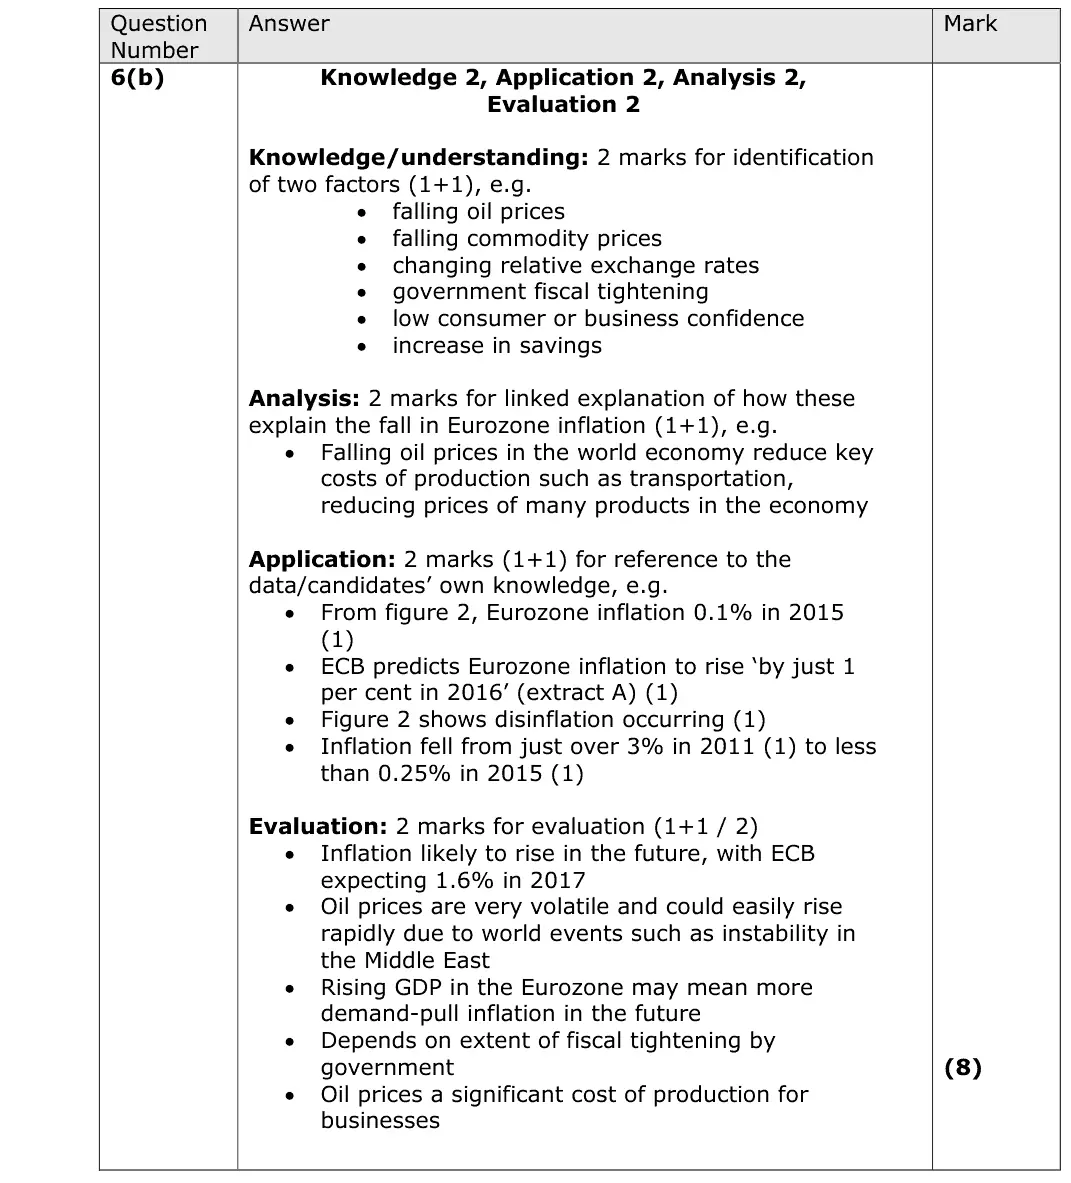
June 2017 · Paper 2 · Q6(b)8 marksAO1=2, AO2=2, AO3=2, AO4=28-mark response
Data and extracts for question 6
Mark scheme, including the levels grid and indicative content
Examiner's comment
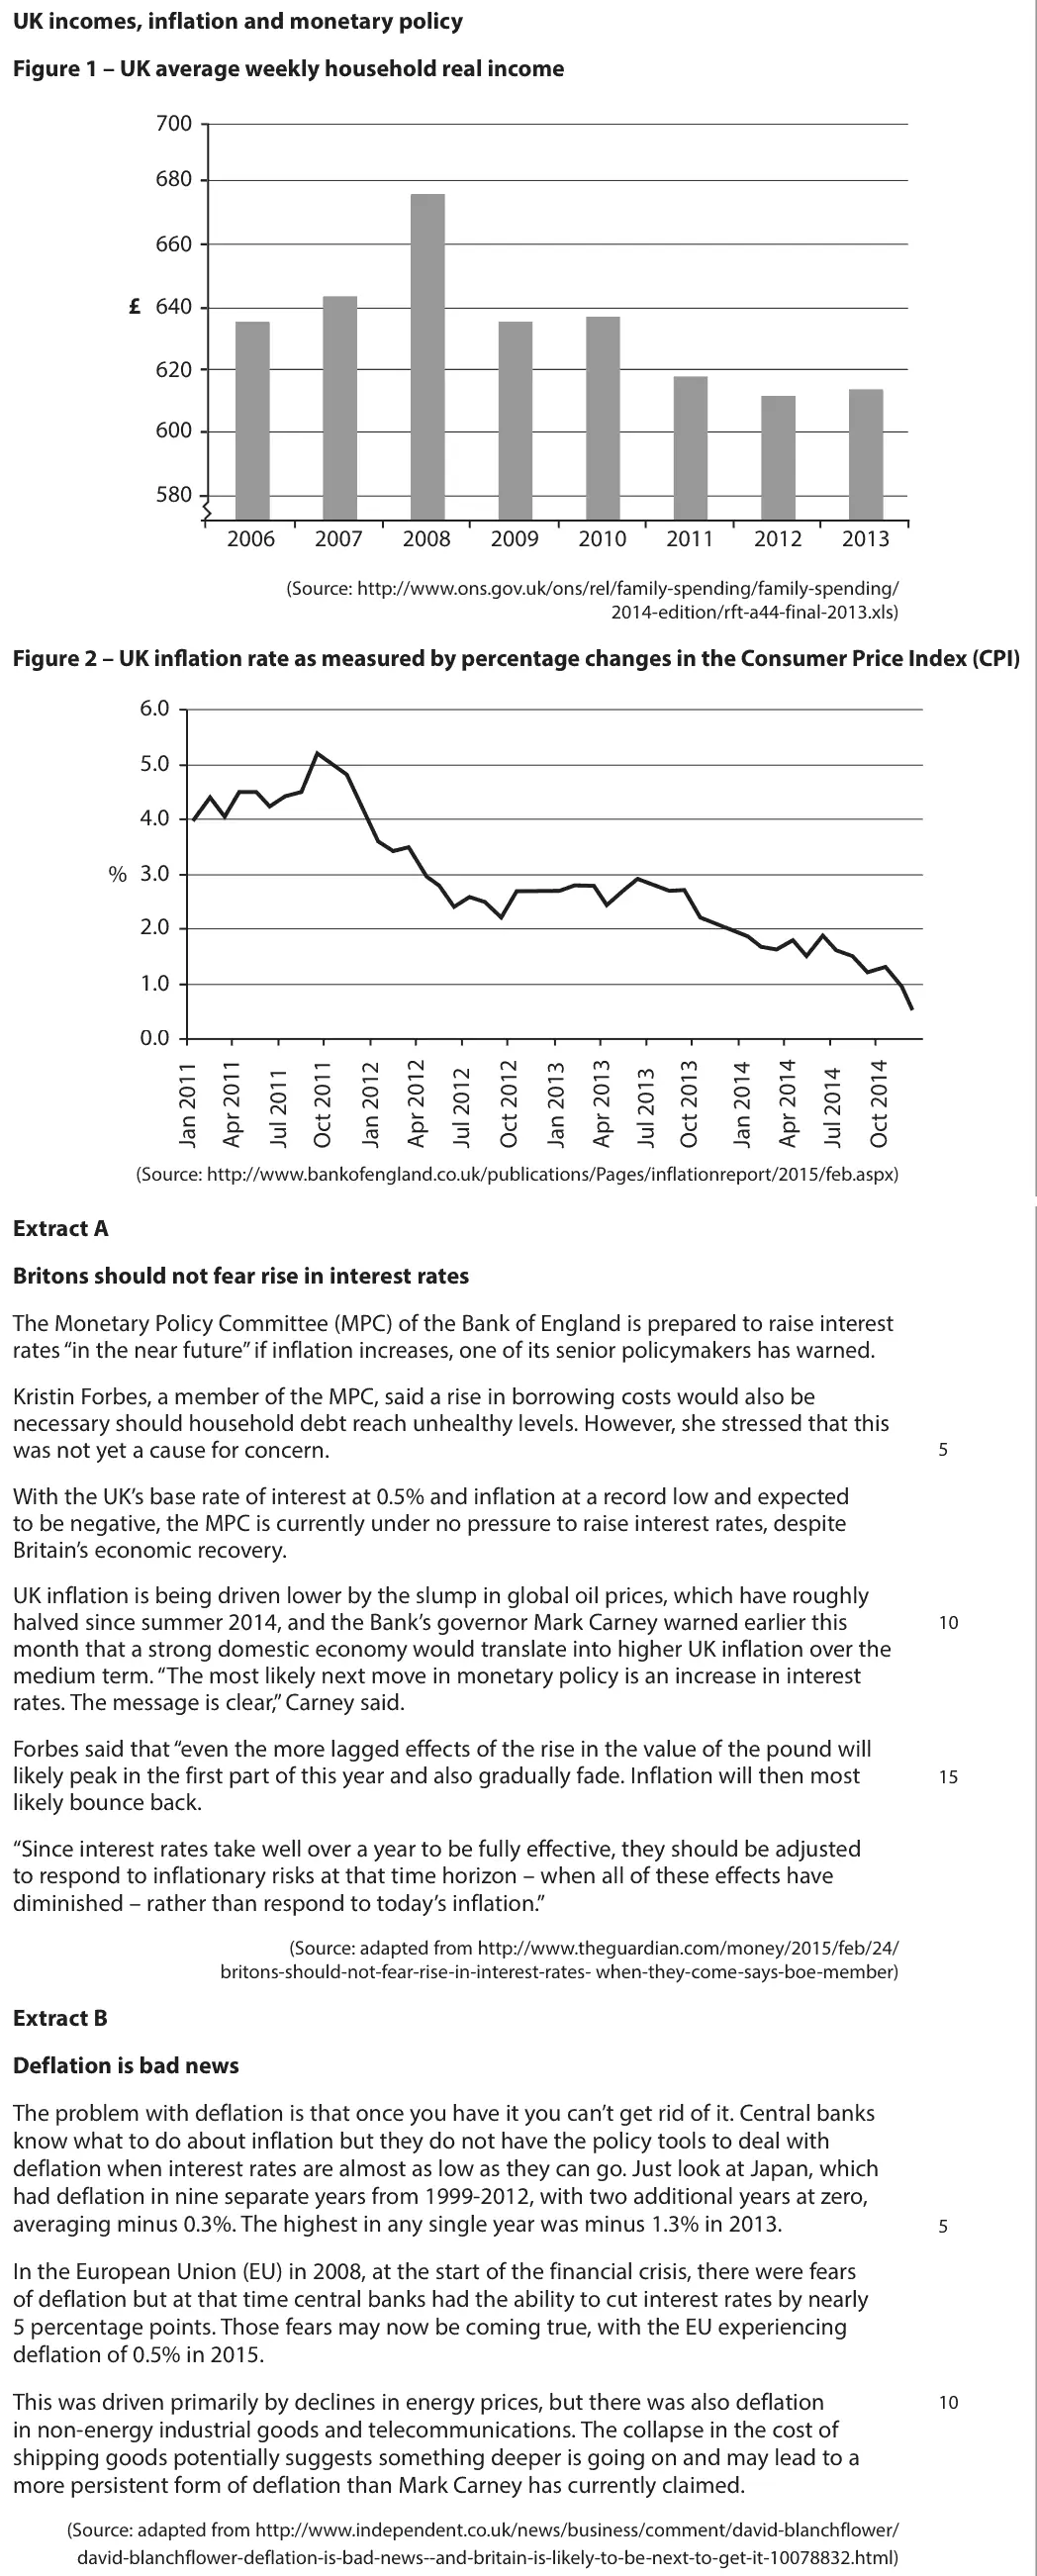
In this question the marks are evenly divided between knowledge, application, analysis, and evaluation (2 marks for each). Again, it is important that candidates appreciate that there has been a continuous fall in the rate of inflation since 2011, as shown in figure 2. This needs to be the basis for their answer. There are a wide variety of reasons that candidates put forward to explain this and all relevant reasons were credited. Candidates also needed to offer some evaluation of their answer. This is where many answers were lacking – candidates simply didn't evaluate, and as such missed out on 2 marks. Make sure you have two distinct reasons. In the pressure of an exam it can be easy to forget what you have already written about. This answer scores 4/8 marks. The candidate unfortunately only has one reason – falling growth/AD. There is also no evaluation. Their application is good and their knowledge and analysis of their one point is good, but 4/8 is the highest they can score in this situation. This answer scores 6/8 marks. The candidate offers 2 good reasons, along with analysis and application. Unfortunately there is no evaluation, so they cannot gain more than 6 marks. Always remember to evaluate in these 8-mark 'examine' questions.
Notes from the mark scheme and report
Figure 2 shows a continuous fall in the inflation rate (about 3.1% in 2011 to 0.1% in 2015), i.e. disinflation
Quantitative skills: QS 10 (distinguish between changes in the level of a variable, and the rate of change); QS 9 (interpret, apply and analyse information in written, graphical tabular and numerical forms)
June 2016 · AS Paper 2 · Q6(d)6 marksAO1=2, AO2=2, AO3=2Short answer
Data and extracts for question 6
Mark scheme
Examiner's comment
In this question one important point to note was that the question asks for two likely reasons. Unfortunately a number of candidates said that one likely reason was that interest rates had been increased. However, the extract (and candidates' general knowledge) shows this is not the case, and so this reason was not awarded any knowledge marks. Many other relevant reasons however were offered by candidates, for which they gained credit. This question also demonstrates the importance of using the case study as much as possible, as there were several reasons that candidates could use included in the information provided. In this answer the candidate correctly identifies two relevant reasons. However, the second reason is about higher interest rates, so they cannot achieve the knowledge mark here. The rest of the question is clear, well-applied, and well-analysed, so this is the only mark they have missed out on. Do ensure your answers are correct in terms of the economic situation explained in the figures and extract. This answer includes two relevant reasons which are well applied and analysed, and as such earns the maximum mark of 6/6.
Notes from the mark scheme and report
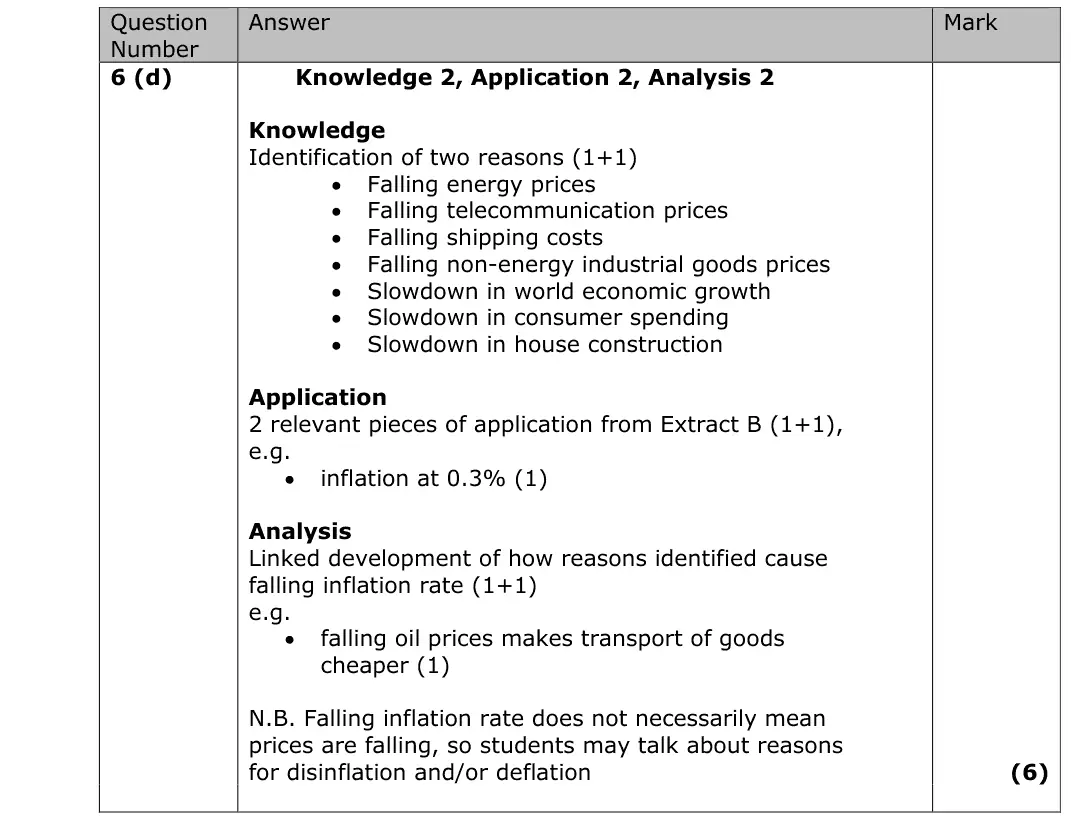
two reasons (falling oil and energy prices, cheaper telecoms and shipping, stronger pound, weak demand) each linked to lower inflation
a falling rate need not mean falling prices
report: rising interest rates is wrong as rates had not risen
Quantitative skills: QS 9 (interpret, apply and analyse information in written, graphical tabular and numerical forms)
June 2016 · AS Paper 2 · Q6(e)15 marksAO1=3, AO2=3, AO3=3, AO4=615-mark response
Data and extracts for question 6
Mark scheme, including the levels grid and indicative content
Examiner's comment
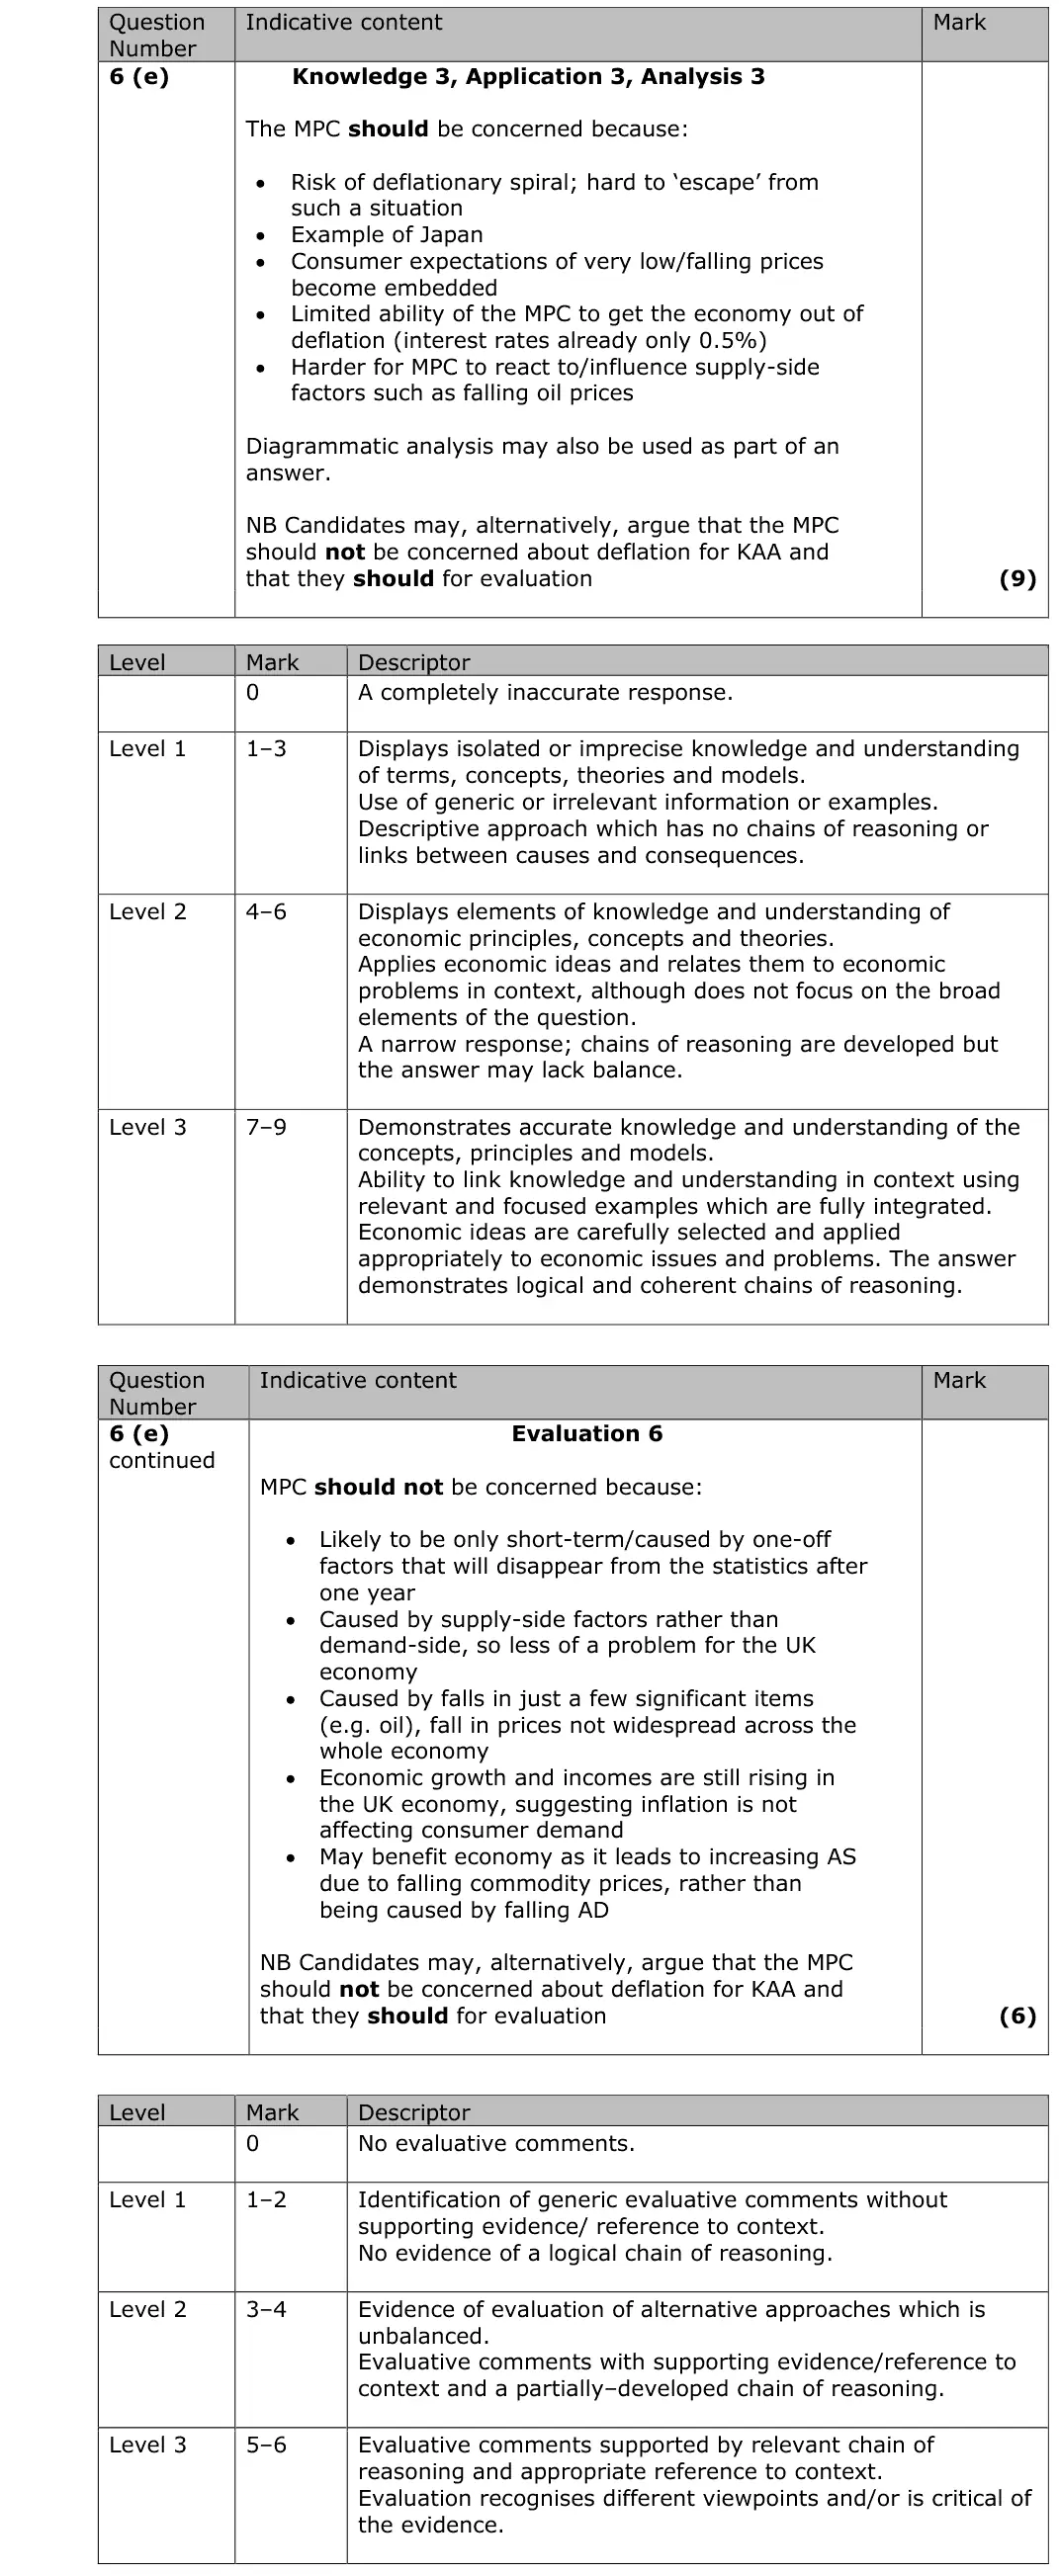
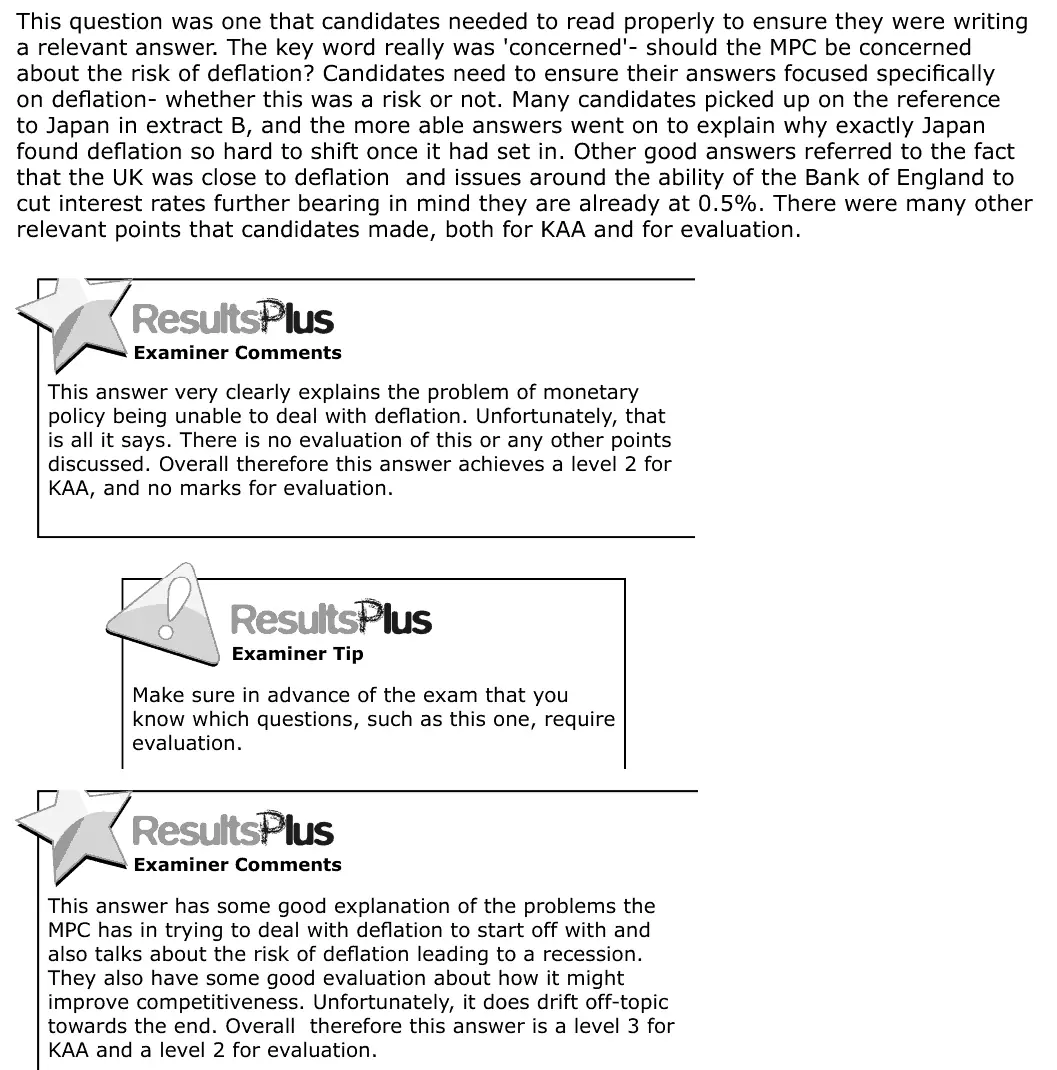
This question was one that candidates needed to read properly to ensure they were writing a relevant answer. The key word really was 'concerned'- should the MPC be concerned about the risk of deflation? Candidates need to ensure their answers focused specifically on deflation- whether this was a risk or not. Many candidates picked up on the reference to Japan in extract B, and the more able answers went on to explain why exactly Japan found deflation so hard to shift once it had set in. Other good answers referred to the fact that the UK was close to deflation and issues around the ability of the Bank of England to cut interest rates further bearing in mind they are already at 0.5%. There were many other relevant points that candidates made, both for KAA and for evaluation. This answer very clearly explains the problem of monetary policy being unable to deal with deflation. Unfortunately, that is all it says. There is no evaluation of this or any other points discussed. Overall therefore this answer achieves a level 2 for KAA, and no marks for evaluation. Make sure in advance of the exam that you know which questions, such as this one, require evaluation. This answer has some good explanation of the problems the MPC has in trying to deal with deflation to start off with and also talks about the risk of deflation leading to a recession. They also have some good evaluation about how it might improve competitiveness. Unfortunately, it does drift off-topic towards the end. Overall therefore this answer is a level 3 for KAA and a level 2 for evaluation.
Notes from the mark scheme and report
deflation risk: delayed spending, deflationary spiral, rising real debt, Japan, little room to cut Bank Rate below 0.5%
evaluate with "good" deflation from falling oil prices, a temporary dip and a strong domestic economy
stay focused on whether the MPC should be concerned
June 2016 · AS Paper 2 · Q6(f)20 marksAO1=4, AO2=4, AO3=6, AO4=620-mark essayEither/or
Data and extracts for question 6
Mark scheme, including the levels grid and indicative content
Examiner's comment
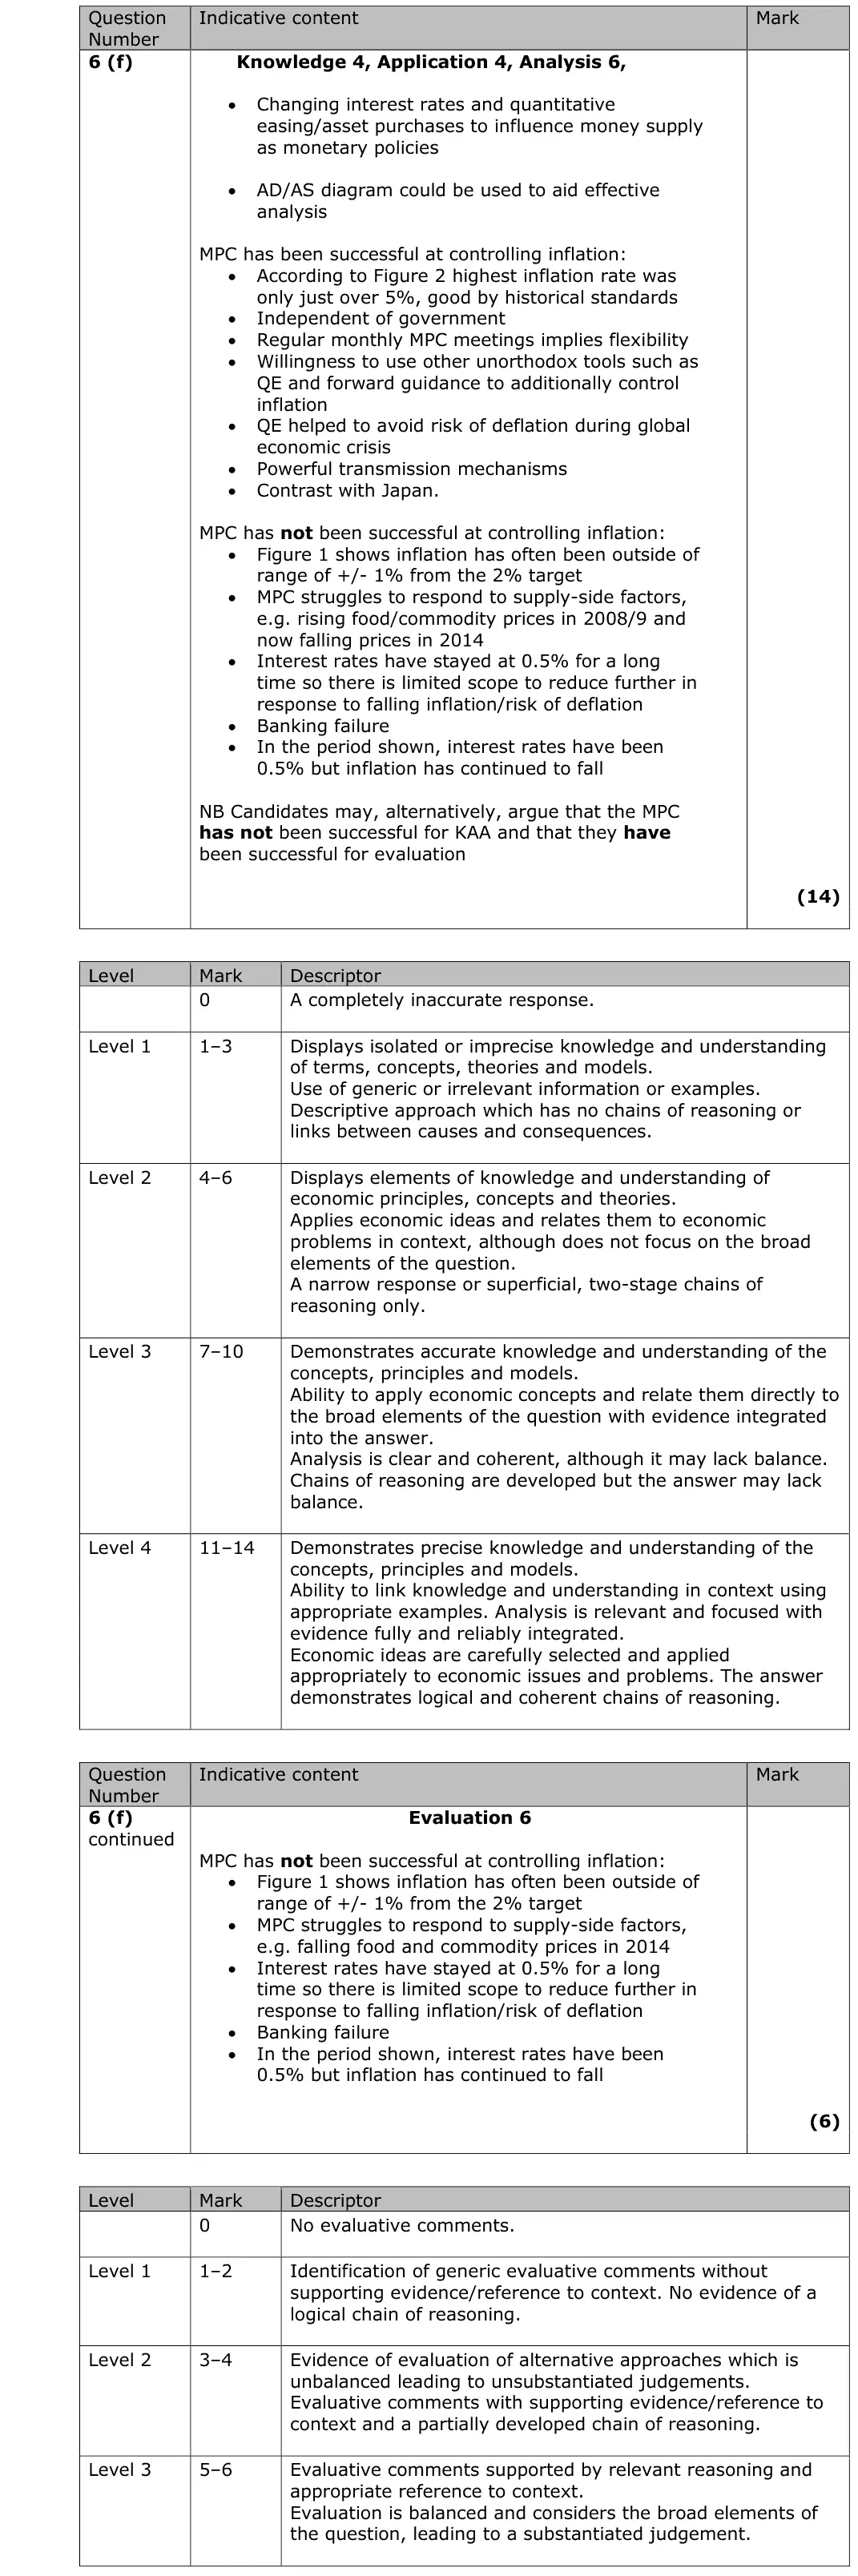
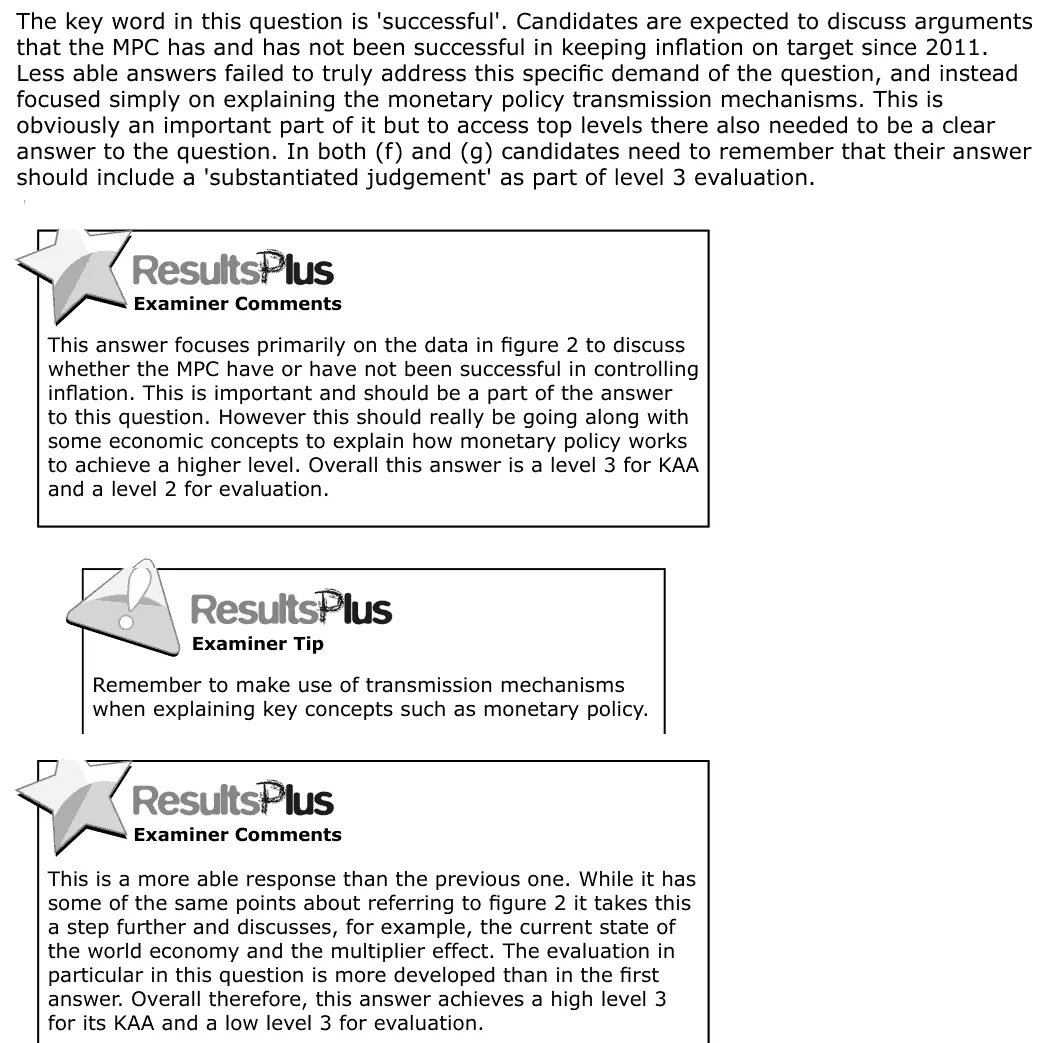
The key word in this question is 'successful'. Candidates are expected to discuss arguments that the MPC has and has not been successful in keeping inflation on target since 2011. Less able answers failed to truly address this specific demand of the question, and instead focused simply on explaining the monetary policy transmission mechanisms. This is obviously an important part of it but to access top levels there also needed to be a clear answer to the question. In both (f) and (g) candidates need to remember that their answer should include a 'substantiated judgement' as part of level 3 evaluation. This answer focuses primarily on the data in figure 2 to discuss whether the MPC have or have not been successful in controlling inflation. This is important and should be a part of the answer to this question. However this should really be going along with some economic concepts to explain how monetary policy works to achieve a higher level. Overall this answer is a level 3 for KAA and a level 2 for evaluation. Remember to make use of transmission mechanisms when explaining key concepts such as monetary policy. This is a more able response than the previous one. While it has some of the same points about referring to figure 2 it takes this a step further and discusses, for example, the current state of the world economy and the multiplier effect. The evaluation in particular in this question is more developed than in the first answer. Overall therefore, this answer achieves a high level 3 for its KAA and a low level 3 for evaluation.
Notes from the mark scheme and report
judge success against the 2% CPI target (plus or minus 1%) using Figure 2: above 5% in 2011, under 1% by late 2014
Bank Rate, QE and forward guidance
supply-side shocks the MPC cannot control
report: weaker answers only described the transmission mechanism
a substantiated judgement is needed for Level 3 evaluation
Quantitative skills: QS 9 (interpret, apply and analyse information in written, graphical tabular and numerical forms)
Work with an Edexcel economics tutor
Essays stuck in Level 2, or losing the easy marks in Section A? Book a trial session with Lianne, a former Edexcel examiner.