Notes and key-term cards for this topic are being written by our tutors. The past-paper questions below are ready now.
Specification statements
4.5.1Public expenditure: a) Distinction between capital expenditure, current expenditure and transfer payments b) Reasons for the changing size and composition of public expenditure in a global context c) The significance of differing levels of public expenditure as a proportion of GDP on: • productivity and growth • living standards • crowding out • level of taxation • equality
4.5.2Taxation: a) Distinction between progressive, proportional and regressive taxes b) The economic effects of changes in direct and indirect tax rates on other variables: • incentives to work • tax revenues: the Laffer curve • income distribution • real output and employment • the price level • the trade balance • FDI flows
4.5.3Public sector finances: a) Distinction between automatic stabilisers and discretionary fiscal policy b) Distinction between a fiscal deficit and the national debt c) Distinction between structural and cyclical deficits d) Factors influencing the size of fiscal deficits e) Factors influencing the size of national debts f) The significance of the size of fiscal deficits and national debts
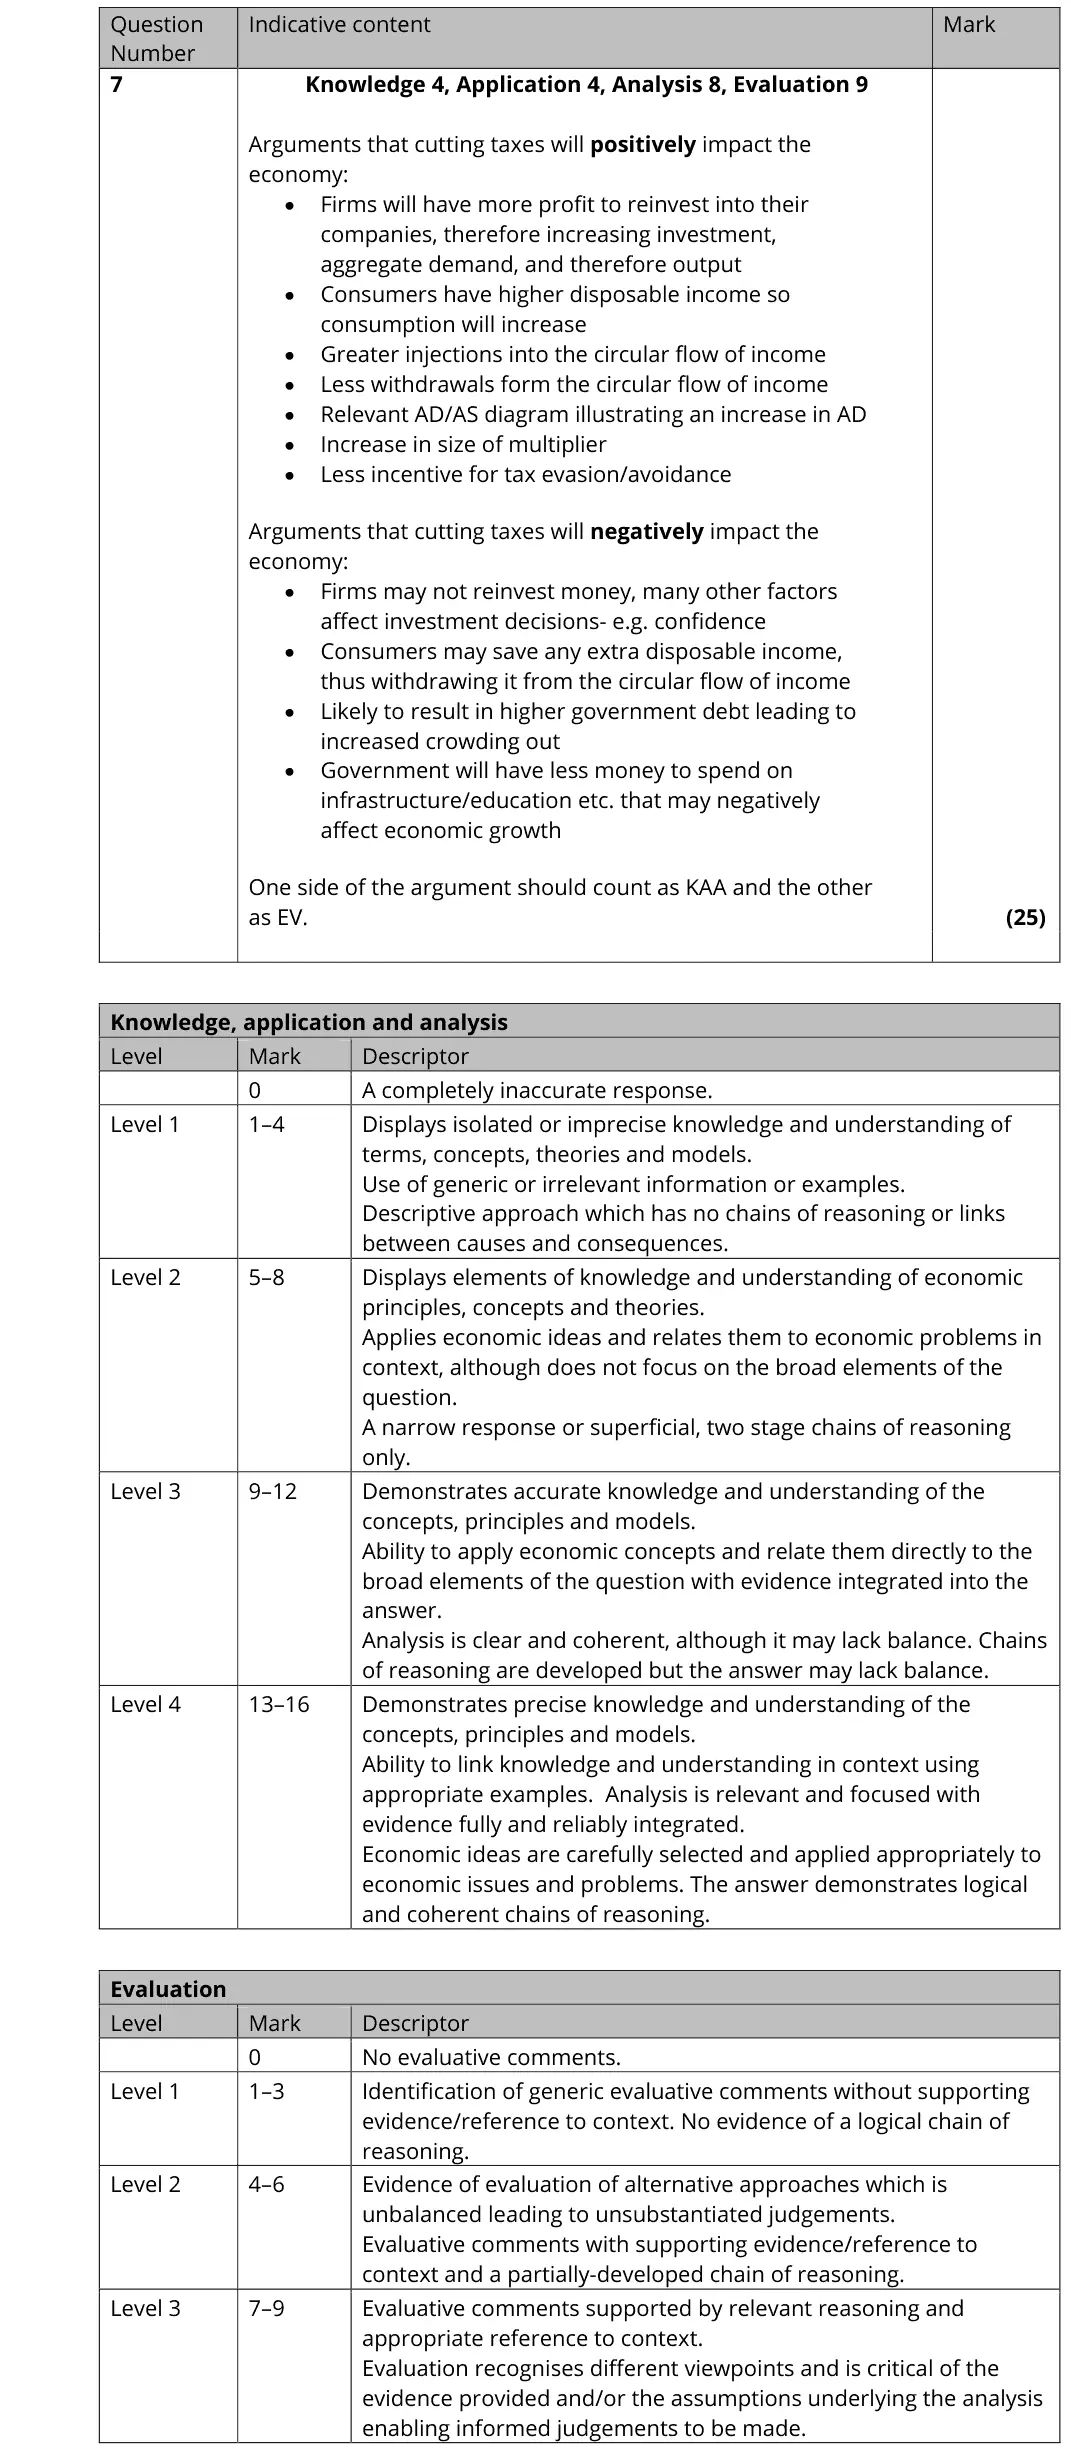
In 2018, the United States Government cut the corporation tax rate (tax on company profits) from 35% to 21%. Income tax rates for US citizens were also reduced: for example, the top rate of income tax was cut from 39.6% to 37%. (Source adapted from: https://www.nytimes.com/) Evaluate the likely impact of cutting tax rates as a policy to increase economic growth.
Japan’s budget deficit for 2017/18 is expected to be 4.6% of GDP. Its national debt is forecast to increase to above 250% of GDP by 2019. Evaluate the impact of a large fiscal deficit and national debt on a country’s economy.
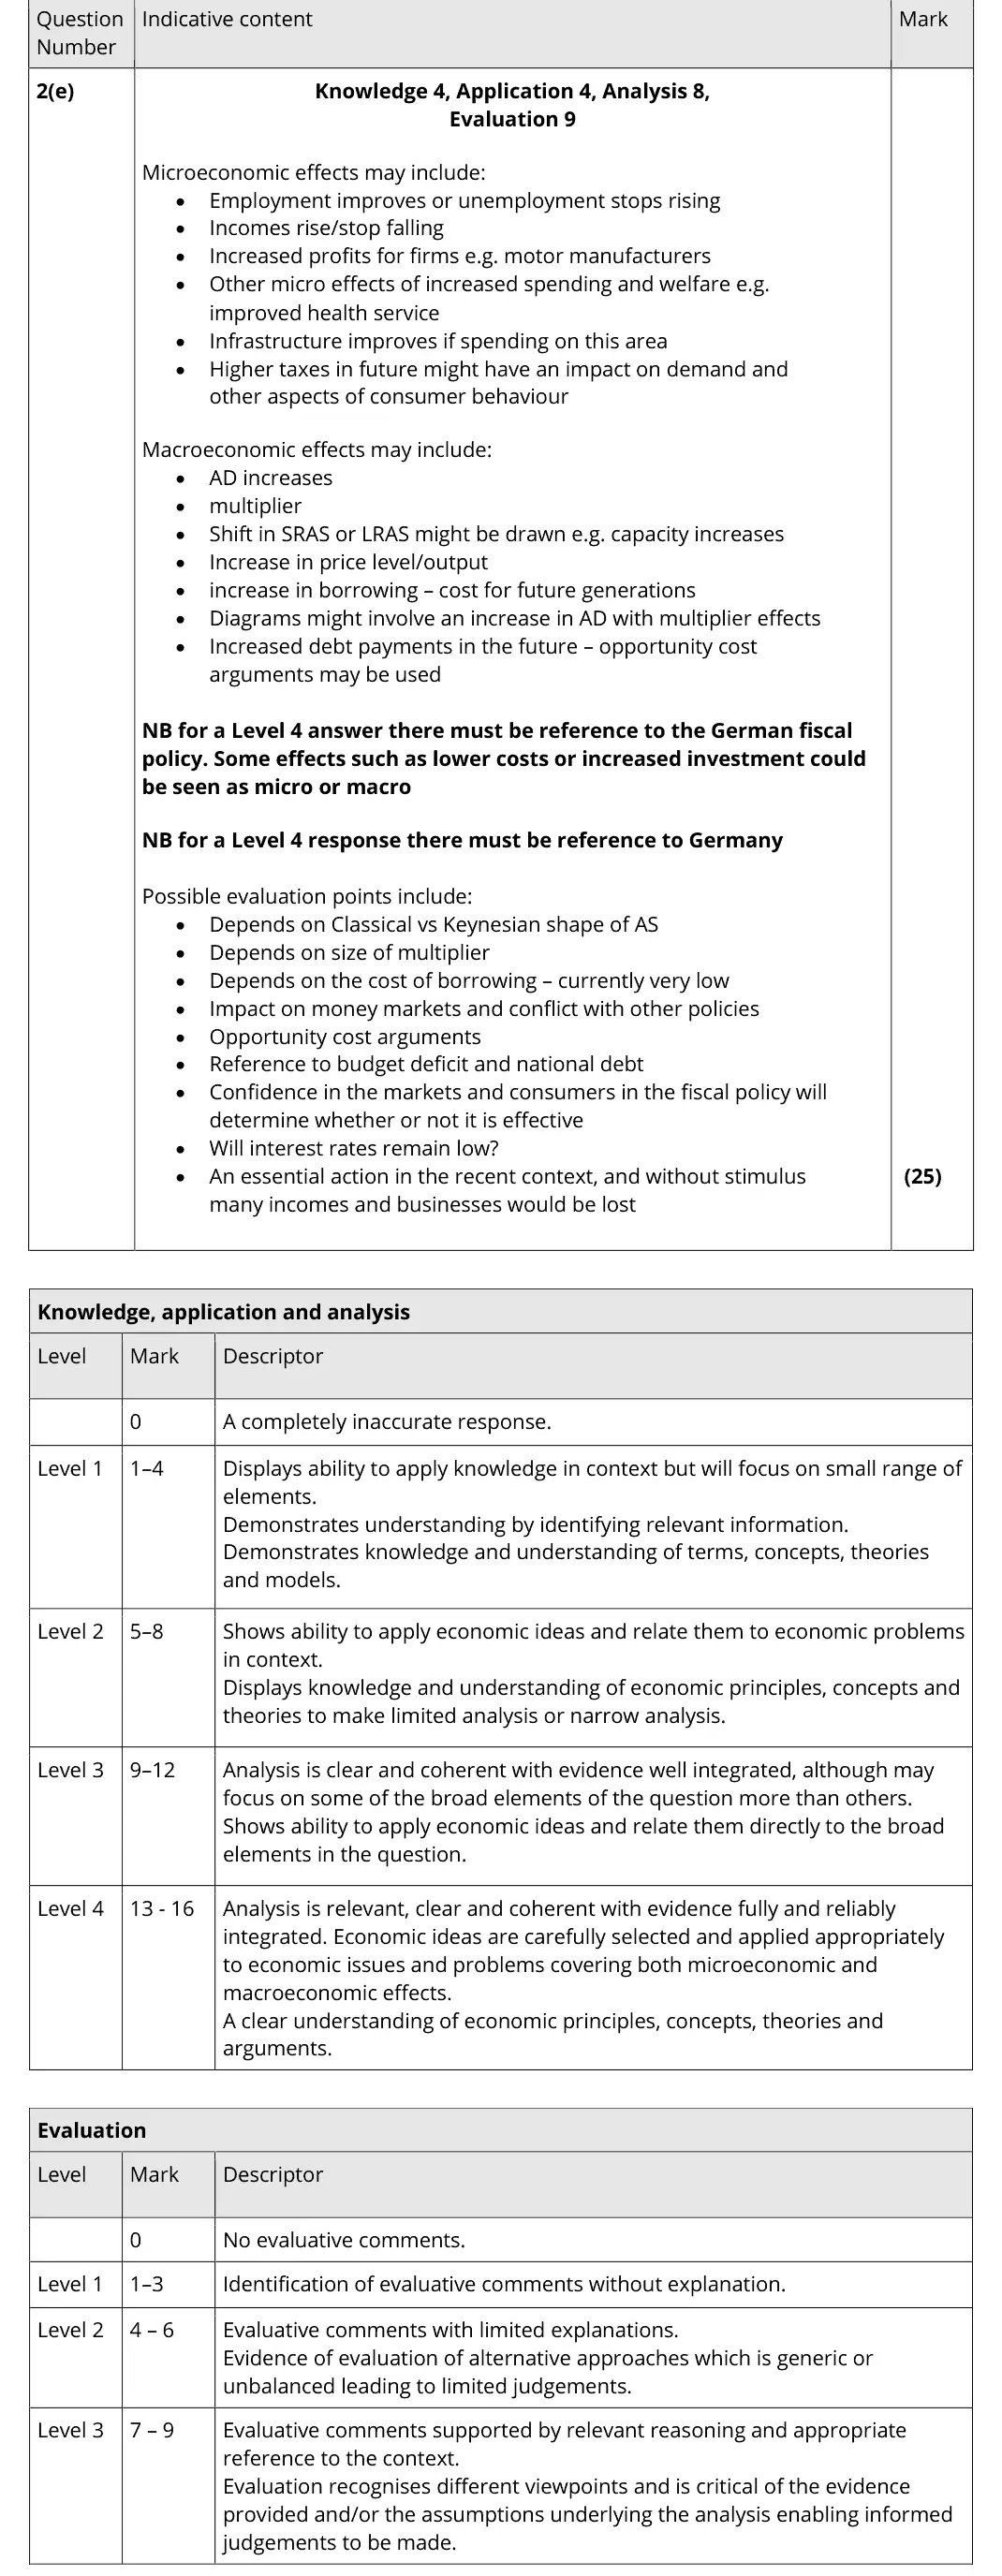
With reference to the information provided and your own knowledge, evaluate the microeconomic and macroeconomic effects of a government policy of cutting public expenditure rather than raising taxes as a means of reducing a fiscal deficit.
Tap a question to zoom it. The data and extracts fold out above each question; the mark scheme and examiner's comment open underneath.
June 2025 · Paper 2 · Q6(a)5 marksAO1=2, AO2=2, AO3=1Short answer
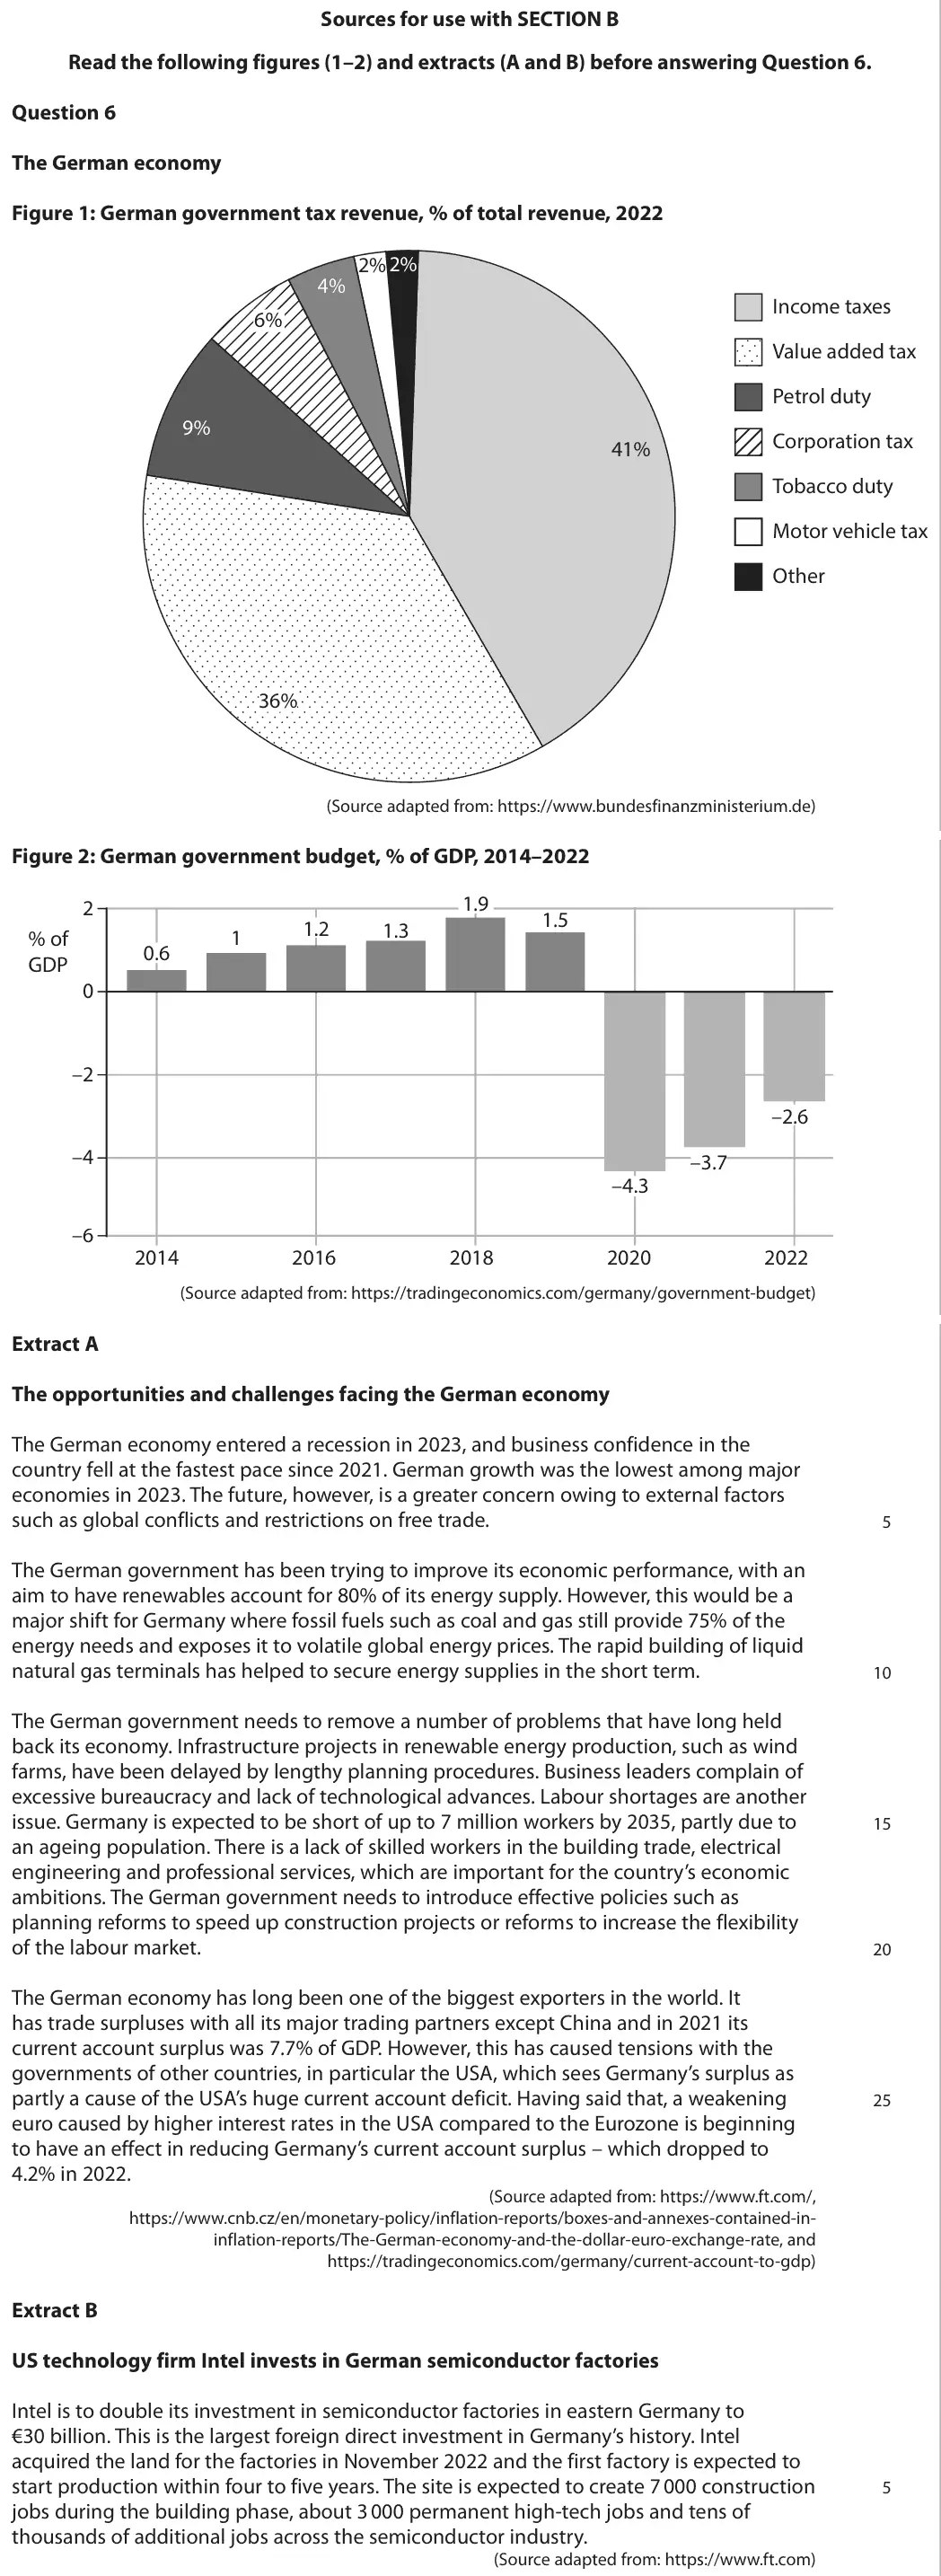
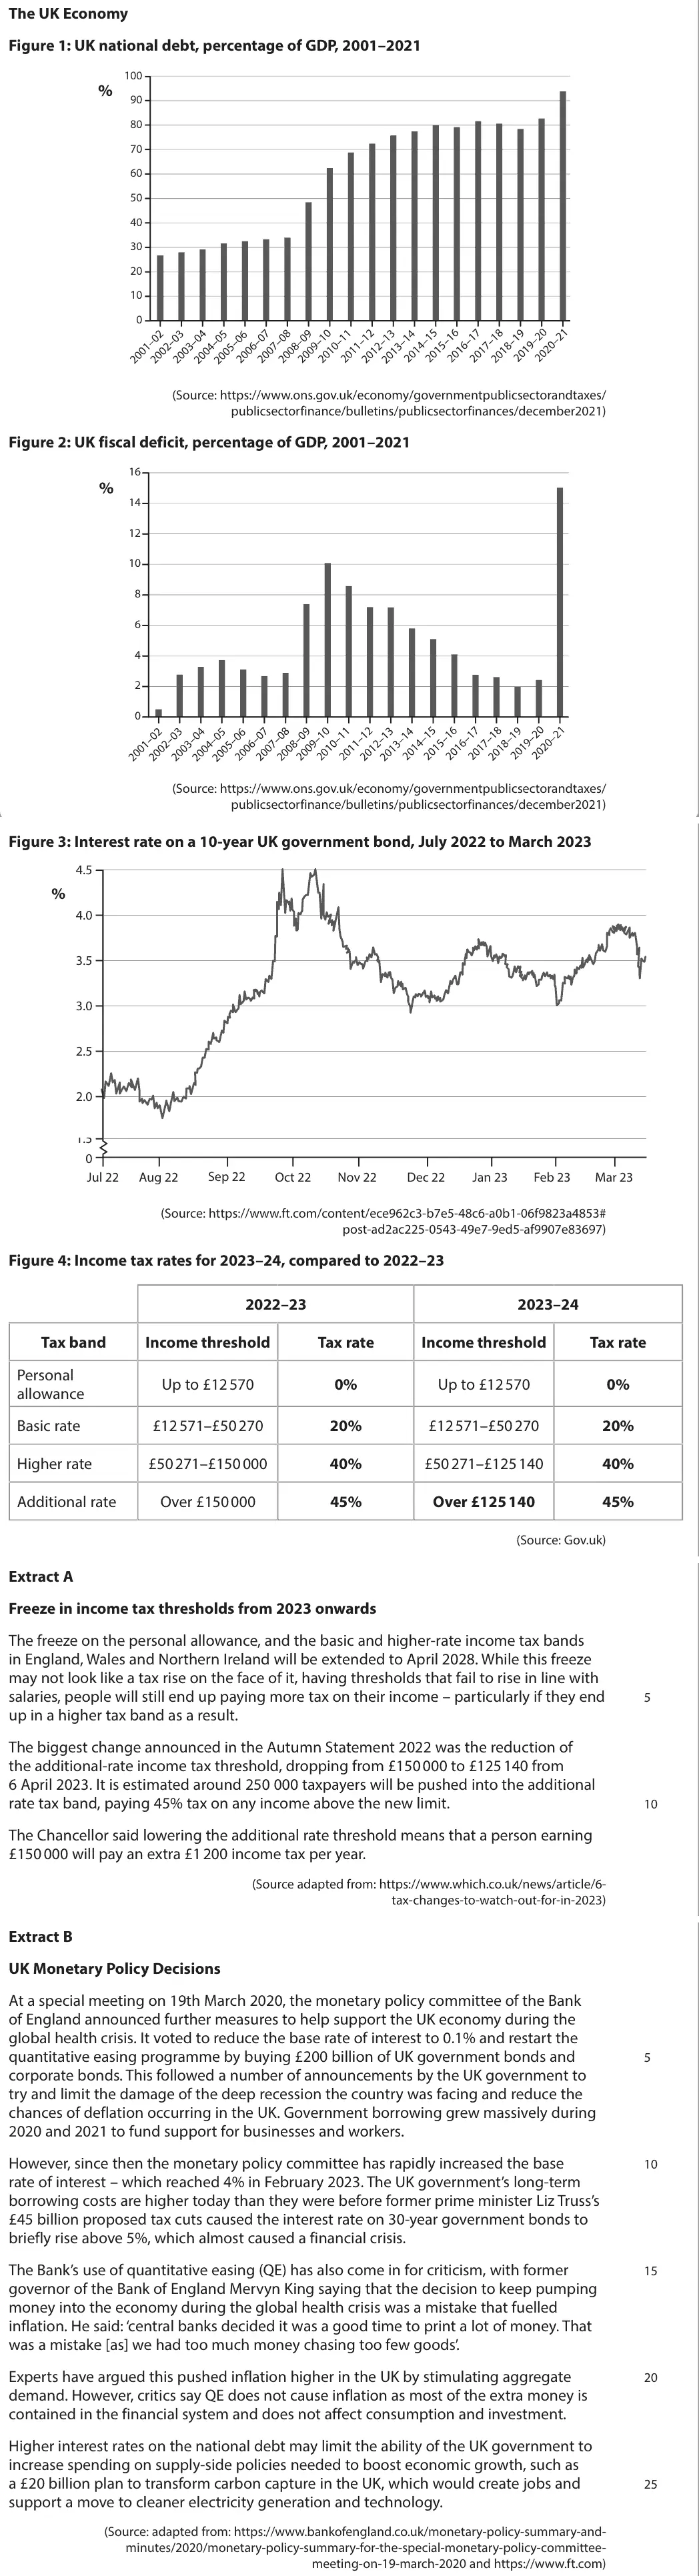
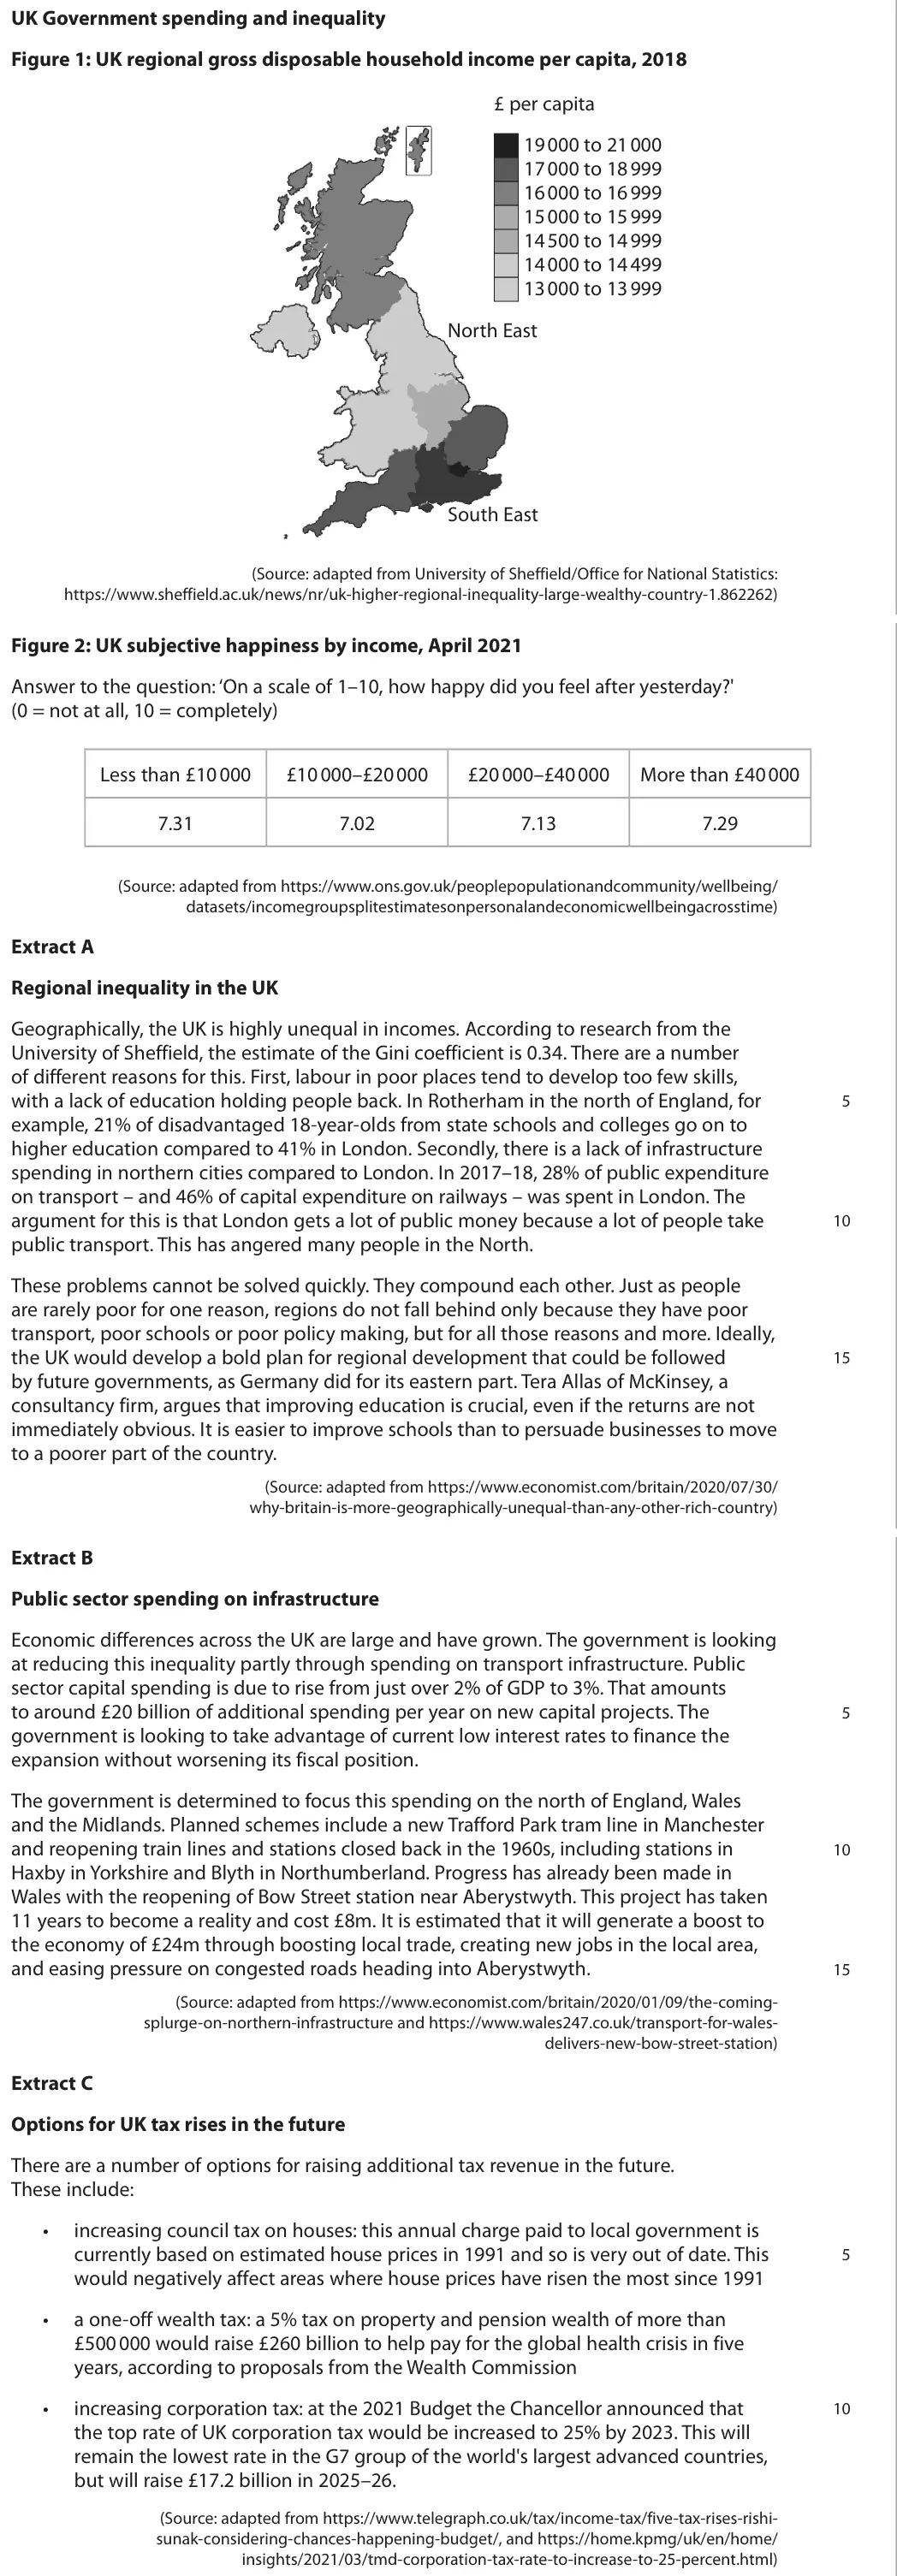
Data and extracts for question 6
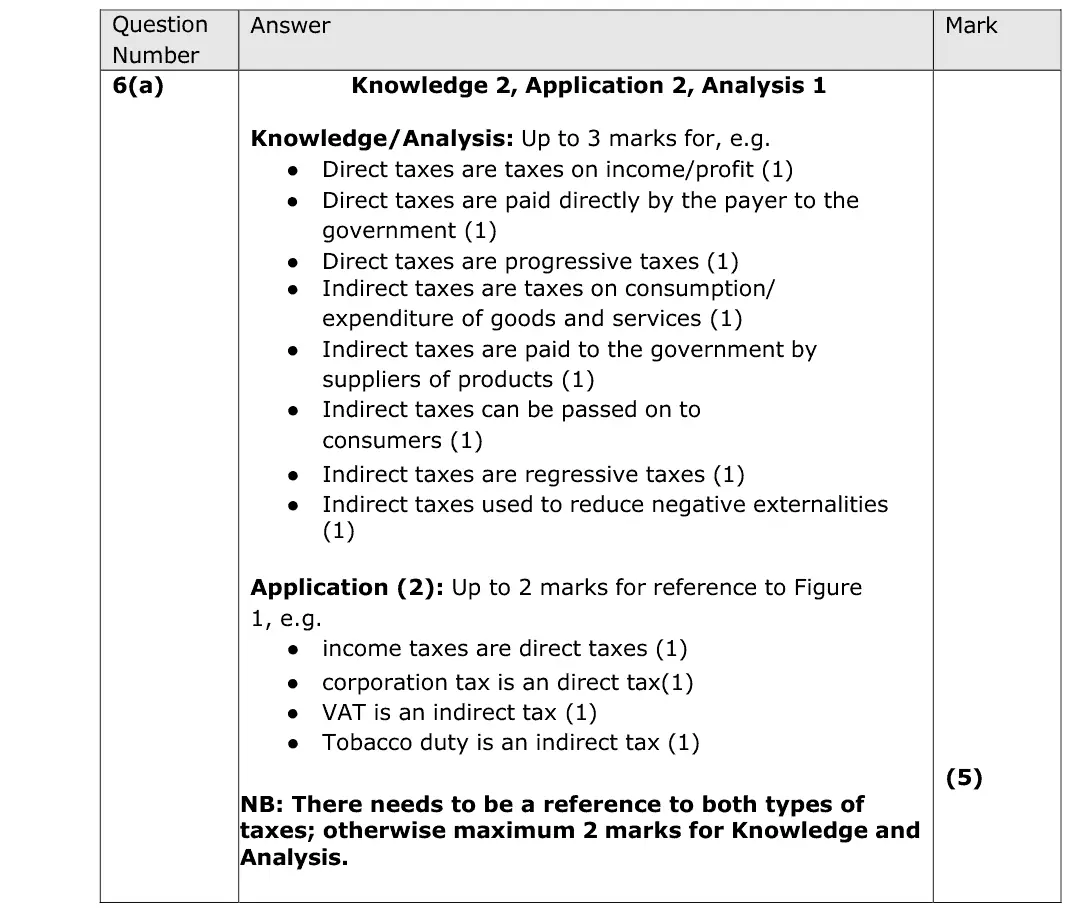
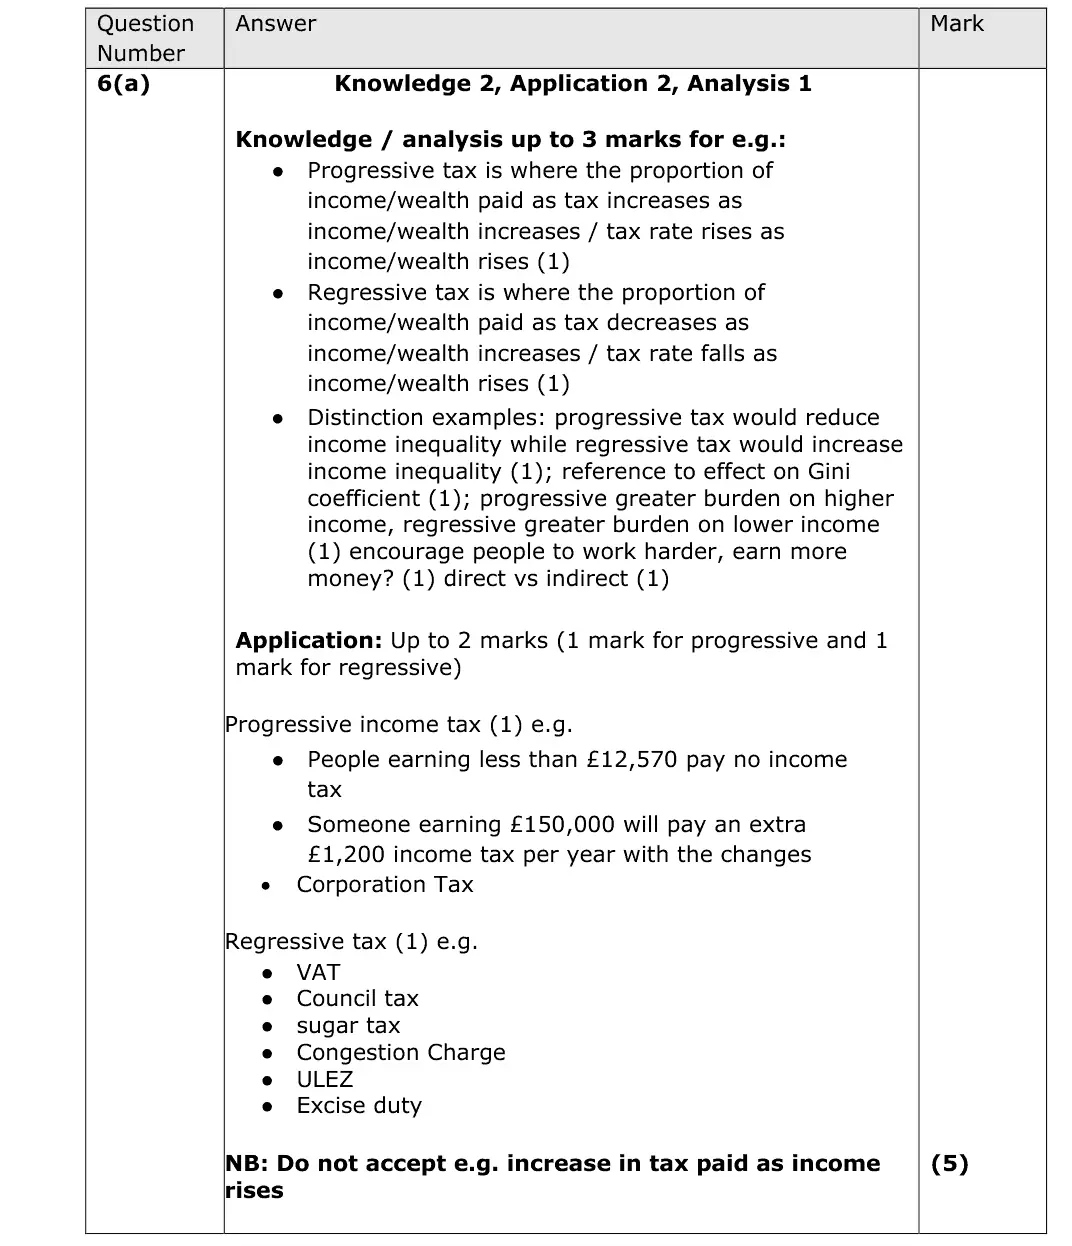
Mark scheme
Examiner's comment
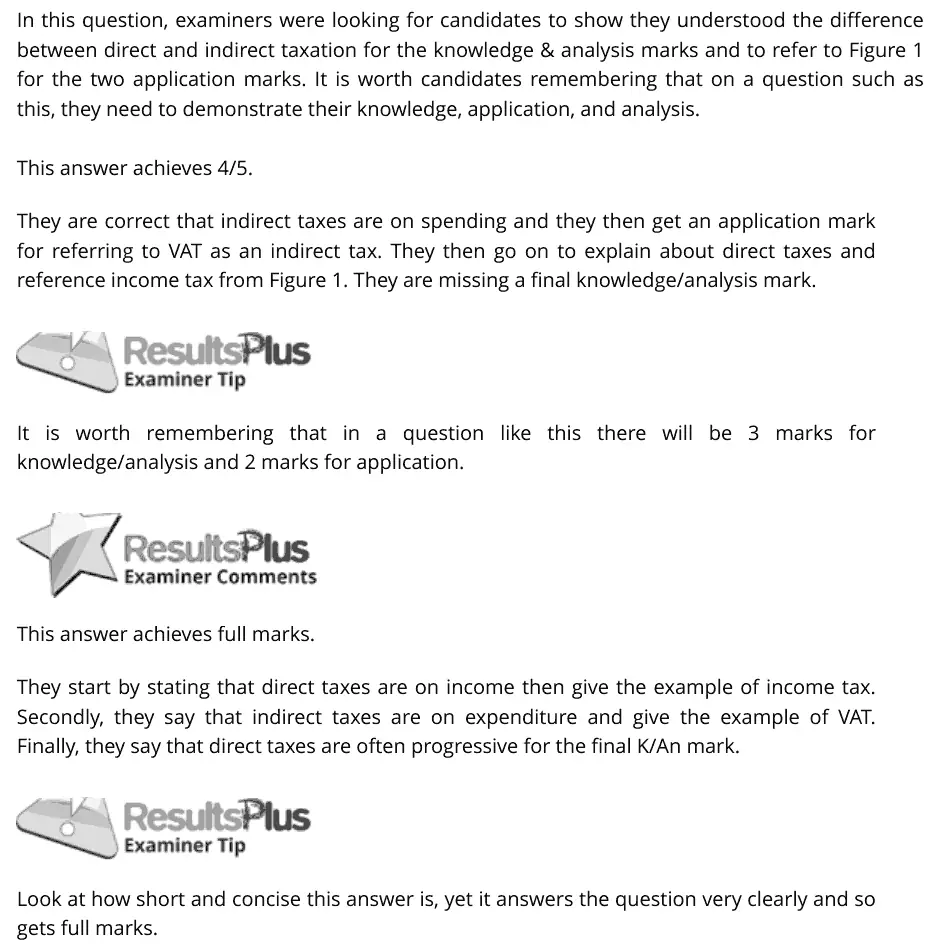
In this question, examiners were looking for candidates to show they understood the difference between direct and indirect taxation for the knowledge & analysis marks and to refer to Figure 1 for the two application marks. It is worth candidates remembering that on a question such as this, they need to demonstrate their knowledge, application, and analysis. This answer achieves 4/5. They are correct that indirect taxes are on spending and they then get an application mark for referring to VAT as an indirect tax. They then go on to explain about direct taxes and reference income tax from Figure 1. They are missing a final knowledge/analysis mark. It is worth remembering that in a question like this there will be 3 marks for knowledge/analysis and 2 marks for application. This answer achieves full marks. They start by stating that direct taxes are on income then give the example of income tax. Secondly, they say that indirect taxes are on expenditure and give the example of VAT. Finally, they say that direct taxes are often progressive for the final K/An mark. Look at how short and concise this answer is, yet it answers the question very clearly and so gets full marks.
Notes from the mark scheme and report
direct taxes on income and profit paid straight to government (income tax 41%, corporation tax 6%), indirect taxes on spending passed on via sellers (VAT 36%, petrol and tobacco duty)
must cover both types
3 marks K/An and 2 application
Quantitative skills: QS 9 (interpret, apply and analyse information in written, graphical tabular and numerical forms)
June 2025 · Paper 2 · Q6(c)10 marksAO1=2, AO2=2, AO3=2, AO4=410-mark response
Data and extracts for question 6
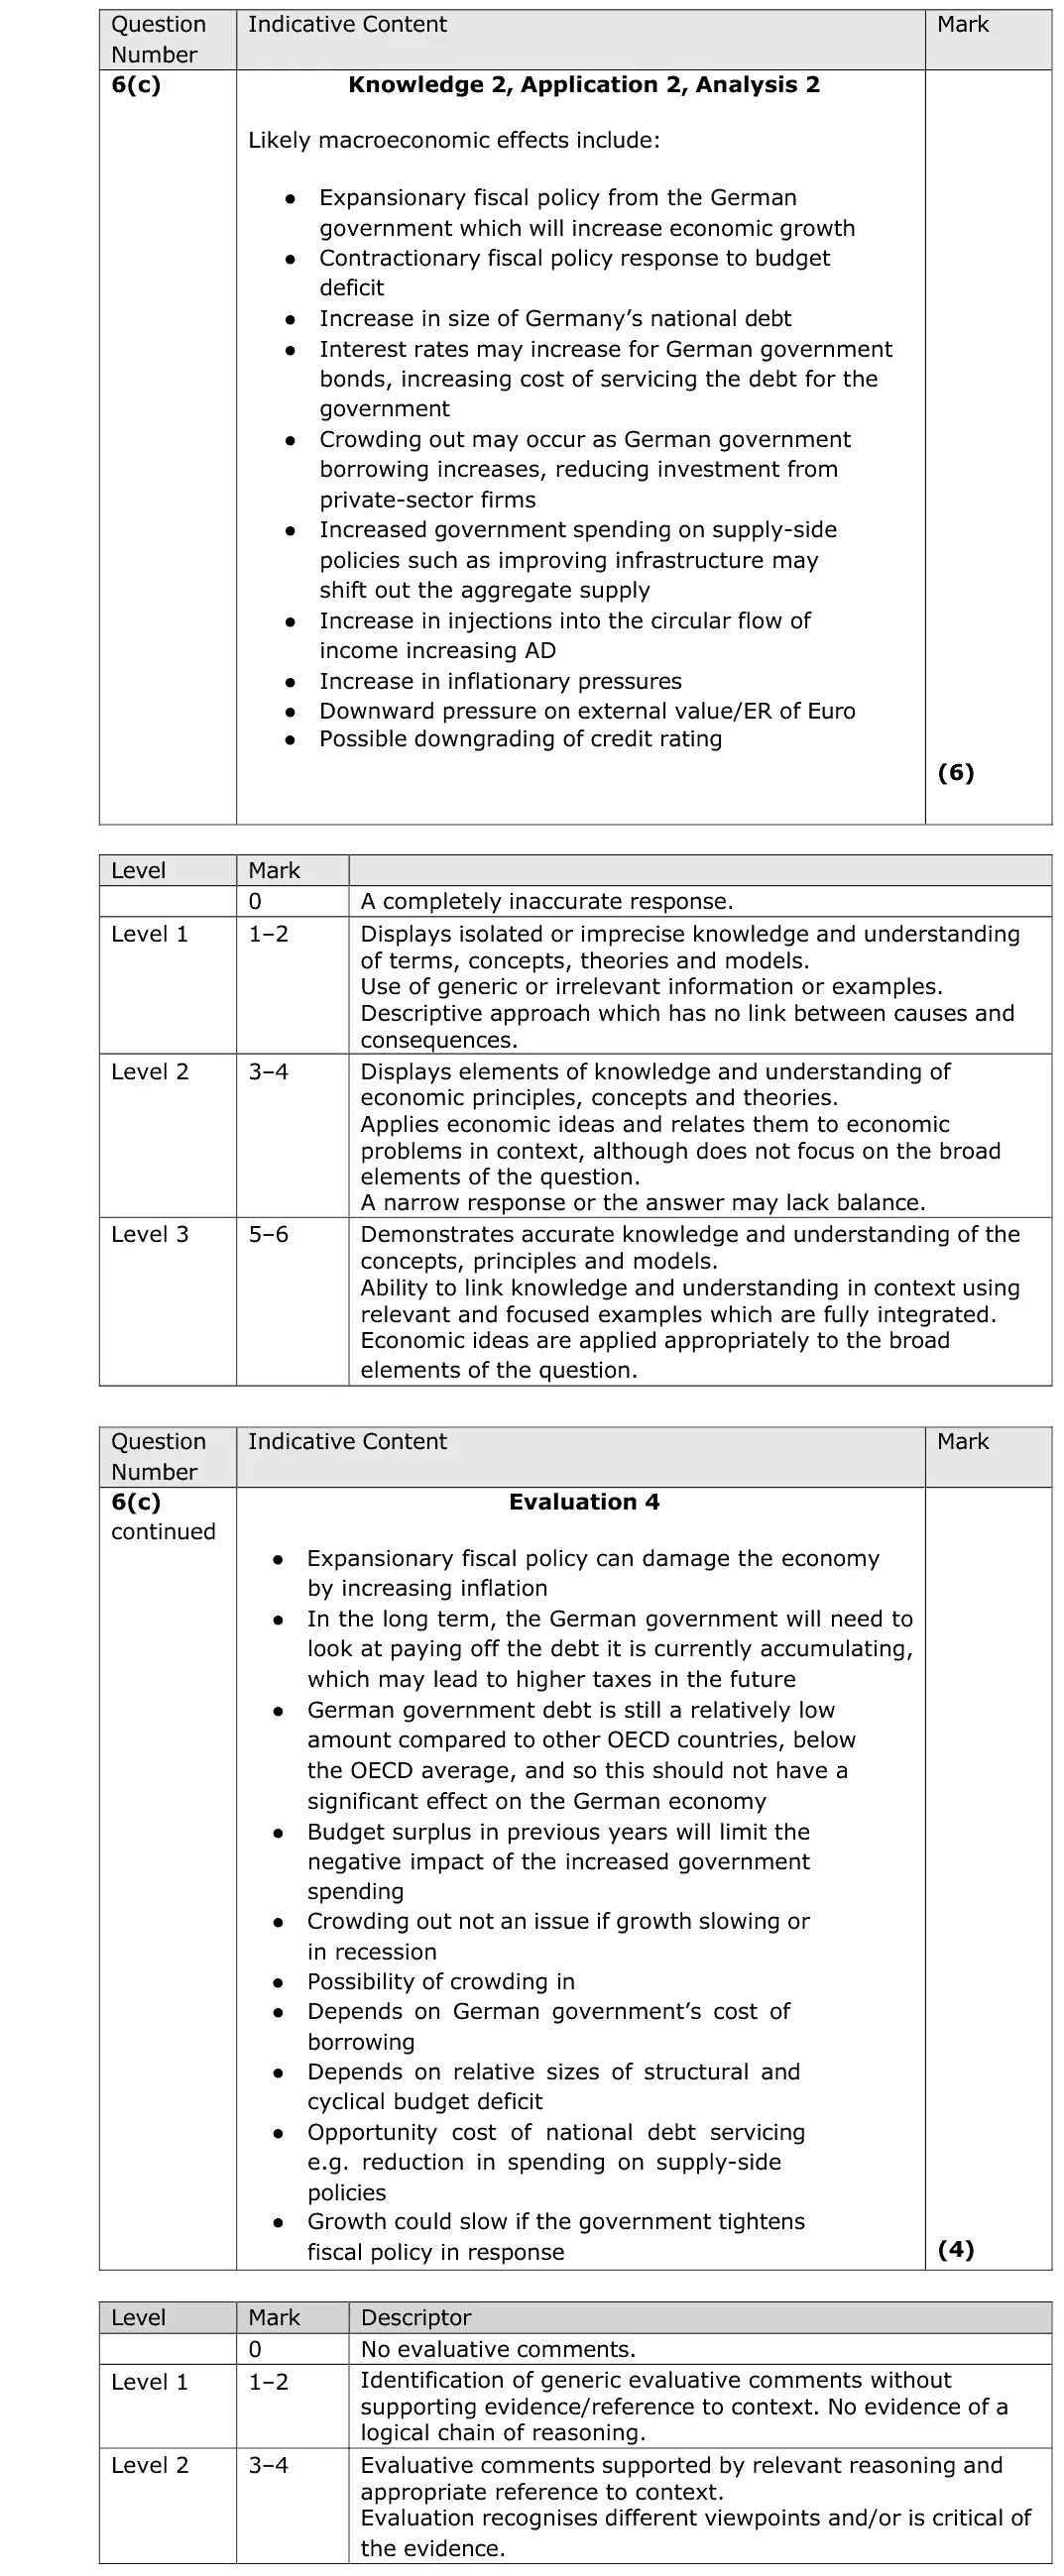
Mark scheme, including the levels grid and indicative content
Examiner's comment
In this question, candidates needed to discuss the effects of the German government’s budget deficit. The question is in plural so examiners were looking for more than one effect to be discussed. This question was marked using a Levels-based mark scheme, which is the same for any 10-mark question across the Economics A exams. The focus when examiners are marking is on the answer as a whole and what level the answer best fits into. In this particular question, some candidates focused more on the immediate term and the fact that the government is running a deficit means that there will be more injections than withdrawals into the circular flow of income, thus increasing aggregate demand. Others took the view that this budget deficit may need to be paid back in the future which could mean contractionary policies. Either approach is acceptable in answering this question. This answer is a fairly limited response. Overall, it is low Level 2 for KAA and low Level 1 for evaluation. In the first paragraph the candidate has simply said that it will create debt with nothing to explain why this is an issue or what the 'problems' they mention might be. There is some better development in the second paragraph about less spending on education and healthcare but it isn’t clearly explained why this might occur as a result of a budget deficit. There is a very brief piece of evaluation right at the end of the answer. Focus on developing fully each of the points you make. Start off a paragraph by identifying a specific point in answer to the question and then think how you can explain that point step- by-step in a way that clearly answers the question set. This is an excellent quality answer that achieves full marks. There are clear chains of argument that explain the candidate’s reasoning along with well- developed evaluation. There is also good evaluation to make it relevant to Germany and the information provided in the case study. Notice that this is a relatively short answer to this question, Candidates should remember to focus on the quality of their answers, not the quantity.
Notes from the mark scheme and report
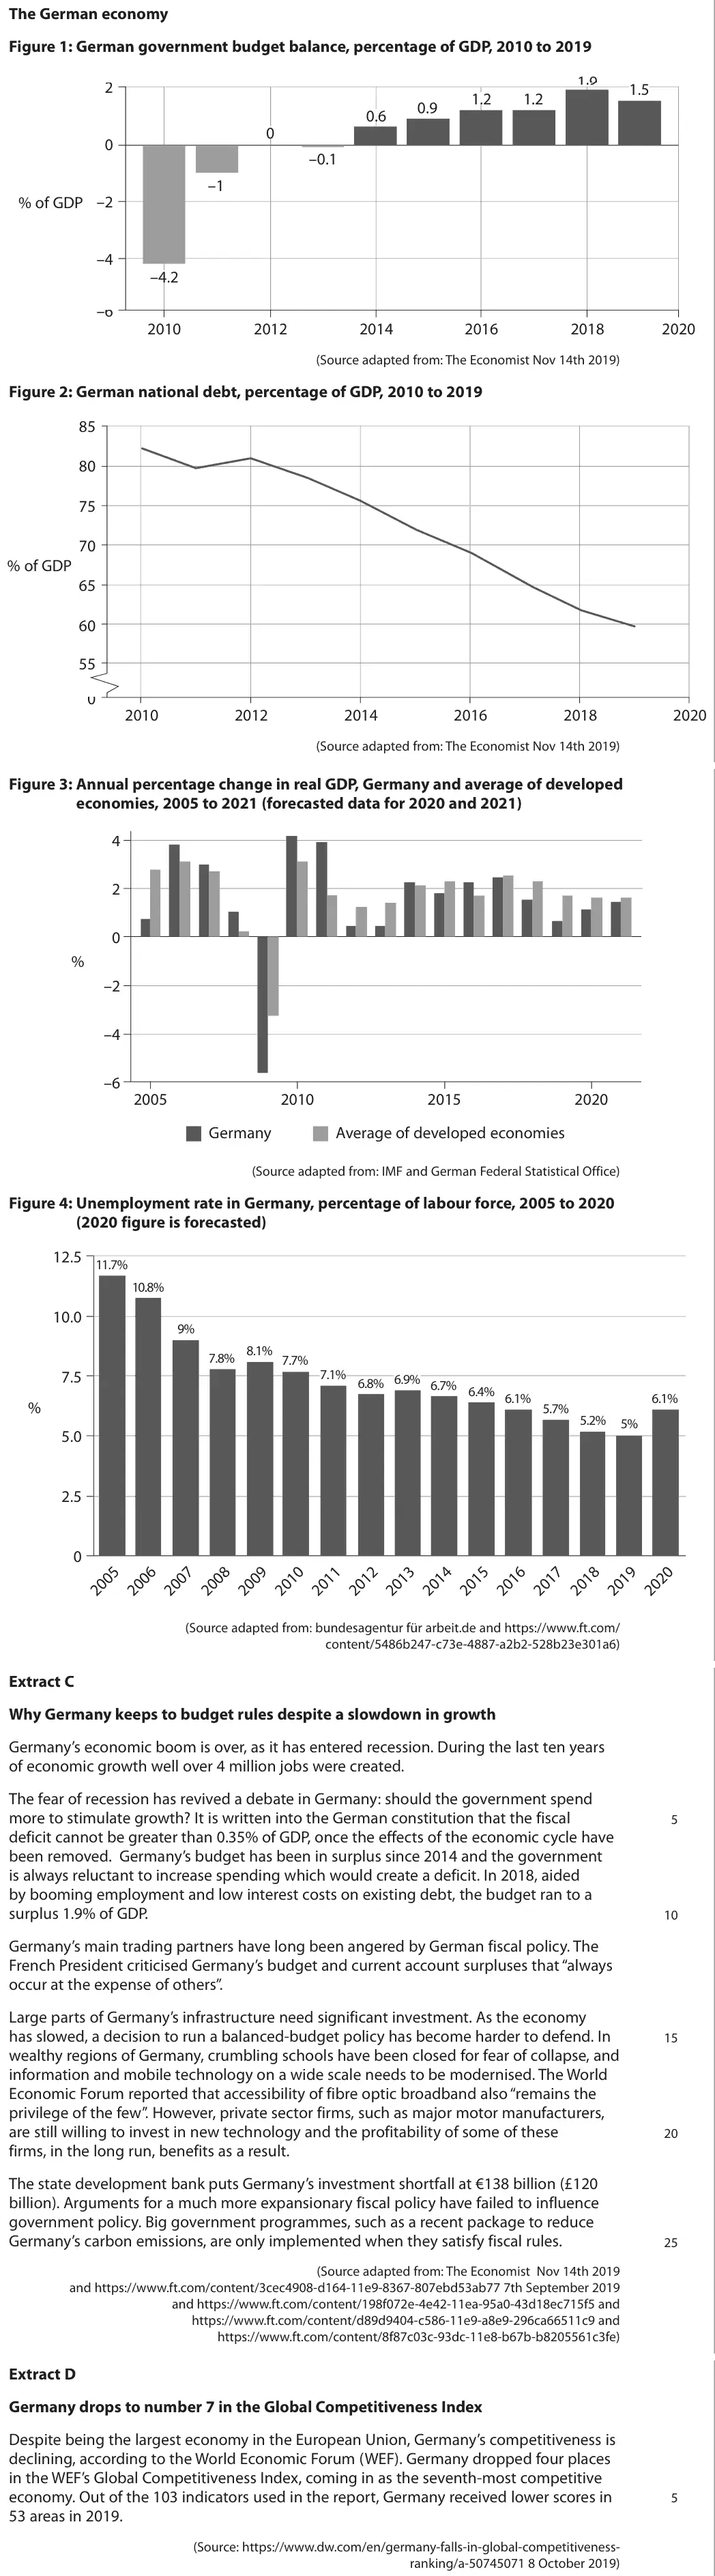
deficit of 4.3% (2020) to 2.6% (2022): injection raises AD, growth and employment via the multiplier
rising national debt, higher bond yields and debt interest, crowding out, future austerity
evaluate with size of deficit, recession in 2023, Germany's earlier surpluses
more than one effect needed
Quantitative skills: QS 9 (interpret, apply and analyse information in written, graphical tabular and numerical forms)
June 2024 · Paper 2 · Q6(a)5 marksAO1=2, AO2=2, AO3=1Short answer
Data and extracts for question 6
Mark scheme
Examiner's comment
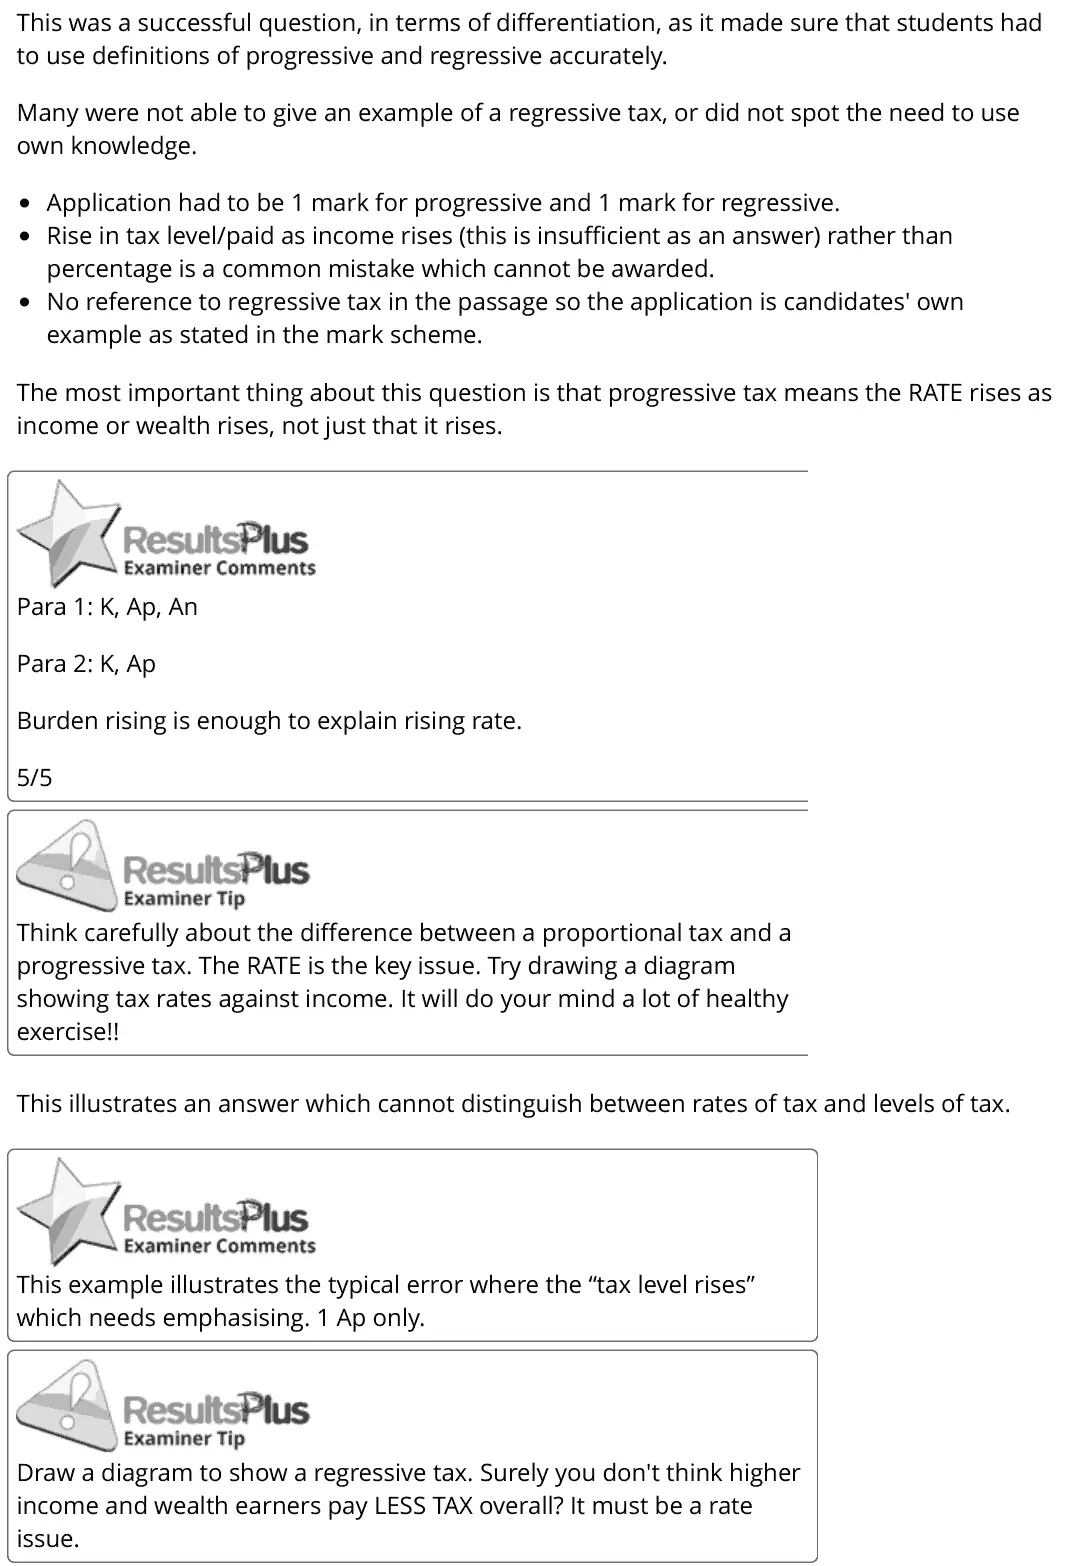
This was a successful question, in terms of differentiation, as it made sure that students had to use definitions of progressive and regressive accurately. Many were not able to give an example of a regressive tax, or did not spot the need to use own knowledge. Application had to be 1 mark for progressive and 1 mark for regressive. Rise in tax level/paid as income rises (this is insufficient as an answer) rather than percentage is a common mistake which cannot be awarded. No reference to regressive tax in the passage so the application is candidates' own example as stated in the mark scheme. The most important thing about this question is that progressive tax means the RATE rises as income or wealth rises, not just that it rises. Para 1: K, Ap, An Para 2: K, Ap Burden rising is enough to explain rising rate. 5/5 Think carefully about the difference between a proportional tax and a progressive tax. The RATE is the key issue. Try drawing a diagram showing tax rates against income. It will do your mind a lot of healthy exercise!! This illustrates an answer which cannot distinguish between rates of tax and levels of tax. This example illustrates the typical error where the “tax level rises” which needs emphasising. 1 Ap only. Draw a diagram to show a regressive tax. Surely you don't think higher income and wealth earners pay LESS TAX overall? It must be a rate issue.
Notes from the mark scheme and report
progressive: the RATE (proportion of income) paid rises as income rises, regressive: it falls
"pay more tax as income rises" is not enough
apply Figure 4 bands for progressive and own example (VAT, excise duties) for regressive
report: many could not give a regressive example
Quantitative skills: QS 9 (interpret, apply and analyse information in written, graphical tabular and numerical forms)
June 2024 · Paper 2 · Q6(b)8 marksAO1=2, AO2=2, AO3=2, AO4=28-mark response
Data and extracts for question 6
Mark scheme, including the levels grid and indicative content
Examiner's comment
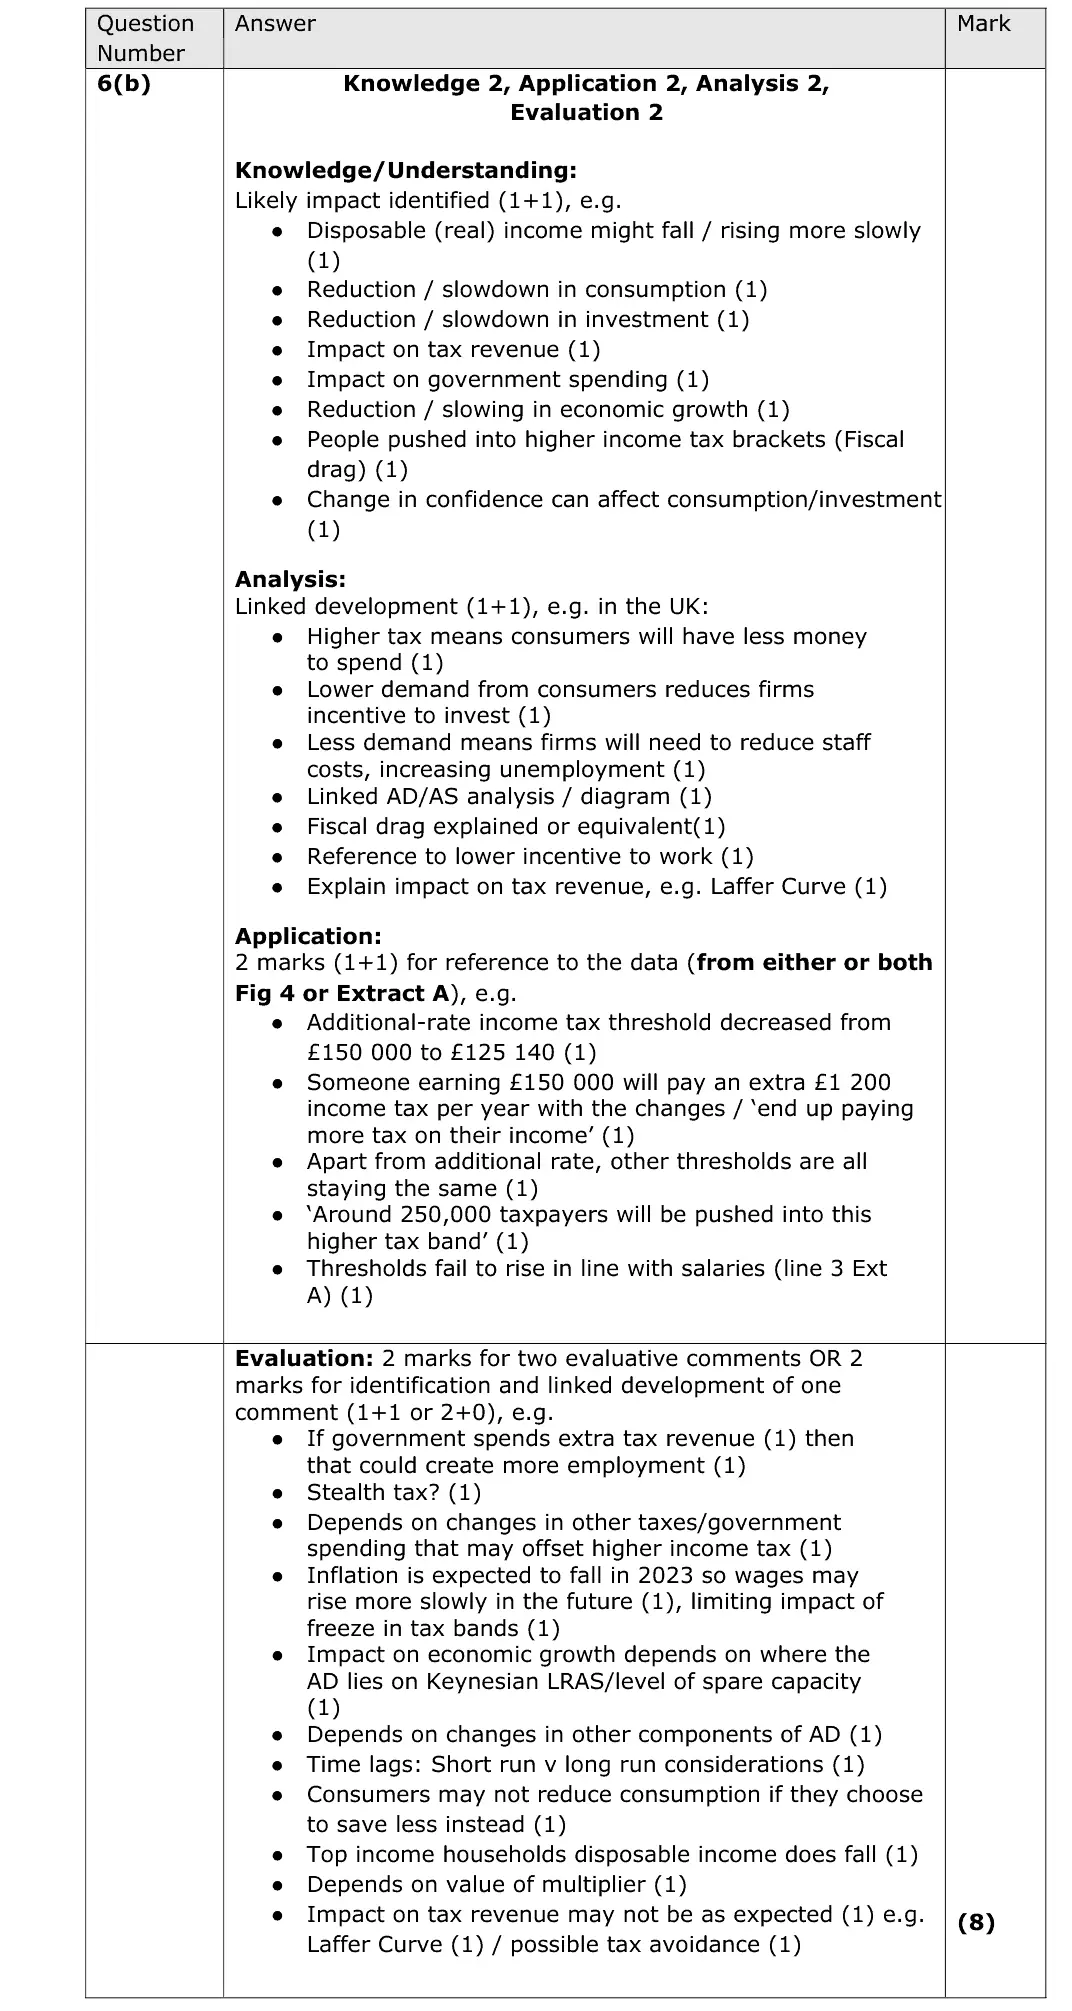
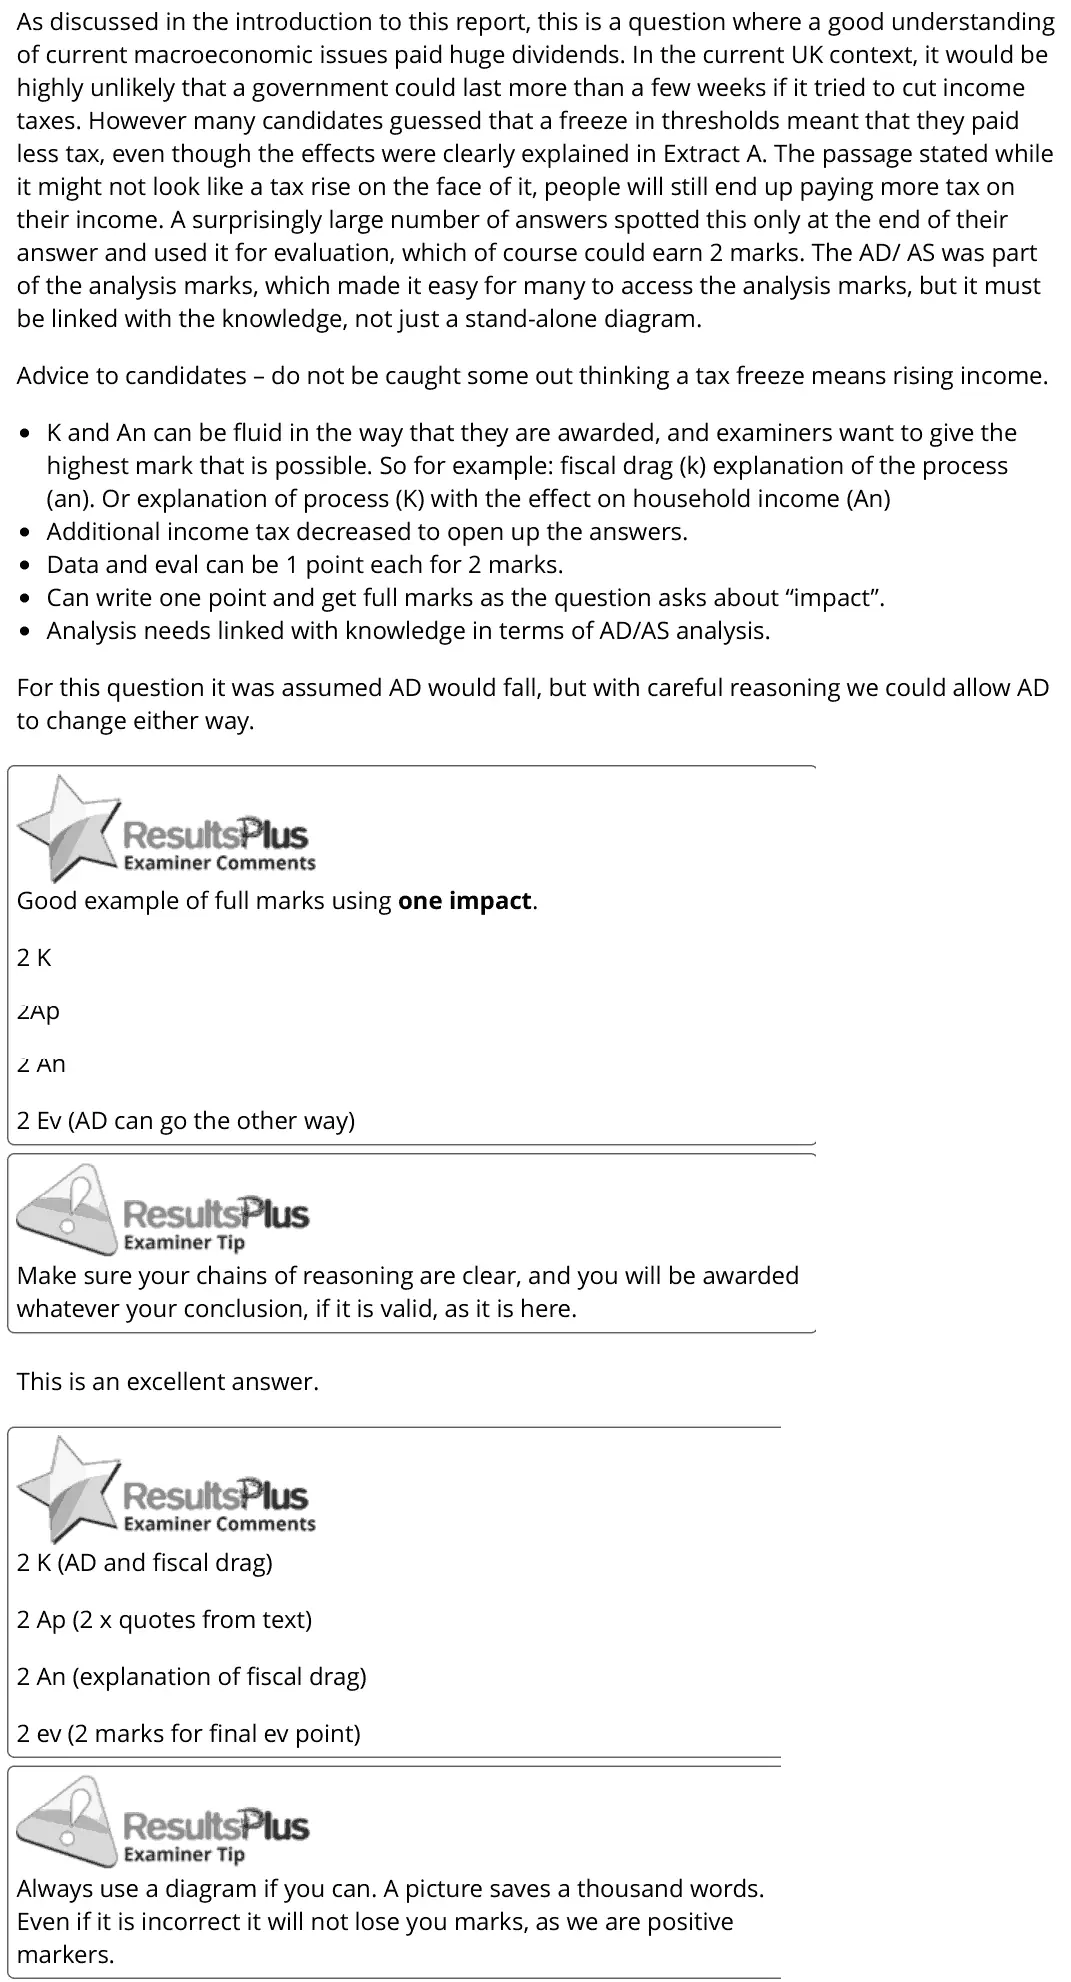
As discussed in the introduction to this report, this is a question where a good understanding of current macroeconomic issues paid huge dividends. In the current UK context, it would be highly unlikely that a government could last more than a few weeks if it tried to cut income taxes. However many candidates guessed that a freeze in thresholds meant that they paid less tax, even though the effects were clearly explained in Extract A. The passage stated while it might not look like a tax rise on the face of it, people will still end up paying more tax on their income. A surprisingly large number of answers spotted this only at the end of their answer and used it for evaluation, which of course could earn 2 marks. The AD/ AS was part of the analysis marks, which made it easy for many to access the analysis marks, but it must be linked with the knowledge, not just a stand-alone diagram. Advice to candidates – do not be caught some out thinking a tax freeze means rising income. K and An can be fluid in the way that they are awarded, and examiners want to give the highest mark that is possible. So for example: fiscal drag (k) explanation of the process (an). Or explanation of process (K) with the effect on household income (An) Additional income tax decreased to open up the answers. Data and eval can be 1 point each for 2 marks. Can write one point and get full marks as the question asks about “impact”. Analysis needs linked with knowledge in terms of AD/AS analysis. For this question it was assumed AD would fall, but with careful reasoning we could allow AD to change either way. Good example of full marks using one impact. 2 K 2Ap 2 An 2 Ev (AD can go the other way) Make sure your chains of reasoning are clear, and you will be awarded whatever your conclusion, if it is valid, as it is here. This is an excellent answer. 2 K (AD and fiscal drag) 2 Ap (2 x quotes from text) 2 An (explanation of fiscal drag) 2 ev (2 marks for final ev point) Always use a diagram if you can. A picture saves a thousand words. Even if it is incorrect it will not lose you marks, as we are positive markers.
Notes from the mark scheme and report
frozen thresholds mean fiscal drag: more income taxed and at higher bands, lower disposable income, consumption and AD
quote £150 000 to £125 140 and the extra £1 200
report: many wrongly assumed the freeze meant paying less tax
Quantitative skills: QS 9 (interpret, apply and analyse information in written, graphical tabular and numerical forms)
June 2024 · Paper 2 · Q6(c)10 marksAO1=2, AO2=2, AO3=2, AO4=410-mark response
Data and extracts for question 6
Mark scheme, including the levels grid and indicative content
Examiner's comment
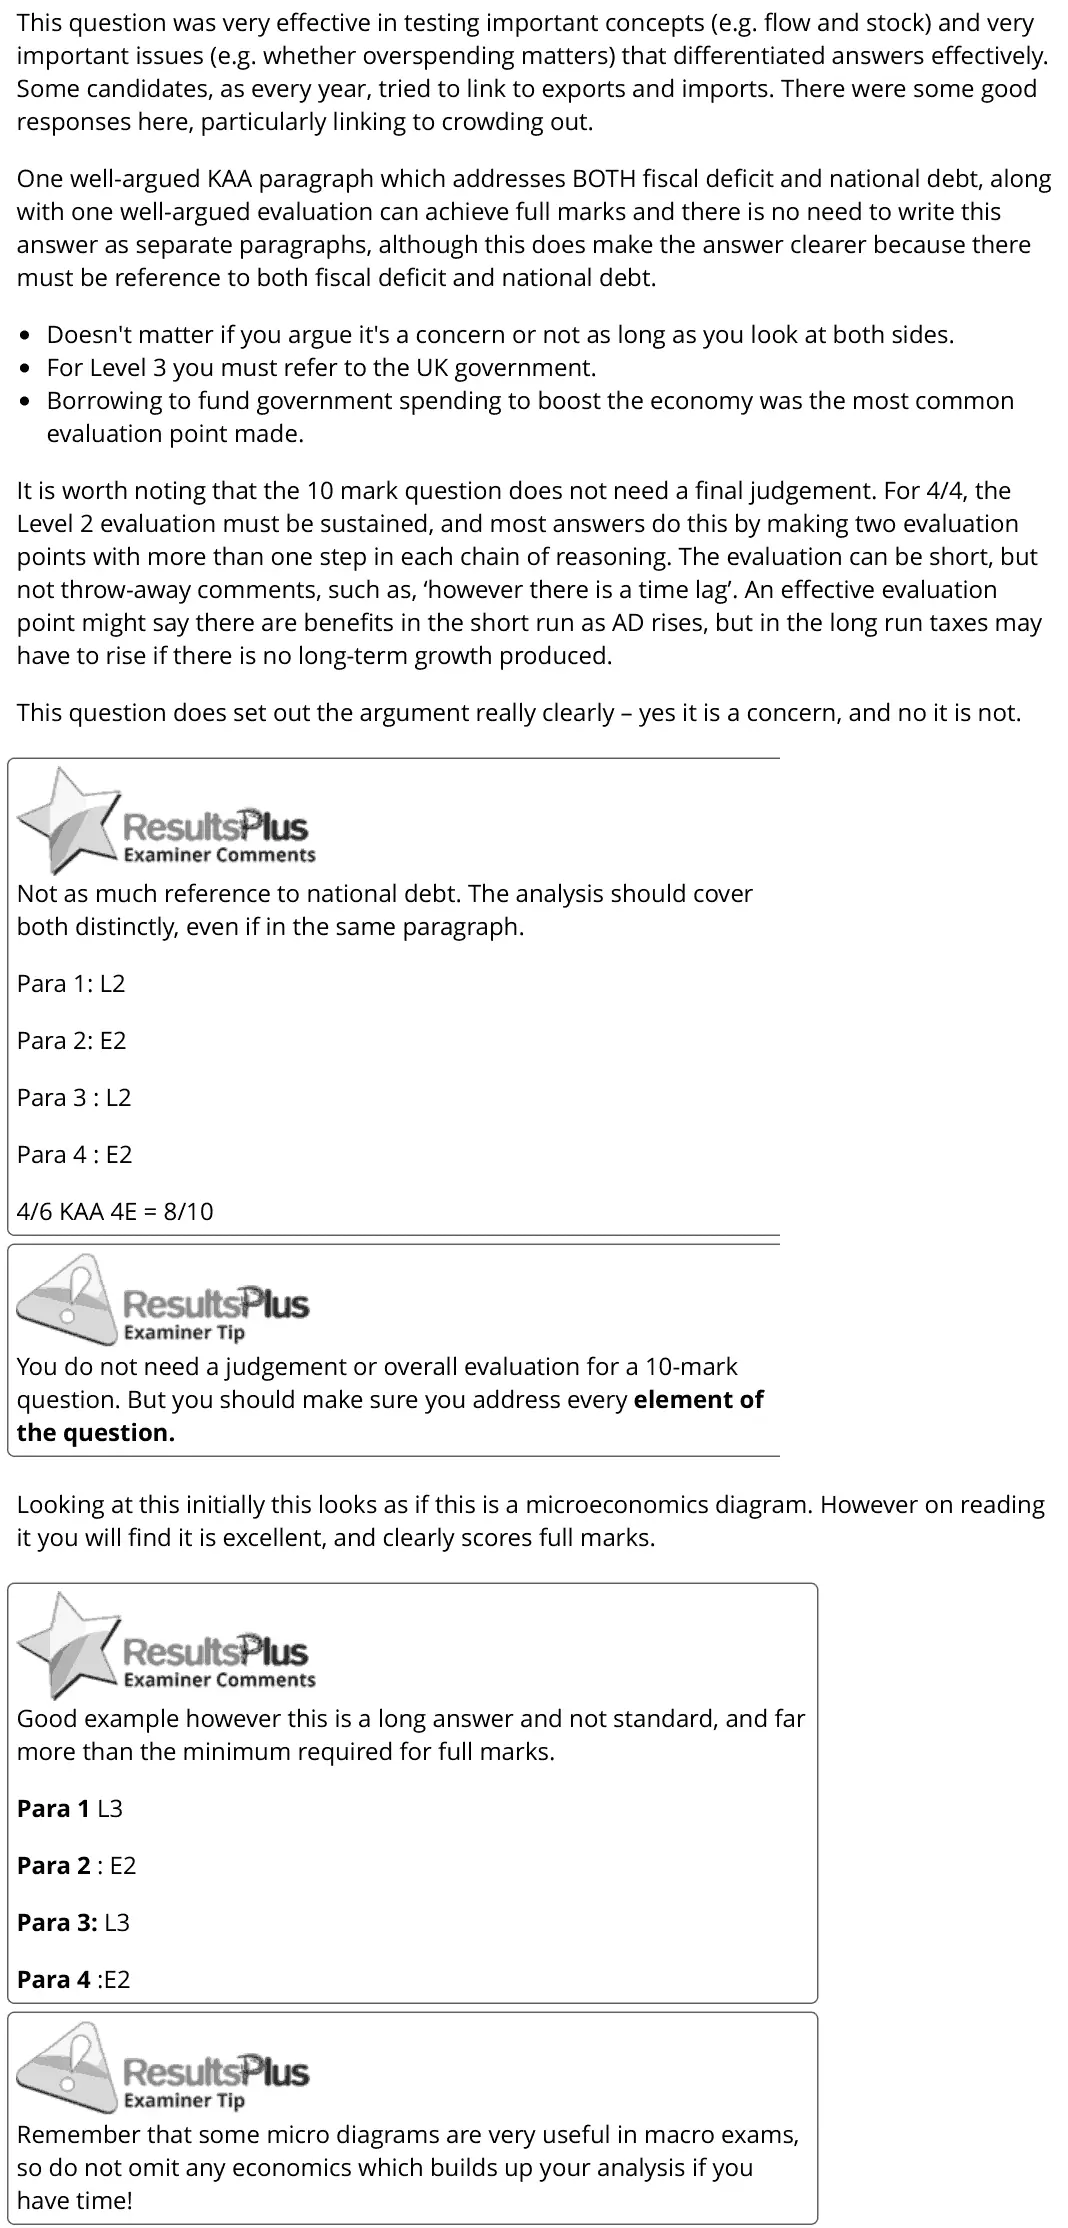
This question was very effective in testing important concepts (e.g. flow and stock) and very important issues (e.g. whether overspending matters) that differentiated answers effectively. Some candidates, as every year, tried to link to exports and imports. There were some good responses here, particularly linking to crowding out. One well-argued KAA paragraph which addresses BOTH fiscal deficit and national debt, along with one well-argued evaluation can achieve full marks and there is no need to write this answer as separate paragraphs, although this does make the answer clearer because there must be reference to both fiscal deficit and national debt. Doesn't matter if you argue it's a concern or not as long as you look at both sides. For Level 3 you must refer to the UK government. Borrowing to fund government spending to boost the economy was the most common evaluation point made. It is worth noting that the 10 mark question does not need a final judgement. For 4/4, the Level 2 evaluation must be sustained, and most answers do this by making two evaluation points with more than one step in each chain of reasoning. The evaluation can be short, but not throw-away comments, such as, ‘however there is a time lag’. An effective evaluation point might say there are benefits in the short run as AD rises, but in the long run taxes may have to rise if there is no long-term growth produced. This question does set out the argument really clearly – yes it is a concern, and no it is not. Not as much reference to national debt. The analysis should cover both distinctly, even if in the same paragraph. Para 1: L2 Para 2: E2 Para 3 : L2 Para 4 : E2 4/6 KAA 4E = 8/10 You do not need a judgement or overall evaluation for a 10-mark question. But you should make sure you address every element of the question. Looking at this initially this looks as if this is a microeconomics diagram. However on reading it you will find it is excellent, and clearly scores full marks. Good example however this is a long answer and not standard, and far more than the minimum required for full marks. Para 1 L3 Para 2 : E2 Para 3: L3 Para 4 :E2 Remember that some micro diagrams are very useful in macro exams, so do not omit any economics which builds up your analysis if you have time!
Notes from the mark scheme and report
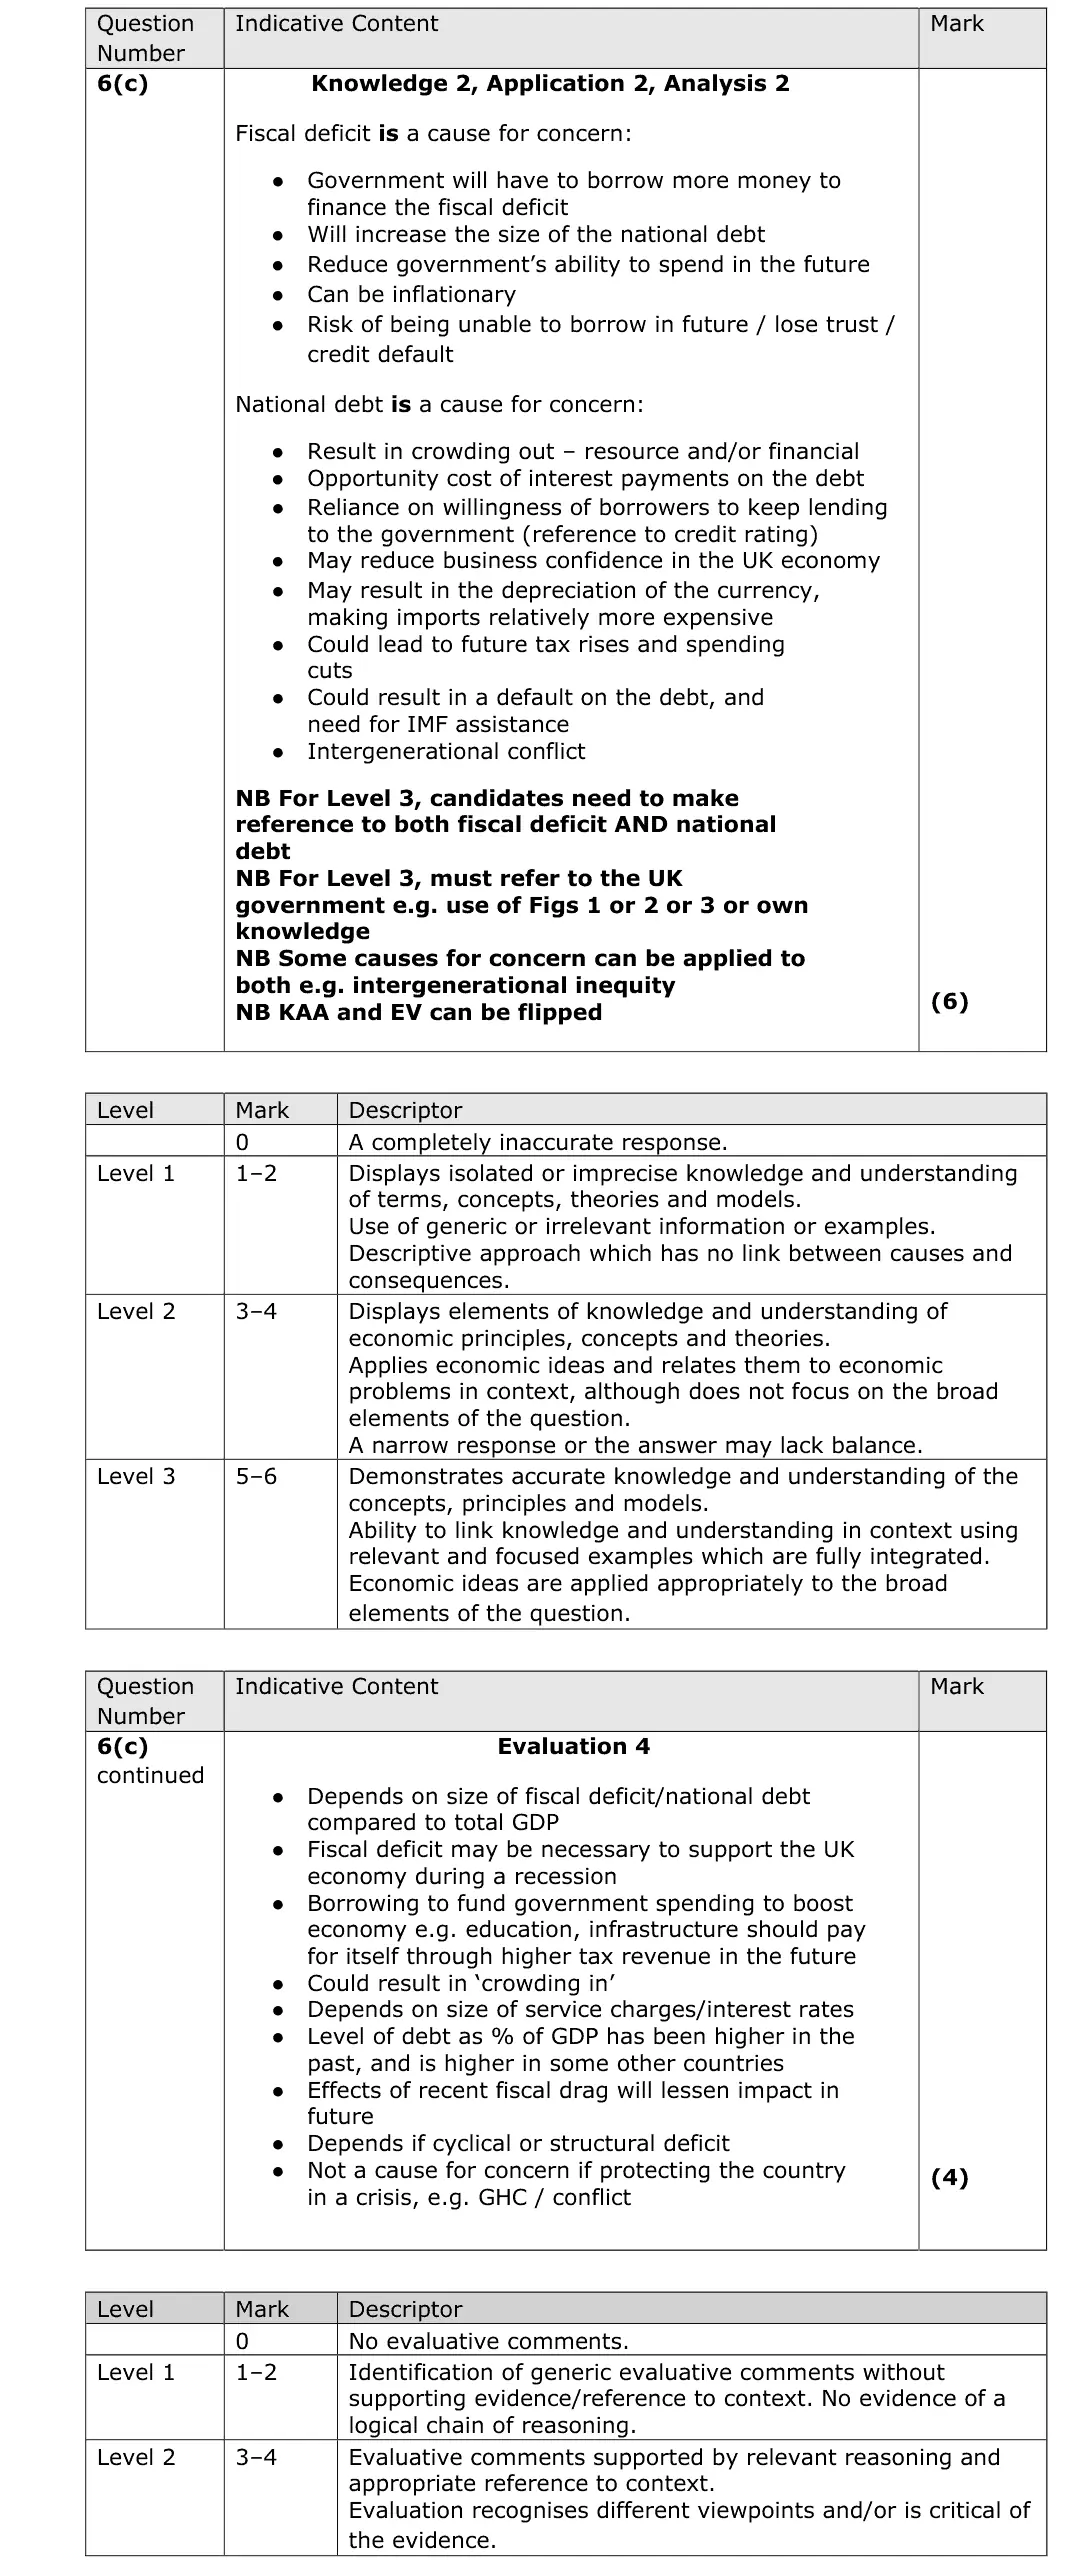
address BOTH the fiscal deficit (flow) and national debt (stock) for the UK
evaluate with borrowing for investment, low interest rates and debt as a % of GDP
Quantitative skills: QS 9 (interpret, apply and analyse information in written, graphical tabular and numerical forms)
June 2023 · Paper 2 · Q5(a)2 marksAO2=2Calculation
Data and extracts for question 5
Mark scheme
Examiner's comment
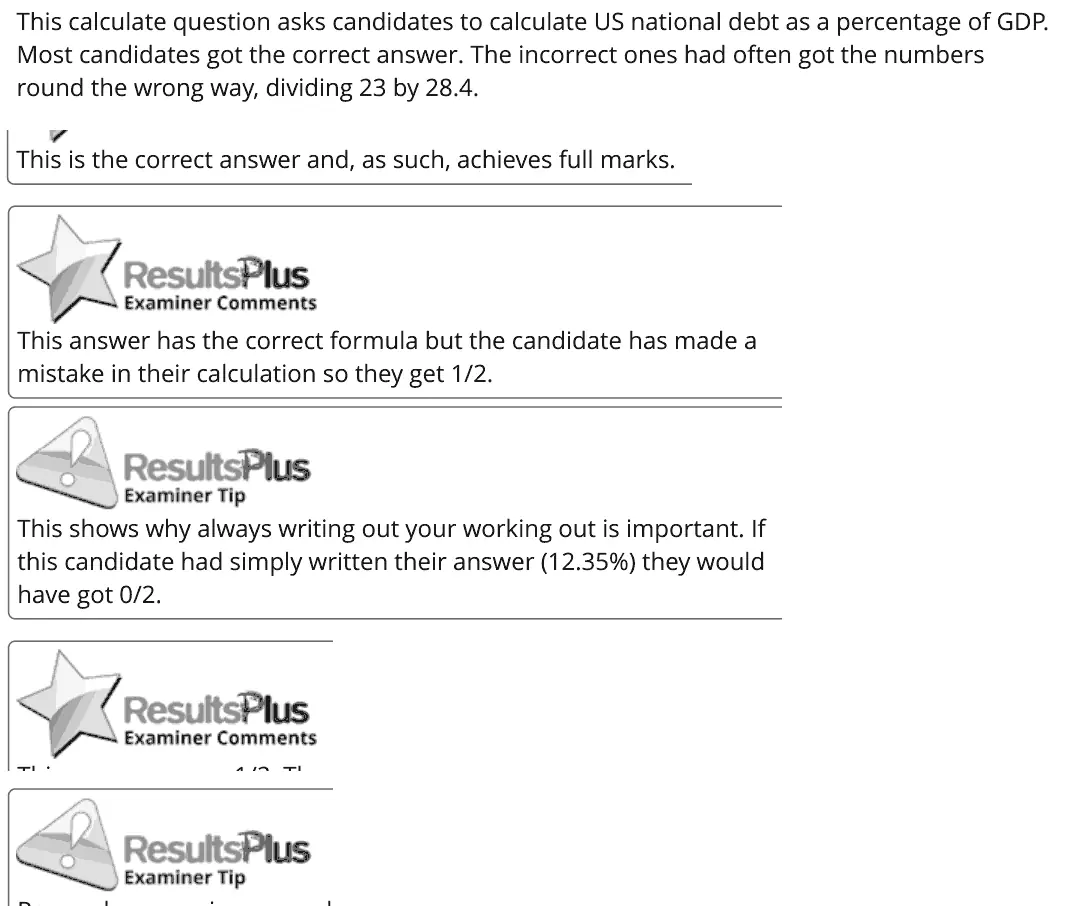
This calculate question asks candidates to calculate US national debt as a percentage of GDP. Most candidates got the correct answer. The incorrect ones had often got the numbers round the wrong way, dividing 23 by 28.4. This is the correct answer and, as such, achieves full marks. This answer has the correct formula but the candidate has made a mistake in their calculation so they get 1/2. This shows why always writing out your working out is important. If this candidate had simply written their answer (12.35%) they would have got 0/2.
Notes from the mark scheme and report
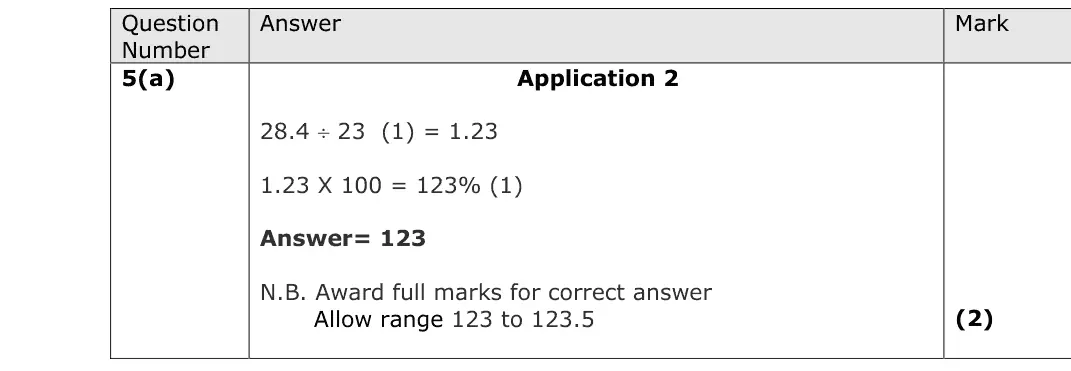
28.4 / 23 x 100 = 123%
common error dividing 23 by 28.4
Quantitative skills: QS 1 (calculate, use and understand ratios and fractions); QS 2 (calculate, use and understand percentages, percentage changes and percentage point changes)
June 2023 · Paper 2 · Q5(b)2 marksAO1=2Short answer
Data and extracts for question 5
Mark scheme
Examiner's comment
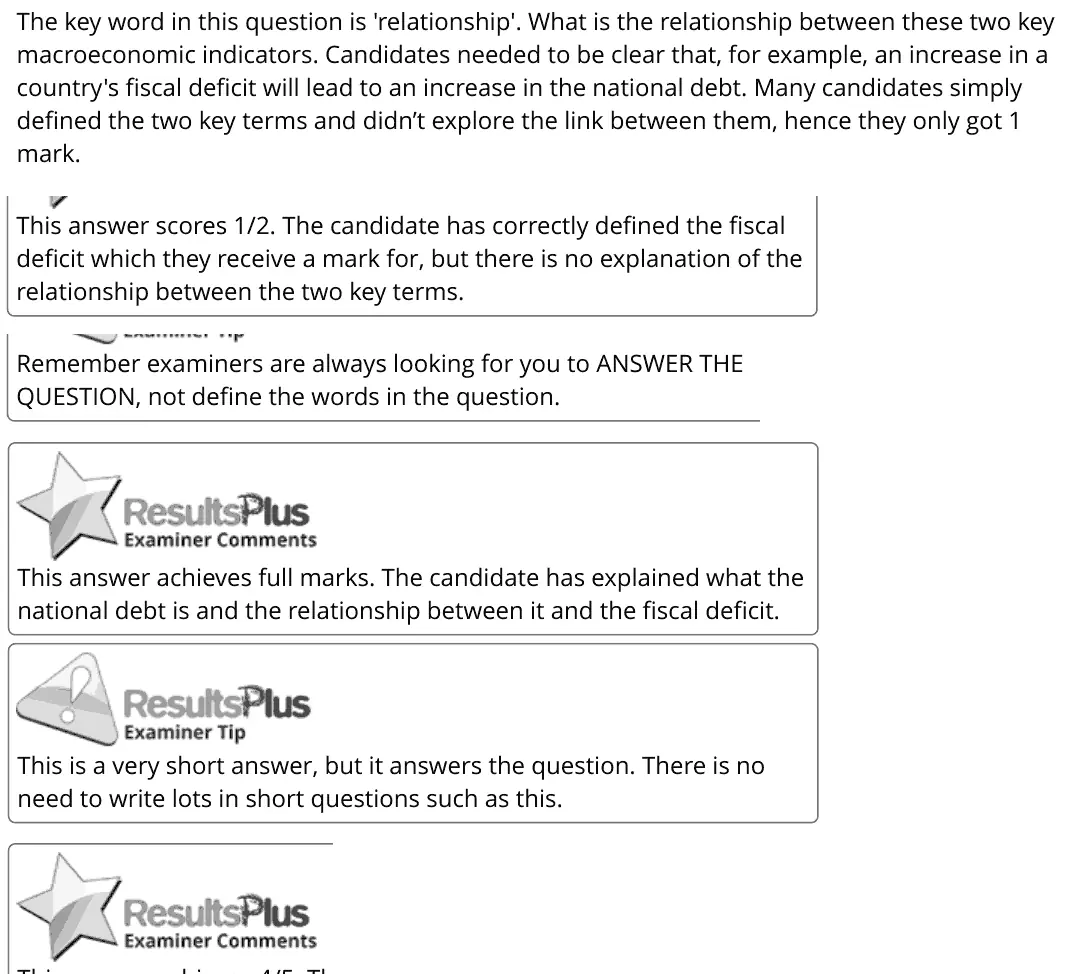
The key word in this question is 'relationship'. What is the relationship between these two key macroeconomic indicators. Candidates needed to be clear that, for example, an increase in a country's fiscal deficit will lead to an increase in the national debt. Many candidates simply defined the two key terms and didn’t explore the link between them, hence they only got 1 mark. This answer scores 1/2. The candidate has correctly defined the fiscal deficit which they receive a mark for, but there is no explanation of the relationship between the two key terms. Remember examiners are always looking for you to ANSWER THE QUESTION, not define the words in the question. This answer achieves full marks. The candidate has explained what the national debt is and the relationship between it and the fiscal deficit. This is a very short answer, but it answers the question. There is no need to write lots in short questions such as this.
Notes from the mark scheme and report
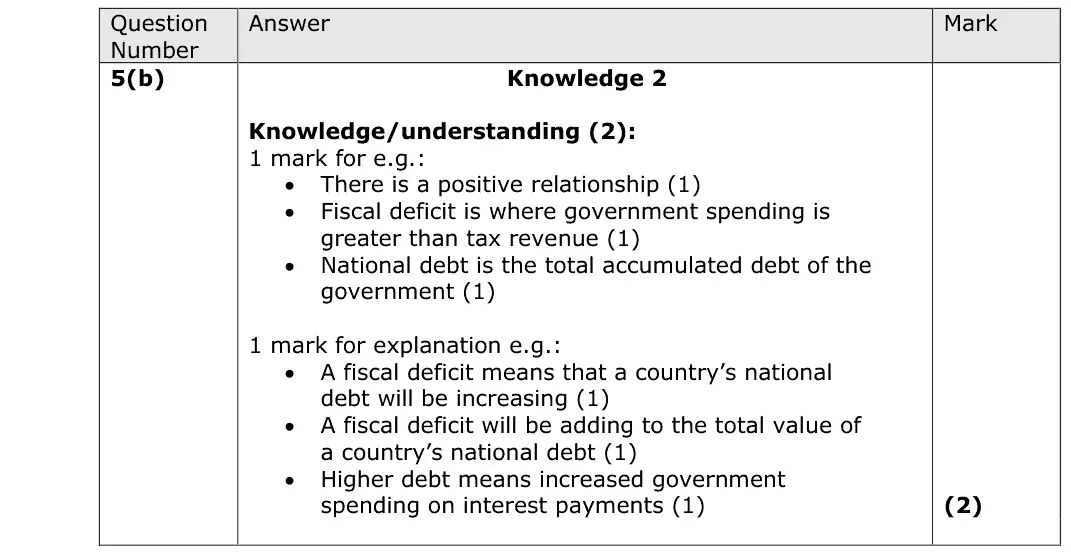
a fiscal deficit (spending > tax revenue) adds to the national debt (accumulated borrowing)
many only defined the terms and got 1 mark
June 2023 · Paper 2 · Q5(c)1 markMultiple choice
Data and extracts for question 5
Answer
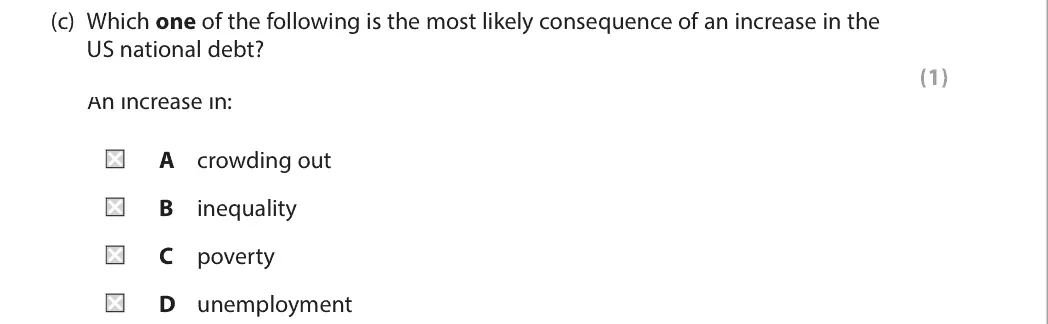
A
Mark scheme
Notes from the mark scheme and report
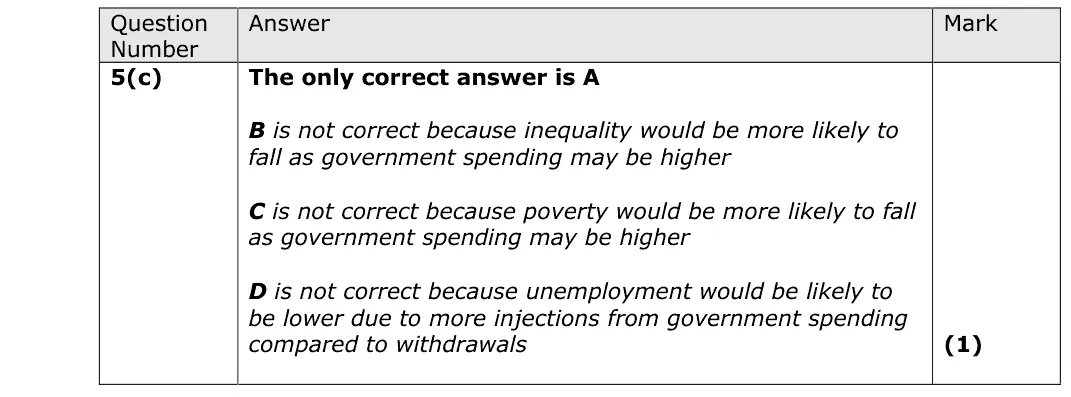
more government borrowing raises interest rates and reduces private investment = crowding out (A)
higher government spending would more likely reduce inequality, poverty and unemployment
June 2023 · Paper 3 · Q1(e)25 marksAO1=4, AO2=4, AO3=8, AO4=925-mark essayEither/or
Data and extracts for question 1
Mark scheme, including the levels grid and indicative content
Examiner's comment
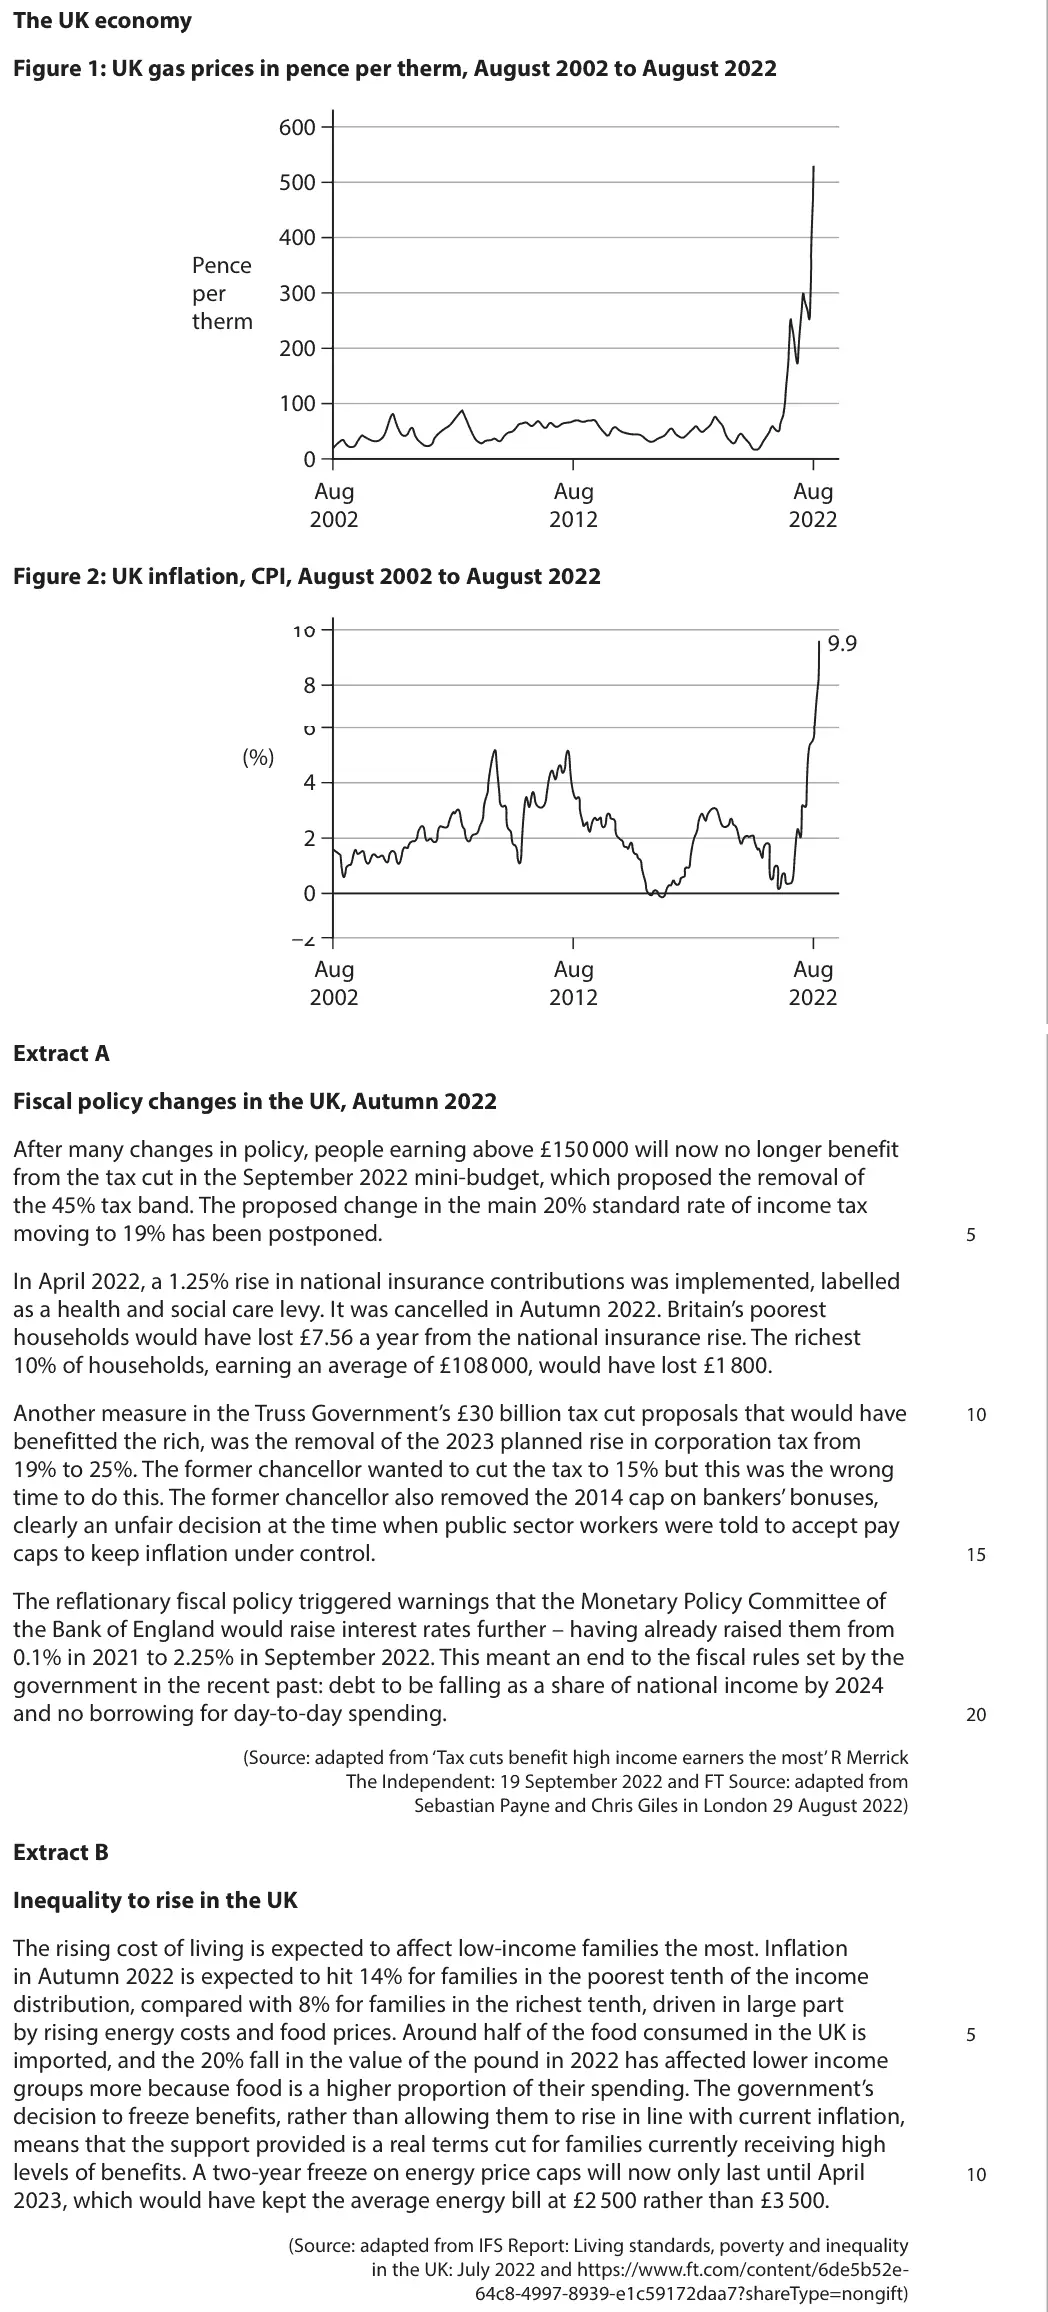
This was a very relevant set of data, and the context could not have been more up to date. The main problem was the change in corporation tax that was mentioned in the passage, and some answers used this in relation to a shift in the cost curves. Of course, corporation tax is post-profit and some answers therefore became off track in their chain of reasoning. In general this question was far more effectively answered, with a mean of 17.74 rather than 16.46 for question 1d. It was also far more popular in a ratio of 4:1 (the split on 2d and e was 1:1). Candidates do find it easier to talk about effects rather than causes or policies, but this is probably because the diagrams are easier to link to each type of tax. The most common micro effect was the potential cut in the top rate of income tax and/or the 19% standard rate, and diagrams showing increases in demand/consumer surplus were common. It was also very common to see the discussion of corporation tax that was in Extract A, and the evaluation was often using the passage to show why at the time this was inadvisable. Many answers used the removal of the cap in bankers’ bonuses, although it was difficult to see why this was a tax. The rise in NICs was used by many although it was not clear that many people could understand the ‘levy’ was a rise in tax rather than the fall in tax asked for in the question. Some were effective in saying that the decision to use the tax was reversed, and the mark scheme allowed for this as a tax cut, although effectively it was not a rise in a tax because it was removed before it was implemented. One of the most effective ways to evaluate on this question was to use the context of the UK today. Since the fiasco described in the passage, inflation rose to over 10% in the UK and there is clearly a link between the fiscal stance and the rate of inflation. Many also discussed that the MPC raised the interest rate even further than the 2.25% mentioned in the passage, and those who showed current knowledge of the macroeconomic position were well rewarded.
Notes from the mark scheme and report
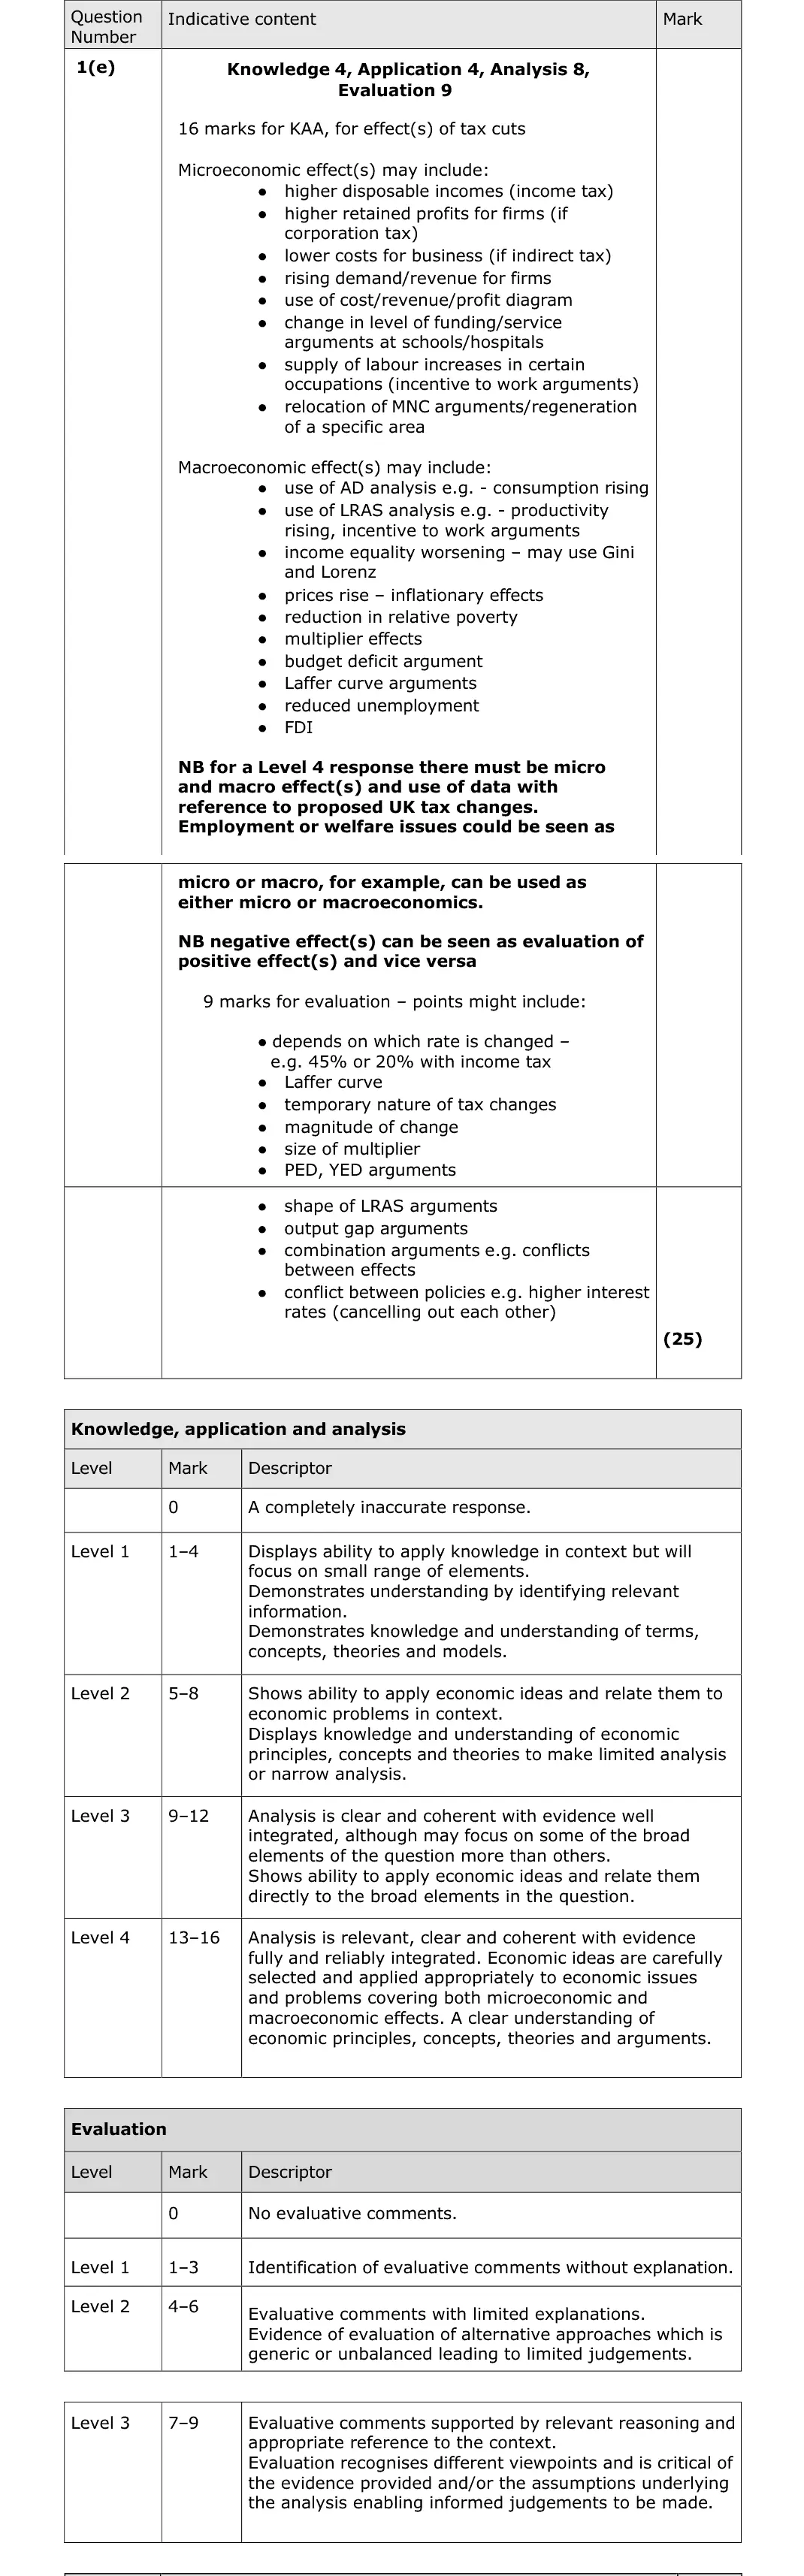
Level 4 needs micro and macro effects and use of the proposed UK tax changes in Extract A
corporation tax is levied on profit so it does not shift cost curves
the national insurance levy was a tax rise
evaluate with Laffer curve, size of multiplier, inequality, conflict with higher interest rates
June 2022 · Paper 2 · Q4(b)4 marksAO1=3, AO2=1Short answerHard
Data and extracts for question 4
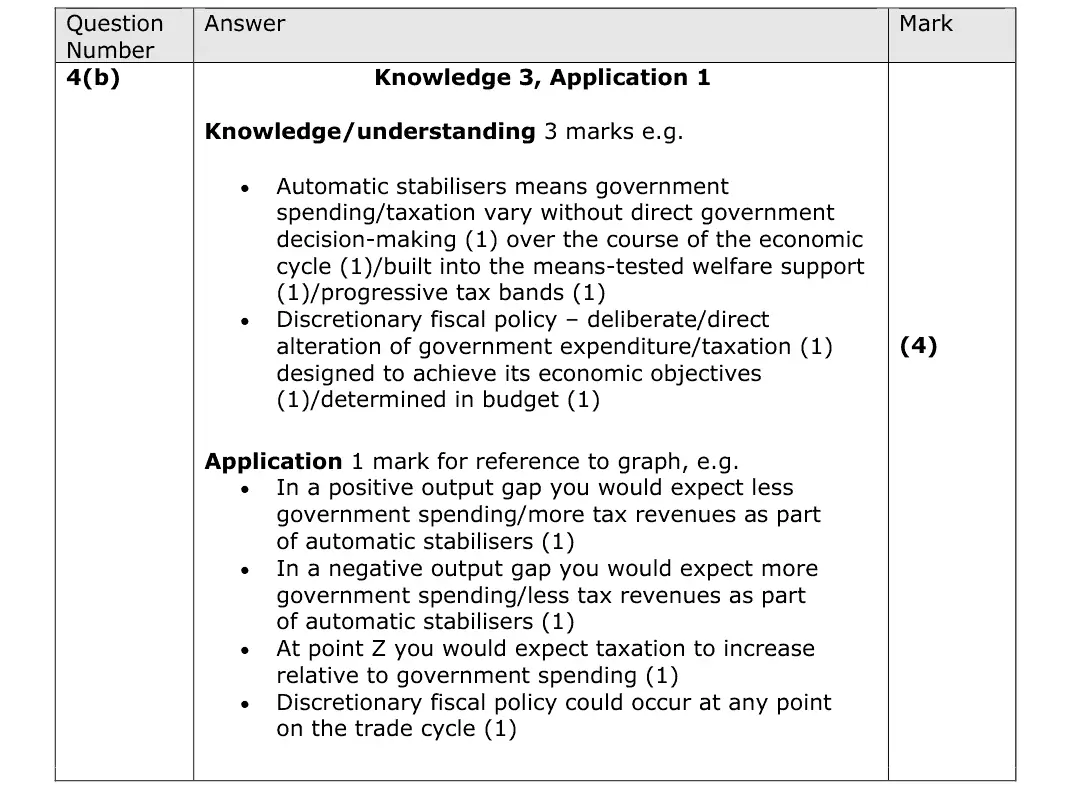
Mark scheme
Examiner's comment
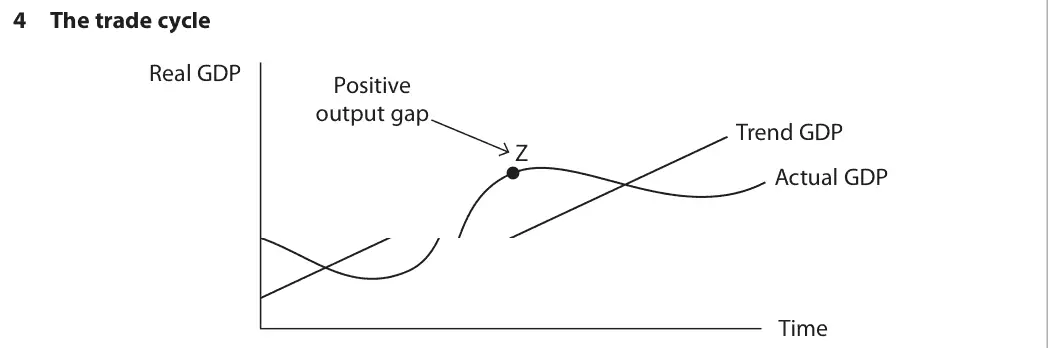
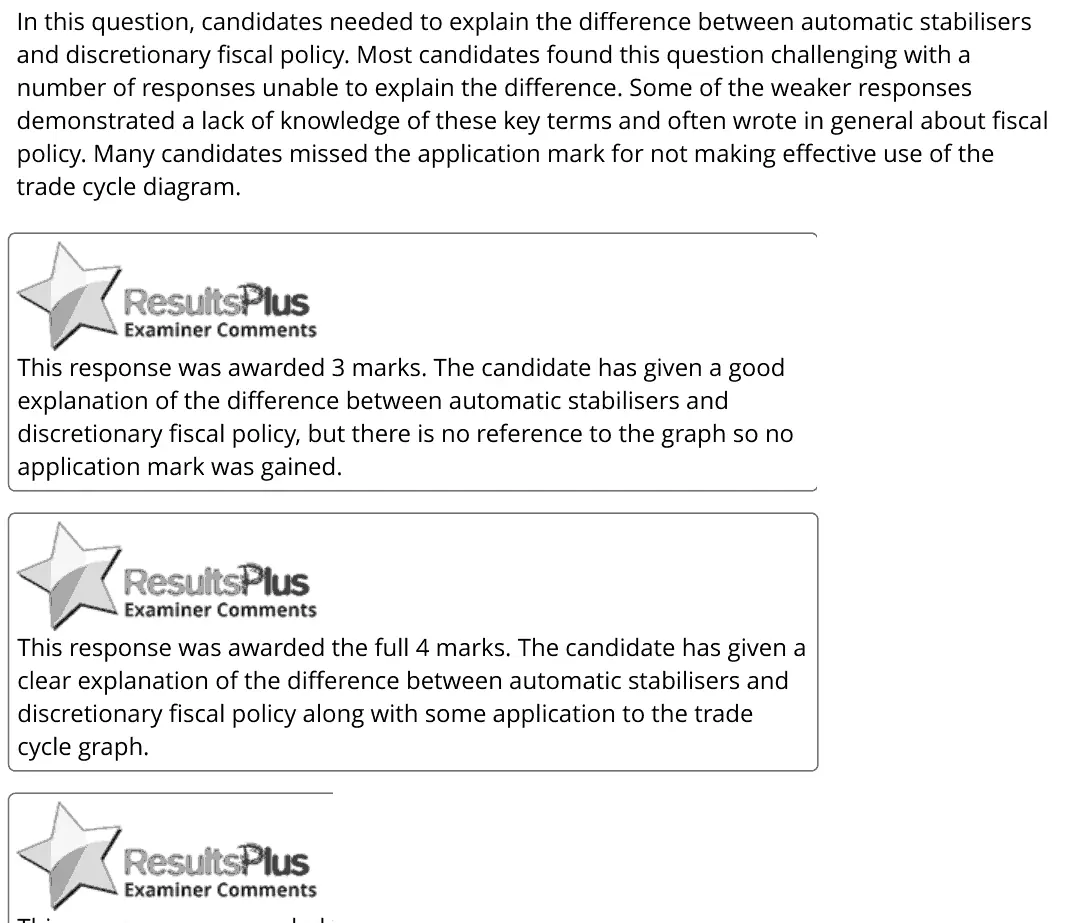
In this question, candidates needed to explain the difference between automatic stabilisers and discretionary fiscal policy. Most candidates found this question challenging with a number of responses unable to explain the difference. Some of the weaker responses demonstrated a lack of knowledge of these key terms and often wrote in general about fiscal policy. Many candidates missed the application mark for not making effective use of the trade cycle diagram. This response was awarded 3 marks. The candidate has given a good explanation of the difference between automatic stabilisers and discretionary fiscal policy, but there is no reference to the graph so no application mark was gained. This response was awarded the full 4 marks. The candidate has given a clear explanation of the difference between automatic stabilisers and discretionary fiscal policy along with some application to the trade cycle graph.
Notes from the mark scheme and report
automatic stabilisers vary without a government decision over the cycle (means-tested benefits, progressive tax)
discretionary policy is a deliberate change in spending or tax rates
application mark needs the graph (e.g. at Z tax revenue rises relative to spending)
report: "most candidates found this question challenging", many wrote generally about fiscal policy
June 2022 · Paper 2 · Q6(d)12 marksAO1=2, AO2=2, AO3=4, AO4=412-mark response
Data and extracts for question 6
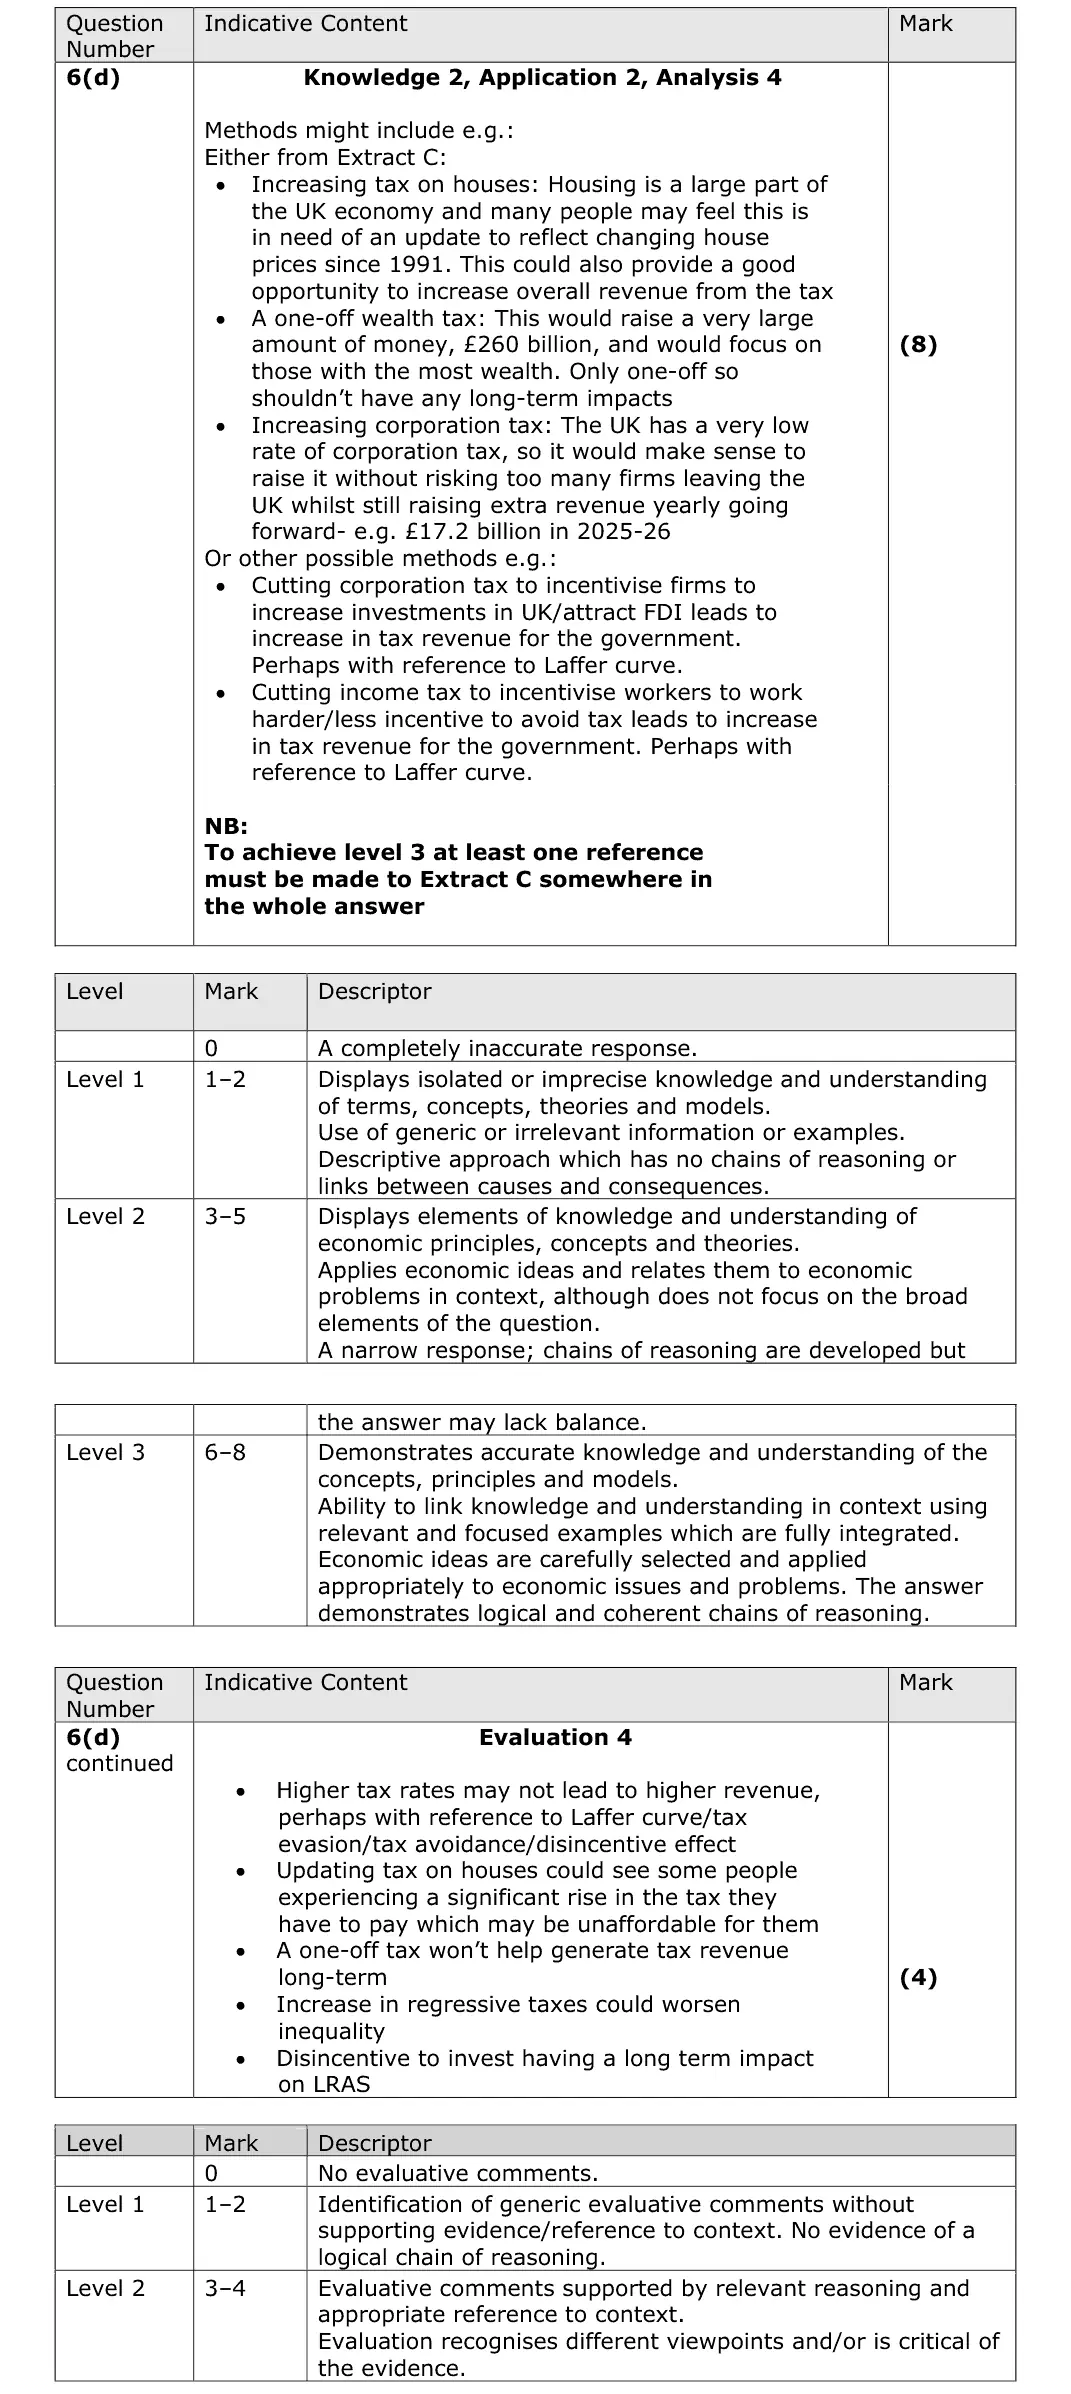
Mark scheme, including the levels grid and indicative content
Examiner's comment
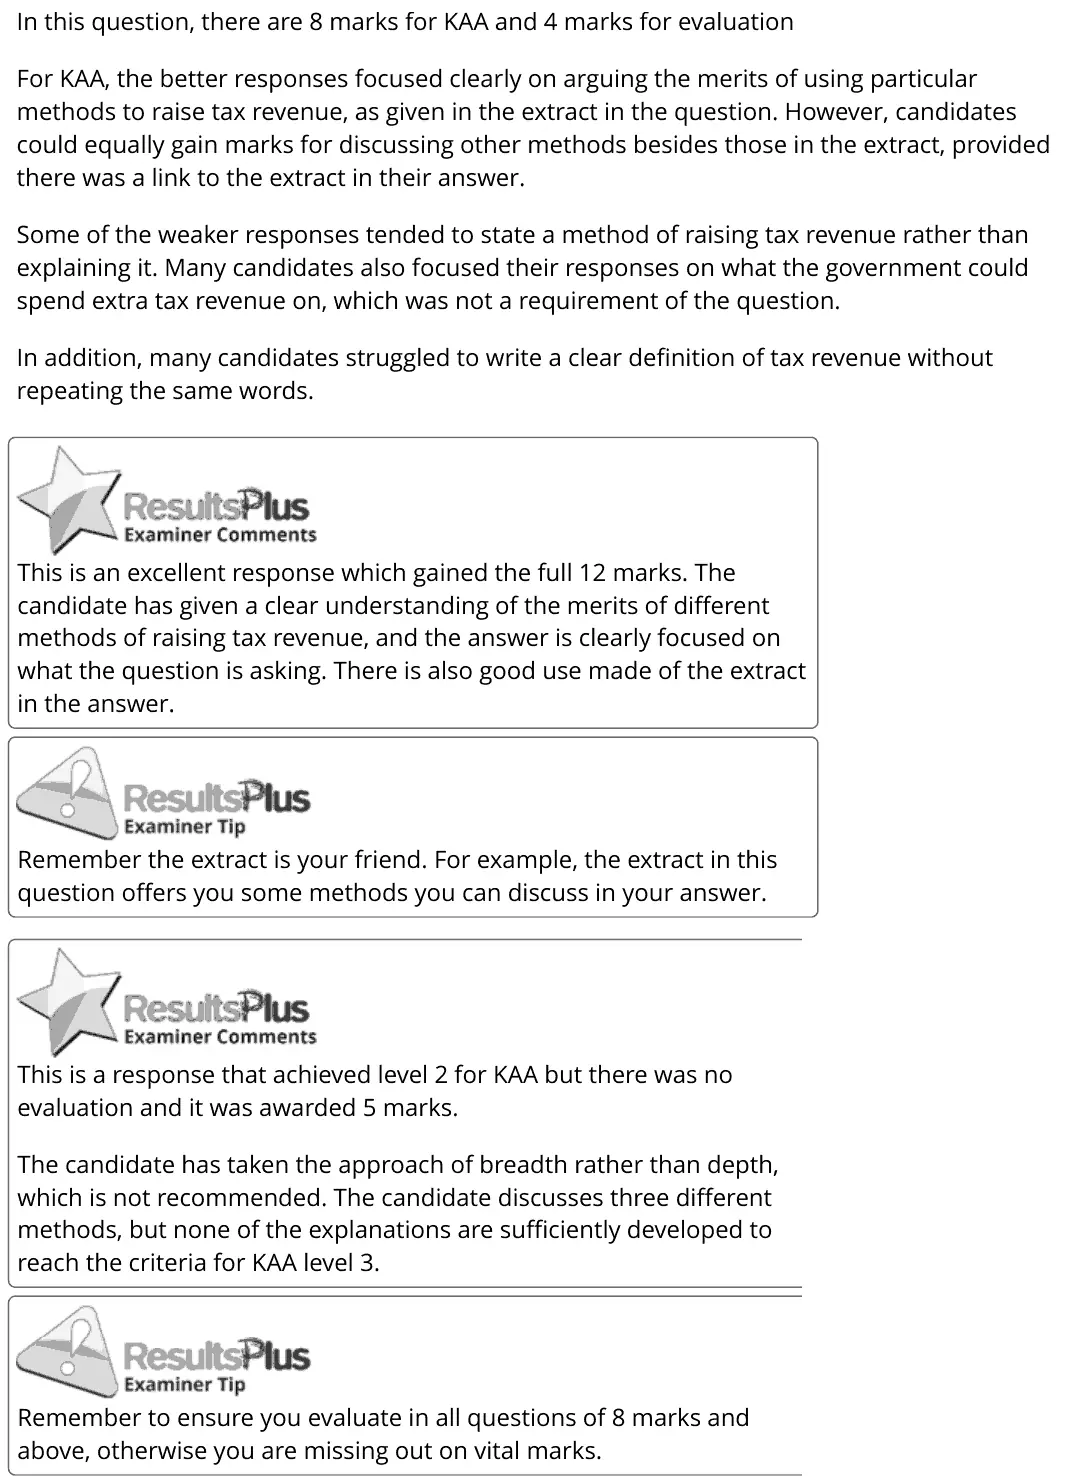
In this question, there are 8 marks for KAA and 4 marks for evaluation For KAA, the better responses focused clearly on arguing the merits of using particular methods to raise tax revenue, as given in the extract in the question. However, candidates could equally gain marks for discussing other methods besides those in the extract, provided there was a link to the extract in their answer. Some of the weaker responses tended to state a method of raising tax revenue rather than explaining it. Many candidates also focused their responses on what the government could spend extra tax revenue on, which was not a requirement of the question. In addition, many candidates struggled to write a clear definition of tax revenue without repeating the same words. This is an excellent response which gained the full 12 marks. The candidate has given a clear understanding of the merits of different methods of raising tax revenue, and the answer is clearly focused on what the question is asking. There is also good use made of the extract in the answer. Remember the extract is your friend. For example, the extract in this question offers you some methods you can discuss in your answer. This is a response that achieved level 2 for KAA but there was no evaluation and it was awarded 5 marks. The candidate has taken the approach of breadth rather than depth, which is not recommended. The candidate discusses three different methods, but none of the explanations are sufficiently developed to reach the criteria for KAA level 3. Remember to ensure you evaluate in all questions of 8 marks and above, otherwise you are missing out on vital marks.
Notes from the mark scheme and report
Level 3 needs at least one reference to Extract C (council tax revaluation, one-off wealth tax raising £260 billion, corporation tax to 25%)
lower tax rates may raise revenue (Laffer curve)
evaluate with avoidance, evasion, regressive effects, disincentives
do not discuss what the revenue would be spent on
November 2021 · Paper 2 · Q1(c)2 marksAO1=1, AO3=1Short answer
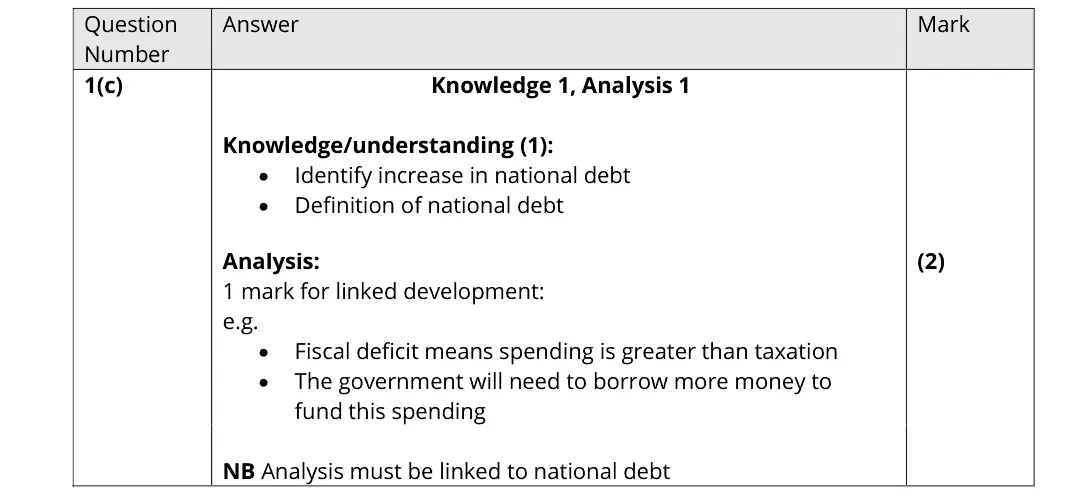
Data and extracts for question 1
Mark scheme
Notes from the mark scheme and report
annual deficits add to the national debt: spending exceeds tax revenue so the government borrows
the analysis must be linked to the debt
November 2021 · Paper 2 · Q4(b)1 markMultiple choice
Data and extracts for question 4
Answer
B
Mark scheme
Notes from the mark scheme and report
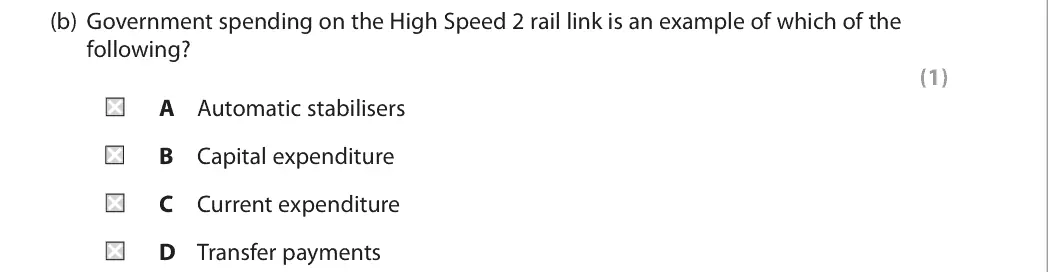
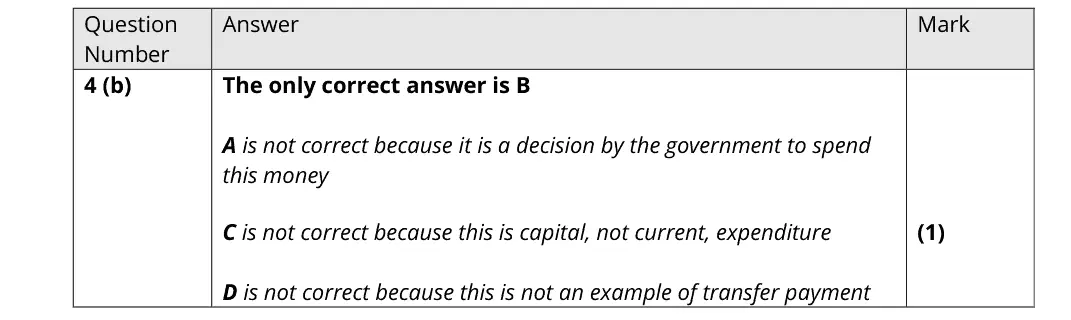
spending on new rail infrastructure is capital expenditure (B)
automatic stabilisers are not a discretionary choice, current spending is day-to-day, transfers are payments with no output in return
November 2021 · Paper 3 · Q2(a)5 marksAO1=2, AO2=2, AO3=1Short answerHard
Data and extracts for question 2
Mark scheme
Examiner's comment
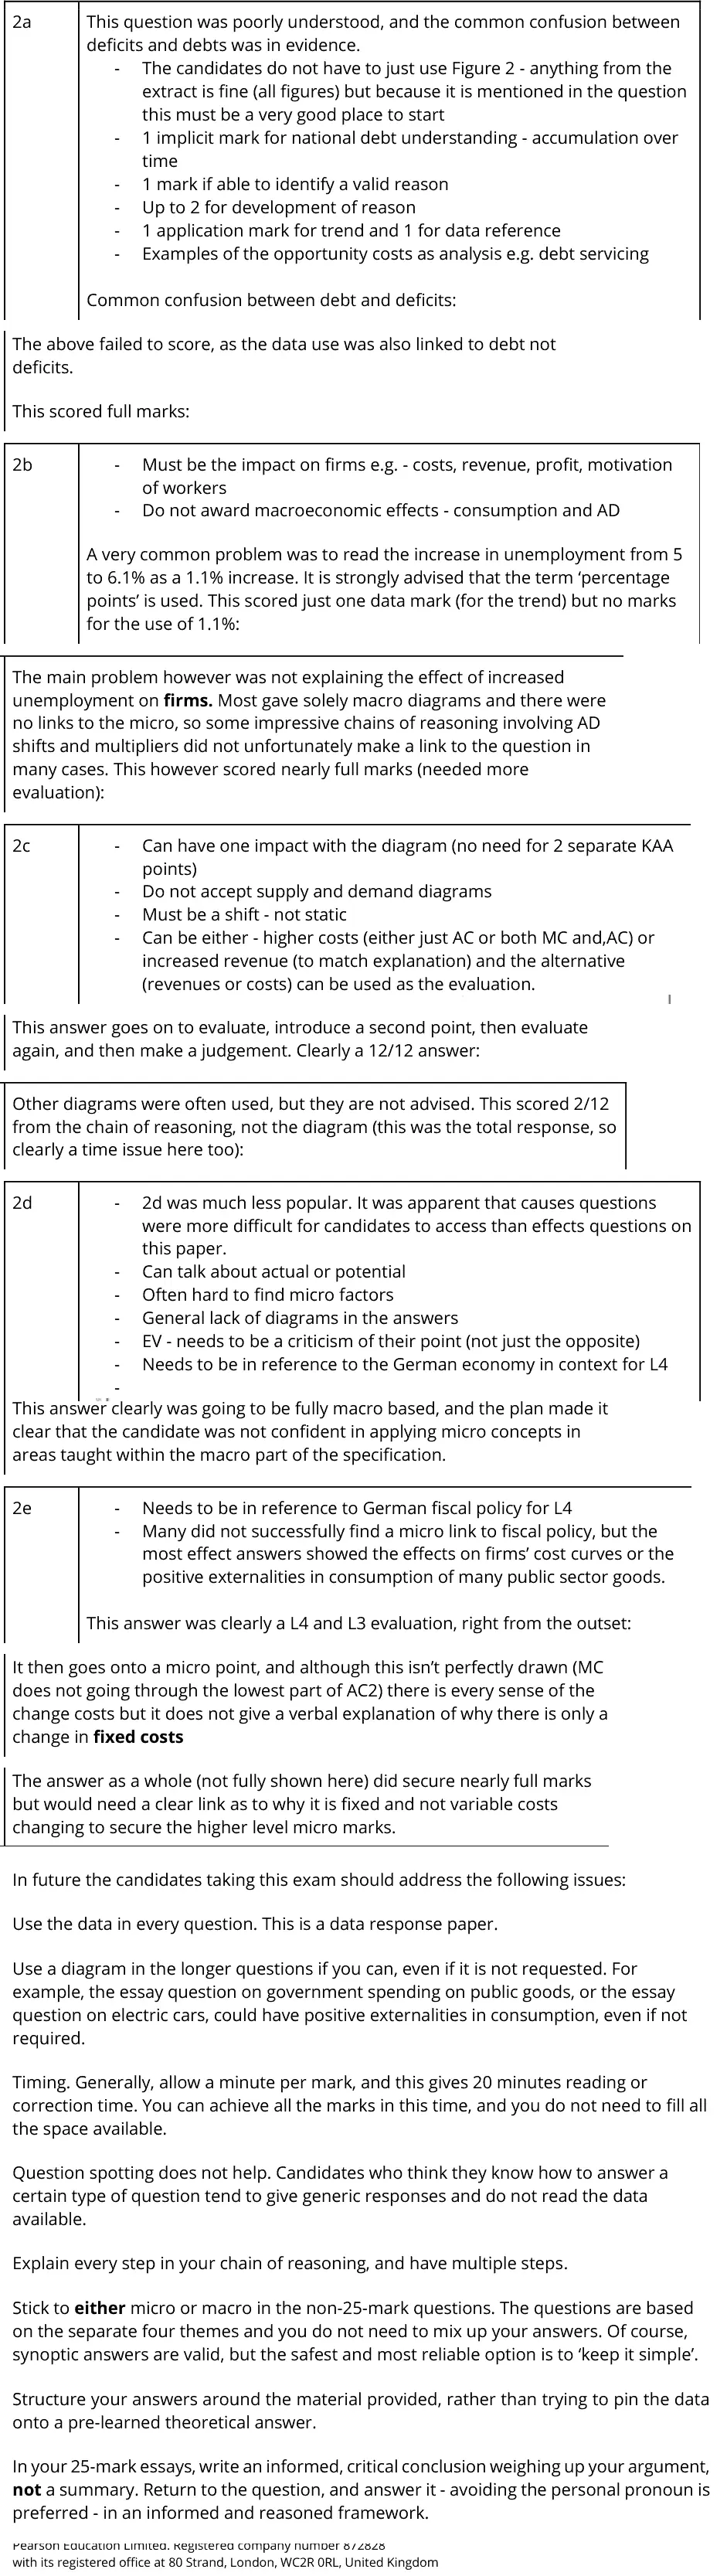
2a This question was poorly understood, and the common confusion between deficits and debts was in evidence. - The candidates do not have to just use Figure 2 - anything from the extract is fine (all figures) but because it is mentioned in the question this must be a very good place to start - 1 implicit mark for national debt understanding - accumulation over time - 1 mark if able to identify a valid reason - Up to 2 for development of reason - 1 application mark for trend and 1 for data reference - Examples of the opportunity costs as analysis e.g. debt servicing Common confusion between debt and deficits: The above failed to score, as the data use was also linked to debt not deficits. This scored full marks: 2b - Must be the impact on firms e.g. - costs, revenue, profit, motivation of workers - Do not award macroeconomic effects - consumption and AD A very common problem was to read the increase in unemployment from 5 to 6.1% as a 1.1% increase. It is strongly advised that the term ‘percentage points’ is used. This scored just one data mark (for the trend) but no marks for the use of 1.1%: The main problem however was not explaining the effect of increased unemployment on firms. Most gave solely macro diagrams and there were no links to the micro, so some impressive chains of reasoning involving AD shifts and multipliers did not unfortunately make a link to the question in many cases. This however scored nearly full marks (needed more evaluation): 2c - Can have one impact with the diagram (no need for 2 separate KAA points) - Do not accept supply and demand diagrams - Must be a shift - not static - Can be either - higher costs (either just AC or both MC and,AC) or increased revenue (to match explanation) and the alternative (revenues or costs) can be used as the evaluation. This answer goes on to evaluate, introduce a second point, then evaluate again, and then make a judgement. Clearly a 12/12 answer: Other diagrams were often used, but they are not advised. This scored 2/12 from the chain of reasoning, not the diagram (this was the total response, so clearly a time issue here too): 2d - 2d was much less popular. It was apparent that causes questions were more difficult for candidates to access than effects questions on this paper. - Can talk about actual or potential - Often hard to find micro factors - General lack of diagrams in the answers - EV - needs to be a criticism of their point (not just the opposite) - Needs to be in reference to the German economy in context for L4 - This answer clearly was going to be fully macro based, and the plan made it clear that the candidate was not confident in applying micro concepts in areas taught within the macro part of the specification. 2e - Needs to be in reference to German fiscal policy for L4 - Many did not successfully find a micro link to fiscal policy, but the most effect answers showed the effects on firms’ cost curves or the positive externalities in consumption of many public sector goods. This answer was clearly a L4 and L3 evaluation, right from the outset: It then goes onto a micro point, and although this isn’t perfectly drawn (MC does not going through the lowest part of AC2) there is every sense of the change costs but it does not give a verbal explanation of why there is only a change in fixed costs The answer as a whole (not fully shown here) did secure nearly full marks but would need a clear link as to why it is fixed and not variable costs changing to secure the higher level micro marks. In future the candidates taking this exam should address the following issues: Use the data in every question. This is a data response paper. Use a diagram in the longer questions if you can, even if it is not requested. For example, the essay question on government spending on public goods, or the essay question on electric cars, could have positive externalities in consumption, even if not required. Timing. Generally, allow a minute per mark, and this gives 20 minutes reading or correction time. You can achieve all the marks in this time, and you do not need to fill all the space available. Question spotting does not help. Candidates who think they know how to answer a certain type of question tend to give generic responses and do not read the data available. Explain every step in your chain of reasoning, and have multiple steps. Stick to either micro or macro in the non-25-mark questions. The questions are based on the separate four themes and you do not need to mix up your answers. Of course, synoptic answers are valid, but the safest and most reliable option is to ‘keep it simple’. Structure your answers around the material provided, rather than trying to pin the data onto a pre-learned theoretical answer. In your 25-mark essays, write an informed, critical conclusion weighing up your argument, not a summary. Return to the question, and answer it - avoiding the personal pronoun is preferred - in an informed and reasoned framework. with its registered office at 80 Strand, London, WC2R 0RL, United Kingdom
Notes from the mark scheme and report
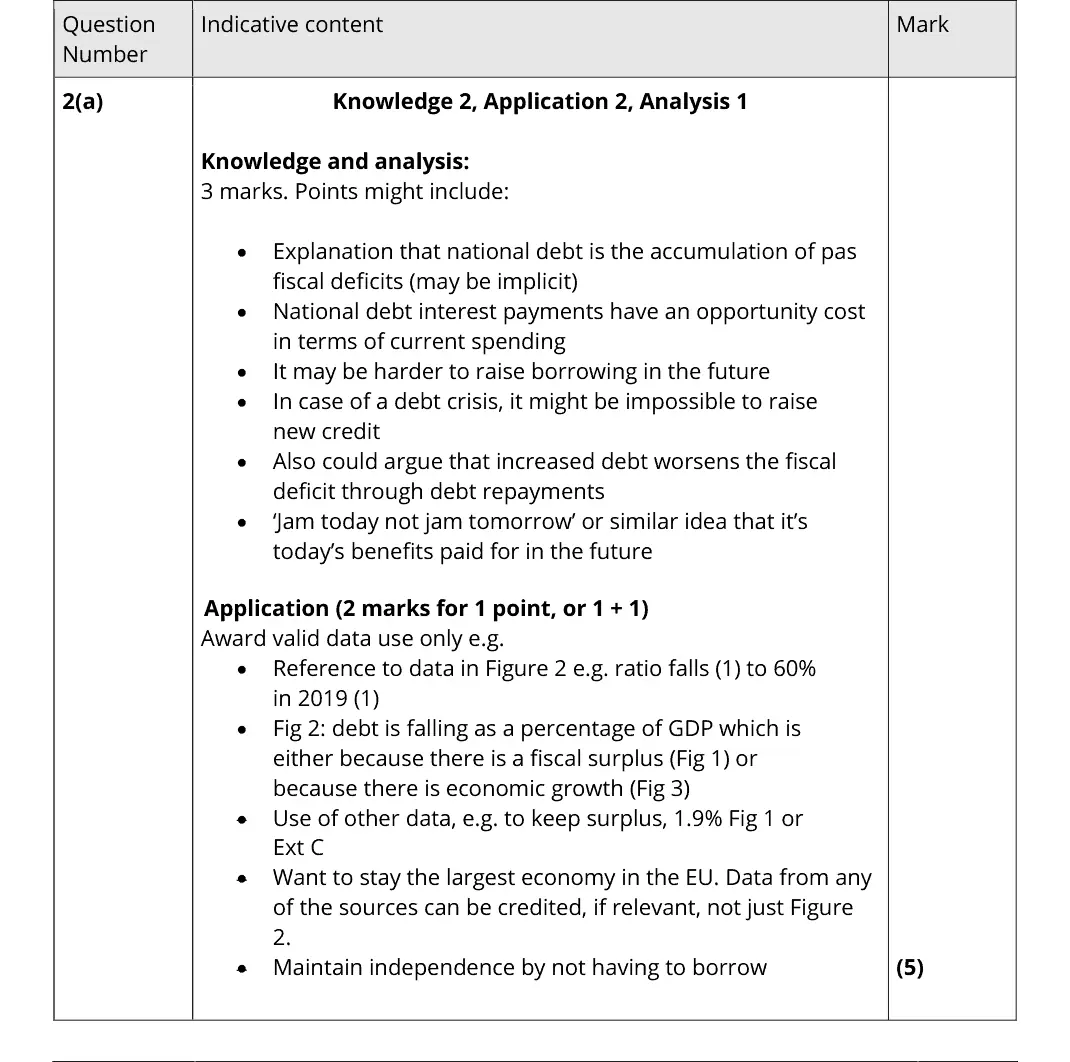
debt is the accumulation of past deficits: do not confuse debt with deficits
interest payments have an opportunity cost, harder to borrow in future
use Figure 2 (falling to 60% in 2019) or the 1.9% surplus
report: "This question was poorly understood, and the common confusion between deficits and debts was in evidence"
Quantitative skills: QS 9 (interpret, apply and analyse information in written, graphical tabular and numerical forms)
November 2021 · Paper 3 · Q2(e)25 marksAO1=4, AO2=4, AO3=8, AO4=925-mark essayEither/or
Data and extracts for question 2
Mark scheme, including the levels grid and indicative content
Examiner's comment
2a This question was poorly understood, and the common confusion between deficits and debts was in evidence. - The candidates do not have to just use Figure 2 - anything from the extract is fine (all figures) but because it is mentioned in the question this must be a very good place to start - 1 implicit mark for national debt understanding - accumulation over time - 1 mark if able to identify a valid reason - Up to 2 for development of reason - 1 application mark for trend and 1 for data reference - Examples of the opportunity costs as analysis e.g. debt servicing Common confusion between debt and deficits: The above failed to score, as the data use was also linked to debt not deficits. This scored full marks: 2b - Must be the impact on firms e.g. - costs, revenue, profit, motivation of workers - Do not award macroeconomic effects - consumption and AD A very common problem was to read the increase in unemployment from 5 to 6.1% as a 1.1% increase. It is strongly advised that the term ‘percentage points’ is used. This scored just one data mark (for the trend) but no marks for the use of 1.1%: The main problem however was not explaining the effect of increased unemployment on firms. Most gave solely macro diagrams and there were no links to the micro, so some impressive chains of reasoning involving AD shifts and multipliers did not unfortunately make a link to the question in many cases. This however scored nearly full marks (needed more evaluation): 2c - Can have one impact with the diagram (no need for 2 separate KAA points) - Do not accept supply and demand diagrams - Must be a shift - not static - Can be either - higher costs (either just AC or both MC and,AC) or increased revenue (to match explanation) and the alternative (revenues or costs) can be used as the evaluation. This answer goes on to evaluate, introduce a second point, then evaluate again, and then make a judgement. Clearly a 12/12 answer: Other diagrams were often used, but they are not advised. This scored 2/12 from the chain of reasoning, not the diagram (this was the total response, so clearly a time issue here too): 2d - 2d was much less popular. It was apparent that causes questions were more difficult for candidates to access than effects questions on this paper. - Can talk about actual or potential - Often hard to find micro factors - General lack of diagrams in the answers - EV - needs to be a criticism of their point (not just the opposite) - Needs to be in reference to the German economy in context for L4 - This answer clearly was going to be fully macro based, and the plan made it clear that the candidate was not confident in applying micro concepts in areas taught within the macro part of the specification. 2e - Needs to be in reference to German fiscal policy for L4 - Many did not successfully find a micro link to fiscal policy, but the most effect answers showed the effects on firms’ cost curves or the positive externalities in consumption of many public sector goods. This answer was clearly a L4 and L3 evaluation, right from the outset: It then goes onto a micro point, and although this isn’t perfectly drawn (MC does not going through the lowest part of AC2) there is every sense of the change costs but it does not give a verbal explanation of why there is only a change in fixed costs The answer as a whole (not fully shown here) did secure nearly full marks but would need a clear link as to why it is fixed and not variable costs changing to secure the higher level micro marks. In future the candidates taking this exam should address the following issues: Use the data in every question. This is a data response paper. Use a diagram in the longer questions if you can, even if it is not requested. For example, the essay question on government spending on public goods, or the essay question on electric cars, could have positive externalities in consumption, even if not required. Timing. Generally, allow a minute per mark, and this gives 20 minutes reading or correction time. You can achieve all the marks in this time, and you do not need to fill all the space available. Question spotting does not help. Candidates who think they know how to answer a certain type of question tend to give generic responses and do not read the data available. Explain every step in your chain of reasoning, and have multiple steps. Stick to either micro or macro in the non-25-mark questions. The questions are based on the separate four themes and you do not need to mix up your answers. Of course, synoptic answers are valid, but the safest and most reliable option is to ‘keep it simple’. Structure your answers around the material provided, rather than trying to pin the data onto a pre-learned theoretical answer. In your 25-mark essays, write an informed, critical conclusion weighing up your argument, not a summary. Return to the question, and answer it - avoiding the personal pronoun is preferred - in an informed and reasoned framework. with its registered office at 80 Strand, London, WC2R 0RL, United Kingdom
Notes from the mark scheme and report
AD shift with multiplier, LRAS shift from infrastructure investment
micro links: firms' cost curves, positive consumption externalities of public goods
Level 4 needs German fiscal policy in context
evaluate with size of multiplier, low borrowing costs, debt brake rules
October 2020 · Paper 2 · Q725 marksAO1=4, AO2=4, AO3=8, AO4=925-mark essayEither/or
Mark scheme, including the levels grid and indicative content
Examiner's comment
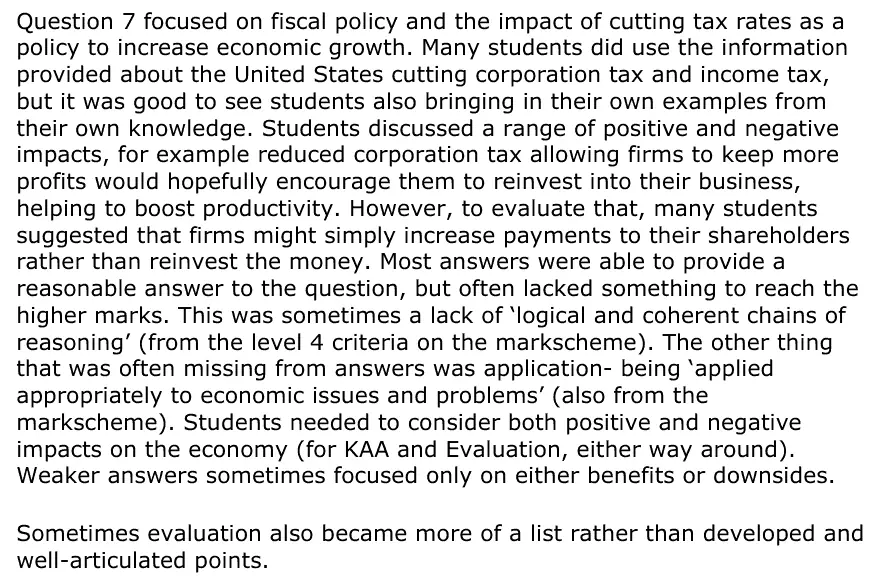
Question 7 focused on fiscal policy and the impact of cutting tax rates as a policy to increase economic growth. Many students did use the information provided about the United States cutting corporation tax and income tax, but it was good to see students also bringing in their own examples from their own knowledge. Students discussed a range of positive and negative impacts, for example reduced corporation tax allowing firms to keep more profits would hopefully encourage them to reinvest into their business, helping to boost productivity. However, to evaluate that, many students suggested that firms might simply increase payments to their shareholders rather than reinvest the money. Most answers were able to provide a reasonable answer to the question, but often lacked something to reach the higher marks. This was sometimes a lack of ‘logical and coherent chains of reasoning’ (from the level 4 criteria on the markscheme). The other thing that was often missing from answers was application- being ‘applied appropriately to economic issues and problems’ (also from the markscheme). Students needed to consider both positive and negative impacts on the economy (for KAA and Evaluation, either way around). Weaker answers sometimes focused only on either benefits or downsides. Sometimes evaluation also became more of a list rather than developed and well-articulated points.
Notes from the mark scheme and report
lower corporation tax raises retained profit for investment, lower income tax raises disposable income and incentives
evaluate with saving, payouts to shareholders instead of investment, higher government debt and crowding out, less spending on infrastructure and education
one side KAA and the other evaluation
answers often lacked application and developed chains
June 2019 · Paper 2 · Q4(b)2 marksAO2=2Calculation
Data and extracts for question 4
Mark scheme
Examiner's comment
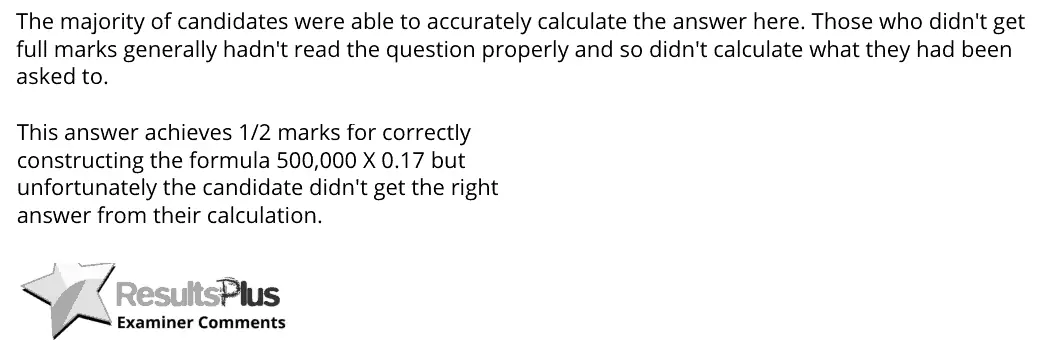
The majority of candidates were able to accurately calculate the answer here. Those who didn't get full marks generally hadn't read the question properly and so didn't calculate what they had been asked to. This answer achieves 1/2 marks for correctly constructing the formula 500,000 X 0.17 but unfortunately the candidate didn't get the right answer from their calculation.
Notes from the mark scheme and report
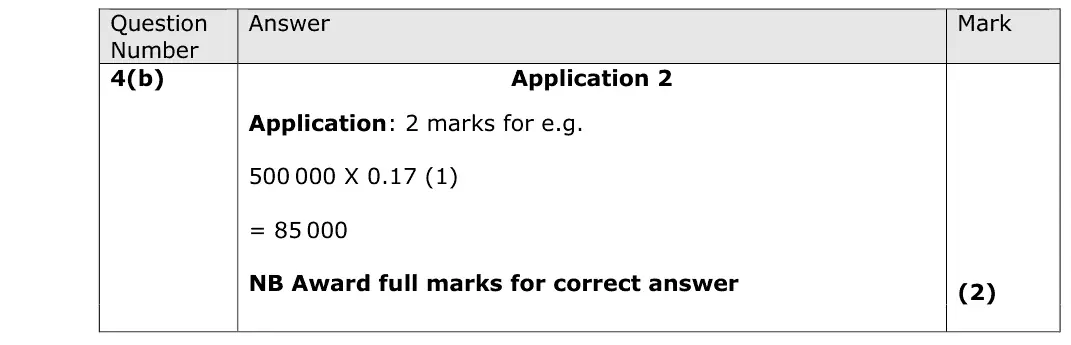
500 000 x 0.17 = £85 000
Quantitative skills: QS 2 (calculate, use and understand percentages, percentage changes and percentage point changes)
June 2019 · Paper 2 · Q4(c)2 marksAO1=1, AO3=1Short answer
Data and extracts for question 4
Mark scheme
Examiner's comment
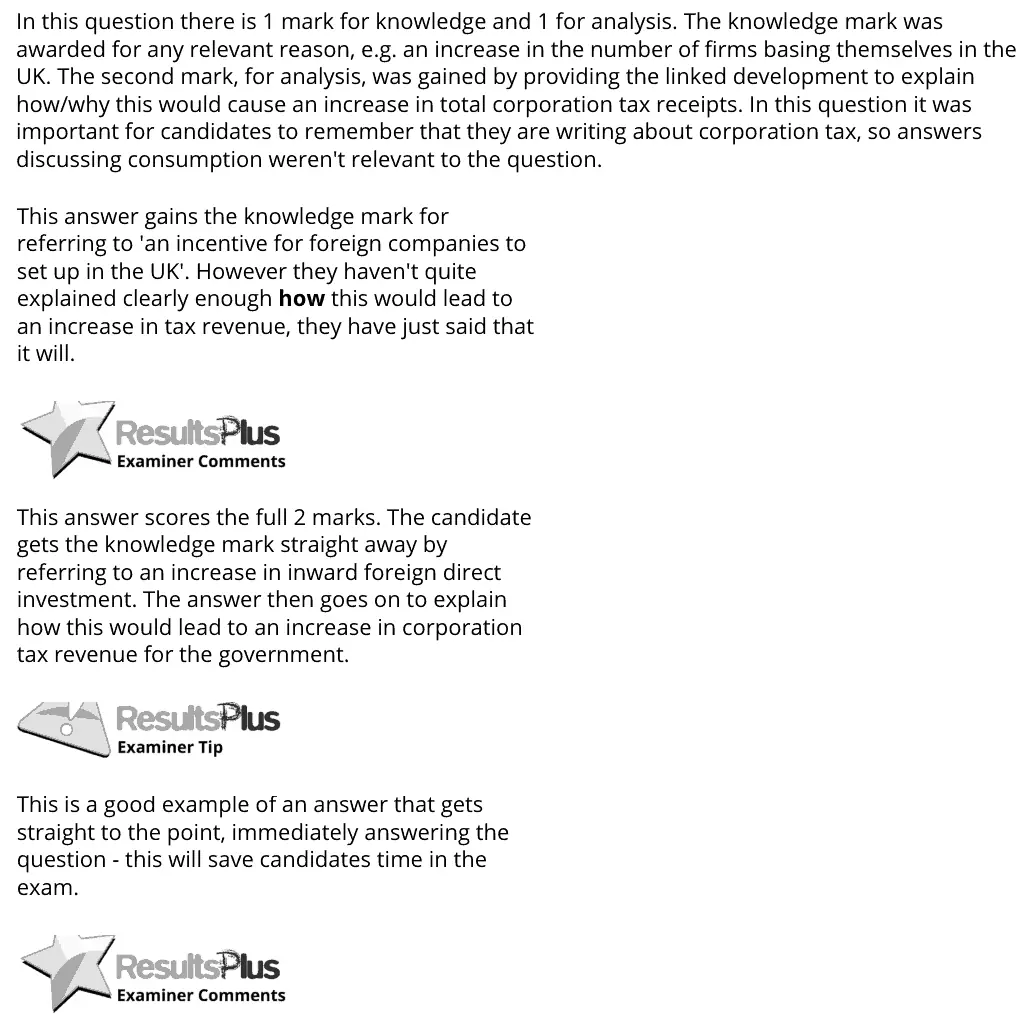
In this question there is 1 mark for knowledge and 1 for analysis. The knowledge mark was awarded for any relevant reason, e.g. an increase in the number of firms basing themselves in the UK. The second mark, for analysis, was gained by providing the linked development to explain how/why this would cause an increase in total corporation tax receipts. In this question it was important for candidates to remember that they are writing about corporation tax, so answers discussing consumption weren't relevant to the question. This answer gains the knowledge mark for referring to 'an incentive for foreign companies to set up in the UK'. However they haven't quite explained clearly enough how this would lead to an increase in tax revenue, they have just said that it will. This answer scores the full 2 marks. The candidate gets the knowledge mark straight away by referring to an increase in inward foreign direct investment. The answer then goes on to explain how this would lead to an increase in corporation tax revenue for the government. This is a good example of an answer that gets straight to the point, immediately answering the question - this will save candidates time in the exam.
Notes from the mark scheme and report
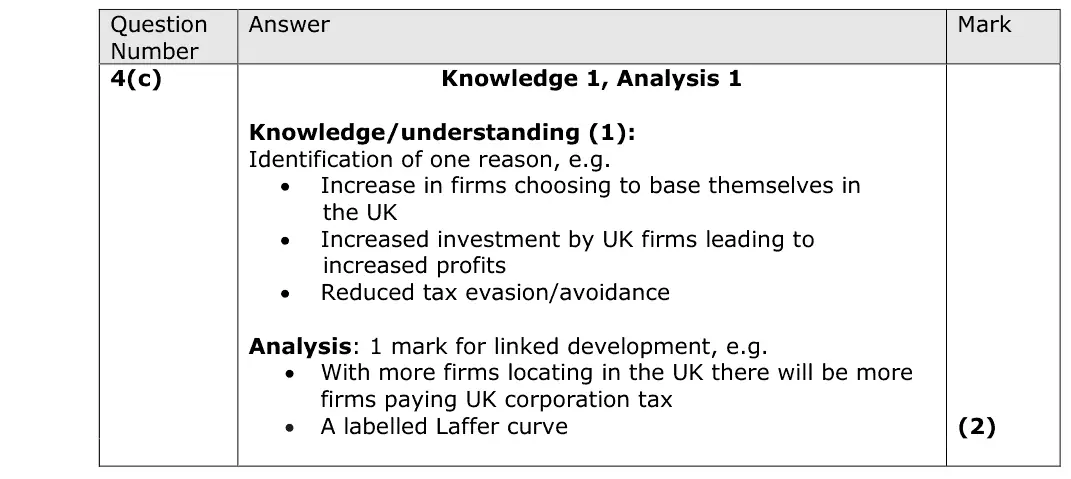
Laffer curve: lower rate attracts firms/FDI to locate in the UK, more investment and profits, less avoidance, so more total receipts
answers about consumption are not about corporation tax
June 2019 · Paper 2 · Q5(c)1 markMultiple choice
Data and extracts for question 5
Answer
B
Mark scheme
Notes from the mark scheme and report
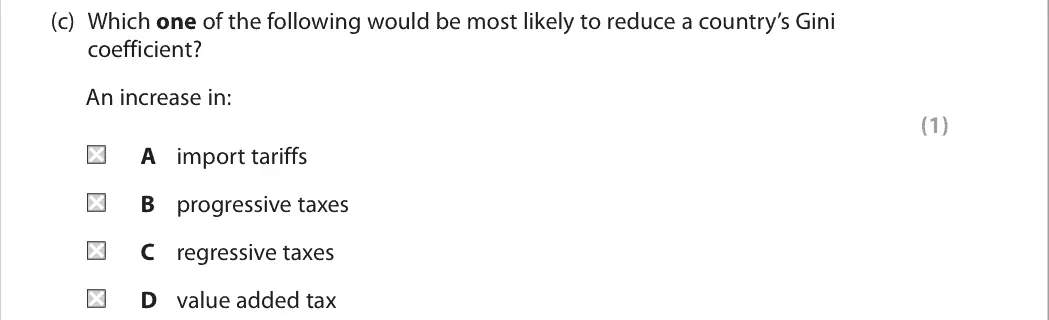
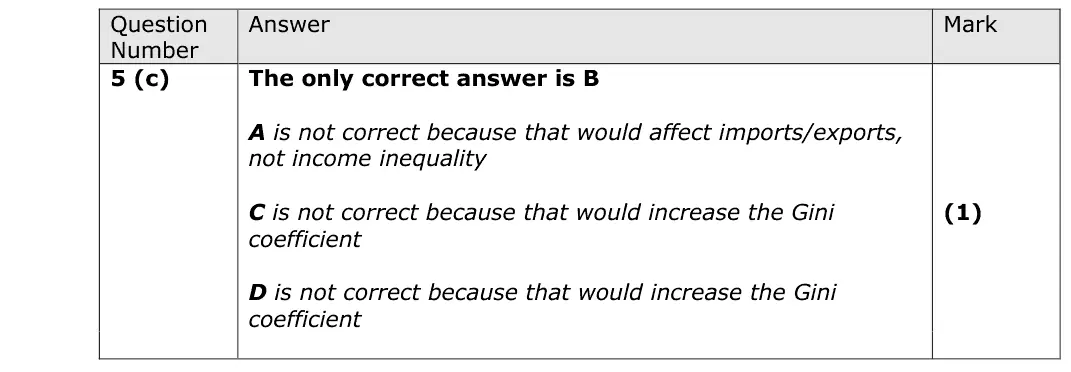
progressive taxes take a larger share from high incomes, reducing the Gini coefficient (B)
regressive taxes and VAT increase it
tariffs affect trade, not income distribution
June 2019 · Paper 2 · Q825 marksAO1=4, AO2=4, AO3=8, AO4=925-mark essayEither/or
Mark scheme, including the levels grid and indicative content
Examiner's comment
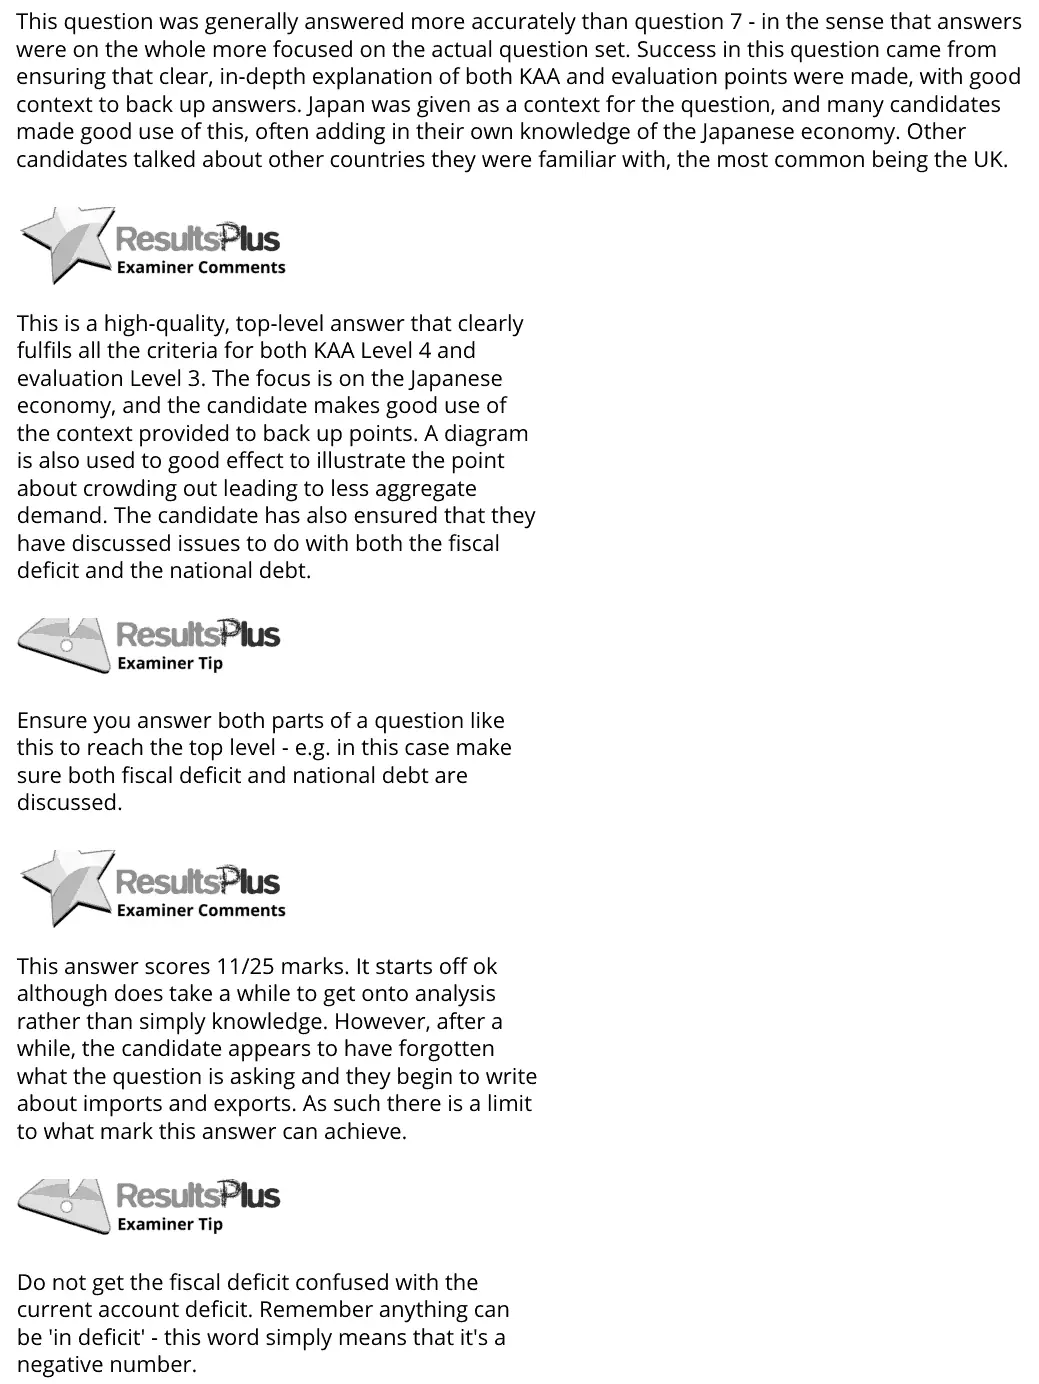
This question was generally answered more accurately than question 7 - in the sense that answers were on the whole more focused on the actual question set. Success in this question came from ensuring that clear, in-depth explanation of both KAA and evaluation points were made, with good context to back up answers. Japan was given as a context for the question, and many candidates made good use of this, often adding in their own knowledge of the Japanese economy. Other candidates talked about other countries they were familiar with, the most common being the UK. This is a high-quality, top-level answer that clearly fulfils all the criteria for both KAA Level 4 and evaluation Level 3. The focus is on the Japanese economy, and the candidate makes good use of the context provided to back up points. A diagram is also used to good effect to illustrate the point about crowding out leading to less aggregate demand. The candidate has also ensured that they have discussed issues to do with both the fiscal deficit and the national debt. Ensure you answer both parts of a question like this to reach the top level - e.g. in this case make sure both fiscal deficit and national debt are discussed. This answer scores 11/25 marks. It starts off ok although does take a while to get onto analysis rather than simply knowledge. However, after a while, the candidate appears to have forgotten what the question is asking and they begin to write about imports and exports. As such there is a limit to what mark this answer can achieve. Do not get the fiscal deficit confused with the current account deficit. Remember anything can be 'in deficit' - this word simply means that it's a negative number.
Notes from the mark scheme and report
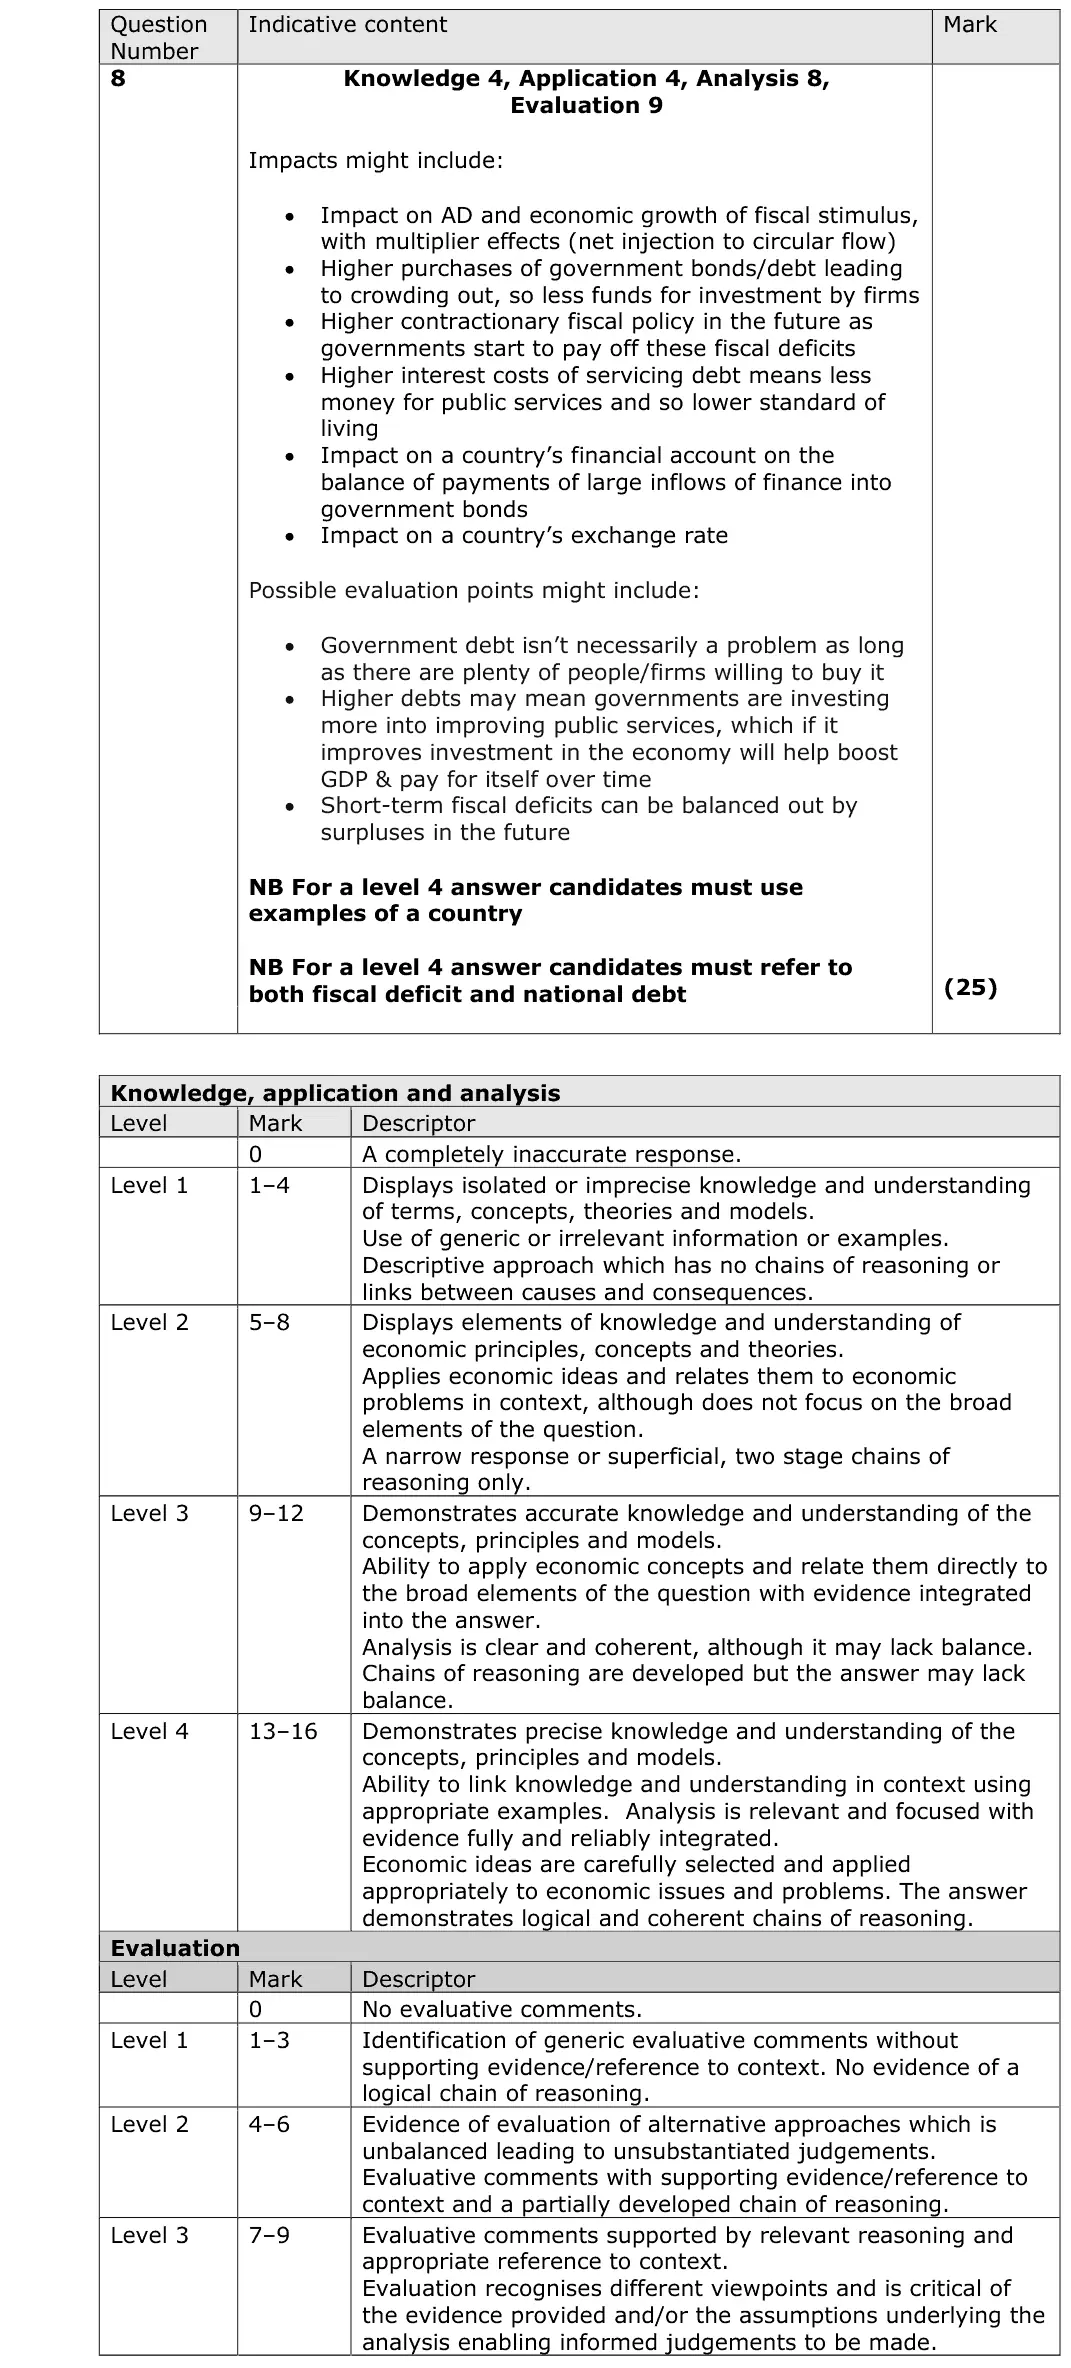
multiplier effects of the deficit, crowding out, debt interest costs, future austerity, bond yields, exchange rate
evaluate who holds the debt (Japan) and use of the borrowing
Level 4 needs a country example and both the deficit and the debt
June 2019 · Paper 3 · Q1(e)25 marksAO1=4, AO2=4, AO3=8, AO4=925-mark essayEither/or
Data and extracts for question 1
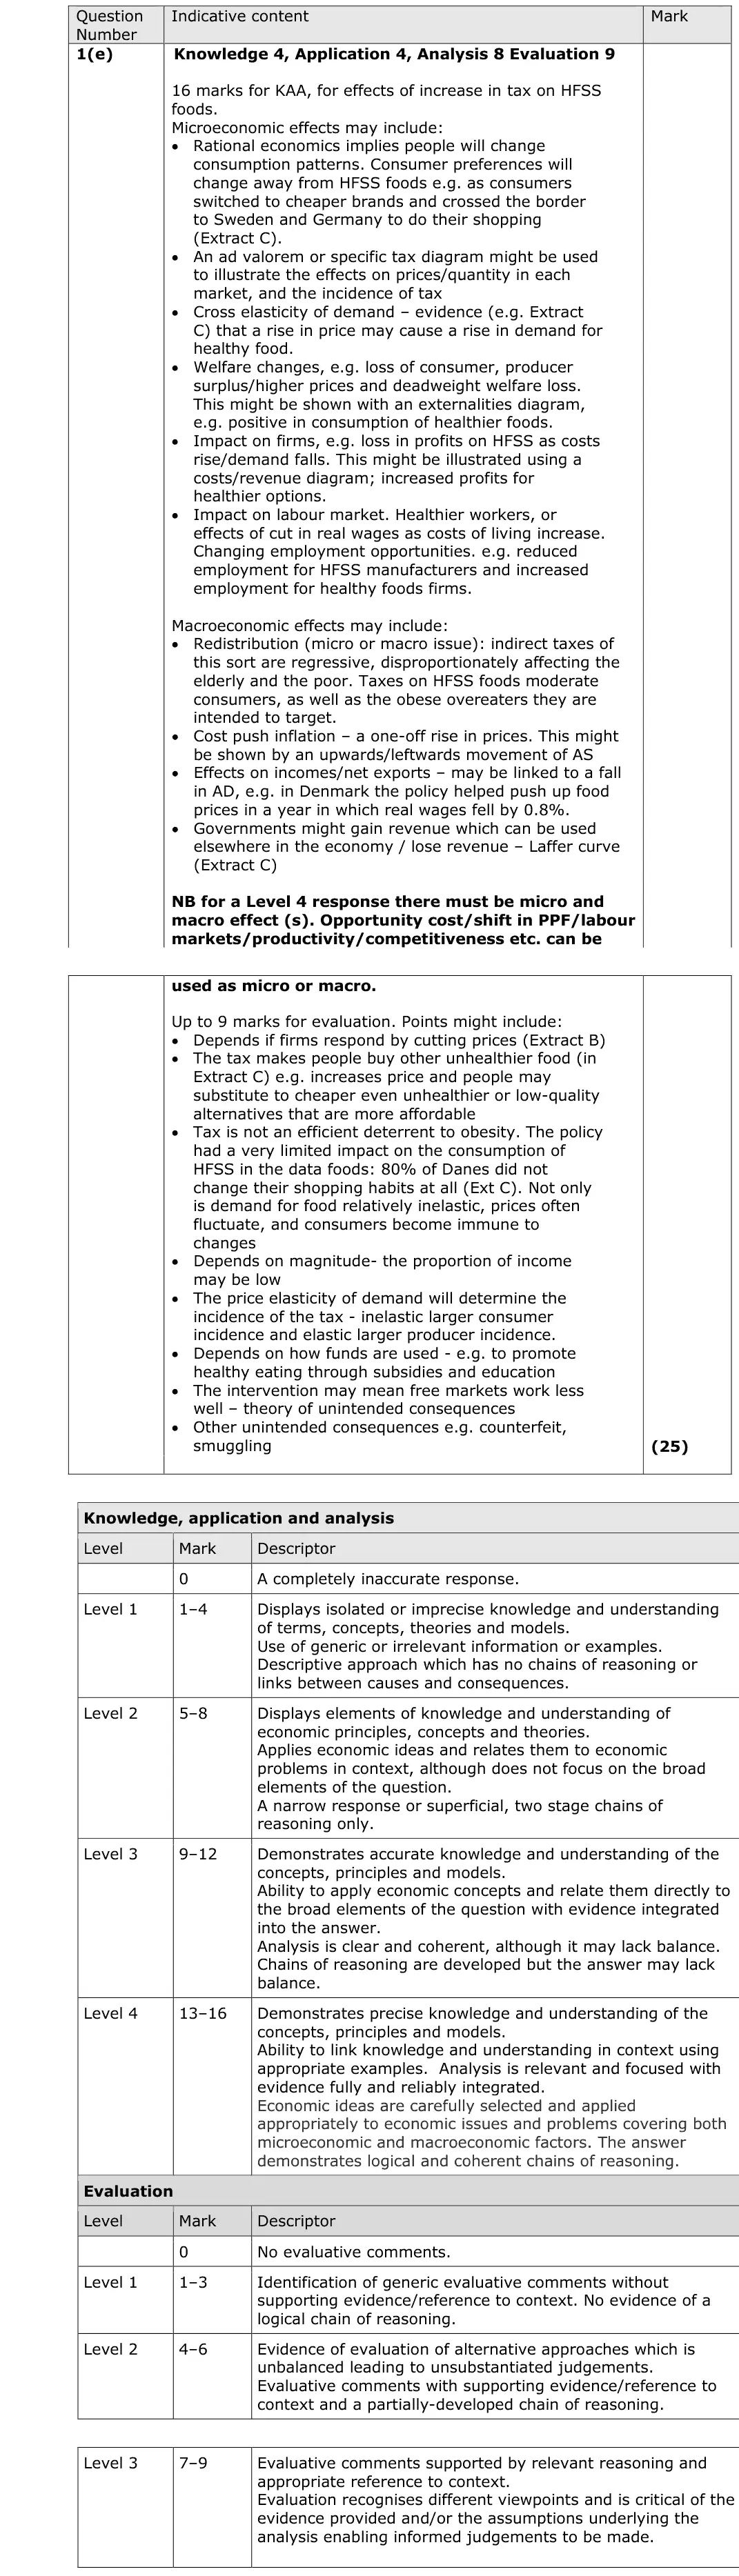
Mark scheme, including the levels grid and indicative content
Examiner's comment
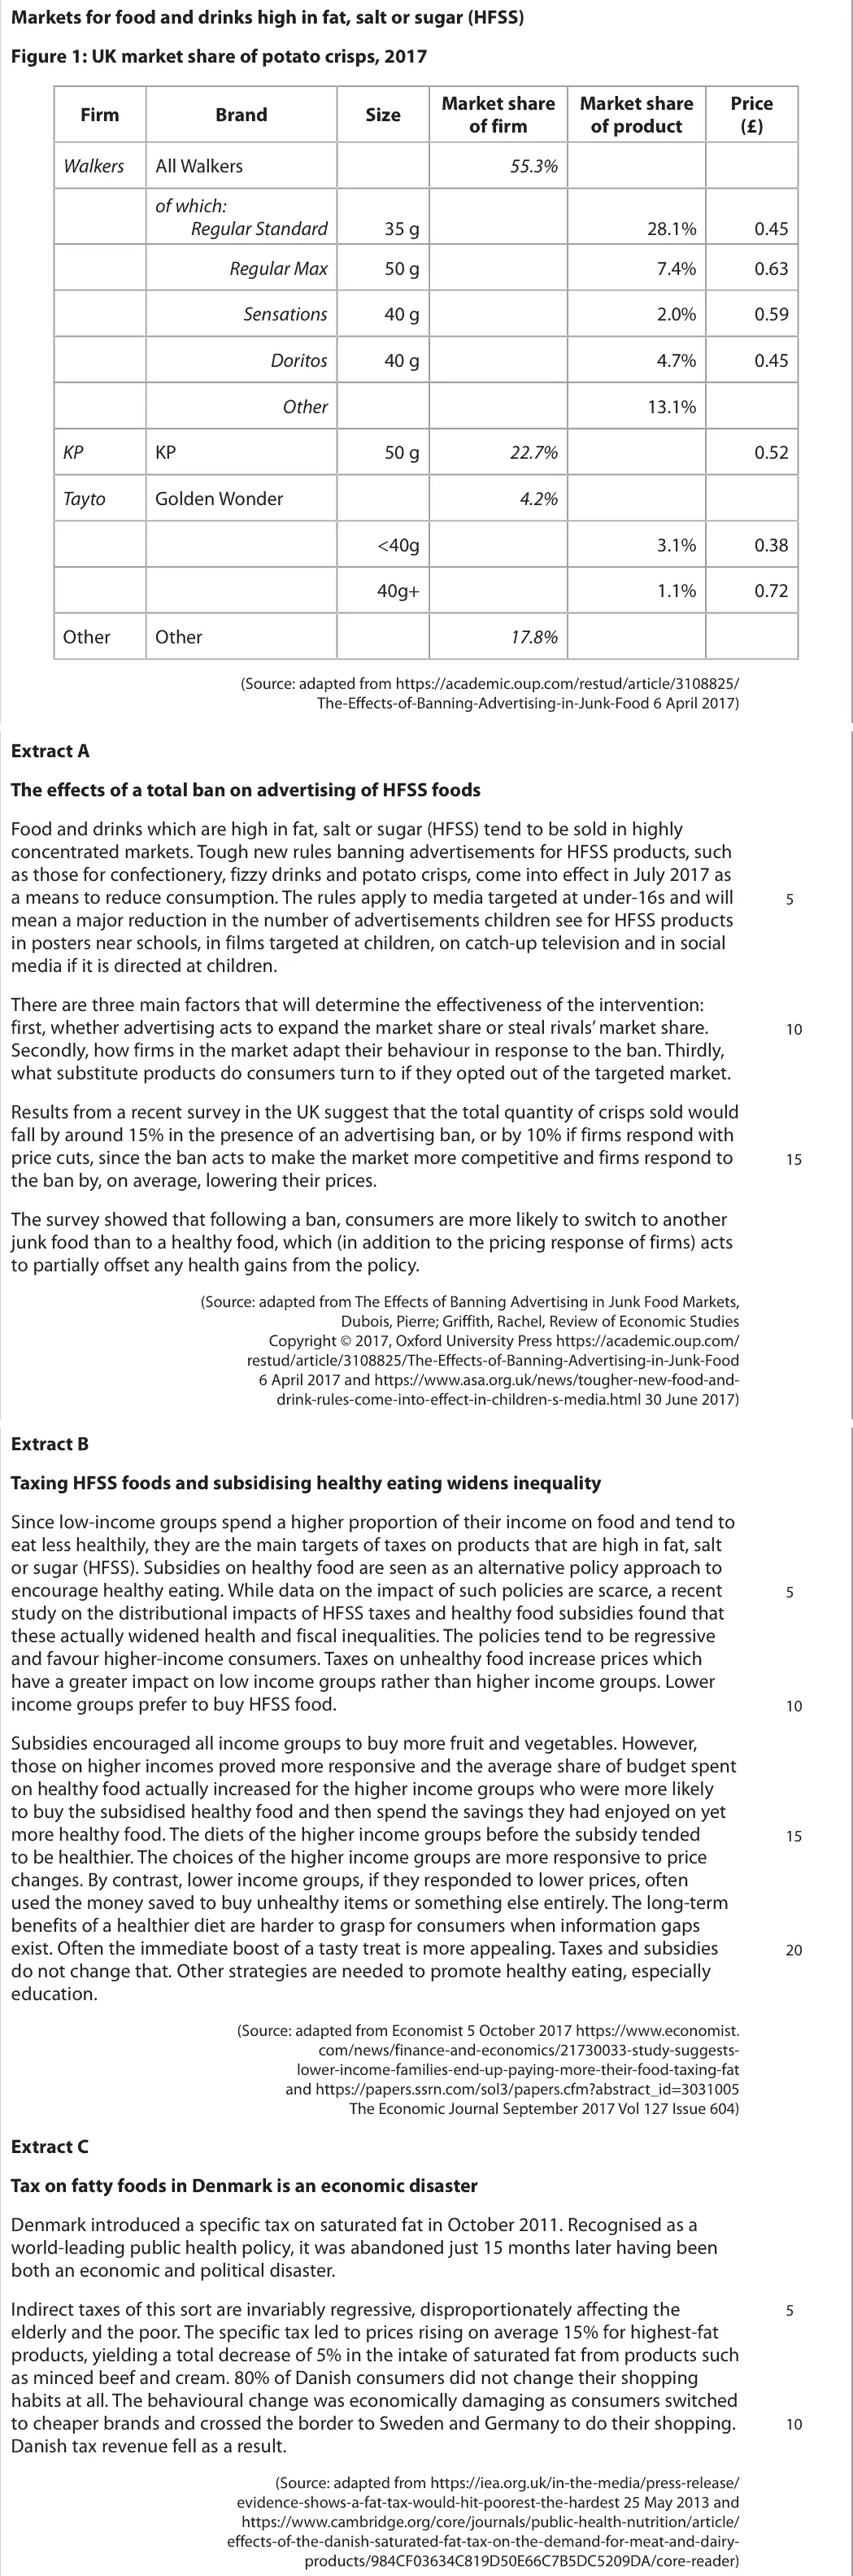
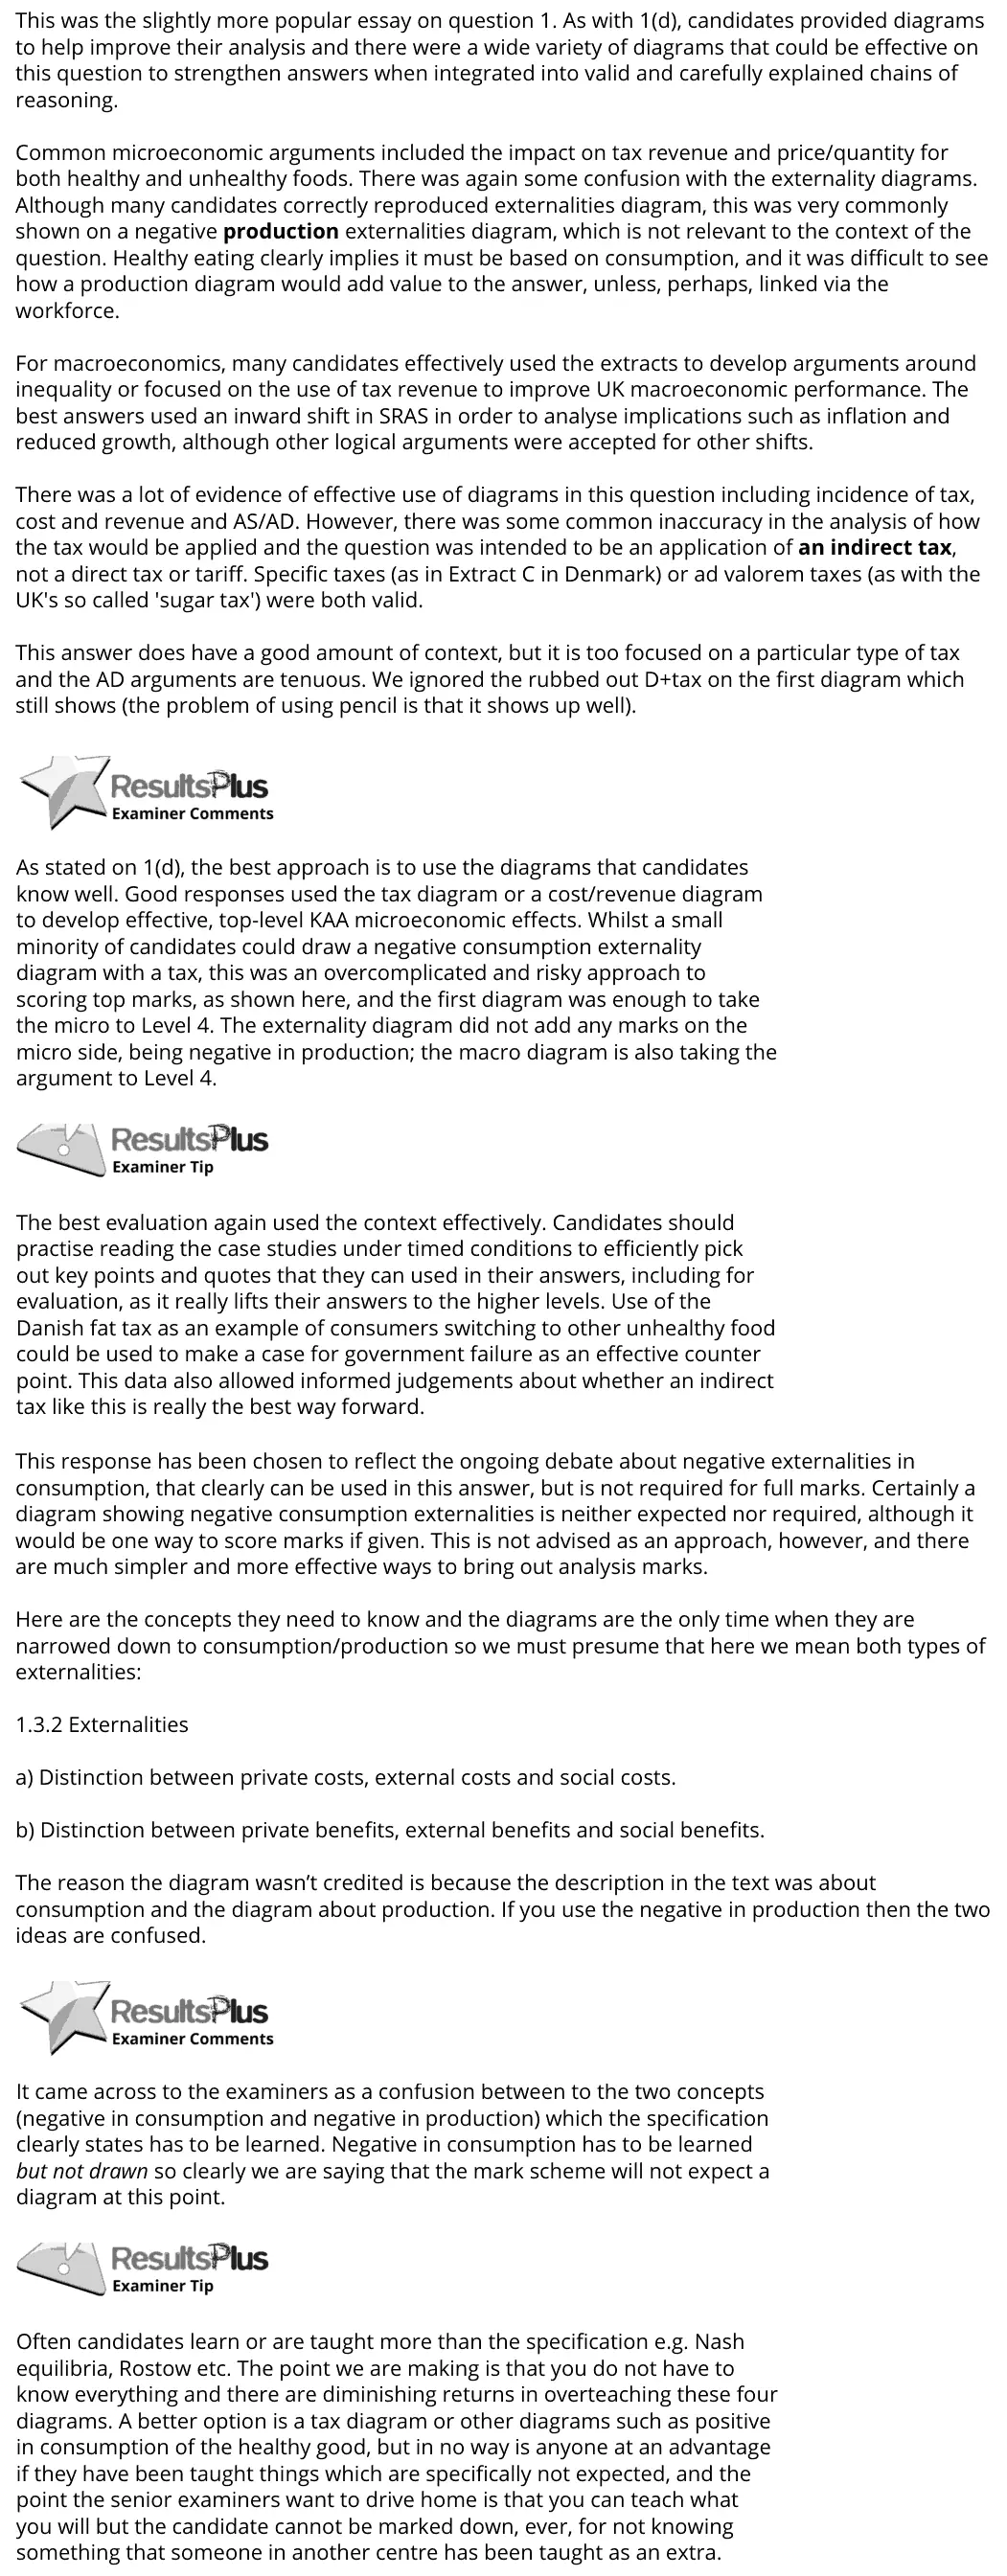
This was the slightly more popular essay on question 1. As with 1(d), candidates provided diagrams to help improve their analysis and there were a wide variety of diagrams that could be effective on this question to strengthen answers when integrated into valid and carefully explained chains of reasoning. Common microeconomic arguments included the impact on tax revenue and price/quantity for both healthy and unhealthy foods. There was again some confusion with the externality diagrams. Although many candidates correctly reproduced externalities diagram, this was very commonly shown on a negative production externalities diagram, which is not relevant to the context of the question. Healthy eating clearly implies it must be based on consumption, and it was difficult to see how a production diagram would add value to the answer, unless, perhaps, linked via the workforce. For macroeconomics, many candidates effectively used the extracts to develop arguments around inequality or focused on the use of tax revenue to improve UK macroeconomic performance. The best answers used an inward shift in SRAS in order to analyse implications such as inflation and reduced growth, although other logical arguments were accepted for other shifts. There was a lot of evidence of effective use of diagrams in this question including incidence of tax, cost and revenue and AS/AD. However, there was some common inaccuracy in the analysis of how the tax would be applied and the question was intended to be an application of an indirect tax, not a direct tax or tariff. Specific taxes (as in Extract C in Denmark) or ad valorem taxes (as with the UK's so called 'sugar tax') were both valid. This answer does have a good amount of context, but it is too focused on a particular type of tax and the AD arguments are tenuous. We ignored the rubbed out D+tax on the first diagram which still shows (the problem of using pencil is that it shows up well). As stated on 1(d), the best approach is to use the diagrams that candidates know well. Good responses used the tax diagram or a cost/revenue diagram to develop effective, top-level KAA microeconomic effects. Whilst a small minority of candidates could draw a negative consumption externality diagram with a tax, this was an overcomplicated and risky approach to scoring top marks, as shown here, and the first diagram was enough to take the micro to Level 4. The externality diagram did not add any marks on the micro side, being negative in production; the macro diagram is also taking the argument to Level 4. The best evaluation again used the context effectively. Candidates should practise reading the case studies under timed conditions to efficiently pick out key points and quotes that they can used in their answers, including for evaluation, as it really lifts their answers to the higher levels. Use of the Danish fat tax as an example of consumers switching to other unhealthy food could be used to make a case for government failure as an effective counter point. This data also allowed informed judgements about whether an indirect tax like this is really the best way forward. This response has been chosen to reflect the ongoing debate about negative externalities in consumption, that clearly can be used in this answer, but is not required for full marks. Certainly a diagram showing negative consumption externalities is neither expected nor required, although it would be one way to score marks if given. This is not advised as an approach, however, and there are much simpler and more effective ways to bring out analysis marks. Here are the concepts they need to know and the diagrams are the only time when they are narrowed down to consumption/production so we must presume that here we mean both types of externalities: 1.3.2 Externalities a) Distinction between private costs, external costs and social costs. b) Distinction between private benefits, external benefits and social benefits. The reason the diagram wasn’t credited is because the description in the text was about consumption and the diagram about production. If you use the negative in production then the two ideas are confused. It came across to the examiners as a confusion between to the two concepts (negative in consumption and negative in production) which the specification clearly states has to be learned. Negative in consumption has to be learned but not drawn so clearly we are saying that the mark scheme will not expect a diagram at this point. Often candidates learn or are taught more than the specification e.g. Nash equilibria, Rostow etc. The point we are making is that you do not have to know everything and there are diminishing returns in overteaching these four diagrams. A better option is a tax diagram or other diagrams such as positive in consumption of the healthy good, but in no way is anyone at an advantage if they have been taught things which are specifically not expected, and the point the senior examiners want to drive home is that you can teach what you will but the candidate cannot be marked down, ever, for not knowing something that someone in another centre has been taught as an extra.
Notes from the mark scheme and report
incidence depends on PED (inelastic demand, consumer bears most)
regressive (Extract B), Denmark tax abandoned after 15 months with cross-border shopping (Extract C)
use a consumption, not production, externality diagram
macro: inflation, SRAS, inequality, tax revenue
Level 4 needs micro and macro
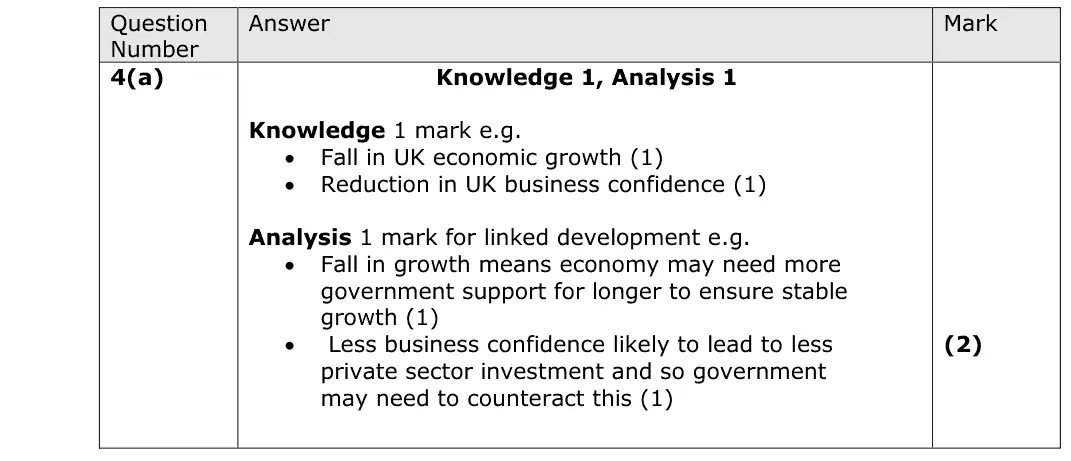
June 2018 · Paper 2 · Q4(a)2 marksAO1=1, AO3=1Short answer
Data and extracts for question 4
Mark scheme
Examiner's comment
In this question there is one mark for knowledge and one for analysis. The knowledge mark comes from identifying 'one likely reason' and the analysis mark is for explaining/justifying that reason. This answer does not include a relevant reason and so achieves no marks. Remember the distinction between the government budget and the current account. This answer includes a relevant reason – Brexit and the resultant fall in confidence. The candidate has also explained their reason, discussing the resultant expansionary policies that would be needed as a result.
Notes from the mark scheme and report
identify a reason (slower growth, lower business confidence e.g. Brexit) then develop it (more government support needed, less private investment to offset)
do not confuse the budget with the current account
June 2018 · Paper 2 · Q4(b)2 marksAO1=1, AO3=1Short answer
Data and extracts for question 4
Mark scheme
Examiner's comment
In this question the marks are split into one mark for knowledge and one for application. The knowledge mark is for explaining that the national debt would increase and the analysis mark is for explaining why it would increase. This answer achieves full marks. One mark for saying that the national debt will 'get bigger'. The second mark for explaining that the government will have to 'finance their spending' etc. Ensure you read the question carefully. Here the question is specifically asking what the impact will be on the UK national debt, not the economy in general. This answer achieves one mark for saying that 'national debt is likely to grow' but there is no analysis here to explain why it will grow.
Notes from the mark scheme and report
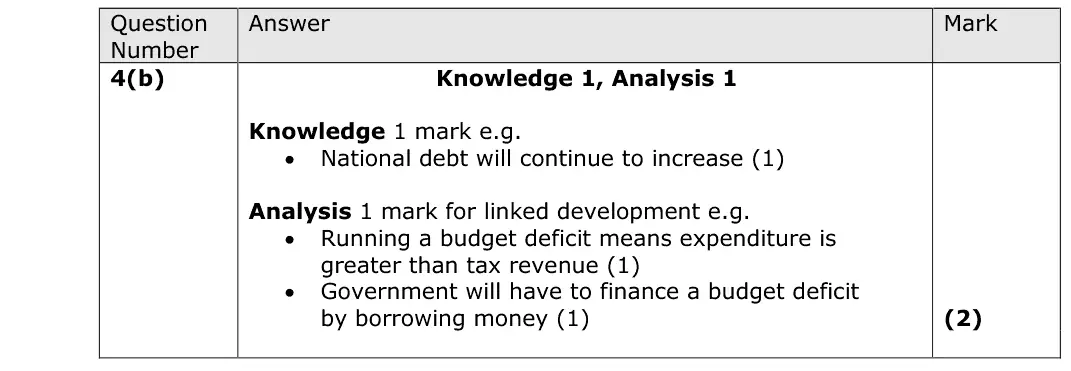
national debt keeps rising (1)
because a deficit means spending exceeds tax revenue and must be financed by borrowing (1)
answer about the national debt, not the economy in general
June 2018 · Paper 2 · Q4(c)1 markMultiple choice
Data and extracts for question 4
Answer
B
Mark scheme
Notes from the mark scheme and report
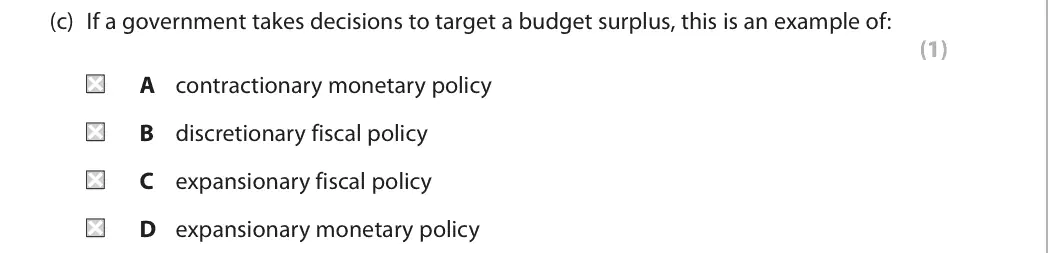
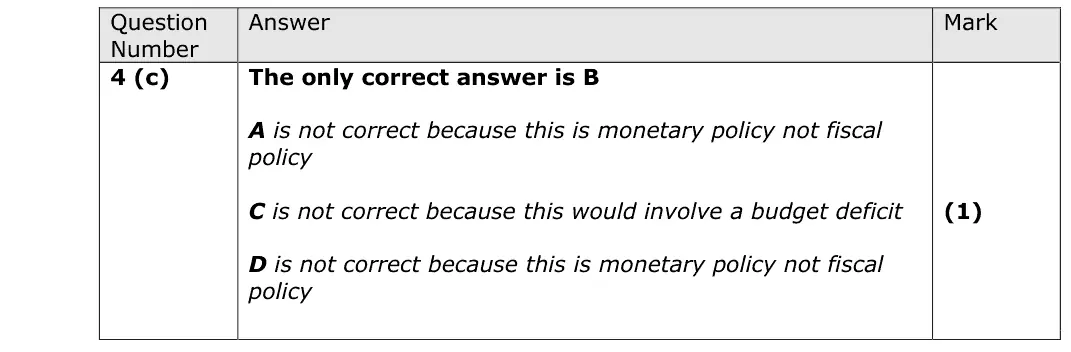
choosing to target a surplus is a deliberate decision on spending and taxes, so discretionary fiscal policy (B)
A and D are monetary policy
C would mean a deficit
June 2017 · Paper 3 · Q2(b)8 marksAO1=2, AO2=2, AO3=2, AO4=28-mark responseHard
Data and extracts for question 2
Mark scheme, including the levels grid and indicative content
Examiner's comment
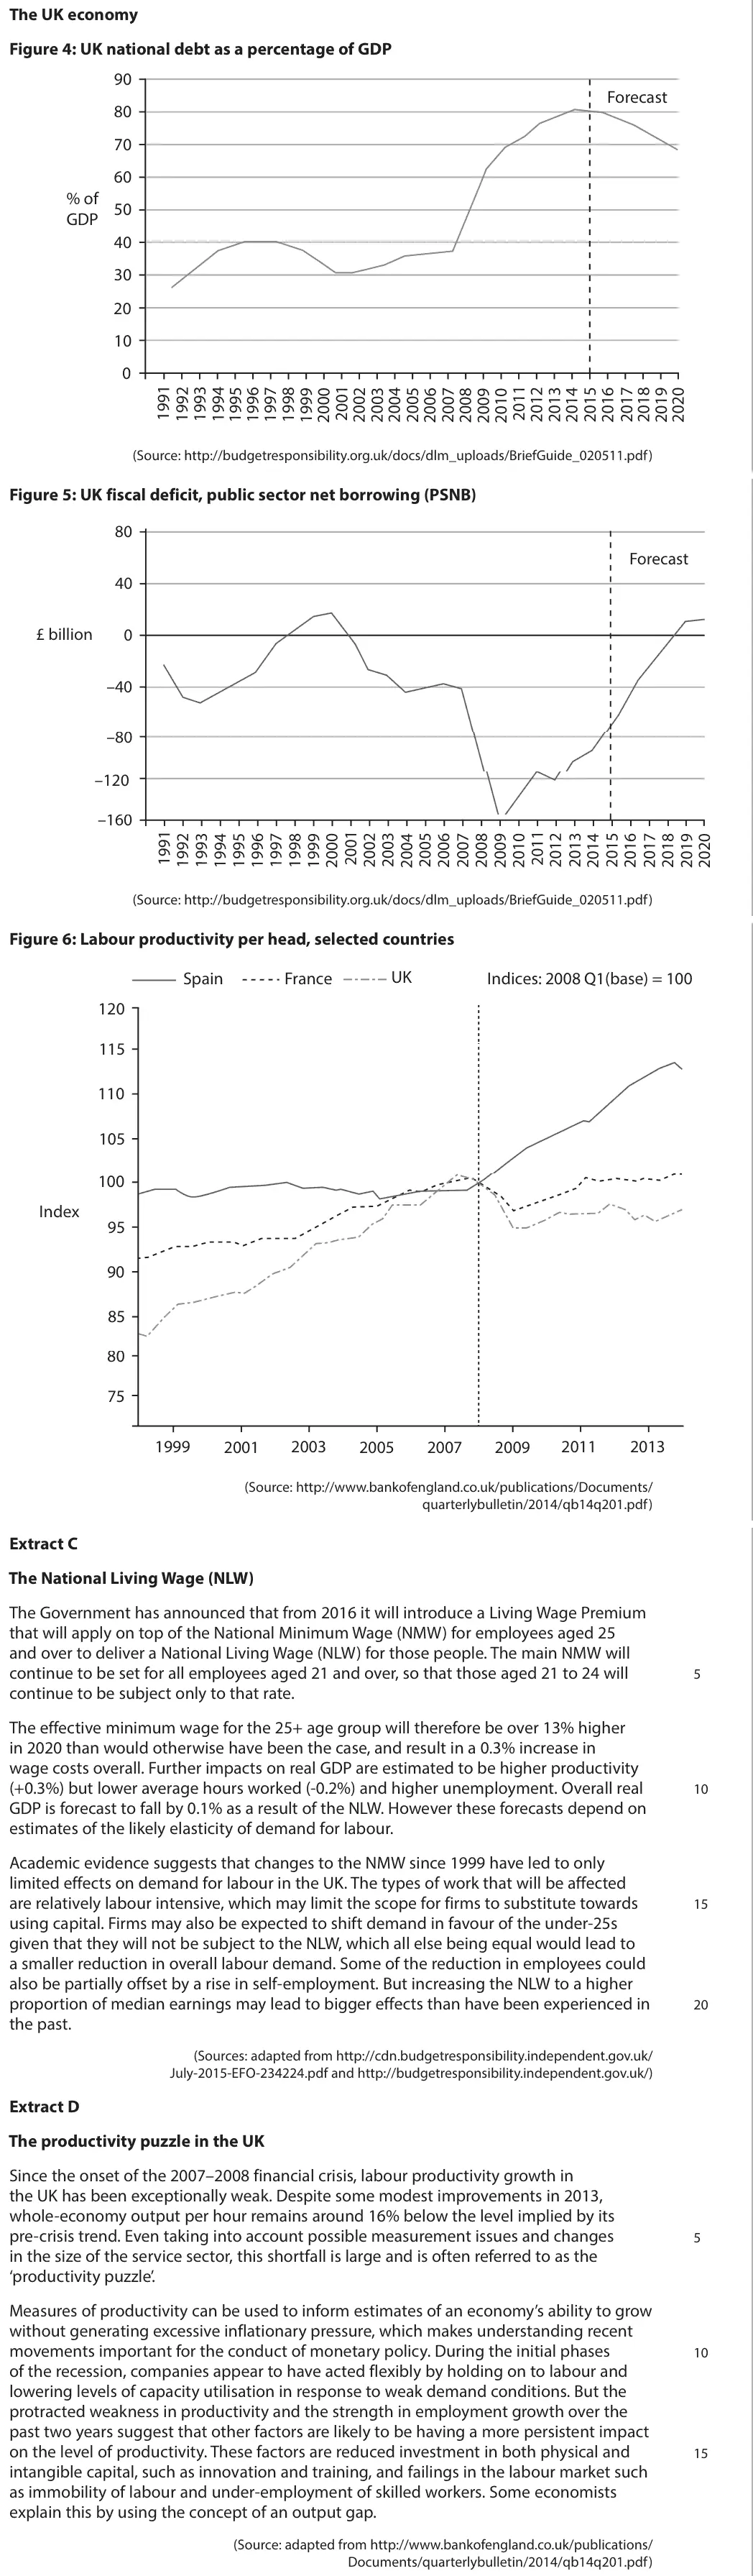
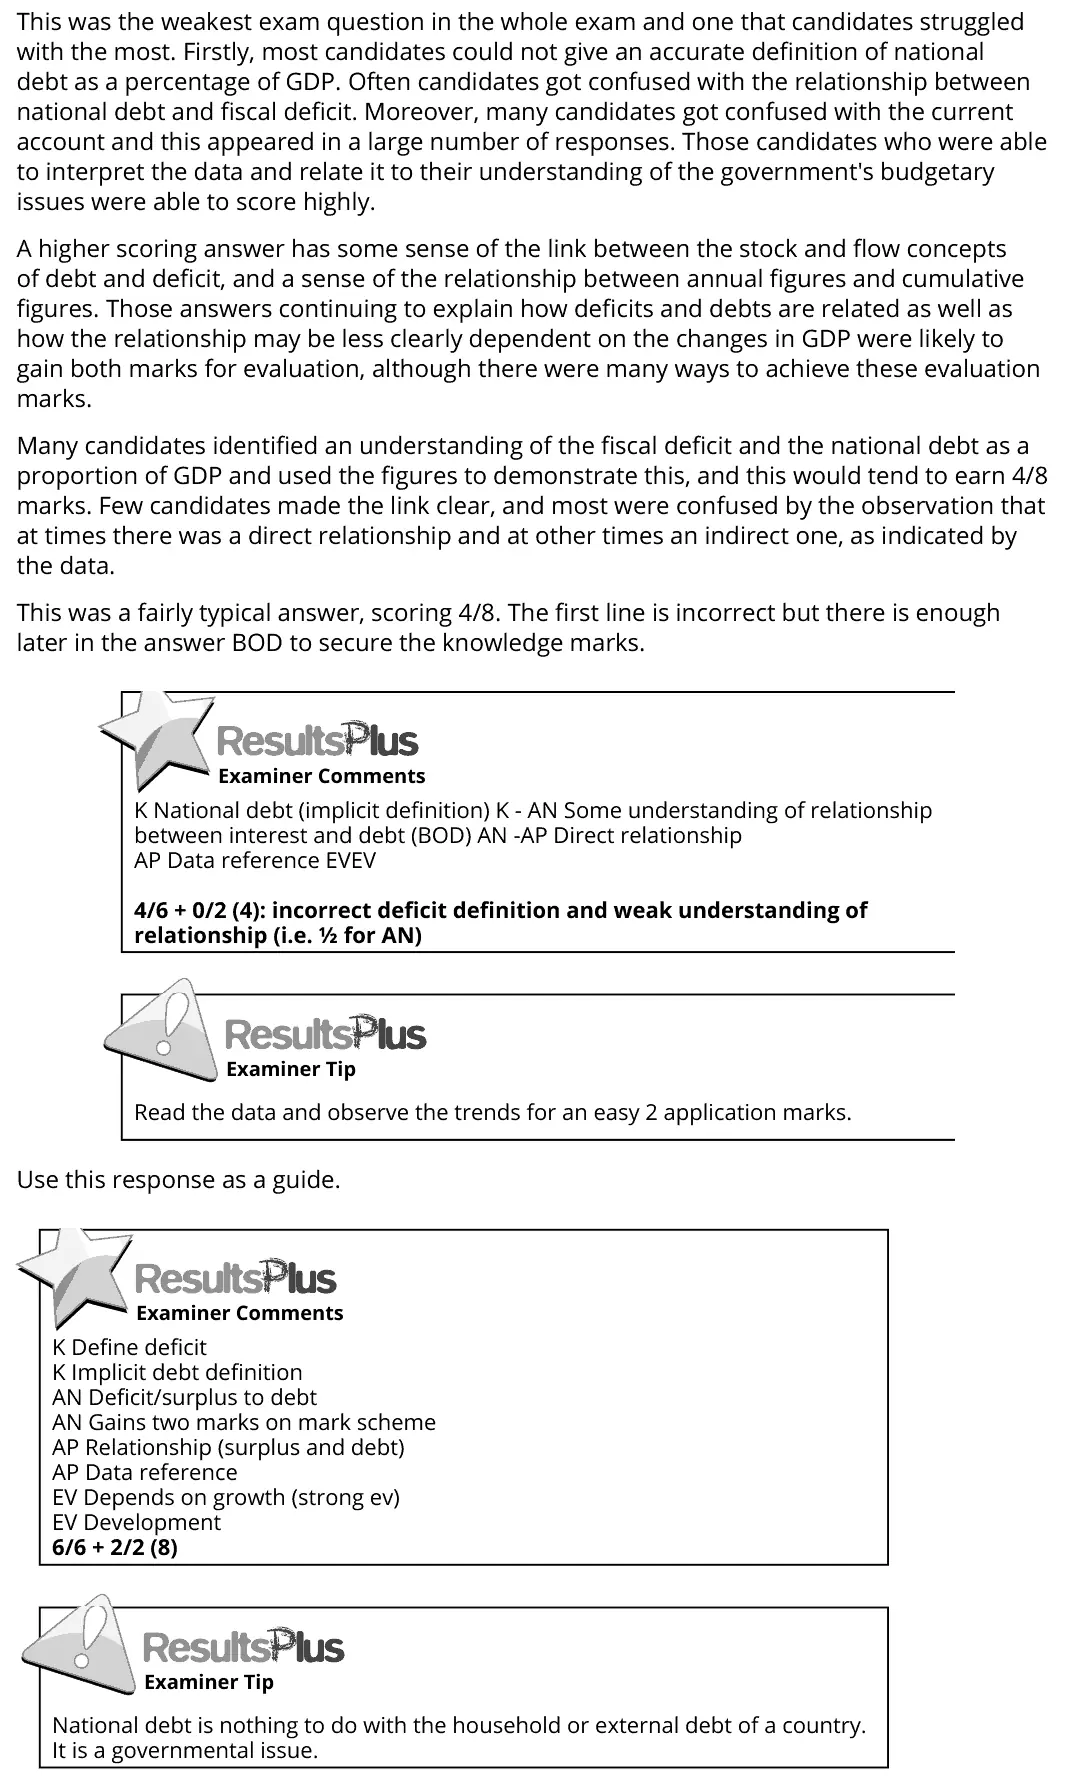
This was the weakest exam question in the whole exam and one that candidates struggled with the most. Firstly, most candidates could not give an accurate definition of national debt as a percentage of GDP. Often candidates got confused with the relationship between national debt and fiscal deficit. Moreover, many candidates got confused with the current account and this appeared in a large number of responses. Those candidates who were able to interpret the data and relate it to their understanding of the government's budgetary issues were able to score highly. A higher scoring answer has some sense of the link between the stock and flow concepts of debt and deficit, and a sense of the relationship between annual figures and cumulative figures. Those answers continuing to explain how deficits and debts are related as well as how the relationship may be less clearly dependent on the changes in GDP were likely to gain both marks for evaluation, although there were many ways to achieve these evaluation marks. Many candidates identified an understanding of the fiscal deficit and the national debt as a proportion of GDP and used the figures to demonstrate this, and this would tend to earn 4/8 marks. Few candidates made the link clear, and most were confused by the observation that at times there was a direct relationship and at other times an indirect one, as indicated by the data. This was a fairly typical answer, scoring 4/8. The first line is incorrect but there is enough later in the answer BOD to secure the knowledge marks. Use this response as a guide. K National debt (implicit definition) K - AN Some understanding of relationship between interest and debt (BOD) AN -AP Direct relationship AP Data reference EVEV 4/6 + 0/2 (4): incorrect deficit definition and weak understanding of relationship (i.e. ½ for AN) Read the data and observe the trends for an easy 2 application marks. K Define deficit K Implicit debt definition AN Deficit/surplus to debt AN Gains two marks on mark scheme AP Relationship (surplus and debt) AP Data reference EV Depends on growth (strong ev) EV Development 6/6 + 2/2 (8) National debt is nothing to do with the household or external debt of a country. It is a governmental issue.
Notes from the mark scheme and report
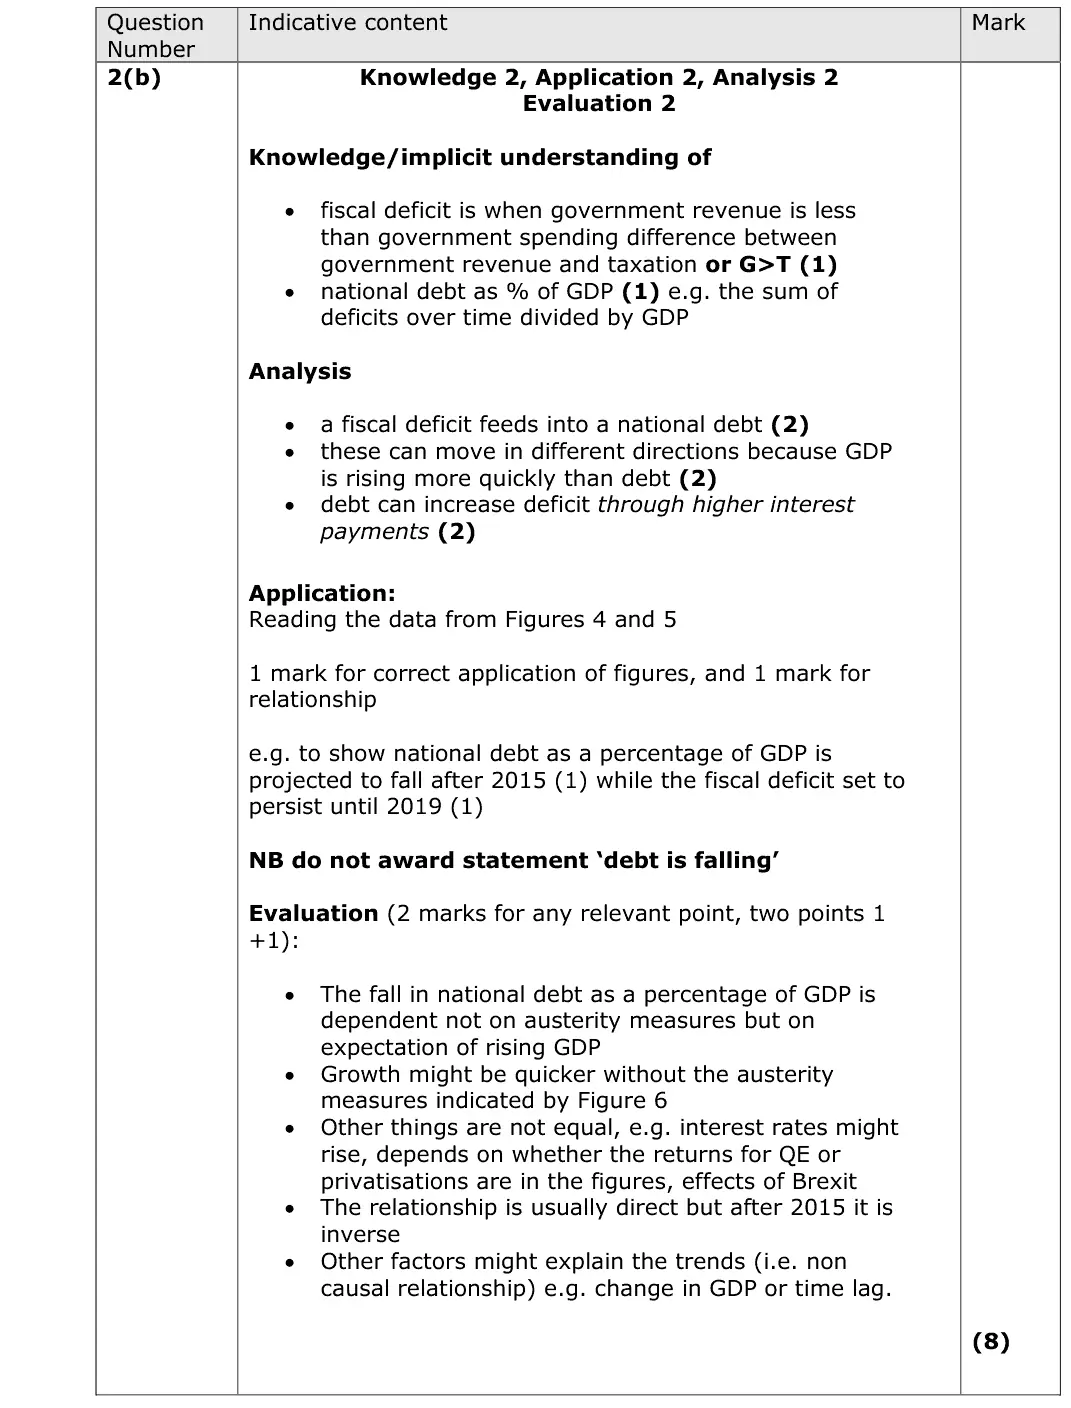
debt is a stock (sum of past deficits), the deficit is a flow
debt as % of GDP can fall while a deficit persists if GDP grows faster
'debt is falling' is not credited
many confused it with the current account
report: "This was the weakest exam question in the whole exam and one that candidates struggled with the most"
Quantitative skills: QS 10 (distinguish between changes in the level of a variable, and the rate of change); QS 9 (interpret, apply and analyse information in written, graphical tabular and numerical forms)
June 2017 · Paper 3 · Q2(e)25 marksAO1=4, AO2=4, AO3=8, AO4=925-mark essayEither/or
Data and extracts for question 2
Mark scheme, including the levels grid and indicative content
Examiner's comment
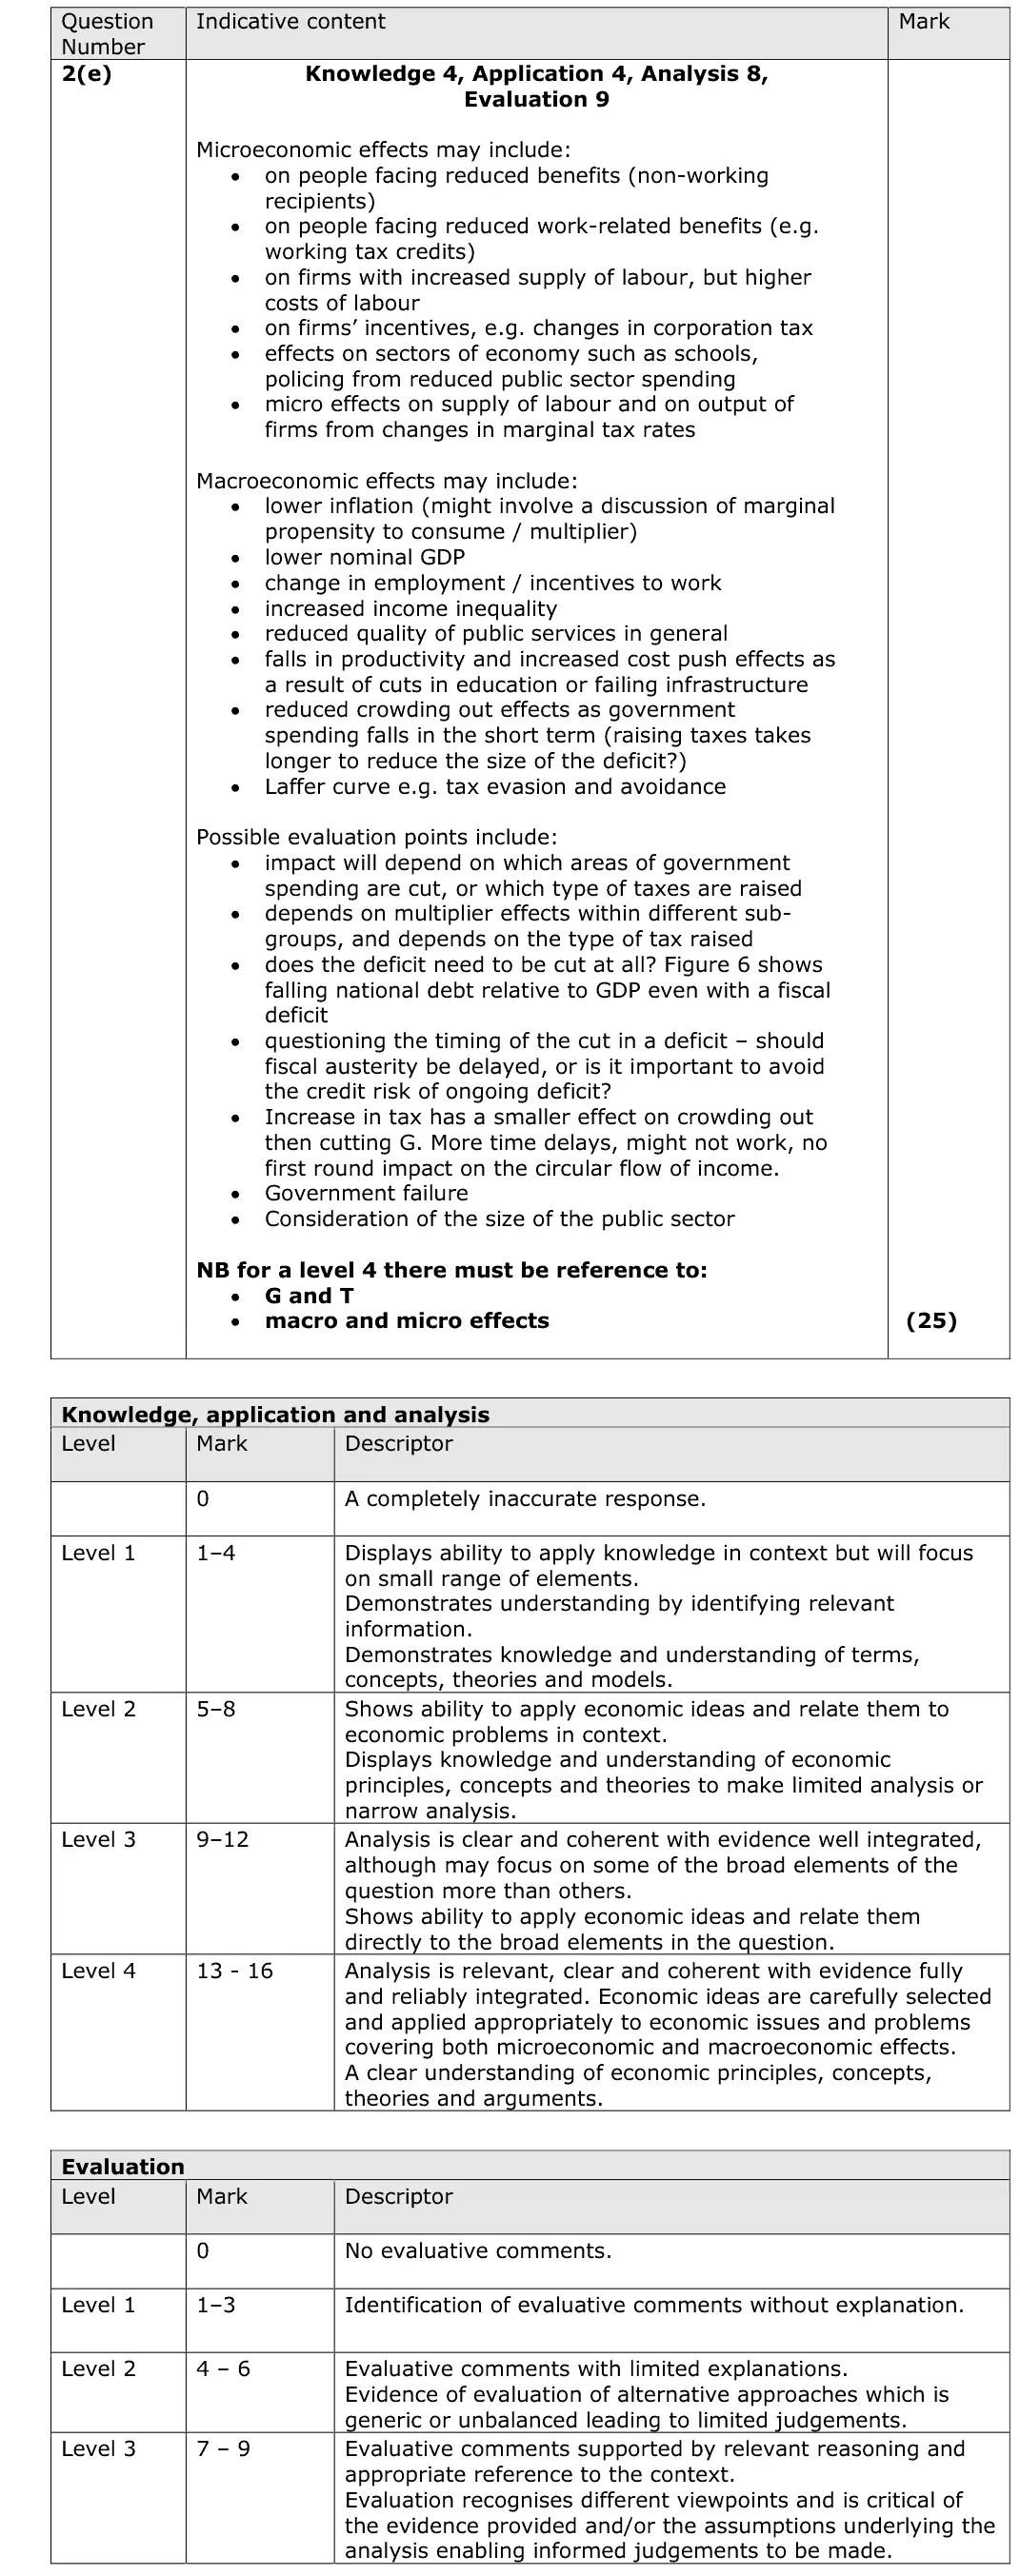
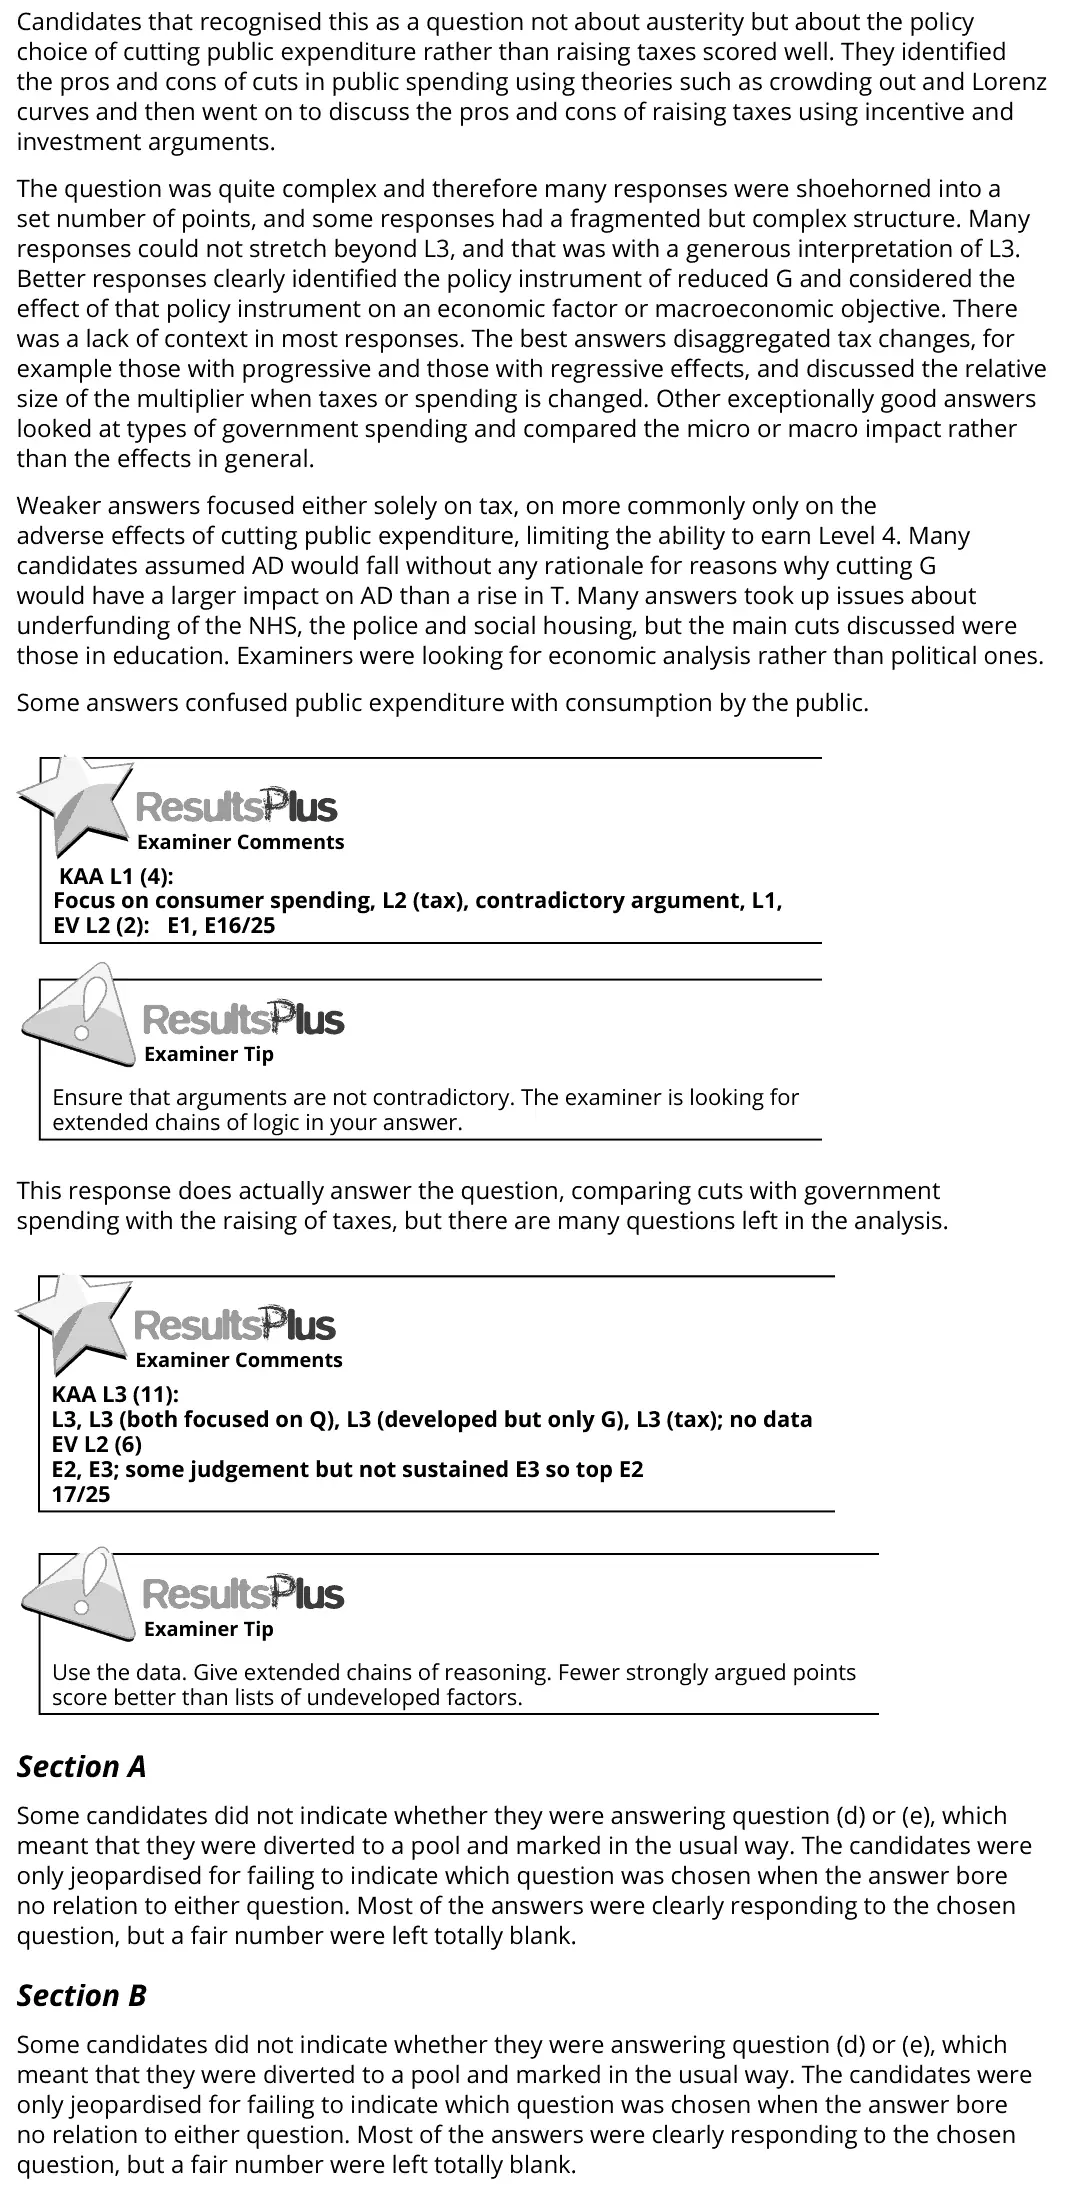
Candidates that recognised this as a question not about austerity but about the policy choice of cutting public expenditure rather than raising taxes scored well. They identified the pros and cons of cuts in public spending using theories such as crowding out and Lorenz curves and then went on to discuss the pros and cons of raising taxes using incentive and investment arguments. The question was quite complex and therefore many responses were shoehorned into a set number of points, and some responses had a fragmented but complex structure. Many responses could not stretch beyond L3, and that was with a generous interpretation of L3. Better responses clearly identified the policy instrument of reduced G and considered the effect of that policy instrument on an economic factor or macroeconomic objective. There was a lack of context in most responses. The best answers disaggregated tax changes, for example those with progressive and those with regressive effects, and discussed the relative size of the multiplier when taxes or spending is changed. Other exceptionally good answers looked at types of government spending and compared the micro or macro impact rather than the effects in general. Weaker answers focused either solely on tax, on more commonly only on the adverse effects of cutting public expenditure, limiting the ability to earn Level 4. Many candidates assumed AD would fall without any rationale for reasons why cutting G would have a larger impact on AD than a rise in T. Many answers took up issues about underfunding of the NHS, the police and social housing, but the main cuts discussed were those in education. Examiners were looking for economic analysis rather than political ones. Some answers confused public expenditure with consumption by the public. KAA L1 (4): Focus on consumer spending, L2 (tax), contradictory argument, L1, EV L2 (2): E1, E16/25 Ensure that arguments are not contradictory. The examiner is looking for extended chains of logic in your answer. This response does actually answer the question, comparing cuts with government spending with the raising of taxes, but there are many questions left in the analysis. Section A Some candidates did not indicate whether they were answering question (d) or (e), which meant that they were diverted to a pool and marked in the usual way. The candidates were only jeopardised for failing to indicate which question was chosen when the answer bore no relation to either question. Most of the answers were clearly responding to the chosen question, but a fair number were left totally blank. Section B Some candidates did not indicate whether they were answering question (d) or (e), which meant that they were diverted to a pool and marked in the usual way. The candidates were only jeopardised for failing to indicate which question was chosen when the answer bore no relation to either question. Most of the answers were clearly responding to the chosen question, but a fair number were left totally blank. Use the data. Give extended chains of reasoning. Fewer strongly argued points score better than lists of undeveloped factors. KAA L3 (11): L3, L3 (both focused on Q), L3 (developed but only G), L3 (tax); no data EV L2 (6) E2, E3; some judgement but not sustained E3 so top E2 17/25
Notes from the mark scheme and report
a choice between cutting G and raising T, not general austerity
Level 4 needs both G and T and micro and macro effects