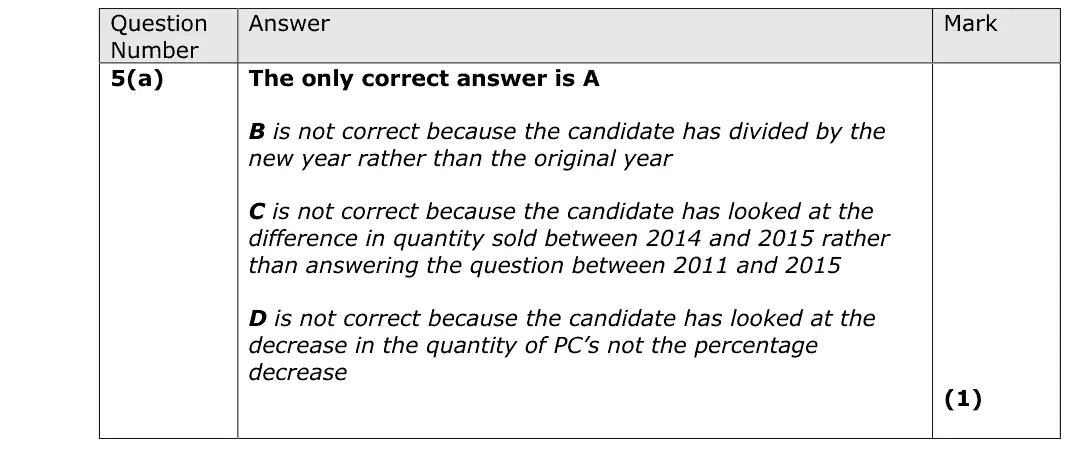
Answer
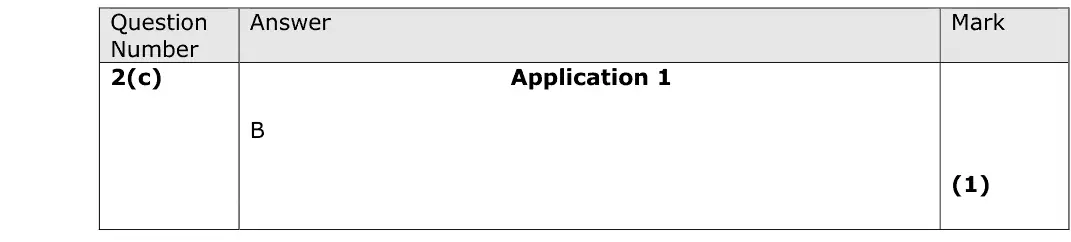
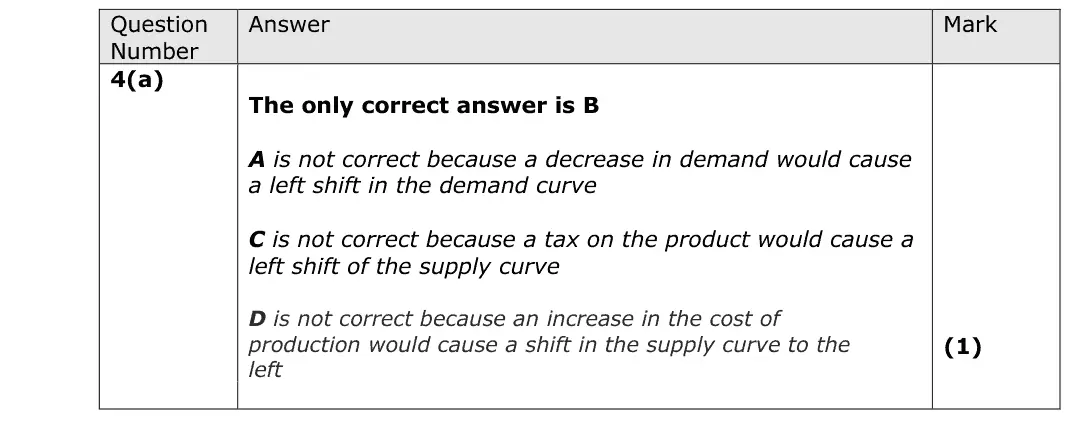
B
Mark scheme
Notes from the mark scheme and report
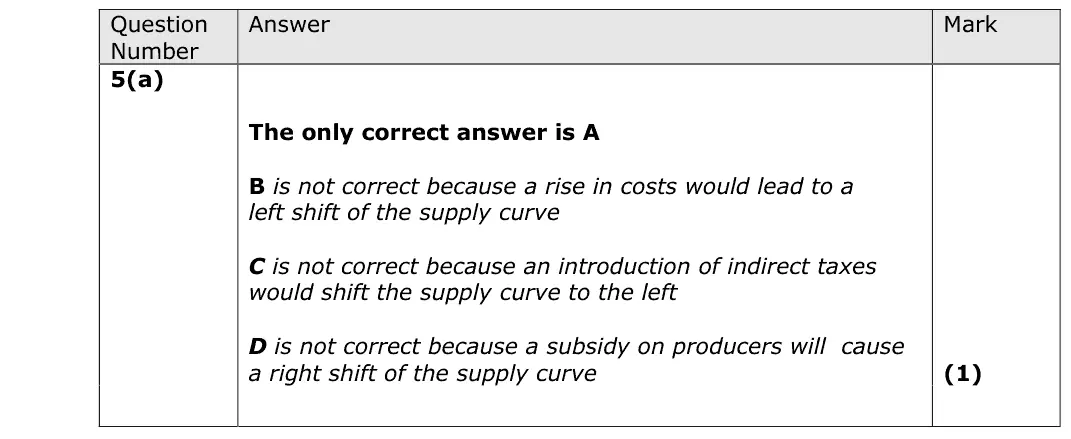
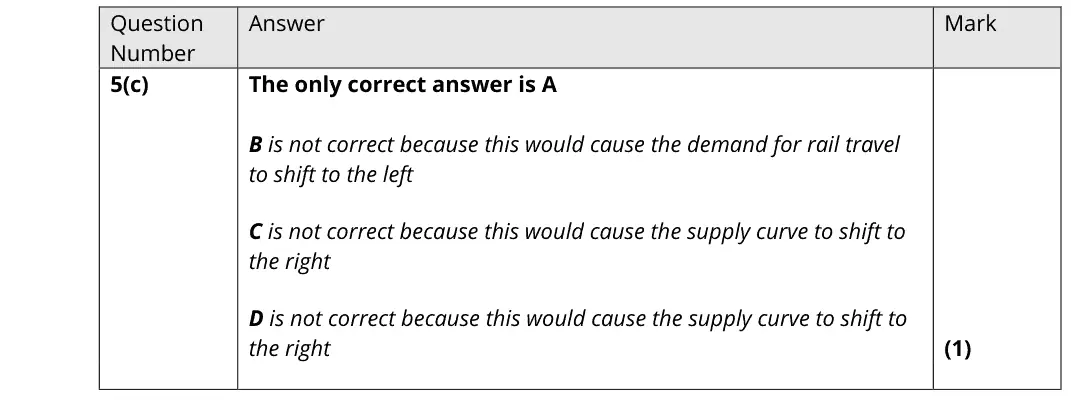
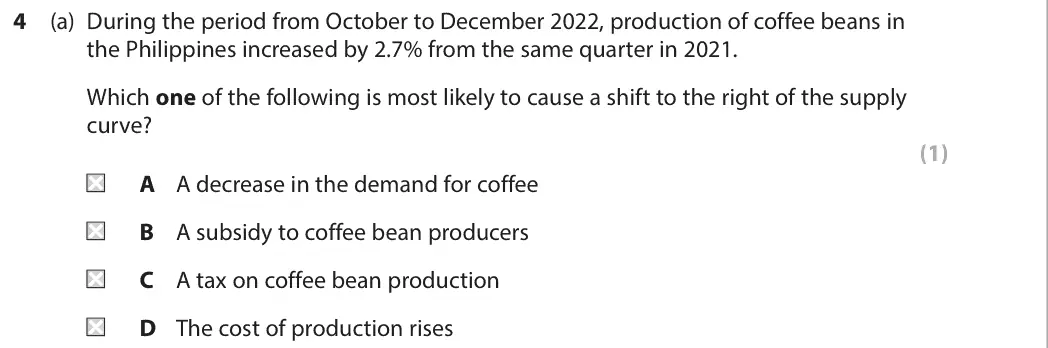
- a subsidy to coffee bean producers lowers costs and shifts supply right (B)
- a fall in demand shifts demand, a tax and rising costs shift supply left
Notes and key-term cards for this topic are being written by our tutors. The past-paper questions below are ready now.
| Series | Paper | Q | Marks | Title |
|---|---|---|---|---|
| June 2019 | AS Paper 1 | 6(f) | 20 | Evaluate possible ways the government could intervene to reduce the excess demand for state-funded health care. |
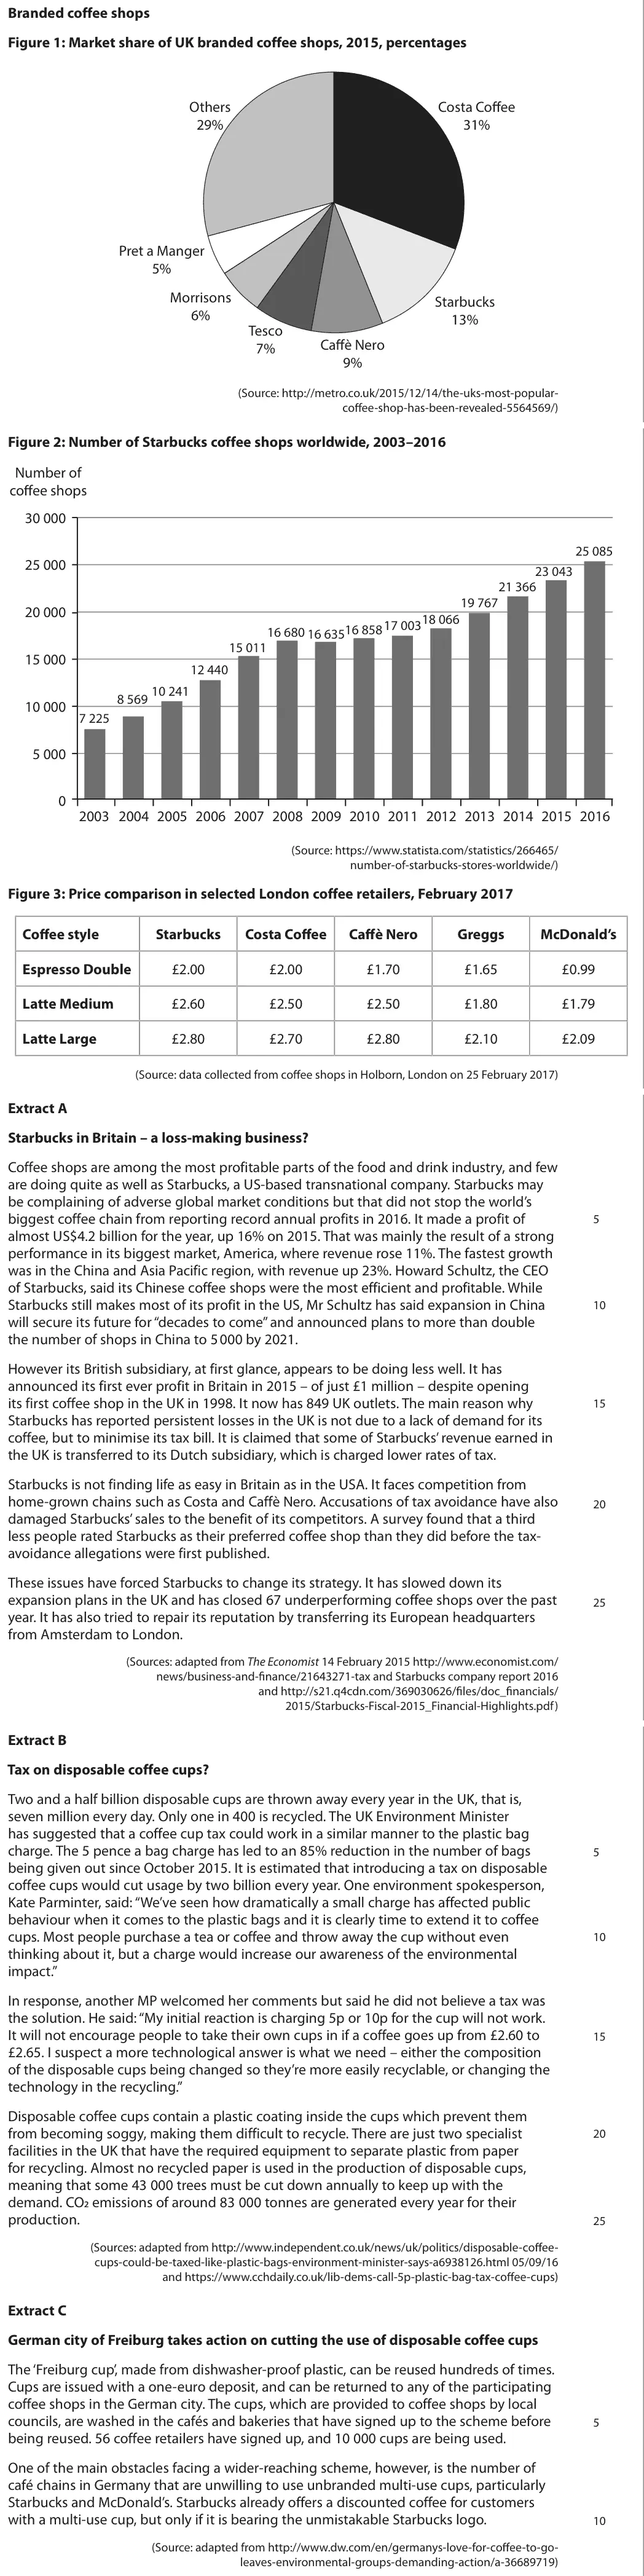
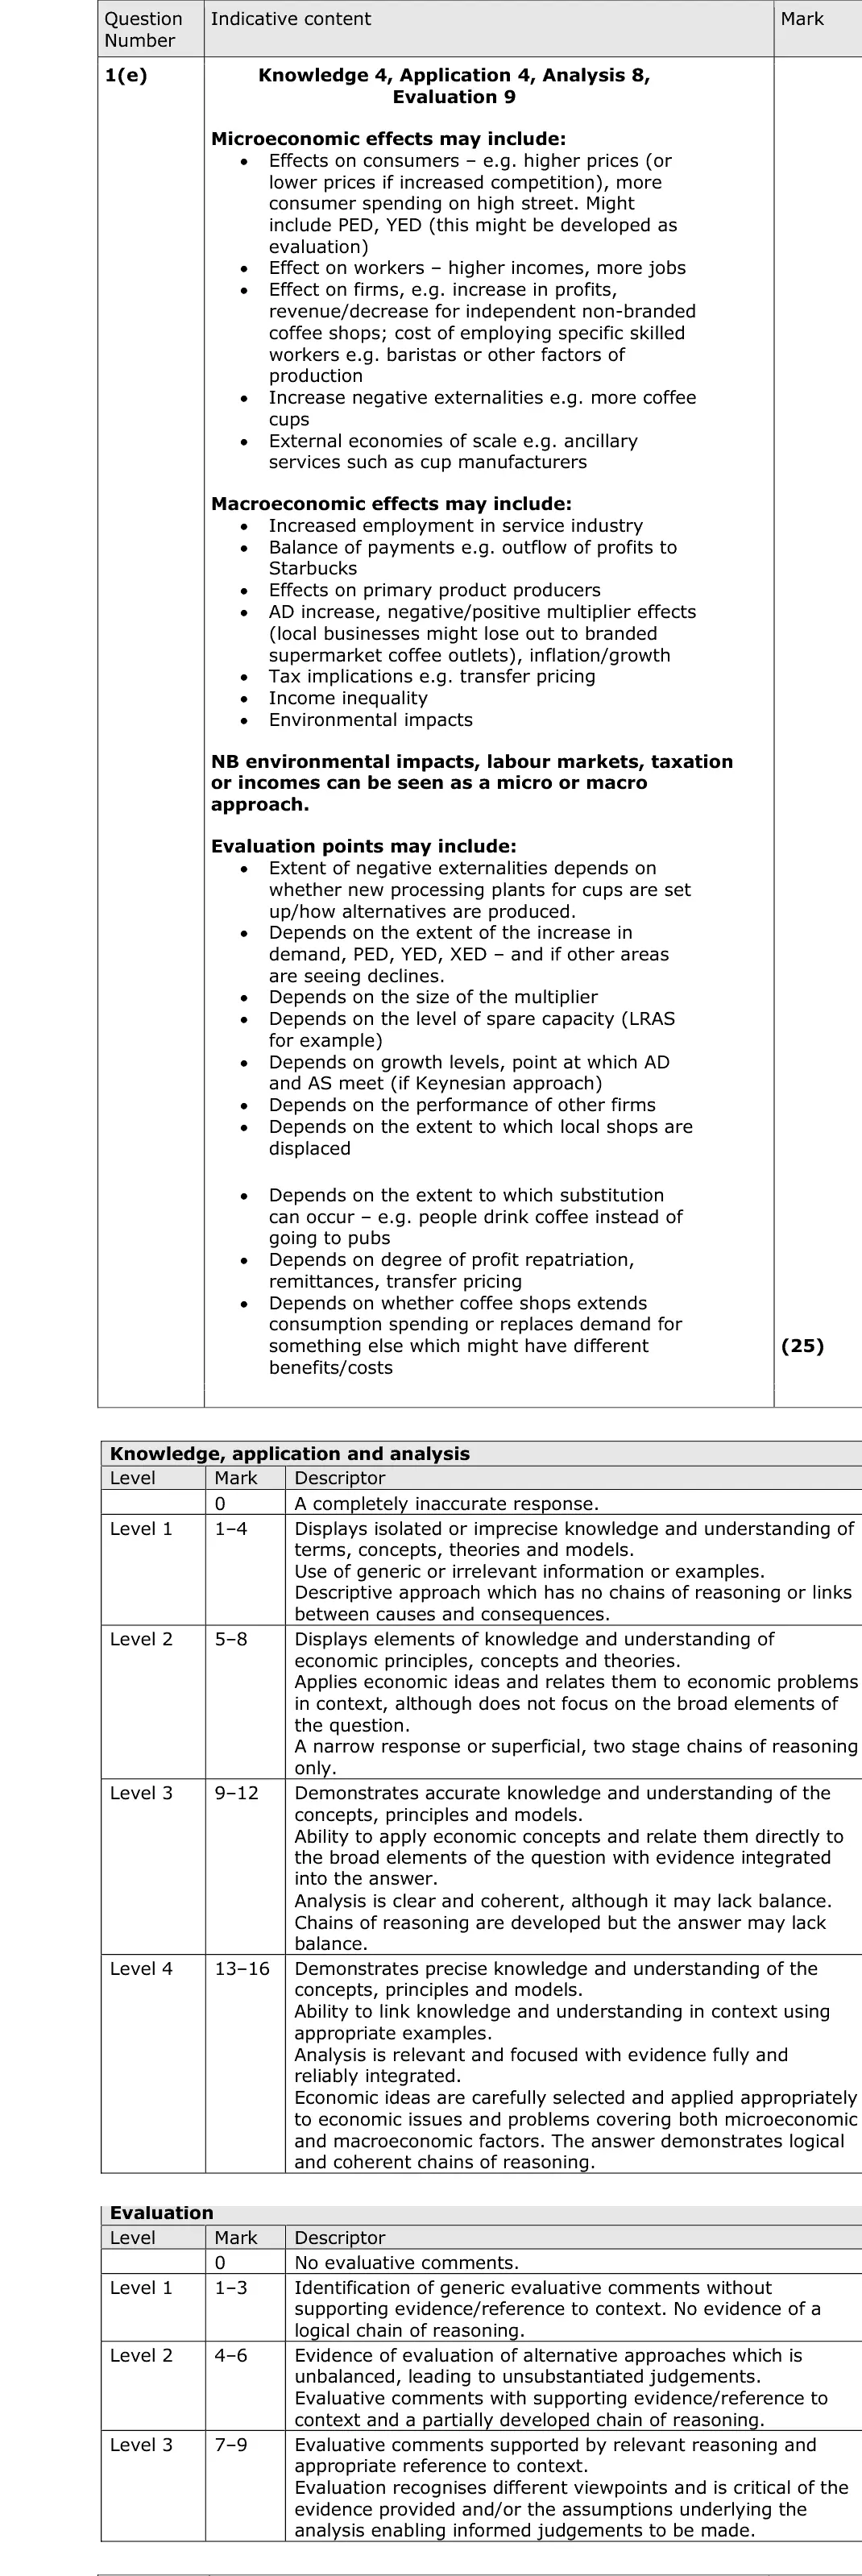
| June 2018 | Paper 3 | 1(e) | 25 | With reference to the information provided and your own knowledge, evaluate the microeconomic and macroeconomic effects of increased UK demand for coffee at branded coffee shops. |
B

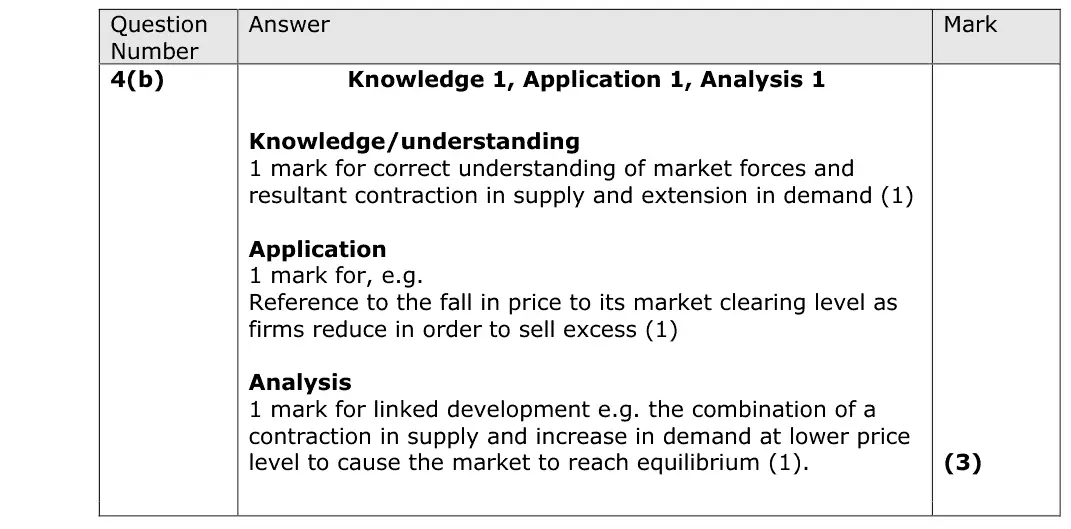
This question was well answered broadly, with many candidates understanding the functions of the price mechanism, and could clearly articulate why this would reduce the excess supply of coffee as mentioned in the question. Referring to coffee, and the price falling due to the high supply were essential to score well on this question.
A

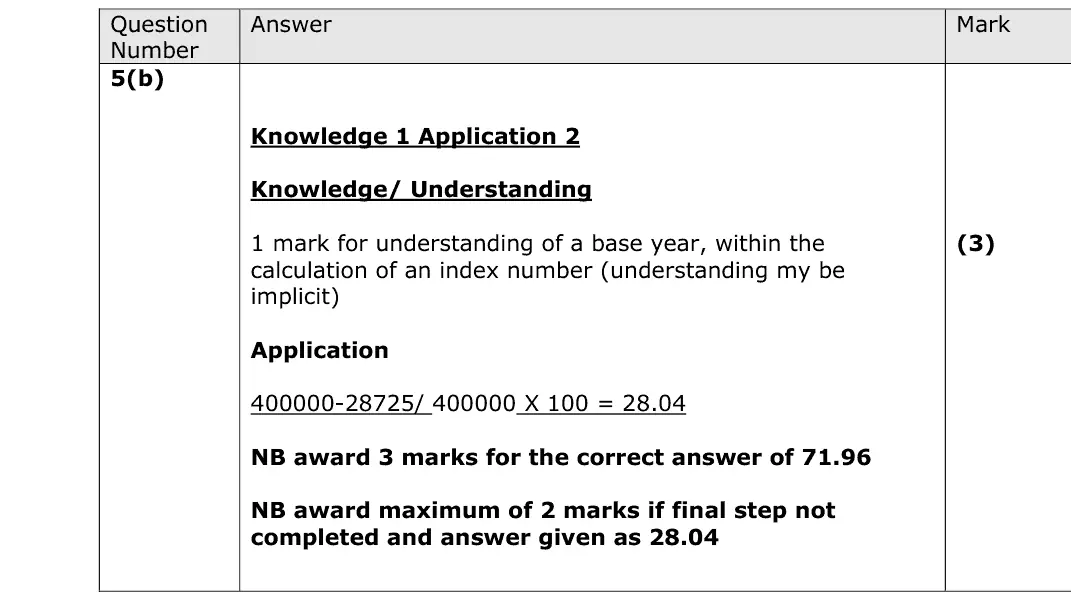
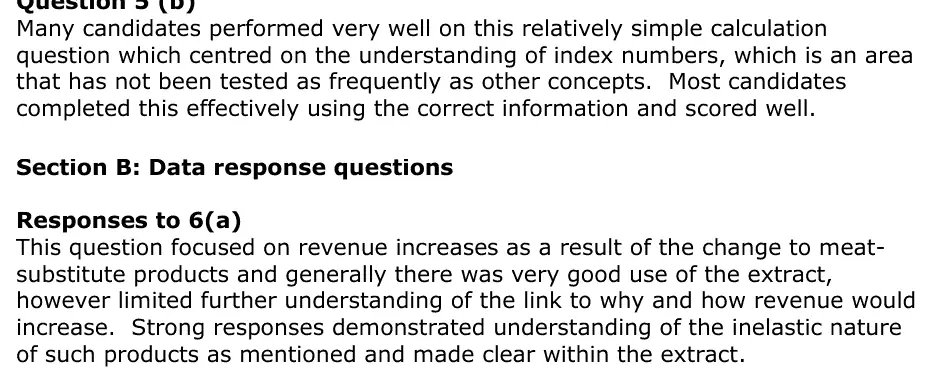
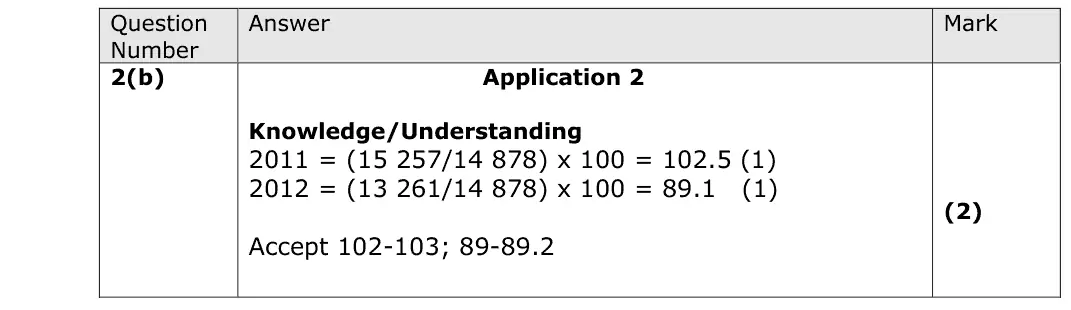
Many candidates performed very well on this relatively simple calculation question which centred on the understanding of index numbers, which is an area that has not been tested as frequently as other concepts. Most candidates completed this effectively using the correct information and scored well. Section B: Data response questions Responses to 6(a) This question focused on revenue increases as a result of the change to meat- substitute products and generally there was very good use of the extract, however limited further understanding of the link to why and how revenue would increase. Strong responses demonstrated understanding of the inelastic nature of such products as mentioned and made clear within the extract.
Quantitative skills: QS 5 (calculate and interpret index numbers); QS 9 (interpret, apply and analyse information in written, graphical tabular and numerical forms)

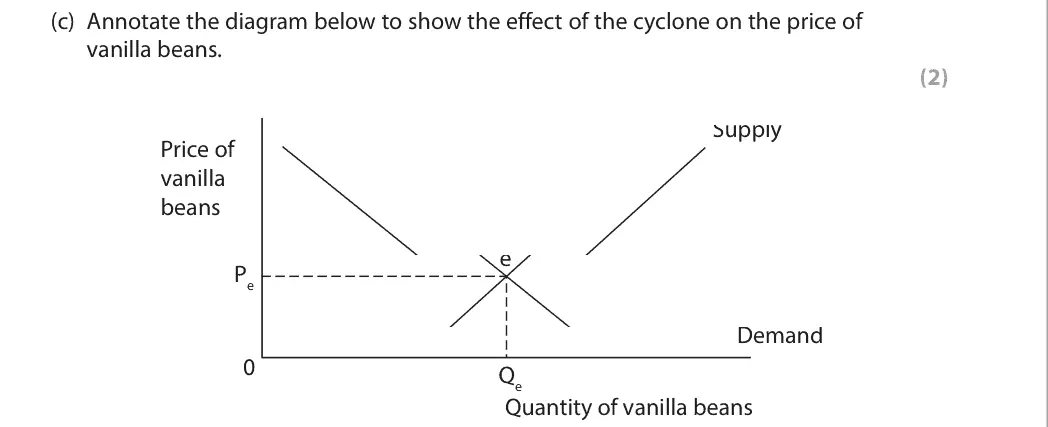
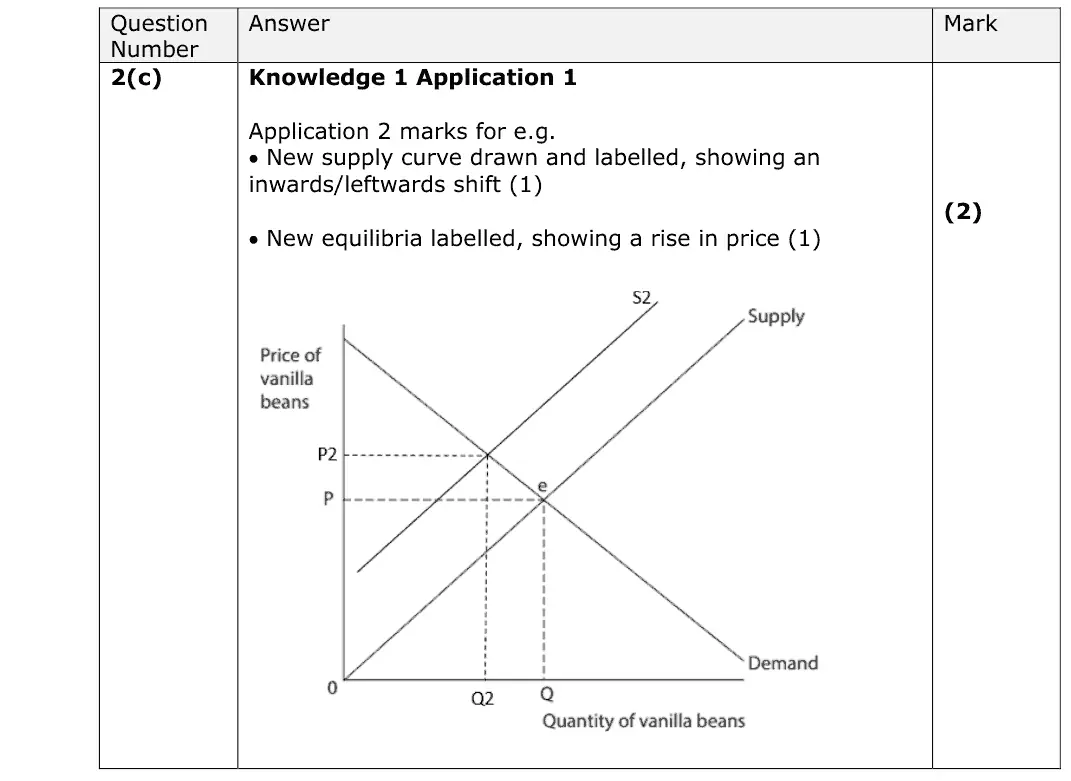
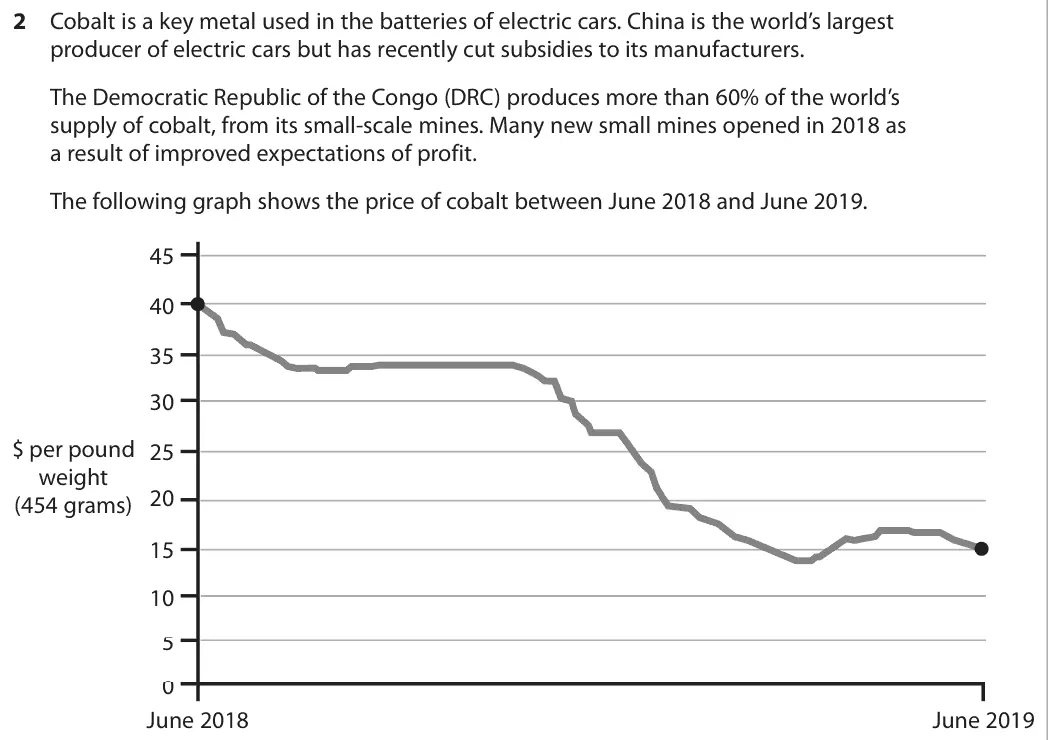
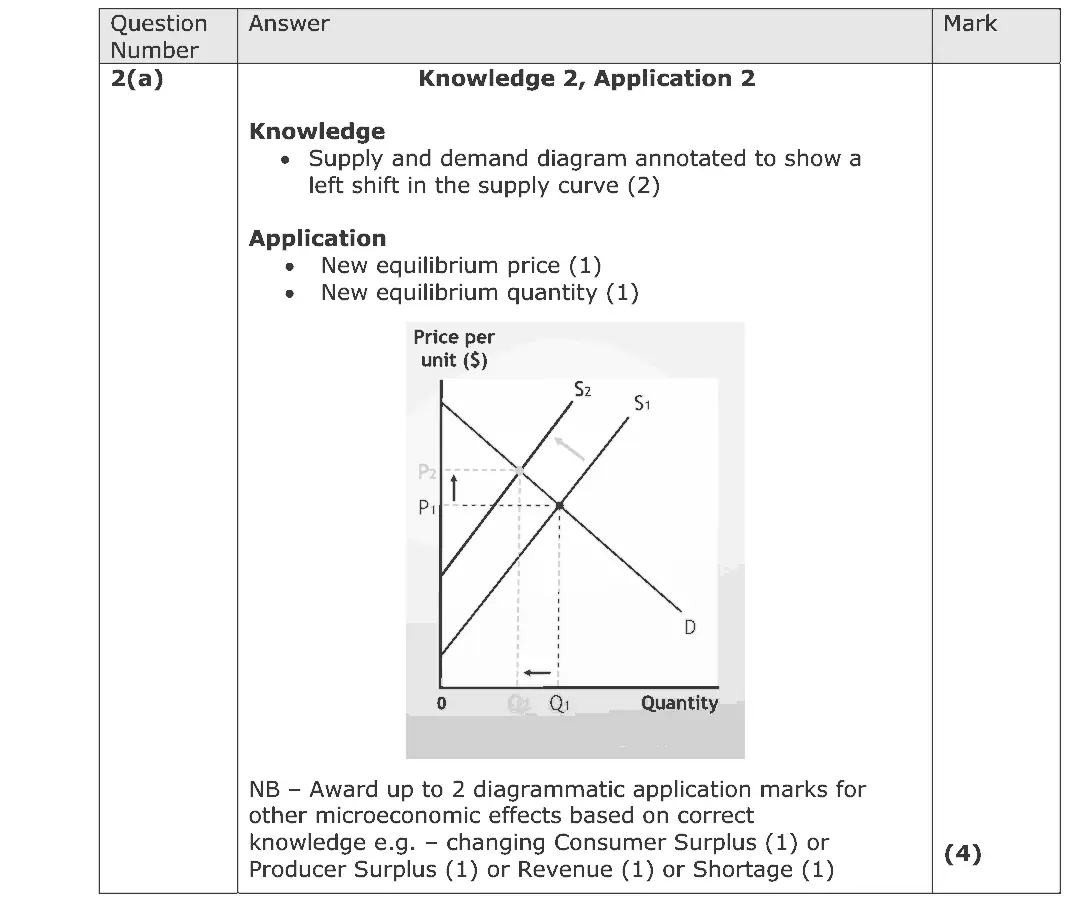
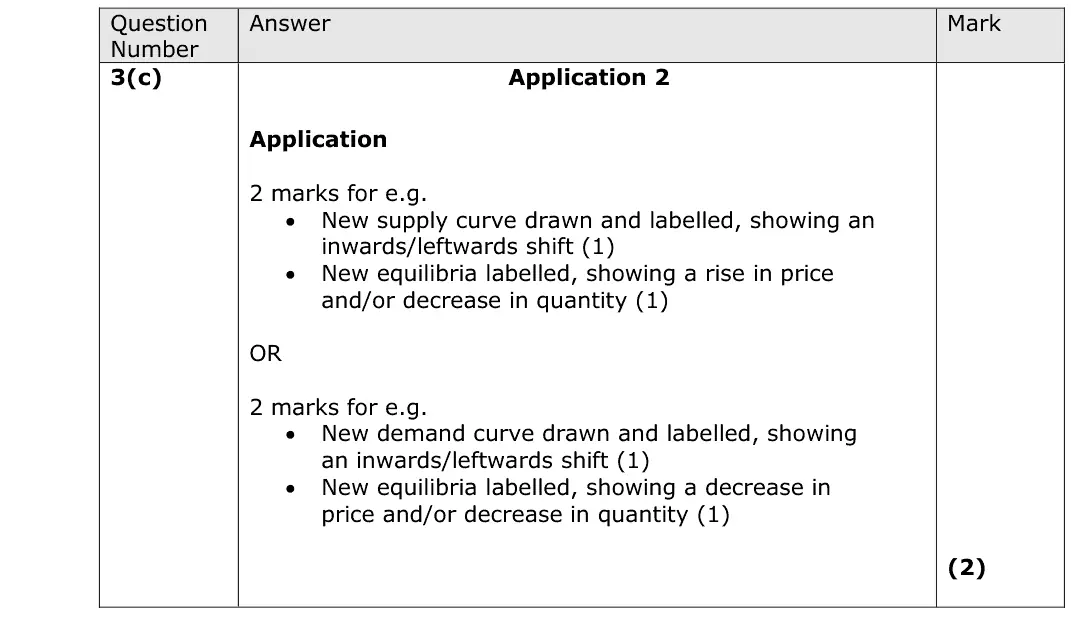
This question was diagrammatical and targeted the production of a new equilibrium point, given a shift in supply to the left. In addition, with a subsequent increase in price and fall in in quantity demanded. Students that lost marks did not label the axes, show the change in price or quantity, or shifted the demand curve instead.
Quantitative skills: QS 4 (construct and interpret a range of standard graphical forms)

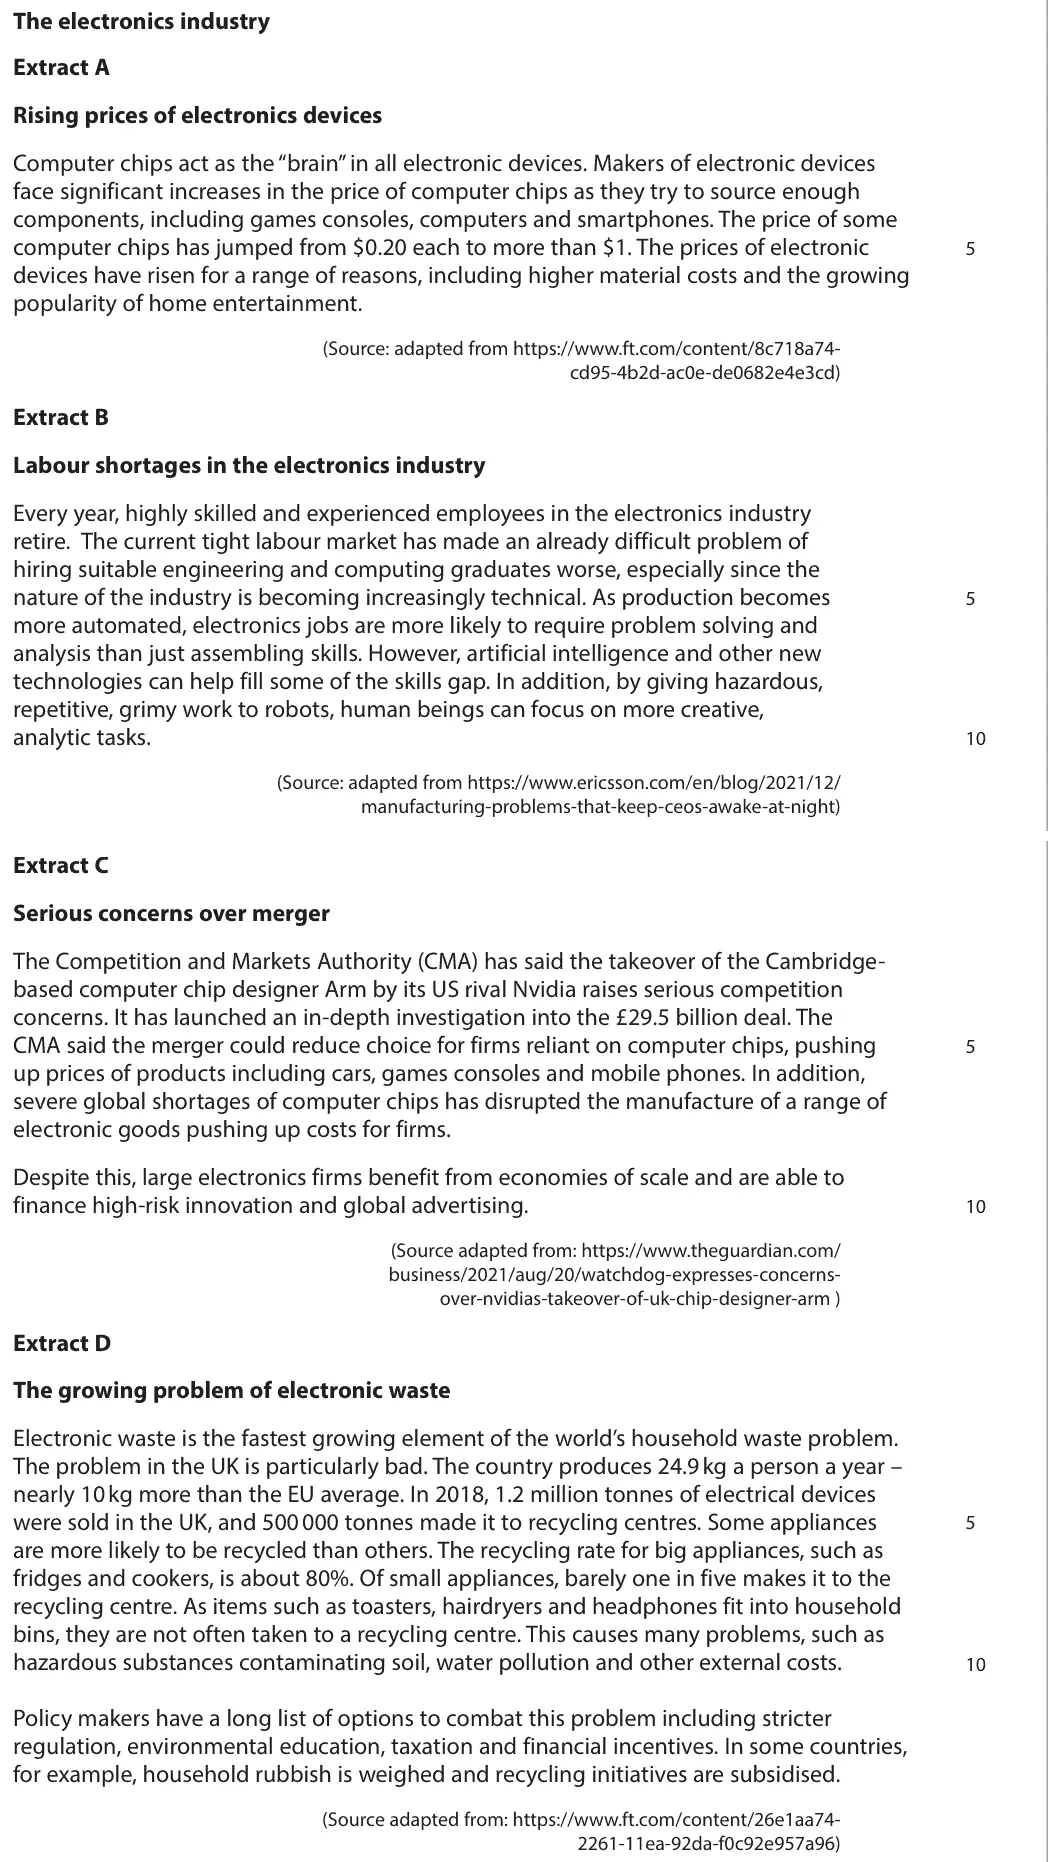
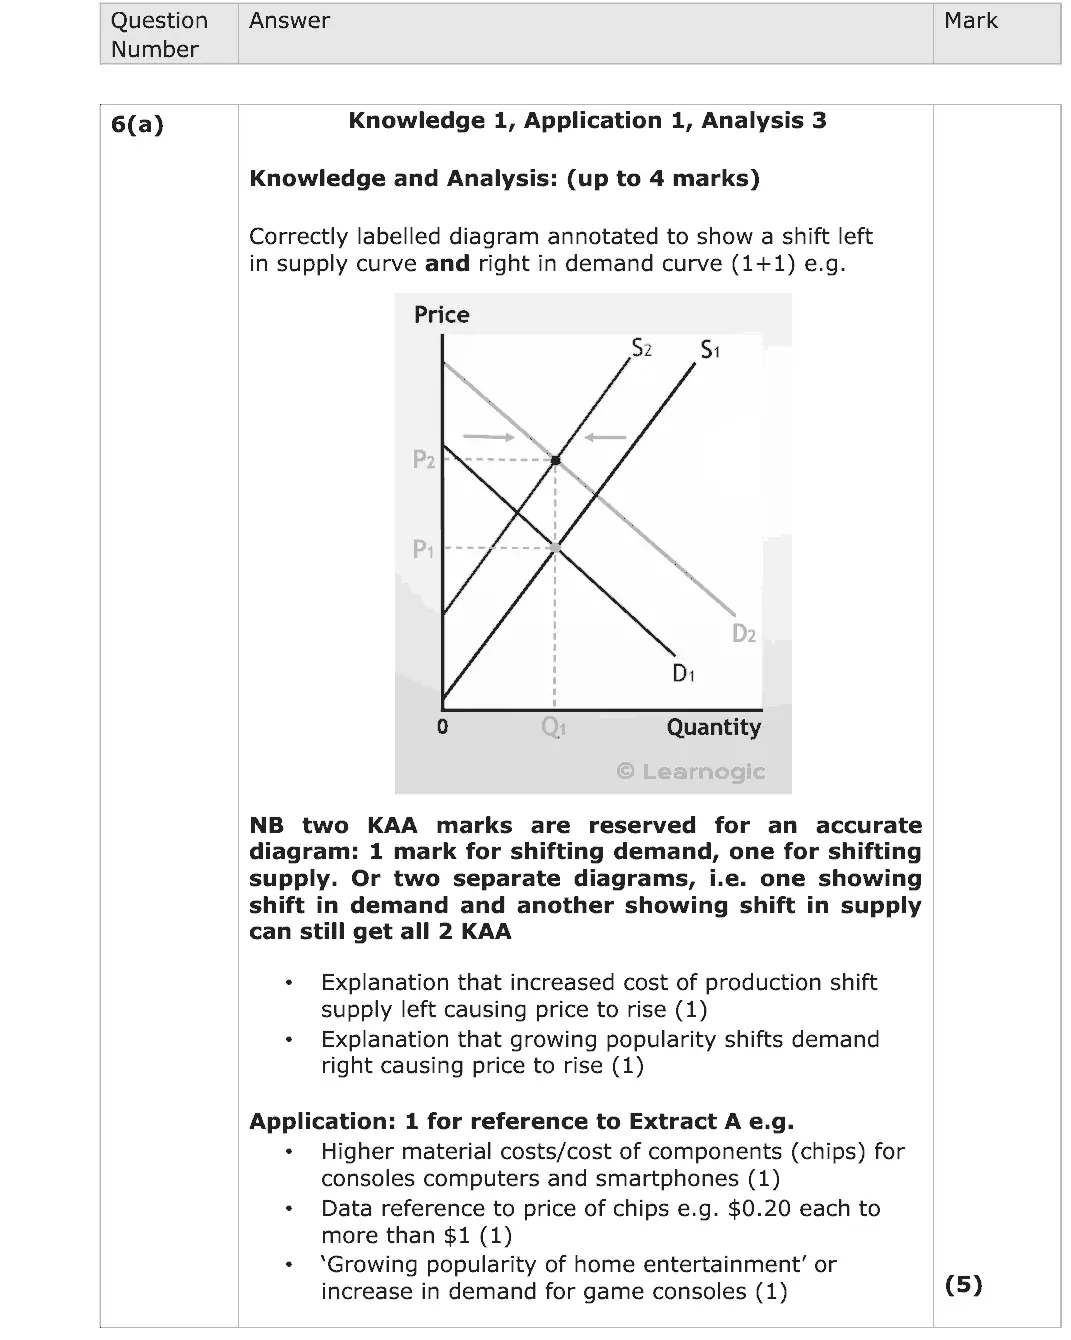
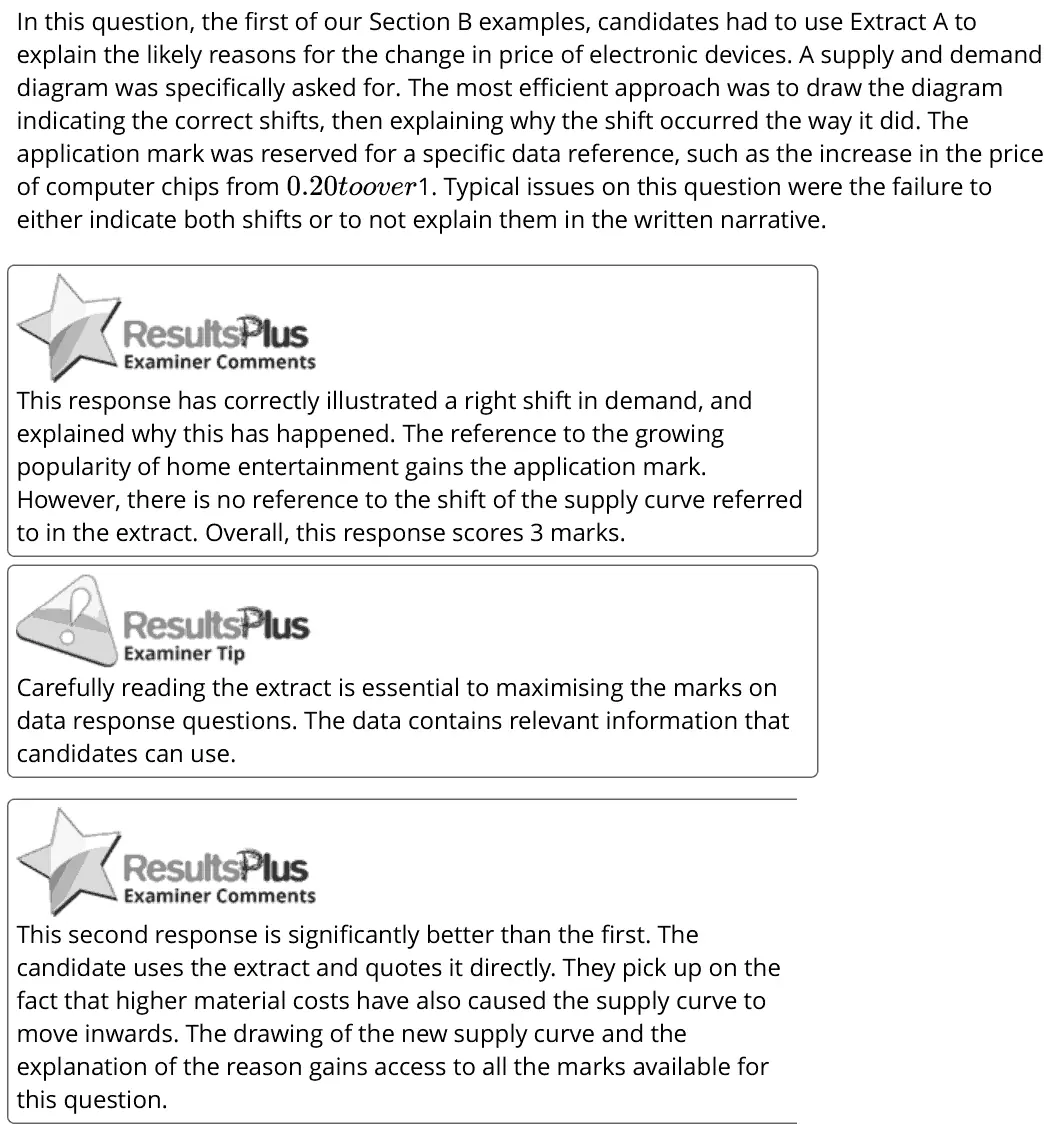
In this question, the first of our Section B examples, candidates had to use Extract A to explain the likely reasons for the change in price of electronic devices. A supply and demand diagram was specifically asked for. The most efficient approach was to draw the diagram indicating the correct shifts, then explaining why the shift occurred the way it did. The application mark was reserved for a specific data reference, such as the increase in the price of computer chips from 1. Typical issues on this question were the failure to either indicate both shifts or to not explain them in the written narrative. 0.20toover This response has correctly illustrated a right shift in demand, and explained why this has happened. The reference to the growing popularity of home entertainment gains the application mark. However, there is no reference to the shift of the supply curve referred to in the extract. Overall, this response scores 3 marks. Carefully reading the extract is essential to maximising the marks on data response questions. The data contains relevant information that candidates can use. This second response is significantly better than the first. The candidate uses the extract and quotes it directly. They pick up on the fact that higher material costs have also caused the supply curve to move inwards. The drawing of the new supply curve and the explanation of the reason gains access to all the marks available for this question.
Quantitative skills: QS 4 (construct and interpret a range of standard graphical forms); QS 9 (interpret, apply and analyse information in written, graphical tabular and numerical forms)

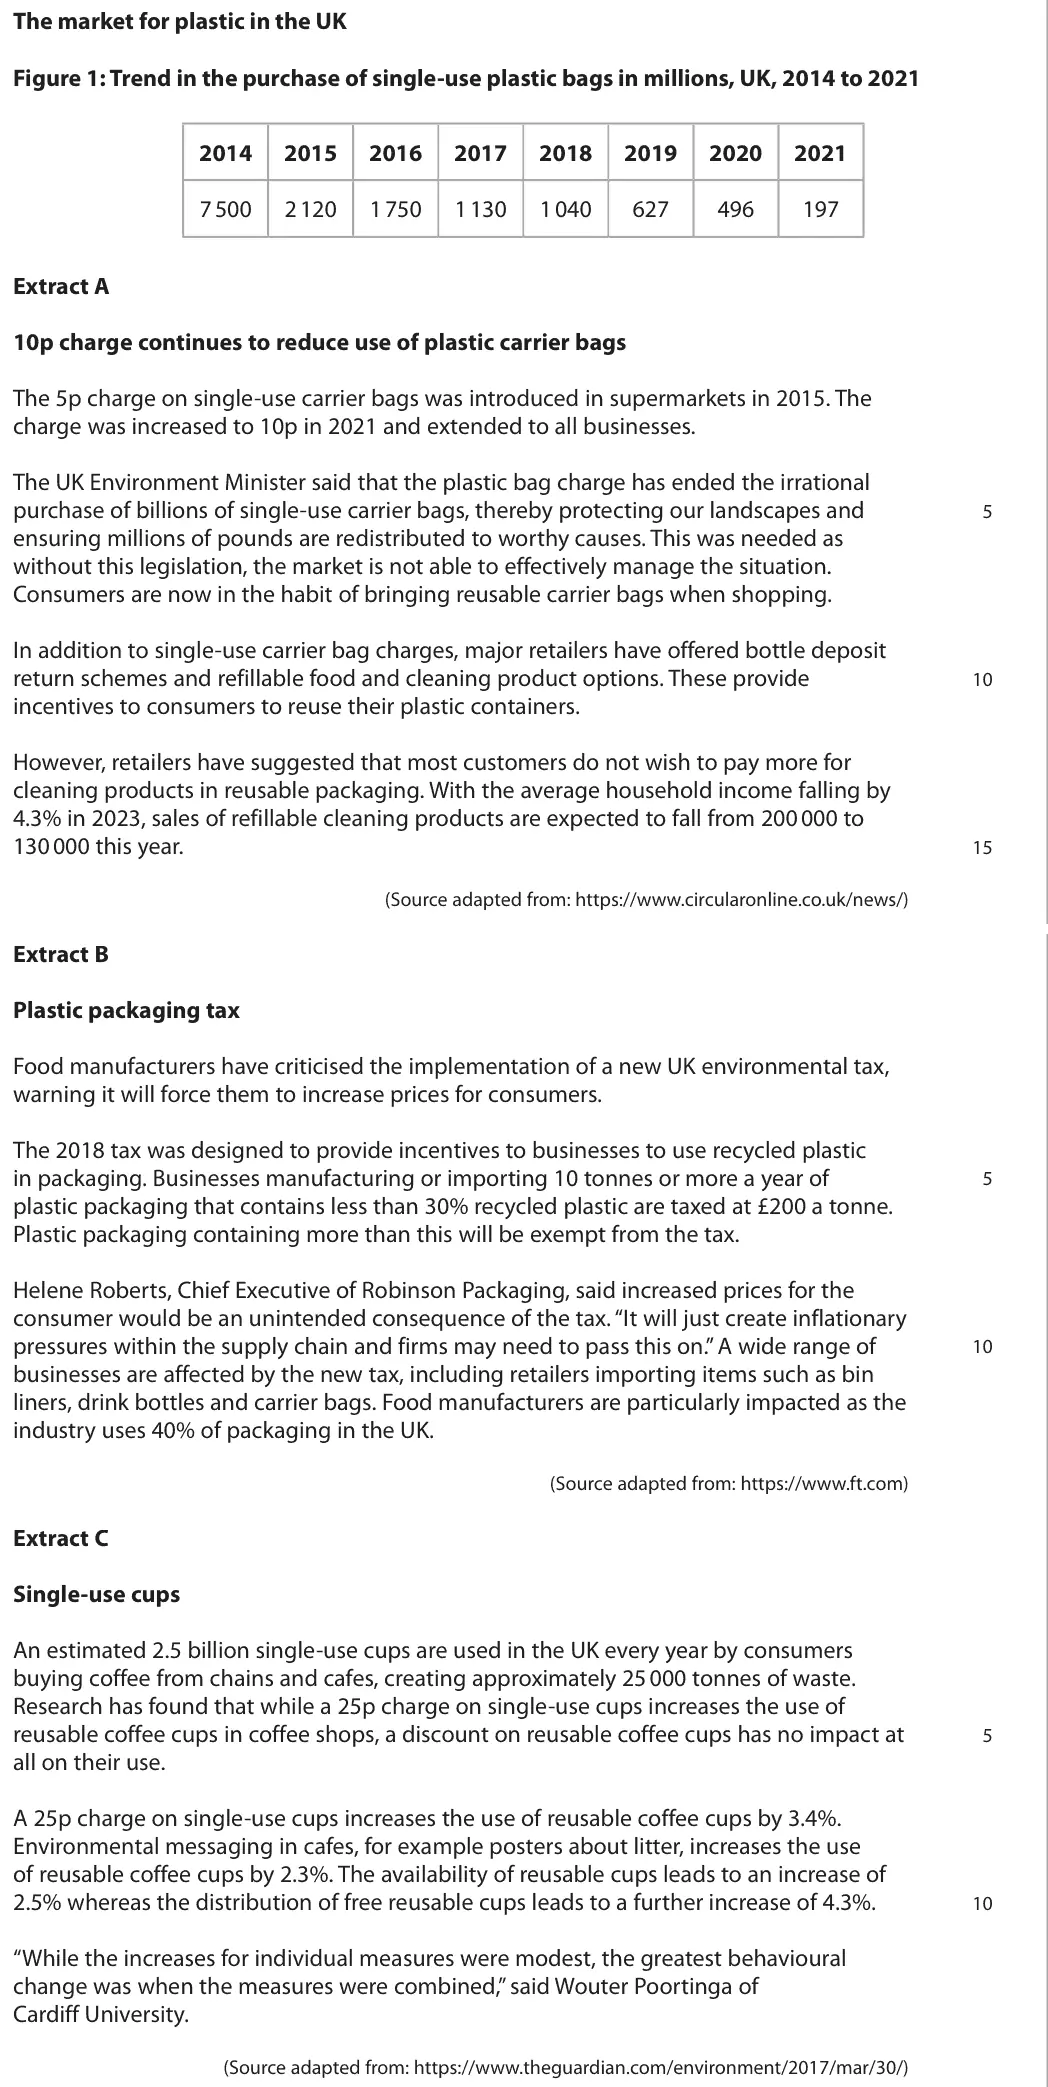
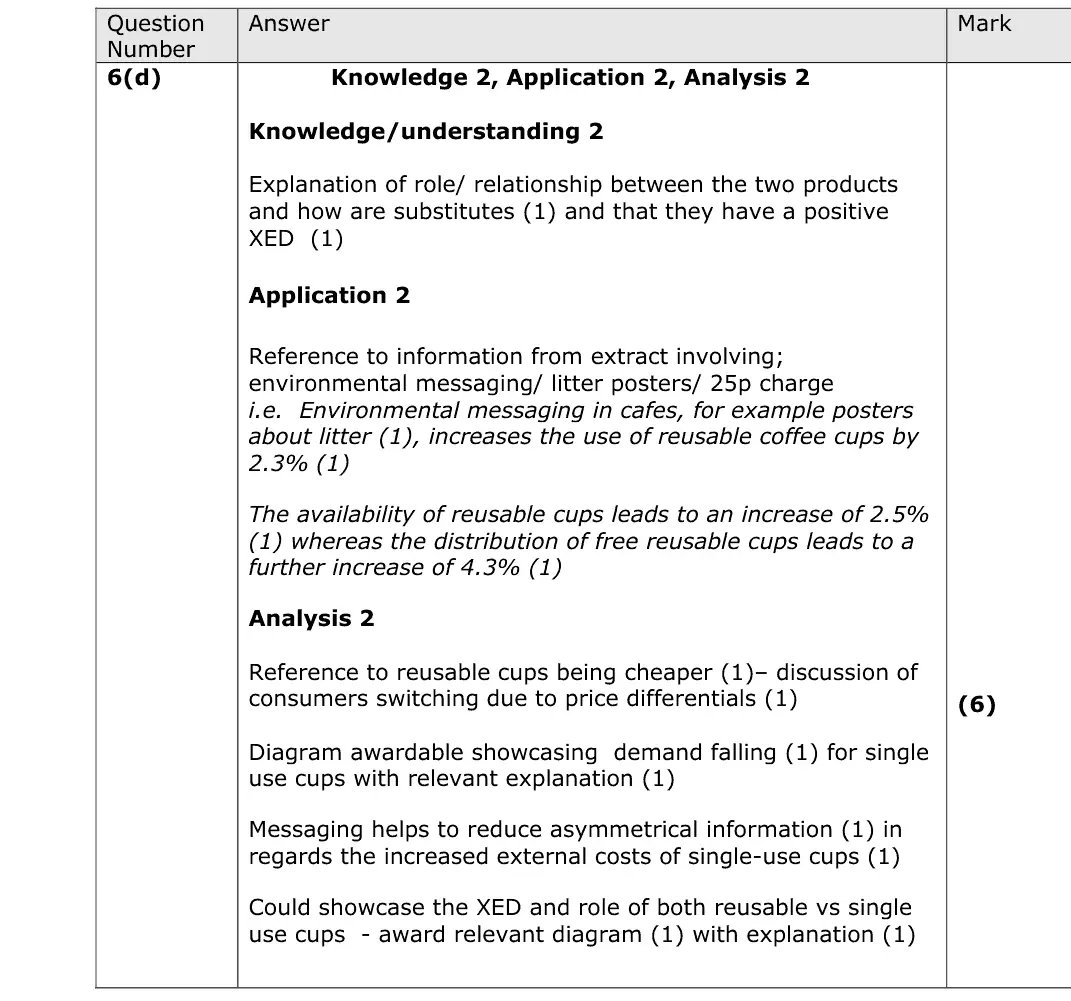
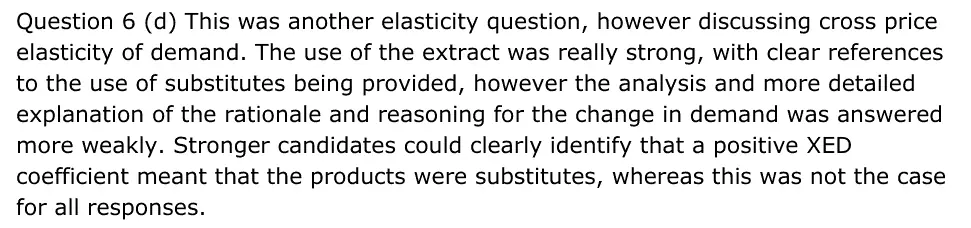
Question 6 (d) This was another elasticity question, however discussing cross price elasticity of demand. The use of the extract was really strong, with clear references to the use of substitutes being provided, however the analysis and more detailed explanation of the rationale and reasoning for the change in demand was answered more weakly. Stronger candidates could clearly identify that a positive XED coefficient meant that the products were substitutes, whereas this was not the case for all responses.
Quantitative skills: QS 8 (make calculations of elasticity and interpret the result)

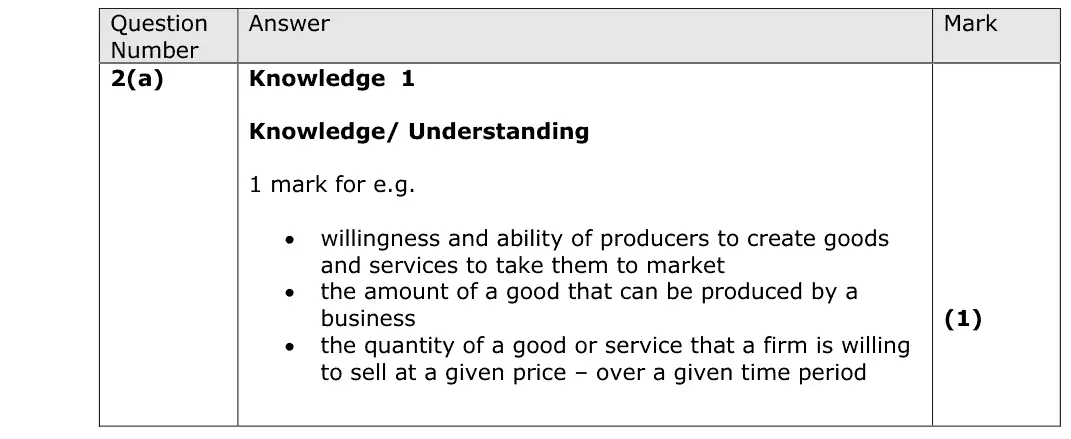
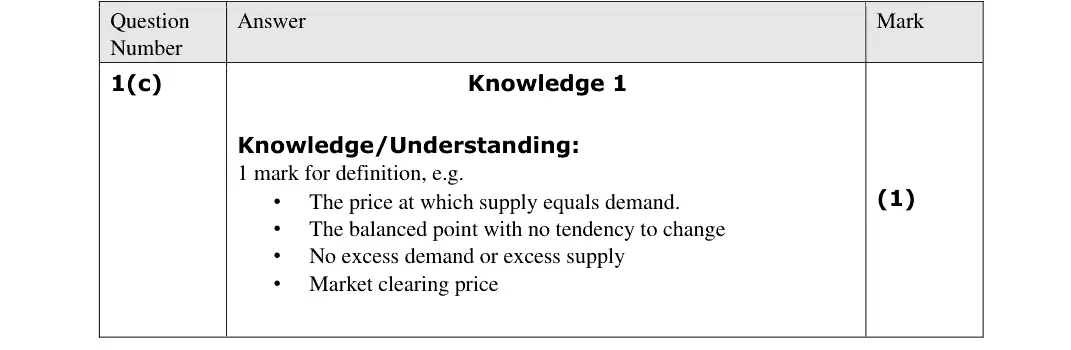
Virtually all candidates were able to accurately define equilibrium price, linking this to demand and supply meeting

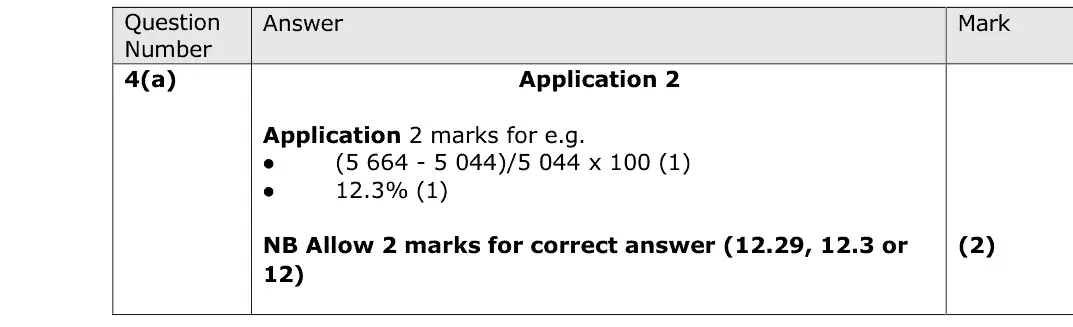
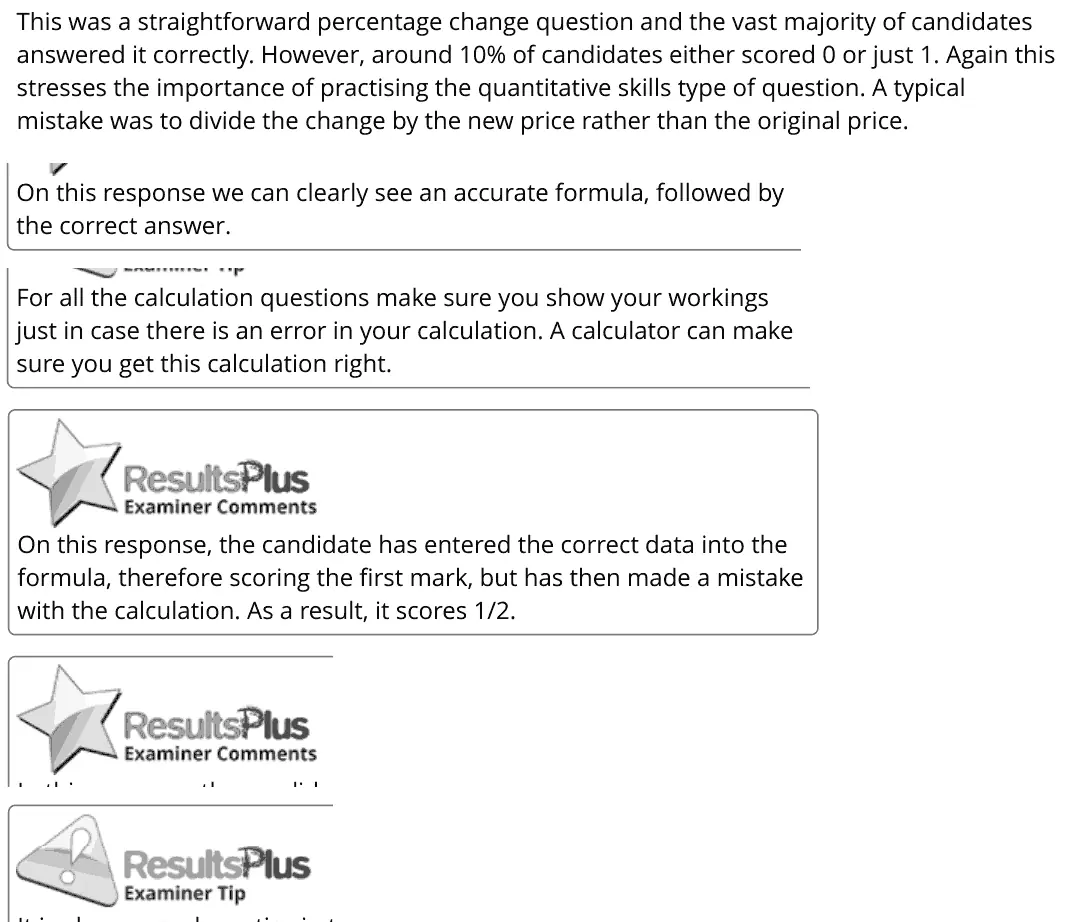
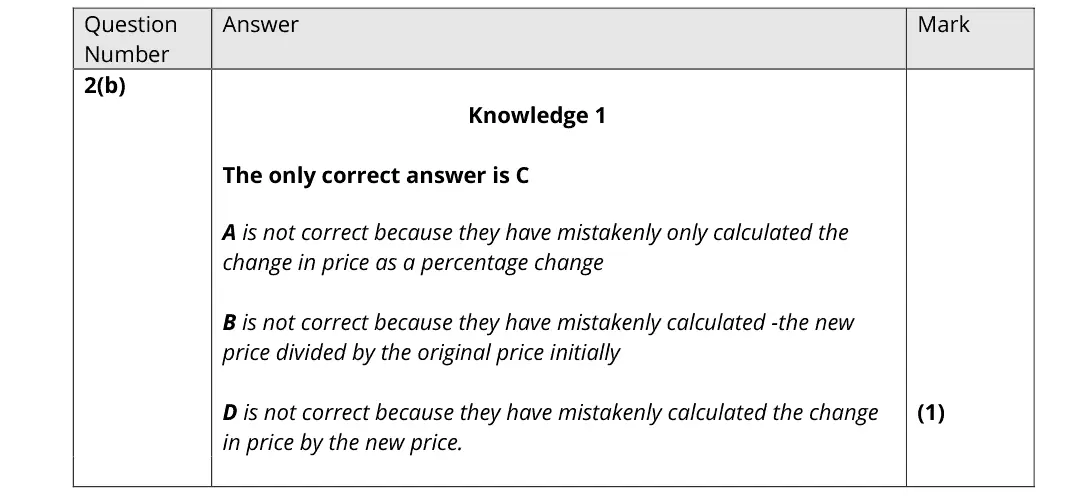
This was a straightforward percentage change question and the vast majority of candidates answered it correctly. However, around 10% of candidates either scored 0 or just 1. Again this stresses the importance of practising the quantitative skills type of question. A typical mistake was to divide the change by the new price rather than the original price. On this response we can clearly see an accurate formula, followed by the correct answer. For all the calculation questions make sure you show your workings just in case there is an error in your calculation. A calculator can make sure you get this calculation right. On this response, the candidate has entered the correct data into the formula, therefore scoring the first mark, but has then made a mistake with the calculation. As a result, it scores 1/2.
Quantitative skills: QS 2 (calculate, use and understand percentages, percentage changes and percentage point changes)

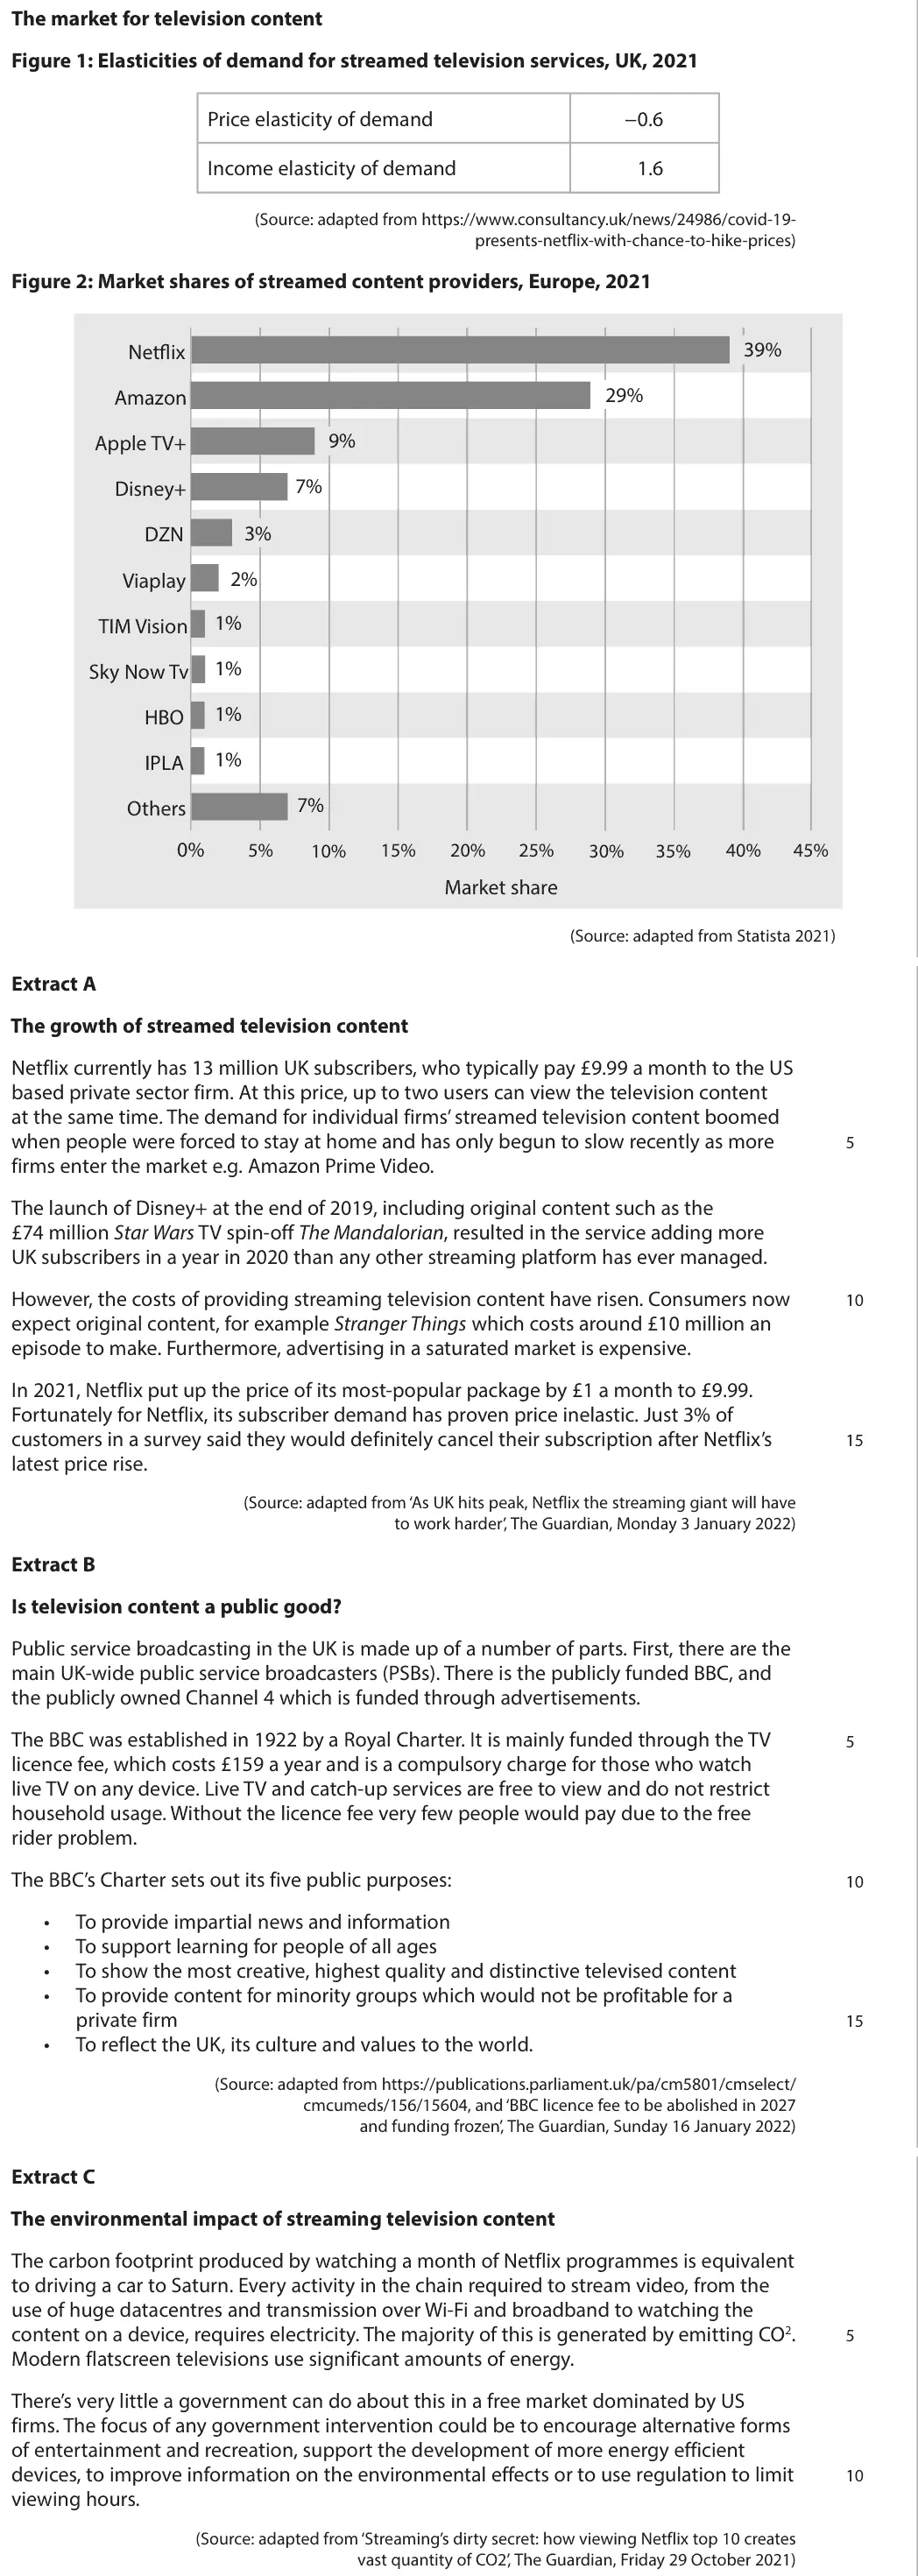
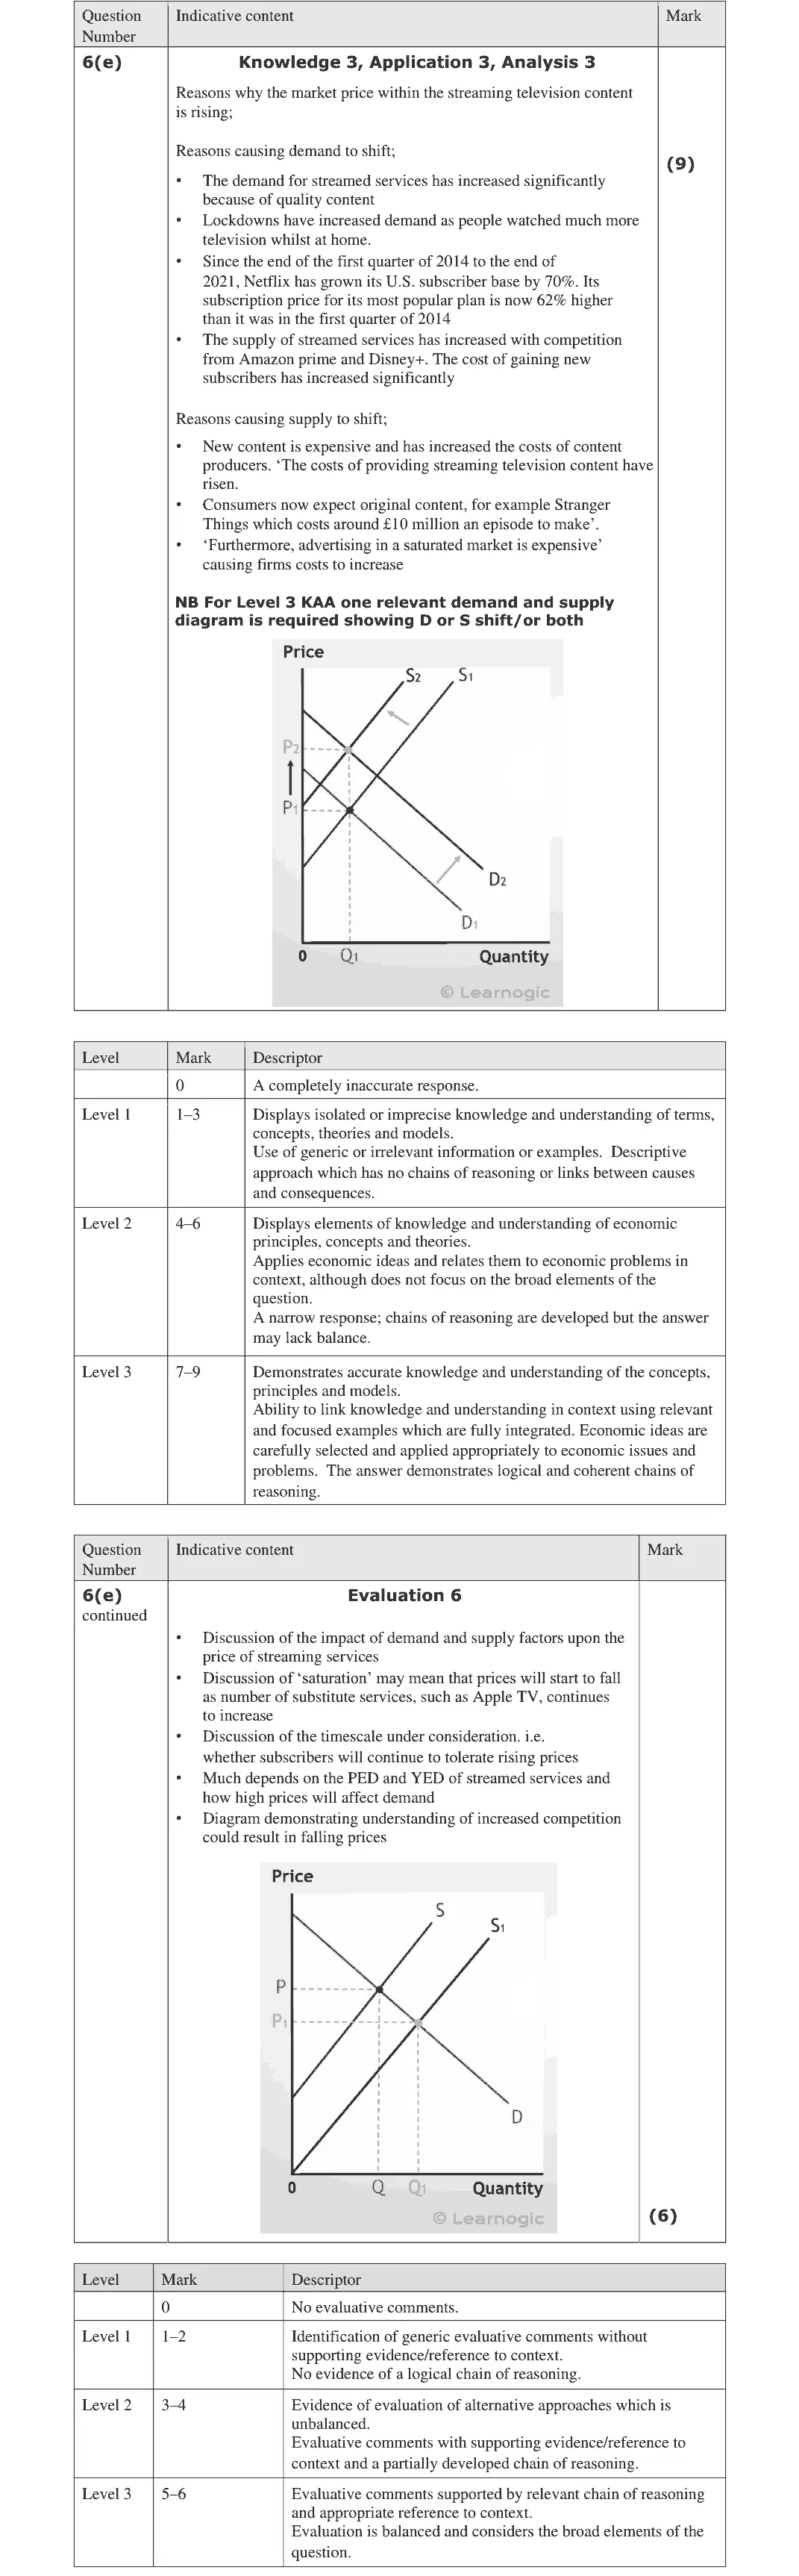
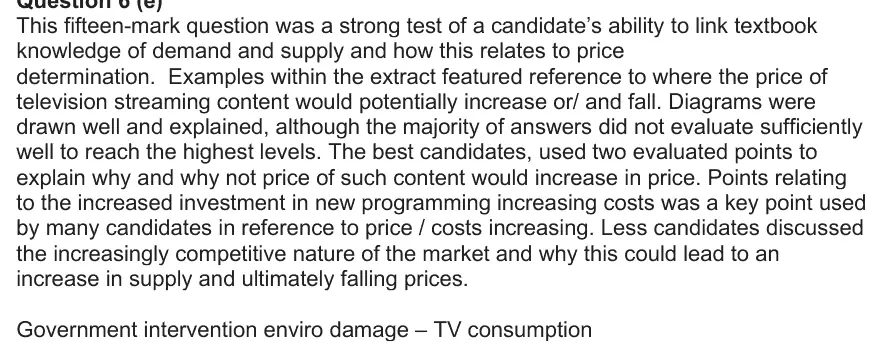
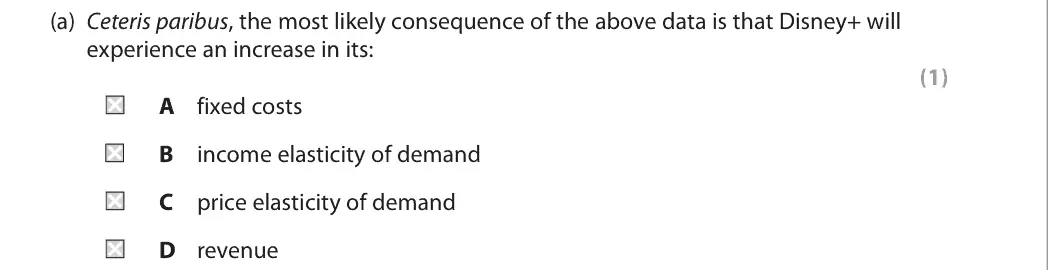
This fifteen-mark question was a strong test of a candidate’s ability to link textbook knowledge of demand and supply and how this relates to price determination. Examples within the extract featured reference to where the price of television streaming content would potentially increase or/ and fall. Diagrams were drawn well and explained, although the majority of answers did not evaluate sufficiently well to reach the highest levels. The best candidates, used two evaluated points to explain why and why not price of such content would increase in price. Points relating to the increased investment in new programming increasing costs was a key point used by many candidates in reference to price / costs increasing. Less candidates discussed the increasingly competitive nature of the market and why this could lead to an increase in supply and ultimately falling prices. Government intervention enviro damage – TV consumption
Quantitative skills: QS 4 (construct and interpret a range of standard graphical forms)
D
Quantitative skills: QS 9 (interpret, apply and analyse information in written, graphical tabular and numerical forms)

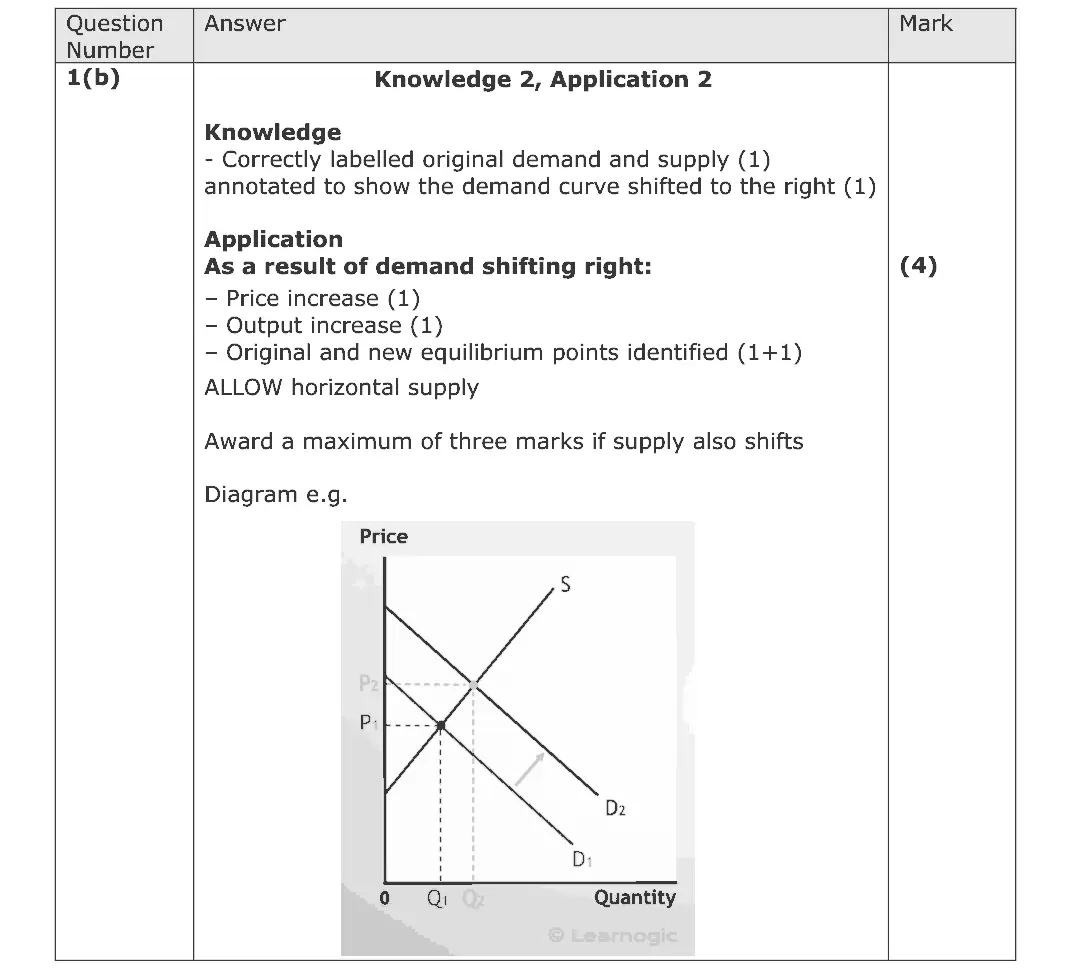
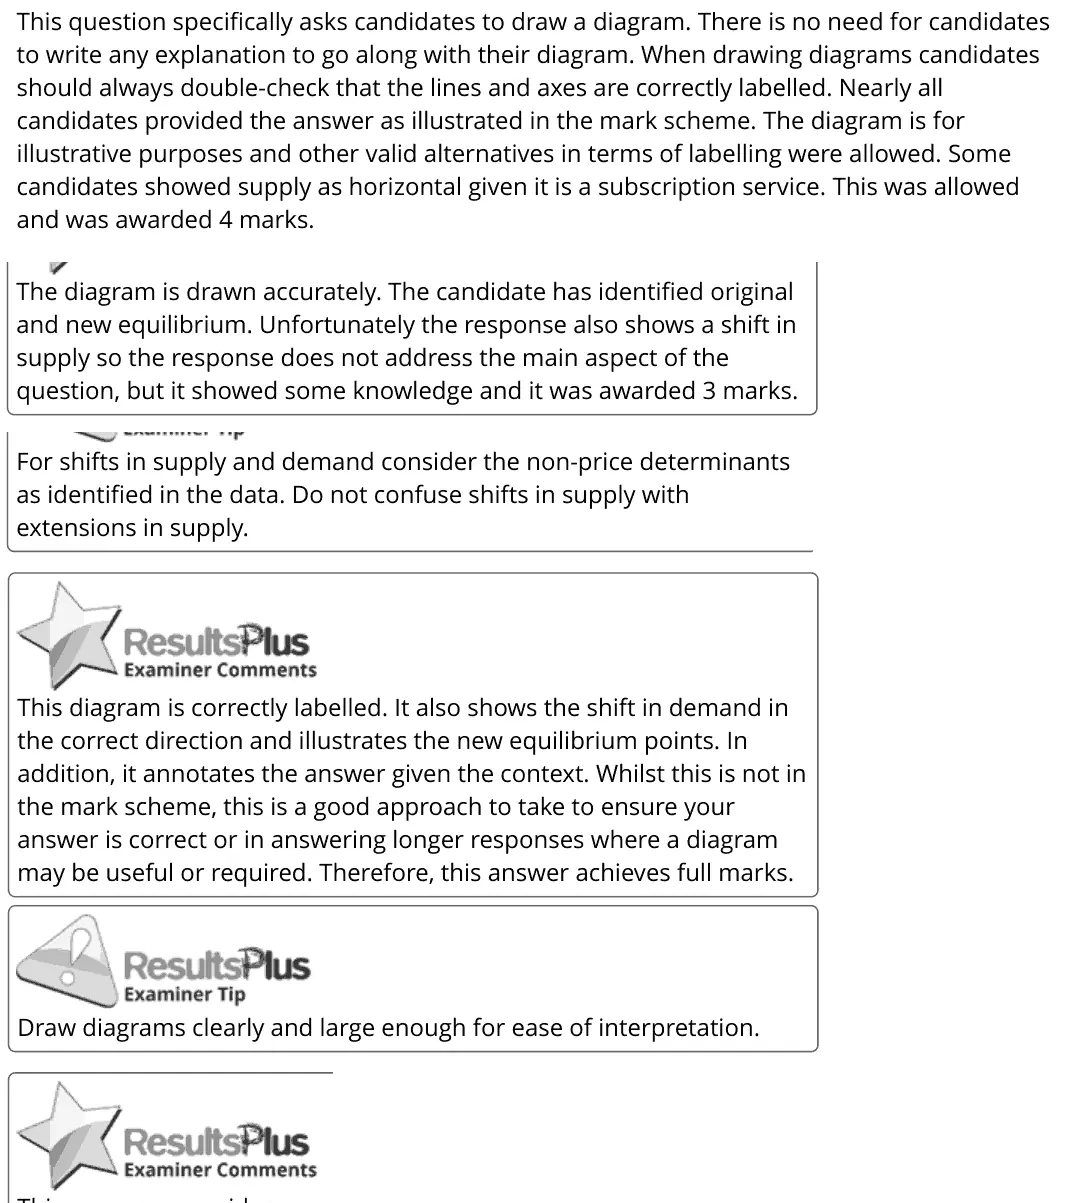
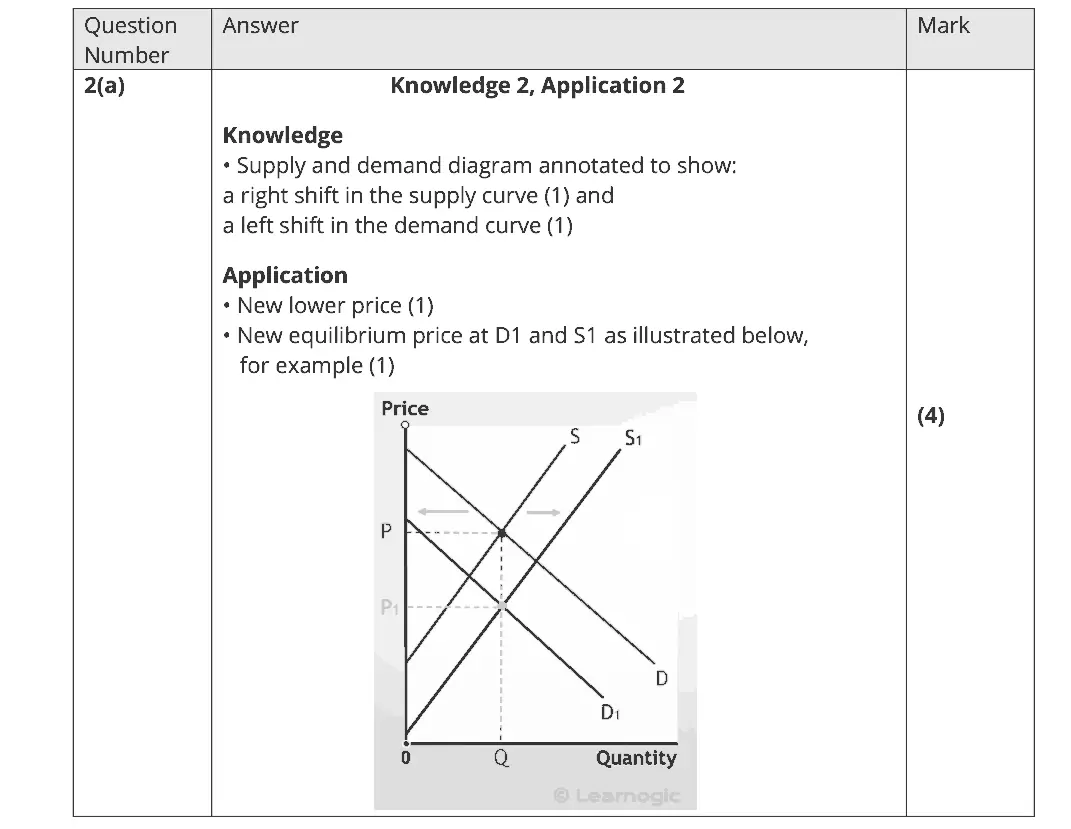
This question specifically asks candidates to draw a diagram. There is no need for candidates to write any explanation to go along with their diagram. When drawing diagrams candidates should always double-check that the lines and axes are correctly labelled. Nearly all candidates provided the answer as illustrated in the mark scheme. The diagram is for illustrative purposes and other valid alternatives in terms of labelling were allowed. Some candidates showed supply as horizontal given it is a subscription service. This was allowed and was awarded 4 marks. The diagram is drawn accurately. The candidate has identified original and new equilibrium. Unfortunately the response also shows a shift in supply so the response does not address the main aspect of the question, but it showed some knowledge and it was awarded 3 marks. For shifts in supply and demand consider the non-price determinants as identified in the data. Do not confuse shifts in supply with extensions in supply. This diagram is correctly labelled. It also shows the shift in demand in the correct direction and illustrates the new equilibrium points. In addition, it annotates the answer given the context. Whilst this is not in the mark scheme, this is a good approach to take to ensure your answer is correct or in answering longer responses where a diagram may be useful or required. Therefore, this answer achieves full marks. Draw diagrams clearly and large enough for ease of interpretation.
Quantitative skills: QS 4 (construct and interpret a range of standard graphical forms)

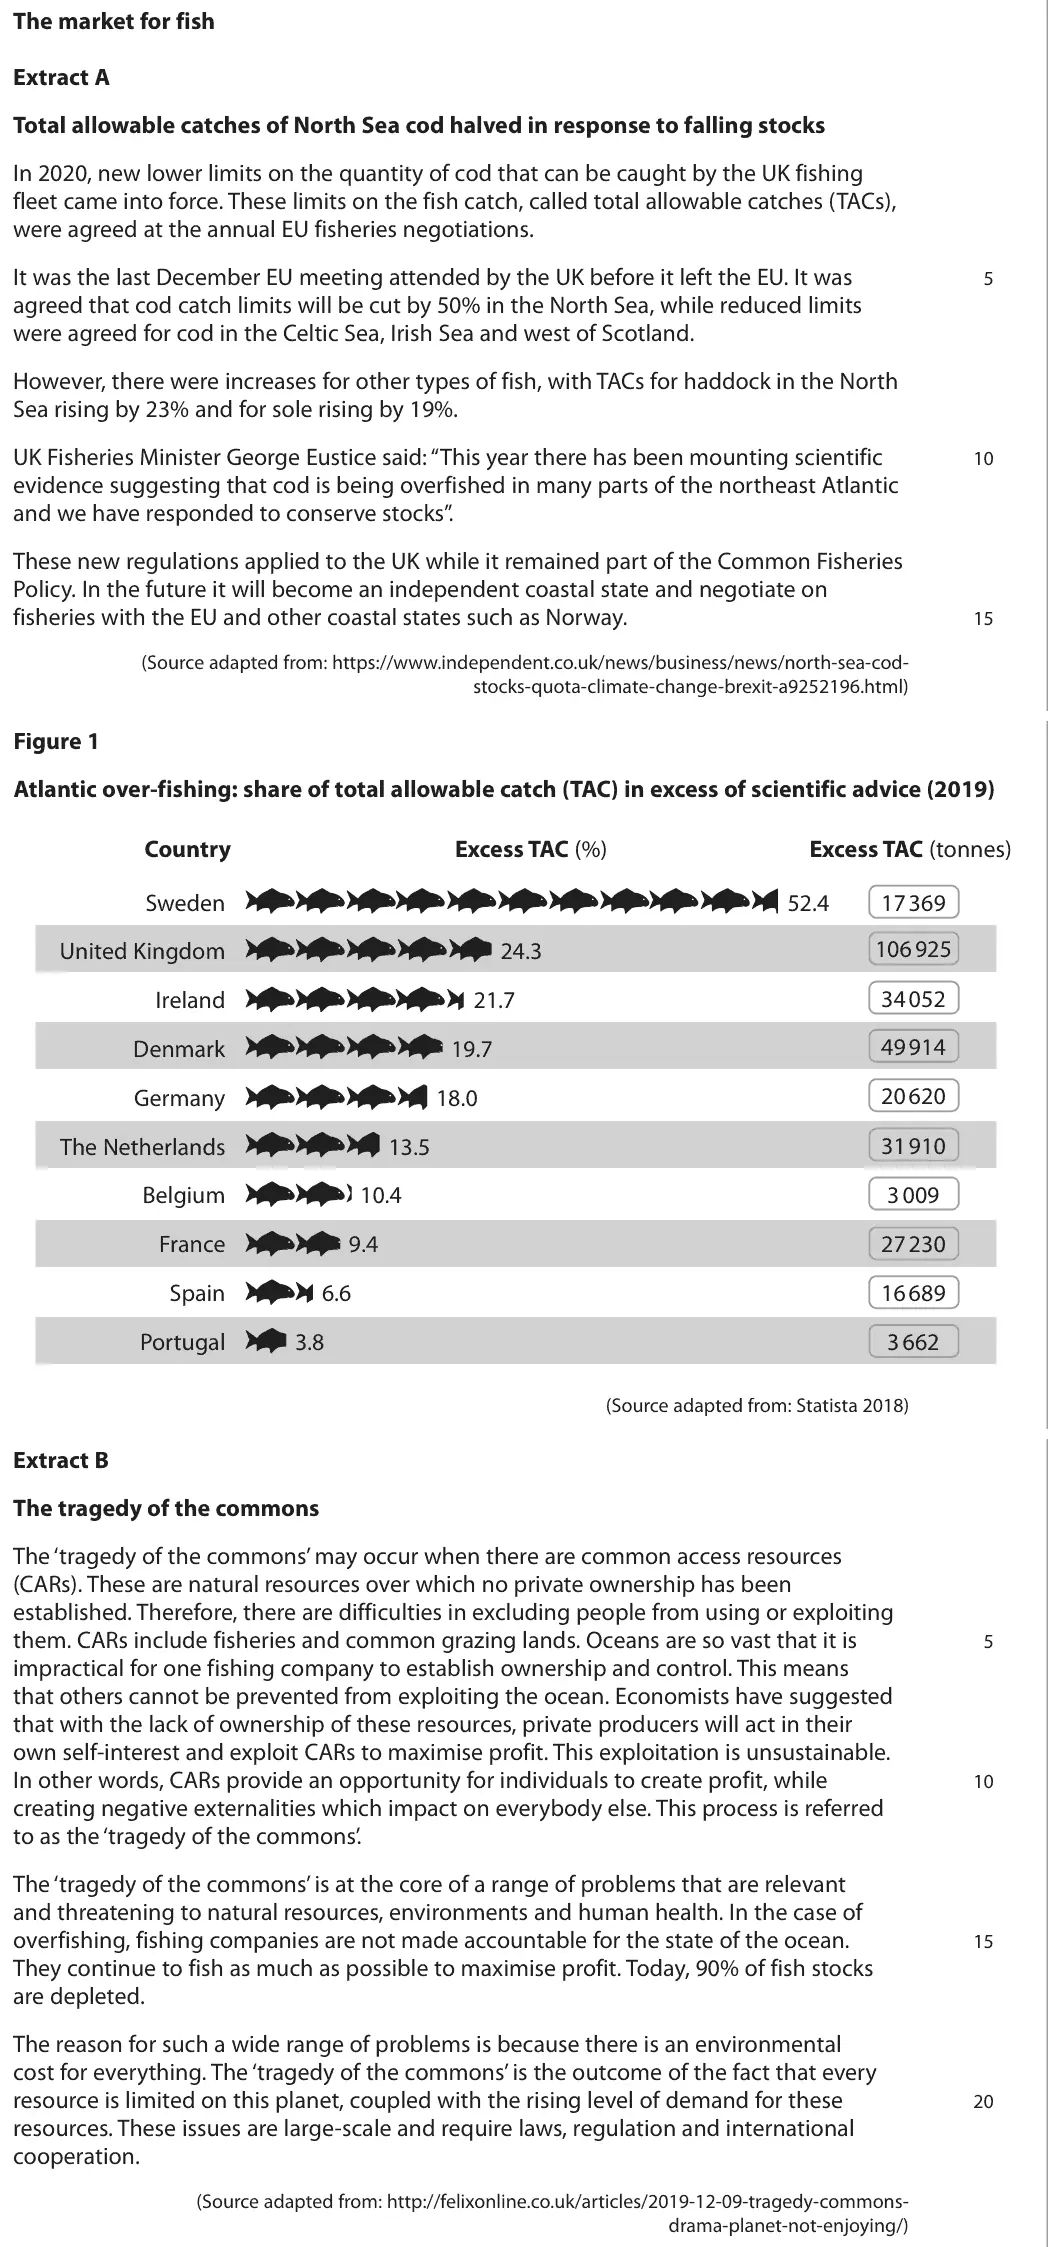
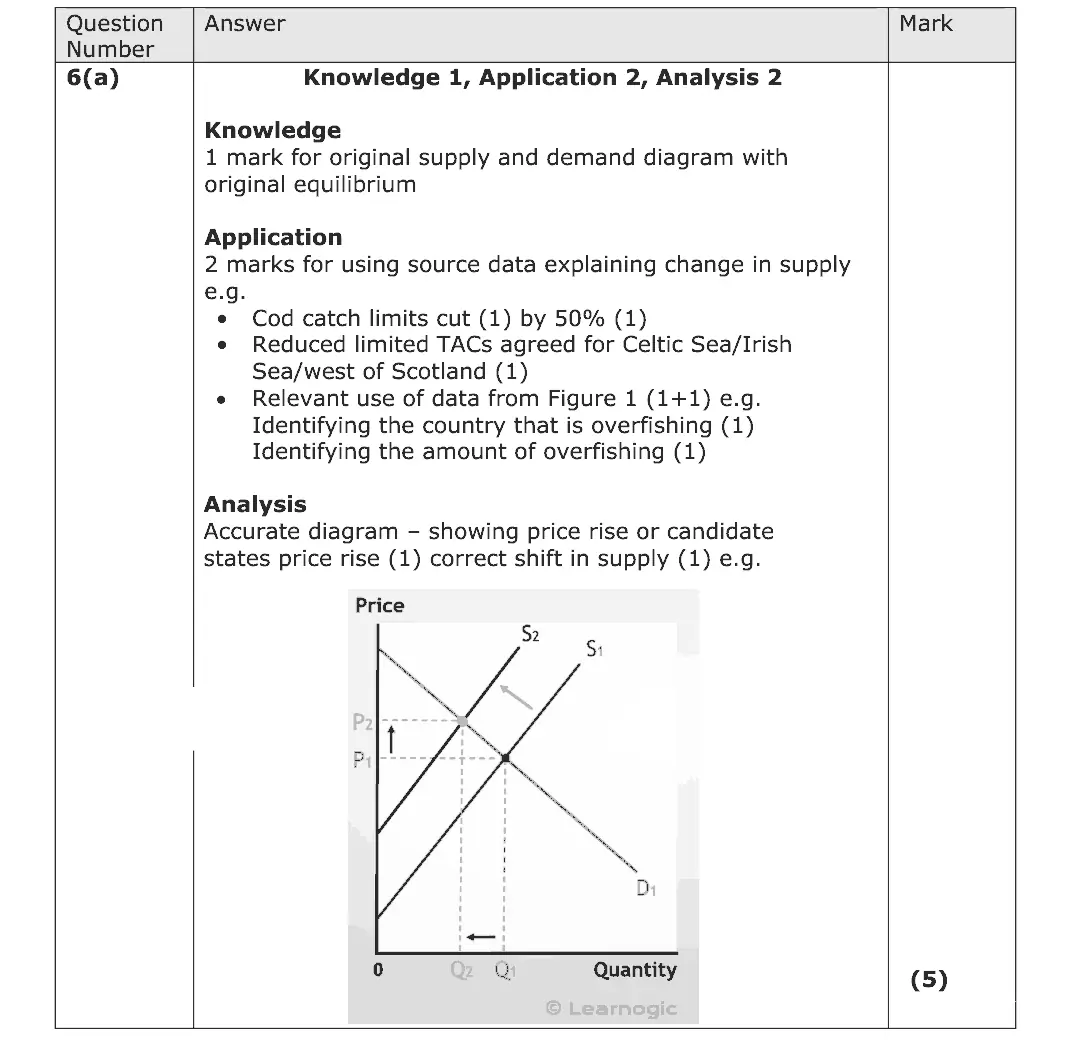
This question required candidates to consider the impact of the new Total Allowable Catches (TACs) on the market for fish. Most candidates were able to clearly draw a supply and demand diagram and used the extract fully to support their answers. Almost half of the candidates scored full marks on this question.
Quantitative skills: QS 4 (construct and interpret a range of standard graphical forms)

Quantitative skills: QS 4 (construct and interpret a range of standard graphical forms); QS 9 (interpret, apply and analyse information in written, graphical tabular and numerical forms)
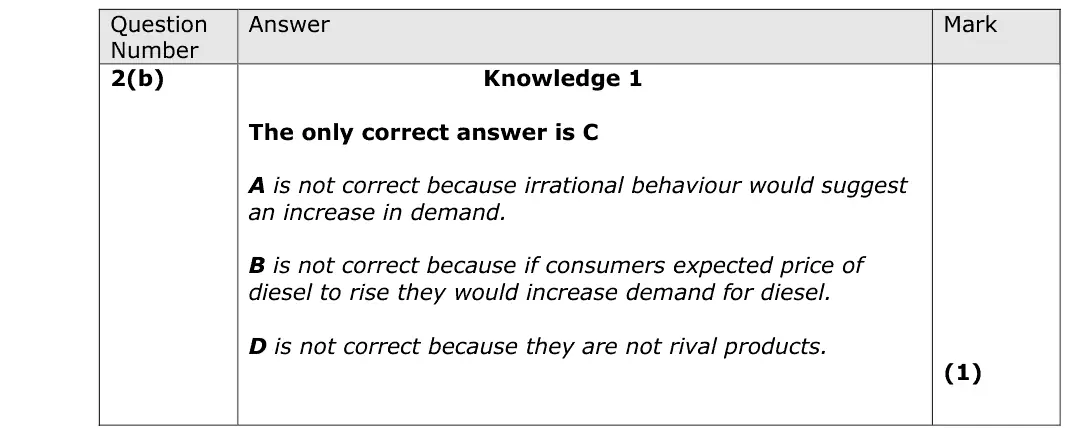
C
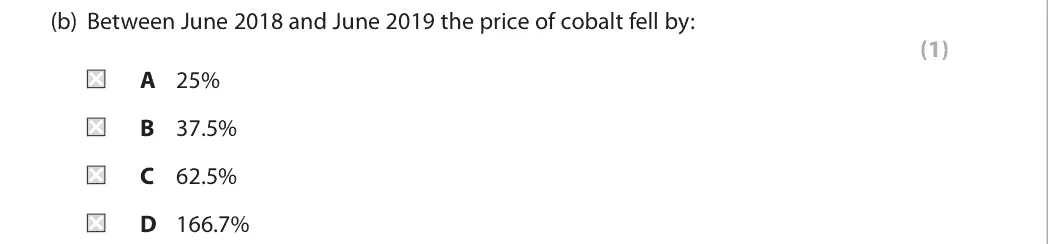
Quantitative skills: QS 2 (calculate, use and understand percentages, percentage changes and percentage point changes); QS 9 (interpret, apply and analyse information in written, graphical tabular and numerical forms)

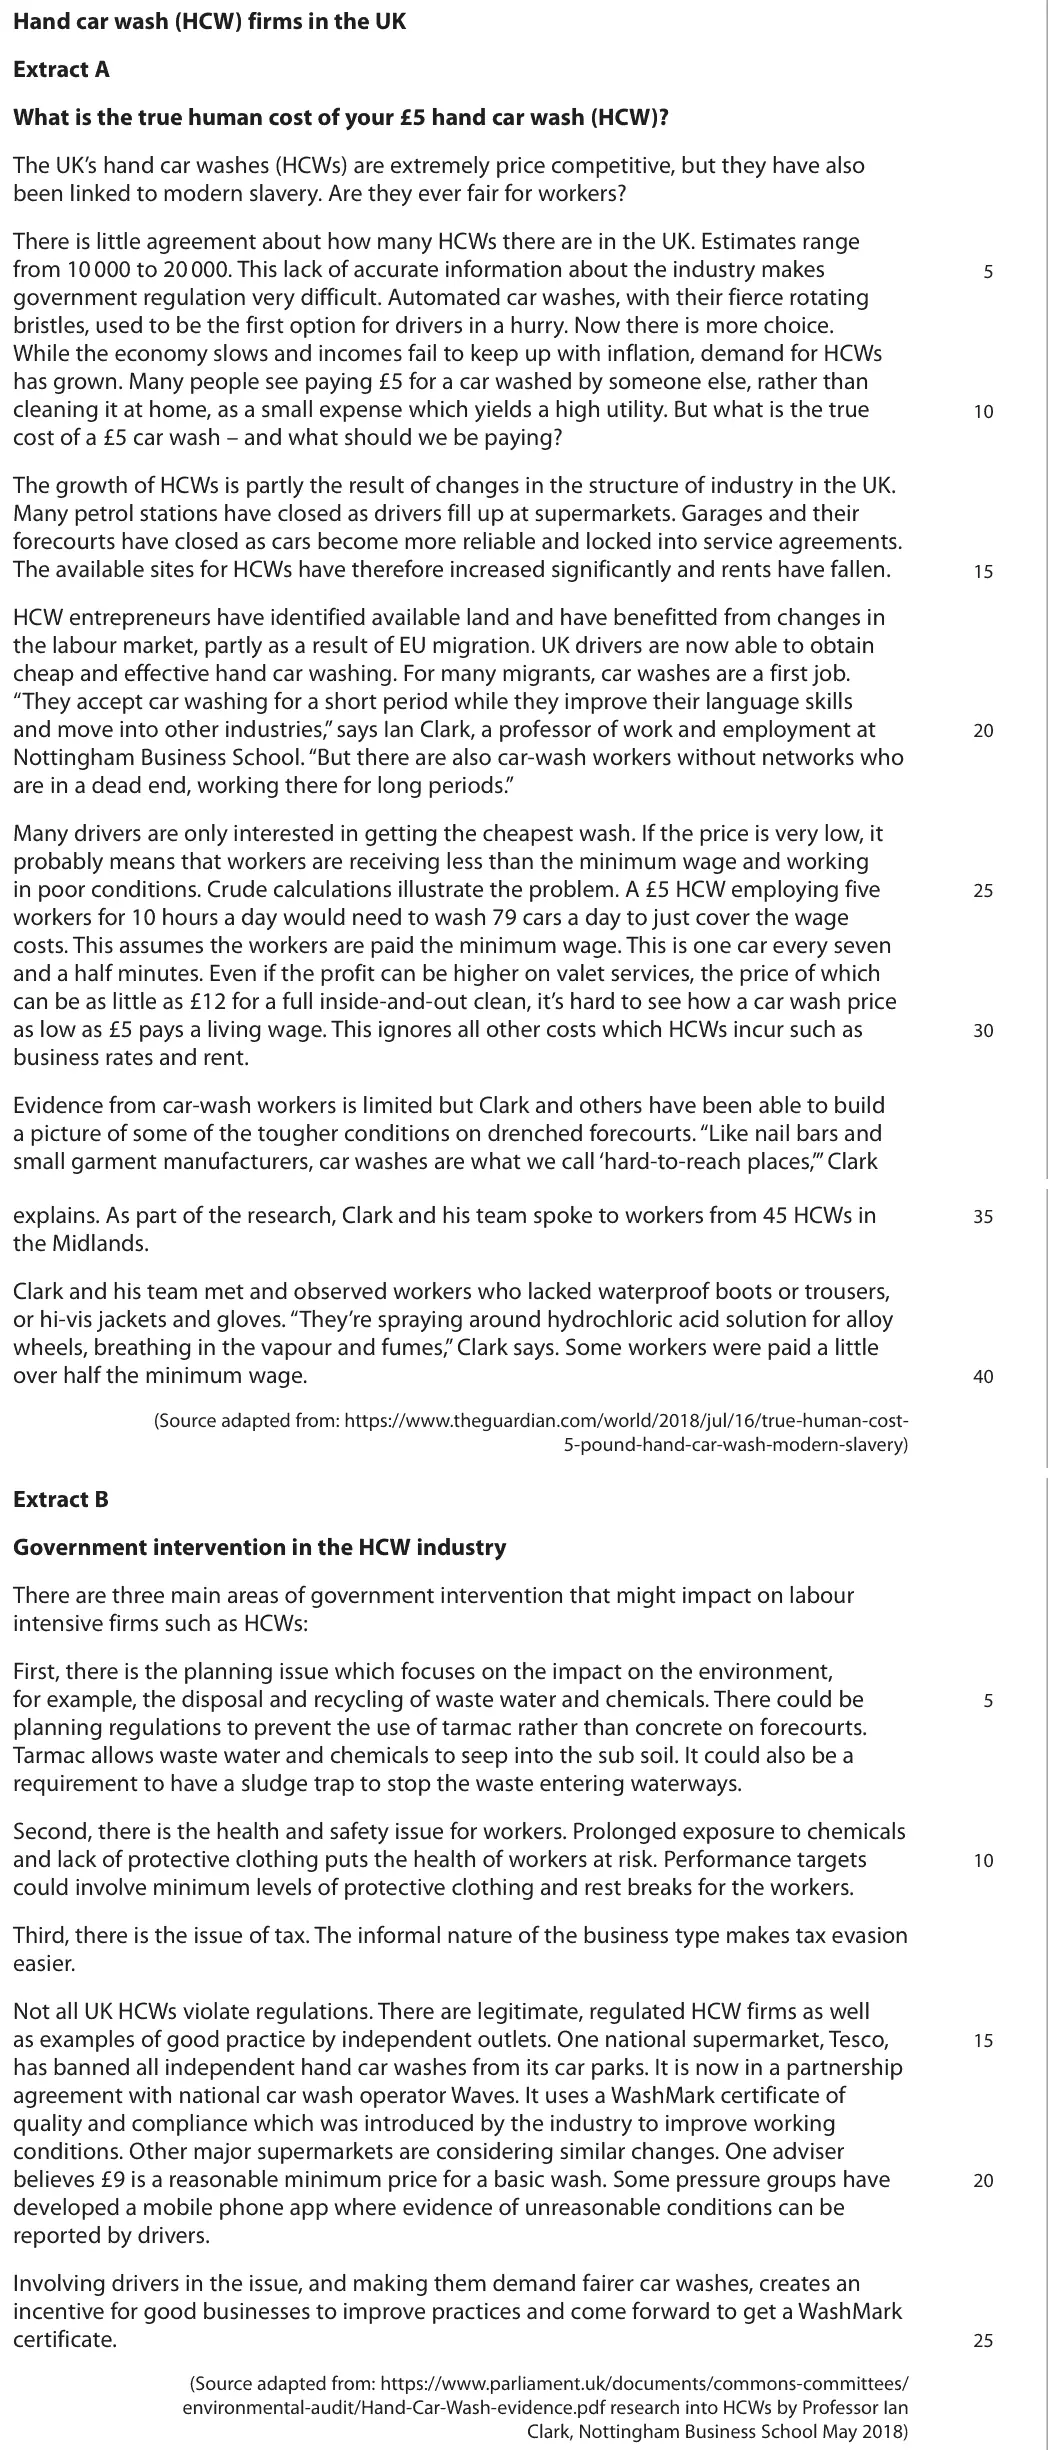
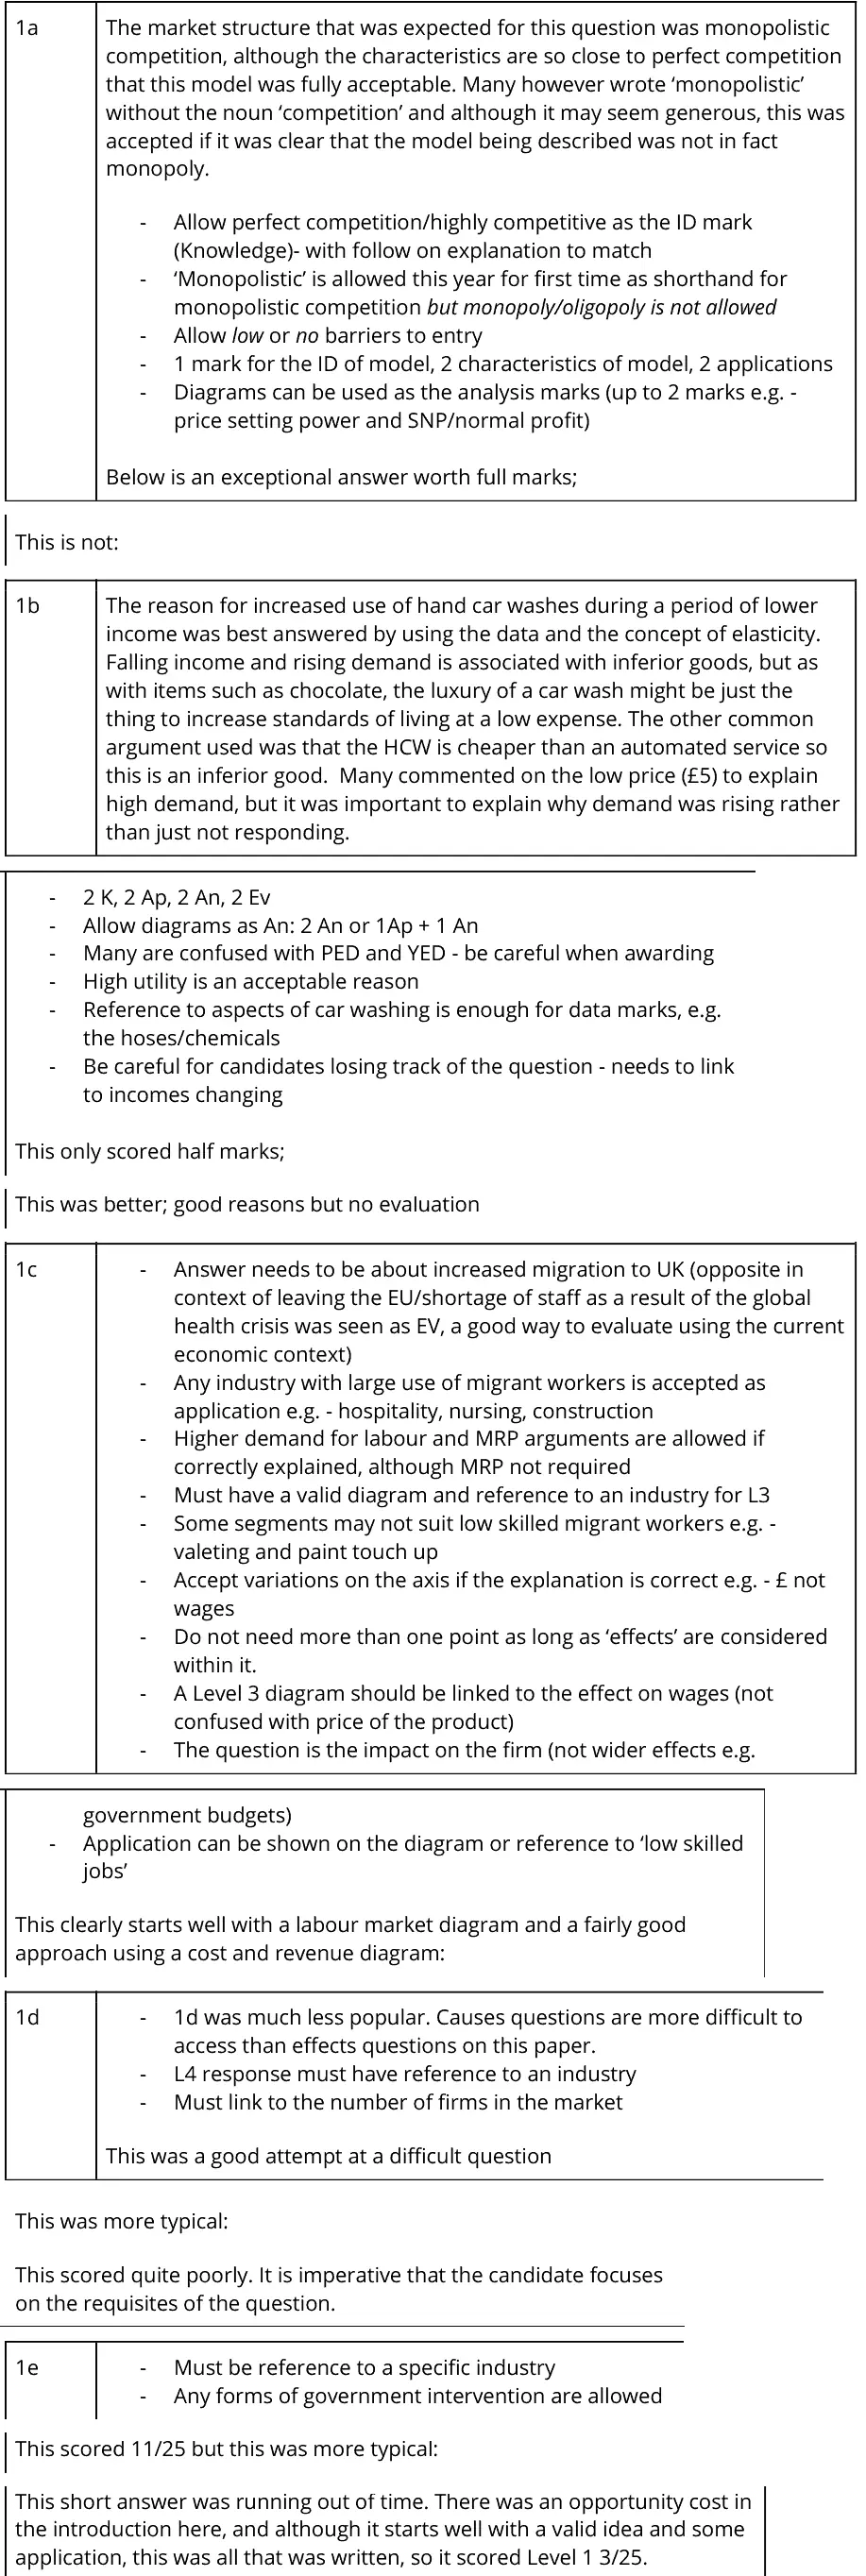
1a The market structure that was expected for this question was monopolistic competition, although the characteristics are so close to perfect competition that this model was fully acceptable. Many however wrote ‘monopolistic’ without the noun ‘competition’ and although it may seem generous, this was accepted if it was clear that the model being described was not in fact monopoly. - Allow perfect competition/highly competitive as the ID mark (Knowledge)- with follow on explanation to match - ‘Monopolistic’ is allowed this year for first time as shorthand for monopolistic competition but monopoly/oligopoly is not allowed - Allow low or no barriers to entry - 1 mark for the ID of model, 2 characteristics of model, 2 applications - Diagrams can be used as the analysis marks (up to 2 marks e.g. - price setting power and SNP/normal profit) Below is an exceptional answer worth full marks; This is not: 1b The reason for increased use of hand car washes during a period of lower income was best answered by using the data and the concept of elasticity. Falling income and rising demand is associated with inferior goods, but as with items such as chocolate, the luxury of a car wash might be just the thing to increase standards of living at a low expense. The other common argument used was that the HCW is cheaper than an automated service so this is an inferior good. Many commented on the low price (£5) to explain high demand, but it was important to explain why demand was rising rather than just not responding. - 2 K, 2 Ap, 2 An, 2 Ev - Allow diagrams as An: 2 An or 1Ap + 1 An - Many are confused with PED and YED - be careful when awarding - High utility is an acceptable reason - Reference to aspects of car washing is enough for data marks, e.g. the hoses/chemicals - Be careful for candidates losing track of the question - needs to link to incomes changing This only scored half marks; This was better; good reasons but no evaluation 1c - Answer needs to be about increased migration to UK (opposite in context of leaving the EU/shortage of staff as a result of the global health crisis was seen as EV, a good way to evaluate using the current economic context) - Any industry with large use of migrant workers is accepted as application e.g. - hospitality, nursing, construction - Higher demand for labour and MRP arguments are allowed if correctly explained, although MRP not required - Must have a valid diagram and reference to an industry for L3 - Some segments may not suit low skilled migrant workers e.g. - valeting and paint touch up - Accept variations on the axis if the explanation is correct e.g. - £ not wages - Do not need more than one point as long as ‘effects’ are considered within it. - A Level 3 diagram should be linked to the effect on wages (not confused with price of the product) - The question is the impact on the firm (not wider effects e.g. government budgets) - Application can be shown on the diagram or reference to ‘low skilled jobs’ This clearly starts well with a labour market diagram and a fairly good approach using a cost and revenue diagram: 1d - 1d was much less popular. Causes questions are more difficult to access than effects questions on this paper. - L4 response must have reference to an industry - Must link to the number of firms in the market This was a good attempt at a difficult question This was more typical: This scored quite poorly. It is imperative that the candidate focuses on the requisites of the question. 1e - Must be reference to a specific industry - Any forms of government intervention are allowed This scored 11/25 but this was more typical: This short answer was running out of time. There was an opportunity cost in the introduction here, and although it starts well with a valid idea and some application, this was all that was written, so it scored Level 1 3/25.
Quantitative skills: QS 9 (interpret, apply and analyse information in written, graphical tabular and numerical forms)
A
Quantitative skills: QS 4 (construct and interpret a range of standard graphical forms)

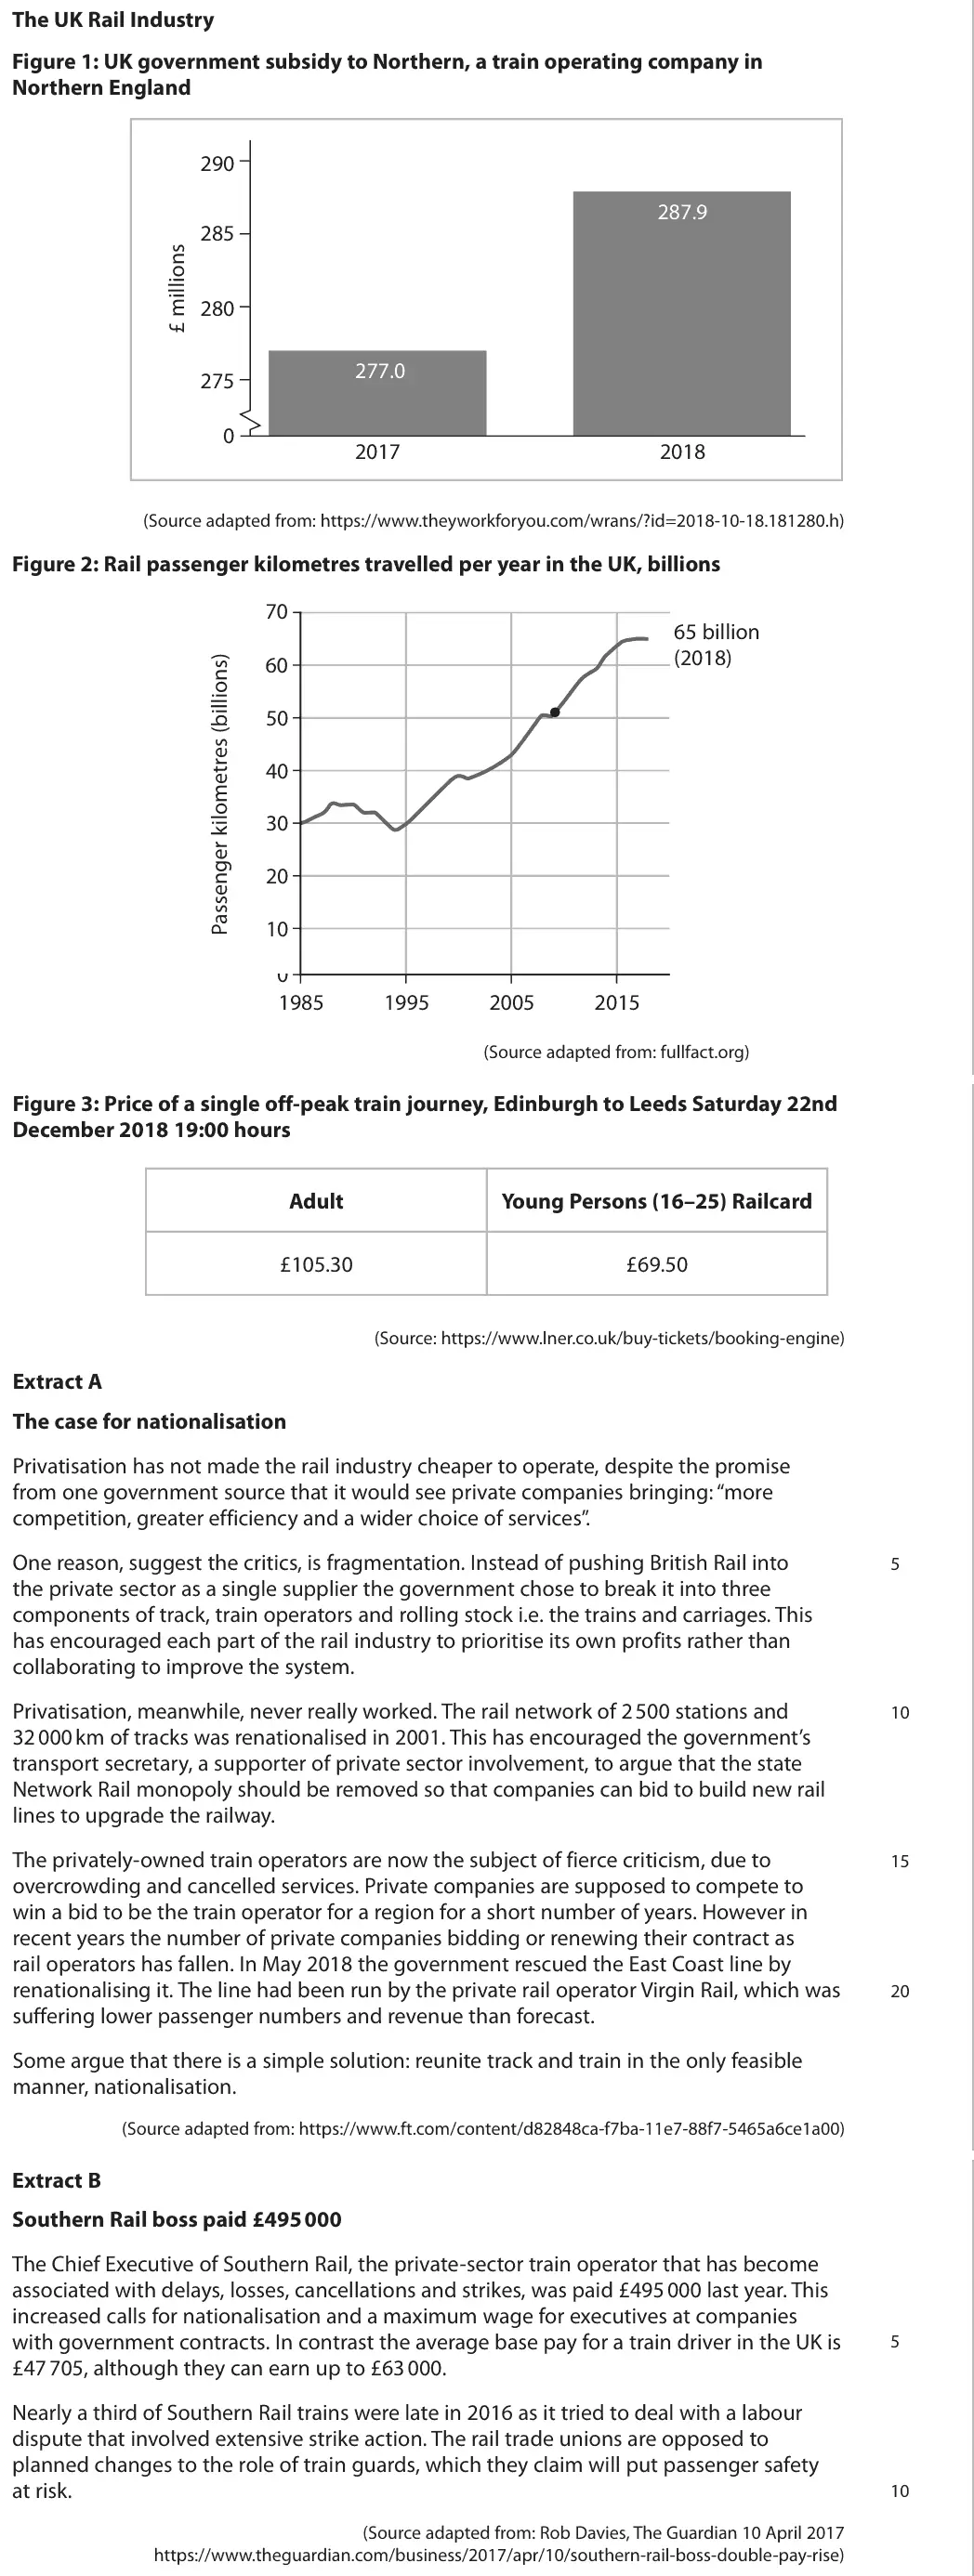
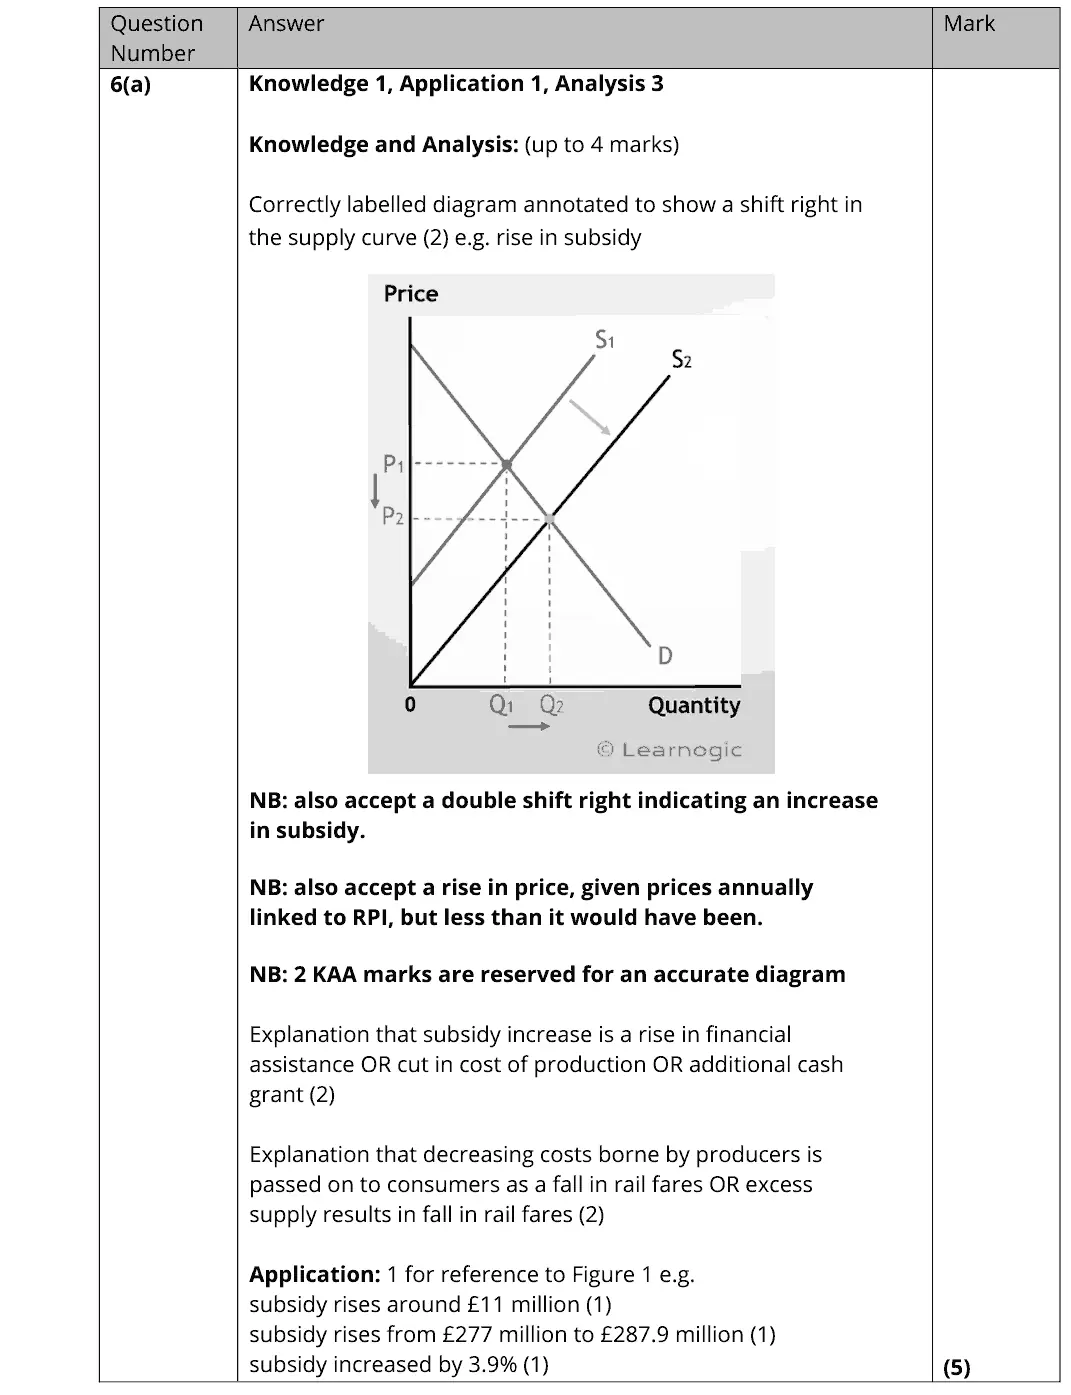
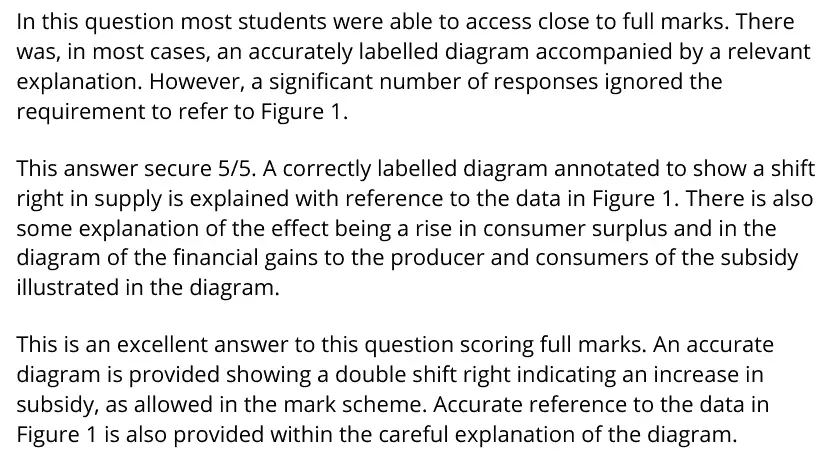
In this question most students were able to access close to full marks. There was, in most cases, an accurately labelled diagram accompanied by a relevant explanation. However, a significant number of responses ignored the requirement to refer to Figure 1. This answer secure 5/5. A correctly labelled diagram annotated to show a shift right in supply is explained with reference to the data in Figure 1. There is also some explanation of the effect being a rise in consumer surplus and in the diagram of the financial gains to the producer and consumers of the subsidy illustrated in the diagram. This is an excellent answer to this question scoring full marks. An accurate diagram is provided showing a double shift right indicating an increase in subsidy, as allowed in the mark scheme. Accurate reference to the data in Figure 1 is also provided within the careful explanation of the diagram.
Quantitative skills: QS 2 (calculate, use and understand percentages, percentage changes and percentage point changes); QS 4 (construct and interpret a range of standard graphical forms); QS 9 (interpret, apply and analyse information in written, graphical tabular and numerical forms)

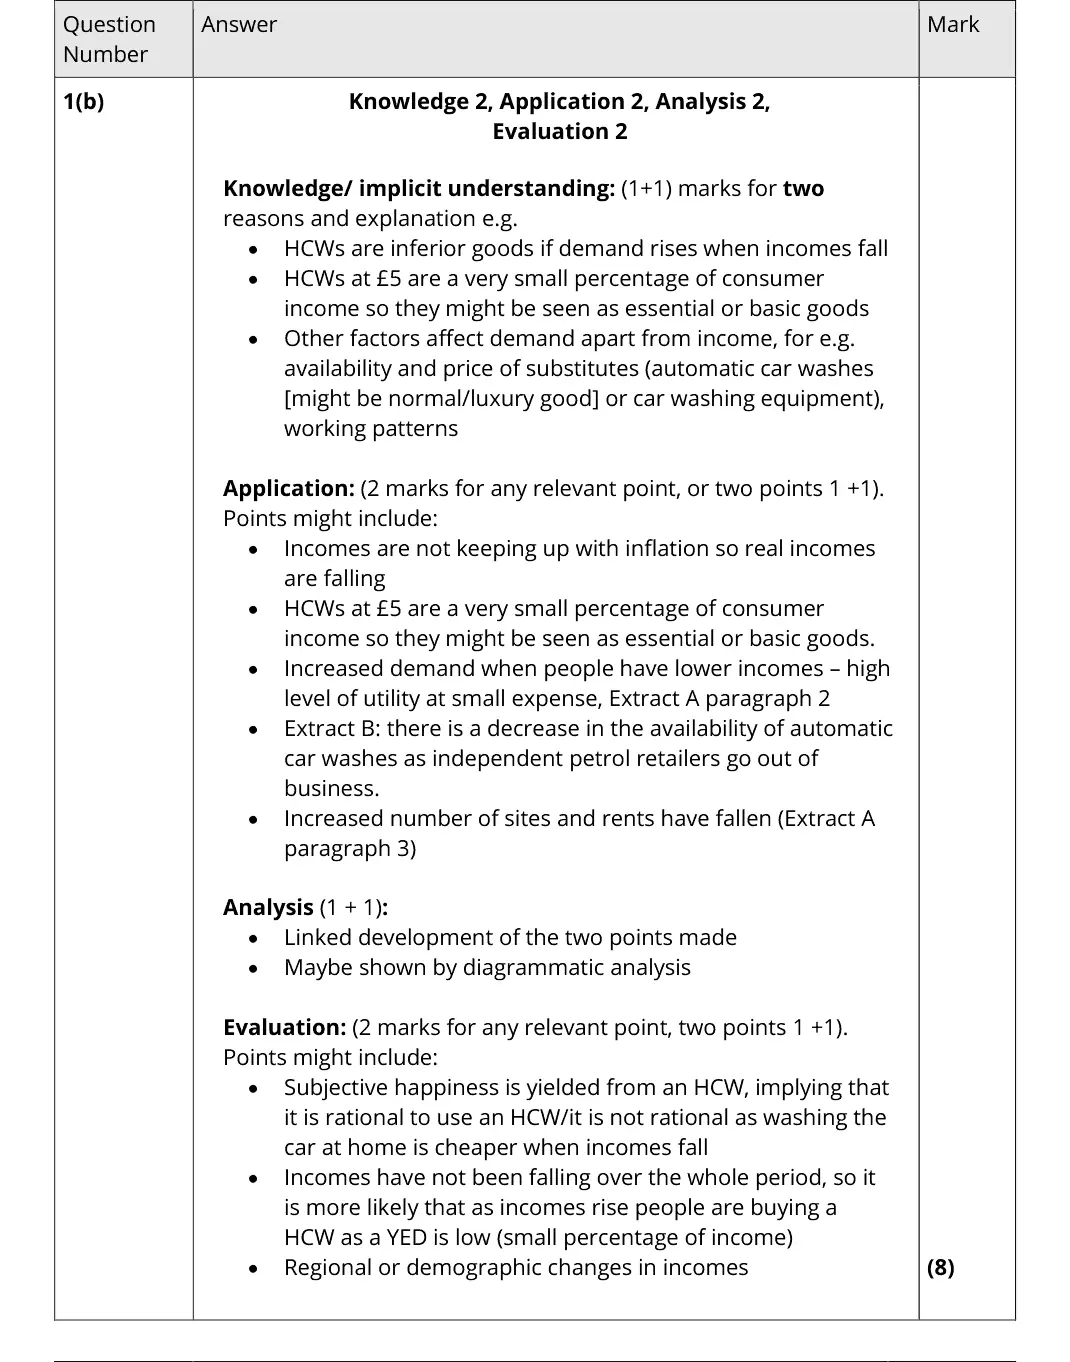
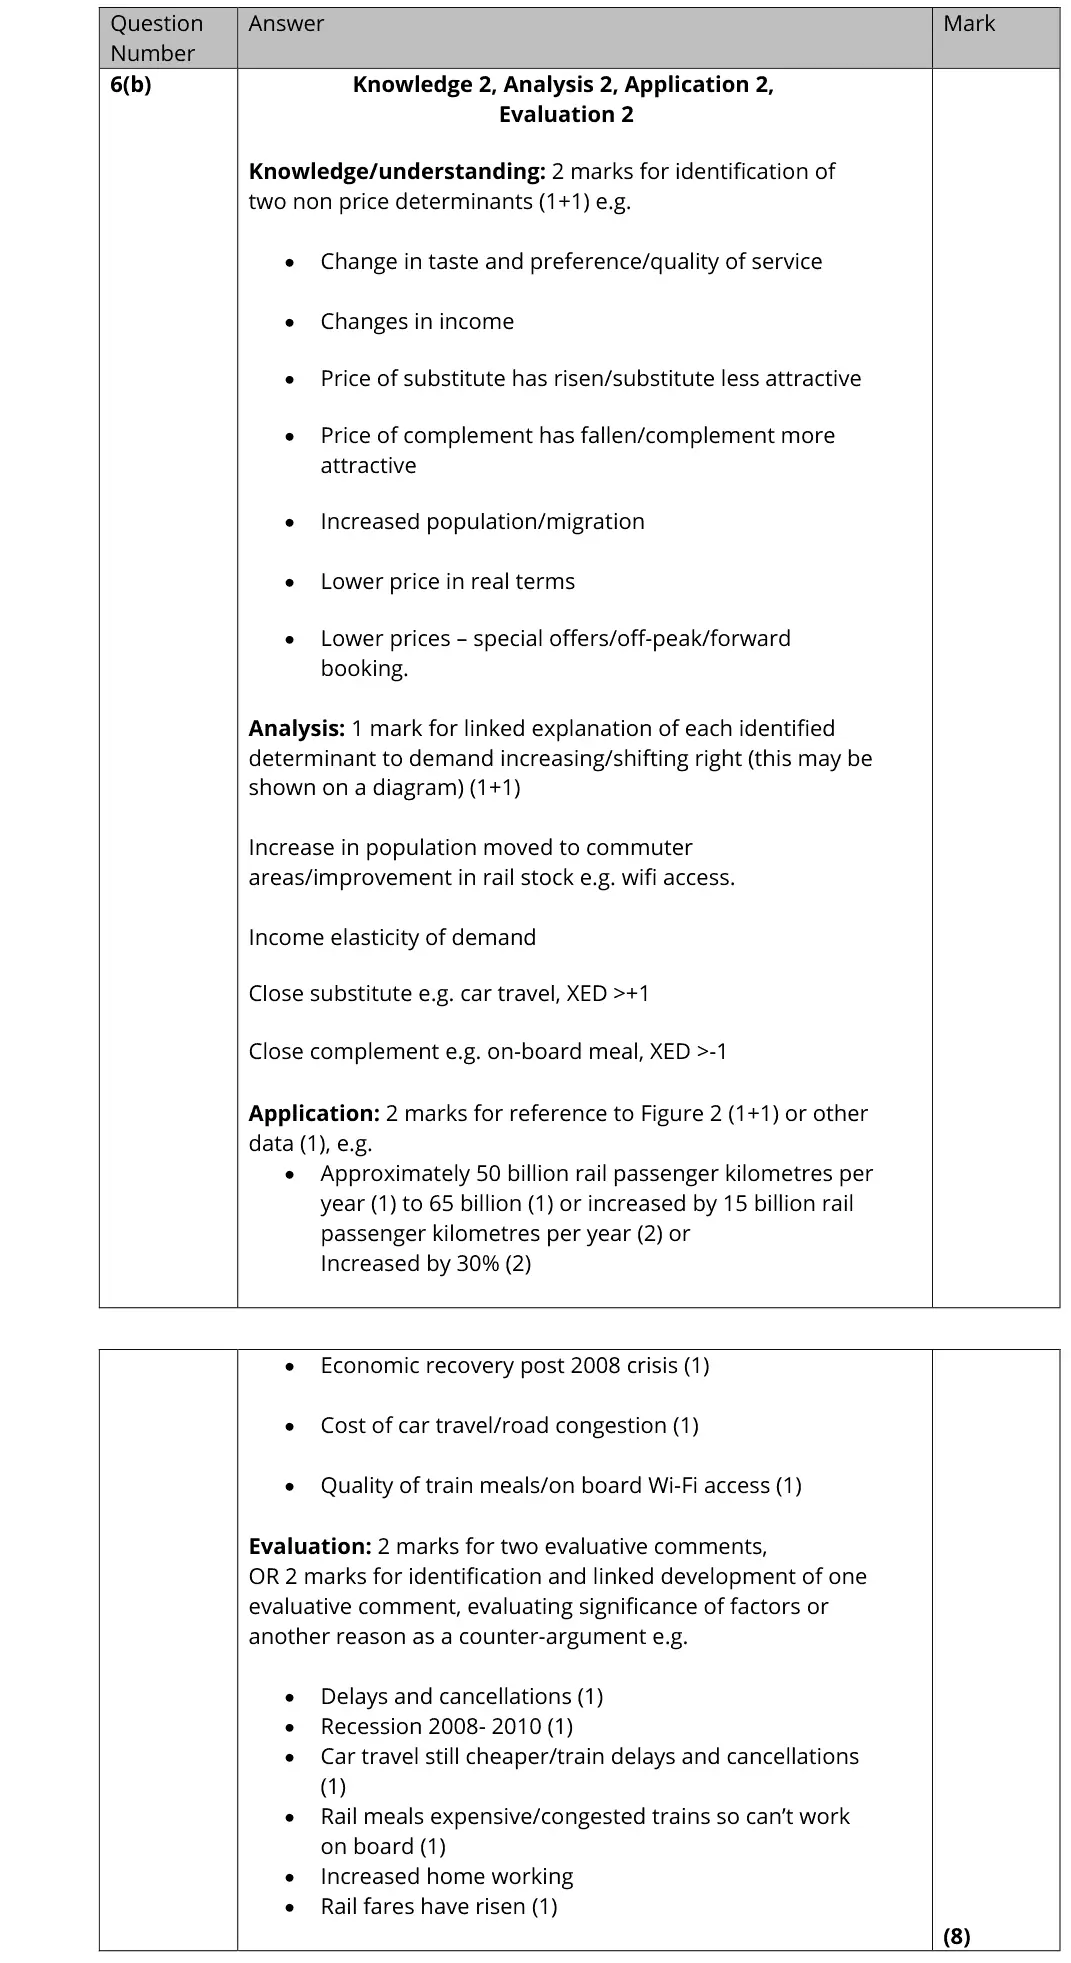
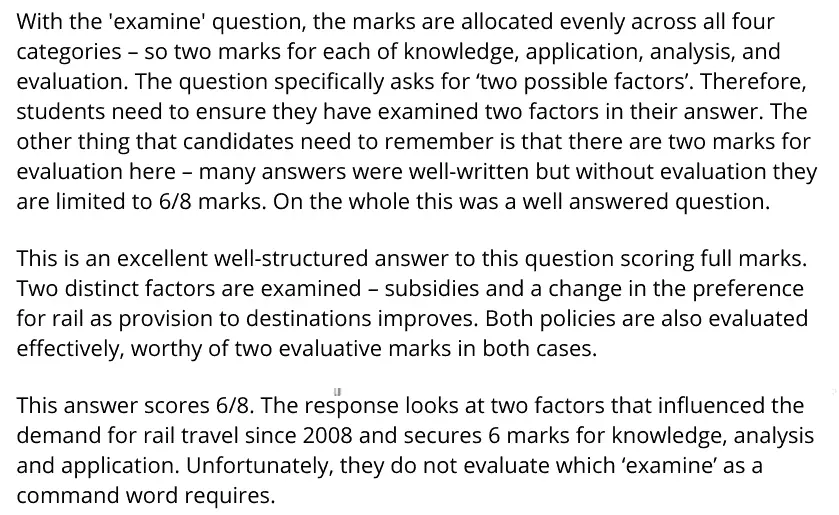
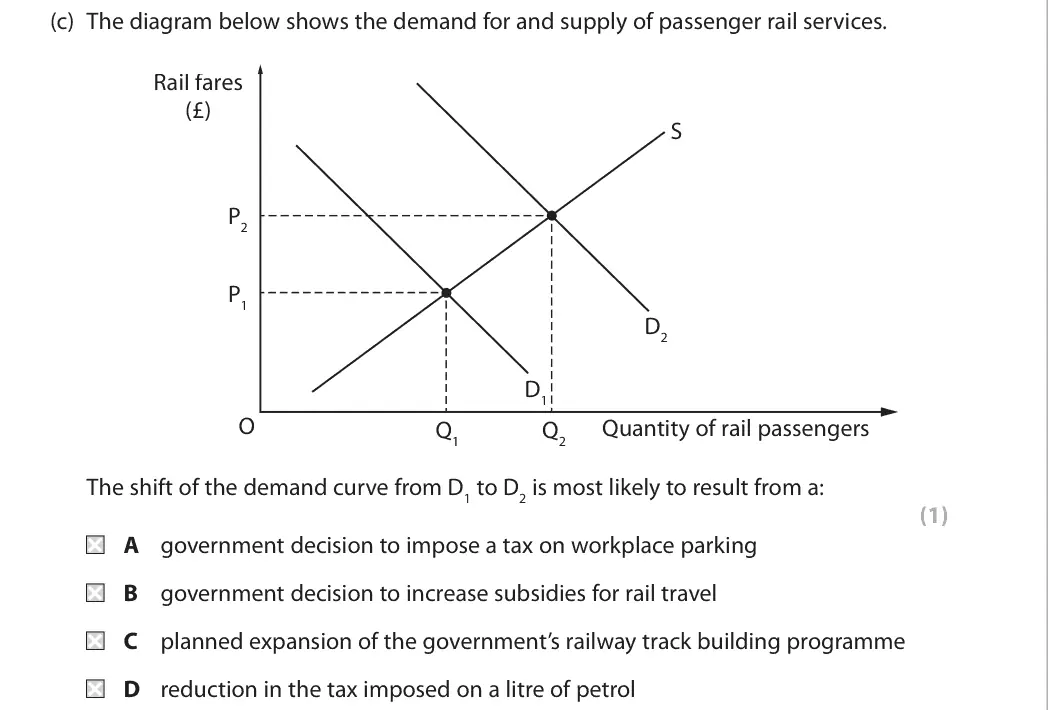
With the 'examine' question, the marks are allocated evenly across all four categories – so two marks for each of knowledge, application, analysis, and evaluation. The question specifically asks for ‘two possible factors’. Therefore, students need to ensure they have examined two factors in their answer. The other thing that candidates need to remember is that there are two marks for evaluation here – many answers were well-written but without evaluation they are limited to 6/8 marks. On the whole this was a well answered question. This is an excellent well-structured answer to this question scoring full marks. Two distinct factors are examined – subsidies and a change in the preference for rail as provision to destinations improves. Both policies are also evaluated effectively, worthy of two evaluative marks in both cases. This answer scores 6/8. The response looks at two factors that influenced the demand for rail travel since 2008 and secures 6 marks for knowledge, analysis and application. Unfortunately, they do not evaluate which ‘examine’ as a command word requires.
Quantitative skills: QS 9 (interpret, apply and analyse information in written, graphical tabular and numerical forms)

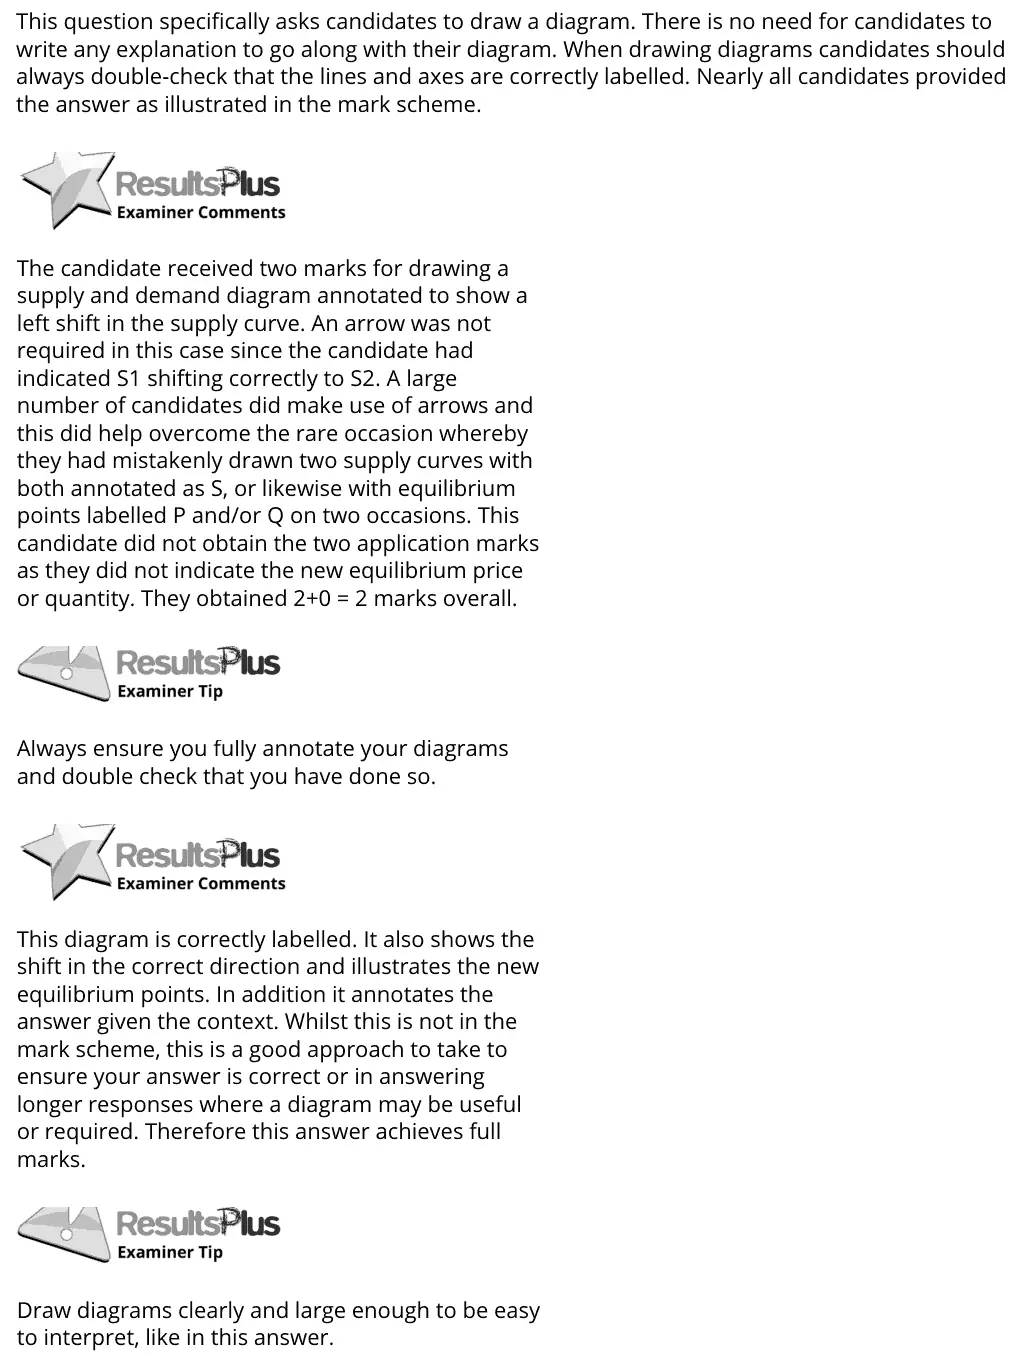
This question specifically asks candidates to draw a diagram. There is no need for candidates to write any explanation to go along with their diagram. When drawing diagrams candidates should always double-check that the lines and axes are correctly labelled. Nearly all candidates provided the answer as illustrated in the mark scheme. The candidate received two marks for drawing a supply and demand diagram annotated to show a left shift in the supply curve. An arrow was not required in this case since the candidate had indicated S1 shifting correctly to S2. A large number of candidates did make use of arrows and this did help overcome the rare occasion whereby they had mistakenly drawn two supply curves with both annotated as S, or likewise with equilibrium points labelled P and/or Q on two occasions. This candidate did not obtain the two application marks as they did not indicate the new equilibrium price or quantity. They obtained 2+0 = 2 marks overall. Always ensure you fully annotate your diagrams and double check that you have done so. This diagram is correctly labelled. It also shows the shift in the correct direction and illustrates the new equilibrium points. In addition it annotates the answer given the context. Whilst this is not in the mark scheme, this is a good approach to take to ensure your answer is correct or in answering longer responses where a diagram may be useful or required. Therefore this answer achieves full marks. Draw diagrams clearly and large enough to be easy to interpret, like in this answer.
Quantitative skills: QS 4 (construct and interpret a range of standard graphical forms)
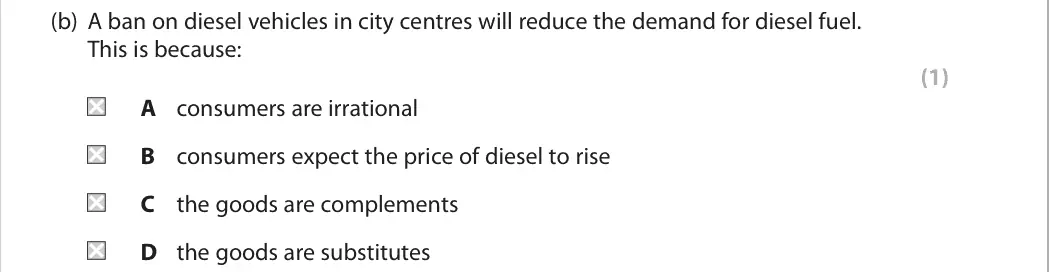
C

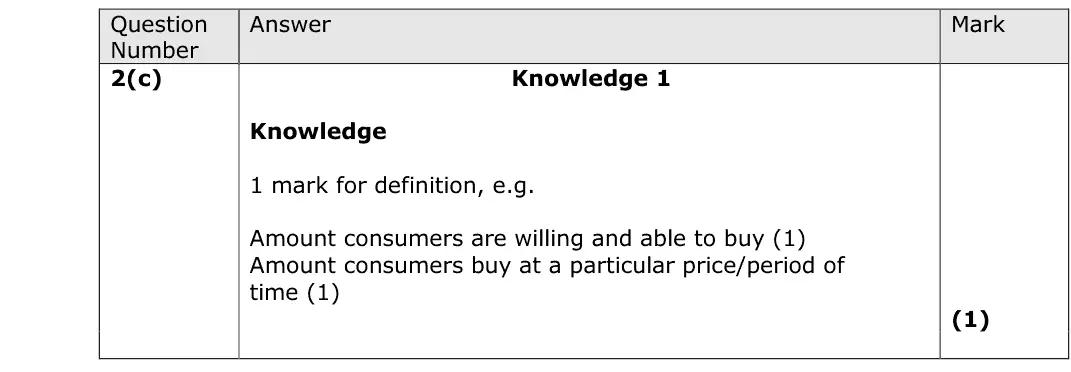
Though many candidates were able to achieve the mark available here, lack of precision in defining demand was an obvious issue for many. Typically, we were looking for some notion of effective demand and definitions discussing needs or simply wants without any sense of ability to buy were too vague to be rewarded.

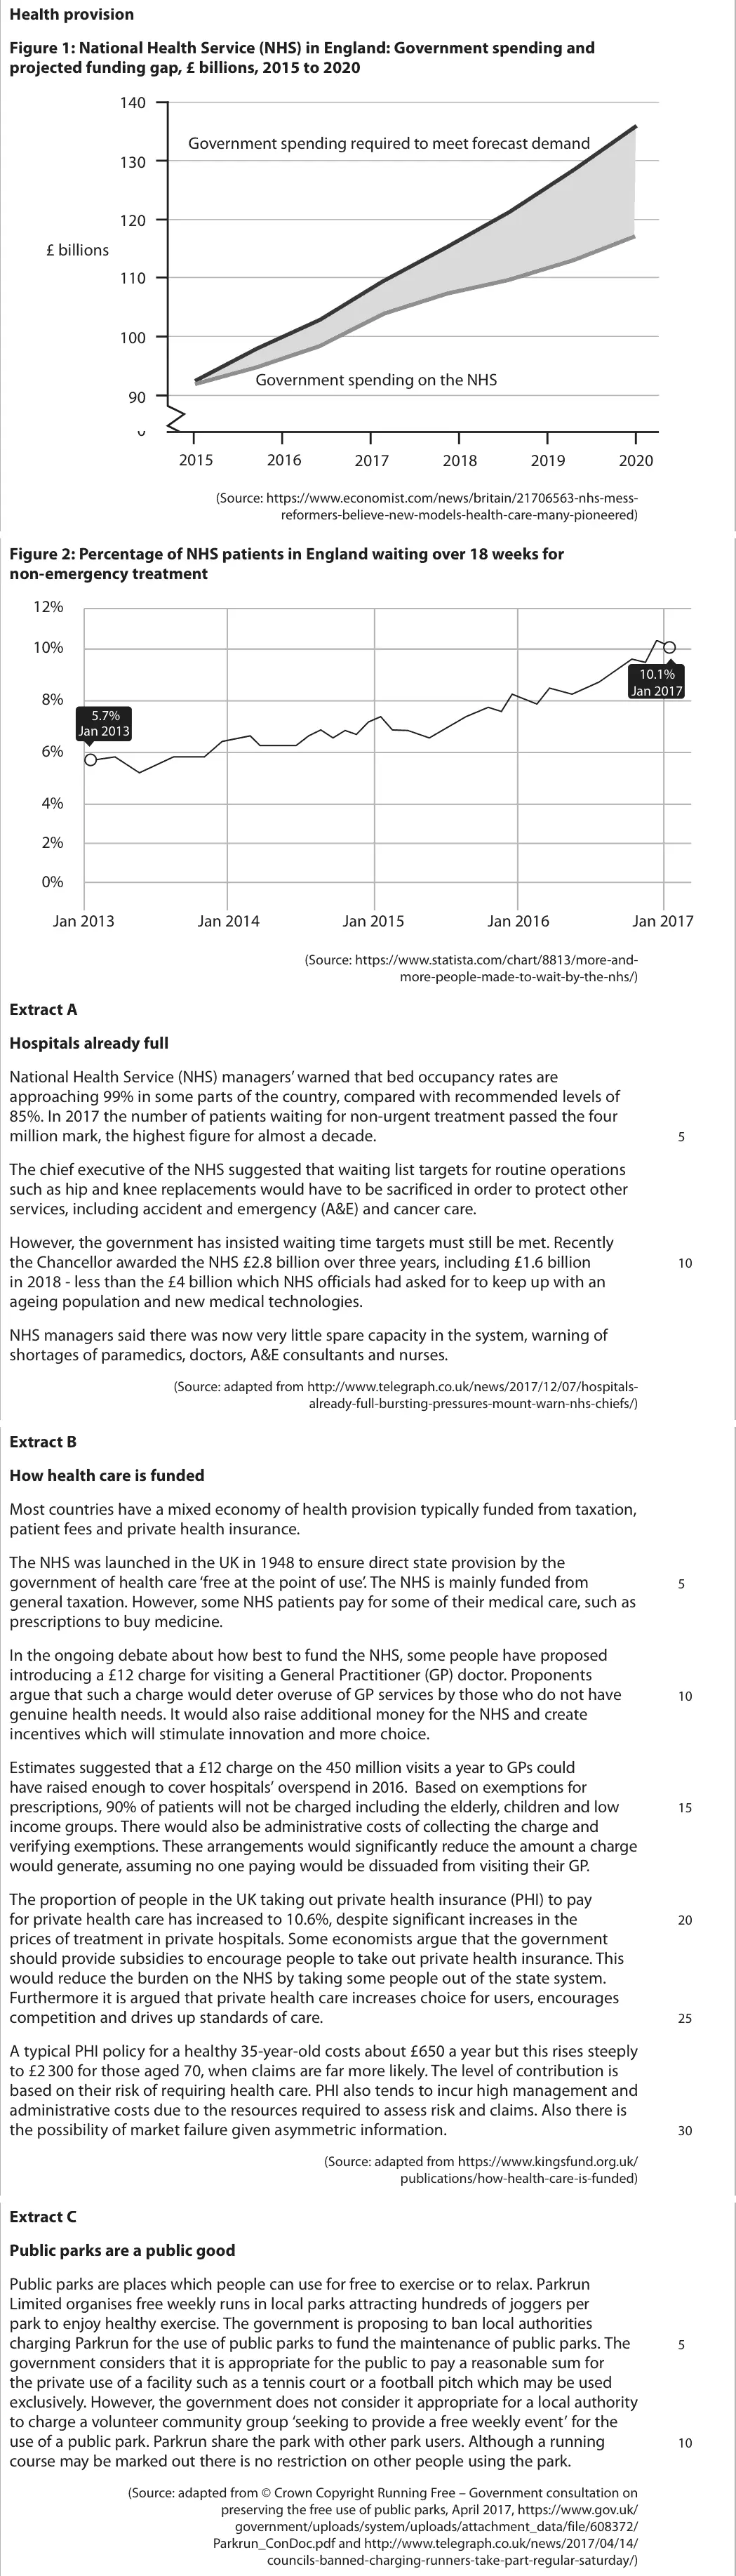
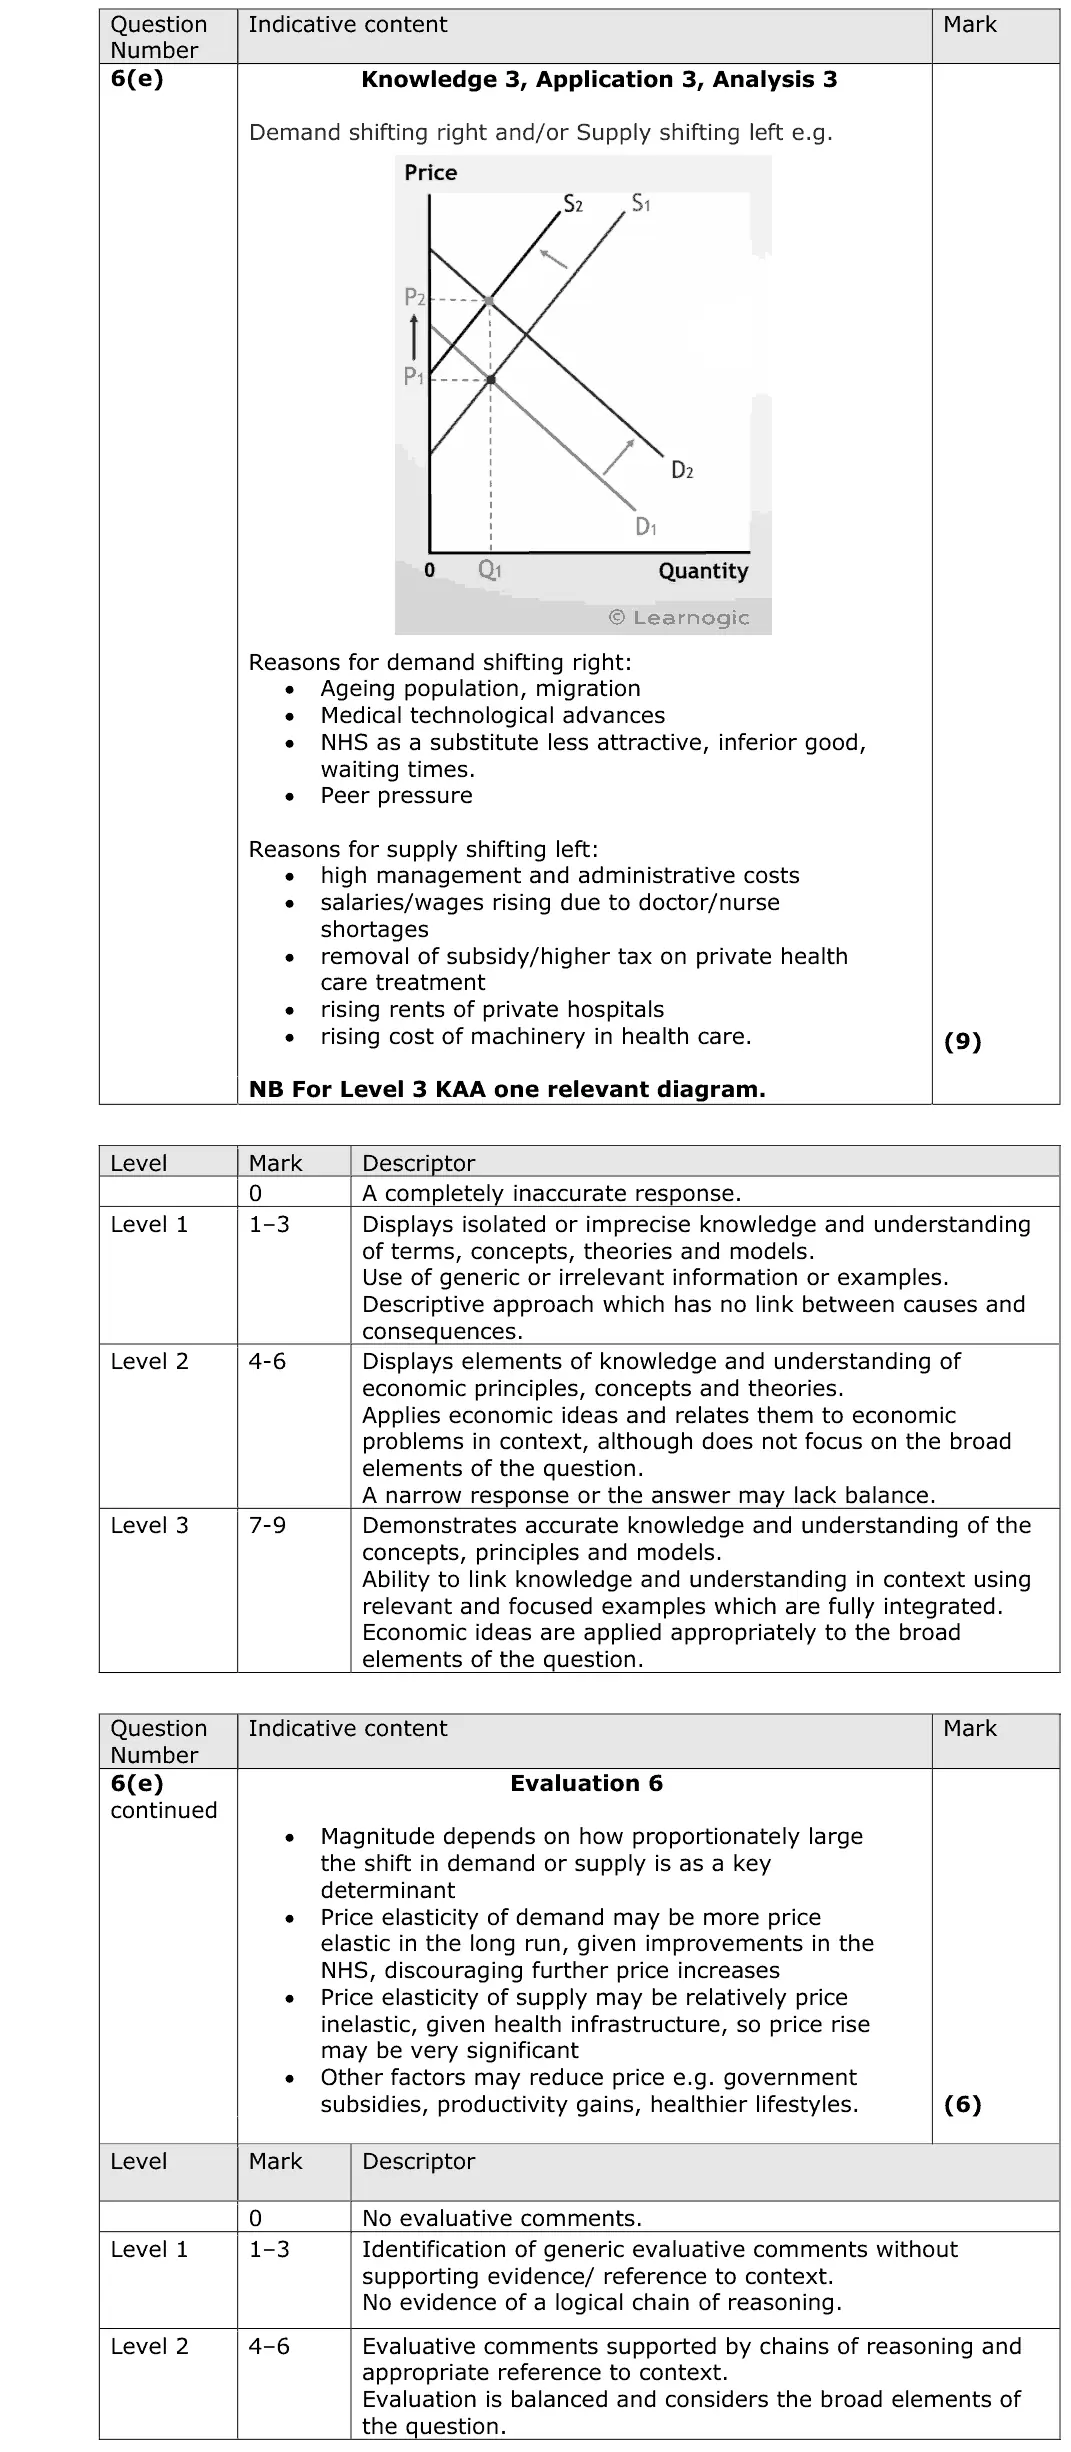
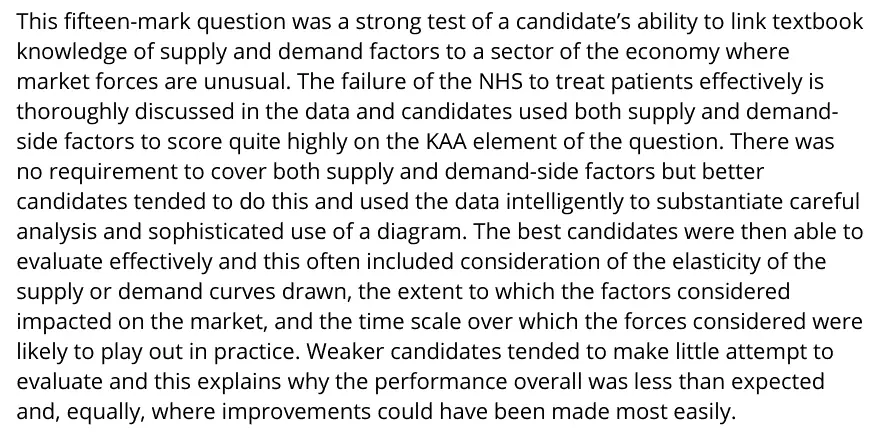
This fifteen-mark question was a strong test of a candidate’s ability to link textbook knowledge of supply and demand factors to a sector of the economy where market forces are unusual. The failure of the NHS to treat patients effectively is thoroughly discussed in the data and candidates used both supply and demand- side factors to score quite highly on the KAA element of the question. There was no requirement to cover both supply and demand-side factors but better candidates tended to do this and used the data intelligently to substantiate careful analysis and sophisticated use of a diagram. The best candidates were then able to evaluate effectively and this often included consideration of the elasticity of the supply or demand curves drawn, the extent to which the factors considered impacted on the market, and the time scale over which the forces considered were likely to play out in practice. Weaker candidates tended to make little attempt to evaluate and this explains why the performance overall was less than expected and, equally, where improvements could have been made most easily.
Quantitative skills: QS 4 (construct and interpret a range of standard graphical forms)

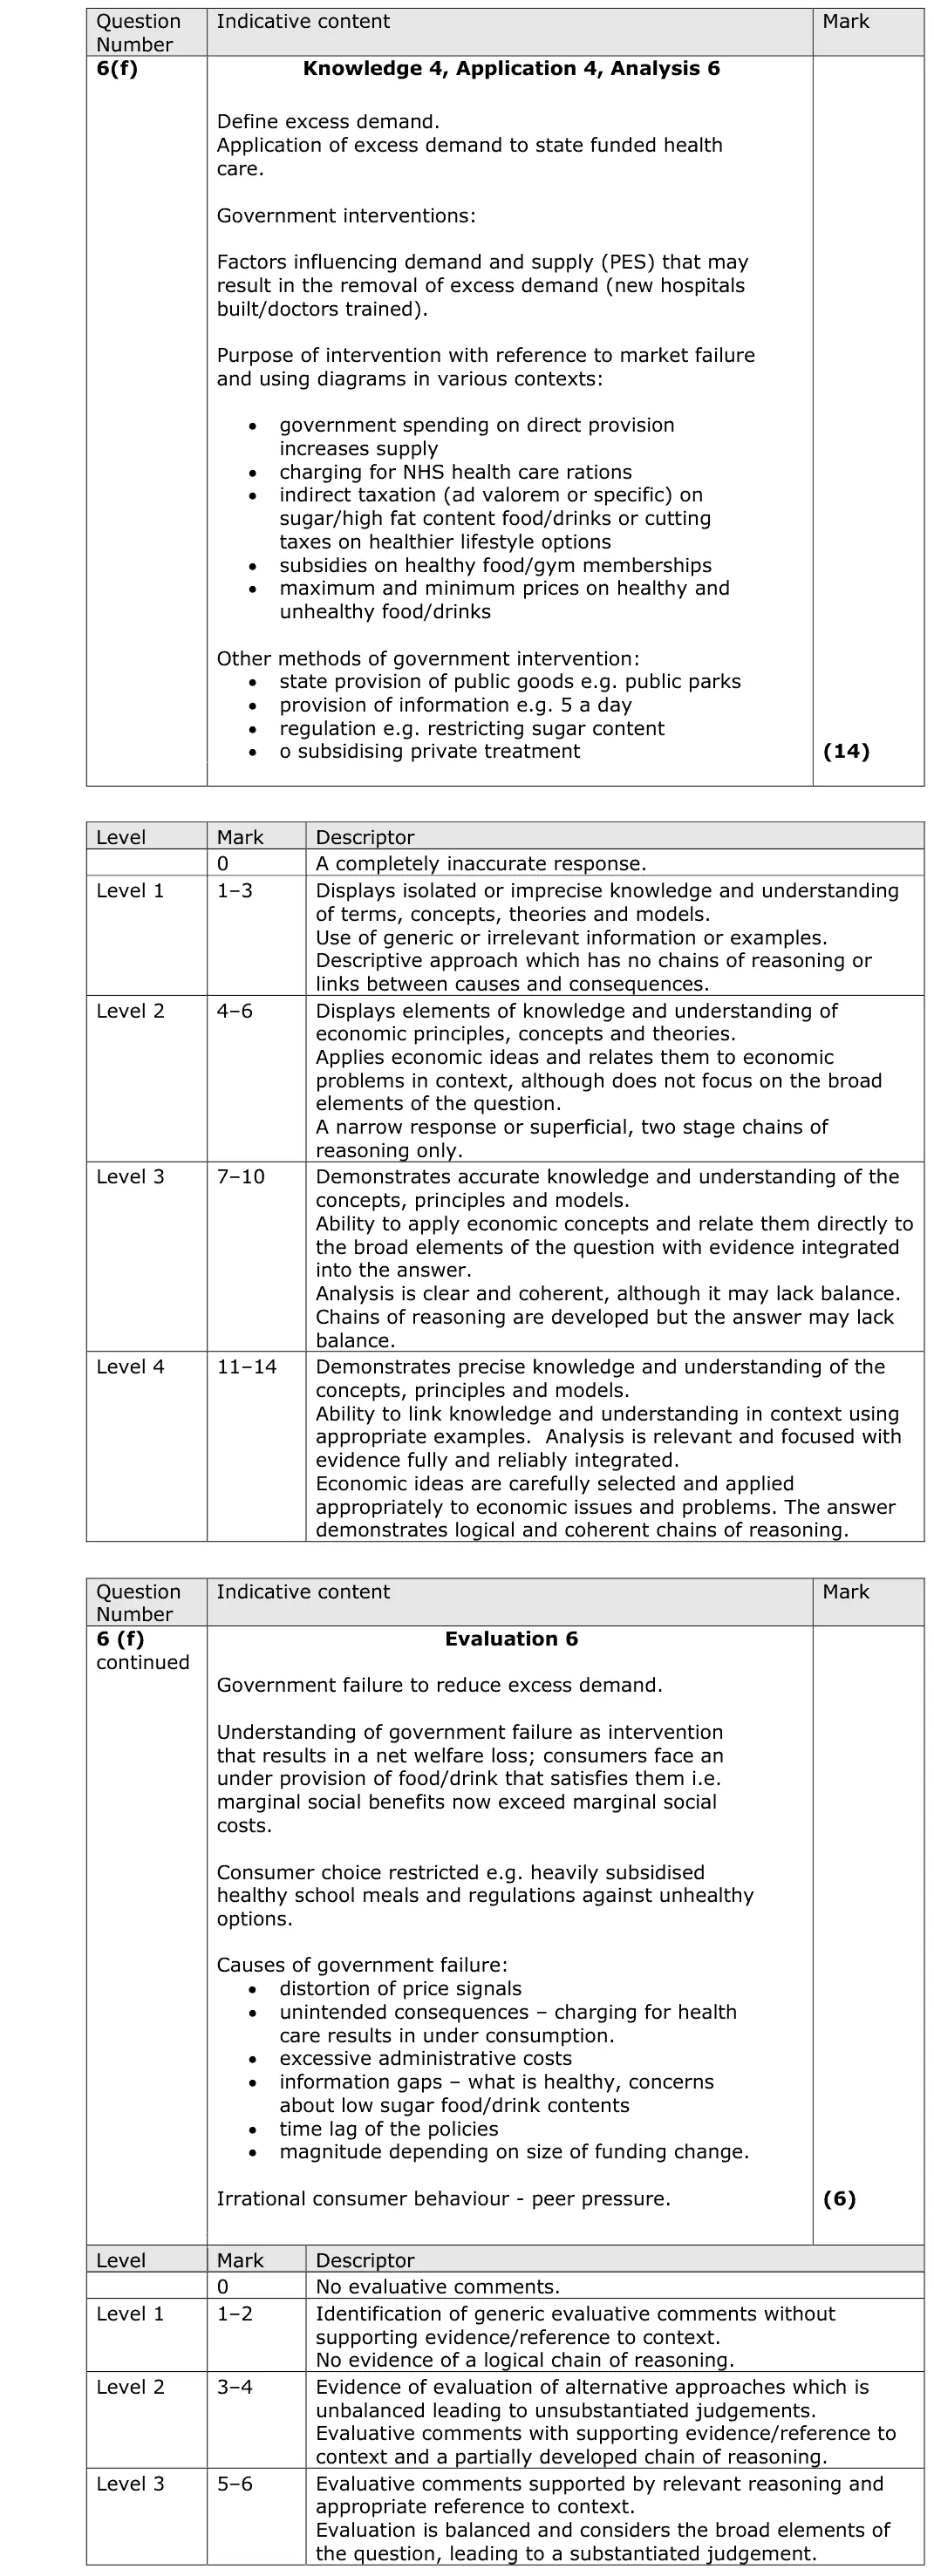
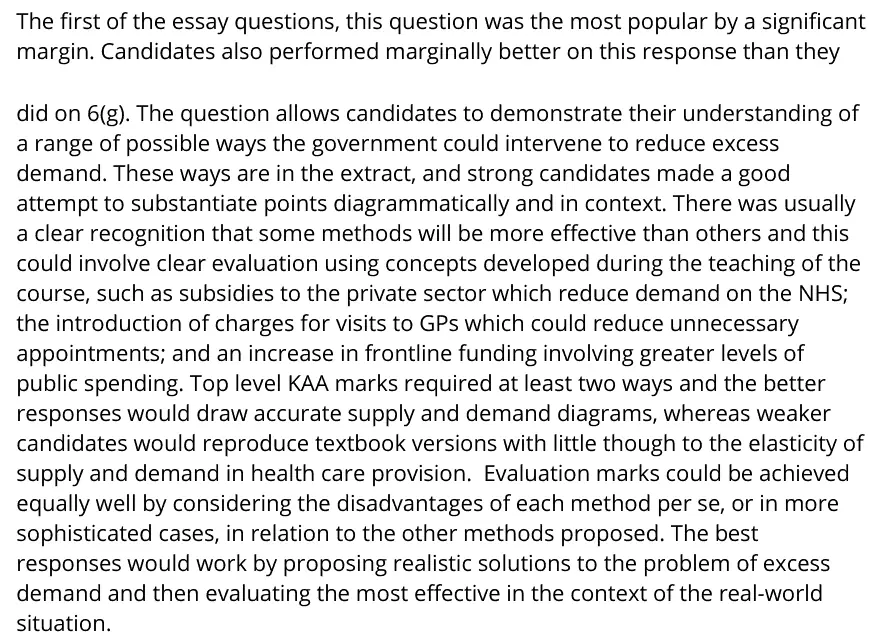
The first of the essay questions, this question was the most popular by a significant margin. Candidates also performed marginally better on this response than they did on 6(g). The question allows candidates to demonstrate their understanding of a range of possible ways the government could intervene to reduce excess demand. These ways are in the extract, and strong candidates made a good attempt to substantiate points diagrammatically and in context. There was usually a clear recognition that some methods will be more effective than others and this could involve clear evaluation using concepts developed during the teaching of the course, such as subsidies to the private sector which reduce demand on the NHS; the introduction of charges for visits to GPs which could reduce unnecessary appointments; and an increase in frontline funding involving greater levels of public spending. Top level KAA marks required at least two ways and the better responses would draw accurate supply and demand diagrams, whereas weaker candidates would reproduce textbook versions with little though to the elasticity of supply and demand in health care provision. Evaluation marks could be achieved equally well by considering the disadvantages of each method per se, or in more sophisticated cases, in relation to the other methods proposed. The best responses would work by proposing realistic solutions to the problem of excess demand and then evaluating the most effective in the context of the real-world situation.
Quantitative skills: QS 4 (construct and interpret a range of standard graphical forms)
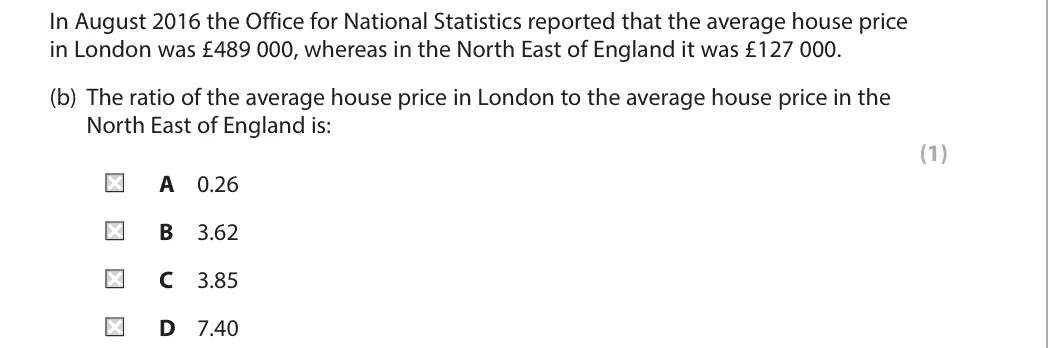
C
Quantitative skills: QS 1 (calculate, use and understand ratios and fractions); QS 9 (interpret, apply and analyse information in written, graphical tabular and numerical forms)

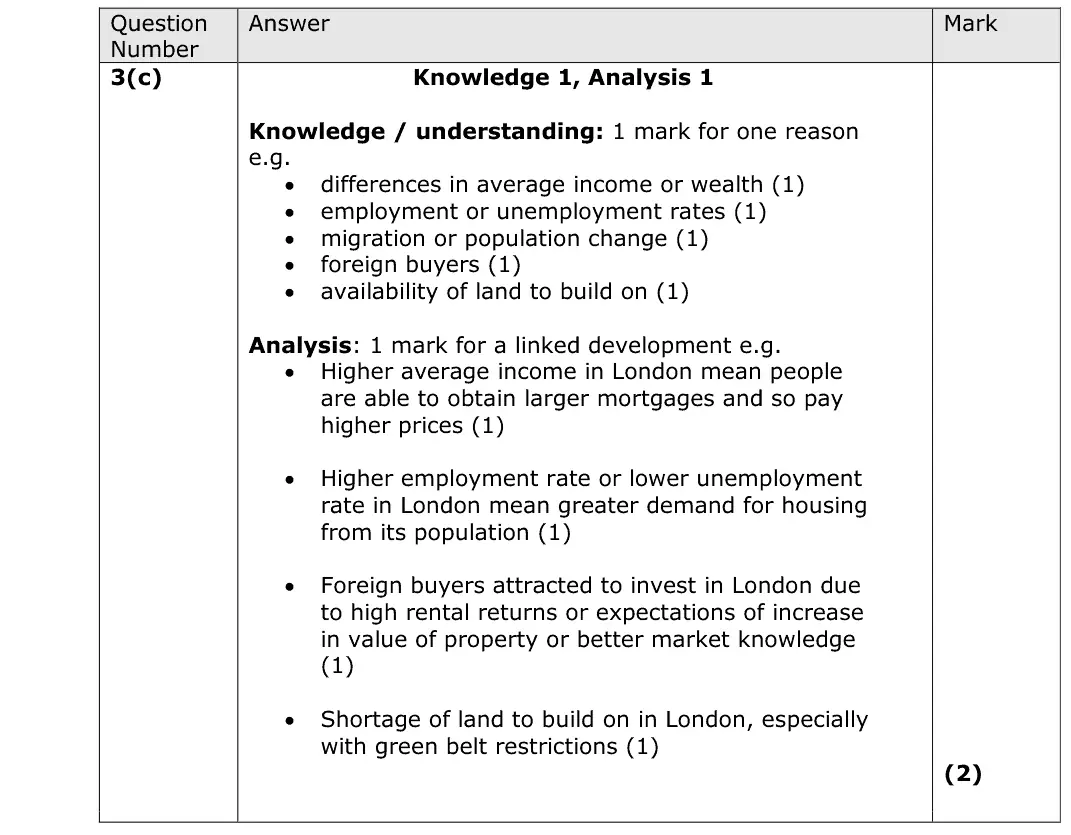
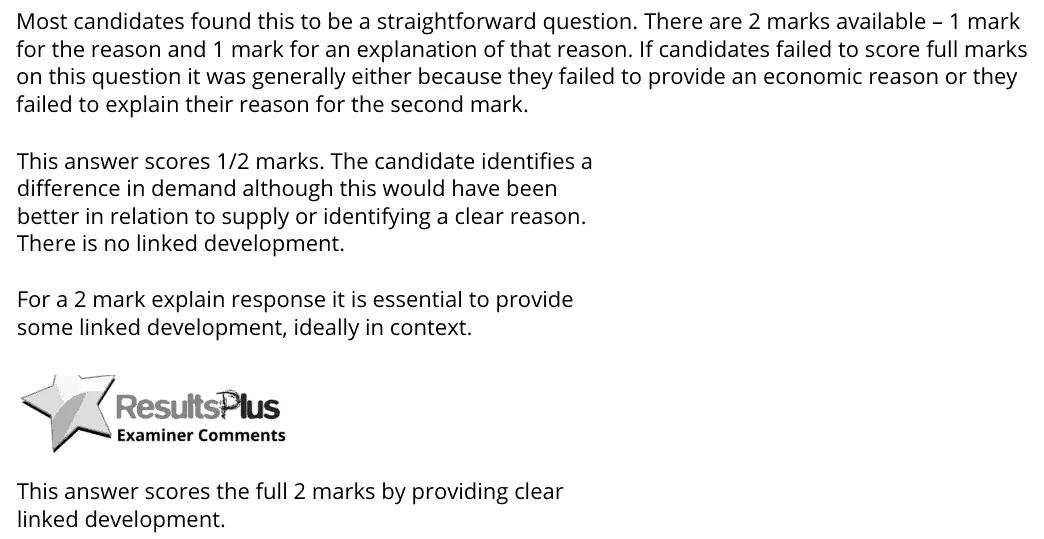
Most candidates found this to be a straightforward question. There are 2 marks available – 1 mark for the reason and 1 mark for an explanation of that reason. If candidates failed to score full marks on this question it was generally either because they failed to provide an economic reason or they failed to explain their reason for the second mark. This answer scores 1/2 marks. The candidate identifies a difference in demand although this would have been better in relation to supply or identifying a clear reason. There is no linked development. For a 2 mark explain response it is essential to provide some linked development, ideally in context. This answer scores the full 2 marks by providing clear linked development.
Quantitative skills: QS 9 (interpret, apply and analyse information in written, graphical tabular and numerical forms)
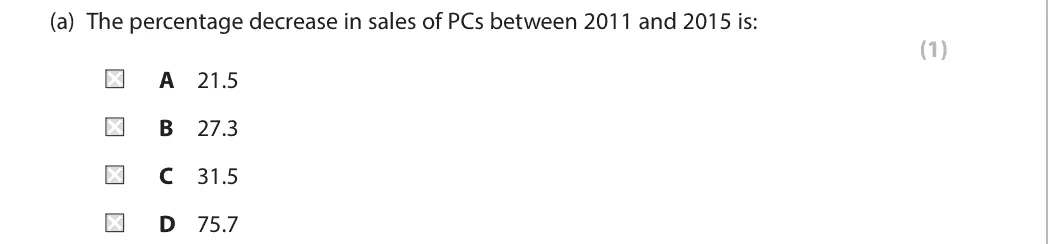
A
Quantitative skills: QS 2 (calculate, use and understand percentages, percentage changes and percentage point changes); QS 9 (interpret, apply and analyse information in written, graphical tabular and numerical forms)

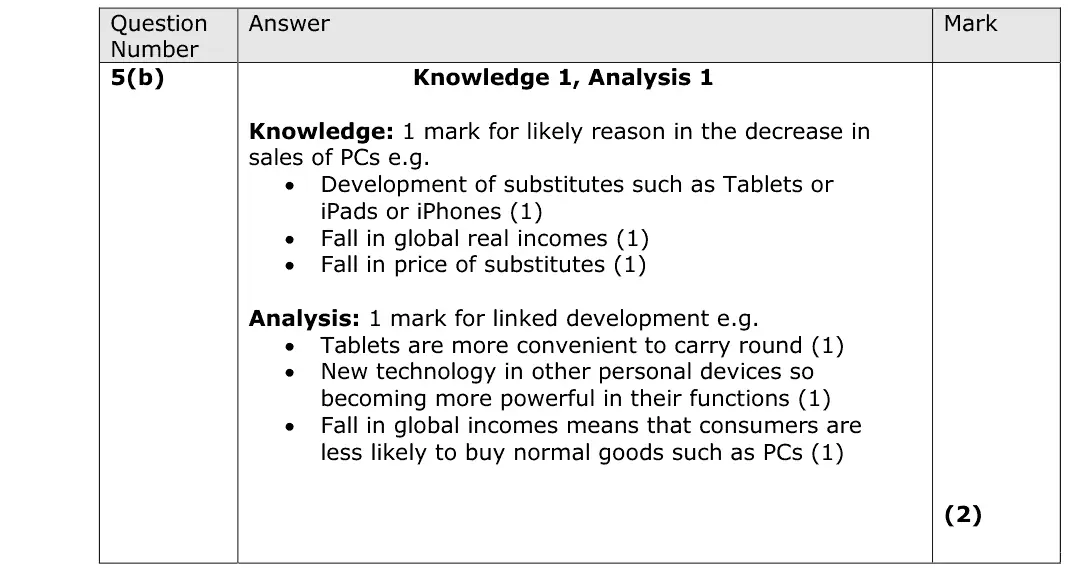
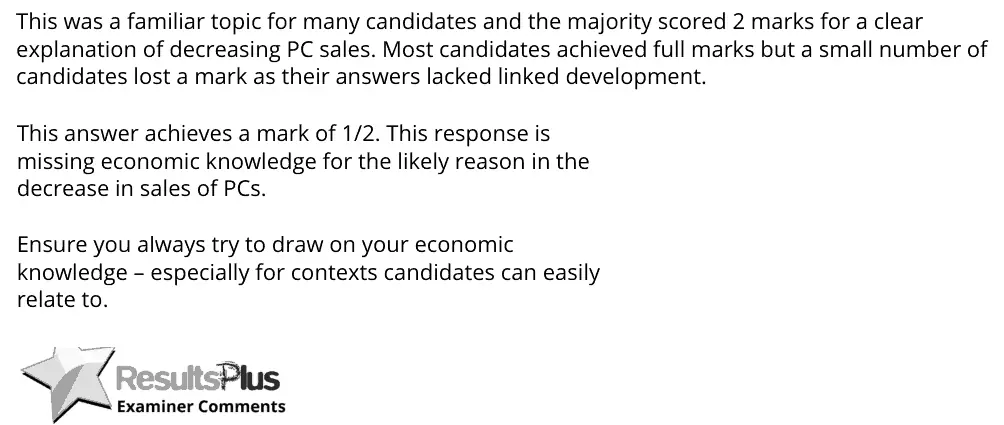
This was a familiar topic for many candidates and the majority scored 2 marks for a clear explanation of decreasing PC sales. Most candidates achieved full marks but a small number of candidates lost a mark as their answers lacked linked development. This answer achieves a mark of 1/2. This response is missing economic knowledge for the likely reason in the decrease in sales of PCs. Ensure you always try to draw on your economic knowledge – especially for contexts candidates can easily relate to.

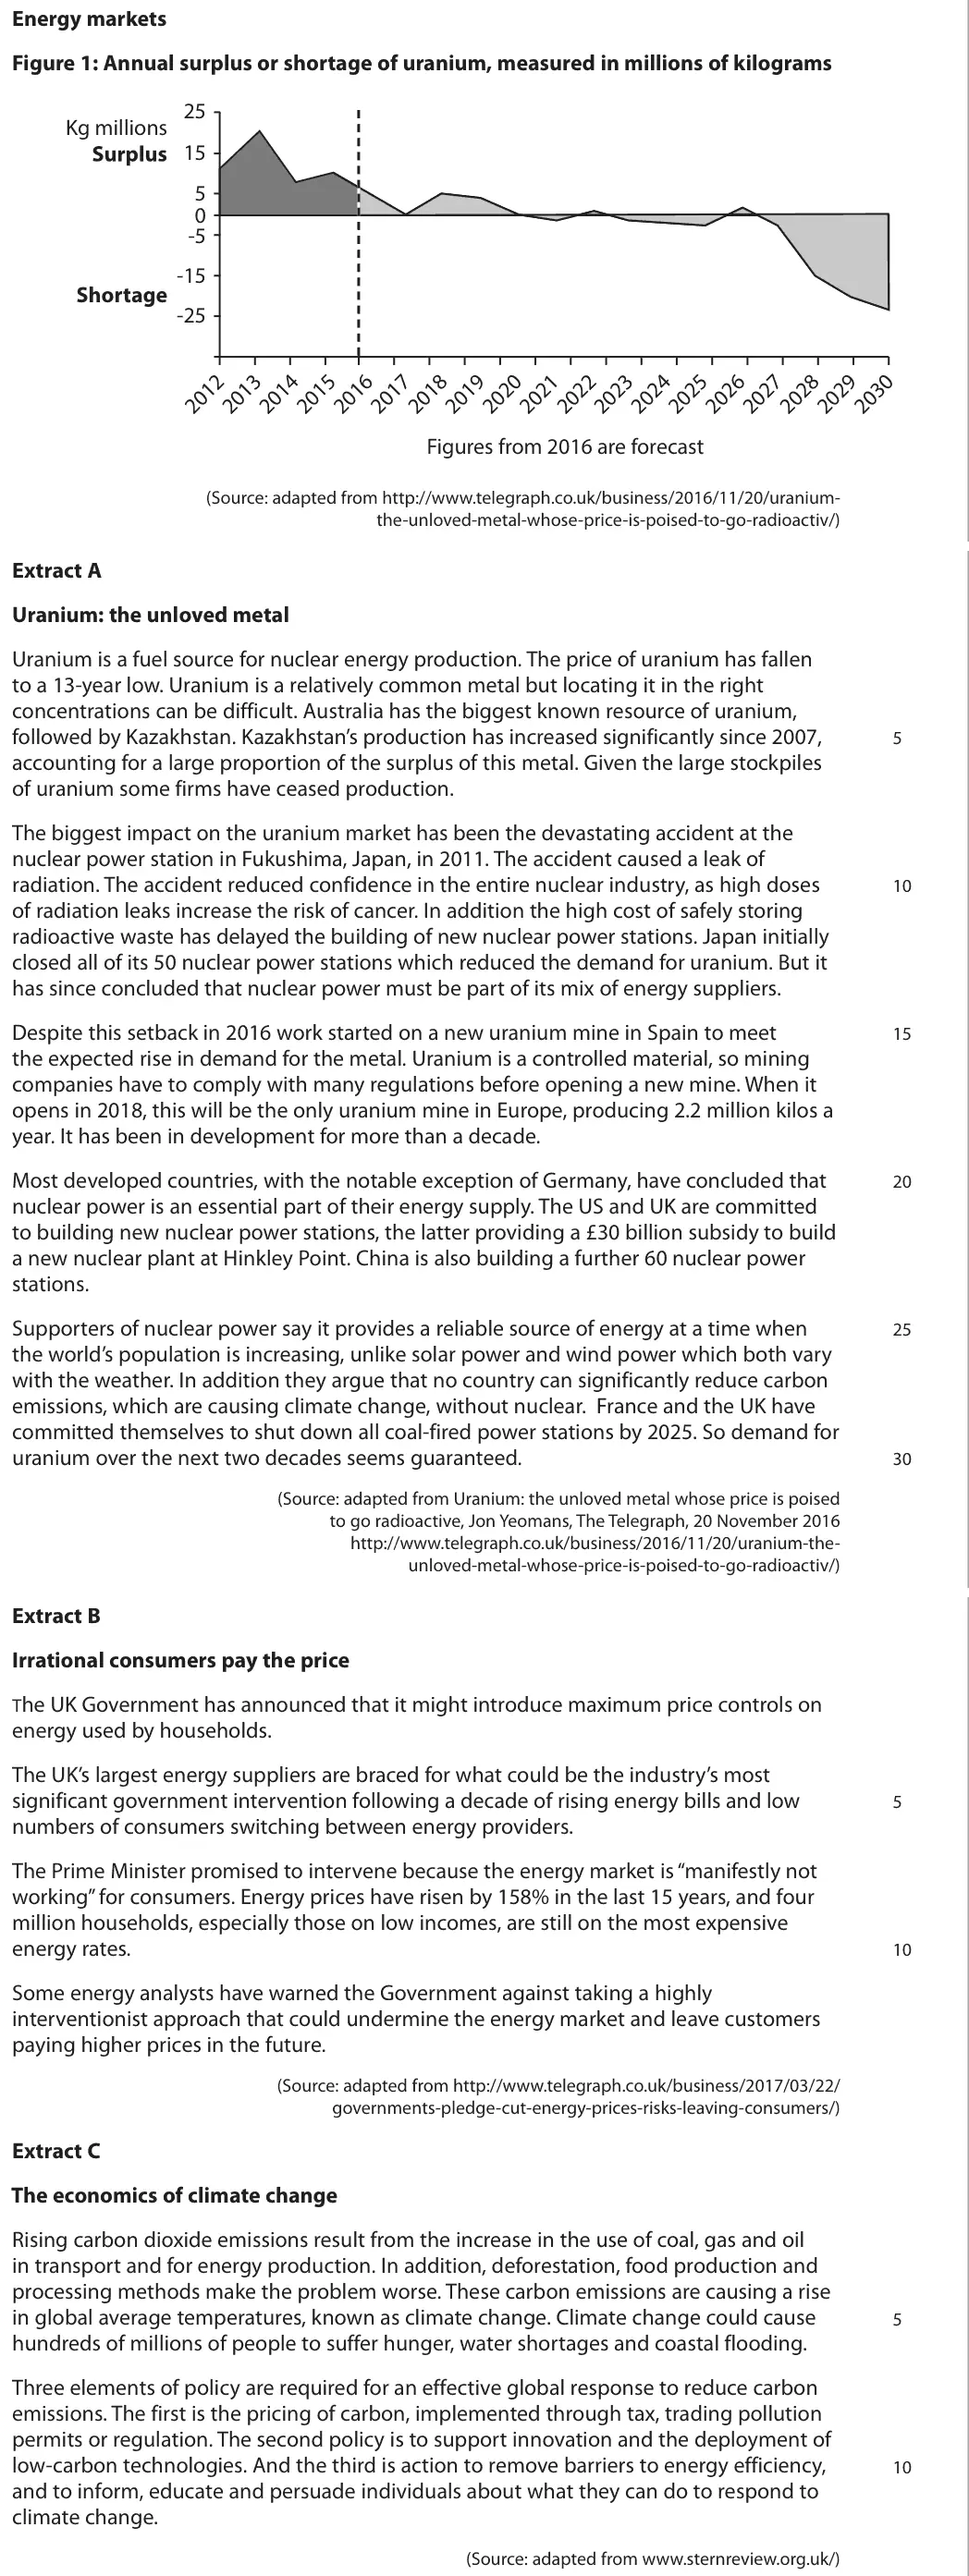
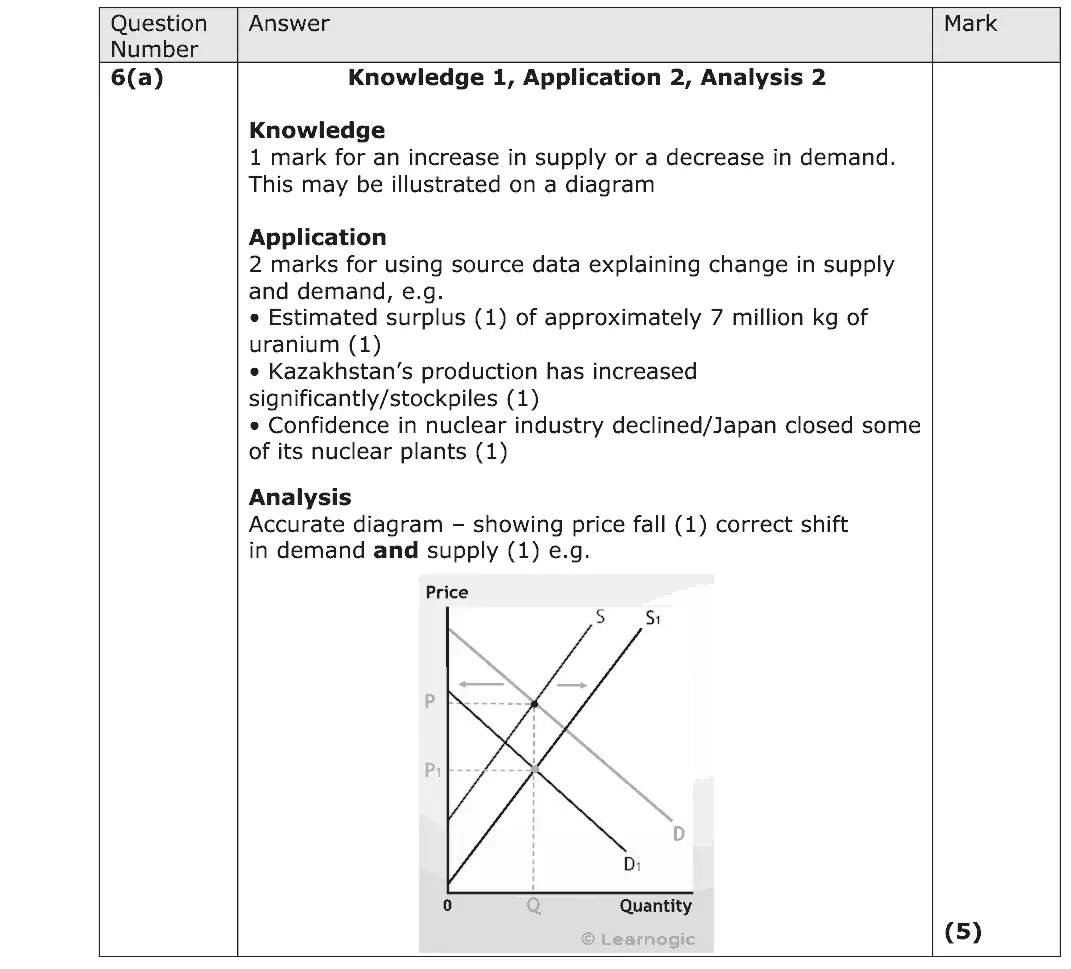
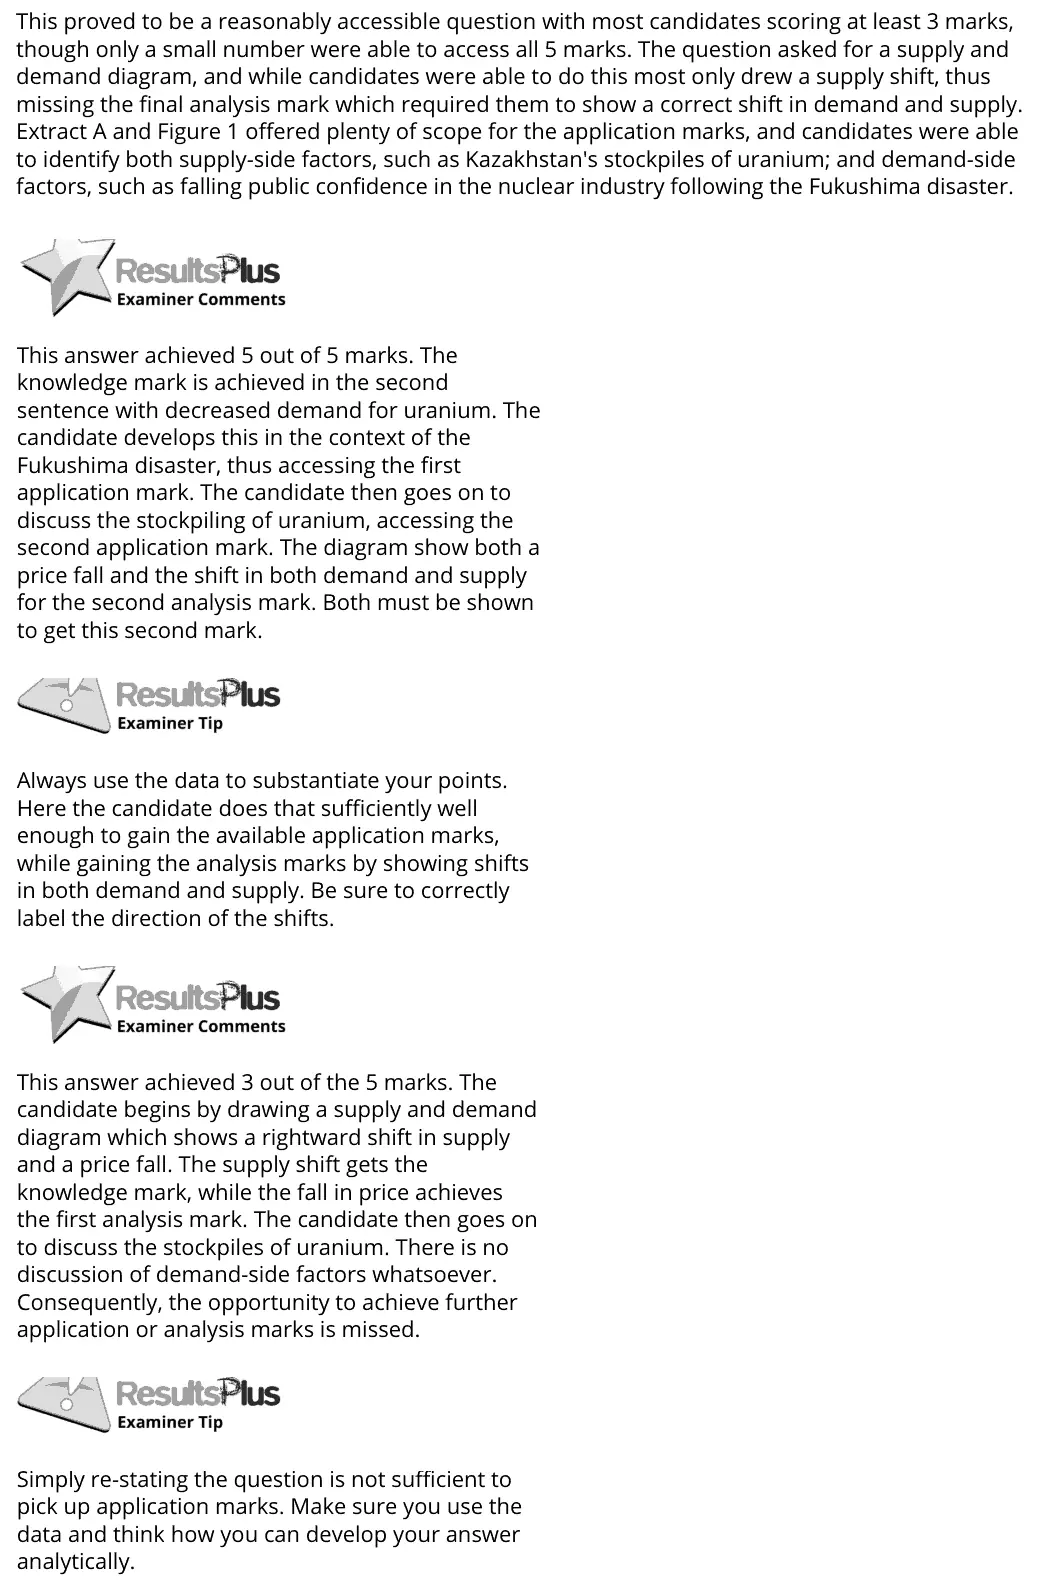
This proved to be a reasonably accessible question with most candidates scoring at least 3 marks, though only a small number were able to access all 5 marks. The question asked for a supply and demand diagram, and while candidates were able to do this most only drew a supply shift, thus missing the final analysis mark which required them to show a correct shift in demand and supply. Extract A and Figure 1 offered plenty of scope for the application marks, and candidates were able to identify both supply-side factors, such as Kazakhstan's stockpiles of uranium; and demand-side factors, such as falling public confidence in the nuclear industry following the Fukushima disaster. This answer achieved 5 out of 5 marks. The knowledge mark is achieved in the second sentence with decreased demand for uranium. The candidate develops this in the context of the Fukushima disaster, thus accessing the first application mark. The candidate then goes on to discuss the stockpiling of uranium, accessing the second application mark. The diagram show both a price fall and the shift in both demand and supply for the second analysis mark. Both must be shown to get this second mark. Always use the data to substantiate your points. Here the candidate does that sufficiently well enough to gain the available application marks, while gaining the analysis marks by showing shifts in both demand and supply. Be sure to correctly label the direction of the shifts. This answer achieved 3 out of the 5 marks. The candidate begins by drawing a supply and demand diagram which shows a rightward shift in supply and a price fall. The supply shift gets the knowledge mark, while the fall in price achieves the first analysis mark. The candidate then goes on to discuss the stockpiles of uranium. There is no discussion of demand-side factors whatsoever. Consequently, the opportunity to achieve further application or analysis marks is missed. Simply re-stating the question is not sufficient to pick up application marks. Make sure you use the data and think how you can develop your answer analytically.
Quantitative skills: QS 4 (construct and interpret a range of standard graphical forms); QS 9 (interpret, apply and analyse information in written, graphical tabular and numerical forms)

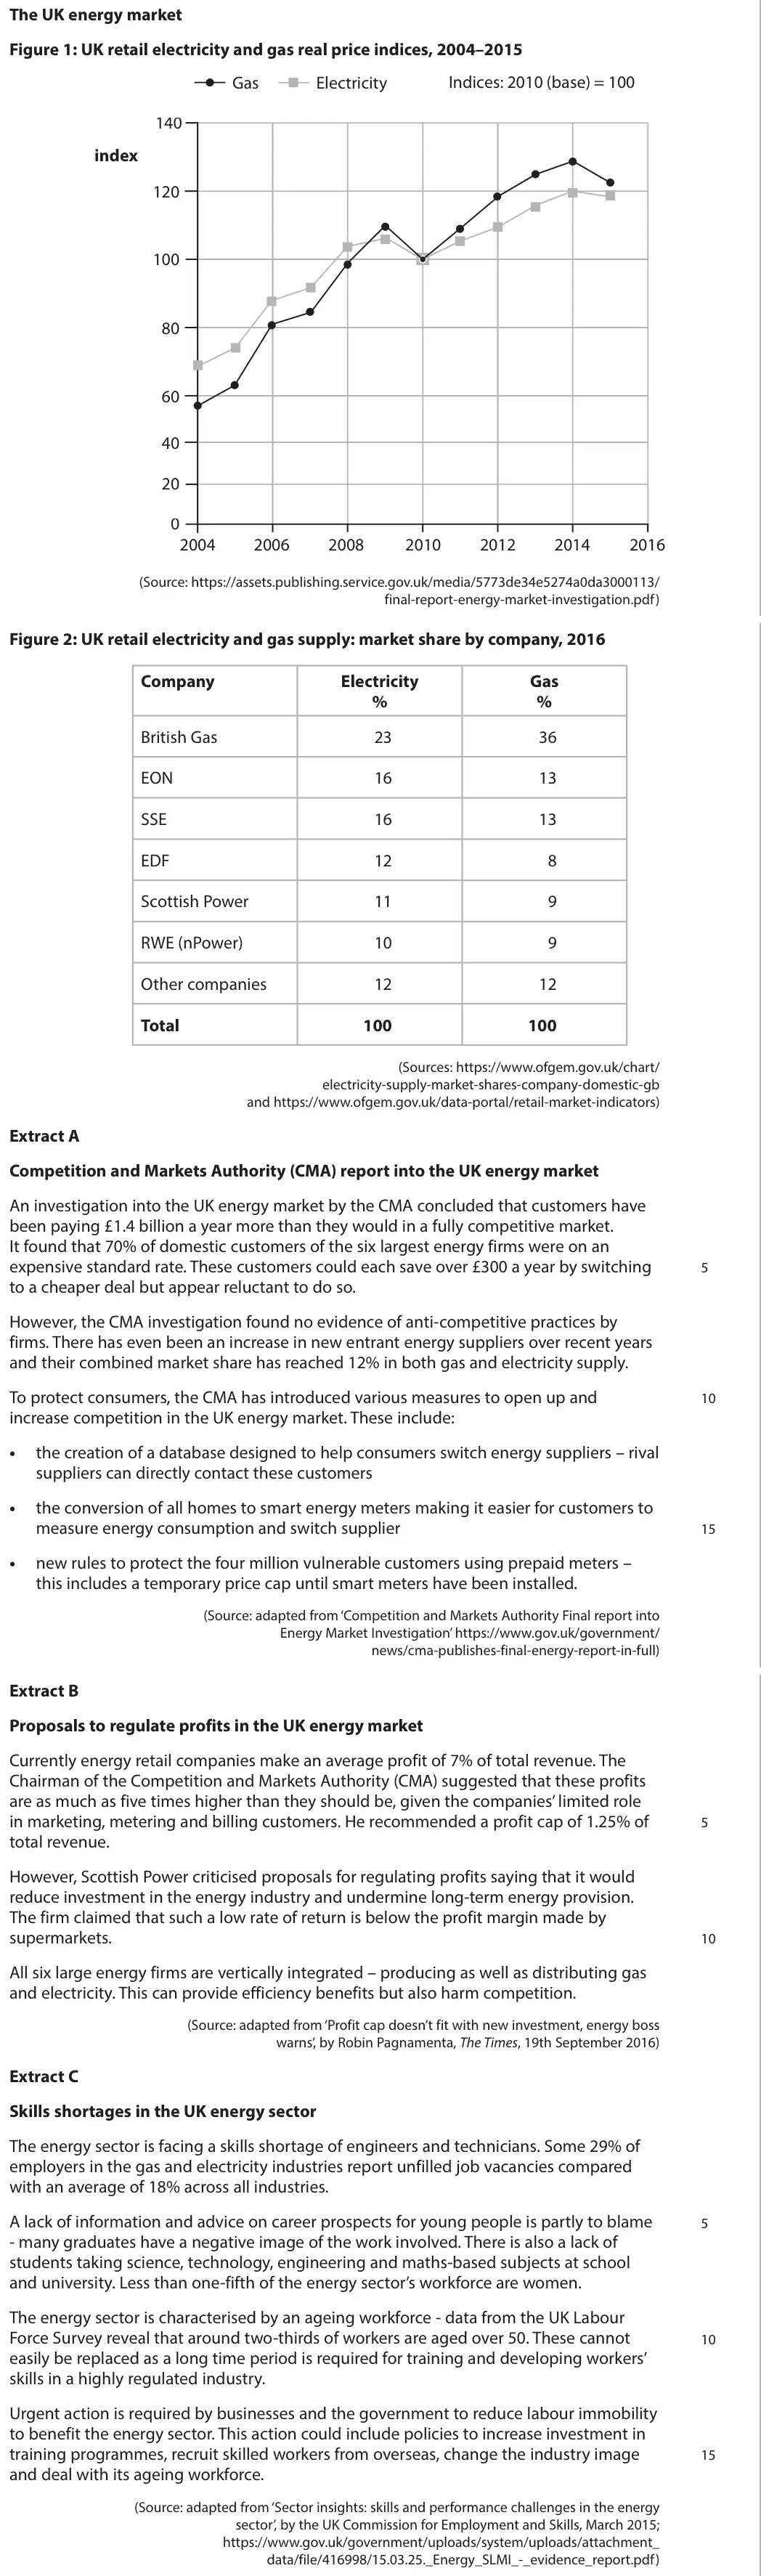
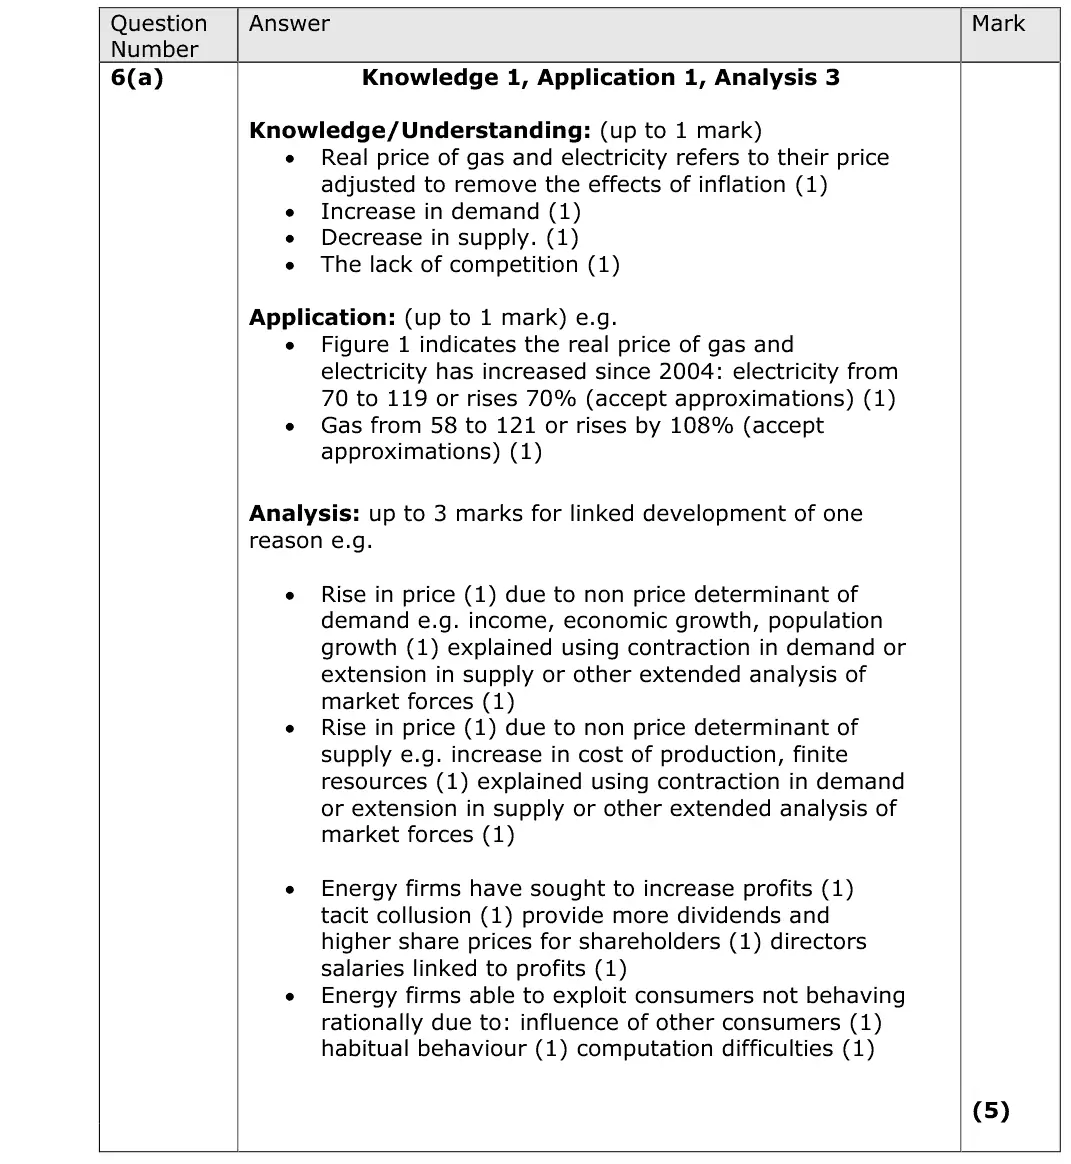
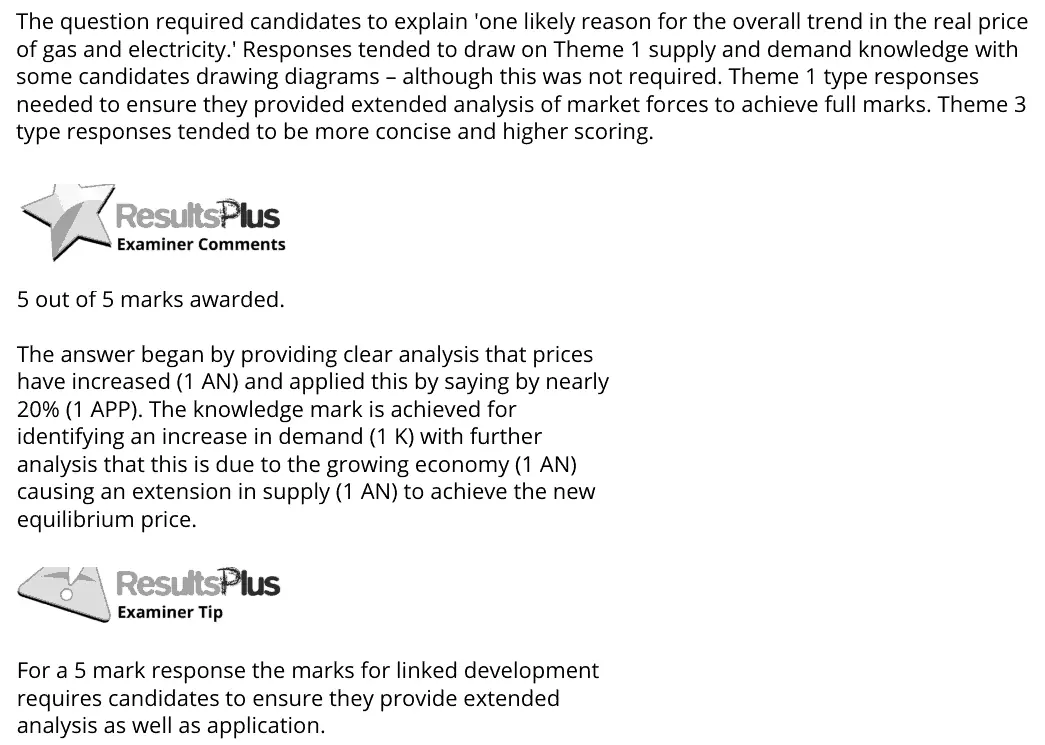
The question required candidates to explain 'one likely reason for the overall trend in the real price of gas and electricity.' Responses tended to draw on Theme 1 supply and demand knowledge with some candidates drawing diagrams – although this was not required. Theme 1 type responses needed to ensure they provided extended analysis of market forces to achieve full marks. Theme 3 type responses tended to be more concise and higher scoring. 5 out of 5 marks awarded. The answer began by providing clear analysis that prices have increased (1 AN) and applied this by saying by nearly 20% (1 APP). The knowledge mark is achieved for identifying an increase in demand (1 K) with further analysis that this is due to the growing economy (1 AN) causing an extension in supply (1 AN) to achieve the new equilibrium price. For a 5 mark response the marks for linked development requires candidates to ensure they provide extended analysis as well as application.
Quantitative skills: QS 5 (calculate and interpret index numbers); QS 9 (interpret, apply and analyse information in written, graphical tabular and numerical forms)

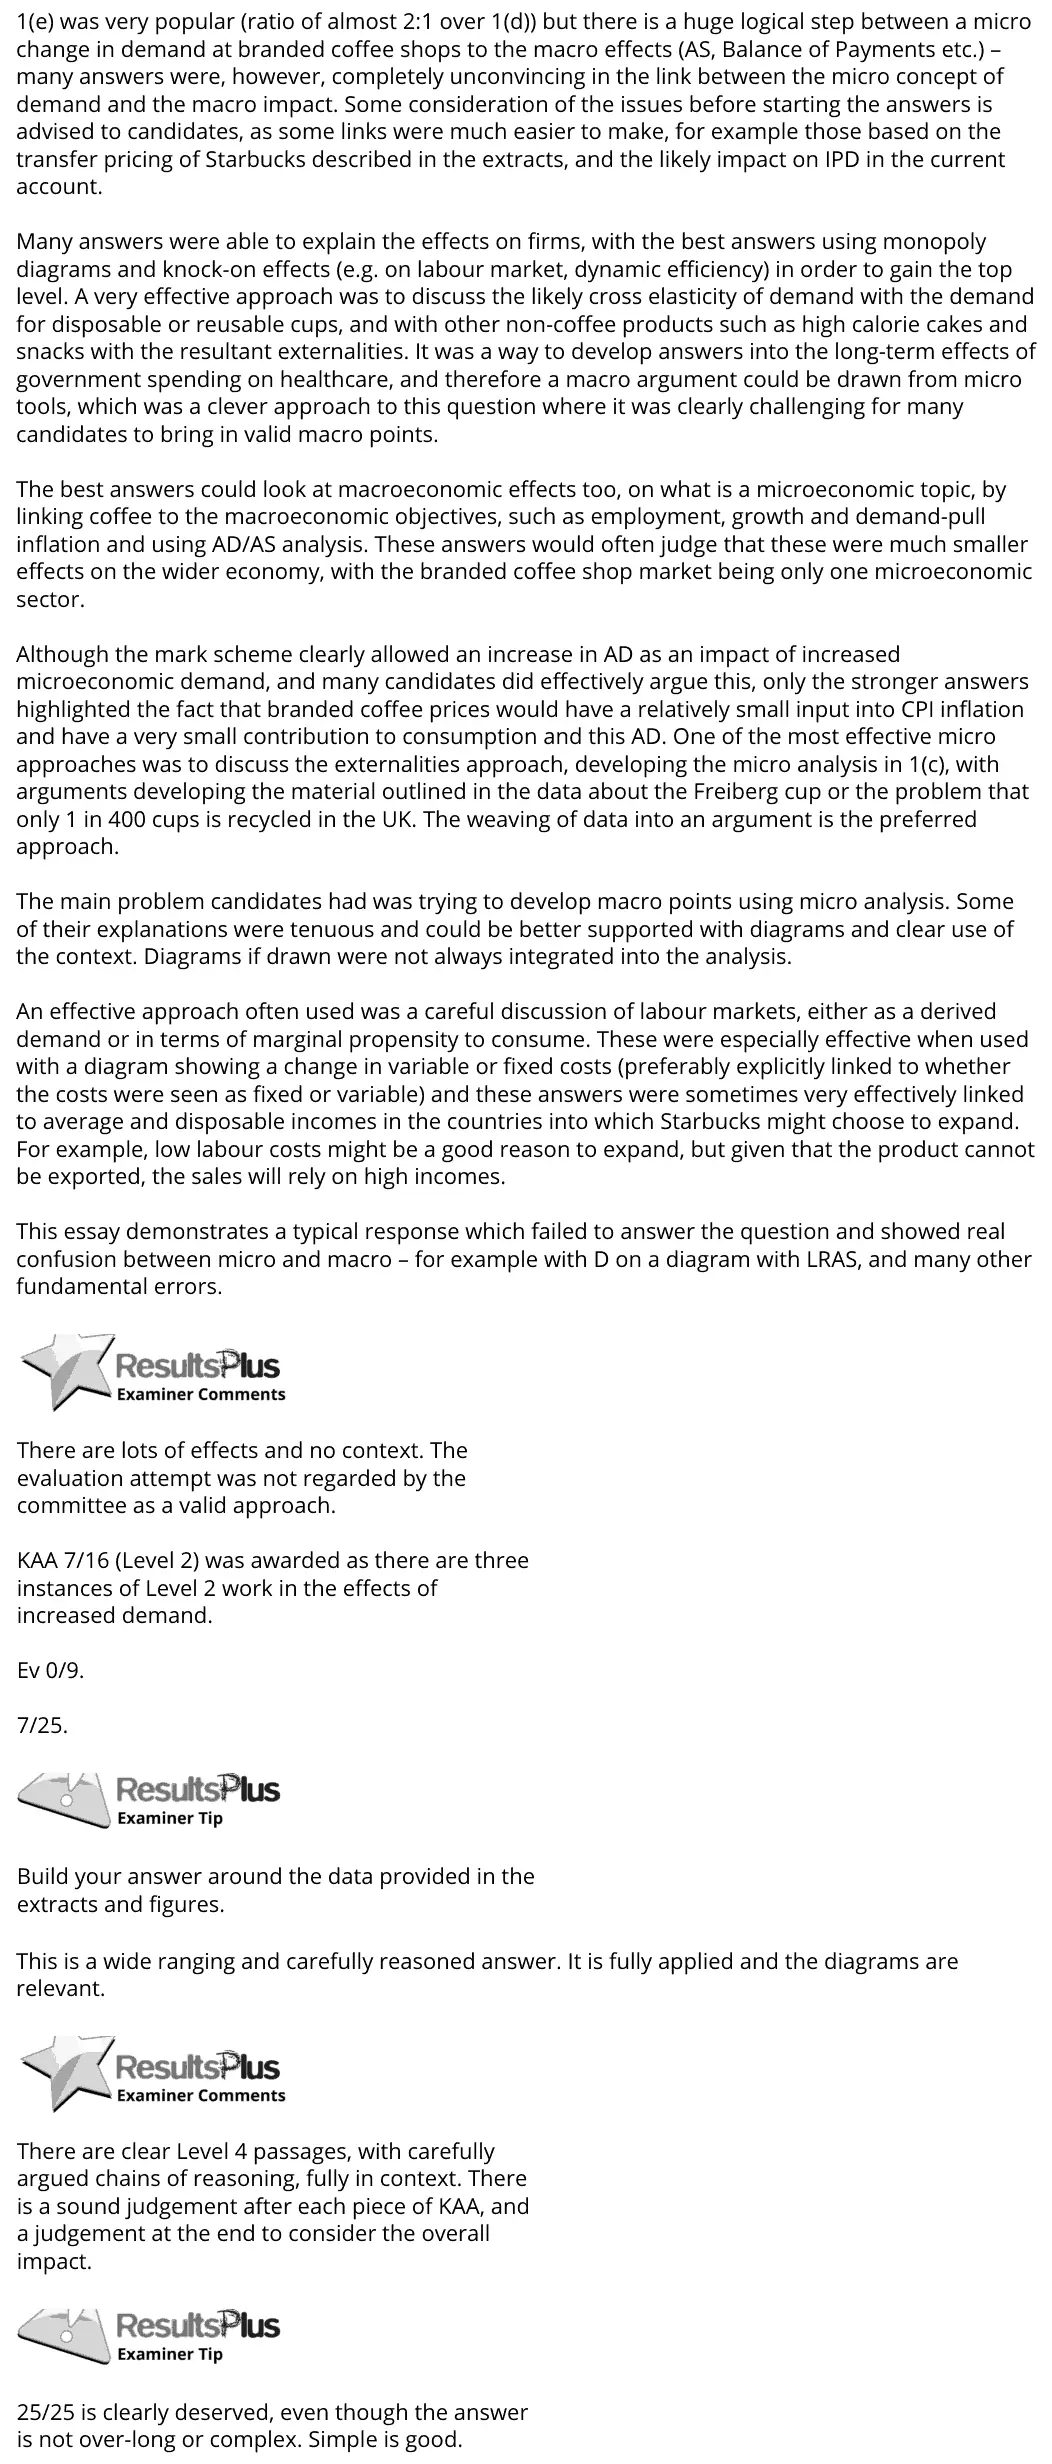
1(e) was very popular (ratio of almost 2:1 over 1(d)) but there is a huge logical step between a micro change in demand at branded coffee shops to the macro effects (AS, Balance of Payments etc.) – many answers were, however, completely unconvincing in the link between the micro concept of demand and the macro impact. Some consideration of the issues before starting the answers is advised to candidates, as some links were much easier to make, for example those based on the transfer pricing of Starbucks described in the extracts, and the likely impact on IPD in the current account. Many answers were able to explain the effects on firms, with the best answers using monopoly diagrams and knock-on effects (e.g. on labour market, dynamic efficiency) in order to gain the top level. A very effective approach was to discuss the likely cross elasticity of demand with the demand for disposable or reusable cups, and with other non-coffee products such as high calorie cakes and snacks with the resultant externalities. It was a way to develop answers into the long-term effects of government spending on healthcare, and therefore a macro argument could be drawn from micro tools, which was a clever approach to this question where it was clearly challenging for many candidates to bring in valid macro points. The best answers could look at macroeconomic effects too, on what is a microeconomic topic, by linking coffee to the macroeconomic objectives, such as employment, growth and demand-pull inflation and using AD/AS analysis. These answers would often judge that these were much smaller effects on the wider economy, with the branded coffee shop market being only one microeconomic sector. Although the mark scheme clearly allowed an increase in AD as an impact of increased microeconomic demand, and many candidates did effectively argue this, only the stronger answers highlighted the fact that branded coffee prices would have a relatively small input into CPI inflation and have a very small contribution to consumption and this AD. One of the most effective micro approaches was to discuss the externalities approach, developing the micro analysis in 1(c), with arguments developing the material outlined in the data about the Freiberg cup or the problem that only 1 in 400 cups is recycled in the UK. The weaving of data into an argument is the preferred approach. The main problem candidates had was trying to develop macro points using micro analysis. Some of their explanations were tenuous and could be better supported with diagrams and clear use of the context. Diagrams if drawn were not always integrated into the analysis. An effective approach often used was a careful discussion of labour markets, either as a derived demand or in terms of marginal propensity to consume. These were especially effective when used with a diagram showing a change in variable or fixed costs (preferably explicitly linked to whether the costs were seen as fixed or variable) and these answers were sometimes very effectively linked to average and disposable incomes in the countries into which Starbucks might choose to expand. For example, low labour costs might be a good reason to expand, but given that the product cannot be exported, the sales will rely on high incomes. This essay demonstrates a typical response which failed to answer the question and showed real confusion between micro and macro – for example with D on a diagram with LRAS, and many other fundamental errors. There are lots of effects and no context. The evaluation attempt was not regarded by the committee as a valid approach. KAA 7/16 (Level 2) was awarded as there are three instances of Level 2 work in the effects of increased demand. Ev 0/9. 7/25. Build your answer around the data provided in the extracts and figures. This is a wide ranging and carefully reasoned answer. It is fully applied and the diagrams are relevant. There are clear Level 4 passages, with carefully argued chains of reasoning, fully in context. There is a sound judgement after each piece of KAA, and a judgement at the end to consider the overall impact. 25/25 is clearly deserved, even though the answer is not over-long or complex. Simple is good.

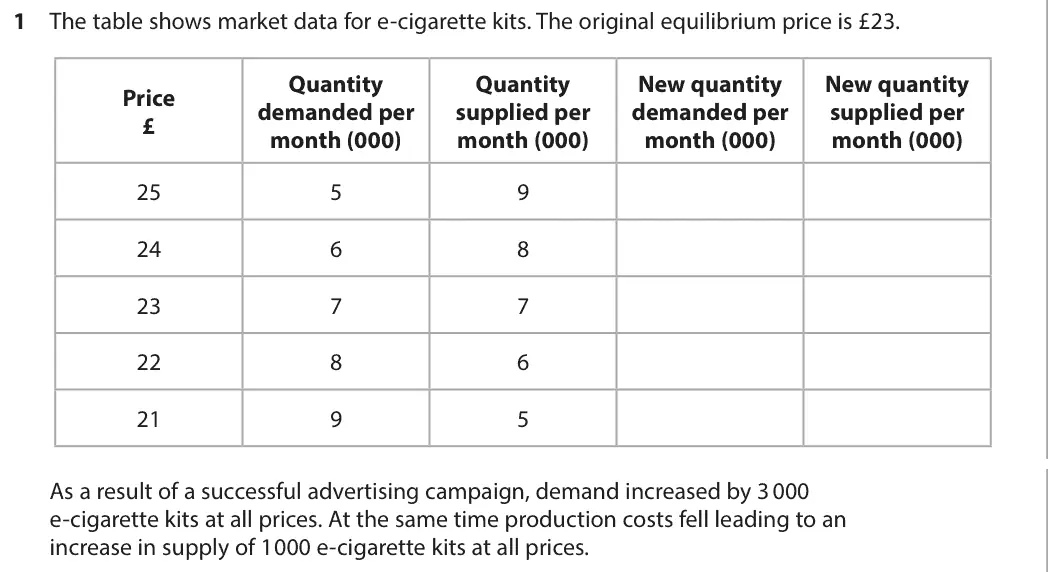
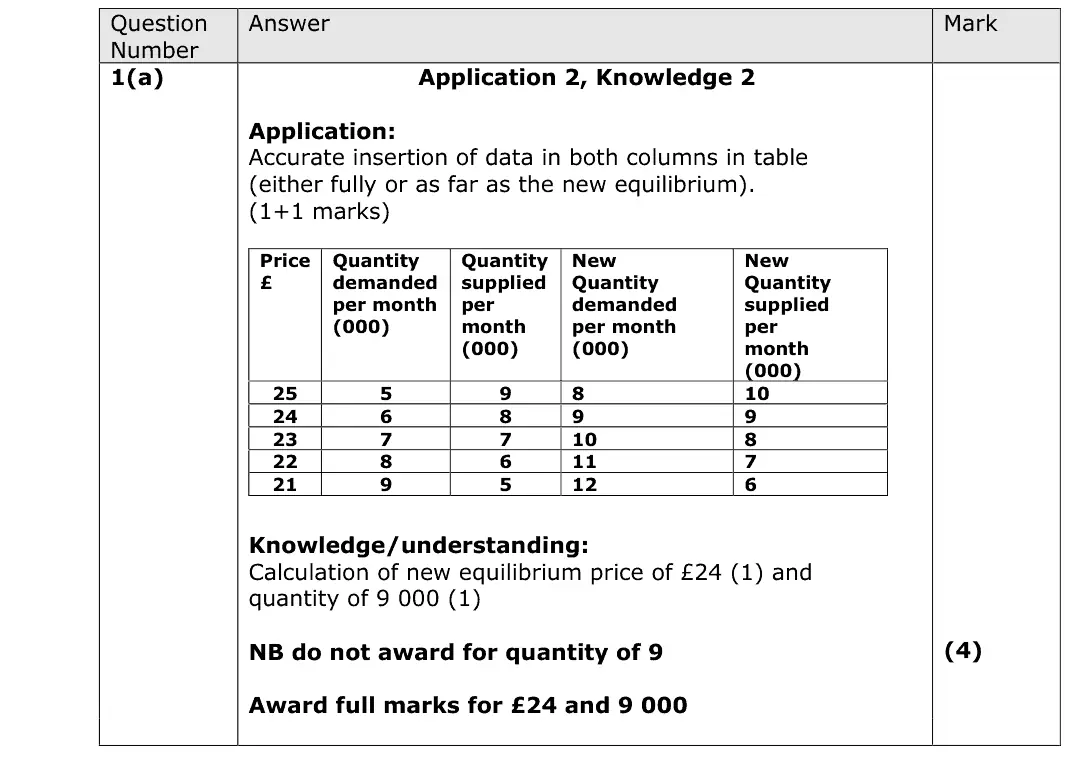
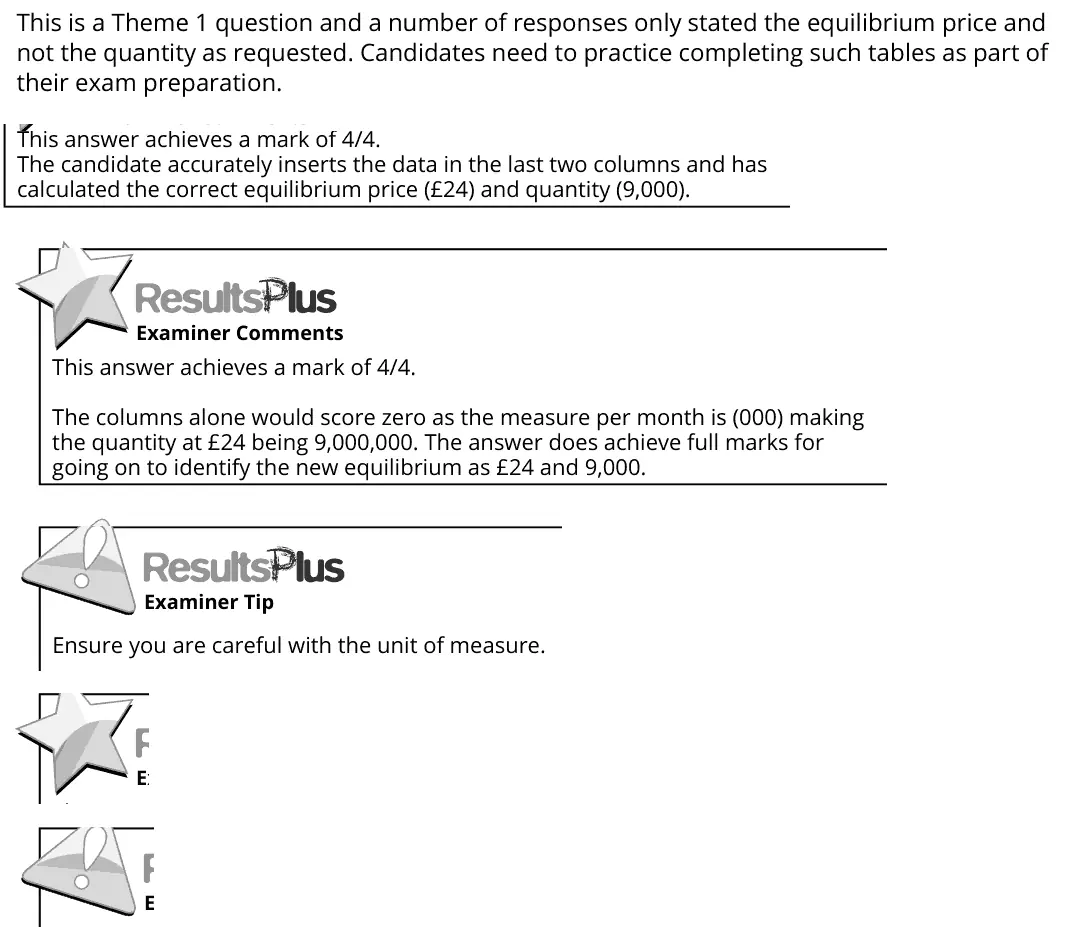
This is a Theme 1 question and a number of responses only stated the equilibrium price and not the quantity as requested. Candidates need to practice completing such tables as part of their exam preparation. This answer achieves a mark of 4/4. The candidate accurately inserts the data in the last two columns and has calculated the correct equilibrium price (£24) and quantity (9,000). This answer achieves a mark of 4/4. The columns alone would score zero as the measure per month is (000) making the quantity at £24 being 9,000,000. The answer does achieve full marks for going on to identify the new equilibrium as £24 and 9,000. Ensure you are careful with the unit of measure.
Quantitative skills: QS 9 (interpret, apply and analyse information in written, graphical tabular and numerical forms)

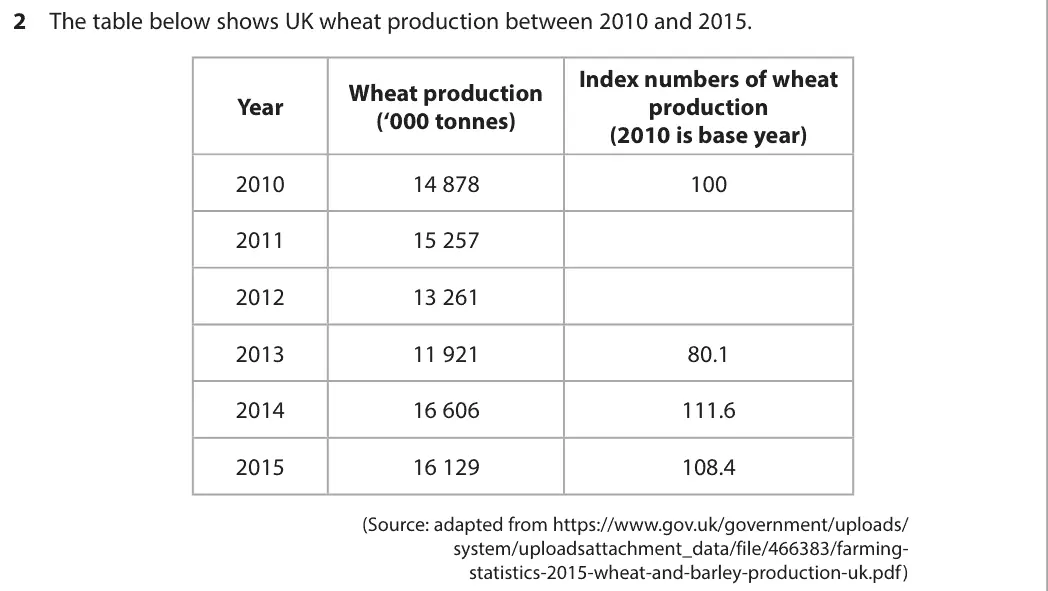
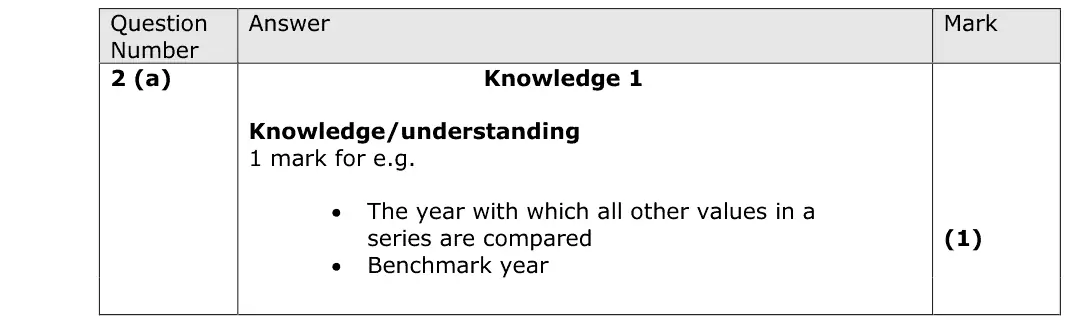
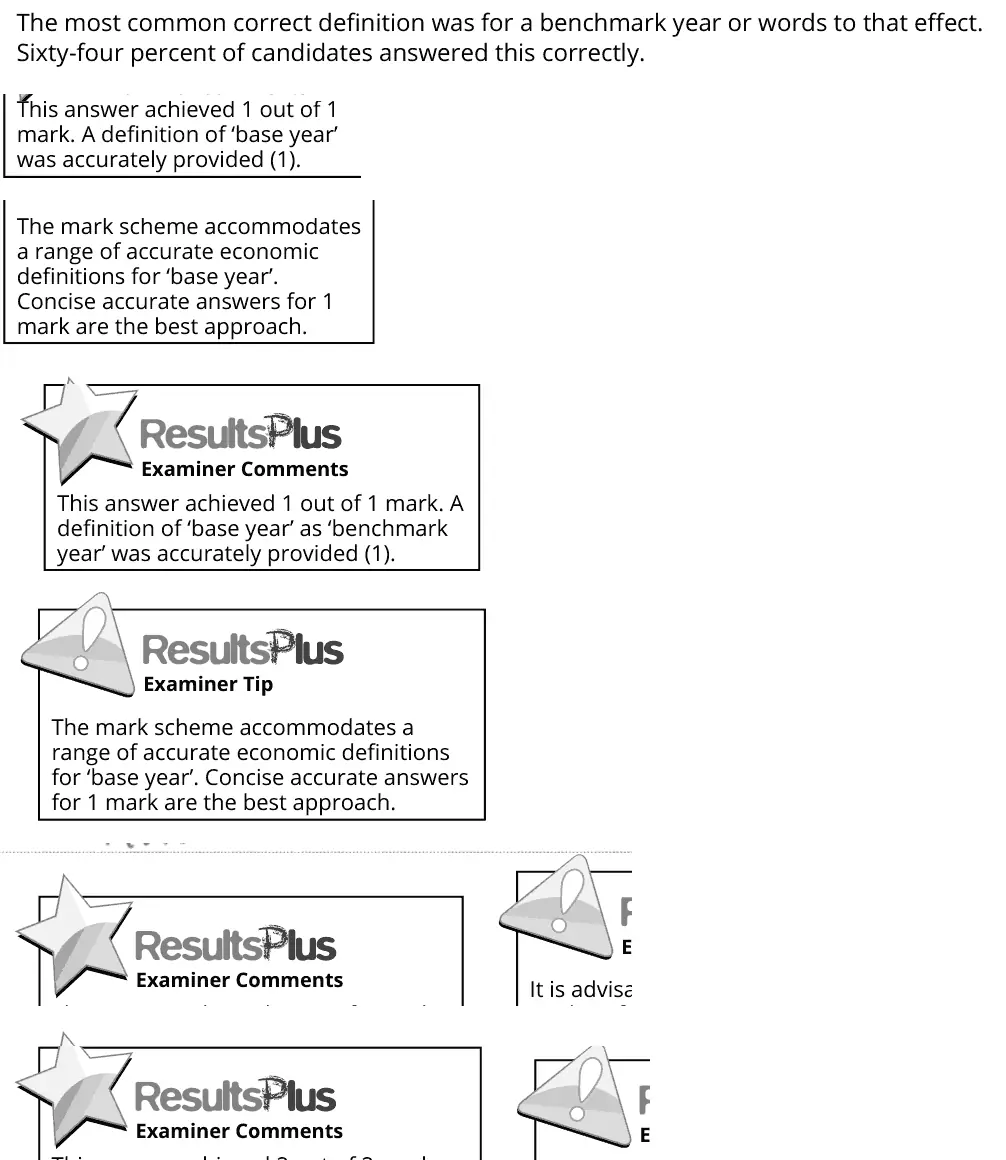
The most common correct definition was for a benchmark year or words to that effect. Sixty-four percent of candidates answered this correctly. This answer achieved 1 out of 1 mark. A definition of ‘base year’ was accurately provided (1). The mark scheme accommodates a range of accurate economic definitions for ‘base year’. Concise accurate answers for 1 mark are the best approach. This answer achieved 1 out of 1 mark. A definition of ‘base year’ as ‘benchmark year’ was accurately provided (1). The mark scheme accommodates a range of accurate economic definitions for ‘base year’. Concise accurate answers for 1 mark are the best approach.
Quantitative skills: QS 5 (calculate and interpret index numbers)

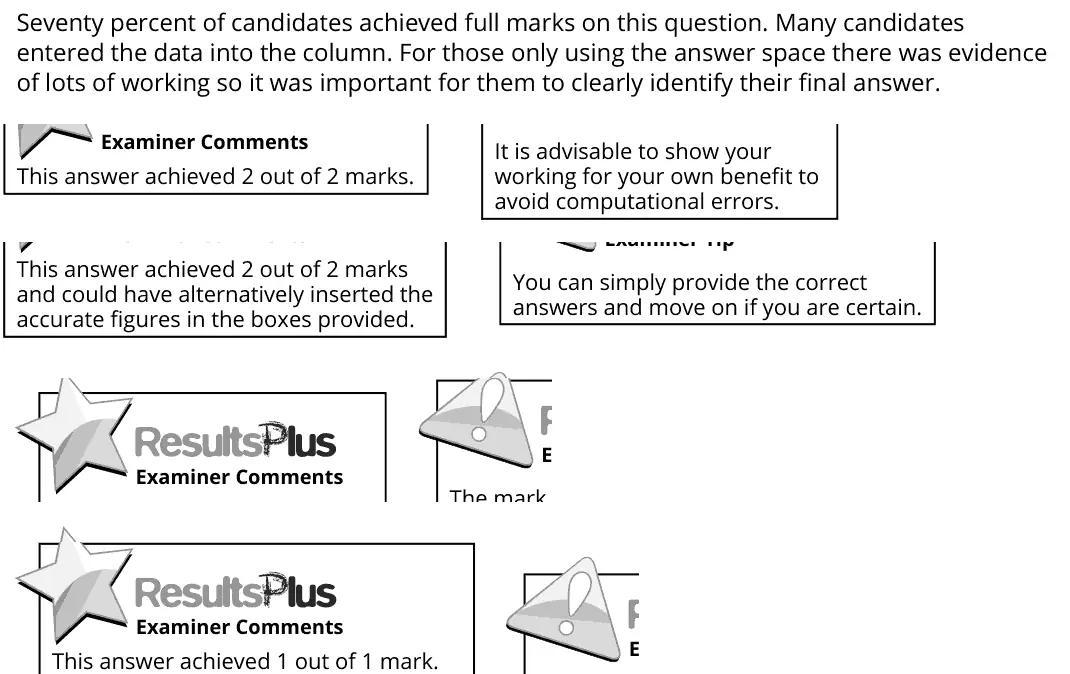
Seventy percent of candidates achieved full marks on this question. Many candidates entered the data into the column. For those only using the answer space there was evidence of lots of working so it was important for them to clearly identify their final answer. It is advisable to show your working for your own benefit to avoid computational errors. This answer achieved 2 out of 2 marks. This answer achieved 2 out of 2 marks and could have alternatively inserted the accurate figures in the boxes provided. You can simply provide the correct answers and move on if you are certain.
Quantitative skills: QS 5 (calculate and interpret index numbers); QS 9 (interpret, apply and analyse information in written, graphical tabular and numerical forms)
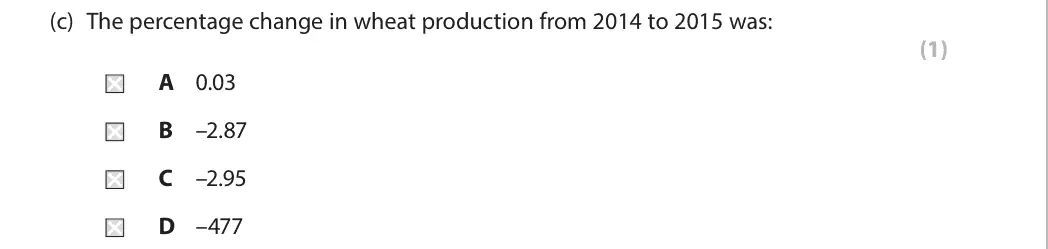
B
Quantitative skills: QS 2 (calculate, use and understand percentages, percentage changes and percentage point changes); QS 9 (interpret, apply and analyse information in written, graphical tabular and numerical forms)
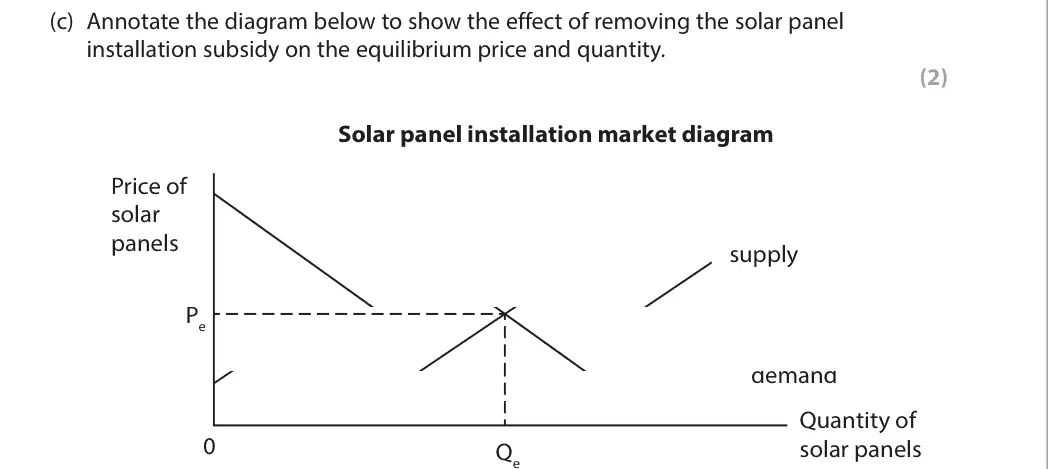
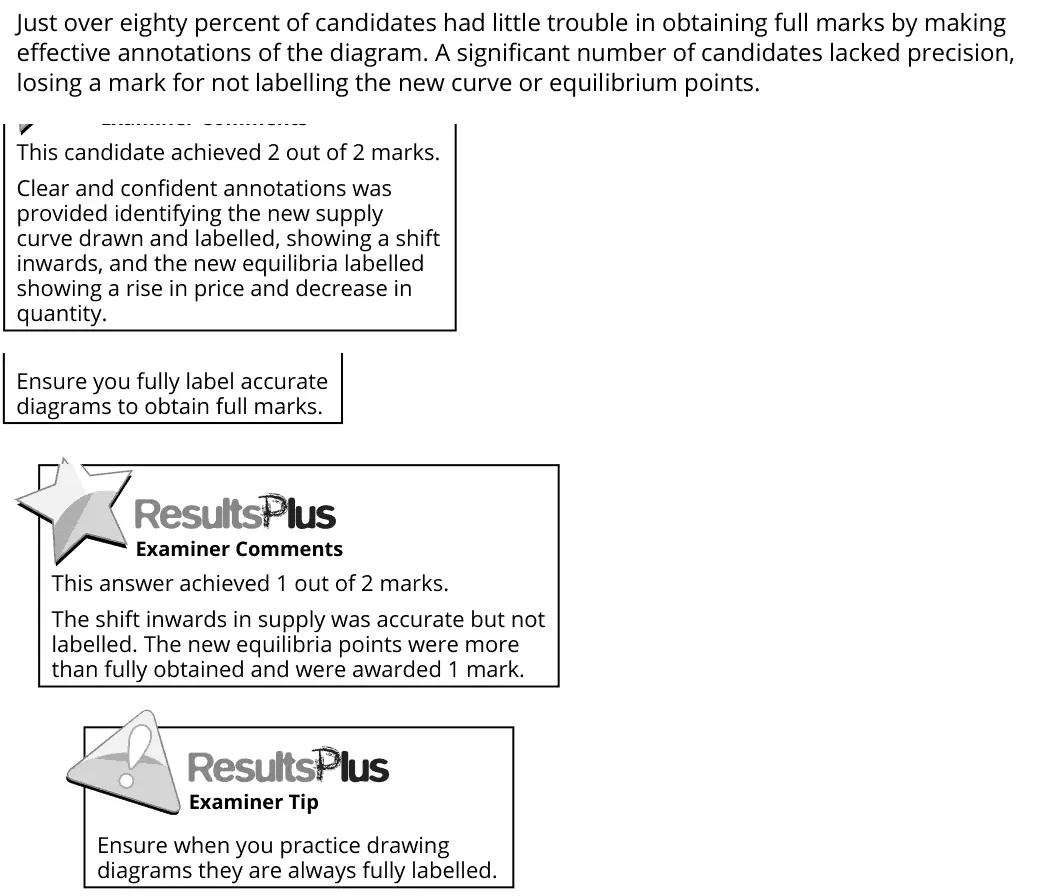
Just over eighty percent of candidates had little trouble in obtaining full marks by making effective annotations of the diagram. A significant number of candidates lacked precision, losing a mark for not labelling the new curve or equilibrium points. This candidate achieved 2 out of 2 marks. Clear and confident annotations was provided identifying the new supply curve drawn and labelled, showing a shift inwards, and the new equilibria labelled showing a rise in price and decrease in quantity. Ensure you fully label accurate diagrams to obtain full marks. This answer achieved 1 out of 2 marks. The shift inwards in supply was accurate but not labelled. The new equilibria points were more than fully obtained and were awarded 1 mark. Ensure when you practice drawing diagrams they are always fully labelled.
Quantitative skills: QS 4 (construct and interpret a range of standard graphical forms)

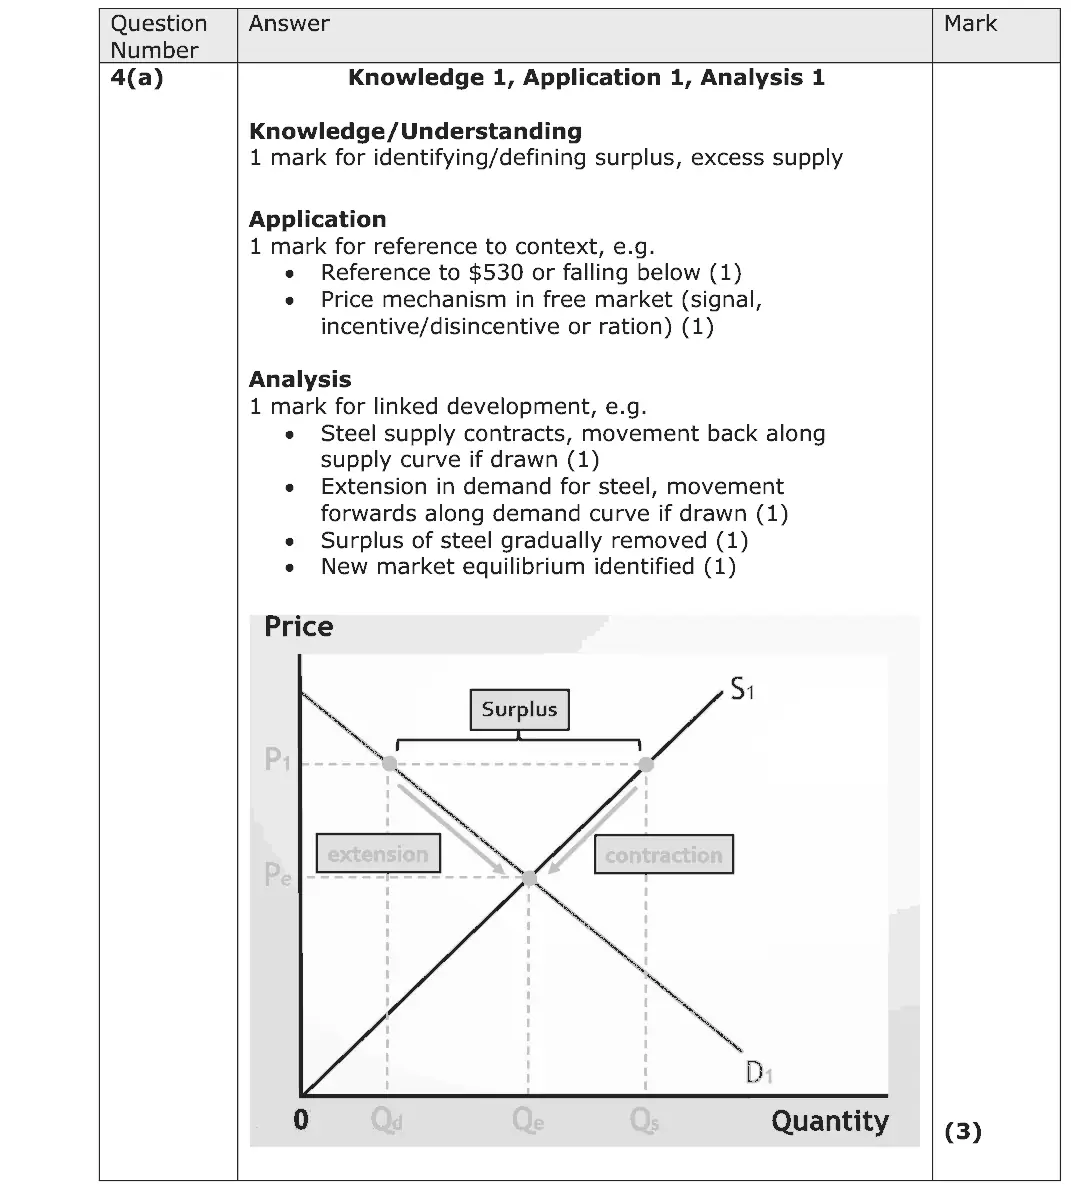
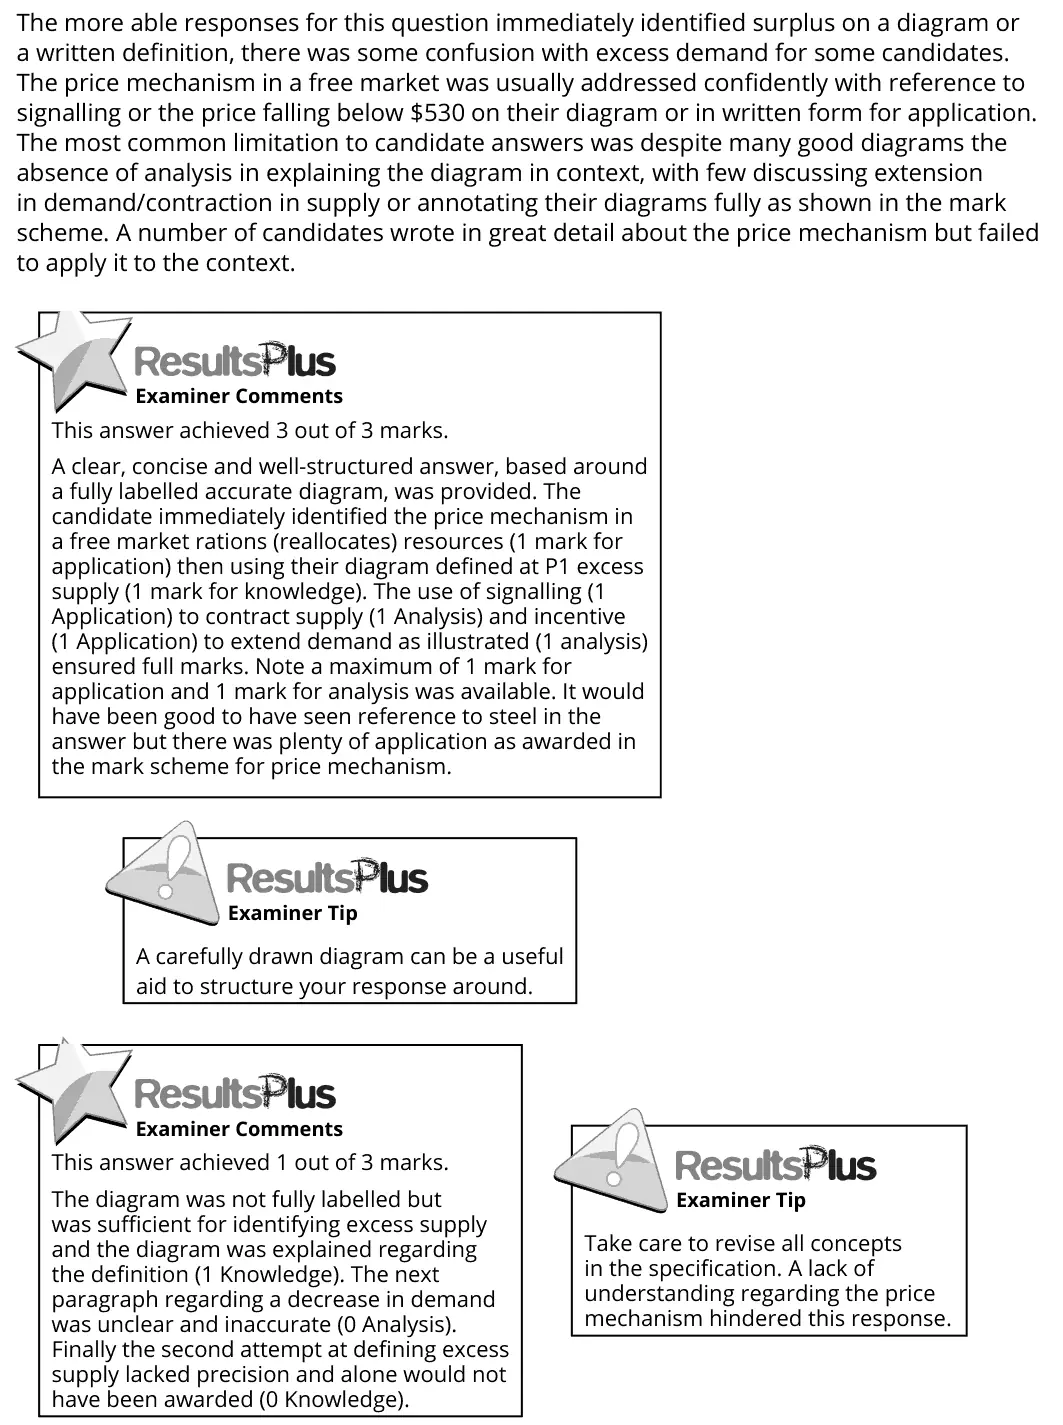
The more able responses for this question immediately identified surplus on a diagram or a written definition, there was some confusion with excess demand for some candidates. The price mechanism in a free market was usually addressed confidently with reference to signalling or the price falling below $530 on their diagram or in written form for application. The most common limitation to candidate answers was despite many good diagrams the absence of analysis in explaining the diagram in context, with few discussing extension in demand/contraction in supply or annotating their diagrams fully as shown in the mark scheme. A number of candidates wrote in great detail about the price mechanism but failed to apply it to the context. This answer achieved 3 out of 3 marks. A clear, concise and well-structured answer, based around a fully labelled accurate diagram, was provided. The candidate immediately identified the price mechanism in a free market rations (reallocates) resources (1 mark for application) then using their diagram defined at P1 excess supply (1 mark for knowledge). The use of signalling (1 Application) to contract supply (1 Analysis) and incentive (1 Application) to extend demand as illustrated (1 analysis) ensured full marks. Note a maximum of 1 mark for application and 1 mark for analysis was available. It would have been good to have seen reference to steel in the answer but there was plenty of application as awarded in the mark scheme for price mechanism. A carefully drawn diagram can be a useful aid to structure your response around. This answer achieved 1 out of 3 marks. The diagram was not fully labelled but was sufficient for identifying excess supply and the diagram was explained regarding the definition (1 Knowledge). The next paragraph regarding a decrease in demand was unclear and inaccurate (0 Analysis). Finally the second attempt at defining excess supply lacked precision and alone would not have been awarded (0 Knowledge). Take care to revise all concepts in the specification. A lack of understanding regarding the price mechanism hindered this response.

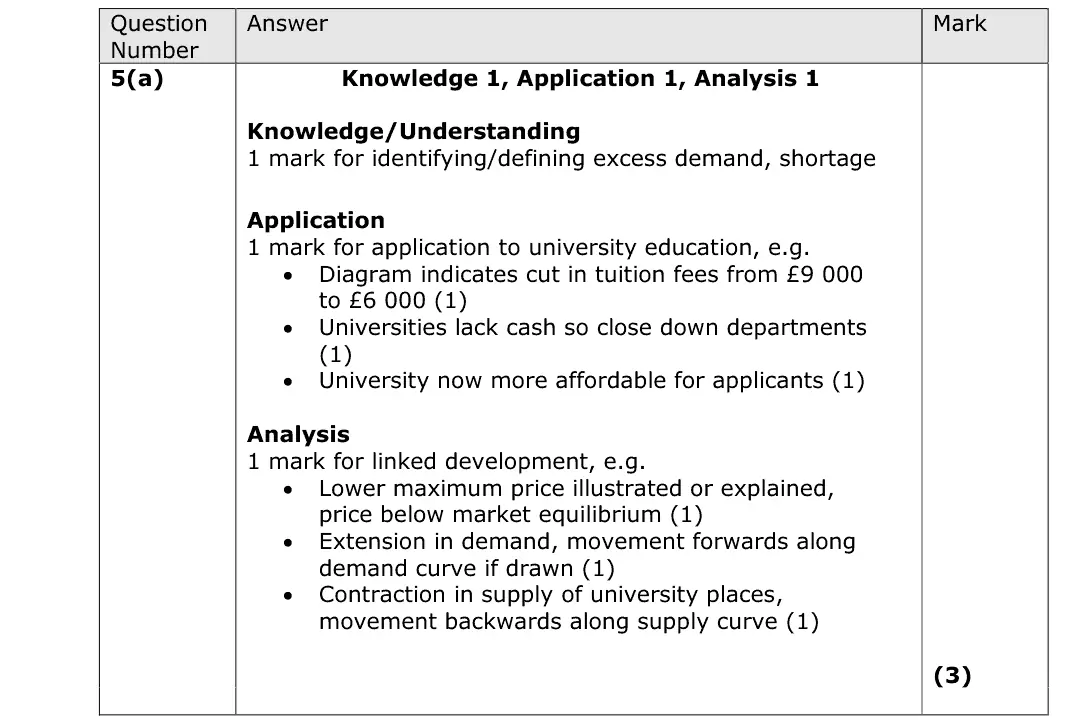
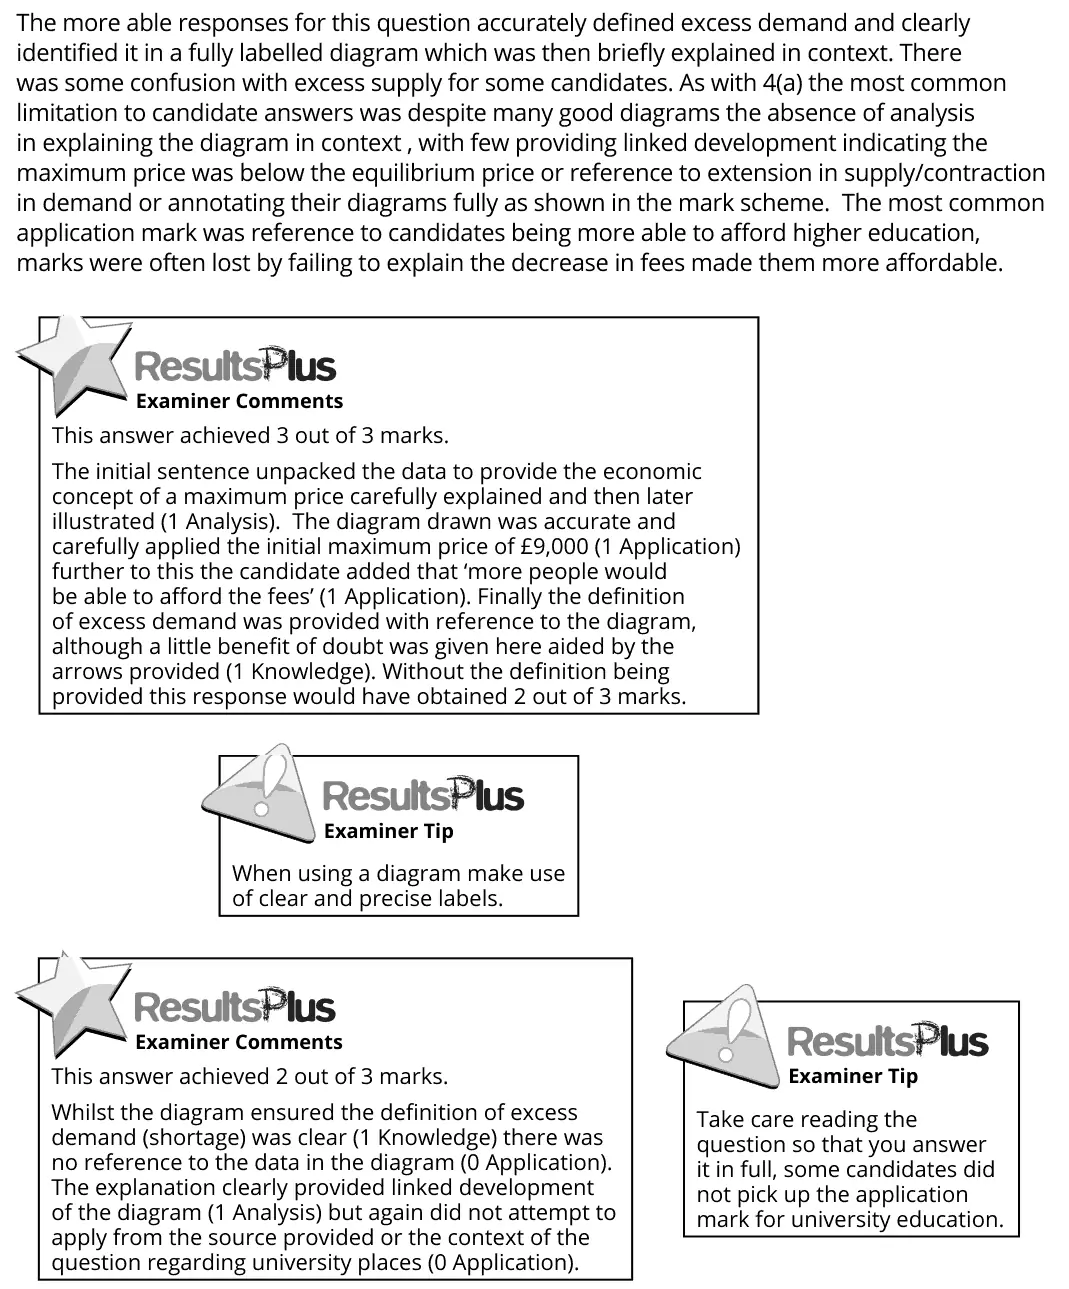
The more able responses for this question accurately defined excess demand and clearly identified it in a fully labelled diagram which was then briefly explained in context. There was some confusion with excess supply for some candidates. As with 4(a) the most common limitation to candidate answers was despite many good diagrams the absence of analysis in explaining the diagram in context , with few providing linked development indicating the maximum price was below the equilibrium price or reference to extension in supply/contraction in demand or annotating their diagrams fully as shown in the mark scheme. The most common application mark was reference to candidates being more able to afford higher education, marks were often lost by failing to explain the decrease in fees made them more affordable. This answer achieved 3 out of 3 marks. The initial sentence unpacked the data to provide the economic concept of a maximum price carefully explained and then later illustrated (1 Analysis). The diagram drawn was accurate and carefully applied the initial maximum price of £9,000 (1 Application) further to this the candidate added that ‘more people would be able to afford the fees’ (1 Application). Finally the definition of excess demand was provided with reference to the diagram, although a little benefit of doubt was given here aided by the arrows provided (1 Knowledge). Without the definition being provided this response would have obtained 2 out of 3 marks. When using a diagram make use of clear and precise labels. This answer achieved 2 out of 3 marks. Whilst the diagram ensured the definition of excess demand (shortage) was clear (1 Knowledge) there was no reference to the data in the diagram (0 Application). The explanation clearly provided linked development of the diagram (1 Analysis) but again did not attempt to apply from the source provided or the context of the question regarding university places (0 Application). Take care reading the question so that you answer it in full, some candidates did not pick up the application mark for university education.

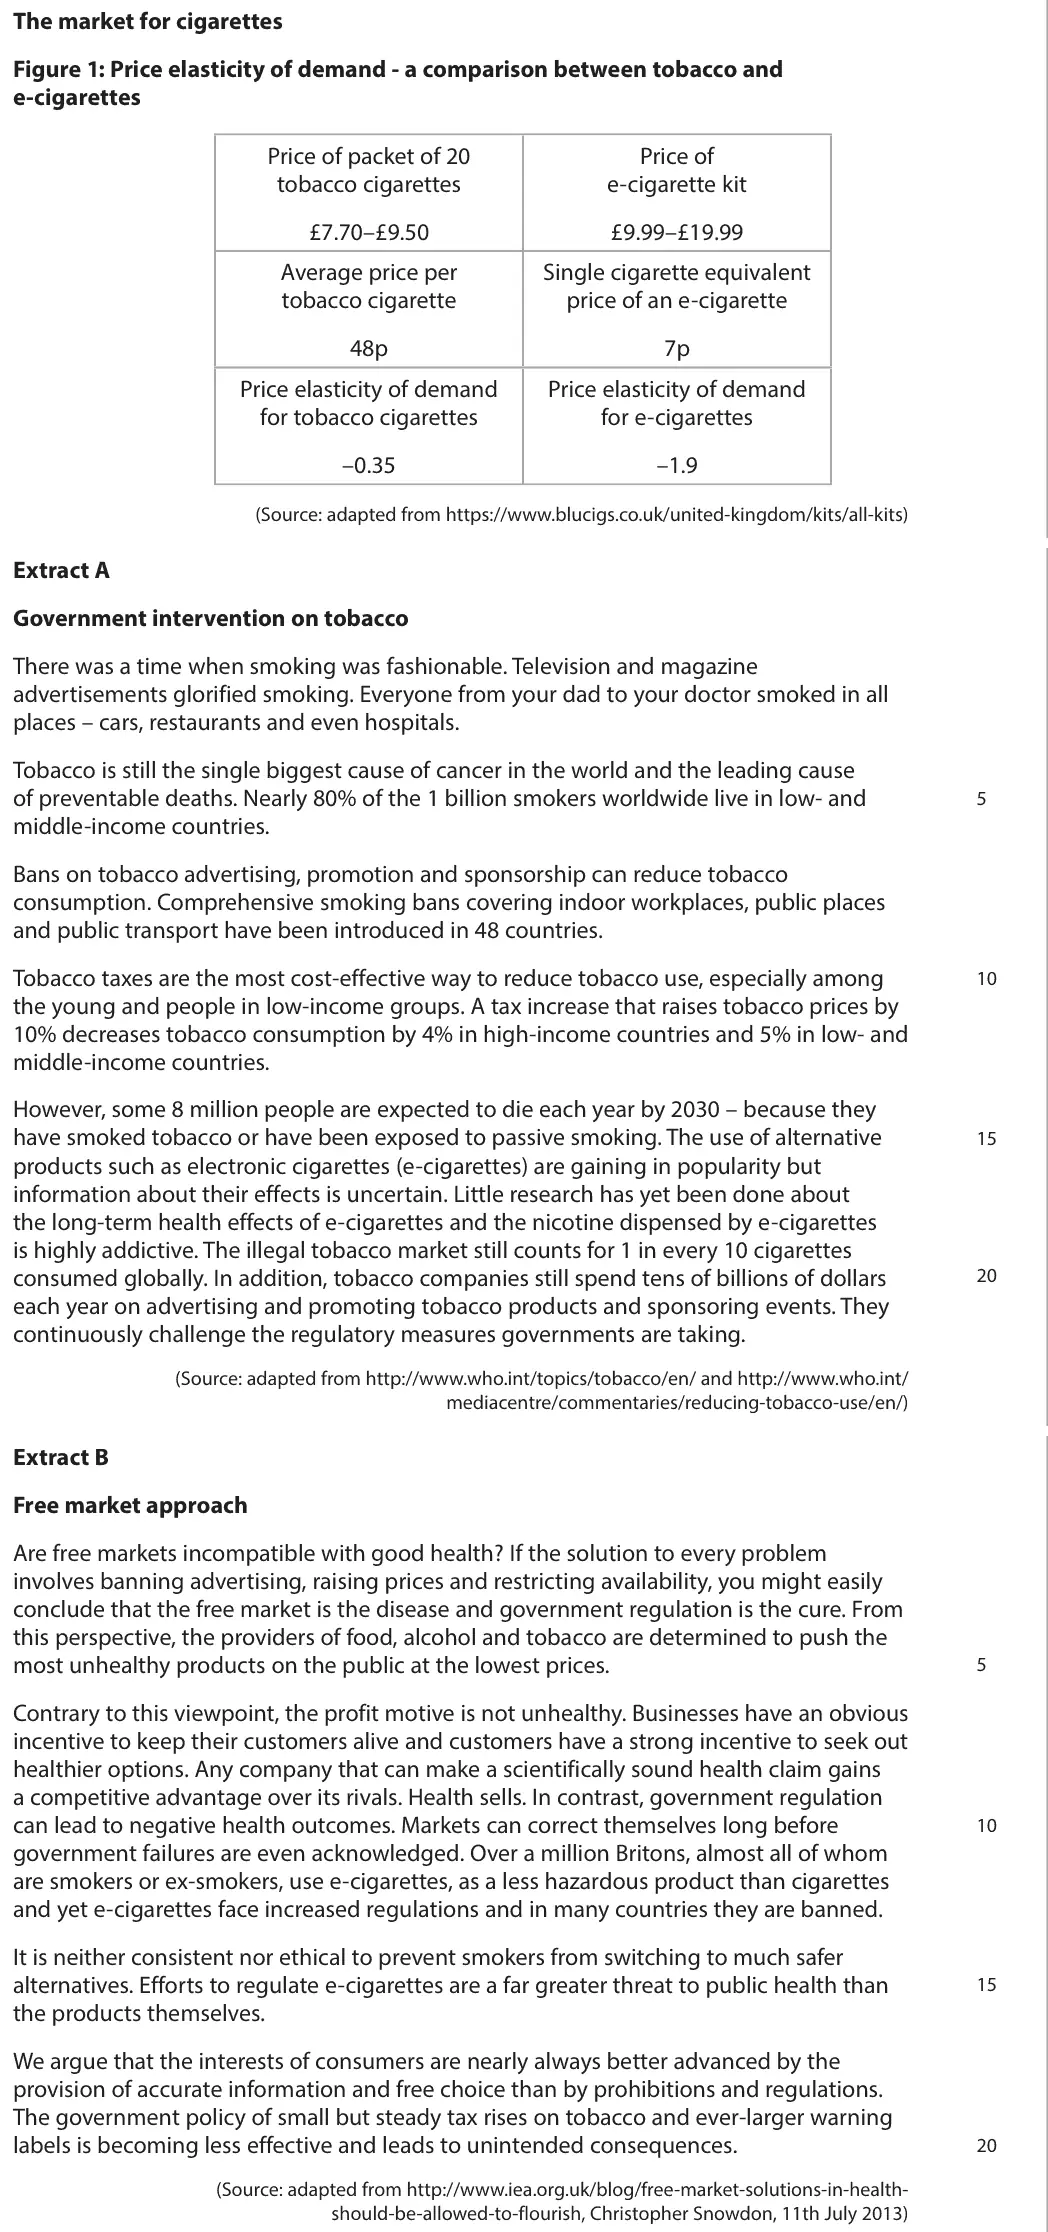
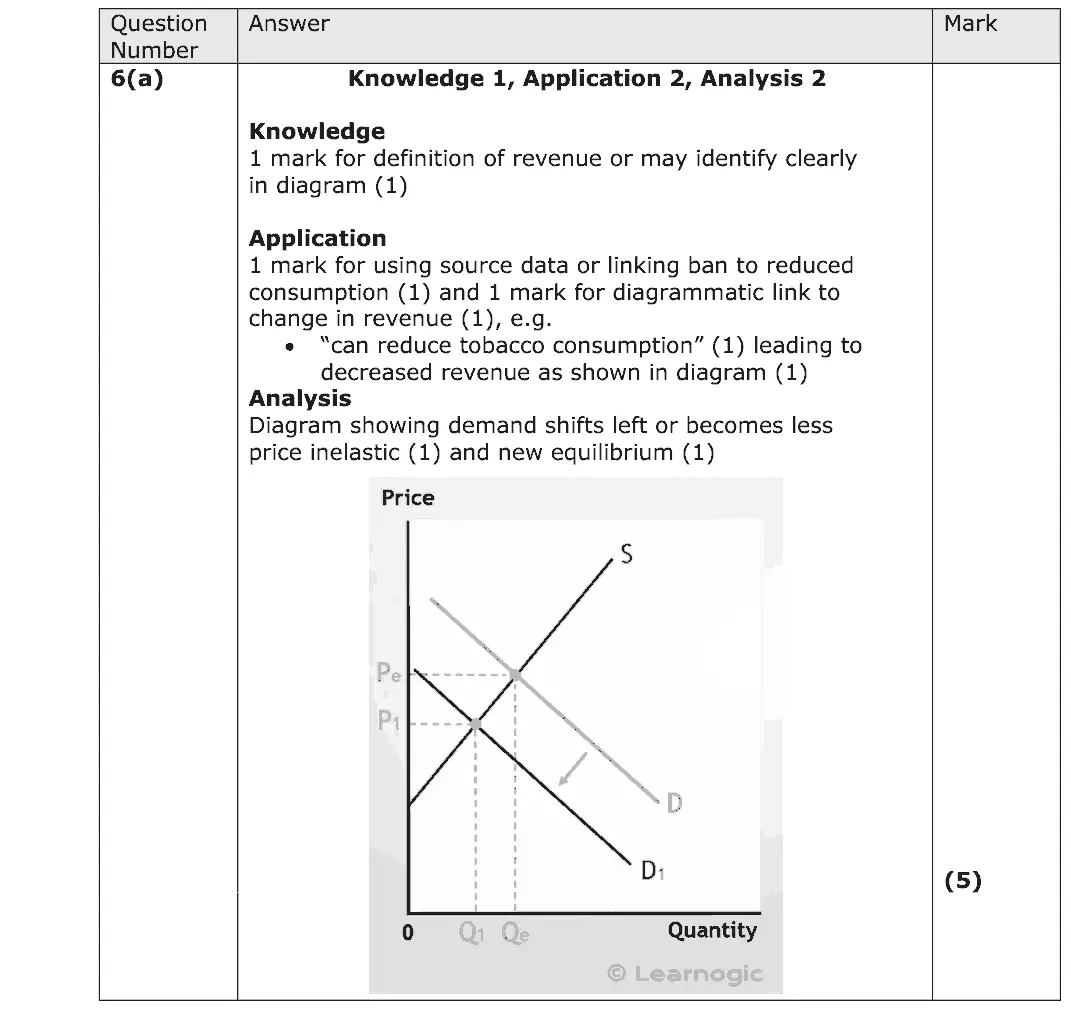
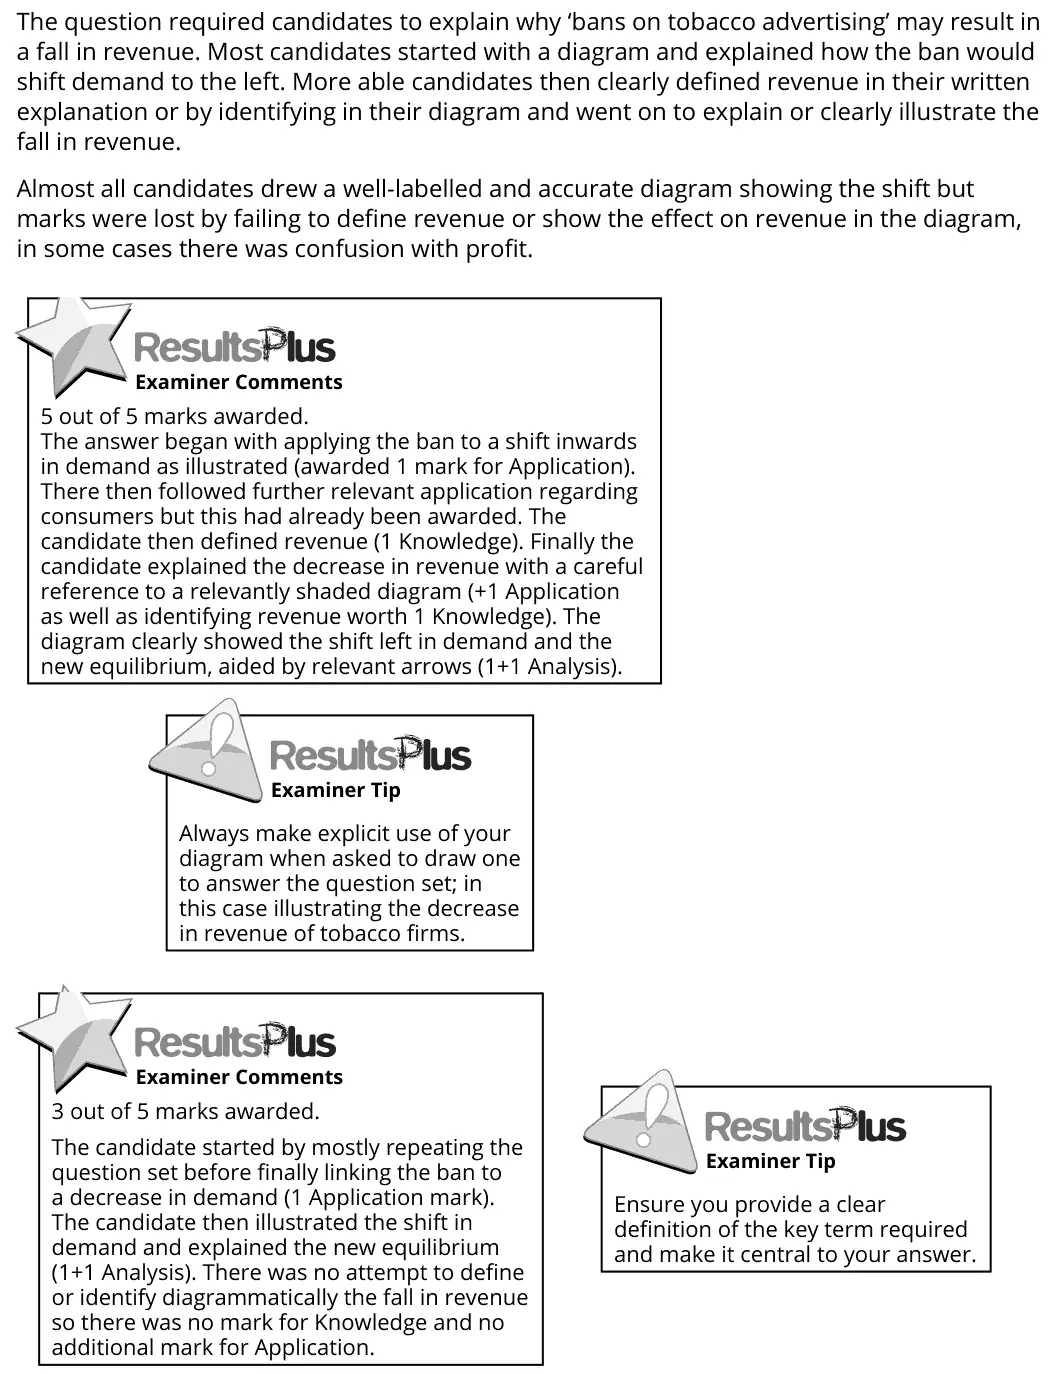
The question required candidates to explain why ‘bans on tobacco advertising’ may result in a fall in revenue. Most candidates started with a diagram and explained how the ban would shift demand to the left. More able candidates then clearly defined revenue in their written explanation or by identifying in their diagram and went on to explain or clearly illustrate the fall in revenue. Almost all candidates drew a well-labelled and accurate diagram showing the shift but marks were lost by failing to define revenue or show the effect on revenue in the diagram, in some cases there was confusion with profit. 5 out of 5 marks awarded. The answer began with applying the ban to a shift inwards in demand as illustrated (awarded 1 mark for Application). There then followed further relevant application regarding consumers but this had already been awarded. The candidate then defined revenue (1 Knowledge). Finally the candidate explained the decrease in revenue with a careful reference to a relevantly shaded diagram (+1 Application as well as identifying revenue worth 1 Knowledge). The diagram clearly showed the shift left in demand and the new equilibrium, aided by relevant arrows (1+1 Analysis). Always make explicit use of your diagram when asked to draw one to answer the question set; in this case illustrating the decrease in revenue of tobacco firms. 3 out of 5 marks awarded. The candidate started by mostly repeating the question set before finally linking the ban to a decrease in demand (1 Application mark). The candidate then illustrated the shift in demand and explained the new equilibrium (1+1 Analysis). There was no attempt to define or identify diagrammatically the fall in revenue so there was no mark for Knowledge and no additional mark for Application. Ensure you provide a clear definition of the key term required and make it central to your answer.
Quantitative skills: QS 4 (construct and interpret a range of standard graphical forms)

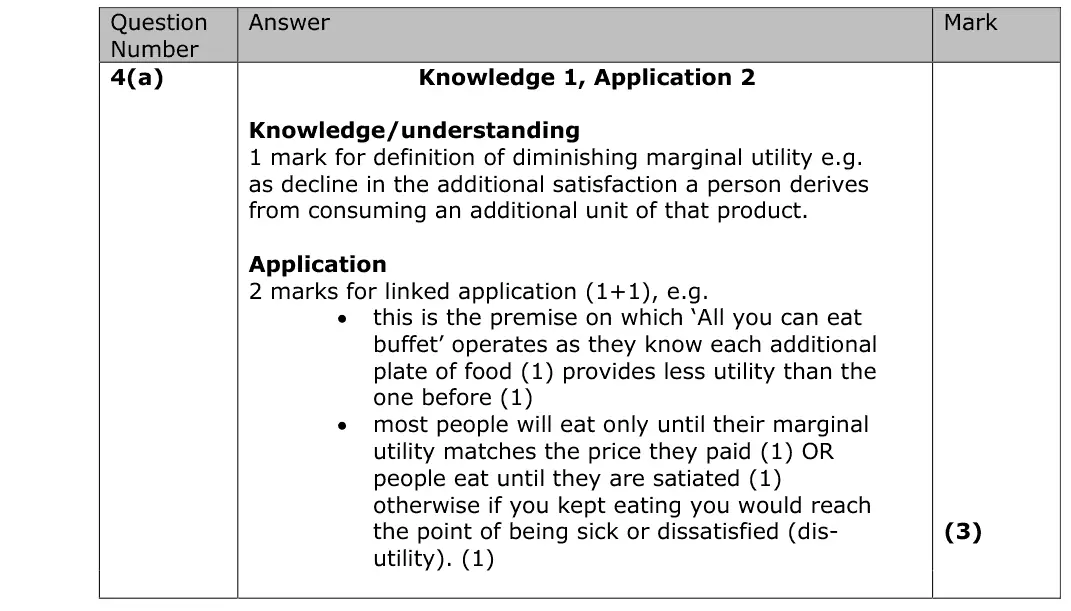
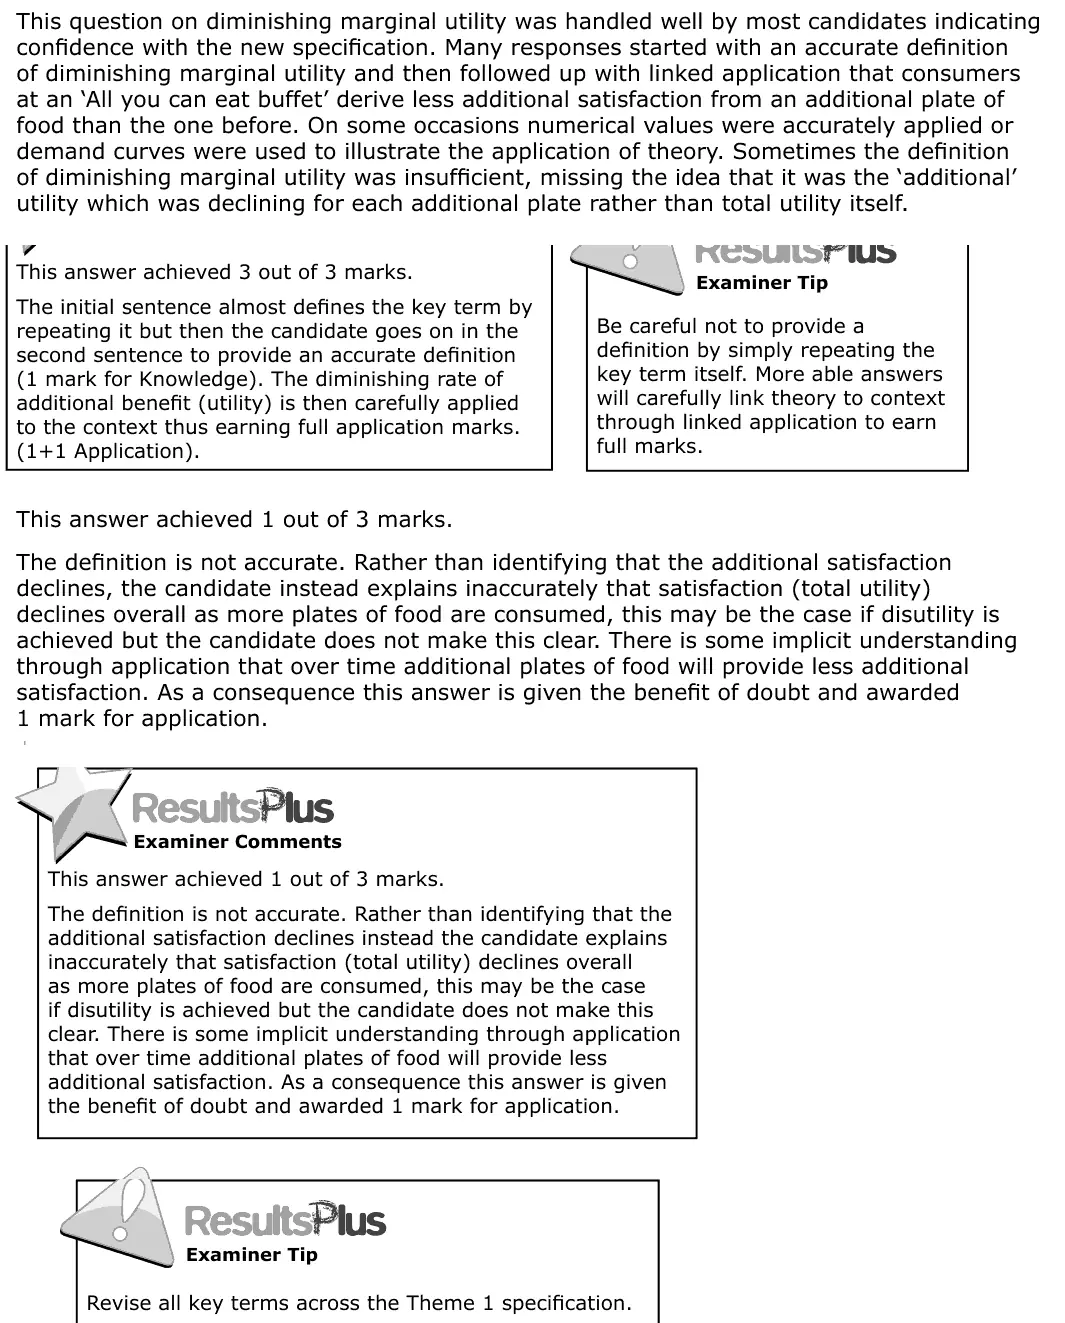
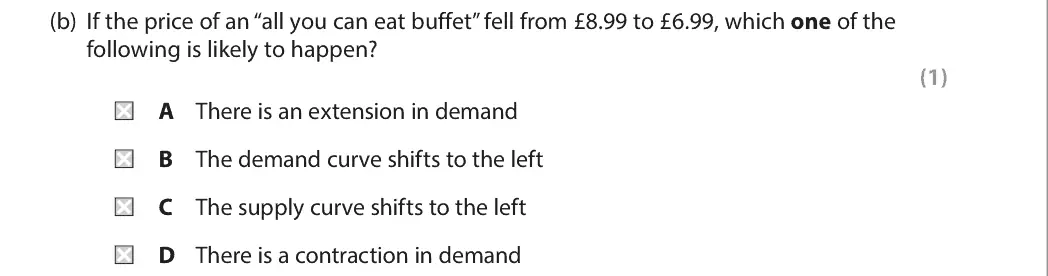
This question on diminishing marginal utility was handled well by most candidates indicating confidence with the new specification. Many responses started with an accurate definition of diminishing marginal utility and then followed up with linked application that consumers at an ‘All you can eat buffet’ derive less additional satisfaction from an additional plate of food than the one before. On some occasions numerical values were accurately applied or demand curves were used to illustrate the application of theory. Sometimes the definition of diminishing marginal utility was insufficient, missing the idea that it was the ‘additional’ utility which was declining for each additional plate rather than total utility itself. This answer achieved 3 out of 3 marks. The initial sentence almost defines the key term by repeating it but then the candidate goes on in the second sentence to provide an accurate definition (1 mark for Knowledge). The diminishing rate of additional benefit (utility) is then carefully applied to the context thus earning full application marks. (1+1 Application). Be careful not to provide a definition by simply repeating the key term itself. More able answers will carefully link theory to context through linked application to earn full marks. This answer achieved 1 out of 3 marks. The definition is not accurate. Rather than identifying that the additional satisfaction declines, the candidate instead explains inaccurately that satisfaction (total utility) declines overall as more plates of food are consumed, this may be the case if disutility is achieved but the candidate does not make this clear. There is some implicit understanding through application that over time additional plates of food will provide less additional satisfaction. As a consequence this answer is given the benefit of doubt and awarded 1 mark for application. This answer achieved 1 out of 3 marks. The definition is not accurate. Rather than identifying that the additional satisfaction declines instead the candidate explains inaccurately that satisfaction (total utility) declines overall as more plates of food are consumed, this may be the case if disutility is achieved but the candidate does not make this clear. There is some implicit understanding through application that over time additional plates of food will provide less additional satisfaction. As a consequence this answer is given the benefit of doubt and awarded 1 mark for application. Revise all key terms across the Theme 1 specification.
A

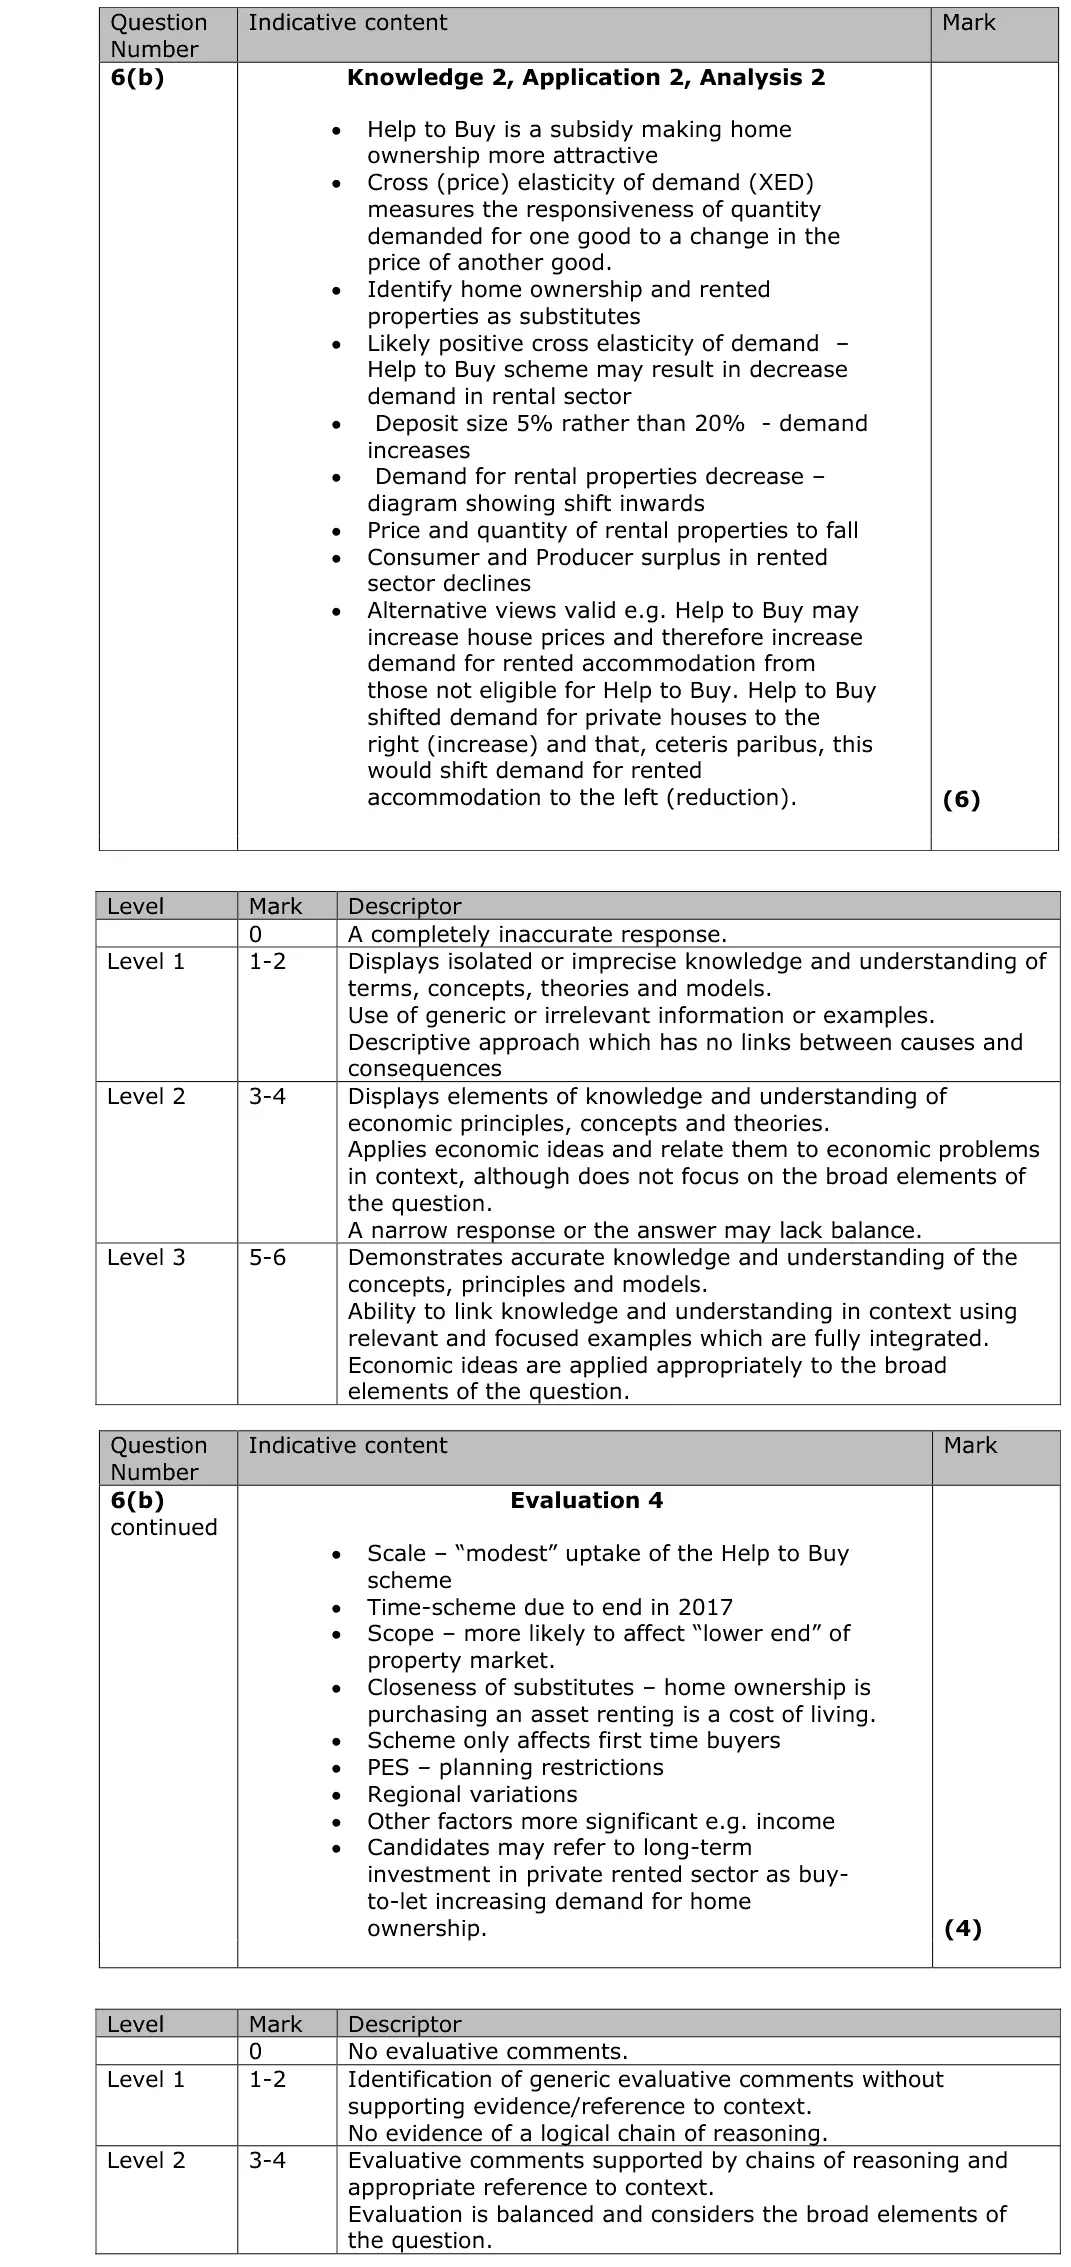
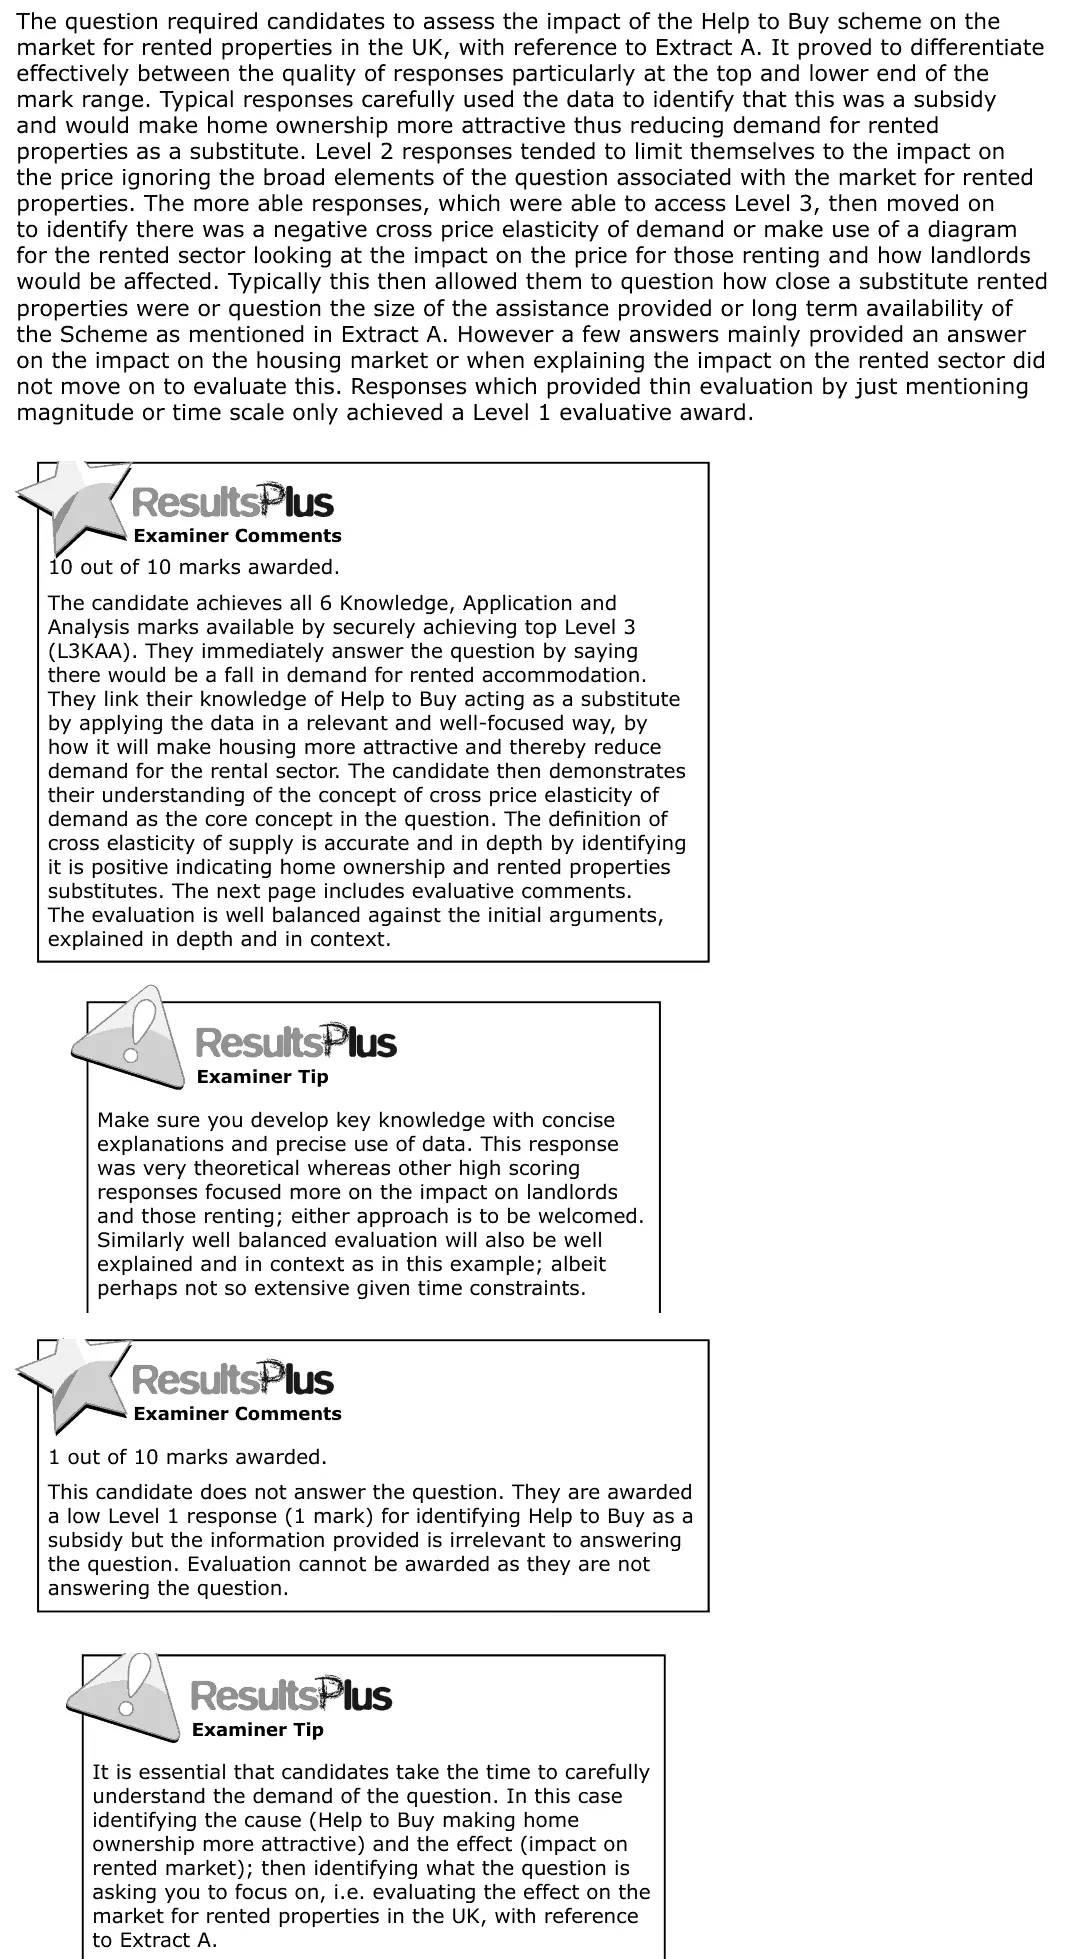
The question required candidates to assess the impact of the Help to Buy scheme on the market for rented properties in the UK, with reference to Extract A. It proved to differentiate effectively between the quality of responses particularly at the top and lower end of the mark range. Typical responses carefully used the data to identify that this was a subsidy and would make home ownership more attractive thus reducing demand for rented properties as a substitute. Level 2 responses tended to limit themselves to the impact on the price ignoring the broad elements of the question associated with the market for rented properties. The more able responses, which were able to access Level 3, then moved on to identify there was a negative cross price elasticity of demand or make use of a diagram for the rented sector looking at the impact on the price for those renting and how landlords would be affected. Typically this then allowed them to question how close a substitute rented properties were or question the size of the assistance provided or long term availability of the Scheme as mentioned in Extract A. However a few answers mainly provided an answer on the impact on the housing market or when explaining the impact on the rented sector did not move on to evaluate this. Responses which provided thin evaluation by just mentioning magnitude or time scale only achieved a Level 1 evaluative award. 10 out of 10 marks awarded. The candidate achieves all 6 Knowledge, Application and Analysis marks available by securely achieving top Level 3 (L3KAA). They immediately answer the question by saying there would be a fall in demand for rented accommodation. They link their knowledge of Help to Buy acting as a substitute by applying the data in a relevant and well-focused way, by how it will make housing more attractive and thereby reduce demand for the rental sector. The candidate then demonstrates their understanding of the concept of cross price elasticity of demand as the core concept in the question. The definition of cross elasticity of supply is accurate and in depth by identifying it is positive indicating home ownership and rented properties substitutes. The next page includes evaluative comments. The evaluation is well balanced against the initial arguments, explained in depth and in context. Make sure you develop key knowledge with concise explanations and precise use of data. This response was very theoretical whereas other high scoring responses focused more on the impact on landlords and those renting; either approach is to be welcomed. Similarly well balanced evaluation will also be well explained and in context as in this example; albeit perhaps not so extensive given time constraints. 1 out of 10 marks awarded. This candidate does not answer the question. They are awarded a low Level 1 response (1 mark) for identifying Help to Buy as a subsidy but the information provided is irrelevant to answering the question. Evaluation cannot be awarded as they are not answering the question. It is essential that candidates take the time to carefully understand the demand of the question. In this case identifying the cause (Help to Buy making home ownership more attractive) and the effect (impact on rented market); then identifying what the question is asking you to focus on, i.e. evaluating the effect on the market for rented properties in the UK, with reference to Extract A.
Quantitative skills: QS 9 (interpret, apply and analyse information in written, graphical tabular and numerical forms)

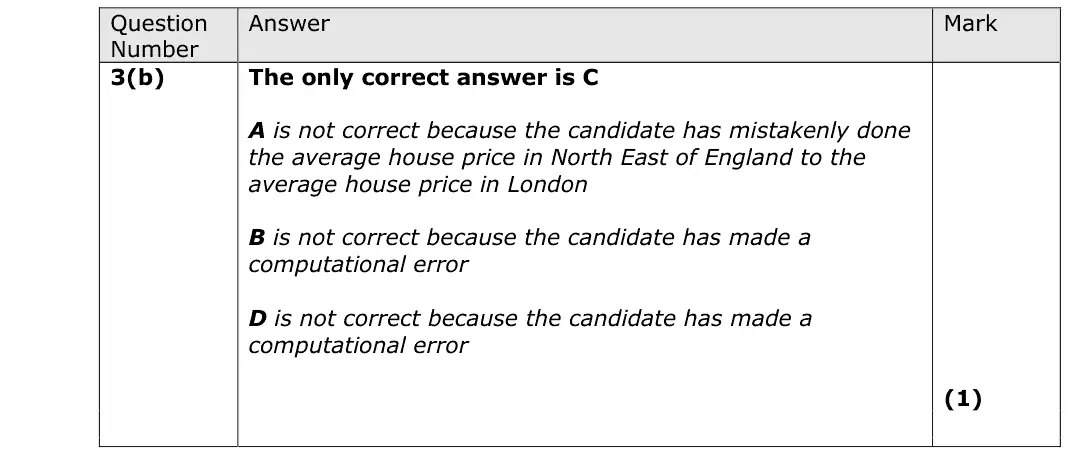
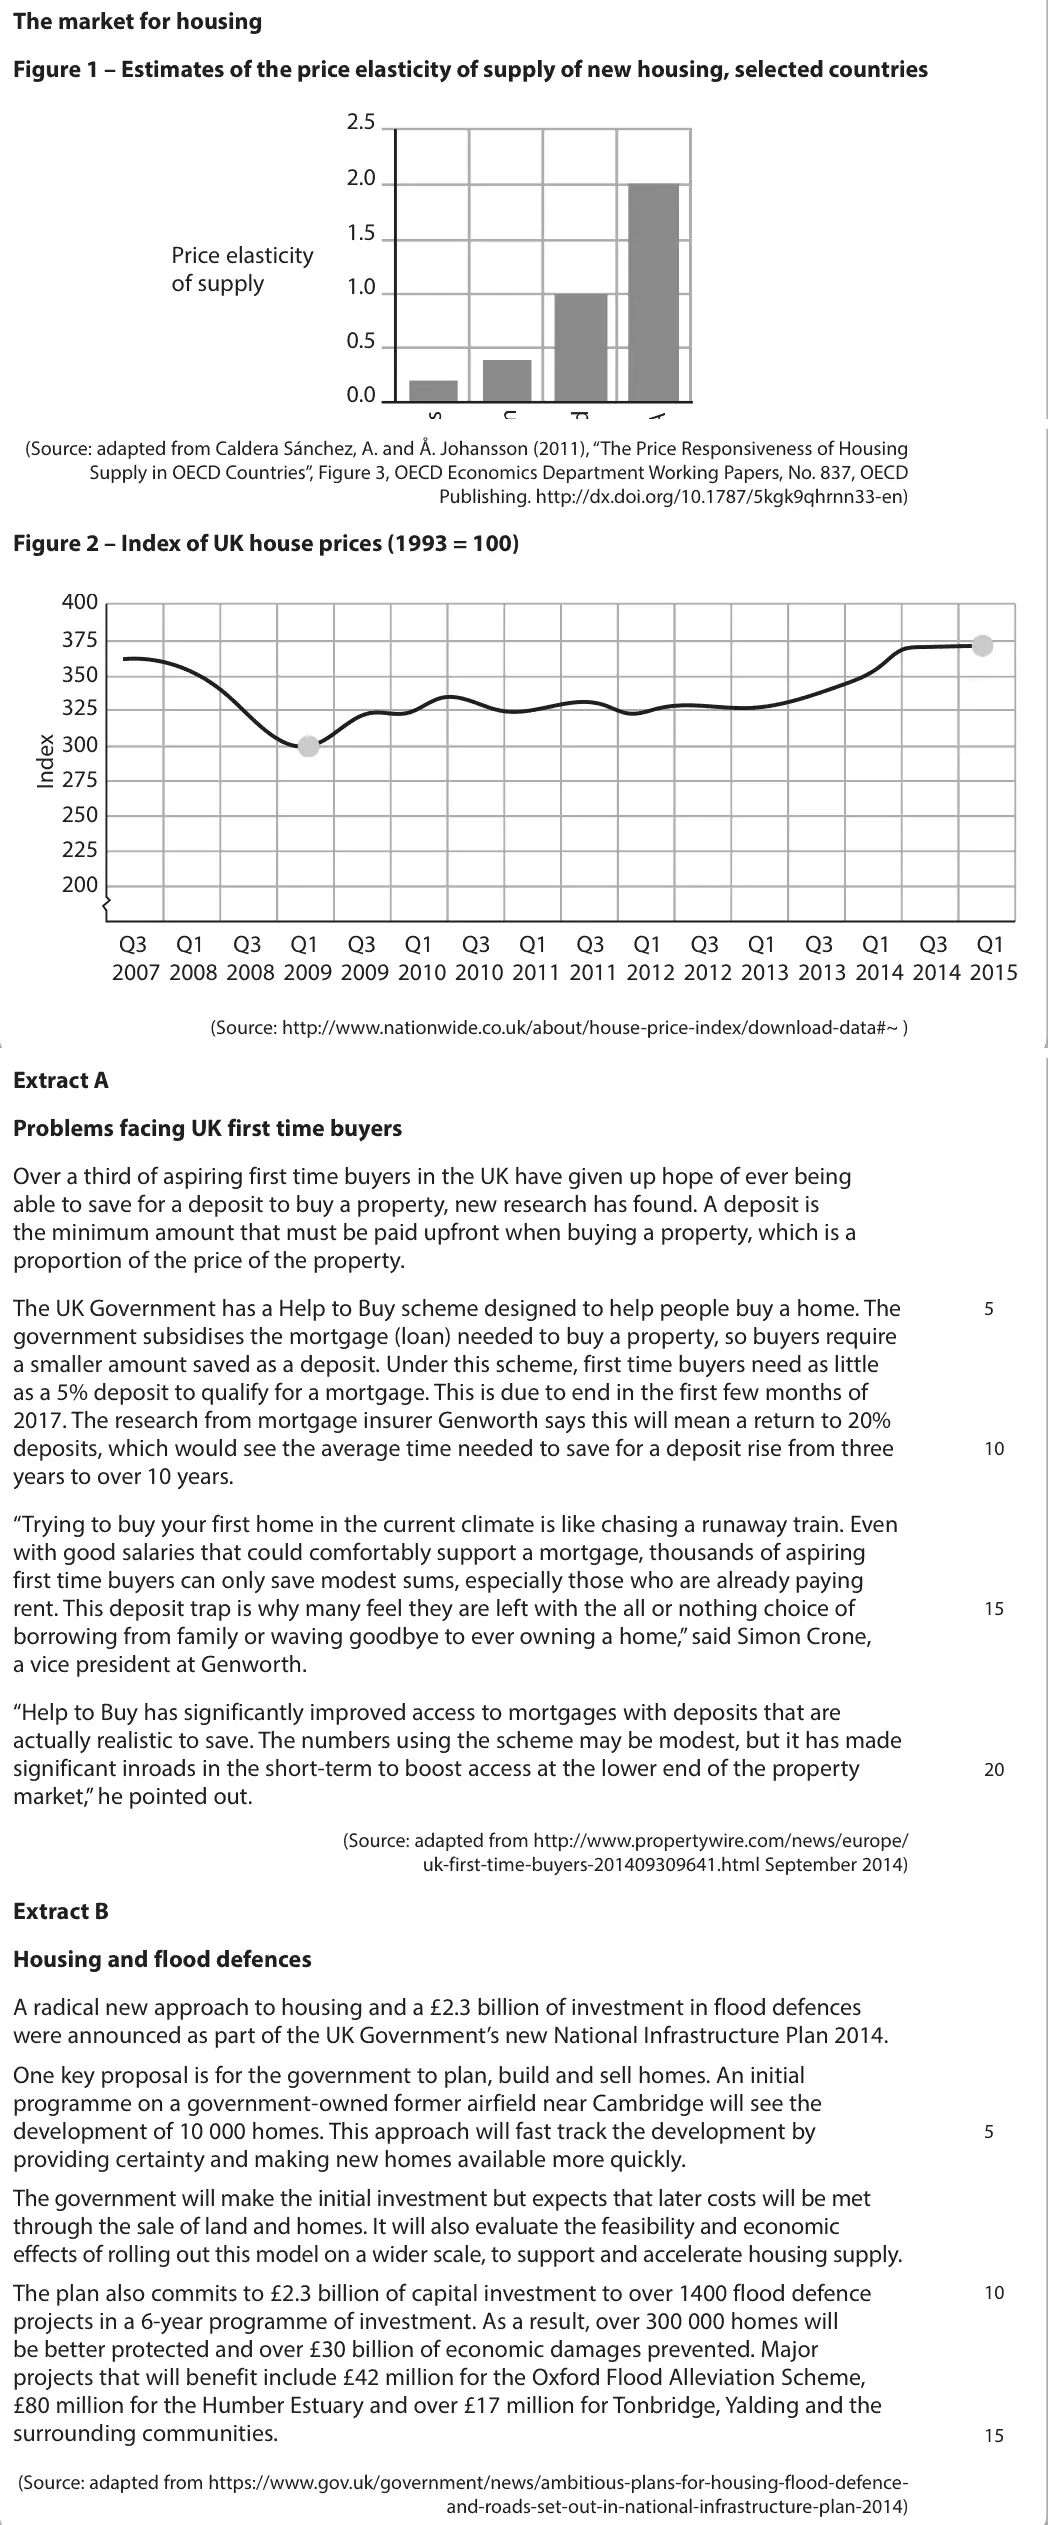
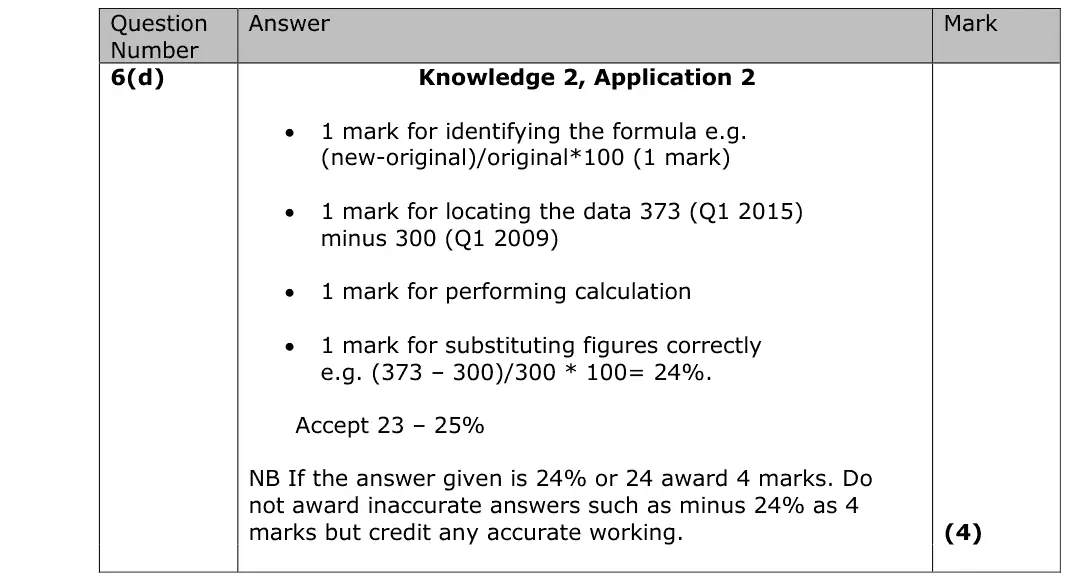
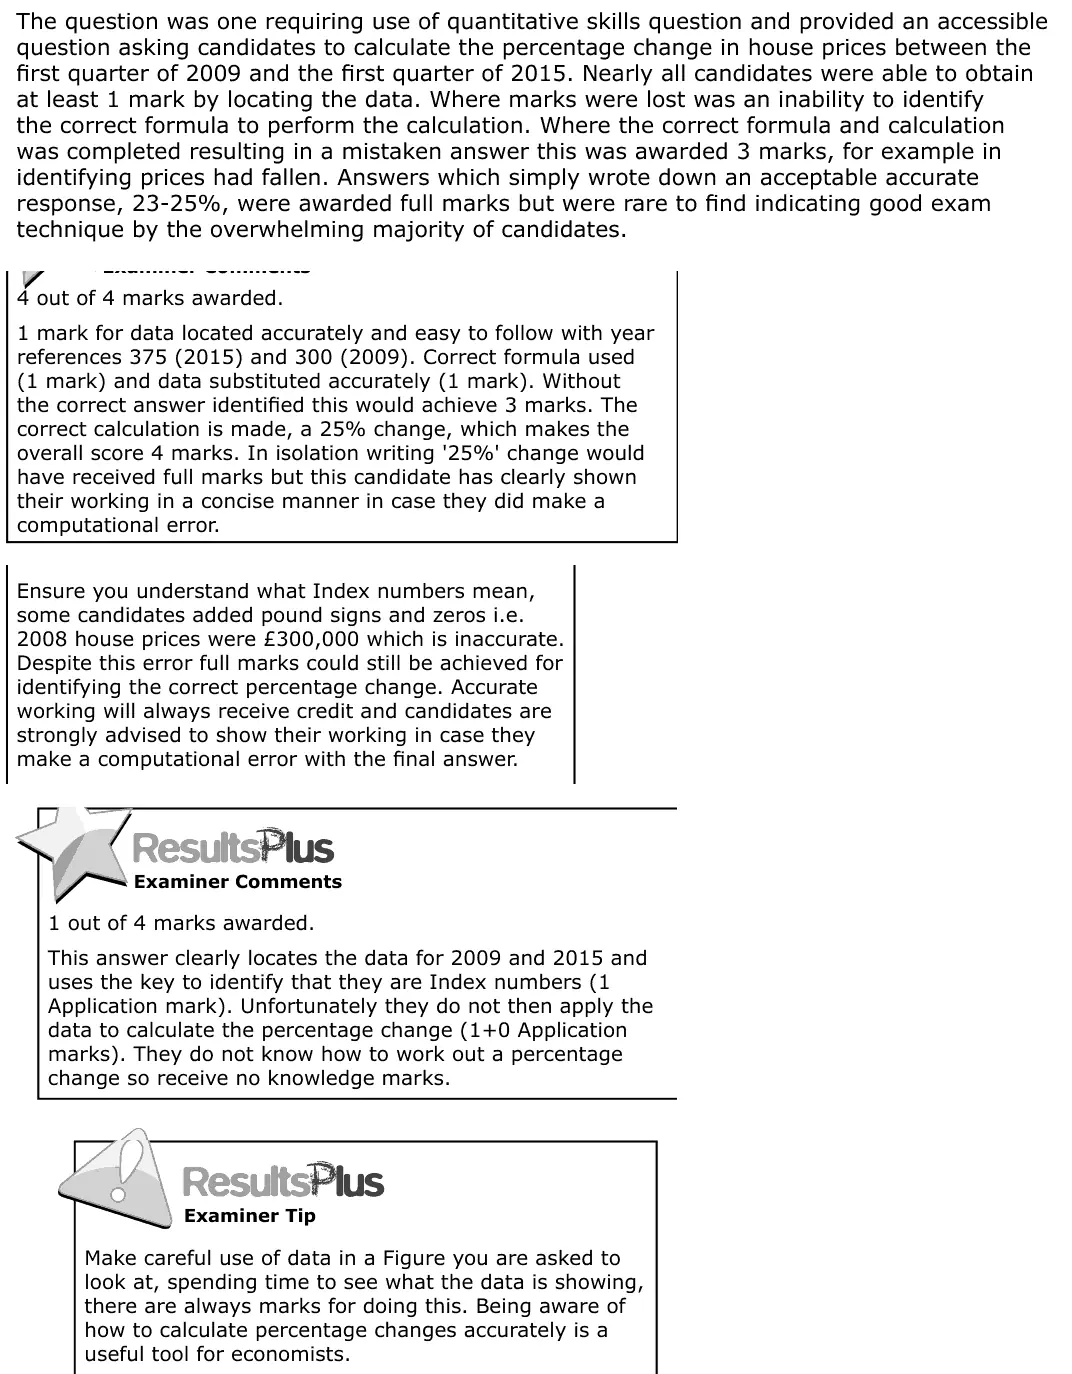
The question was one requiring use of quantitative skills question and provided an accessible question asking candidates to calculate the percentage change in house prices between the first quarter of 2009 and the first quarter of 2015. Nearly all candidates were able to obtain at least 1 mark by locating the data. Where marks were lost was an inability to identify the correct formula to perform the calculation. Where the correct formula and calculation was completed resulting in a mistaken answer this was awarded 3 marks, for example in identifying prices had fallen. Answers which simply wrote down an acceptable accurate response, 23-25%, were awarded full marks but were rare to find indicating good exam technique by the overwhelming majority of candidates. 4 out of 4 marks awarded. 1 mark for data located accurately and easy to follow with year references 375 (2015) and 300 (2009). Correct formula used (1 mark) and data substituted accurately (1 mark). Without the correct answer identified this would achieve 3 marks. The correct calculation is made, a 25% change, which makes the overall score 4 marks. In isolation writing '25%' change would have received full marks but this candidate has clearly shown their working in a concise manner in case they did make a computational error. Ensure you understand what Index numbers mean, some candidates added pound signs and zeros i.e. 2008 house prices were £300,000 which is inaccurate. Despite this error full marks could still be achieved for identifying the correct percentage change. Accurate working will always receive credit and candidates are strongly advised to show their working in case they make a computational error with the final answer. 1 out of 4 marks awarded. This answer clearly locates the data for 2009 and 2015 and uses the key to identify that they are Index numbers (1 Application mark). Unfortunately they do not then apply the data to calculate the percentage change (1+0 Application marks). They do not know how to work out a percentage change so receive no knowledge marks. Make careful use of data in a Figure you are asked to look at, spending time to see what the data is showing, there are always marks for doing this. Being aware of how to calculate percentage changes accurately is a useful tool for economists.
Quantitative skills: QS 2 (calculate, use and understand percentages, percentage changes and percentage point changes); QS 5 (calculate and interpret index numbers); QS 9 (interpret, apply and analyse information in written, graphical tabular and numerical forms)
Essays stuck in Level 2, or losing the easy marks in Section A? Book a trial session with Lianne, a former Edexcel examiner.