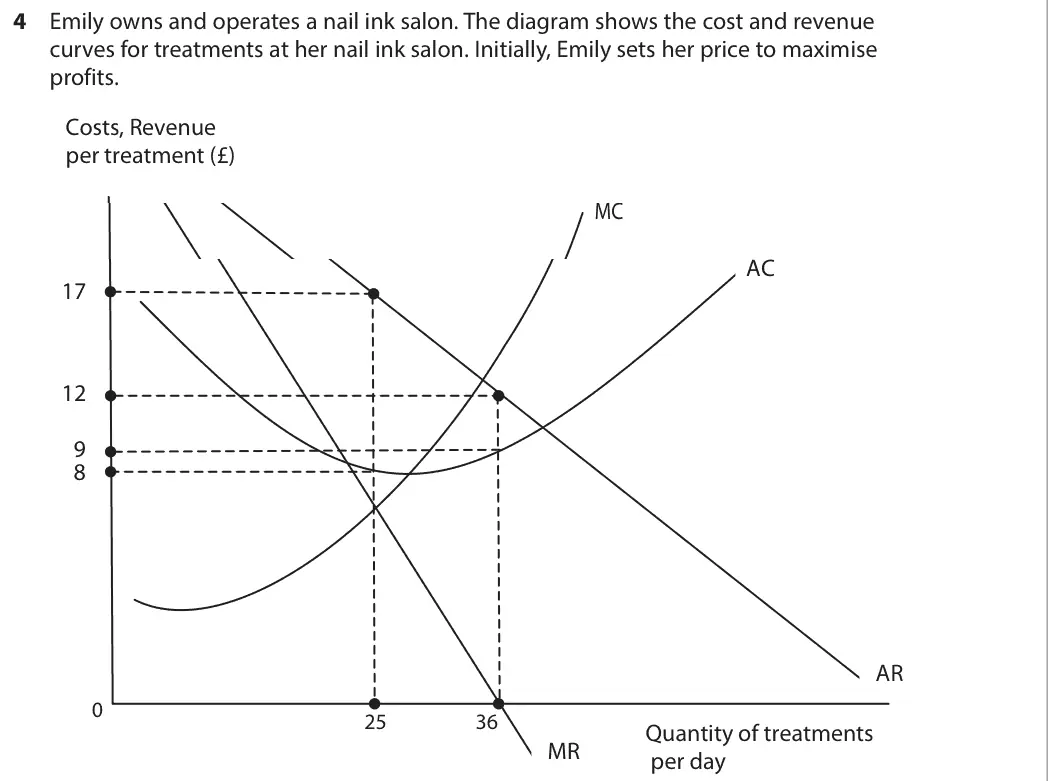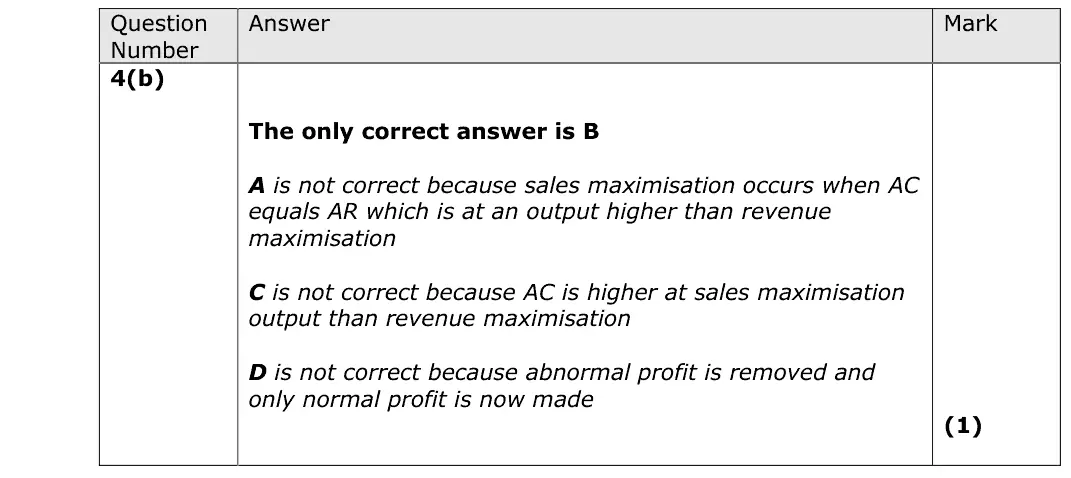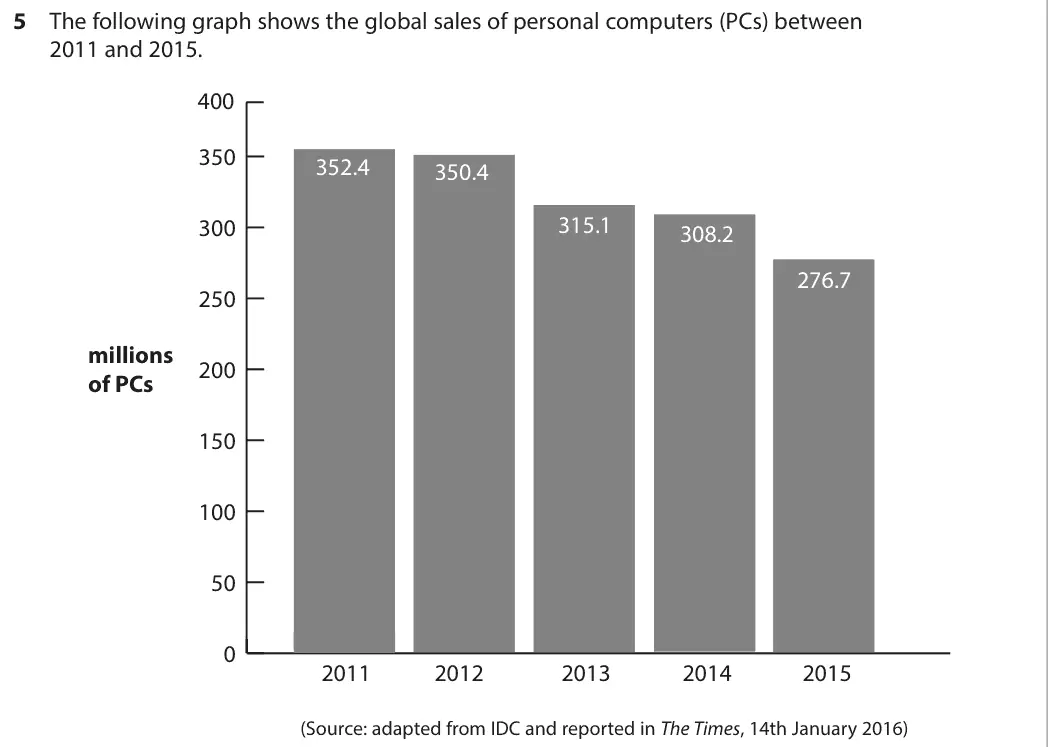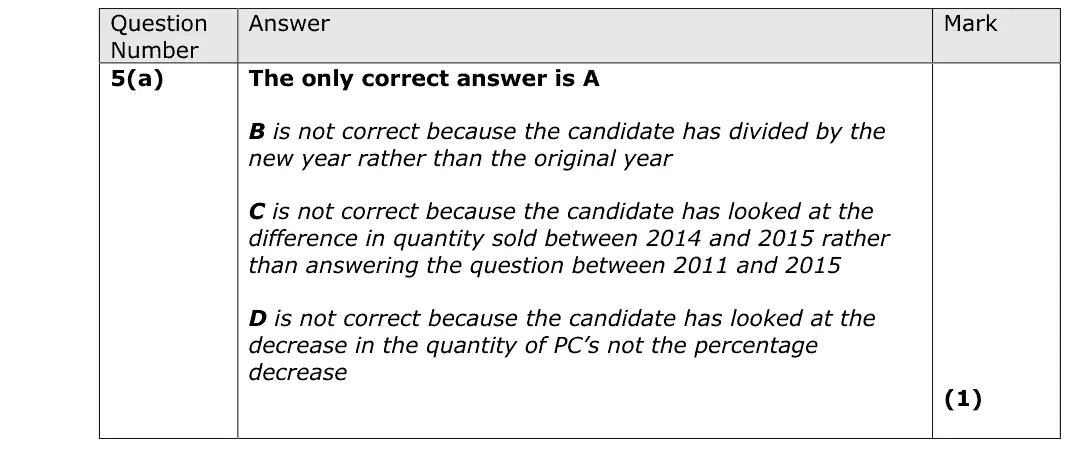
Multiple-choice questions

Every multiple-choice item from Section A of the AS papers and the A-level papers since 2016, with the answer behind the button. The examiners' reports never comment on these, so the notes come from the mark schemes. 180 questions.

Other types: Definition questions · Calculation questions · Diagram questions · Short explain questions (2–6 marks) · 8- to 15-mark responses · 20- and 25-mark essays · Data-response questions

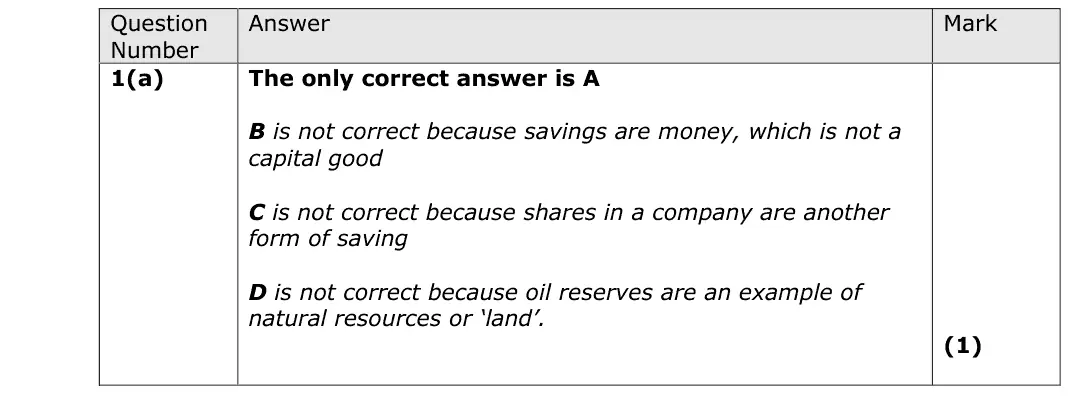
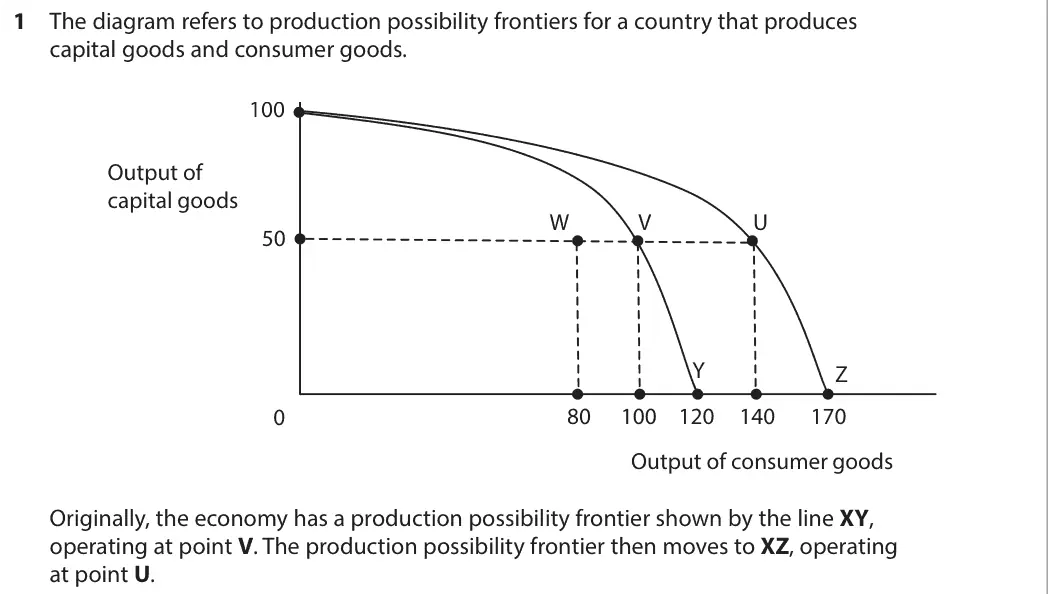
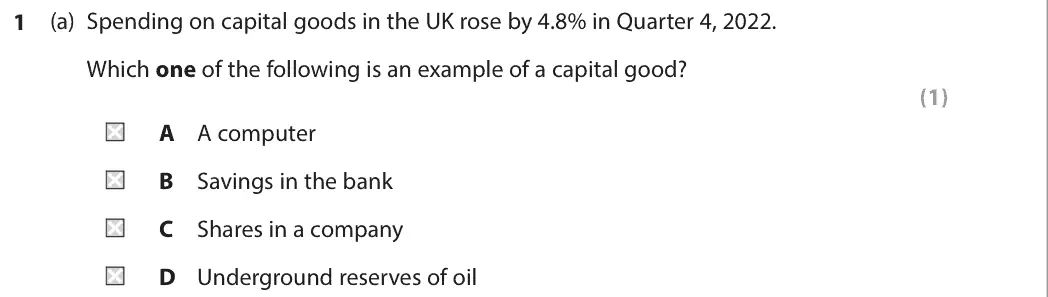
June 2025 · AS Paper 1 · Q1(a) 1 mark Multiple choice production possibility frontiers
(a) Spending on capital goods in the UK rose by 4.8% in Quarter 4, 2022. Which one of the following is an example of a capital good? (1) A A computer B Savings in the bank C Shares in a company D Underground reserves of oil
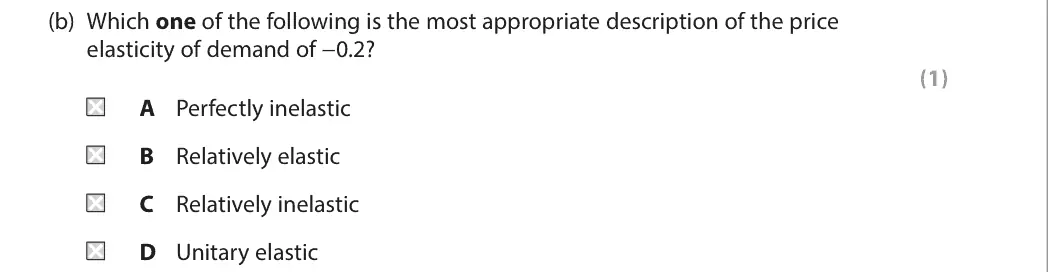
June 2025 · AS Paper 1 · Q2(b) 1 mark Multiple choice price elasticity of demand
(b) Which one of the following is the most appropriate description of the price elasticity of demand of -0.2? (1) A Perfectly inelastic B Relatively elastic C Relatively inelastic D Unitary elastic
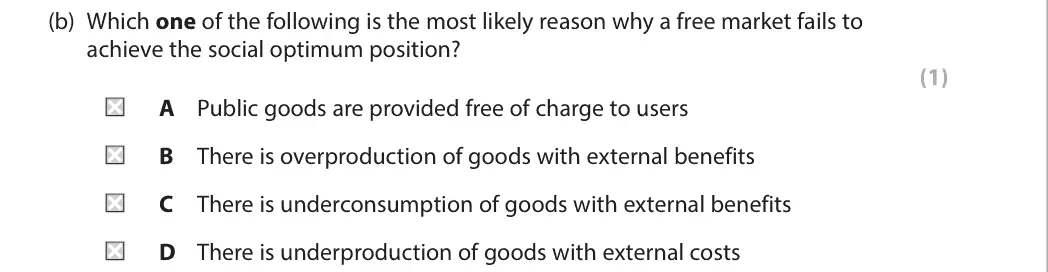
June 2025 · AS Paper 1 · Q3(b) 1 mark Multiple choice externalities
(b) Which one of the following is the most likely reason why a free market fails to achieve the social optimum position? (1) A Public goods are provided free of charge to users B There is overproduction of goods with external benefits C There is underconsumption of goods with external benefits D There is underproduction of goods with external costs
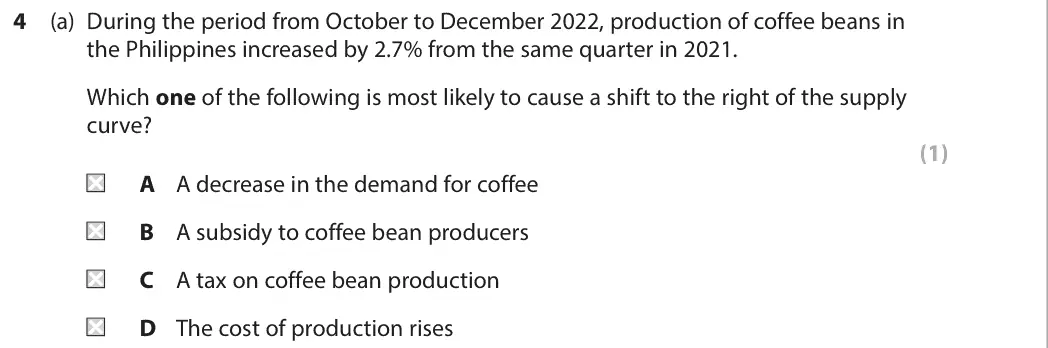
June 2025 · AS Paper 1 · Q4(a) 1 mark Multiple choice supply and demand
(a) During the period from October to December 2022, production of coffee beans in the Philippines increased by 2.7% from the same quarter in 2021. Which one of the following is most likely to cause a shift to the right of the supply curve? (1) A A decrease in the demand for coffee B A subsidy to coffee bean producers C A tax on coffee bean production D The cost of production rises
June 2025 · AS Paper 1 · Q5(a) 1 mark Multiple choice supply and demand
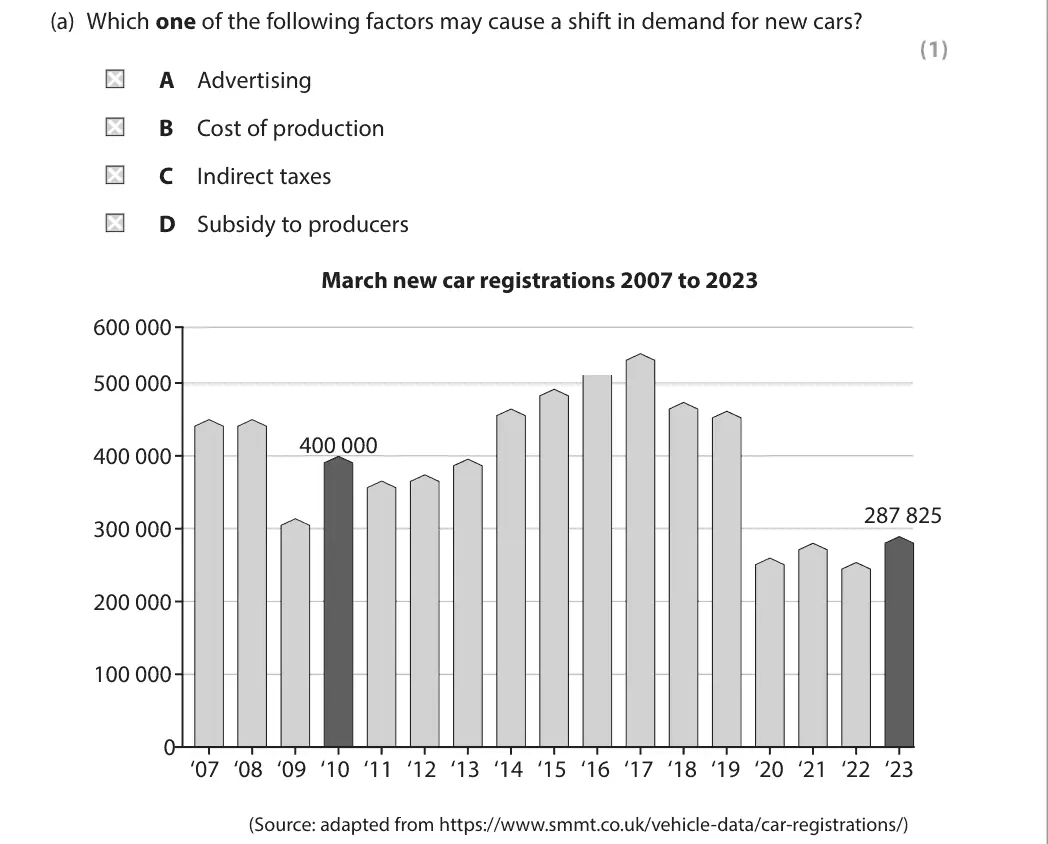
Data and extracts for question 55 In March 2019, 458 054 new car registrations were made, which subsequently fell by 44% in March 2020 due to the impact of the global health crisis. Demand for new vehicles can change quickly and can be caused by a variety of factors. (Source: adapted from https://fleetworld.co.uk/uk-new-car-registrations-slump-44-in-march/)
(a) Which one of the following factors may cause a shift in demand for new cars? (1) A Advertising B Cost of production C Indirect taxes D Subsidy to producers March new car registrations 2007 to 2023 600 000 500 000 400 000 400 000 287 825 300 000 200 000 100 000 0 ‘07 ‘08 ‘09 ‘10 ‘11 ‘12 ‘13 ‘14 ‘15 ‘16 ‘17 ‘18 ‘19 ‘20 ‘21 ‘22 ‘23 (Source: adapted from https://www.smmt.co.uk/vehicle-data/car-registrations/)
June 2025 · AS Paper 2 · Q1(a) 1 mark Multiple choice unemployment
Data and extracts for question 11 Between January 2020 and December 2020, the rate of unemployment in the UK increased from 3.9% to 5.2%. This was as a result of the UK economy experiencing a recession.
(a) Which one of the following best describes this cause of unemployment? (1) A Cyclical B Frictional C Seasonal D Structural
June 2025 · AS Paper 2 · Q2(a) 1 mark Multiple choice aggregate demand
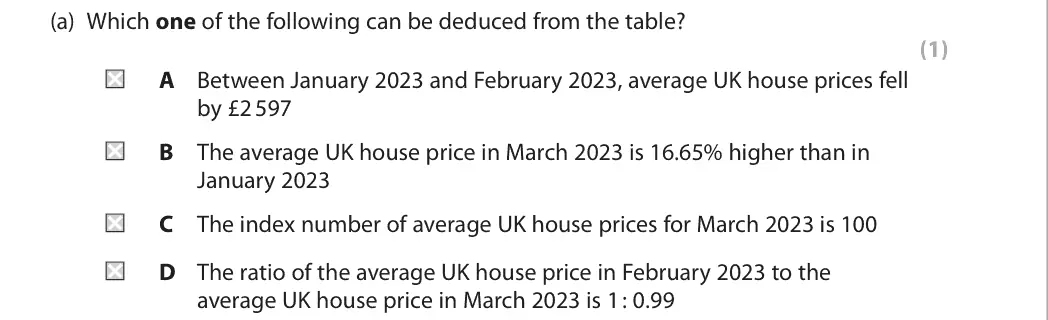
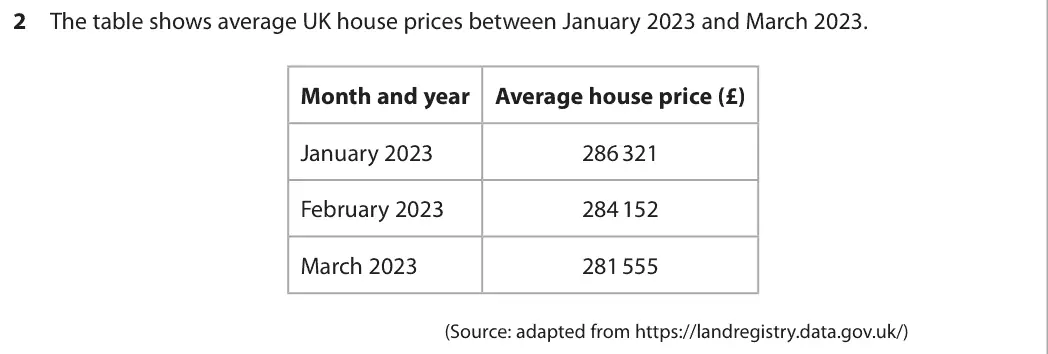
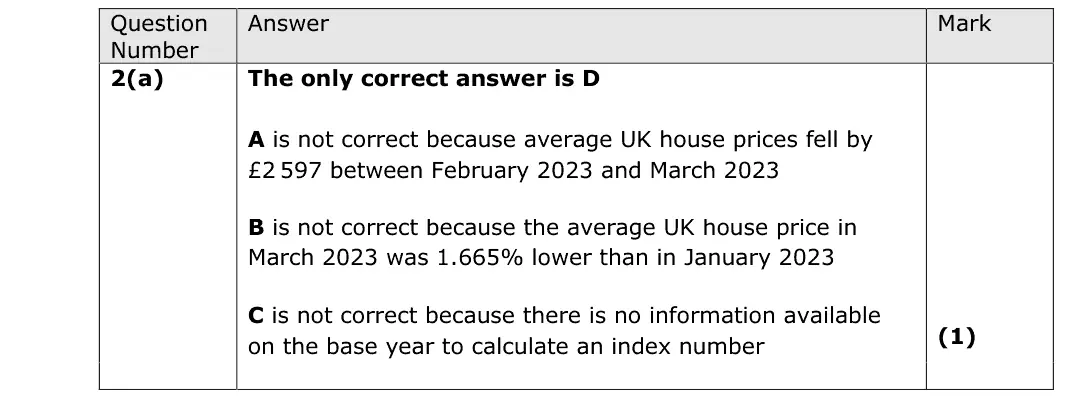
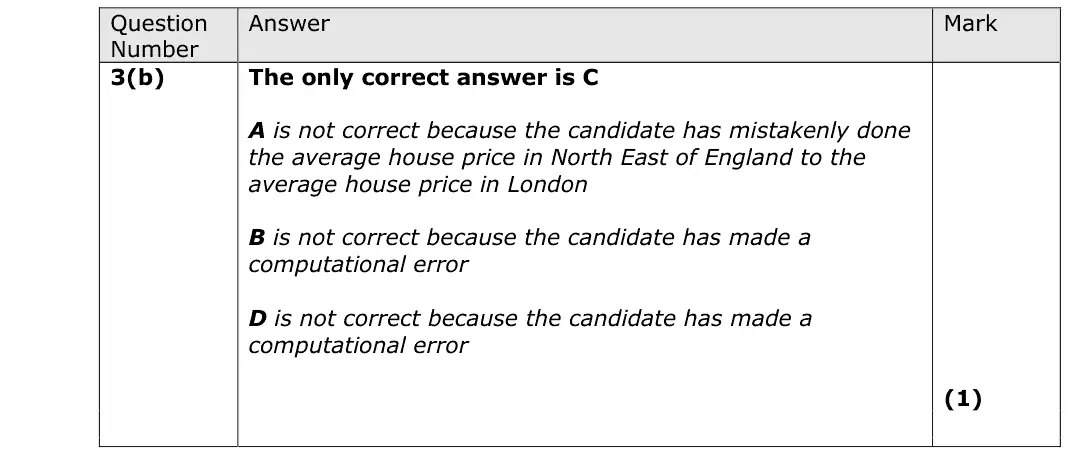
Data and extracts for question 22 The table shows average UK house prices between January 2023 and March 2023. Month and year Average house price (£) January 2023 286 321 February 2023 284 152 March 2023 281 555 (Source: adapted from https://landregistry.data.gov.uk/)
(a) Which one of the following can be deduced from the table? (1) A Between January 2023 and February 2023, average UK house prices fell by £2 597 B The average UK house price in March 2023 is 16.65% higher than in January 2023 C The index number of average UK house prices for March 2023 is 100 D The ratio of the average UK house price in February 2023 to the average UK house price in March 2023 is 1 : 0.99
June 2025 · AS Paper 2 · Q3(a) 1 mark Multiple choice economic growth and the trade cycle
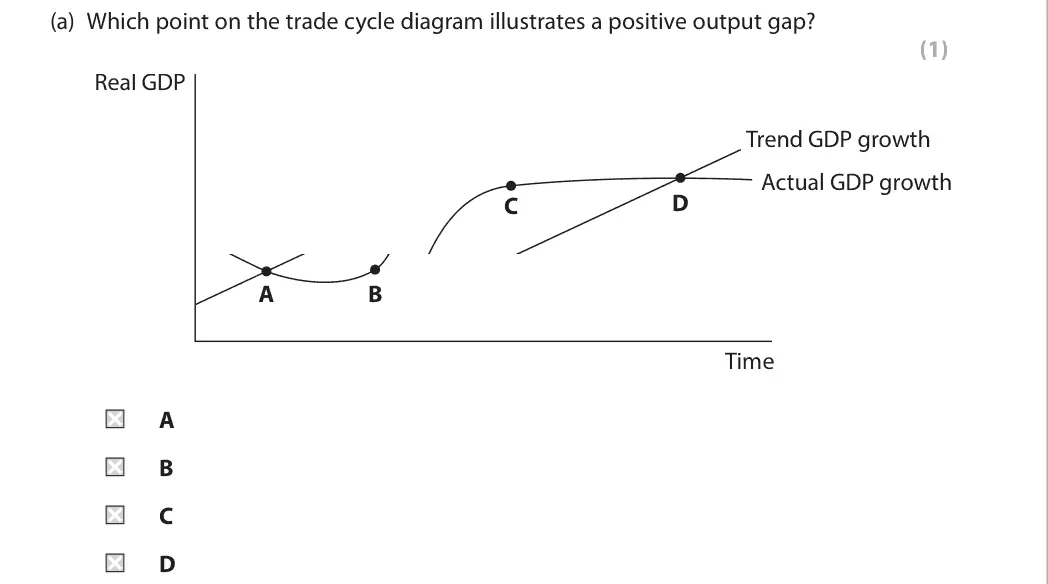
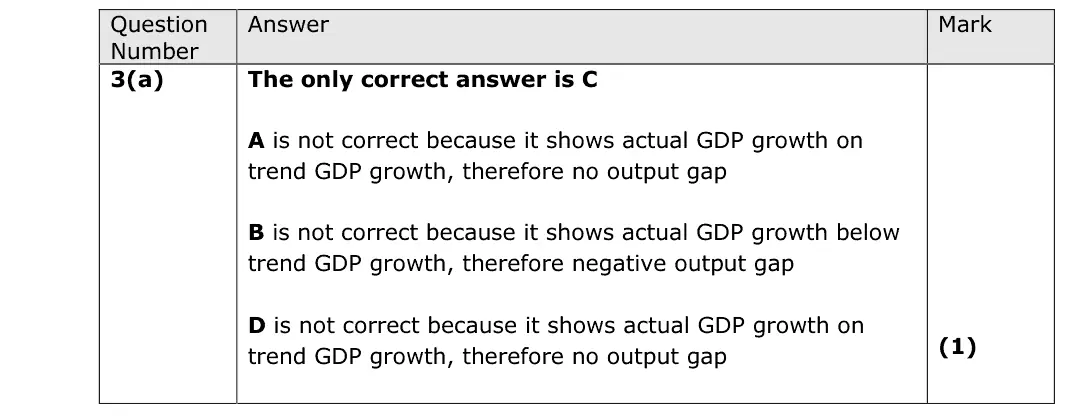
Data and extracts for question 33 It was forecast that the UK will experience a positive output gap in 2024.
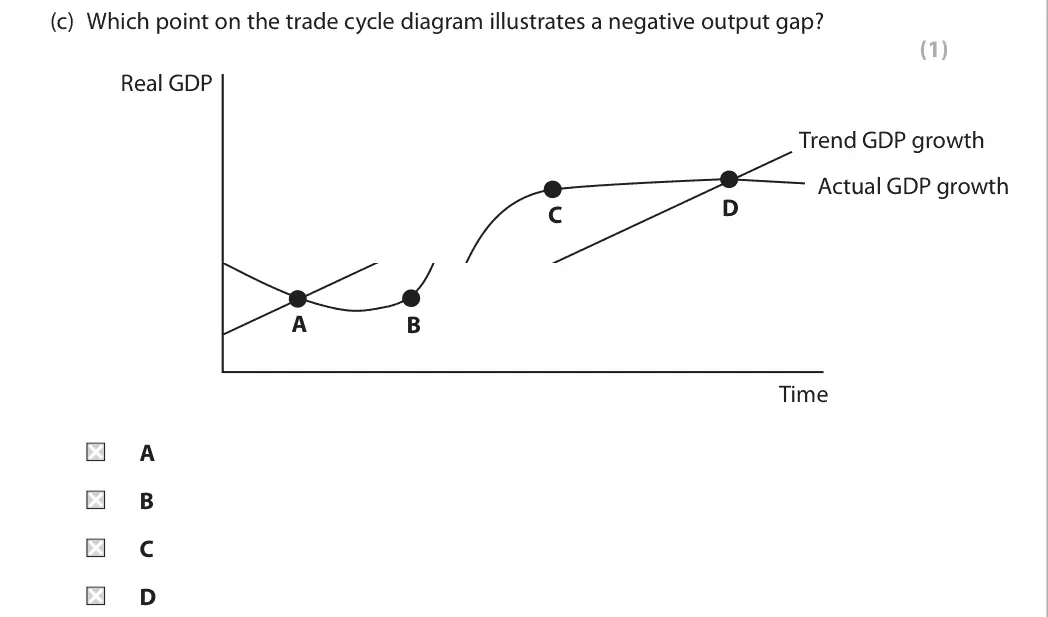
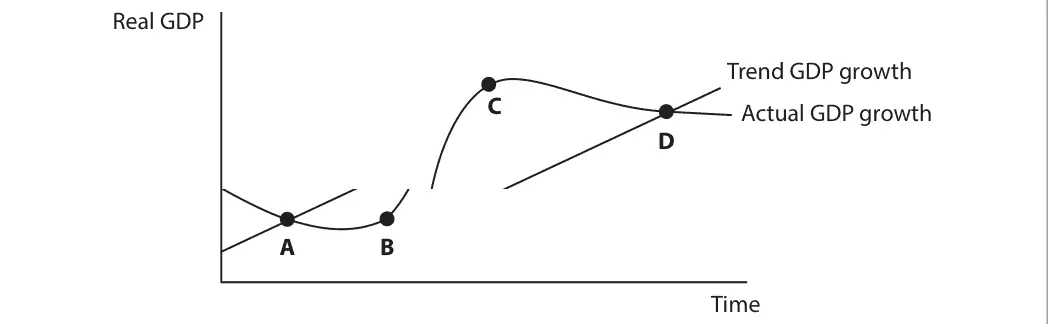
(a) Which point on the trade cycle diagram illustrates a positive output gap? (1) Real GDP Trend GDP growth Actual GDP growth D C A B Time A B C D
June 2025 · AS Paper 2 · Q4(c) 1 mark Multiple choice fiscal and monetary policy
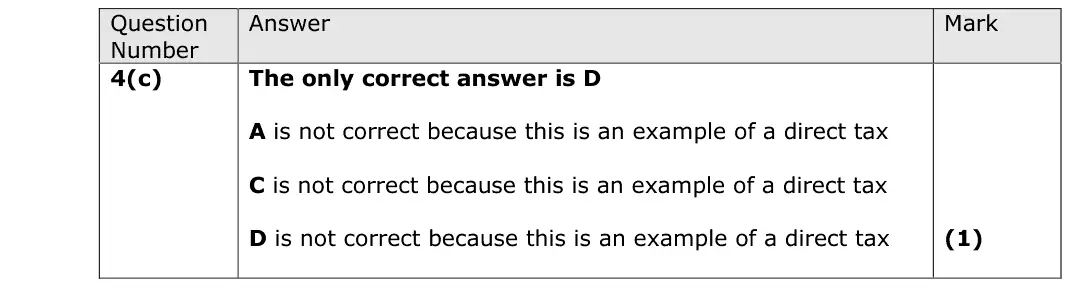
Data and extracts for question 44 In 2023 the UK government reduced indirect tax on certain goods and services.
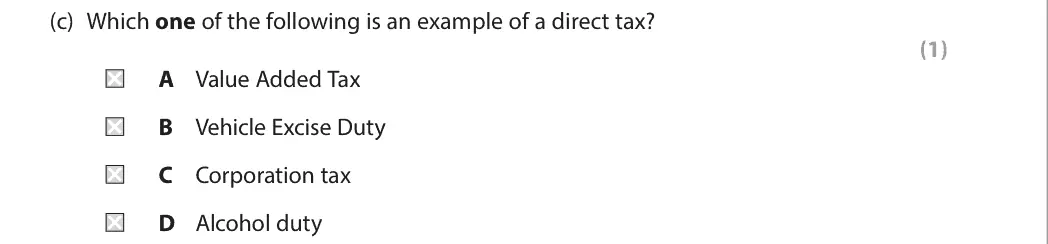
(c) Which one of the following is an example of an indirect tax? (1) A Corporation tax B Income tax C Inheritance tax D Value added tax
June 2025 · AS Paper 2 · Q5(a) 1 mark Multiple choice balance of payments
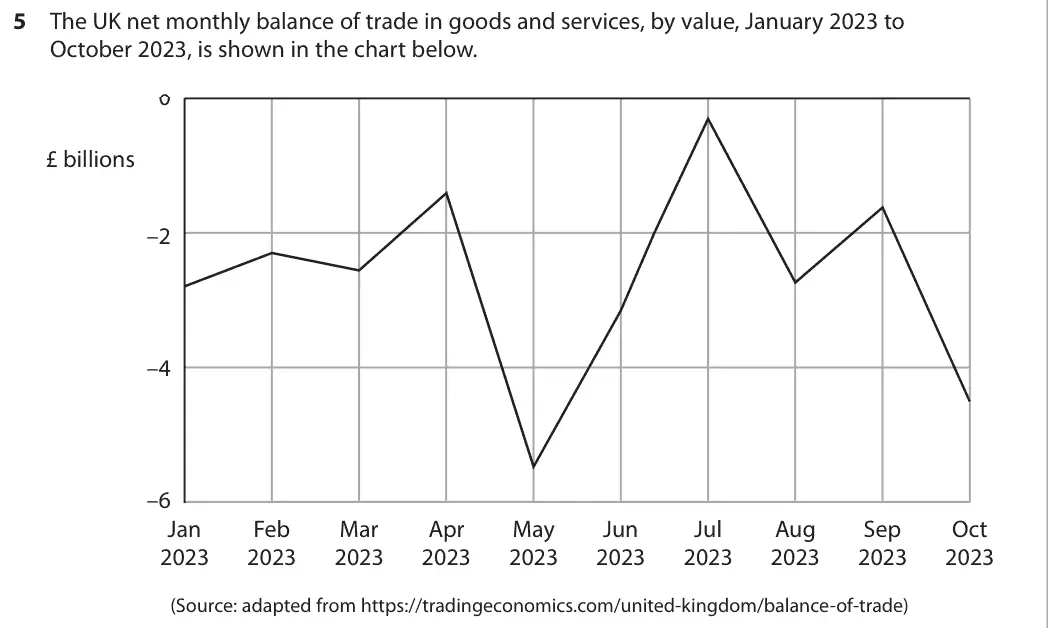
Data and extracts for question 55 The UK net monthly balance of trade in goods and services, by value, January 2023 to October 2023, is shown in the chart below. 0 £ billions –2 –4 –6 Jan Feb Mar Apr May Jun Jul Aug Sep Oct 2023 2023 2023 2023 2023 2023 2023 2023 2023 2023 (Source: adapted from https://tradingeconomics.com/united-kingdom/balance-of-trade)
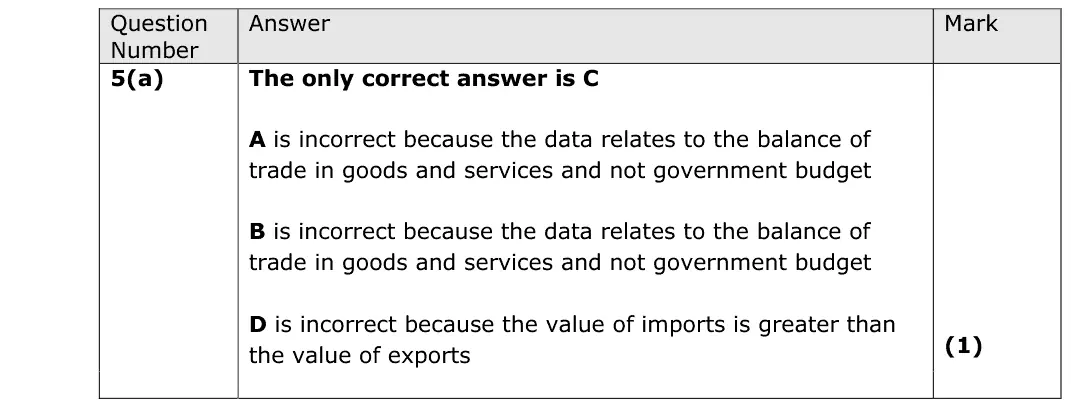
(a) Which one of the following can be deduced from the chart? (1) A The government was spending less than it received in taxation B The government was spending more than it received in taxation C The value of imports was greater than the value of exports D The value of imports was smaller than the value of exports
June 2025 · Paper 1 · Q1(b) 1 mark Multiple choice revenues costs and profits
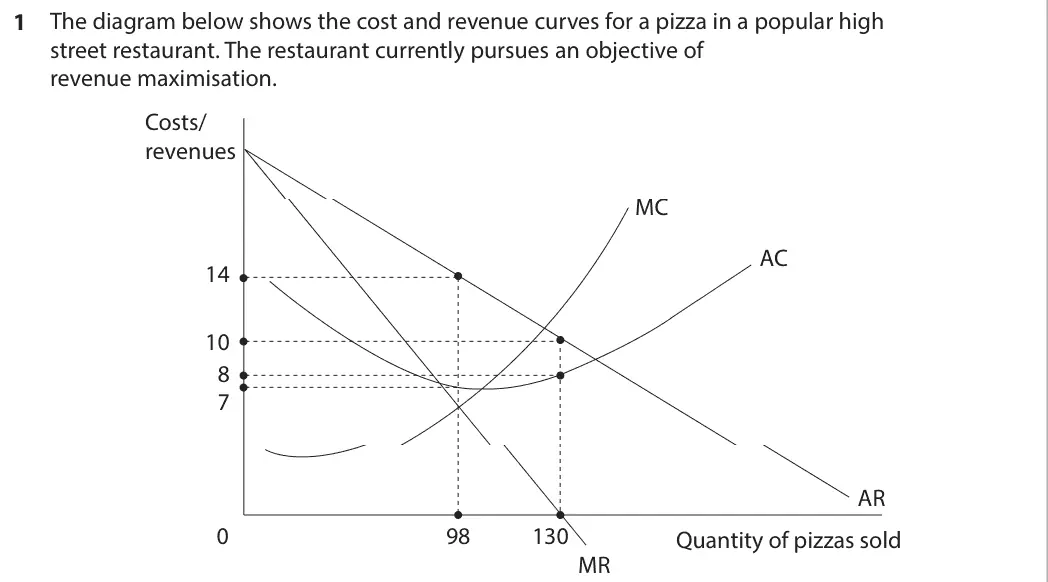
Data and extracts for question 11 The diagram below shows the cost and revenue curves for a pizza in a popular high street restaurant. The restaurant currently pursues an objective of revenue maximisation. Costs/ revenues MC AC 14 10 8 7 AR 0 98 130 Quantity of pizzas sold MR
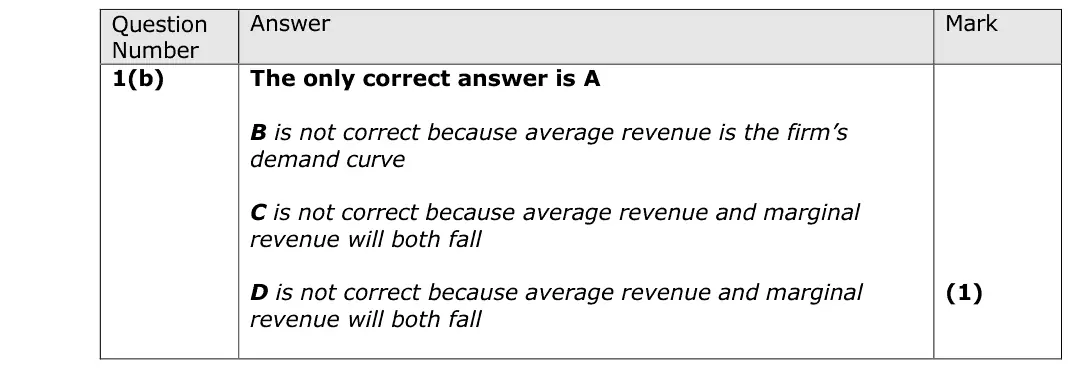
(b) Refer to the previous diagram. There is a reduction in the demand for pizza. Ceteris paribus, which one of the following will happen to the restaurant’s average revenue and marginal revenue as a result of this change? (1) A Average revenue and marginal revenue both fall B Average revenue and marginal revenue stay the same C Average revenue falls and marginal revenue increases D Average revenue increases and marginal revenue falls
June 2025 · Paper 1 · Q2(b) 1 mark Multiple choice price elasticity of demand
Data and extracts for question 22 In 2022 the UK government provided 130 new licences for North Sea oil and gas exploration, in order to reduce energy prices. However, companies can take 20 years to begin to extract oil. Furthermore, they often have to continue producing oil even when prices fall because the equipment has no other uses. (Source: adapted from https://www.theguardian.com/environment/2022/dec/12/ uk-ministers-face-legal-challenge-over-north-sea-oil-and-gas-licences)
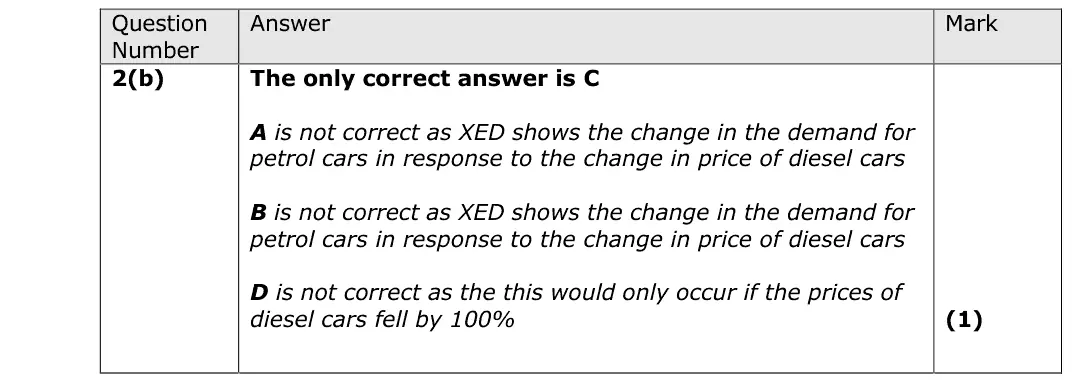
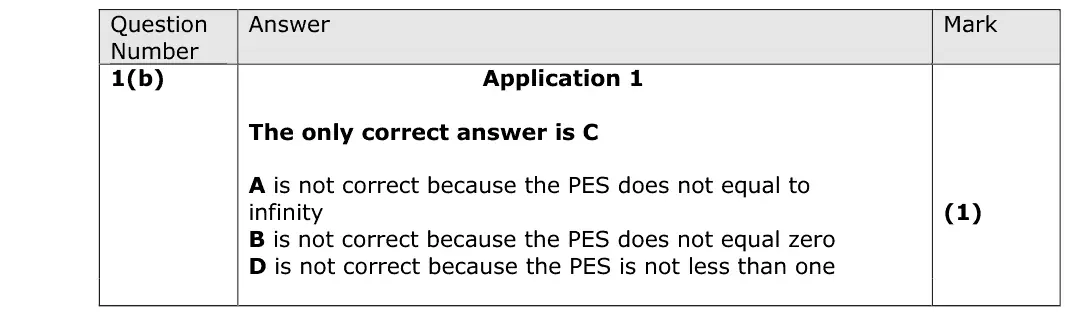
(b) The cross elasticity of demand for petrol cars with respect to the price of diesel cars is estimated to be +0.64. Which one of the following is the most likely impact if the price of diesel cars falls by 10%? (1) A The price of petrol cars falls by 6.4% B The price of petrol cars rises by 64% C The quantity demanded of petrol cars falls by 6.4% D The quantity demanded of petrol cars rises by 64%
June 2025 · Paper 1 · Q3(a) 1 mark Multiple choice market structures and efficiency
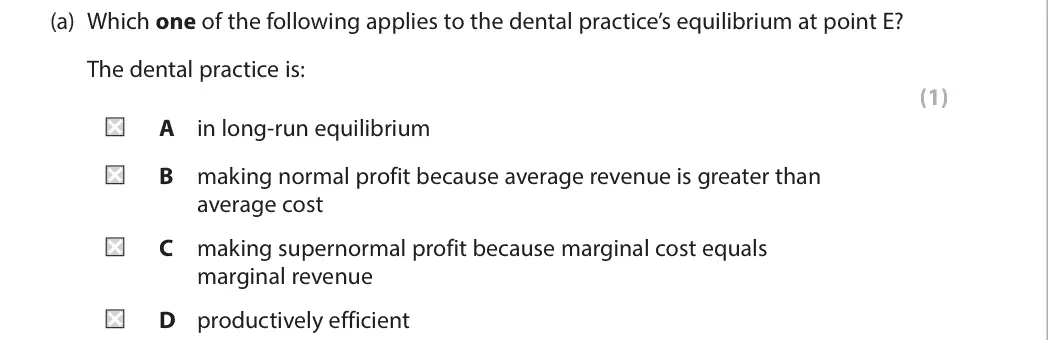
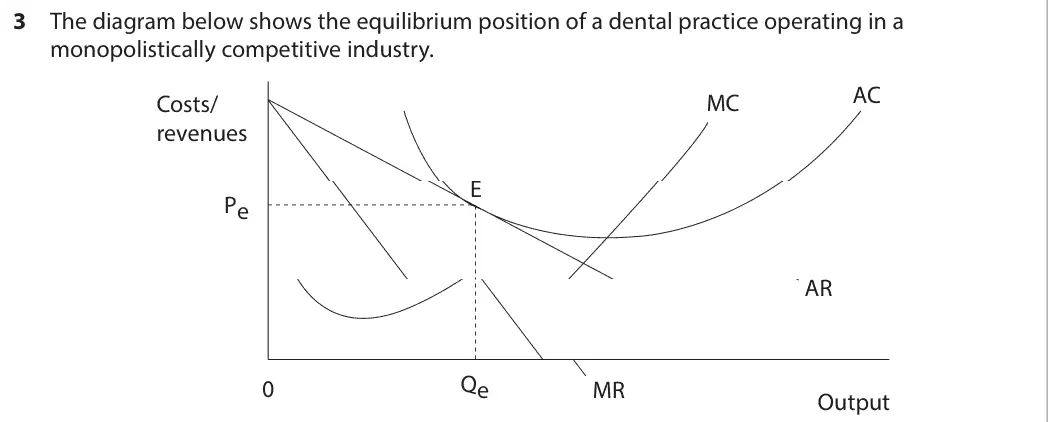
Data and extracts for question 33 The diagram below shows the equilibrium position of a dental practice operating in a monopolistically competitive industry. AC Costs/ MC revenues E Pe AR Qe 0 MR Output
(a) Which one of the following applies to the dental practice’s equilibrium at point E? The dental practice is: (1) A in long-run equilibrium B making normal profit because average revenue is greater than average cost C making supernormal profit because marginal cost equals marginal revenue D productively efficient
June 2025 · Paper 1 · Q4(b) 1 mark Multiple choice rational decision making and behavioural economics
Data and extracts for question 44 Nearly 750 000 consumers in Britain face unresolved problems with used car purchases every year. Older vehicles tend to have more faults and increase the risks facing a potential buyer. (Source: adapted from https://www.gov.uk/government/news/new- approach-to-give-second-hand-car-buyers-a-better-deal)
(b) In September 2022, the online retailer, Amazon, increased the price of its Prime service from £7.99 a month to £8.99. As a result, almost 600 000 people cancelled their subscriptions. (Source: adapted from https://www.telegraph.co.uk/business/2022/08/17/ hundreds-thousands-uk-households-ditch-amazon-prime/) Which one of the following is the most likely explanation of this behaviour? These consumers: (1) A aim to maximise profits B aim to maximise utility C demonstrate habitual behaviour D demonstrate weakness at computation
June 2025 · Paper 1 · Q5(b) 1 mark Multiple choice labour market
Data and extracts for question 55 The National Minimum Wage for people over 23 rose by 9.7% to £10.42 in April 2023. The industry most affected is hospitality. (Source: adapted from https://www.gov.uk/government/publications/the-national- minimum-wage-in-2023/the-national-minimum-wage-in-2023)
(b) There has been a significant decrease in the supply of agricultural workers in the UK. Which one of the following is the most likely cause of this decrease? (1) A Increased demand for UK-grown strawberries B Increased job security for qualified workers in the industry C Increased productivity of workers in the industry D Increased wages in the retail industry
June 2025 · Paper 2 · Q1(a) 1 mark Multiple choice emerging and developing economies
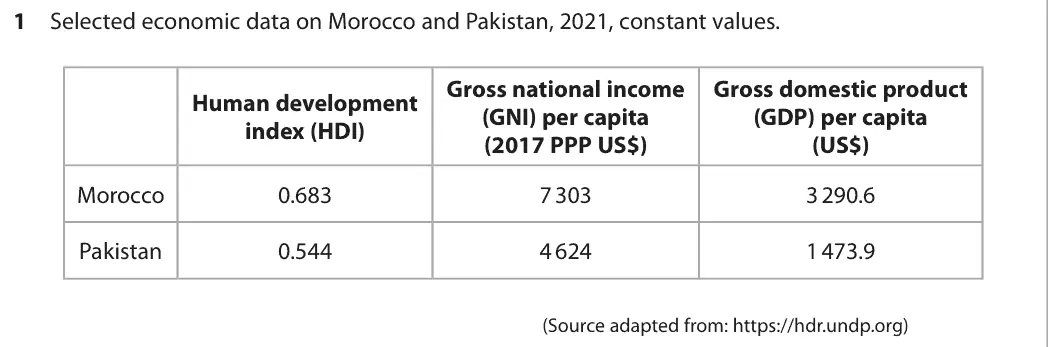
Data and extracts for question 11 Selected economic data on Morocco and Pakistan, 2021, constant values. Gross national income Gross domestic product Human development (GNI) per capita (GDP) per capita index (HDI) (2017 PPP US$) (US$) Morocco 0.683 7 303 3 290.6 Pakistan 0.544 4 624 1 473.9 (Source adapted from: https://hdr.undp.org)
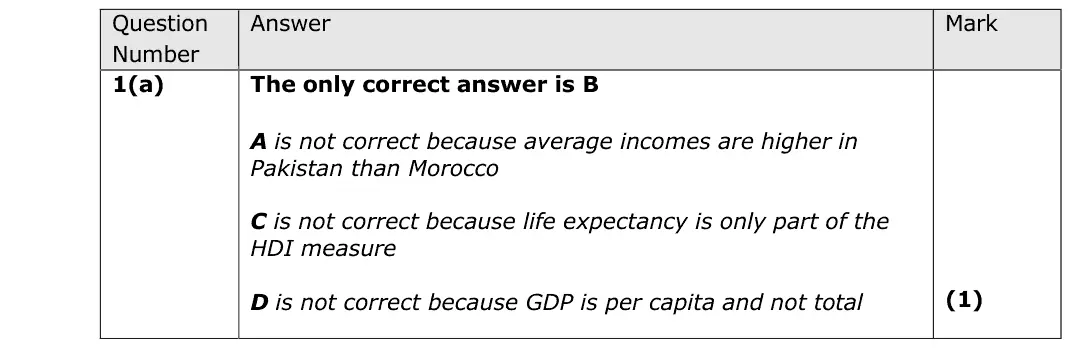
(a) With reference to the table above, which one of the following is correct? (1) A Average incomes are lower in Morocco than in Pakistan B Economic development, as measured by the HDI, is higher in Morocco than in Pakistan C Life expectancy in Morocco is 68.3 years D Total output in Morocco is higher than in Pakistan
June 2025 · Paper 2 · Q2(a) 1 mark Multiple choice balance of payments
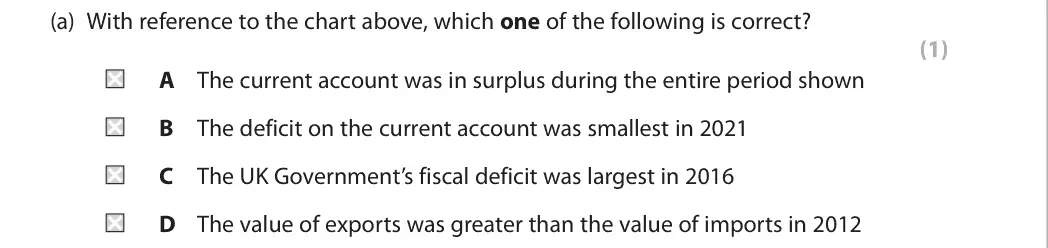
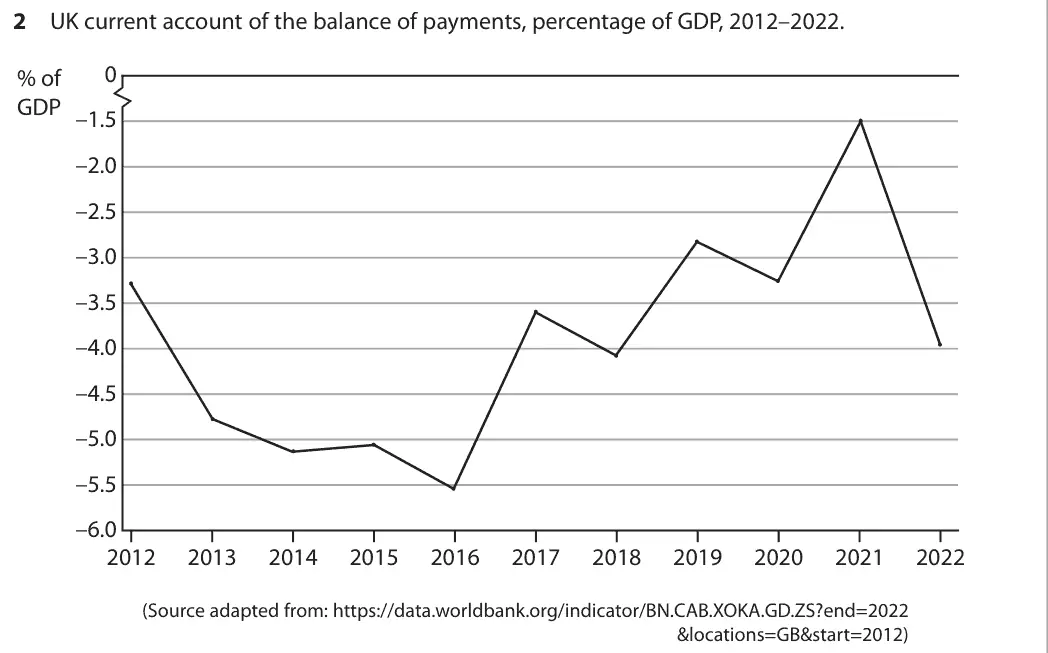
Data and extracts for question 22 UK current account of the balance of payments, percentage of GDP, 2012–2022. 0 % of GDP –1.5 –2.0 –2.5 –3.0 –3.5 –4.0 –4.5 –5.0 –5.5 –6.0 2012 2013 2014 2015 2016 2017 2018 2019 2020 2021 2022 (Source adapted from: https://data.worldbank.org/indicator/BN.CAB.XOKA.GD.ZS?end=2022 &locations=GB&start=2012)
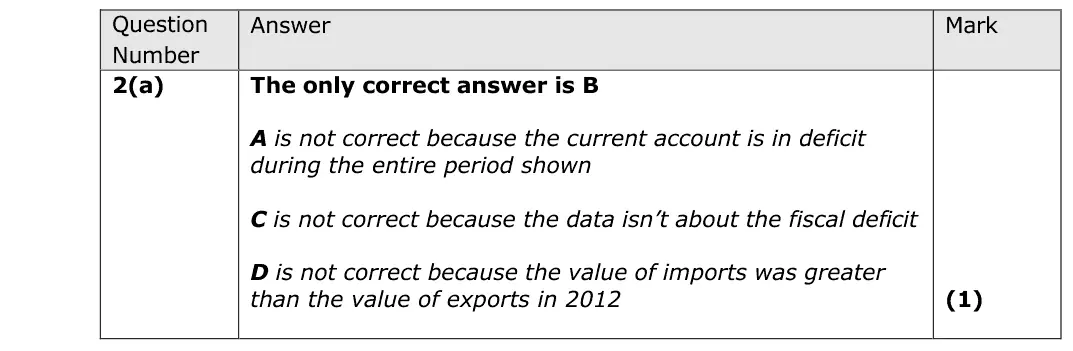
(a) With reference to the chart above, which one of the following is correct? (1) A The current account was in surplus during the entire period shown B The deficit on the current account was smallest in 2021 C The UK Government’s fiscal deficit was largest in 2016 D The value of exports was greater than the value of imports in 2012
June 2025 · Paper 2 · Q3(a) 1 mark Multiple choice measuring economic growth
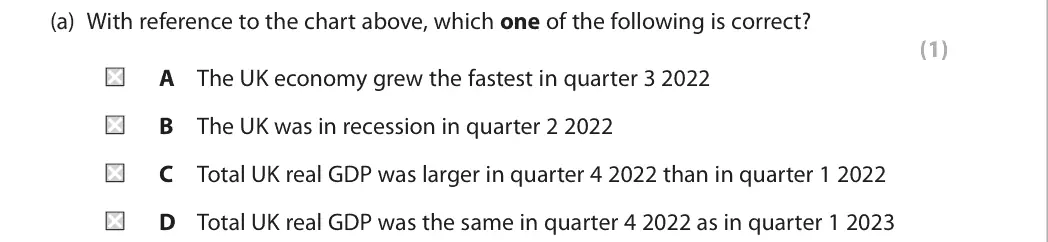
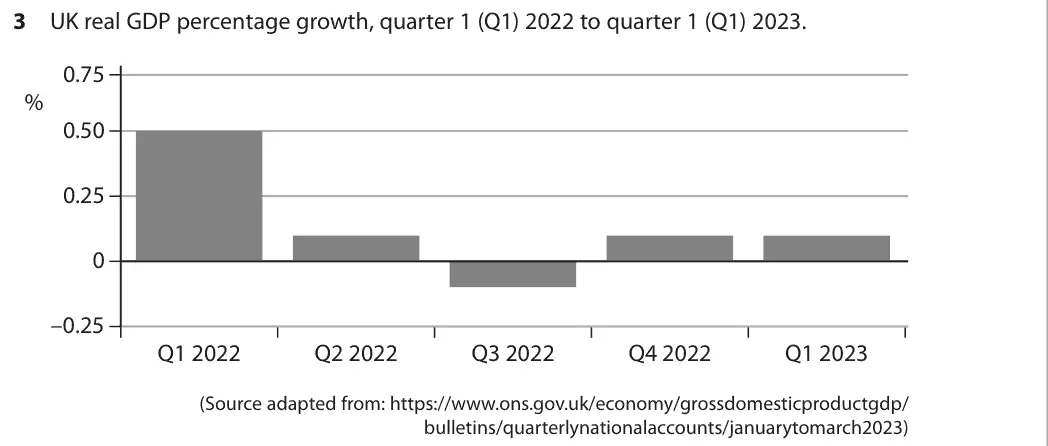
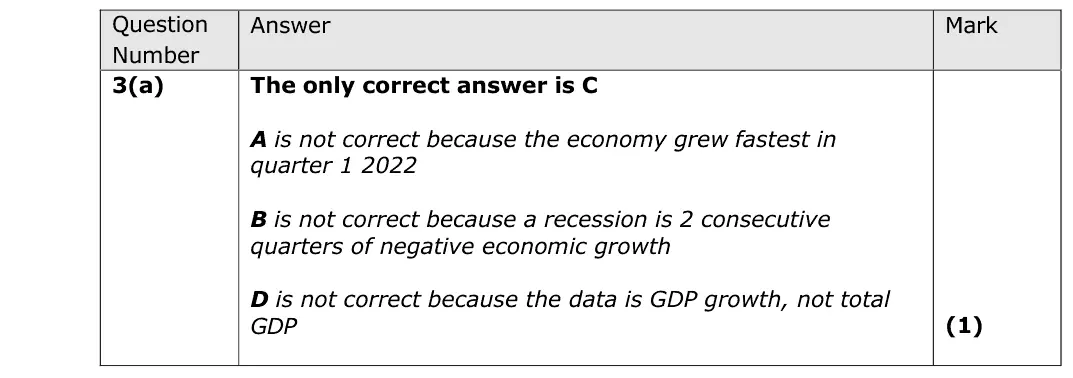
Data and extracts for question 33 UK real GDP percentage growth, quarter 1 (Q1) 2022 to quarter 1 (Q1) 2023. 0.75 % 0.50 0.25 0 –0.25 Q1 2022 Q2 2022 Q3 2022 Q4 2022 Q1 2023 (Source adapted from: https://www.ons.gov.uk/economy/grossdomesticproductgdp/ bulletins/quarterlynationalaccounts/januarytomarch2023)
(a) With reference to the chart above, which one of the following is correct? (1) A The UK economy grew the fastest in quarter 3 2022 B The UK was in recession in quarter 2 2022 C Total UK real GDP was larger in quarter 4 2022 than in quarter 1 2022 D Total UK real GDP was the same in quarter 4 2022 as in quarter 1 2023
June 2025 · Paper 2 · Q4(b) 1 mark Multiple choice globalisation and trade
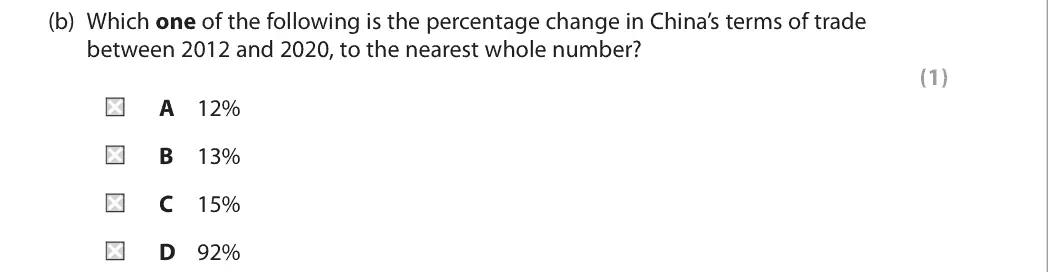
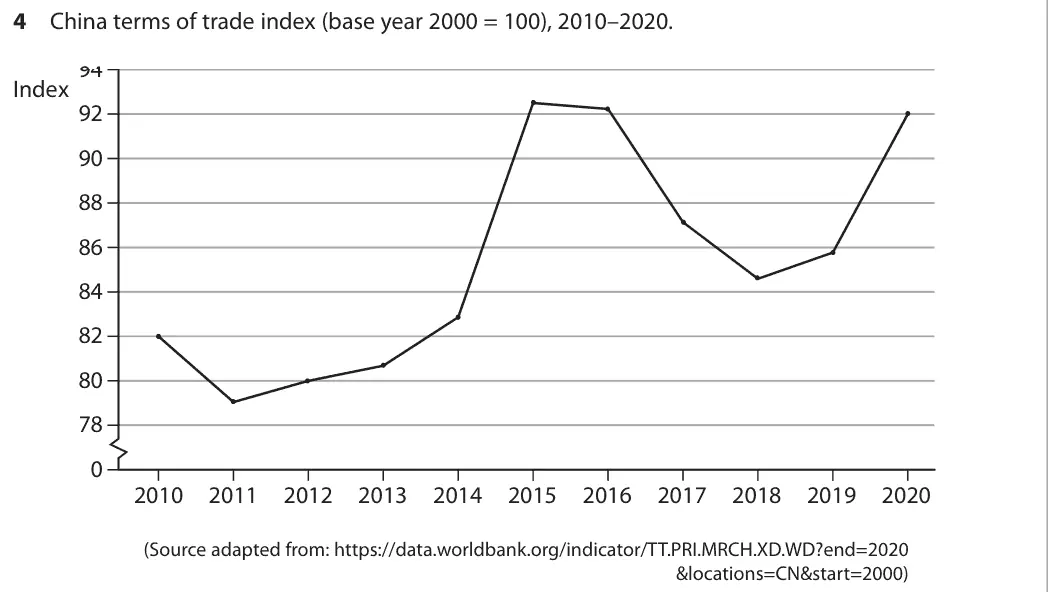
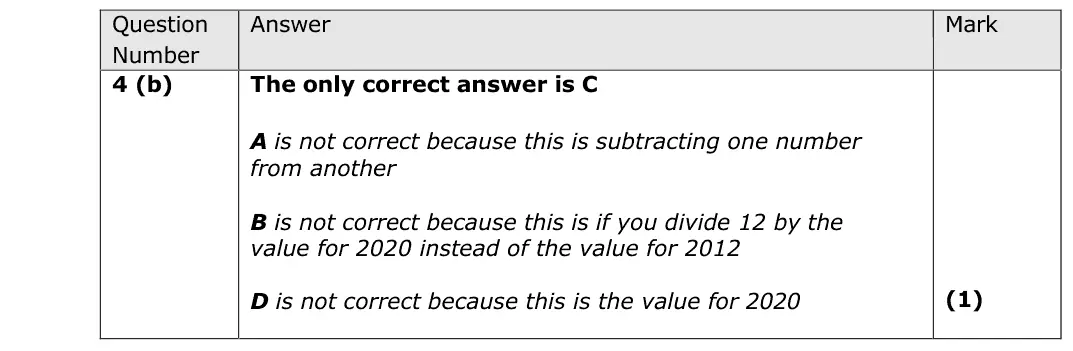
Data and extracts for question 44 China terms of trade index (base year 2000 = 100), 2010–2020. 94 Index 92 90 88 86 84 82 80 78 0 2010 2011 2012 2013 2014 2015 2016 2017 2018 2019 2020 (Source adapted from: https://data.worldbank.org/indicator/TT.PRI.MRCH.XD.WD?end=2020 &locations=CN&start=2000)
(b) Which one of the following is the percentage change in China’s terms of trade between 2012 and 2020, to the nearest whole number? (1) A 12% B 13% C 15% D 92%
June 2025 · Paper 2 · Q5(c) 1 mark Multiple choice unemployment
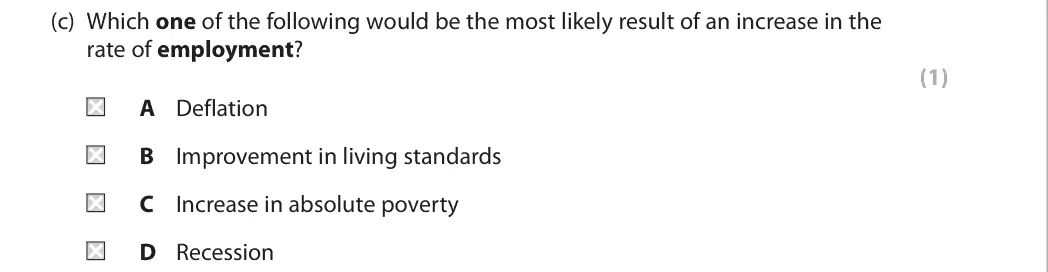
Data and extracts for question 55 The UK’s labour force inactivity rate was 20.2% in January 2020 and increased to 21.5% in January 2022. After an increase in the early stages of the global health crisis, most developed countries have recorded a decrease in the inactivity rate back to, and below, levels in 2019. This is not the case in the UK. (Source adapted from: https://www.theguardian.com/business/2023/apr/13/ uk‑worst‑performer‑g7‑workforce‑participation‑since‑covid; tradingeconomics.com)
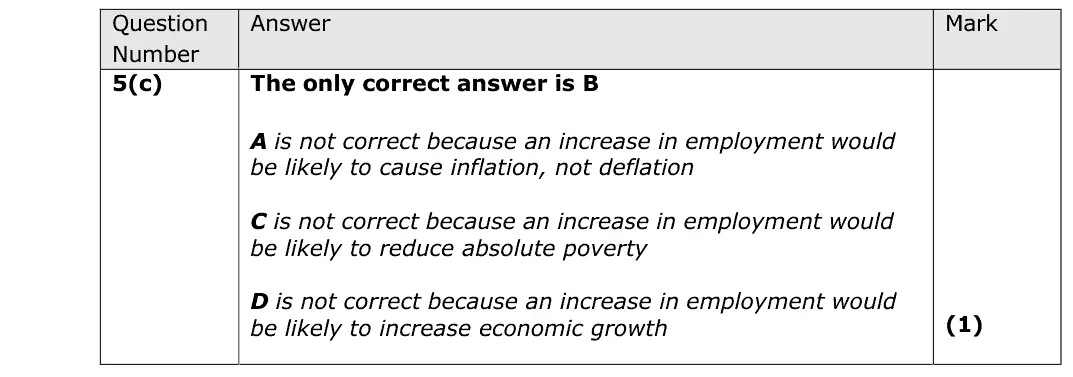
(c) Which one of the following would be the most likely result of an increase in the rate of employment? (1) A Deflation B Improvement in living standards C Increase in absolute poverty D Recession
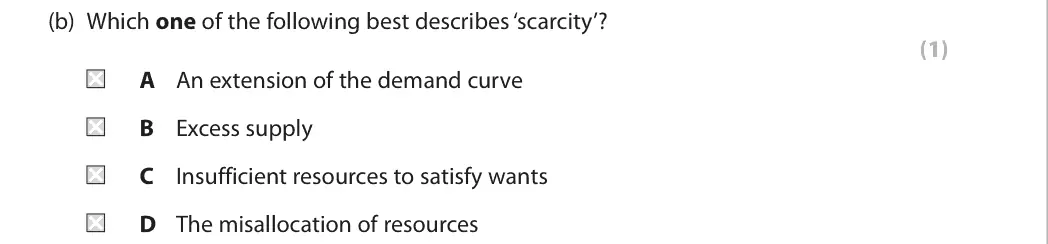
June 2024 · AS Paper 1 · Q1(b) 1 mark AO1=1 Multiple choice nature of economics
Data and extracts for question 11 Scarcity of non‑renewable resources, such as oil, is a key reason why alternative resources have been developed by economies. In recent years, within the energy market there has been a large increase in the production of wind power.
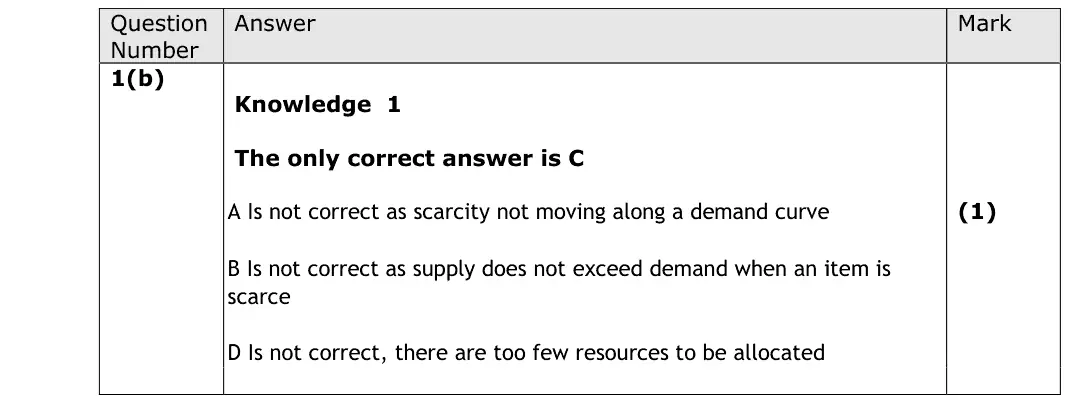
(b) Which one of the following best describes ‘scarcity’? (1) A An extension of the demand curve B Excess supply C Insufficient resources to satisfy wants D The misallocation of resources
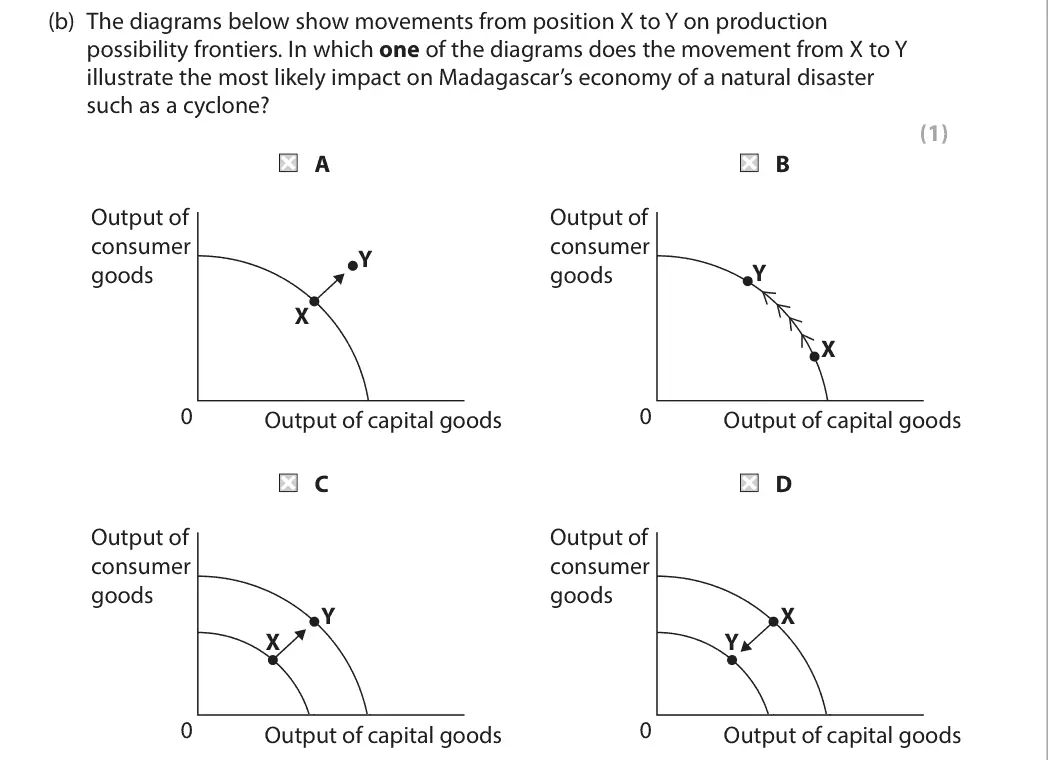
June 2024 · AS Paper 1 · Q2(b) 1 mark AO1=1 Multiple choice production possibility frontiers
Data and extracts for question 22 Vanilla bean prices increased to a record $600 a kilogramme in 2018 after a cyclone hit the tropical island of Madagascar, damaging crops. Madagascar supplies 75% to 80% of the world vanilla bean market.
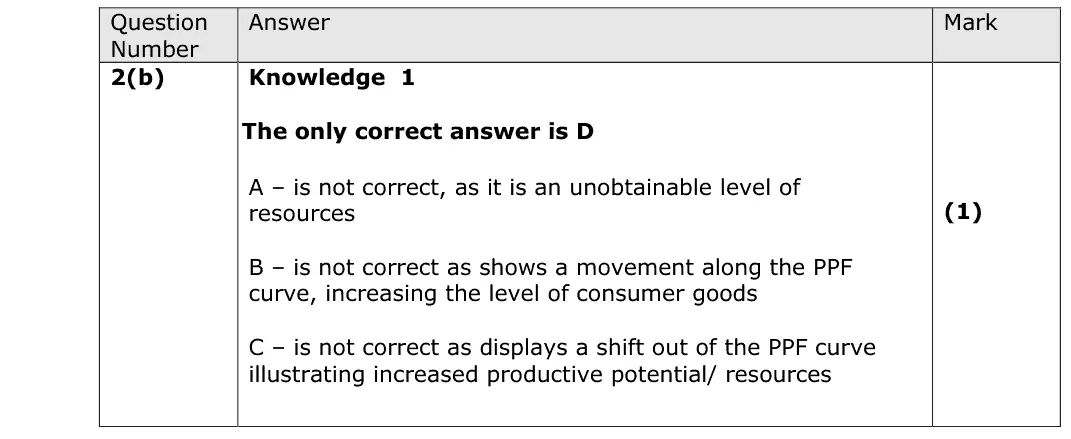
(b) The diagrams below show movements from position X to Y on production possibility frontiers. In which one of the diagrams does the movement from X to Y illustrate the most likely impact on Madagascar’s economy of a natural disaster such as a cyclone? (1) A B Output of Output of consumer consumer Y Y goods goods X X 0 0 Output of capital goods Output of capital goods C D Output of Output of consumer consumer goods goods Y X X Y 0 0 Output of capital goods Output of capital goods
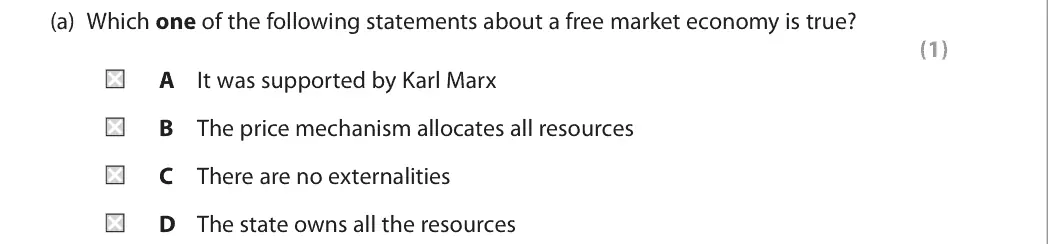
June 2024 · AS Paper 1 · Q3(a) 1 mark AO1=1 Multiple choice economic systems
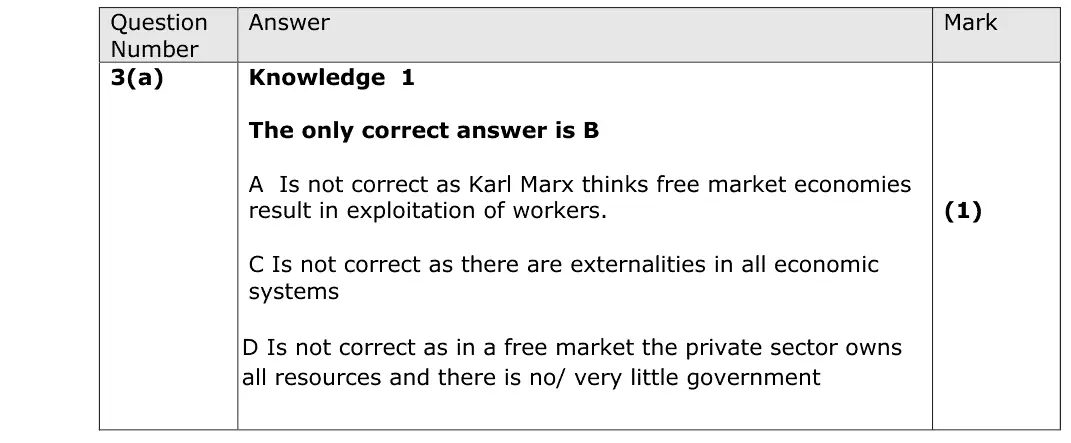
Data and extracts for question 33 Singapore is mainly a free market economy.
(a) Which one of the following statements about a free market economy is true? (1) A It was supported by Karl Marx B The price mechanism allocates all resources C There are no externalities D The state owns all the resources
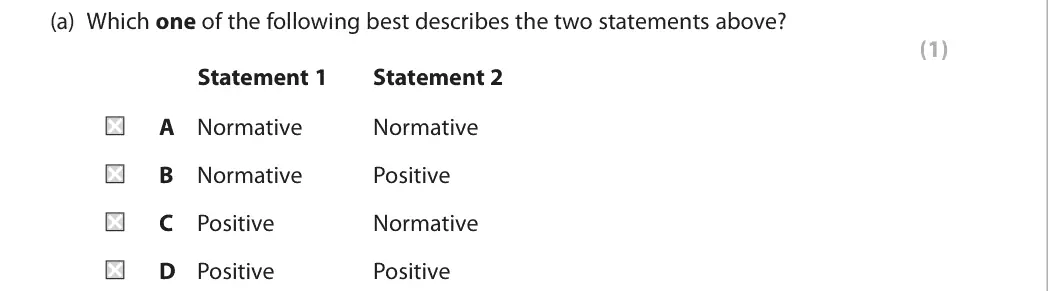
June 2024 · AS Paper 1 · Q4(a) 1 mark AO1=1 Multiple choice nature of economics
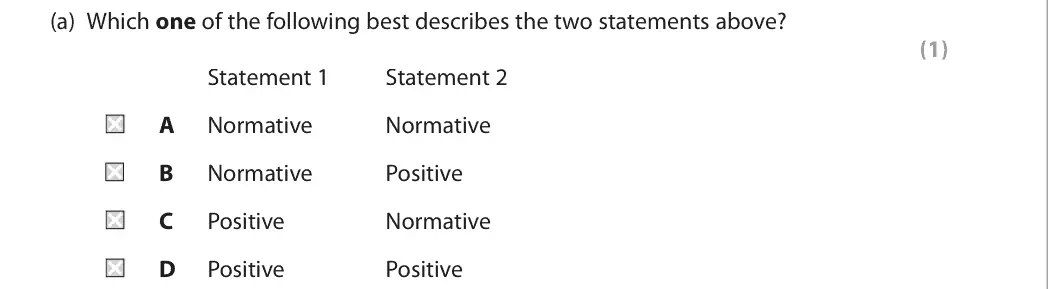
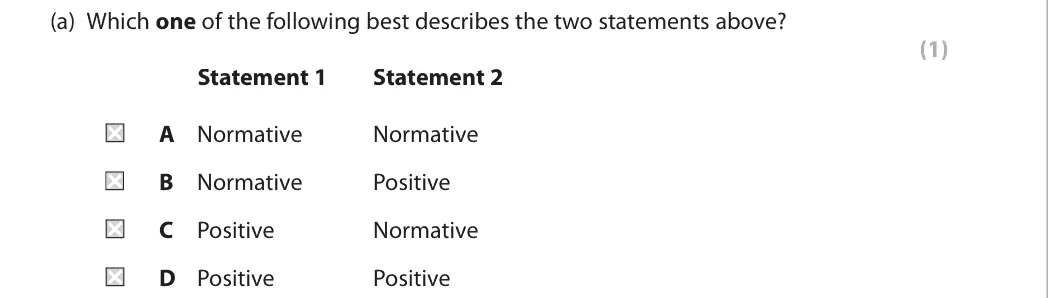
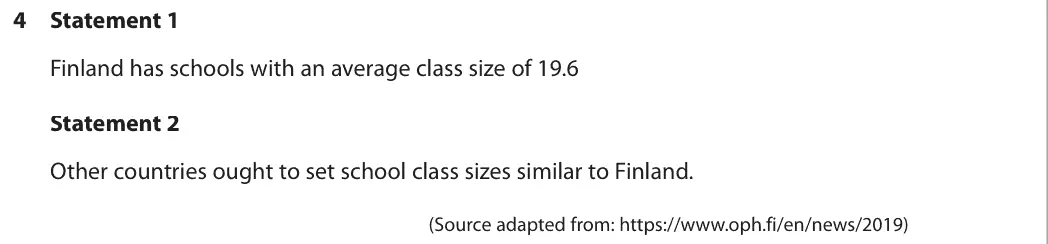
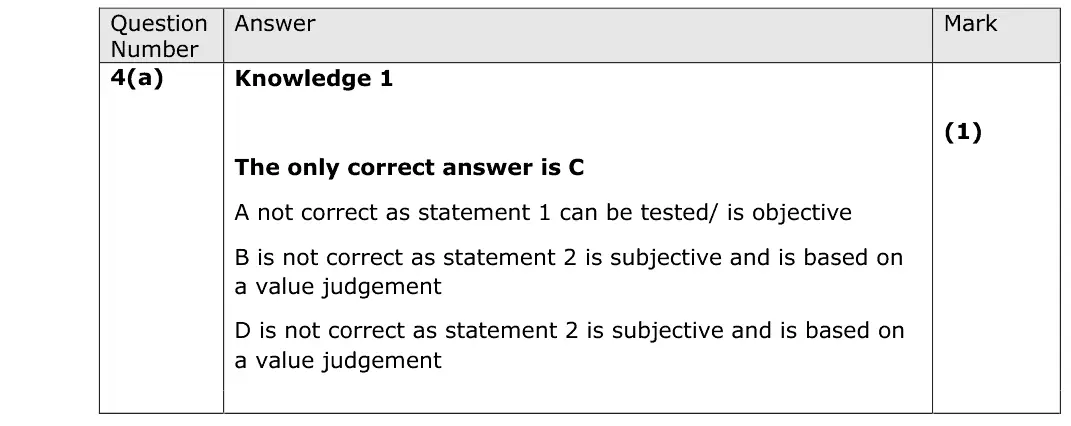
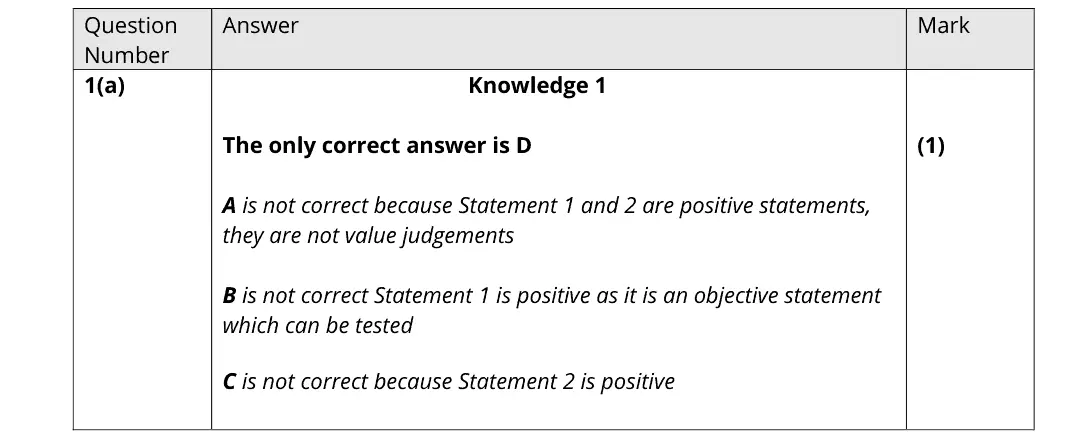
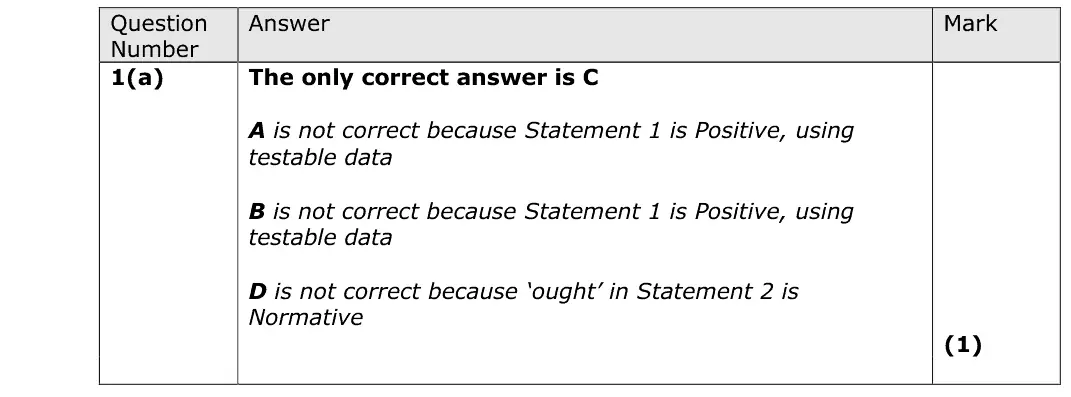
Data and extracts for question 44 Statement 1 Finland has schools with an average class size of 19.6 Statement 2 Other countries ought to set school class sizes similar to Finland. (Source adapted from: https://www.oph.fi/en/news/2019)
(a) Which one of the following best describes the two statements above? (1) Statement 1 Statement 2 A Normative Normative B Normative Positive C Positive Normative D Positive Positive
June 2024 · AS Paper 1 · Q5(c) 1 mark AO1=1 Multiple choice price elasticity of demand
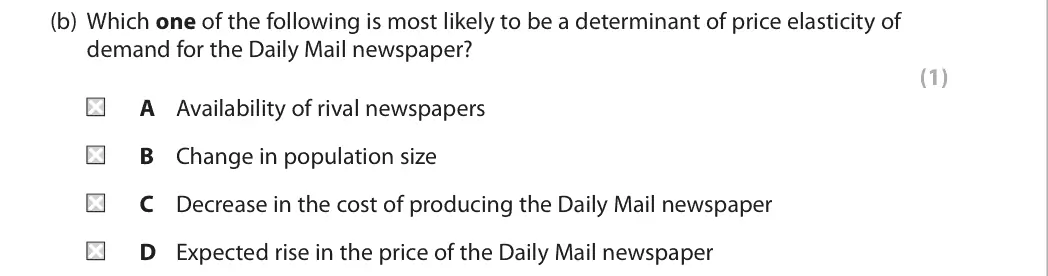
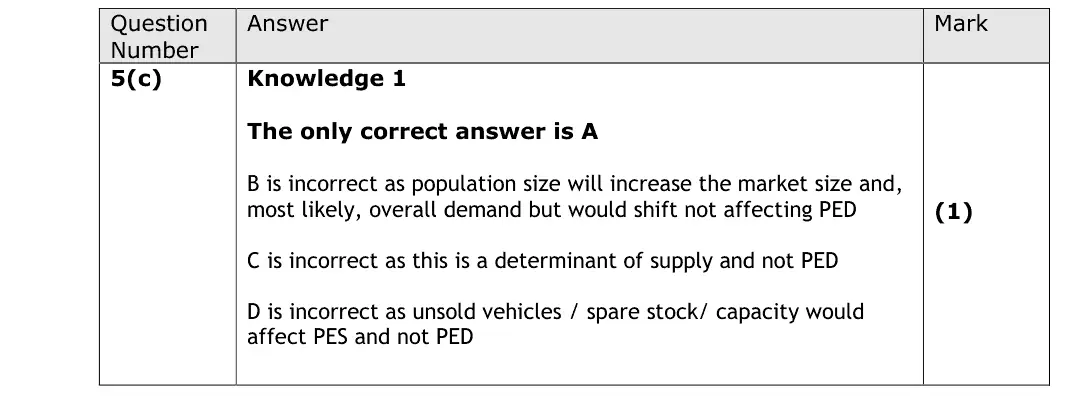
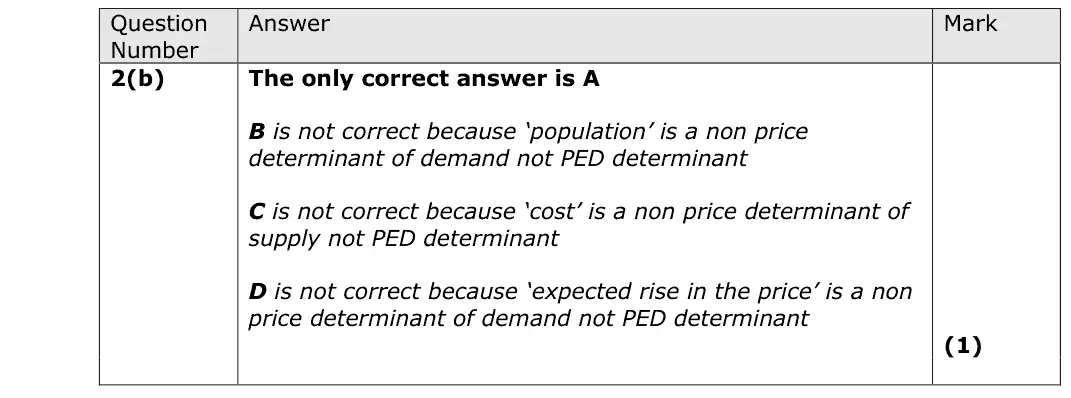
Data and extracts for question 55 Chief Executive Elon Musk said “affordability” was the biggest barrier to Tesla reaching a far larger market. Before recent price cuts for its electric vehicles, he said, “We weren’t sure about what the price elasticity of demand was for Tesla. We found that even small changes in price have a big impact on demand.” (Source adapted from: https://www.ft.com/)
(c) Which one of the following is most likely to be a determinant of price elasticity of demand for the Model 3 electric vehicle? (1) A Availability of substitute electric vehicles B Change in population size C Increase in the cost of steel D Number of unsold Model 3 electric vehicles
June 2024 · AS Paper 2 · Q1(a) 1 mark Multiple choice economic growth and the trade cycle
Data and extracts for question 11 In 2019 the average annual percentage increase in real Gross Domestic Product (GDP) was 1.7% in developed countries and it was 4.6% in developing countries. (Source: adapted from IMF, World Economic Outlook 2019)
(a) Which one of the following best describes an increase in real GDP? (1) A Actual economic growth B Negative output gap C Positive output gap D Potential economic growth
June 2024 · AS Paper 2 · Q2(c) 1 mark Multiple choice national income and the multiplier
Data and extracts for question 22 In 2019 the marginal propensity to consume in the UK was estimated to be 0.8.
(c) Using the above data, which one of the following represents the value of the multiplier? (1) A 0.2 B 0.8 C 1.3 D 5.0
June 2024 · AS Paper 2 · Q3(a) 1 mark Multiple choice unemployment
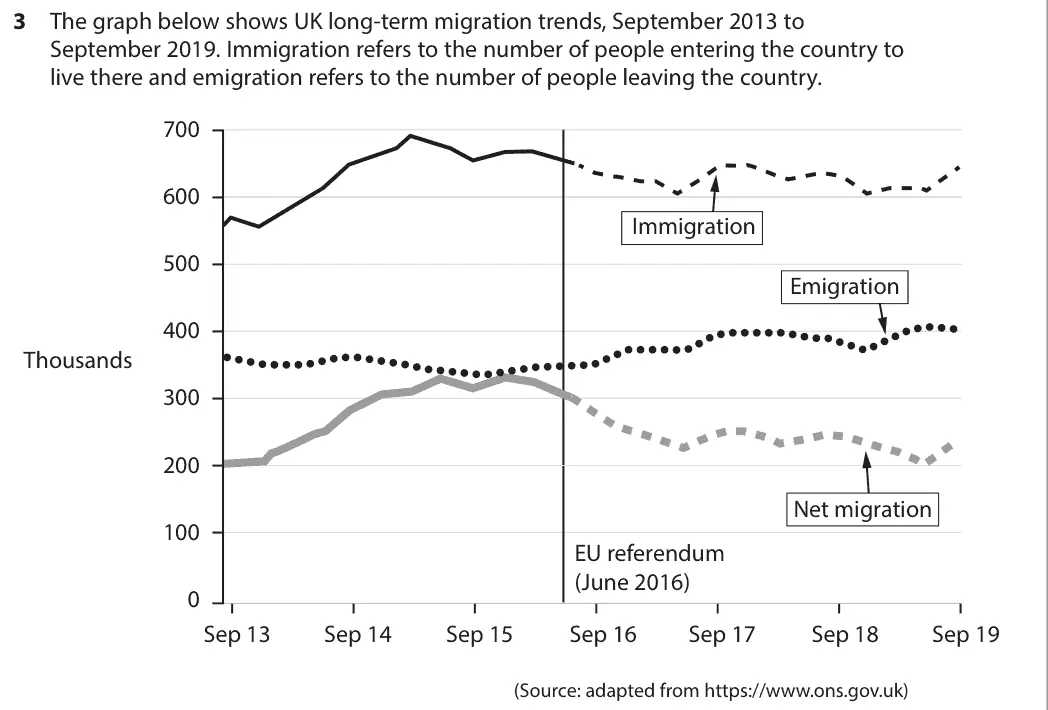
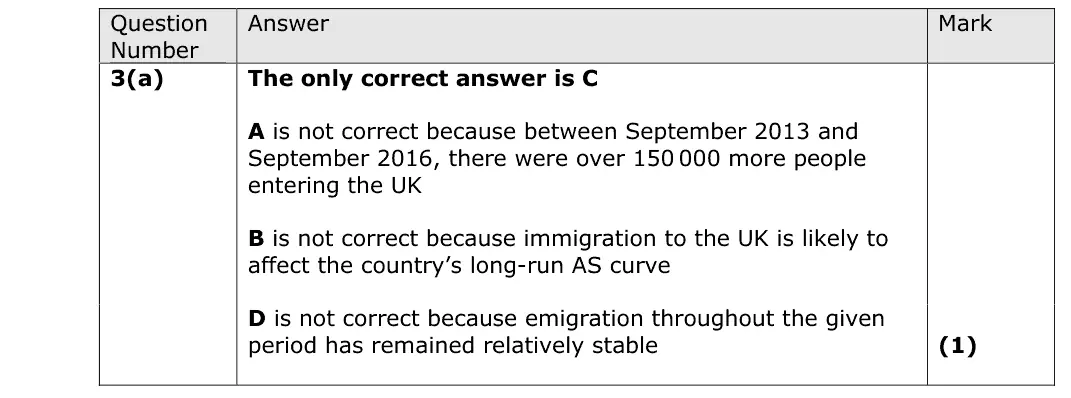
Data and extracts for question 33 The graph below shows UK long-term migration trends, September 2013 to September 2019. Immigration refers to the number of people entering the country to live there and emigration refers to the number of people leaving the country. 700 600 Immigration 500 Emigration 400 Thousands 300 200 Net migration 100 EU referendum (June 2016) 0 Sep 13 Sep 14 Sep 15 Sep 16 Sep 17 Sep 18 Sep 19 (Source: adapted from https://www.ons.gov.uk)
(a) Which one of the following can be inferred from the above chart? (1) A Between September 2013 and September 2016, there were nearly 100 000 more people leaving the UK than entering the UK B Immigration to the UK is likely to decrease the short-run AS curve C Since the EU referendum, net migration has fallen by around 80 000 D There has been a significant decrease in emigration throughout the given period
June 2024 · AS Paper 2 · Q4(c) 1 mark Multiple choice aggregate demand
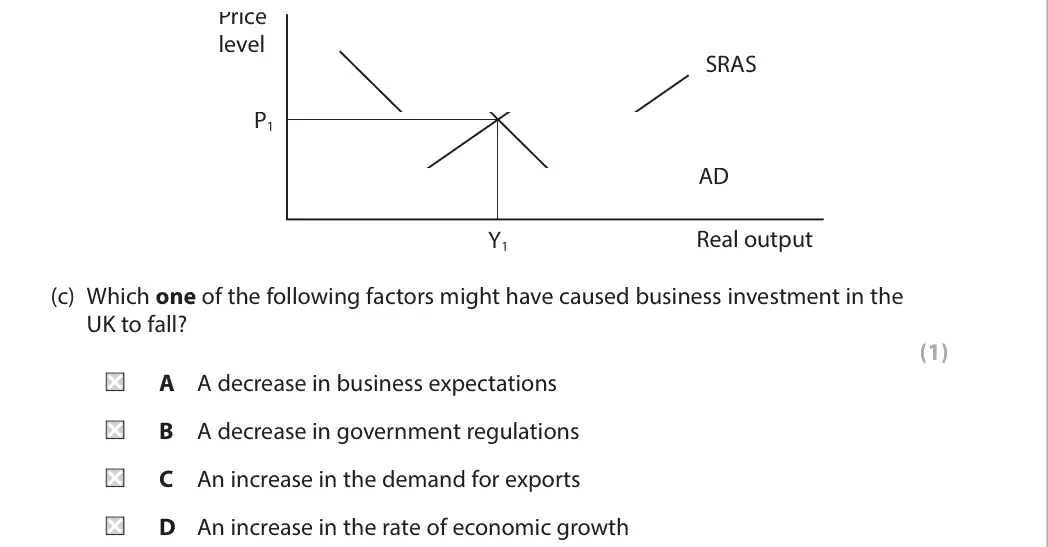
Data and extracts for question 44 Business investment fell by 0.5% between Quarter 3 2019 and Quarter 4 2019. (Source: adapted from https://www.ons.gov.uk)
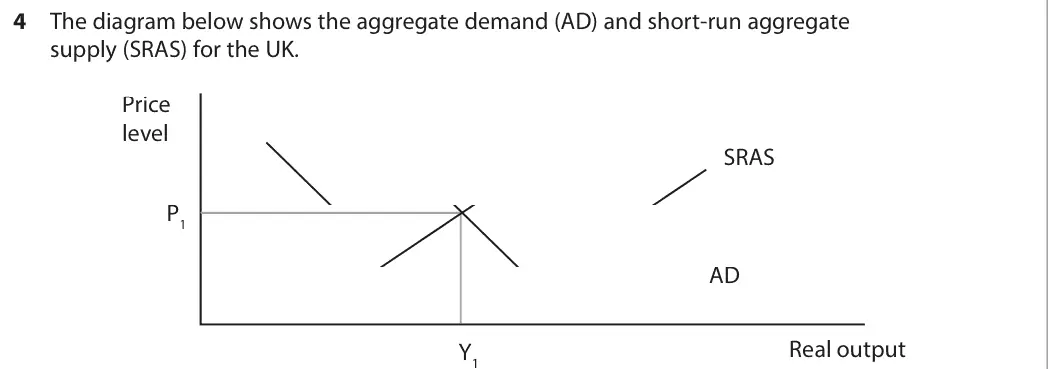
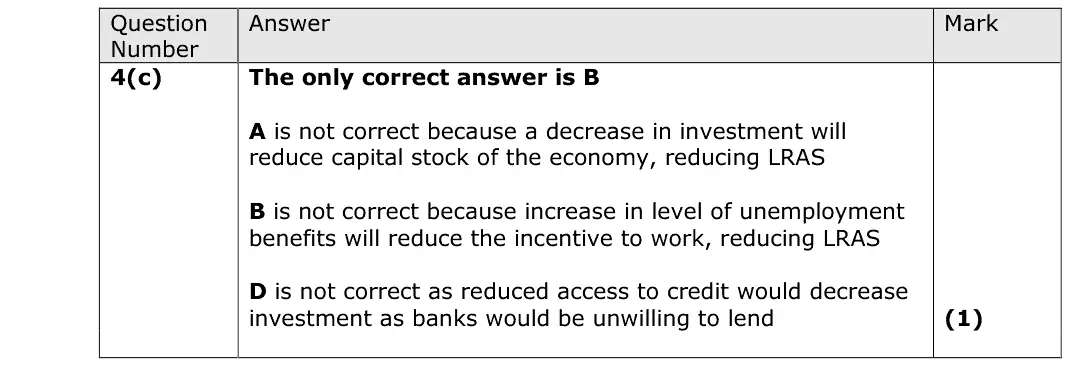
Price level SRAS P1 AD Real output Y1 (c) Which one of the following factors might have caused business investment in the UK to fall? (1) A A decrease in business expectations B A decrease in government regulations C An increase in the demand for exports D An increase in the rate of economic growth
June 2024 · AS Paper 2 · Q5(c) 1 mark Multiple choice fiscal and monetary policy
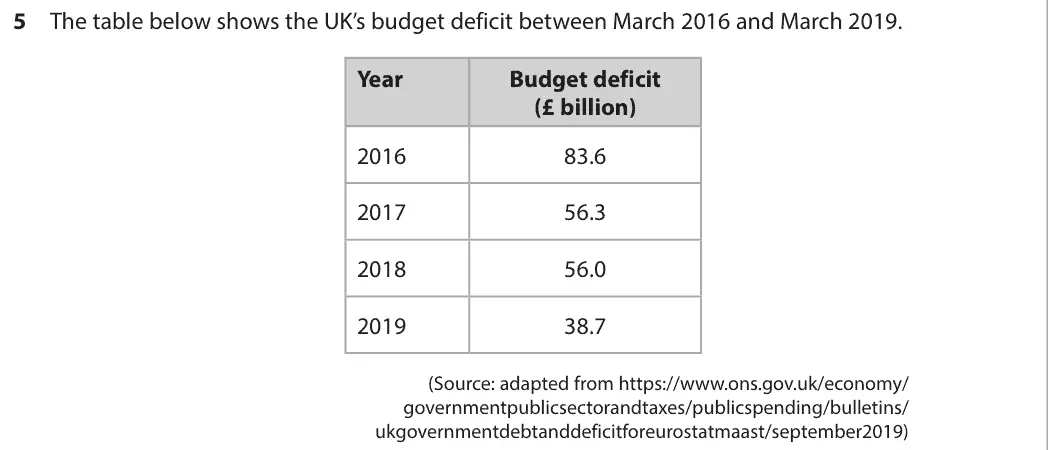
Data and extracts for question 55 The table below shows the UK’s budget deficit between March 2016 and March 2019. Year Budget deficit (£ billion) 2016 83.6 2017 56.3 2018 56.0 2019 38.7 (Source: adapted from https://www.ons.gov.uk/economy/ governmentpublicsectorandtaxes/publicspending/bulletins/ ukgovernmentdebtanddeficitforeurostatmaast/september2019)
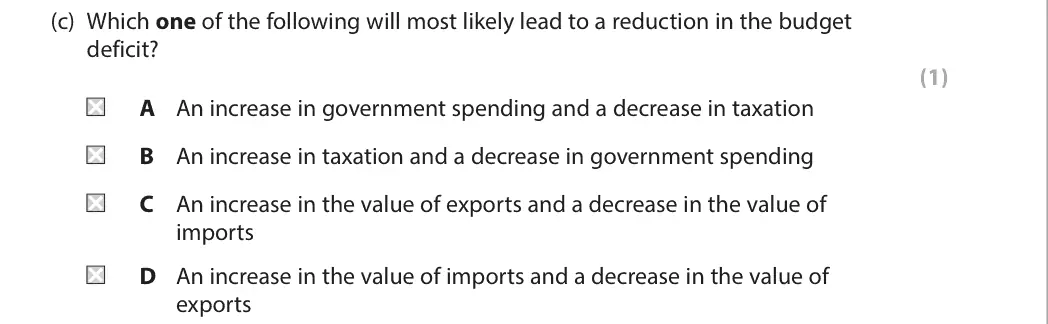
(c) Which one of the following will most likely lead to a reduction in the budget deficit? (1) A An increase in government spending and a decrease in taxation B An increase in taxation and a decrease in government spending C An increase in the value of exports and a decrease in the value of imports D An increase in the value of imports and a decrease in the value of exports
June 2024 · Paper 1 · Q1(b) 1 mark Multiple choice price elasticity of demand
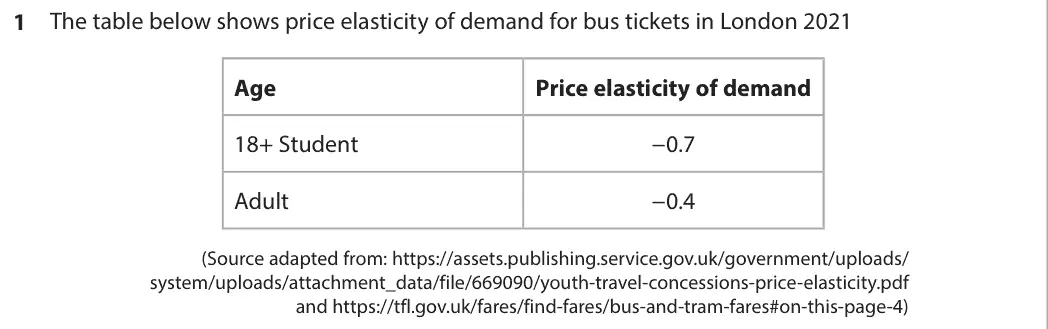
Data and extracts for question 11 The table below shows price elasticity of demand for bus tickets in London 2021 Age Price elasticity of demand 18+ Student -0.7 Adult -0.4 (Source adapted from: https://assets.publishing.service.gov.uk/government/uploads/ system/uploads/attachment_data/file/669090/youth-travel-concessions-price-elasticity.pdf and https://tfl.gov.uk/fares/find-fares/bus-and-tram-fares#on-this-page-4)
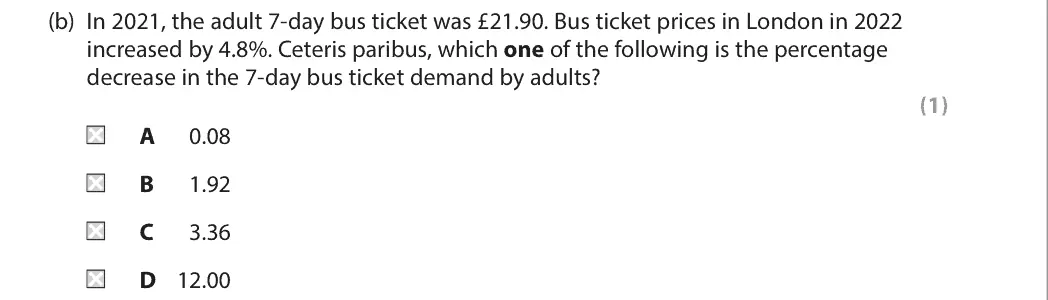
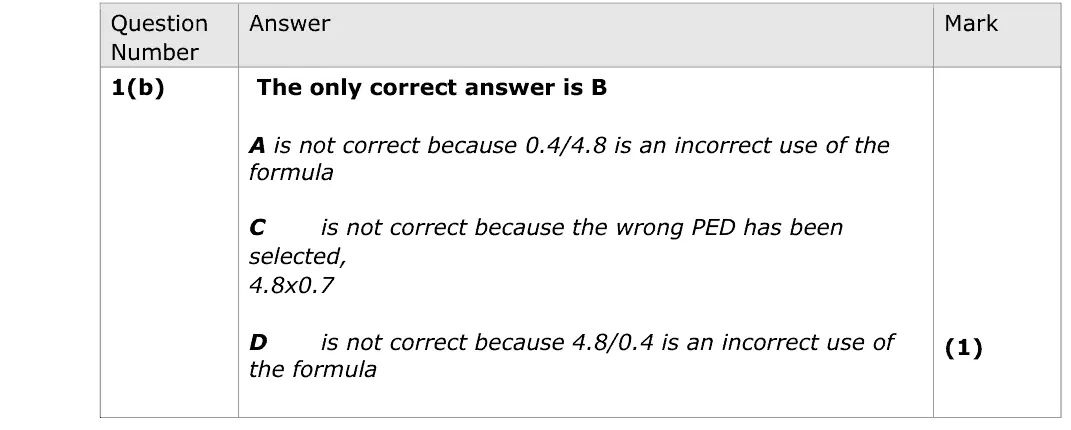
(b) In 2021, the adult 7-day bus ticket was £21.90. Bus ticket prices in London in 2022 increased by 4.8%. Ceteris paribus, which one of the following is the percentage decrease in the 7-day bus ticket demand by adults? (1) A 0.08 B 1.92 C 3.36 D 12.00
June 2024 · Paper 1 · Q2(b) 1 mark Multiple choice elasticity of supply
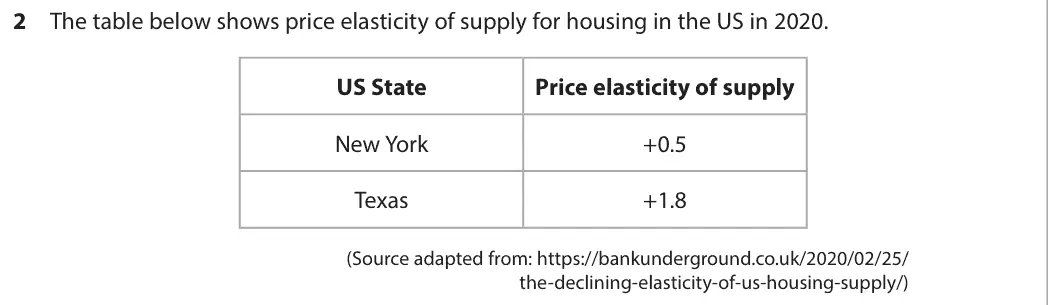
Data and extracts for question 22 The table below shows price elasticity of supply for housing in the US in 2020. US State Price elasticity of supply New York +0.5 Texas +1.8 (Source adapted from: https://bankunderground.co.uk/2020/02/25/ the-declining-elasticity-of-us-housing-supply/)
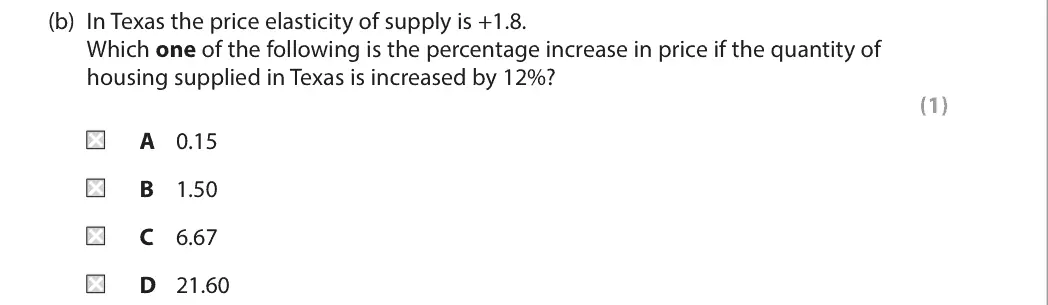
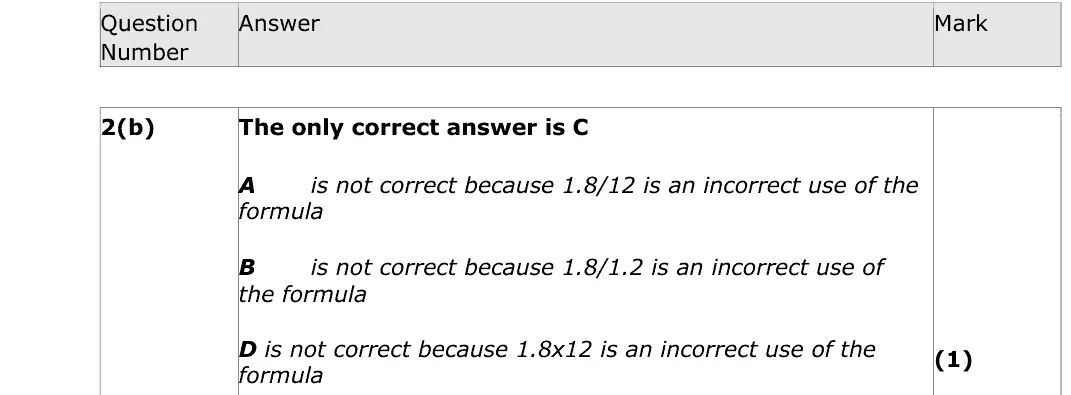
(b) In Texas the price elasticity of supply is +1.8. Which one of the following is the percentage increase in price if the quantity of housing supplied in Texas is increased by 12%? (1) A 0.15 B 1.50 C 6.67 D 21.60
June 2024 · Paper 1 · Q3(b) 1 mark Multiple choice business growth and objectives
Data and extracts for question 33 Peloton is a firm which makes exercise bikes. Peloton’s objective is to prioritise selling fitness services rather than to achieve short-term profit maximisation. (Source adapted from: https://www.forbes.com/sites/shelleykohan/2022/01/26/ peloton-prioritizes-access-and-acquisition-over-profits/?sh=13d8ee474f40 )
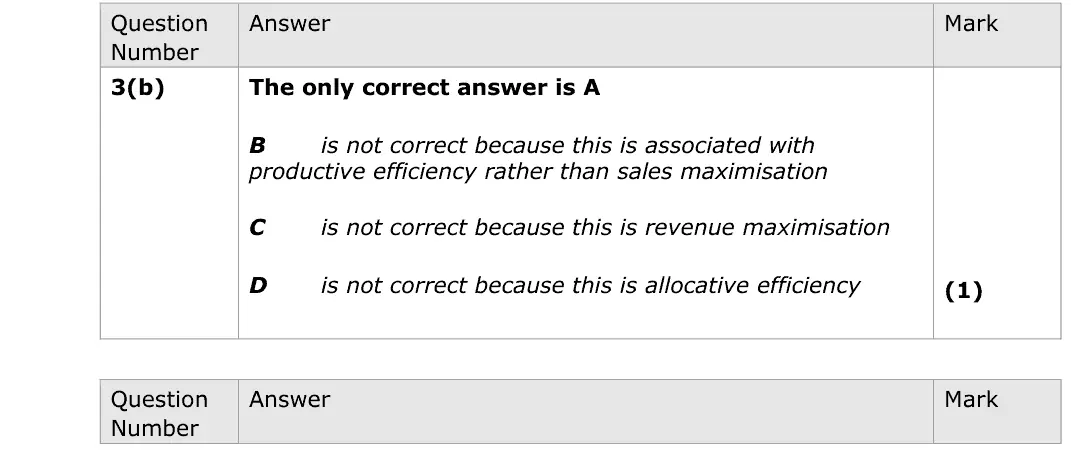
(b) If Peloton changes its objective to sales maximisation, then without making a loss, it operates at an output where: (1) A average cost equals average revenue B average cost is minimised C price elasticity of demand is equal to -1 D price equals marginal cost
June 2024 · Paper 1 · Q4(b) 1 mark Multiple choice government failure
Data and extracts for question 44 In 2022 the government announced that the maximum undergraduate tuition fee for universities in England will remain at £9 250 per year for the next two years. (Source adapted from: https://questions-statements.parliament.uk/ written-statements/detail/2021-10-21/HCWS339)
(b) Which one of the following is an example of government failure associated with the maximum price? (1) A Contraction in demand B Distortion of price signals C Excess supply D Extension in supply
June 2024 · Paper 1 · Q5(b) 1 mark Multiple choice oligopoly
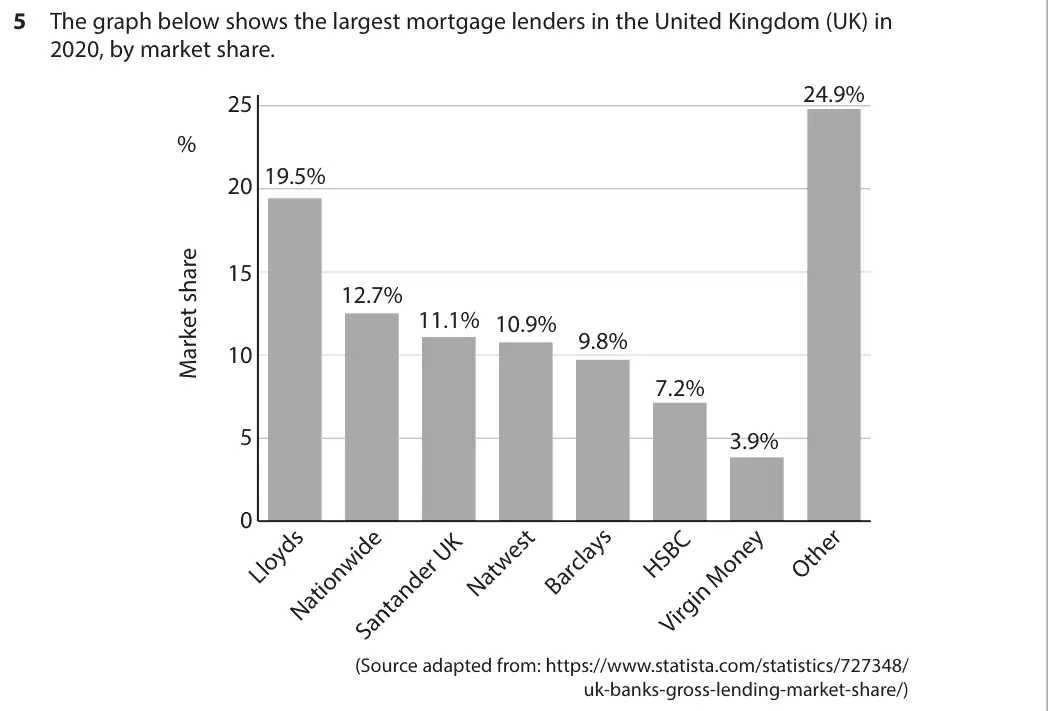
Data and extracts for question 55 The graph below shows the largest mortgage lenders in the United Kingdom (UK) in 2020, by market share. 24.9% 25 % 19.5% 20 15 12.7% 11.1% 10.9% 9.8% 10 7.2% 5 3.9% 0 (Source adapted from: https://www.statista.com/statistics/727348/ uk-banks-gross-lending-market-share/)
(b) The value of all mortgage loans was £1 601 billion at the end of 2020. Which one of the following is the value of Lloyds’ market share? (1) A £82 billion B £126 billion C £312 billion D £8 210 billion
June 2024 · Paper 2 · Q1(a) 1 mark Multiple choice aggregate demand
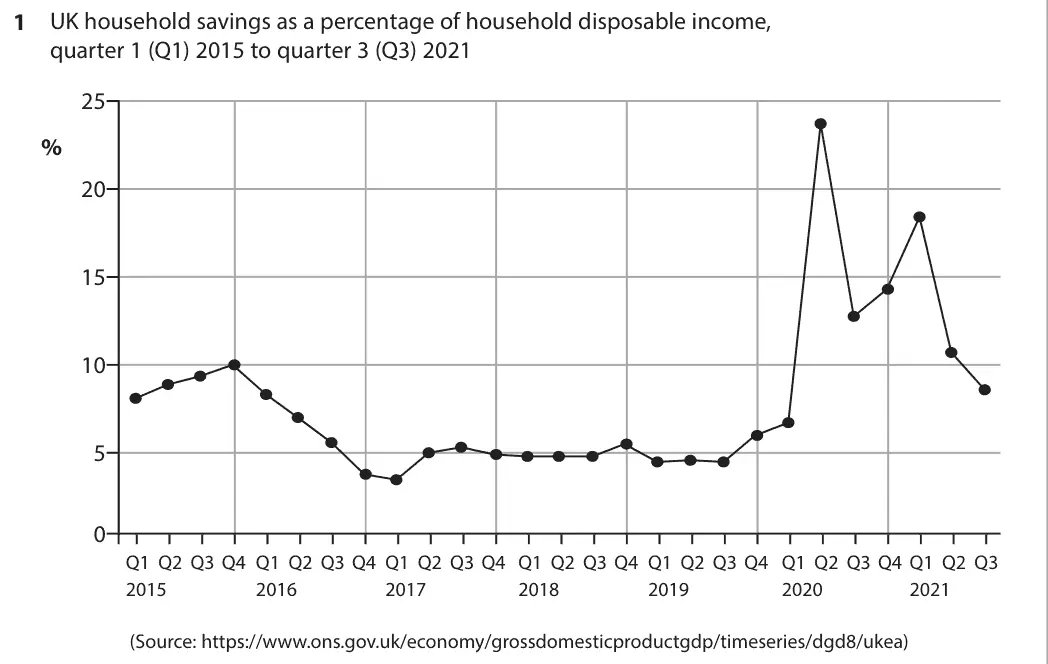
Data and extracts for question 11 UK household savings as a percentage of household disposable income, quarter 1 (Q1) 2015 to quarter 3 (Q3) 2021 25 % 20 15 10 5 0 Q1 Q2 Q3 Q4 Q1 Q2 Q3 Q4 Q1 Q2 Q3 Q4 Q1 Q2 Q3 Q4 Q1 Q2 Q3 Q4 Q1 Q2 Q3 Q4 Q1 Q2 Q3 2015 2016 2017 2018 2019 2020 2021 (Source: https://www.ons.gov.uk/economy/grossdomesticproductgdp/timeseries/dgd8/ukea)
(a) With reference to the chart above, which one of the following is correct? (1) UK household savings as a percentage of household disposable income: A fell in 2015 B fell throughout the time period shown C were the highest in Q1 2017 D were the highest in Q2 2020
June 2024 · Paper 2 · Q2(a) 1 mark Multiple choice aggregate demand
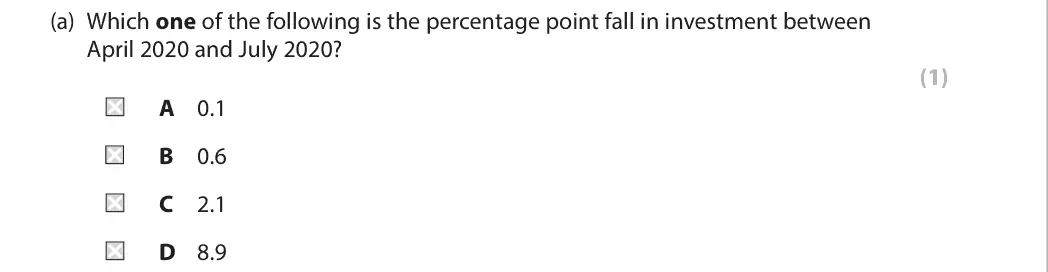
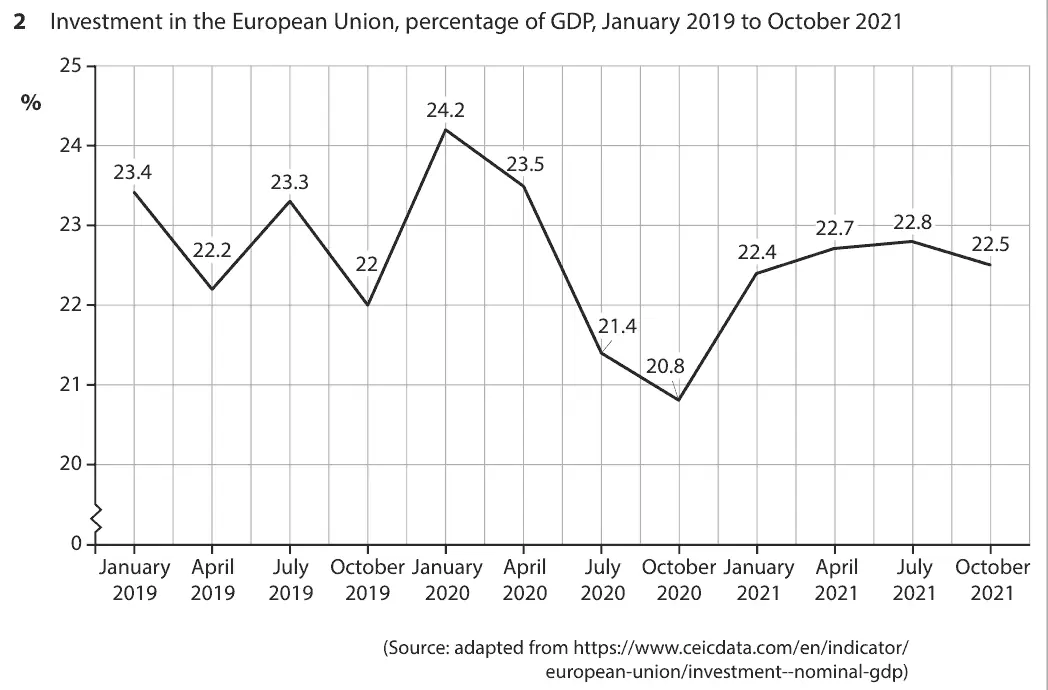
Data and extracts for question 22 Investment in the European Union, percentage of GDP, January 2019 to October 2021 25 % 24.2 24 23.5 23.4 23.3 22.8 23 22.7 22.5 22.2 22.4 22 22 21.4 20.8 21 20 0 January April July October January April July October January April July October 2019 2019 2019 2019 2020 2020 2020 2020 2021 2021 2021 2021 (Source: adapted from https://www.ceicdata.com/en/indicator/ european-union/investment--nominal-gdp)
(a) Which one of the following is the percentage point fall in investment between April 2020 and July 2020? (1) A 0.1 B 0.6 C 2.1 D 8.9
June 2024 · Paper 2 · Q3(b) 1 mark Multiple choice financial sector
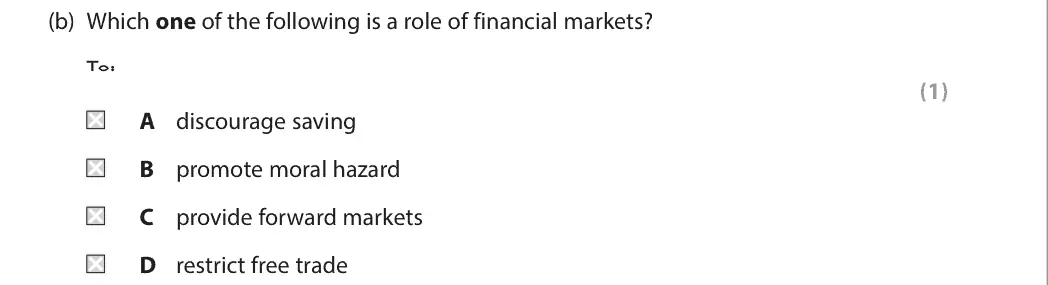
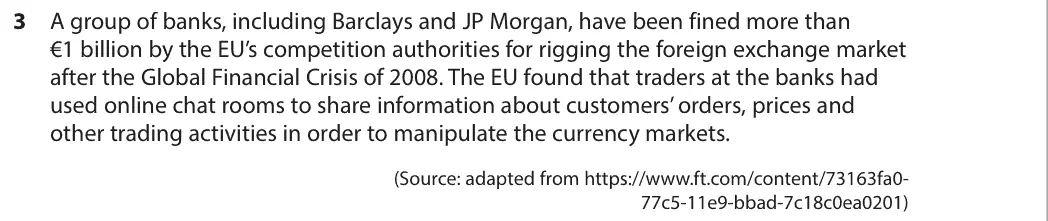
Data and extracts for question 33 A group of banks, including Barclays and JP Morgan, have been fined more than €1 billion by the EU’s competition authorities for rigging the foreign exchange market after the Global Financial Crisis of 2008. The EU found that traders at the banks had used online chat rooms to share information about customers’ orders, prices and other trading activities in order to manipulate the currency markets. (Source: adapted from https://www.ft.com/content/73163fa0- 77c5-11e9-bbad-7c18c0ea0201)
(b) Which one of the following is a role of financial markets? To: (1) A discourage saving B promote moral hazard C provide forward markets D restrict free trade
June 2024 · Paper 2 · Q4(a) 1 mark Multiple choice economic growth and the trade cycle
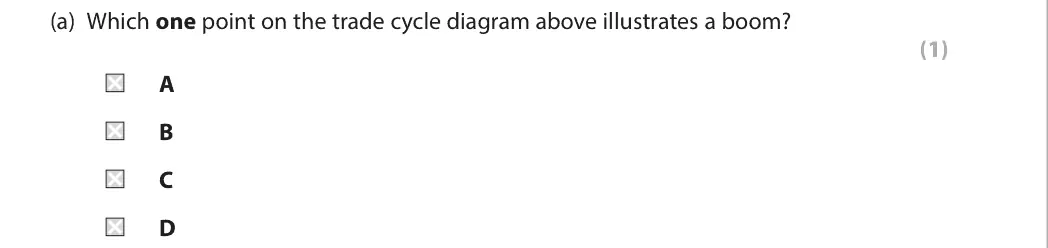
Data and extracts for question 44 Real GDP Trend GDP growth C Actual GDP growth D A B Time
(a) Which one point on the trade cycle diagram above illustrates a boom? (1) A B C D
June 2024 · Paper 2 · Q5(b) 1 mark Multiple choice globalisation and trade
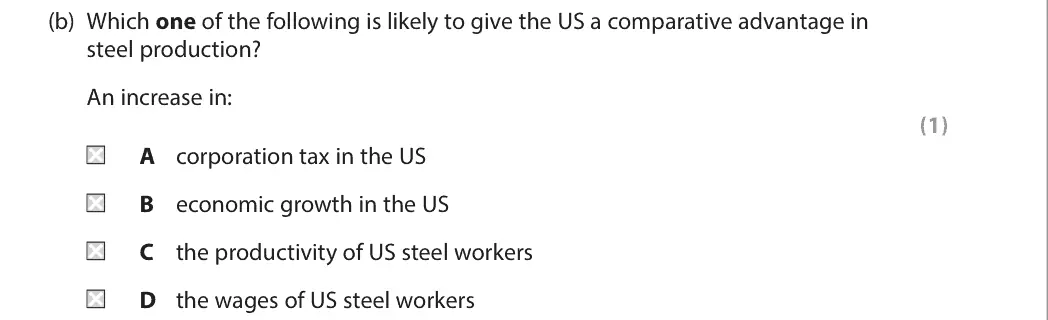
Data and extracts for question 55 In March 2018 the US imposed a tariff of 25% on steel imports from the UK. (Source: adapted from https://www.reuters.com/business/us-uk-announce- plans-formal-talks-metals-tariffs-wednesday-sources-2022-01-19/)
(b) Which one of the following is likely to give the US a comparative advantage in steel production? An increase in: (1) A corporation tax in the US B economic growth in the US C the productivity of US steel workers D the wages of US steel workers
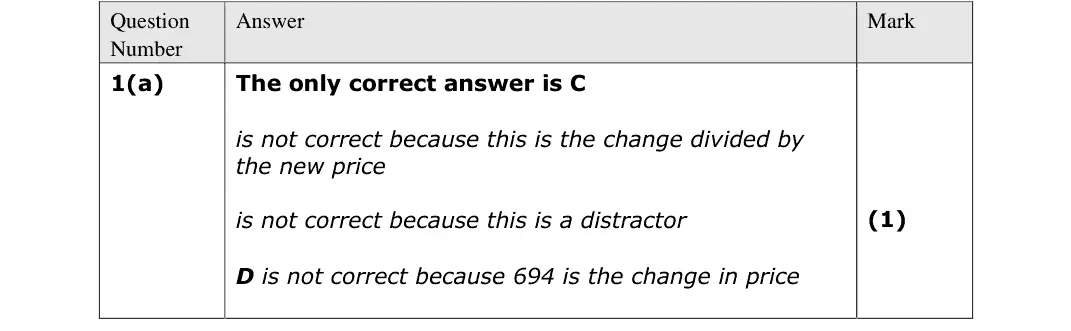
June 2023 · AS Paper 1 · Q1(a) 1 mark Multiple choice government intervention in markets
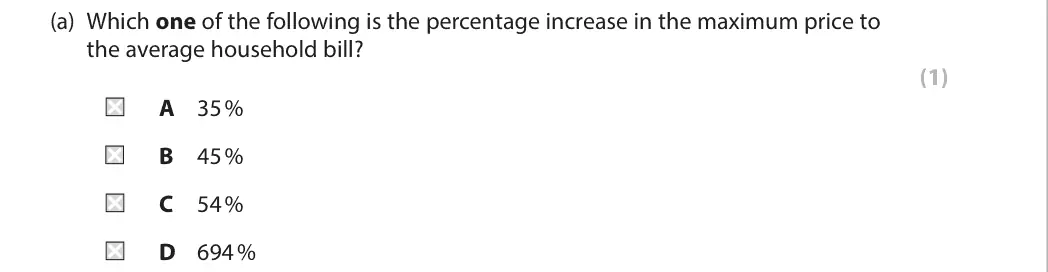
Data and extracts for question 11 In 2021, energy regulator Ofgem announced that the maximum price of energy will rise from £ 1 277 to £ 1 971 a year, for the average household bill. (Source: adapted from https://www.moneysavingexpert.com/ utilities/what-is-the-energy-price-cap/)
(a) Which one of the following is the percentage increase in the maximum price to the average household bill? (1) A 35 % B 45 % C 54 % D 694 %
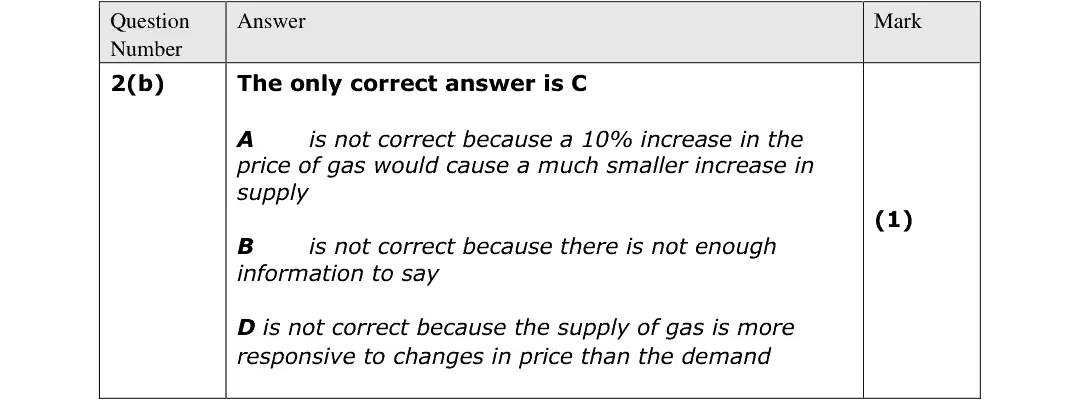
June 2023 · AS Paper 1 · Q2(b) 1 mark Multiple choice price elasticity of demandelasticity of supply
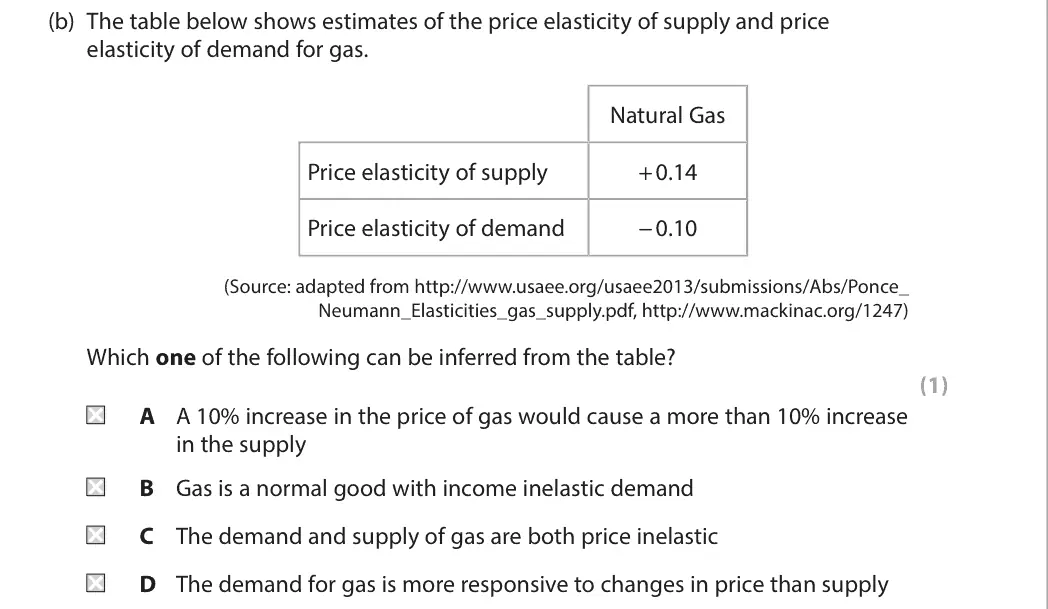
Data and extracts for question 22 The world’s largest producer of natural gas is the USA. In 2021 production fell even though the price increased.
(b) The table below shows estimates of the price elasticity of supply and price elasticity of demand for gas. Natural Gas Price elasticity of supply + 0.14 Price elasticity of demand - 0.10 (Source: adapted from http://www.usaee.org/usaee2013/submissions/Abs/Ponce_ Neumann_Elasticities_gas_supply.pdf, http://www.mackinac.org/1247) Which one of the following can be inferred from the table? (1) A A 10% increase in the price of gas would cause a more than 10% increase in the supply B Gas is a normal good with income inelastic demand C The demand and supply of gas are both price inelastic D The demand for gas is more responsive to changes in price than supply
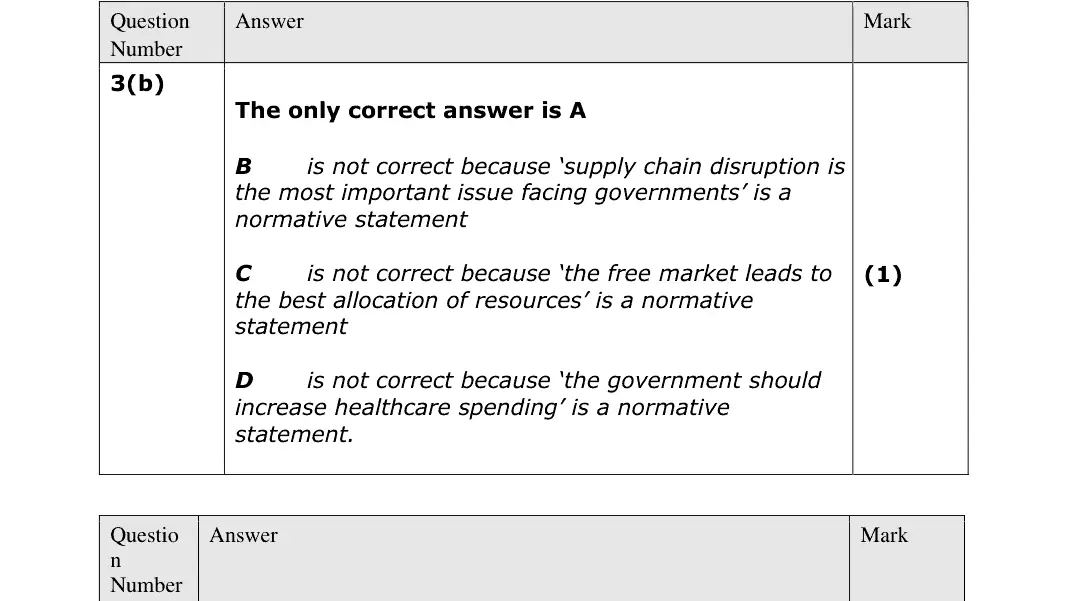
June 2023 · AS Paper 1 · Q3(b) 1 mark Multiple choice nature of economics
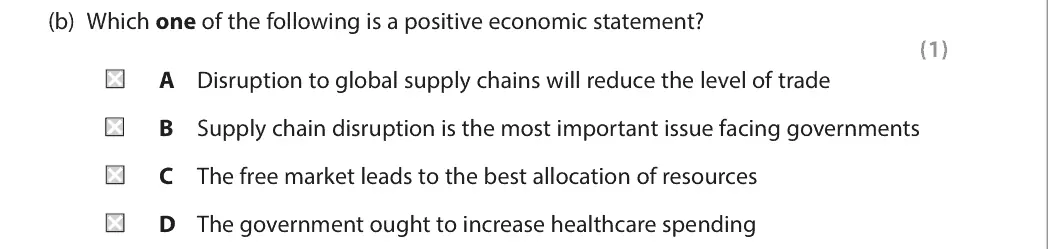
Data and extracts for question 33 Disruption in the supply chains of essential goods and shortages of key medical products during the global health crisis have highlighted the links between countries and renewed the debate on the advantages and disadvantages of specialisation. (Source: adapted from https://commonslibrary.parliament.uk/research-briefings/cbp-8978/)
(b) Which one of the following is a positive economic statement? (1) A Disruption to global supply chains will reduce the level of trade B Supply chain disruption is the most important issue facing governments C The free market leads to the best allocation of resources D The government ought to increase healthcare spending
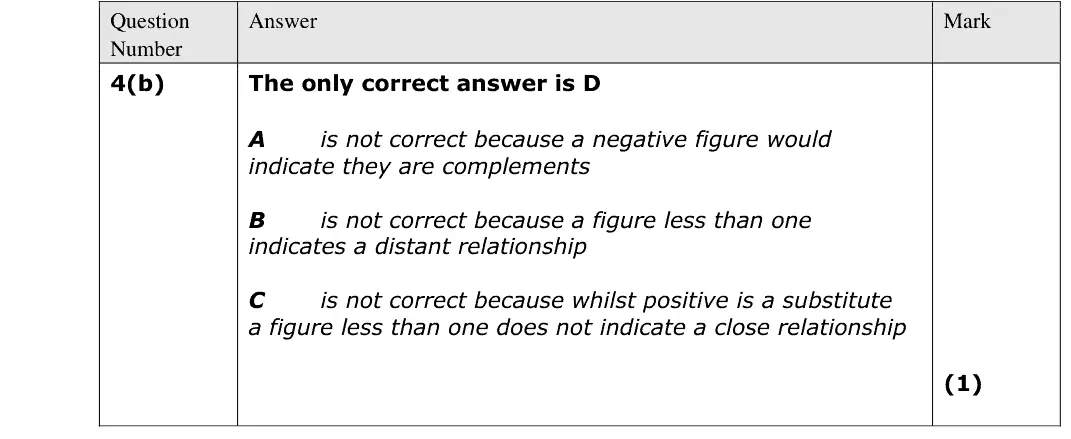
June 2023 · AS Paper 1 · Q4(b) 1 mark Multiple choice price elasticity of demand
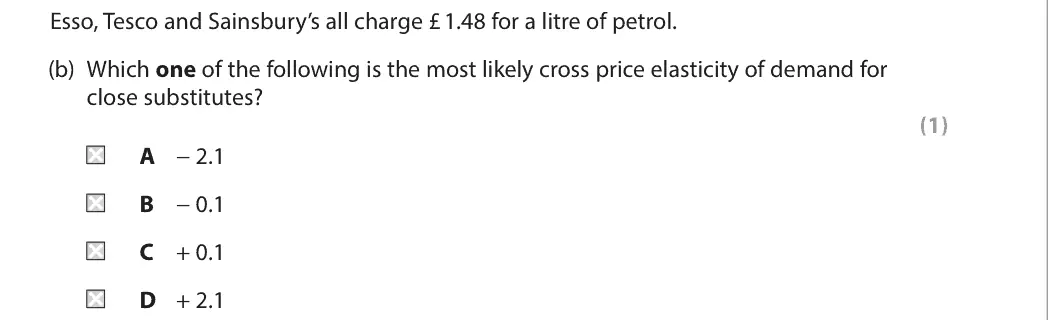
Data and extracts for question 44 During 2021 the UK experienced severe shortages of crisps, petrol and many other items. (Source: adapted from https://www.independent.co.uk/news/business/news/ uk-shortages-covid-brexit-supply-chain-b1968458.html)
Esso, Tesco and Sainsbury’s all charge £ 1.48 for a litre of petrol. (b) Which one of the following is the most likely cross price elasticity of demand for close substitutes? (1) A - 2.1 B - 0.1 C + 0.1 D + 2.1
June 2023 · AS Paper 1 · Q5(c) 1 mark Multiple choice economic systems
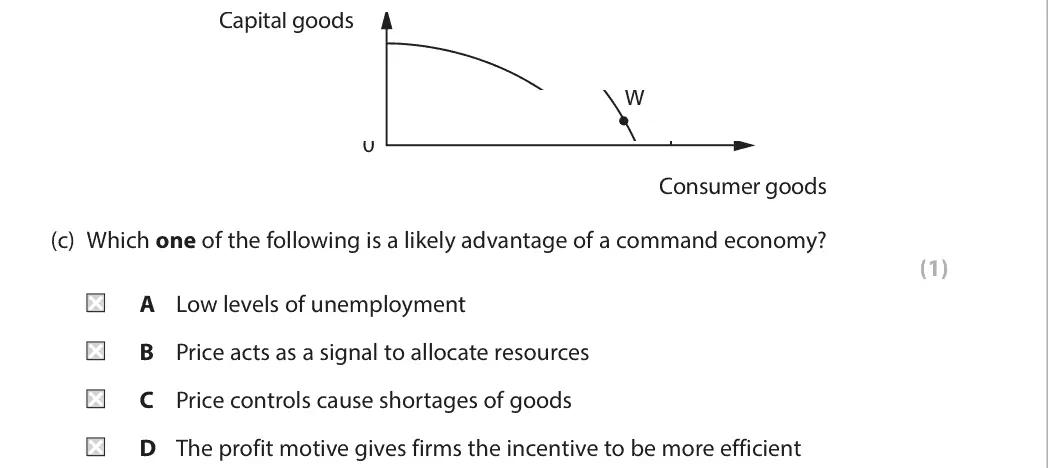
Data and extracts for question 55 During the global health crisis, 11.7 million jobs were furloughed, costing the UK Government £70 billion. This meant people were paid by the government 80% of their wages even though they did not work. Some private sector employers continued to pay the remaining 20 %. (Source: adapted from https://commonslibrary.parliament.uk/ examining-the-end-of-the-furlough-scheme)
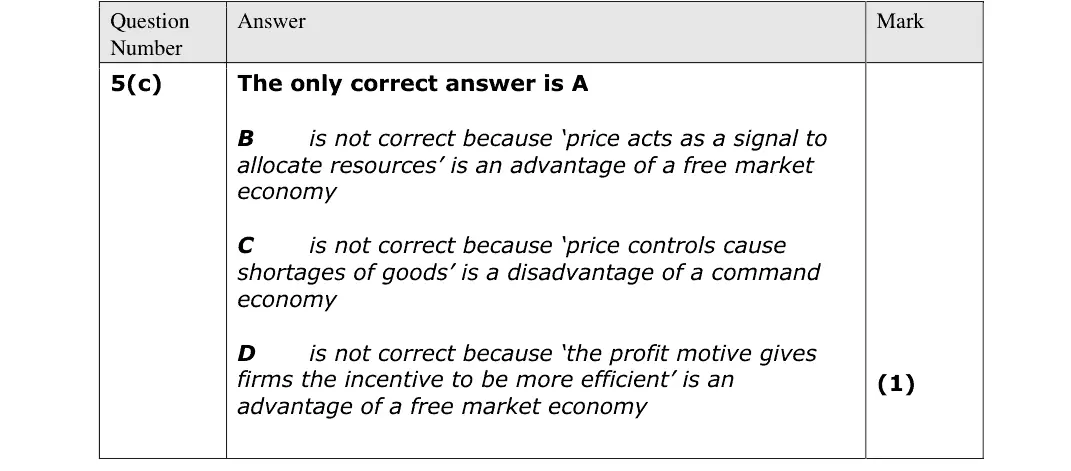
Capital goods W 0 Consumer goods (c) Which one of the following is a likely advantage of a command economy? (1) A Low levels of unemployment B Price acts as a signal to allocate resources C Price controls cause shortages of goods D The profit motive gives firms the incentive to be more efficient
June 2023 · AS Paper 2 · Q1(b) 1 mark Multiple choice supply side policies
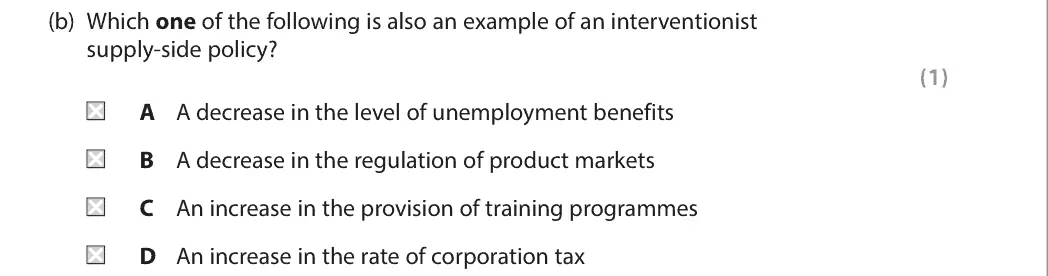
Data and extracts for question 11 Between 2019 and 2020 the UK Government increased its expenditure on healthcare from £175.1 billion to £219.9 billion.
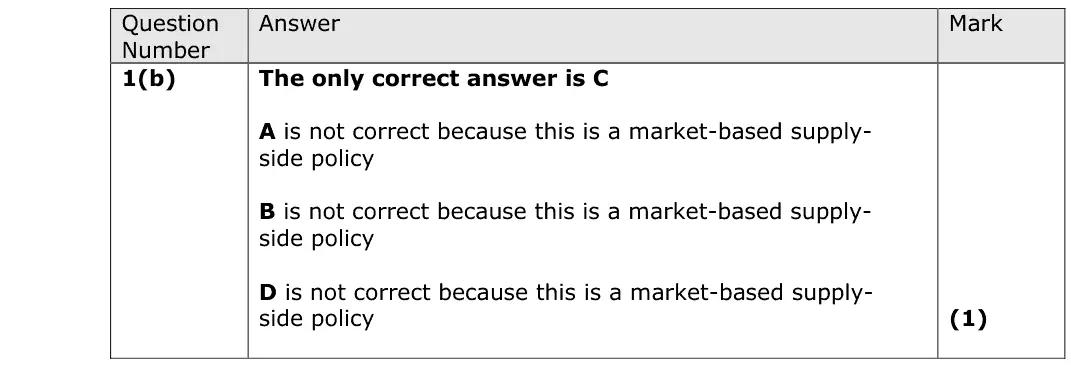
(b) Which one of the following is also an example of an interventionist supply-side policy? (1) A A decrease in the level of unemployment benefits B A decrease in the regulation of product markets C An increase in the provision of training programmes D An increase in the rate of corporation tax
June 2023 · AS Paper 2 · Q2(b) 1 mark Multiple choice measuring economic growth
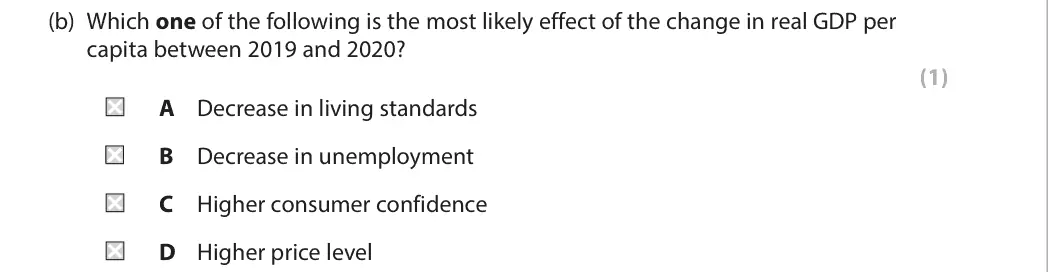
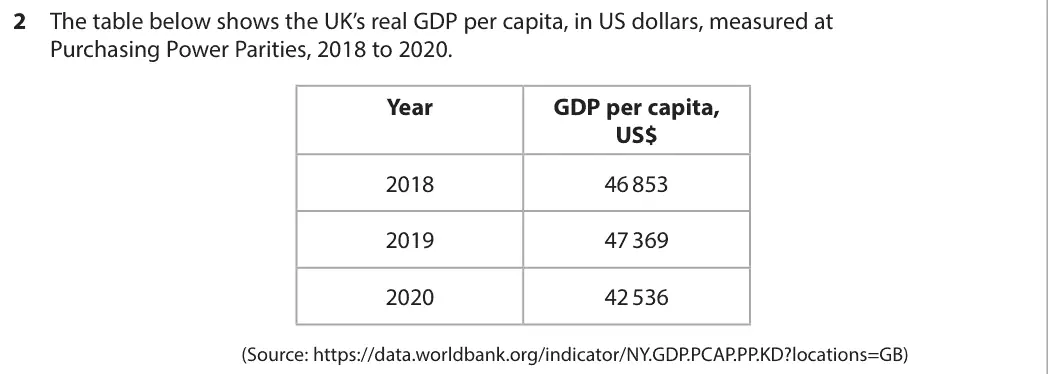
Data and extracts for question 22 The table below shows the UK’s real GDP per capita, in US dollars, measured at Purchasing Power Parities, 2018 to 2020. Year GDP per capita, US$ 2018 46 853 2019 47 369 2020 42 536 (Source: https://data.worldbank.org/indicator/NY.GDP.PCAP.PP.KD?locations=GB)
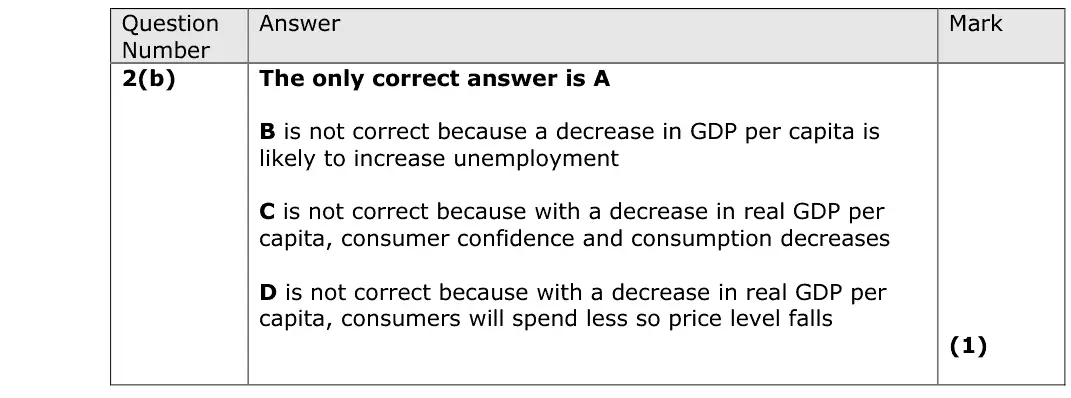
(b) Which one of the following is the most likely effect of the change in real GDP per capita between 2019 and 2020? (1) A Decrease in living standards B Decrease in unemployment C Higher consumer confidence D Higher price level
June 2023 · AS Paper 2 · Q3(a) 1 mark Multiple choice fiscal and monetary policy
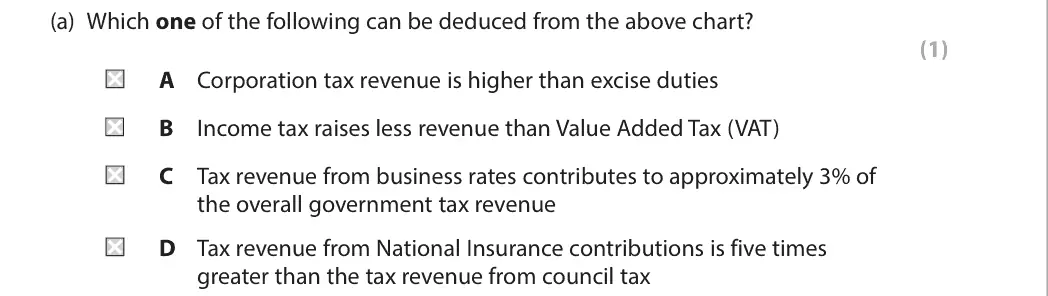
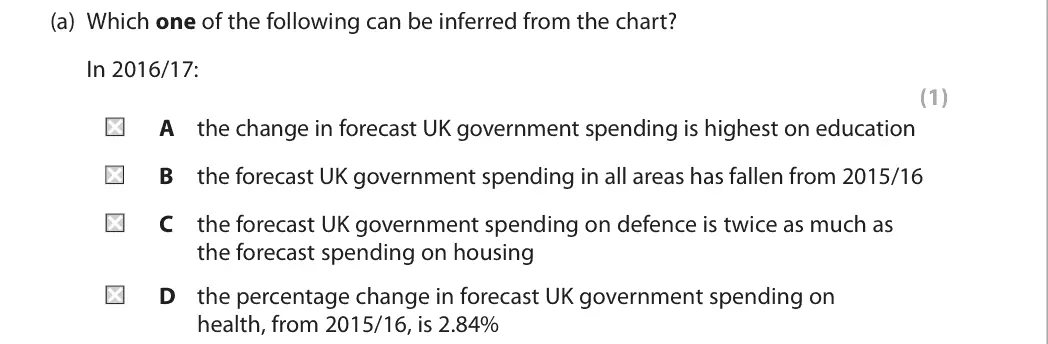
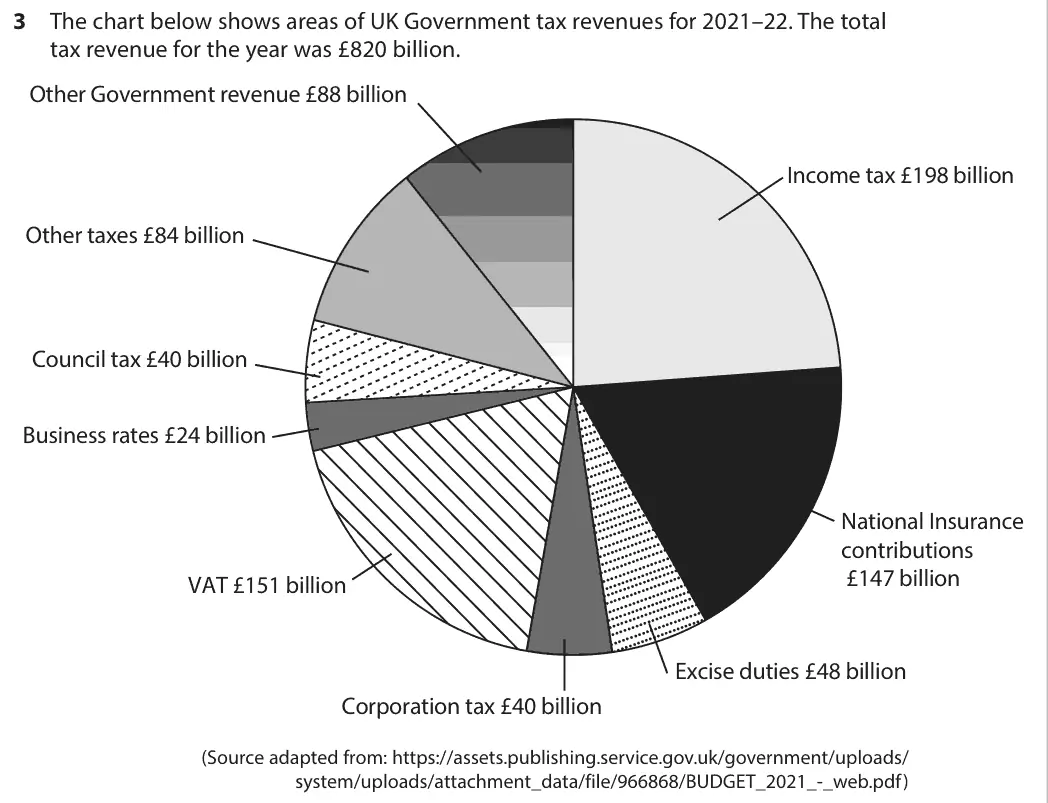
Data and extracts for question 33 The chart below shows areas of UK Government tax revenues for 2021–22. The total tax revenue for the year was £820 billion. Other Government revenue £88 billion Income tax £198 billion Other taxes £84 billion Council tax £40 billion Business rates £24 billion National Insurance contributions £147 billion VAT £151 billion Excise duties £48 billion Corporation tax £40 billion (Source adapted from: https://assets.publishing.service.gov.uk/government/uploads/ system/uploads/attachment_data/file/966868/BUDGET_2021_-_web.pdf)
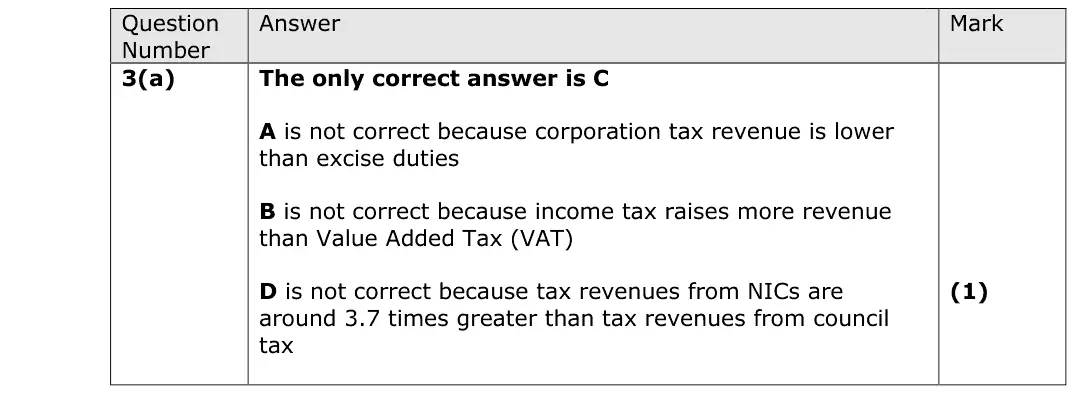
(a) Which one of the following can be deduced from the above chart? (1) A Corporation tax revenue is higher than excise duties B Income tax raises less revenue than Value Added Tax (VAT) C Tax revenue from business rates contributes to approximately 3% of the overall government tax revenue D Tax revenue from National Insurance contributions is five times greater than the tax revenue from council tax
June 2023 · AS Paper 2 · Q4(b) 1 mark Multiple choice aggregate demand
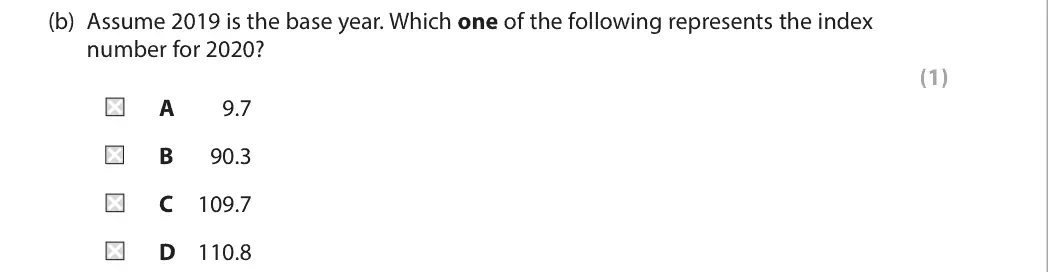
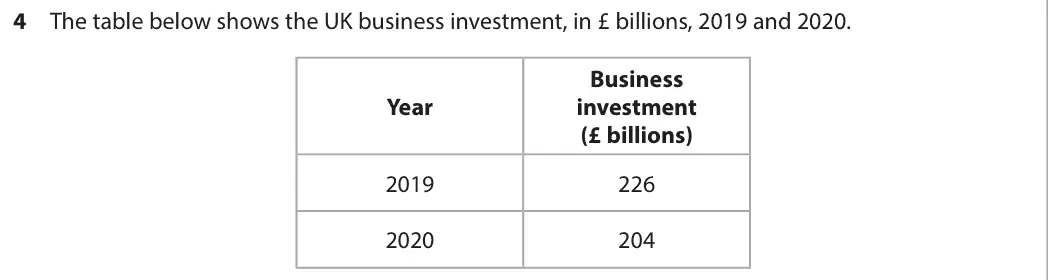
Data and extracts for question 44 The table below shows the UK business investment, in £ billions, 2019 and 2020. Business Year investment (£ billions) 2019 226 2020 204
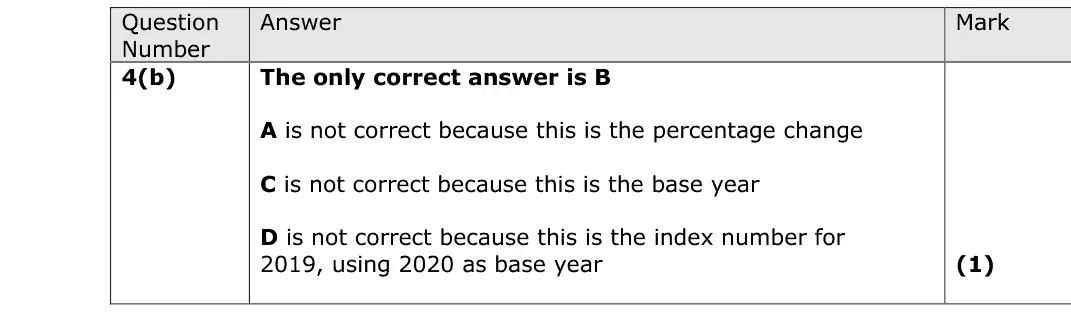
(b) Assume 2019 is the base year. Which one of the following represents the index number for 2020? (1) A 9.7 B 90.3 C 109.7 D 110.8
June 2023 · AS Paper 2 · Q5(a) 1 mark Multiple choice measuring economic growth
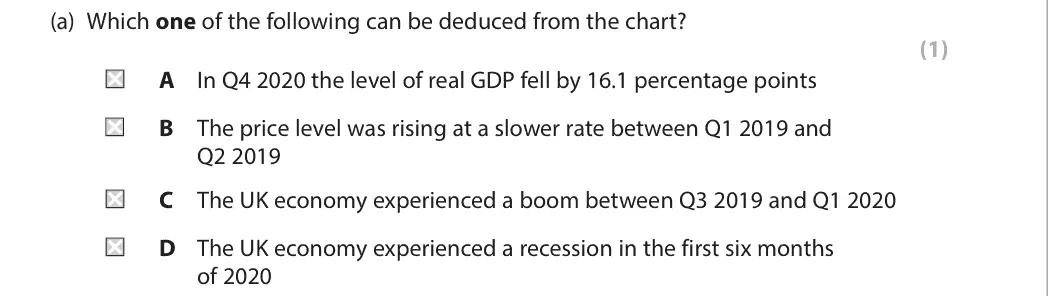
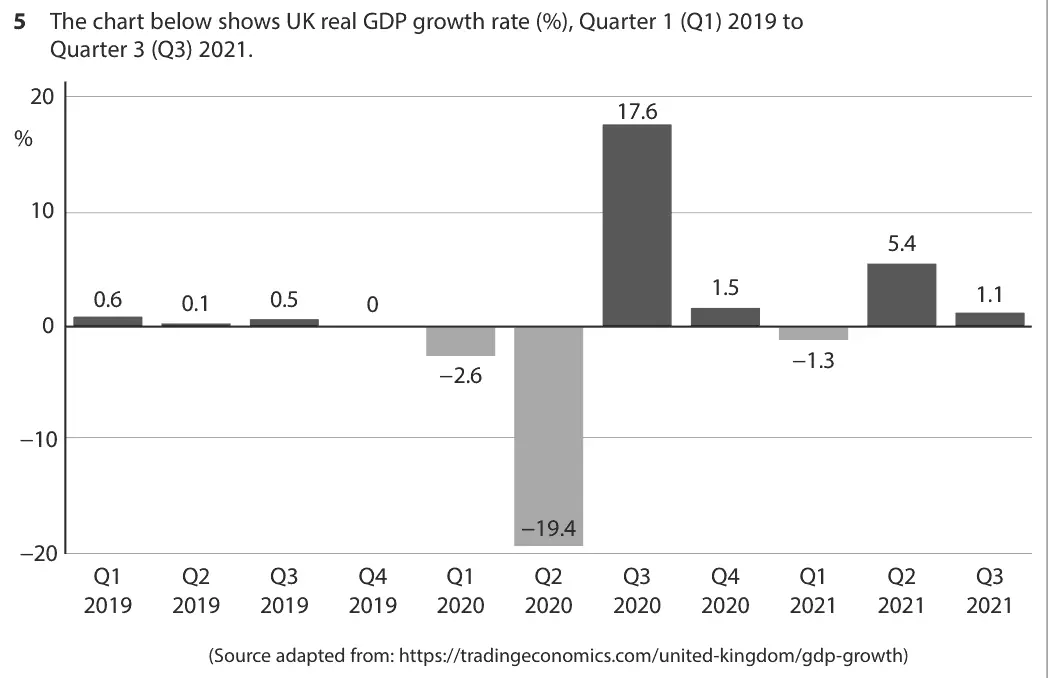
Data and extracts for question 55 The chart below shows UK real GDP growth rate (%), Quarter 1 (Q1) 2019 to Quarter 3 (Q3) 2021. 20 17.6 % 10 5.4 1.5 1.1 0.6 0.5 0.1 0 0 -1.3 -2.6 -10 -19.4 -20 Q1 Q2 Q3 Q4 Q1 Q2 Q3 Q4 Q1 Q2 Q3 2019 2019 2019 2019 2020 2020 2020 2020 2021 2021 2021 (Source adapted from: https://tradingeconomics.com/united-kingdom/gdp-growth)
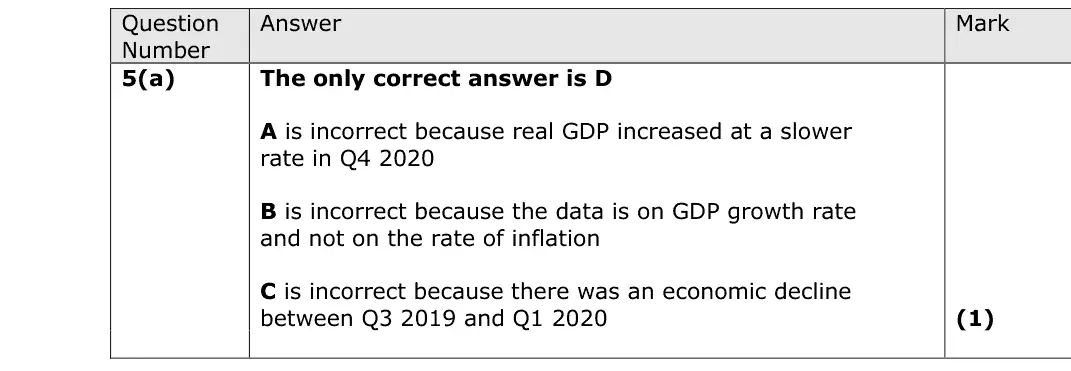
(a) Which one of the following can be deduced from the chart? (1) A In Q4 2020 the level of real GDP fell by 16.1 percentage points B The price level was rising at a slower rate between Q1 2019 and Q2 2019 C The UK economy experienced a boom between Q3 2019 and Q1 2020 D The UK economy experienced a recession in the first six months of 2020
June 2023 · Paper 1 · Q1(b) 1 mark AO1=1 Multiple choice economic systems
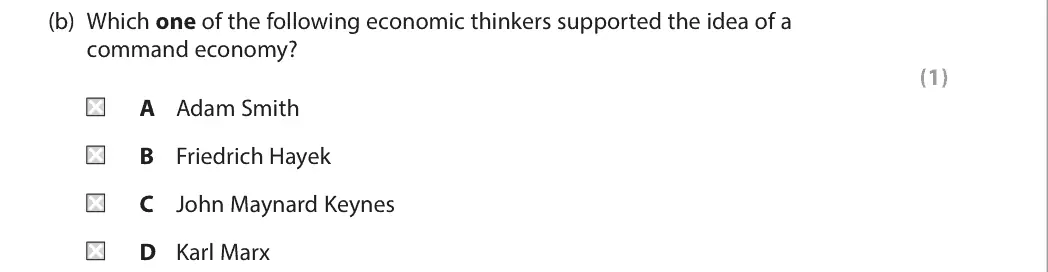
Data and extracts for question 11 In a major reform of its command economy, the Cuban government will allow small private businesses to operate in most fields. Free market economists have long called for the role of small business to be expanded to help jump‑start the economy and to create jobs. (Source adapted from: https://www.telegraph.co.uk/news/2021/02/07/ cuba-allows-massive-expansion-private-businesses/)
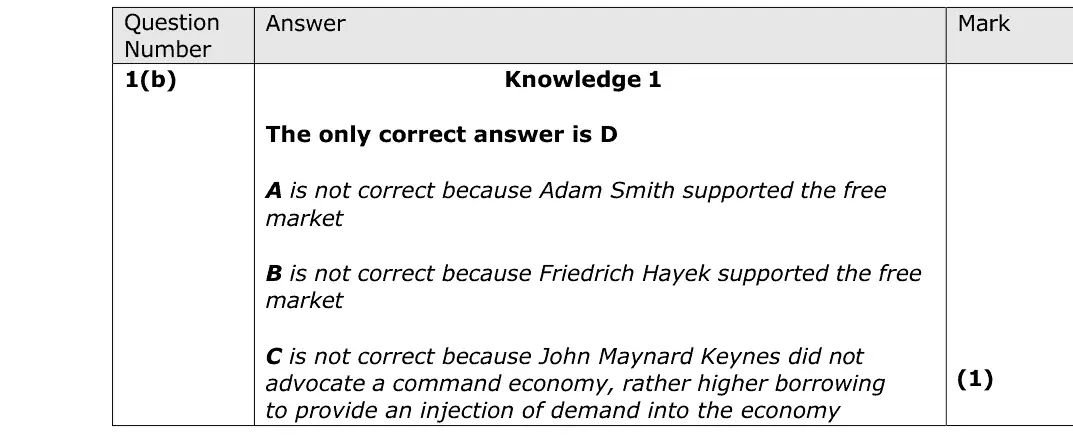
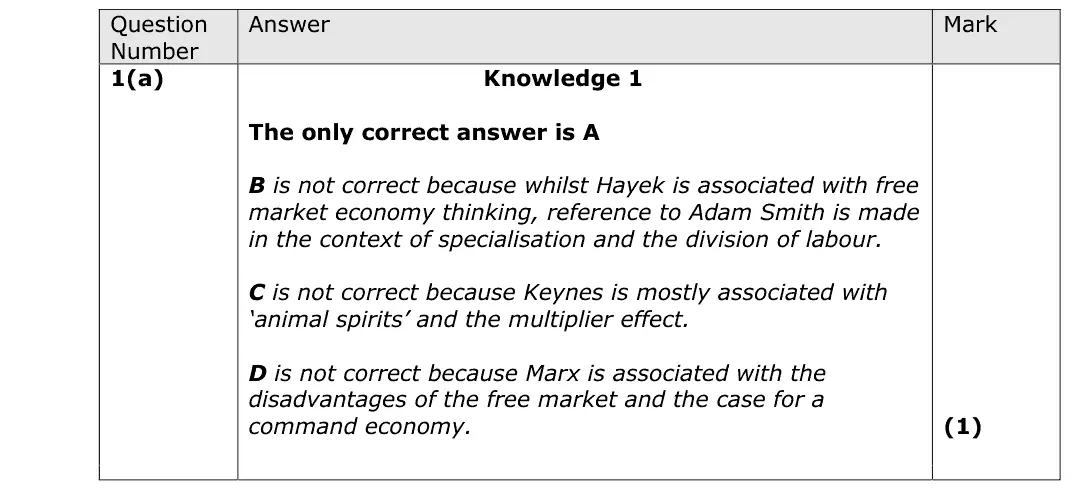
(b) Which one of the following economic thinkers supported the idea of a command economy? (1) A Adam Smith B Friedrich Hayek C John Maynard Keynes D Karl Marx
June 2023 · Paper 1 · Q2(c) 1 mark AO1=1 Multiple choice production possibility frontiers
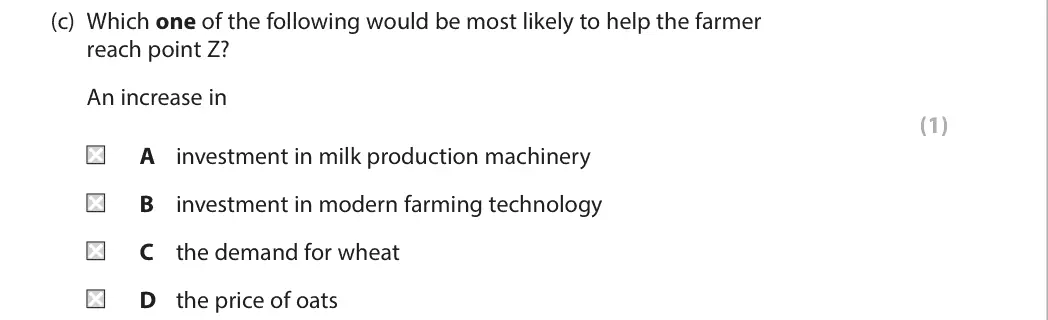
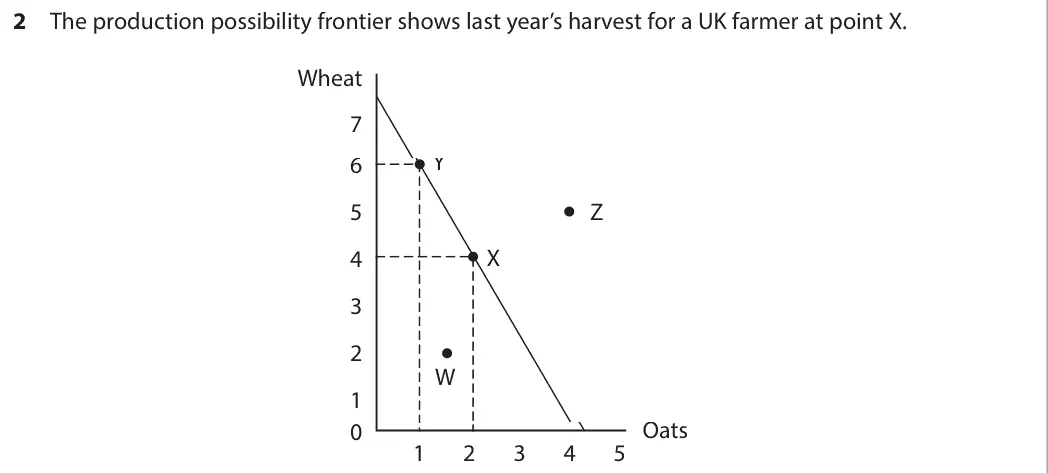
Data and extracts for question 22 The production possibility frontier shows last year’s harvest for a UK farmer at point X. Wheat 7 Y 6 Z 5 4 X 3 2 W 1 Oats 0 1 2 3 4 5
(c) Which one of the following would be most likely to help the farmer reach point Z? An increase in (1) A investment in milk production machinery B investment in modern farming technology C the demand for wheat D the price of oats
June 2023 · Paper 1 · Q3(a) 1 mark AO2=1 Multiple choice price elasticity of demand
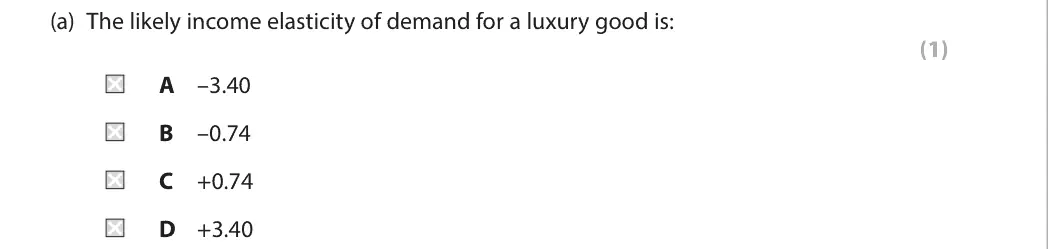
Data and extracts for question 33 A luxury brownie baker is faced with falling demand as incomes fall.
(a) The likely income elasticity of demand for a luxury good is: (1) A –3.40 B –0.74 C +0.74 D +3.40
June 2023 · Paper 1 · Q4(c) 1 mark AO2=1 Multiple choice price mechanism and surplus
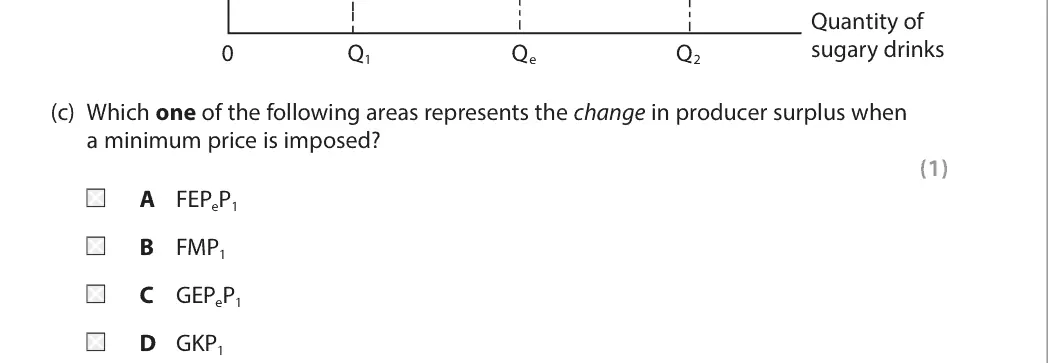
Data and extracts for question 44 An annual season ticket for a train journey between London and Reading is planned to increase from £5 044 to £5 664 in 2023. (Source adapted from: https://commonslibrary.parliament.uk/ how-much-could-rail-fares-increase-by-in-2023-and-why)
Quantity of sugary drinks Qe Q2 Q1 0 (c) Which one of the following areas represents the change in producer surplus when a minimum price is imposed? (1) A FEPeP1 B FMP1 C GEPeP1 D GKP1
June 2023 · Paper 1 · Q5(a) 1 mark AO2=1 Multiple choice labour market
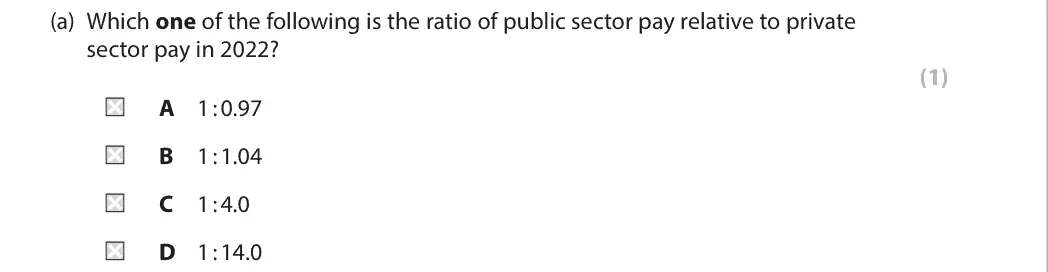
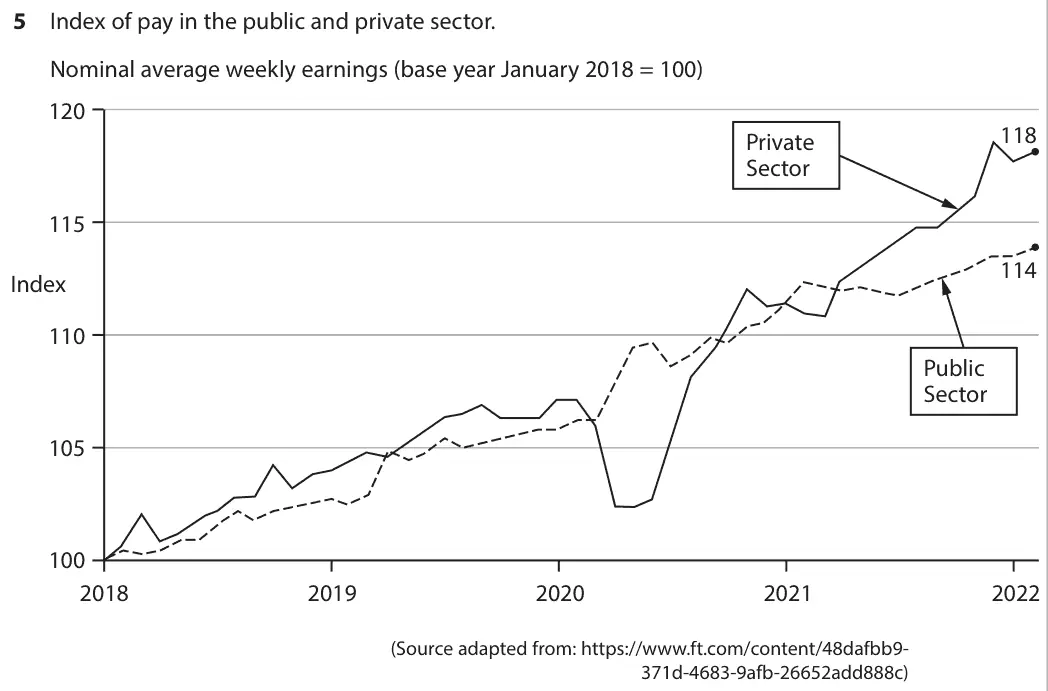
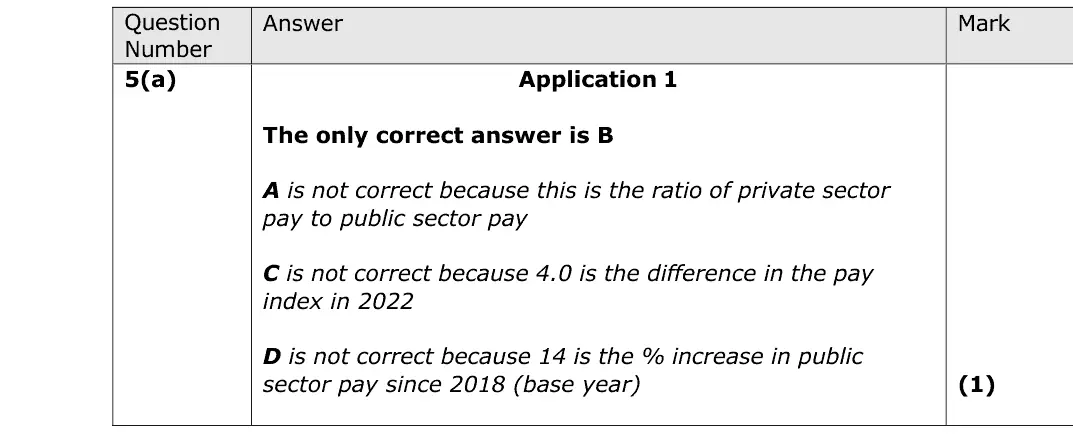
Data and extracts for question 55 Index of pay in the public and private sector. Nominal average weekly earnings (base year January 2018 = 100) 120 118 Private Sector 115 114 Index 110 Public Sector 105 100 2018 2019 2020 2021 2022 (Source adapted from: https://www.ft.com/content/48dafbb9- 371d-4683-9afb-26652add888c)
(a) Which one of the following is the ratio of public sector pay relative to private sector pay in 2022? (1) A 1 : 0.97 B 1 : 1.04 C 1 : 4.0 D 1 : 14.0
June 2023 · Paper 2 · Q1(b) 1 mark Multiple choice fiscal and monetary policy
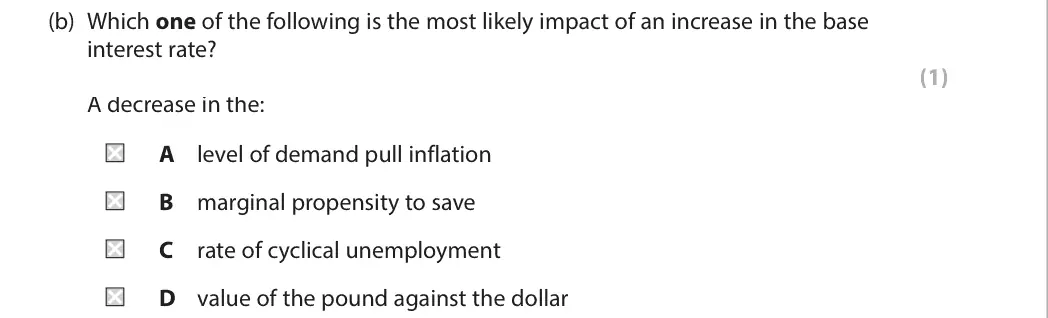
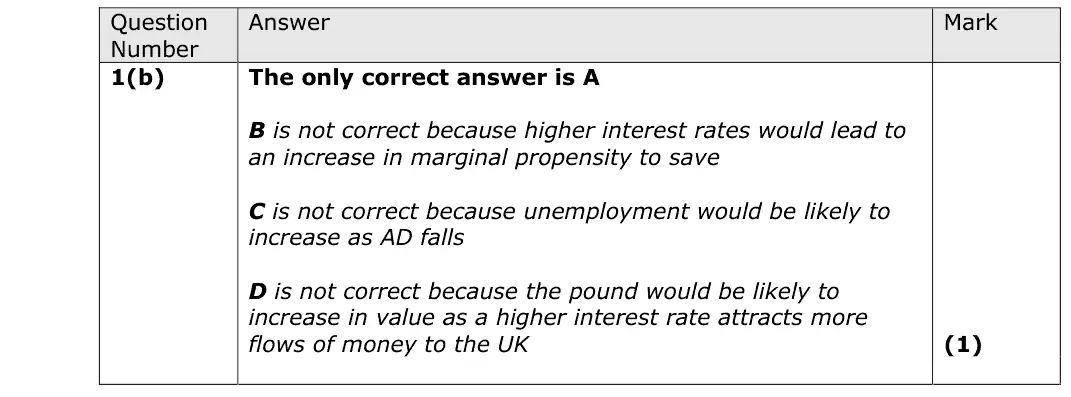
Data and extracts for question 11 In September 2022 the Bank of England increased the base interest rate from 1.75% to 2.25%. (Source: adapted from https://www.bankofengland.co.uk/boeapps/database/Bank-Rate.asp)
(b) Which one of the following is the most likely impact of an increase in the base interest rate? (1) A decrease in the: A level of demand pull inflation B marginal propensity to save C rate of cyclical unemployment D value of the pound against the dollar
June 2023 · Paper 2 · Q2(a) 1 mark Multiple choice unemployment
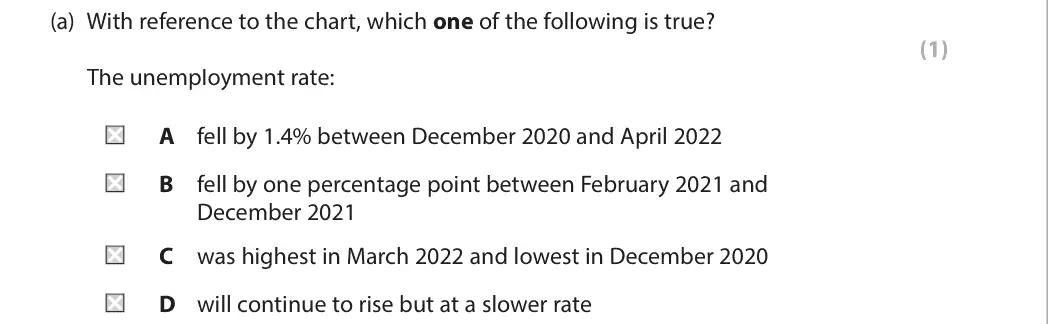
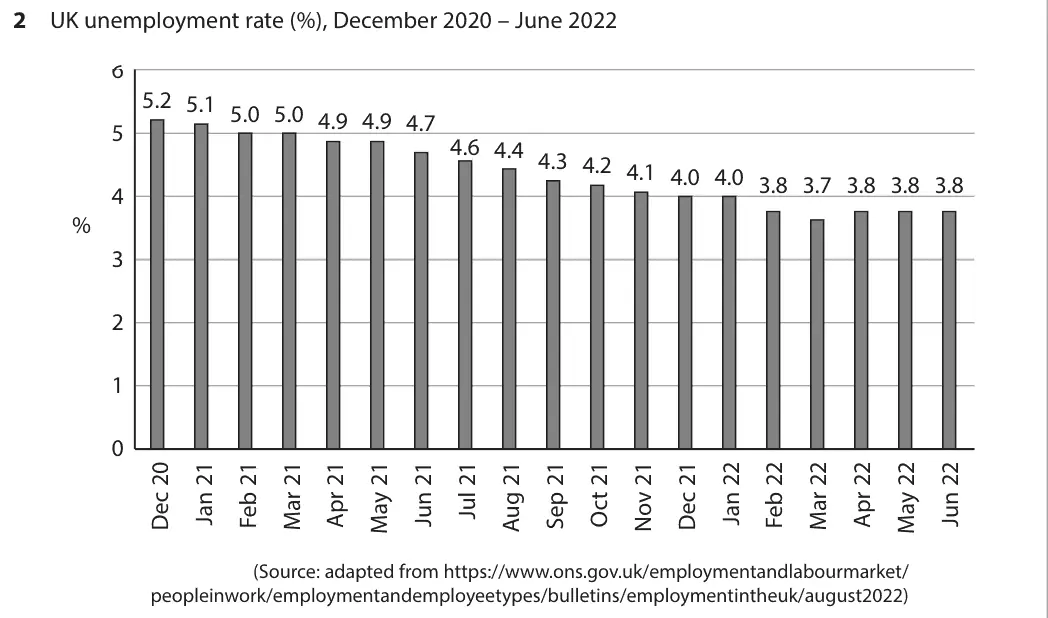
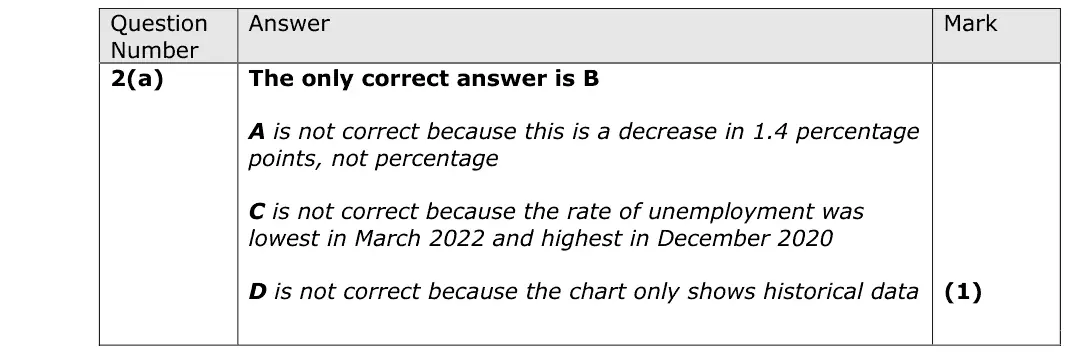
Data and extracts for question 22 UK unemployment rate (%), December 2020 – June 2022 6 5.2 5.1 5.0 5.0 4.9 4.9 4.7 5 4.6 4.4 4.3 4.2 4.1 4.0 4.0 3.8 3.7 3.8 3.8 3.8 4 % 3 2 1 0 (Source: adapted from https://www.ons.gov.uk/employmentandlabourmarket/ peopleinwork/employmentandemployeetypes/bulletins/employmentintheuk/august2022)
(a) With reference to the chart, which one of the following is true? (1) The unemployment rate: A fell by 1.4% between December 2020 and April 2022 B fell by one percentage point between February 2021 and December 2021 C was highest in March 2022 and lowest in December 2020 D will continue to rise but at a slower rate
June 2023 · Paper 2 · Q3(c) 1 mark Multiple choice economic growth and the trade cycle
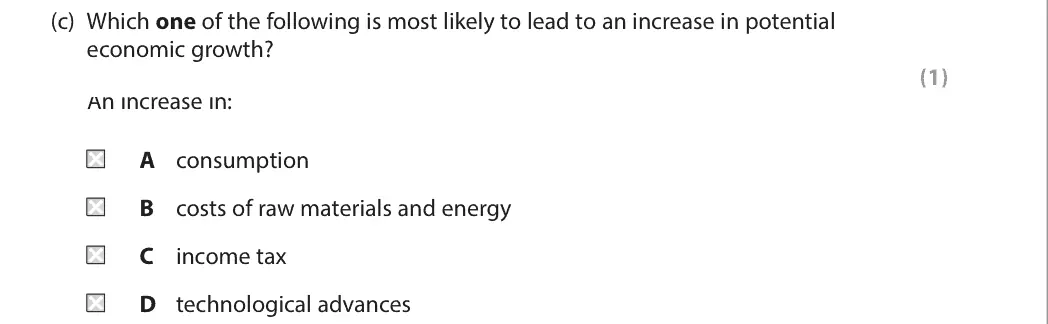
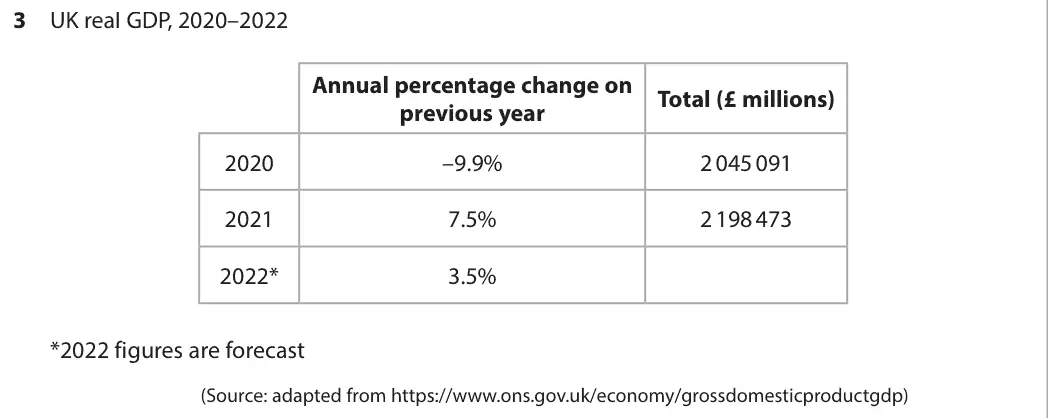
Data and extracts for question 33 UK real GDP, 2020–2022 Annual percentage change on Total (£ millions) previous year 2020 –9.9% 2 045 091 2021 7.5% 2 198 473 2022* 3.5% *2022 figures are forecast (Source: adapted from https://www.ons.gov.uk/economy/grossdomesticproductgdp)
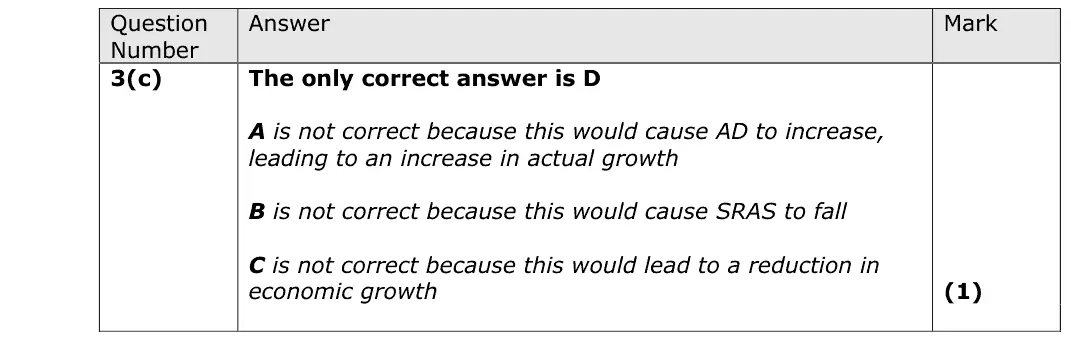
(c) Which one of the following is most likely to lead to an increase in potential economic growth? (1) An increase in: A consumption B costs of raw materials and energy C income tax D technological advances
June 2023 · Paper 2 · Q4(a) 1 mark Multiple choice aggregate demand
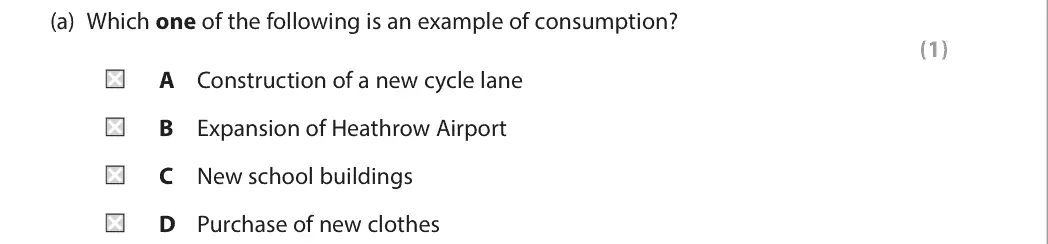
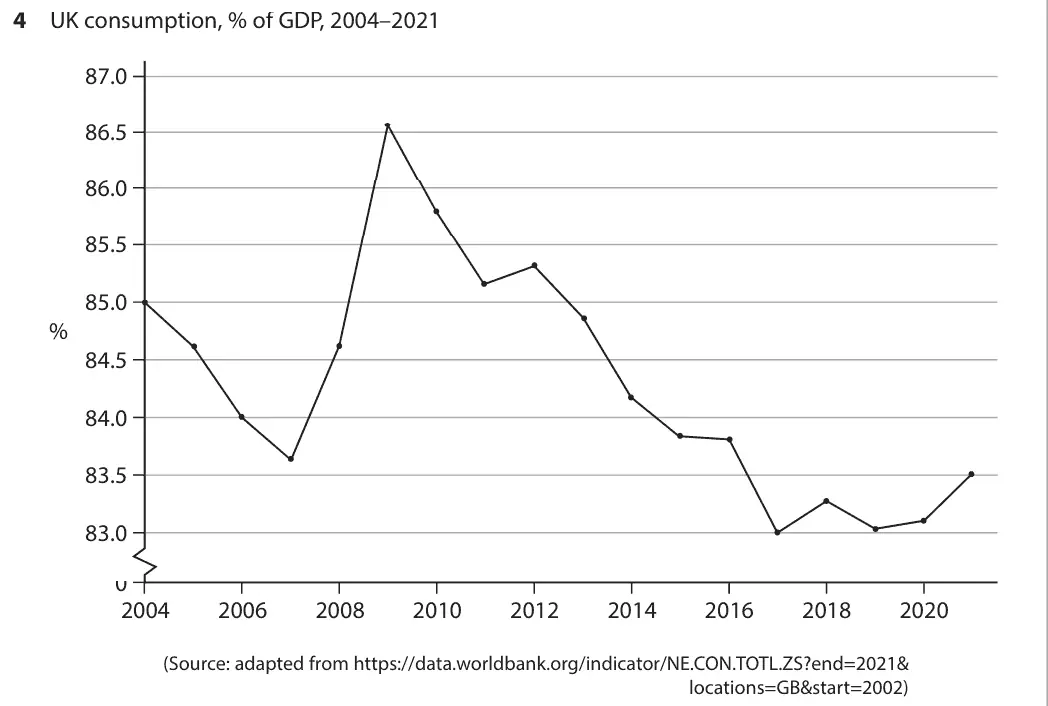
Data and extracts for question 44 UK consumption, % of GDP, 2004–2021 87.0 86.5 86.0 85.5 85.0 % 84.5 84.0 83.5 83.0 0 2004 2006 2008 2010 2012 2014 2016 2018 2020 (Source: adapted from https://data.worldbank.org/indicator/NE.CON.TOTL.ZS?end=2021& locations=GB&start=2002)
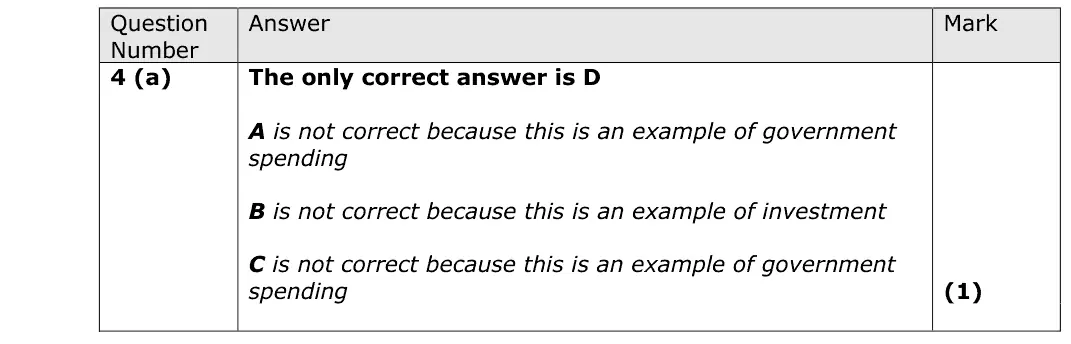
(a) Which one of the following is an example of consumption? (1) A Construction of a new cycle lane B Expansion of Heathrow Airport C New school buildings D Purchase of new clothes
June 2023 · Paper 2 · Q5(c) 1 mark Multiple choice public finances and taxation
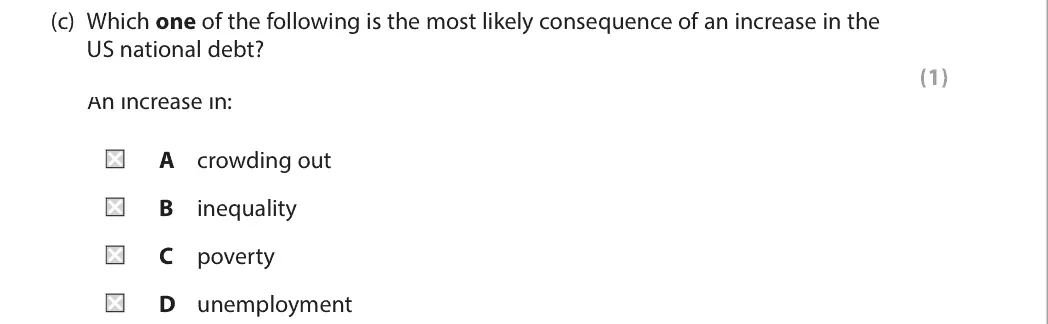
Data and extracts for question 55 In 2021, the US total GDP was $23 trillion and national debt was $28.4 trillion. (Source: adapted from https://data.worldbank.org/indicator/NY.GDP.MKTP.CD?locations=US and https://fiscaldata.treasury.gov/national-debt/)
(c) Which one of the following is the most likely consequence of an increase in the US national debt? (1) An increase in: A crowding out B inequality C poverty D unemployment
June 2022 · AS Paper 1 · Q1(a) 1 mark Multiple choice public goods and information gaps
Data and extracts for question 11 Since 2015, the government has invested £74 million on a flood defence scheme in the Calder Valley. The scheme will protect homes, businesses and jobs. (Source: https://www.theguardian.com/uk-news/2020/feb/10/yorkshire-residents-criticise- delays-to-flood-defence-scheme)
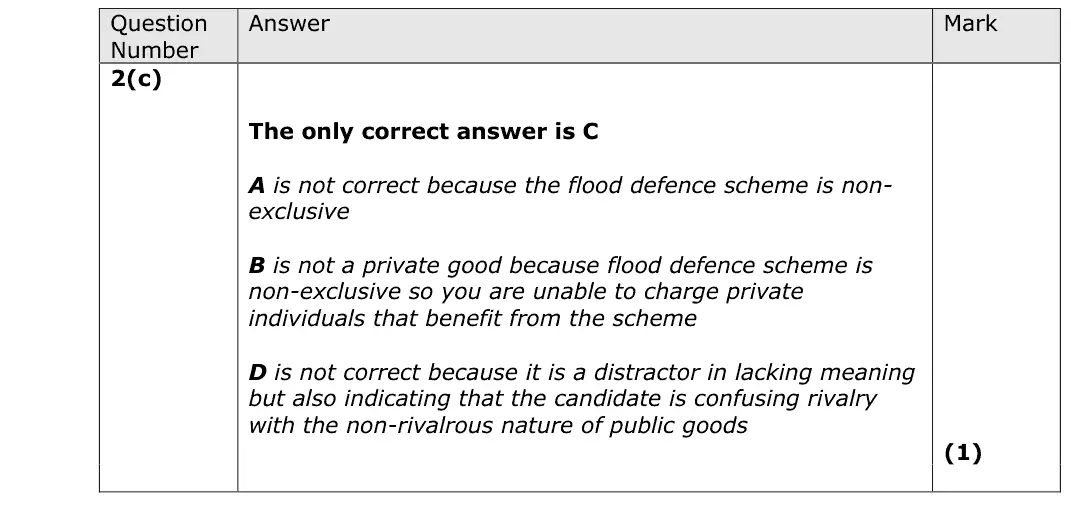
(a) What are the characteristics of a private good? (1) A Non-rivalrous and excludable B Non-rivalrous and non-excludable C Rivalrous and excludable D Rivalrous and non-excludable
June 2022 · AS Paper 1 · Q2(b) 1 mark Multiple choice government intervention in markets
Data and extracts for question 22 The Common Agricultural Policy (CAP) is a system of minimum prices and other programmes covering farming, environmental measures and rural development. The CAP applied to British farmers before the UK left the EU in January 2020. (Source adapted from: https://www.gov.uk/government/collections/common-agricultural- policy-reform)
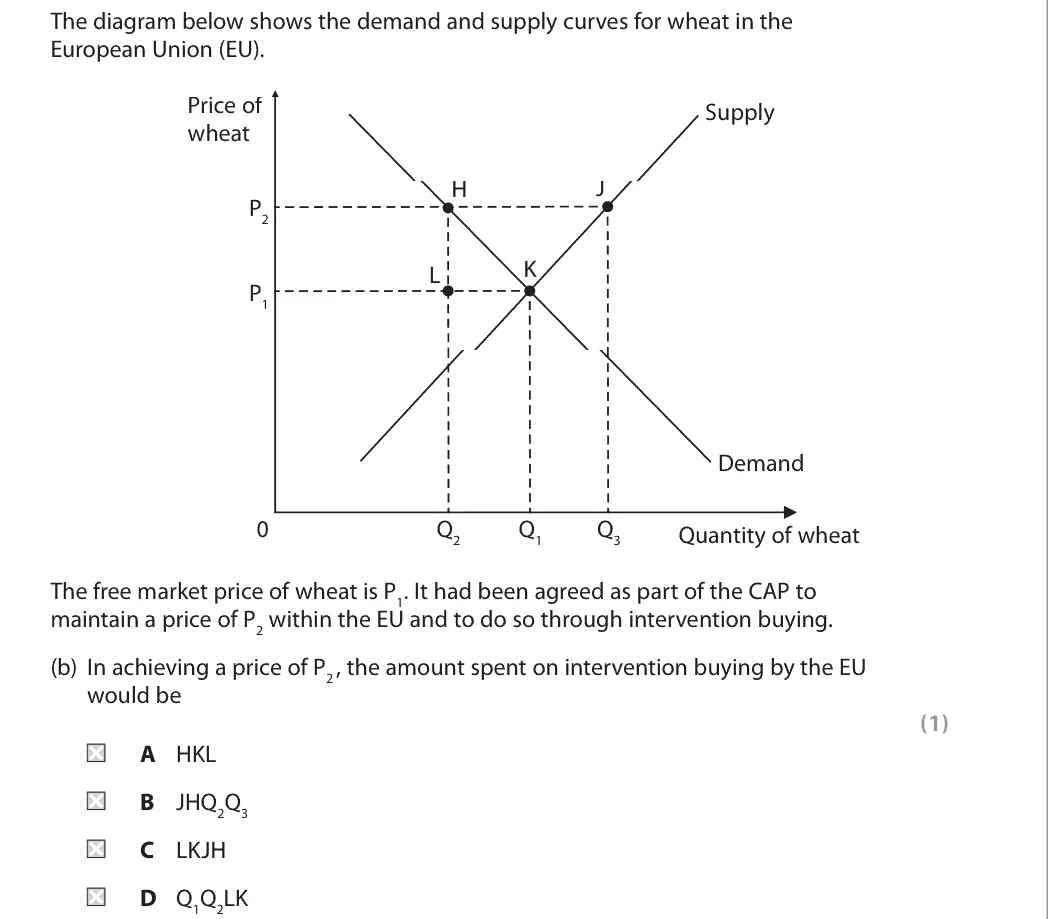
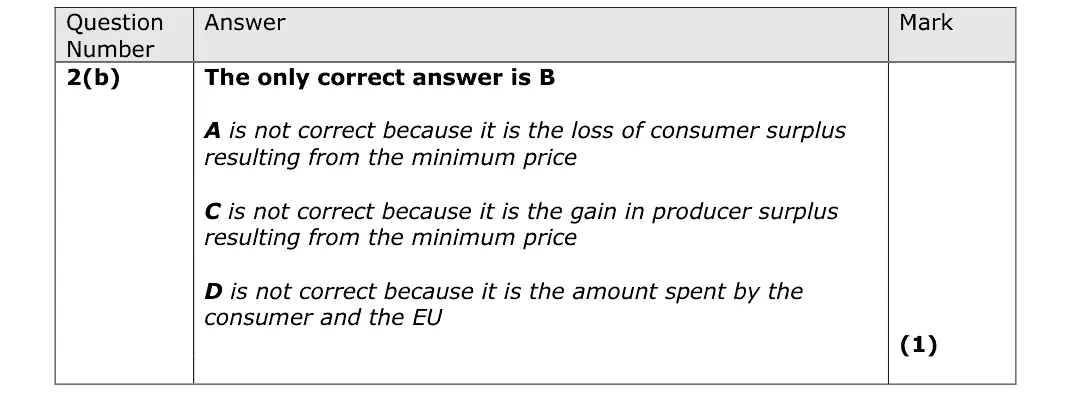
The diagram below shows the demand and supply curves for wheat in the European Union (EU). Price of Supply wheat J H P2 K L P1 Demand Q2 Q1 Q3 0 Quantity of wheat The free market price of wheat is P1. It had been agreed as part of the CAP to maintain a price of P2 within the EU and to do so through intervention buying. (b) In achieving a price of P2 , the amount spent on intervention buying by the EU would be (1) A HKL B JHQ2Q3 C LKJH D Q1Q2LK
June 2022 · AS Paper 1 · Q3(a) 1 mark Multiple choice specialisation and division of labour
Data and extracts for question 33 The world’s first cryptocurrency, Bitcoin is stored and exchanged securely on the internet through a digital ledger known as a blockchain. Bitcoins are divisible into smaller units known as satoshis. (Source: https://www.coinbase.com/price/bitcoin)
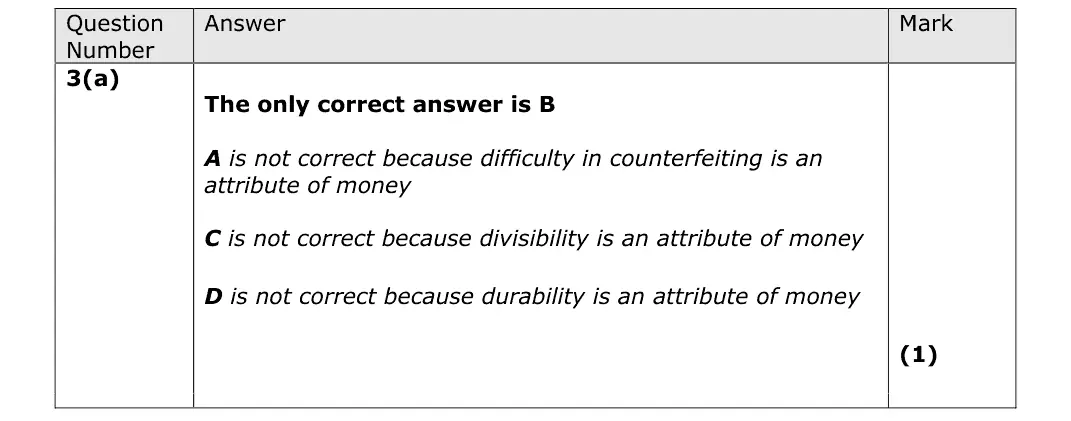
(a) Which one of the following would be most likely to cause a country’s currency to no longer be acceptable as a medium of exchange? (1) A It becomes harder to counterfeit B It becomes unlimited in supply C It is issued in smaller denominations D It is more long lasting
June 2022 · AS Paper 1 · Q4(b) 1 mark Multiple choice externalities
Data and extracts for question 44 A large number of people should be vaccinated against a new virus, so that even those who are not vaccinated will benefit.
(b) Which one of the following explains how market failure might occur in a free market economy? (1) A A net welfare loss results from intervention by the government B Firms enter the market in response to higher prices C Goods with positive externalities are underprovided D Prices rise when there is excess demand
June 2022 · AS Paper 1 · Q5(b) 1 mark Multiple choice elasticity of supply
Data and extracts for question 55 In March 2020, a substantial increase in the demand for flour resulted in the retail price of flour increasing. Despite the price rises, the supply of flour failed to keep up with the increased demand.
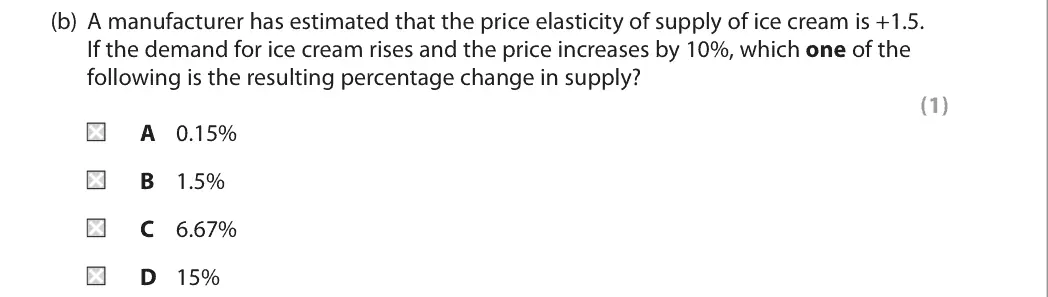
(b) A manufacturer has estimated that the price elasticity of supply of ice cream is +1.5. If the demand for ice cream rises and the price increases by 10%, which one of the following is the resulting percentage change in supply? (1) A 0.15% B 1.5% C 6.67% D 15%
June 2022 · AS Paper 2 · Q1(a) 1 mark Multiple choice fiscal and monetary policy
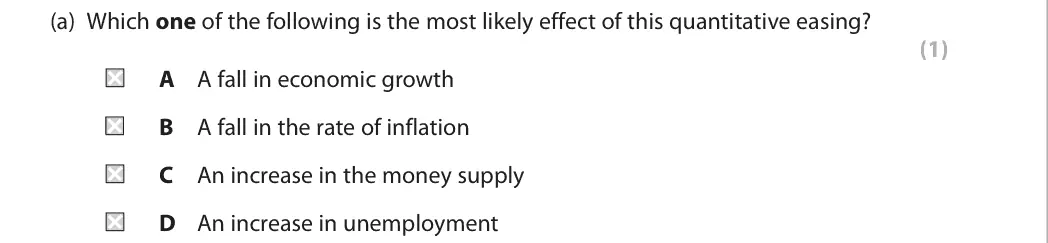
Data and extracts for question 11 In March 2020 the Monetary Policy Committee (MPC) of the Bank of England reintroduced its quantitative easing programme.
(a) Which one of the following is the most likely effect of this quantitative easing? (1) A A fall in economic growth B A fall in the rate of inflation C An increase in the money supply D An increase in unemployment
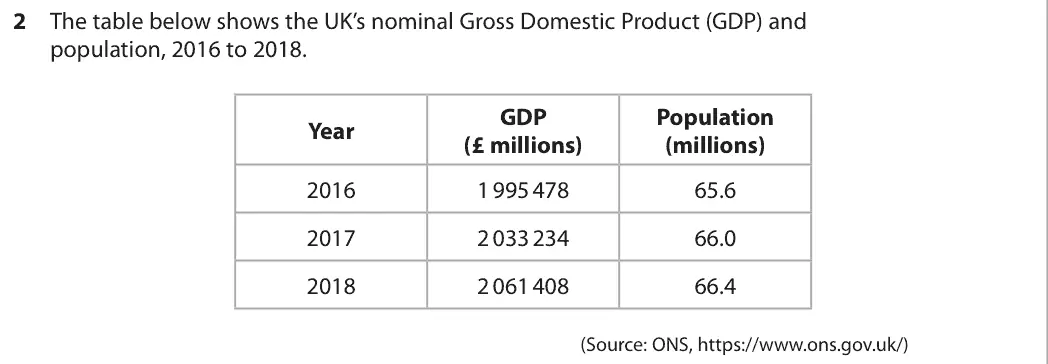
June 2022 · AS Paper 2 · Q2(b) 1 mark Multiple choice measuring economic growth
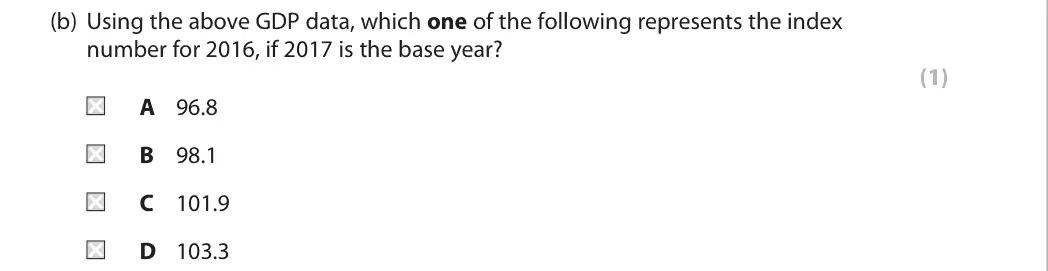
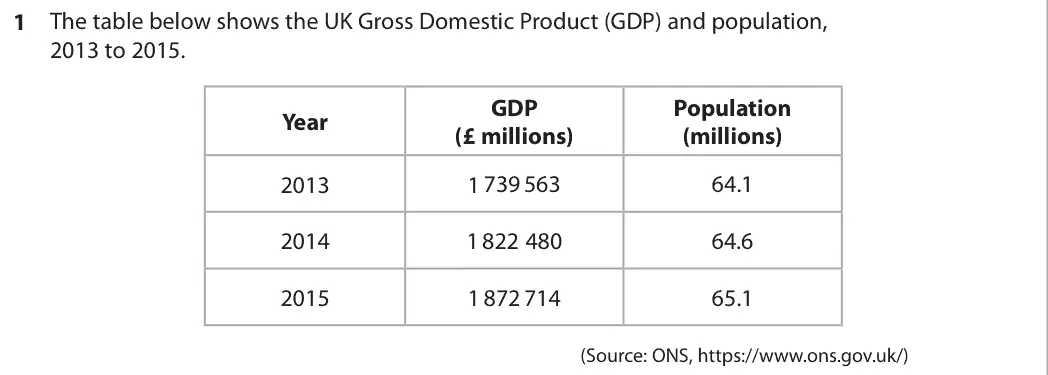
Data and extracts for question 22 The table below shows the UK’s nominal Gross Domestic Product (GDP) and population, 2016 to 2018. GDP Population Year (£ millions) (millions) 2016 1 995 478 65.6 2017 2 033 234 66.0 2018 2 061 408 66.4 (Source: ONS, https://www.ons.gov.uk/)
(b) Using the above GDP data, which one of the following represents the index number for 2016, if 2017 is the base year? (1) A 96.8 B 98.1 C 101.9 D 103.3
June 2022 · AS Paper 2 · Q3(a) 1 mark Multiple choice measuring economic growth
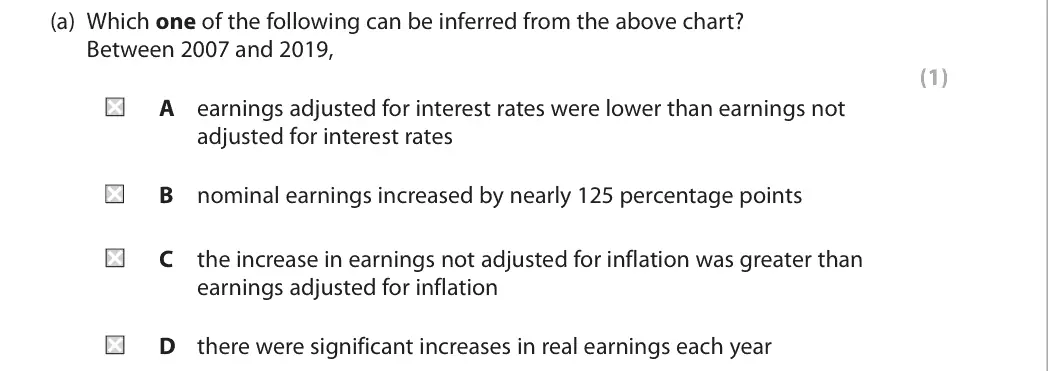
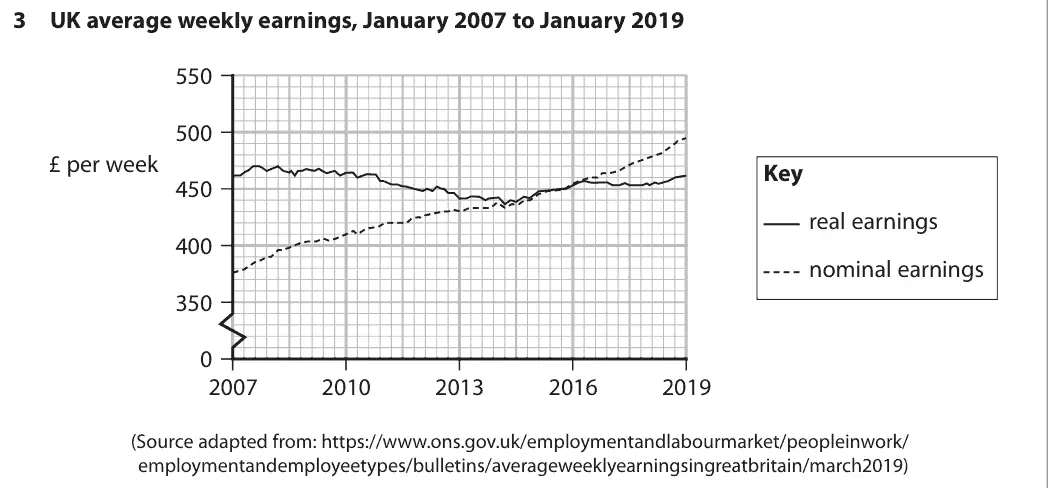
Data and extracts for question 33 UK average weekly earnings, January 2007 to January 2019 550 500 £ per week Key 450 real earnings 400 nominal earnings 350 0 2007 2010 2013 2016 2019 (Source adapted from: https://www.ons.gov.uk/employmentandlabourmarket/peopleinwork/ employmentandemployeetypes/bulletins/averageweeklyearningsingreatbritain/march2019)
(a) Which one of the following can be inferred from the above chart? Between 2007 and 2019, (1) A earnings adjusted for interest rates were lower than earnings not adjusted for interest rates B nominal earnings increased by nearly 125 percentage points C the increase in earnings not adjusted for inflation was greater than earnings adjusted for inflation D there were significant increases in real earnings each year
June 2022 · AS Paper 2 · Q4(b) 1 mark Multiple choice aggregate demand
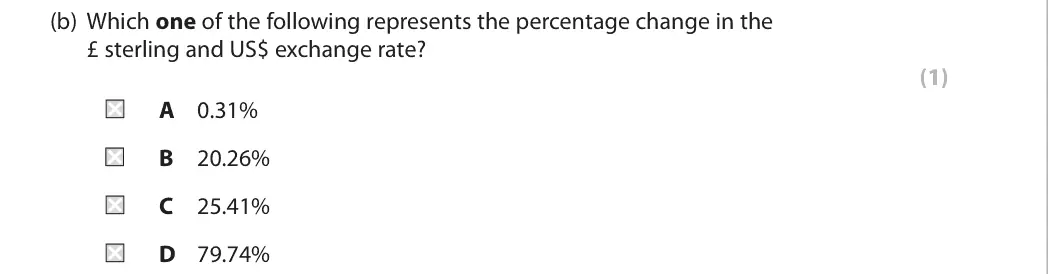
Data and extracts for question 44 The UK exchange rate changed from £1 = $1.53 in January 2015 to £1 = $1.22 in October 2019.
(b) Which one of the following represents the percentage change in the £ sterling and US$ exchange rate? (1) A 0.31% B 20.26% C 25.41% D 79.74%
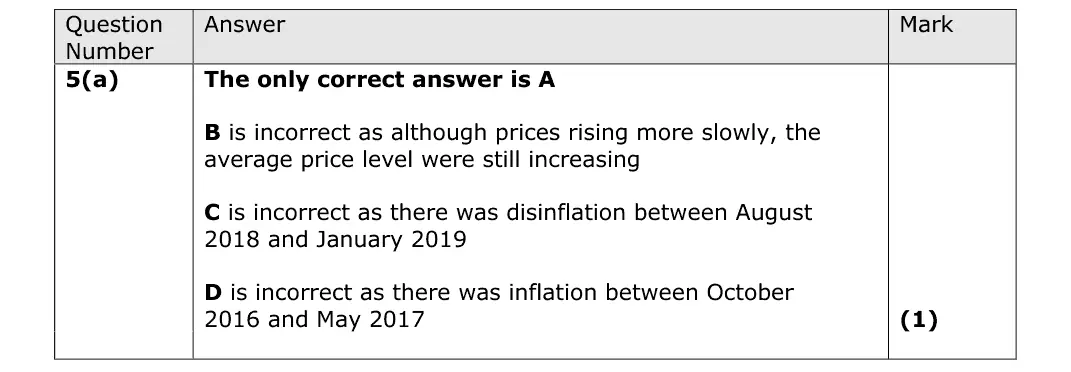
June 2022 · AS Paper 2 · Q5(a) 1 mark Multiple choice inflation
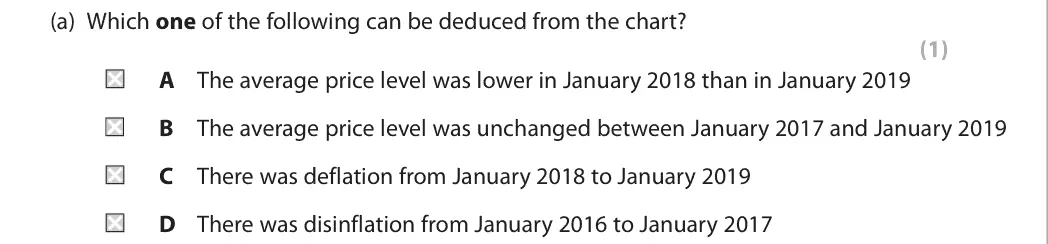
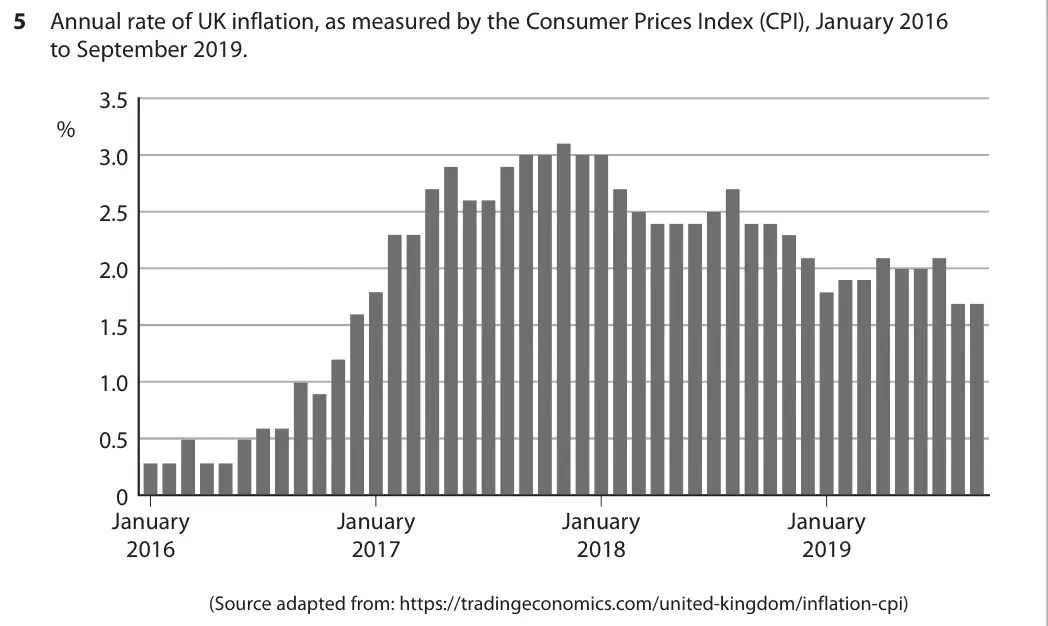
Data and extracts for question 55 Annual rate of UK inflation, as measured by the Consumer Prices Index (CPI), January 2016 to September 2019. 3.5 % 3.0 2.5 2.0 1.5 1.0 0.5 0 January January January January 2016 2017 2018 2019 (Source adapted from: https://tradingeconomics.com/united-kingdom/inflation-cpi)
(a) Which one of the following can be deduced from the chart? (1) A The average price level was lower in January 2018 than in January 2019 B The average price level was unchanged between January 2017 and January 2019 C There was deflation from January 2018 to January 2019 D There was disinflation from January 2016 to January 2017
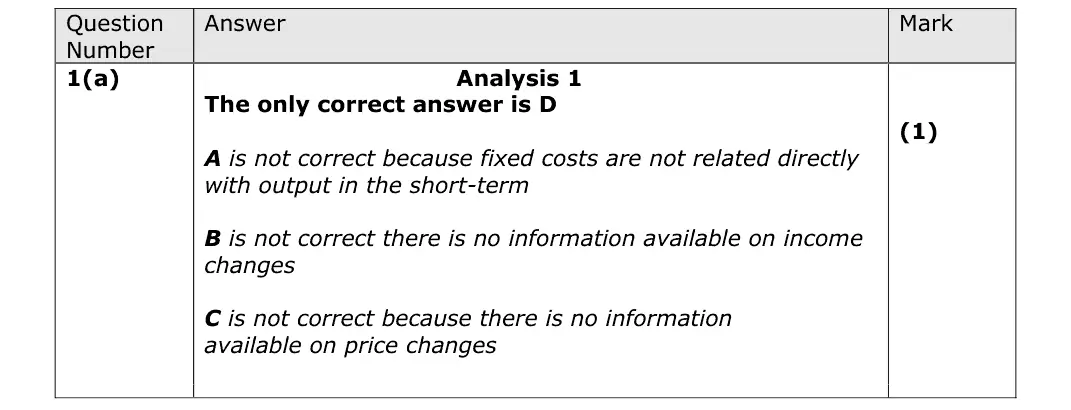
June 2022 · Paper 1 · Q1(a) 1 mark AO3=1 Multiple choice supply and demand
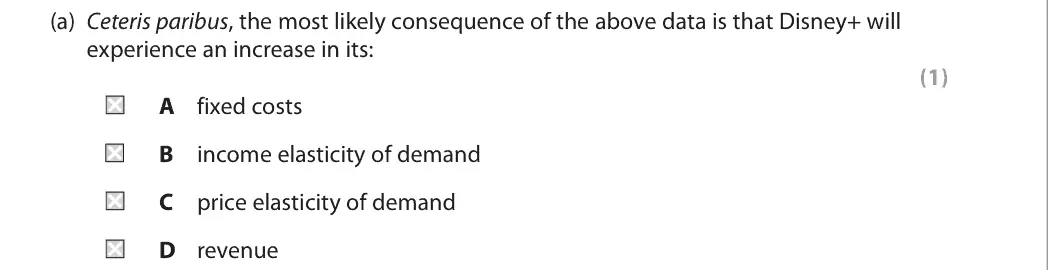
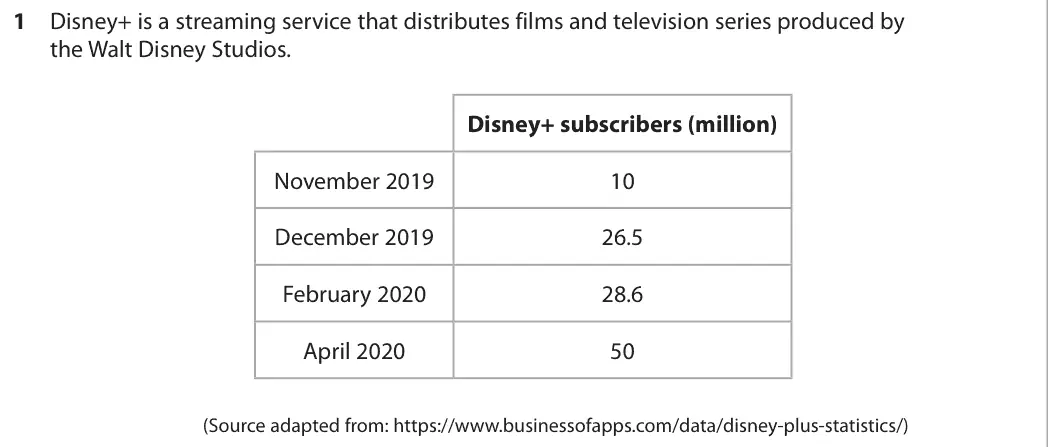
Data and extracts for question 11 Disney+ is a streaming service that distributes films and television series produced by the Walt Disney Studios. Disney+ subscribers (million) November 2019 10 December 2019 26.5 February 2020 28.6 April 2020 50 (Source adapted from: https://www.businessofapps.com/data/disney-plus-statistics/)
(a) Ceteris paribus, the most likely consequence of the above data is that Disney+ will experience an increase in its: (1) A fixed costs B income elasticity of demand C price elasticity of demand D revenue
June 2022 · Paper 1 · Q2(c) 1 mark AO1=1 Multiple choice price elasticity of demand
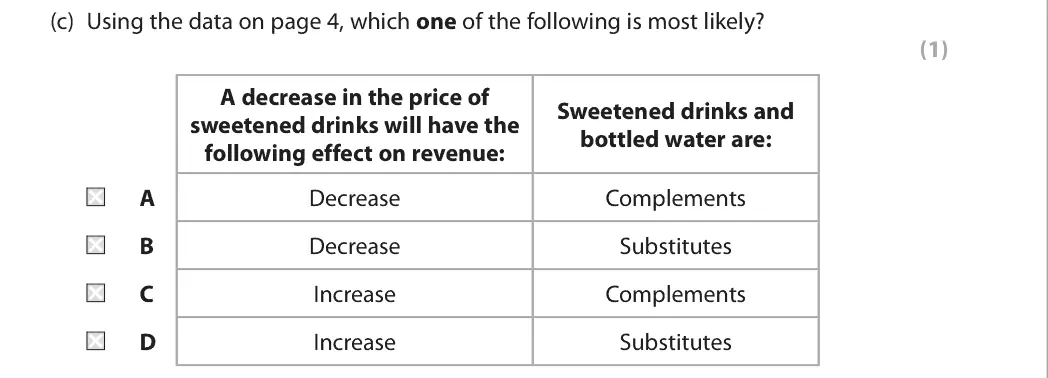
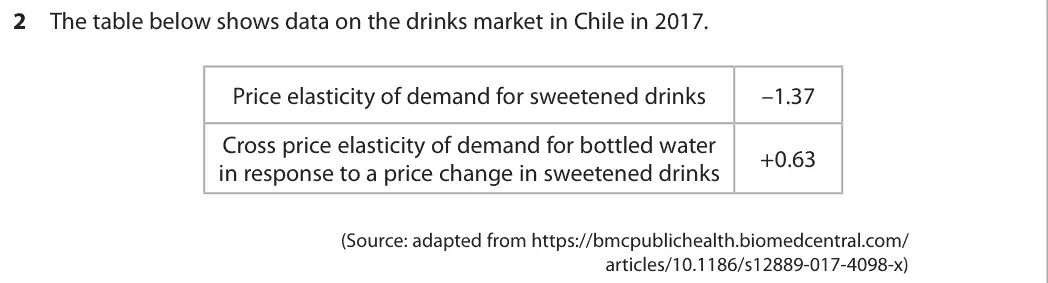
Data and extracts for question 22 The table below shows data on the drinks market in Chile in 2017. Price elasticity of demand for sweetened drinks –1.37 Cross price elasticity of demand for bottled water +0.63 in response to a price change in sweetened drinks (Source: adapted from https://bmcpublichealth.biomedcentral.com/ articles/10.1186/s12889-017-4098-x)
(c) Using the data on page 4, which one of the following is most likely? (1) A decrease in the price of Sweetened drinks and sweetened drinks will have the bottled water are: following effect on revenue: A Decrease Complements B Decrease Substitutes C Increase Complements D Increase Substitutes
June 2022 · Paper 1 · Q3(b) 1 mark AO3=1 Multiple choice government intervention in markets
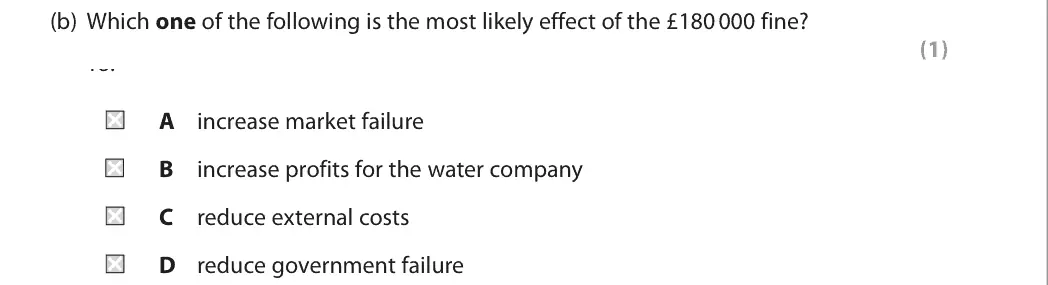
Data and extracts for question 33 A company that provides drinking water and treats waste water has been fined £180 000 after an incident that killed about 2 500 fish. The charges relate to an illegal discharge of sewage from the waste water treatment plant that polluted nine kilometres of the River Severn, a popular tourist destination. (Source: adapted from https://www.leaderlive.co.uk/news/wrexham/ 19393552.water-company-fined-today-sewage-leaked-wrexham-river-killing-2-500-fish/)
(b) Which one of the following is the most likely effect of the £180 000 fine? (1) To: A increase market failure B increase profits for the water company C reduce external costs D reduce government failure
June 2022 · Paper 1 · Q4(b) 1 mark AO3=1 Multiple choice oligopoly
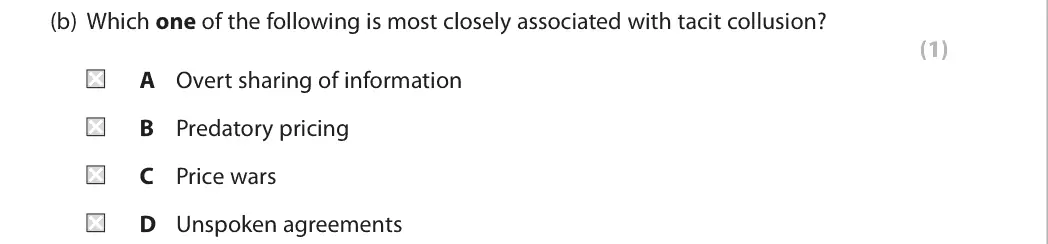
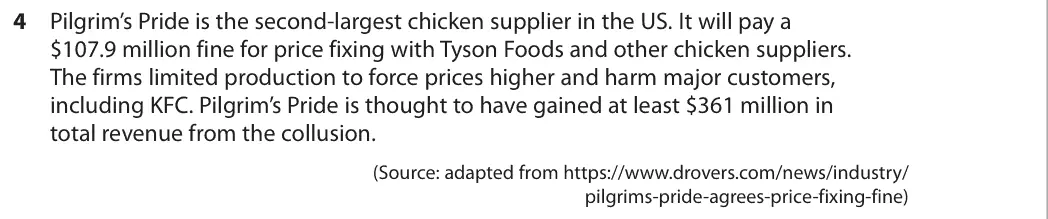
Data and extracts for question 44 Pilgrim’s Pride is the second-largest chicken supplier in the US. It will pay a $107.9 million fine for price fixing with Tyson Foods and other chicken suppliers. The firms limited production to force prices higher and harm major customers, including KFC. Pilgrim’s Pride is thought to have gained at least $361 million in total revenue from the collusion. (Source: adapted from https://www.drovers.com/news/industry/ pilgrims-pride-agrees-price-fixing-fine)
(b) Which one of the following is most closely associated with tacit collusion? (1) A Overt sharing of information B Predatory pricing C Price wars D Unspoken agreements
June 2022 · Paper 1 · Q5(a) 1 mark AO1=1 Multiple choice business growth and objectives
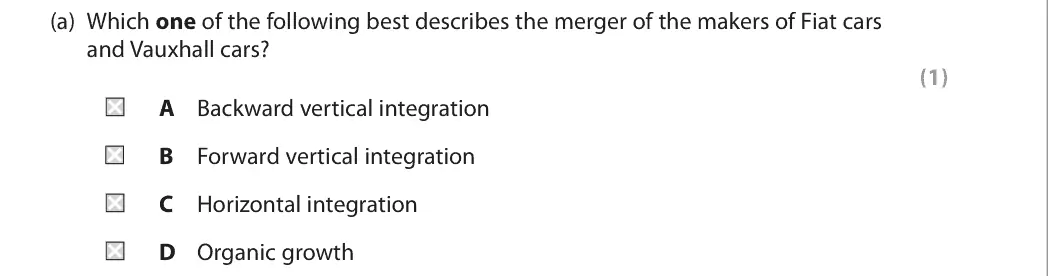
Data and extracts for question 55 The makers of Fiat cars merged with the makers of Vauxhall cars in 2021. Fiat management had aggressively sought a merger to achieve economies of scale. The competition authorities in the EU investigated the merger. (Source: adapted from https://www.thedrive.com/news/34856/ the-merged-fiat-chrysler-and-peugeot-group-will-be-called-stellantis)
(a) Which one of the following best describes the merger of the makers of Fiat cars and Vauxhall cars? (1) A Backward vertical integration B Forward vertical integration C Horizontal integration D Organic growth
June 2022 · Paper 2 · Q1(b) 1 mark Multiple choice national income and the multiplier
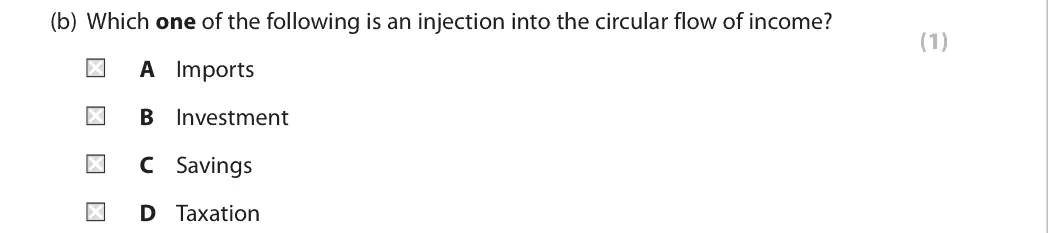
Data and extracts for question 11 According to the Bank of England, the UK’s marginal propensity to consume is estimated to be 0.64. (Source: adapted from https://www.bankofengland.co.uk/-/media/boe/files/working- paper/2017/the-consumption-response-to-positive-and-negative-income-changes.pdf?)
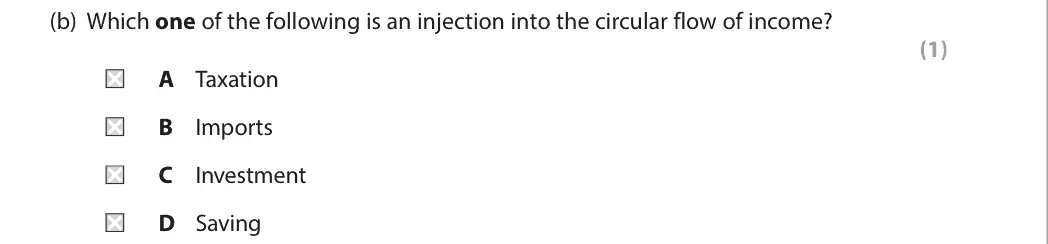
(b) Which one of the following is an injection into the circular flow of income? (1) A Imports B Investment C Savings D Taxation
June 2022 · Paper 2 · Q2(a) 1 mark Multiple choice aggregate demand
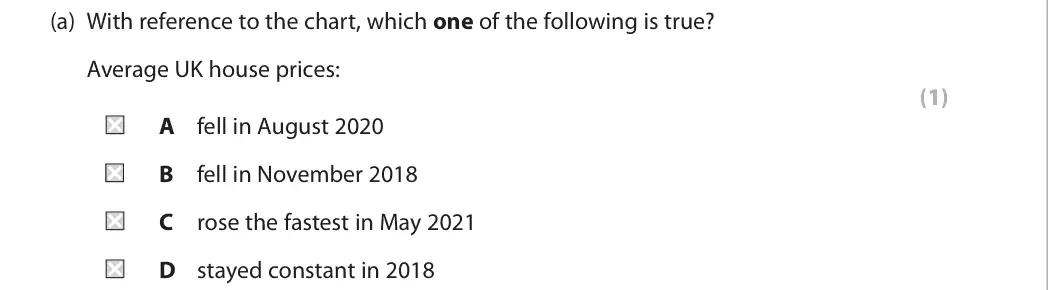
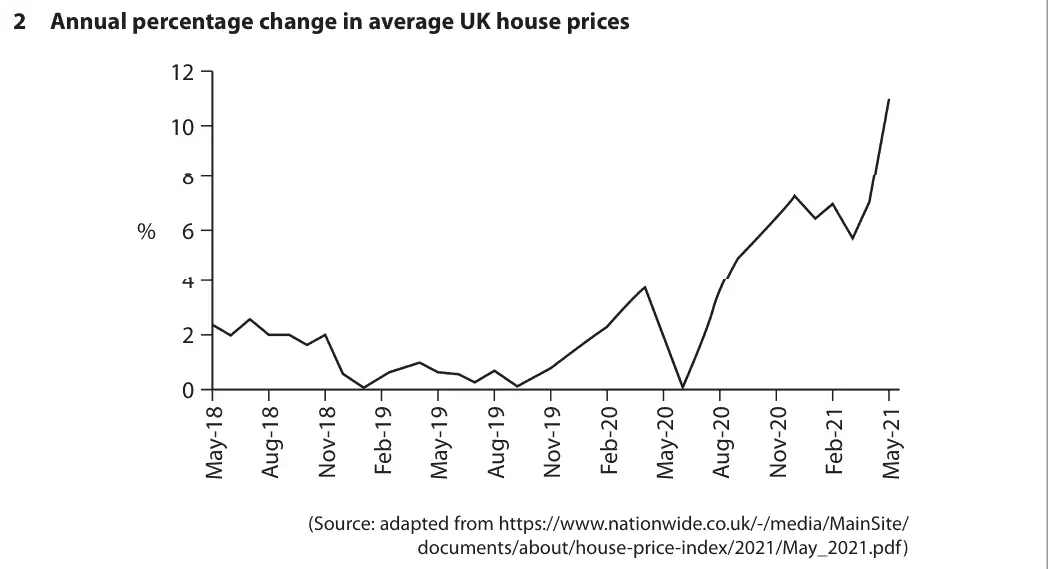
Data and extracts for question 22 Annual percentage change in average UK house prices 12 10 8 % 6 4 2 0 (Source: adapted from https://www.nationwide.co.uk/-/media/MainSite/ documents/about/house-price-index/2021/May_2021.pdf)
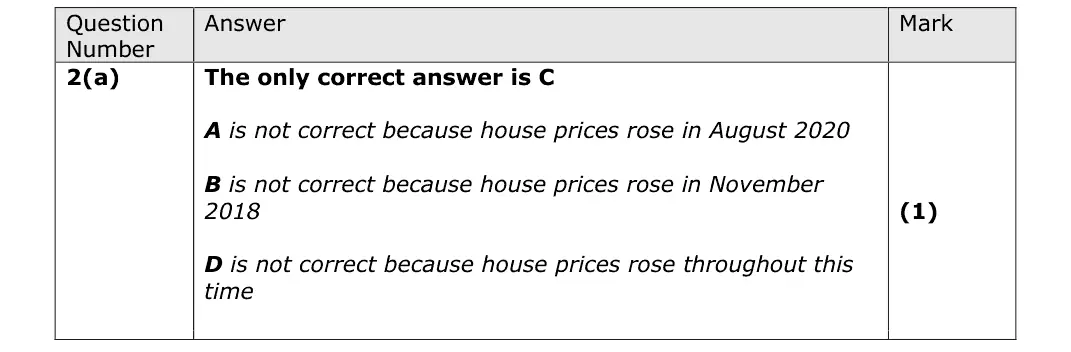
(a) With reference to the chart, which one of the following is true? Average UK house prices: (1) A fell in August 2020 B fell in November 2018 C rose the fastest in May 2021 D stayed constant in 2018
June 2022 · Paper 2 · Q3(b) 1 mark Multiple choice exchange rates
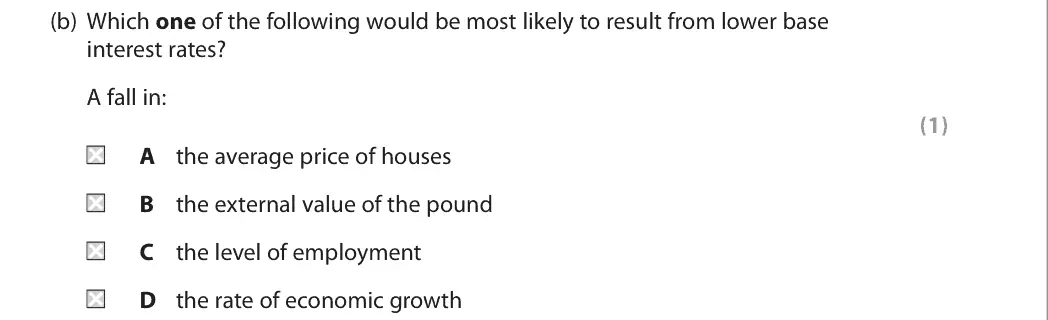
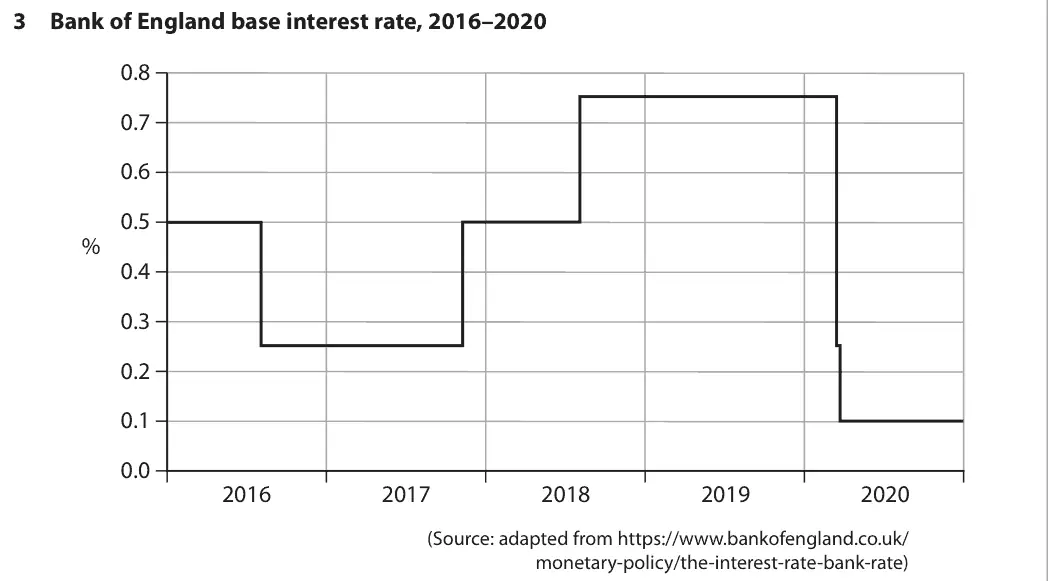
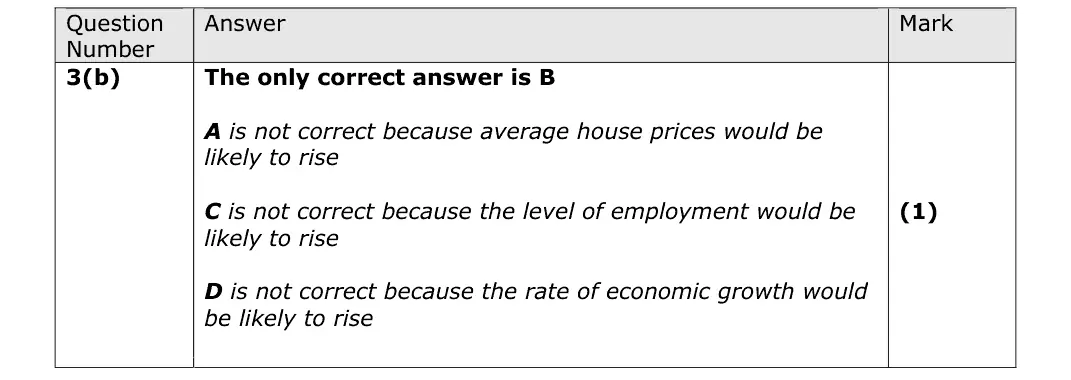
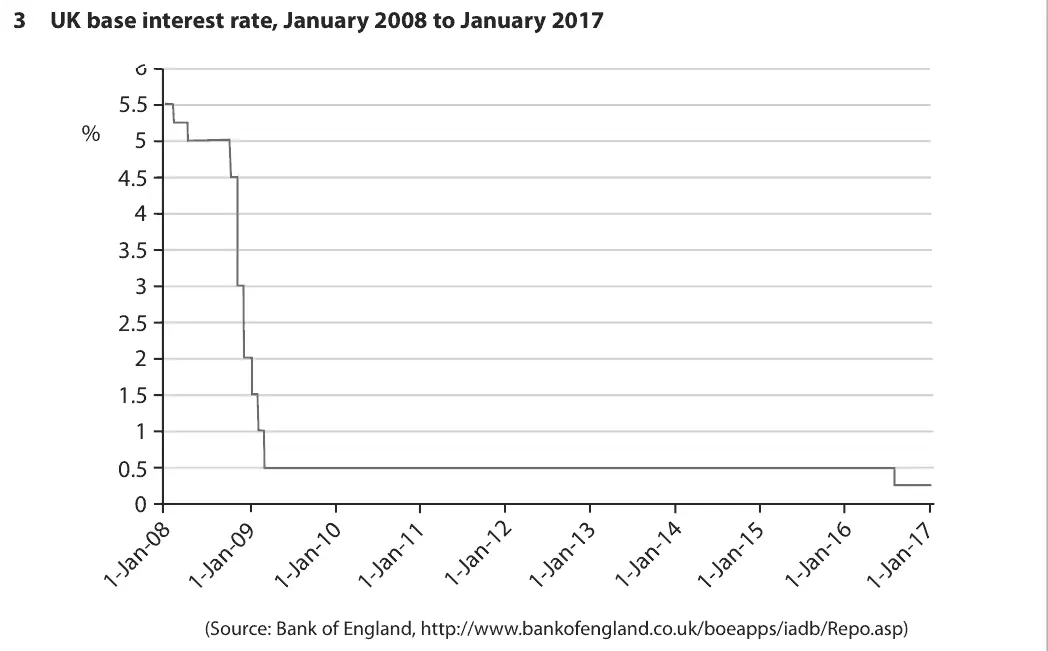
Data and extracts for question 33 Bank of England base interest rate, 2016–2020 0.8 0.7 0.6 0.5 % 0.4 0.3 0.2 0.1 0.0 2016 2017 2018 2019 2020 (Source: adapted from https://www.bankofengland.co.uk/ monetary-policy/the-interest-rate-bank-rate)
(b) Which one of the following would be most likely to result from lower base interest rates? A fall in: (1) A the average price of houses B the external value of the pound C the level of employment D the rate of economic growth
June 2022 · Paper 2 · Q4(a) 1 mark Multiple choice economic growth and the trade cycle
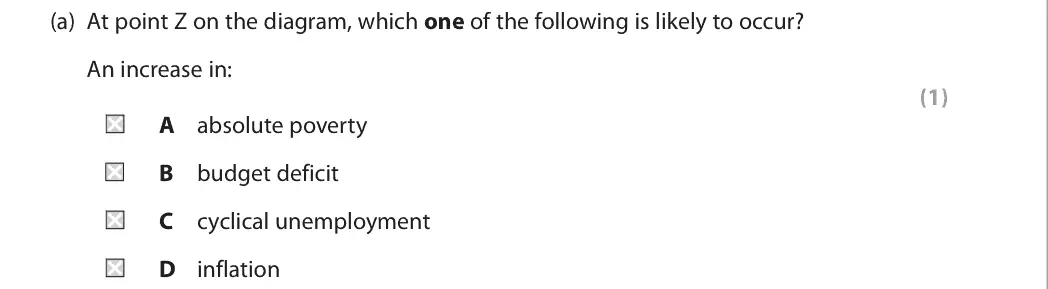
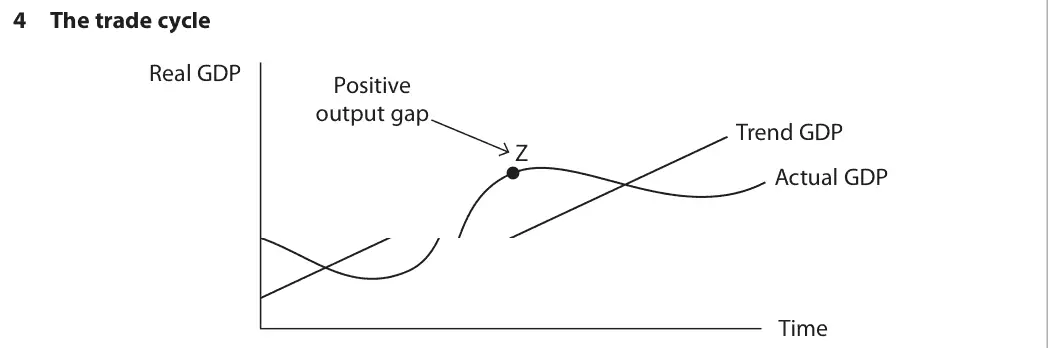
Data and extracts for question 44 The trade cycle Real GDP Positive output gap Trend GDP Z Actual GDP Time
(a) At point Z on the diagram, which one of the following is likely to occur? An increase in: (1) A absolute poverty B budget deficit C cyclical unemployment D inflation
June 2022 · Paper 2 · Q5(b) 1 mark Multiple choice financial sector
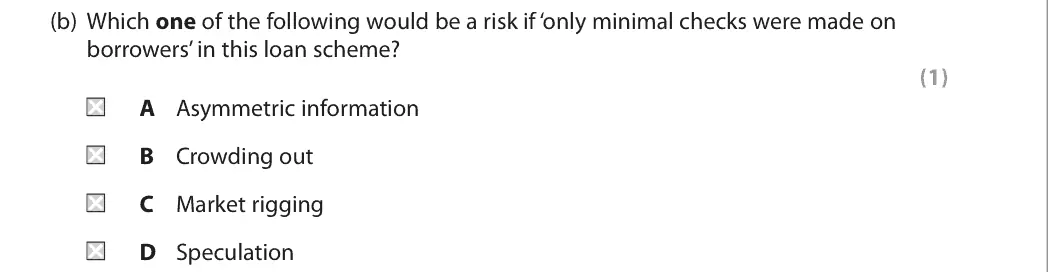
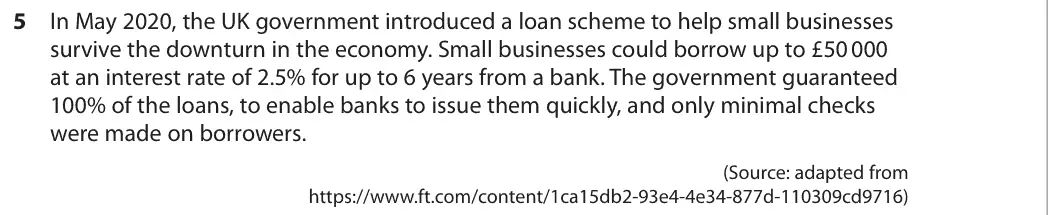
Data and extracts for question 55 In May 2020, the UK government introduced a loan scheme to help small businesses survive the downturn in the economy. Small businesses could borrow up to £50 000 at an interest rate of 2.5% for up to 6 years from a bank. The government guaranteed 100% of the loans, to enable banks to issue them quickly, and only minimal checks were made on borrowers. (Source: adapted from https://www.ft.com/content/1ca15db2-93e4-4e34-877d-110309cd9716)
(b) Which one of the following would be a risk if ‘only minimal checks were made on borrowers’ in this loan scheme? (1) A Asymmetric information B Crowding out C Market rigging D Speculation
November 2021 · Paper 1 · Q1(a) 1 mark AO1=1 Multiple choice nature of economics
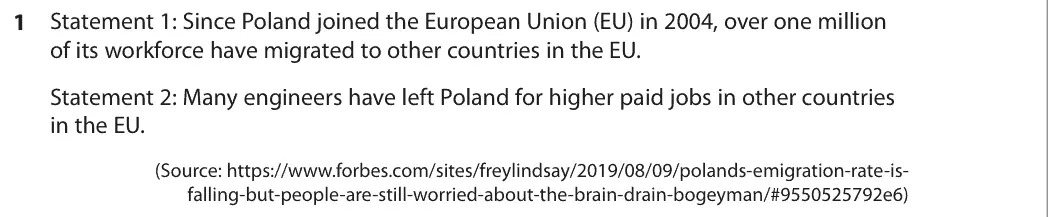
Data and extracts for question 11 Statement 1: Since Poland joined the European Union (EU) in 2004, over one million of its workforce have migrated to other countries in the EU. Statement 2: Many engineers have left Poland for higher paid jobs in other countries in the EU. (Source: https://www.forbes.com/sites/freylindsay/2019/08/09/polands-emigration-rate-is- falling-but-people-are-still-worried-about-the-brain-drain-bogeyman/#9550525792e6)
(a) Which one of the following best describes the two statements above? (1) Statement 1 Statement 2 A Normative Normative B Normative Positive C Positive Normative D Positive Positive
November 2021 · Paper 1 · Q2(b) 1 mark AO1=1 Multiple choice supply and demand
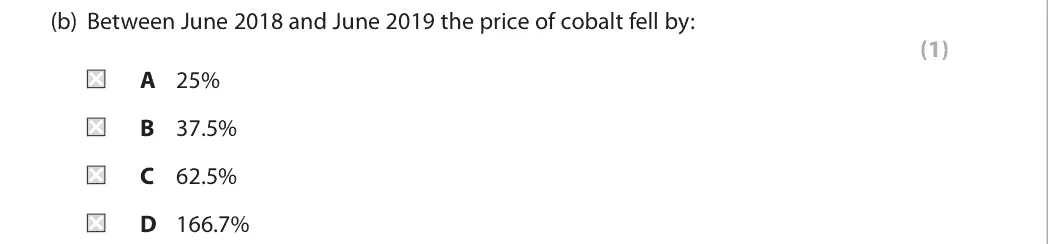
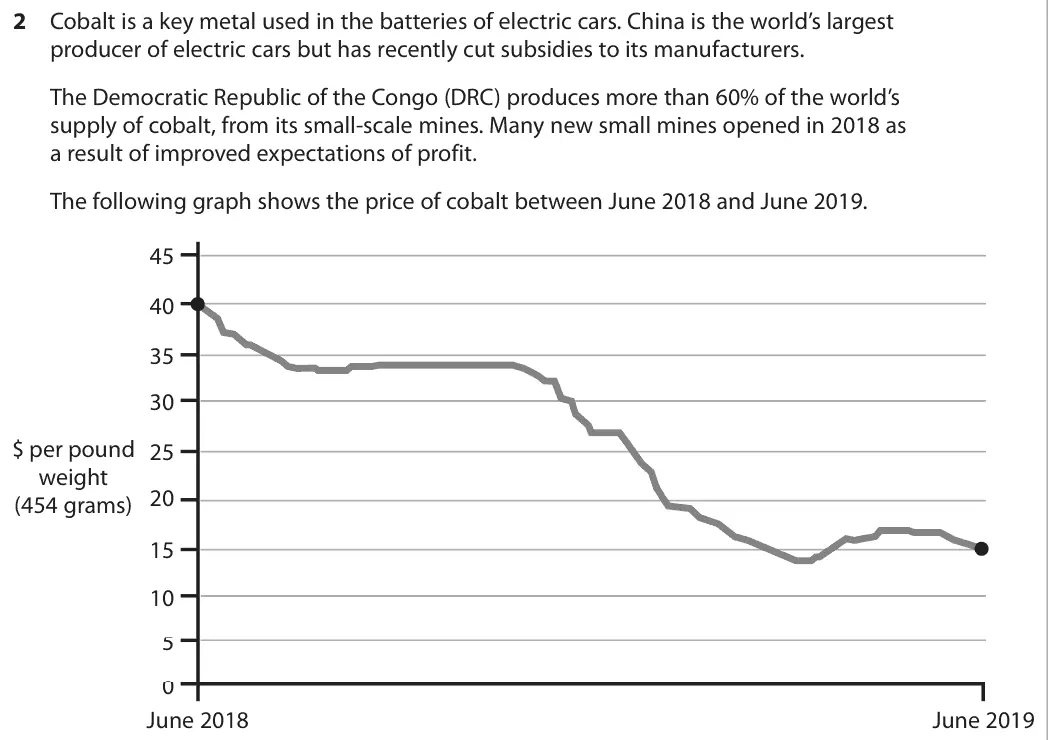
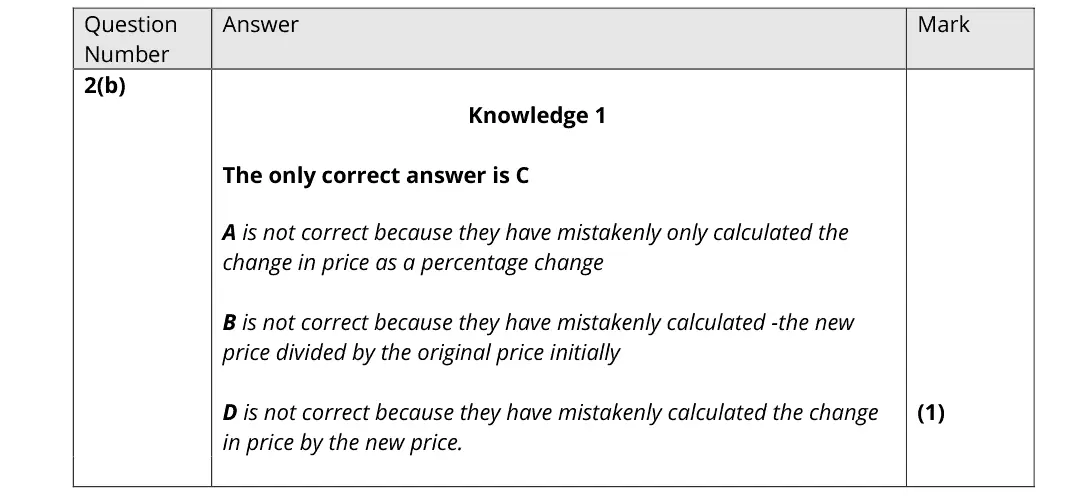
Data and extracts for question 22 Cobalt is a key metal used in the batteries of electric cars. China is the world’s largest producer of electric cars but has recently cut subsidies to its manufacturers. The Democratic Republic of the Congo (DRC) produces more than 60% of the world’s supply of cobalt, from its small-scale mines. Many new small mines opened in 2018 as a result of improved expectations of profit. The following graph shows the price of cobalt between June 2018 and June 2019. 45 40 35 30 $ per pound 25 weight 20 (454 grams) 15 10 5 0 June 2018 June 2019
(b) Between June 2018 and June 2019 the price of cobalt fell by: (1) A 25% B 37.5% C 62.5% D 166.7%
November 2021 · Paper 1 · Q3(b) 1 mark AO3=1 Multiple choice monopoly
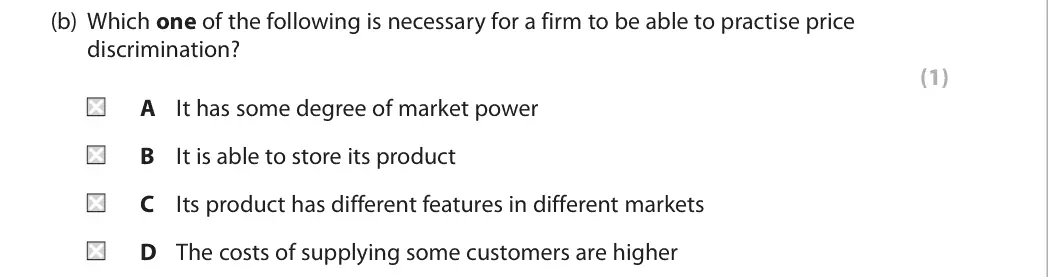
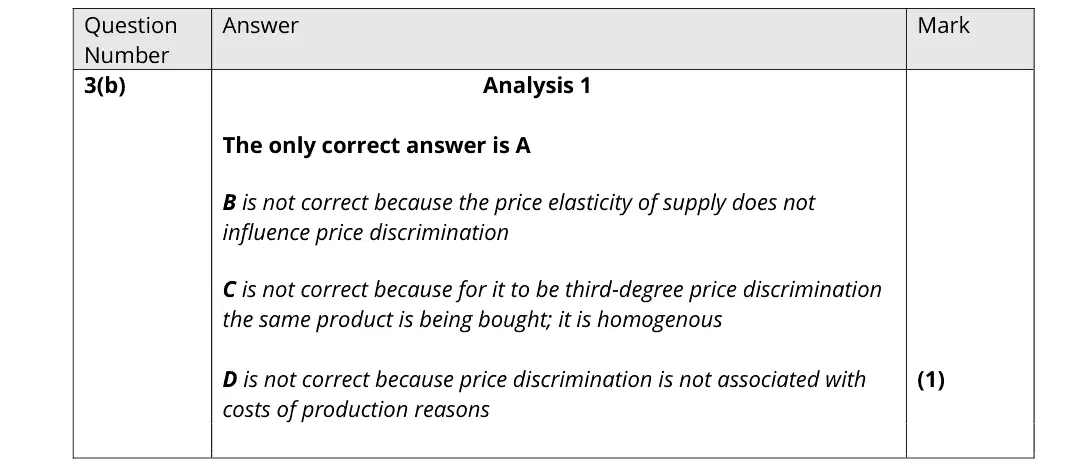
Data and extracts for question 33 River Island is a clothing retailer. Students are offered a River Island student discount code to benefit from a 10% price reduction as an attempt by the firm to increase profit.
(b) Which one of the following is necessary for a firm to be able to practise price discrimination? (1) A It has some degree of market power B It is able to store its product C Its product has different features in different markets D The costs of supplying some customers are higher
November 2021 · Paper 1 · Q4(c) 1 mark AO3=1 Multiple choice business growth and objectives
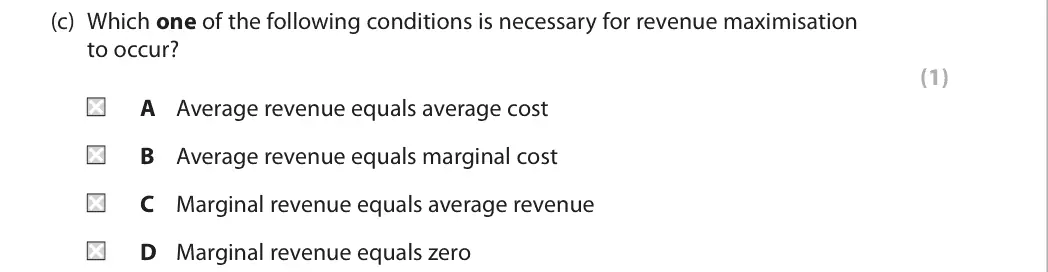
Data and extracts for question 44 Patrick Street Productions produces musicals. Its latest production is ‘It’s a Wonderful Life’ and the total cost of this production is $200 000. The ticket price is $40. The theatre has a capacity of 300 seats. The company aims for revenue maximisation. If this is achieved, revenue from ticket sales will cover 30% of total costs. Charitable donations contribute 12.5% towards total cost and a government subsidy ensures the production covers all of its costs. (Source adapted from: https://www.cbc.ca/news/canada/british-columbia/a-bit-of- a-desperate-time-as-costs-rise-professional-theatre-companies-survive-rather-than- thrive-1.5489733)
(c) Which one of the following conditions is necessary for revenue maximisation to occur? (1) A Average revenue equals average cost B Average revenue equals marginal cost C Marginal revenue equals average revenue D Marginal revenue equals zero
November 2021 · Paper 1 · Q5(b) 1 mark AO3=1 Multiple choice market structures and efficiency
Data and extracts for question 55 In Sicily, many households can grow lemons of the same quality as each other. Chiara decides to sell lemons at her local market, expecting to make a normal profit. She notices that all of the many lemon sellers are charging exactly the same price.
(b) Which one of the following will exist in the short run if Chiara makes a loss? (1) A Allocative efficiency and productive efficiency B Allocative efficiency and productive inefficiency C Allocative inefficiency and productive efficiency D Allocative inefficiency and productive inefficiency
November 2021 · Paper 2 · Q1(a) 1 mark Multiple choice national income and the multiplier
Data and extracts for question 11 After the Global Financial Crisis of 2008, the US President introduced expansionary fiscal policies of $800 billion. The International Monetary Fund estimated that the multiplier at the time was approximately 1.5. (Source adapted from: https://www.economist.com/the-economist-explains/2016/09/07/ what-is-the-keynesian-multiplier)
(a) Which one of the following is a withdrawal from the circular flow of income? (1) A Exports B Government spending C Investment D Taxation
November 2021 · Paper 2 · Q2(a) 1 mark Multiple choice aggregate supplynational income and the multiplier
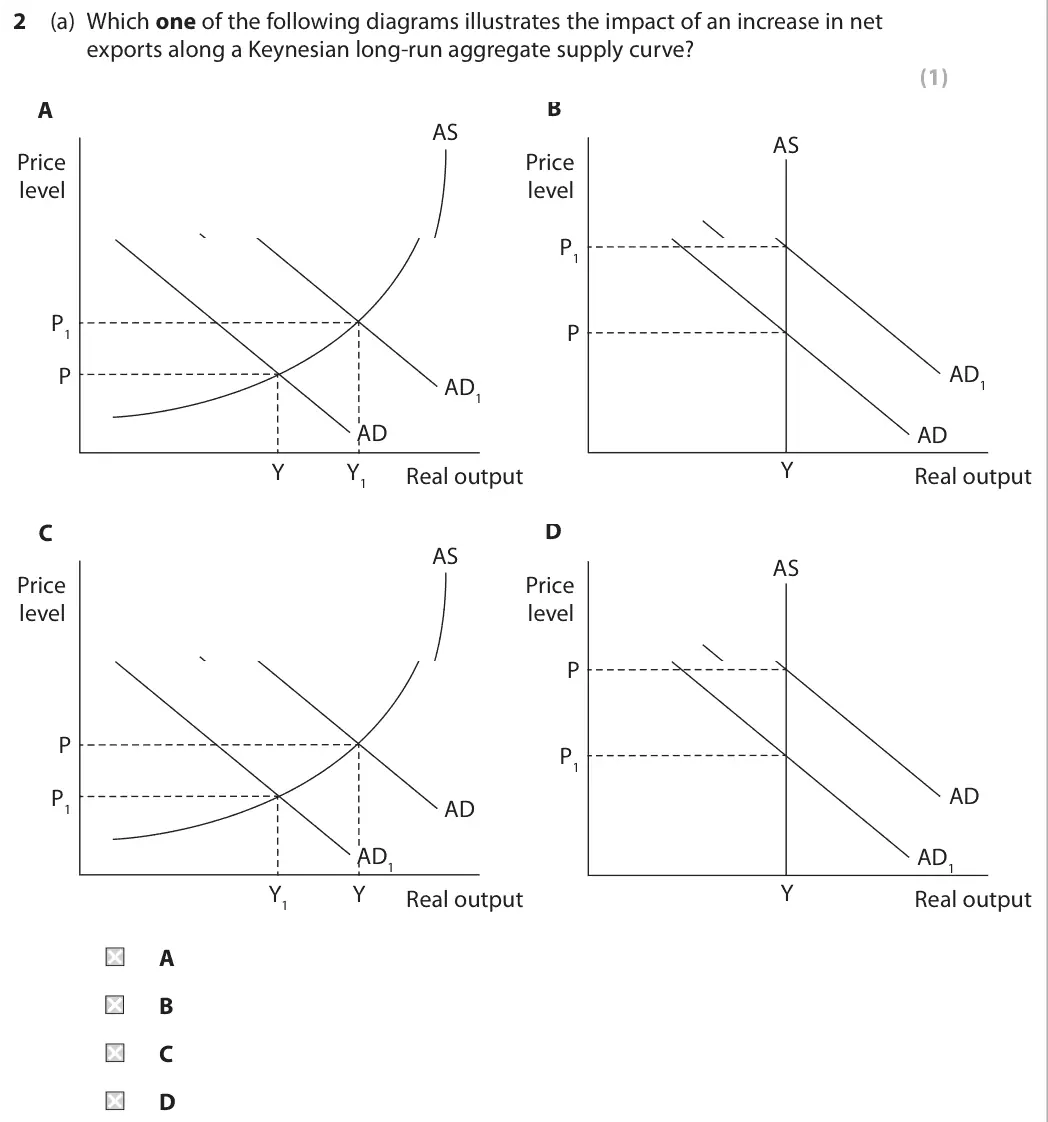
(a) Which one of the following diagrams illustrates the impact of an increase in net exports along a Keynesian long-run aggregate supply curve? (1) B A AS AS Price Price level level P1 P1 P AD1 P AD1 AD AD Y Y Y1 Real output Real output D C AS AS Price Price level level P P P1 AD P1 AD AD1 AD1 Y Y1 Y Real output Real output A B C D
November 2021 · Paper 2 · Q3(a) 1 mark Multiple choice exchange rates
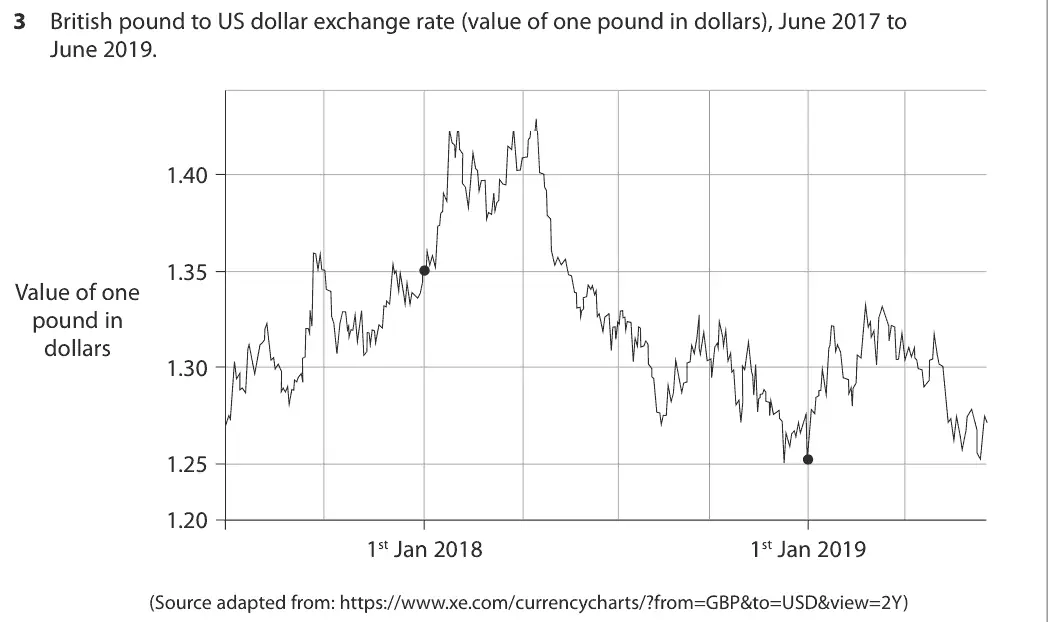
Data and extracts for question 33 British pound to US dollar exchange rate (value of one pound in dollars), June 2017 to June 2019. 1.40 1.35 Value of one pound in dollars 1.30 1.25 1.20 1st Jan 2018 1st Jan 2019 (Source adapted from: https://www.xe.com/currencycharts/?from=GBP&to=USD&view=2Y)
(a) Which one of the following has been the overall change in the British pound to US dollar exchange rate from 1st January 2018 to 1st January 2019? (1) A Appreciation B Depreciation C Devaluation D Revaluation
November 2021 · Paper 2 · Q4(b) 1 mark Multiple choice public finances and taxation
Data and extracts for question 44 A number of business groups have signed an open letter to the UK Government asking it to commit to delivering the full High Speed 2 rail link. This will connect London to the northern cities of Manchester and Leeds at a cost of £56 billion and reduce journey times by as much as 50%. (Source adapted from: https://www.theguardian.com/uk-news/2019/jun/22/business-heads- urge-next-pm-to-commit-to-finishing-hs2)
(b) Government spending on the High Speed 2 rail link is an example of which of the following? (1) A Automatic stabilisers B Capital expenditure C Current expenditure D Transfer payments
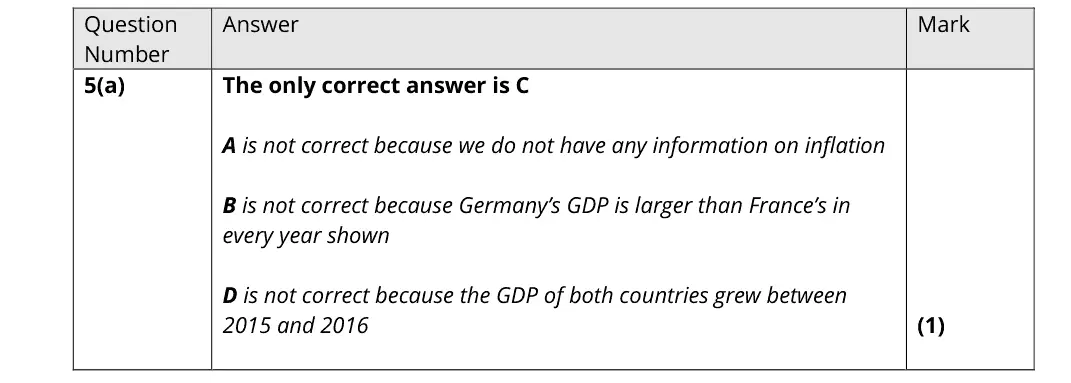
November 2021 · Paper 2 · Q5(a) 1 mark Multiple choice measuring economic growth
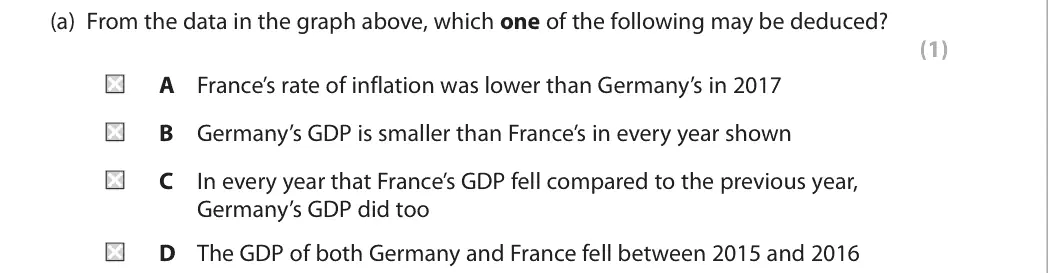
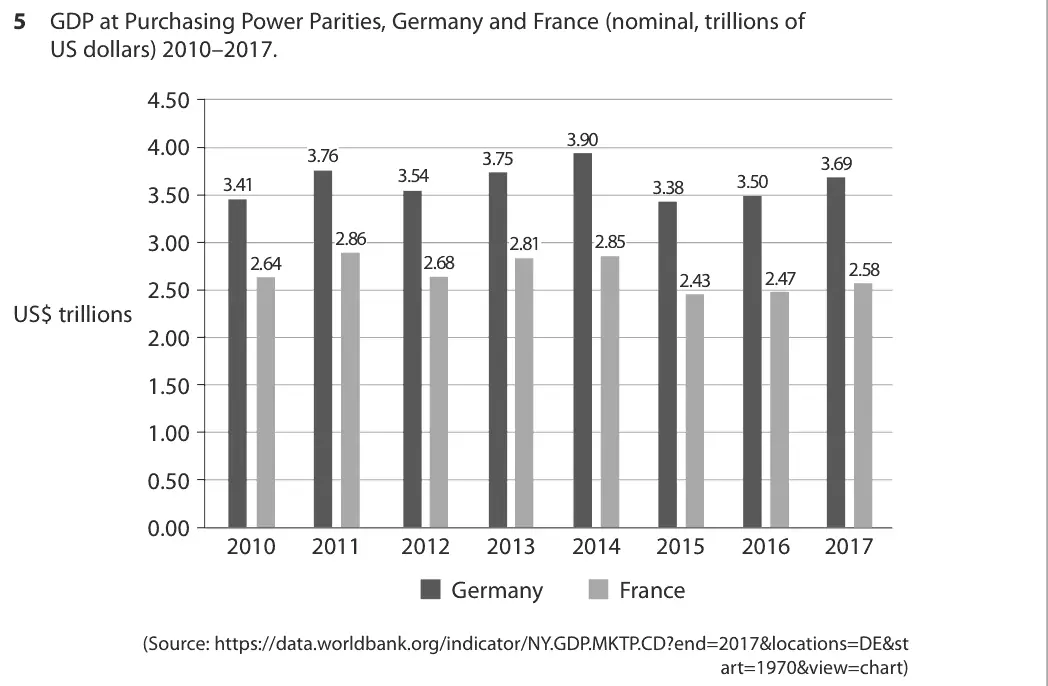
Data and extracts for question 55 GDP at Purchasing Power Parities, Germany and France (nominal, trillions of US dollars) 2010–2017. 4.50 3 . 90 4.00 3 . 76 3 . 75 3 . 69 3 . 54 3 . 50 3 . 41 3 . 38 3.50 2 . 86 3.00 2 . 85 2 . 81 2. 64 2 . 68 2 . 58 2 . 47 2 . 43 2.50 US$ trillions 2.00 1.50 1.00 0.50 0.00 2010 2011 2012 2013 2014 2015 2016 2017 Germany France (Source: https://data.worldbank.org/indicator/NY.GDP.MKTP.CD?end=2017&locations=DE&st art=1970&view=chart)
(a) From the data in the graph above, which one of the following may be deduced? (1) A France’s rate of inflation was lower than Germany’s in 2017 B Germany’s GDP is smaller than France’s in every year shown C In every year that France’s GDP fell compared to the previous year, Germany’s GDP did too D The GDP of both Germany and France fell between 2015 and 2016
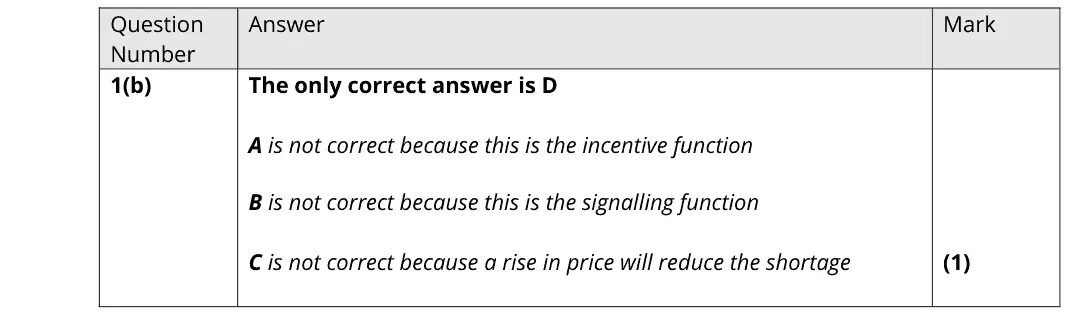
October 2020 · AS Paper 1 · Q1(b) 1 mark Multiple choice price mechanism and surplus
(b) Which one of the following is the best example of the rationing function of the price mechanism? (1) A An increase in demand, leading to a rise in price, will encourage new firms to enter the market B Changes in price provide information to both producers and consumers C If a product is scarce, a rise in price is likely to make the shortage worse D When there is a shortage of a product, the price will rise and discourage some consumers from buying the product
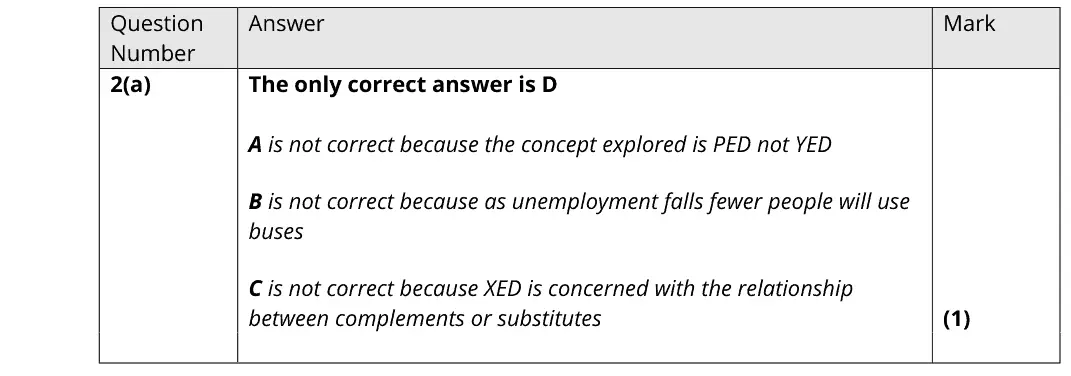
October 2020 · AS Paper 1 · Q2(a) 1 mark Multiple choice price elasticity of demand
(a) The income elasticity of demand for bus travel is estimated to be –1.5. This implies that: (1) A a 10% increase in fares will lead to a 15% decrease in passengers B as unemployment falls, more people will use buses C bus travel has a negative cross elasticity of demand compared to rail travel D bus travel is an inferior good
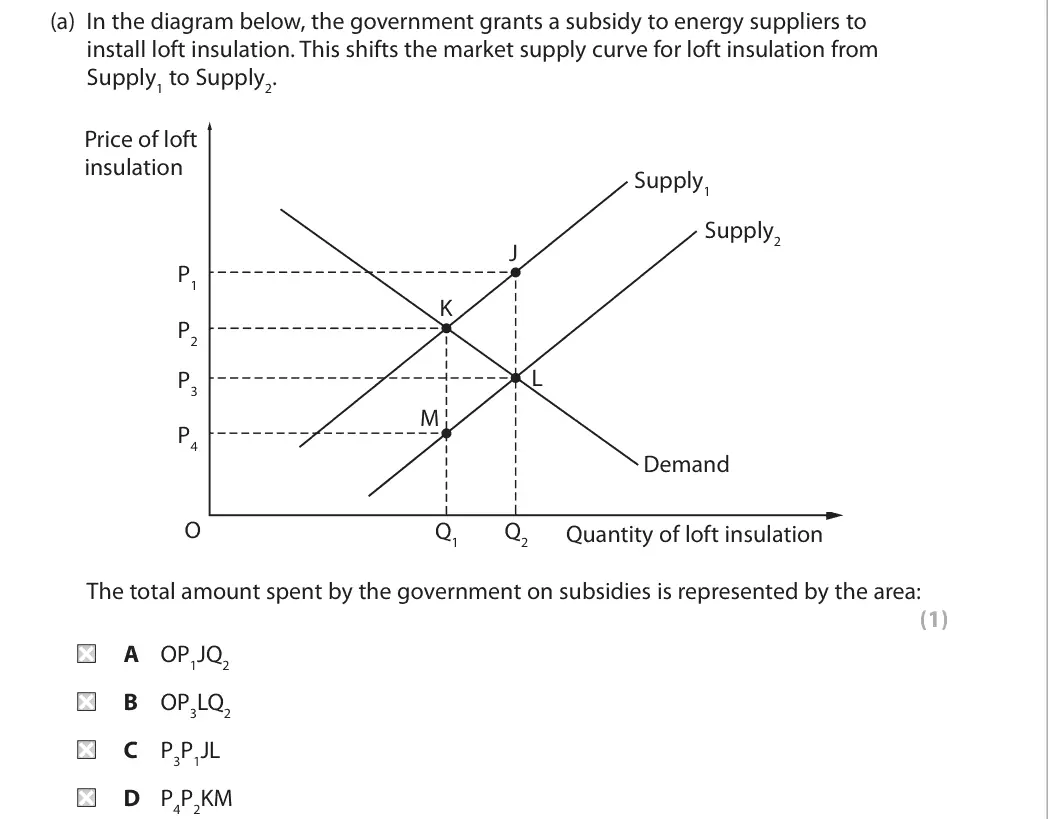
October 2020 · AS Paper 1 · Q3(a) 1 mark Multiple choice indirect taxes and subsidies
Data and extracts for question 33 The ‘Energy Company Obligation’ is the government’s term for its programme to make houses in the UK more energy efficient.
(a) In the diagram below, the government grants a subsidy to energy suppliers to install loft insulation. This shifts the market supply curve for loft insulation from Supply1 to Supply2. Price of loft insulation Supply1 Supply2 J P1 K P2 L P3 M P4 Demand O Q1 Q2 Quantity of loft insulation The total amount spent by the government on subsidies is represented by the area: (1) A OP1JQ2 B OP3LQ2 C P3P1JL D P4P2KM
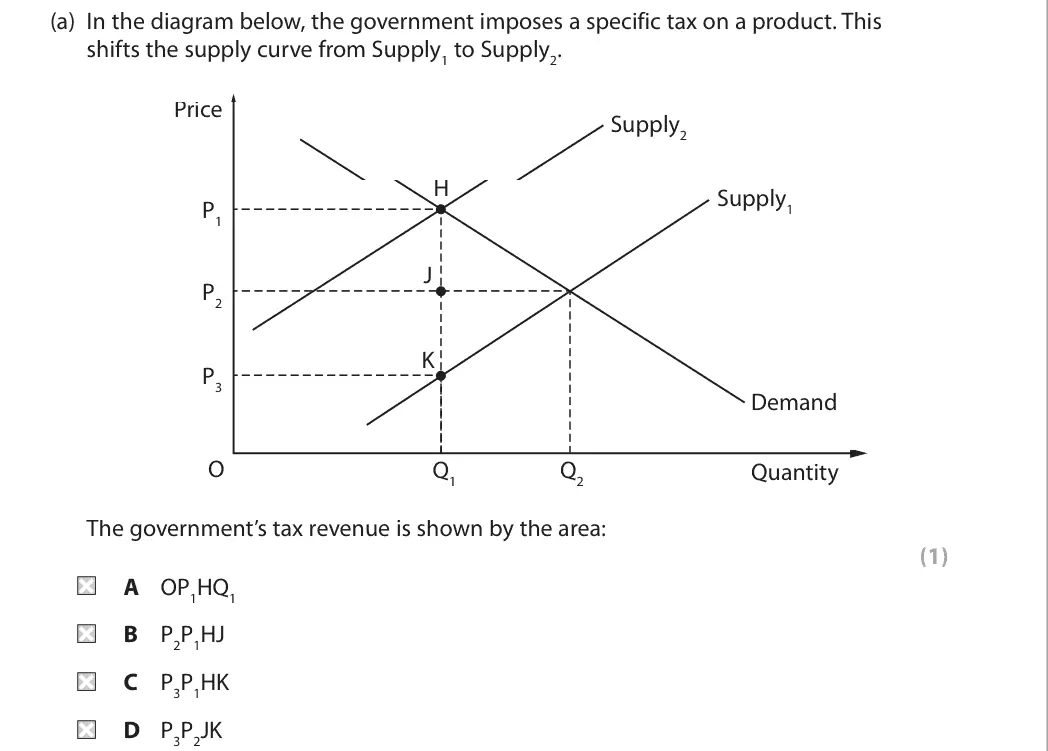
October 2020 · AS Paper 1 · Q4(a) 1 mark Multiple choice indirect taxes and subsidies
Data and extracts for question 44 The UK Government uses a range of indirect taxes to affect the market prices and quantities of many goods and services.
(a) In the diagram below, the government imposes a specific tax on a product. This shifts the supply curve from Supply1 to Supply2. Price Supply2 H Supply1 P1 J P2 K P3 Demand O Q1 Q2 Quantity The government’s tax revenue is shown by the area: (1) A OP1HQ1 B P2P1HJ C P3P1HK D P3P2JK
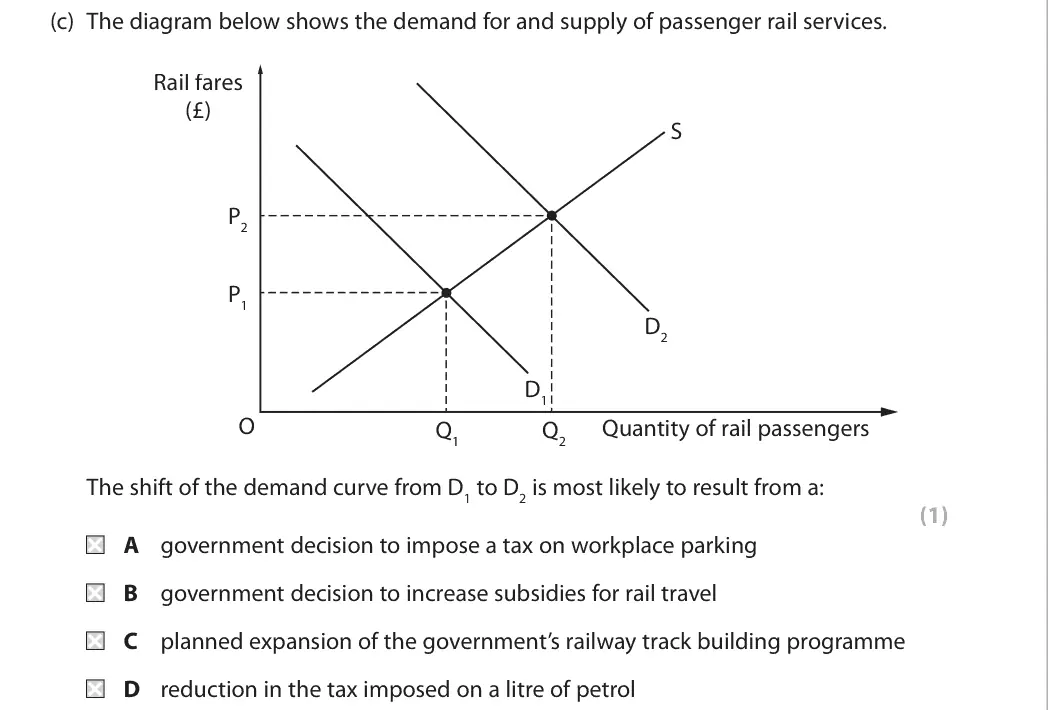
October 2020 · AS Paper 1 · Q5(c) 1 mark Multiple choice supply and demand
Data and extracts for question 55 HS2 is a high-speed rail network linking the north and south of England. HS2 will be four years late and cost double the Department for Transport’s original estimate. (Source: https://www.transportxtra.com/publications/local-transport-today/news /58459/hs2-will-be-four-years-late-and-cost-double-the-dft-s-estimate-mps-told)
(c) The diagram below shows the demand for and supply of passenger rail services. Rail fares (£) S P2 P1 D2 D1 O Quantity of rail passengers Q1 Q2 The shift of the demand curve from D1 to D2 is most likely to result from a: (1) A government decision to impose a tax on workplace parking B government decision to increase subsidies for rail travel C planned expansion of the government’s railway track building programme D reduction in the tax imposed on a litre of petrol
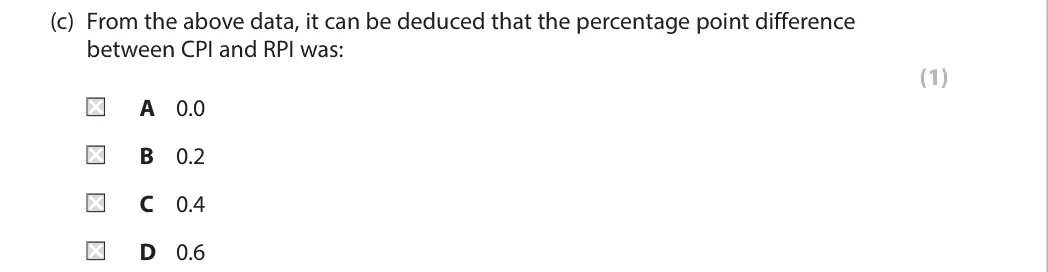
October 2020 · AS Paper 2 · Q1(c) 1 mark Multiple choice inflation
Data and extracts for question 11 In October 2019 the annual rate of inflation in the UK was 1.5%, as measured by the Consumer Prices Index (CPI), and 2.1%, as measured by the Retail Prices Index (RPI).
(c) From the above data, it can be deduced that the percentage point difference between CPI and RPI was: (1) A 0.0 B 0.2 C 0.4 D 0.6
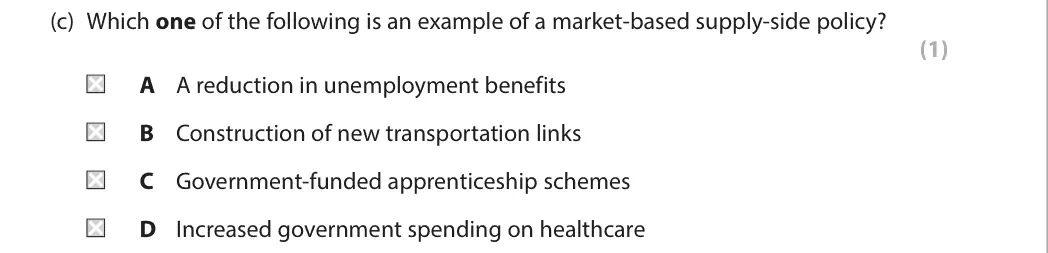
October 2020 · AS Paper 2 · Q2(c) 1 mark Multiple choice supply side policies
(c) Which one of the following is an example of a market-based supply-side policy? (1) A A reduction in unemployment benefits B Construction of new transportation links C Government-funded apprenticeship schemes D Increased government spending on healthcare
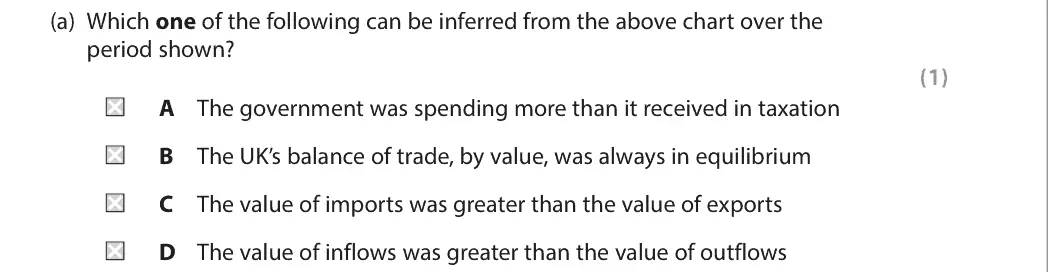
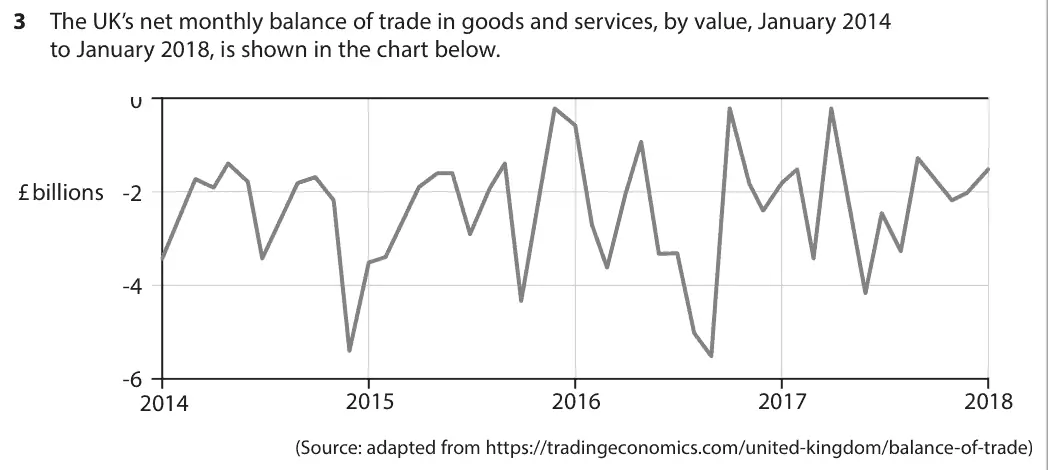
October 2020 · AS Paper 2 · Q3(a) 1 mark Multiple choice balance of payments
Data and extracts for question 33 The UK’s net monthly balance of trade in goods and services, by value, January 2014 to January 2018, is shown in the chart below. 2 0 £ billions -2 -4 -6 2015 2016 2017 2018 2014 (Source: adapted from https://tradingeconomics.com/united-kingdom/balance-of-trade)
(a) Which one of the following can be inferred from the above chart over the period shown? (1) A The government was spending more than it received in taxation B The UK’s balance of trade, by value, was always in equilibrium C The value of imports was greater than the value of exports D The value of inflows was greater than the value of outflows
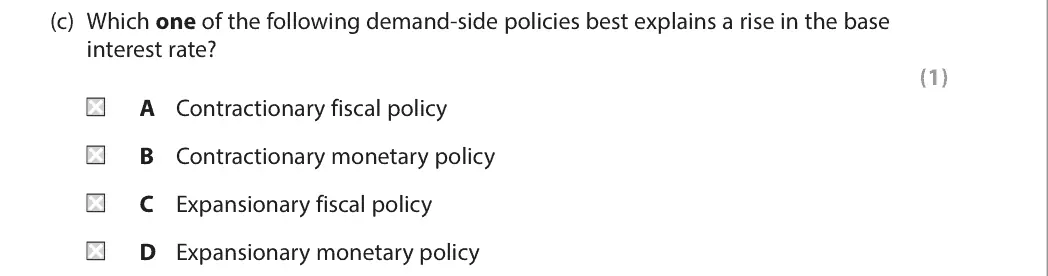
October 2020 · AS Paper 2 · Q4(c) 1 mark Multiple choice fiscal and monetary policy
Data and extracts for question 44 In August 2018 the Monetary Policy Committee of the Bank of England raised the UK’s base interest rate from 0.5% to 0.75%.
(c) Which one of the following demand-side policies best explains a rise in the base interest rate? (1) A Contractionary fiscal policy B Contractionary monetary policy C Expansionary fiscal policy D Expansionary monetary policy
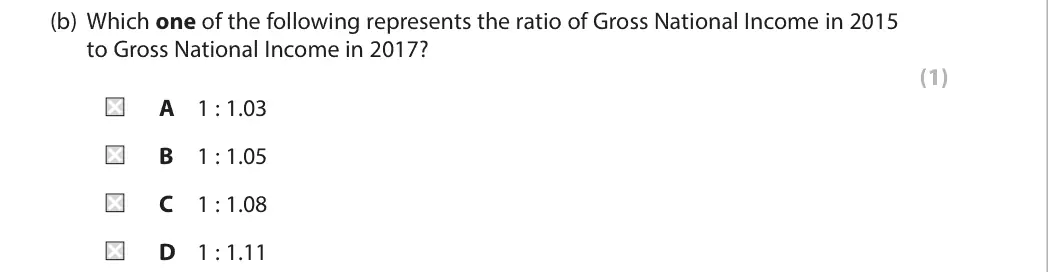
October 2020 · AS Paper 2 · Q5(b) 1 mark Multiple choice measuring economic growth
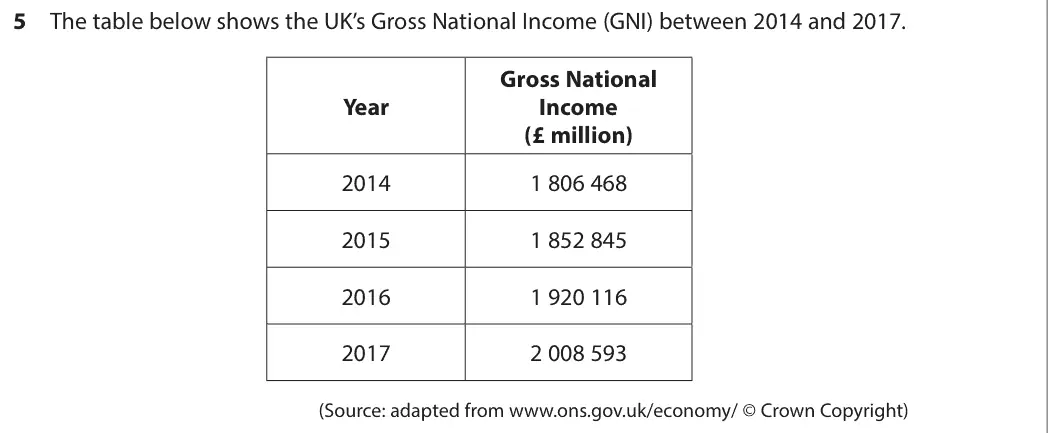
Data and extracts for question 55 The table below shows the UK’s Gross National Income (GNI) between 2014 and 2017. Gross National Year Income (£ million) 2014 1 806 468 2015 1 852 845 2016 1 920 116 2017 2 008 593 (Source: adapted from www.ons.gov.uk/economy/ © Crown Copyright)
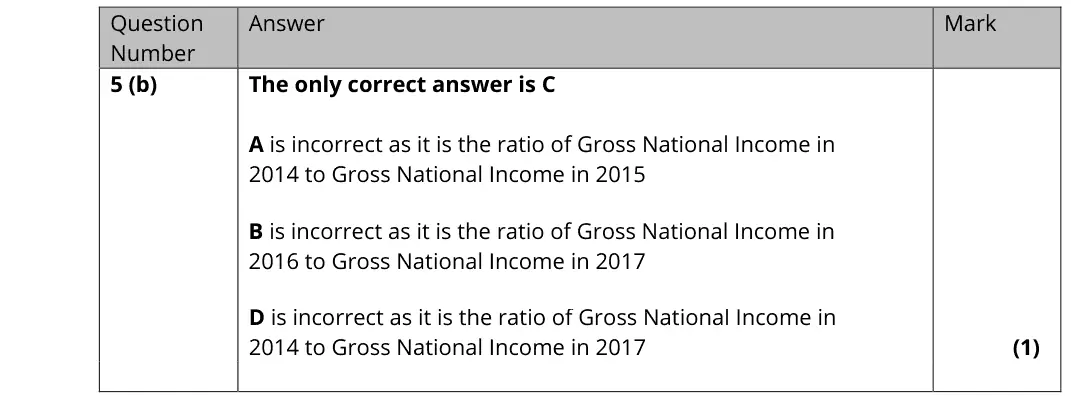
(b) Which one of the following represents the ratio of Gross National Income in 2015 to Gross National Income in 2017? (1) A 1 : 1.03 B 1 : 1.05 C 1 : 1.08 D 1 : 1.11
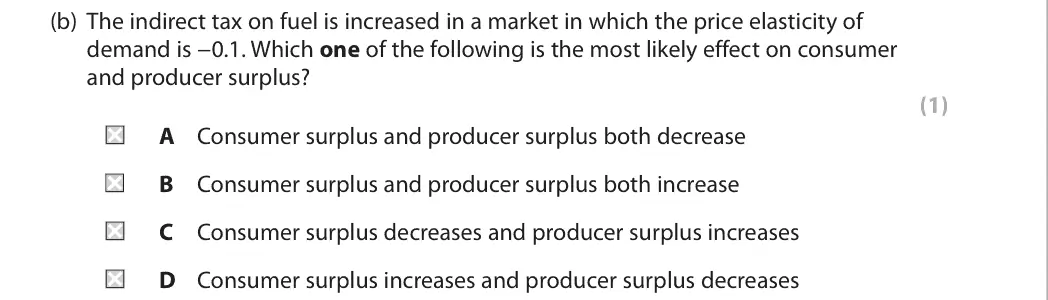
October 2020 · Paper 1 · Q1(b) 1 mark AO3=1 Multiple choice price mechanism and surplusindirect taxes and subsidies
Data and extracts for question 11 Fuel duty is an excise tax imposed on the sale of petrol, included in the price paid by consumers, set at 58 pence per litre. (Source: https://www.gov.uk/tax-on-shopping/fuel-duty)
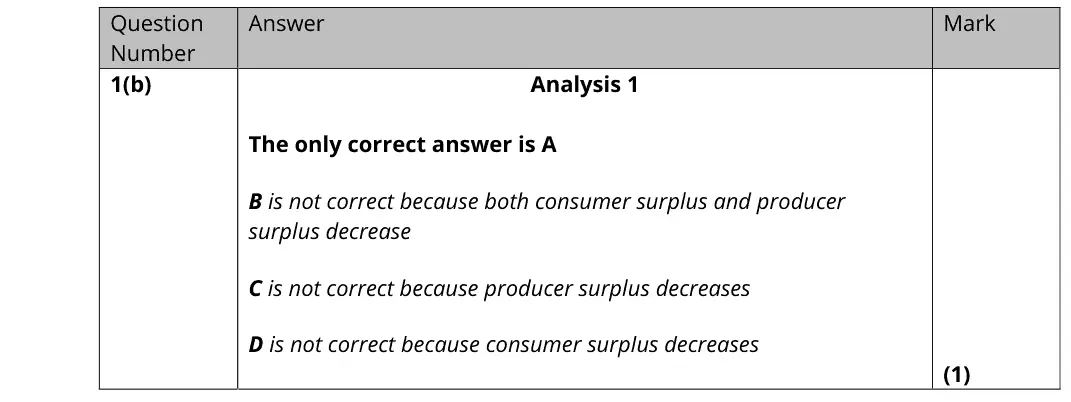
(b) The indirect tax on fuel is increased in a market in which the price elasticity of demand is -0.1. Which one of the following is the most likely effect on consumer and producer surplus? (1) A Consumer surplus and producer surplus both decrease B Consumer surplus and producer surplus both increase C Consumer surplus decreases and producer surplus increases D Consumer surplus increases and producer surplus decreases
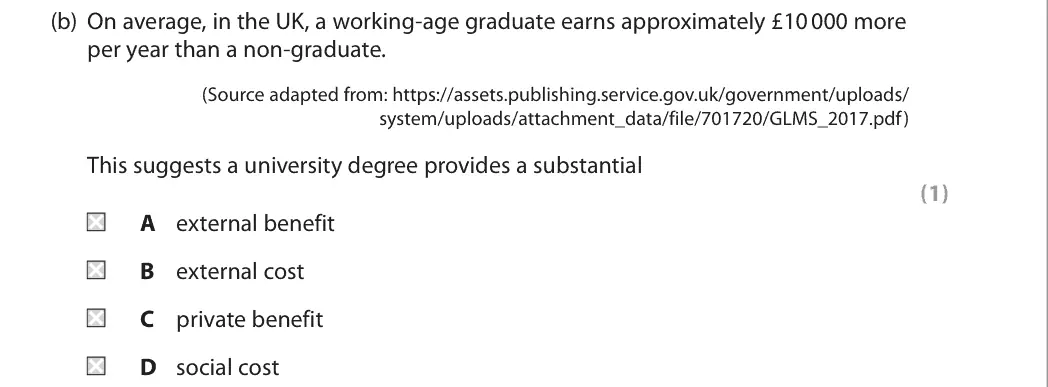
October 2020 · Paper 1 · Q2(b) 1 mark AO3=1 Multiple choice externalities
Data and extracts for question 22 The external benefits of higher education include increased tax revenue, faster economic growth, greater innovation and labour market flexibility. (Source adapted from: https://www.timeshighereducation.com/news/higher-education-its- good-for-you-and-society/2008681.article#survey-answer)
(b) On average, in the UK, a working-age graduate earns approximately £10 000 more per year than a non-graduate. (Source adapted from: https://assets.publishing.service.gov.uk/government/uploads/ system/uploads/attachment_data/file/701720/GLMS_2017.pdf) This suggests a university degree provides a substantial (1) A external benefit B external cost C private benefit D social cost
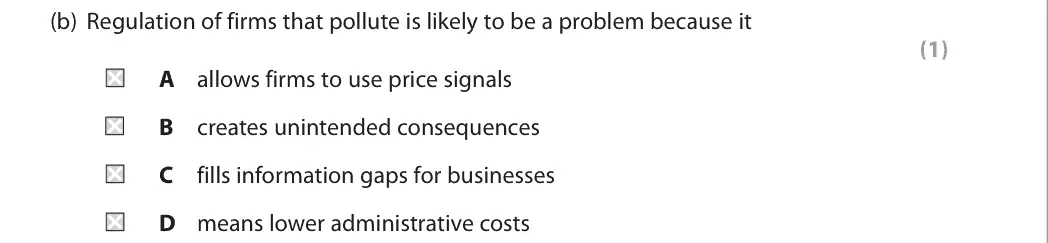
October 2020 · Paper 1 · Q3(b) 1 mark AO3=1 Multiple choice government failure
Data and extracts for question 33 The EU tradable pollution permits scheme is expected to become more effective by 2020, due to recent reductions in the number of tradable pollution permits. (Source adapted from: https://ec.europa.eu/clima/policies/ets_en)
(b) Regulation of firms that pollute is likely to be a problem because it (1) A allows firms to use price signals B creates unintended consequences C fills information gaps for businesses D means lower administrative costs
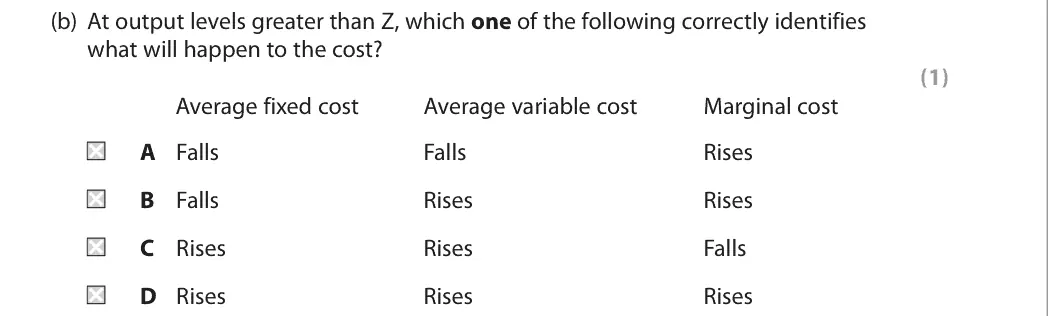
October 2020 · Paper 1 · Q4(b) 1 mark AO2=1 Multiple choice revenues costs and profits
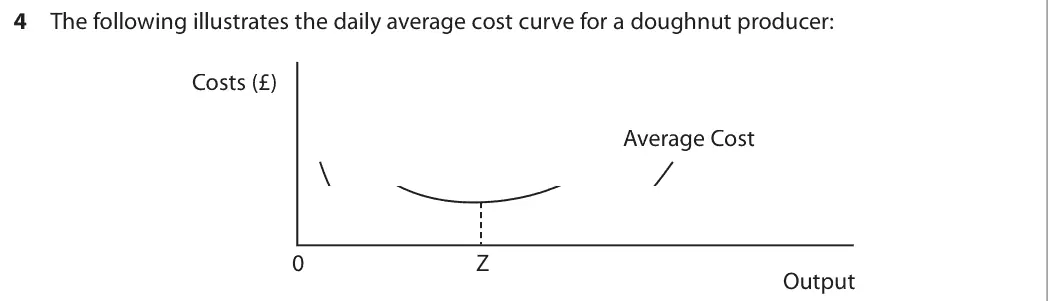
Data and extracts for question 44 The following illustrates the daily average cost curve for a doughnut producer: Costs (£) Average Cost 0 Z Output
(b) At output levels greater than Z, which one of the following correctly identifies what will happen to the cost? (1) Average fixed cost Average variable cost Marginal cost A Falls Falls Rises B Falls Rises Rises C Rises Rises Falls D Rises Rises Rises
October 2020 · Paper 1 · Q5(c) 1 mark AO2=1 Multiple choice business growth and objectives
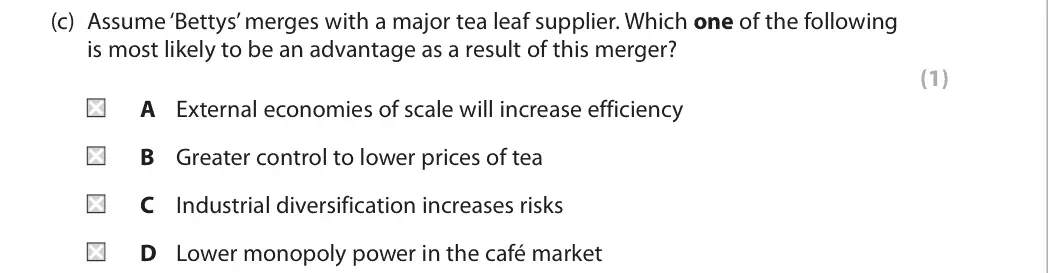
Data and extracts for question 55 ‘Bettys’ is a luxury café, first opened in Harrogate in 1919 specialising in afternoon tea service. Since then it has opened a further five branches in Yorkshire. It has no plans to increase the number of cafés. The six branches have 2 million customers a year. (Source adapted from: https://www.forbes.com/sites/sarahturner/2018/03/22/the-famed-yorkshire-cafe- that-blends-nostalgia-with-profits-and-conservation/#7eb50cec7a4e)
(c) Assume ‘Bettys’ merges with a major tea leaf supplier. Which one of the following is most likely to be an advantage as a result of this merger? (1) A External economies of scale will increase efficiency B Greater control to lower prices of tea C Industrial diversification increases risks D Lower monopoly power in the café market
October 2020 · Paper 2 · Q1(c) 1 mark AO2=1 Multiple choice measuring economic growth
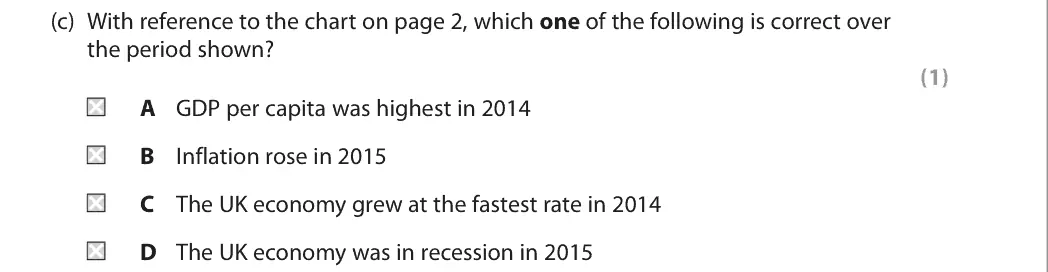
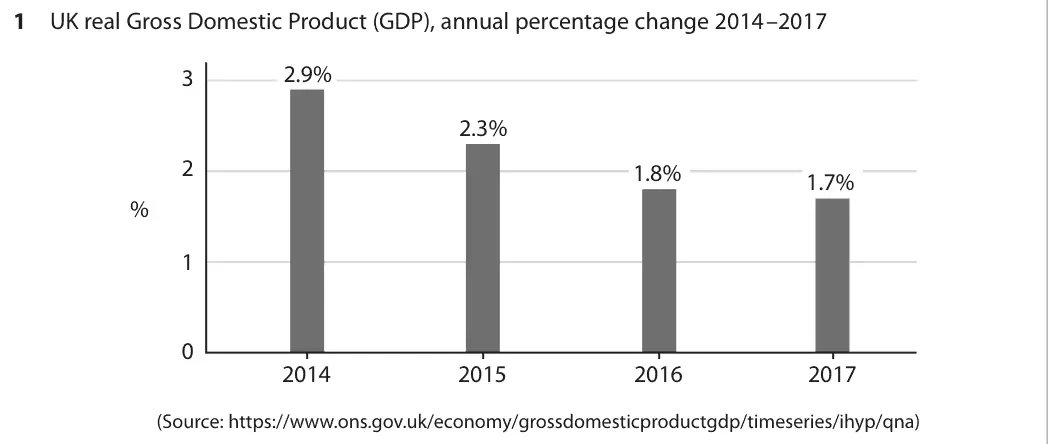
Data and extracts for question 11 UK real Gross Domestic Product (GDP), annual percentage change 2014–2017 2.9% 3 2.3% 2 1.8% 1.7% % 1 0 2014 2015 2016 2017 (Source: https://www.ons.gov.uk/economy/grossdomesticproductgdp/timeseries/ihyp/qna)
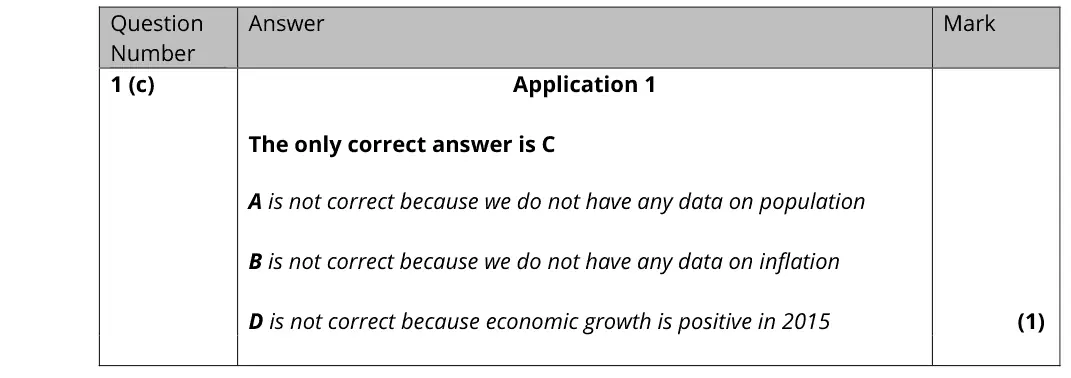
(c) With reference to the chart on page 2, which one of the following is correct over the period shown? (1) A GDP per capita was highest in 2014 B Inflation rose in 2015 C The UK economy grew at the fastest rate in 2014 D The UK economy was in recession in 2015
October 2020 · Paper 2 · Q2(a) 1 mark Multiple choice national income and the multiplier
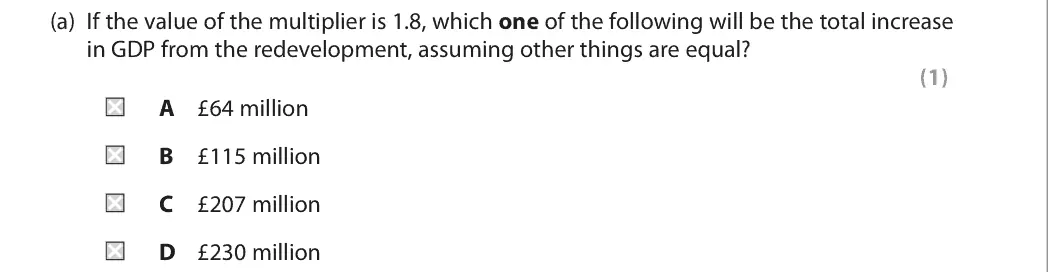
Data and extracts for question 22 The planned investment in the redevelopment of Dover Port will cost £115 million. The Chief Executive said it will lead to many ‘new job opportunities for local people and a transformed waterfront experience’ with new cafés, bars, and shops. (Source adapted from: https://www.kentonline.co.uk/dover/news/docklands‑ redevelopment‑work‑to‑start‑118581/)
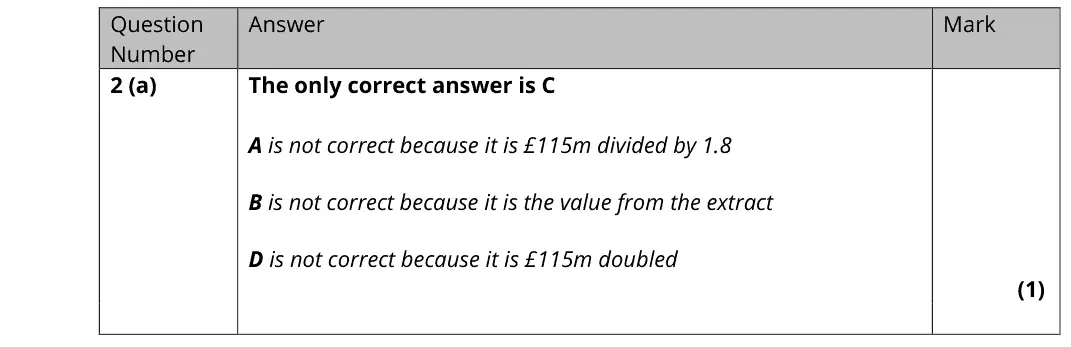
(a) If the value of the multiplier is 1.8, which one of the following will be the total increase in GDP from the redevelopment, assuming other things are equal? (1) A £64 million B £115 million C £207 million D £230 million
October 2020 · Paper 2 · Q3(b) 1 mark Multiple choice exchange rates
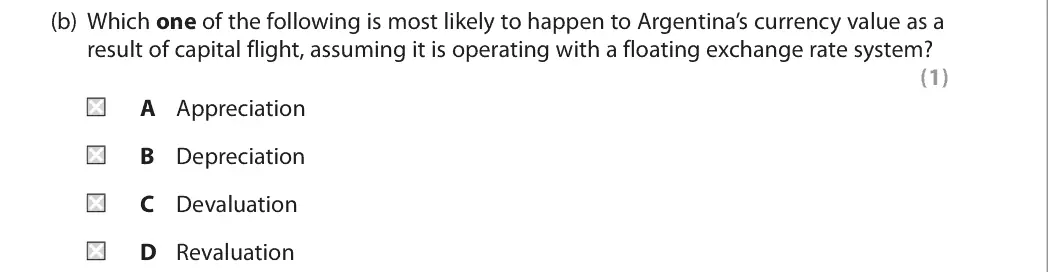
Data and extracts for question 33 In 2018, the International Monetary Fund (IMF) lent Argentina $57 billion as part of a bailout package to help prevent the country’s government defaulting on its debts. This financial crisis also caused significant capital flight out of Argentina’s economy. (Source adapted from: https://www.ft.com/content/737b48bc‑c1c9‑11e8‑95b1‑d36dfef1b89a)
(b) Which one of the following is most likely to happen to Argentina’s currency value as a result of capital flight, assuming it is operating with a floating exchange rate system? (1) A Appreciation B Depreciation C Devaluation D Revaluation
October 2020 · Paper 2 · Q4(c) 1 mark Multiple choice unemployment
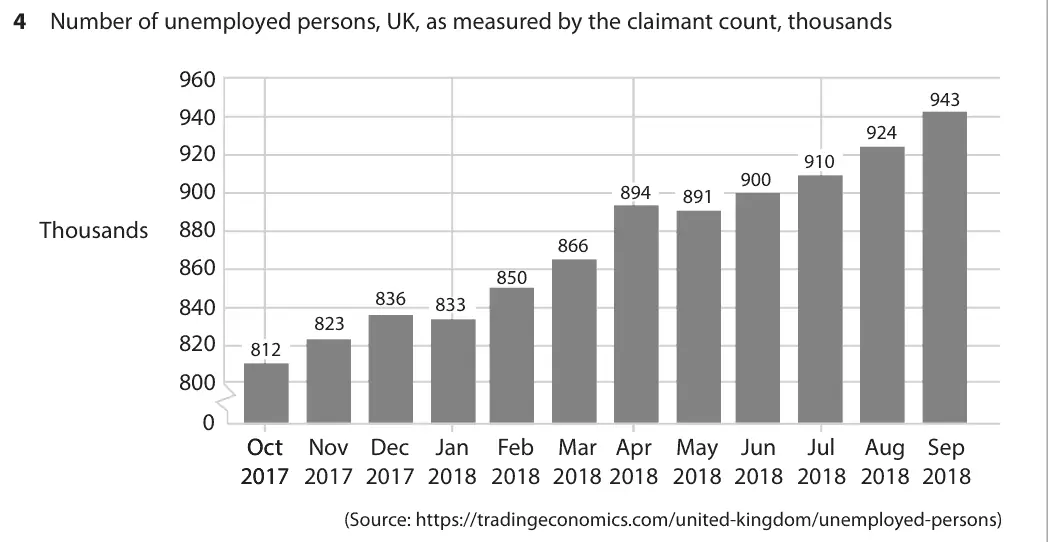
Data and extracts for question 44 Number of unemployed persons, UK, as measured by the claimant count, thousands 960 943 940 924 920 910 900 900 894 891 880 Thousands 866 860 850 836 840 833 823 820 812 800 0 O Oc tc Nov Dec Jan Feb Mar Apr May Jun Jul Aug Sep 2 2 0 0 1 1 7 7 2017 2017 2018 2018 2018 2018 2018 2018 2018 2018 2018 (Source: https://tradingeconomics.com/united‑kingdom/unemployed‑persons)
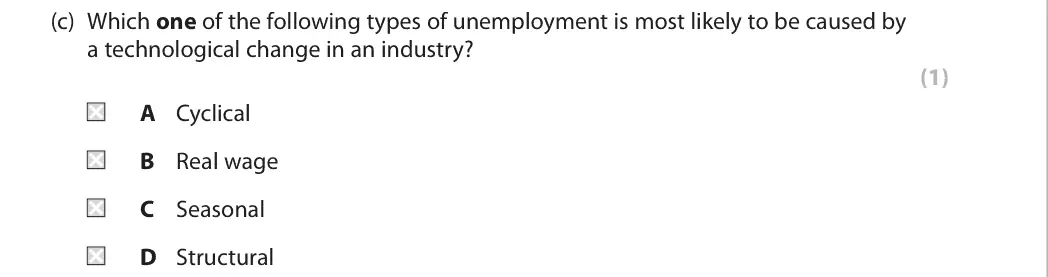
(c) Which one of the following types of unemployment is most likely to be caused by a technological change in an industry? (1) A Cyclical B Real wage C Seasonal D Structural
October 2020 · Paper 2 · Q5(b) 1 mark Multiple choice economic growth and the trade cycle
Data and extracts for question 55 The Hong Kong‑Zhuhai‑Macau Bridge is the world’s longest sea bridge. It reduces the journey time from Hong Kong to Zhuhai from 4 hours to just 30 minutes. It cost the equivalent of $18.8 billion and was government funded. (Source adapted from: www.theguardian.com)
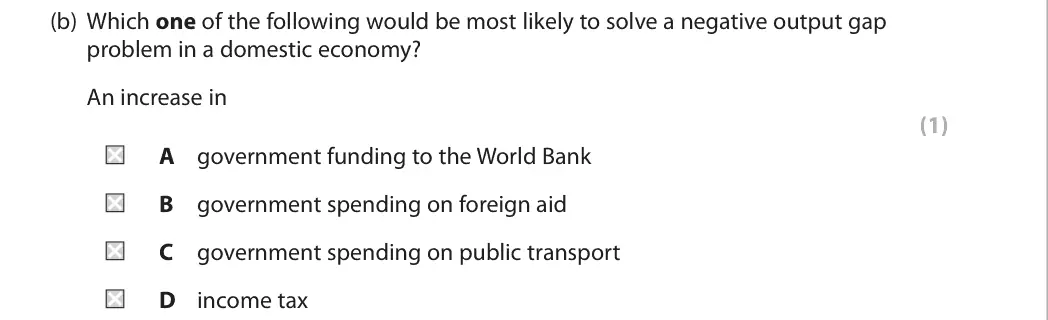
(b) Which one of the following would be most likely to solve a negative output gap problem in a domestic economy? An increase in (1) A government funding to the World Bank B government spending on foreign aid C government spending on public transport D income tax
June 2019 · AS Paper 1 · Q1(a) 1 mark AO1=1 Multiple choice specialisation and division of labour
Data and extracts for question 11 Henry Ford designed his first moving assembly line in 1913, and revolutionised the car production process of the Ford Model T. This assembly line, at the first Ford factory, became the benchmark for mass production methods around the world. (Source: adapted from https://www.ford.co.uk/experience-ford/history-and-heritage)
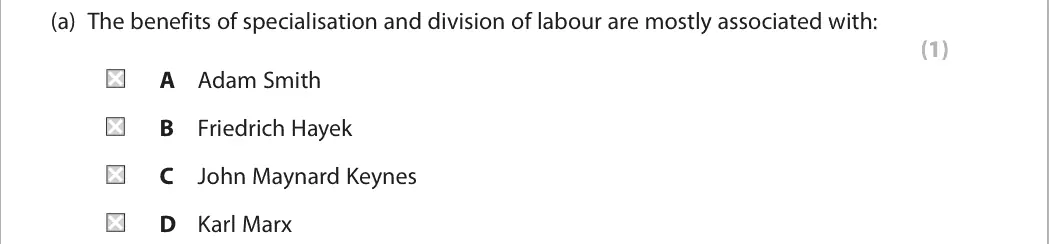
(a) The benefits of specialisation and division of labour are mostly associated with: (1) A Adam Smith B Friedrich Hayek C John Maynard Keynes D Karl Marx
June 2019 · AS Paper 1 · Q2(b) 1 mark AO1=1 Multiple choice supply and demand
Data and extracts for question 22 The consensus that diesel emissions are bad for health has led to many cities planning to ban diesel vehicles from their centres. The mayors of Paris, Mexico City, Madrid and Athens have said they intend to ban these vehicles by 2025. (Source: adapted from http://www.autoexpress.co.uk/car-news/consumer-news/98747/ diesel-ban-clean-air-zone-expansion-could-see-diesel-cars-charged-to)
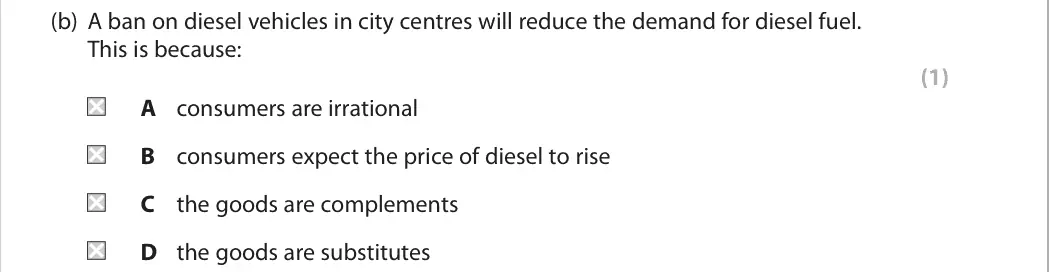
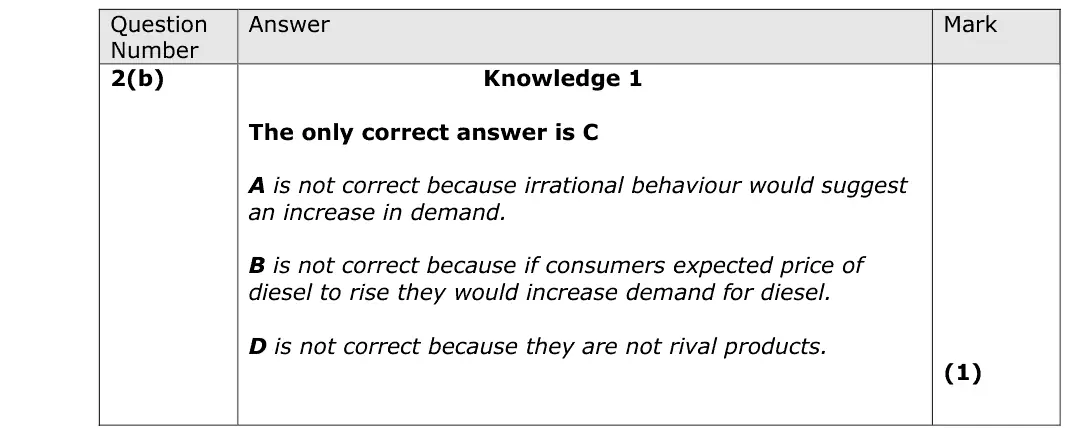
(b) A ban on diesel vehicles in city centres will reduce the demand for diesel fuel. This is because: (1) A consumers are irrational B consumers expect the price of diesel to rise C the goods are complements D the goods are substitutes
June 2019 · AS Paper 1 · Q3(a) 1 mark AO2=1 Multiple choice price elasticity of demand
Data and extracts for question 33 Amazon Prime, Netflix and NowTV all charge £7.99 per month for streaming very similar film and television services.
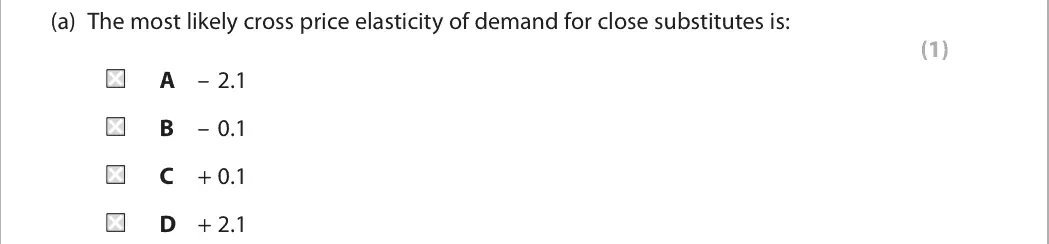
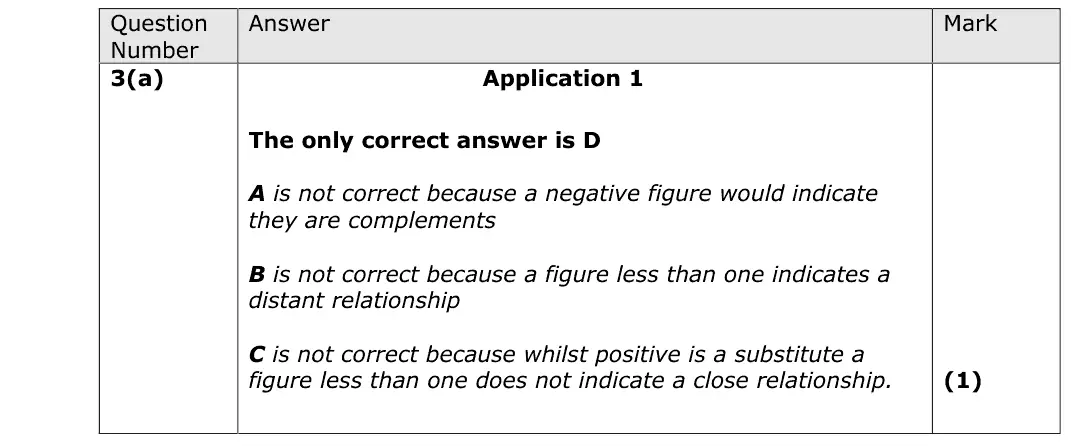
(a) The most likely cross price elasticity of demand for close substitutes is: (1) A – 2.1 B – 0.1 C + 0.1 D + 2.1
June 2019 · AS Paper 1 · Q4(a) 1 mark AO2=1 Multiple choice indirect taxes and subsidies
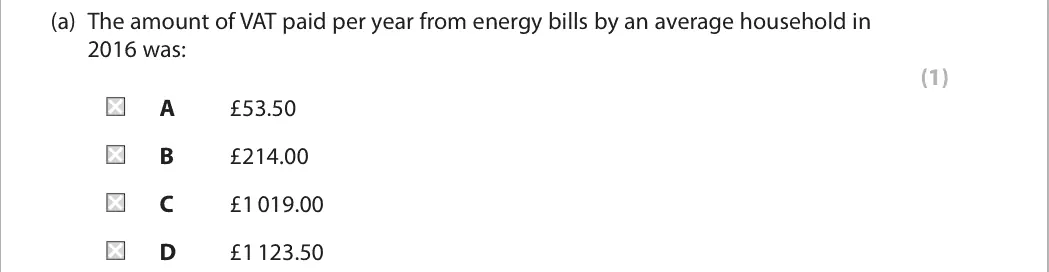
Data and extracts for question 44 In 2016 the average energy bill per household was £1 070 per year, excluding VAT, an indirect tax charged at 5%. (Source: adapted from ©Crown Copyright https://www.ofgem.gov.uk/ publications-and-updates/infographic-bills-prices-and-profits)
(a) The amount of VAT paid per year from energy bills by an average household in 2016 was: (1) A £53.50 B £214.00 C £1 019.00 D £1 123.50
June 2019 · AS Paper 1 · Q5(a) 1 mark AO2=1 Multiple choice price elasticity of demand
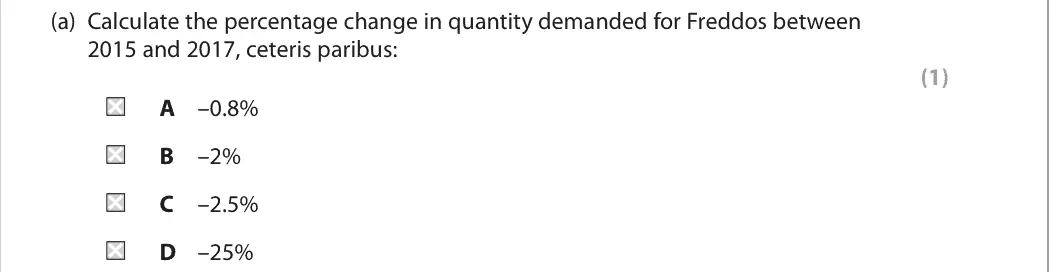
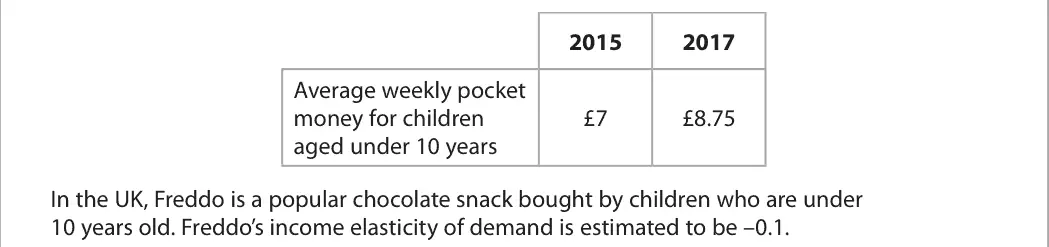
Data and extracts for question 55 2015 2017 Average weekly pocket money for children £7 £8.75 aged under 10 years In the UK, Freddo is a popular chocolate snack bought by children who are under 10 years old. Freddo’s income elasticity of demand is estimated to be –0.1.
(a) Calculate the percentage change in quantity demanded for Freddos between 2015 and 2017, ceteris paribus: (1) A –0.8% B –2% C –2.5% D –25%
June 2019 · AS Paper 2 · Q1(c) 1 mark Multiple choice national income and the multiplier
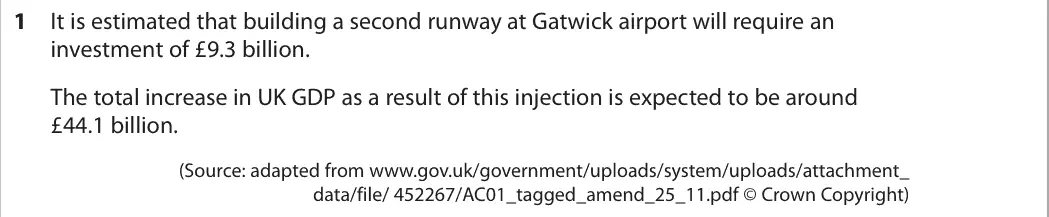
Data and extracts for question 11 It is estimated that building a second runway at Gatwick airport will require an investment of £9.3 billion. The total increase in UK GDP as a result of this injection is expected to be around £44.1 billion. (Source: adapted from www.gov.uk/government/uploads/system/uploads/attachment_ data/file/ 452267/AC01_tagged_amend_25_11.pdf © Crown Copyright)
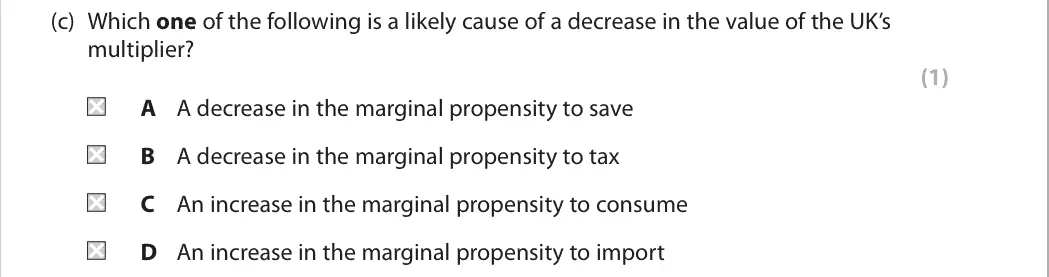
(c) Which one of the following is a likely cause of a decrease in the value of the UK’s multiplier? (1) A A decrease in the marginal propensity to save B A decrease in the marginal propensity to tax C An increase in the marginal propensity to consume D An increase in the marginal propensity to import
June 2019 · AS Paper 2 · Q2(c) 1 mark Multiple choice aggregate supply
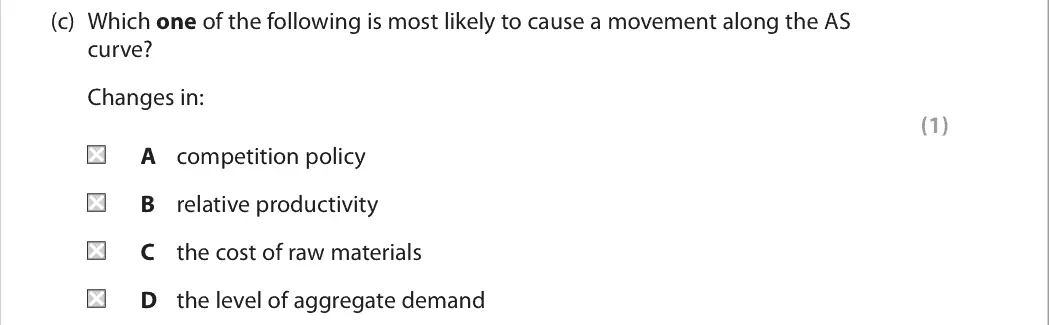
(c) Which one of the following is most likely to cause a movement along the AS curve? Changes in: (1) A competition policy B relative productivity C the cost of raw materials D the level of aggregate demand
June 2019 · AS Paper 2 · Q3(b) 1 mark Multiple choice supply side policies
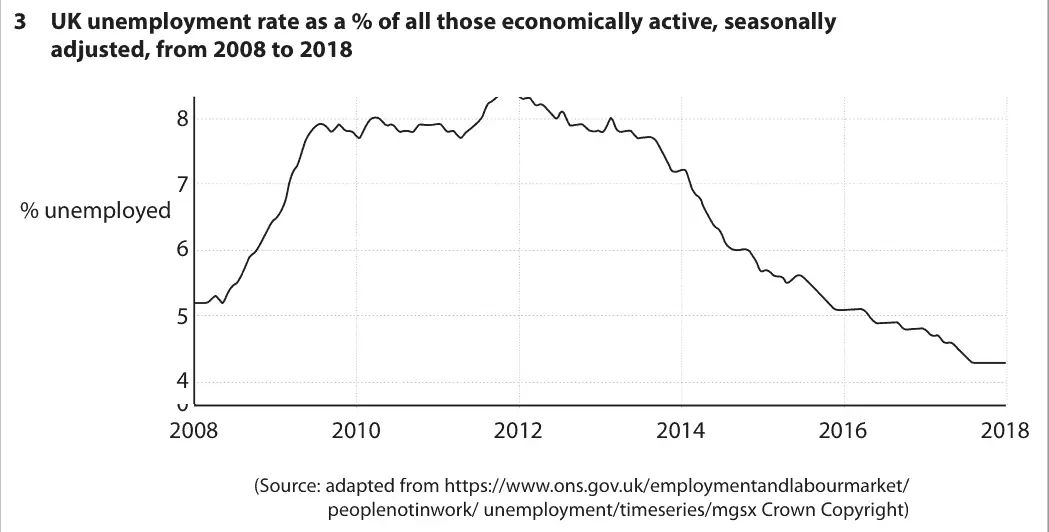
Data and extracts for question 33 UK unemployment rate as a % of all those economically active, seasonally adjusted, from 2008 to 2018 9 8 7 % unemployed 6 5 4 0 2008 2010 2012 2014 2016 2018 (Source: adapted from https://www.ons.gov.uk/employmentandlabourmarket/ peoplenotinwork/ unemployment/timeseries/mgsx Crown Copyright)
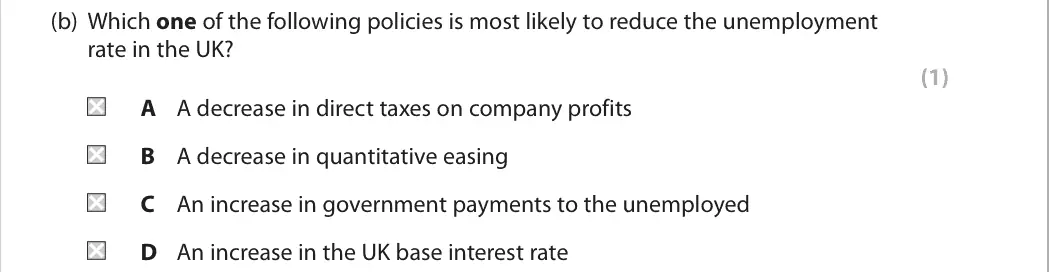
(b) Which one of the following policies is most likely to reduce the unemployment rate in the UK? (1) A A decrease in direct taxes on company profits B A decrease in quantitative easing C An increase in government payments to the unemployed D An increase in the UK base interest rate
June 2019 · AS Paper 2 · Q4(c) 1 mark Multiple choice supply side policies
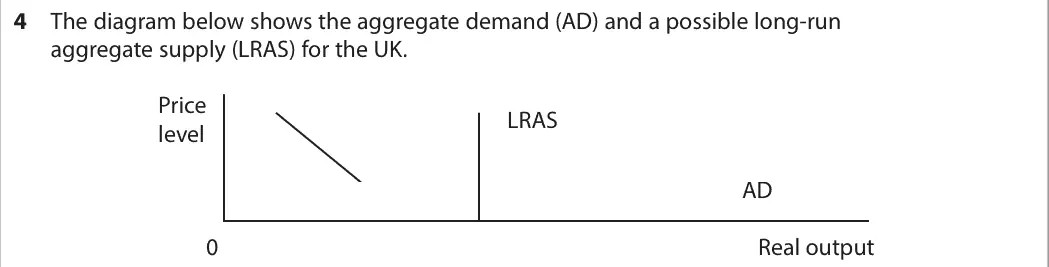
Data and extracts for question 44 The diagram below shows the aggregate demand (AD) and a possible long-run aggregate supply (LRAS) for the UK. Price LRAS level AD 0 Real output
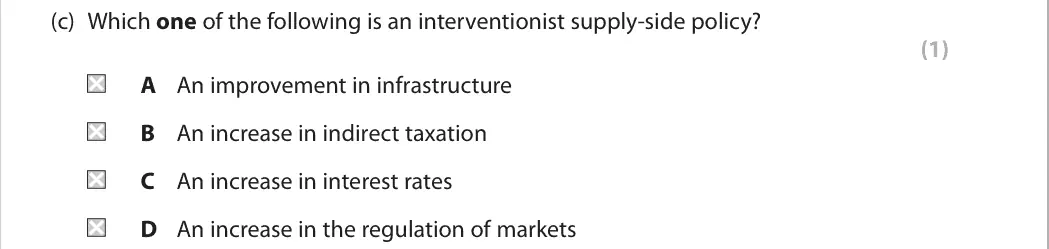
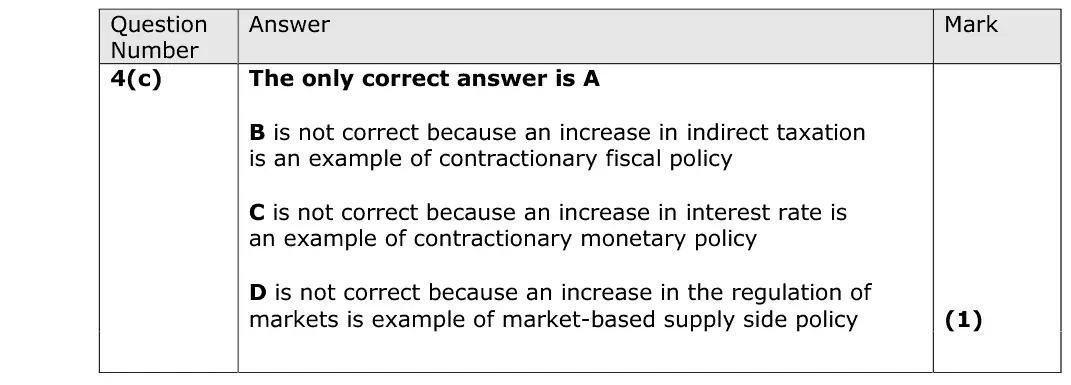
(c) Which one of the following is an interventionist supply-side policy? (1) A An improvement in infrastructure B An increase in indirect taxation C An increase in interest rates D An increase in the regulation of markets
June 2019 · AS Paper 2 · Q5(a) 1 mark Multiple choice aggregate demand
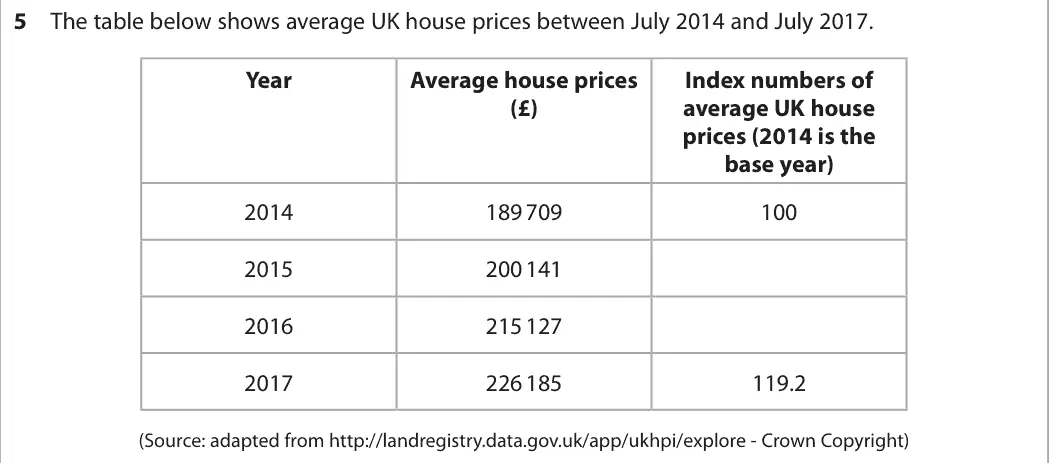
Data and extracts for question 55 The table below shows average UK house prices between July 2014 and July 2017. Year Average house prices Index numbers of (£) average UK house prices (2014 is the base year) 2014 189 709 100 2015 200 141 2016 215 127 2017 226 185 119.2 (Source: adapted from http://landregistry.data.gov.uk/app/ukhpi/explore - Crown Copyright)
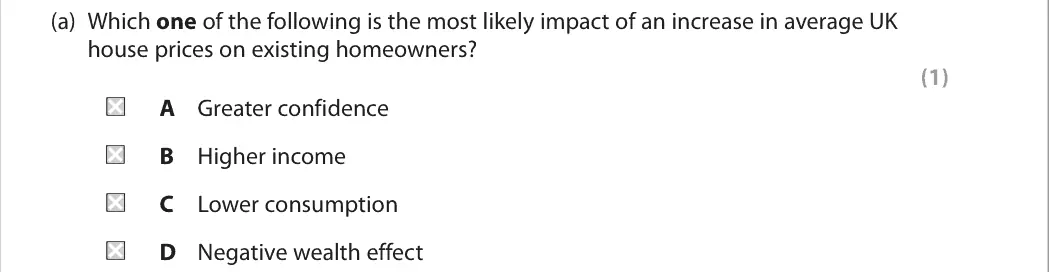
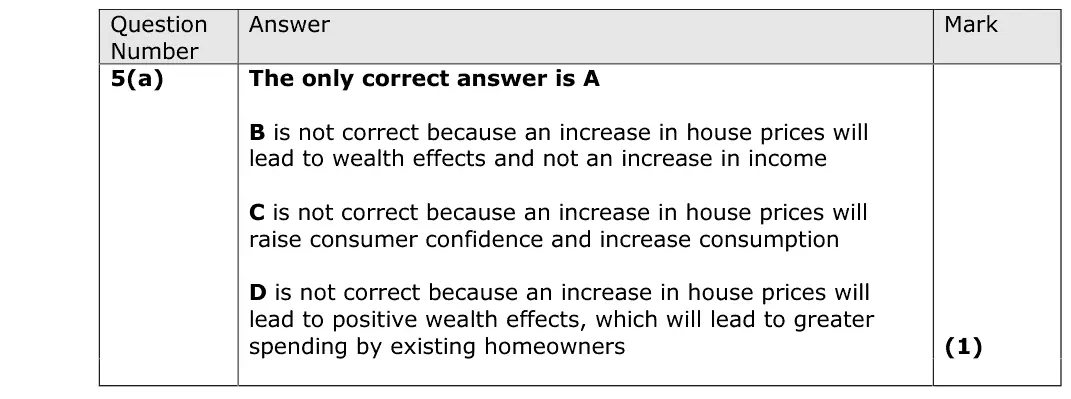
(a) Which one of the following is the most likely impact of an increase in average UK house prices on existing homeowners? (1) A Greater confidence B Higher income C Lower consumption D Negative wealth effect
June 2019 · Paper 1 · Q1(b) 1 mark AO2=1 Multiple choice elasticity of supply
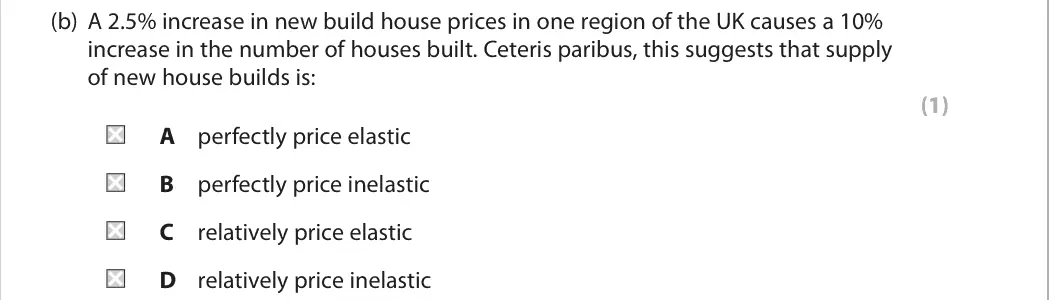
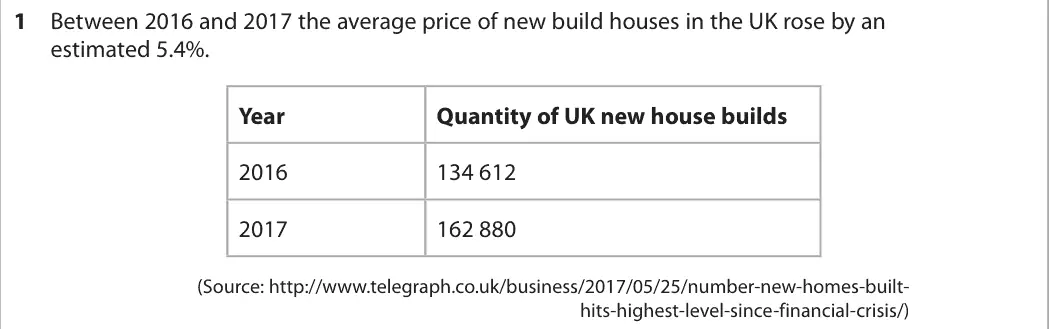
Data and extracts for question 11 Between 2016 and 2017 the average price of new build houses in the UK rose by an estimated 5.4%. Year Quantity of UK new house builds 2016 134 612 2017 162 880 (Source: http://www.telegraph.co.uk/business/2017/05/25/number-new-homes-built- hits-highest-level-since-financial-crisis/)
(b) A 2.5% increase in new build house prices in one region of the UK causes a 10% increase in the number of houses built. Ceteris paribus, this suggests that supply of new house builds is: (1) A perfectly price elastic B perfectly price inelastic C relatively price elastic D relatively price inelastic
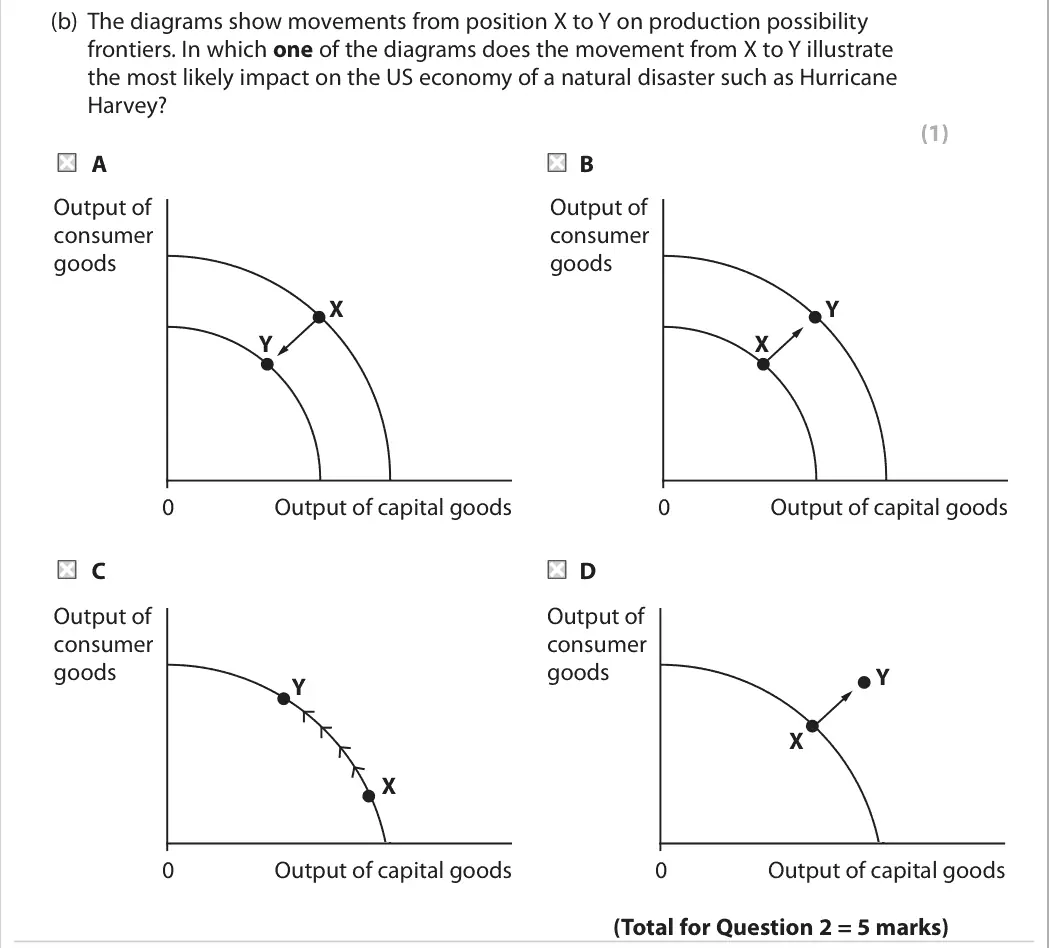
June 2019 · Paper 1 · Q2(b) 1 mark AO3=1 Multiple choice production possibility frontiers
Data and extracts for question 22 In August 2017 Hurricane Harvey caused the closure of nearly a quarter of the oil production capacity in the United States.
(b) The diagrams show movements from position X to Y on production possibility frontiers. In which one of the diagrams does the movement from X to Y illustrate the most likely impact on the US economy of a natural disaster such as Hurricane Harvey? (1) A B Output of Output of consumer consumer goods goods X Y Y X 0 Output of capital goods 0 Output of capital goods C D Output of Output of consumer consumer goods goods Y Y X X 0 Output of capital goods 0 Output of capital goods
June 2019 · Paper 1 · Q3(a) 1 mark AO3=1 Multiple choice market structures and efficiency
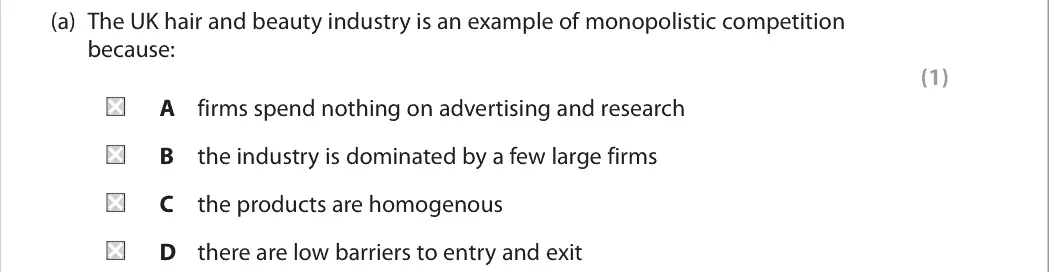
Data and extracts for question 33 According to the Royal Mail, more hair and beauty salons opened on UK high streets last year than any other type of independent business, with a net increase of 10%, representing 626 new salons. (Source: adapted from https://www.theguardian.com/small-business-network/2016/nov/18/ beauty-boom-or-bust-uk-too-many-salons)
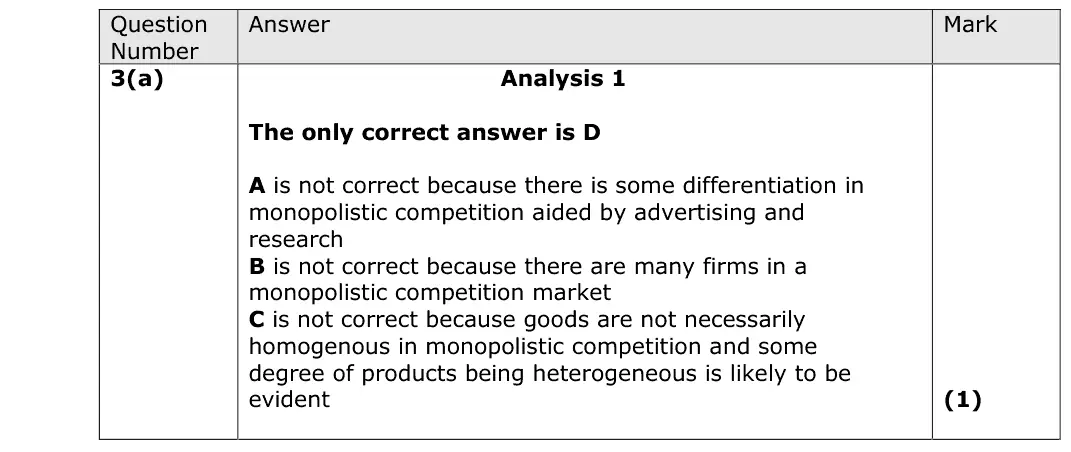
(a) The UK hair and beauty industry is an example of monopolistic competition because: (1) A firms spend nothing on advertising and research B the industry is dominated by a few large firms C the products are homogenous D there are low barriers to entry and exit
June 2019 · Paper 1 · Q4(a) 1 mark AO3=1 Multiple choice business growth and objectives
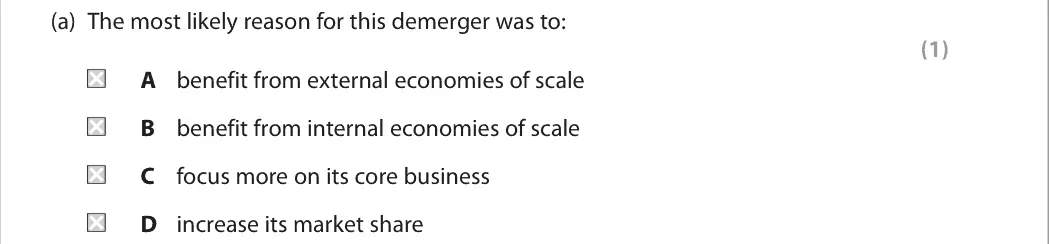
Data and extracts for question 44 In 2016, the insurance group Esure undertook a demerger with its GoCompare price comparison website.
(a) The most likely reason for this demerger was to: (1) A benefit from external economies of scale B benefit from internal economies of scale C focus more on its core business D increase its market share
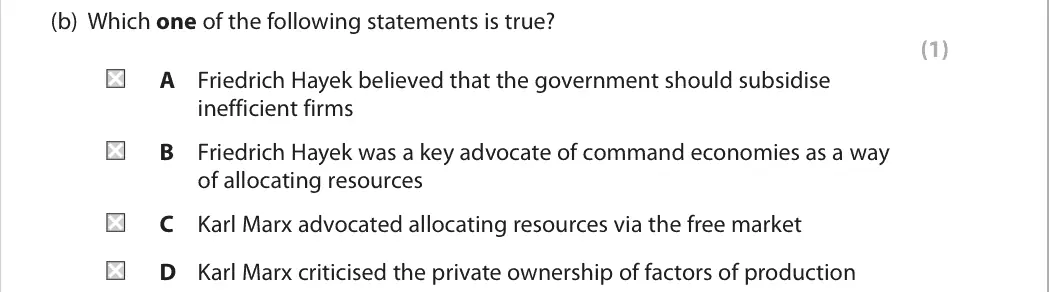
June 2019 · Paper 1 · Q5(b) 1 mark AO1=1 Multiple choice economic systems
Data and extracts for question 55 Free market economics is being challenged. The arguments for and against are being increasingly discussed within many countries.
(b) Which one of the following statements is true? (1) A Friedrich Hayek believed that the government should subsidise inefficient firms B Friedrich Hayek was a key advocate of command economies as a way of allocating resources C Karl Marx advocated allocating resources via the free market D Karl Marx criticised the private ownership of factors of production
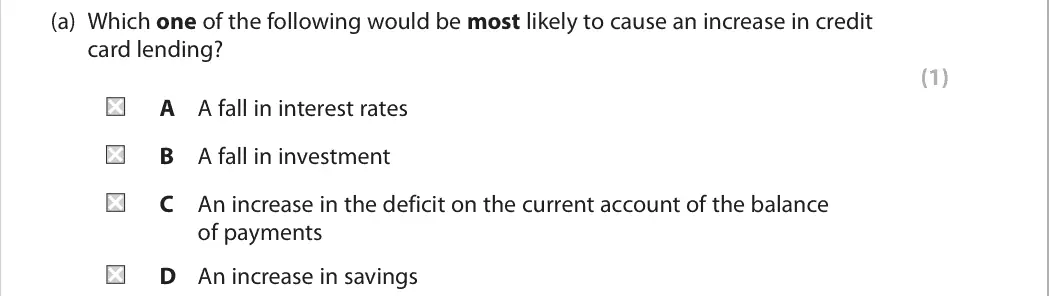
June 2019 · Paper 2 · Q1(a) 1 mark Multiple choice aggregate demand
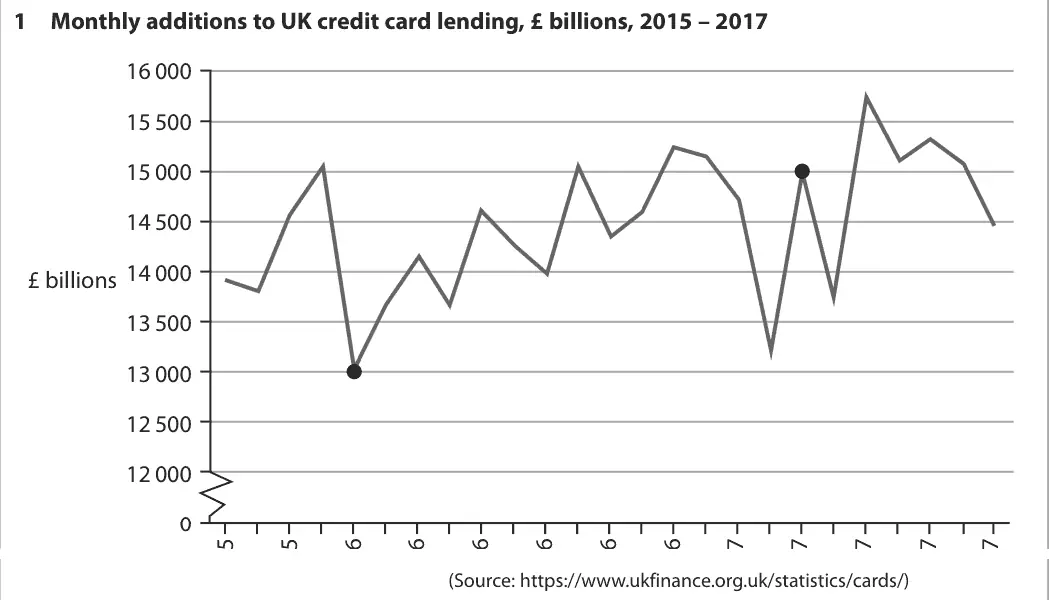
Data and extracts for question 11 Monthly additions to UK credit card lending, £ billions, 2015 – 2017 16 000 15 500 15 000 14 500 14 000 £ billions 13 500 13 000 12 500 12 000 0 (Source: https://www.ukfinance.org.uk/statistics/cards/)
(a) Which one of the following would be most likely to cause an increase in credit card lending? (1) A A fall in interest rates B A fall in investment C An increase in the deficit on the current account of the balance of payments D An increase in savings
June 2019 · Paper 2 · Q2(b) 1 mark Multiple choice aggregate demand
Data and extracts for question 22 The International Monetary Fund has called on the G20 group of large industrialised countries to boost government spending on infrastructure. (Source: https://www.theguardian.com/business/2016/jul/23/ imf-calls-for-more-government-spending-as-rate-cuts-lose-their-impact)
(b) Which one of the following would be an example of government spending on infrastructure? (1) An increase in: A construction work on new railway lines B interest payments on the national debt C salaries for teachers D unemployment benefit payments
June 2019 · Paper 2 · Q3(c) 1 mark Multiple choice international competitiveness
Data and extracts for question 33 Unit labour costs for selected European countries, 2017, base year 2010 = 100. Country Unit labour costs Austria 113 Hungary 120 Estonia 129 France 107 (Source: http://www.oecd-ilibrary.org/economics/data/labour/unit-labour- cost-quarterly-indicators-early-estimates_data-00607-en)
(c) The increase in Austria’s unit labour costs between 2010 and 2017 is: (1) A 3% B 11.3% C 13% D 113%
June 2019 · Paper 2 · Q4(a) 1 mark Multiple choice supply side policies
Data and extracts for question 44 The UK Government is planning to cut the rate of corporation tax on all pre-tax profits of companies to 17% by 2020. (Source: adapted from https://www.ft.com/content/ 7579f124-5742-11e7-9fed-c19e2700005f)
(a) This would be an example of: (1) A a contractionary monetary policy B an exchange rate policy C an expansionary monetary policy D a supply-side policy
June 2019 · Paper 2 · Q5(c) 1 mark Multiple choice public finances and taxation
Data and extracts for question 55 According to the charity Oxfam, the combined wealth of the 62 richest people in the world is the same as the wealth of the poorest half of the world’s population. The value of the combined wealth of the poorest half of the world’s population has fallen by 38% between 2010 and 2016. (Source: adapted from https://www.oxfam.org/en/pressroom/pressreleases /2016-01-18/62-people-own-same-half-world-reveals-oxfam-davos-report)
(c) Which one of the following would be most likely to reduce a country’s Gini coefficient? An increase in: (1) A import tariffs B progressive taxes C regressive taxes D value added tax
June 2018 · AS Paper 1 · Q1(a) 1 mark Multiple choice nature of economics
Data and extracts for question 11 Statement 1: Cuba has a healthcare system with a patient to doctor ratio of 155:1. Statement 2: Other countries ought to adopt a similar healthcare system to that which exists in Cuba.
(a) Which one of the following best describes the two statements above? (1) Statement 1 Statement 2 A Normative Normative B Normative Positive C Positive Normative D Positive Positive
June 2018 · AS Paper 1 · Q2(b) 1 mark Multiple choice price elasticity of demand
Data and extracts for question 22 In February 2016 the Daily Mail newspaper increased its price from 60p to 65p. By August 2016 its sales had fallen by 5.41%.
(b) Which one of the following is most likely to be a determinant of price elasticity of demand for the Daily Mail newspaper? (1) A Availability of rival newspapers B Change in population size C Decrease in the cost of producing the Daily Mail newspaper D Expected rise in the price of the Daily Mail newspaper
June 2018 · AS Paper 1 · Q3(a) 1 mark Multiple choice price mechanism and surplus
Data and extracts for question 33 In the UK charges for dental treatment vary. For example, the following charges can be made for a tooth filling: • National Health Service (NHS) dental treatment £50.50 Private dental treatment £95–£700 • A dentist can choose to offer NHS treatment, private treatment or both.
(a) Using the data above, which one of the following is a function of the price mechanism in the market for private dental care? (1) A Acting as a signal to dentists when deciding whether to provide private dental treatment B Eliminating a shortage of private dentists by allowing the price of private treatment to fall C Encouraging government intervention to set dental care targets D Incentivising private dentists to offer only NHS treatment
June 2018 · AS Paper 1 · Q4(a) 1 mark Multiple choice price elasticity of demand
Data and extracts for question 44 Between 2013 and 2015, median household income in the UK increased from £24 200 to £25 700. Over the same period the demand for bus travel fell by 3%.
(a) Which one of the following is the most accurate explanation of the term ‘median household income’? (1) A The difference between the highest level of household income and the lowest level of household income B The middle household income after placing all household incomes in numerical order C The most frequently occurring level of household income D Total household income divided by the number of households
June 2018 · AS Paper 1 · Q5(c) 1 mark Multiple choice public goods and information gaps
Data and extracts for question 55 The British Broadcasting Corporation (BBC) is a TV broadcaster. It is financed through an annual TV licence fee of £145.50. At this fee level many TV owners benefit from consumer surplus.
Popular entertainment programmes output per year W 0 Educational programmes output per year (c) BBC programmes are often referred to as being public goods. This is because: (1) A all BBC programmes are financed by the public sector B the BBC is the most popular broadcaster in the UK C the consumption of these programmes is non-rivalrous D there are external benefits from the consumption of many BBC programmes
June 2018 · AS Paper 2 · Q1(c) 1 mark Multiple choice measuring economic growth
Data and extracts for question 11 The table below shows the UK Gross Domestic Product (GDP) and population, 2013 to 2015. GDP Population Year (£ millions) (millions) 2013 1 739 563 64.1 2014 1 822 480 64.6 2015 1 872 714 65.1 (Source: ONS, https://www.ons.gov.uk/)
(c) Which one of the following is the most likely effect of an increase in real GDP per capita? (1) A Increase in living standards B Increase in unemployment C Lower consumer confidence D Lower purchasing power
June 2018 · AS Paper 2 · Q2(c) 1 mark Multiple choice economic growth and the trade cycle
(c) Which point on the trade cycle diagram illustrates a negative output gap? (1) Real GDP Trend GDP growth Actual GDP growth D C A B Time A B C D
June 2018 · AS Paper 2 · Q3(b) 1 mark Multiple choice fiscal and monetary policy
Data and extracts for question 33 UK base interest rate, January 2008 to January 2017 6 5.5 % 5 4.5 4 3.5 3 2.5 2 1.5 1 0.5 0 (Source: Bank of England, http://www.bankofengland.co.uk/boeapps/iadb/Repo.asp)
In August 2016 the Bank of England extended its existing asset purchases (quantitative easing) programme, from a total of £375 billion to £435 billion. (b) Which one of the following is the most likely effect of the Bank of England’s quantitative easing? (1) A A fall in economic growth B A fall in the money supply C An increase in the rate of inflation D An increase in unemployment
June 2018 · AS Paper 2 · Q4(c) 1 mark Multiple choice aggregate supply
Data and extracts for question 44 The diagram below shows the aggregate demand (AD) and short-run aggregate supply (SRAS) for the UK. Price level SRAS P1 AD Real output Y1
(c) Which one of the following factors is most likely to cause an increase in the long-run aggregate supply? (1) A Decrease in investment B Increase in relative productivity C Increase in the level of unemployment benefits D Reduced access to credit for consumers and businesses
June 2018 · AS Paper 2 · Q5(a) 1 mark Multiple choice aggregate demand
Data and extracts for question 55 The chart below shows selected areas of forecast UK government spending for 2015/16 and 2016/17. 232 Social protection 240 141 Health 145 99 Education 102 45 Defence 46 28 Housing 34 0 100 150 250 50 200 £ billions 2015/16 2016/17 (Source: Budget 2015, https://www.gov.uk/government/uploads/system/uploads/ attachment_data/file/416330/47881_Budget_2015_Web_Accessible.pdf; Budget 2016, https://www.gov.uk/government/uploads/system/uploads/attachment_ data/file/508193/HMT_Budget_2016_Web_Accessible.pdf)
(a) Which one of the following can be inferred from the chart? In 2016/17: (1) A the change in forecast UK government spending is highest on education B the forecast UK government spending in all areas has fallen from 2015/16 C the forecast UK government spending on defence is twice as much as the forecast spending on housing D the percentage change in forecast UK government spending on health, from 2015/16, is 2.84%
June 2018 · Paper 1 · Q1(b) 1 mark Multiple choice production possibility frontiers
Data and extracts for question 11 The diagram refers to production possibility frontiers for a country that produces capital goods and consumer goods. X 100 Output of capital goods W V U 50 Y Z 0 80 100 120 140 170 Output of consumer goods Originally, the economy has a production possibility frontier shown by the line XY, operating at point V. The production possibility frontier then moves to XZ, operating at point U.
(b) Which one of the following was the most likely cause of the movement in the production possibility frontier from XY to XZ? (1) A A reduction in unemployment in consumer goods industries B A rise in the cost of producing consumer goods C An increase in demand for consumer goods D A technological improvement in the production of consumer goods
June 2018 · Paper 1 · Q2(c) 1 mark Multiple choice public goods and information gaps
Data and extracts for question 22 The number of individual weekly ticket sales from UK National Lottery games operated by Camelot was 73 million in the financial year 2015–2016. The sale price of each lottery ticket was £2. This figure included 24 pence of tax revenue on each ticket sold.
In 2016 a coastal flood defence scheme was completed at Broomhill Sands in Kent, protecting people, homes and businesses. A £30 million grant from the National Lottery paid for the scheme. (Source: https://www.gov.uk/government/news/30-million- project-set-to-reduce-flood-risk-in-kent) (c) The most likely reason for this grant is to ensure the: (1) A exclusivity of Broomhill Sands B provision of a private good C provision of a public good D rivalry of Broomhill Sands
June 2018 · Paper 1 · Q3(b) 1 mark Multiple choice supply and demand
Data and extracts for question 33 The average fee charged by high-street estate agents to homeowners for selling property is 1.3% of the final sale price. (Source: http://www.which.co.uk/money/mortgages-and-property/home- movers/guides/selling-a-house/estate-agent-fees-and-contracts)
In August 2016 the Office for National Statistics reported that the average house price in London was £489 000, whereas in the North East of England it was £127 000. (b) The ratio of the average house price in London to the average house price in the North East of England is: (1) A 0.26 B 3.62 C 3.85 D 7.40
June 2018 · Paper 1 · Q4(b) 1 mark Multiple choice business growth and objectives
Data and extracts for question 44 Emily owns and operates a nail ink salon. The diagram shows the cost and revenue curves for treatments at her nail ink salon. Initially, Emily sets her price to maximise profits. Costs, Revenue per treatment (£) MC AC 17 12 9 8 AR 0 25 36 Quantity of treatments MR per day
(b) Emily now decides to change her objective from revenue maximisation to sales maximisation. This change will lead to: (1) A a decrease in the number of customers B a decrease in the price of treatments C an increase in productive efficiency D an increase in the level of profit
June 2018 · Paper 1 · Q5(a) 1 mark Multiple choice supply and demand
Data and extracts for question 55 The following graph shows the global sales of personal computers (PCs) between 2011 and 2015. 400 350 352.4 350.4 315.1 300 308.2 276.7 250 millions 200 of PCs 150 100 50 0 2011 2012 2013 2014 2015 (Source: adapted from IDC and reported in The Times, 14th January 2016)
(a) The percentage decrease in sales of PCs between 2011 and 2015 is: (1) A 21.5 B 27.3 C 31.5 D 75.7
June 2018 · Paper 2 · Q1(a) 1 mark Multiple choice trading blocs and protectionism
Data and extracts for question 11 The trade deal known as the Comprehensive Economic and Trade Agreement (CETA) is designed to eliminate or reduce trade barriers between the European Union (EU) and Canada. It is estimated that it will increase trade by 20% and boost EU GDP by 12 billion euros. (Source: http://www.theguardian.com/business/2016/oct/30/eu-canada- sign-ceta-free-trade-deal-trudeau-juncker)
(a) Which one of the following is most likely to decrease as a result of CETA? (1) A Economic growth in EU countries B Exports from EU countries to Canada C Imports from Canada to EU countries D Tariffs on European exports to Canada
June 2018 · Paper 2 · Q2(a) 1 mark Multiple choice aggregate demand
(a) Which one of the following would be most likely to cause aggregate demand to increase? A fall in: (1) A government spending B net trade (X–M) C the marginal propensity to consume D the marginal propensity to save
June 2018 · Paper 2 · Q3(c) 1 mark Multiple choice balance of payments
Data and extracts for question 33 United States current account of the balance of payments, 1993–2015 0 –100 –200 –300 –400 US$ (billions) –500 –600 –700 –800 –900 –1000 1994 1996 1998 2000 2002 2004 2006 2008 2010 2012 2014 Year (Source: http://data.worldbank.org/indicator/BN.CAB.XOKA. CD?end=2015&locations=US&start=1993)
(c) Using the chart on page 6, which one of the following may be inferred about the United States balance of payments? (1) A The current account deficit decreased between 2001 and 2006 B The current account surplus increased between 2001 and 2006 C There was a current account deficit for the entire period shown D There was a current account surplus for the entire period shown
June 2018 · Paper 2 · Q4(c) 1 mark Multiple choice public finances and taxationfiscal and monetary policy
Data and extracts for question 44 The UK has experienced a budget deficit since 2001. The government aimed to reach a budget surplus by 2019, but in 2016 this target was abandoned. (Source: adapted from https://www.gov.uk/government/news/autumn- statement-2016-some-of-the-things-weve-announced)
(c) If a government takes decisions to target a budget surplus, this is an example of: (1) A contractionary monetary policy B discretionary fiscal policy C expansionary fiscal policy D expansionary monetary policy
June 2018 · Paper 2 · Q5(b) 1 mark Multiple choice aggregate demand
Data and extracts for question 55 UK total bank lending to individuals, percentage change on previous year 2014 2.5% 2015 3.2% 2016 4.0% (Source: Bank of England 2017)
(b) Which one of the following is most likely to result from an increase in bank lending to individuals? (1) A An improvement in net trade (X–M) B An increase in consumption C An increase in unemployment D Deflation
June 2017 · AS Paper 1 · Q1(b) 1 mark Multiple choice production possibility frontiers
Data and extracts for question 11 The production possibility frontier for an economy is shown in the table below. Capital goods output Consumer goods output Opportunity cost (million units) (million units) 0 42 – 10 40 20 36 30 30 40 22 50 12 60 0
(b) Which one of the following is the most likely effect of an economy producing more capital goods? (1) A Reduced specialisation of labour B A shift in the production possibility frontier C A reduction in marginal utility D A shift in demand for consumer goods
June 2017 · AS Paper 1 · Q2(c) 1 mark AO2=1 Multiple choice supply and demand
Data and extracts for question 22 The table below shows UK wheat production between 2010 and 2015. Index numbers of wheat Wheat production Year production (‘000 tonnes) (2010 is base year) 2010 14 878 100 2011 15 257 2012 13 261 2013 11 921 80.1 2014 16 606 111.6 2015 16 129 108.4 (Source: adapted from https://www.gov.uk/government/uploads/ system/uploadsattachment_data/file/466383/farming- statistics-2015-wheat-and-barley-production-uk.pdf)
(c) The percentage change in wheat production from 2014 to 2015 was: (1) A 0.03 B –2.87 C –2.95 D –477
June 2017 · AS Paper 1 · Q3(b) 1 mark AO1=1 Multiple choice price mechanism and surplusindirect taxes and subsidies
Data and extracts for question 33 In 2015 the UK government cut subsidies for the installation of solar energy panels.
(b) The most likely effect of cutting subsidies for the installation of solar panels is to: (1) A increase producer surplus B decrease the provision of public goods C decrease consumer surplus D increase government expenditure
June 2017 · AS Paper 1 · Q4(b) 1 mark Multiple choice government intervention in markets
Data and extracts for question 44 The excess supply of carbon steel has recently caused its global price to fall below $530 per tonne. (Source: adapted from http://www.meps.co.uk/allproducts%20steel%20price.htm)
Steel production leads to high levels of carbon emissions. (b) Which one of the following is likely to result in an increase in carbon emissions? (1) A Introducing a tradable pollution permits scheme B Shutting down steel factories C Subsidising the steel industry to install cleaner technology D Reducing indirect taxes on steel products
June 2017 · AS Paper 1 · Q5(b) 1 mark Multiple choice externalities
Data and extracts for question 55 Universities UK raised concerns about the proposal to reduce the maximum tuition fees (fee cap) for undergraduate courses in England from £9 000 to £6 000. It stated “This unfunded proposal to reduce the fee cap would damage the quality of experience our universities could deliver to students and remove opportunities for those seeking to benefit from a university education”. (Source: adapted from tuition fees 2015 Times letter Universities UK http://www.universitiesuk.ac.uk/highereducation/ Pages/UUKboardFeesLetter.aspx#.VjoQRbfhDIU)
(b) Which one of the following statements is correct? (1) A The marginal social benefits exceed the marginal private benefits from university education B University education is an inferior good C University education is a public good D The social optimum equilibrium quantity is less than the market equilibrium quantity for university education
June 2017 · AS Paper 2 · Q1(c) 1 mark Multiple choice inflation
Data and extracts for question 11 UK Consumer Prices Index (the base year 2005=100) September 2013 126.8 September 2014 128.4 September 2015 128.2 (Source: http://www.ons.gov.uk/ons/publications/re-reference- tables.html?edition=tcm%3A77-323657)
(c) Which one of the following is most likely to be a cause of deflation? A fall in: (1) A oil prices B unemployment C income tax rates D interest rates
June 2017 · AS Paper 2 · Q2(b) 1 mark Multiple choice unemployment
Data and extracts for question 22 Between 2008 and 2014 the number of people in the UK looking to work longer hours and therefore receive more total pay increased from 76 482 to 142 788. Over the same period the unemployment rate fell to 5.7%. (Sources: https://www.gov.uk/government/statistics/numbers-of-part-timers- seeking-full-time-employment and http://www.ons.gov.uk/ons/ taxonomy/index.html?nscl=Unemployment+Rates#tab-data-tables)
(b) Which one of the following is the most likely reason for a fall in the unemployment rate? (1) A Increasing unemployment benefit payments B Decreasing real GDP C Decreasing funding for apprenticeships D Increasing consumer spending
June 2017 · AS Paper 2 · Q3(a) 1 mark Multiple choice measuring economic growth
Data and extracts for question 33 Real GDP in selected economies (the base year 2008=100) 110 108 106 104 102 Index 100 98 96 94 92 0 2009 2010 2011 2012 2013 2014 France Italy United Kingdom (Source: http://www.ons.gov.uk/ons/rel/elmr/gdp-and-the-labour-market/q1-2014- -may-gdp-update/sty-gdp-g7-economies.html?format=print)
(a) Which one of the following can be inferred from the chart? (1) A The UK’s real GDP is smaller in 2014 than it was in 2008 B Between 2008 and 2014 France’s real GDP growth rate was higher than Italy’s C Between 2008 and 2014 inflation was lower in France than in the UK D France experienced a greater fall in real GDP than the UK in 2014
June 2017 · AS Paper 2 · Q4(c) 1 mark Multiple choice fiscal and monetary policy
Data and extracts for question 44 The Chancellor announced in the 2015 Budget that the personal allowance (the annual income that can be earned before starting to pay income tax) would increase from £10 600 to £11 000 in April 2016. This means most consumers will pay less income tax. (Source: adapted from http://www.telegraph.co.uk/finance/personalfinance/ how-budget-affect-me/11721785/Budget-2015-what-to-expect- for-income-tax-and-the-personal-allowance.html)
(c) Which one of the following is an example of a direct tax? (1) A Value Added Tax B Vehicle Excise Duty C Corporation tax D Alcohol duty
June 2017 · AS Paper 2 · Q5(b) 1 mark Multiple choice national income and the multiplier
Data and extracts for question 55 The chart below shows the results from a survey of UK consumers’ confidence in their financial situation. A negative balance means that, on average, consumers reported their financial situation got worse, a positive balance means they reported it improved and a zero balance indicates no change. This is recorded on a scale from –100 to +100. UK consumer confidence 20 15 10 5 0 –5 –10 –15 –20 –25 –30 2008 2009 2010 2011 2012 2013 2014 2015 (Source: http://www.ons.gov.uk/ons/dcp171778_418064.pdf)
(b) Which one of the following is most likely to result from an improvement in UK consumer confidence? A decrease in the marginal propensity to: (1) A consume B tax C import D save
June 2017 · Paper 1 · Q1(b) 1 mark Multiple choice price elasticity of demand
Data and extracts for question 11 The table shows market data for e-cigarette kits. The original equilibrium price is £23. Quantity Quantity New quantity New quantity Price demanded per supplied per demanded per supplied per £ month (000) month (000) month (000) month (000) 25 5 9 24 6 8 23 7 7 22 8 6 21 9 5 As a result of a successful advertising campaign, demand increased by 3 000 e-cigarette kits at all prices. At the same time production costs fell leading to an increase in supply of 1 000 e-cigarette kits at all prices.
(b) Research conducted in New Zealand in 2014 estimated the cross elasticity of demand for e-cigarettes to be 0.16 in response to changes in the price of tobacco. This implies that a 5% increase in the price of tobacco will cause the percentage change in demand for e-cigarettes to be: (1) A -31.25 B -0.16 C 0.8 D 31.25
June 2017 · Paper 1 · Q2(c) 1 mark Multiple choice price elasticity of demand
Data and extracts for question 22 Between 2010 and 2015 the average price of tea in the UK increased from £7.20 per kilo to £8.48 per kilo. Over the same period the quantity of tea purchased fell from 97 million kilos to 76 million kilos. (Source: http://www.theguardian.com/lifeandstyle/shortcuts/2015/aug/05/brew-do- you-think-you-are-why-tea-needs-to-copy-coffee-in-order-to-survive)
(c) Estimates for the demand for black tea in the UK suggest that it is an inferior good. This implies it has a negative: (1) A cross elasticity of demand B income elasticity of demand C price elasticity of demand D price elasticity of supply
June 2017 · Paper 1 · Q3(c) 1 mark Multiple choice price mechanism and surplus
Data and extracts for question 33 The Indian government has introduced a subsidy on domestic cooking gas cylinders in the city of Mumbai. The diagram below shows the effect following the introduction of the subsidy. Price per cylinder (Rupees) S S1 1023 526 455 D 0 1.5 1.8 Quantity of gas cylinders, daily (million) (Source: https://www.iocl.com/products/indanegas.aspx and http://indianexpress.com/article/business/business-others/lpg- subsidy-fixed-at-rs-568-price-to-change-after-march/)
(c) One effect of the subsidy is to increase: (1) A consumer surplus B market failure C public good provision D tax revenue
June 2017 · Paper 1 · Q4(b) 1 mark Multiple choice monopsony and contestability
Data and extracts for question 44 In 2015 JCB, the construction equipment manufacturer, experienced a 6% fall in revenue. This resulted from a reduction in sales of construction equipment to emerging markets.
(b) In India JCB has a strong brand image and a 50% share of the market for construction equipment. This means the construction equipment market in India is likely to have a low level of: (1) A concentration B contestability C private ownership D specialisation
June 2017 · Paper 1 · Q5(a) 1 mark Multiple choice revenues costs and profits
Data and extracts for question 55 Figure 1 shows the distribution of the revenue received from the sale of a Starbucks cappuccino drink priced at £2.27 in 2015. Figure 1 Coffee 4% Milk 4% Packaging 8% Rent/rates 15% Admin/ overheads 15% Labour 24% VAT 17% Profit 13% (Source: adapted from Allegra strategies research and analysis, reported in The Times, 27th January 2015)
(a) Which one of the following is a fixed cost to Starbucks? (1) A Coffee B Milk C Packaging D Rent
June 2017 · Paper 2 · Q1(a) 1 mark Multiple choice unemployment
Data and extracts for question 11 The chart below shows the UK unemployment rate, seasonally adjusted, from 2008 to 2015 9.0 8.0 7.0 6.0 % of all 5.0 economically 4.0 active 3.0 2.0 1.0 0.0 Year (Source: http://www.ons.gov.uk/ons/rel/lms/labour-market-statistics/december-2015/ statistical-bulletin.html#tab-8--Unemployment)
(a) Which one of the following types of unemployment best explains the change in the data between 2008 and 2010? (1) A Cyclical B Frictional C Seasonal D Voluntary
June 2017 · Paper 2 · Q2(c) 1 mark Multiple choice national income and the multiplier
Data and extracts for question 22 The table below shows marginal propensity to save data for an economy. Marginal propensity Year to save (mps) 2010 0.11 2011 0.09 2012 0.07 2013 0.05 2014 0.05 2015 0.04
An economy has marginal propensity to save of 0.1, marginal propensity to tax of 0.2 and marginal propensity to import of 0.1. (c) Which one of the following is the correct size of the multiplier? (1) A 0.4 B 0.6 C 1.7 D 2.5
June 2017 · Paper 2 · Q3(a) 1 mark Multiple choice inflation
Data and extracts for question 33 The chart below shows UK inflation as measured by the Consumer Prices Index (CPI), 2011 to 2015. 6.0 5.0 4.0 Annual 3.0 percentage change 2.0 in prices 1.0 0.0 –1.0 –2.0 Year CPI Food and fuel Other goods and services (Source: http://www.ons.gov.uk/ons/dcp171780_427182.pdf)
(a) Which one of the following statements is correct about the UK’s inflation record between September 2011 and January 2013? Based on the data shown, the UK experienced: (1) A deflation B disinflation C falling average prices D falling money supply
June 2017 · Paper 2 · Q4(b) 1 mark Multiple choice poverty and inequality
Data and extracts for question 44 The chart below shows the UK Gini coefficient of incomes, 2007 to 2013. 0.40 0.38 0.36 0.34 0.32 Gini 0.30 coefficient 0.28 0.26 0.24 0.22 0.20 0 Year (Source: adapted from https://www.equalitytrust.org.uk/how-has-inequality-changed)
(b) Which one of the following values for the Gini coefficient is correct if there is perfect income equality? (1) A 0 B 0.5 C 1 D 50:50
June 2017 · Paper 2 · Q5(a) 1 mark Multiple choice measuring economic growth
Data and extracts for question 55 The table shows the selected economic data in 2014 for Vietnam and India. Gross National Human Income per Development capita Index (HDI) value (2011 PPPs) Vietnam 5 092 0.666 India 5 497 0.609 (Source: www.hdr.undp.org/en/composite/HDI)
(a) Which one of the following statements can be deduced from the data in the table? (1) A Average incomes are higher in India than in Vietnam. B Levels of absolute poverty are higher in Vietnam. C Life expectancy is higher in India than in Vietnam. D Provision of healthcare and education is less effective in Vietnam than in India.
June 2016 · AS Paper 1 · Q1(a) 1 mark Multiple choice specialisation and division of labour
(a) Which one of the following is the most likely consequence of an increase in the division of labour in the production of smartphones? (1) A Decrease in boredom for smartphone workers B Decrease in use of specialised manufacturing equipment C Decrease in the cost per unit of smartphones D Increase in training costs per worker
June 2016 · AS Paper 1 · Q2(b) 1 mark Multiple choice government intervention in marketsexternalities
Diagram A shows the market for nursery school places. Diagram A Costs/ benefits £ MPC=MSC V R P1 Pe T MSB S MPB 0 Qe Q1 Quantity of nursery school places (b) Which one of the following measures could a government introduce to achieve the social optimum consumption of nursery school places? It could introduce a: (1) A maximum price of 0P1 per unit B subsidy of RS per unit C tax of VT per unit D minimum price of 0P1 per unit
June 2016 · AS Paper 1 · Q3(a) 1 mark Multiple choice externalities
Data and extracts for question 33 The area around Lake Naivasha in Kenya supplies 70% of the UK cut-rose flower market. Much of the water which the flower farms are dependent on is extracted from the lake. This has resulted in damage to fish stocks and increasing competition for water. (Source: adapted from ‘Flower Struggles’, Matthew Wilson, House and Home, Financial Times, 28 February/1 March 2015)
(a) The impact of the flower industry on workers in the fishing industry is an example of: (1) A private benefits B private costs C external costs D external benefits
June 2016 · AS Paper 1 · Q4(b) 1 mark Multiple choice supply and demand
Data and extracts for question 44 A restaurant in London offers an “all you can eat buffet for £8.99”. At this price you can refill your plate as many times as you like.
(b) If the price of an “all you can eat buffet” fell from £8.99 to £6.99, which one of the following is likely to happen? (1) A There is an extension in demand B The demand curve shifts to the left C The supply curve shifts to the left D There is a contraction in demand
June 2016 · AS Paper 1 · Q5(a) 1 mark Multiple choice price elasticity of demand
Data and extracts for question 55 “Since peaking at 132p a litre in July 2014, petrol prices have fallen by 20%”. (Source: adapted from UK petrol prices cut again, L Elliott, The Guardian 12-1-15 http://www.theguardian.com/business/2015/jan/12/oil-slump-uk-petrol-prices-fall)
(a) What is the expected percentage change in the quantity of petrol demanded if the price elasticity of demand is –0.2? (1) A –0.4% B +0.4% C –4% D +4%
June 2016 · AS Paper 2 · Q1(b) 1 mark Multiple choice national income and the multiplier
(b) Which one of the following is an injection into the circular flow of income? (1) A Taxation B Imports C Investment D Saving
June 2016 · AS Paper 2 · Q2(b) 1 mark Multiple choice measuring economic growth
Data and extracts for question 22 The table below shows GDP per capita at purchasing power parities (PPPs) for a selection of European countries in 2013. GDP per capita Country (US$, at PPPs, 2013, rounded) UK 38 500 Spain 33 000 Italy 35 500 (Source: http://data.worldbank.org/indicator/NY.GDP.PCAP.PP.CD)
(b) The Office for National Statistics estimates that the UK population was 64 million in 2013. Using the data, what was the UK’s total GDP in 2013? (1) A $2 464 000 million B $2 272 000 million C $1 662 000 million D $2 112 000 million
June 2016 · AS Paper 2 · Q3(c) 1 mark Multiple choice unemployment
Data and extracts for question 33 The table below shows claimant count data for the UK. Number of Claimants August 2014 961 149 September 2014 923 240 October 2014 887 771 November 2014 848 085 December 2014 823 880 January 2015 852 934 February 2015 858 344 (Source: http://www.nomisweb.co.uk/query/construct/submit.asp?forward=yes&menuopt=201&subcomp=)
(c) Which one of the following is likely to cause a reduction in the claimant count? (1) A An increase in the weekly payment for claimants B A compulsory weekly interview for every claimant C An increase in the size of the workforce D A fall in employment
June 2016 · AS Paper 2 · Q4(a) 1 mark Multiple choice balance of payments
Data and extracts for question 44 Figure 1 shows data on the UK’s balance of trade. Figure 1 – UK’s balance of trade January 2013 to January 2015 £ billion, seasonally adjusted 10 8 6 4 2 0 -2 -4 -6 -8 -10 -12 Balance of Trade in Goods Balance of Trade in Services Balance of Total UK Trade (Source: http://www.ons.gov.uk/ons/rel/uktrade/uk-trade/january-2015/ summ-uk-trade--january-2015.html)
(a) Which one of the following can be inferred from Figure 1 in the period shown? (1) A The total UK trade deficit was the largest in June 2013 B The trade in goods was always in surplus between January 2013 and January 2015 C The total UK trade deficit was the smallest in January 2014 D The trade in goods deficit was the smallest in June 2013
June 2016 · AS Paper 2 · Q5(b) 1 mark Multiple choice aggregate supply
Data and extracts for question 55 In 2014 the Bank of England estimated the marginal propensity to consume of UK consumers to be 0.5. In 2014 the Chancellor of the Exchequer announced a £15 billion investment programme into UK road infrastructure. (Sources: http://www.bankofengland.co.uk/publications/Documents/quarterlybulletin/ 2014/qb14q405.pdf and https://www.gov.uk/government/news/ autumn-statement-2014-16-things-you-should-know)
(b) Which one of the following is most likely to cause a rightward shift in the aggregate supply curve? (1) A A decrease in real output B A rise in price level C A fall in price level D An increase in productivity

Work with an Edexcel economics tutor

Essays stuck in Level 2, or losing the easy marks in Section A? Book a trial session with Lianne, a former Edexcel examiner.
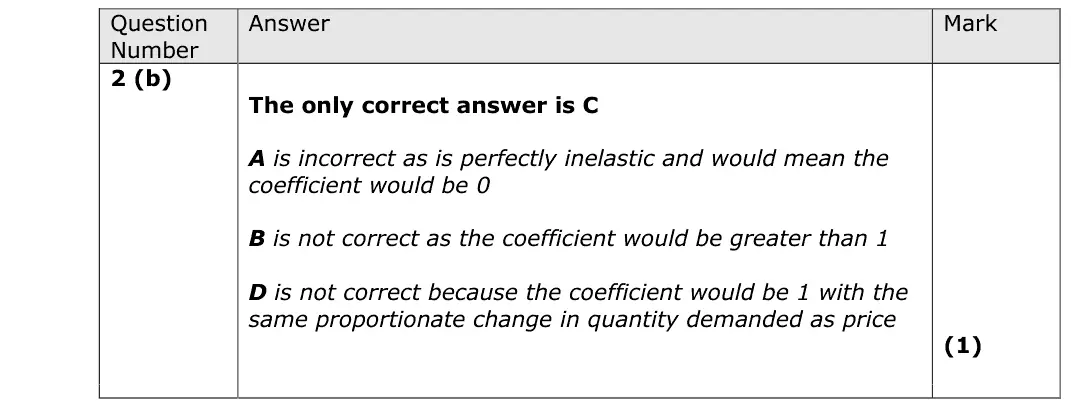
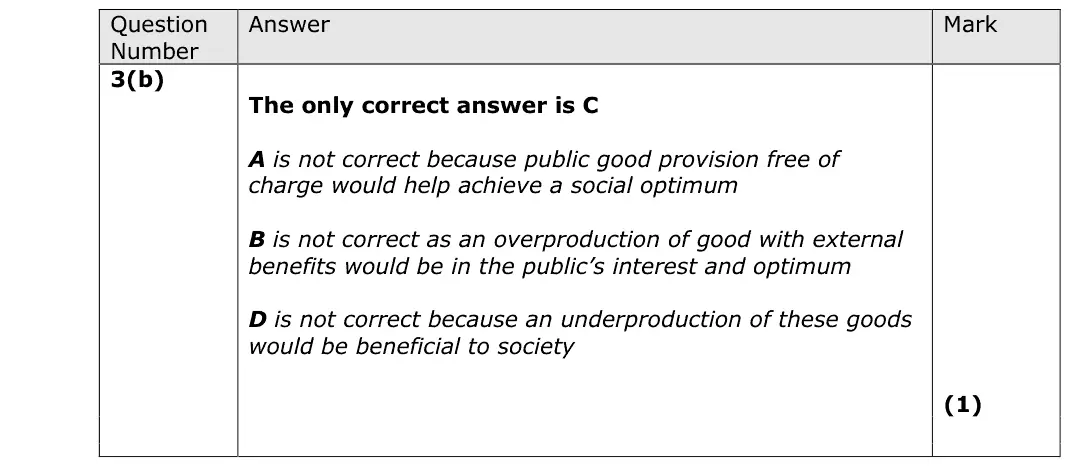
Prefer email? Send an enquiry

If you are under 18, please include a parent's contact details. Enquiries go to enquiries@economicsaleveltutor.com and are deleted once handled. All tutoring is online.