Notes and key-term cards for this topic are being written by our tutors. The past-paper questions below are ready now.
Specification statements
4.2.1Absolute and relative poverty: a) Distinction between absolute poverty and relative poverty b) Measures of absolute poverty and relative poverty c) Causes of changes in absolute poverty and relative poverty
4.2.2Inequality: a) Distinction between wealth and income inequality b) Measurements of income inequality: • the Lorenz curve (diagrammatic analysis) • the Gini coefficient c) Causes of income and wealth inequality within countries and between countries d) Impact of economic change and development on inequality e) Significance of capitalism for inequality
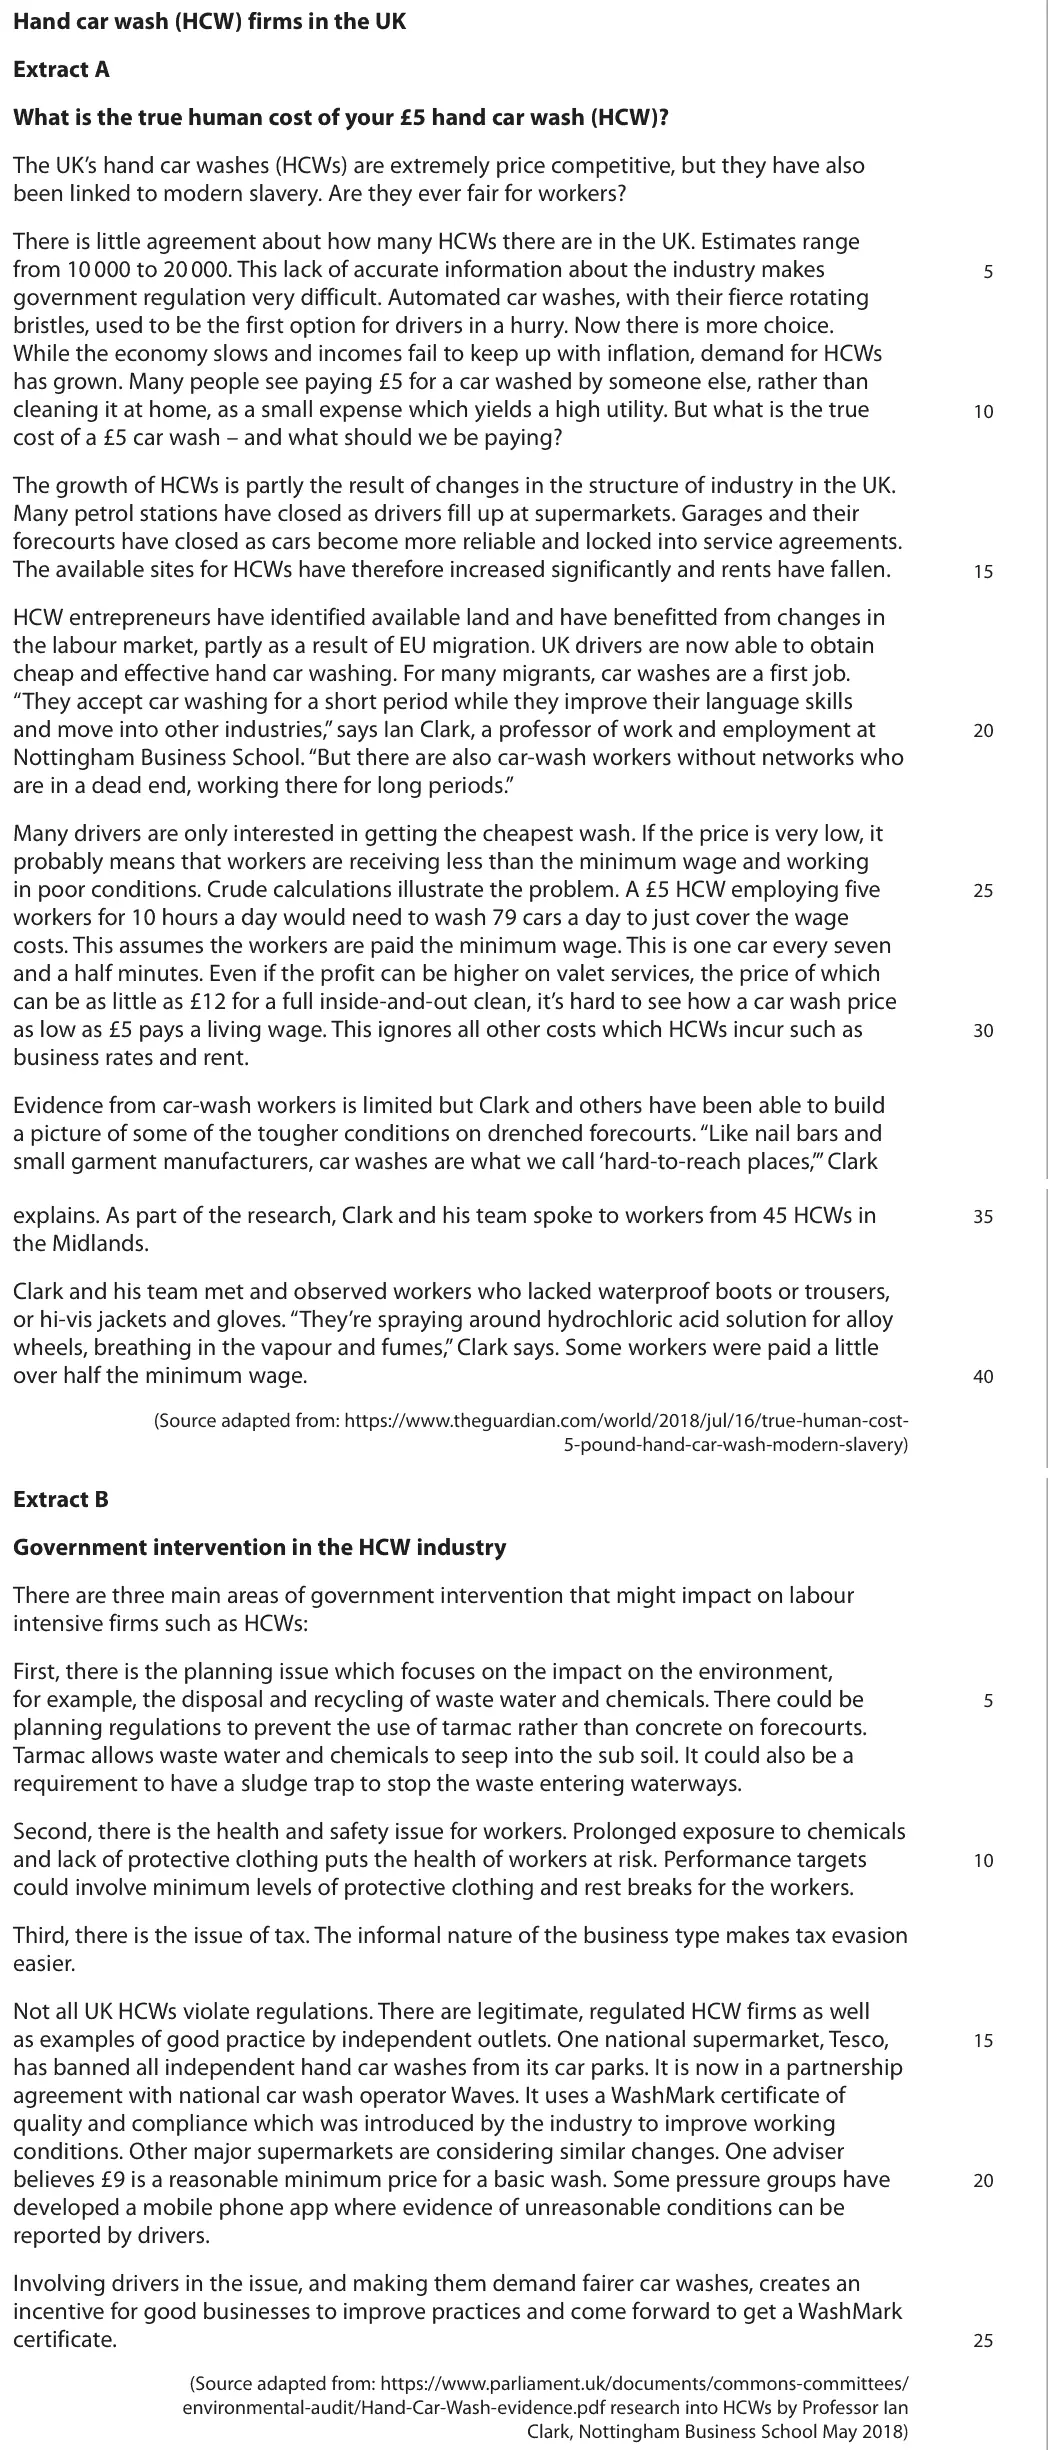
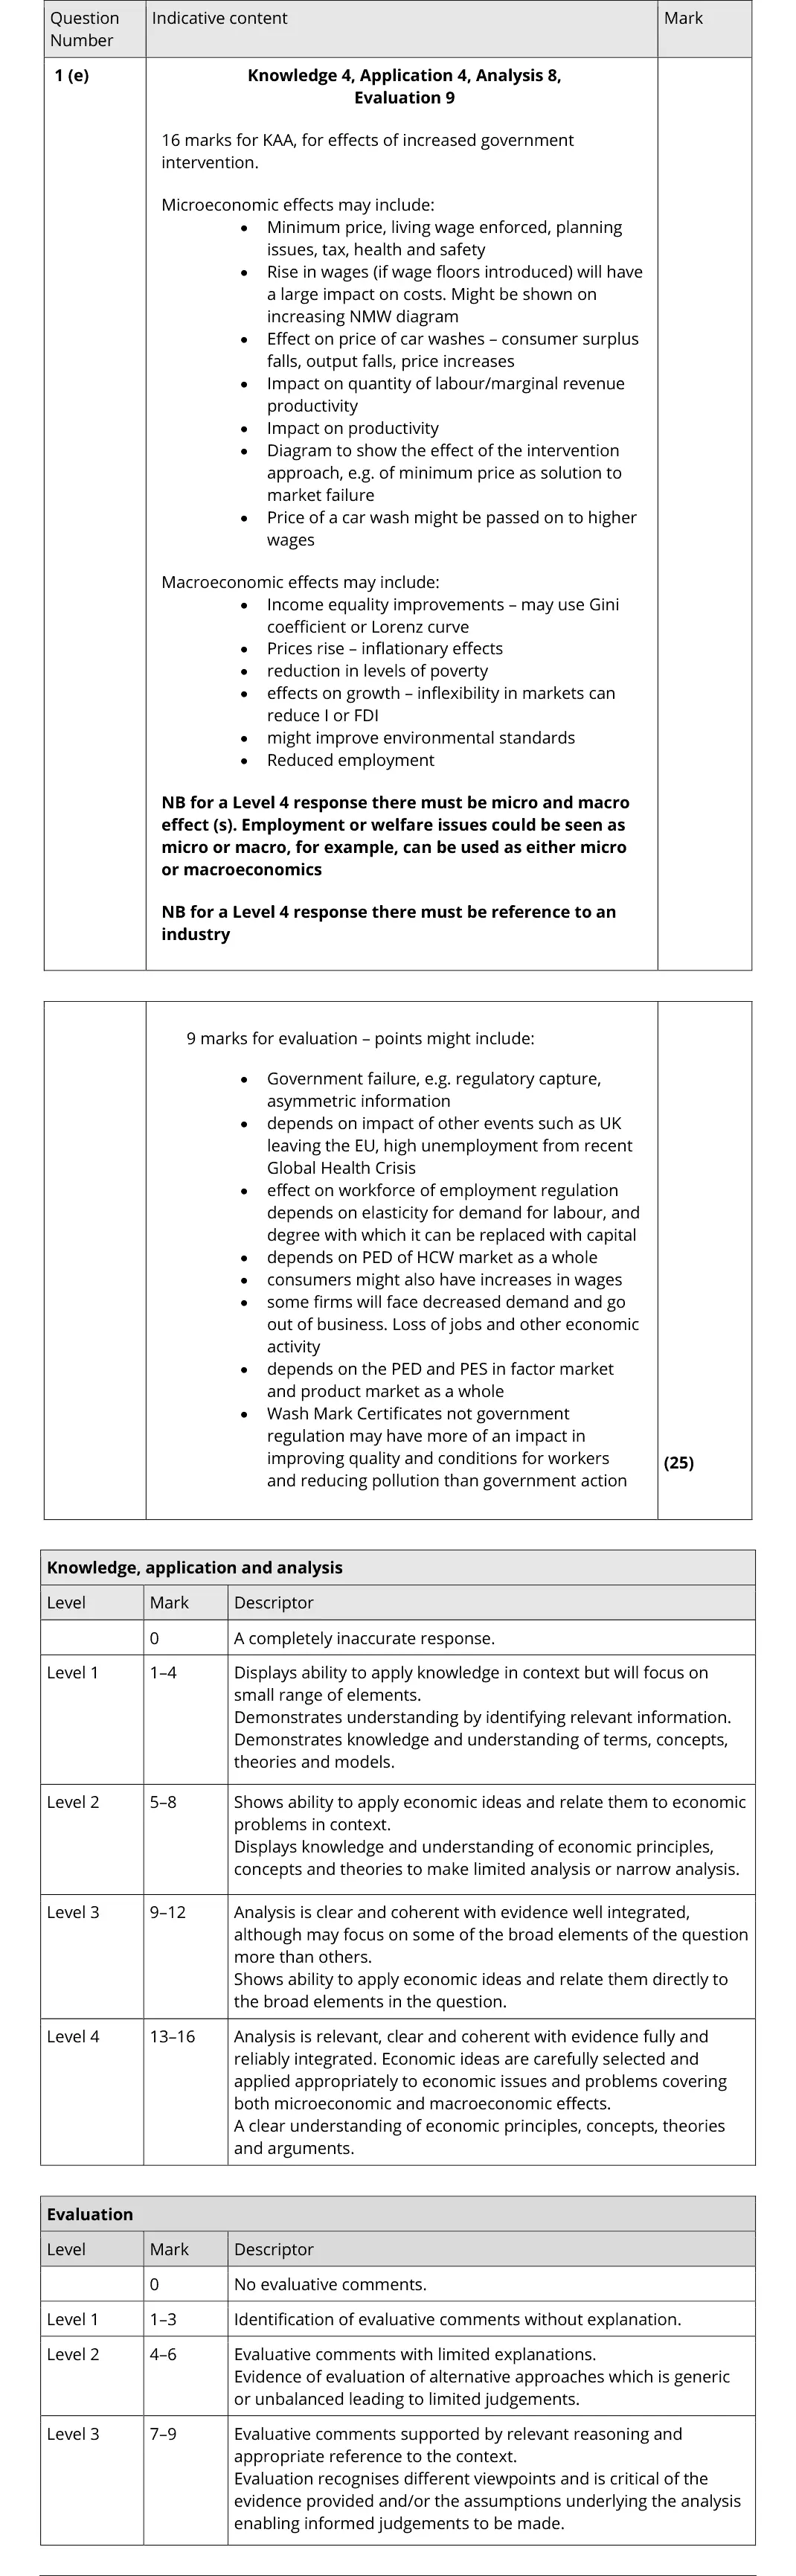
Evaluate the microeconomic and macroeconomic effects of increased government intervention in an industry. Refer to HCWs or another industry of your choice.
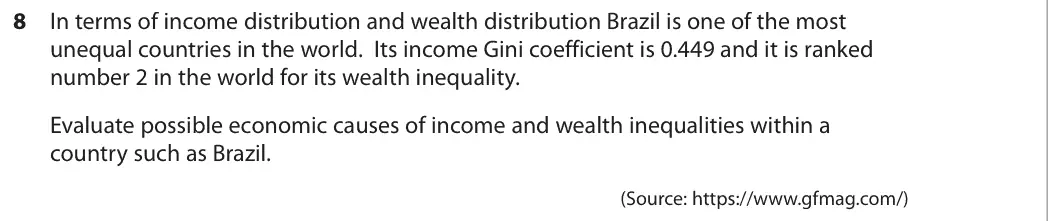
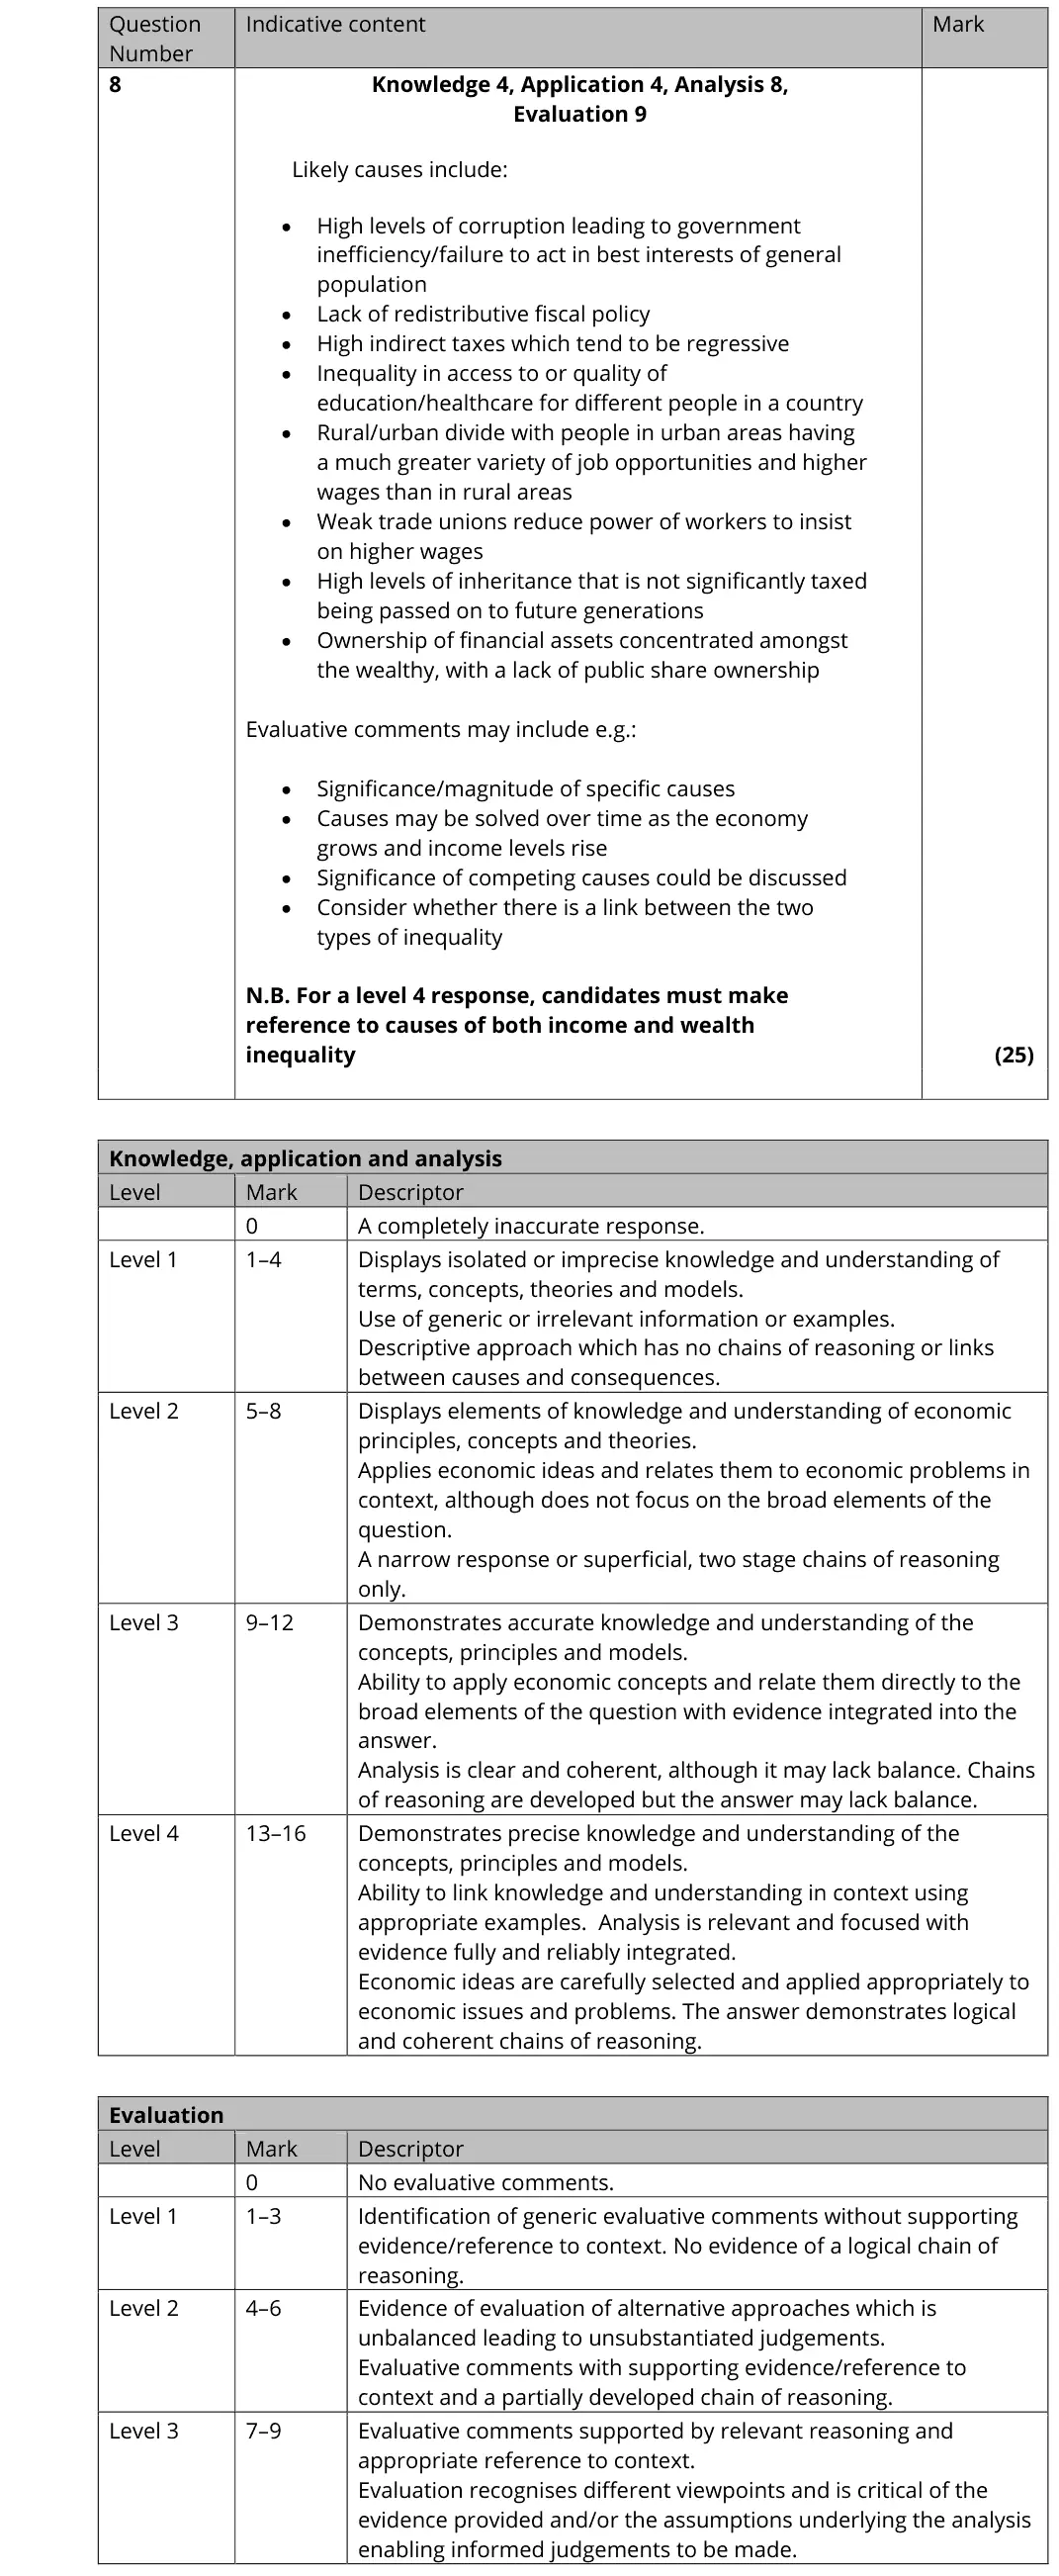
In terms of income distribution and wealth distribution Brazil is one of the most unequal countries in the world. Its income Gini coefficient is 0.449 and it is ranked number 2 in the world for its wealth inequality. Evaluate possible economic causes of income and wealth inequalities within a country such as Brazil. (Source: https://www.gfmag.com/)
Tap a question to zoom it. The data and extracts fold out above each question; the mark scheme and examiner's comment open underneath.
June 2025 · Paper 3 · Q2(d)25 marksAO1=4, AO2=4, AO3=8, AO4=925-mark essayEither/or
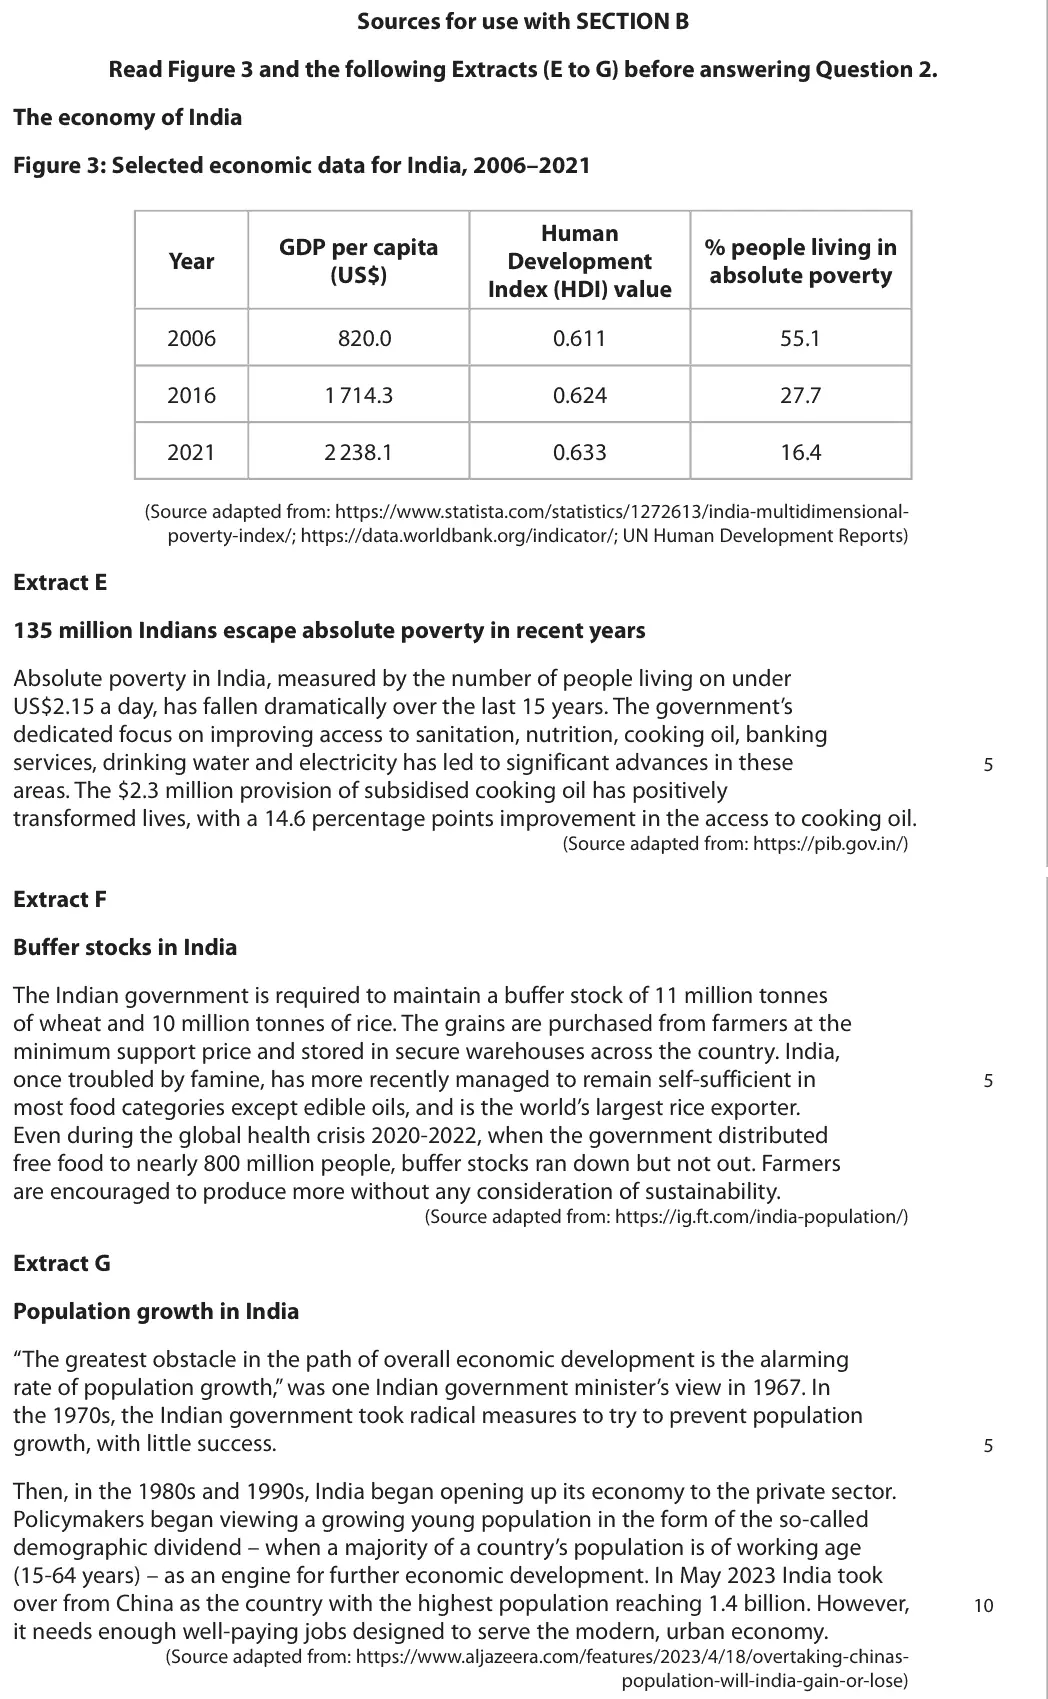
Data and extracts for question 2
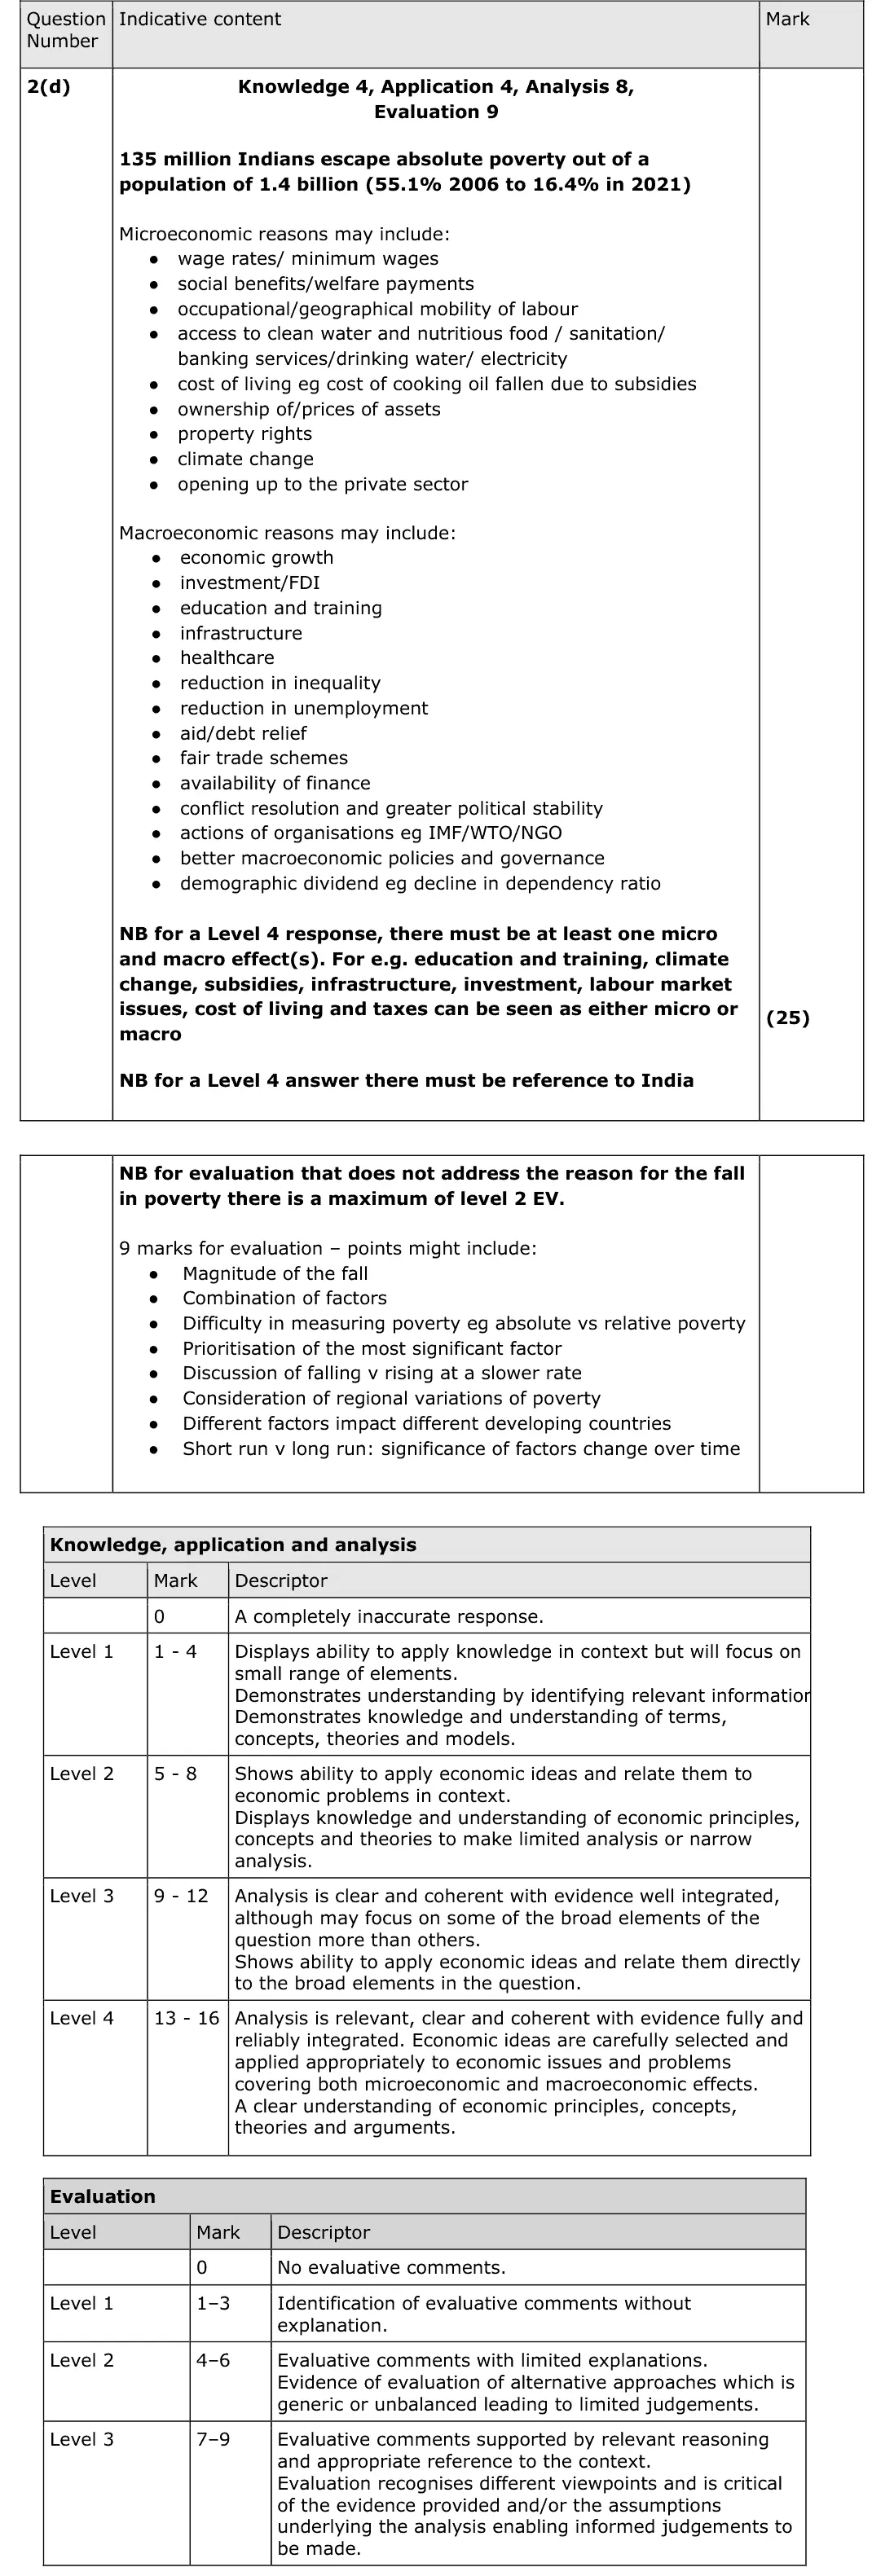
Mark scheme, including the levels grid and indicative content
Examiner's comment
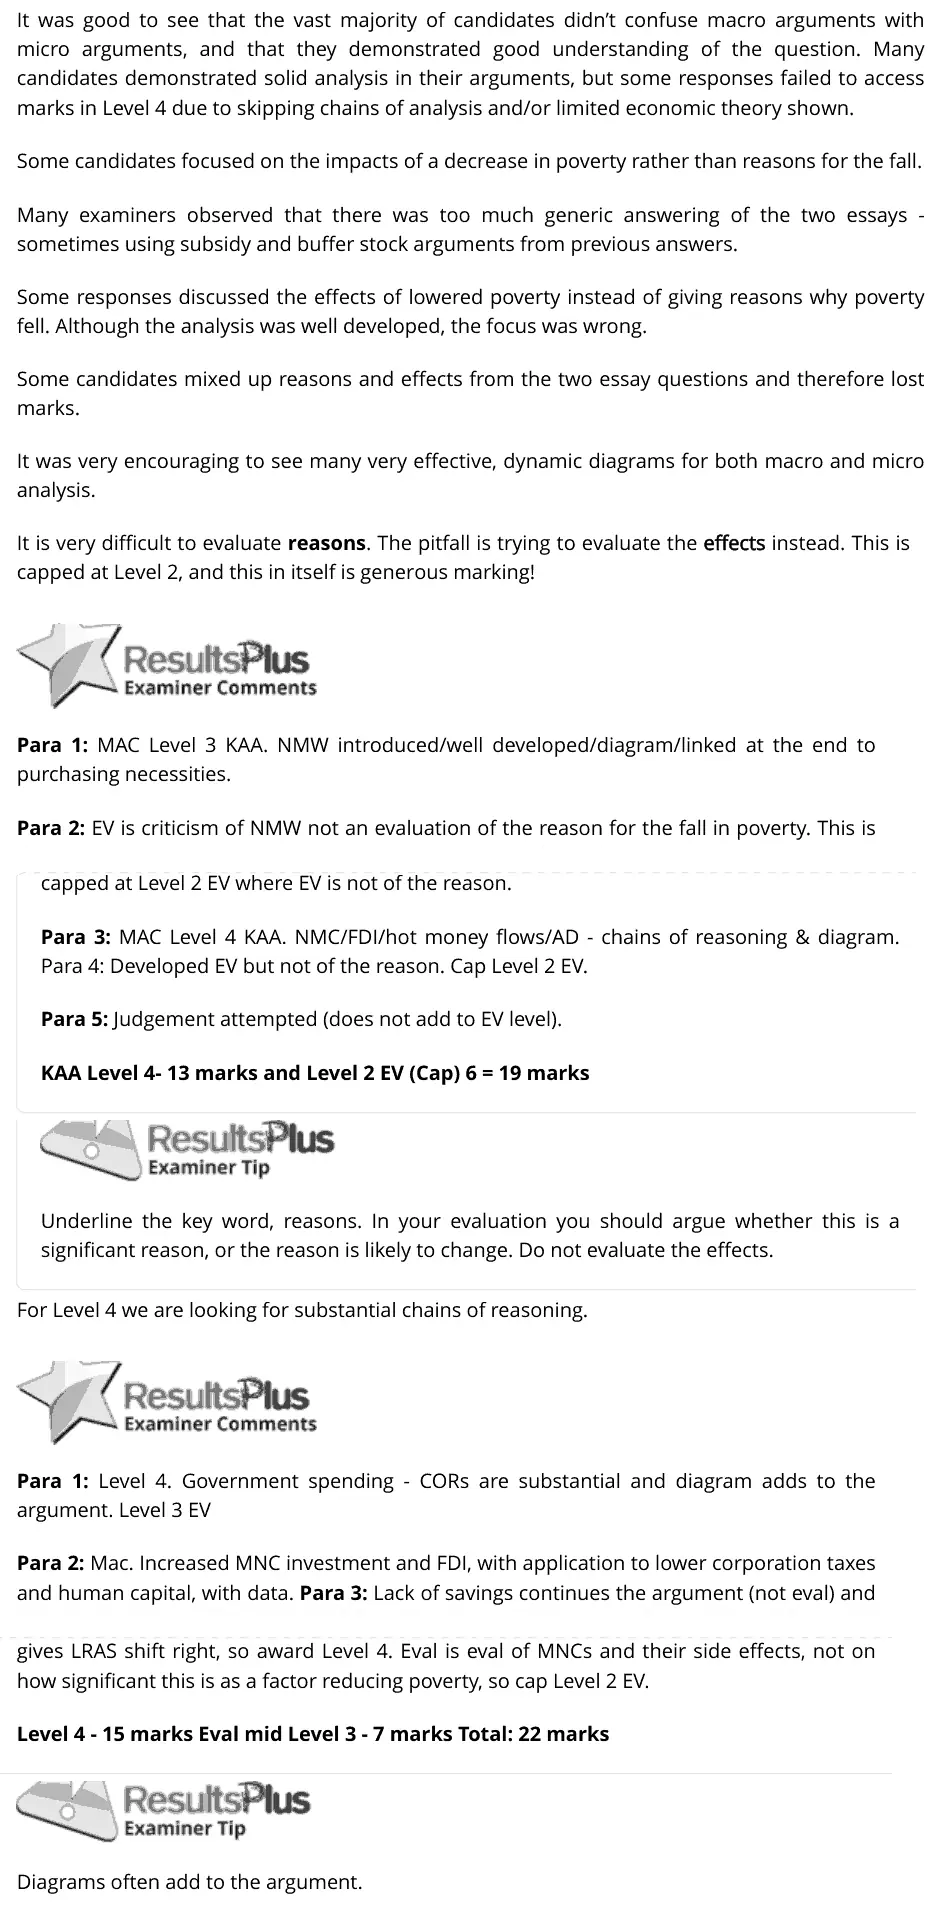
It was good to see that the vast majority of candidates didn’t confuse macro arguments with micro arguments, and that they demonstrated good understanding of the question. Many candidates demonstrated solid analysis in their arguments, but some responses failed to access marks in Level 4 due to skipping chains of analysis and/or limited economic theory shown. Some candidates focused on the impacts of a decrease in poverty rather than reasons for the fall. Many examiners observed that there was too much generic answering of the two essays - sometimes using subsidy and buffer stock arguments from previous answers. Some responses discussed the effects of lowered poverty instead of giving reasons why poverty fell. Although the analysis was well developed, the focus was wrong. Some candidates mixed up reasons and effects from the two essay questions and therefore lost marks. It was very encouraging to see many very effective, dynamic diagrams for both macro and micro analysis. It is very difficult to evaluate reasons. The pitfall is trying to evaluate the effects instead. This is capped at Level 2, and this in itself is generous marking! Para 1: MAC Level 3 KAA. NMW introduced/well developed/diagram/linked at the end to purchasing necessities. Para 2: EV is criticism of NMW not an evaluation of the reason for the fall in poverty. This is capped at Level 2 EV where EV is not of the reason. Para 3: MAC Level 4 KAA. NMC/FDI/hot money flows/AD - chains of reasoning & diagram. Para 4: Developed EV but not of the reason. Cap Level 2 EV. Para 5: Judgement attempted (does not add to EV level). KAA Level 4- 13 marks and Level 2 EV (Cap) 6 = 19 marks Underline the key word, reasons. In your evaluation you should argue whether this is a significant reason, or the reason is likely to change. Do not evaluate the effects. For Level 4 we are looking for substantial chains of reasoning. Para 1: Level 4. Government spending - CORs are substantial and diagram adds to the argument. Level 3 EV Para 2: Mac. Increased MNC investment and FDI, with application to lower corporation taxes and human capital, with data. Para 3: Lack of savings continues the argument (not eval) and gives LRAS shift right, so award Level 4. Eval is eval of MNCs and their side effects, not on how significant this is as a factor reducing poverty, so cap Level 2 EV. Level 4 - 15 marks Eval mid Level 3 - 7 marks Total: 22 marks Diagrams often add to the argument.
Notes from the mark scheme and report
reasons for the fall in poverty (55.1% to 16.4%), not its effects
micro: wages/minimum wage, mobility, access to water, food and banking
macro: growth, FDI, education, infrastructure
Level 4 needs a micro and a macro reason and reference to India
Quantitative skills: QS 9 (interpret, apply and analyse information in written, graphical tabular and numerical forms)
June 2024 · Paper 3 · Q1(d)25 marksAO1=4, AO2=4, AO3=8, AO4=925-mark essayEither/or
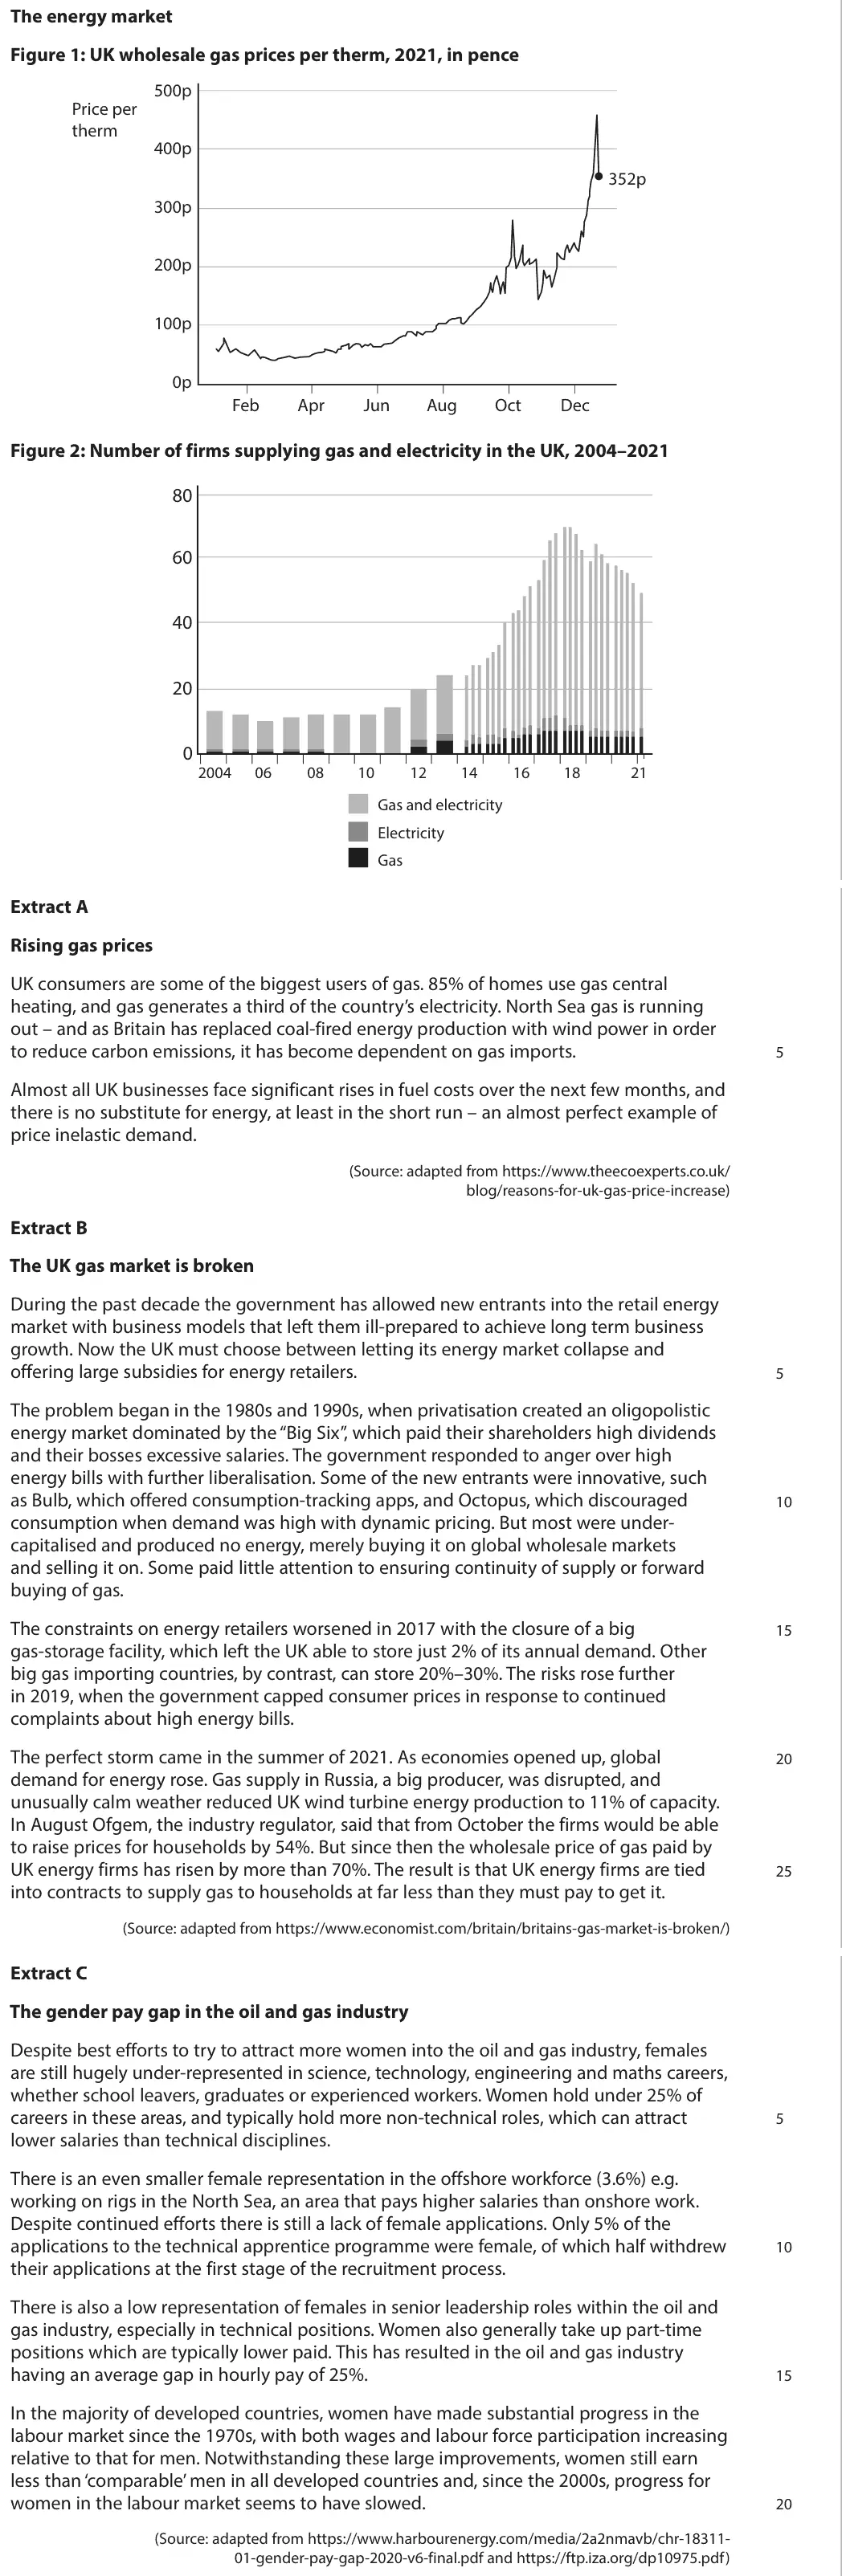
Data and extracts for question 1
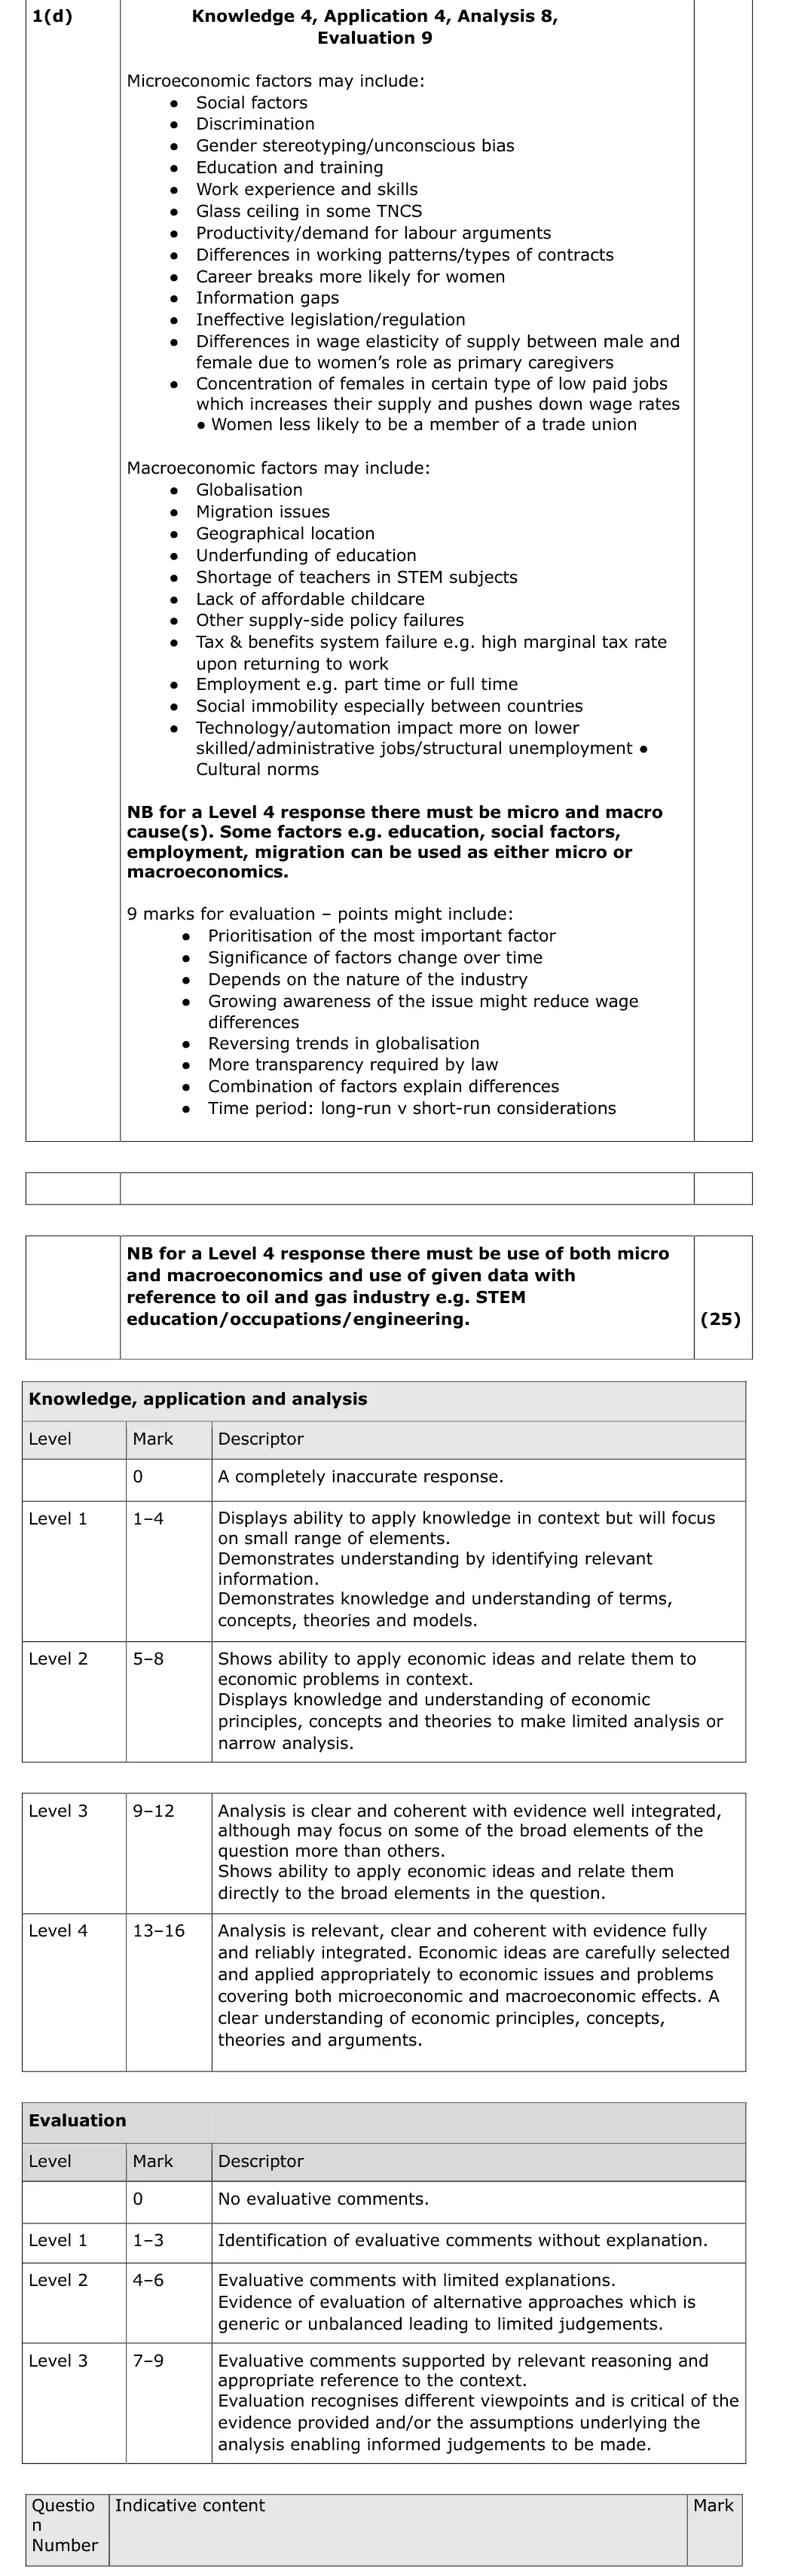
Mark scheme, including the levels grid and indicative content
Examiner's comment
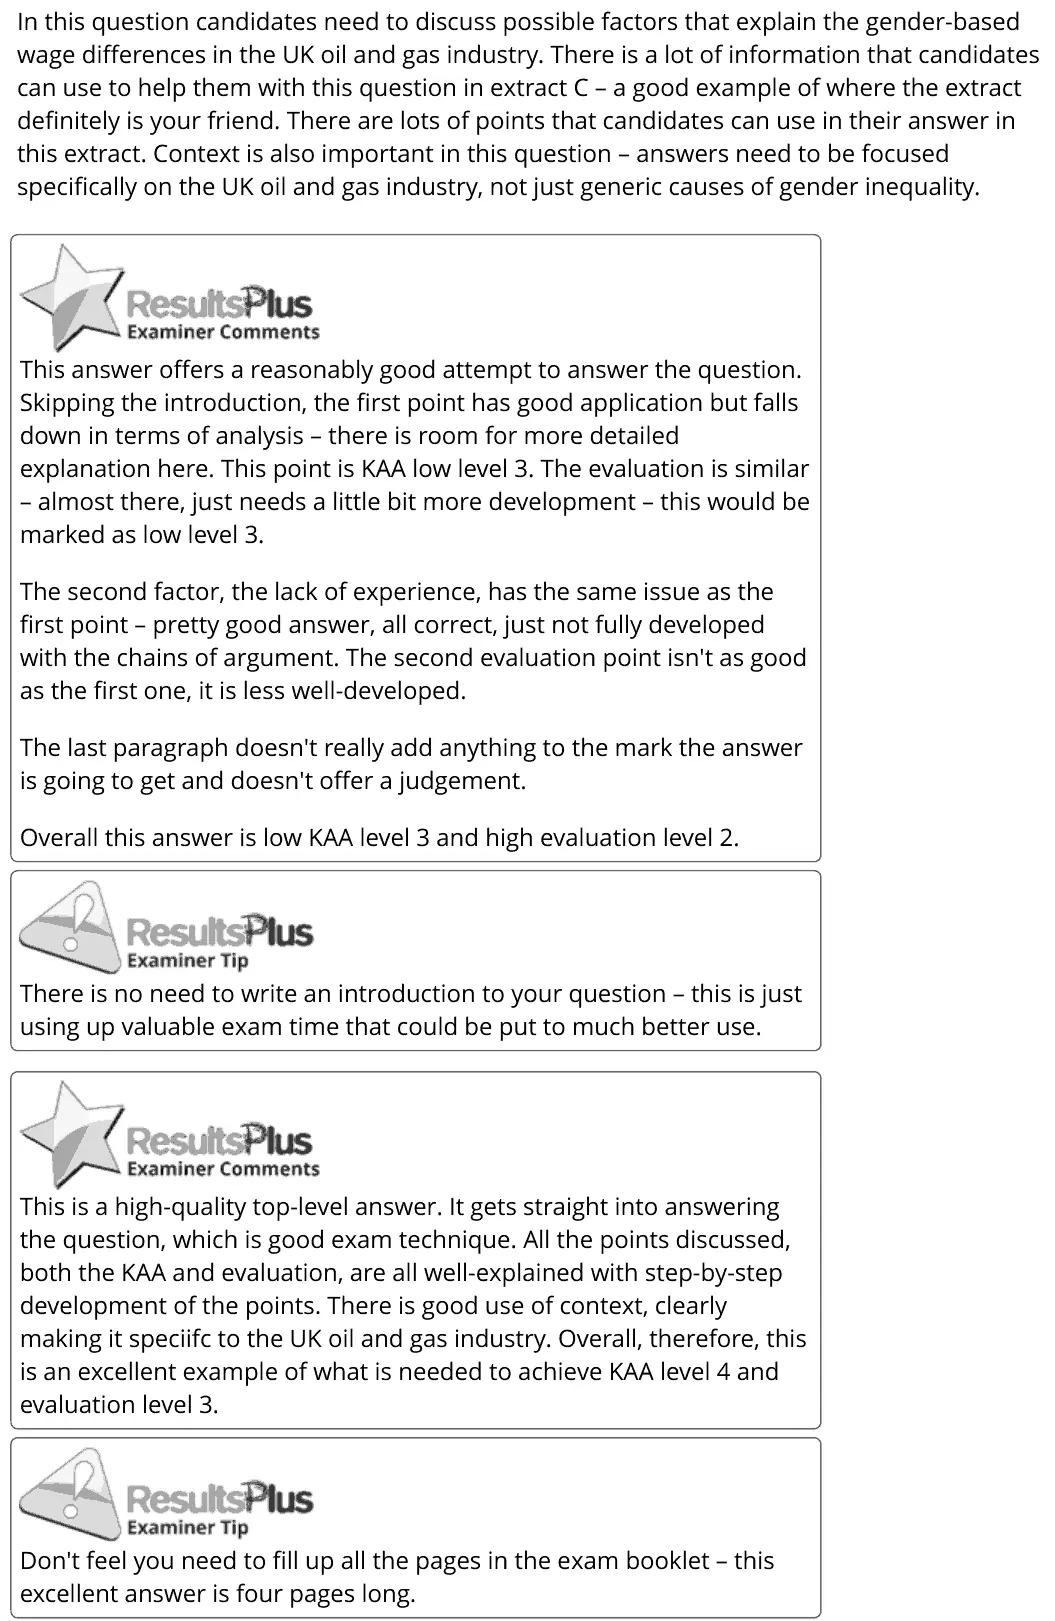
In this question candidates need to discuss possible factors that explain the gender-based wage differences in the UK oil and gas industry. There is a lot of information that candidates can use to help them with this question in extract C - a good example of where the extract definitely is your friend. There are lots of points that candidates can use in their answer in this extract. Context is also important in this question - answers need to be focused specifically on the UK oil and gas industry, not just generic causes of gender inequality. This answer offers a reasonably good attempt to answer the question. Skipping the introduction, the first point has good application but falls down in terms of analysis - there is room for more detailed explanation here. This point is KAA low level 3. The evaluation is similar - almost there, just needsa little bit more development - this would be marked as low level 3. The second factor, the lack of experience, has the same issue as the first point - pretty good answer, all correct, just not fully developed with the chains of argument. The second evaluation point isn't as good as the first one, it is less well-developed. The last paragraph doesn't really add anything to the mark the answer is going to get and doesn't offer a judgement. Overall this answer is low KAA level 3 and high evaluation level 2. GM ResultsPius —~_) Examiner Tip There is no need to write an introduction to your question - this is just using up valuable exam time that could be put to much better use. <p BesultsPtus This is a high-quality top-level answer. It gets straight into answering the question, which is good exam technique. All the points discussed, both the KAA and evaluation, are all well-explained with step-by-step development ofthe points. There is good use of context, clearly making it speciifc to the UK oil and gas industry. Overall, therefore, this is an excellent example of what is needed to achieve KAA level 4 and evaluation level 3. GF ResultsPlus ~~) Examiner Tip Don't feel you need to fill up all the pages in the exam booklet - this excellent answer is four pages long.
Notes from the mark scheme and report
micro: discrimination, stereotyping, skills and STEM training, part-time work, career breaks, elasticity of labour supply
macro: underfunded education, childcare, tax and benefit system, technology
Level 4 needs both micro and macro and use of Extract C data on oil and gas
generic gender pay gap answers stay low
no introduction needed
June 2022 · Paper 2 · Q6(a)5 marksAO1=2, AO2=2, AO3=1Diagram
Data and extracts for question 6
Mark scheme
Examiner's comment
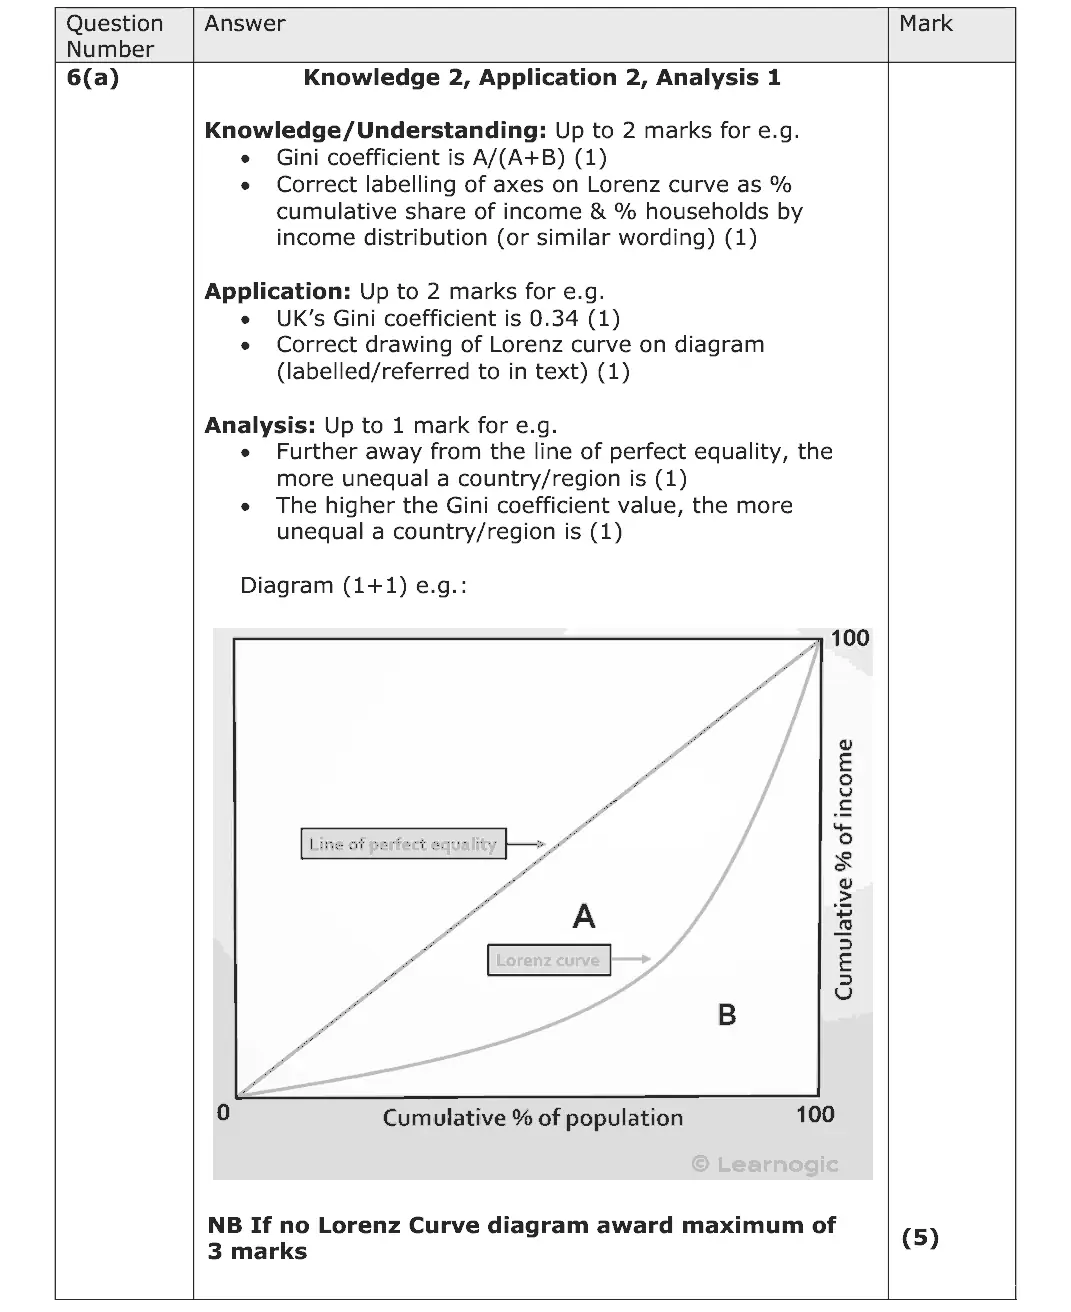
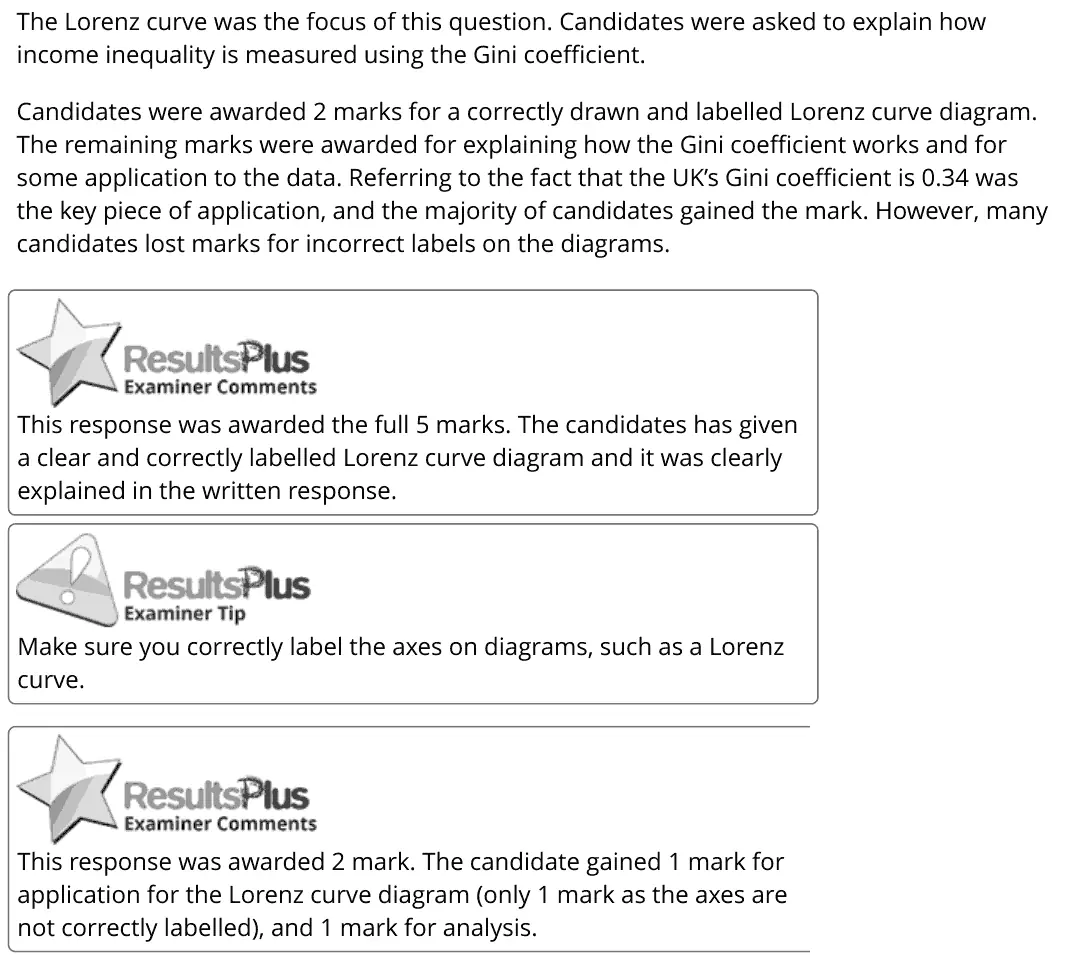
The Lorenz curve was the focus of this question. Candidates were asked to explain how income inequality is measured using the Gini coefficient. Candidates were awarded 2 marks for a correctly drawn and labelled Lorenz curve diagram. The remaining marks were awarded for explaining how the Gini coefficient works and for some application to the data. Referring to the fact that the UK’s Gini coefficient is 0.34 was the key piece of application, and the majority of candidates gained the mark. However, many candidates lost marks for incorrect labels on the diagrams. This response was awarded the full 5 marks. The candidates has given a clear and correctly labelled Lorenz curve diagram and it was clearly explained in the written response. Make sure you correctly label the axes on diagrams, such as a Lorenz curve. This response was awarded 2 mark. The candidate gained 1 mark for application for the Lorenz curve diagram (only 1 mark as the axes are not correctly labelled), and 1 mark for analysis.
Notes from the mark scheme and report
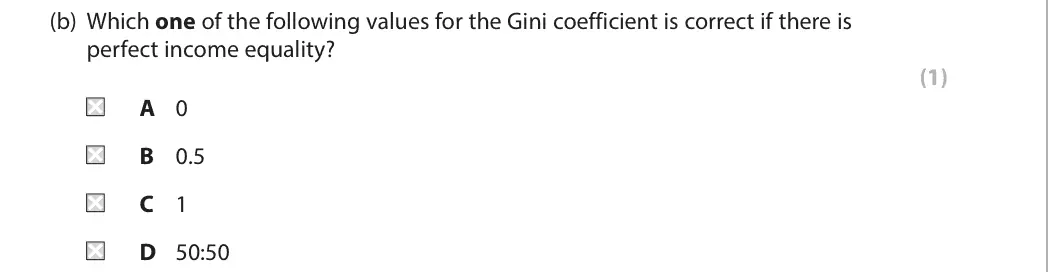
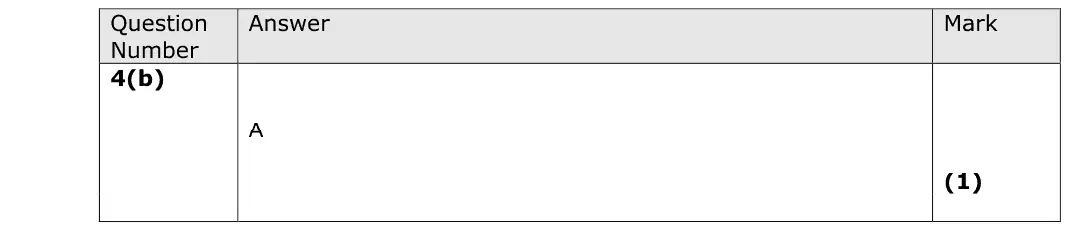
Gini = A/(A+B) from the Lorenz curve
label axes cumulative % of income and cumulative % of population/households
quote UK Gini of 0.34 (Extract A)
maximum 3 without a Lorenz diagram
many lost marks for incorrect axis labels
Quantitative skills: QS 4 (construct and interpret a range of standard graphical forms); QS 9 (interpret, apply and analyse information in written, graphical tabular and numerical forms)
June 2022 · Paper 2 · Q6(b)8 marksAO1=2, AO2=2, AO3=2, AO4=28-mark response
Data and extracts for question 6
Mark scheme, including the levels grid and indicative content
Examiner's comment
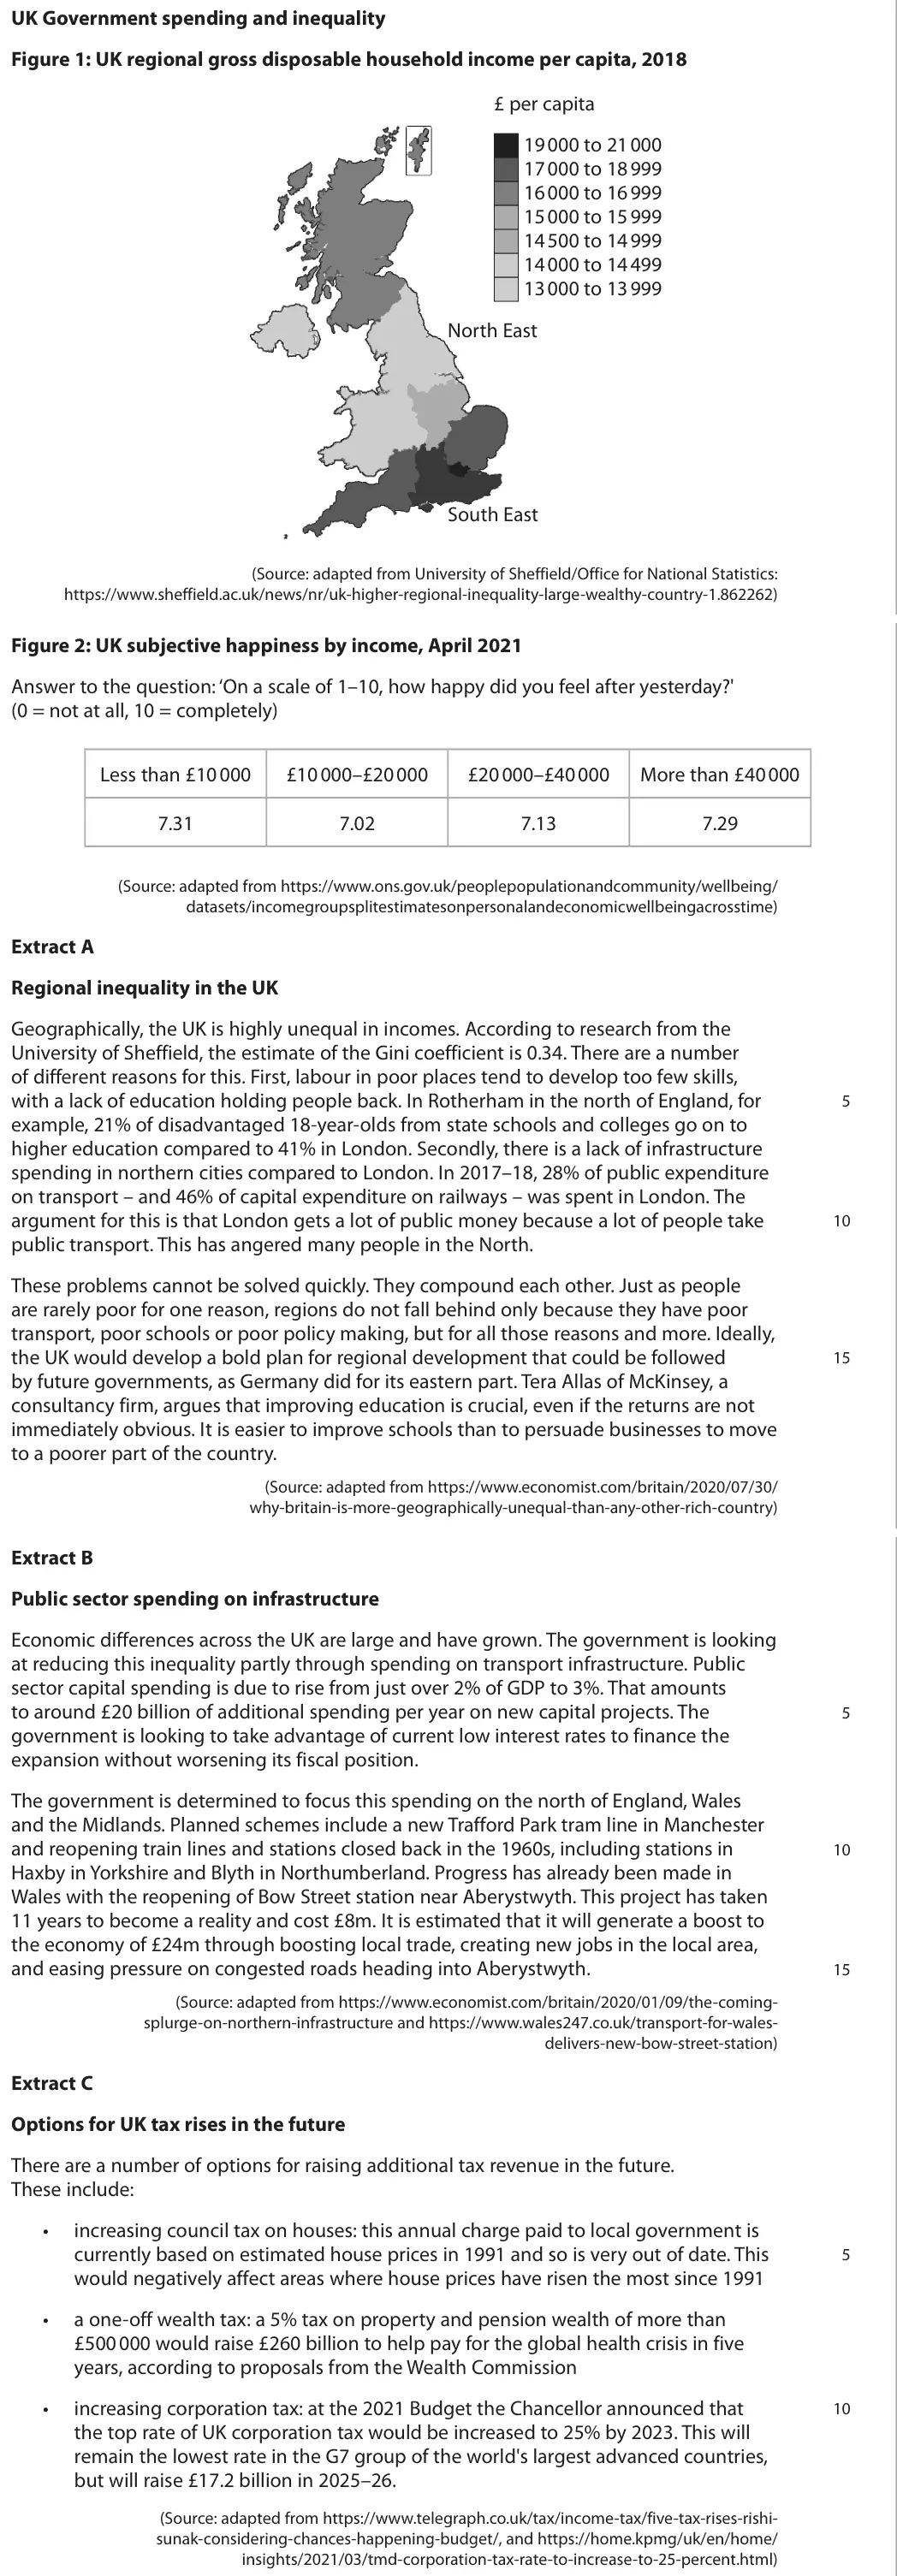
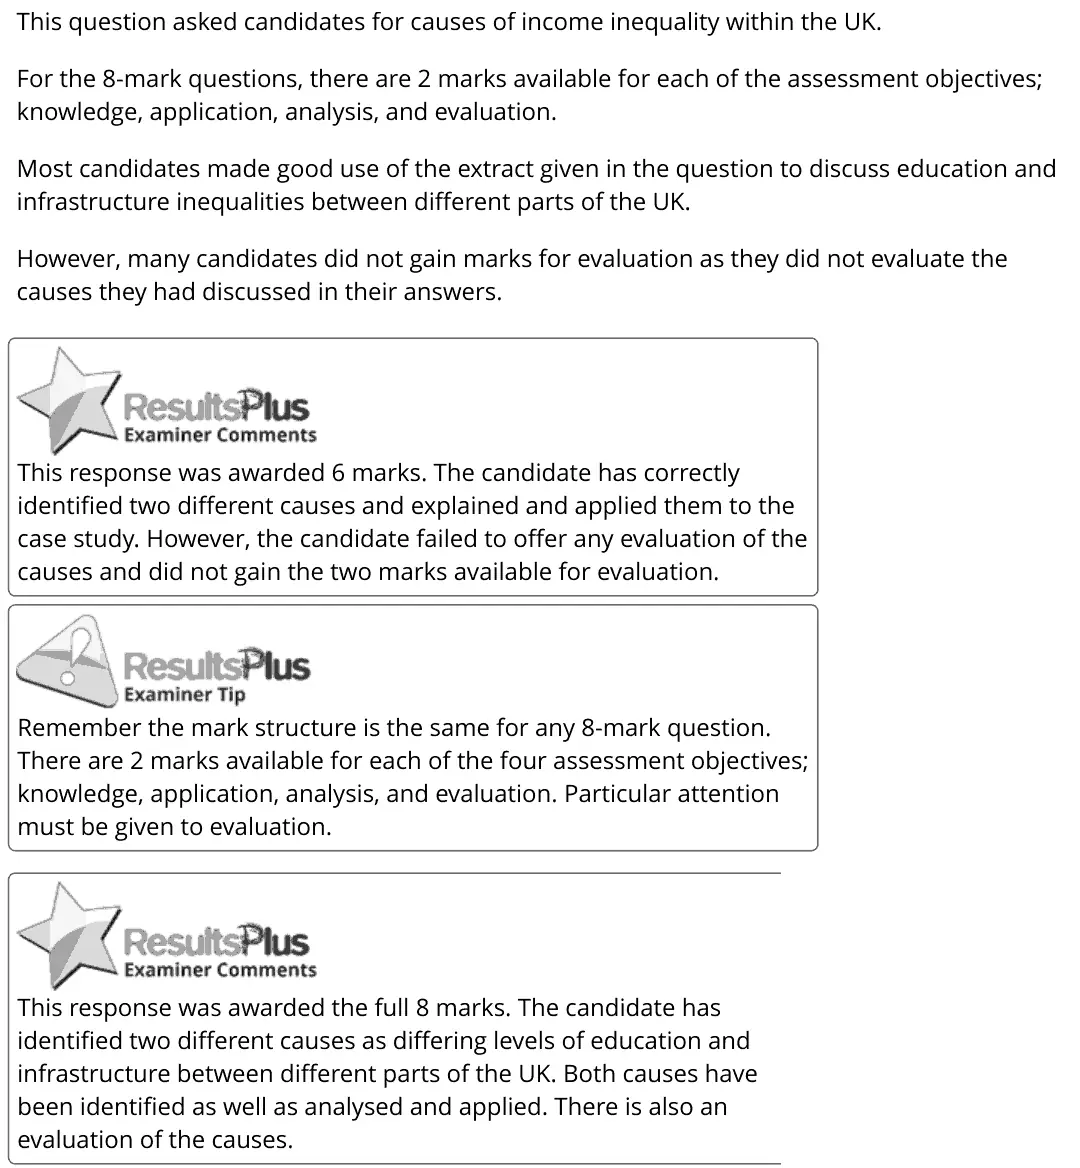
This question asked candidates for causes of income inequality within the UK. For the 8-mark questions, there are 2 marks available for each of the assessment objectives; knowledge, application, analysis, and evaluation. Most candidates made good use of the extract given in the question to discuss education and infrastructure inequalities between different parts of the UK. However, many candidates did not gain marks for evaluation as they did not evaluate the causes they had discussed in their answers. This response was awarded 6 marks. The candidate has correctly identified two different causes and explained and applied them to the case study. However, the candidate failed to offer any evaluation of the causes and did not gain the two marks available for evaluation. Remember the mark structure is the same for any 8-mark question. There are 2 marks available for each of the four assessment objectives; knowledge, application, analysis, and evaluation. Particular attention must be given to evaluation. This response was awarded the full 8 marks. The candidate has identified two different causes as differing levels of education and infrastructure between different parts of the UK. Both causes have been identified as well as analysed and applied. There is also an evaluation of the causes.
Notes from the mark scheme and report
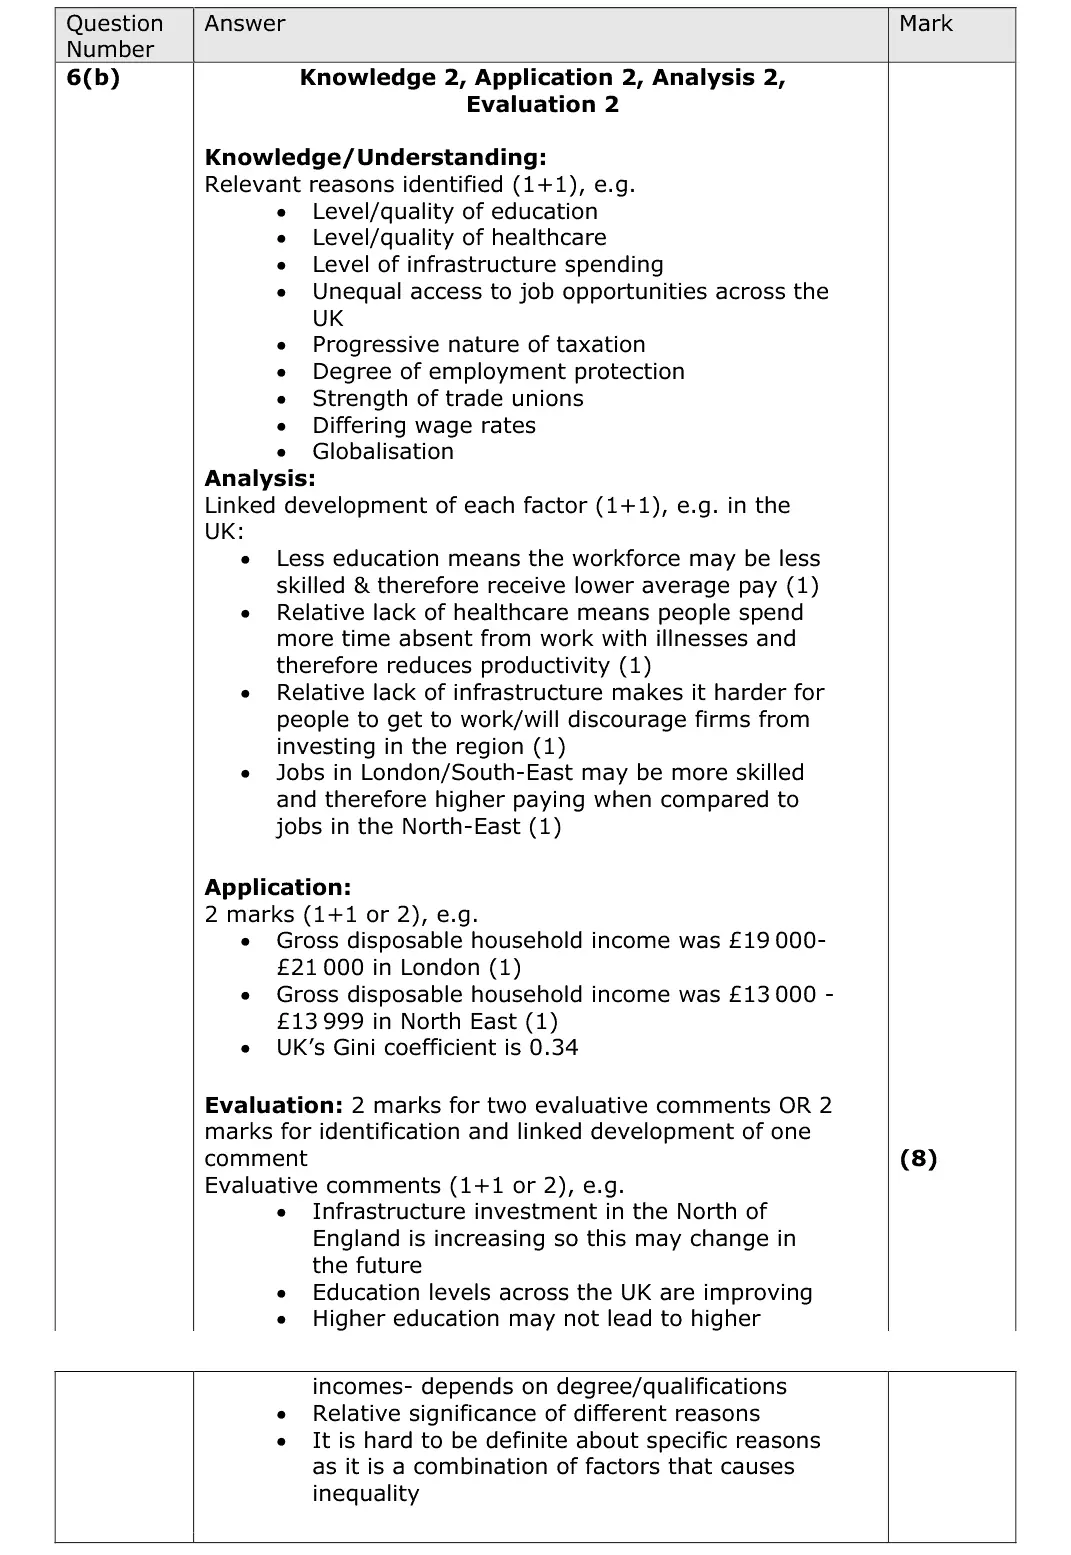
two causes (education, infrastructure spending, job opportunities, unions, wage rates) applied to Figure 1 (£19 000 to £21 000 in London vs £13 000 to £13 999 in the North East) or Extract A
many lost both evaluation marks
Quantitative skills: QS 9 (interpret, apply and analyse information in written, graphical tabular and numerical forms)
November 2021 · Paper 3 · Q1(e)25 marksAO1=4, AO2=4, AO3=8, AO4=925-mark essayEither/or
Data and extracts for question 1
Mark scheme, including the levels grid and indicative content
Examiner's comment
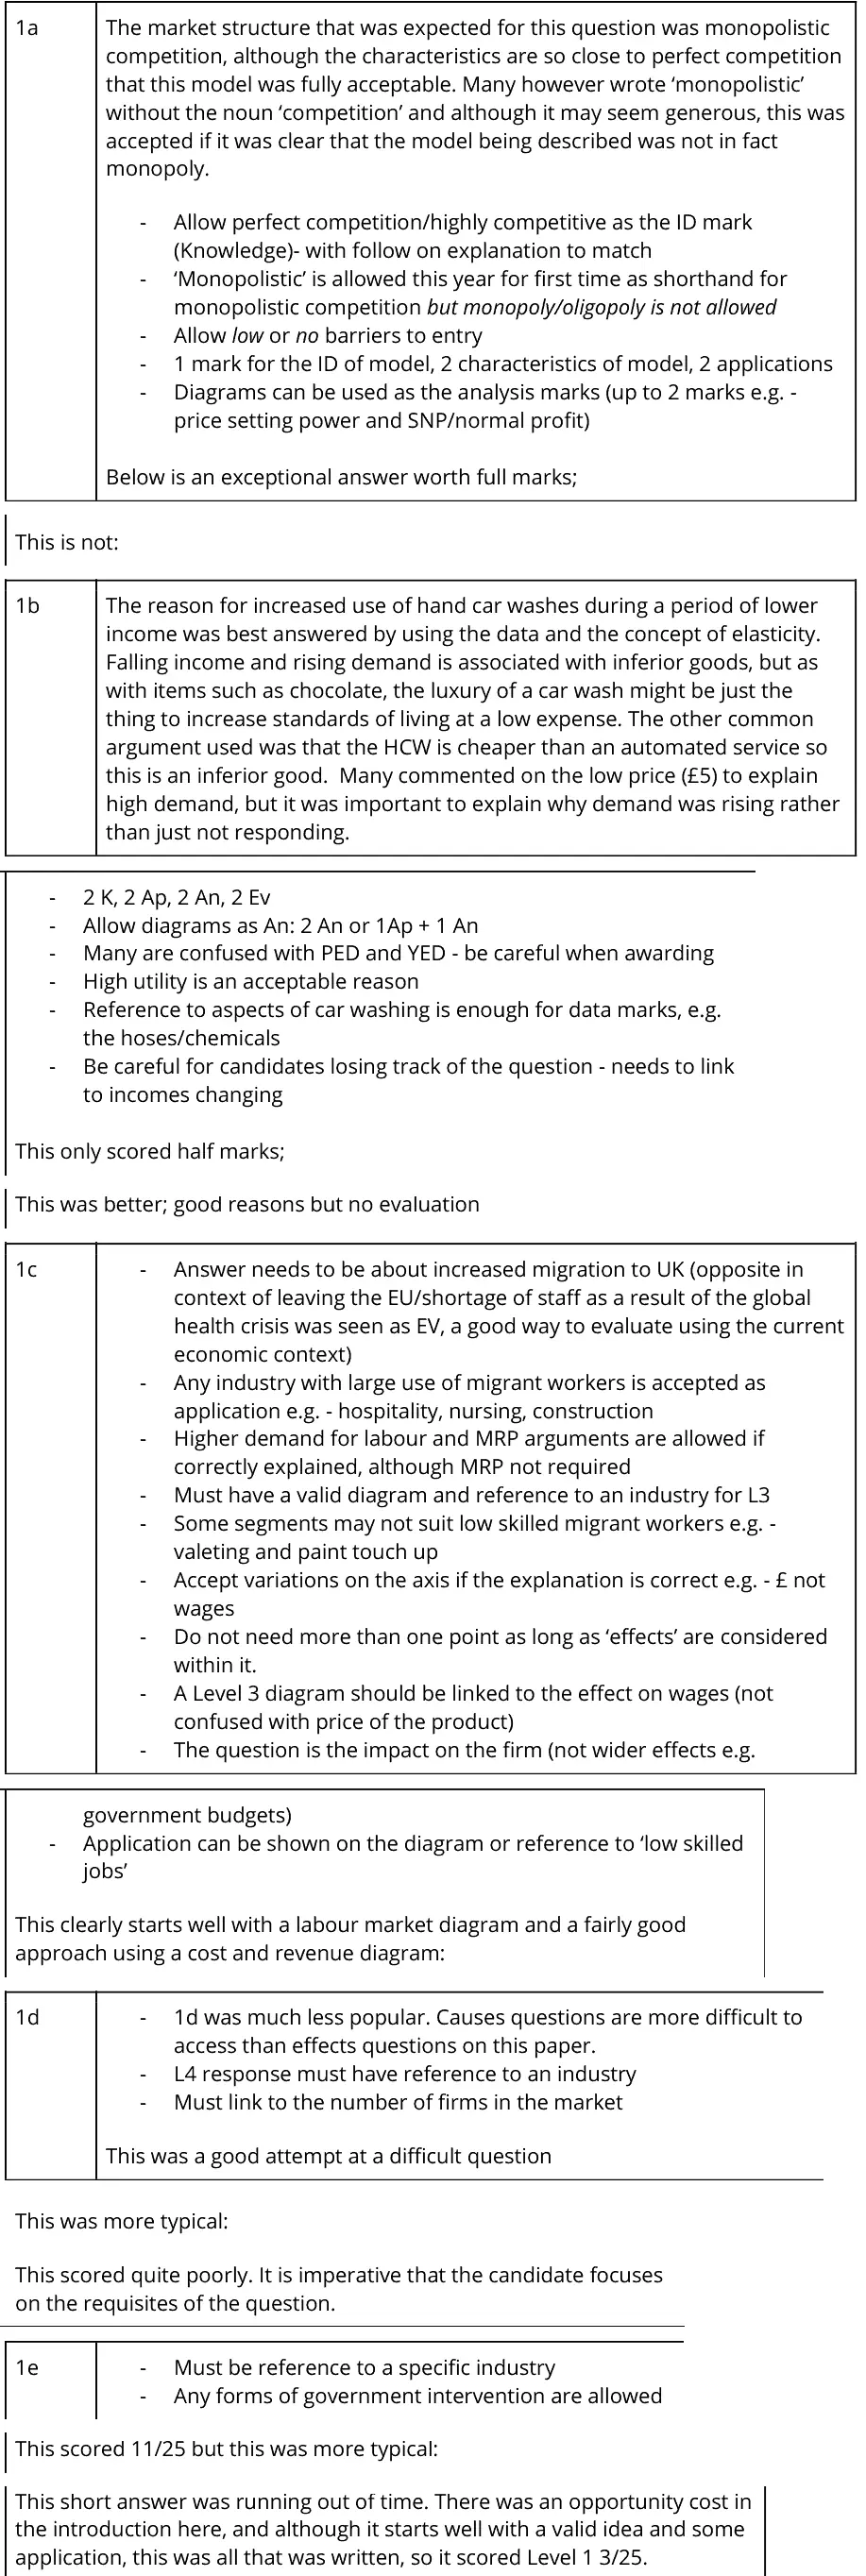
1a The market structure that was expected for this question was monopolistic competition, although the characteristics are so close to perfect competition that this model was fully acceptable. Many however wrote ‘monopolistic’ without the noun ‘competition’ and although it may seem generous, this was accepted if it was clear that the model being described was not in fact monopoly. - Allow perfect competition/highly competitive as the ID mark (Knowledge)- with follow on explanation to match - ‘Monopolistic’ is allowed this year for first time as shorthand for monopolistic competition but monopoly/oligopoly is not allowed - Allow low or no barriers to entry - 1 mark for the ID of model, 2 characteristics of model, 2 applications - Diagrams can be used as the analysis marks (up to 2 marks e.g. - price setting power and SNP/normal profit) Below is an exceptional answer worth full marks; This is not: 1b The reason for increased use of hand car washes during a period of lower income was best answered by using the data and the concept of elasticity. Falling income and rising demand is associated with inferior goods, but as with items such as chocolate, the luxury of a car wash might be just the thing to increase standards of living at a low expense. The other common argument used was that the HCW is cheaper than an automated service so this is an inferior good. Many commented on the low price (£5) to explain high demand, but it was important to explain why demand was rising rather than just not responding. - 2 K, 2 Ap, 2 An, 2 Ev - Allow diagrams as An: 2 An or 1Ap + 1 An - Many are confused with PED and YED - be careful when awarding - High utility is an acceptable reason - Reference to aspects of car washing is enough for data marks, e.g. the hoses/chemicals - Be careful for candidates losing track of the question - needs to link to incomes changing This only scored half marks; This was better; good reasons but no evaluation 1c - Answer needs to be about increased migration to UK (opposite in context of leaving the EU/shortage of staff as a result of the global health crisis was seen as EV, a good way to evaluate using the current economic context) - Any industry with large use of migrant workers is accepted as application e.g. - hospitality, nursing, construction - Higher demand for labour and MRP arguments are allowed if correctly explained, although MRP not required - Must have a valid diagram and reference to an industry for L3 - Some segments may not suit low skilled migrant workers e.g. - valeting and paint touch up - Accept variations on the axis if the explanation is correct e.g. - £ not wages - Do not need more than one point as long as ‘effects’ are considered within it. - A Level 3 diagram should be linked to the effect on wages (not confused with price of the product) - The question is the impact on the firm (not wider effects e.g. government budgets) - Application can be shown on the diagram or reference to ‘low skilled jobs’ This clearly starts well with a labour market diagram and a fairly good approach using a cost and revenue diagram: 1d - 1d was much less popular. Causes questions are more difficult to access than effects questions on this paper. - L4 response must have reference to an industry - Must link to the number of firms in the market This was a good attempt at a difficult question This was more typical: This scored quite poorly. It is imperative that the candidate focuses on the requisites of the question. 1e - Must be reference to a specific industry - Any forms of government intervention are allowed This scored 11/25 but this was more typical: This short answer was running out of time. There was an opportunity cost in the introduction here, and although it starts well with a valid idea and some application, this was all that was written, so it scored Level 1 3/25.
Notes from the mark scheme and report
micro: wage floors raise costs, higher car wash prices, minimum price, health and safety
macro: equality, inflation, employment
Level 4 needs micro and macro and a specific industry
evaluate with government failure (regulatory capture, asymmetric information), PED, WashMark self-regulation
October 2020 · Paper 2 · Q825 marksAO1=4, AO2=4, AO3=8, AO4=925-mark essayEither/or
Mark scheme, including the levels grid and indicative content
Examiner's comment
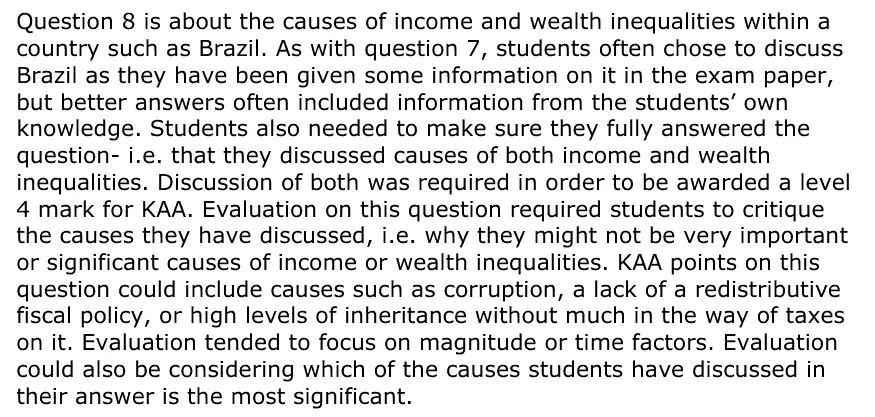
Question 8 is about the causes of income and wealth inequalities within a country such as Brazil. As with question 7, students often chose to discuss Brazil as they have been given some information on it in the exam paper, but better answers often included information from the students’ own knowledge. Students also needed to make sure they fully answered the question- i.e. that they discussed causes of both income and wealth inequalities. Discussion of both was required in order to be awarded a level 4 mark for KAA. Evaluation on this question required students to critique the causes they have discussed, i.e. why they might not be very important or significant causes of income or wealth inequalities. KAA points on this question could include causes such as corruption, a lack of a redistributive fiscal policy, or high levels of inheritance without much in the way of taxes on it. Evaluation tended to focus on magnitude or time factors. Evaluation could also be considering which of the causes students have discussed in their answer is the most significant.
Notes from the mark scheme and report
causes of income and wealth inequality (corruption, little redistributive fiscal policy, regressive indirect taxes, unequal education and healthcare, rural-urban divide, weak unions, untaxed inheritance)
Level 4 KAA requires causes of BOTH income and wealth inequality
evaluate magnitude and time
June 2019 · Paper 2 · Q5(b)2 marksAO1=1, AO3=1Short answer
Data and extracts for question 5
Mark scheme
Examiner's comment
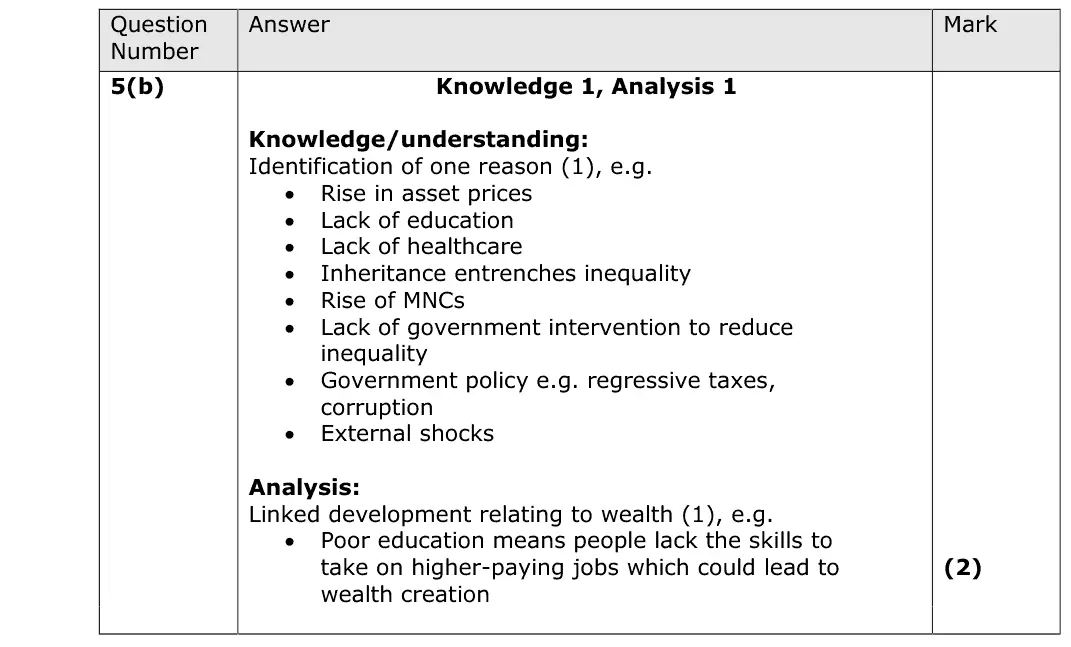
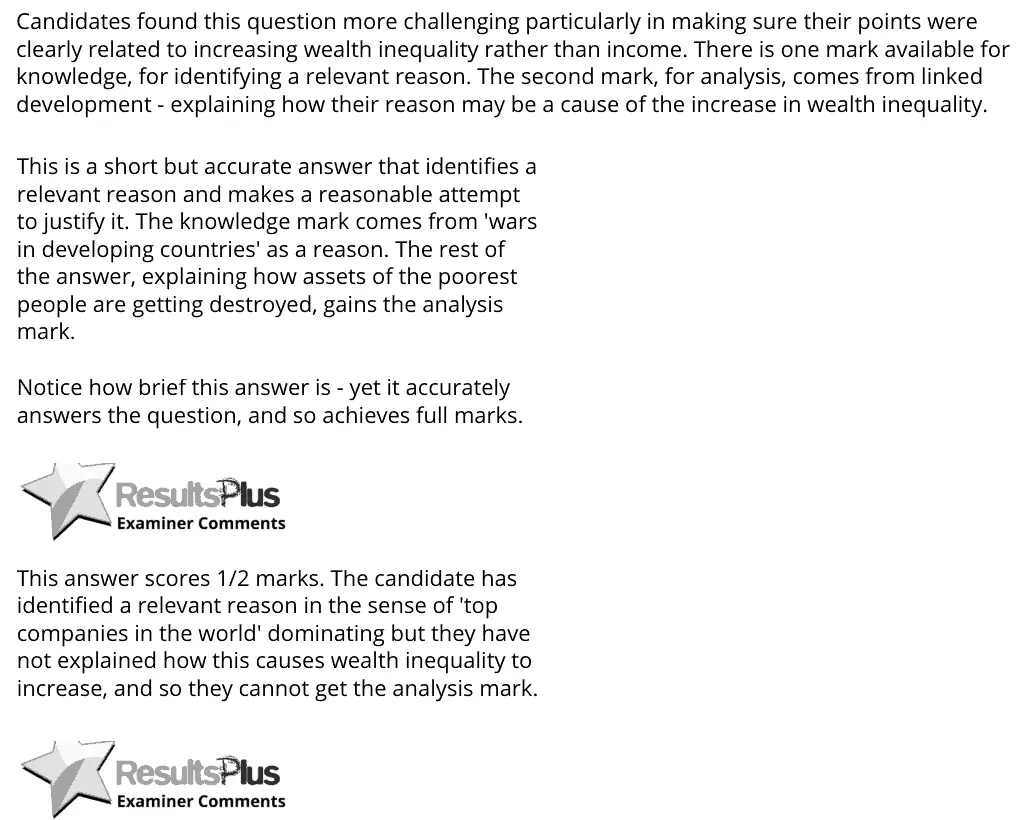
Candidates found this question more challenging particularly in making sure their points were clearly related to increasing wealth inequality rather than income. There is one mark available for knowledge, for identifying a relevant reason. The second mark, for analysis, comes from linked development - explaining how their reason may be a cause of the increase in wealth inequality. This is a short but accurate answer that identifies a relevant reason and makes a reasonable attempt to justify it. The knowledge mark comes from 'wars in developing countries' as a reason. The rest of the answer, explaining how assets of the poorest people are getting destroyed, gains the analysis mark. Notice how brief this answer is - yet it accurately answers the question, and so achieves full marks. This answer scores 1/2 marks. The candidate has identified a relevant reason in the sense of 'top companies in the world' dominating but they have not explained how this causes wealth inequality to increase, and so they cannot get the analysis mark.
Notes from the mark scheme and report
one reason plus linked development, e.g. rising asset prices, inheritance, lack of education
candidates often explained income rather than wealth inequality
June 2019 · Paper 3 · Q1(b)8 marksAO1=2, AO2=2, AO3=2, AO4=28-mark response
Data and extracts for question 1
Mark scheme, including the levels grid and indicative content
Examiner's comment
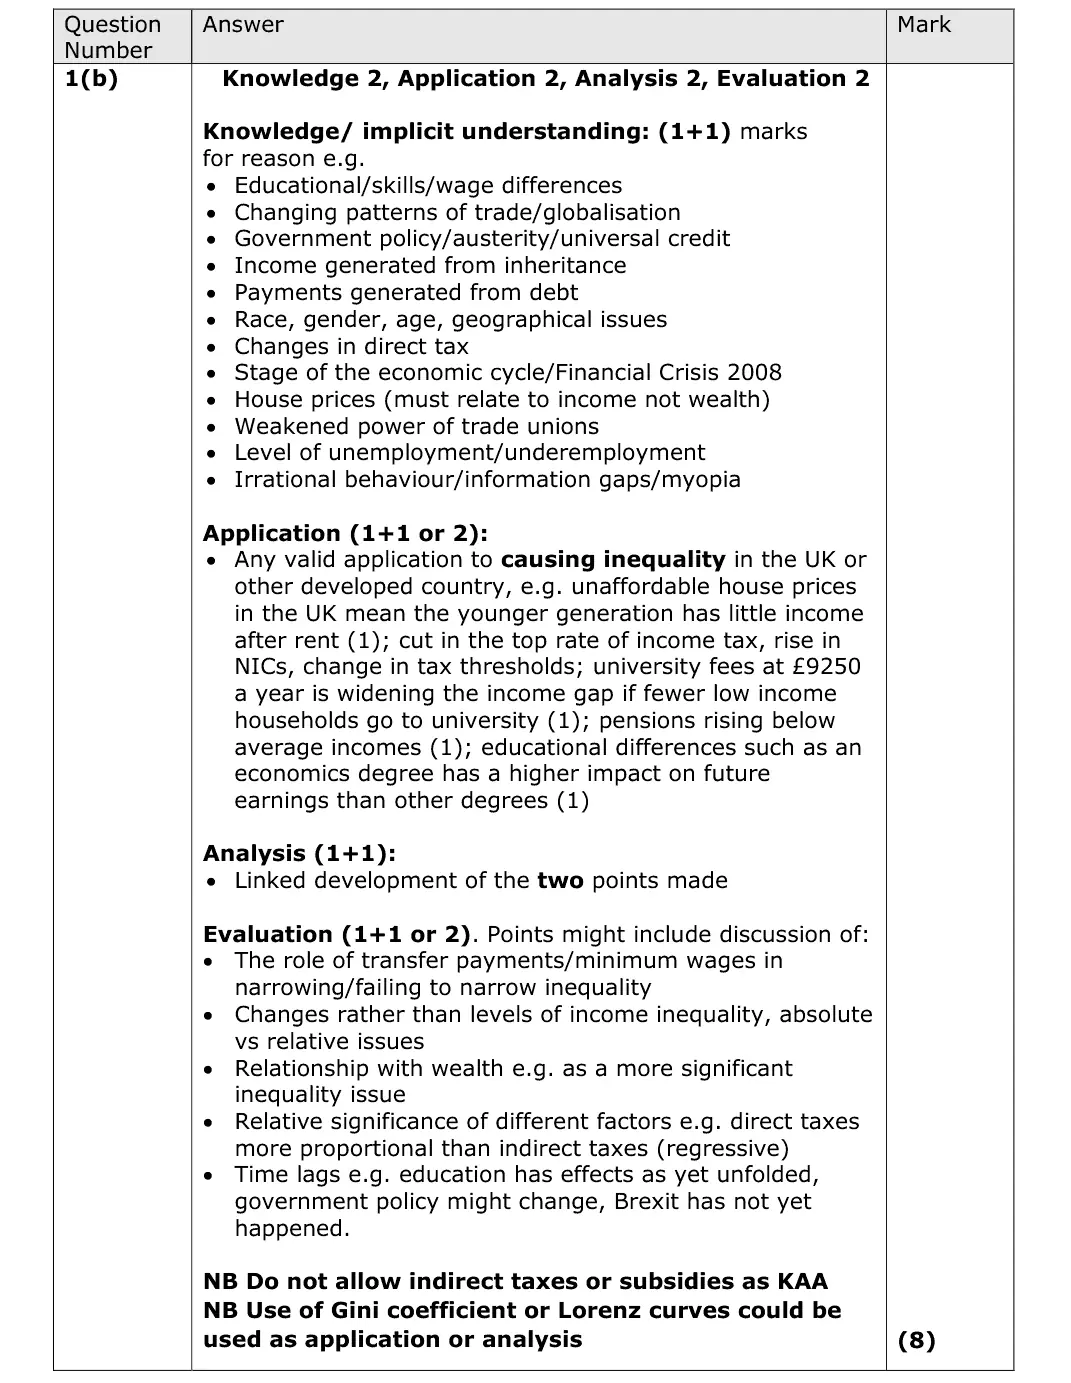
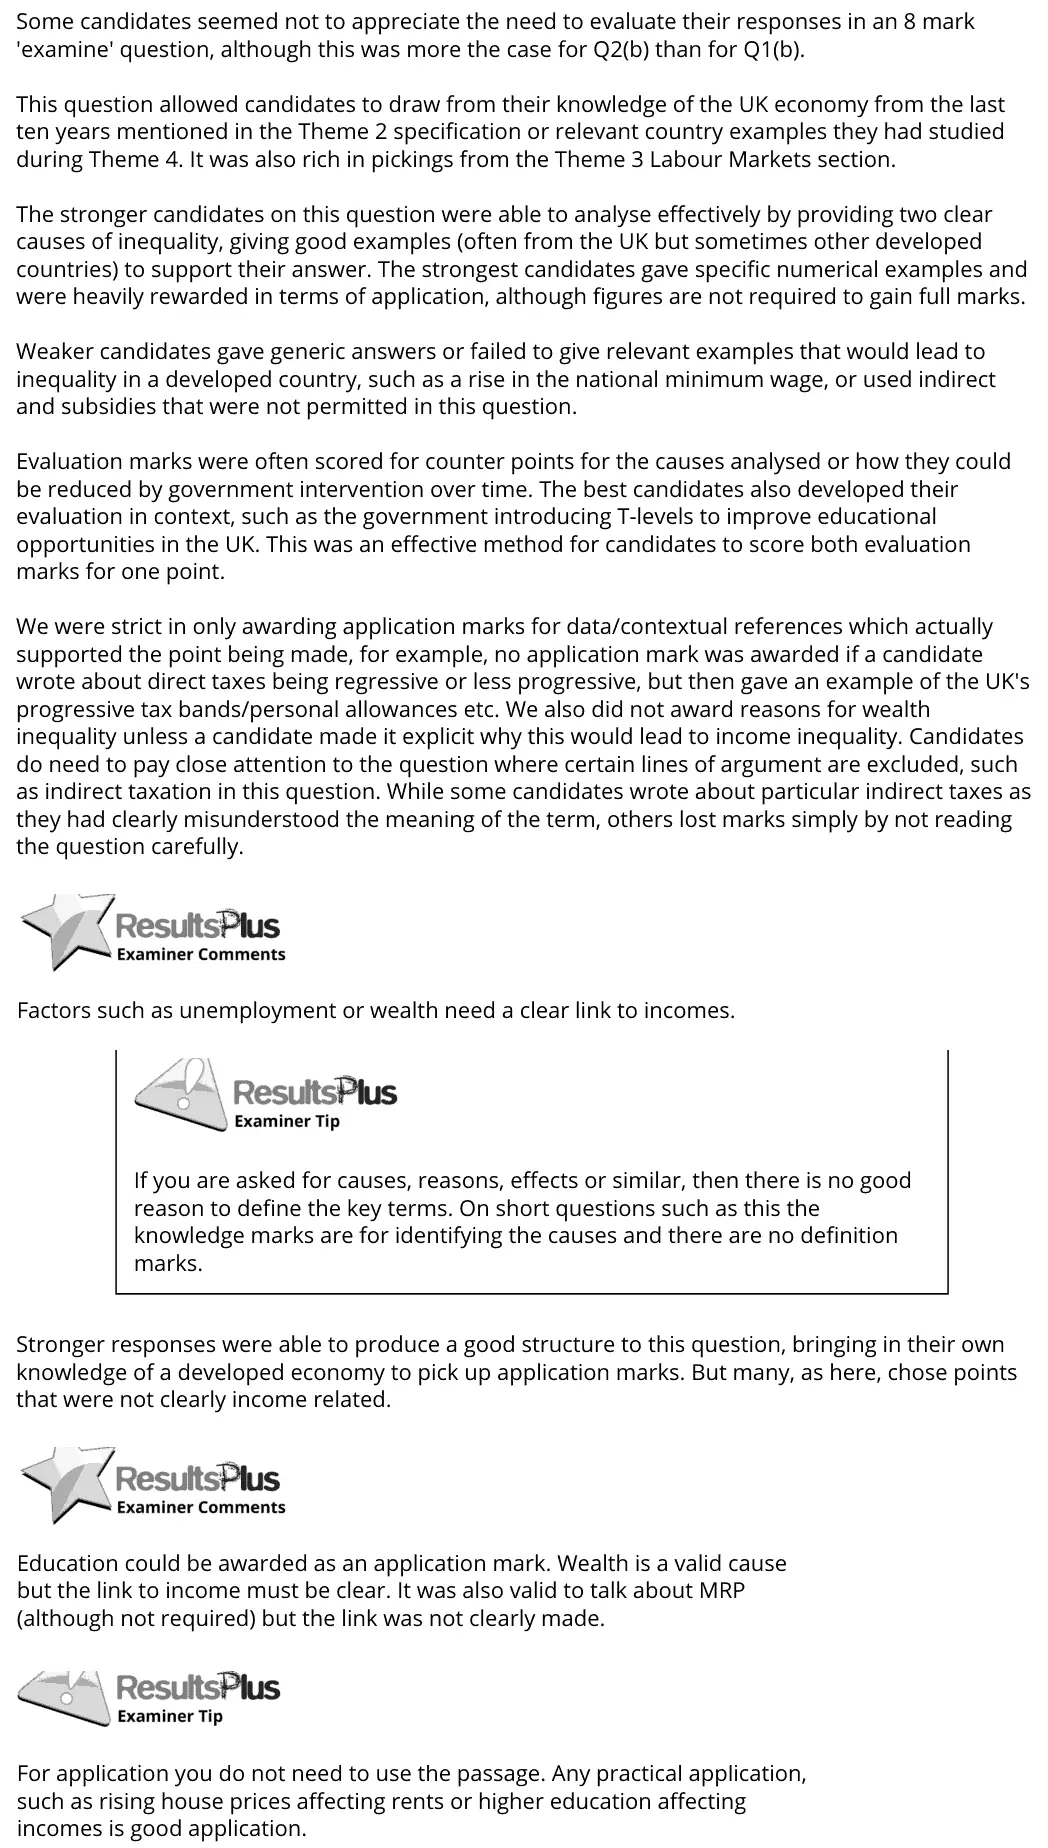
Some candidates seemed not to appreciate the need to evaluate their responses in an 8 mark 'examine' question, although this was more the case for Q2(b) than for Q1(b). This question allowed candidates to draw from their knowledge of the UK economy from the last ten years mentioned in the Theme 2 specification or relevant country examples they had studied during Theme 4. It was also rich in pickings from the Theme 3 Labour Markets section. The stronger candidates on this question were able to analyse effectively by providing two clear causes of inequality, giving good examples (often from the UK but sometimes other developed countries) to support their answer. The strongest candidates gave specific numerical examples and were heavily rewarded in terms of application, although figures are not required to gain full marks. Weaker candidates gave generic answers or failed to give relevant examples that would lead to inequality in a developed country, such as a rise in the national minimum wage, or used indirect and subsidies that were not permitted in this question. Evaluation marks were often scored for counter points for the causes analysed or how they could be reduced by government intervention over time. The best candidates also developed their evaluation in context, such as the government introducing T-levels to improve educational opportunities in the UK. This was an effective method for candidates to score both evaluation marks for one point. We were strict in only awarding application marks for data/contextual references which actually supported the point being made, for example, no application mark was awarded if a candidate wrote about direct taxes being regressive or less progressive, but then gave an example of the UK's progressive tax bands/personal allowances etc. We also did not award reasons for wealth inequality unless a candidate made it explicit why this would lead to income inequality. Candidates do need to pay close attention to the question where certain lines of argument are excluded, such as indirect taxation in this question. While some candidates wrote about particular indirect taxes as they had clearly misunderstood the meaning of the term, others lost marks simply by not reading the question carefully. Factors such as unemployment or wealth need a clear link to incomes. If you are asked for causes, reasons, effects or similar, then there is no good reason to define the key terms. On short questions such as this the knowledge marks are for identifying the causes and there are no definition marks. Stronger responses were able to produce a good structure to this question, bringing in their own knowledge of a developed economy to pick up application marks. But many, as here, chose points that were not clearly income related. Education could be awarded as an application mark. Wealth is a valid cause but the link to income must be clear. It was also valid to talk about MRP (although not required) but the link was not clearly made. For application you do not need to use the passage. Any practical application, such as rising house prices affecting rents or higher education affecting incomes is good application.
Notes from the mark scheme and report
two causes, each applied to the UK or another developed country (house prices, tuition fees, tax changes, skills, weak unions)
indirect taxes and subsidies earn no KAA and some misread them
evaluate with transfer payments or income v wealth
June 2018 · Paper 2 · Q6(a)5 marksAO1=2, AO2=2, AO3=1Short answer
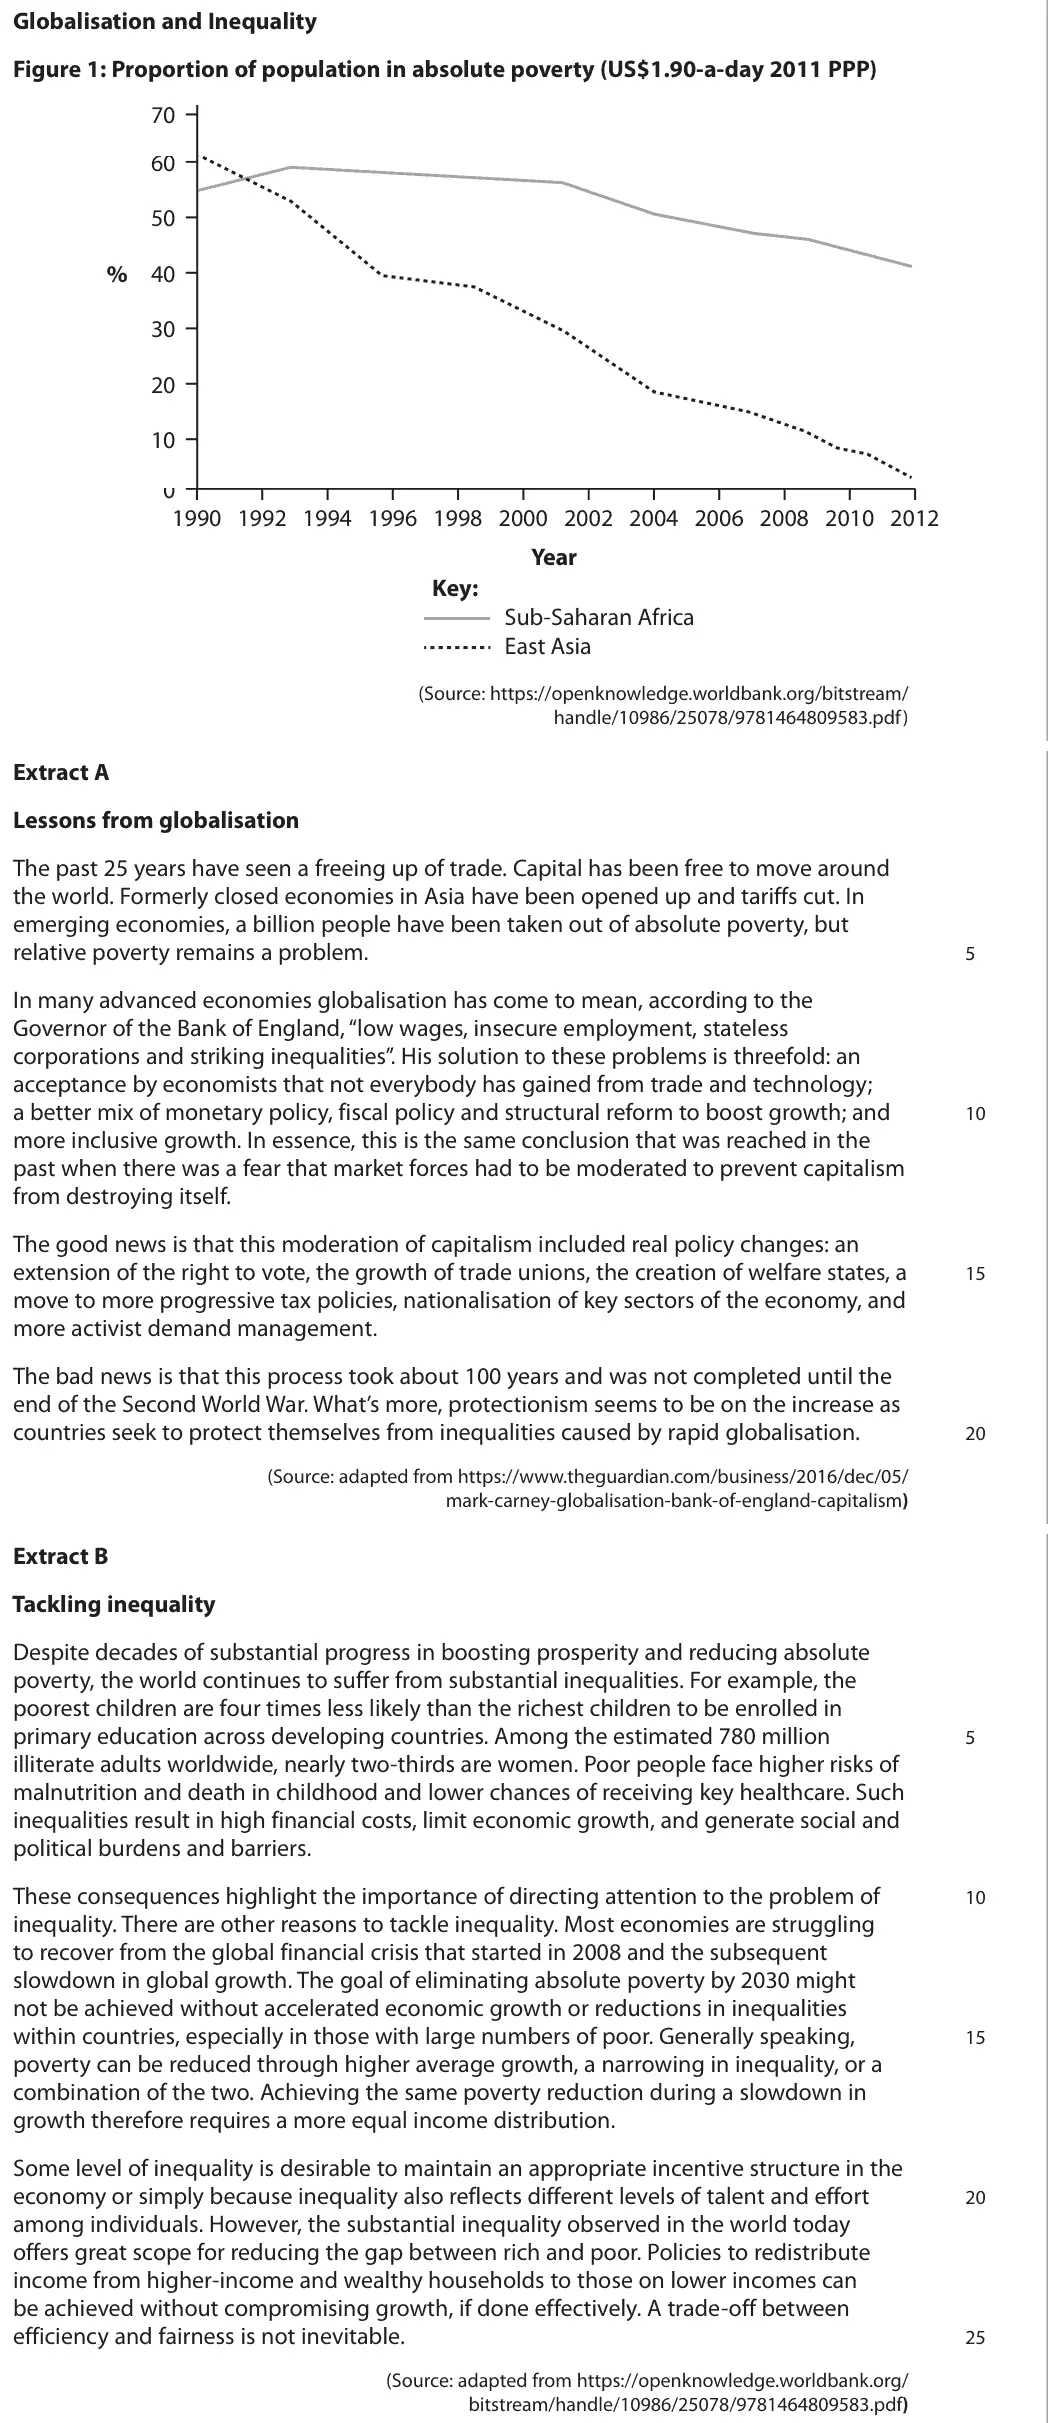
Data and extracts for question 6
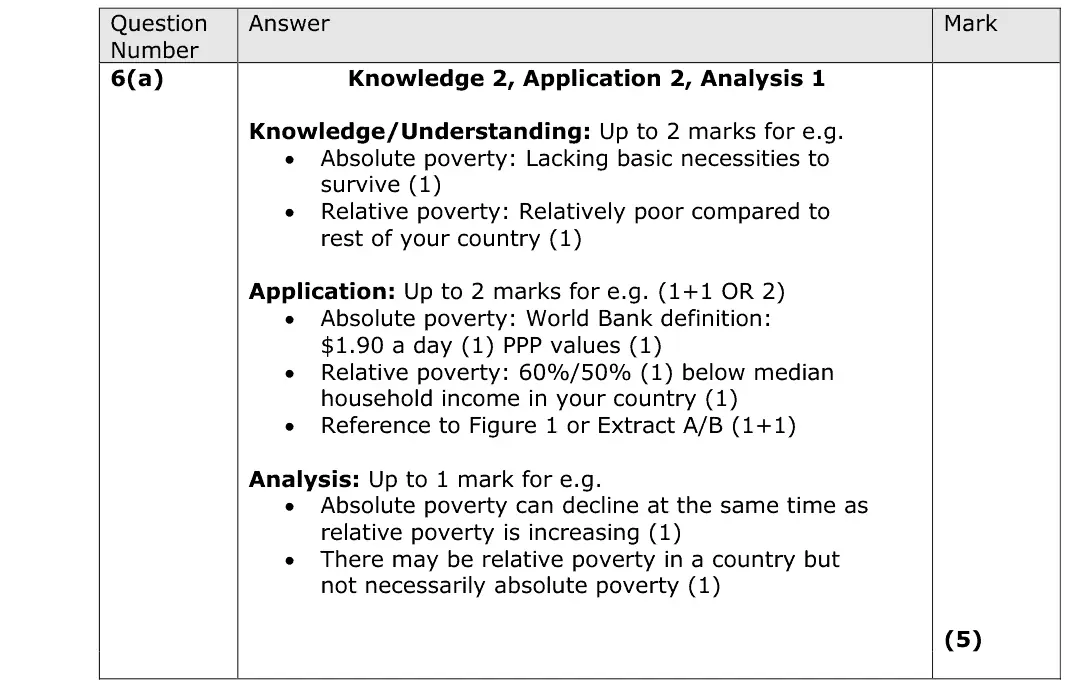
Mark scheme
Examiner's comment
In this answer there are two marks for knowledge, two for application, and one for analysis. Candidates were generally better at explaining absolute poverty than relative poverty. Many candidates achieved 4/5 as they did not offer anything that earnt the analysis mark. This answer achieves a total of 4/5. In the first paragraph the candidate gains one knowledge mark for defining absolute poverty and two application marks for $1.90 a day at PPP. In the second paragraph they explain the idea of relative poverty. This answer achieves a total of two marks. One mark for a definition of absolute poverty and one mark for application. The relative poverty definition is not correct. Ensure you know accurate definitions of key terms from the specification.
Notes from the mark scheme and report
absolute = lacking basic necessities, $1.90 a day at PPP (World Bank)
relative = below 60% (or 50%) of median household income
analysis mark e.g. absolute poverty can fall while relative poverty rises
many lost the analysis mark or gave a wrong relative definition
Quantitative skills: QS 9 (interpret, apply and analyse information in written, graphical tabular and numerical forms)
June 2018 · Paper 2 · Q6(d)10 marksAO1=2, AO2=2, AO3=2, AO4=410-mark response
Data and extracts for question 6
Mark scheme, including the levels grid and indicative content
Examiner's comment
Answers to this question were generally quick to grasp what the question was about. Weaker answers focused on explaining how inequality is measured or ways to solve it rather than whether it is 'desirable' or not. Stronger answers effectively presented both sides of the argument e.g. focusing on incentivising people to work harder through the possibility of higher wages and as an evaluation the risk of disincentivisation if the gap gets too great. This answer has only limited relevance to the question. The candidate might have written a lot and it is loosely related to the topic of inequality, but it fails to address the key focus of the question. As such it only achieves a score of 3/10. It is important to focus on the quality of your answer and ensure it is answering the question, rather than trying to write down everything you know about a particular topic. This is a clear and well-written answer to the question which addresses the key elements of it, especially on the KAA side, for example looking at different jobs and their differing pay rates. The evaluation is, unfortunately, a little bit on the brief side. Overall this is a very good answer and it achieves 8/10 in total.
Notes from the mark scheme and report
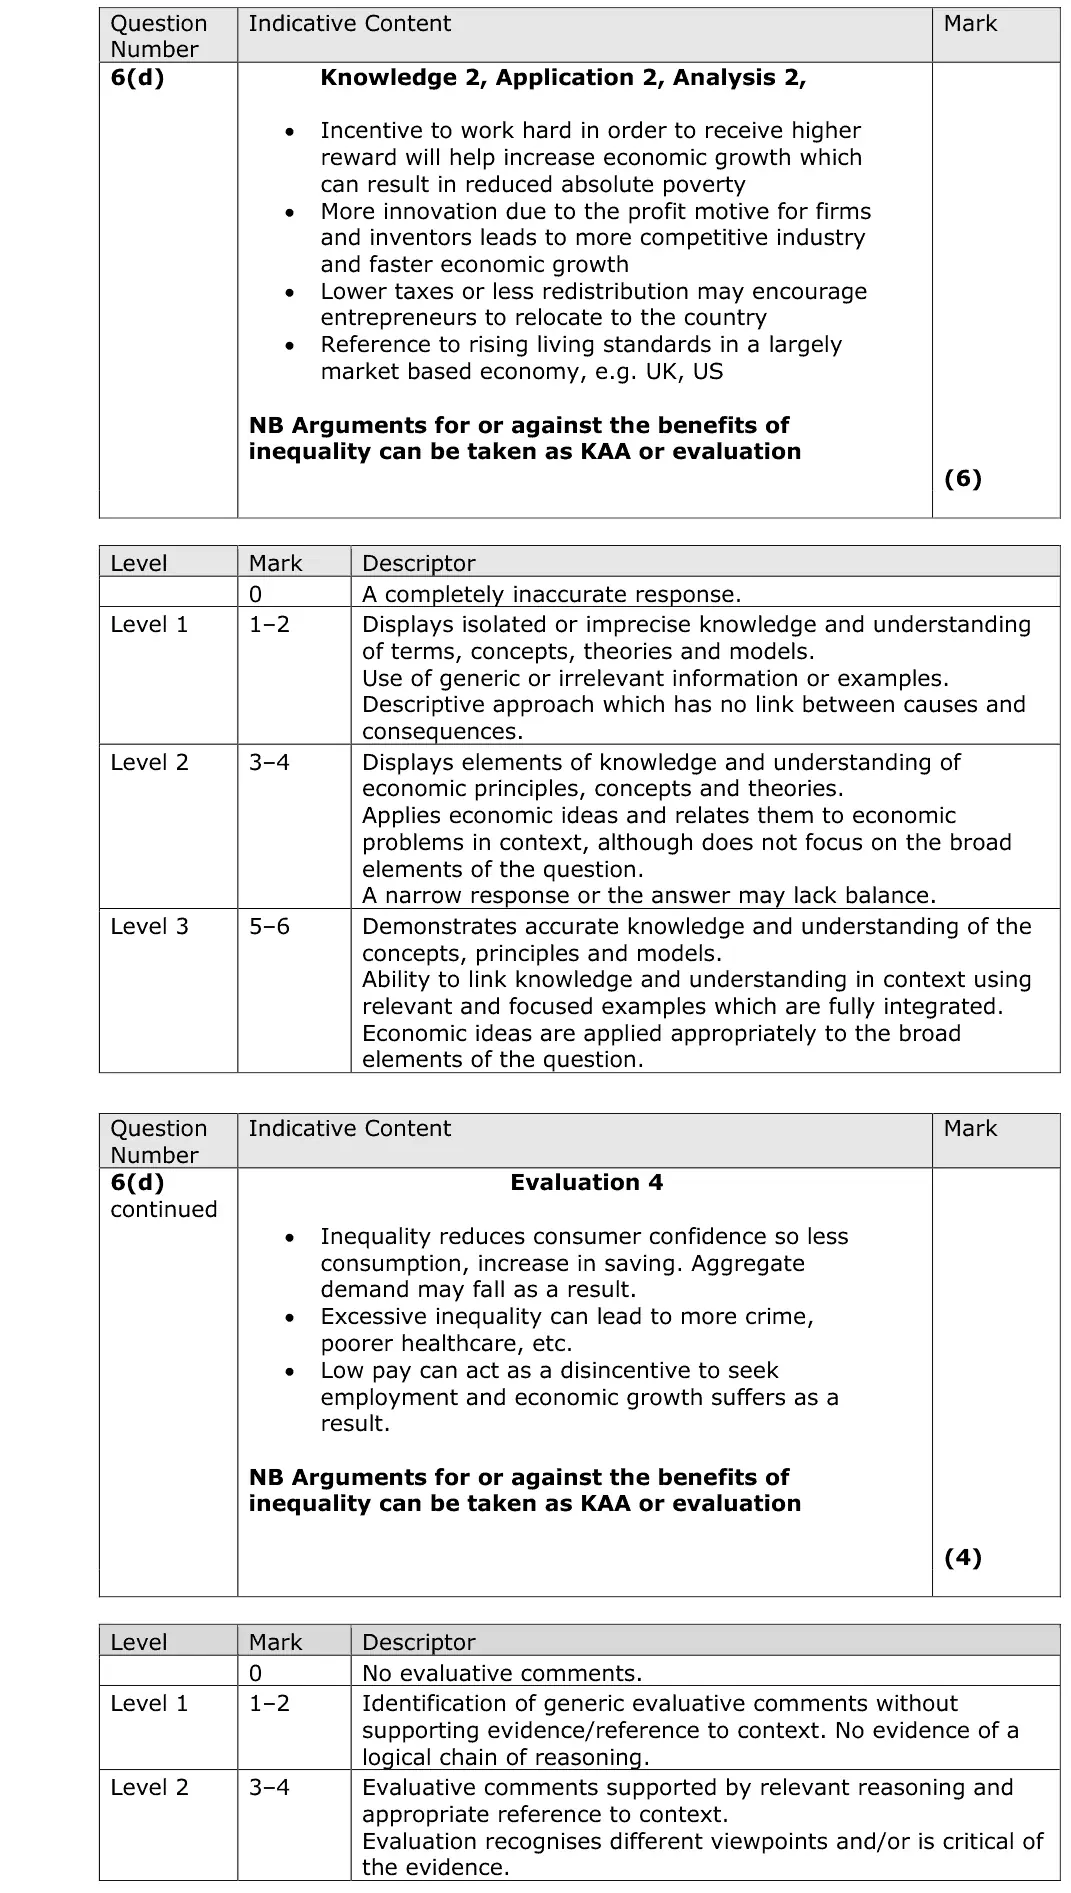
argue whether inequality is desirable: incentives to work, innovate and take risks vs lower consumption, crime and disincentives at low pay
arguments either way count as KAA or evaluation
weaker answers described how inequality is measured or reduced
June 2017 · Paper 2 · Q4(a)4 marksAO2=3, AO3=1Short answer
Data and extracts for question 4
Mark scheme
Examiner's comment
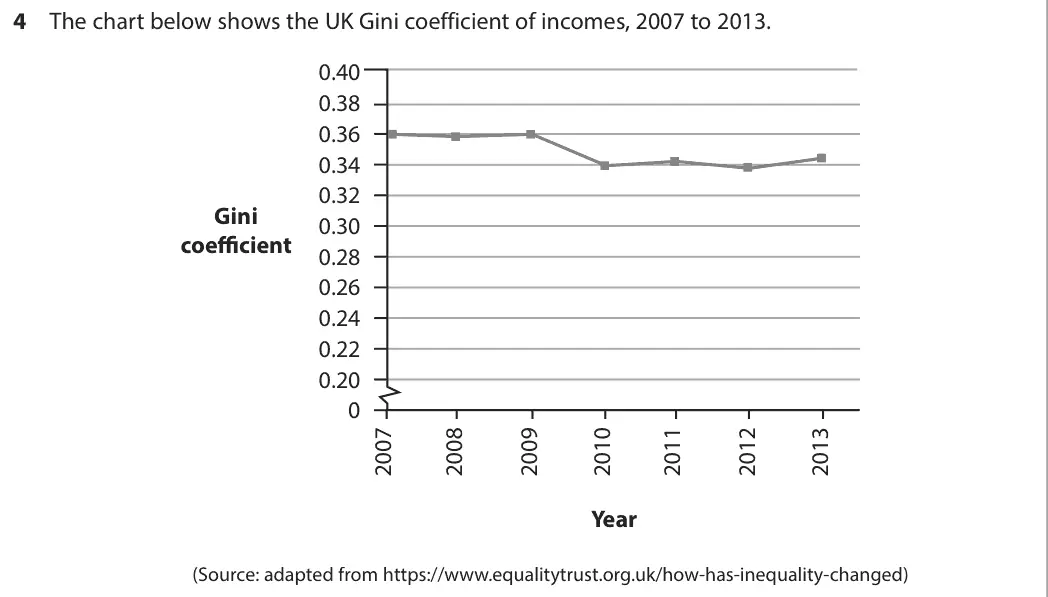
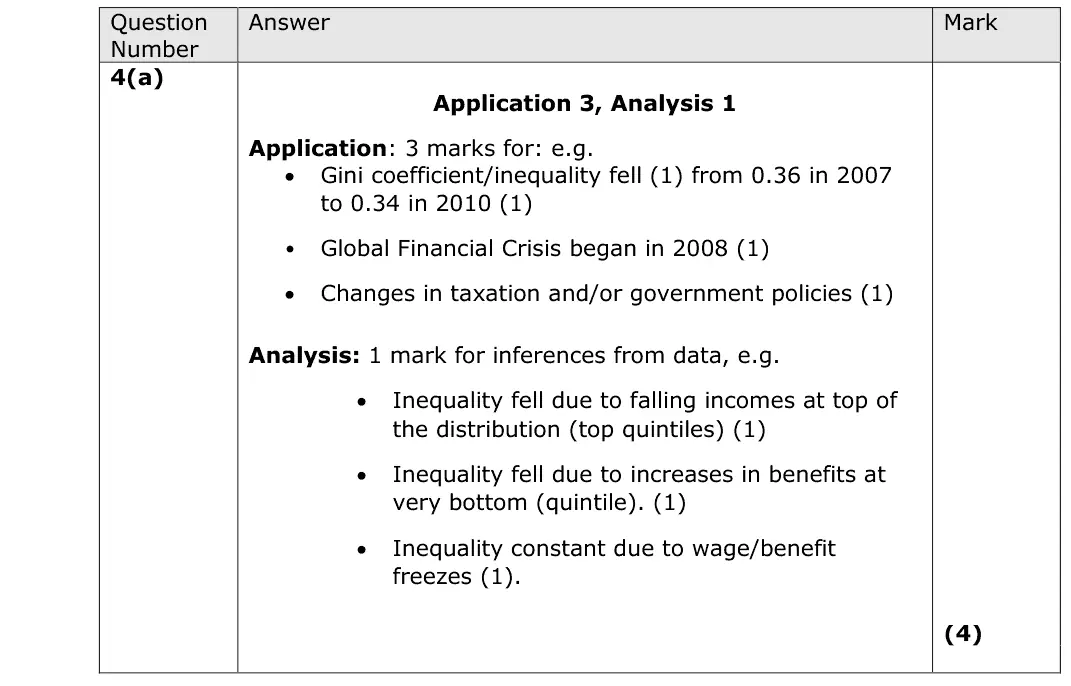
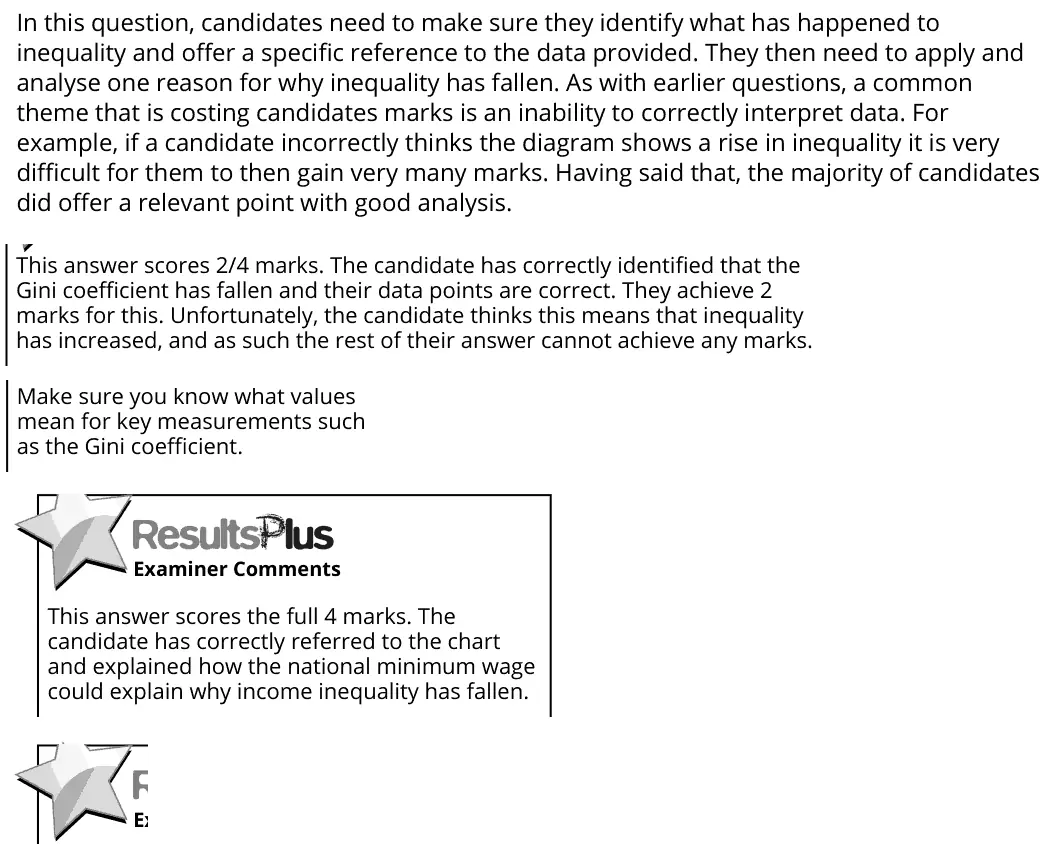
In this question, candidates need to make sure they identify what has happened to inequality and offer a specific reference to the data provided. They then need to apply and analyse one reason for why inequality has fallen. As with earlier questions, a common theme that is costing candidates marks is an inability to correctly interpret data. For example, if a candidate incorrectly thinks the diagram shows a rise in inequality it is very difficult for them to then gain very many marks. Having said that, the majority of candidates did offer a relevant point with good analysis. Make sure you know what values mean for key measurements such as the Gini coefficient. This answer scores 2/4 marks. The candidate has correctly identified that the Gini coefficient has fallen and their data points are correct. They achieve 2 marks for this. Unfortunately, the candidate thinks this means that inequality has increased, and as such the rest of their answer cannot achieve any marks. This answer scores the full 4 marks. The candidate has correctly referred to the chart and explained how the national minimum wage could explain why income inequality has fallen.
Notes from the mark scheme and report
Gini fell from 0.36 (2007) to 0.34 (2010) = inequality fell
reading a falling Gini as rising inequality scores only the data marks