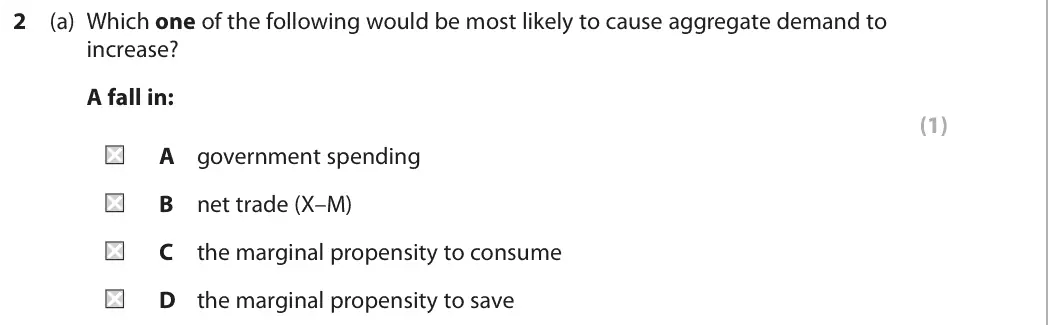
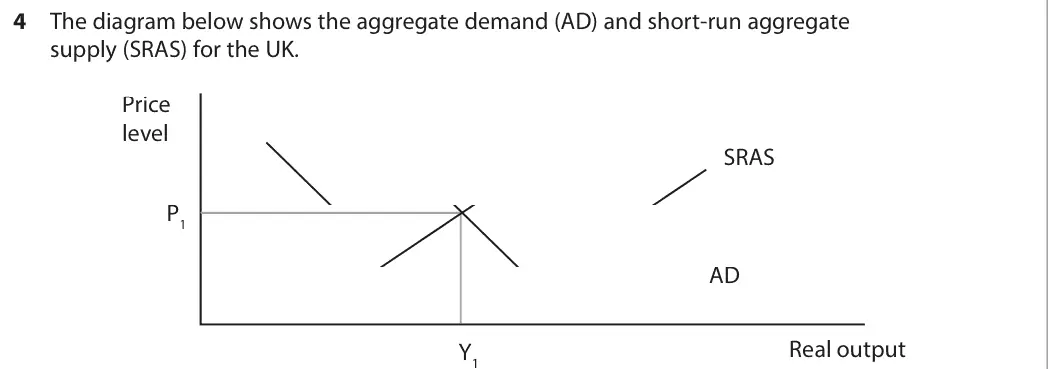
2.2.1The characteristics of AD: a) Components of AD: C+I+G+(X-M) b) The relative importance of the components of AD c) The AD curve d) The distinction between a movement along, and a shift of, the AD curveAS
2.2.2Consumption (C): a) Disposable income and its influence on consumer spending b) An understanding of the relationship between savings and consumption c) Other influences on consumer spending: • interest rates • consumer confidence • wealth effectsAS
2.2.3Investment (I): a) Distinction between gross and net investment b) Influences on investment: • the rate of economic growth • business expectations and confidence • Keynes and ‘animal spirits’ • demand for exports • interest rates • access to credit • the influence of government and regulationsAS
2.2.4Government expenditure (G): a) The main influences on government expenditure: • the trade cycle • fiscal policyAS
2.2.5Net trade (X-M): a) The main influences on the (net) trade balance: • real income • exchange rates • state of the world economy • degree of protectionism • non-price factorsAS
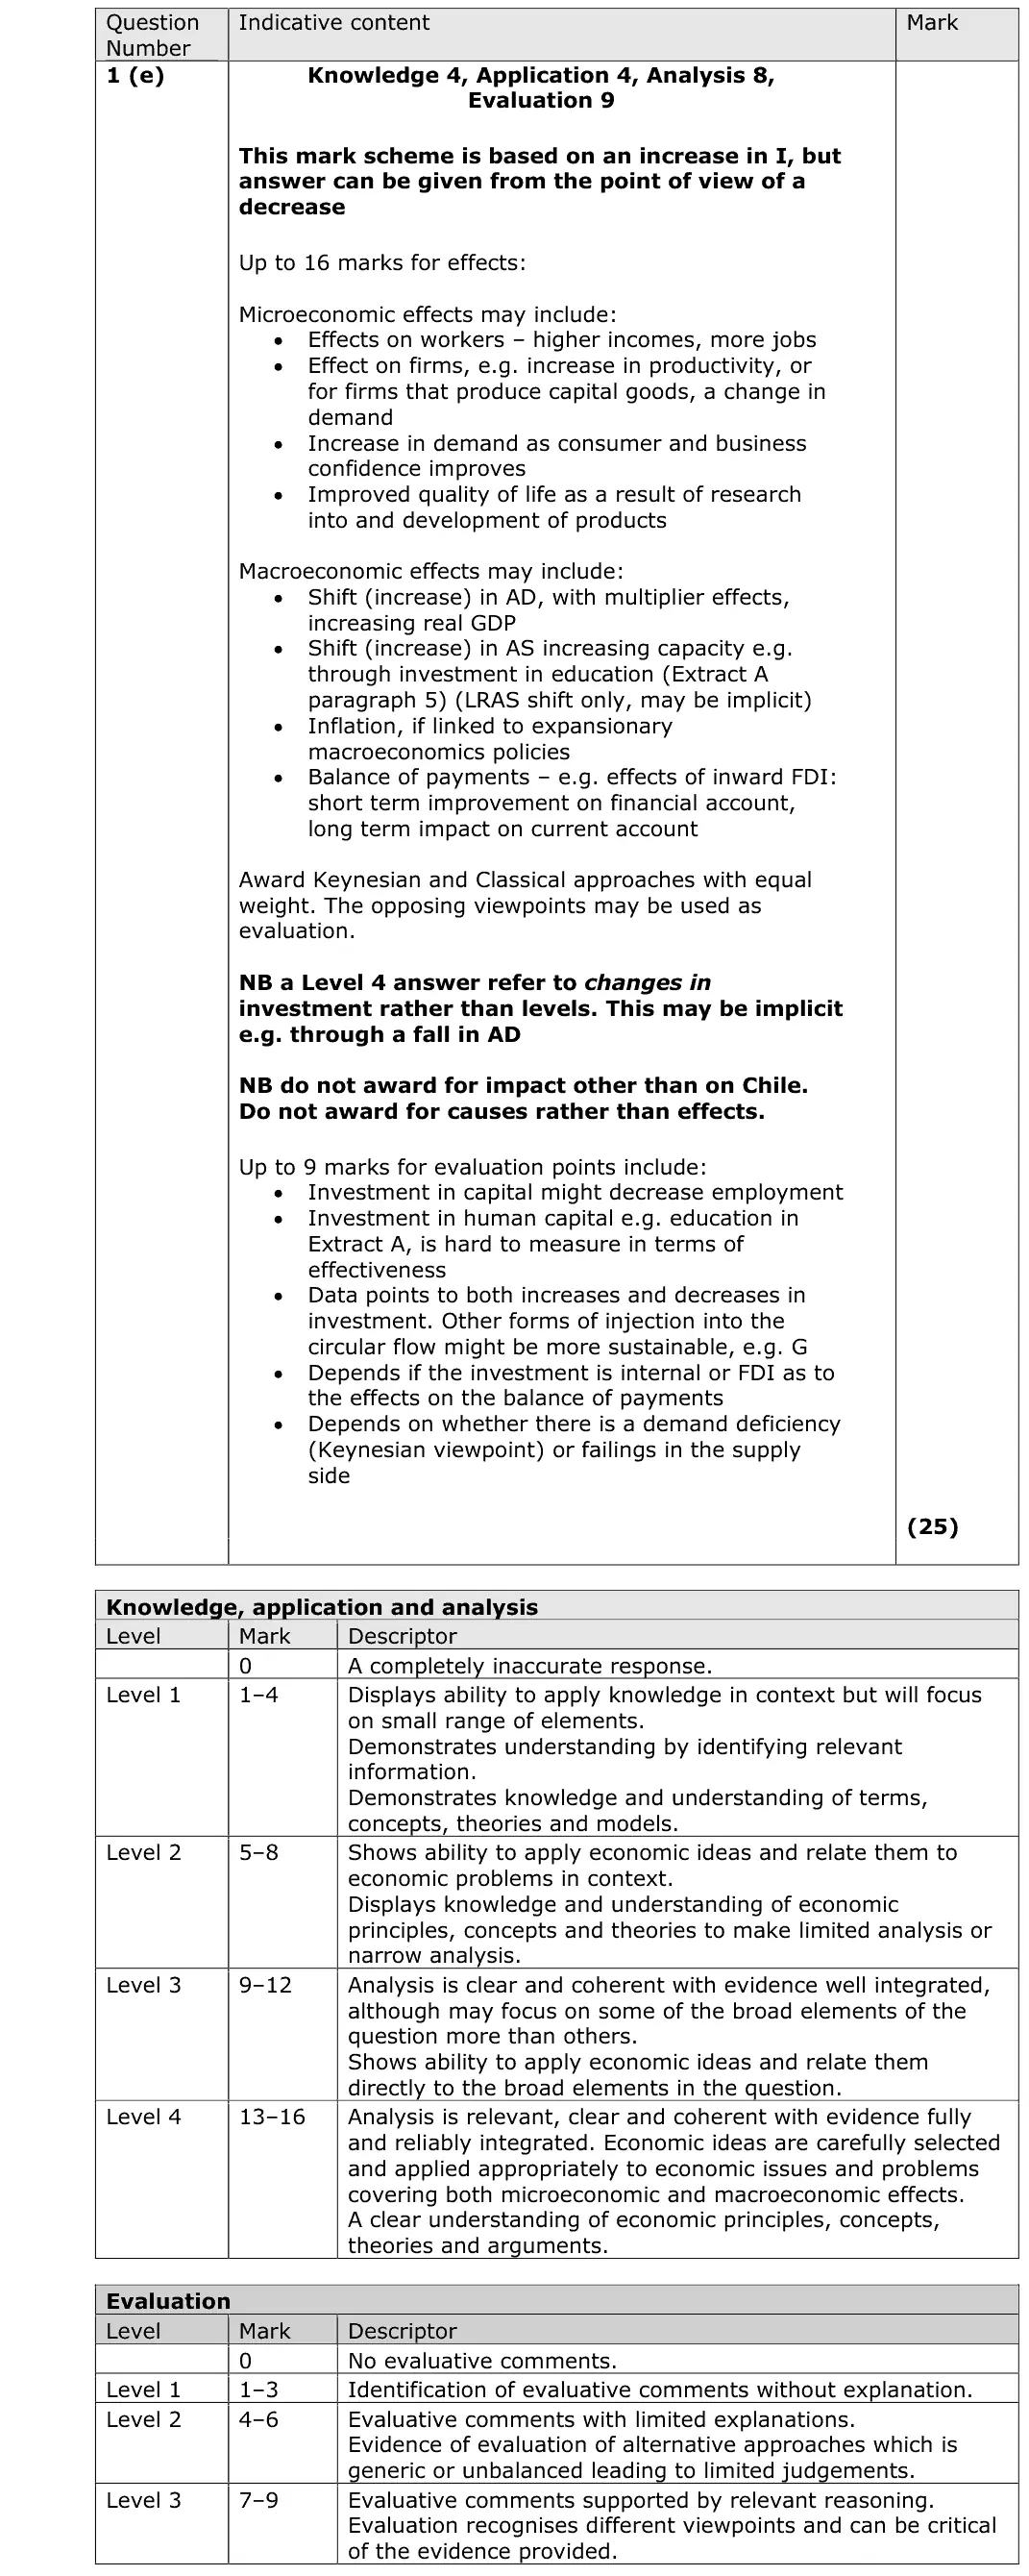
With reference to the information provided and your own knowledge, evaluate the microeconomic and macroeconomic impact on Chile’s economy of changes in the level of investment.
Tap a question to zoom it. The data and extracts fold out above each question; the mark scheme and examiner's comment open underneath.
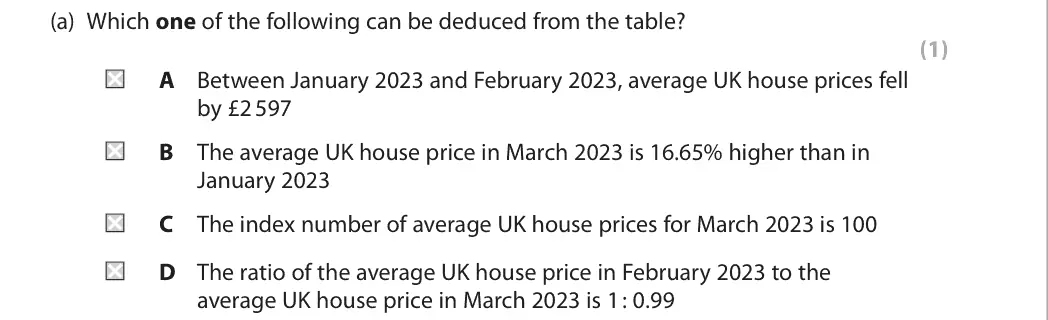
June 2025 · AS Paper 2 · Q2(a)1 markMultiple choice
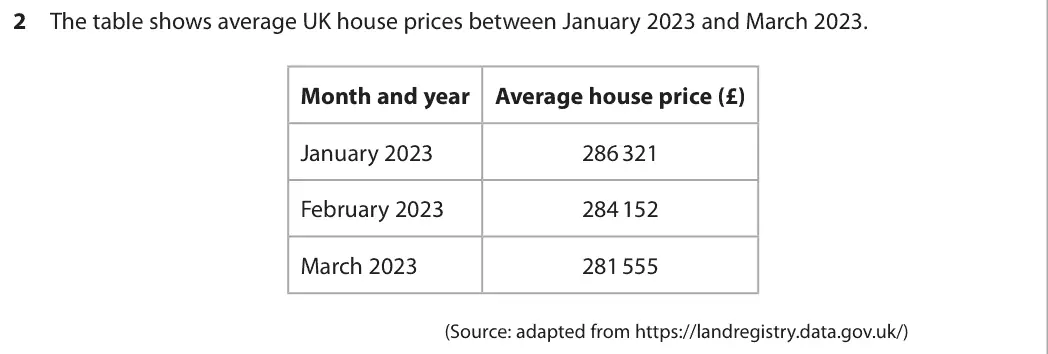
Data and extracts for question 2
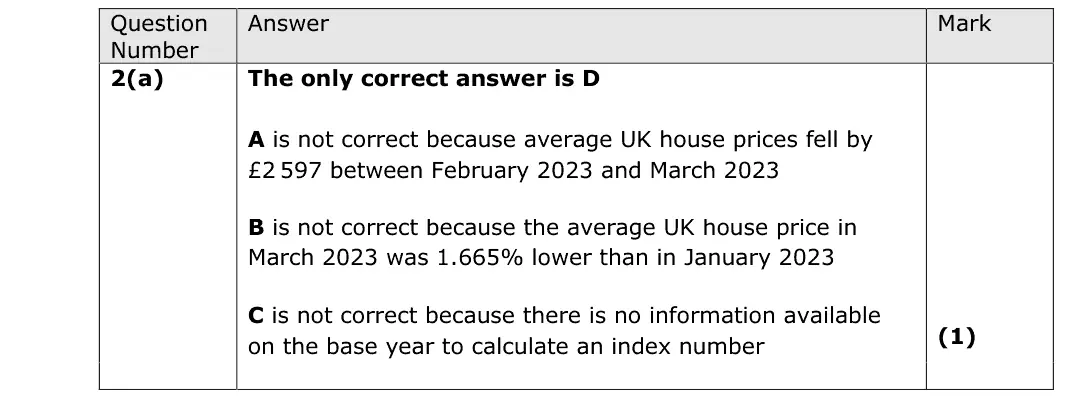
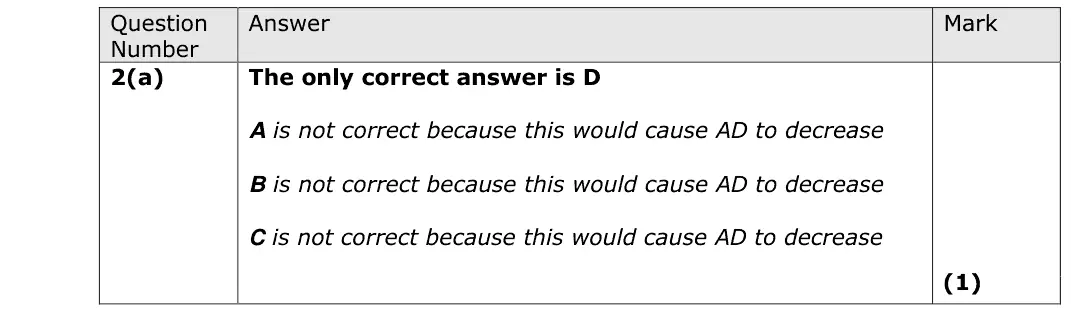
Answer
D
Mark scheme
Notes from the mark scheme and report
284 152 : 281 555 = 1 : 0.99 (D)
the £2 597 fall was Feb-Mar not Jan-Feb
March was 1.665% lower, not 16.65% higher
no base year is given for an index
Quantitative skills: QS 1 (calculate, use and understand ratios and fractions); QS 2 (calculate, use and understand percentages, percentage changes and percentage point changes); QS 9 (interpret, apply and analyse information in written, graphical tabular and numerical forms)
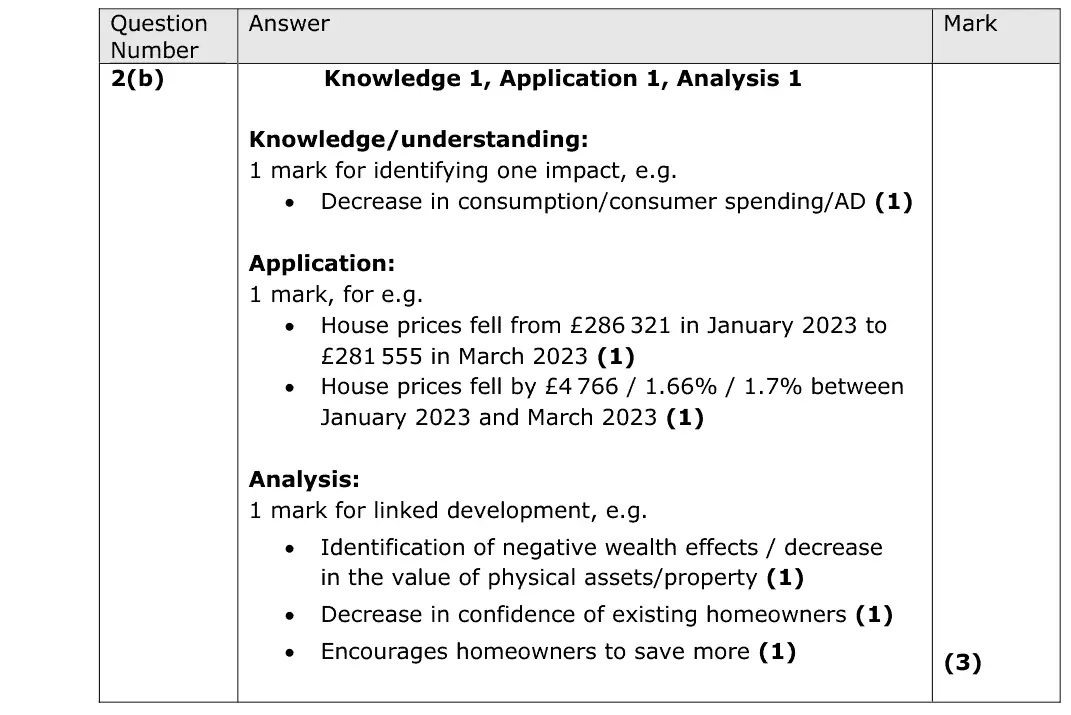
June 2025 · AS Paper 2 · Q2(b)3 marksAO1=1, AO2=1, AO3=1Short answerHard
Data and extracts for question 2
Mark scheme
Examiner's comment
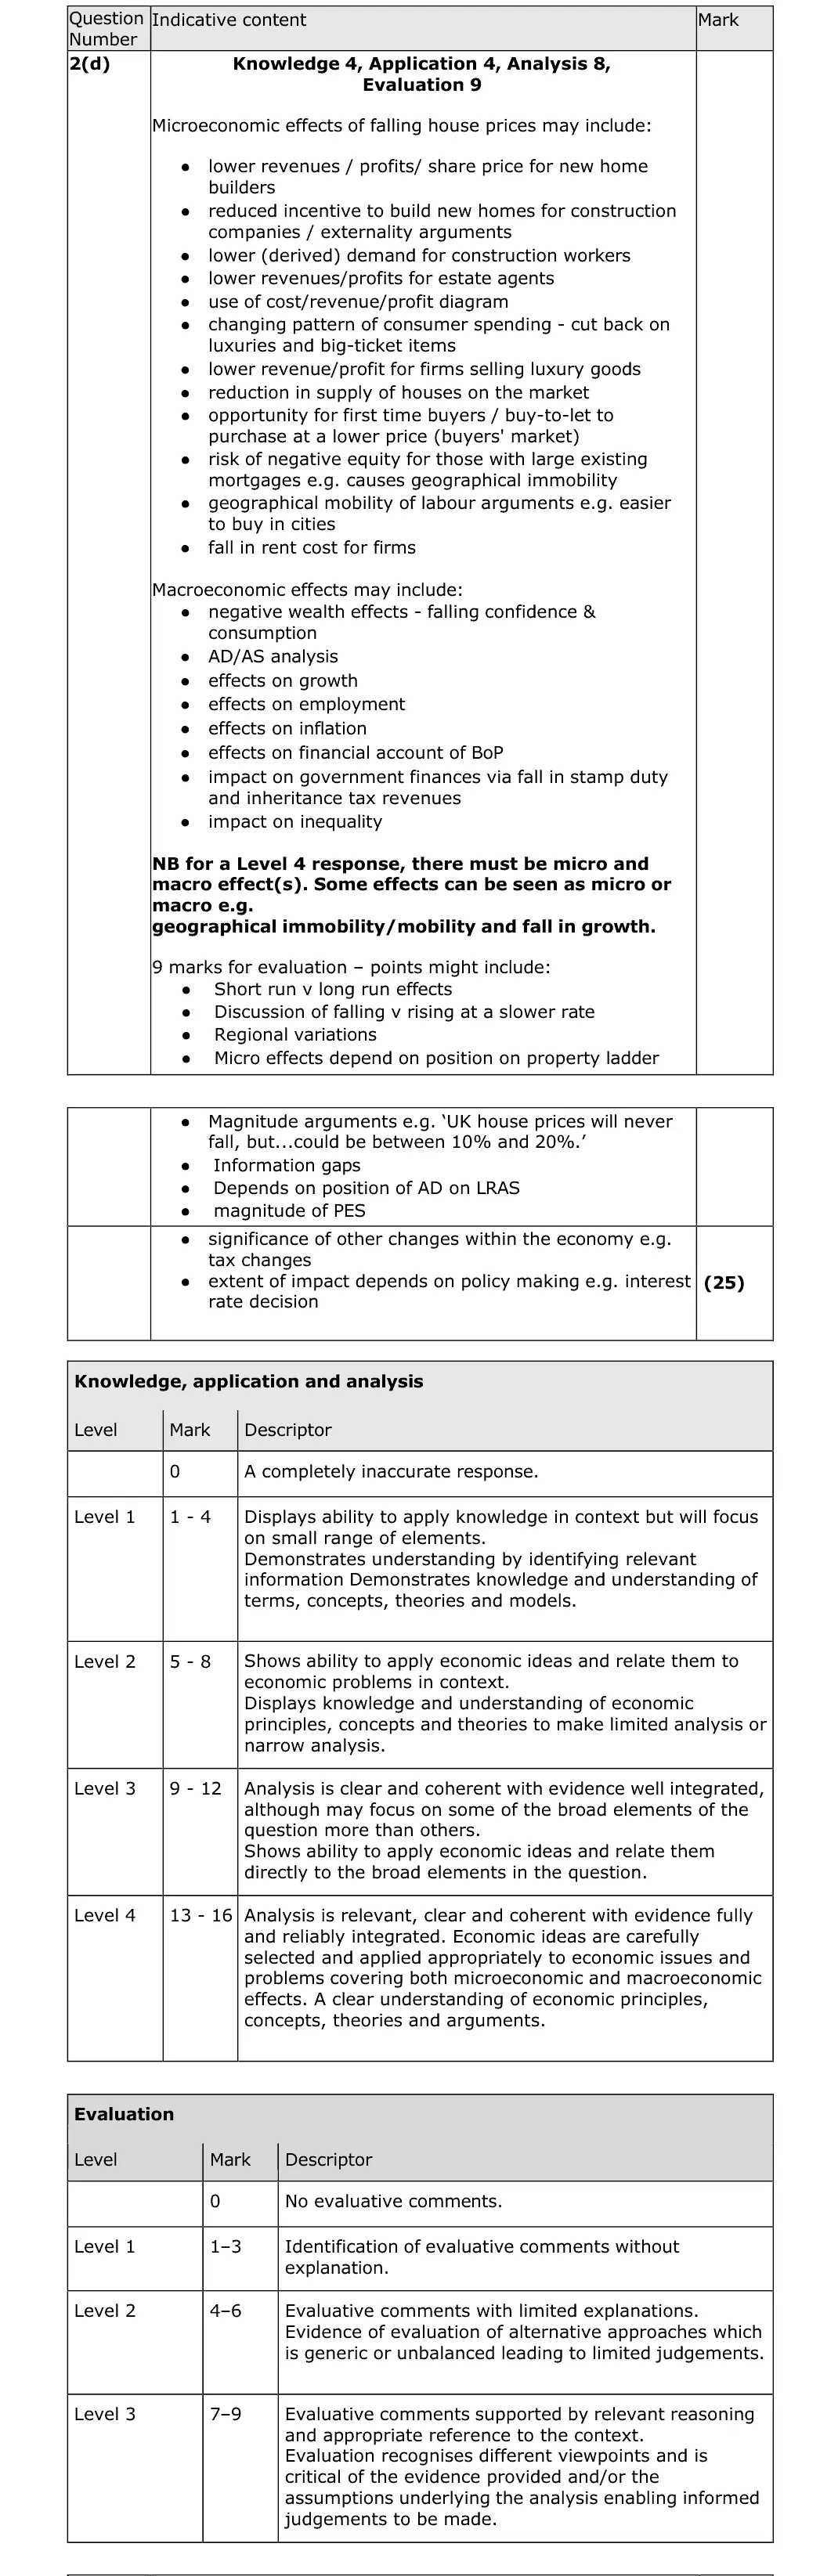
In this question the marks are split as 1 for knowledge, 1 for application, and 1 for analysis. This is a house prices question that candidates were not able to answer accurately, and the majority were unable to relate it to existing homeowners. Candidates also need to be careful to read the question carefully, as some candidates lost marks as they did not recognise the requirements of the question.
Notes from the mark scheme and report
negative wealth effect: homeowners' assets fall in value, confidence and consumption fall
quote £286 321 to £281 555 (fall of £4 766 or 1.7%)
report: "candidates were not able to answer accurately, and the majority were unable to relate it to existing homeowners"
Quantitative skills: QS 9 (interpret, apply and analyse information in written, graphical tabular and numerical forms)
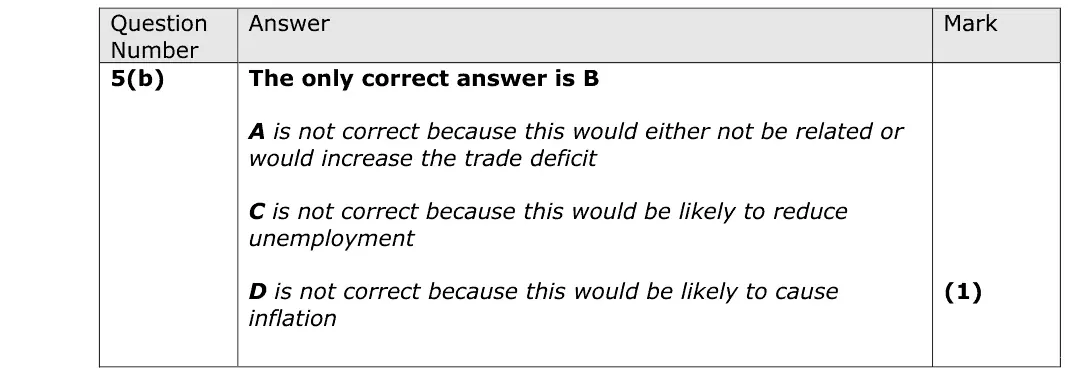
June 2025 · AS Paper 2 · Q5(b)3 marksAO1=1, AO2=1, AO3=1Short answer
Data and extracts for question 5
Mark scheme
Examiner's comment
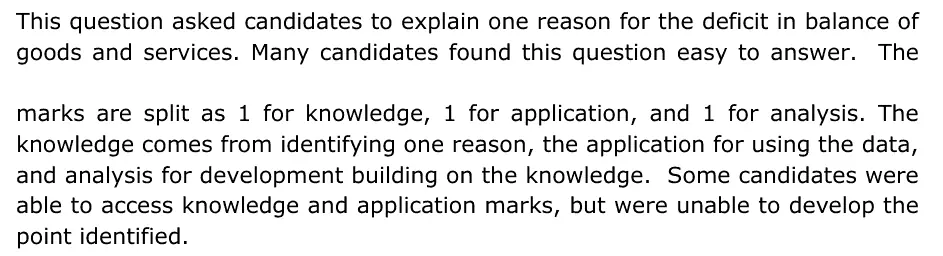
This question asked candidates to explain one reason for the deficit in balance of goods and services. Many candidates found this question easy to answer. The marks are split as 1 for knowledge, 1 for application, and 1 for analysis. The knowledge comes from identifying one reason, the application for using the data, and analysis for development building on the knowledge. Some candidates were able to access knowledge and application marks, but were unable to develop the point identified.
Notes from the mark scheme and report
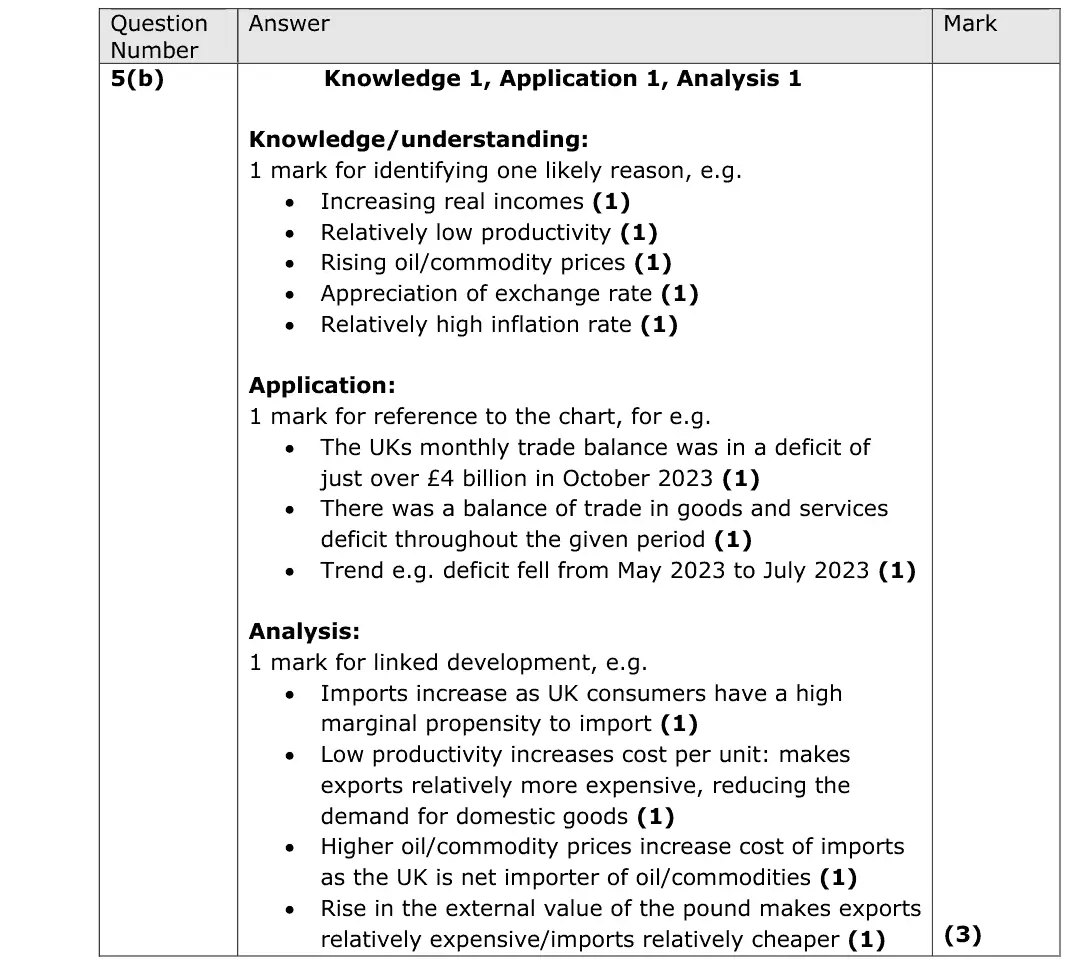
one reason (rising real incomes and mpm, low productivity, high oil/commodity prices, strong pound, relatively high inflation) developed
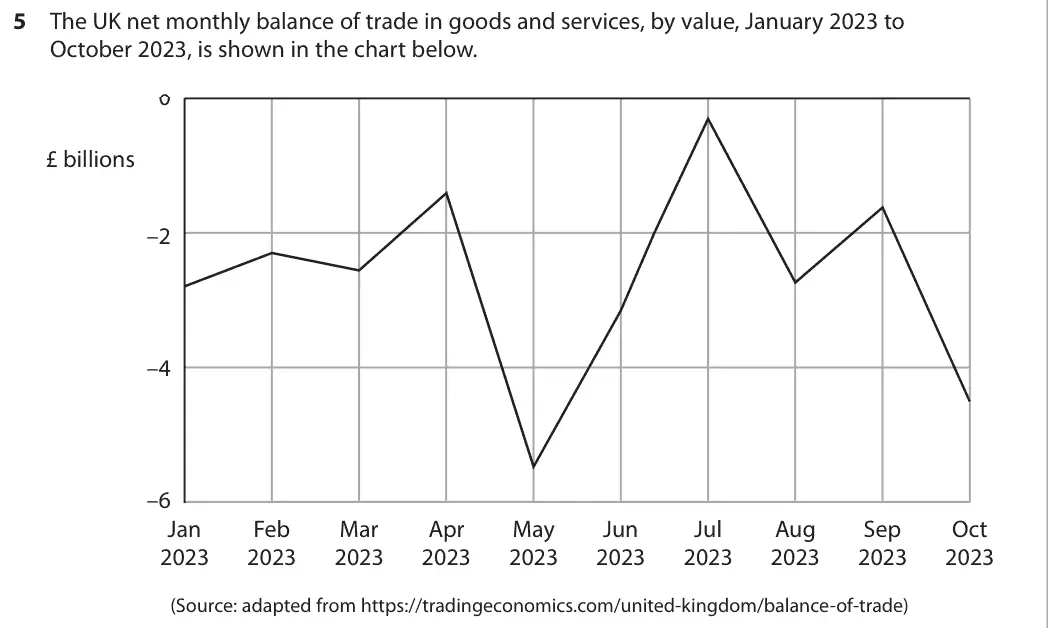
chart reference e.g. deficit throughout, just over £4bn in October 2023
many did not develop the point
Quantitative skills: QS 9 (interpret, apply and analyse information in written, graphical tabular and numerical forms)
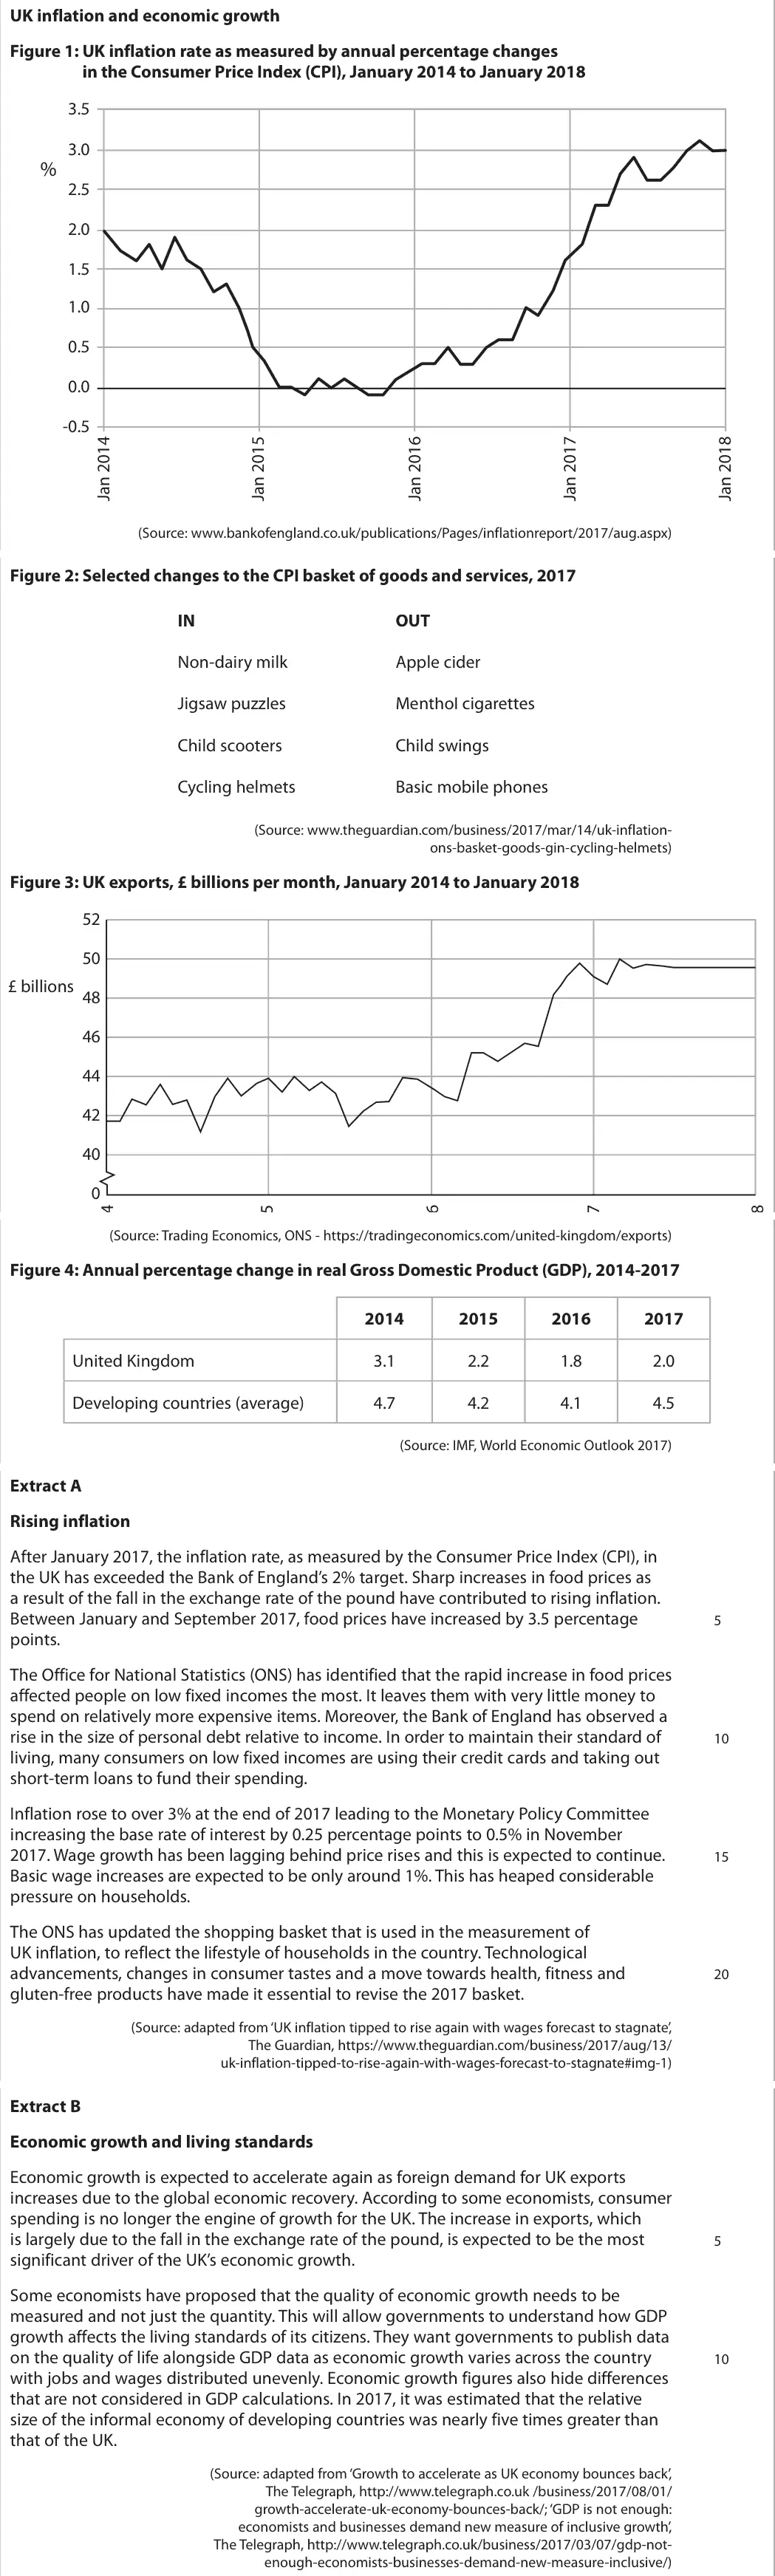
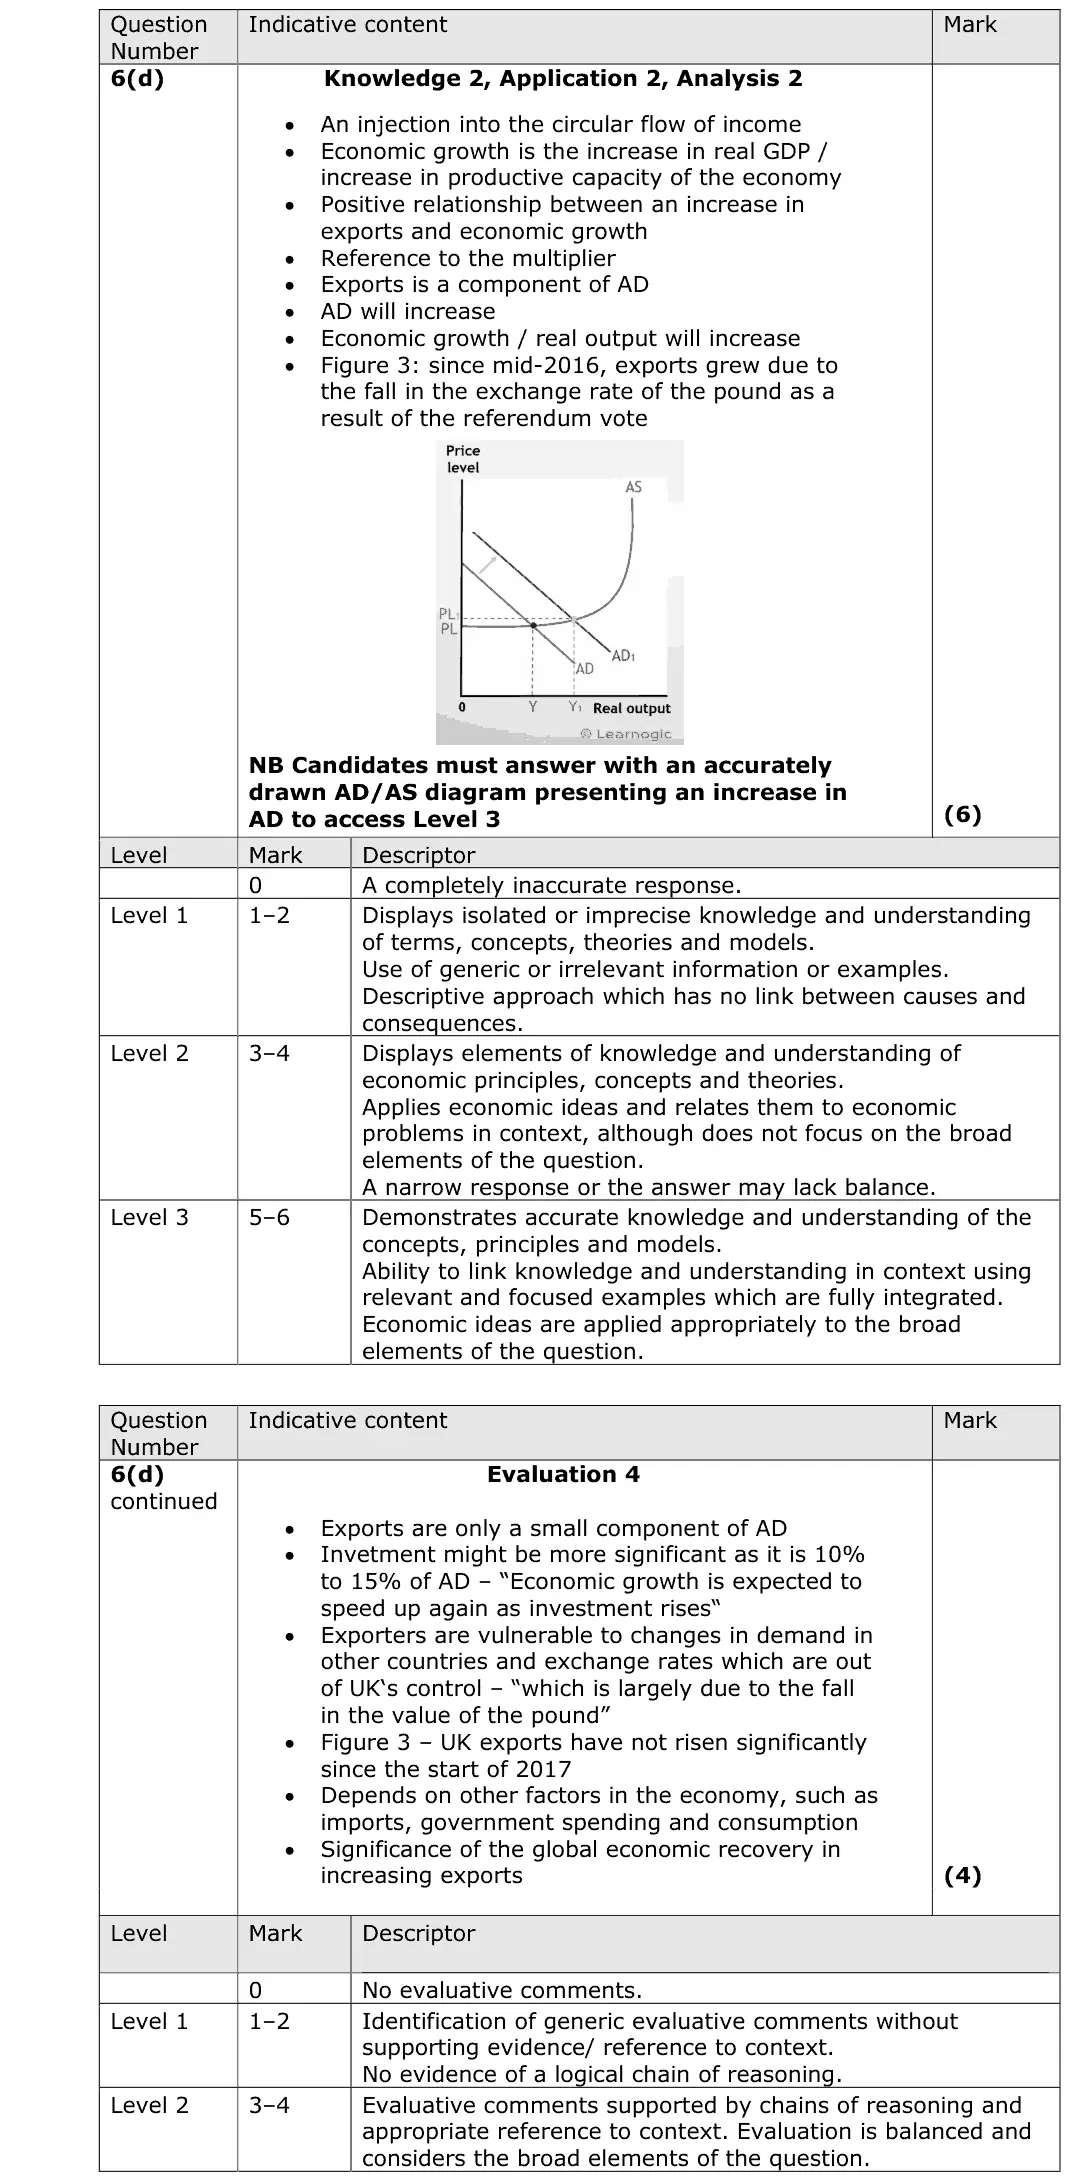
June 2025 · Paper 2 · Q6(d)12 marksAO1=2, AO2=2, AO3=4, AO4=412-mark response
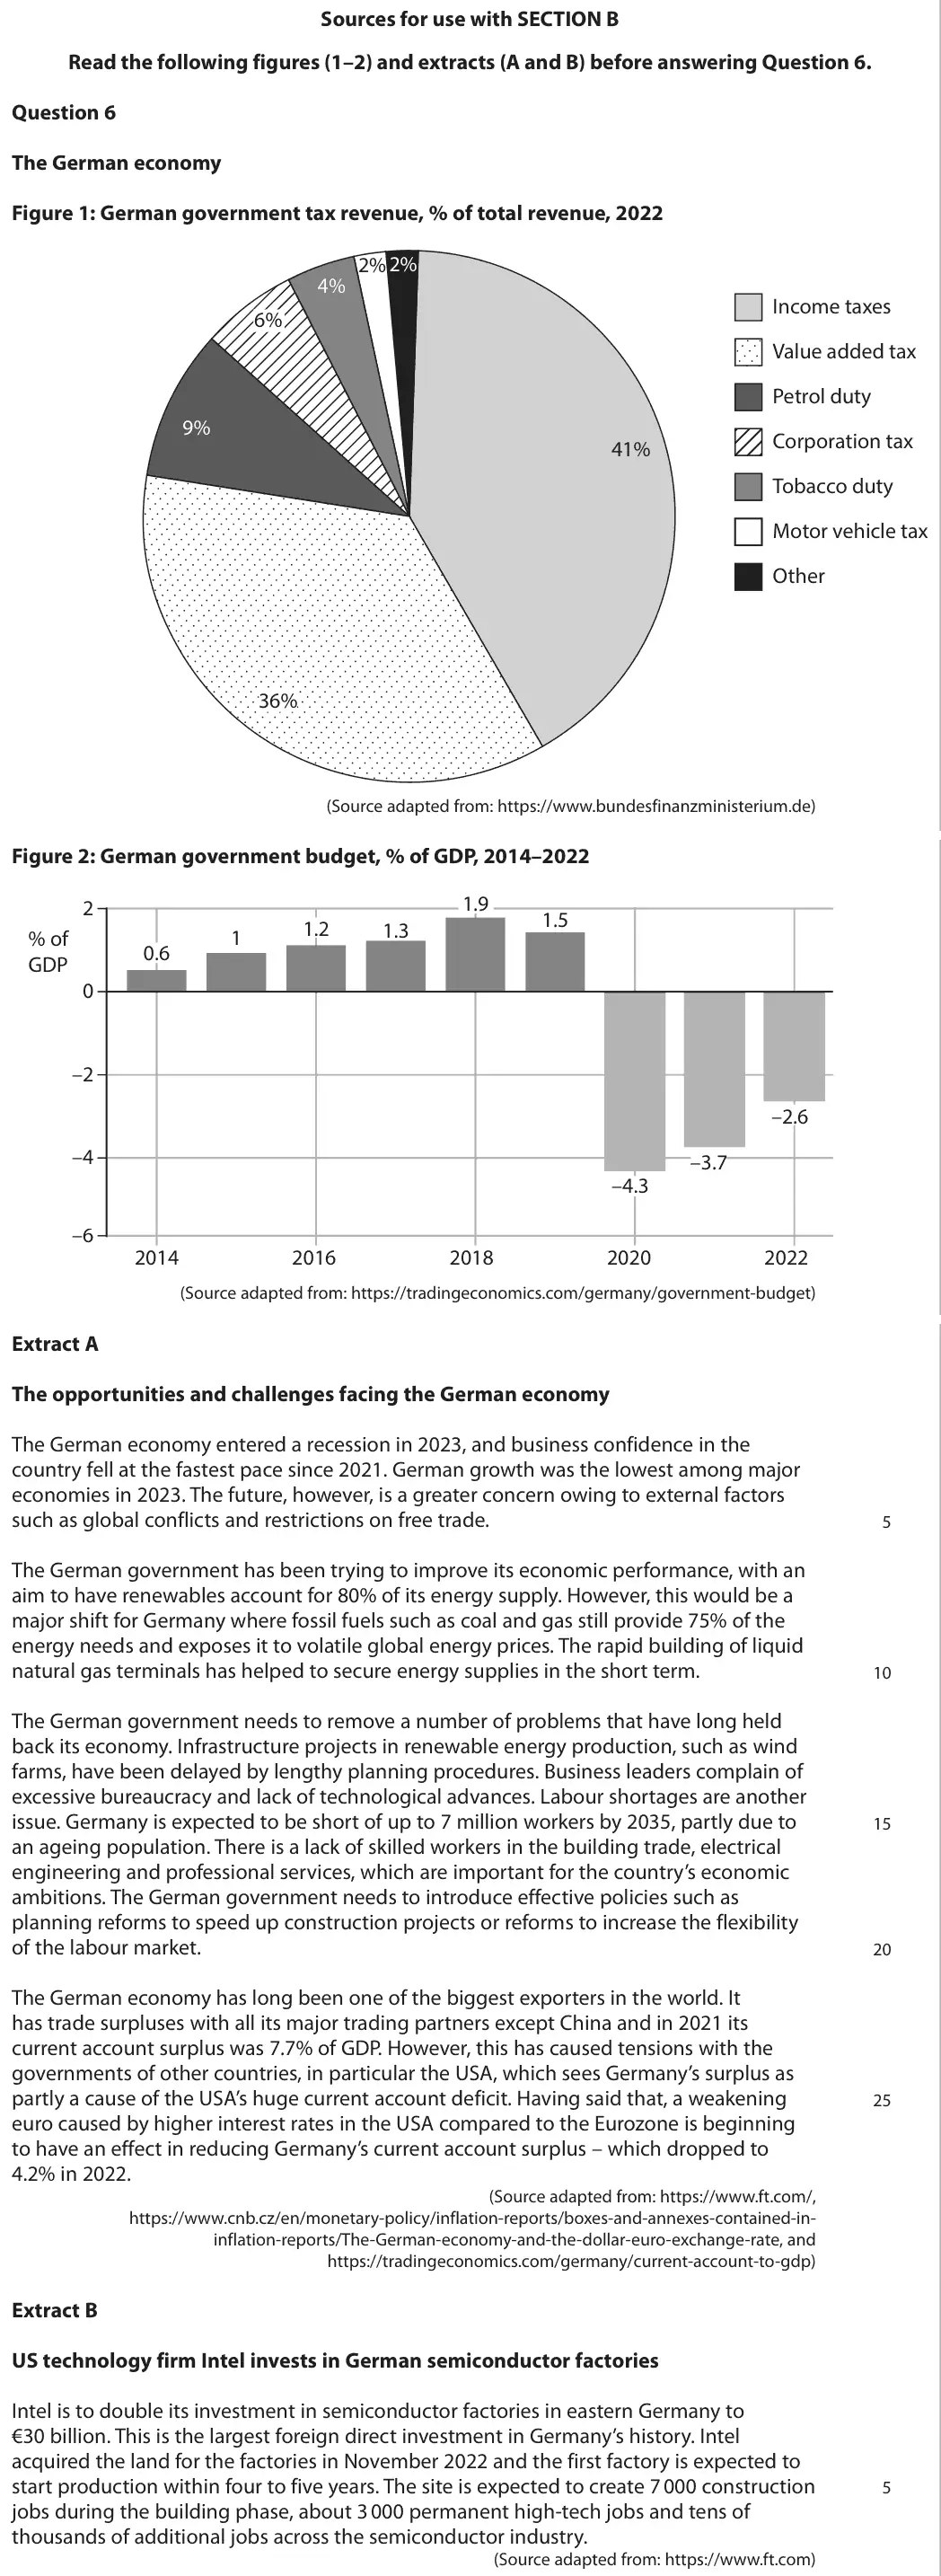
Data and extracts for question 6
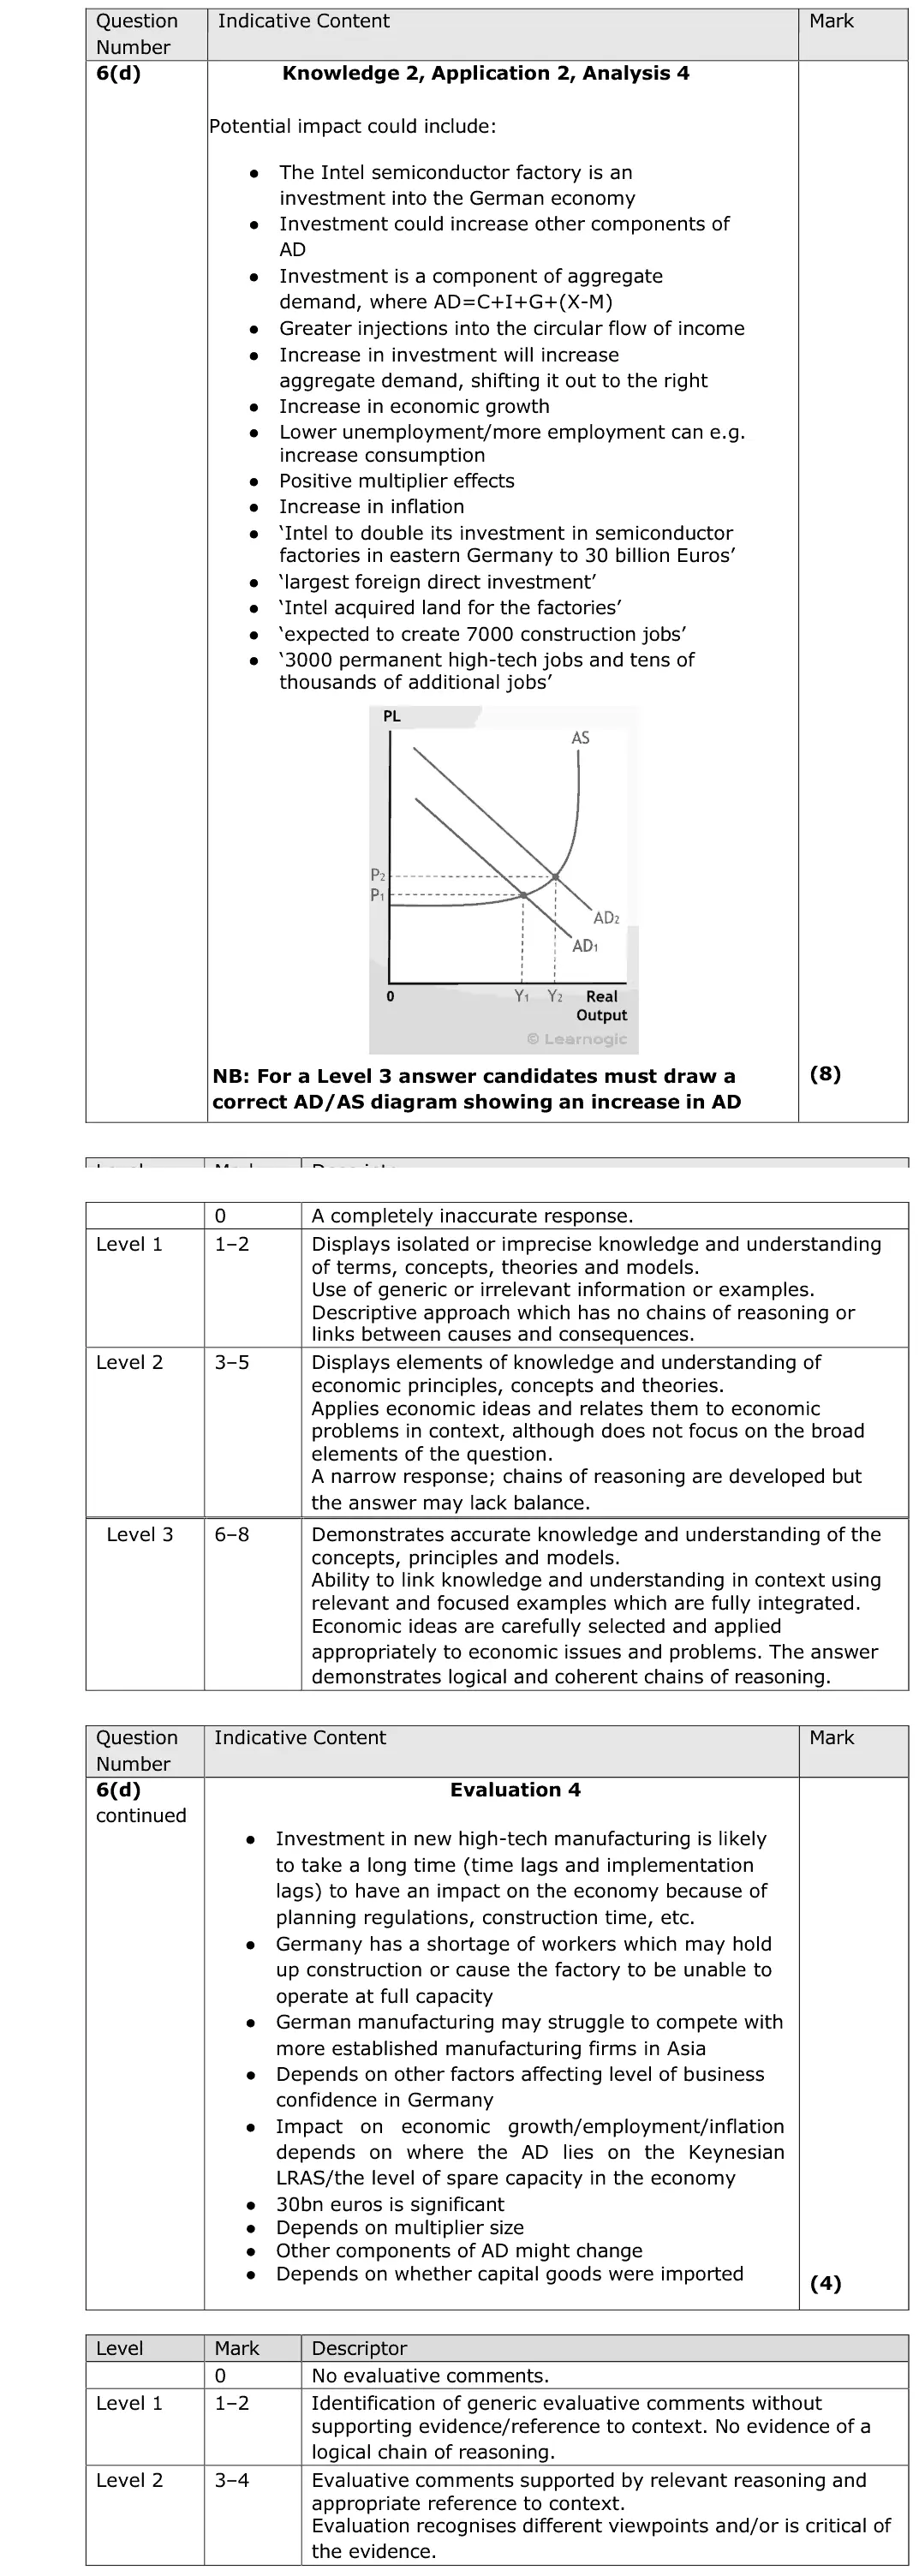
Mark scheme, including the levels grid and indicative content
Examiner's comment
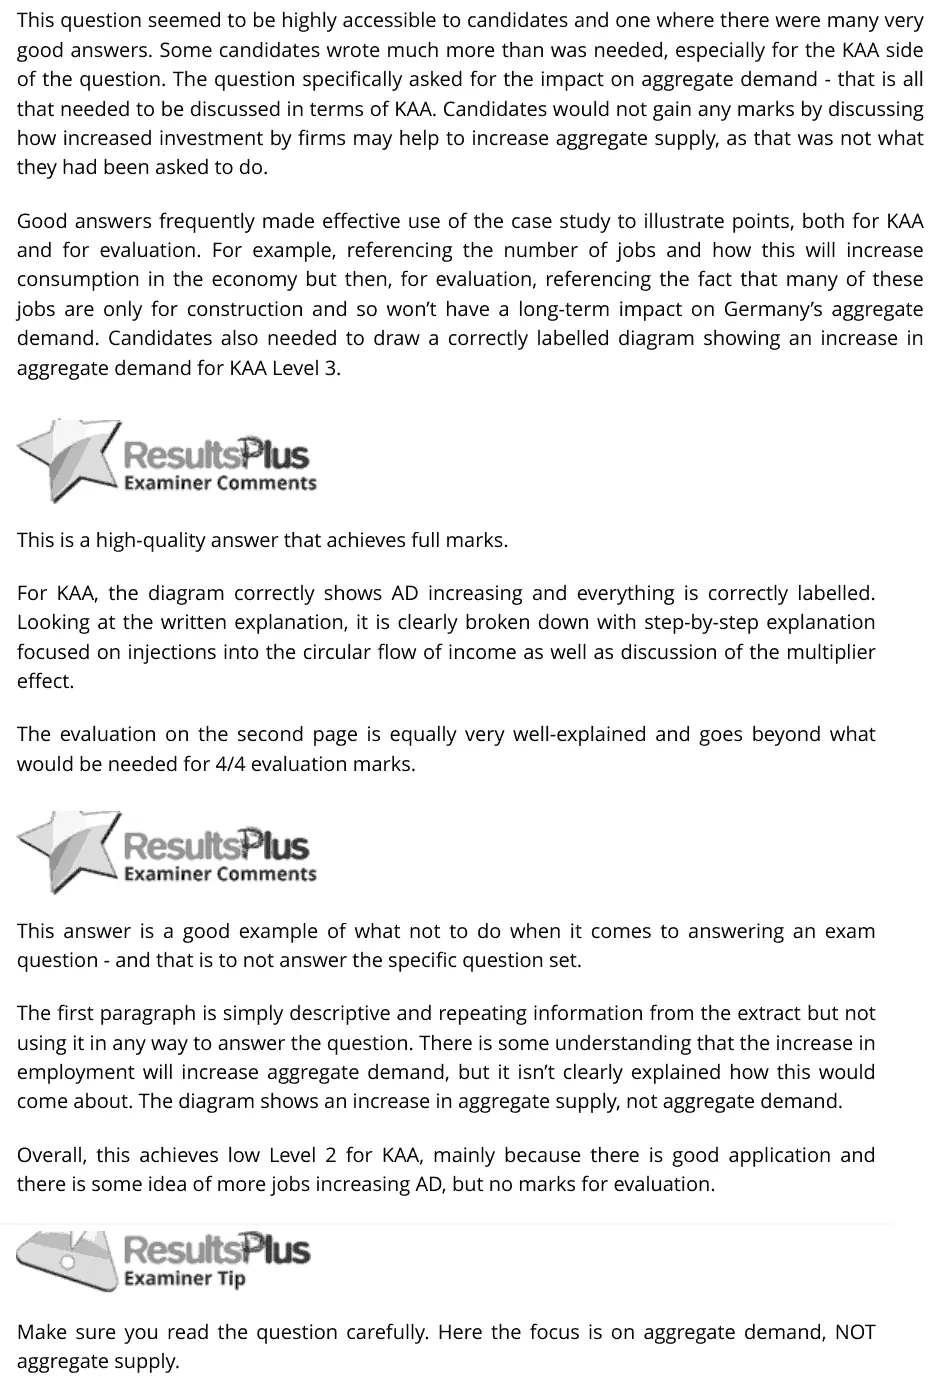
This question seemed to be highly accessible to candidates and one where there were many very good answers. Some candidates wrote much more than was needed, especially for the KAA side of the question. The question specifically asked for the impact on aggregate demand - that is all that needed to be discussed in terms of KAA. Candidates would not gain any marks by discussing how increased investment by firms may help to increase aggregate supply, as that was not what they had been asked to do. Good answers frequently made effective use of the case study to illustrate points, both for KAA and for evaluation. For example, referencing the number of jobs and how this will increase consumption in the economy but then, for evaluation, referencing the fact that many of these jobs are only for construction and so won’t have a long-term impact on Germany’s aggregate demand. Candidates also needed to draw a correctly labelled diagram showing an increase in aggregate demand for KAA Level 3. This is a high-quality answer that achieves full marks. For KAA, the diagram correctly shows AD increasing and everything is correctly labelled. Looking at the written explanation, it is clearly broken down with step-by-step explanation focused on injections into the circular flow of income as well as discussion of the multiplier effect. The evaluation on the second page is equally very well-explained and goes beyond what would be needed for 4/4 evaluation marks. This answer is a good example of what not to do when it comes to answering an exam question - and that is to not answer the specific question set. The first paragraph is simply descriptive and repeating information from the extract but not using it in any way to answer the question. There is some understanding that the increase in employment will increase aggregate demand, but it isn’t clearly explained how this would come about. The diagram shows an increase in aggregate supply, not aggregate demand. Overall, this achieves low Level 2 for KAA, mainly because there is good application and there is some idea of more jobs increasing AD, but no marks for evaluation. Make sure you read the question carefully. Here the focus is on aggregate demand, NOT aggregate supply.
Notes from the mark scheme and report
Intel's €30bn FDI is investment (I in AD = C + I + G + X - M): AD shifts right, multiplier from 7 000 construction and 3 000 permanent jobs
Level 3 needs a correctly labelled AD/AS diagram
evaluate: construction jobs are temporary, size relative to GDP, imports leak
report: discussing AS earned nothing
Quantitative skills: QS 4 (construct and interpret a range of standard graphical forms)
June 2025 · AS Paper 2 · Q6(e)15 marks15-mark response
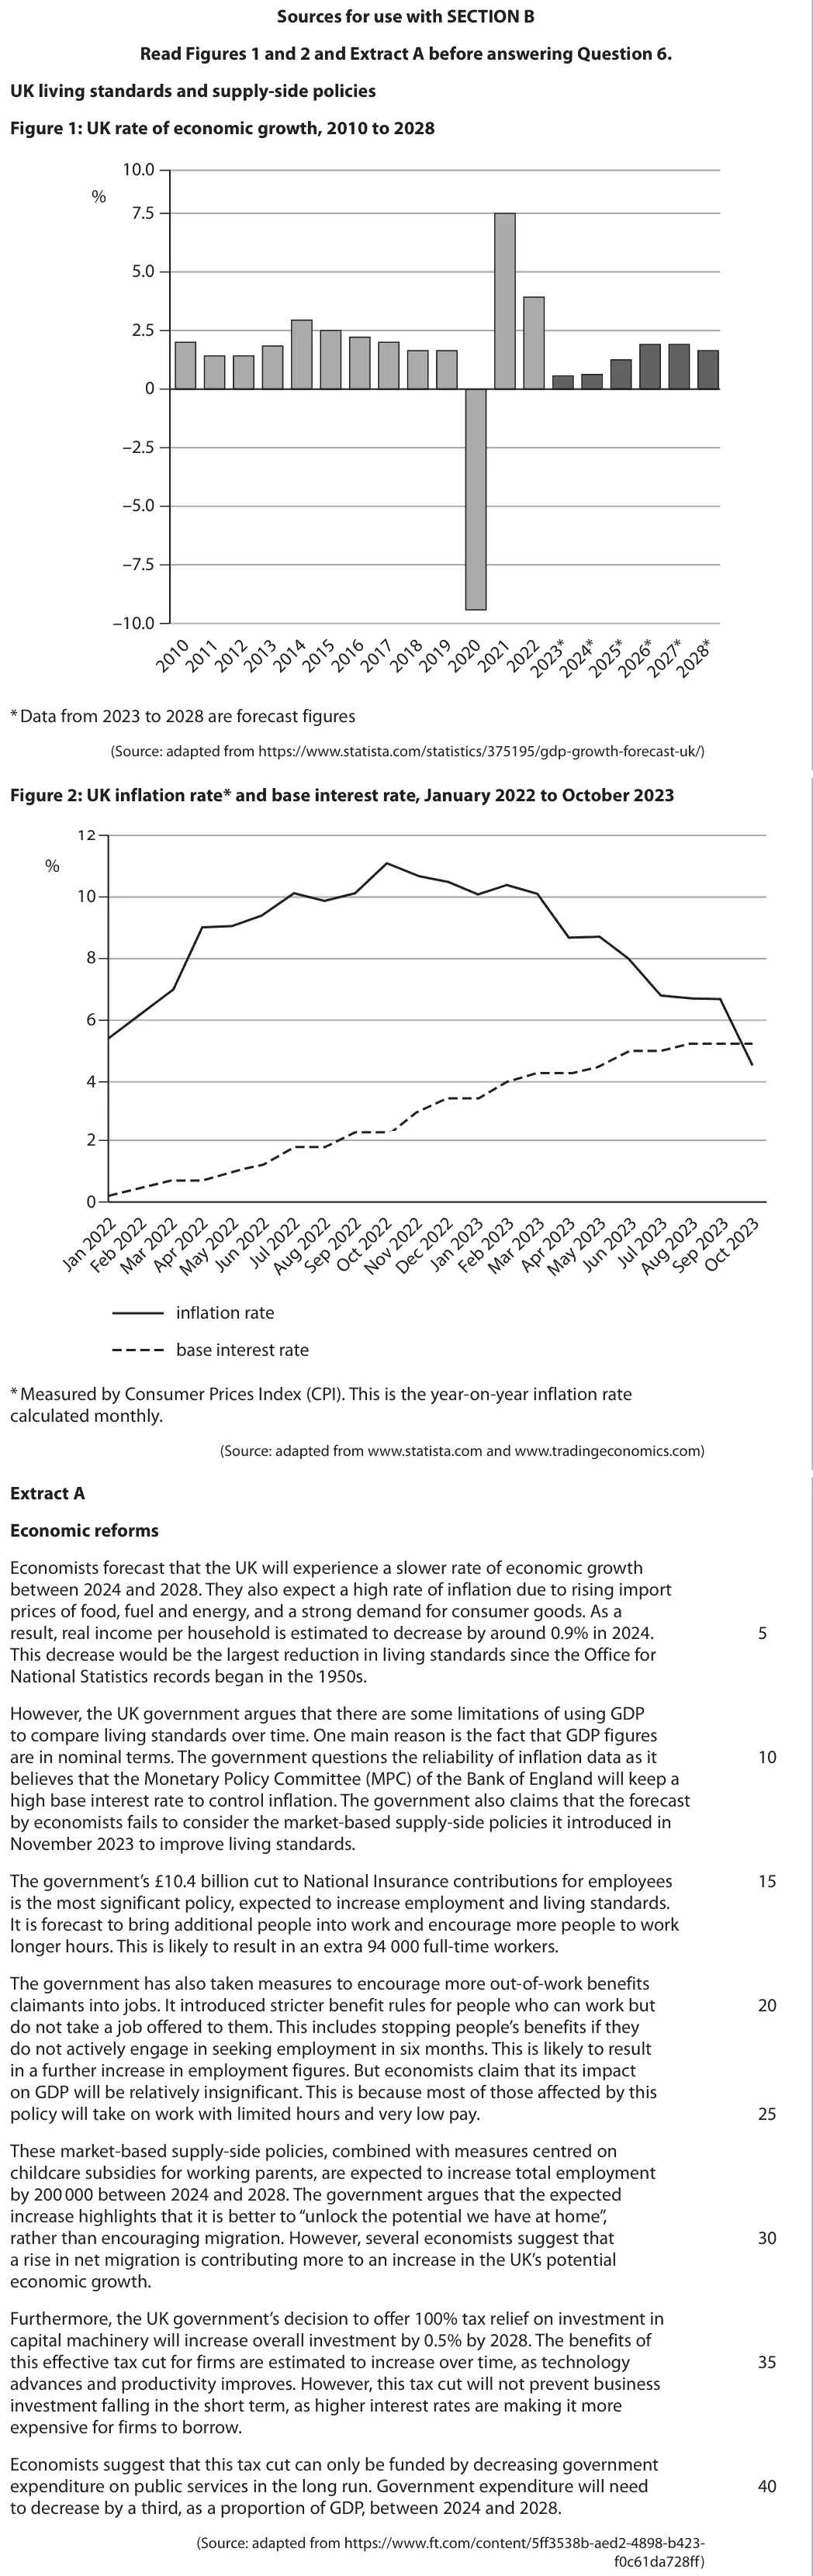
Data and extracts for question 6
Mark scheme, including the levels grid and indicative content
Examiner's comment
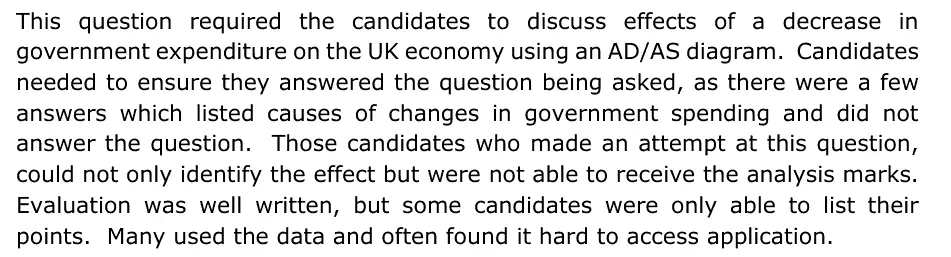
This question required the candidates to discuss effects of a decrease in government expenditure on the UK economy using an AD/AS diagram. Candidates needed to ensure they answered the question being asked, as there were a few answers which listed causes of changes in government spending and did not answer the question. Those candidates who made an attempt at this question, could not only identify the effect but were not able to receive the analysis marks. Evaluation was well written, but some candidates were only able to list their points. Many used the data and often found it hard to access application.
Notes from the mark scheme and report
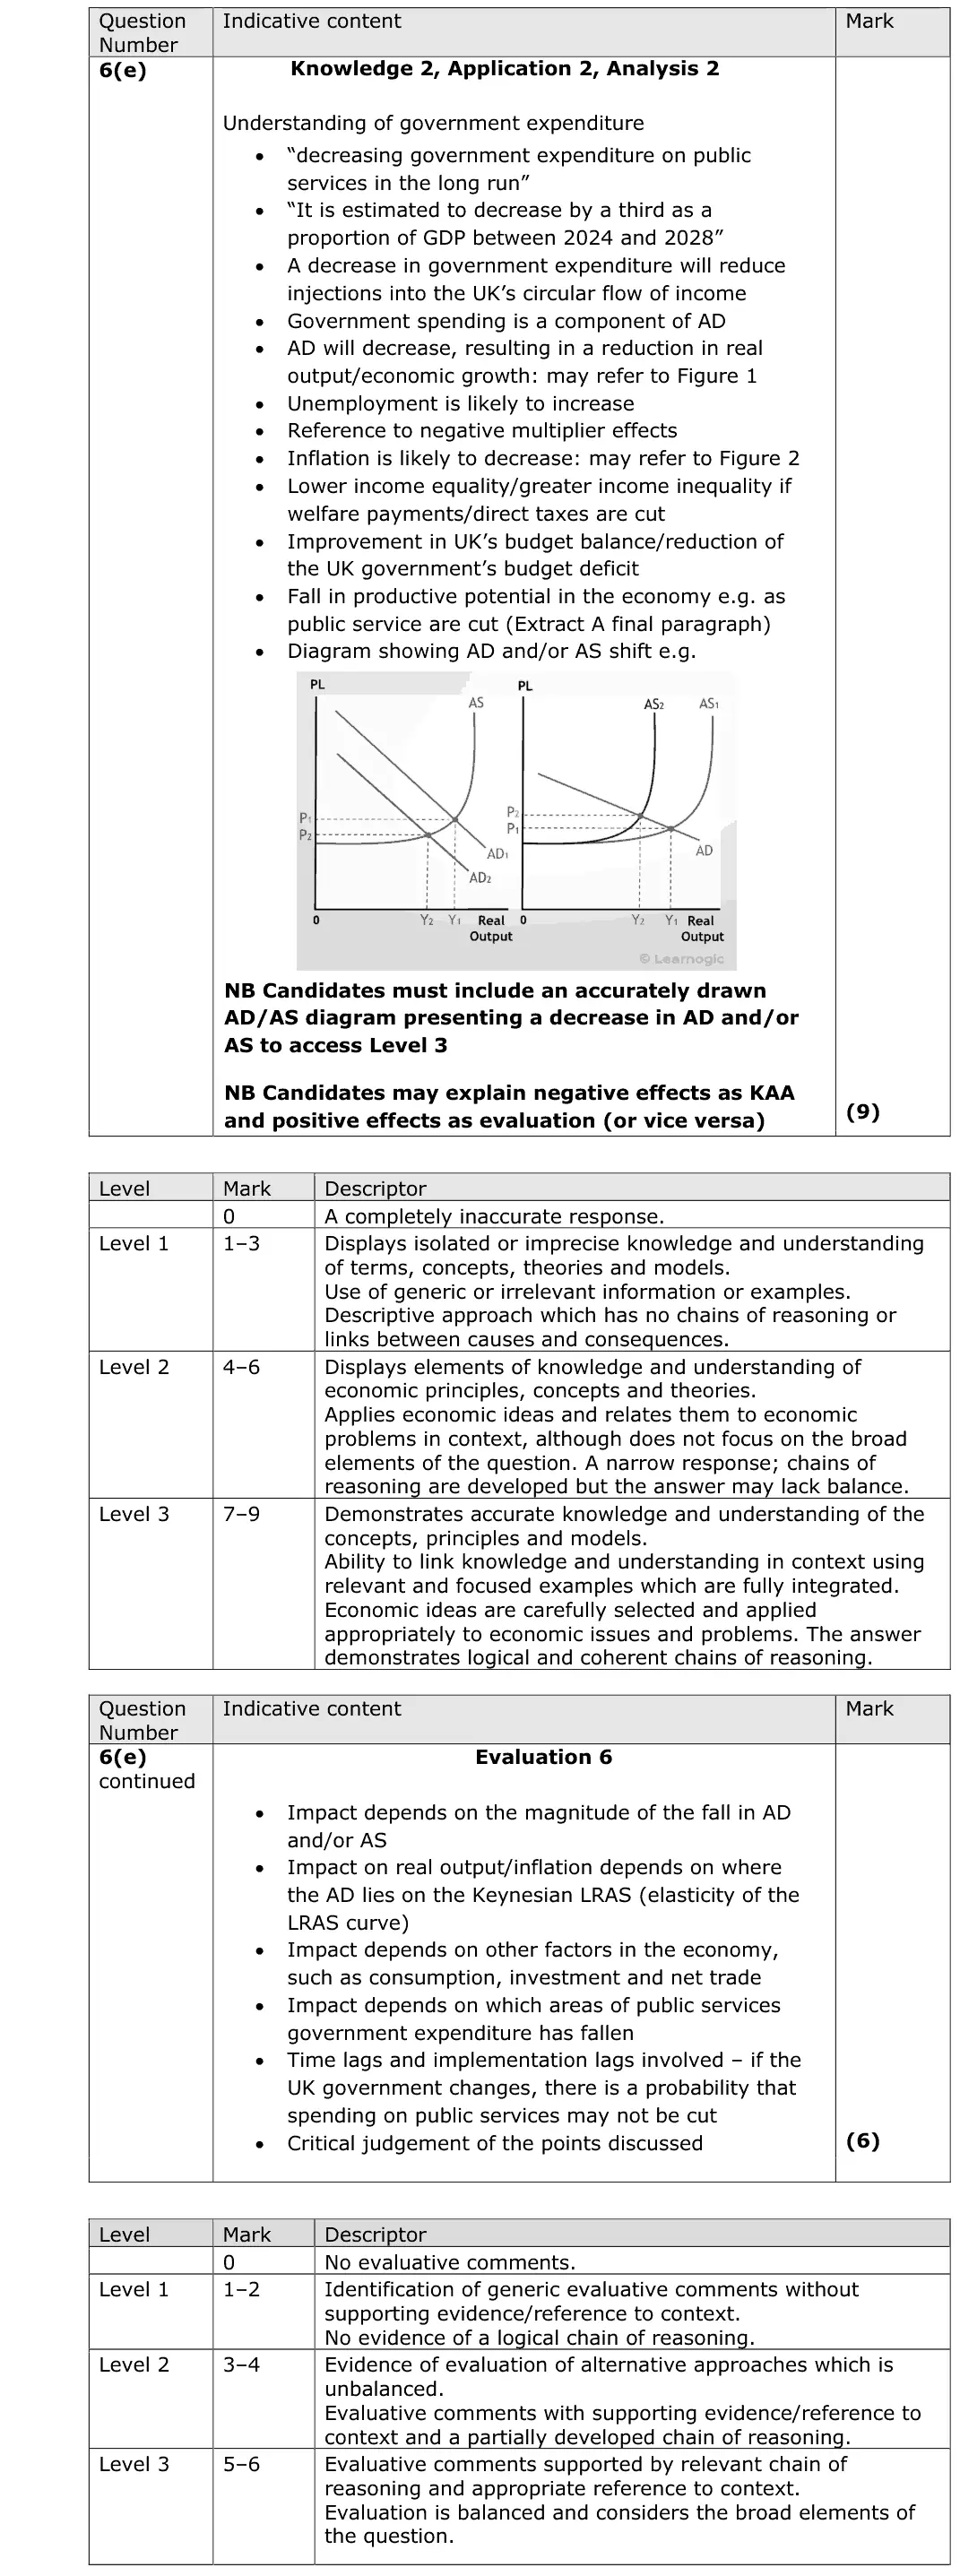
Level 3 needs an accurate AD/AS diagram showing AD (and/or AS) shifting
less G lowers AD via the multiplier: output, unemployment, inflation, budget deficit, poorer public services (cut by a third of GDP 2024-28)
evaluate with size of the cut, spare capacity, crowding in, time lags
Quantitative skills: QS 4 (construct and interpret a range of standard graphical forms)
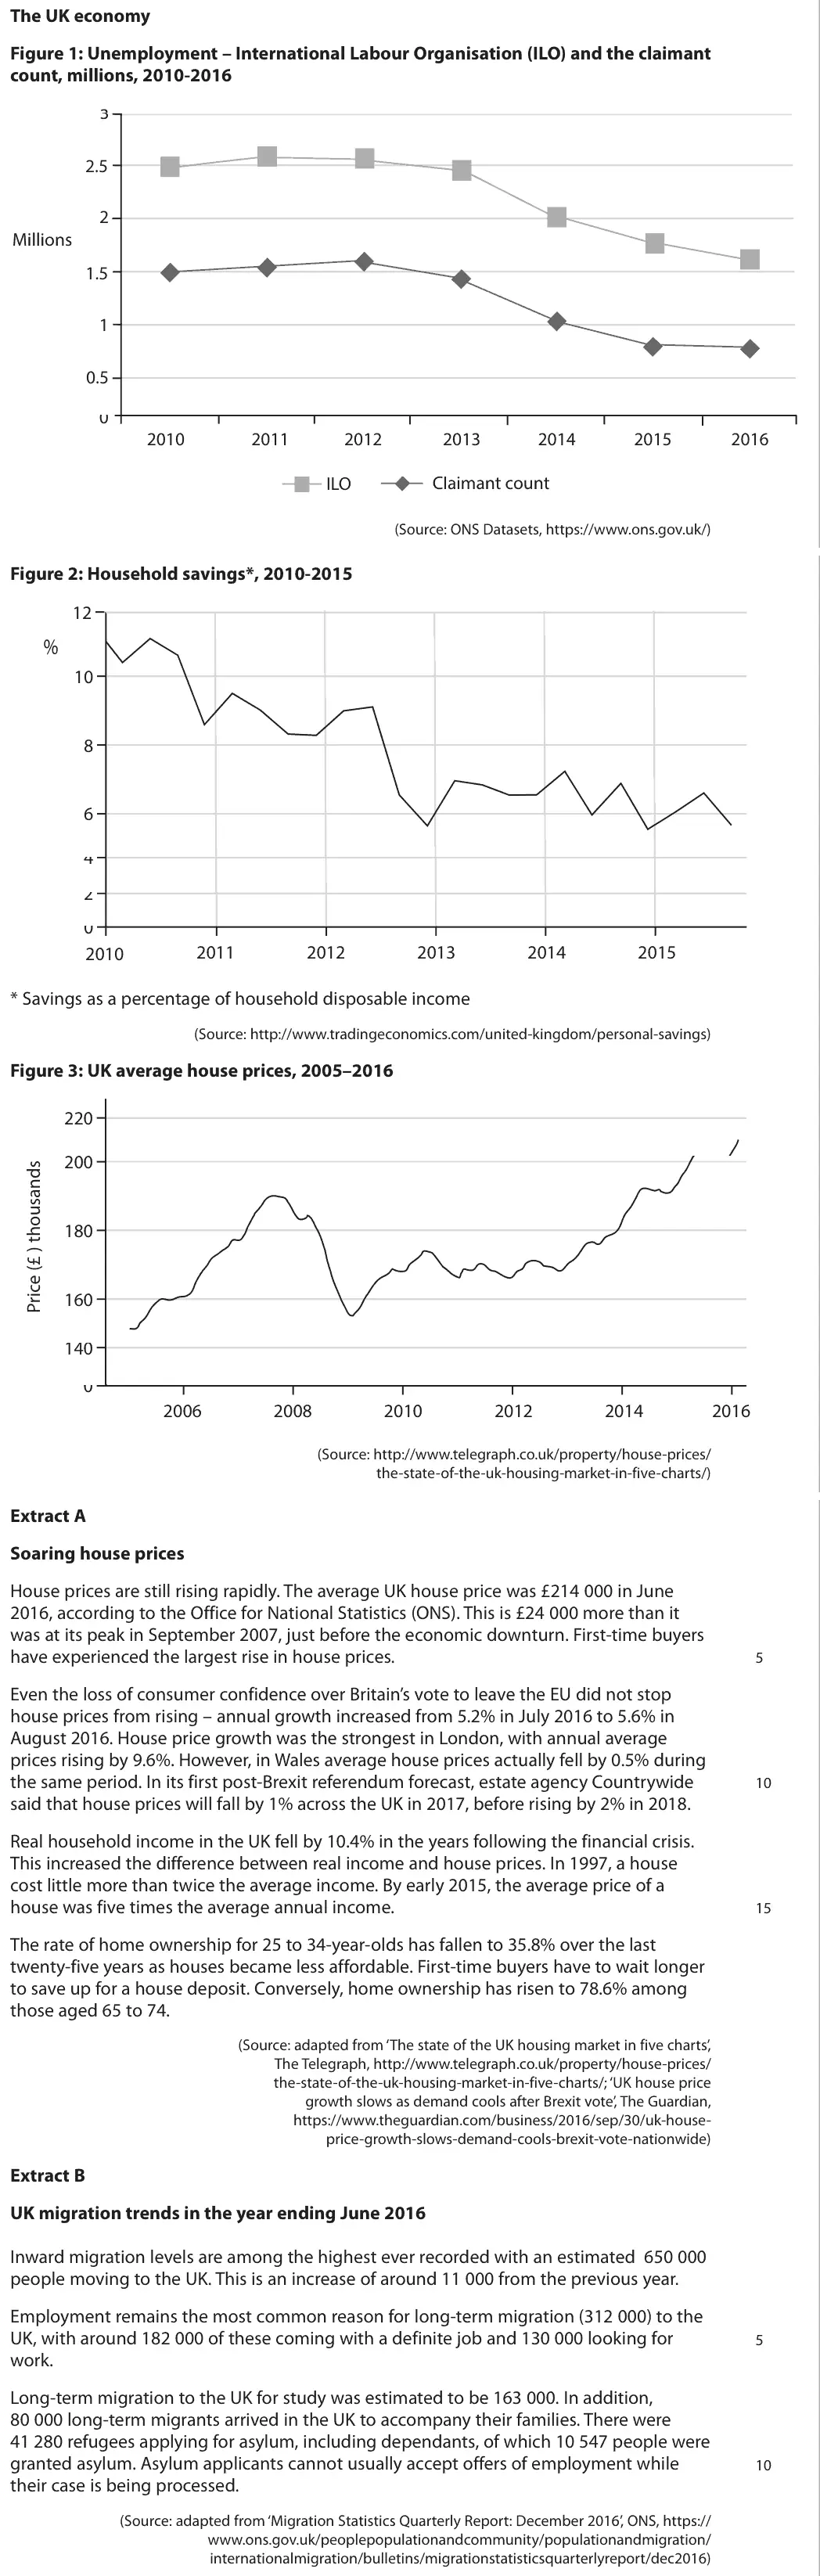
June 2024 · Paper 2 · Q1(a)1 markMultiple choice
Data and extracts for question 1
Answer
D
Mark scheme
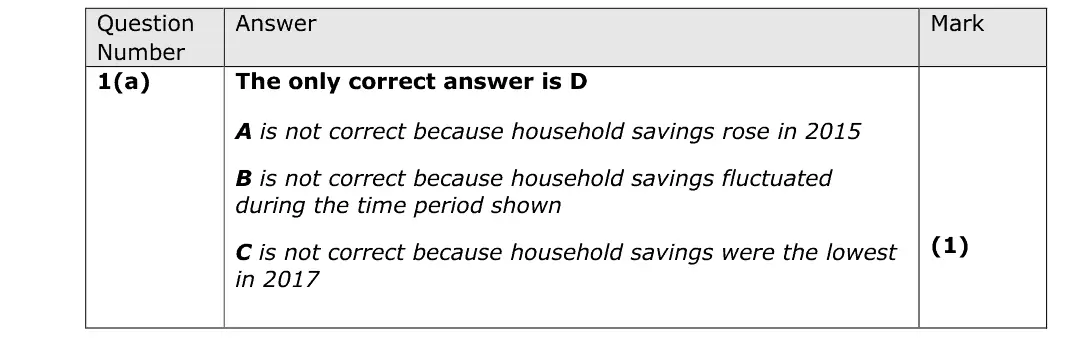
Notes from the mark scheme and report
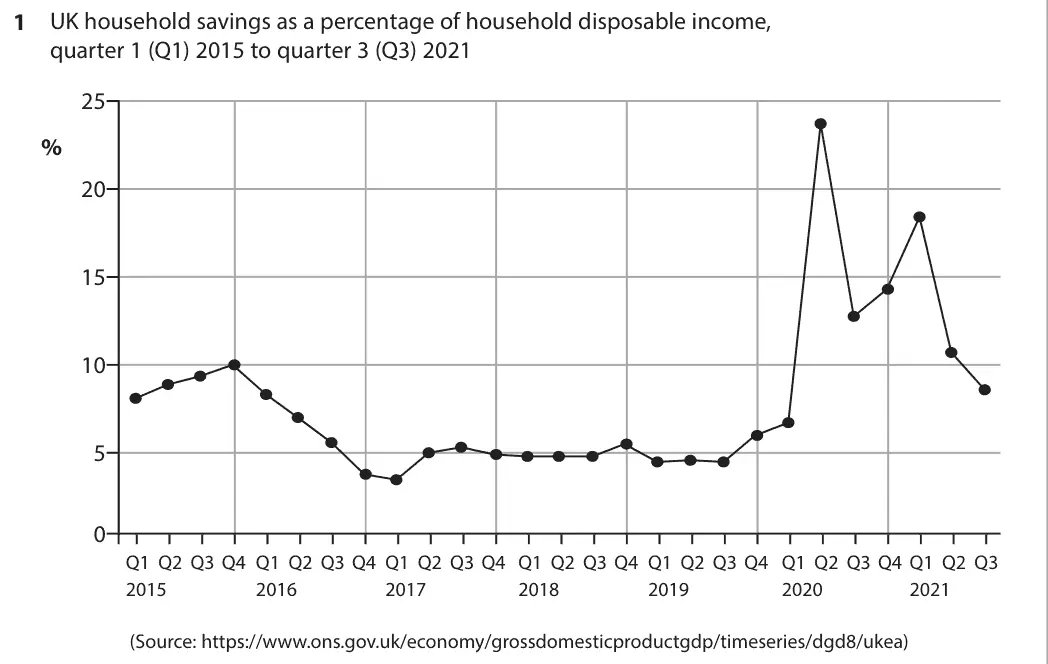
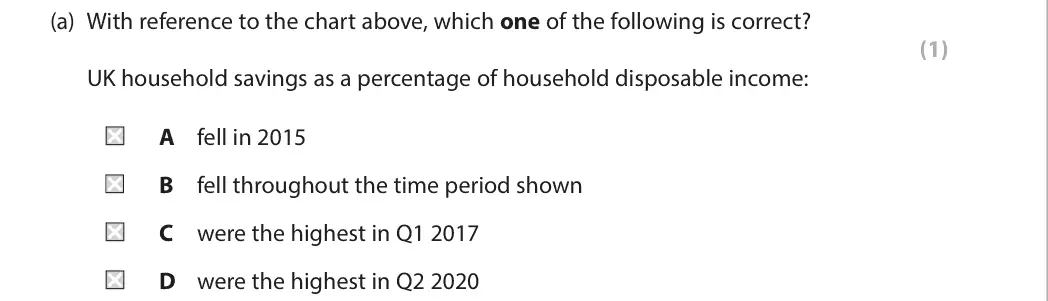
read the savings ratio chart carefully (D)
A wrong as savings rose during 2015, B wrong as savings fluctuated, C wrong as the lowest point was in 2017
Quantitative skills: QS 4 (construct and interpret a range of standard graphical forms); QS 9 (interpret, apply and analyse information in written, graphical tabular and numerical forms)
June 2024 · Paper 2 · Q1(b)2 marksAO2=2Calculation
Data and extracts for question 1
Mark scheme
Examiner's comment
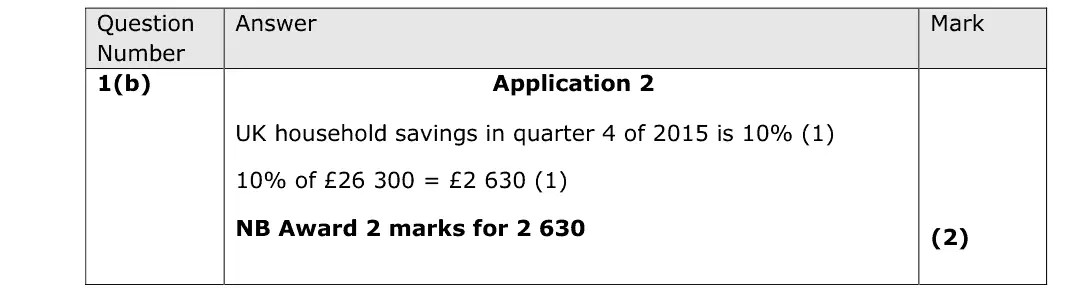
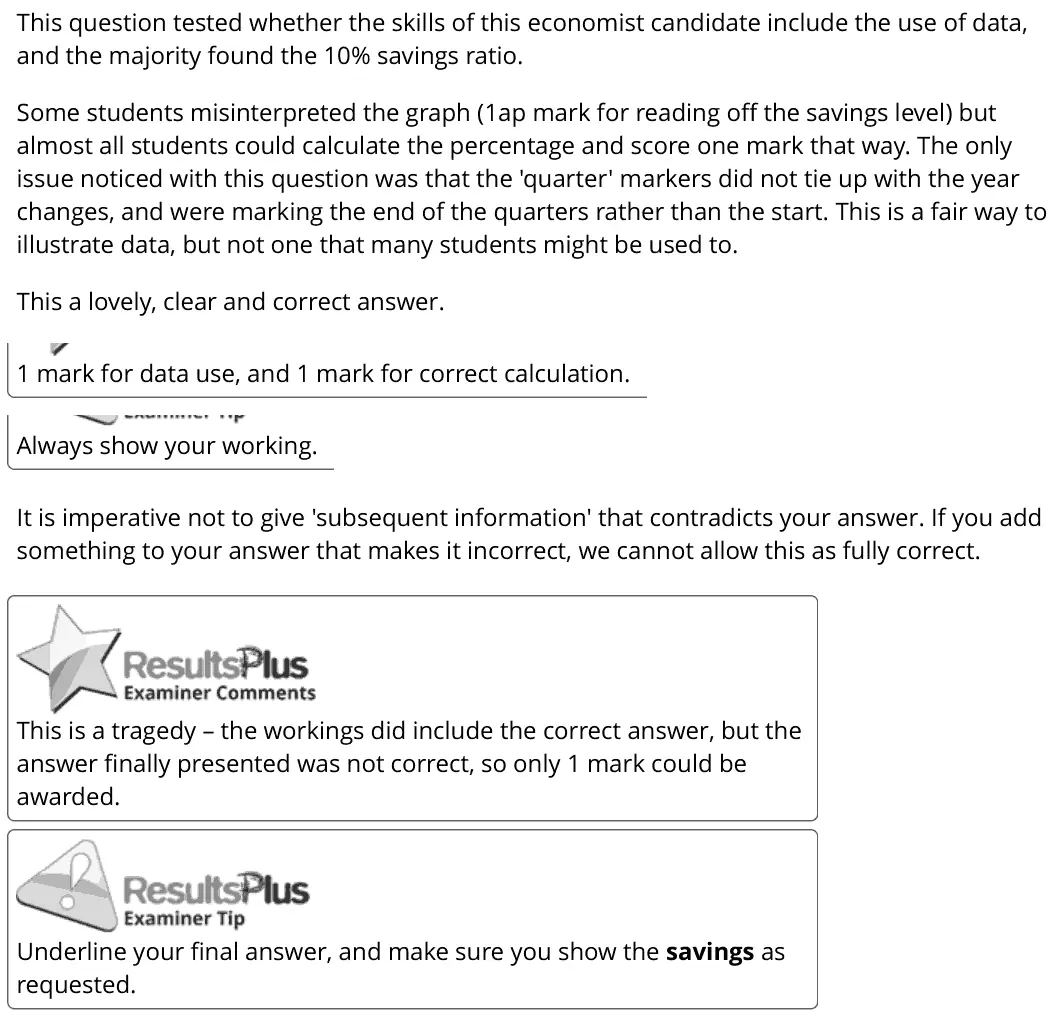
This question tested whether the skills of this economist candidate include the use of data, and the majority found the 10% savings ratio. Some students misinterpreted the graph (1ap mark for reading off the savings level) but almost all students could calculate the percentage and score one mark that way. The only issue noticed with this question was that the 'quarter' markers did not tie up with the year changes, and were marking the end of the quarters rather than the start. This is a fair way to illustrate data, but not one that many students might be used to. This a lovely, clear and correct answer. 1 mark for data use, and 1 mark for correct calculation. Always show your working. It is imperative not to give 'subsequent information' that contradicts your answer. If you add something to your answer that makes it incorrect, we cannot allow this as fully correct. This is a tragedy – the workings did include the correct answer, but the answer finally presented was not correct, so only 1 mark could be awarded. Underline your final answer, and make sure you show the savings as requested.
Notes from the mark scheme and report
savings ratio in Q4 2015 is 10%, so 10% x £26 300 = £2 630
report: some misread the quarter markers
do not add later working that contradicts the answer
Quantitative skills: QS 2 (calculate, use and understand percentages, percentage changes and percentage point changes); QS 9 (interpret, apply and analyse information in written, graphical tabular and numerical forms)
June 2024 · Paper 2 · Q1(c)2 marksAO1=1, AO3=1Short answer
Data and extracts for question 1
Mark scheme
Examiner's comment
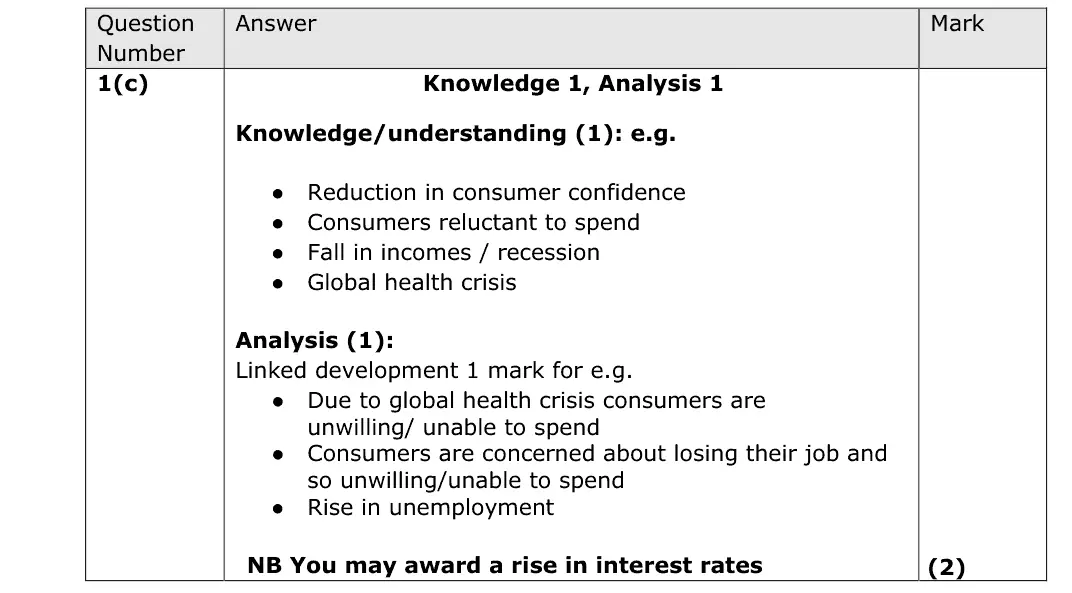
In this 2-mark question there were no application marks (as the application was given in 1b), although most candidates did write further about the data. 2 mark ‘explain’ questions are not application marks, according to the Test Specification, which examiners have to use when setting papers. Although over this period, interest rates did not rise and were very low, we awarded rising in interest rates because there were no application marks and as a theoretical factor this could well have been a cause of the rise in savings, and this meant that most candidates scored very highly on this question. The most common answer was, unsurprisingly, Covid, and although again this is not on the specification it had to be allowed that a loss in confidence in the economy, potential fears of falls in income or the inability to spend money might cause people to save more. Do not waste time in short answer questions like this by using the data. It asks for a reason, and you have to explain that reason. There is no application mark here. This earns 2/2 but too much time has been spent here. Do not feel you have to use every line given. The marker is looking for the reason, then the explanation. There is no 'hidden' data expectation. Interest rates did not of course rise over this period, but because they are a 'likely reason' for a change in savings, this argument was awarded. 1 mark for identifying the rise in interest rates. The analysis does follow from the reasoning so this scores full marks. Short answers are highly recommended for Section A. If you fill up all the lines there is a huge opportunity cost.
Notes from the mark scheme and report
one reason (loss of consumer confidence, fear of job losses, inability to spend during the health crisis, rise in interest rates allowed) plus linked development
no application mark so do not spend time on the data
June 2024 · Paper 2 · Q2(a)1 markMultiple choice
Data and extracts for question 2
Answer
C
Mark scheme
Notes from the mark scheme and report
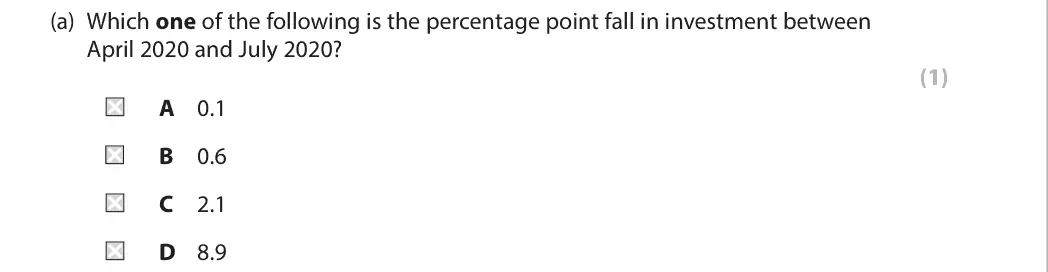
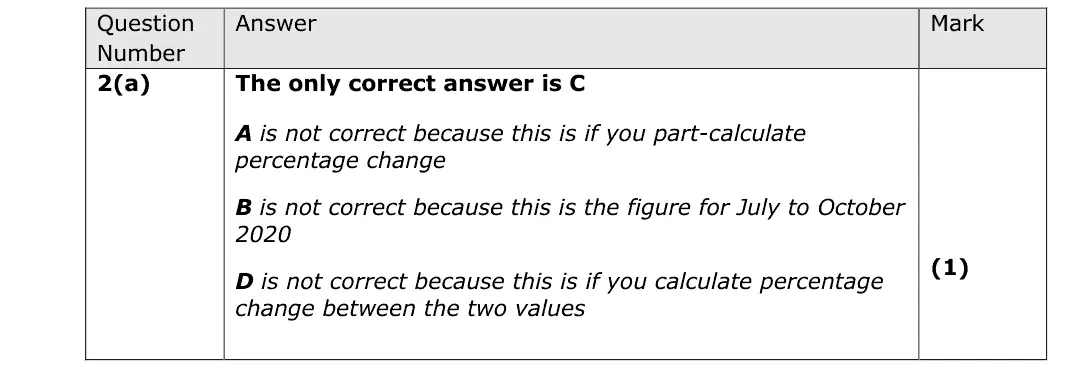
percentage point fall = 23.5 - 21.4 = 2.1 (C)
D is the percentage change between the values, A a part-calculated percentage change, B the July to October 2020 fall
Quantitative skills: QS 10 (distinguish between changes in the level of a variable, and the rate of change); QS 2 (calculate, use and understand percentages, percentage changes and percentage point changes)
June 2024 · AS Paper 2 · Q2(b)2 marksAO1=2Short answer
Data and extracts for question 2
Mark scheme
Examiner's comment
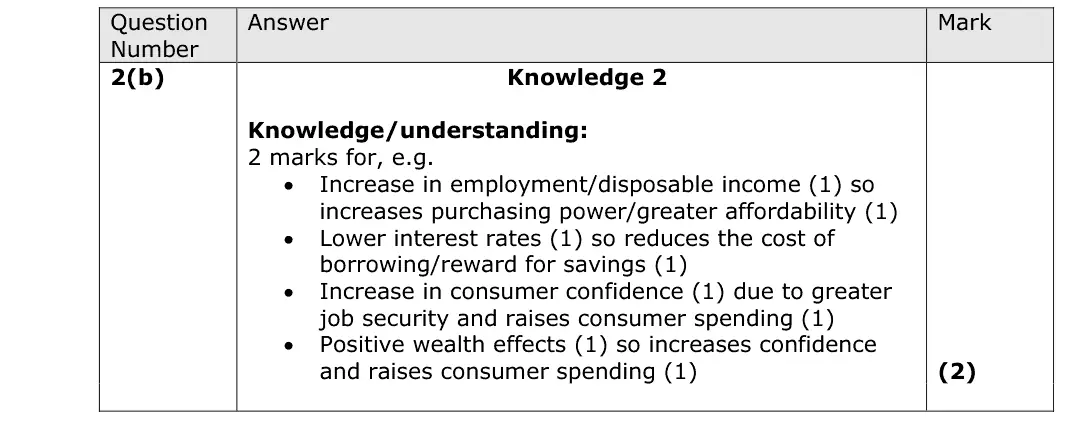
This question requires candidates to explain one likely factor that could increase the level of consumption of UK households. Candidates were able to answer this question relatively easily.
Notes from the mark scheme and report
one factor with its reason, e.g. lower interest rates cut the cost of borrowing and reward for saving, or higher disposable income, confidence, wealth effects
June 2024 · Paper 2 · Q2(b)4 marksAO1=2, AO2=1, AO3=1Short answer
Data and extracts for question 2
Mark scheme
Examiner's comment
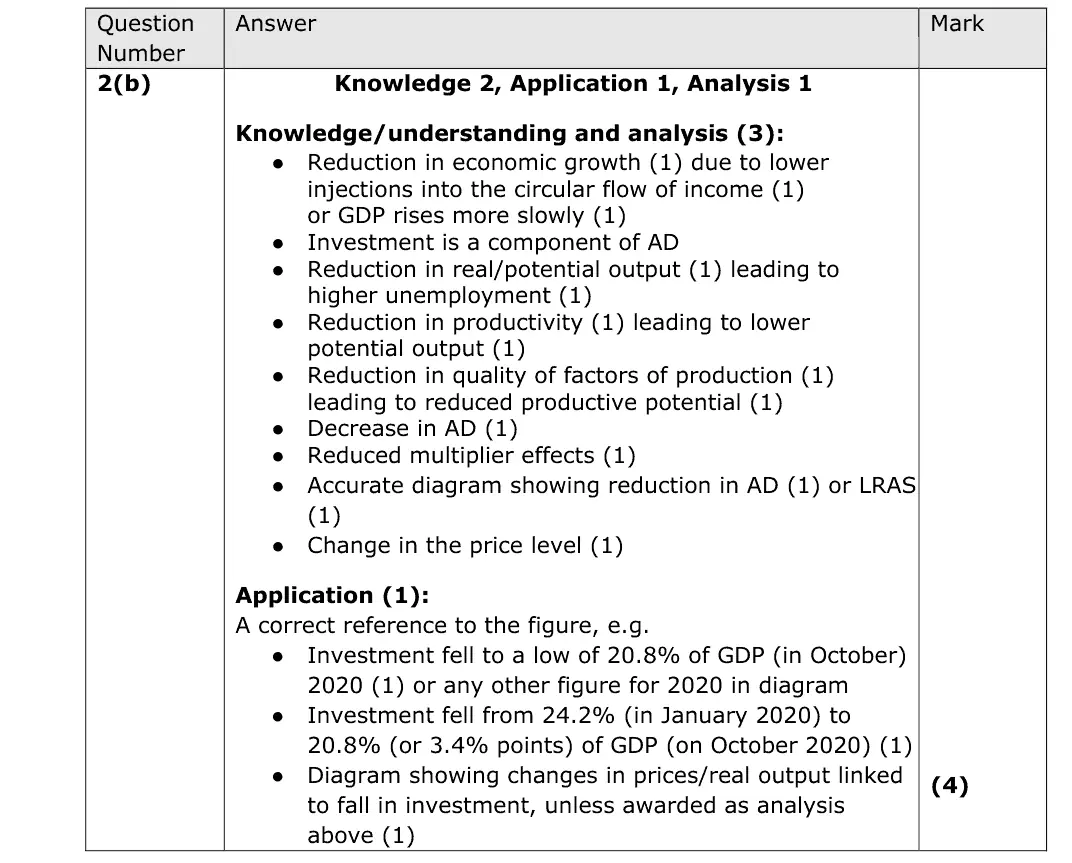
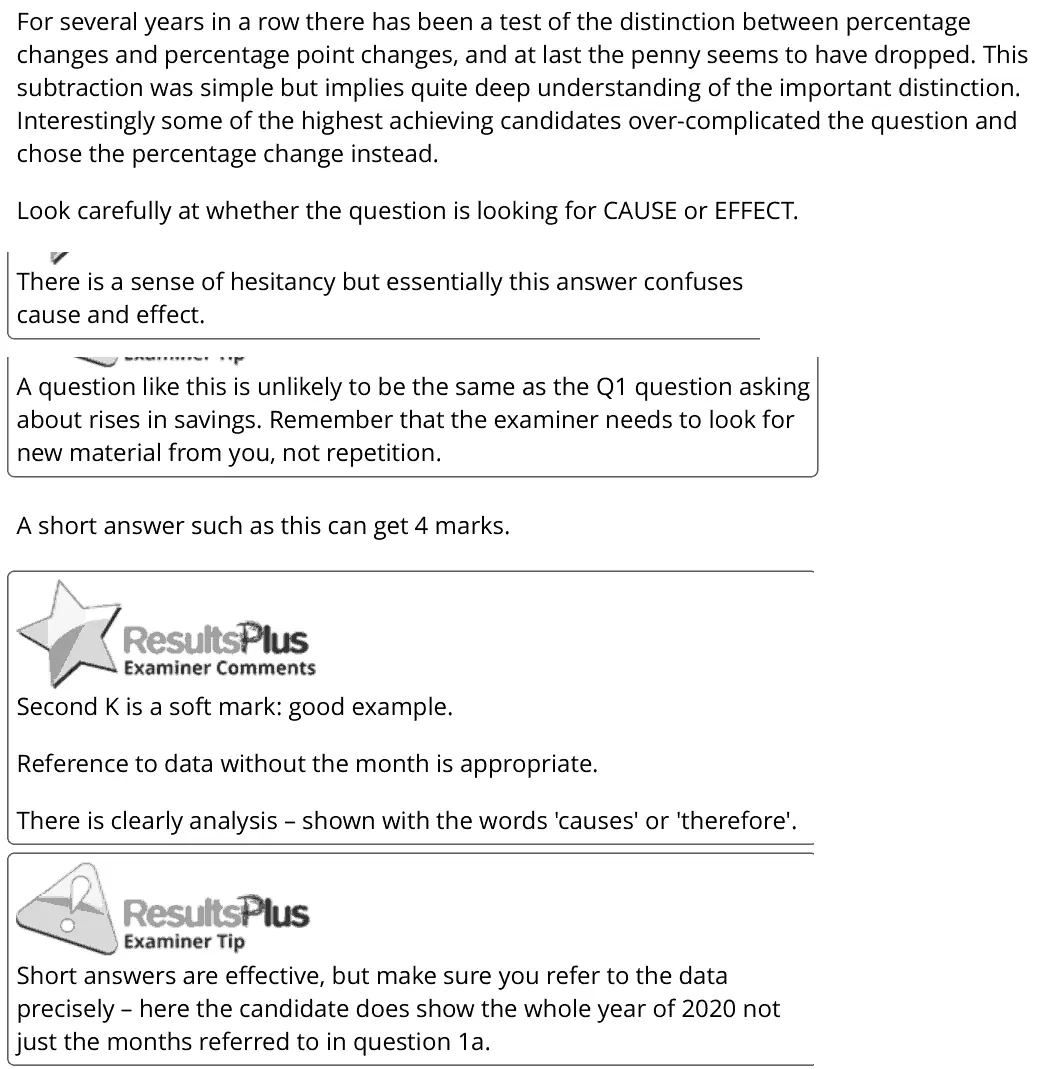
For several years in a row there has been a test of the distinction between percentage changes and percentage point changes, and at last the penny seems to have dropped. This subtraction was simple but implies quite deep understanding of the important distinction. Interestingly some of the highest achieving candidates over-complicated the question and chose the percentage change instead. Look carefully at whether the question is looking for CAUSE or EFFECT. There is a sense of hesitancy but essentially this answer confuses cause and effect. A question like this is unlikely to be the same as the Q1 question asking about rises in savings. Remember that the examiner needs to look for new material from you, not repetition. A short answer such as this can get 4 marks. Second K is a soft mark: good example. Reference to data without the month is appropriate. There is clearly analysis – shown with the words 'causes' or 'therefore'. Short answers are effective, but make sure you refer to the data precisely – here the candidate does show the whole year of 2020 not just the months referred to in question 1a.
Notes from the mark scheme and report
an EFFECT of lower investment (lower AD and growth, fewer injections, smaller multiplier, lower potential output and productivity)
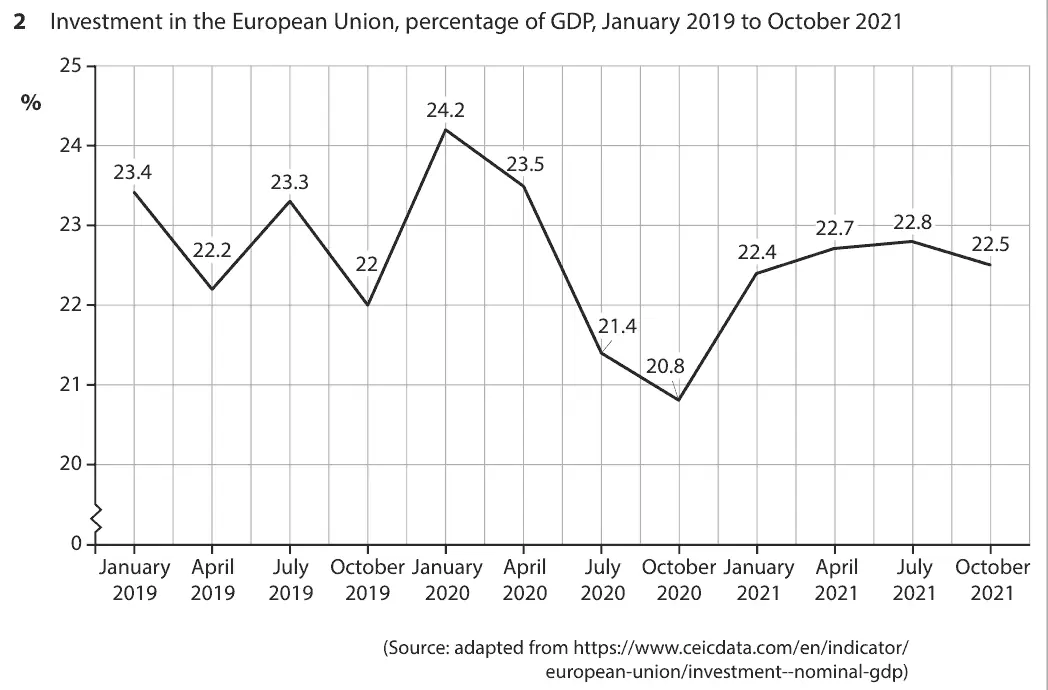
quote e.g. 24.2% to 20.8% of GDP in 2020
report: several wrote causes of the fall, repeating their savings answer to 1(c)
Quantitative skills: QS 9 (interpret, apply and analyse information in written, graphical tabular and numerical forms)
June 2024 · AS Paper 2 · Q4(a)1 markAO1=1Definition
Data and extracts for question 4
Mark scheme
Examiner's comment
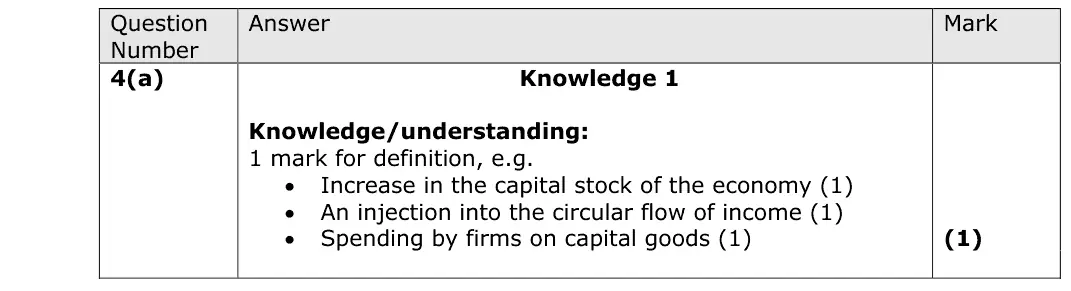
This question requires a clear definition of the term investment. Many provided accurate definitions and hence attained the one mark available for this question.
Notes from the mark scheme and report
spending by firms on capital goods (addition to the capital stock), an injection into the circular flow
not buying shares
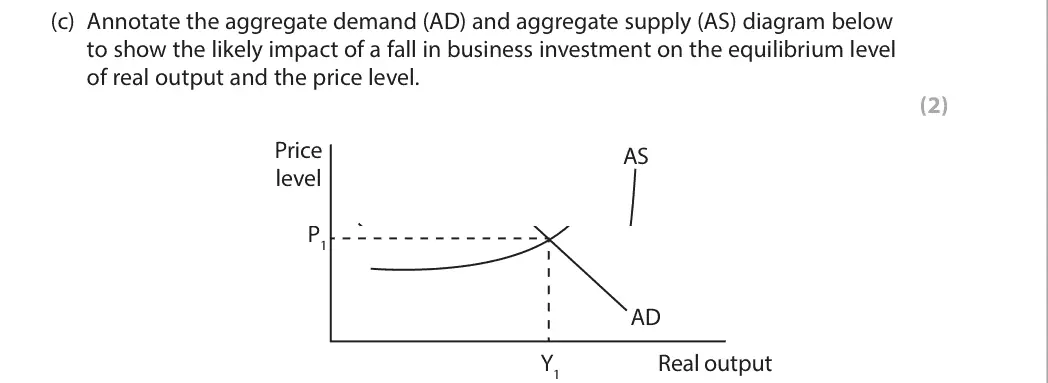
June 2024 · AS Paper 2 · Q4(b)2 marksAO2=2Diagram
Data and extracts for question 4
Mark scheme
Examiner's comment
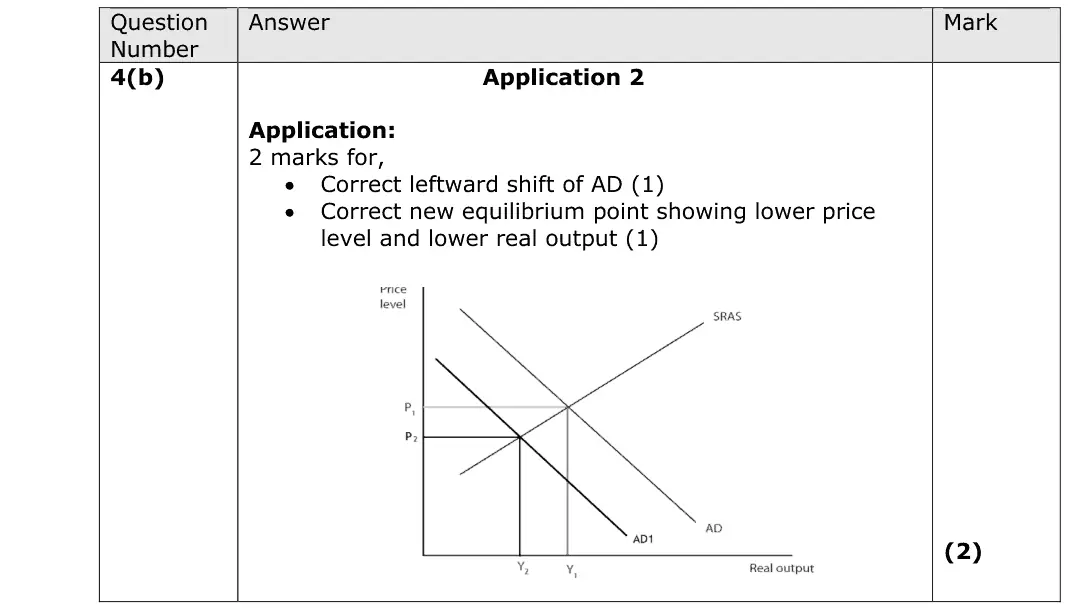
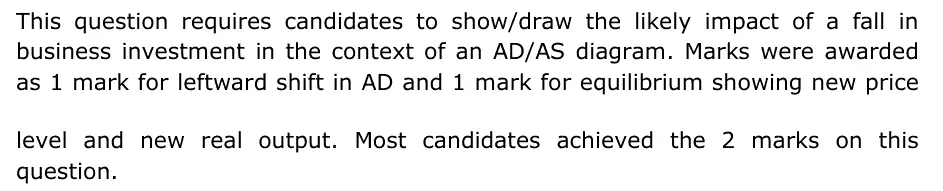
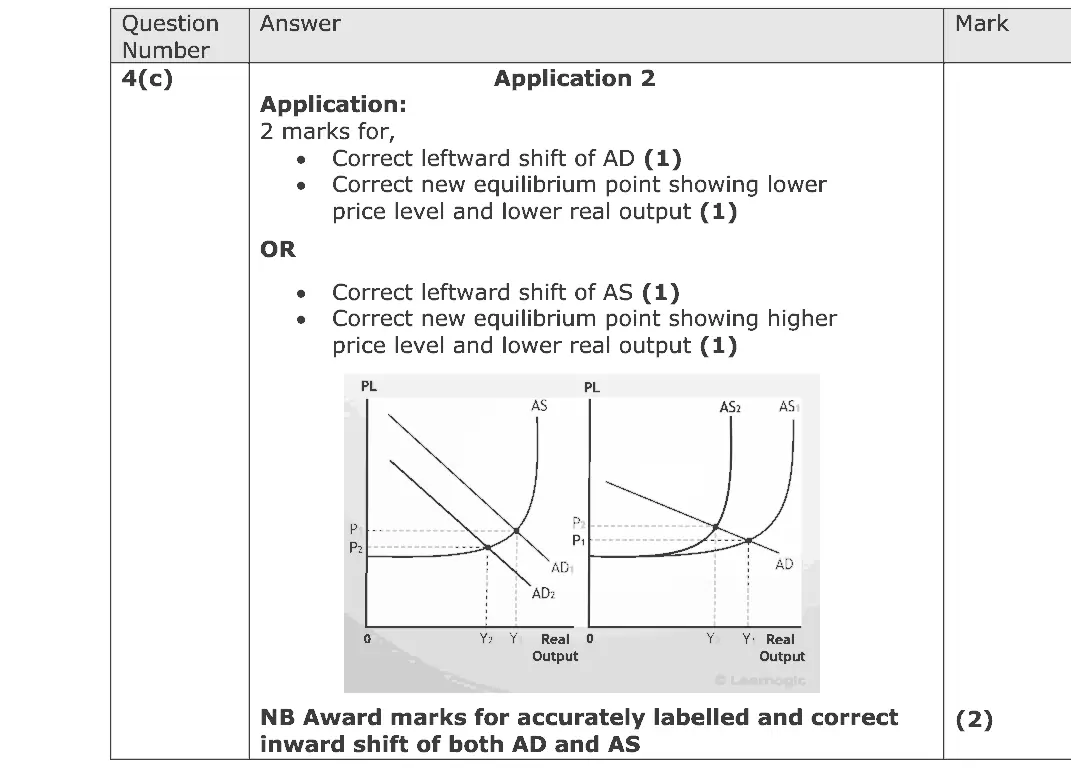
This question requires candidates to show/draw the likely impact of a fall in business investment in the context of an AD/AS diagram. Marks were awarded as 1 mark for leftward shift in AD and 1 mark for equilibrium showing new price level and new real output. Most candidates achieved the 2 marks on this question.
Notes from the mark scheme and report
shift AD left and mark the new equilibrium with lower price level and lower real output
Quantitative skills: QS 4 (construct and interpret a range of standard graphical forms)
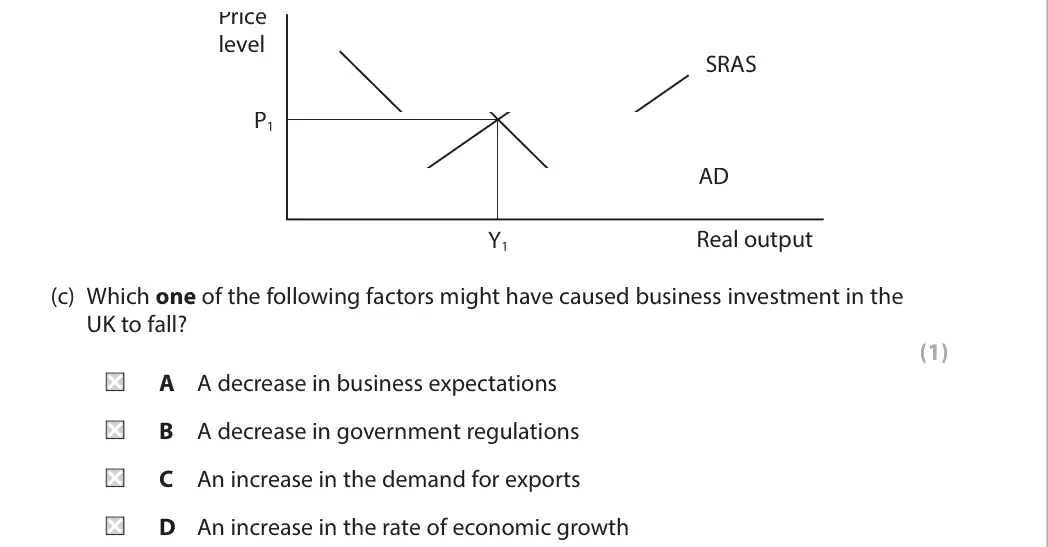
June 2024 · AS Paper 2 · Q4(c)1 markMultiple choice
Data and extracts for question 4
Answer
A
Mark scheme
Notes from the mark scheme and report
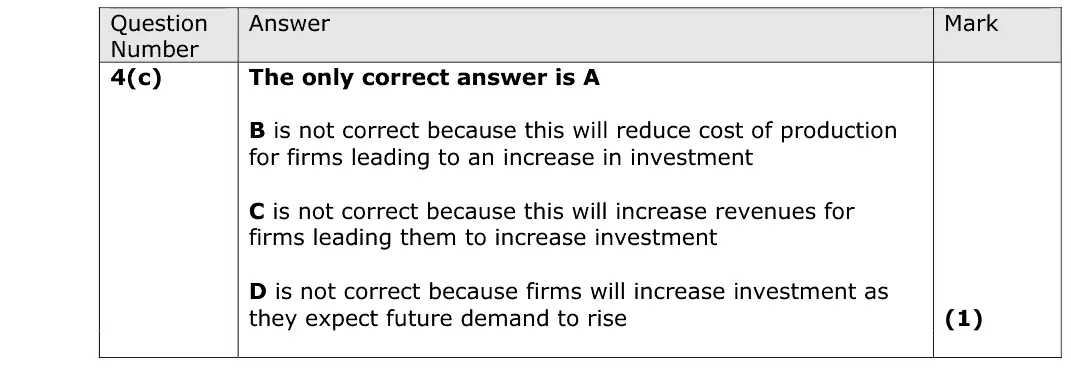
weaker business expectations (animal spirits) cut investment (A)
less regulation, more export demand and faster growth would all raise investment
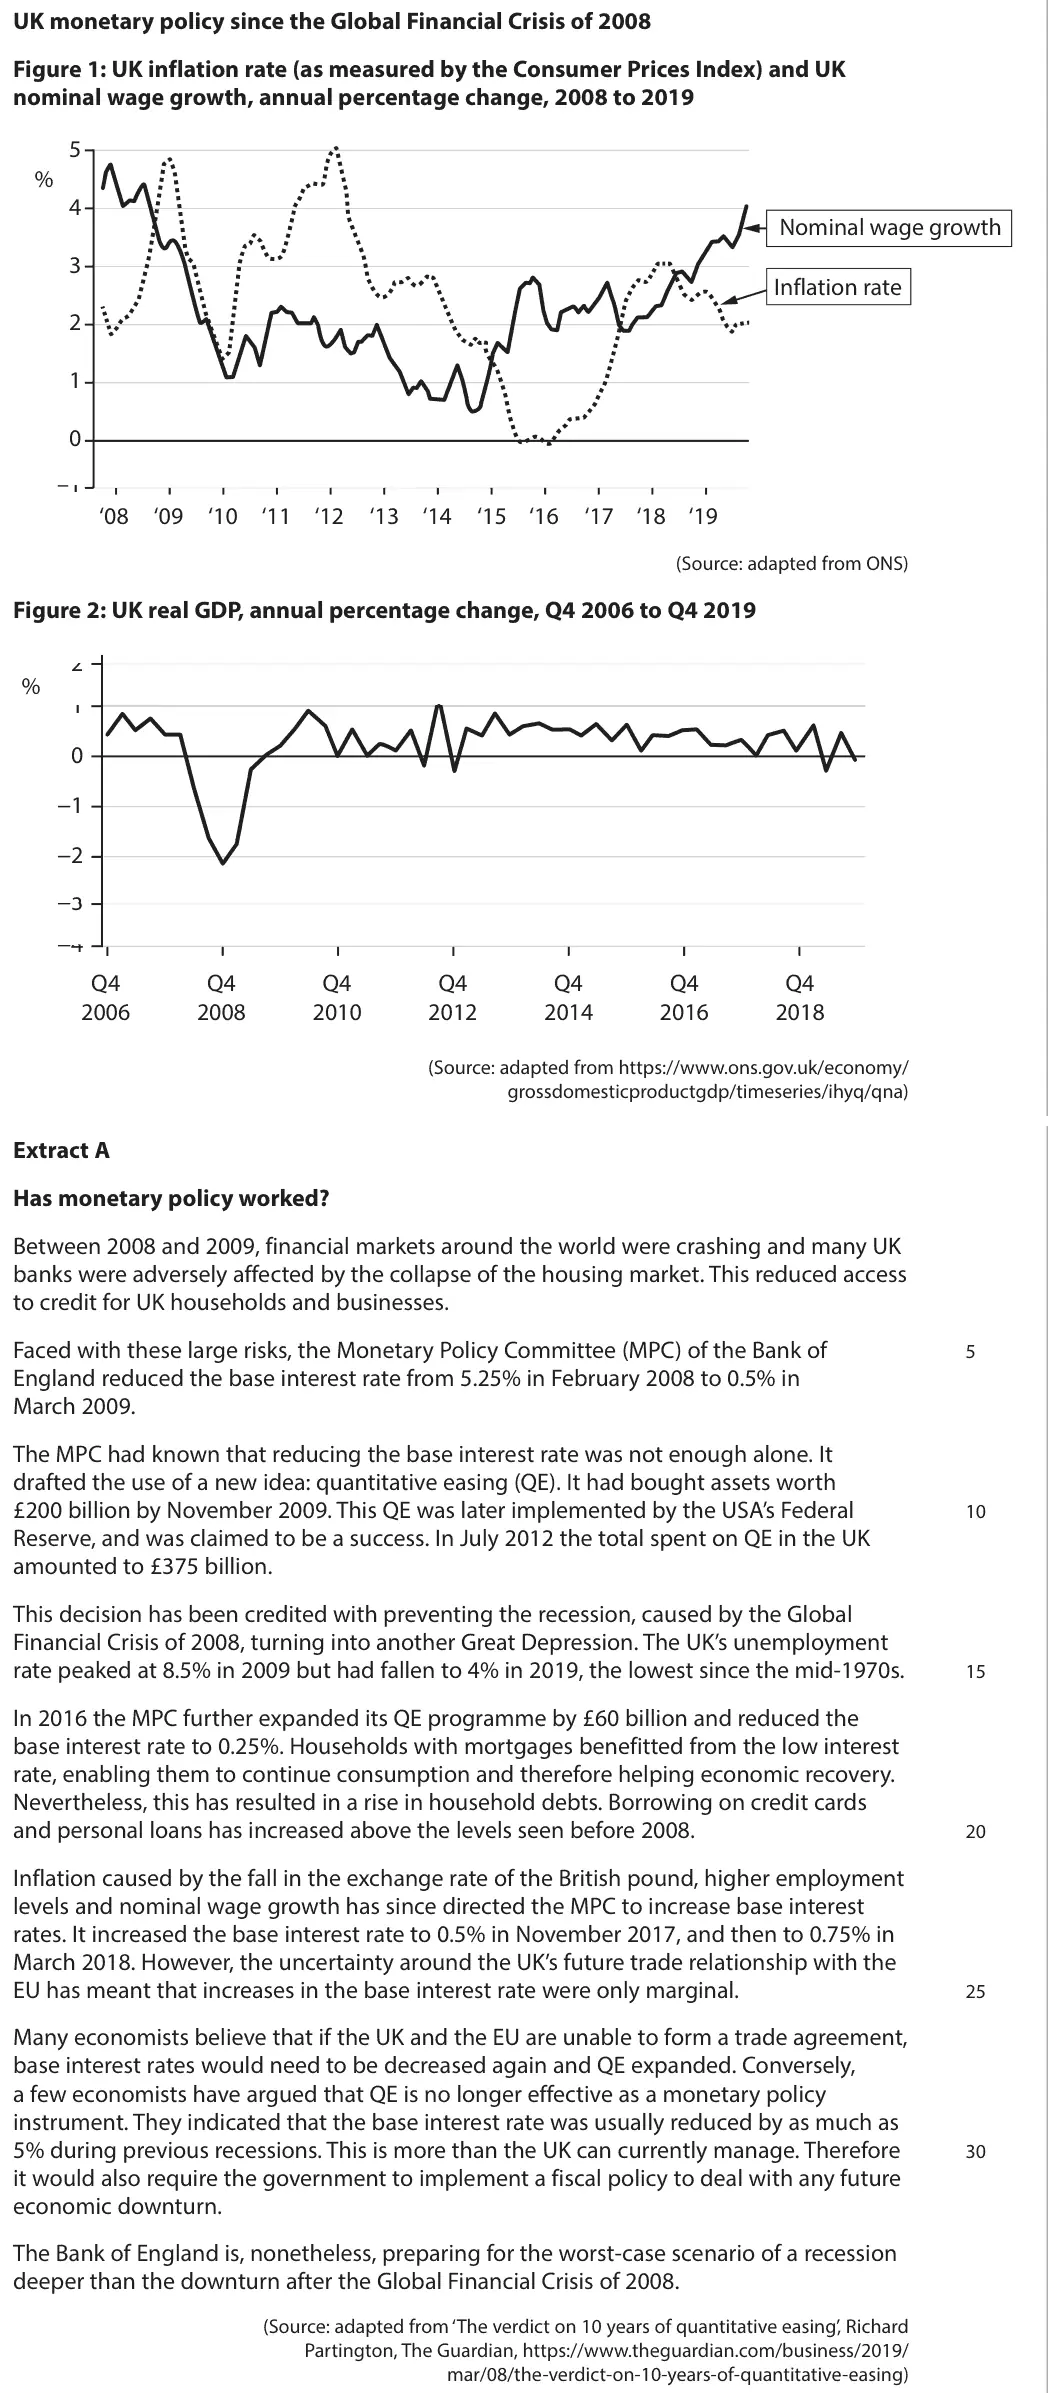
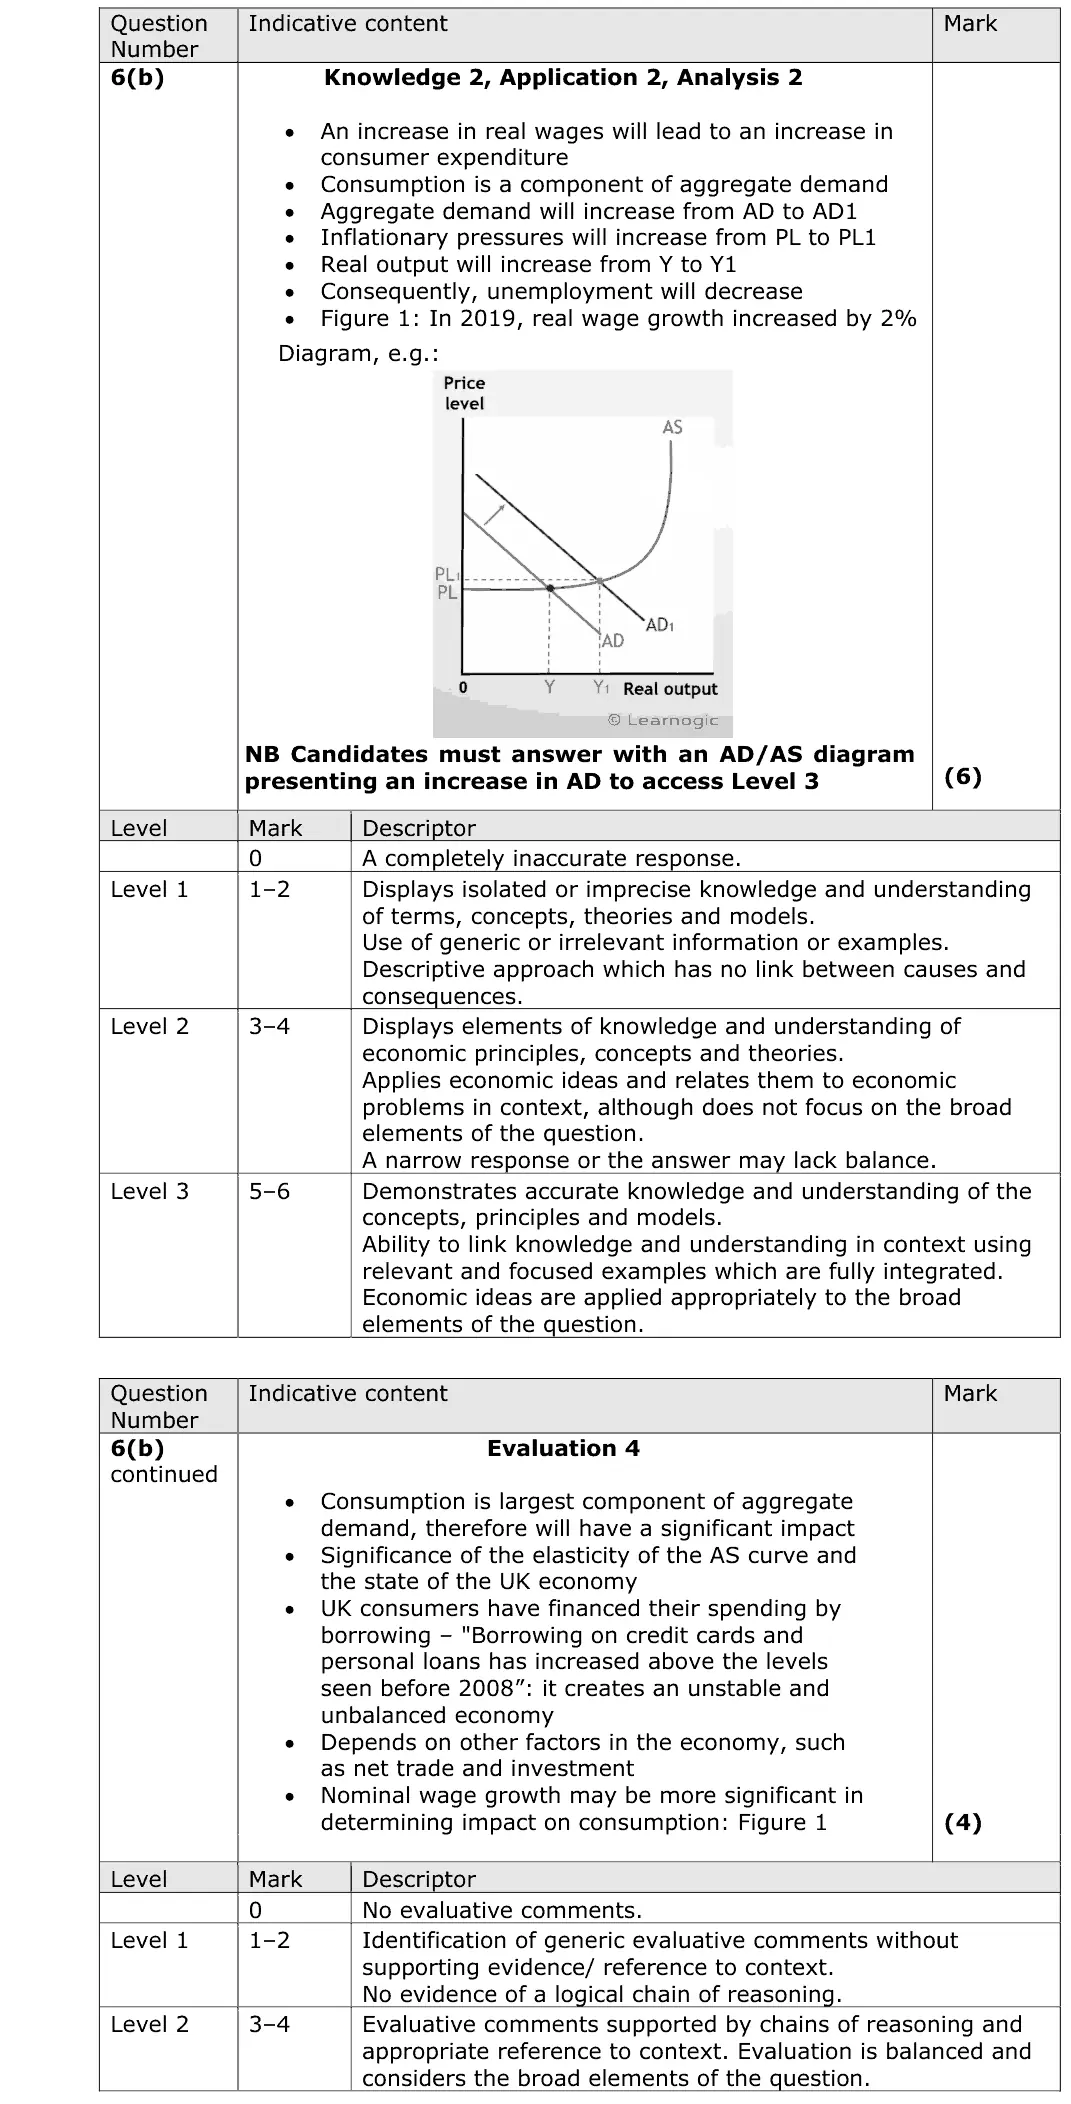
June 2024 · AS Paper 2 · Q6(b)10 marksAO1=2, AO2=2, AO3=2, AO4=410-mark response
Data and extracts for question 6
Mark scheme, including the levels grid and indicative content
Examiner's comment
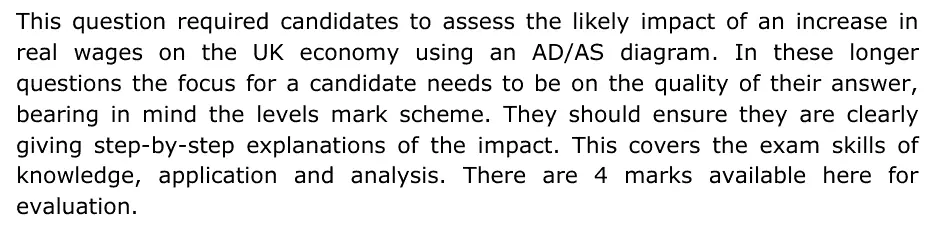
This question required candidates to assess the likely impact of an increase in real wages on the UK economy using an AD/AS diagram. In these longer questions the focus for a candidate needs to be on the quality of their answer, bearing in mind the levels mark scheme. They should ensure they are clearly giving step-by-step explanations of the impact. This covers the exam skills of knowledge, application and analysis. There are 4 marks available here for evaluation.
Notes from the mark scheme and report
Level 3 needs an AD/AS diagram with AD shifting right (higher consumption, real output and price level, lower unemployment)
evaluate with spare capacity, saving, imports, cost-push effects on SRAS
Quantitative skills: QS 4 (construct and interpret a range of standard graphical forms)
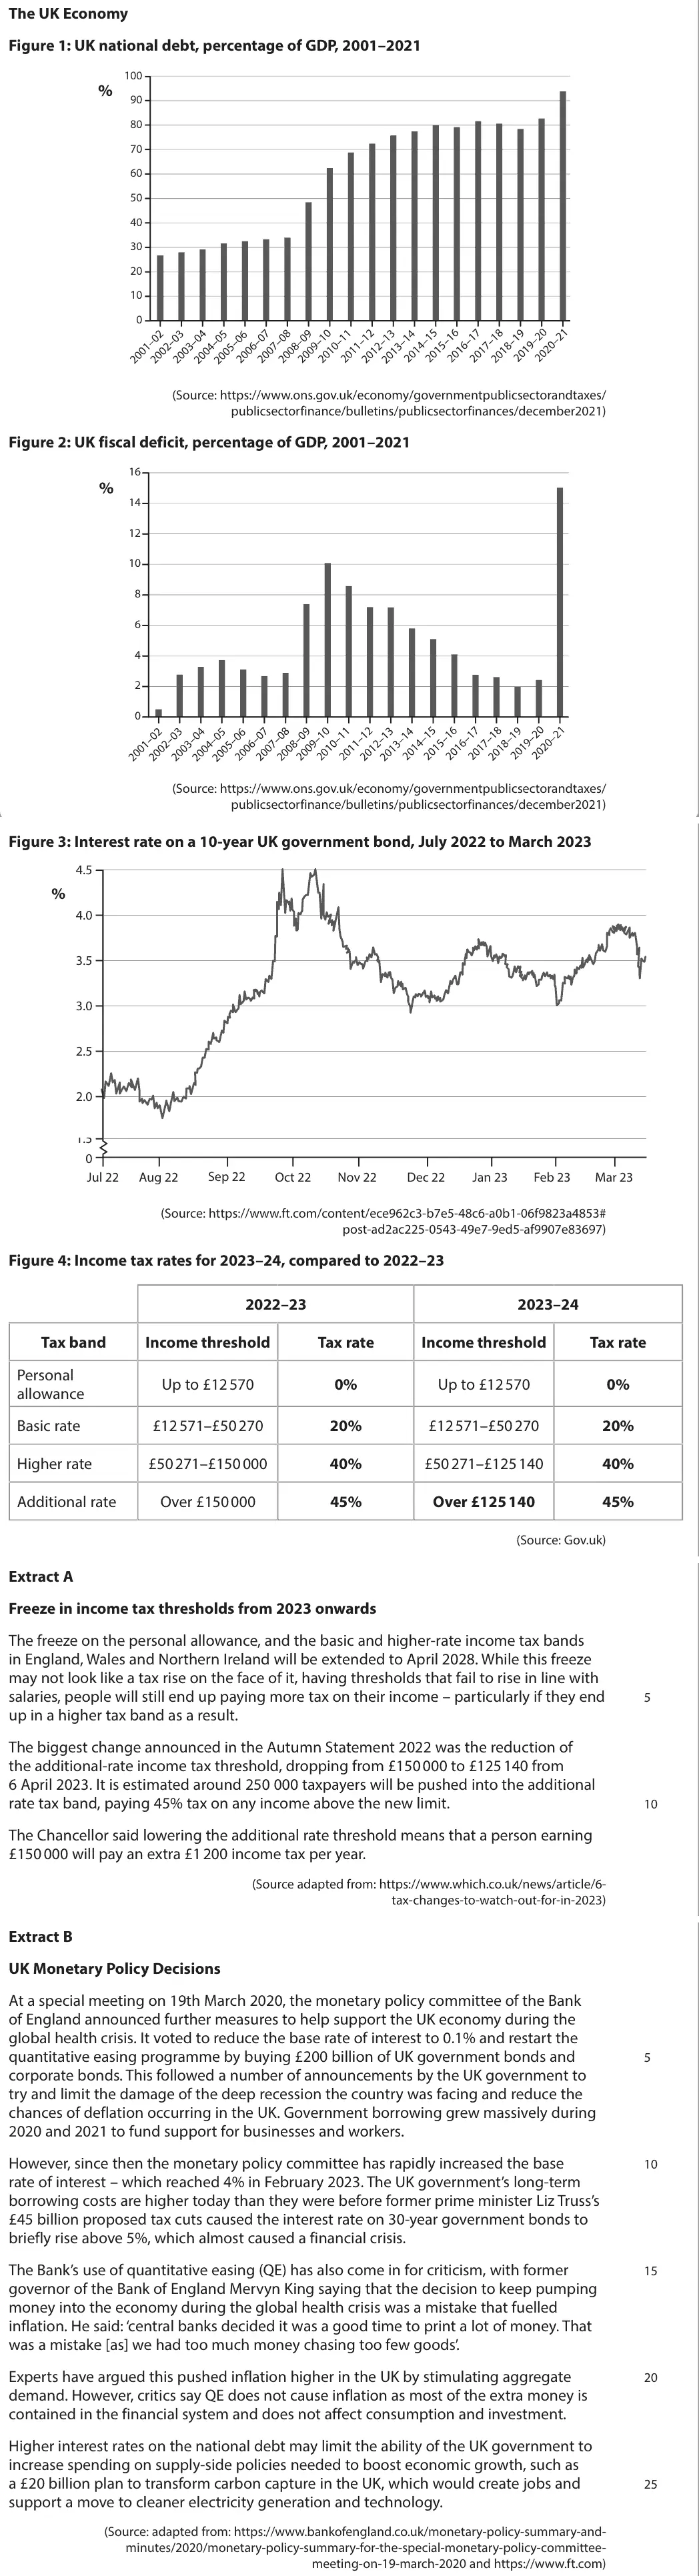
June 2024 · Paper 2 · Q6(b)8 marksAO1=2, AO2=2, AO3=2, AO4=28-mark response
Data and extracts for question 6
Mark scheme, including the levels grid and indicative content
Examiner's comment
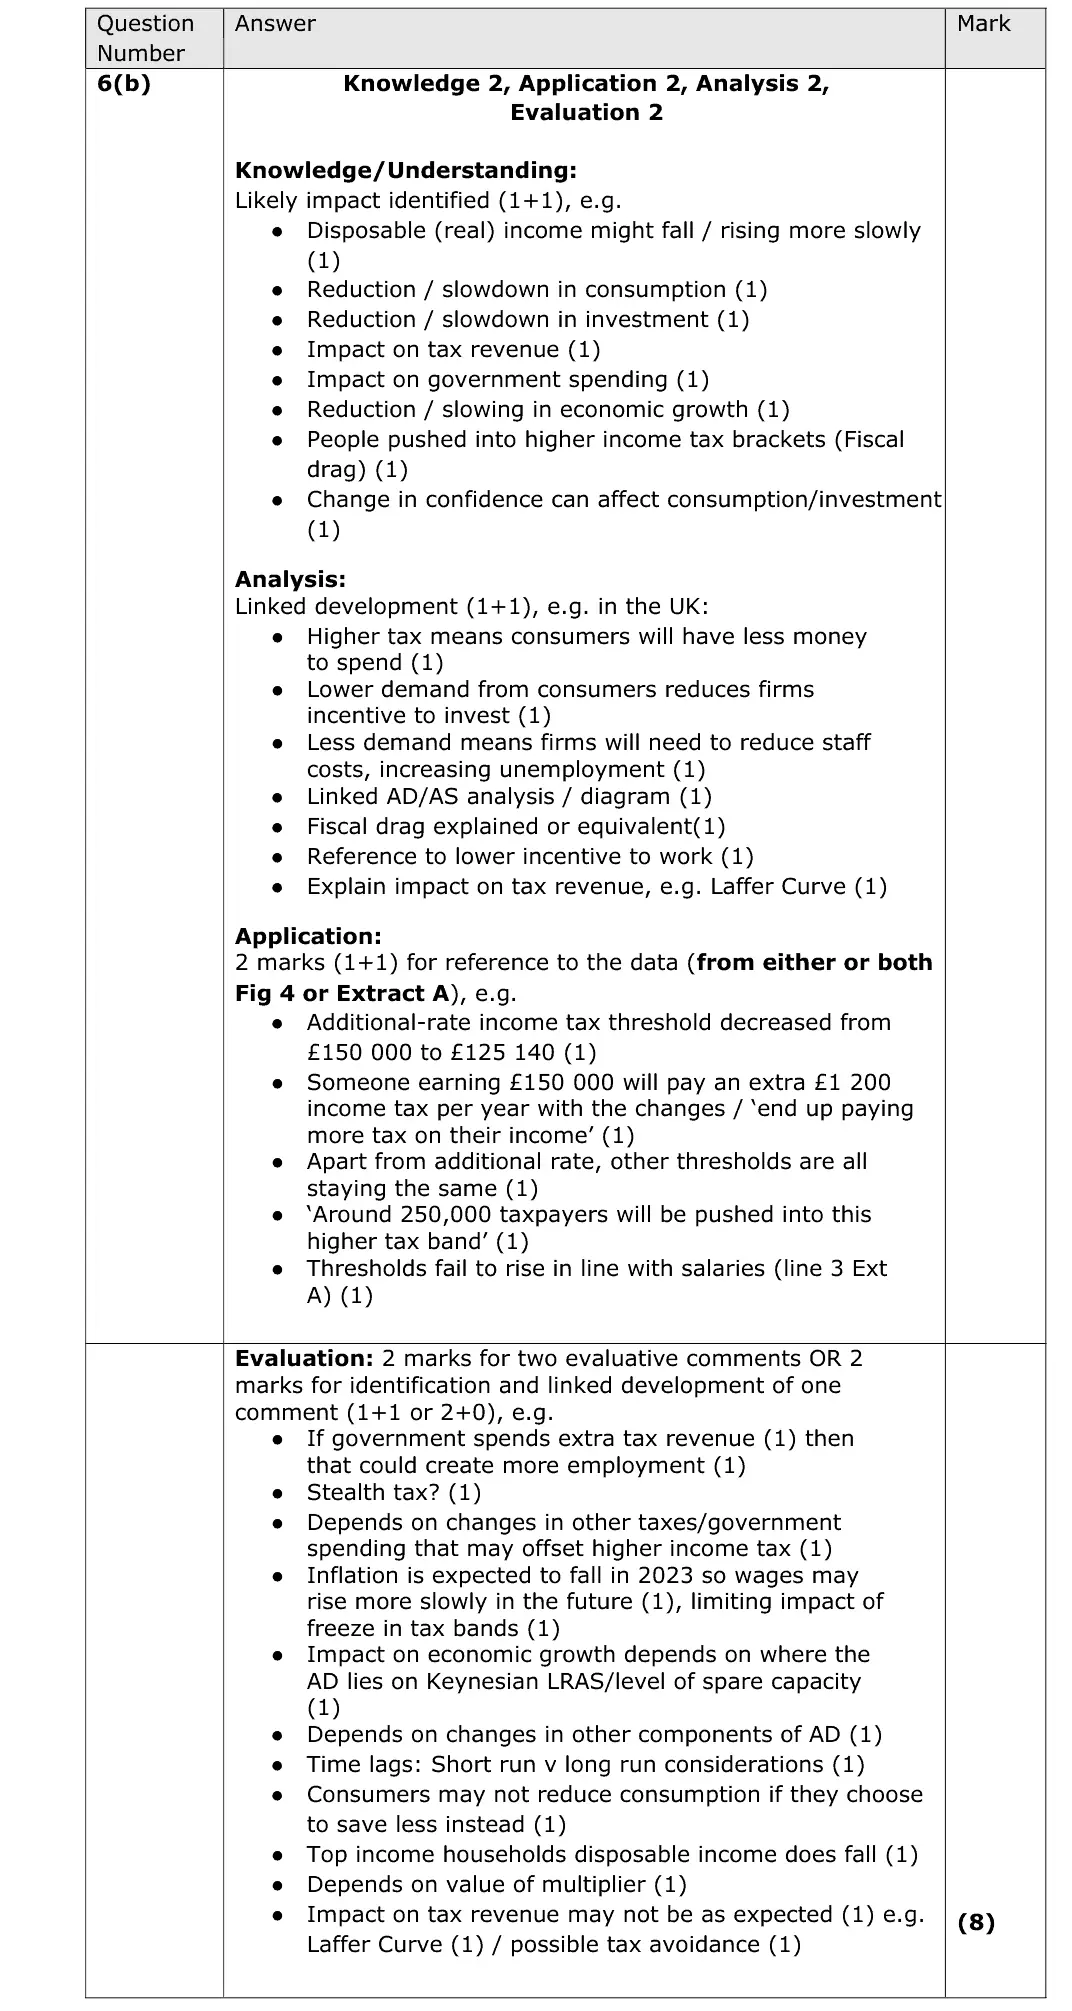
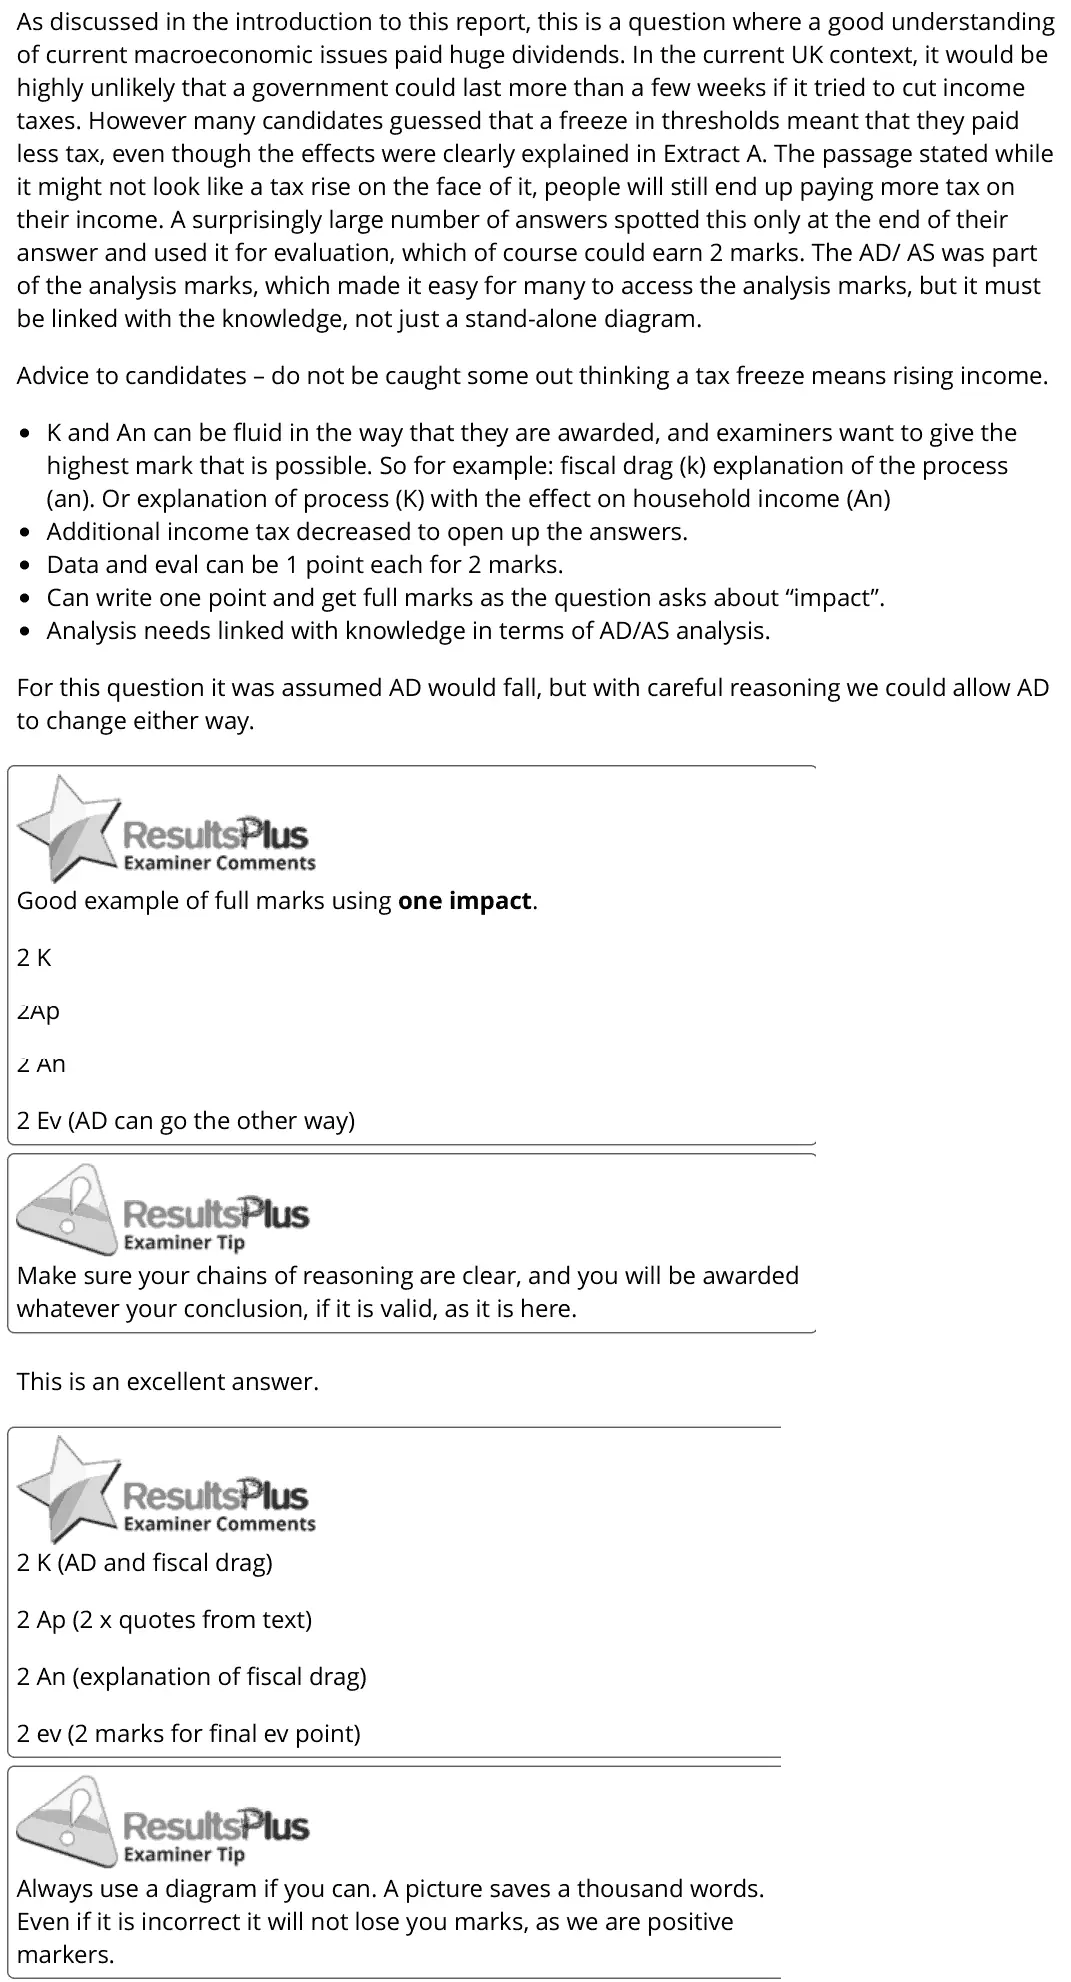
As discussed in the introduction to this report, this is a question where a good understanding of current macroeconomic issues paid huge dividends. In the current UK context, it would be highly unlikely that a government could last more than a few weeks if it tried to cut income taxes. However many candidates guessed that a freeze in thresholds meant that they paid less tax, even though the effects were clearly explained in Extract A. The passage stated while it might not look like a tax rise on the face of it, people will still end up paying more tax on their income. A surprisingly large number of answers spotted this only at the end of their answer and used it for evaluation, which of course could earn 2 marks. The AD/ AS was part of the analysis marks, which made it easy for many to access the analysis marks, but it must be linked with the knowledge, not just a stand-alone diagram. Advice to candidates – do not be caught some out thinking a tax freeze means rising income. K and An can be fluid in the way that they are awarded, and examiners want to give the highest mark that is possible. So for example: fiscal drag (k) explanation of the process (an). Or explanation of process (K) with the effect on household income (An) Additional income tax decreased to open up the answers. Data and eval can be 1 point each for 2 marks. Can write one point and get full marks as the question asks about “impact”. Analysis needs linked with knowledge in terms of AD/AS analysis. For this question it was assumed AD would fall, but with careful reasoning we could allow AD to change either way. Good example of full marks using one impact. 2 K 2Ap 2 An 2 Ev (AD can go the other way) Make sure your chains of reasoning are clear, and you will be awarded whatever your conclusion, if it is valid, as it is here. This is an excellent answer. 2 K (AD and fiscal drag) 2 Ap (2 x quotes from text) 2 An (explanation of fiscal drag) 2 ev (2 marks for final ev point) Always use a diagram if you can. A picture saves a thousand words. Even if it is incorrect it will not lose you marks, as we are positive markers.
Notes from the mark scheme and report
frozen thresholds mean fiscal drag: more income taxed and at higher bands, lower disposable income, consumption and AD
quote £150 000 to £125 140 and the extra £1 200
report: many wrongly assumed the freeze meant paying less tax
Quantitative skills: QS 9 (interpret, apply and analyse information in written, graphical tabular and numerical forms)
June 2024 · Paper 3 · Q2(c)12 marksAO1=2, AO2=2, AO3=4, AO4=412-mark response
Data and extracts for question 2
Mark scheme, including the levels grid and indicative content
Examiner's comment
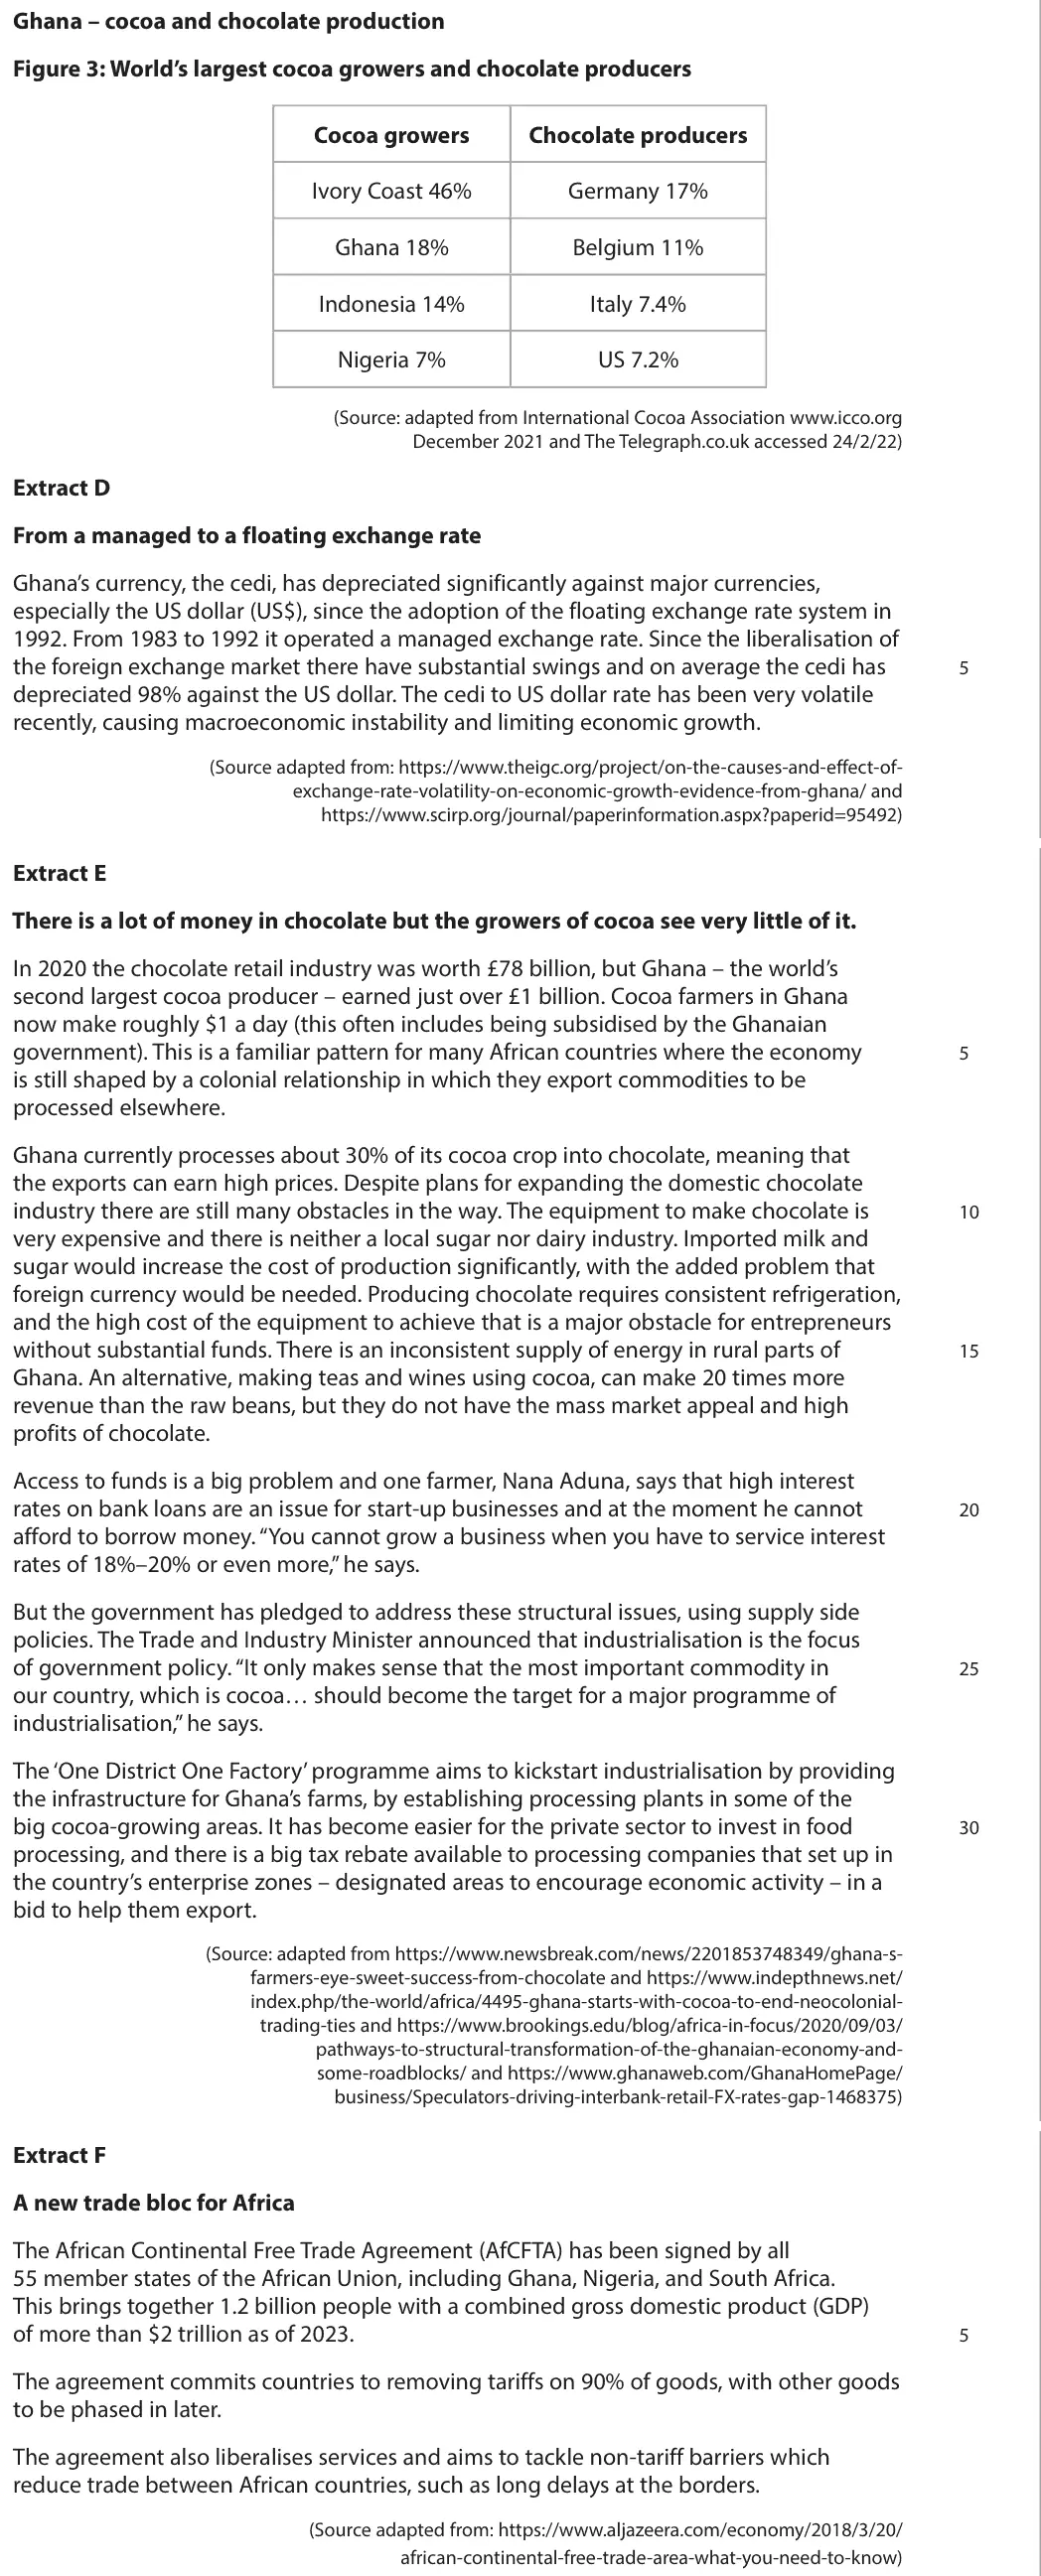
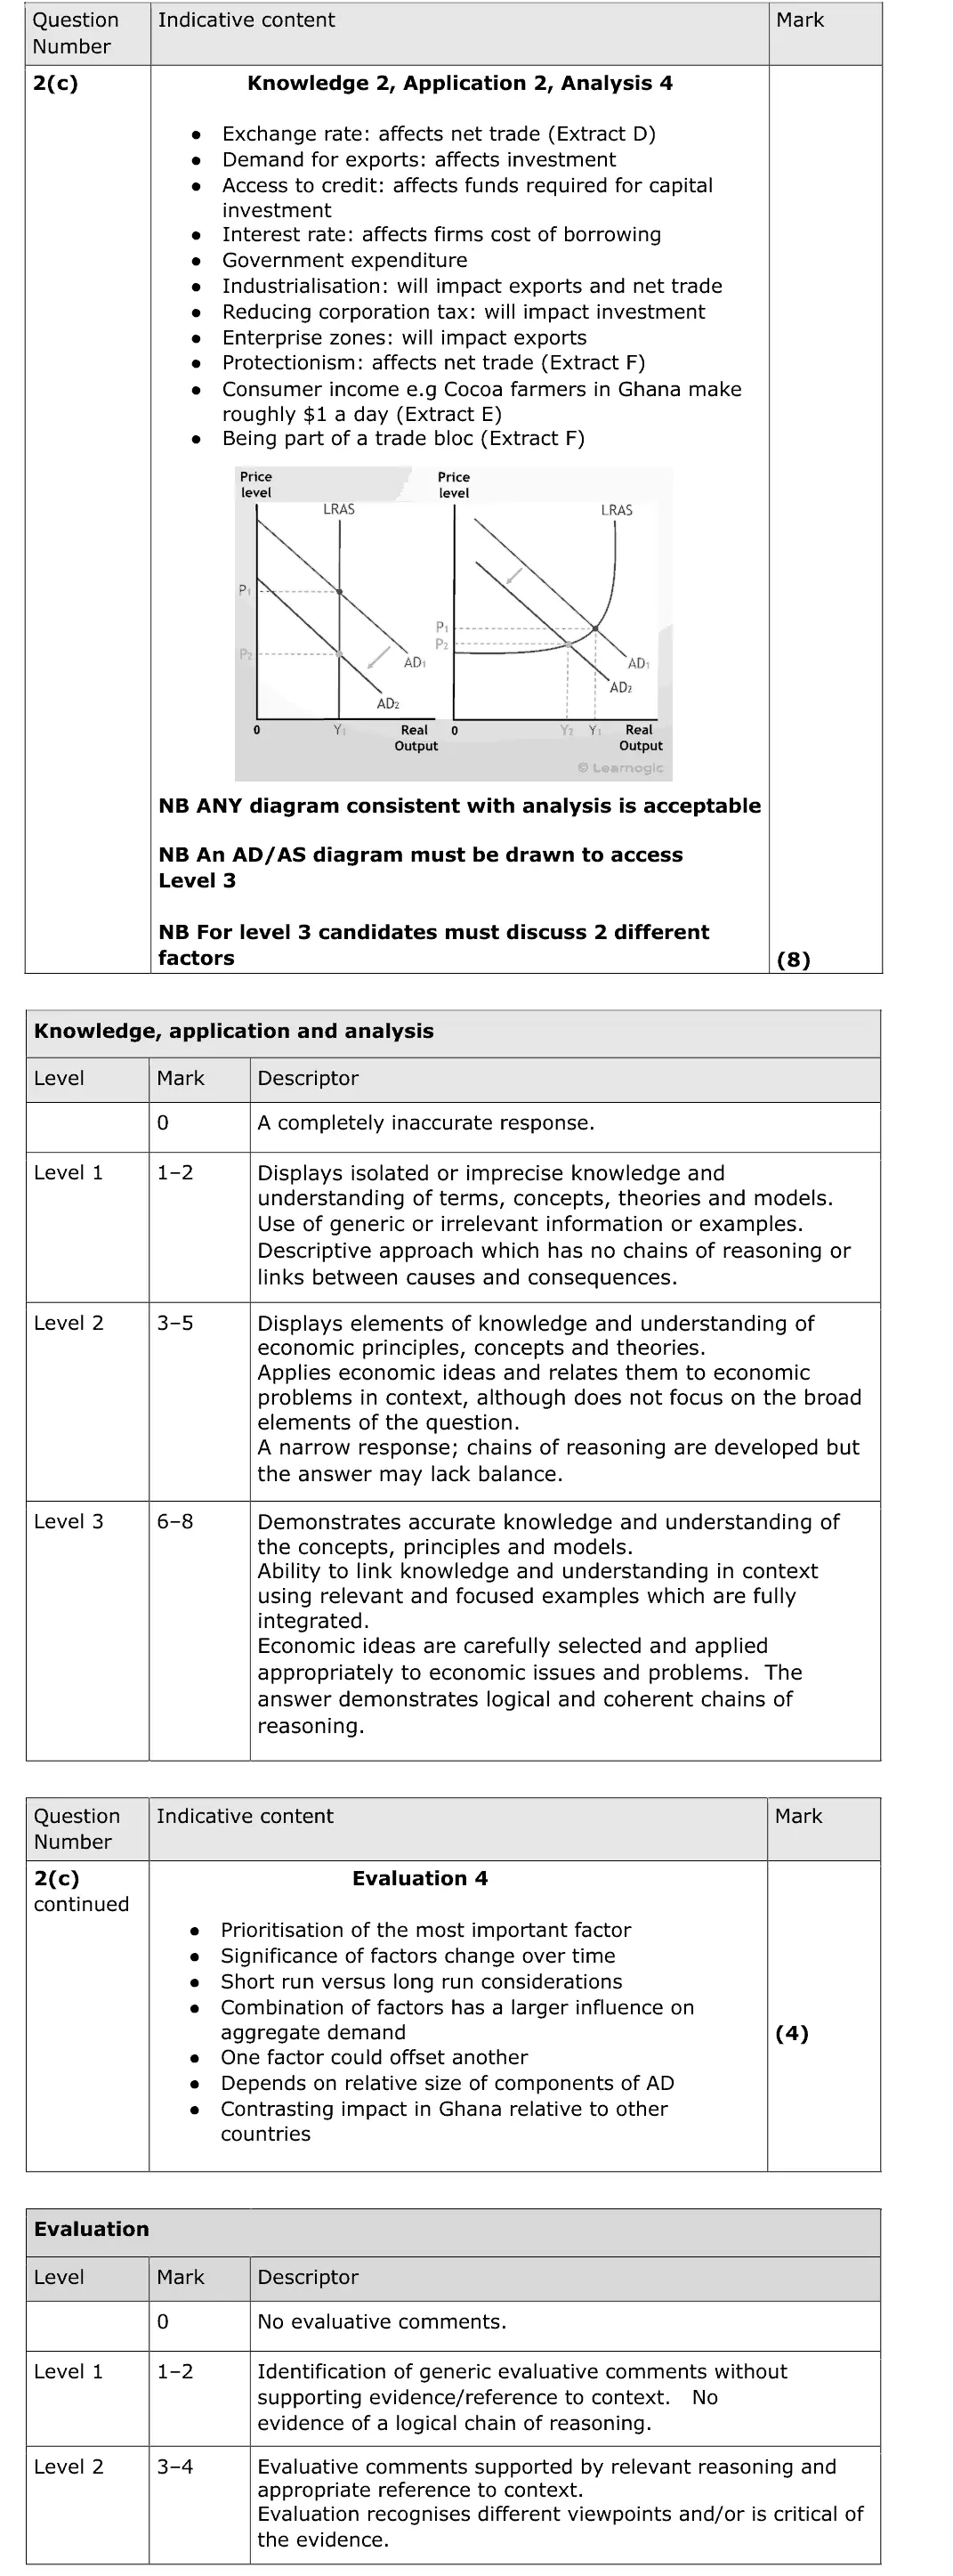
This question asks candidates to discuss factors influencing the level of aggregate demand in Ghana and specifies that they draw an AD/AS diagram. If a candidate does not drawa diagram, they are unable to achieve level 3 for KAA. Any AD/AS diagram is acceptable. The route that many candidates took on this question was to consider the aggregate demand formula of C+I+G+(X-M) and discuss two of these, but other factors were also valid. It should be noted that the question is in the plural - it is asking for factorS, and so candidates need to write about two different factors to access KAA level 3. There are four marks for evaluation on this question, so candidates need to ensure they have offered some clear evaluation in their answer, with some development of their point. <p BesultsPtus The first point in this answer is well-argued and includes a correct AD/AS diagram, achieving low KAA level 3. The second point is very brief and doesn't go beyond KAA level 1. Overall therefore, this answer is KAA level 2. There is no evaluation in this answer, so the candidate cannot achieve those four marks. G4, ResultsPius ~~) Examiner Tip There is no need to define things such as aggregate demand ina question like this - just focus on answering the question. KkResultsPlus This is a high quality answer that does an excellent job of answering the question. The first point focusing on removal of tariffs through joining the AfCFTA is really nicely explained with good step-by-step explanation, along with application such as the 90% reduction in tariffs as well as an accurate AD/AS diagram. This is clearly top level KAA. The evaluation of this point is also clear and well-argued. The second KAA point, focusing on the depreciation of the cedi, again is clearly applied to Ghana by referencing the 98% depreciation. Analysis is clear and well-argued. The evaluation is also relevant and developed. Overall this is a high quality top level answer for both KAA and evaluation. G4, ResultsPius ~~) Examiner Tip Remember to make sure you have two KAA points in a question such as this.
Notes from the mark scheme and report
Level 3 KAA needs an AD/AS diagram and two different factors (exchange rate and net trade, interest rates and access to credit, government spending, tax rebates, AfCFTA)
no need to define AD
evaluate relative size of components, time lags
Quantitative skills: QS 4 (construct and interpret a range of standard graphical forms)
June 2023 · AS Paper 2 · Q4(a)1 markAO1=1Definition
Data and extracts for question 4
Mark scheme
Examiner's comment
This question requires a clear definition of the term investment. Many provided accurate definitions and hence attained the one mark available for this question.
Notes from the mark scheme and report
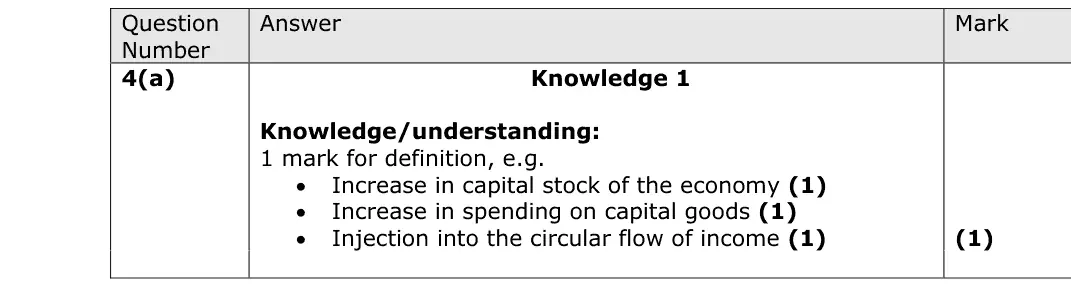
spending on capital goods that adds to the capital stock (an injection into the circular flow)
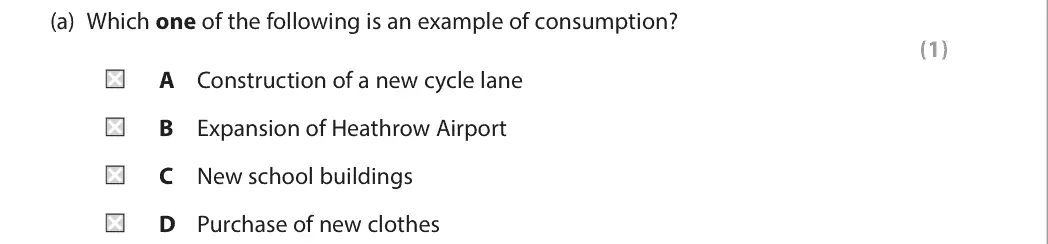
June 2023 · Paper 2 · Q4(a)1 markMultiple choice
Data and extracts for question 4
Answer
D
Mark scheme
Notes from the mark scheme and report
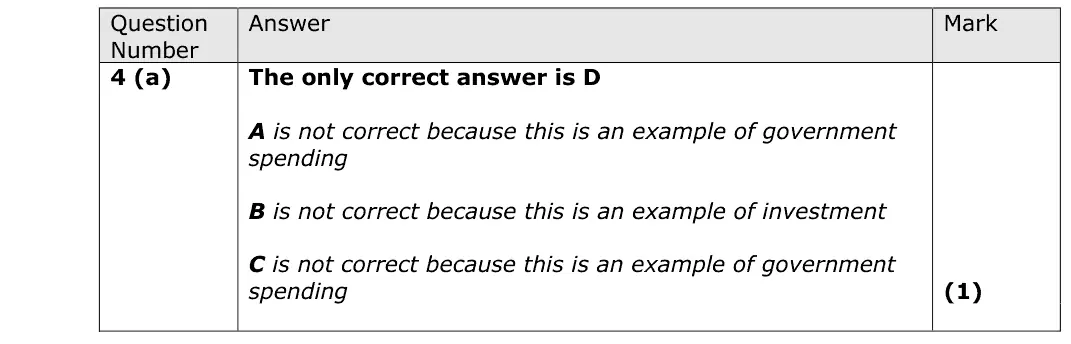
buying new clothes is household consumption (D)
a cycle lane and school buildings are government spending
Heathrow expansion is investment
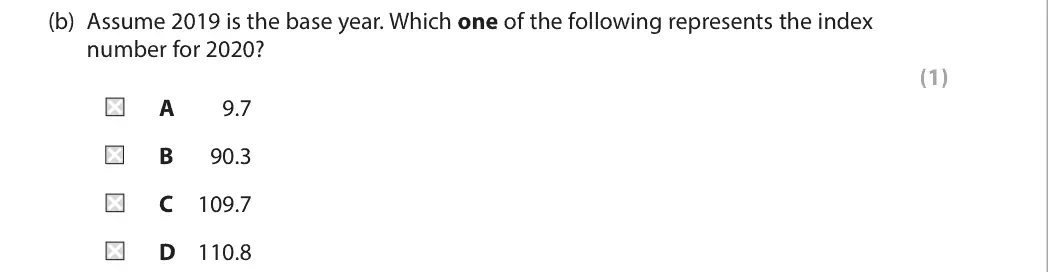
June 2023 · AS Paper 2 · Q4(b)1 markMultiple choice
Data and extracts for question 4
Answer
B
Mark scheme
Notes from the mark scheme and report
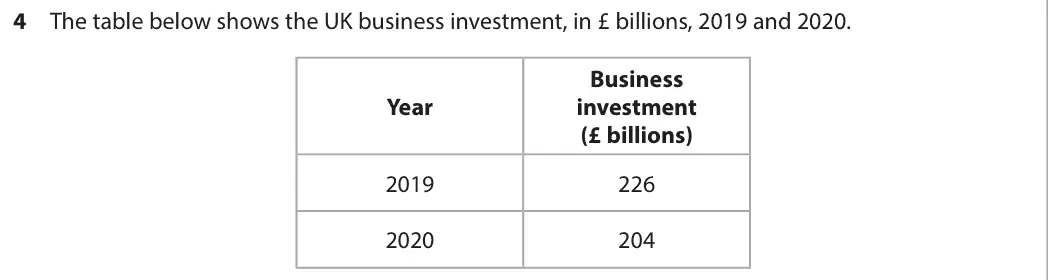
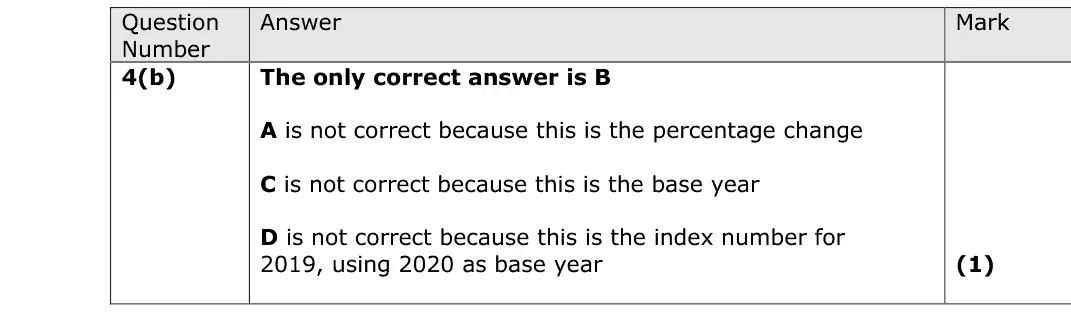
204 / 226 x 100 = 90.3 (B)
A is the percentage change
C is the base year value 100
D uses 2020 as the base
Quantitative skills: QS 5 (calculate and interpret index numbers)
June 2023 · AS Paper 2 · Q4(c)2 marksAO2=2Diagram
Data and extracts for question 4
Mark scheme
Examiner's comment
This question requires candidates to show/draw the likely impact of a fall in business investment in the context of an AD/AS diagram. Marks were awarded as 1 mark for leftward shift in AD/AS and 1 mark for equilibrium showing new price level and new real output. Most candidates achieved the 2 marks on this question.
Notes from the mark scheme and report
lower investment shifts AD left: lower price level and real output at the new equilibrium (a leftward AS shift with higher price was also accepted)
Quantitative skills: QS 4 (construct and interpret a range of standard graphical forms)
June 2023 · AS Paper 2 · Q6(c)10 marksAO1=2, AO2=2, AO3=2, AO4=410-mark response
Data and extracts for question 6
Mark scheme, including the levels grid and indicative content
Examiner's comment
This question required candidates to assess likely impact of a rise in the value of exports on the UK economy. In these longer questions the focus for a candidate needs to be on the quality of their answer, bearing in mind the levels mark scheme. They should ensure they are clearly giving step-by-step explanations of the impact. This would cover the exam skills of knowledge, application, and analysis. There are 4 marks available here for evaluation.
Notes from the mark scheme and report
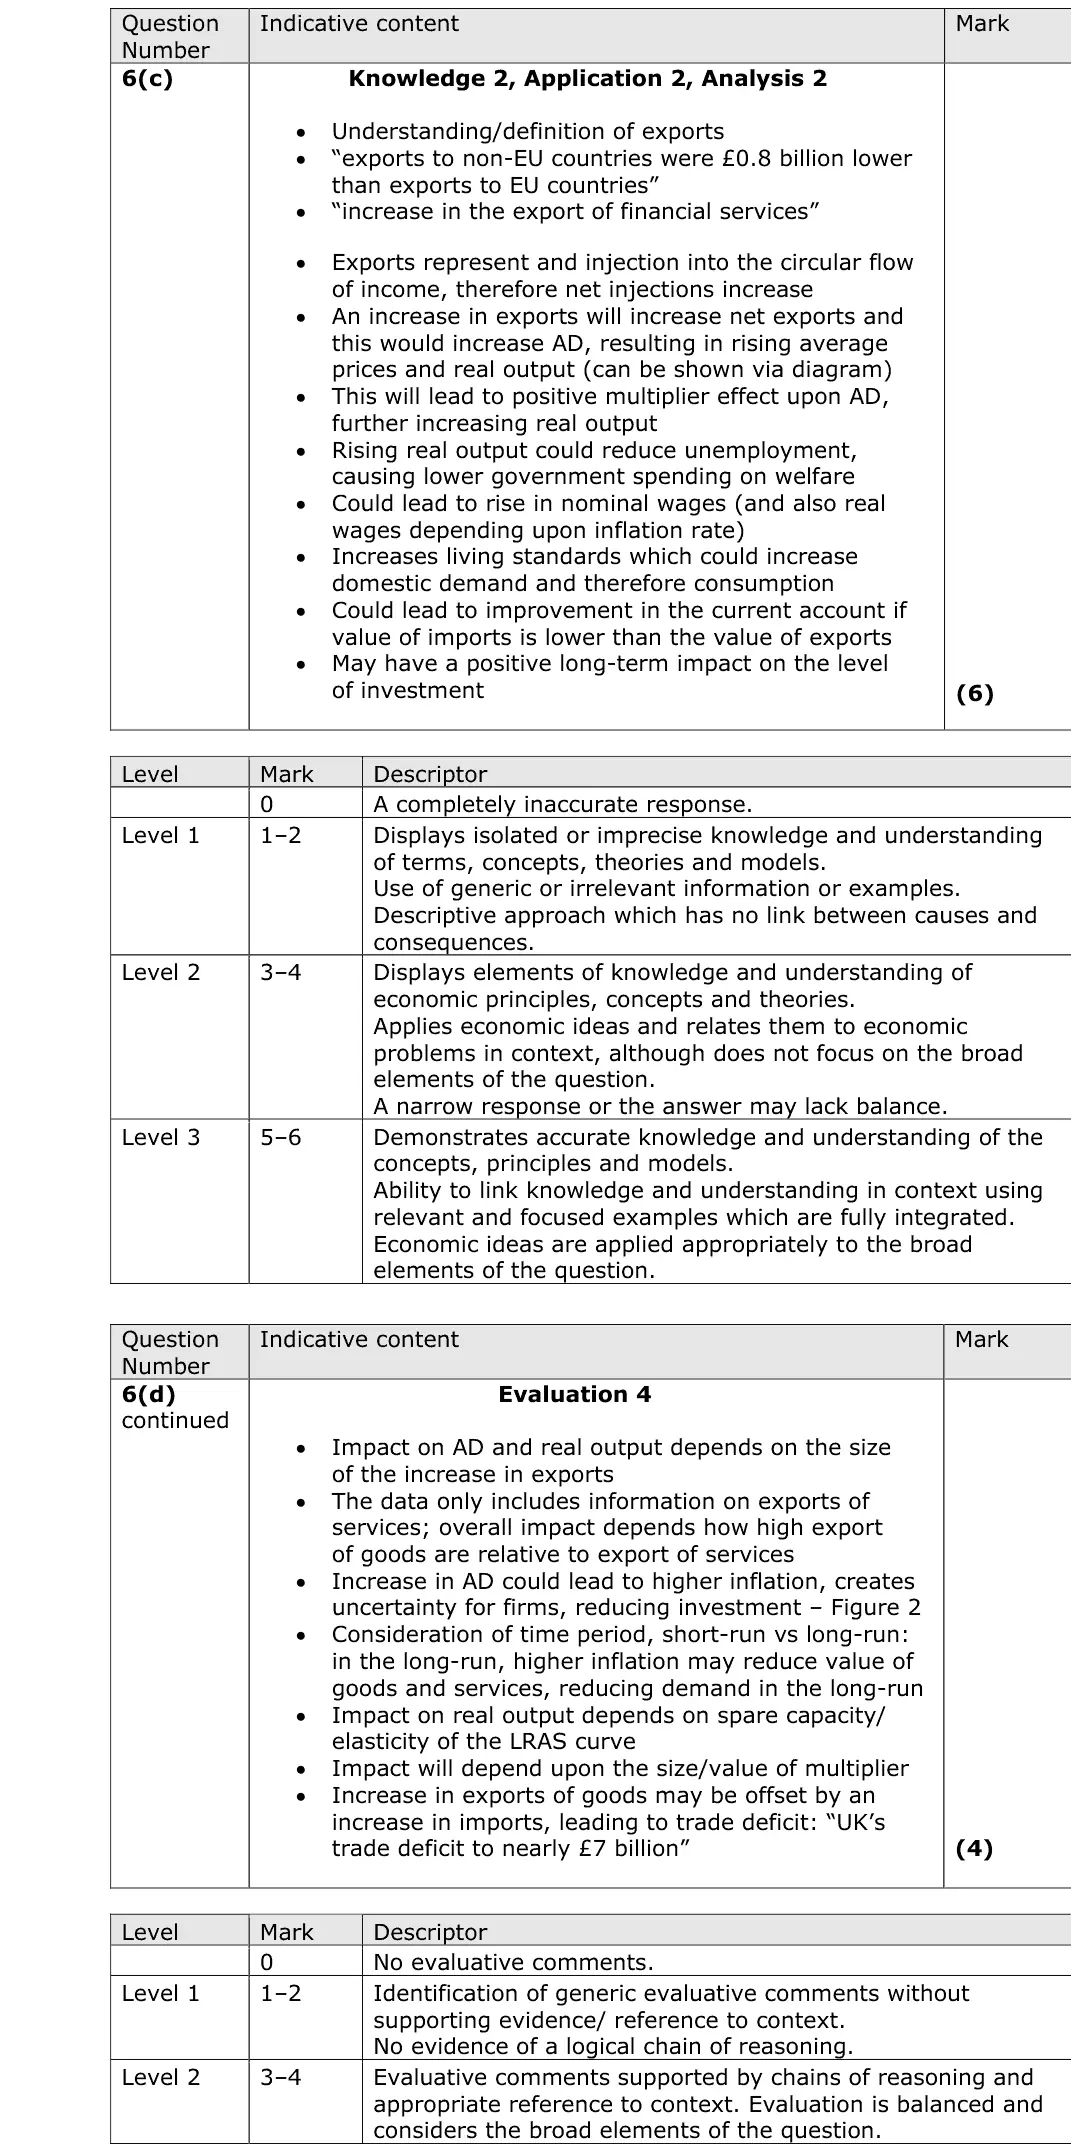
exports are an injection: higher AD, multiplier, real output, employment and current account
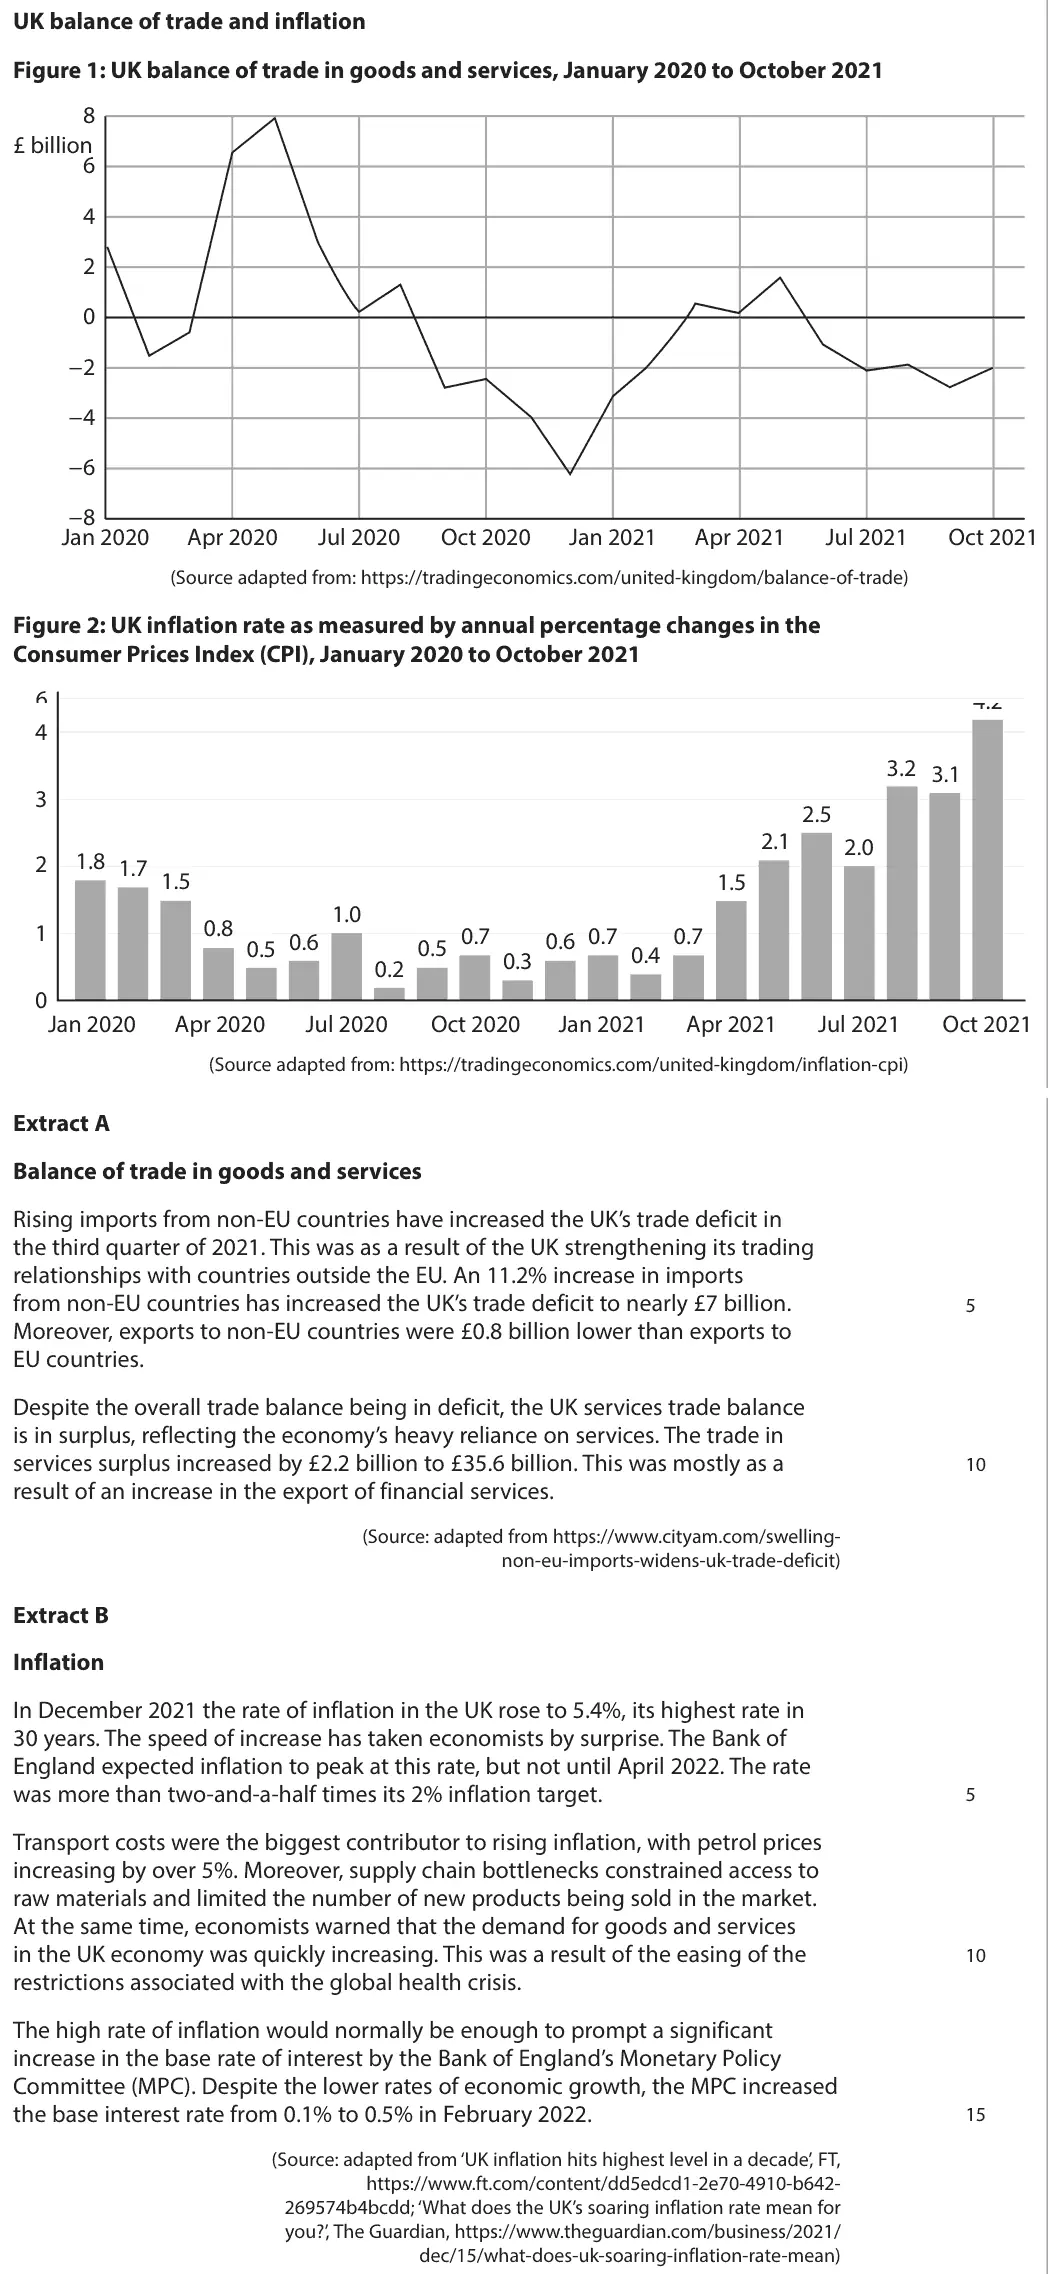
apply Extract A (services surplus £35.6bn, exports to non-EU £0.8bn lower)
evaluate with size of the rise, imports, inflation at full capacity
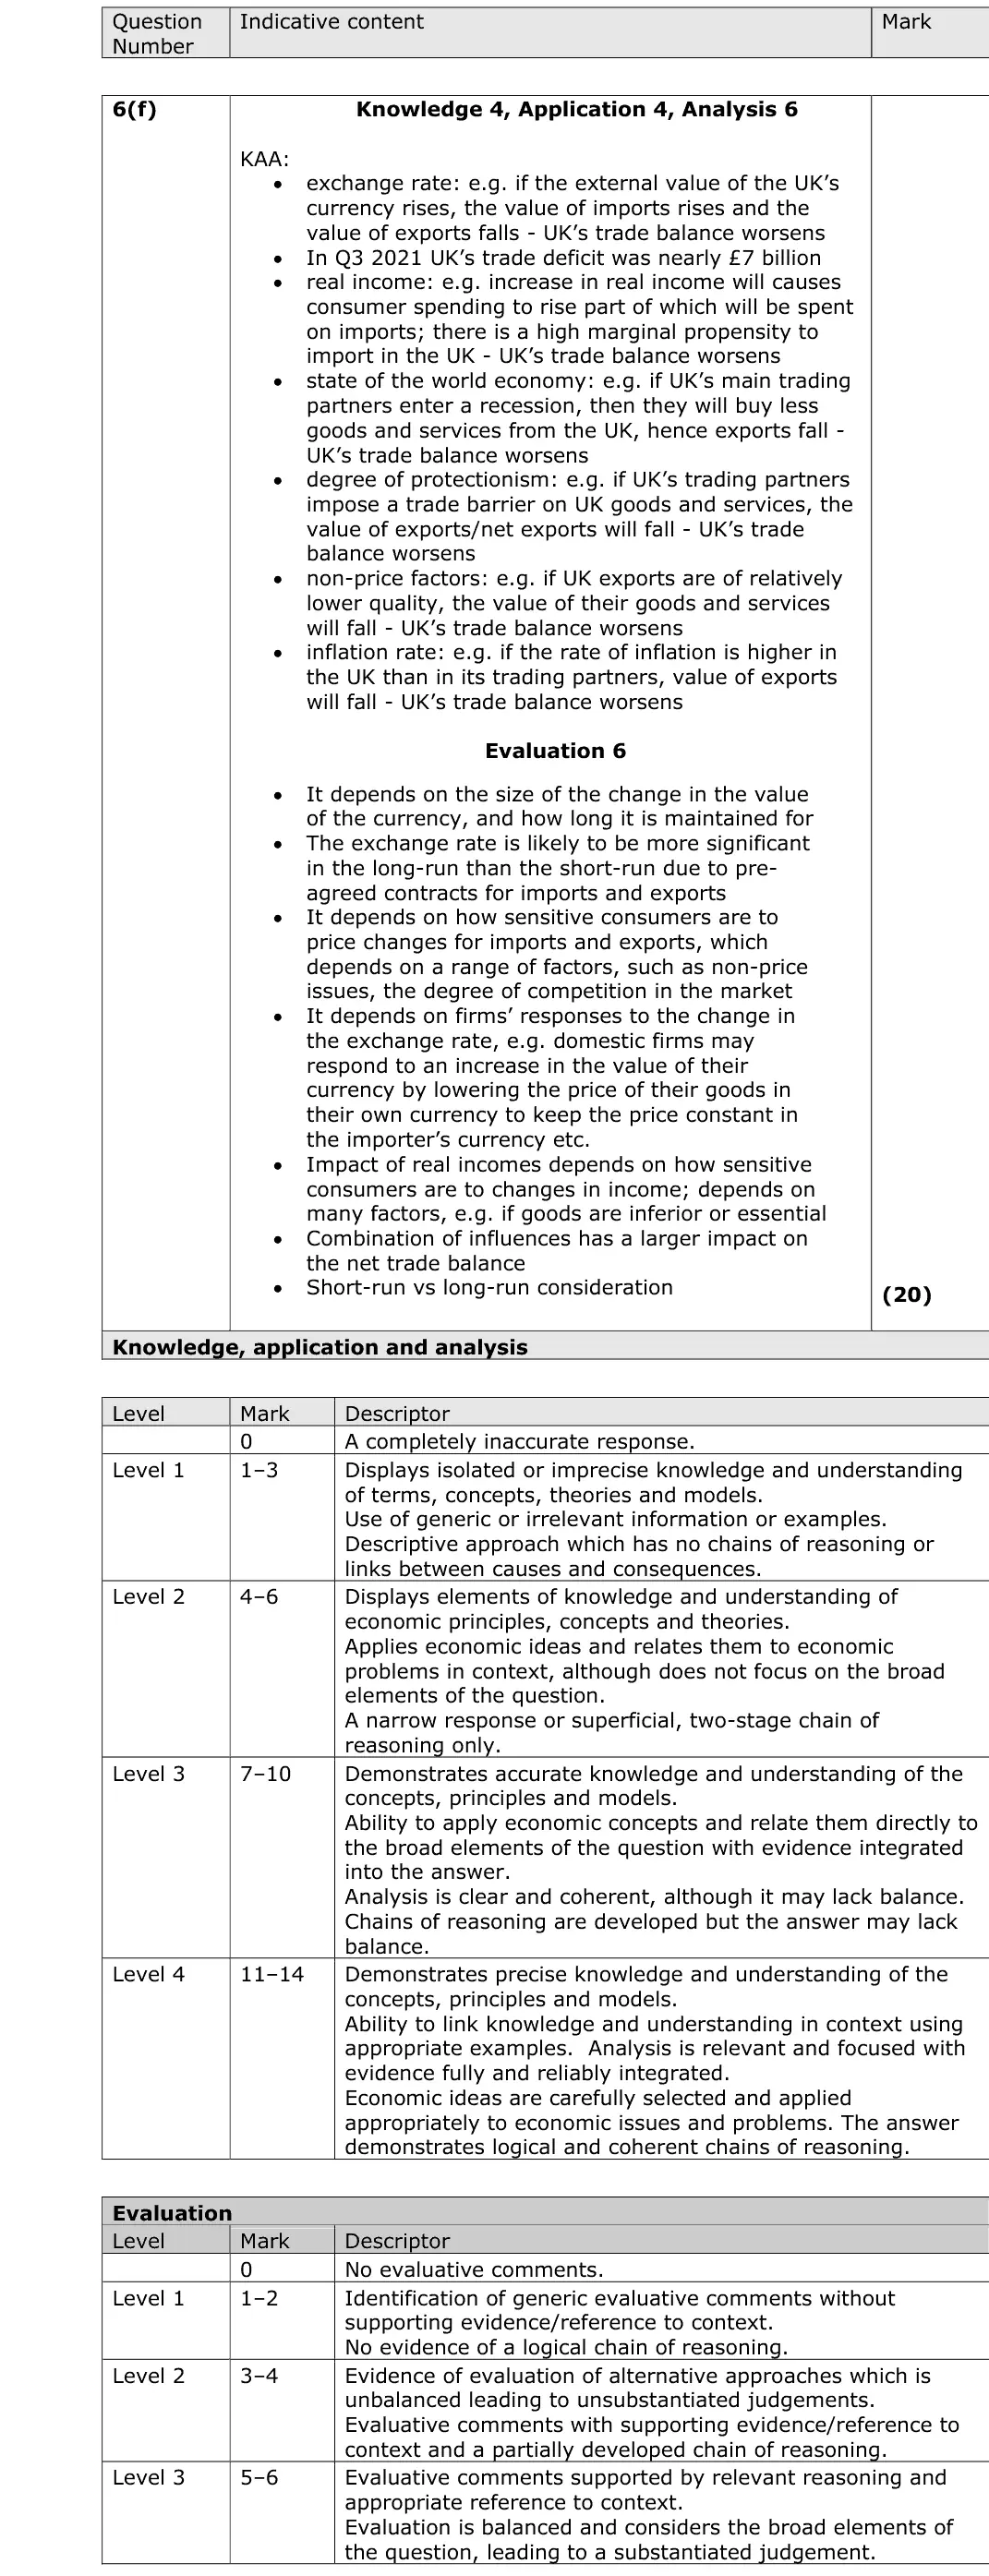
June 2023 · AS Paper 2 · Q6(f)20 marksAO1=4, AO2=4, AO3=6, AO4=620-mark essayEither/orHard
Data and extracts for question 6
Mark scheme, including the levels grid and indicative content
Examiner's comment
This question required candidates to evaluate main influences on the UK’s net trade balance. Many candidates were not able to effectively answer this question and only identified the influences. One of the key issues was that many candidates discussed solutions to solving the net trade balance as evaluation and this was not credited. Those who effectively answered this question explained their arguments in context of recent UK trends.
Notes from the mark scheme and report
influences: exchange rate, real income and high MPM, state of the world economy, protectionism, non-price factors
apply the near £7bn deficit
report: "Many candidates were not able to effectively answer this question and only identified the influences", and solutions to the deficit were not credited as evaluation
Quantitative skills: QS 9 (interpret, apply and analyse information in written, graphical tabular and numerical forms)
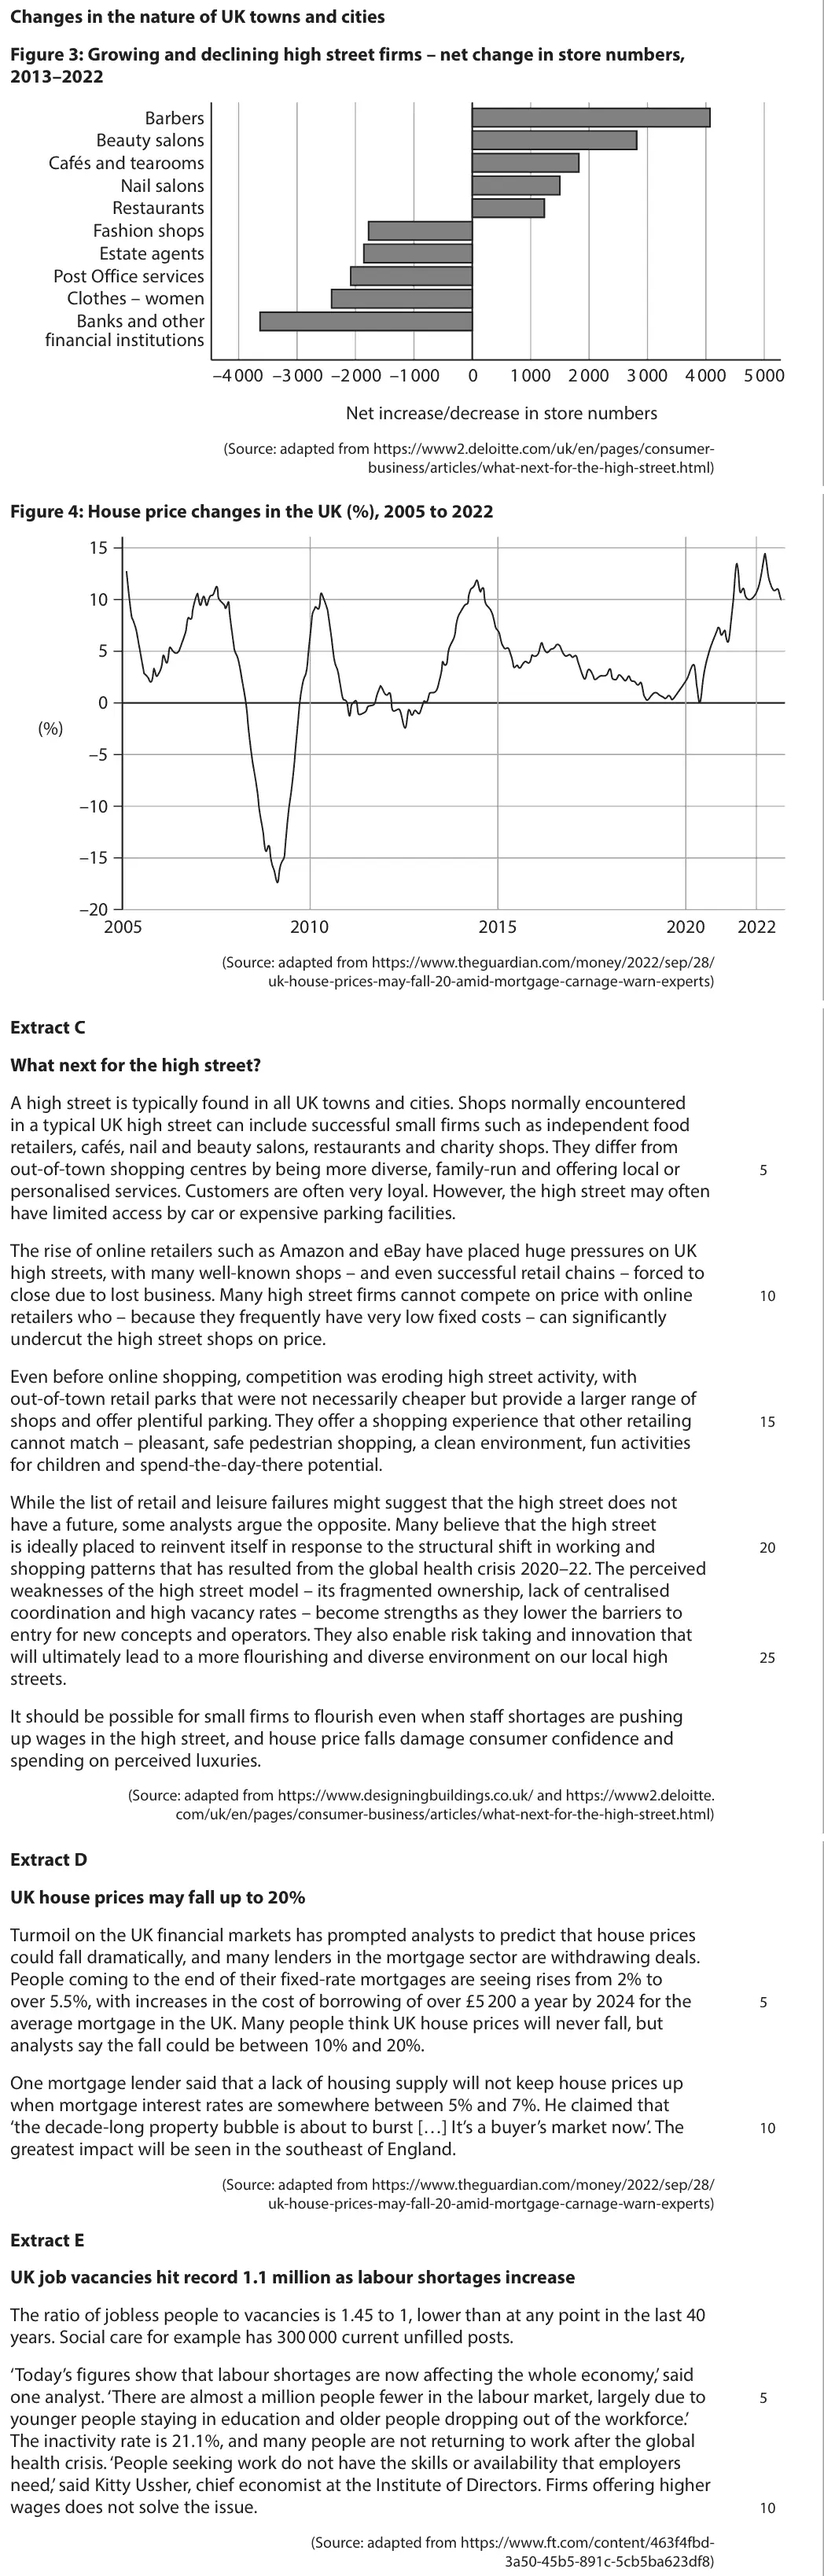
June 2023 · Paper 3 · Q2(d)25 marksAO1=4, AO2=4, AO3=8, AO4=925-mark essayEither/orHard
Data and extracts for question 2
Mark scheme, including the levels grid and indicative content
Examiner's comment
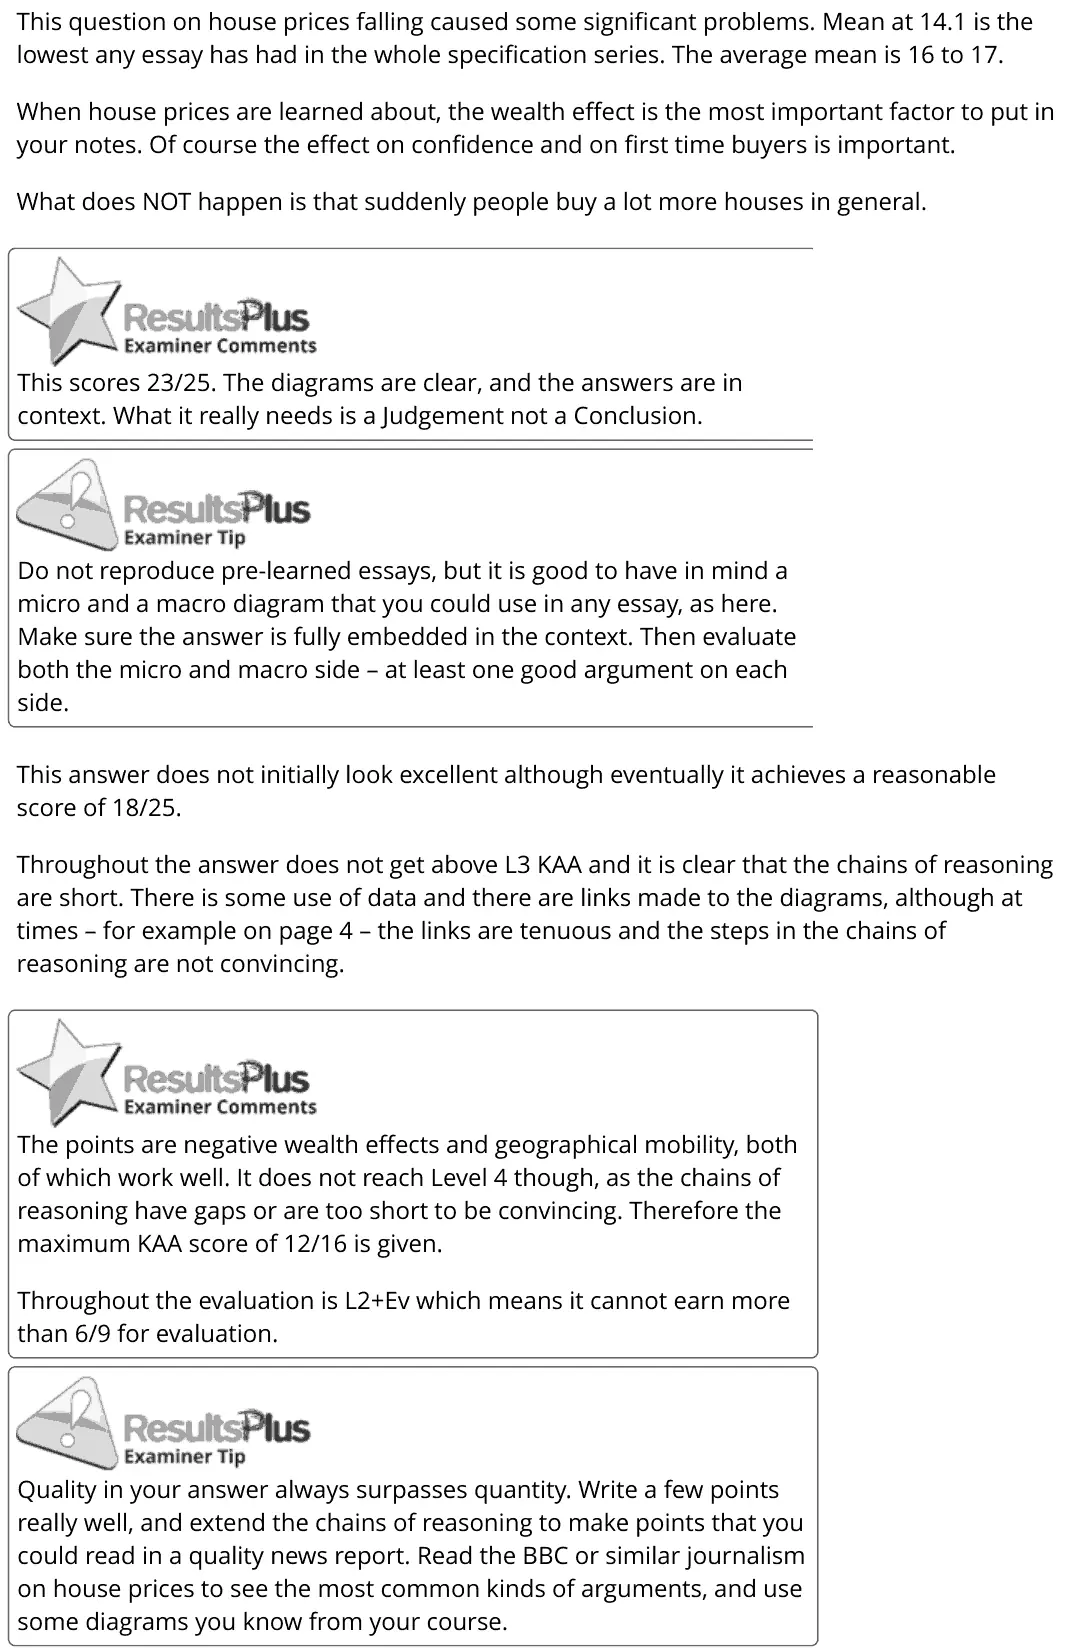
This question on house prices falling caused some significant problems. Mean at 14.1 is the lowest any essay has had in the whole specification series. The average mean is 16 to 17. When house prices are learned about, the wealth effect is the most important factor to put in your notes. Of course the effect on confidence and on first time buyers is important. What does NOT happen is that suddenly people buy a lot more houses in general. This scores 23/25. The diagrams are clear, and the answers are in context. What it really needs is a Judgement not a Conclusion. Do not reproduce pre-learned essays, but it is good to have in mind a micro and a macro diagram that you could use in any essay, as here. Make sure the answer is fully embedded in the context. Then evaluate both the micro and macro side – at least one good argument on each side. This answer does not initially look excellent although eventually it achieves a reasonable score of 18/25. Throughout the answer does not get above L3 KAA and it is clear that the chains of reasoning are short. There is some use of data and there are links made to the diagrams, although at times – for example on page 4 – the links are tenuous and the steps in the chains of reasoning are not convincing. The points are negative wealth effects and geographical mobility, both of which work well. It does not reach Level 4 though, as the chains of reasoning have gaps or are too short to be convincing. Therefore the maximum KAA score of 12/16 is given. Throughout the evaluation is L2+Ev which means it cannot earn more than 6/9 for evaluation. Quality in your answer always surpasses quantity. Write a few points really well, and extend the chains of reasoning to make points that you could read in a quality news report. Read the BBC or similar journalism on house prices to see the most common kinds of arguments, and use some diagrams you know from your course.
Notes from the mark scheme and report
negative wealth effect on consumption and confidence is the key macro link
micro: builders, estate agents, negative equity and geographical immobility
people do not suddenly buy many more houses
evaluate with size of fall (10% to 20%), regional variation
report: "caused some significant problems. Mean at 14.1 is the lowest any essay has had in the whole specification series"
Quantitative skills: QS 9 (interpret, apply and analyse information in written, graphical tabular and numerical forms)
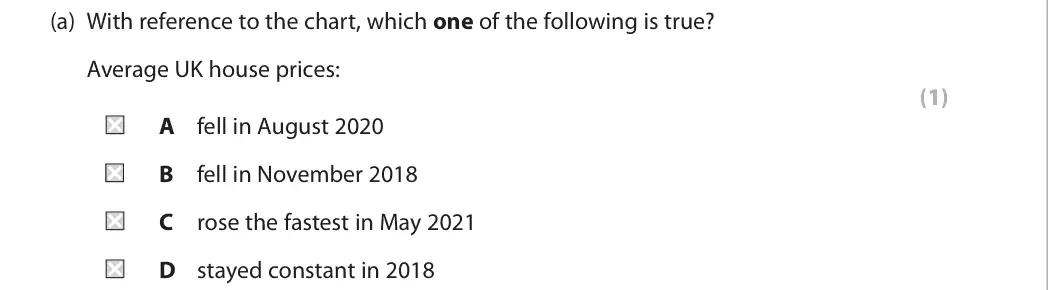
June 2022 · Paper 2 · Q2(a)1 markMultiple choice
Data and extracts for question 2
Answer
C
Mark scheme
Notes from the mark scheme and report
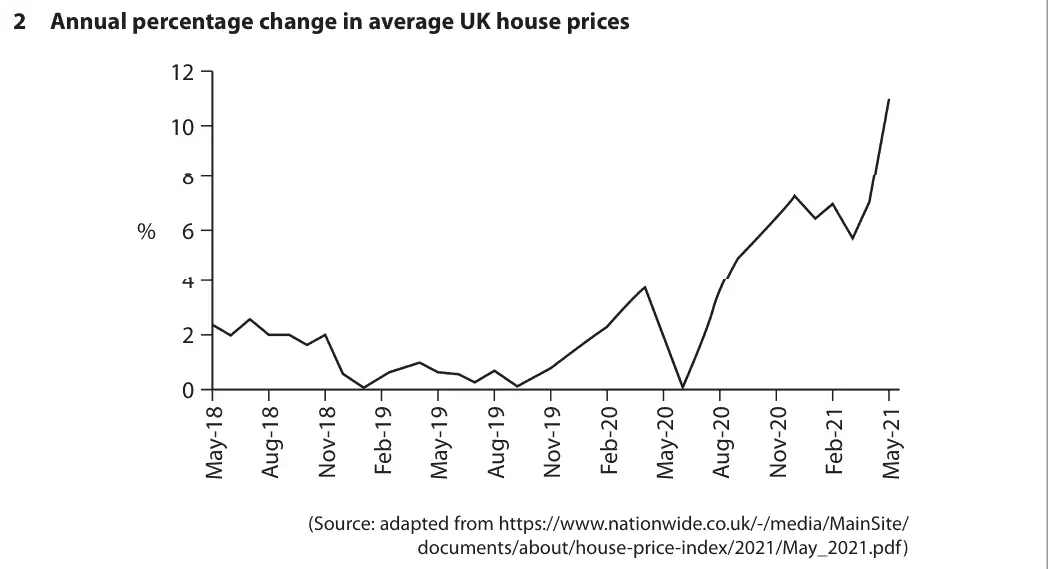
the chart shows the annual % change, so house prices rose fastest where the line is highest, May 2021 (C)
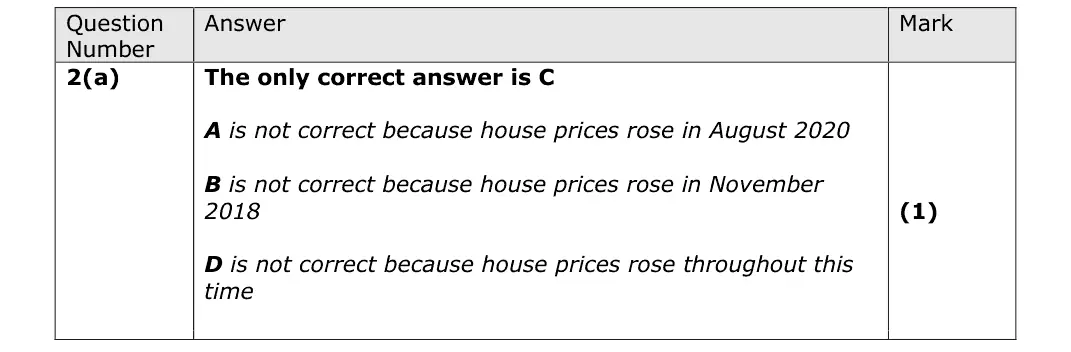
a falling line still means prices rising (A, B wrong) and prices rose throughout 2018 (not D)
Quantitative skills: QS 10 (distinguish between changes in the level of a variable, and the rate of change); QS 9 (interpret, apply and analyse information in written, graphical tabular and numerical forms)
June 2022 · Paper 2 · Q2(b)4 marksAO1=2, AO2=1, AO3=1Short answer
Data and extracts for question 2
Mark scheme
Examiner's comment
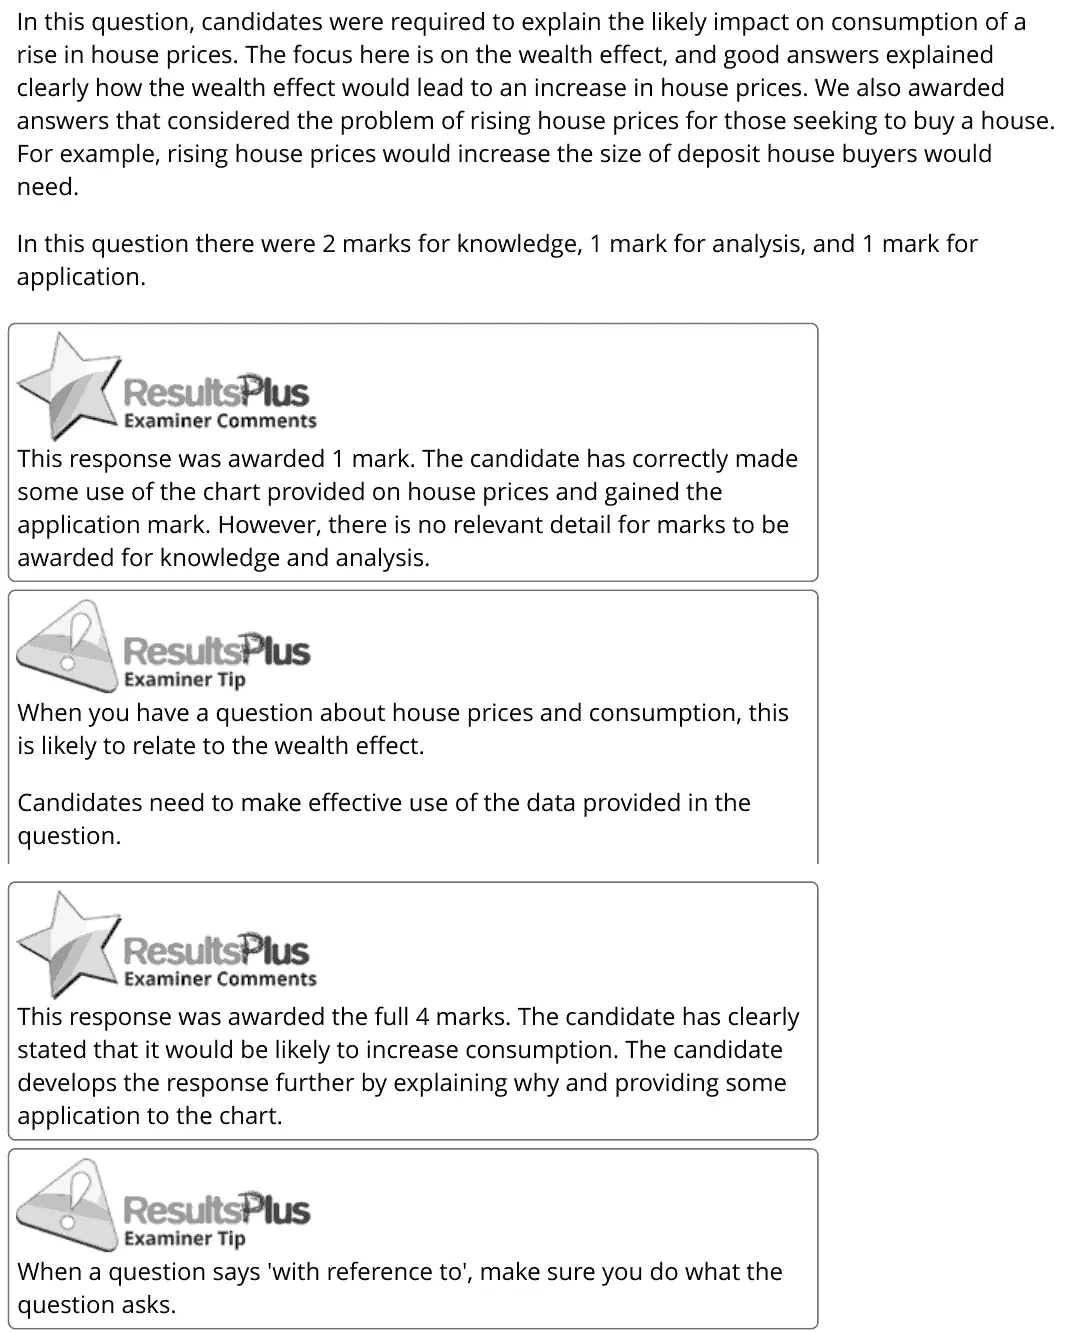
In this question, candidates were required to explain the likely impact on consumption of a rise in house prices. The focus here is on the wealth effect, and good answers explained clearly how the wealth effect would lead to an increase in house prices. We also awarded answers that considered the problem of rising house prices for those seeking to buy a house. For example, rising house prices would increase the size of deposit house buyers would need. In this question there were 2 marks for knowledge, 1 mark for analysis, and 1 mark for application. This response was awarded 1 mark. The candidate has correctly made some use of the chart provided on house prices and gained the application mark. However, there is no relevant detail for marks to be awarded for knowledge and analysis. When you have a question about house prices and consumption, this is likely to relate to the wealth effect. Candidates need to make effective use of the data provided in the question. This response was awarded the full 4 marks. The candidate has clearly stated that it would be likely to increase consumption. The candidate develops the response further by explaining why and providing some application to the chart. When a question says 'with reference to', make sure you do what the question asks.
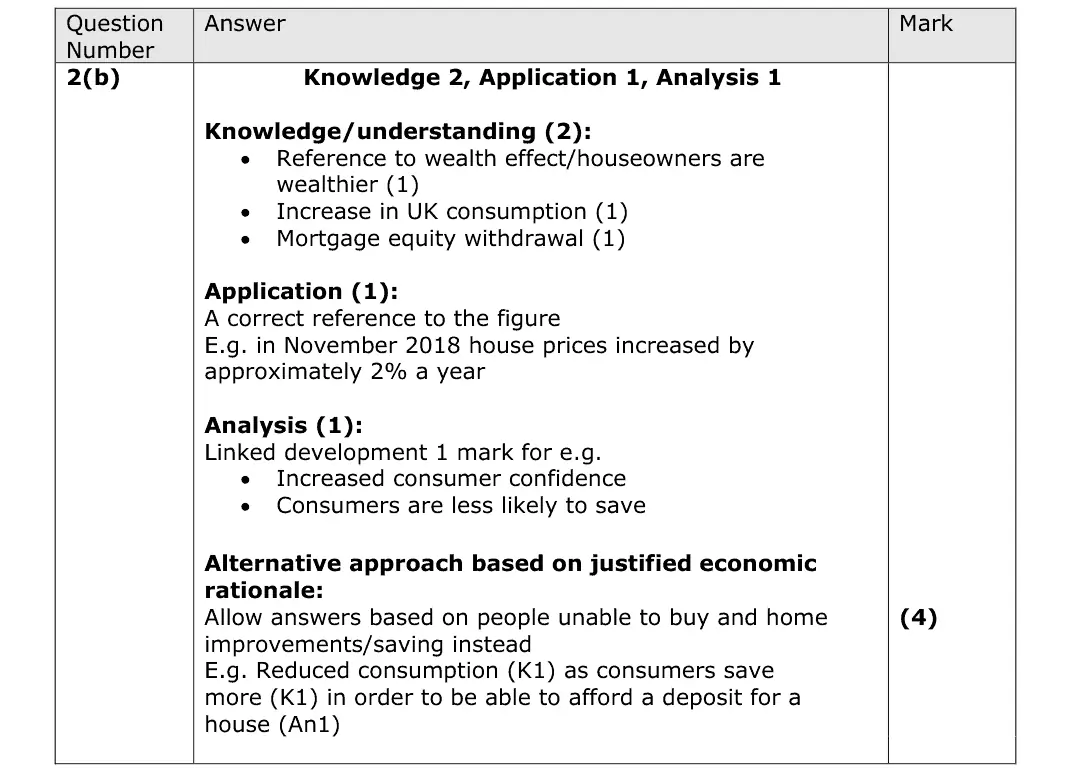
quote the chart (e.g. about 2% a year in November 2018) for the application mark
the alternative argument (buyers save for bigger deposits so consumption falls) is also credited
Quantitative skills: QS 9 (interpret, apply and analyse information in written, graphical tabular and numerical forms)
June 2022 · Paper 2 · Q3(a)4 marksAO1=2, AO2=1, AO3=1Short answer
Data and extracts for question 3
Mark scheme
Examiner's comment
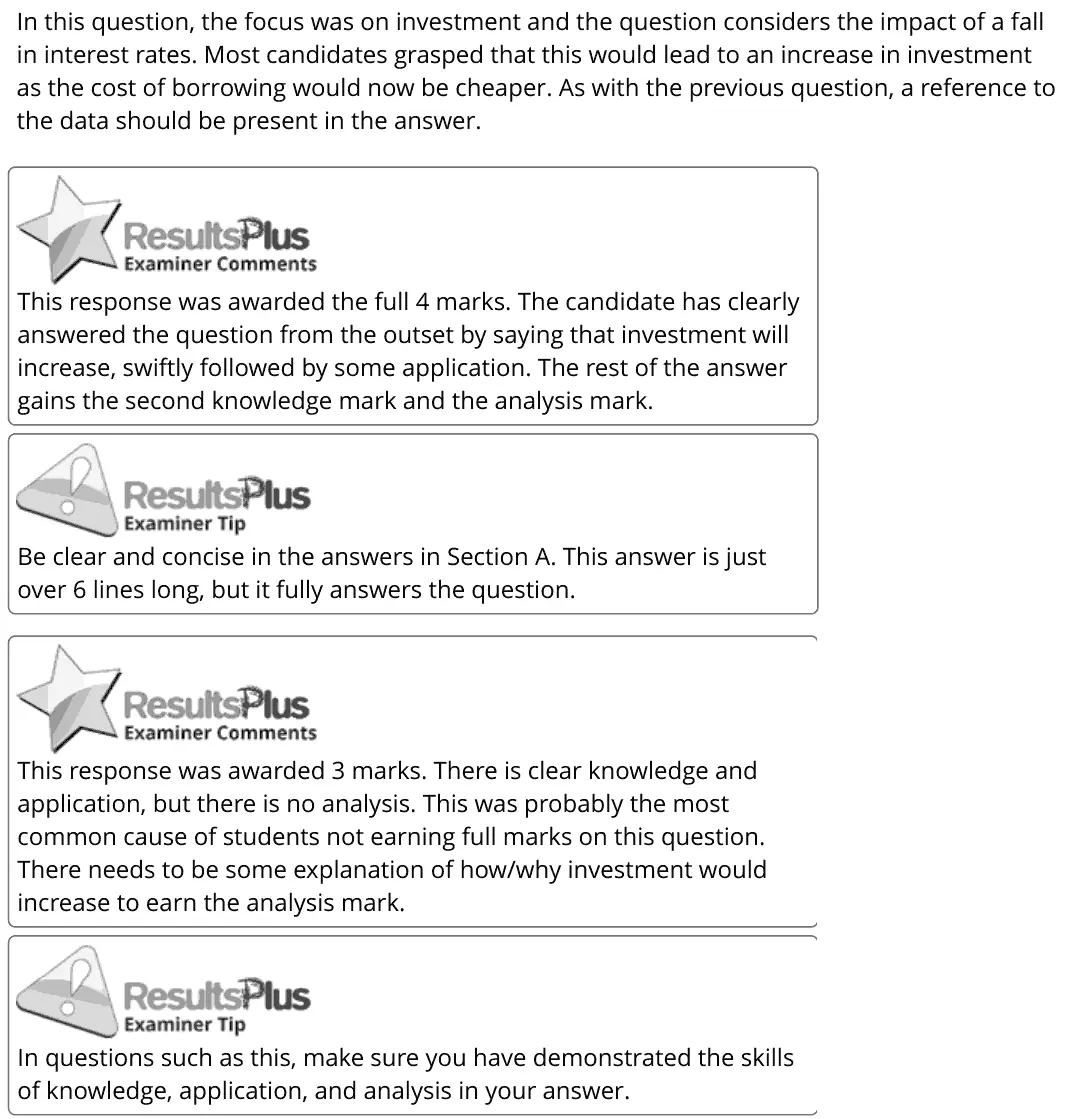
In this question, the focus was on investment and the question considers the impact of a fall in interest rates. Most candidates grasped that this would lead to an increase in investment as the cost of borrowing would now be cheaper. As with the previous question, a reference to the data should be present in the answer. This response was awarded the full 4 marks. The candidate has clearly answered the question from the outset by saying that investment will increase, swiftly followed by some application. The rest of the answer gains the second knowledge mark and the analysis mark. Be clear and concise in the answers in Section A. This answer is just over 6 lines long, but it fully answers the question. This response was awarded 3 marks. There is clear knowledge and application, but there is no analysis. This was probably the most common cause of students not earning full marks on this question. There needs to be some explanation of how/why investment would increase to earn the analysis mark. In questions such as this, make sure you have demonstrated the skills of knowledge, application, and analysis in your answer.
Notes from the mark scheme and report
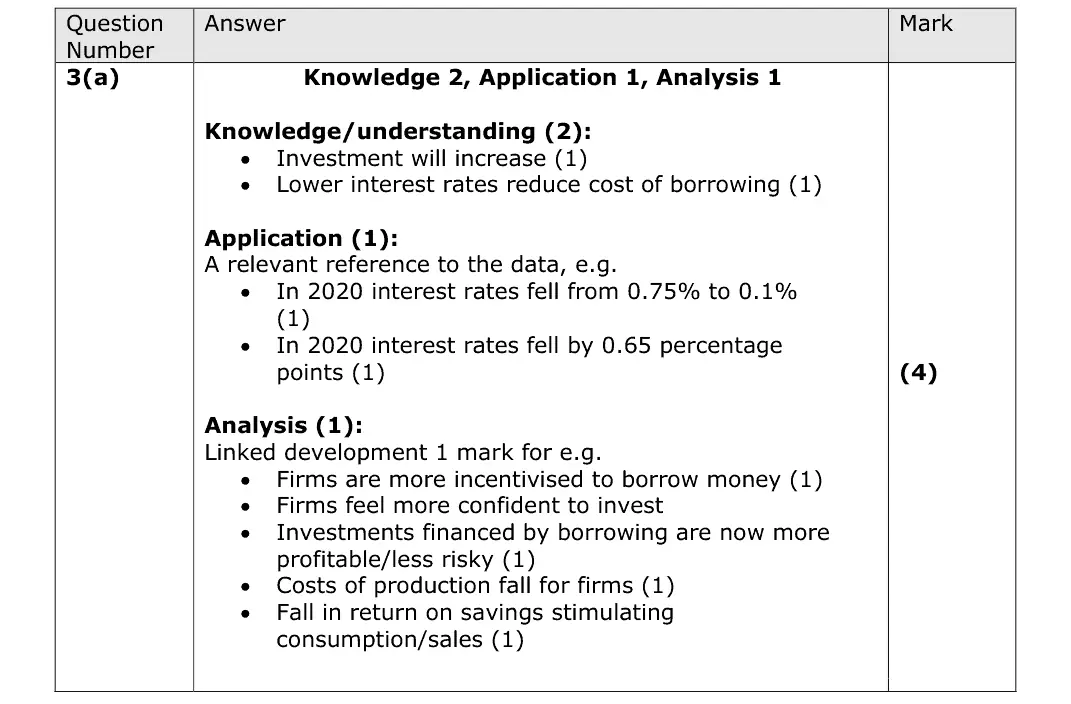
lower cost of borrowing raises investment
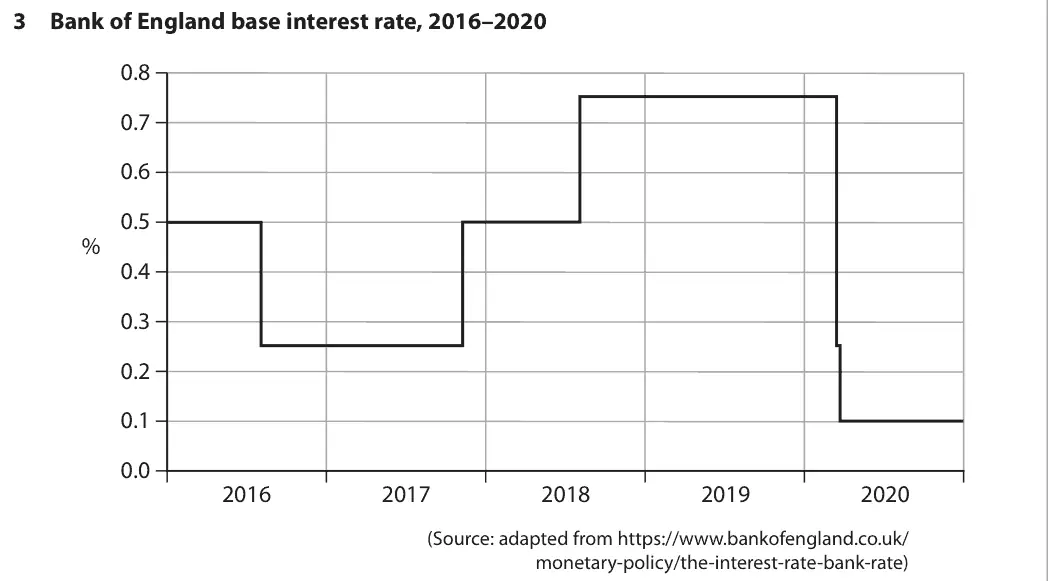
quote the data (fell from 0.75% to 0.1% in 2020, 0.65 percentage points)
most common loss was the analysis mark: explain why investment rises (more profitable, more confidence)
Quantitative skills: QS 9 (interpret, apply and analyse information in written, graphical tabular and numerical forms)
June 2022 · AS Paper 2 · Q4(a)1 markAO1=1DefinitionHard
Data and extracts for question 4
Mark scheme
Examiner's comment
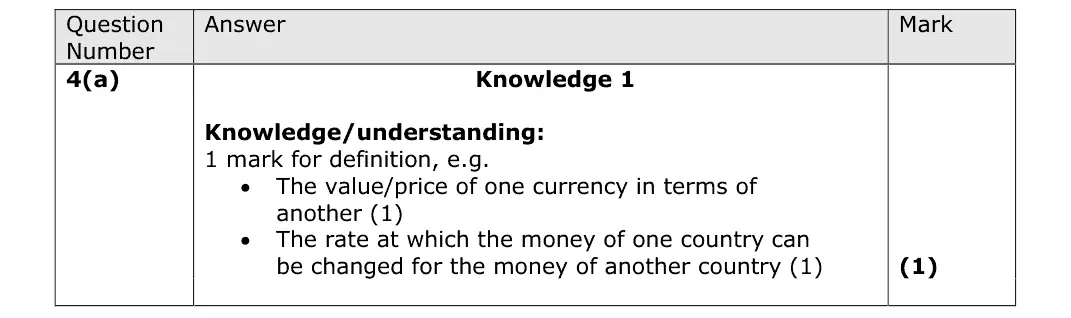
This question requires a clear definition of the term exchange rate. Many were not able to provide an accurate definition and hence did not get the mark for this question.
Notes from the mark scheme and report
the price of one currency in terms of another
report: "Many were not able to provide an accurate definition and hence did not get the mark"
June 2022 · AS Paper 2 · Q4(b)1 markMultiple choice
Data and extracts for question 4
Answer
B
Mark scheme
Notes from the mark scheme and report
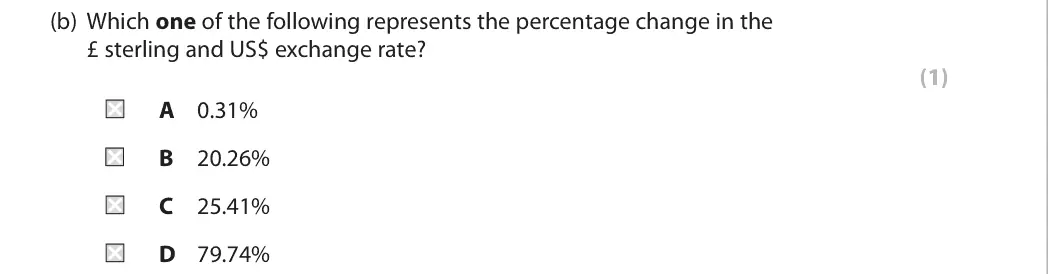
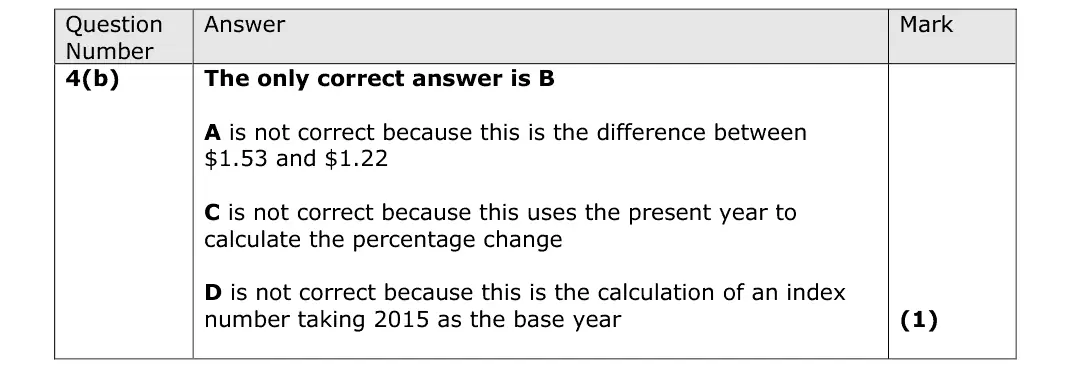
(1.22 - 1.53)/1.53 x 100 = -20.26%, a 20.26% fall (B)
A is the $0.31 difference, C divides by the new value 1.22, D is the index with 2015 = 100
Quantitative skills: QS 2 (calculate, use and understand percentages, percentage changes and percentage point changes)
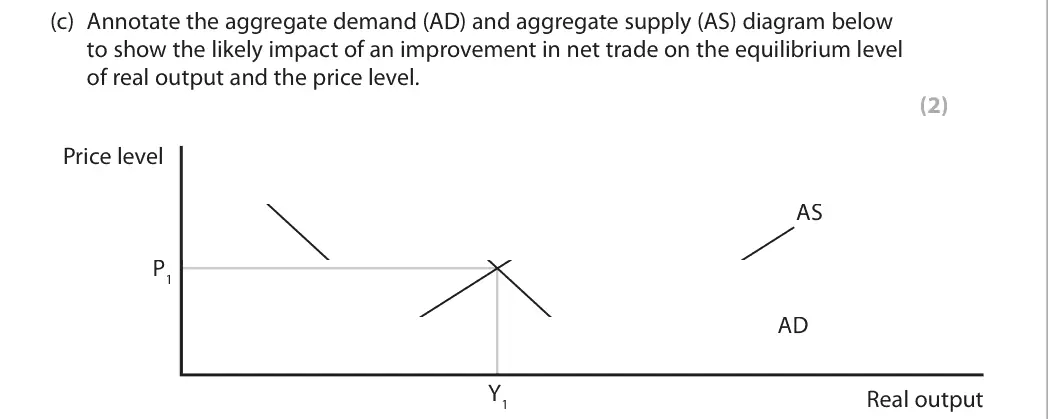
June 2022 · AS Paper 2 · Q4(c)2 marksAO2=2Diagram
Data and extracts for question 4
Mark scheme
Examiner's comment
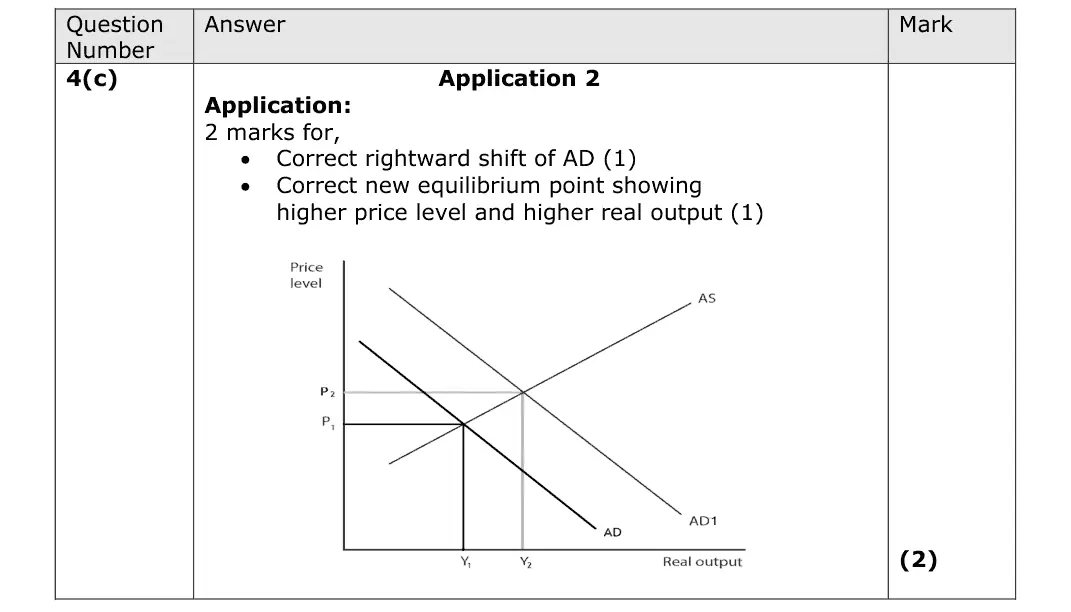
This question requires candidates to show/draw the likely impact of an improvement in net trade in context of an AD/AS diagram. Marks were awarded as 1 mark for rightward shift in AD and 1 mark for a new equilibrium showing higher price level and higher real output. Most candidates achieved the 2 marks on this question.
Notes from the mark scheme and report
improved net trade shifts AD right
mark the new equilibrium with a higher price level and higher real output
Quantitative skills: QS 4 (construct and interpret a range of standard graphical forms)
June 2022 · AS Paper 2 · Q6(a)4 marksAO1=2, AO2=2Short answer
Data and extracts for question 6
Mark scheme
Examiner's comment
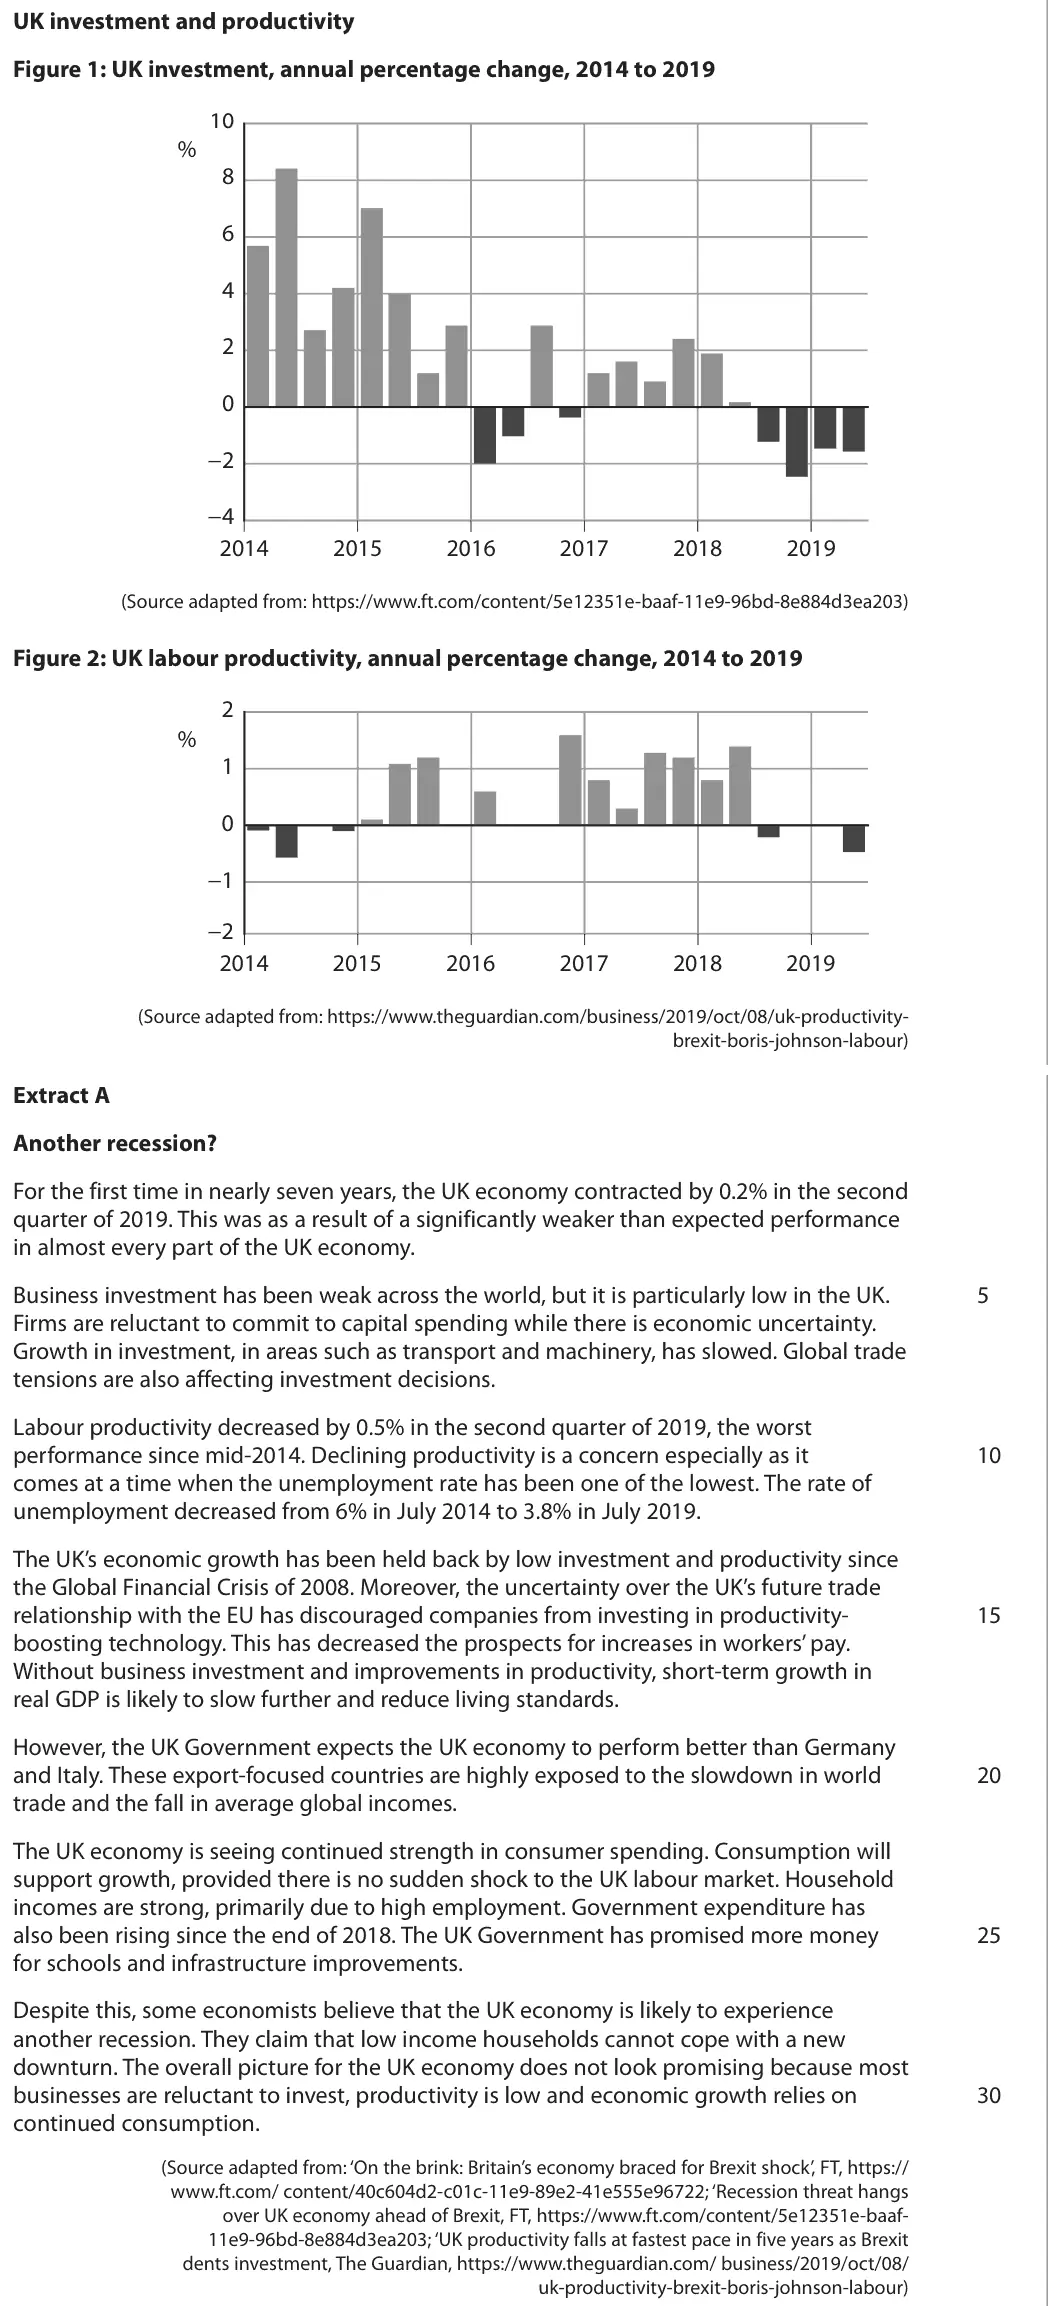
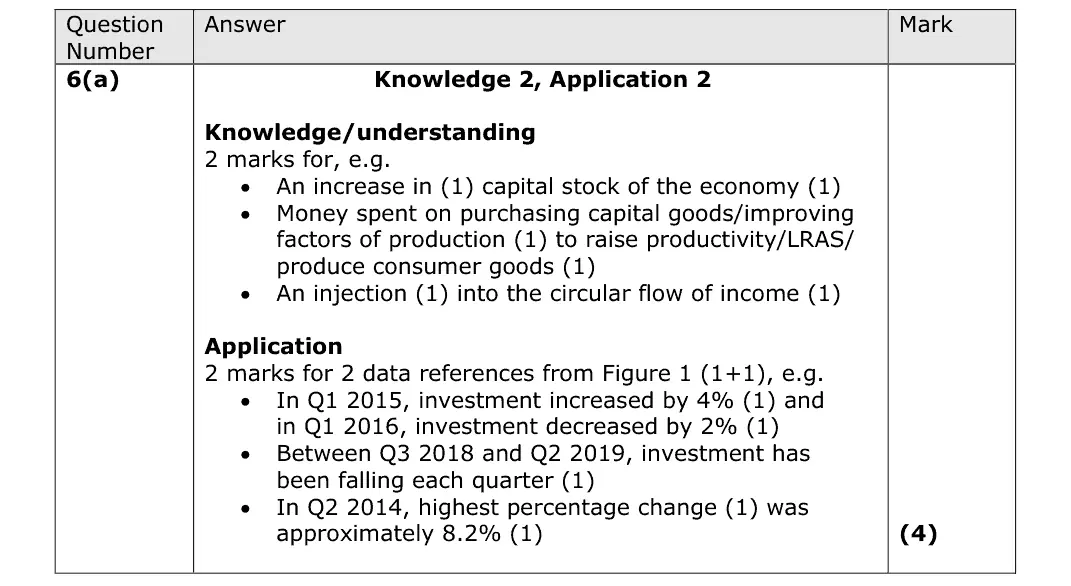
The four marks for this question are split in half between knowledge and application. Candidates achieved 2 marks for explanation of the term investment and 2 marks for relevant application from Figure 1 only.
Notes from the mark scheme and report
spending on capital goods that adds to the capital stock / an injection
two references to Figure 1 (e.g. +4% in Q1 2015, falls from Q3 2018 to Q2 2019)
Quantitative skills: QS 9 (interpret, apply and analyse information in written, graphical tabular and numerical forms)
June 2022 · AS Paper 2 · Q6(b)6 marksAO1=2, AO2=2, AO3=2Short answer
Data and extracts for question 6
Mark scheme
Examiner's comment
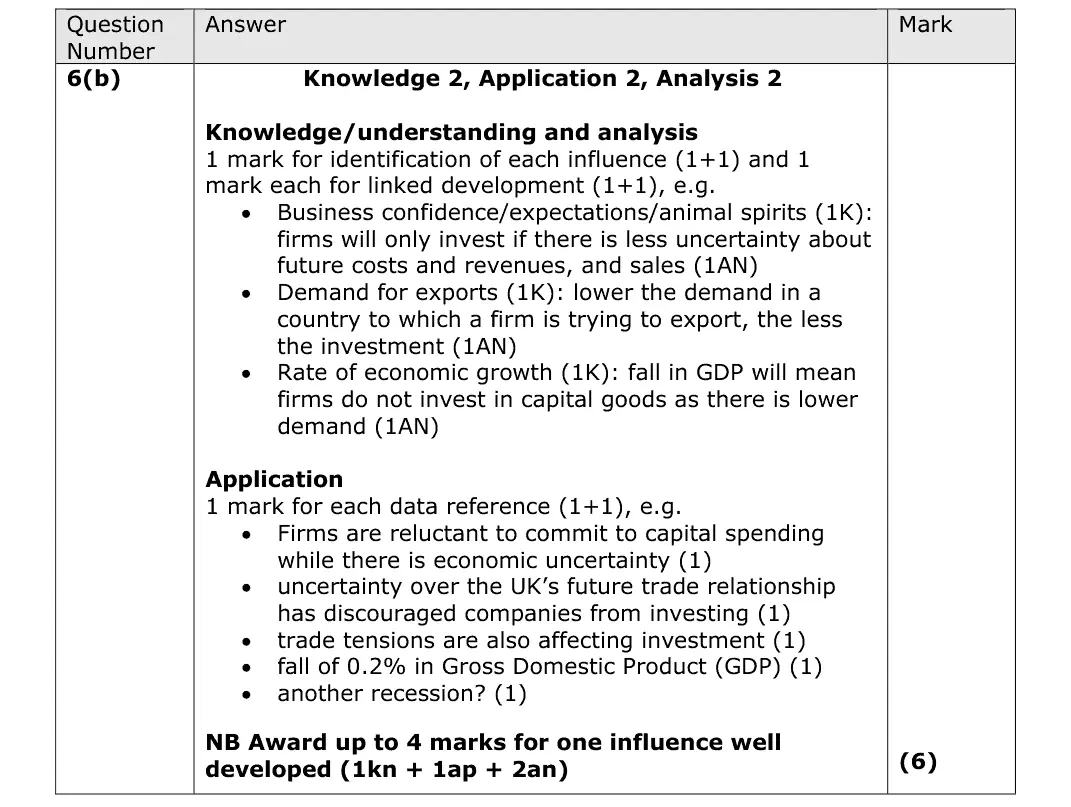
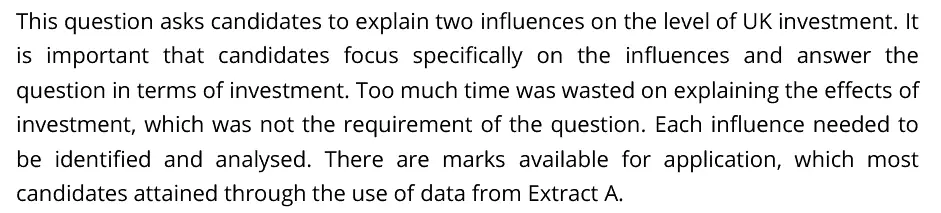
This question asks candidates to explain two influences on the level of UK investment. It is important that candidates focus specifically on the influences and answer the question in terms of investment. Too much time was wasted on explaining the effects of investment, which was not the requirement of the question. Each influence needed to be identified and analysed. There are marks available for application, which most candidates attained through the use of data from Extract A.
Notes from the mark scheme and report
two influences (business confidence/uncertainty and 'animal spirits', demand for exports, economic growth) each developed with Extract A data
explaining the effects of investment instead wasted time
November 2021 · Paper 2 · Q2(c)2 marksAO1=1, AO3=1Short answer
Mark scheme
Notes from the mark scheme and report
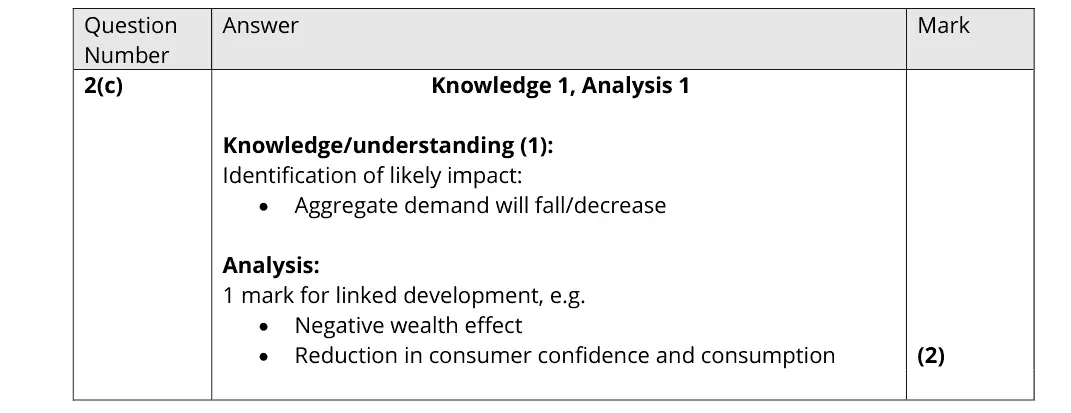
AD falls through the negative wealth effect and lower consumer confidence and consumption
answers about the housing market rather than AD missed marks
October 2020 · AS Paper 2 · Q3(b)3 marksAO1=1, AO2=1, AO3=1Short answer
Data and extracts for question 3
Mark scheme
Notes from the mark scheme and report
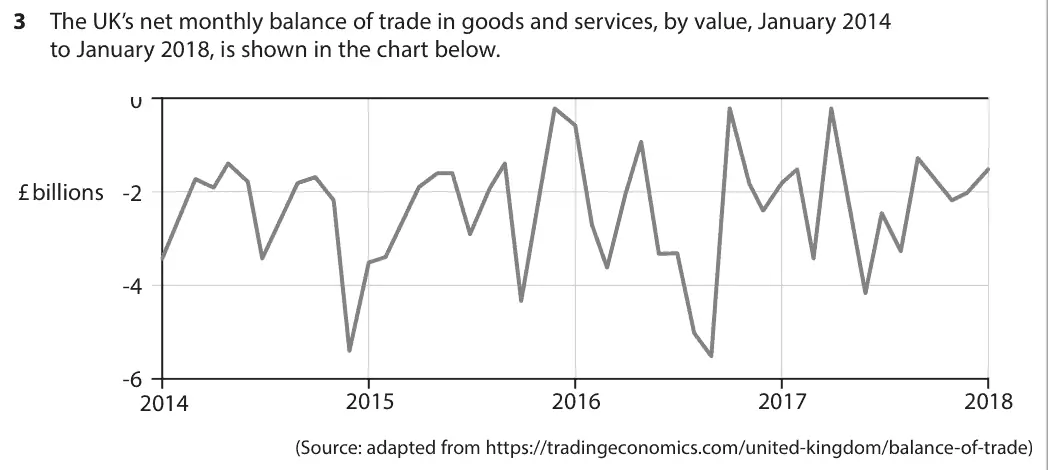
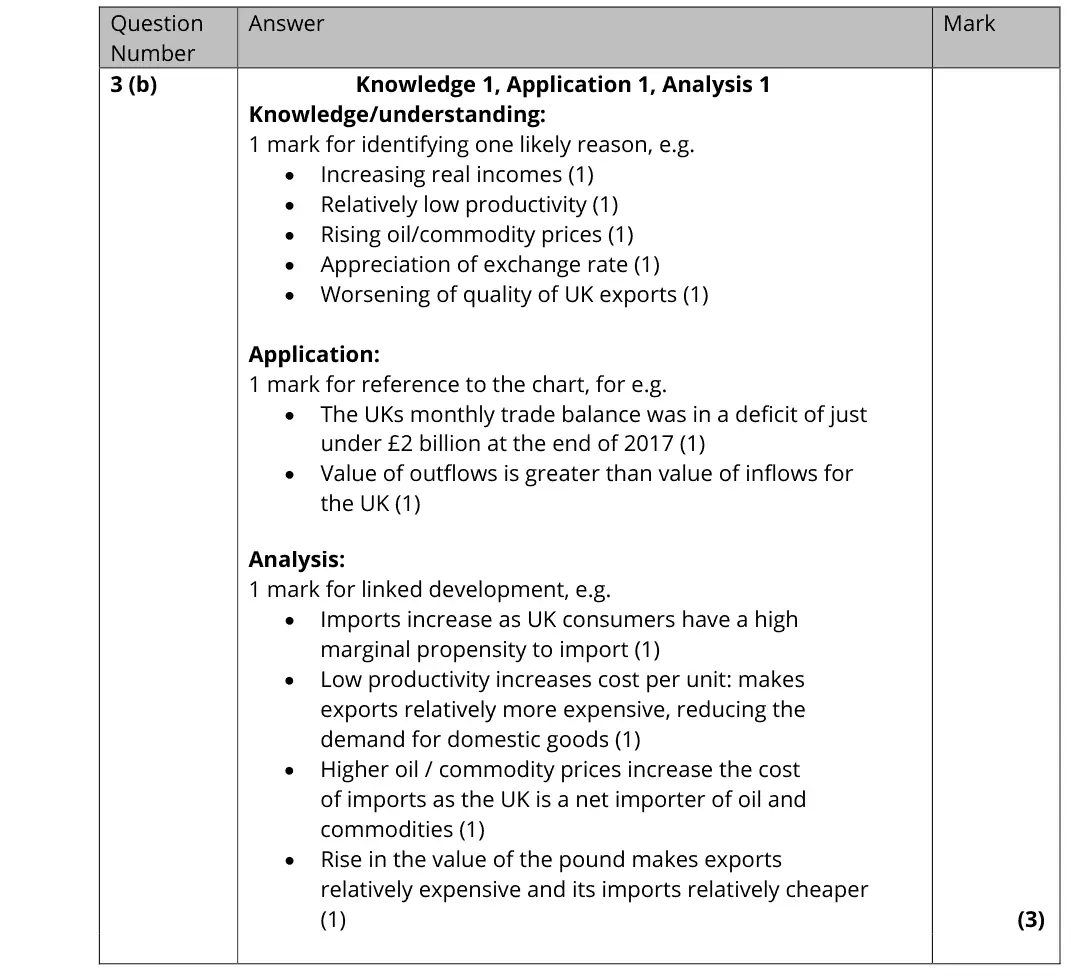
one reason (rising real incomes with a high propensity to import, low productivity, rising commodity prices, strong pound) with linked development
application from the chart e.g. a deficit of just under £2 billion a month at the end of 2017
Quantitative skills: QS 9 (interpret, apply and analyse information in written, graphical tabular and numerical forms)
October 2020 · AS Paper 2 · Q6(b)5 marksAO1=1, AO2=2, AO3=2Short answer
Data and extracts for question 6
Mark scheme
Examiner's comment
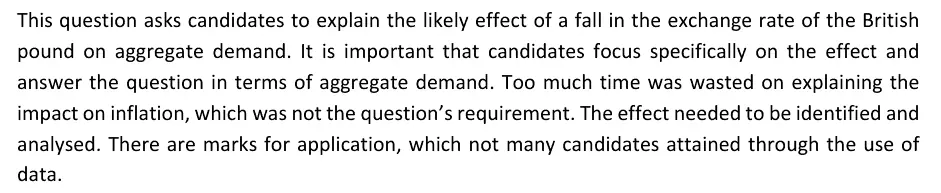
This question asks candidates to explain the likely effect of a fall in the exchange rate of the British pound on aggregate demand. It is important that candidates focus specifically on the effect and answer the question in terms of aggregate demand. Too much time was wasted on explaining the impact on inflation, which was not the question’s requirement. The effect needed to be identified and analysed. There are marks for application, which not many candidates attained through the use of data.
Notes from the mark scheme and report
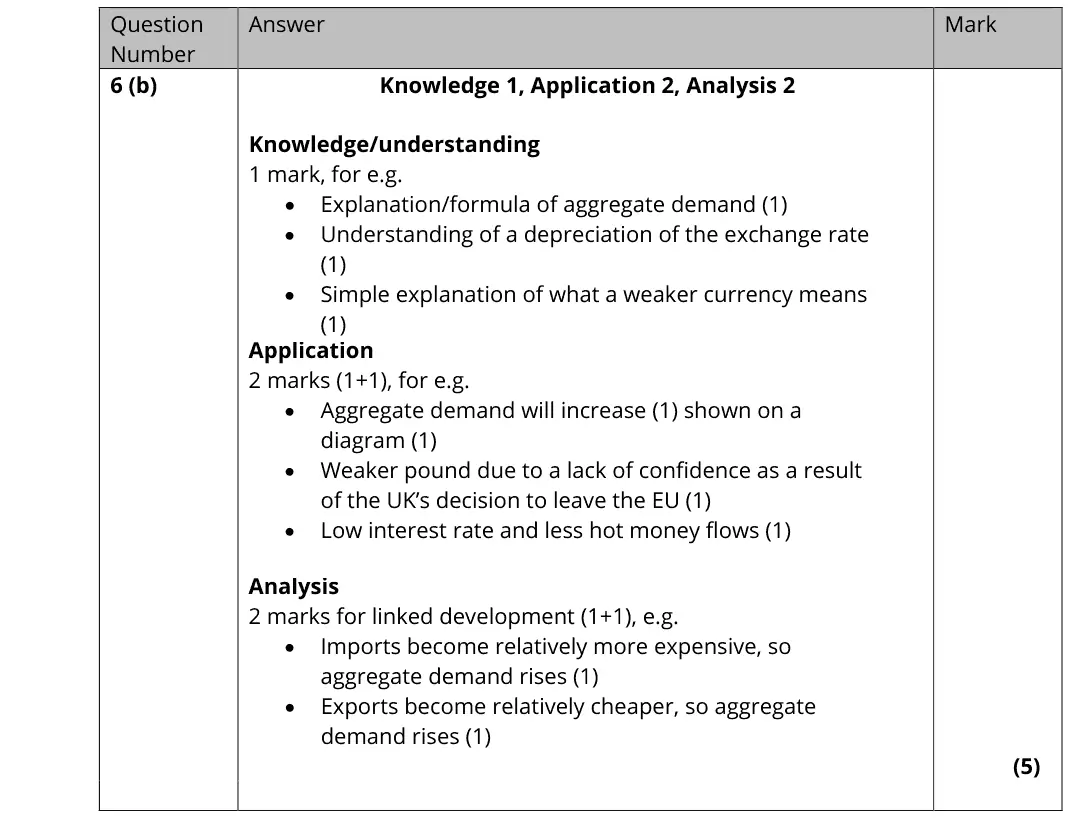
a weaker pound makes exports cheaper and imports dearer so net exports and AD rise
answer in terms of AD, not inflation
application from Extract A was often missing
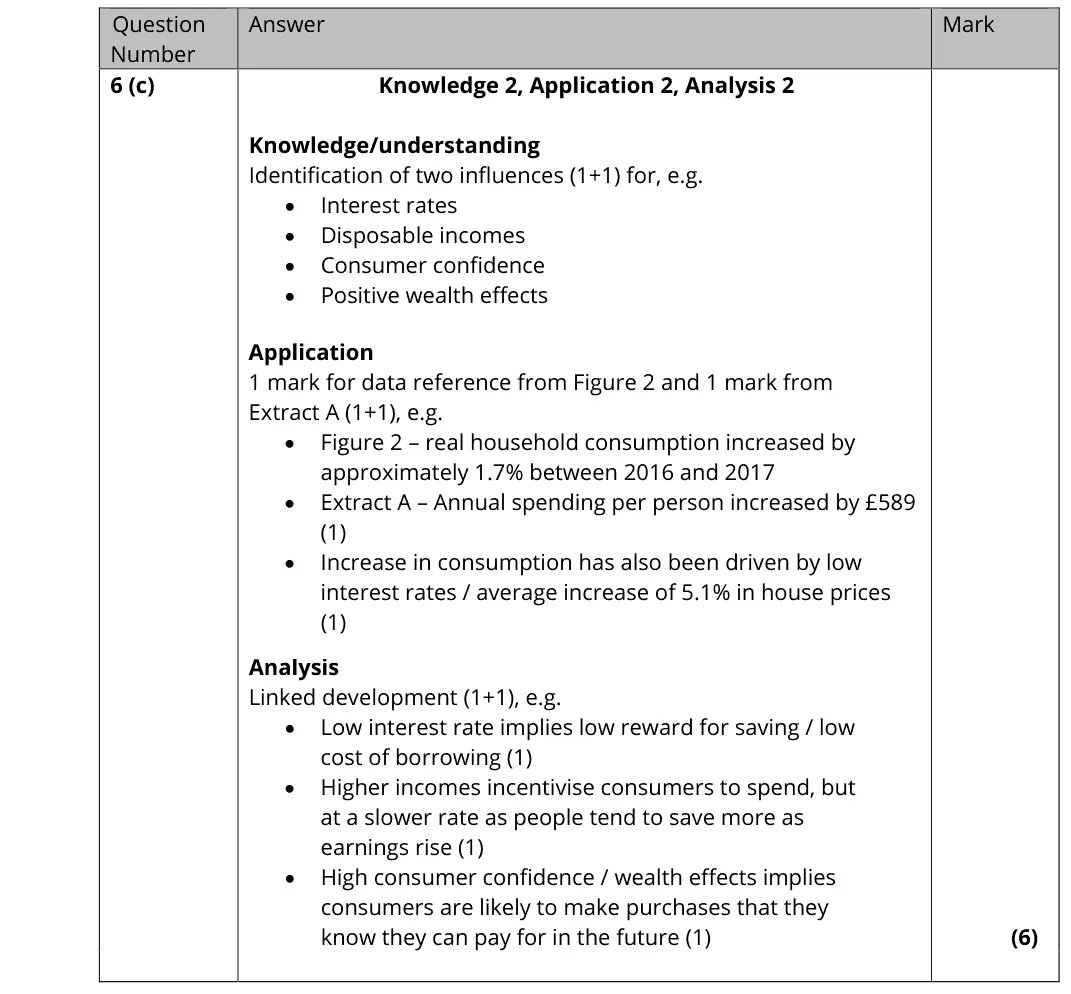
October 2020 · AS Paper 2 · Q6(c)6 marksAO1=2, AO2=2, AO3=2Short answer
Data and extracts for question 6
Mark scheme
Examiner's comment
This question asked candidates to explain two likely influences on the level of UK real household consumption. Therefore, it is important for candidates to make the most of their time in the exam and not explain just one factor. Several possibilities could be explained here. Popular application included the use of Figure 2 to explain answers. Candidates should remember that in these shorter questions examiners are looking for specific pieces of application.
Notes from the mark scheme and report
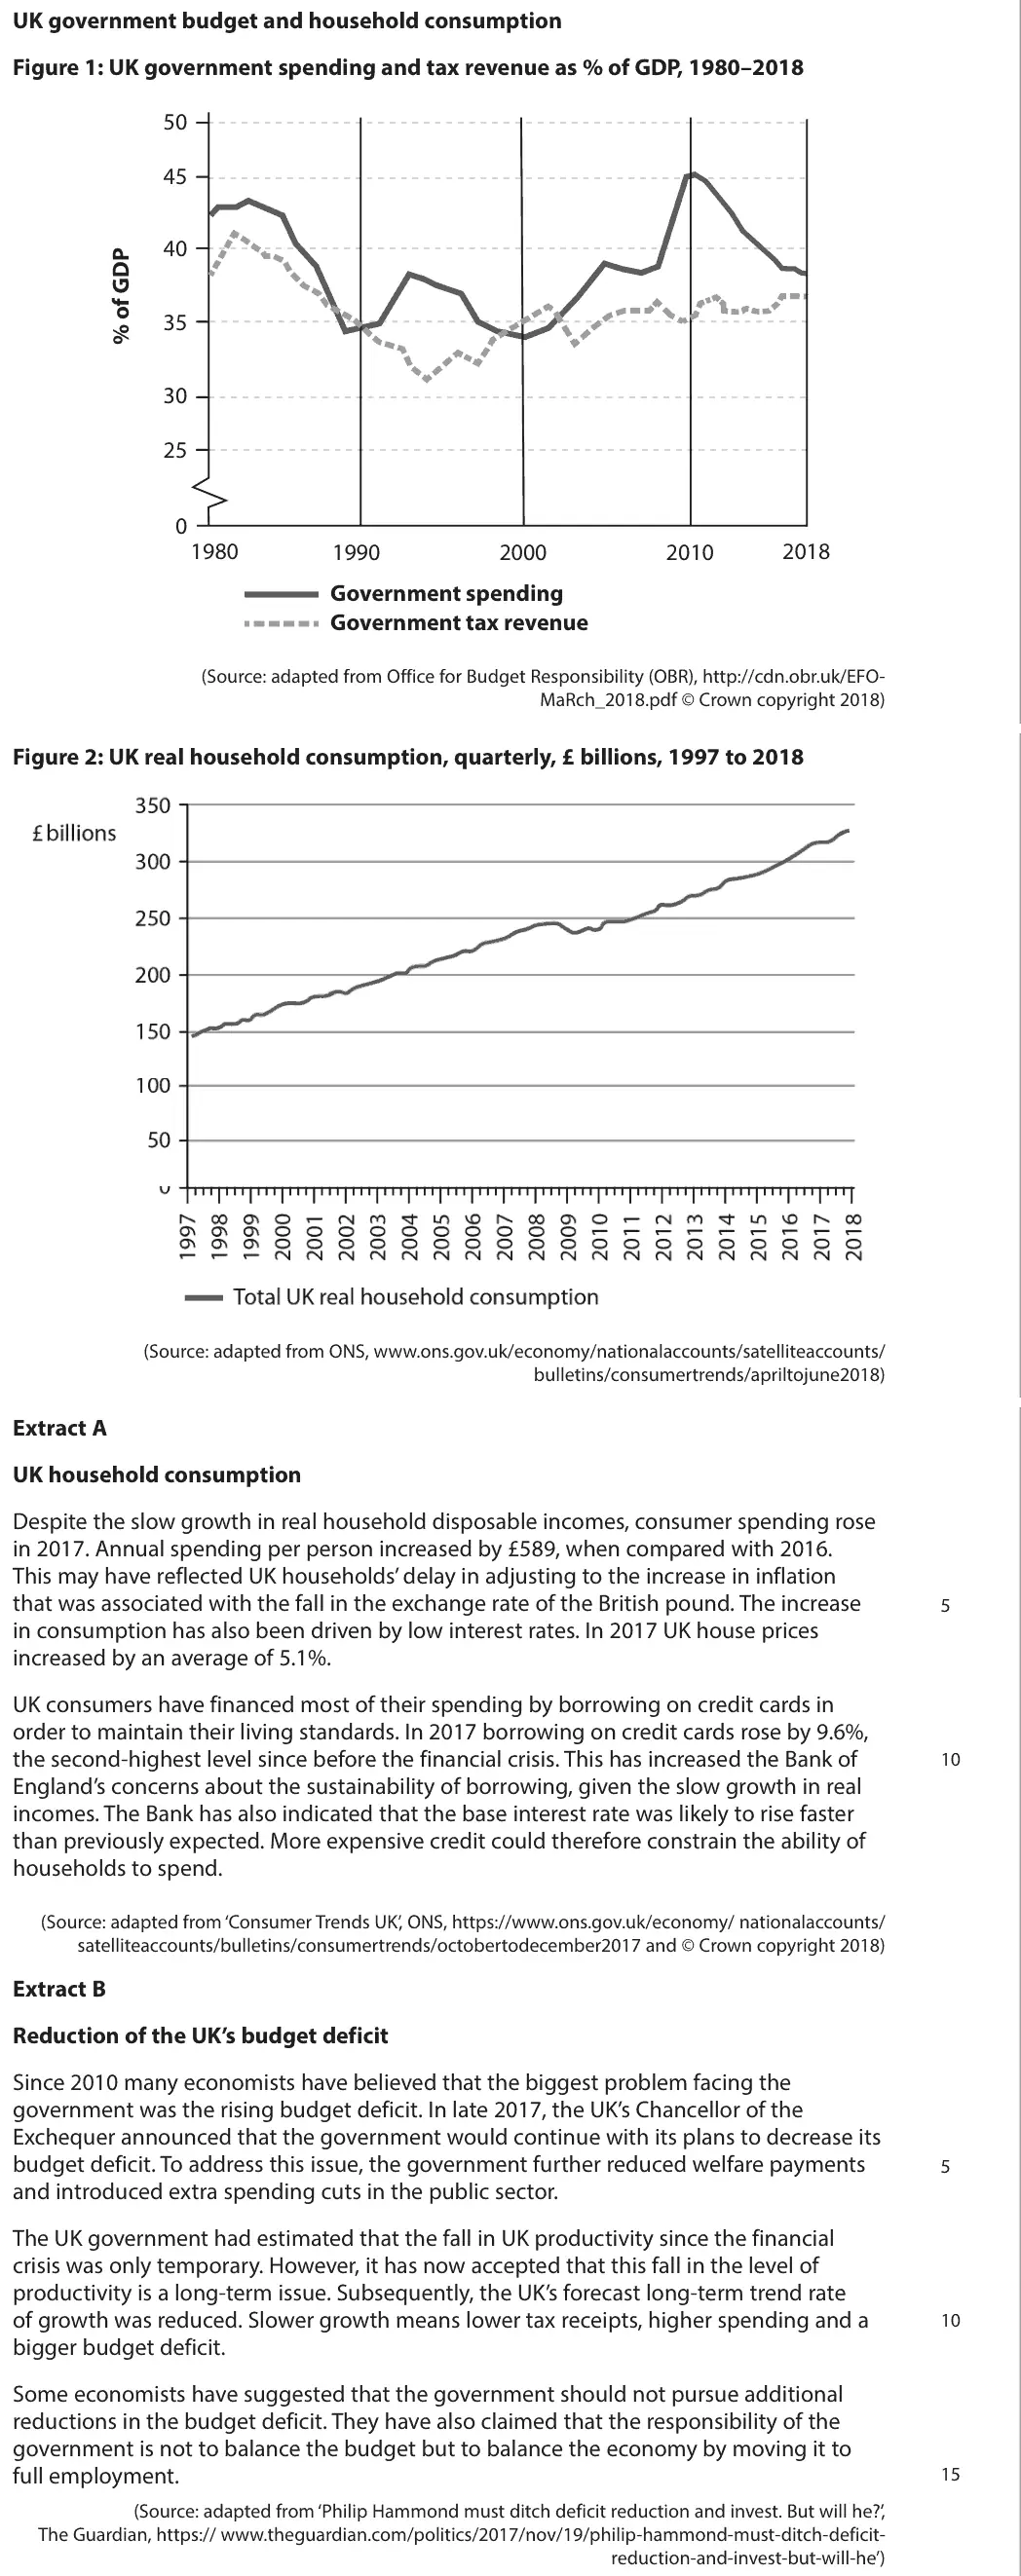
two influences (interest rates, disposable income, confidence, wealth effects from 5.1% house price rise)
one reference from Figure 2 and one from Extract A
explain each link
Quantitative skills: QS 9 (interpret, apply and analyse information in written, graphical tabular and numerical forms)
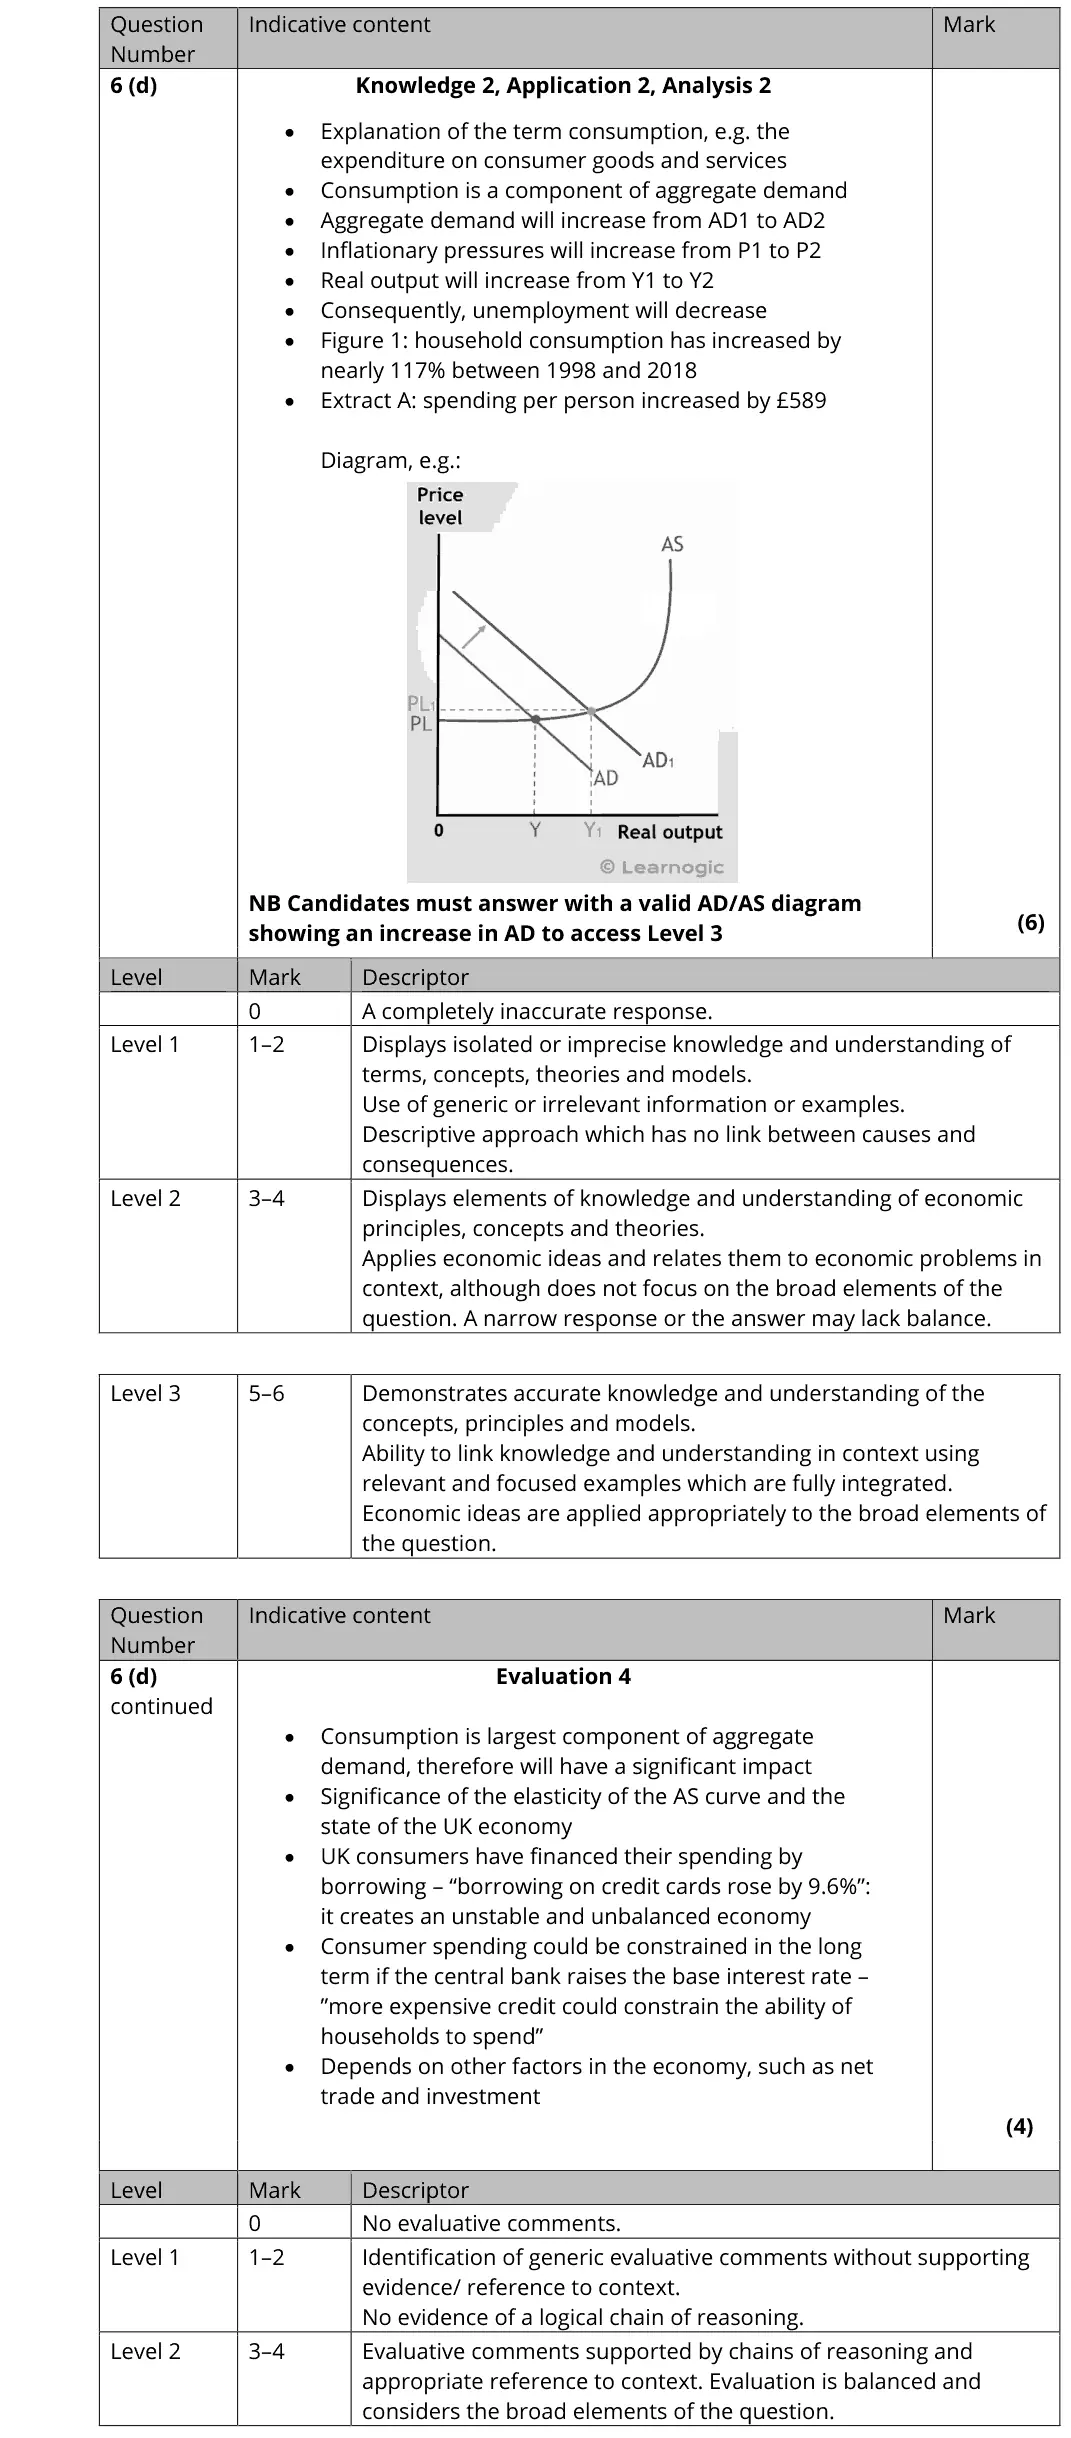
October 2020 · AS Paper 2 · Q6(d)10 marksAO1=2, AO2=2, AO3=2, AO4=410-mark response
Data and extracts for question 6
Mark scheme, including the levels grid and indicative content
Examiner's comment
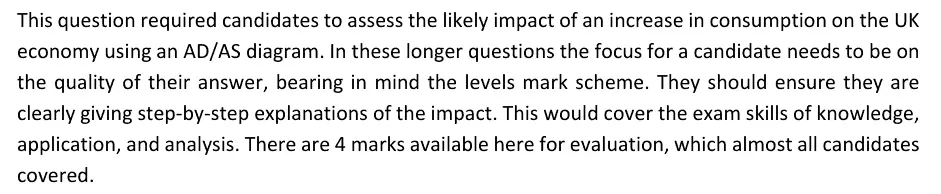
This question required candidates to assess the likely impact of an increase in consumption on the UK economy using an AD/AS diagram. In these longer questions the focus for a candidate needs to be on the quality of their answer, bearing in mind the levels mark scheme. They should ensure they are clearly giving step-by-step explanations of the impact. This would cover the exam skills of knowledge, application, and analysis. There are 4 marks available here for evaluation, which almost all candidates covered.
Notes from the mark scheme and report
Level 3 needs a valid AD/AS diagram with AD shifting right (higher real output and price level, lower unemployment)
evaluate with spare capacity, debt-financed spending (credit card borrowing up 9.6%), rising interest rates, imports
Quantitative skills: QS 4 (construct and interpret a range of standard graphical forms)
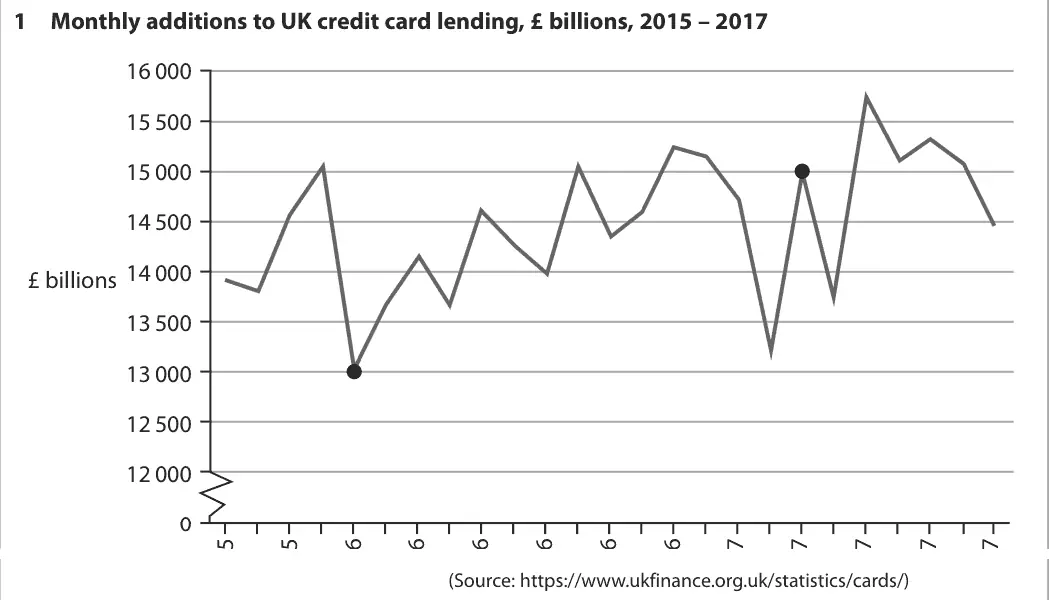
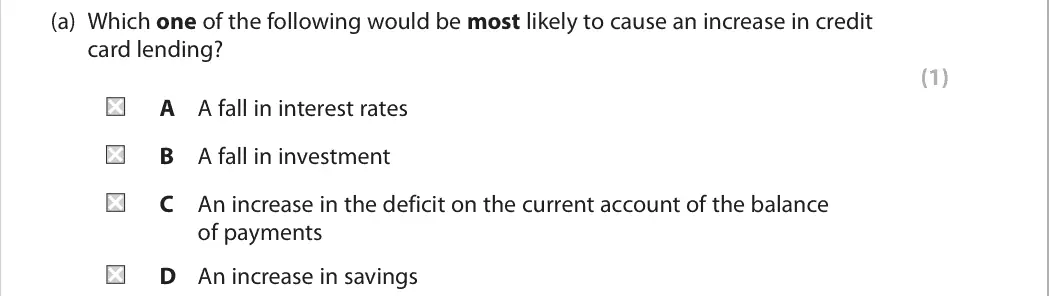
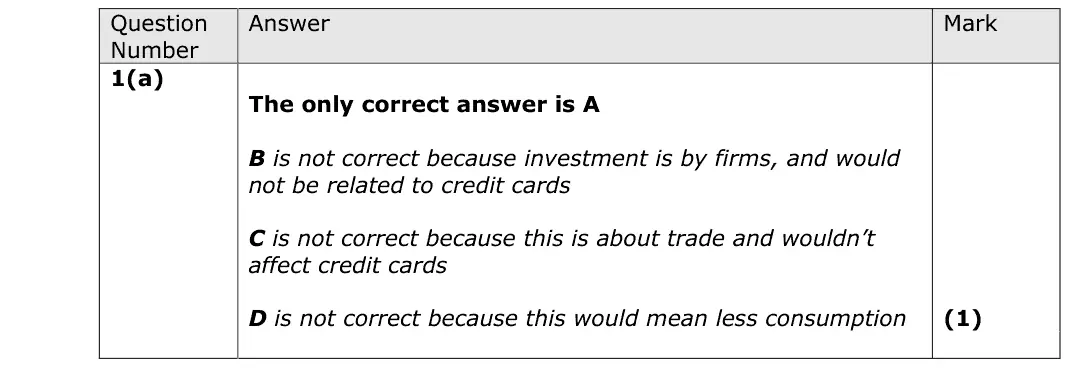
June 2019 · Paper 2 · Q1(a)1 markMultiple choice
Data and extracts for question 1
Answer
A
Mark scheme
Notes from the mark scheme and report
lower interest rates make borrowing cheaper so credit card lending rises (A)
investment is by firms, the current account is unrelated, more saving means less consumption
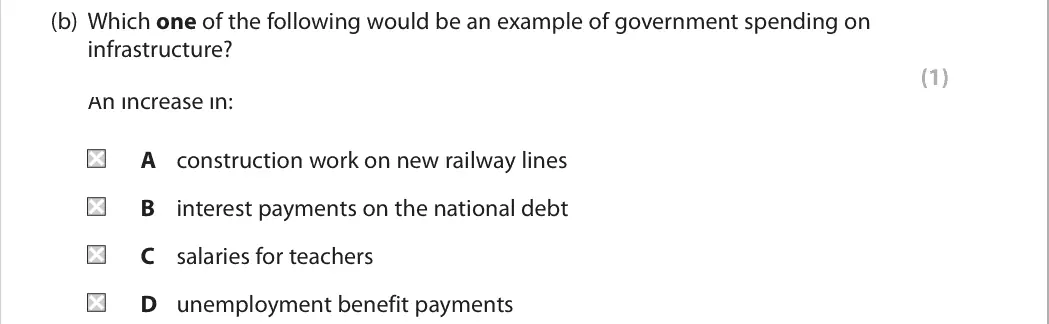
June 2019 · Paper 2 · Q2(b)1 markMultiple choice
Data and extracts for question 2
Answer
A
Mark scheme
Notes from the mark scheme and report
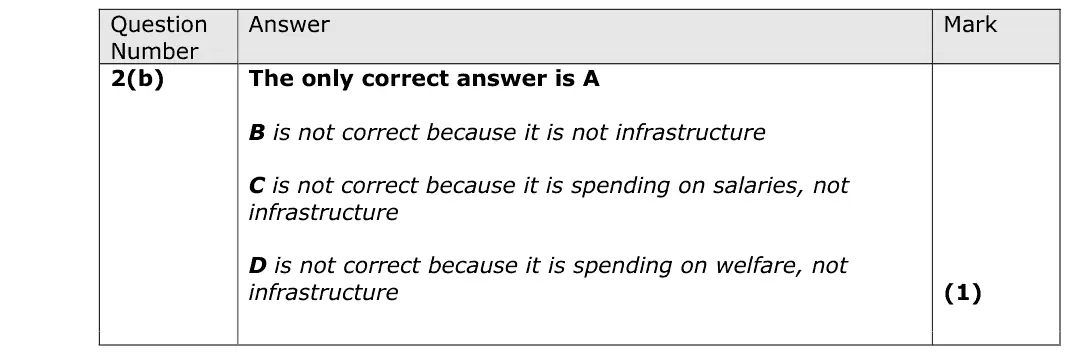
construction of new railway lines is infrastructure (capital spending) (A)
debt interest and unemployment benefit are transfers, teachers' salaries are current spending
June 2019 · AS Paper 2 · Q5(a)1 markMultiple choice
Data and extracts for question 5
Answer
A
Mark scheme
Notes from the mark scheme and report
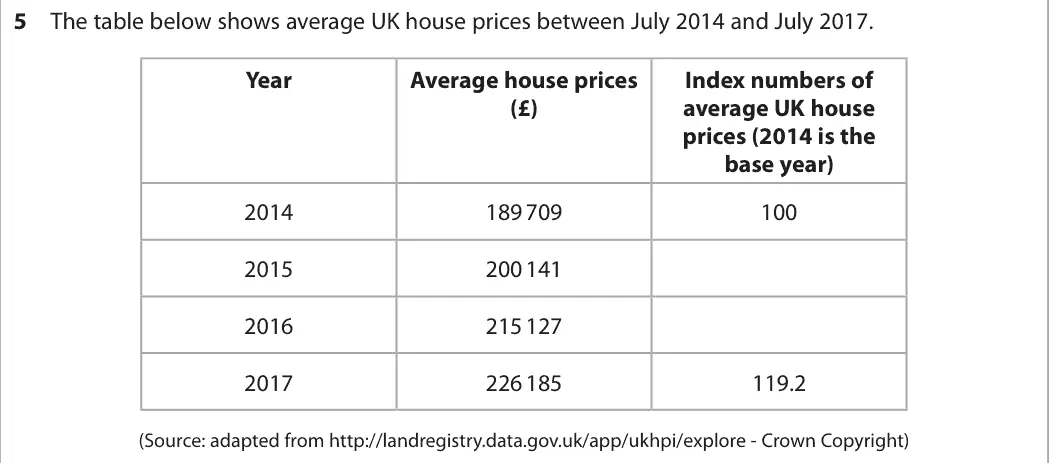
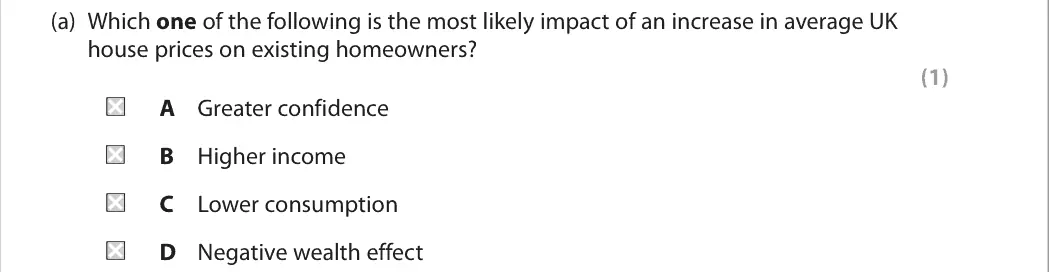
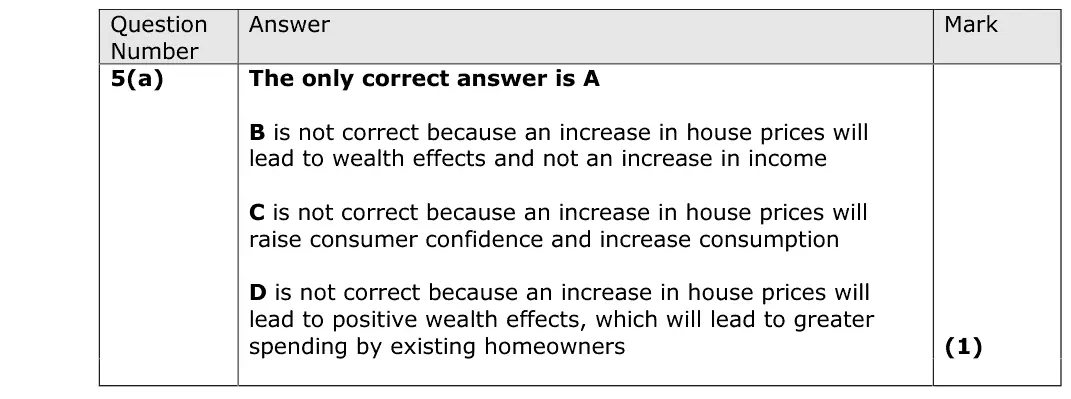
higher house prices give homeowners a positive wealth effect (A)
B house prices raise wealth, not income
C and D wrongly predict lower confidence or spending
June 2019 · AS Paper 2 · Q6(d)10 marksAO1=2, AO2=2, AO3=2, AO4=410-mark response
Data and extracts for question 6
Mark scheme, including the levels grid and indicative content
Examiner's comment
This question required candidates to assess the likely impact of the change in the value of exports, on the economic growth of the UK using an AD/AS diagram. In these longer questions the focus for a candidate needs to be on the quality of their answer, bearing in mind the levels mark scheme. They should ensure they are clearly giving step-by-step explanations of the impact. This would cover the exam skills of knowledge, application, and analysis. There are 4 marks available here for evaluation.
Notes from the mark scheme and report
Level 3 needs an accurate AD/AS diagram with AD shifting right
exports rose from about £43bn to £50bn a month after the 2016 depreciation, an injection with multiplier effects raising real GDP
evaluate with import content, spare capacity and size relative to GDP
Quantitative skills: QS 4 (construct and interpret a range of standard graphical forms); QS 9 (interpret, apply and analyse information in written, graphical tabular and numerical forms)
June 2018 · Paper 2 · Q2(a)1 markMultiple choice
Answer
D
Mark scheme
Notes from the mark scheme and report
a fall in the MPS means a higher MPC, so consumption and AD rise (D)
falls in G, net trade or the MPC all reduce AD
June 2018 · AS Paper 2 · Q4(a)1 markAO1=1DefinitionHard
Data and extracts for question 4
Mark scheme
Examiner's comment
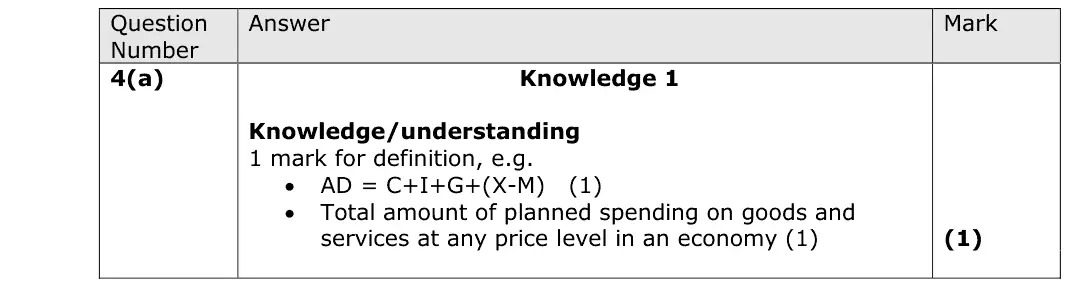
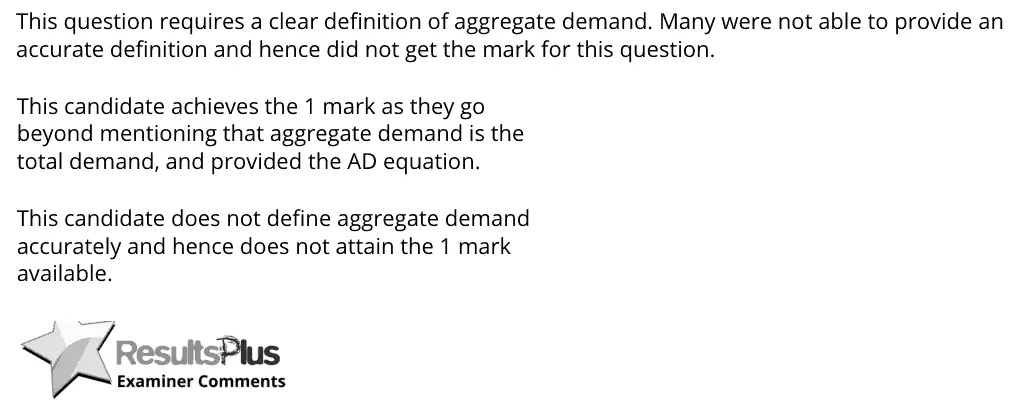
This question requires a clear definition of aggregate demand. Many were not able to provide an accurate definition and hence did not get the mark for this question. This candidate achieves the 1 mark as they go beyond mentioning that aggregate demand is the total demand, and provided the AD equation. This candidate does not define aggregate demand accurately and hence does not attain the 1 mark available.
Notes from the mark scheme and report
total planned spending on goods and services in an economy at any given price level, AD = C + I + G + (X - M)
'total demand' alone is not enough
report: "Many were not able to provide an accurate definition and hence did not get the mark"
June 2018 · AS Paper 2 · Q5(a)1 markMultiple choice
Data and extracts for question 5
Answer
D
Mark scheme
Notes from the mark scheme and report
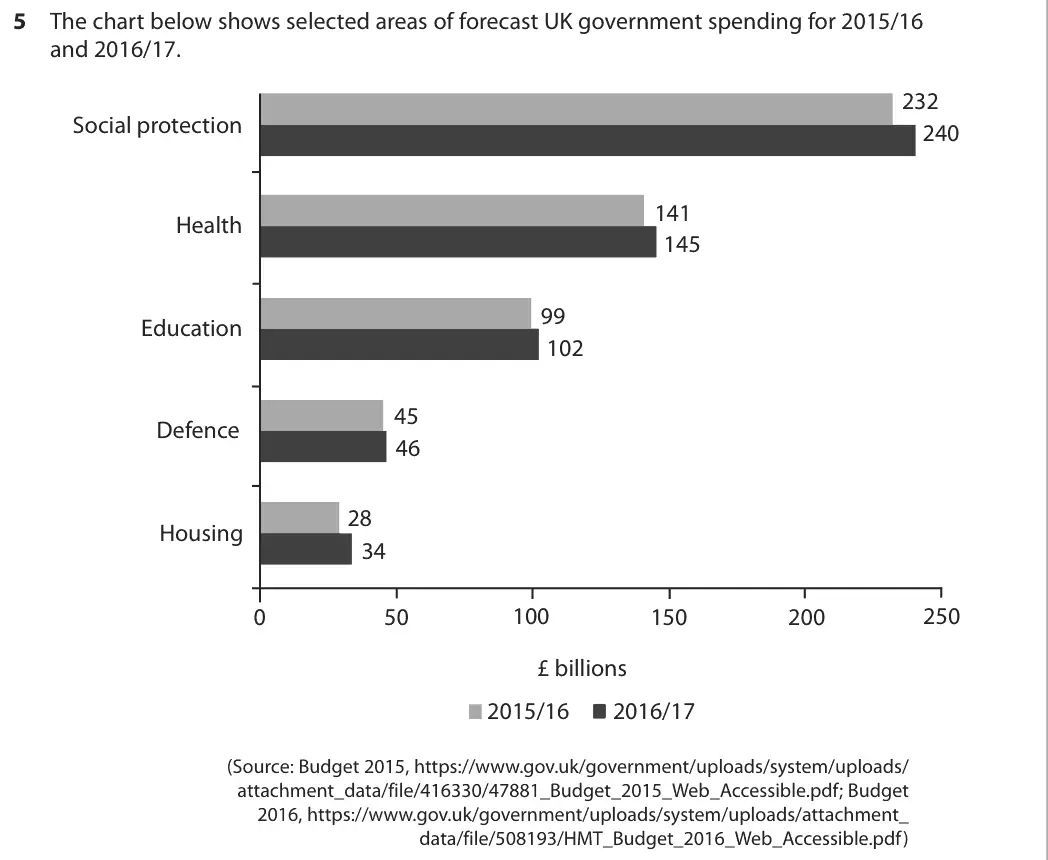
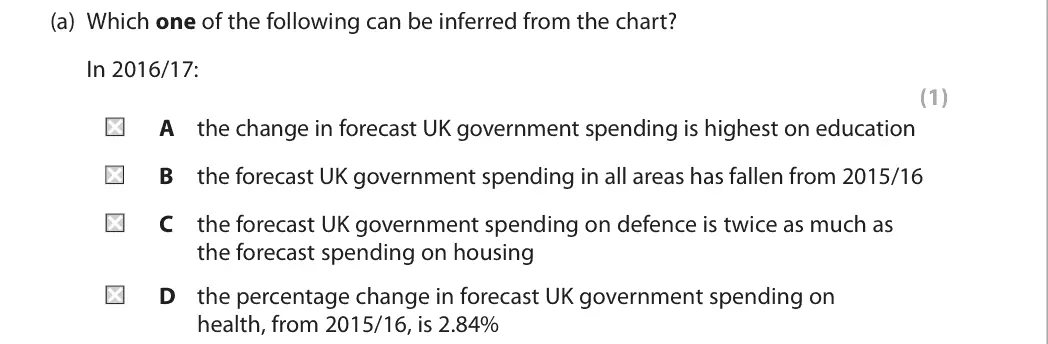
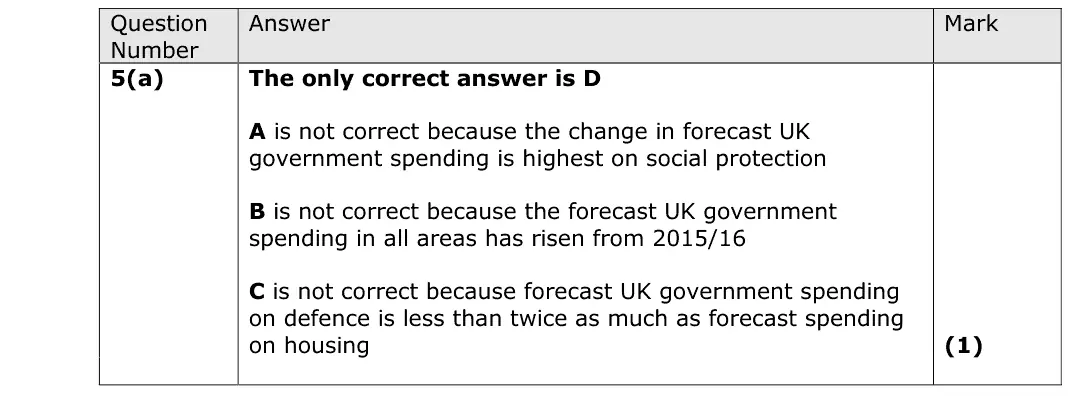
health spending rose from 141 to 145: 4/141 = 2.84% (D)
the biggest change is social protection (+8), all areas rose, defence (46) is less than twice housing (34)
Quantitative skills: QS 2 (calculate, use and understand percentages, percentage changes and percentage point changes); QS 9 (interpret, apply and analyse information in written, graphical tabular and numerical forms)
June 2018 · Paper 2 · Q5(a)2 marksAO1=1, AO3=1Short answer
Data and extracts for question 5
Mark scheme
Examiner's comment
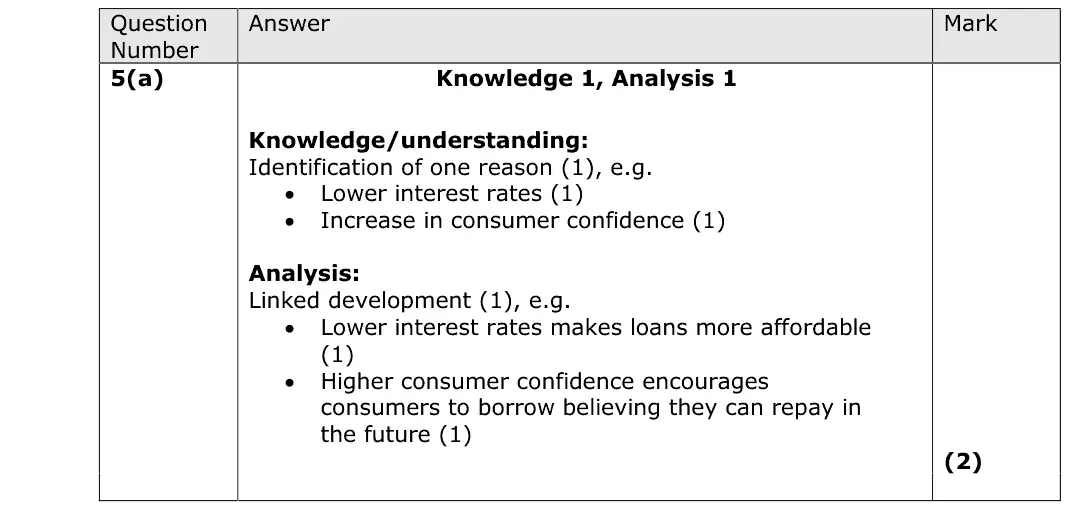
There are two marks for this question, one for knowledge and one for identifying a likely reason. The second analysis mark is for linked development – justifying the reason. This answer achieves full marks – one knowledge mark for interest rates decrease. Then the analysis mark for the rest of this sentence in the candidate's answer. This answer achieves one mark for 'increased confidence'. However the rest of the answer doesn't explain why increased confidence would lead to an increase in demand for bank loans. When you are asked to explain a reason, make sure you not only identify your reason but that you then go on to justify that reason.
Notes from the mark scheme and report
identify a reason (lower interest rates, higher consumer confidence) and develop it (loans more affordable, confident of repaying)
identifying the reason without justifying it scores 1
June 2018 · AS Paper 2 · Q5(b)2 marksAO2=2Calculation
Data and extracts for question 5
Mark scheme
Examiner's comment
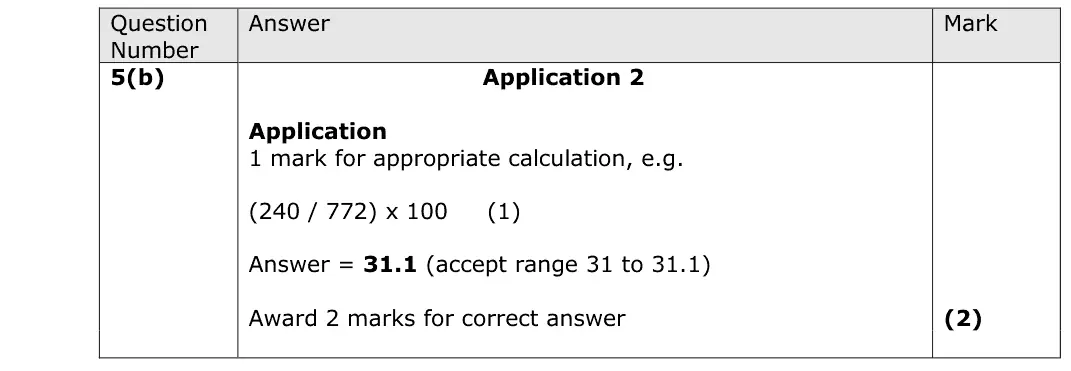
This question asked candidates to calculate the forecast UK government spending on social protection as a percentage of total forecast UK government spending in 2016/17. Many candidates were able to answer this question relatively easily. However, some candidates lost marks because they selected the wrong two pieces of data. This candidate achieves 2/2 marks. They have correctly calculated an answer of 31%. This candidate achieves 0/2 marks. They have not shown the correct workings and their answer is incorrect.
Notes from the mark scheme and report
240 / 772 x 100 = 31.1%
the £716bn tax receipts figure is a distractor
some used the wrong data
Quantitative skills: QS 2 (calculate, use and understand percentages, percentage changes and percentage point changes); QS 9 (interpret, apply and analyse information in written, graphical tabular and numerical forms)
June 2018 · Paper 2 · Q5(b)1 markMultiple choice
Data and extracts for question 5
Answer
B
Mark scheme
Notes from the mark scheme and report
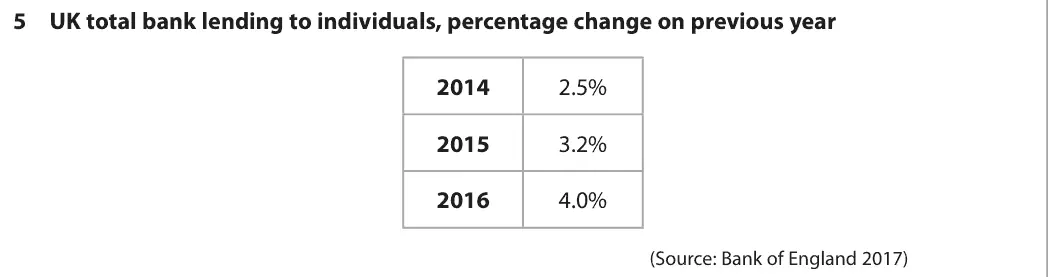
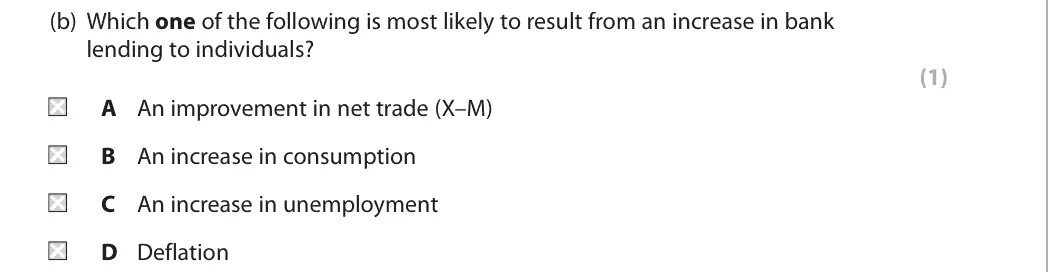
more lending to individuals finances consumer spending, so consumption rises (B)
it would worsen net trade (not A), reduce unemployment (not C) and add to inflation, not deflation (not D)
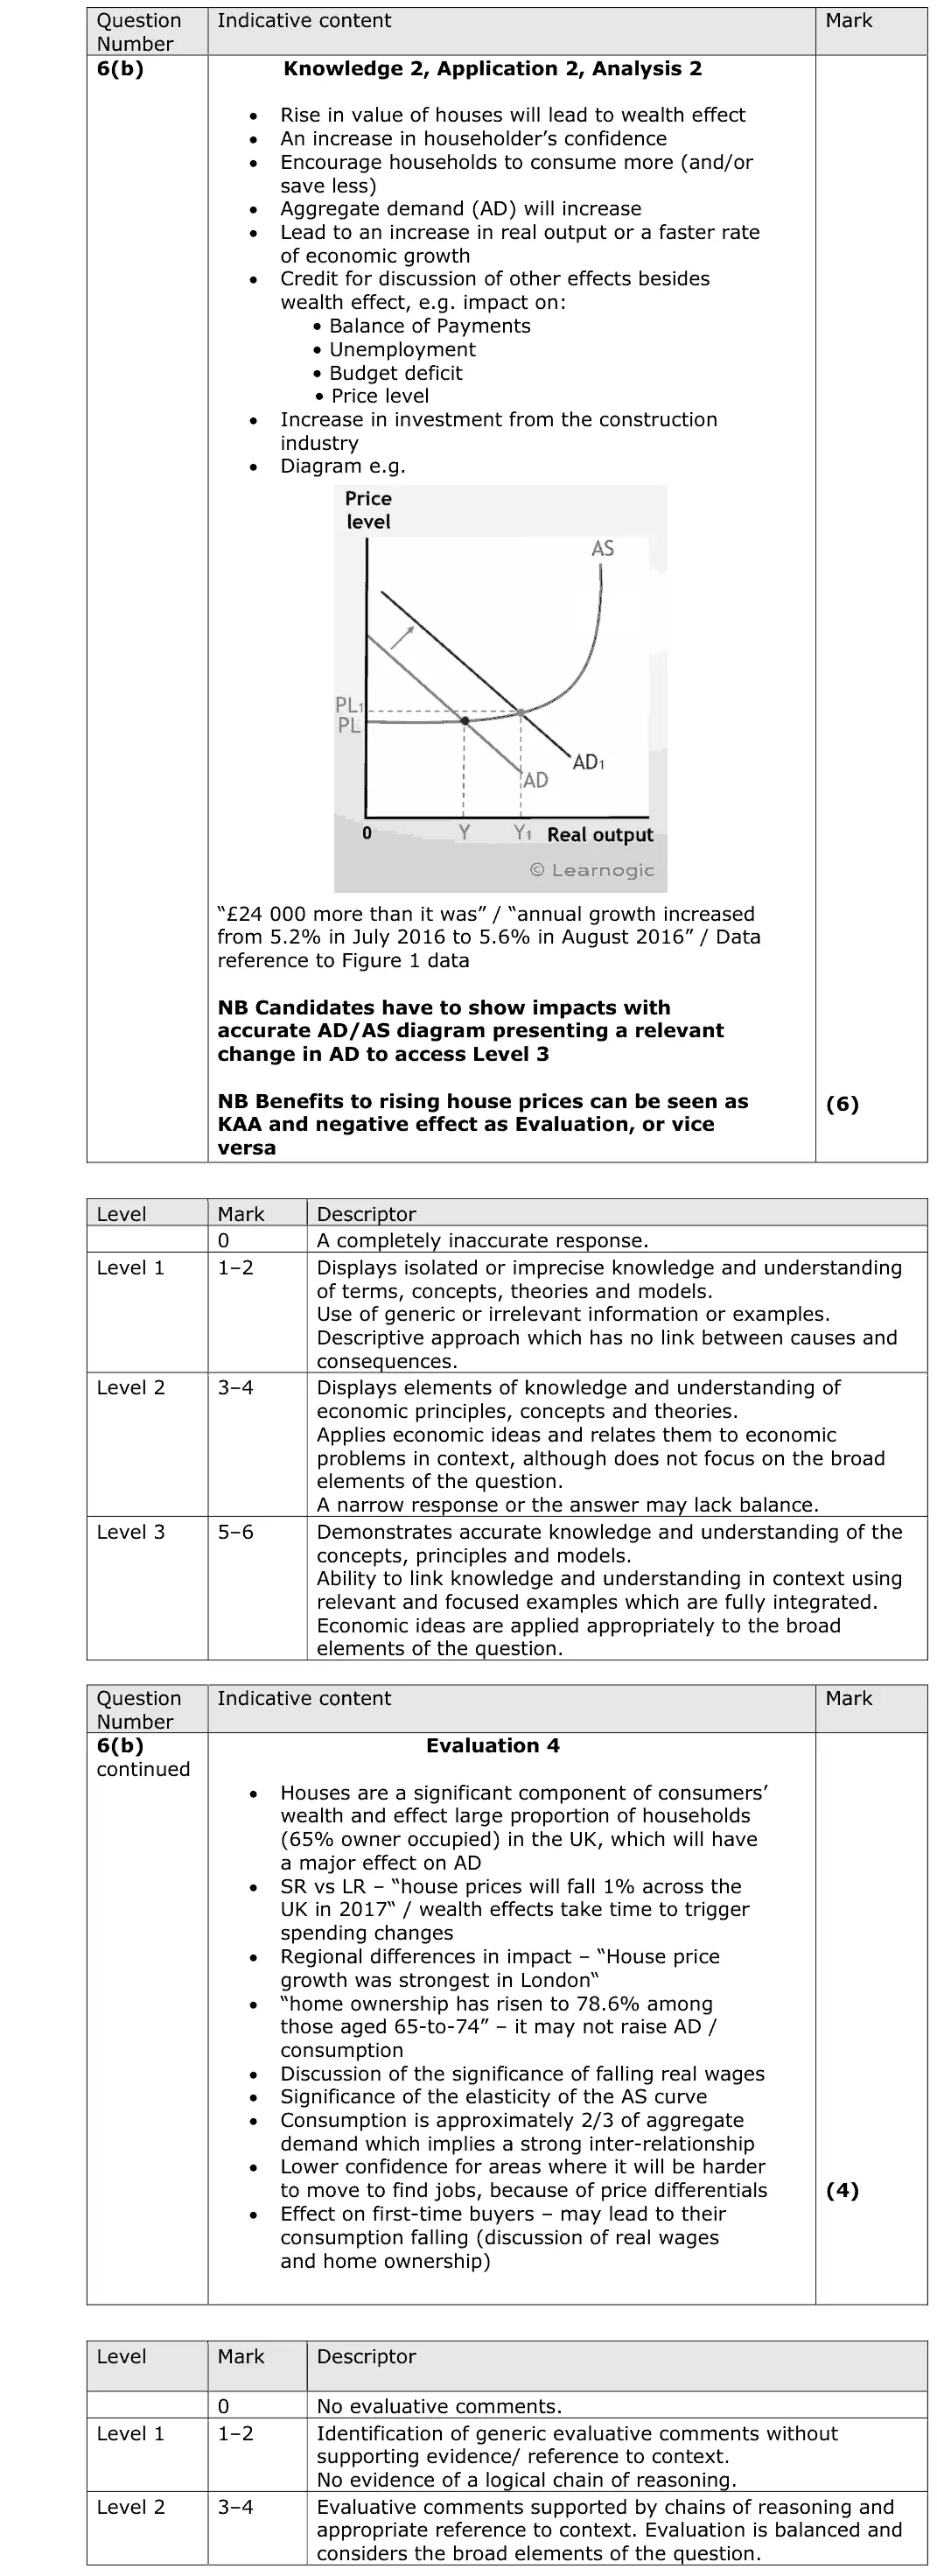
June 2018 · AS Paper 2 · Q6(b)10 marksAO1=2, AO2=2, AO3=2, AO4=410-mark response
Data and extracts for question 6
Mark scheme, including the levels grid and indicative content
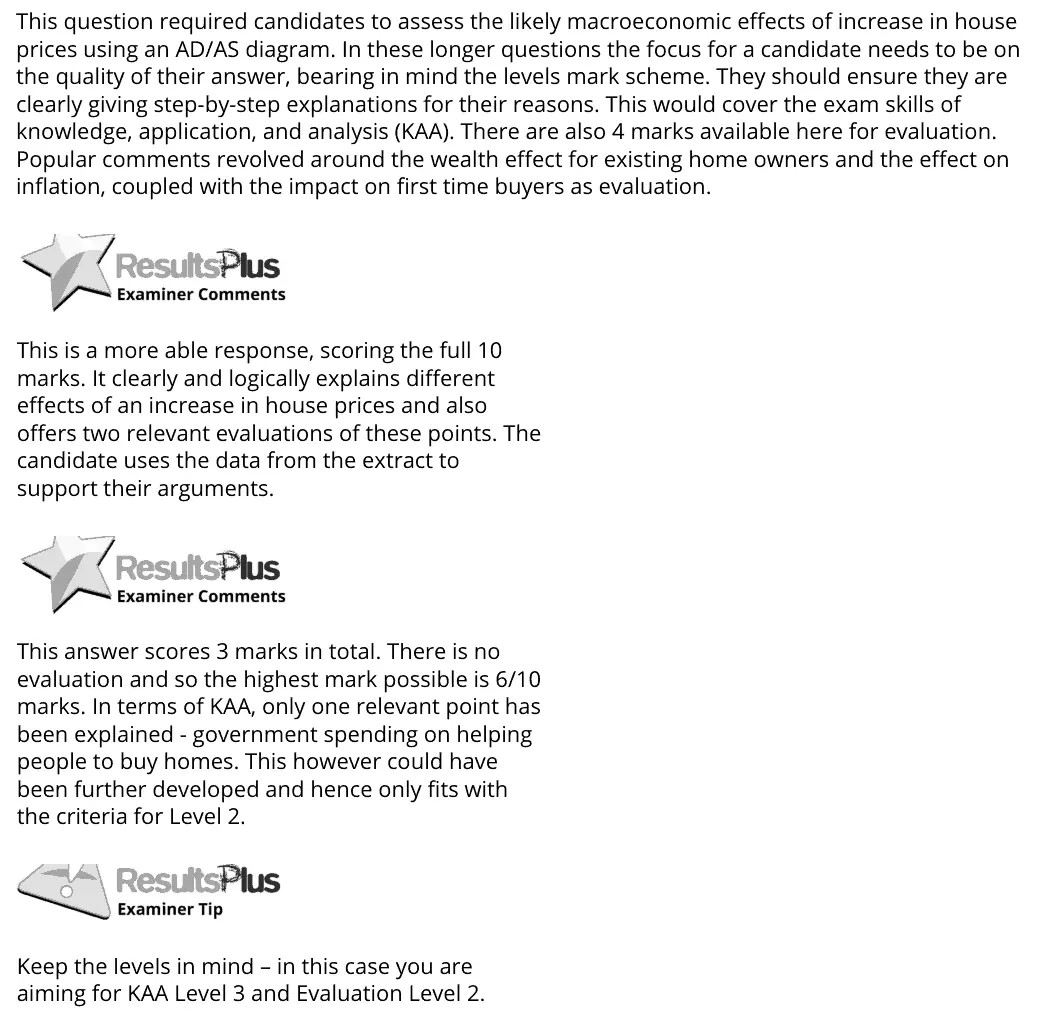
Examiner's comment
This question required candidates to assess the likely macroeconomic effects of increase in house prices using an AD/AS diagram. In these longer questions the focus for a candidate needs to be on the quality of their answer, bearing in mind the levels mark scheme. They should ensure they are clearly giving step-by-step explanations for their reasons. This would cover the exam skills of knowledge, application, and analysis (KAA). There are also 4 marks available here for evaluation. Popular comments revolved around the wealth effect for existing home owners and the effect on inflation, coupled with the impact on first time buyers as evaluation. This is a more able response, scoring the full 10 marks. It clearly and logically explains different effects of an increase in house prices and also offers two relevant evaluations of these points. The candidate uses the data from the extract to support their arguments. This answer scores 3 marks in total. There is no evaluation and so the highest mark possible is 6/10 marks. In terms of KAA, only one relevant point has been explained - government spending on helping people to buy homes. This however could have been further developed and hence only fits with the criteria for Level 2. Keep the levels in mind – in this case you are aiming for KAA Level 3 and Evaluation Level 2.
Notes from the mark scheme and report
wealth effect and confidence raise consumption, AD shifts right, higher real output and price level
Level 3 needs an accurate AD/AS diagram
evaluate with first-time buyers, regional differences, size of the effect, falling real incomes
Quantitative skills: QS 4 (construct and interpret a range of standard graphical forms)
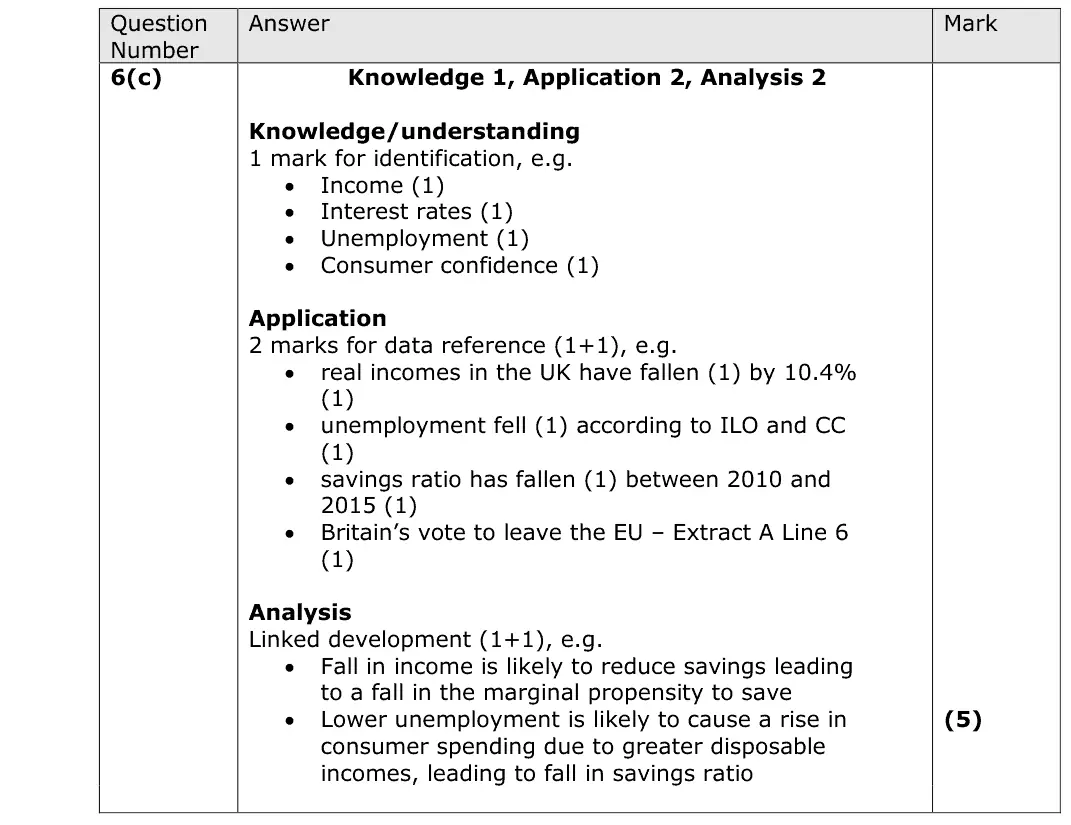
June 2018 · AS Paper 2 · Q6(c)5 marksAO1=1, AO2=2, AO3=2Short answer
Data and extracts for question 6
Mark scheme
Examiner's comment
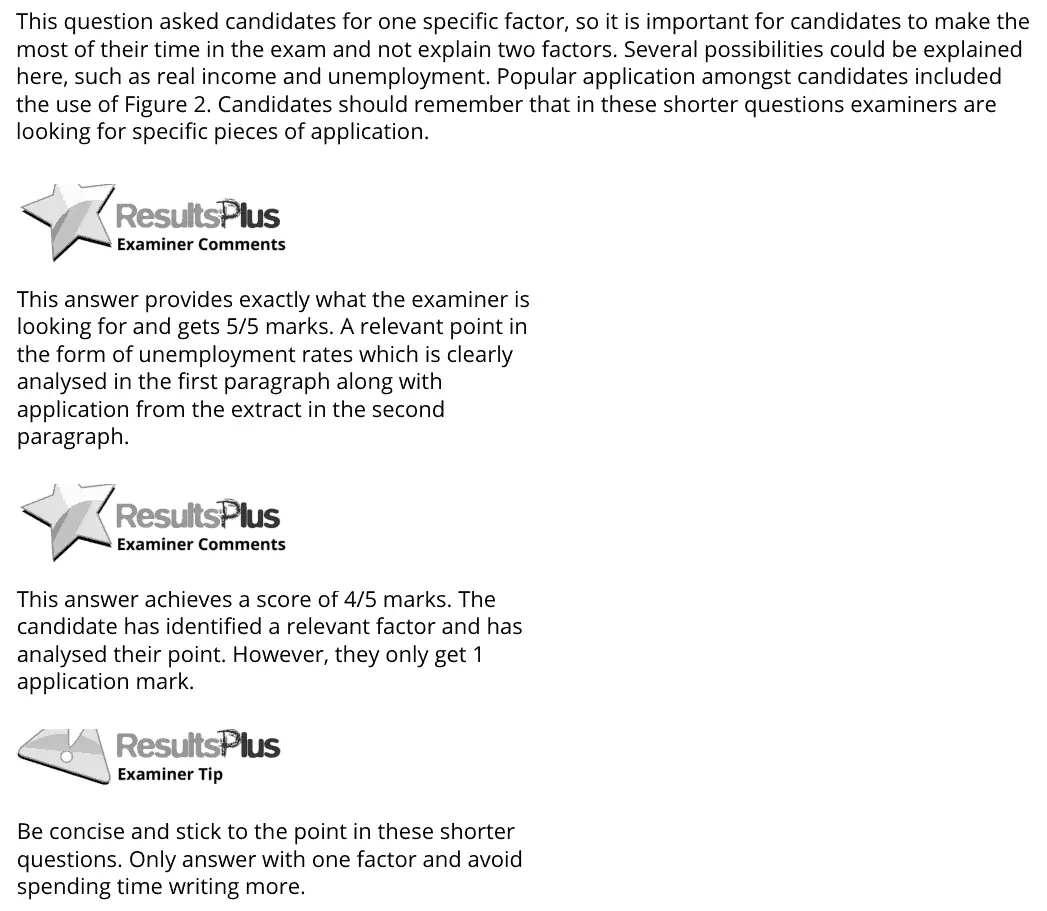
This question asked candidates for one specific factor, so it is important for candidates to make the most of their time in the exam and not explain two factors. Several possibilities could be explained here, such as real income and unemployment. Popular application amongst candidates included the use of Figure 2. Candidates should remember that in these shorter questions examiners are looking for specific pieces of application. This answer provides exactly what the examiner is looking for and gets 5/5 marks. A relevant point in the form of unemployment rates which is clearly analysed in the first paragraph along with application from the extract in the second paragraph. This answer achieves a score of 4/5 marks. The candidate has identified a relevant factor and has analysed their point. However, they only get 1 application mark. Be concise and stick to the point in these shorter questions. Only answer with one factor and avoid spending time writing more.
Notes from the mark scheme and report
one factor only (income, interest rates, unemployment, confidence) with two data references, e.g. savings ratio fell from about 11% (2010) to under 6% (2015), real incomes fell 10.4%
Quantitative skills: QS 9 (interpret, apply and analyse information in written, graphical tabular and numerical forms)
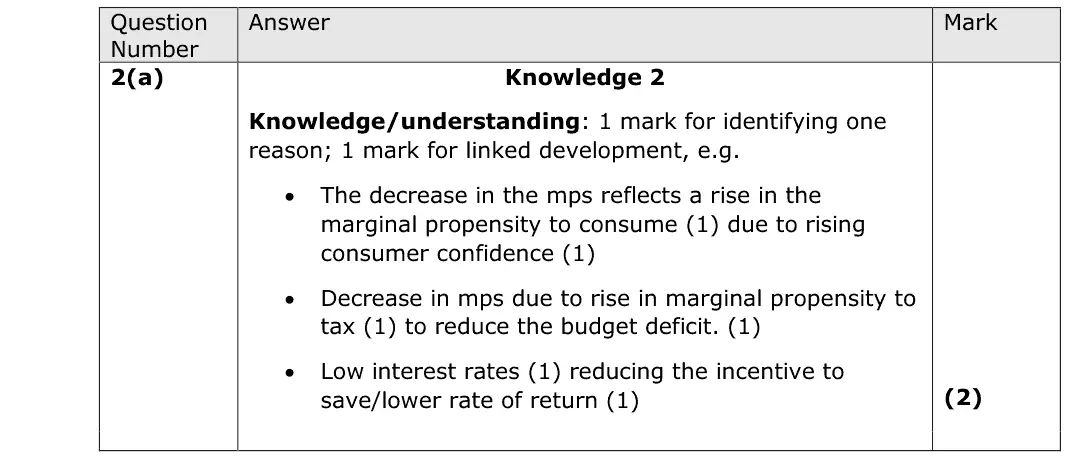
June 2017 · Paper 2 · Q2(a)2 marksAO1=2Short answer
Data and extracts for question 2
Mark scheme
Examiner's comment
Most candidates found this to be a straightforward question. There are 2 marks available for knowledge, 1 mark for the reason and 1 mark for an explanation of that reason. If candidates failed to score full marks on this question it was generally either because they misread the data or they failed to explain their reason for the second mark. Most candidates explained the impact of falling interest rates reducing the incentive to save. This answer scores the full 2 marks. The candidate has identified falling interest rates and clearly explained why it would lead to a lower MPS. Be clear and concise in these short questions.
Notes from the mark scheme and report
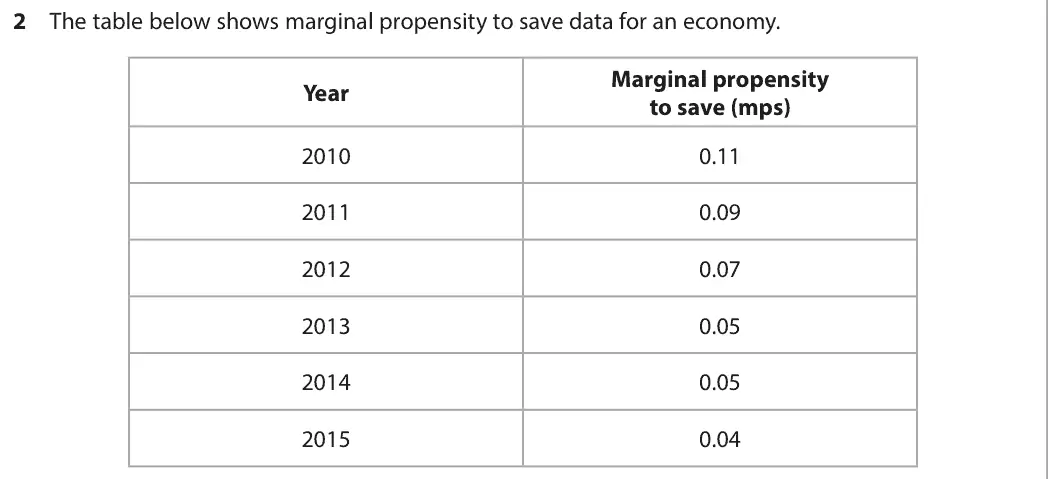
mps fell from 0.11 to 0.04
one reason plus linked development, e.g. low interest rates reduce the reward for saving, rising consumer confidence raises mpc
Quantitative skills: QS 9 (interpret, apply and analyse information in written, graphical tabular and numerical forms)
June 2017 · AS Paper 2 · Q5(a)3 marksAO1=1, AO2=1, AO3=1Short answer
Data and extracts for question 5
Mark scheme
Examiner's comment
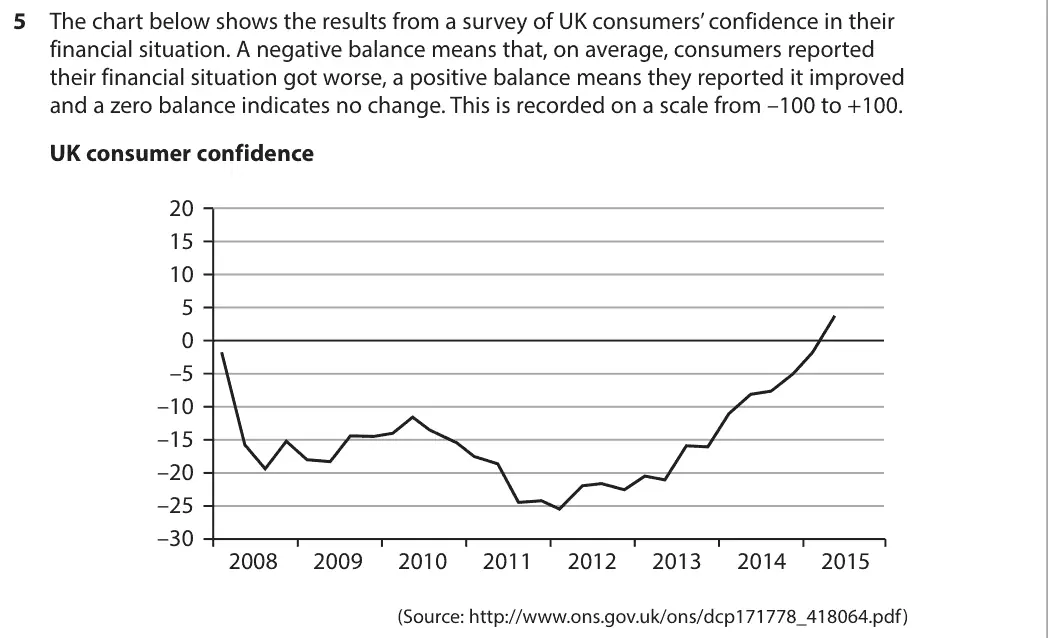
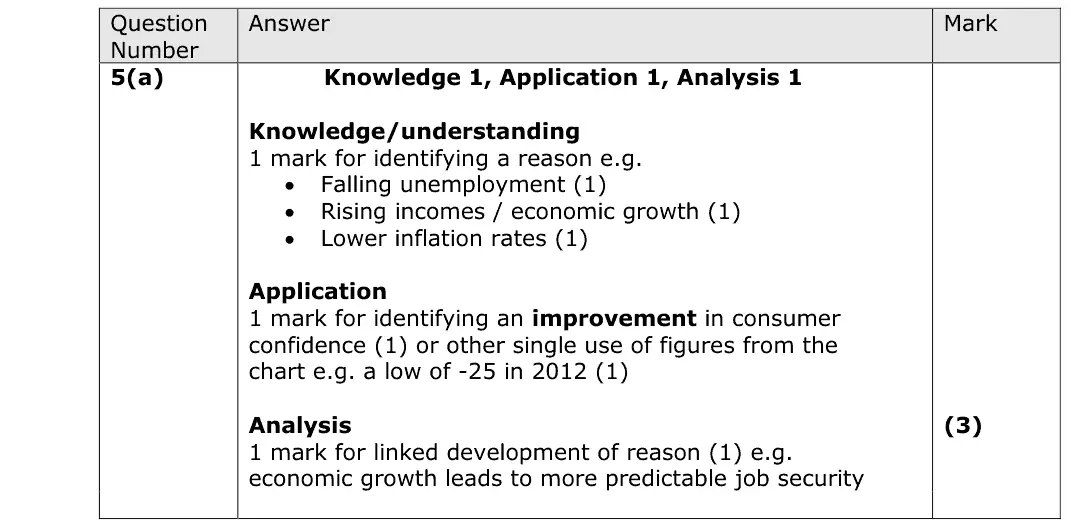
In this question the 3 marks are divided between knowledge, application, and analysis. Knowledge comes from identifying a likely reason. Application comes from studying the chart and seeing that between 2012 and 2015 consumer confidence has increased. Analysis comes from explaining the reason. One mistake that candidates made was not reading the question carefully – it refers specifically to the time period 2012 to 2015, when consumer confidence had improved, as you can see on the chart. As such answers discussing a reason for confidence falling (as it did in earlier years) are unlikely to receive many marks. This answer scores the full 3 marks. They have correctly interpreted the graph to see the consumer confidence has risen. They have identified falling unemployment as a reason, and have then gone on to explain this. It is important that candidates can quickly and easily interpret charts such as this. It is therefore worth practicing this as part of exam preparation. In this answer the candidate scores 2/3 marks. They receive the application mark for consumer confidence is rising and they have identified that coming out of recession is a likely reason. However, there is no analysis of why this would cause consumer confidence to rise. To get full marks you need to remember to explain your points, not just state them.
Notes from the mark scheme and report
confidence rose from a low of about -25 in 2012 to positive in 2015
reason e.g. falling unemployment or rising real incomes, then explain the link (job security)
reasons for falling confidence earn little
Quantitative skills: QS 9 (interpret, apply and analyse information in written, graphical tabular and numerical forms)
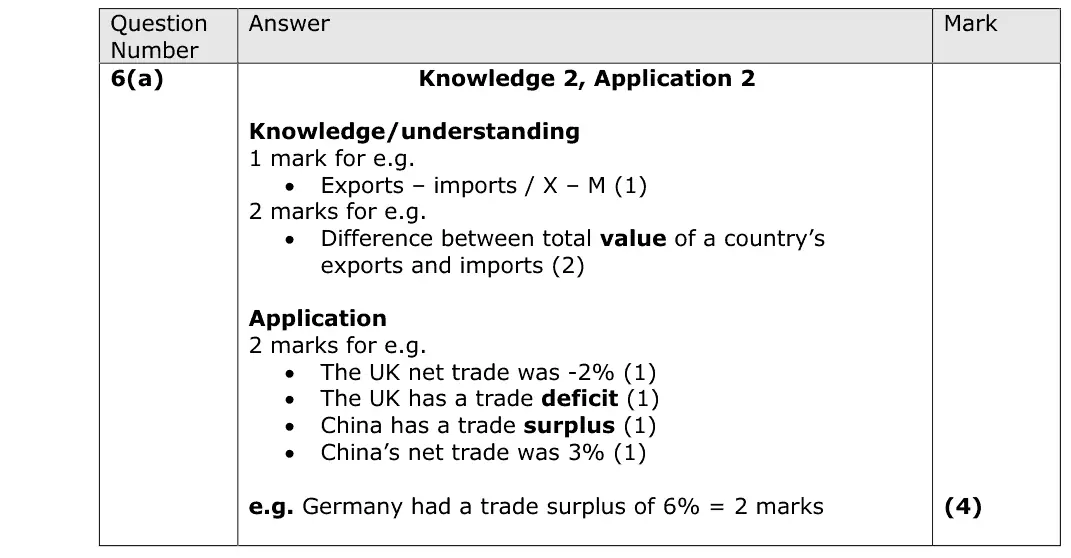
June 2017 · AS Paper 2 · Q6(a)4 marksAO1=2, AO2=2Short answer
Data and extracts for question 6
Mark scheme
Examiner's comment
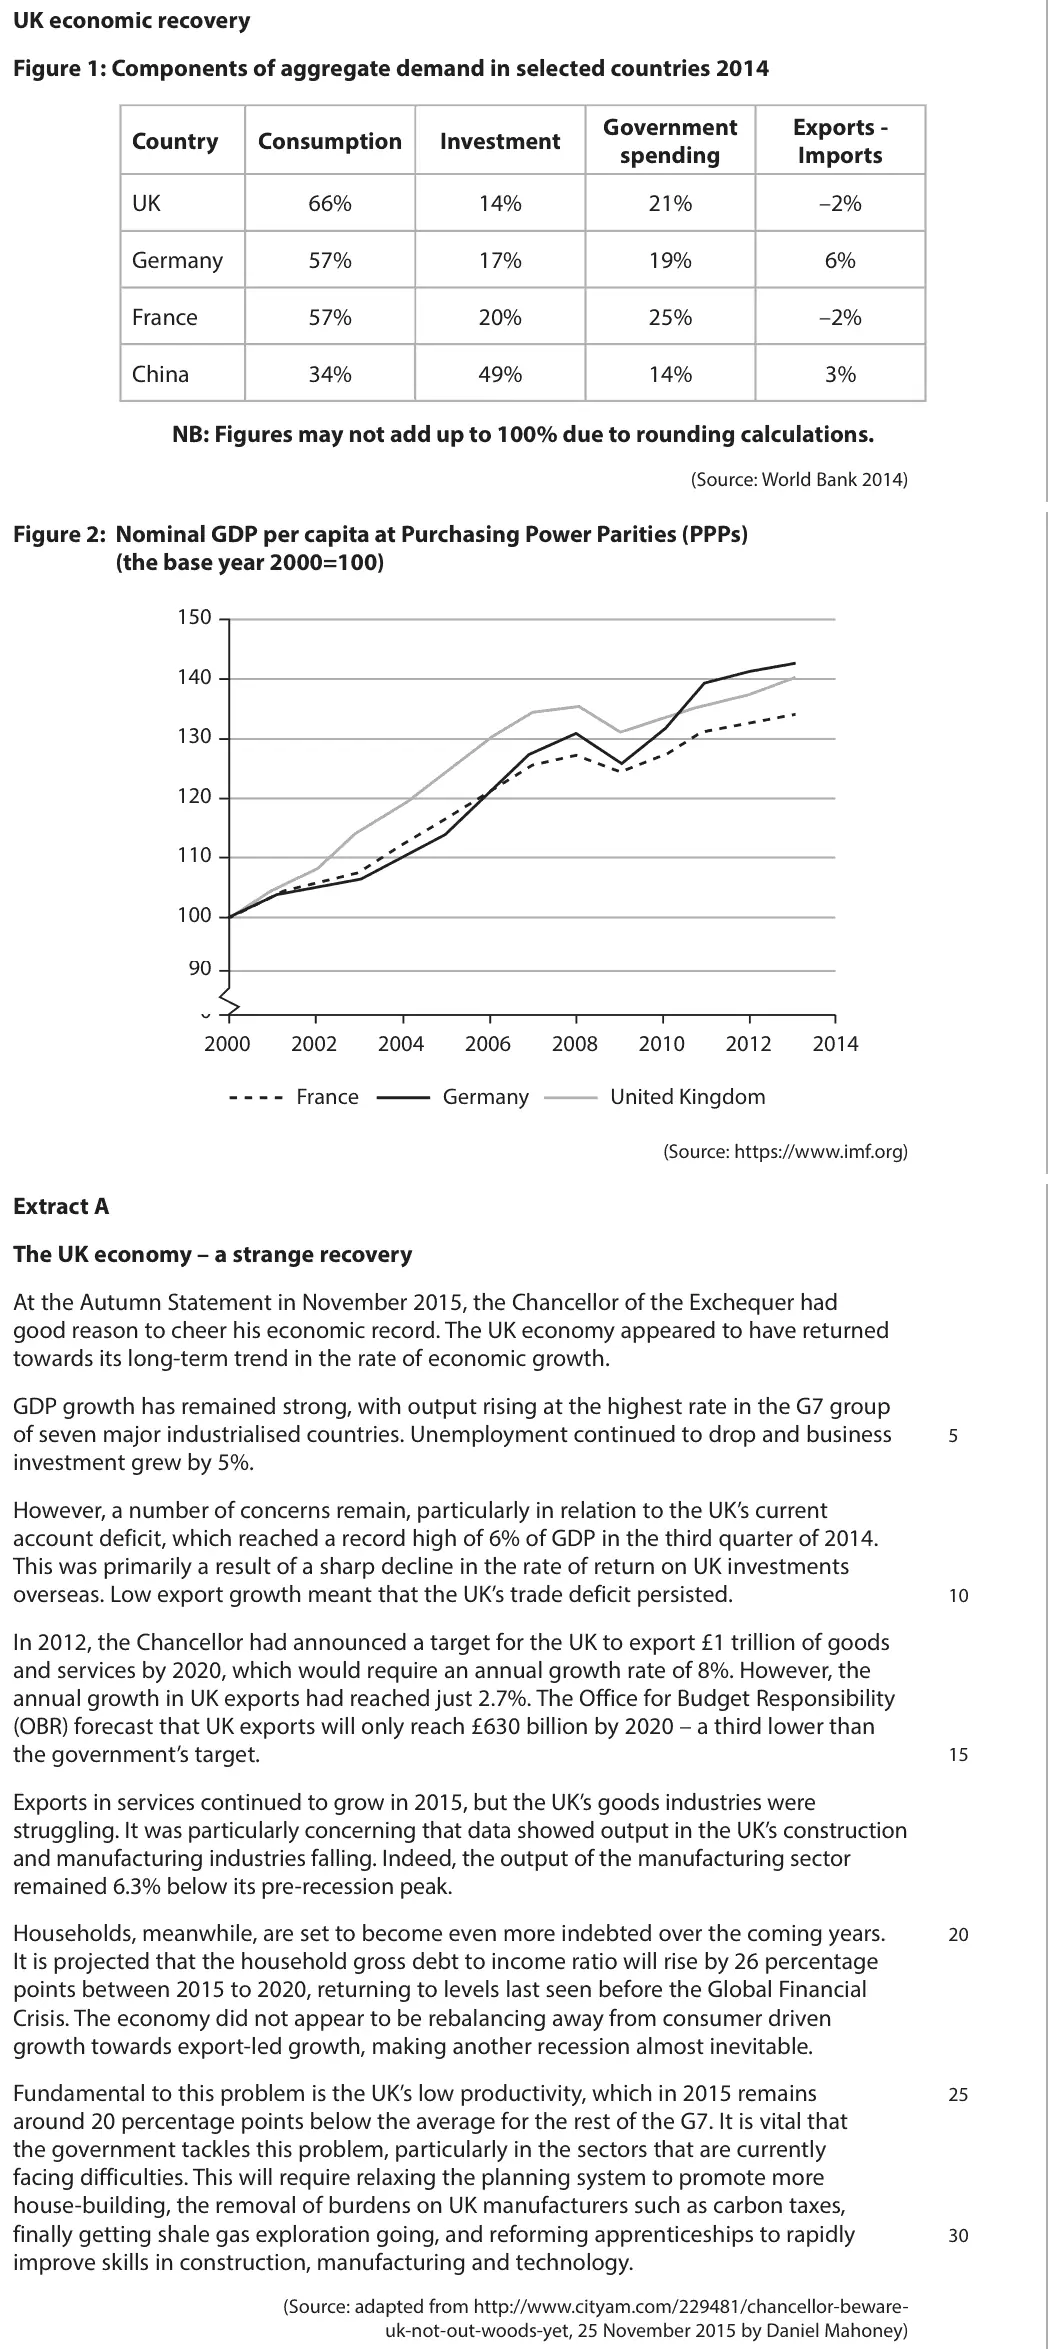
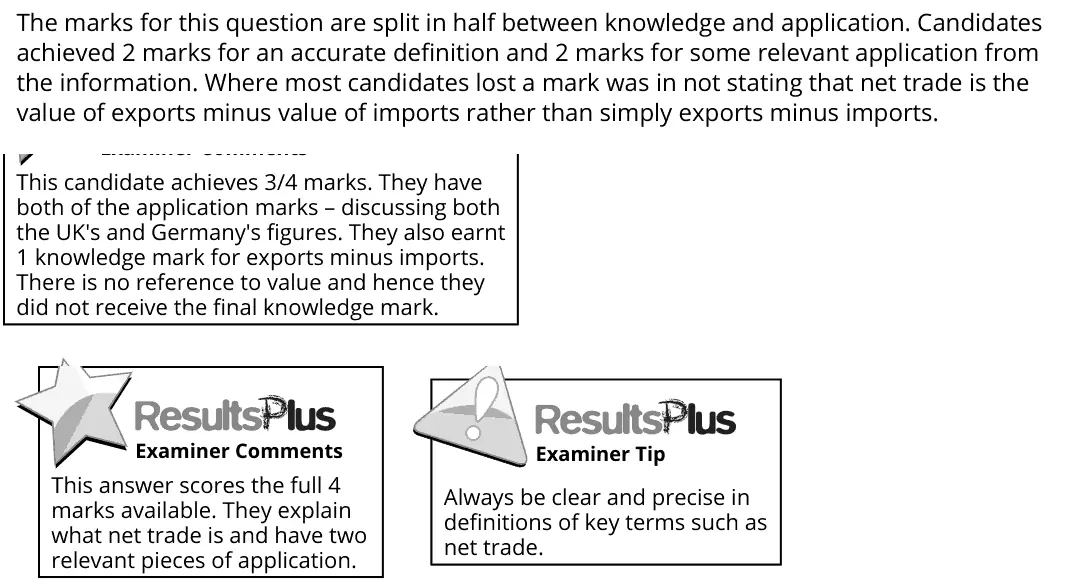
The marks for this question are split in half between knowledge and application. Candidates achieved 2 marks for an accurate definition and 2 marks for some relevant application from the information. Where most candidates lost a mark was in not stating that net trade is the value of exports minus value of imports rather than simply exports minus imports. This candidate achieves 3/4 marks. They have both of the application marks – discussing both the UK's and Germany's figures. They also earnt 1 knowledge mark for exports minus imports. There is no reference to value and hence they did not receive the final knowledge mark. This answer scores the full 4 marks available. They explain what net trade is and have two relevant pieces of application. Always be clear and precise in definitions of key terms such as net trade.
Notes from the mark scheme and report
net trade = value of exports minus value of imports (X - M)
'value' needed for the second knowledge mark
application e.g. UK -2% (deficit), Germany +6% (surplus)
Quantitative skills: QS 9 (interpret, apply and analyse information in written, graphical tabular and numerical forms)
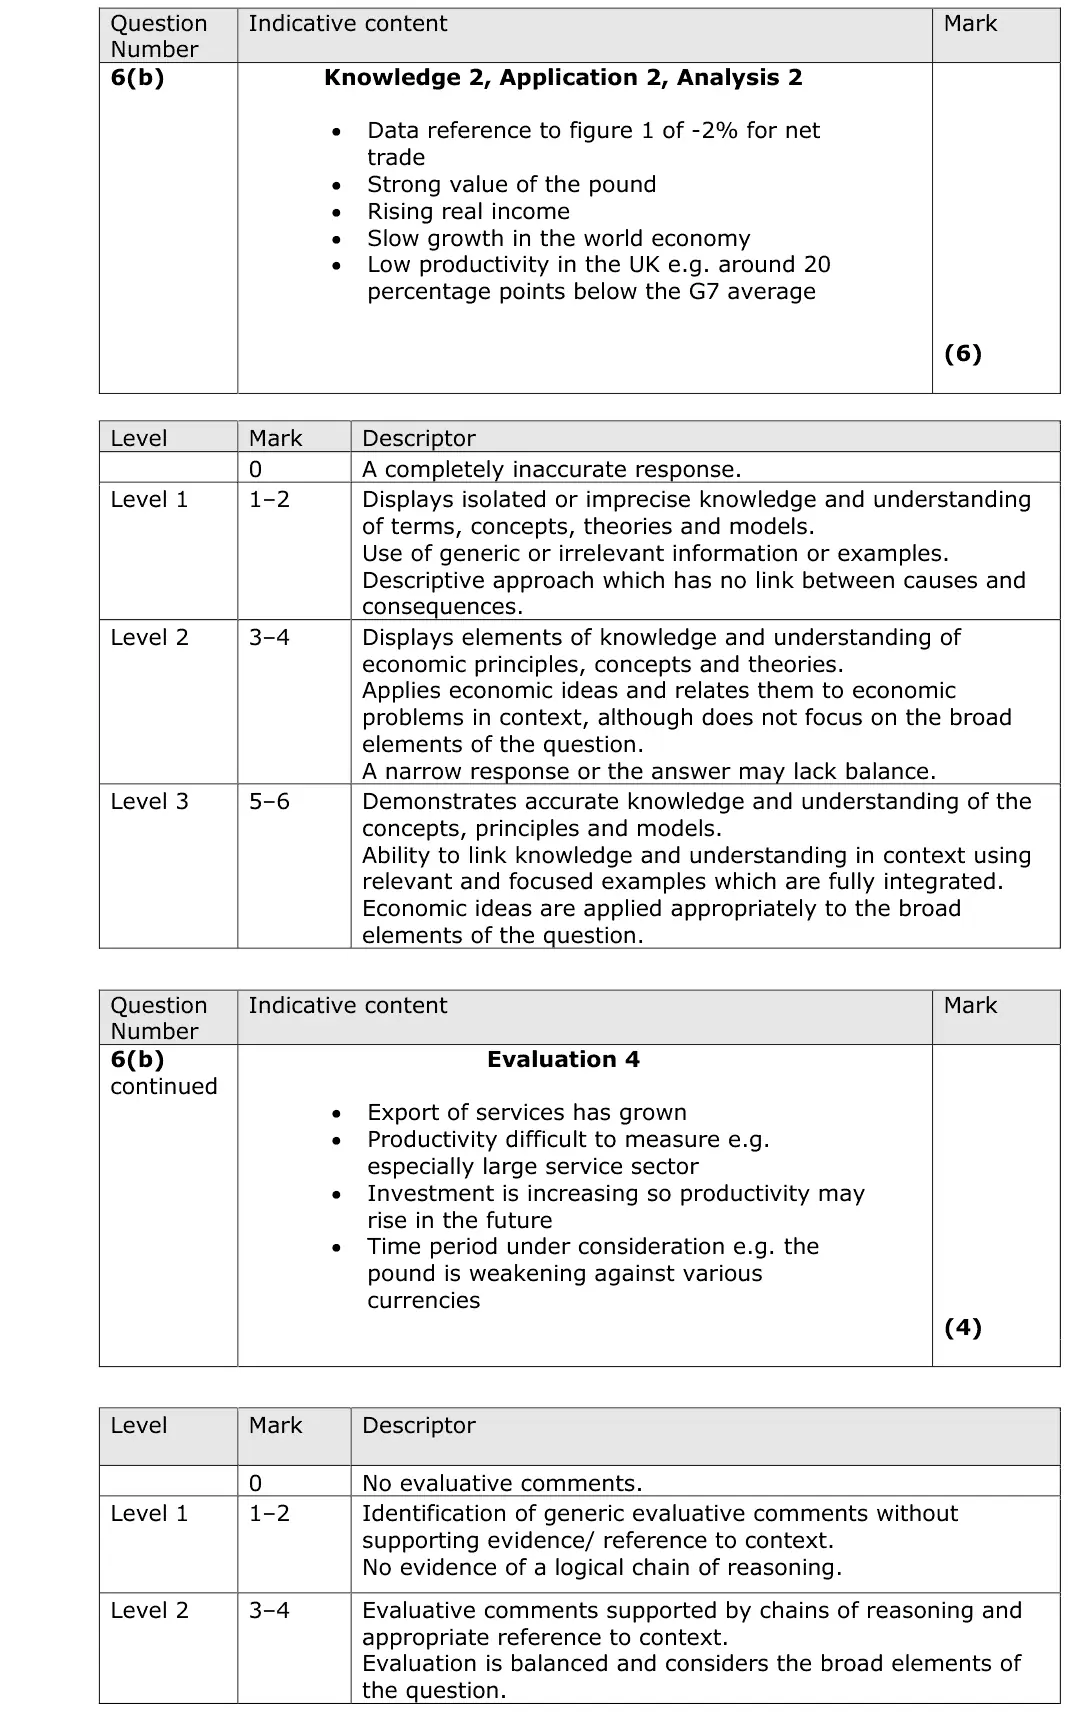
June 2017 · AS Paper 2 · Q6(b)10 marksAO1=2, AO2=2, AO3=2, AO4=410-mark response
Data and extracts for question 6
Mark scheme, including the levels grid and indicative content
Examiner's comment
This question builds on the previous question, considering reasons why the UK might have a current account deficit. In these longer questions the focus for a candidate needs to be on the quality of their answer, bearing in mind the levels mark scheme. They should ensure they are clearly giving step-by-step explanations their reasons. This would then cover the exam skills of knowledge, application, and analysis. There are also 4 marks available here for evaluation – presenting the counter-argument and considering why these reasons may not be valid explanations. Popular comments revolved around the exchange rate and real incomes, coupled with the UK's high marginal propensity to import. Keep the levels in mind – in this case you are aiming for KAA Level 3 and Evaluation Level 2. This is a more able response, scoring the full 10 marks. It clearly and logically explains different reasons for why the UK has a current account deficit and also offers relevant evaluation of these points along the lines of elasticity, which where relevant is often a good topic to use for evaluation. This answer scores 4 marks in total. There is no evaluation and so the highest mark possible is 6/10 marks. In terms of KAA relevant points have been identified but the explanation of them fits with the criteria for Level 2. There is room for a clearer explanation of the points beyond stating them and offering a bit of reasoning.
Notes from the mark scheme and report
causes: strong pound, rising real incomes with a high propensity to import, slow world growth, low productivity (20 points below G7)
4 evaluation marks, e.g. elasticities
no evaluation caps the mark at 6
Quantitative skills: QS 9 (interpret, apply and analyse information in written, graphical tabular and numerical forms)
June 2017 · AS Paper 2 · Q6(c)5 marksAO1=1, AO2=2, AO3=2Short answer
Data and extracts for question 6
Mark scheme
Examiner's comment
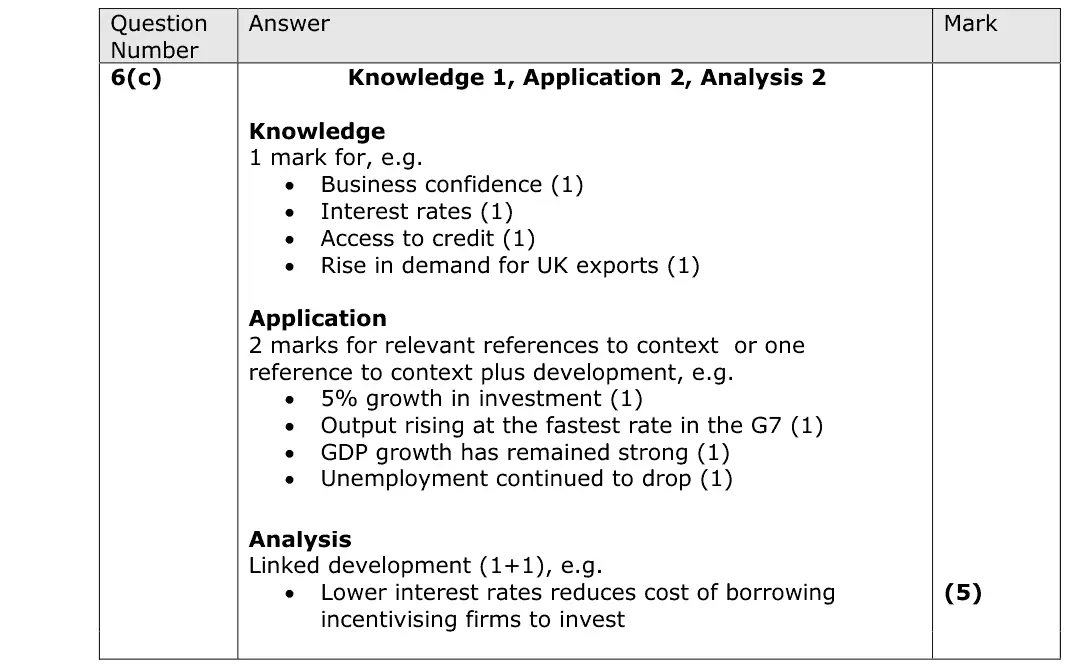
This question asked candidates for one specific reason, so it is important for candidates to make the most of their time in the exam and not explain two reasons. A number of possibilities could be explained here, such as interest rates and business confidence. Popular application included the 5% growth in UK investment and unemployment falling. Candidates should remember that in these shorter questions examiners are looking for specific pieces of application. This brief answer provides exactly what the examiner is looking for. A relevant point in the form of interest rates which is clearly analysed along with application from the extract. Be concise and stick to the point in these shorter questions. This answer achieves a score of 4/5 marks. It has identified a relevant point and has application also. However, the analysis is somewhat limited. A more detailed explanation is needed of the link between economic growth and investment.
Notes from the mark scheme and report
one influence only (e.g. interest rates, business confidence, rising demand)
application: investment grew 5%, fastest output growth in the G7
develop the link e.g. lower borrowing costs raise the return on investment
June 2017 · Paper 3 · Q1(e)25 marksAO1=4, AO2=4, AO3=8, AO4=925-mark essayEither/or
Data and extracts for question 1
Mark scheme, including the levels grid and indicative content
Examiner's comment
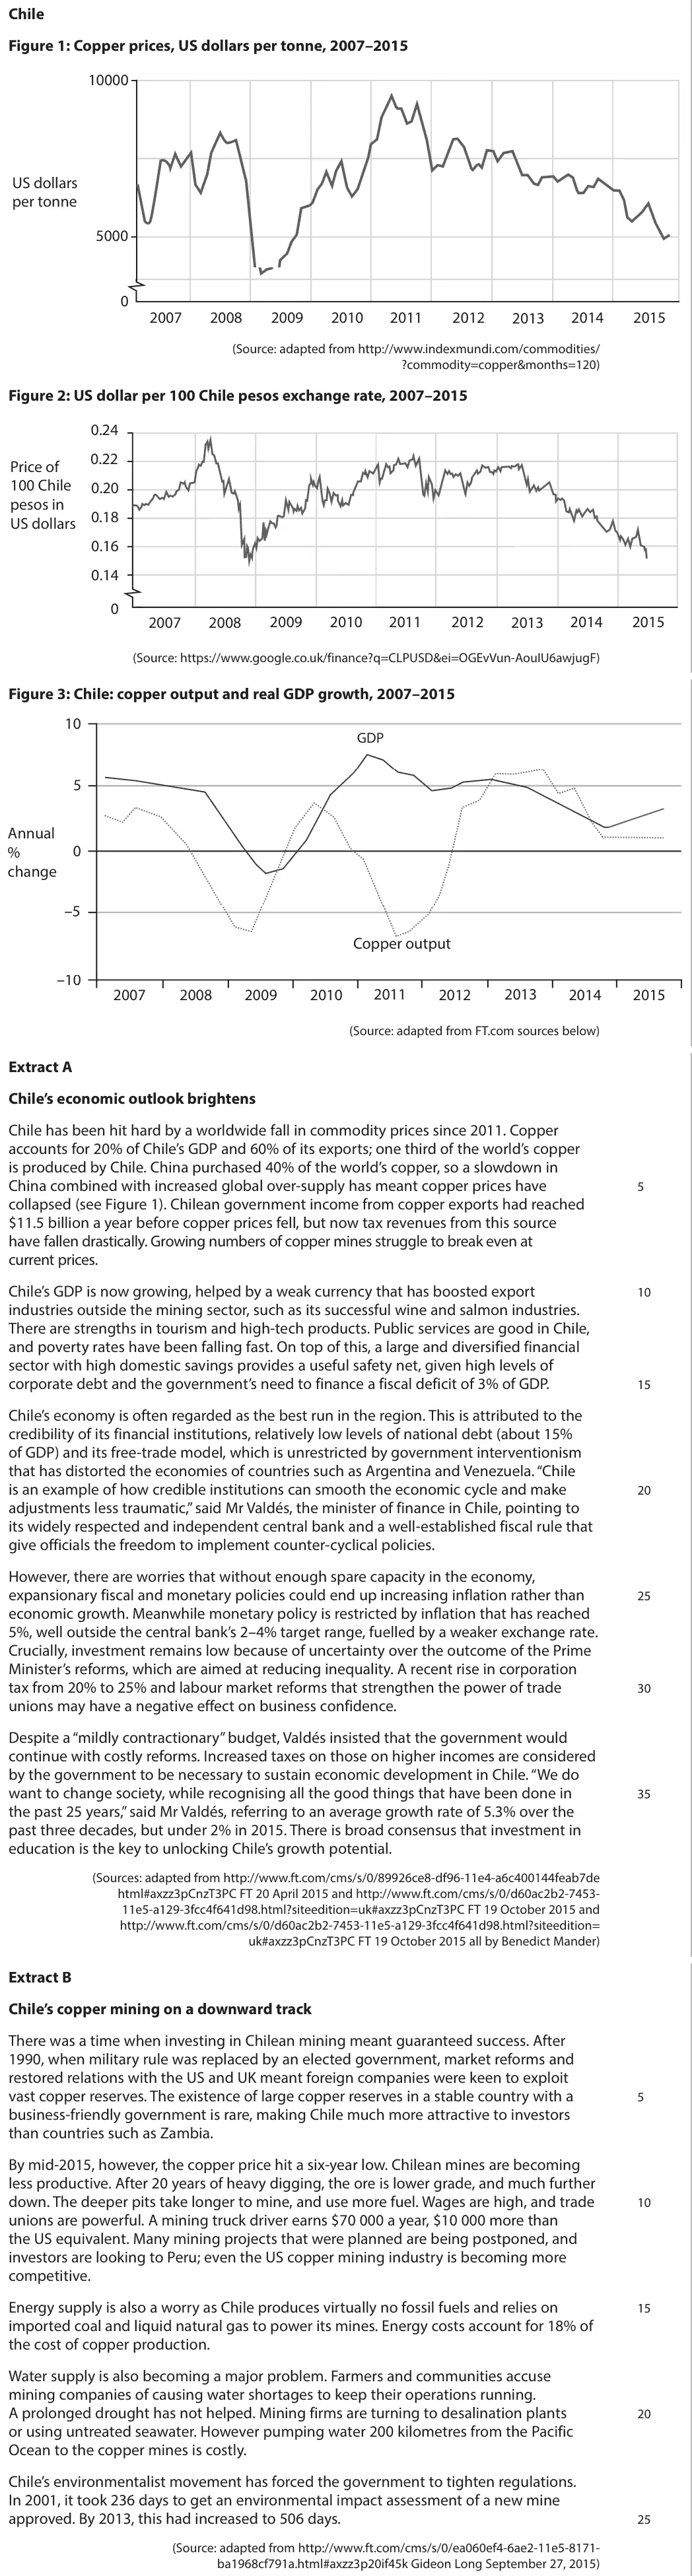
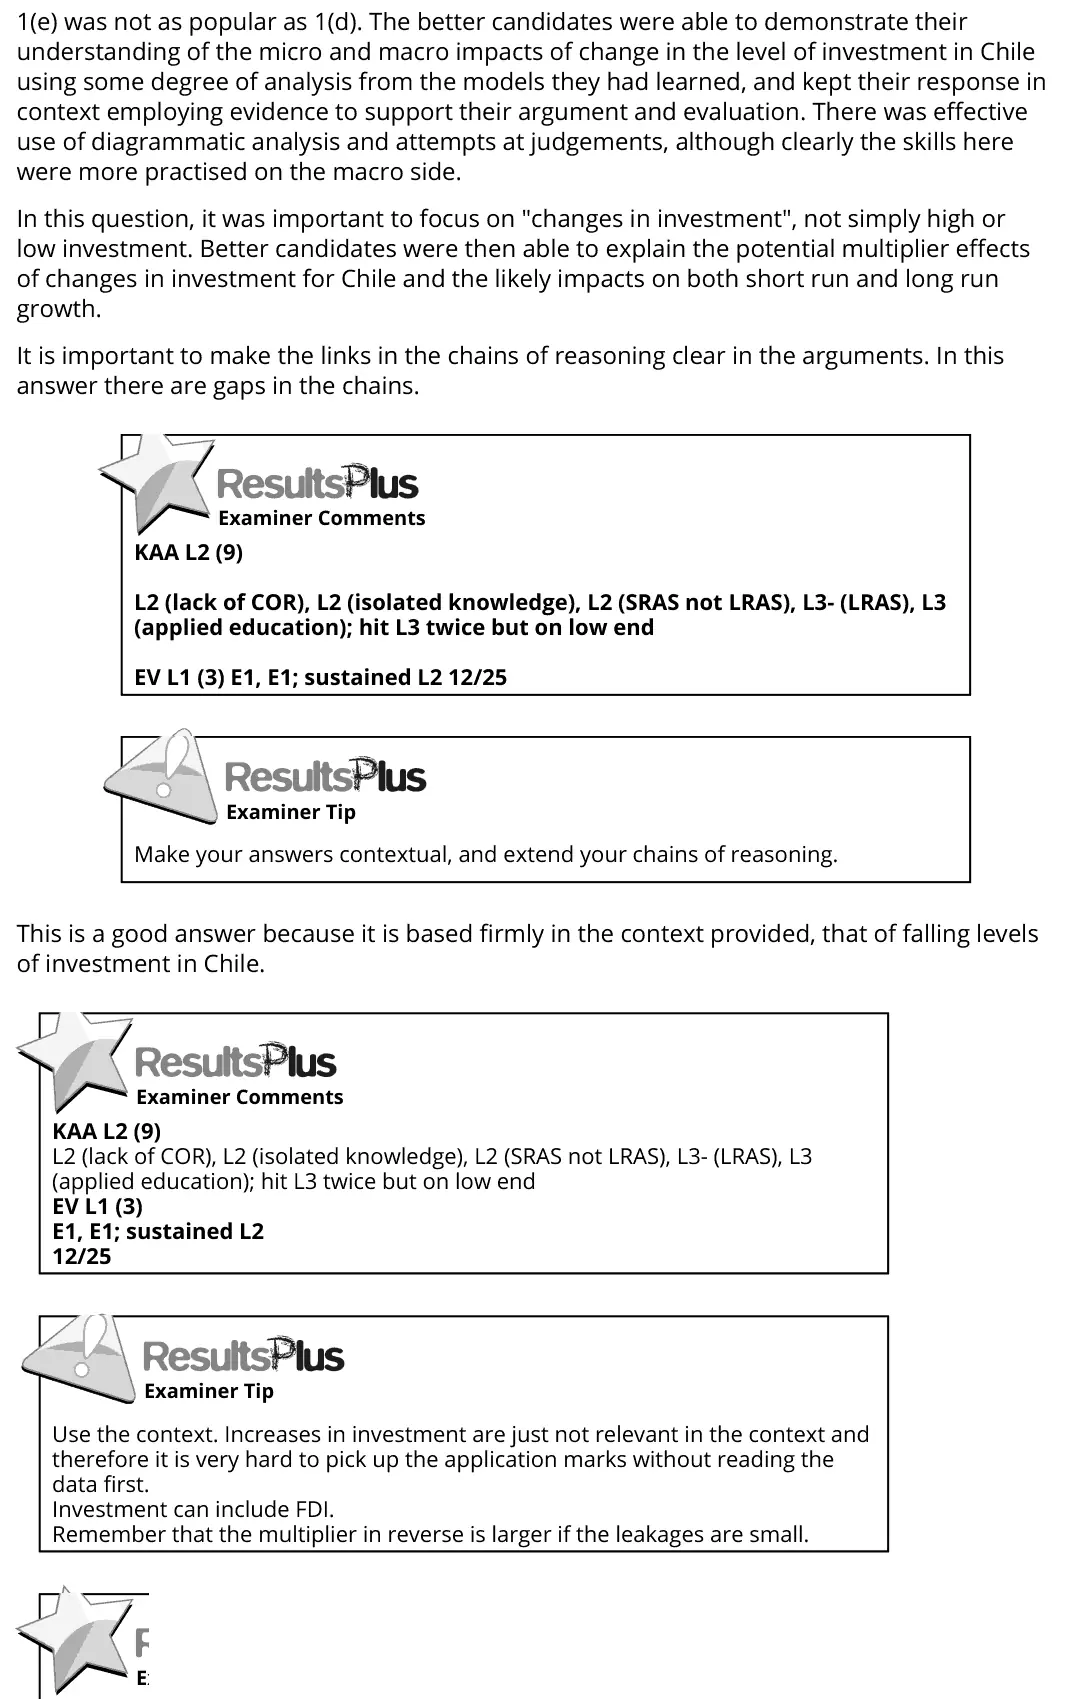
1(e) was not as popular as 1(d). The better candidates were able to demonstrate their understanding of the micro and macro impacts of change in the level of investment in Chile using some degree of analysis from the models they had learned, and kept their response in context employing evidence to support their argument and evaluation. There was effective use of diagrammatic analysis and attempts at judgements, although clearly the skills here were more practised on the macro side. In this question, it was important to focus on "changes in investment", not simply high or low investment. Better candidates were then able to explain the potential multiplier effects of changes in investment for Chile and the likely impacts on both short run and long run growth. It is important to make the links in the chains of reasoning clear in the arguments. In this answer there are gaps in the chains. This is a good answer because it is based firmly in the context provided, that of falling levels of investment in Chile. KAA L2 (9) L2 (lack of COR), L2 (isolated knowledge), L2 (SRAS not LRAS), L3- (LRAS), L3 (applied education); hit L3 twice but on low end EV L1 (3) E1, E1; sustained L2 12/25 Make your answers contextual, and extend your chains of reasoning. KAA L2 (9) L2 (lack of COR), L2 (isolated knowledge), L2 (SRAS not LRAS), L3- (LRAS), L3 (applied education); hit L3 twice but on low end EV L1 (3) E1, E1; sustained L2 12/25 Use the context. Increases in investment are just not relevant in the context and therefore it is very hard to pick up the application marks without reading the data first. Investment can include FDI. Remember that the multiplier in reverse is larger if the leakages are small.
Notes from the mark scheme and report
focus on changes in investment, not high or low levels
AD shift with multiplier and LRAS shift from capacity (e.g. education)
micro effects on workers and firms
effects only on Chile, not causes of investment
evaluate Keynesian v classical view, FDI and the balance of payments
June 2016 · AS Paper 2 · Q4(b)3 marksAO1=1, AO2=1, AO3=1Short answer
Data and extracts for question 4
Mark scheme
Examiner's comment
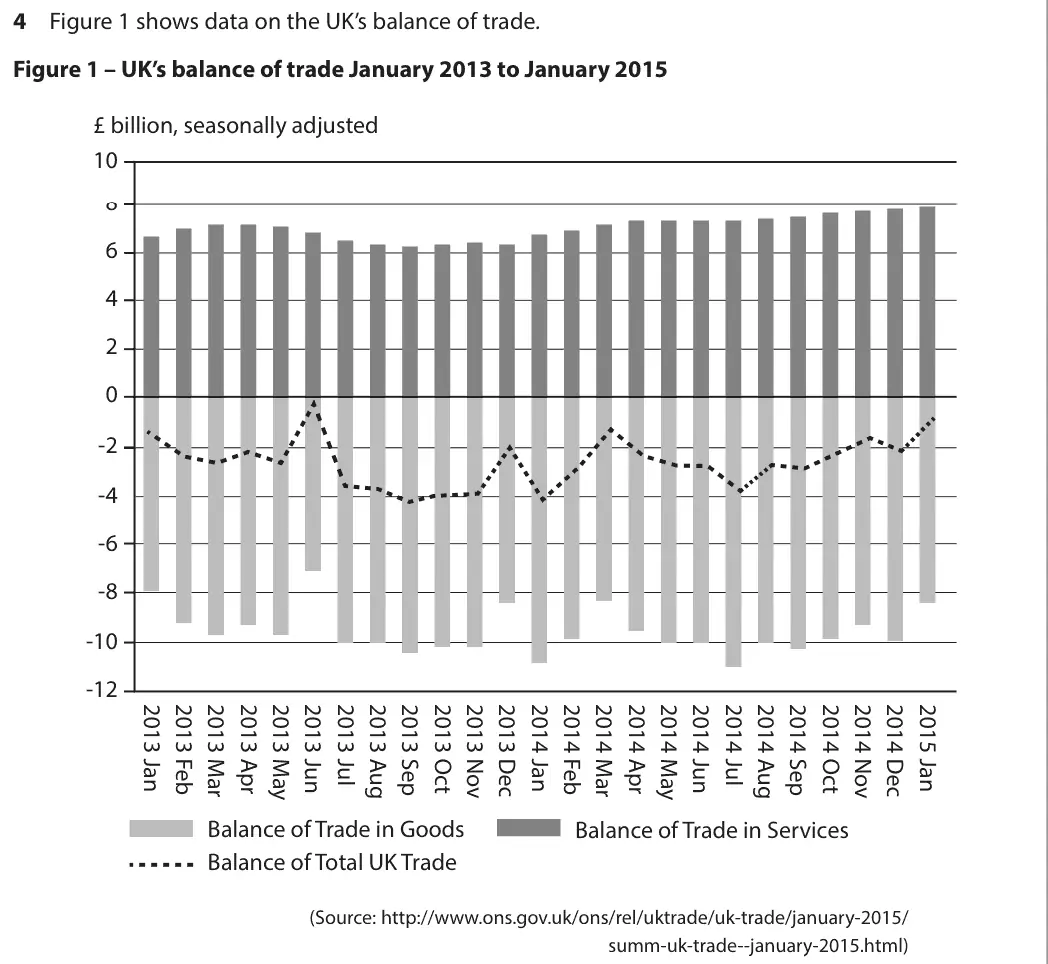
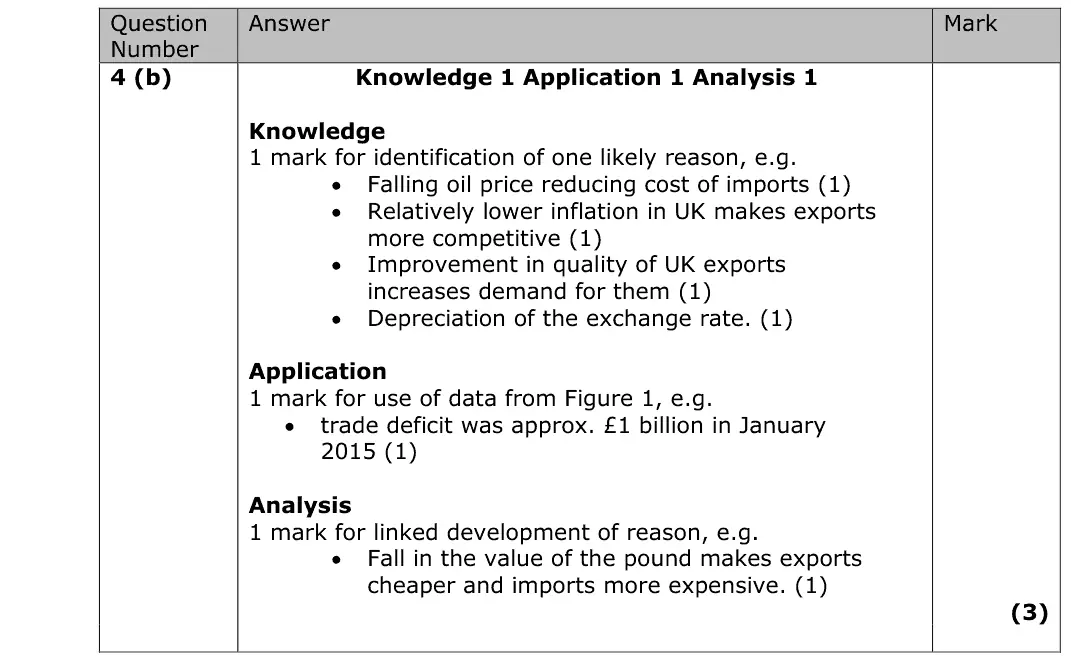
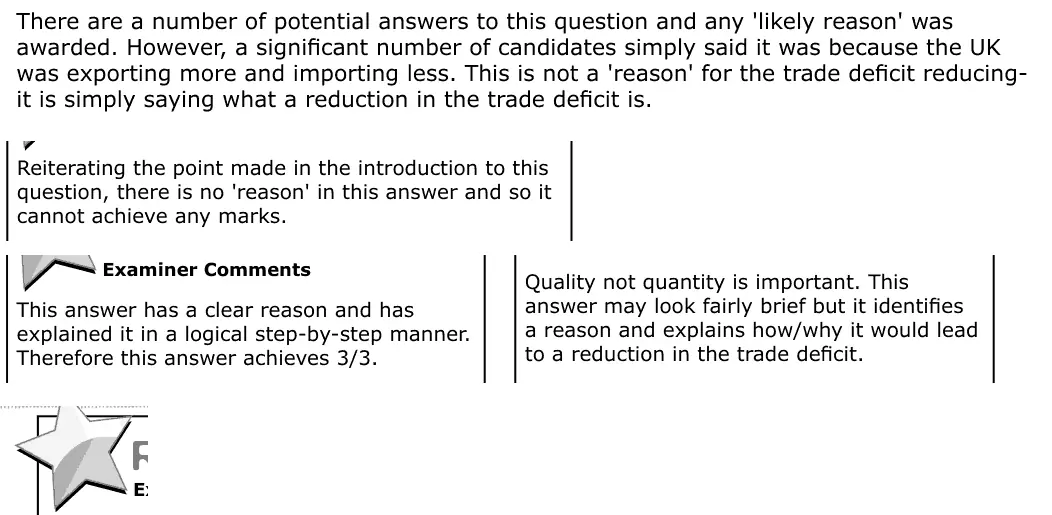
There are a number of potential answers to this question and any 'likely reason' was awarded. However, a significant number of candidates simply said it was because the UK was exporting more and importing less. This is not a 'reason' for the trade deficit reducing- it is simply saying what a reduction in the trade deficit is. Reiterating the point made in the introduction to this question, there is no 'reason' in this answer and so it cannot achieve any marks. This answer has a clear reason and has explained it in a logical step-by-step manner. Therefore this answer achieves 3/3. Quality not quantity is important. This answer may look fairly brief but it identifies a reason and explains how/why it would lead to a reduction in the trade deficit.
Notes from the mark scheme and report
a reason (falling oil price cutting import costs, relatively low UK inflation, depreciation, better export quality) explained step by step
quote the deficit of about £1 billion in January 2015
report: many just said exports rose and imports fell, which is a description not a reason
Quantitative skills: QS 9 (interpret, apply and analyse information in written, graphical tabular and numerical forms)
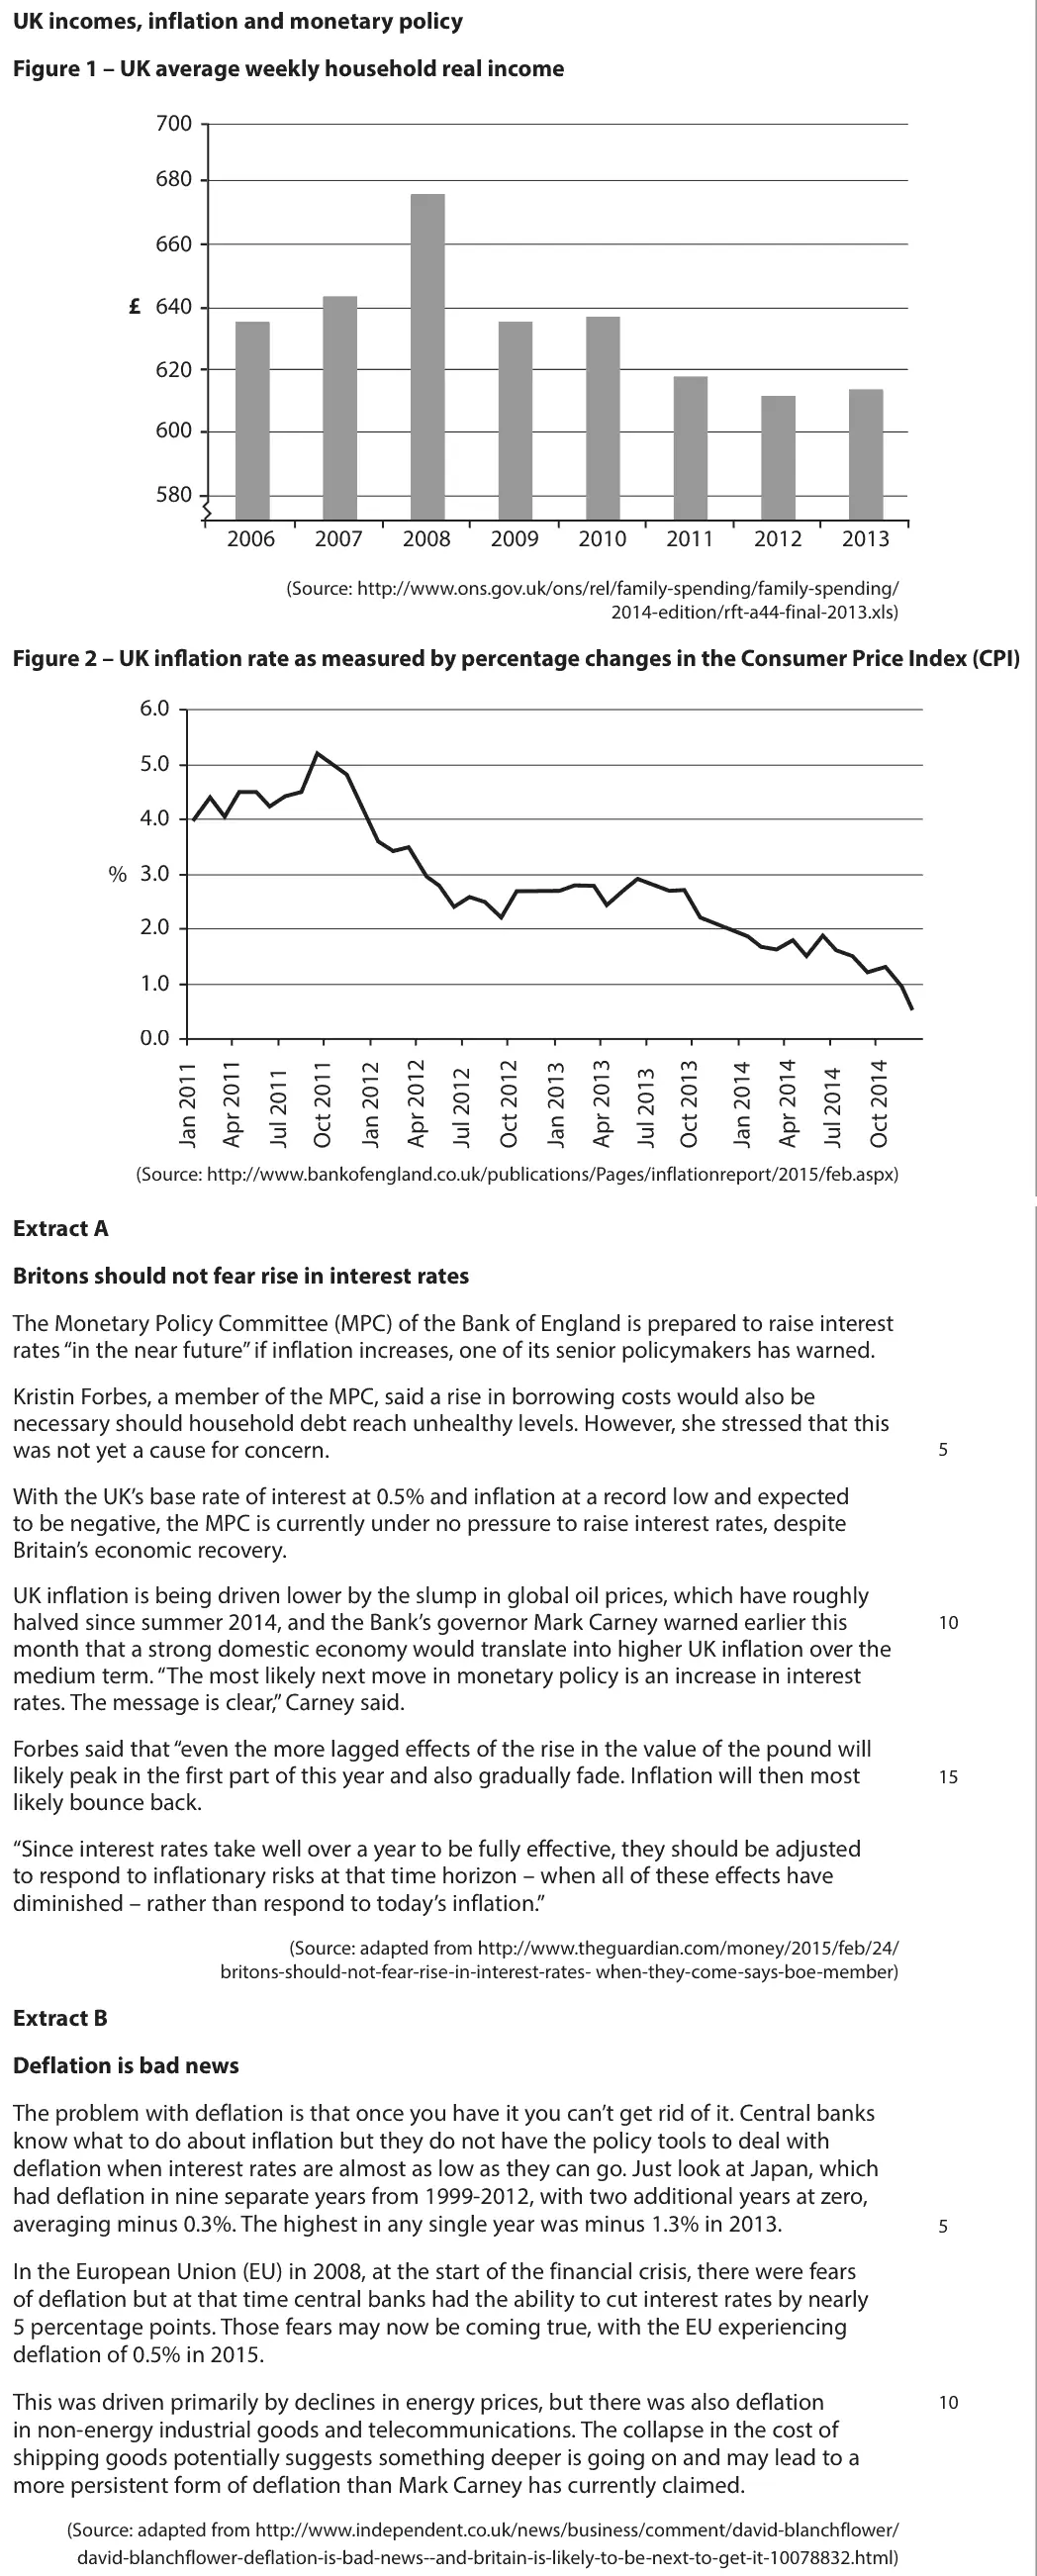
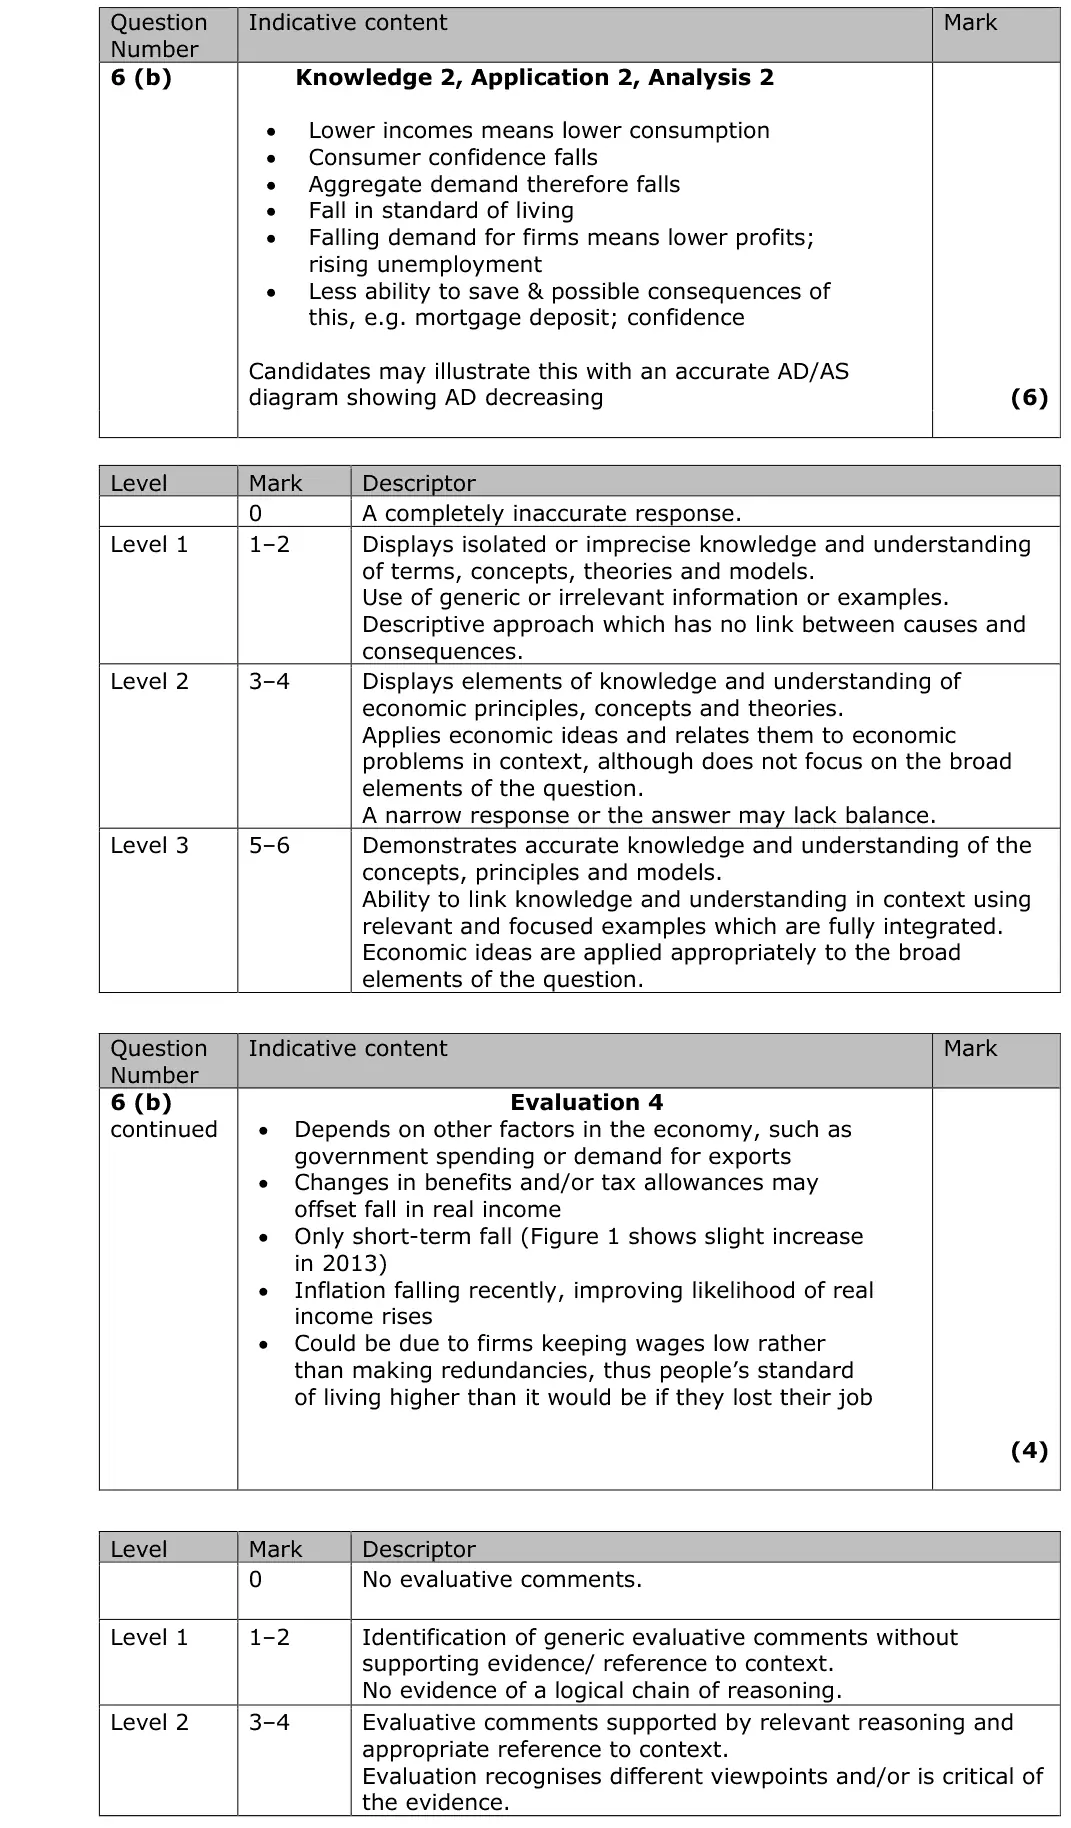
June 2016 · AS Paper 2 · Q6(b)10 marksAO1=2, AO2=2, AO3=2, AO4=410-mark response
Data and extracts for question 6
Mark scheme, including the levels grid and indicative content
Examiner's comment
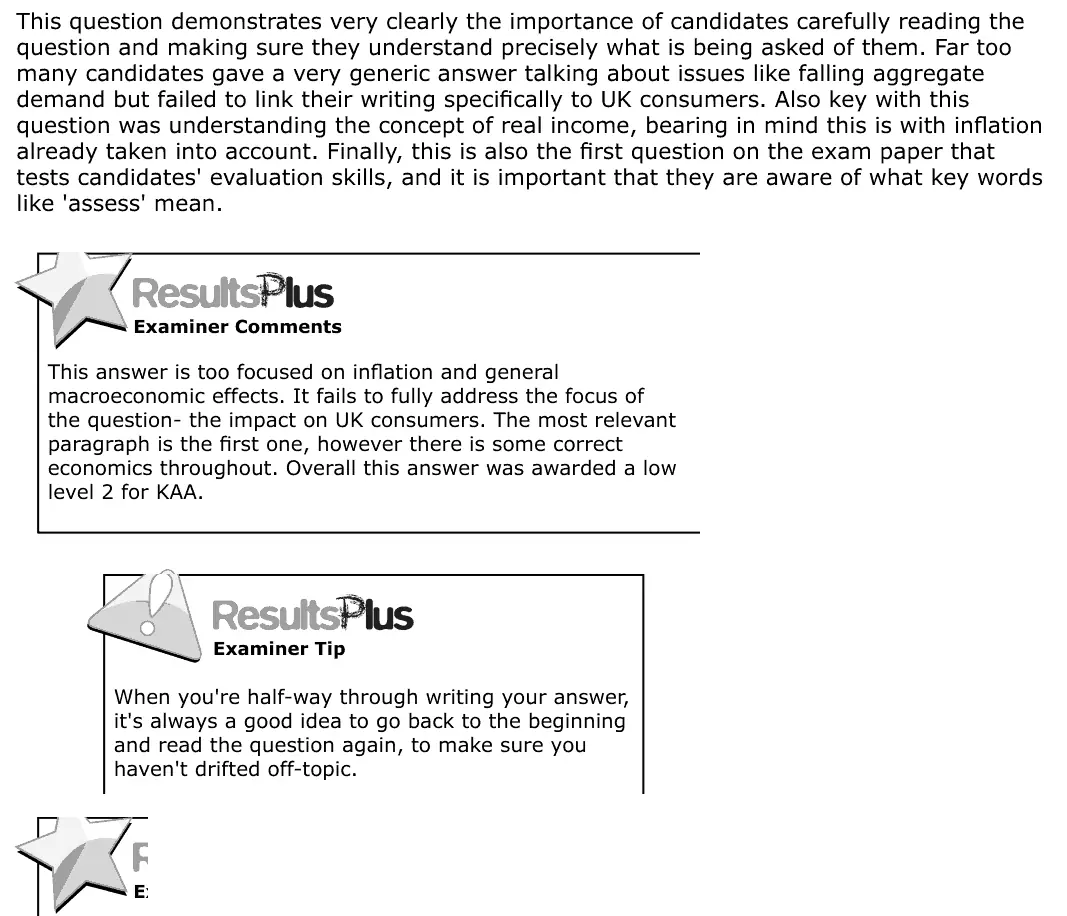
This question demonstrates very clearly the importance of candidates carefully reading the question and making sure they understand precisely what is being asked of them. Far too many candidates gave a very generic answer talking about issues like falling aggregate demand but failed to link their writing specifically to UK consumers. Also key with this question was understanding the concept of real income, bearing in mind this is with inflation already taken into account. Finally, this is also the first question on the exam paper that tests candidates' evaluation skills, and it is important that they are aware of what key words like 'assess' mean. This answer is too focused on inflation and general macroeconomic effects. It fails to fully address the focus of the question- the impact on UK consumers. The most relevant paragraph is the first one, however there is some correct economics throughout. Overall this answer was awarded a low level 2 for KAA. When you're half-way through writing your answer, it's always a good idea to go back to the beginning and read the question again, to make sure you haven't drifted off-topic.
Notes from the mark scheme and report
link every point to UK consumers: lower consumption, confidence, saving and living standards
real income already allows for inflation
report: "far too many candidates gave a very generic answer" about AD without linking to consumers
June 2016 · AS Paper 2 · Q6(c)5 marksAO1=1, AO2=2, AO3=2Short answer
Data and extracts for question 6
Mark scheme
Examiner's comment
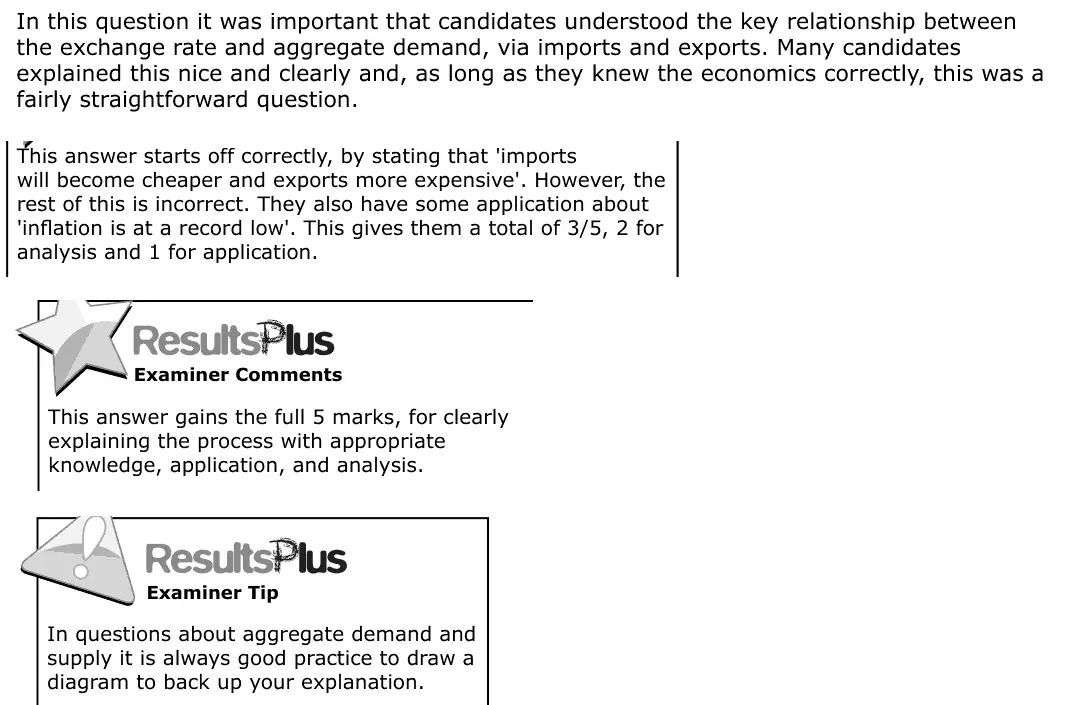
In this question it was important that candidates understood the key relationship between the exchange rate and aggregate demand, via imports and exports. Many candidates explained this nice and clearly and, as long as they knew the economics correctly, this was a fairly straightforward question. This answer starts off correctly, by stating that 'imports will become cheaper and exports more expensive'. However, the rest of this is incorrect. They also have some application about 'inflation is at a record low'. This gives them a total of 3/5, 2 for analysis and 1 for application. This answer gains the full 5 marks, for clearly explaining the process with appropriate knowledge, application, and analysis. In questions about aggregate demand and supply it is always good practice to draw a diagram to back up your explanation.
Notes from the mark scheme and report
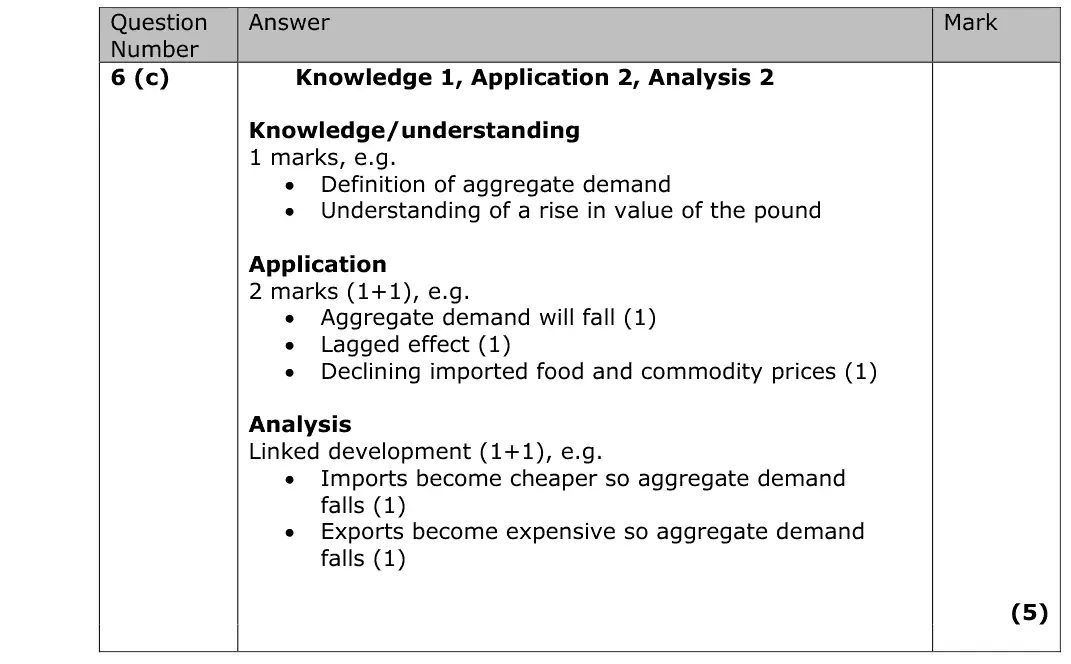
a stronger pound makes exports dearer and imports cheaper, so (X - M) and AD fall
apply the lagged effect and cheaper imported commodities from Extract A
Work with an Edexcel economics tutor
Essays stuck in Level 2, or losing the easy marks in Section A? Book a trial session with Lianne, a former Edexcel examiner.