Notes and key-term cards for this topic are being written by our tutors. The past-paper questions below are ready now.
Specification statements
4.3.1Measures of development: a) The three dimensions of the Human Development Index (HDI) (education, health and living standards) and how they are measured and combined b) The advantages and limitations of using the HDI to compare levels of development between countries and over time c) Other indicators of development
4.3.2Factors influencing growth and development: a) Impact of economic factors in different countries: • primary product dependency • volatility of commodity prices • savings gap: Harrod-Domar model • foreign currency gap • capital flight • demographic factors • debt • access to credit and banking • infrastructure • education/skills • absence of property rights b) Impact of non-economic factors in different countries
4.3.3Strategies influencing growth and development: a) Market-orientated strategies: • trade liberalisation • promotion of FDI • removal of government subsidies • floating exchange rate systems • microfinance schemes • privatisation b) Interventionist strategies: • development of human capital • protectionism • managed exchange rates • infrastructure development • promoting joint ventures with global companies • buffer stock schemes c) Other strategies: • industrialisation: the Lewis model • development of tourism • development of primary industries • Fairtrade schemes • aid • debt relief d) Awareness of the role of international institutions and non-government organisations (NGOs): • World Bank • International Monetary Fund (IMF) • NGOs
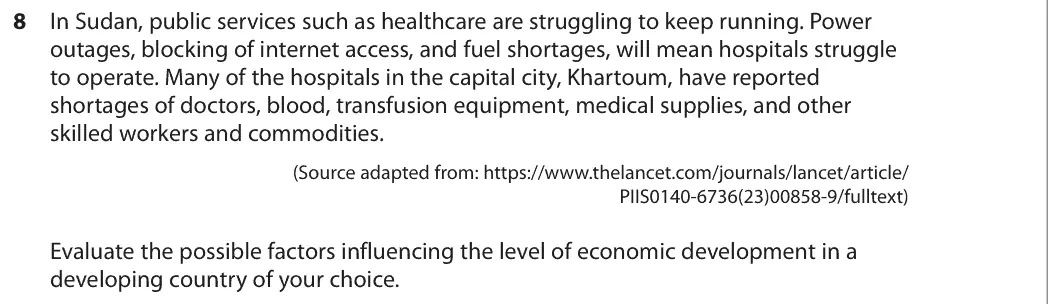
In Sudan, public services such as healthcare are struggling to keep running. Power outages, blocking of internet access, and fuel shortages, will mean hospitals struggle to operate. Many of the hospitals in the capital city, Khartoum, have reported shortages of doctors, blood, transfusion equipment, medical supplies, and other skilled workers and commodities. (Source adapted from: https://www.thelancet.com/journals/lancet/article/ PIIS0140‑6736(23)00858‑9/fulltext) Evaluate the possible factors influencing the level of economic development in a developing country of your choice.
Evaluate the microeconomic and macroeconomic strategies that could be used to promote development in Kenya, or another developing country of your choice.
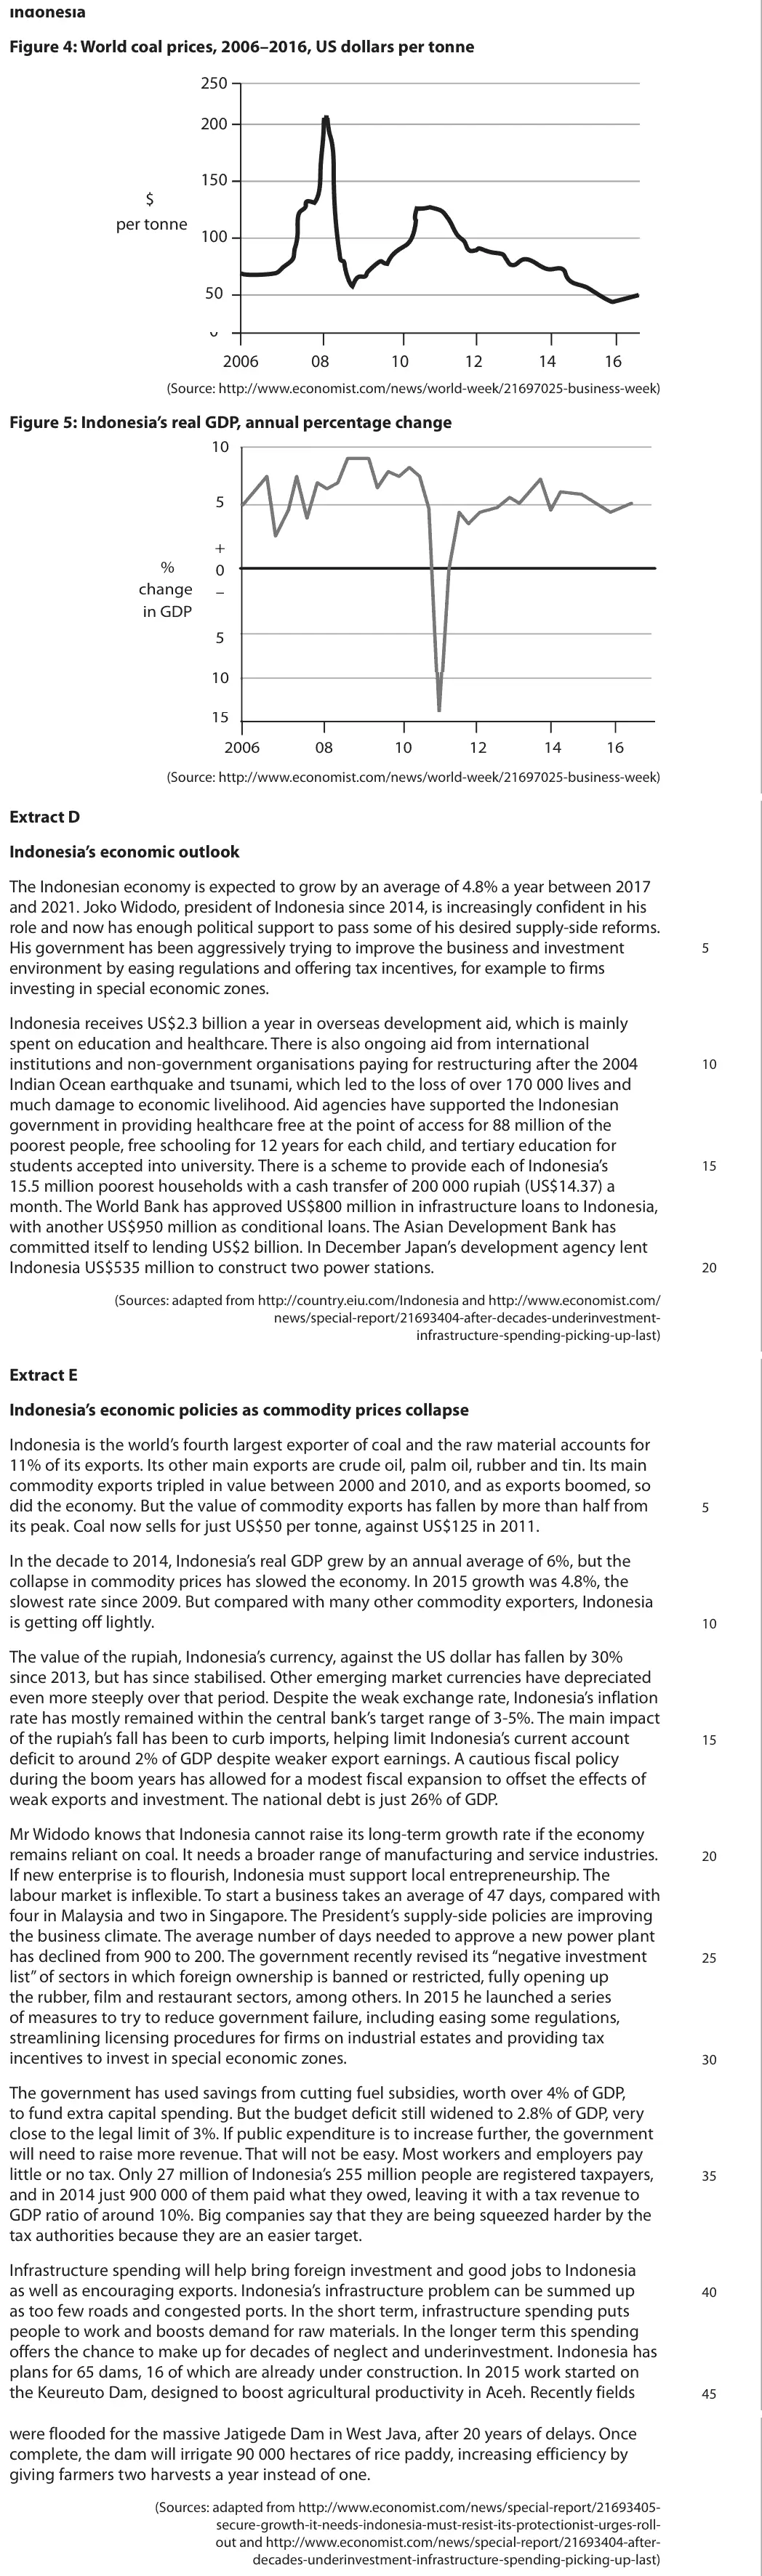
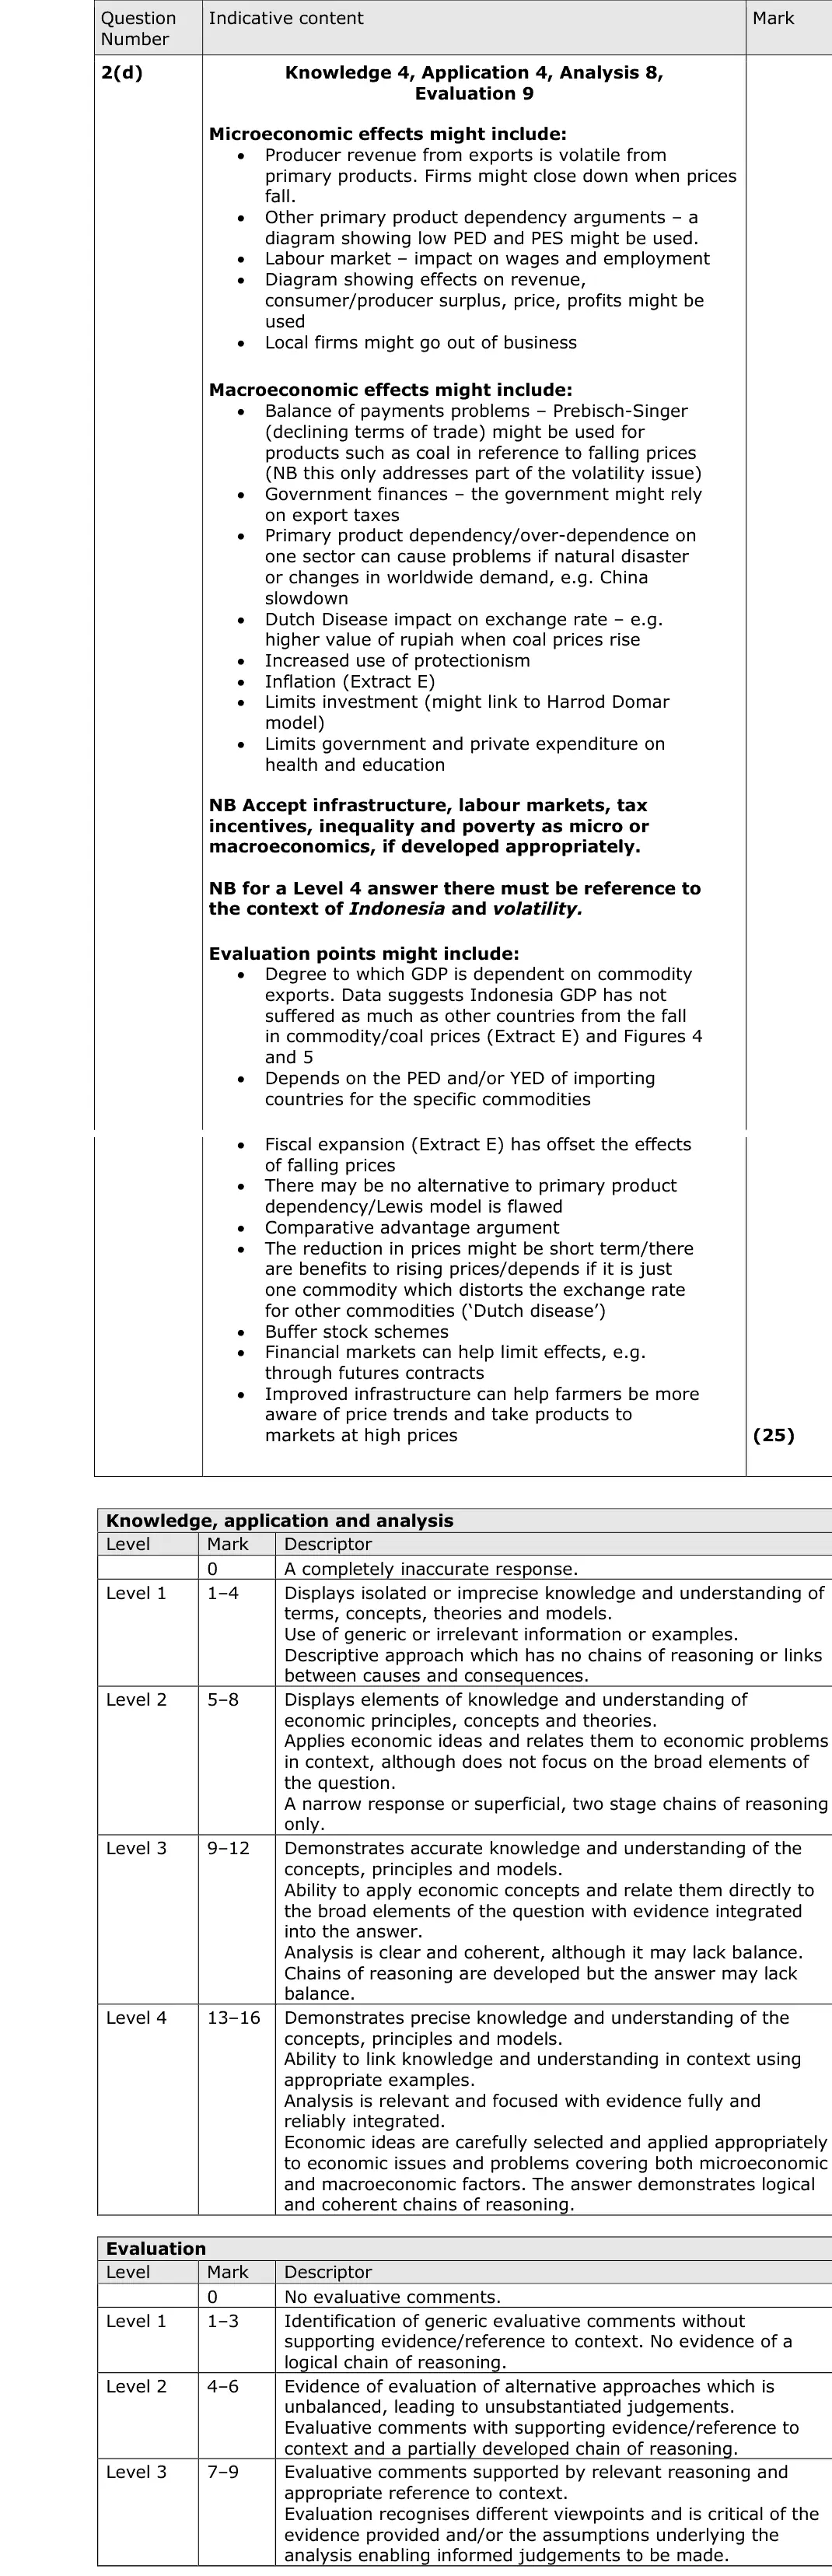
With reference to the information provided and your own knowledge, evaluate the microeconomic and macroeconomic effects on Indonesia of the volatility of prices of commodities such as coal.
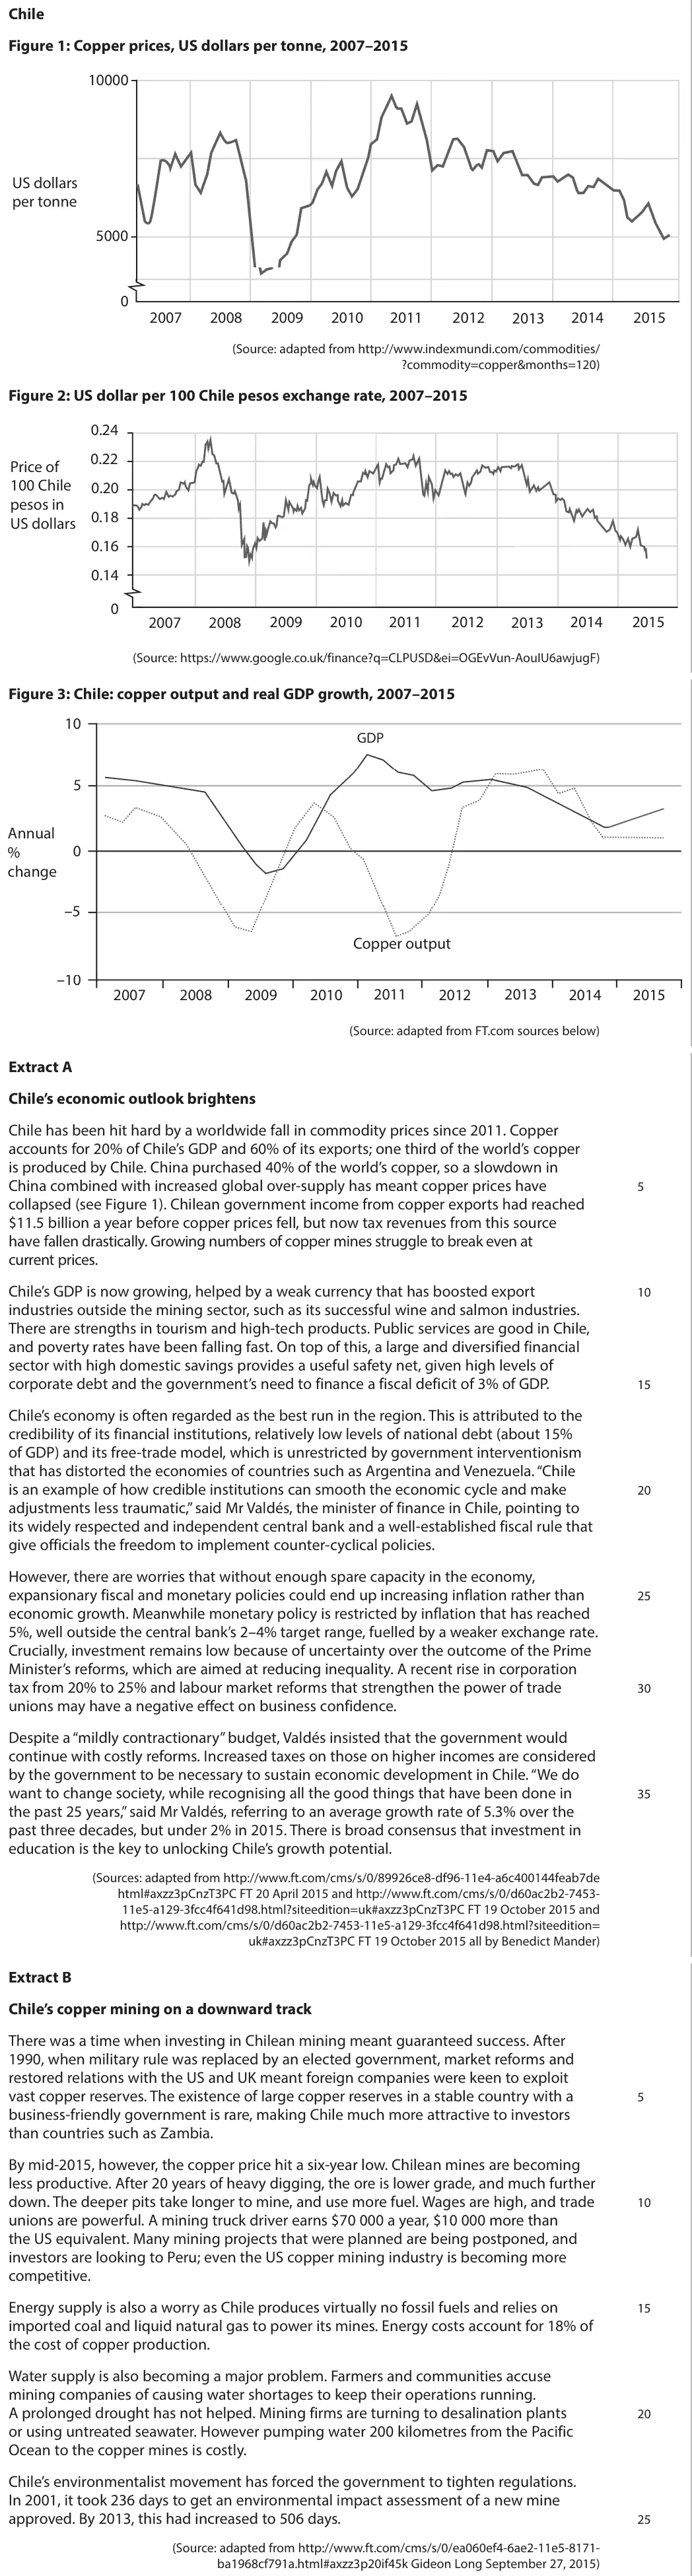
With reference to the information provided and your own knowledge, evaluate the microeconomic and macroeconomic effects of policies that could be used to stimulate economic growth and development in Chile.
Tap a question to zoom it. The data and extracts fold out above each question; the mark scheme and examiner's comment open underneath.
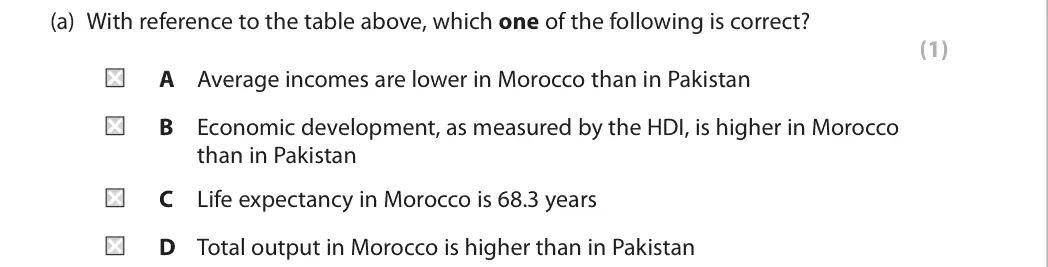
June 2025 · Paper 2 · Q1(a)1 markMultiple choice
Data and extracts for question 1
Answer
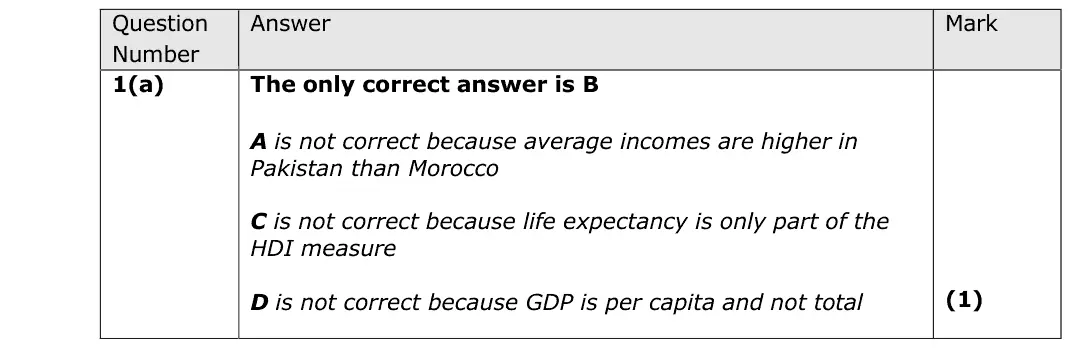
B
Mark scheme
Notes from the mark scheme and report
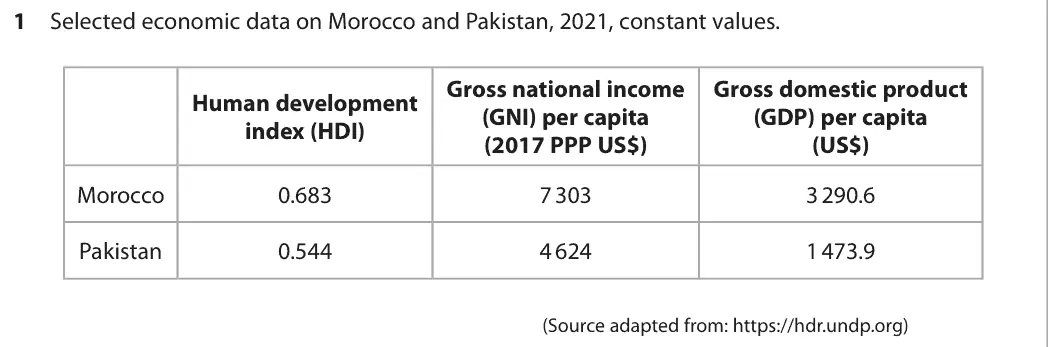
Morocco's HDI 0.683 is above Pakistan's 0.544, so development as measured by HDI is higher in Morocco (B)
A is wrong as Morocco's incomes are higher
C: life expectancy is only one part of HDI, 0.683 is not 68.3 years
D: the data are per capita, not total output
Quantitative skills: QS 11 (understand composite indicators); QS 9 (interpret, apply and analyse information in written, graphical tabular and numerical forms)
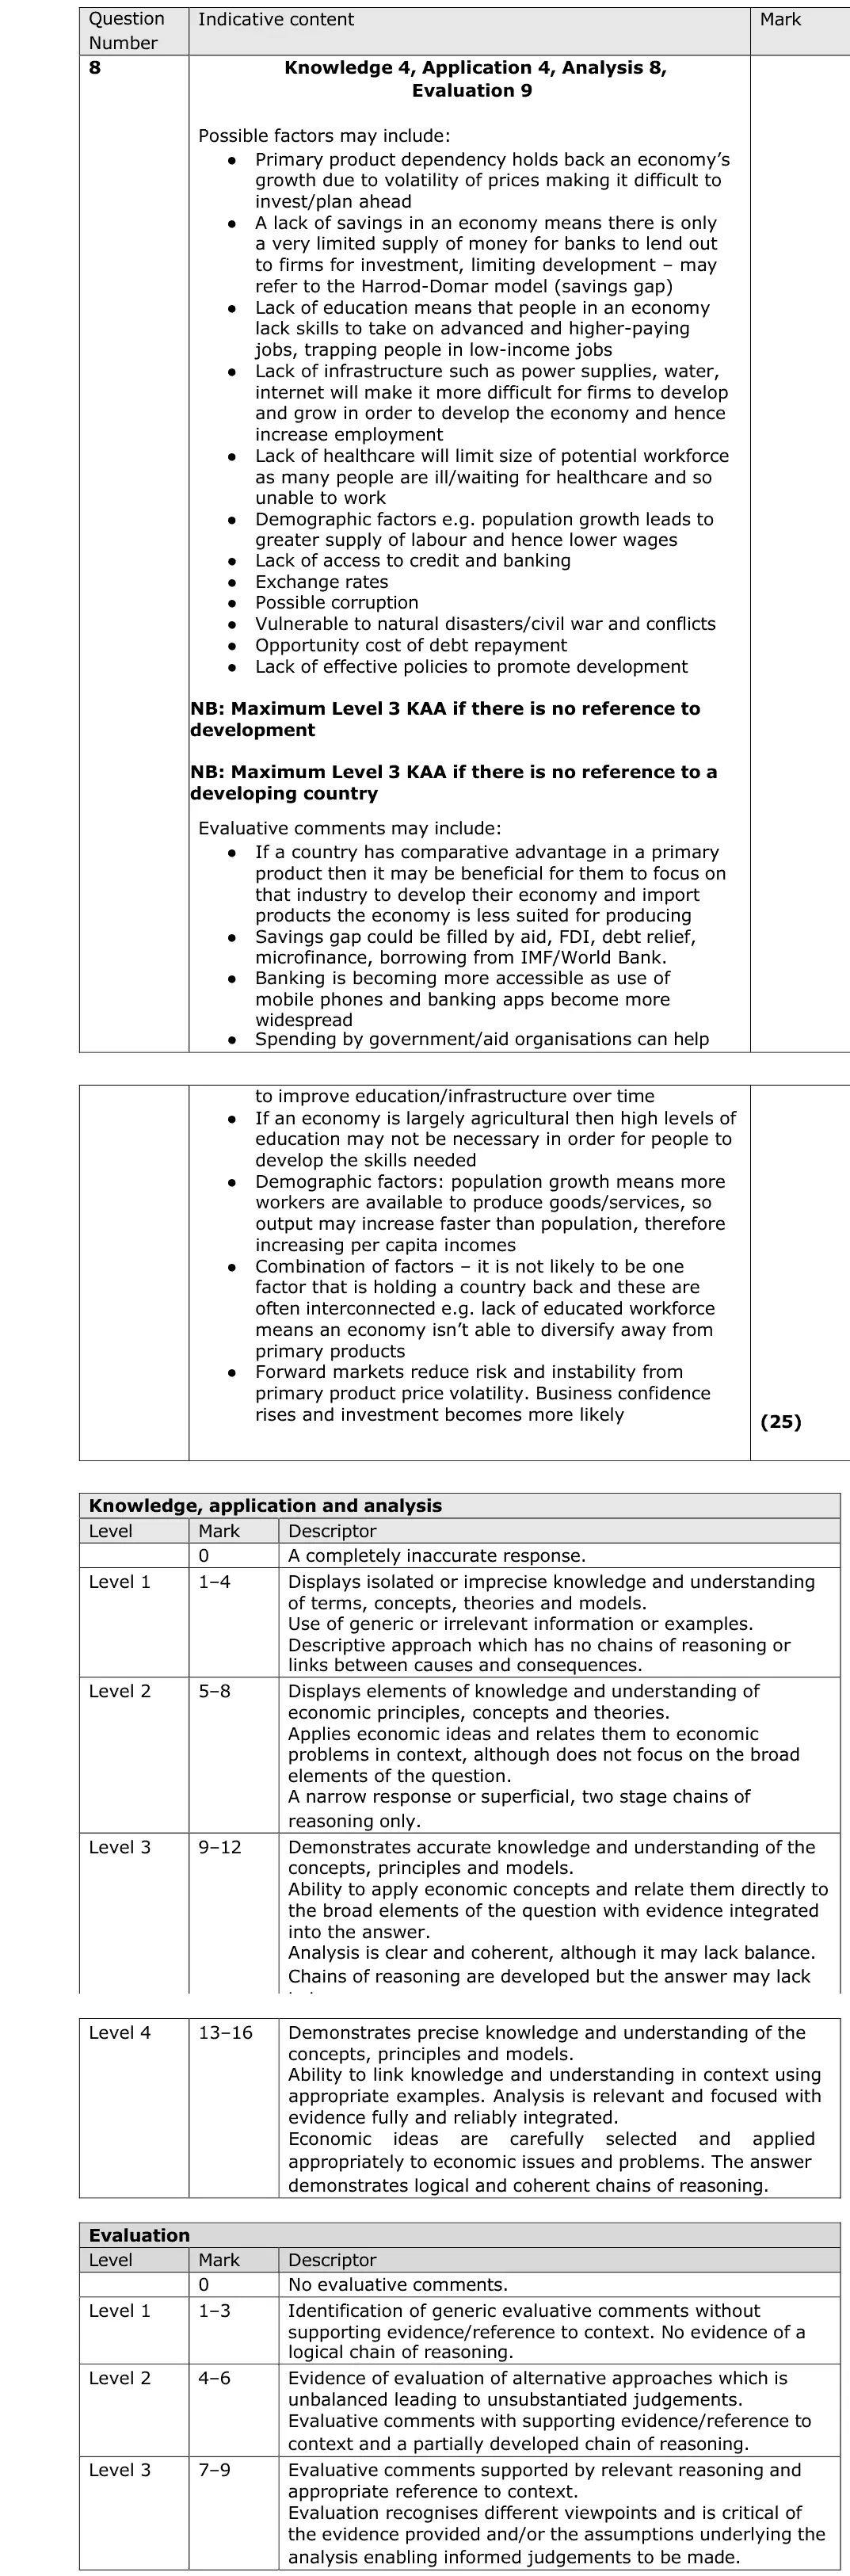
June 2025 · Paper 2 · Q825 marksAO1=4, AO2=4, AO3=8, AO4=925-mark essayEither/or
Mark scheme, including the levels grid and indicative content
Examiner's comment
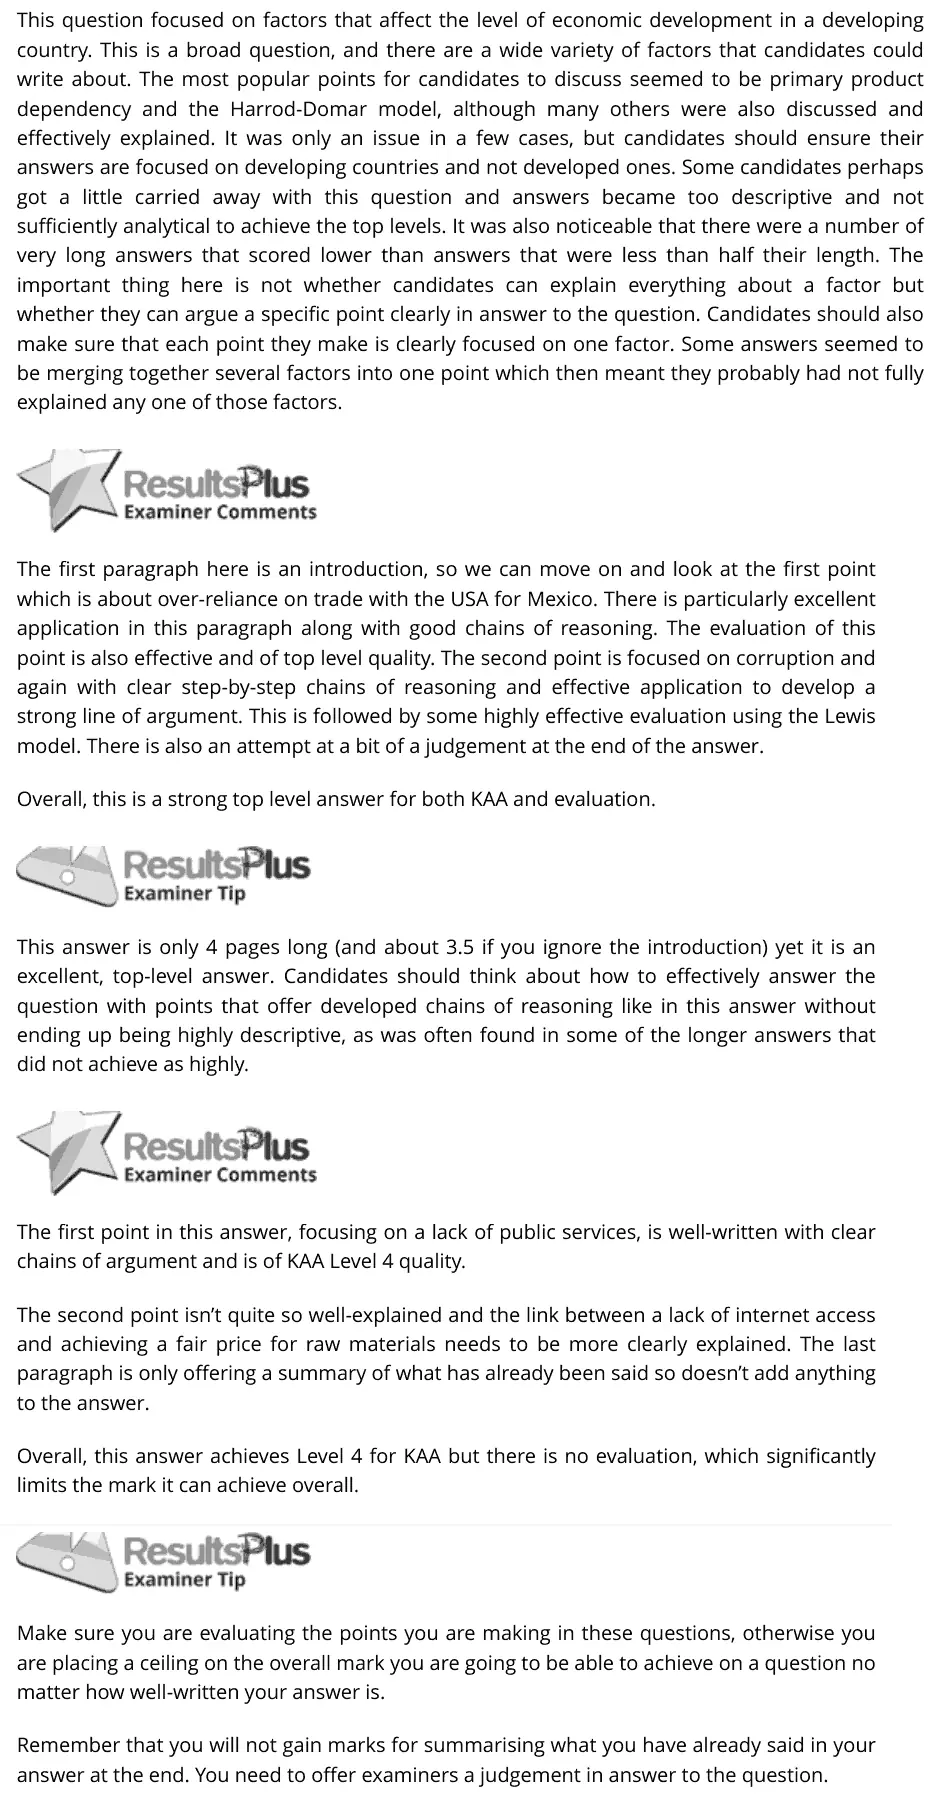
This question focused on factors that affect the level of economic development in a developing country. This is a broad question, and there are a wide variety of factors that candidates could write about. The most popular points for candidates to discuss seemed to be primary product dependency and the Harrod-Domar model, although many others were also discussed and effectively explained. It was only an issue in a few cases, but candidates should ensure their answers are focused on developing countries and not developed ones. Some candidates perhaps got a little carried away with this question and answers became too descriptive and not sufficiently analytical to achieve the top levels. It was also noticeable that there were a number of very long answers that scored lower than answers that were less than half their length. The important thing here is not whether candidates can explain everything about a factor but whether they can argue a specific point clearly in answer to the question. Candidates should also make sure that each point they make is clearly focused on one factor. Some answers seemed to be merging together several factors into one point which then meant they probably had not fully explained any one of those factors. The first paragraph here is an introduction, so we can move on and look at the first point which is about over-reliance on trade with the USA for Mexico. There is particularly excellent application in this paragraph along with good chains of reasoning. The evaluation of this point is also effective and of top level quality. The second point is focused on corruption and again with clear step-by-step chains of reasoning and effective application to develop a strong line of argument. This is followed by some highly effective evaluation using the Lewis model. There is also an attempt at a bit of a judgement at the end of the answer. Overall, this is a strong top level answer for both KAA and evaluation. This answer is only 4 pages long (and about 3.5 if you ignore the introduction) yet it is an excellent, top-level answer. Candidates should think about how to effectively answer the question with points that offer developed chains of reasoning like in this answer without ending up being highly descriptive, as was often found in some of the longer answers that did not achieve as highly. The first point in this answer, focusing on a lack of public services, is well-written with clear chains of argument and is of KAA Level 4 quality. The second point isn’t quite so well-explained and the link between a lack of internet access and achieving a fair price for raw materials needs to be more clearly explained. The last paragraph is only offering a summary of what has already been said so doesn’t add anything to the answer. Overall, this answer achieves Level 4 for KAA but there is no evaluation, which significantly limits the mark it can achieve overall. Make sure you are evaluating the points you are making in these questions, otherwise you are placing a ceiling on the overall mark you are going to be able to achieve on a question no matter how well-written your answer is. Remember that you will not gain marks for summarising what you have already said in your answer at the end. You need to offer examiners a judgement in answer to the question.
Notes from the mark scheme and report
factors: primary product dependency, savings gap (Harrod-Domar), infrastructure, conflict and corruption, health and education, debt, capital flight
must be a developing country of choice
report: some answers became descriptive and too long
argue one factor clearly per paragraph
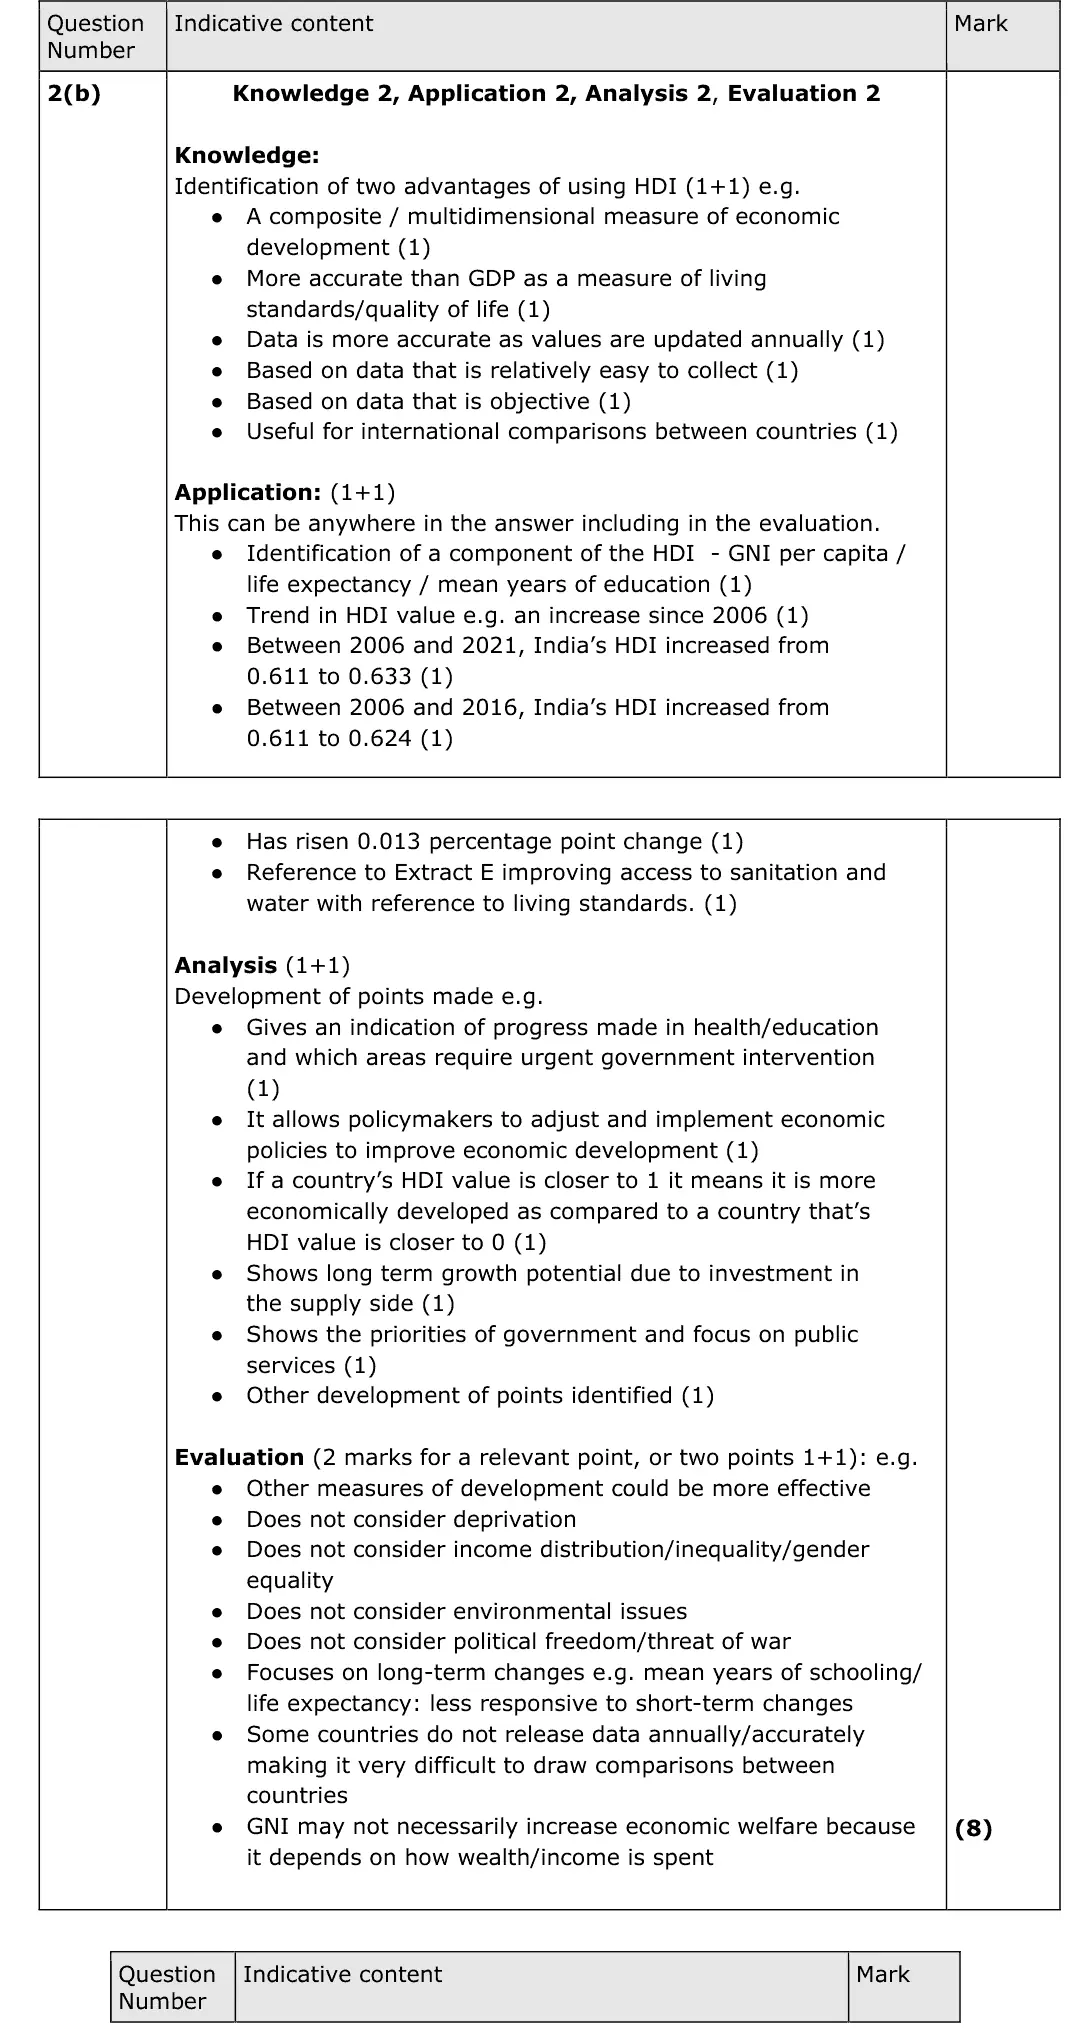
June 2025 · Paper 3 · Q2(b)8 marksAO1=2, AO2=2, AO3=2, AO4=28-mark response
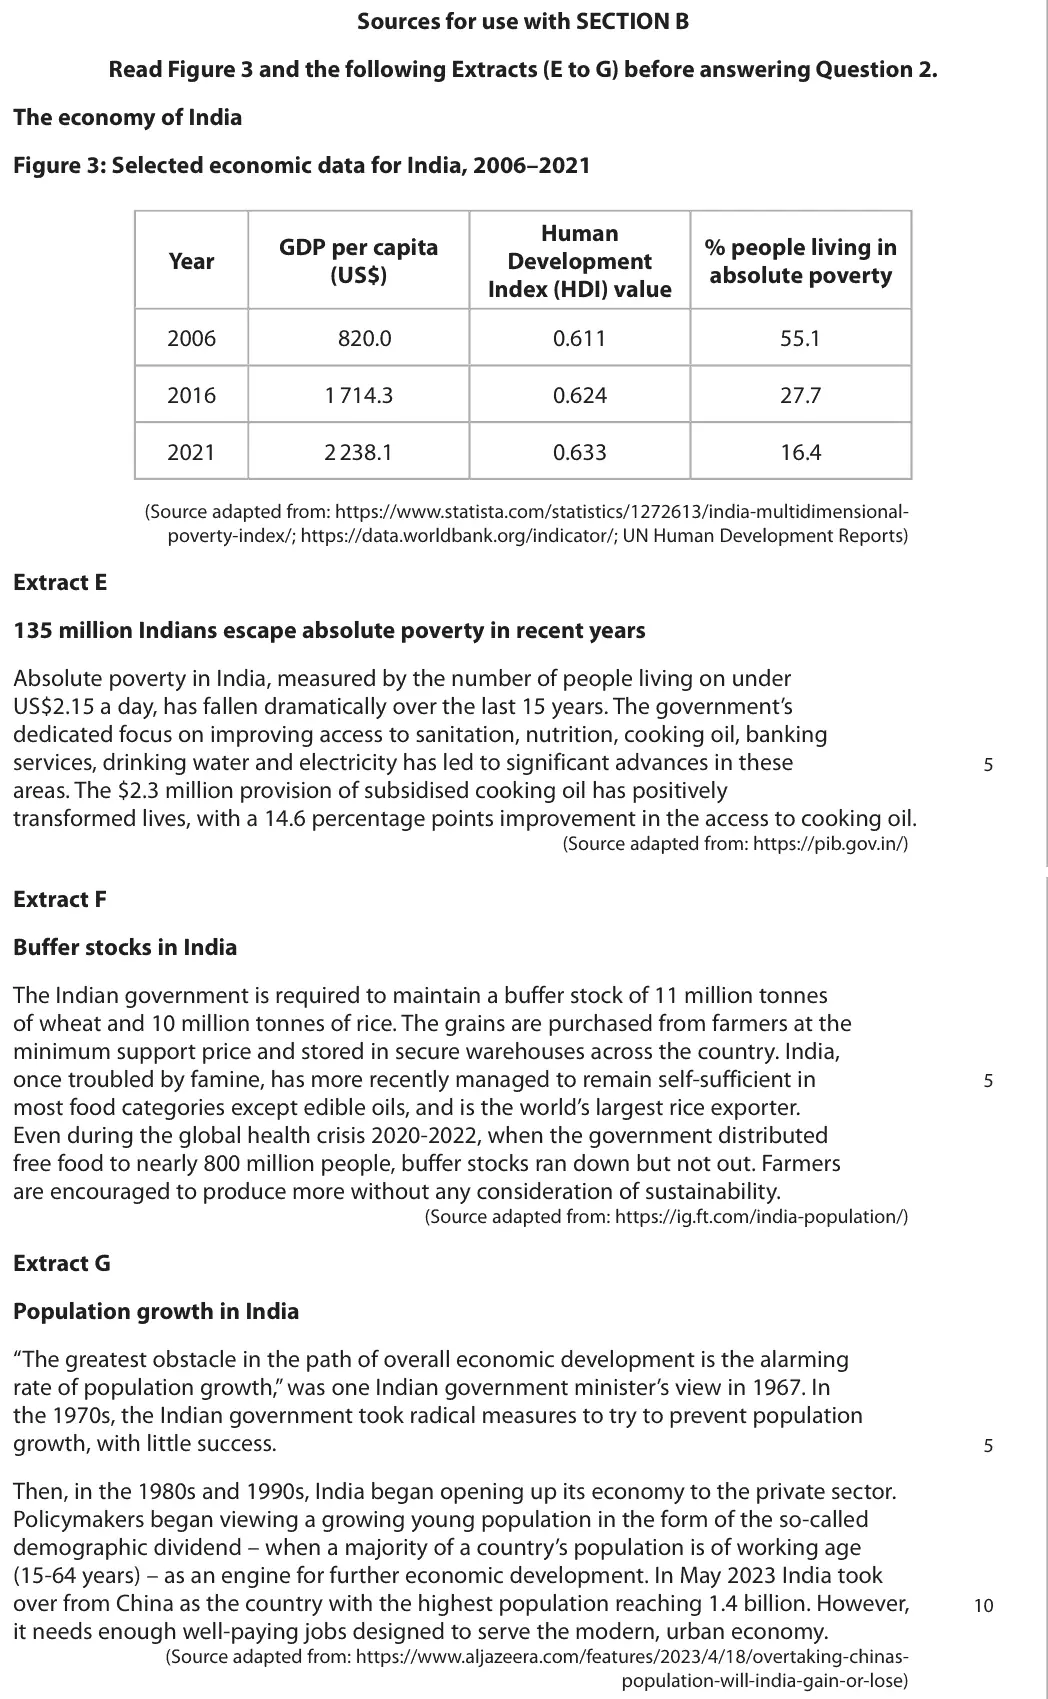
Data and extracts for question 2
Mark scheme, including the levels grid and indicative content
Examiner's comment
Solid knowledge of HDI was shown, but some candidates were not awarded application marks because the relevant application/data were not used and many just used the data provided on poverty. Poor use and interpretation of data was in evidence in many responses, for example in thinking that an increase in the HDI was a concern for the Indian economy and showing a confusion between HDI and Gini index numbers. Sometimes knowledge points and analysis points overlapped but those who fully understood the composition of the index could make helpful observations about life expectancy and number of years of schooling (expected or reflective) and put them in contrast with GNI per capita as an income measure. Some candidates failed to evaluate - rather they were repeating knowledge points or offering a third observation on HDU. Some candidates were not aware that they should develop an evaluation point. Try to make two clearly distinct points. K - more accurate Ap - life expectancy An - how good the healthcare system is/gov policy K - BOD composite as uses the phrase ‘also analyses’ An - whether education needs to improve Ev - still high inequality 2K, 1Ap, 2AN, 2Ev Short answers can be very effective.
Notes from the mark scheme and report
advantages: composite measure (health, education, income) better than GDP alone, comparable data
quote HDI (0.611 to 0.633)
some used only the poverty data or confused HDI with the Gini coefficient
evaluate rather than add a third point
Quantitative skills: QS 11 (understand composite indicators); QS 9 (interpret, apply and analyse information in written, graphical tabular and numerical forms)
June 2025 · Paper 3 · Q2(c)12 marksAO1=2, AO2=2, AO3=4, AO4=412-mark response
Data and extracts for question 2
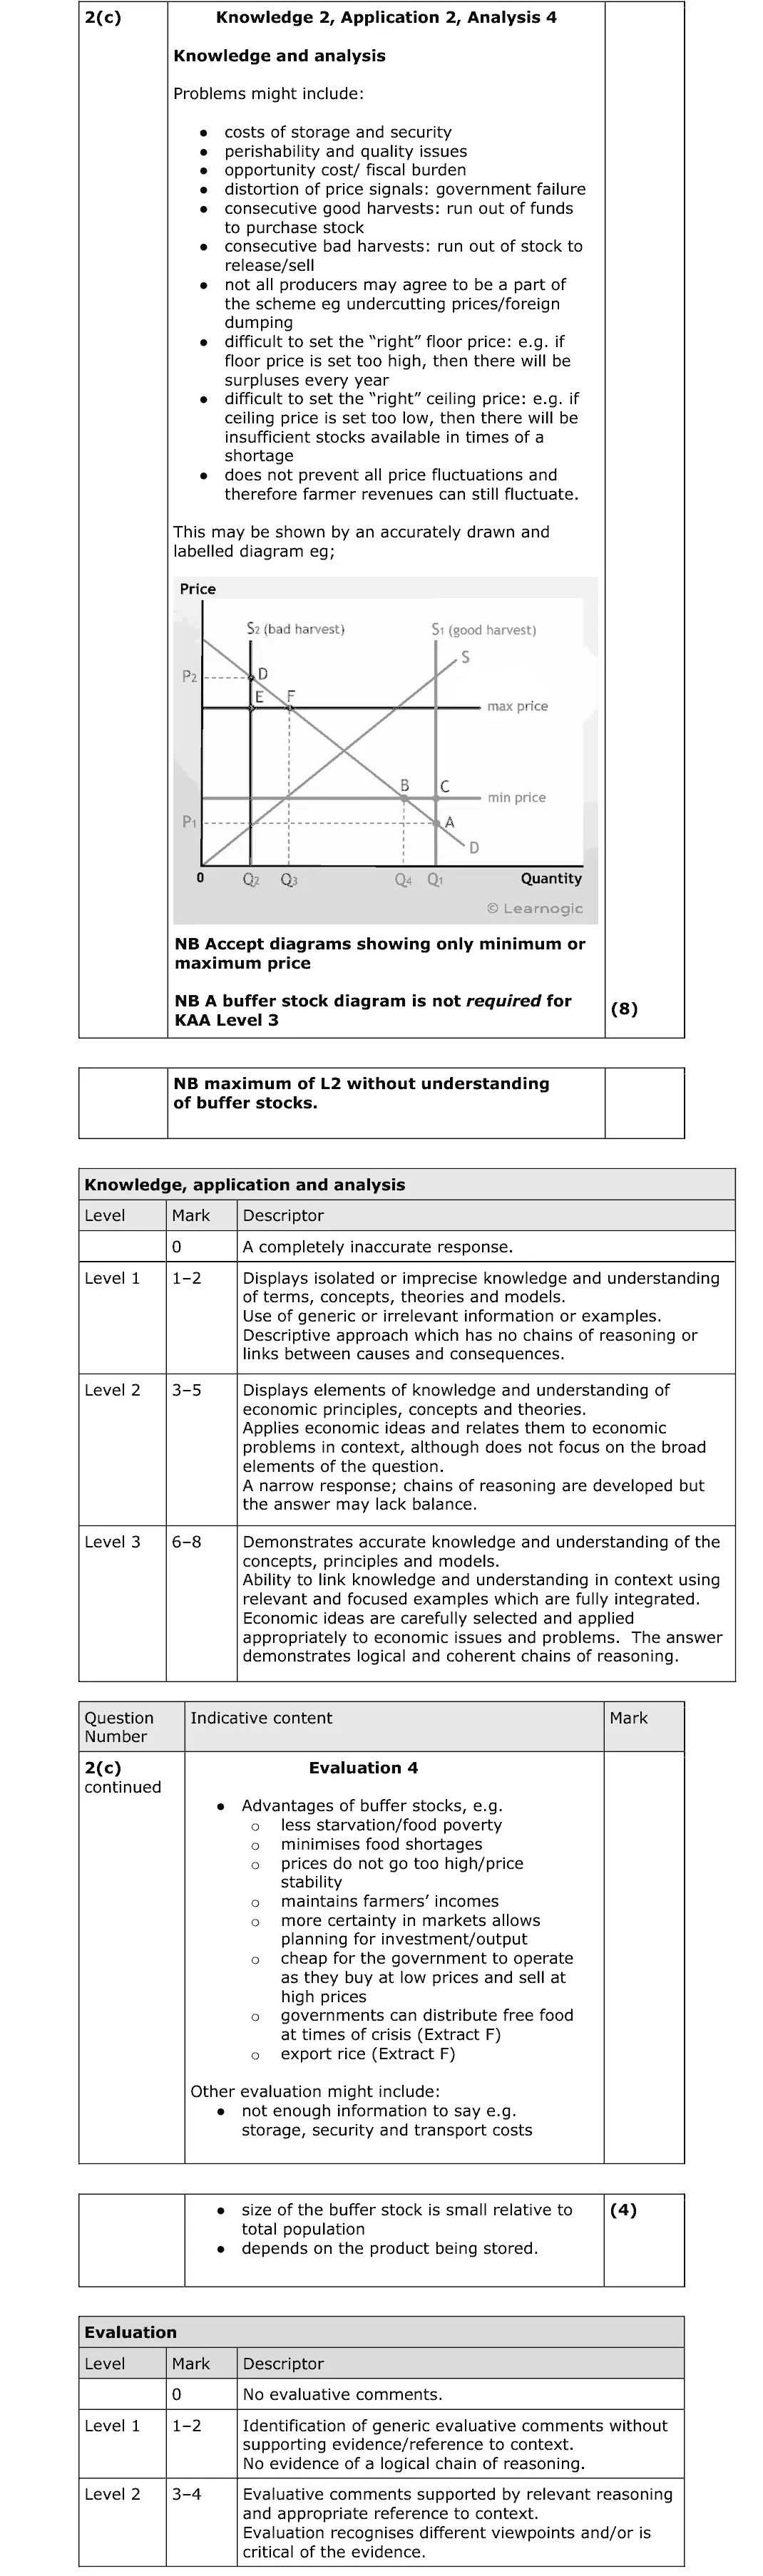
Mark scheme, including the levels grid and indicative content
Examiner's comment
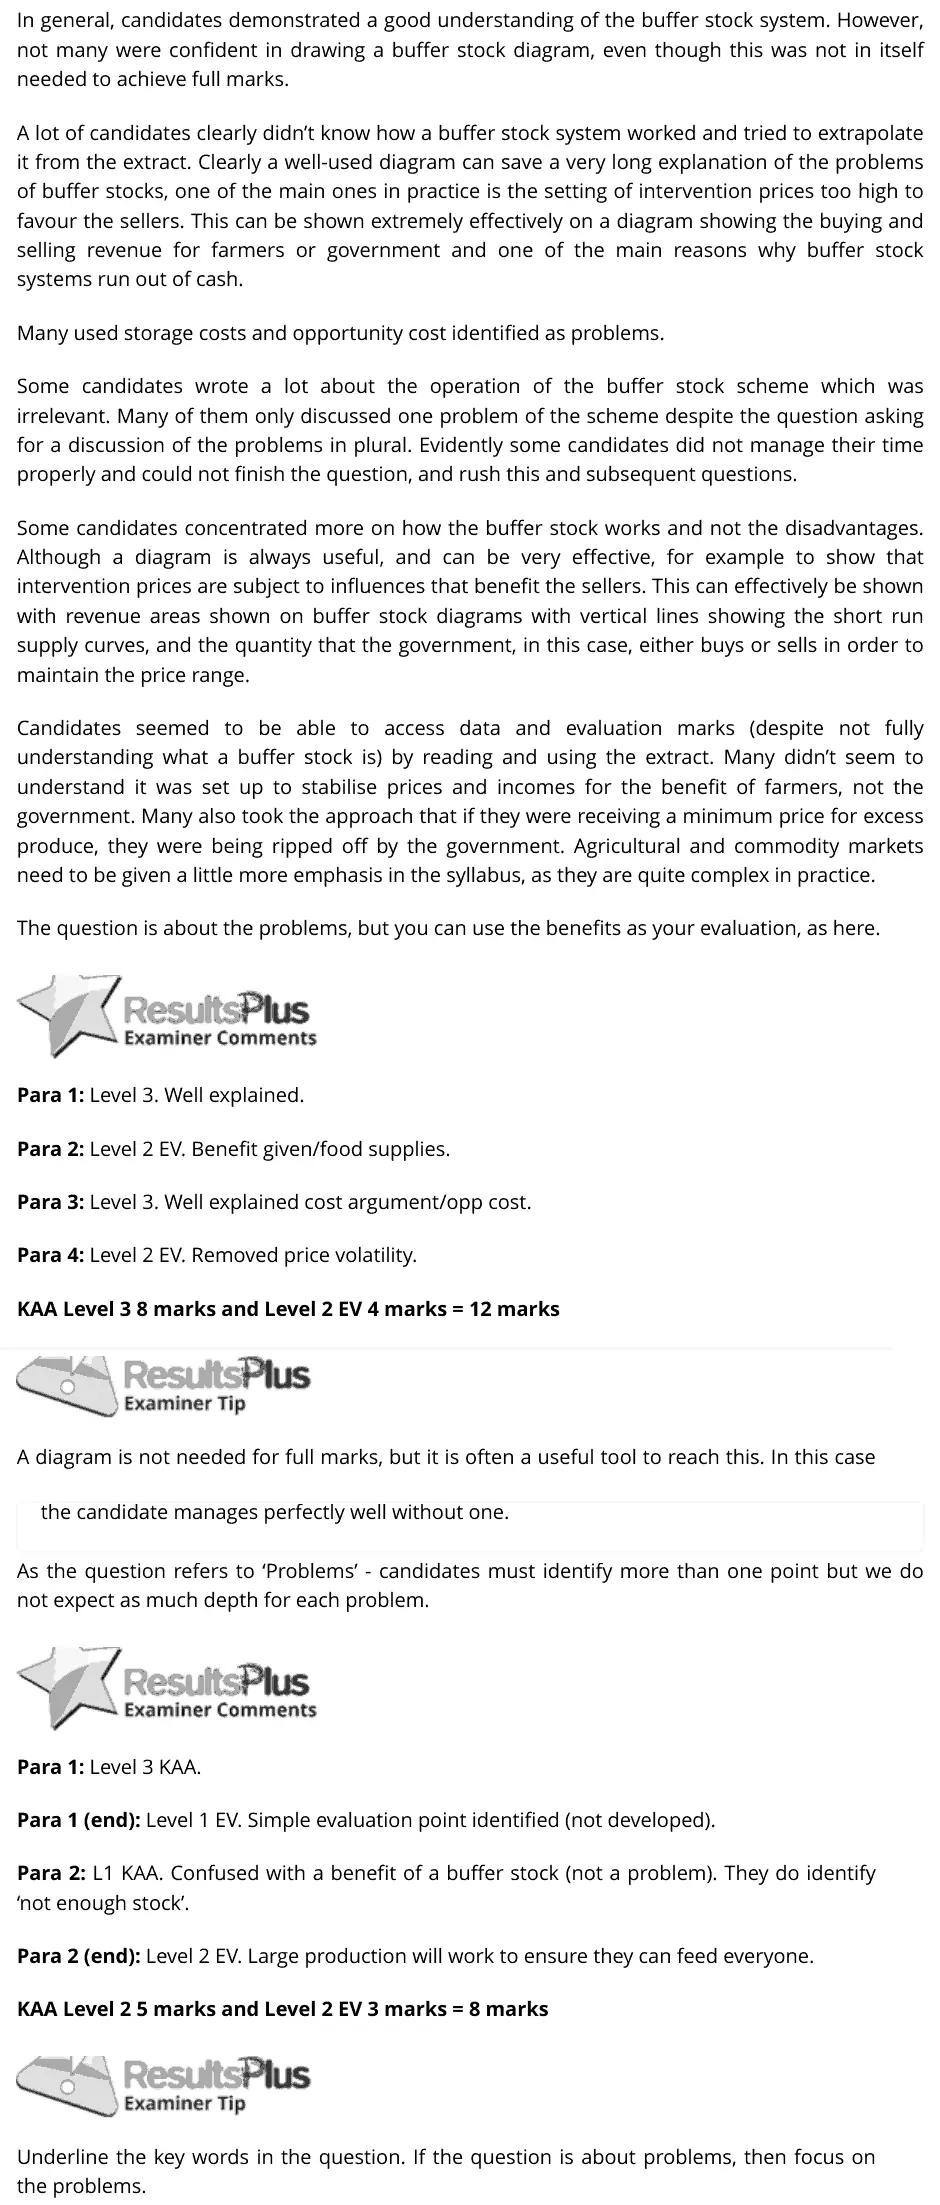
In general, candidates demonstrated a good understanding of the buffer stock system. However, not many were confident in drawing a buffer stock diagram, even though this was not in itself needed to achieve full marks. A lot of candidates clearly didn’t know how a buffer stock system worked and tried to extrapolate it from the extract. Clearly a well-used diagram can save a very long explanation of the problems of buffer stocks, one of the main ones in practice is the setting of intervention prices too high to favour the sellers. This can be shown extremely effectively on a diagram showing the buying and selling revenue for farmers or government and one of the main reasons why buffer stock systems run out of cash. Many used storage costs and opportunity cost identified as problems. Some candidates wrote a lot about the operation of the buffer stock scheme which was irrelevant. Many of them only discussed one problem of the scheme despite the question asking for a discussion of the problems in plural. Evidently some candidates did not manage their time properly and could not finish the question, and rush this and subsequent questions. Some candidates concentrated more on how the buffer stock works and not the disadvantages. Although a diagram is always useful, and can be very effective, for example to show that intervention prices are subject to influences that benefit the sellers. This can effectively be shown with revenue areas shown on buffer stock diagrams with vertical lines showing the short run supply curves, and the quantity that the government, in this case, either buys or sells in order to maintain the price range. Candidates seemed to be able to access data and evaluation marks (despite not fully understanding what a buffer stock is) by reading and using the extract. Many didn’t seem to understand it was set up to stabilise prices and incomes for the benefit of farmers, not the government. Many also took the approach that if they were receiving a minimum price for excess produce, they were being ripped off by the government. Agricultural and commodity markets need to be given a little more emphasis in the syllabus, as they are quite complex in practice. The question is about the problems, but you can use the benefits as your evaluation, as here. Para 1: Level 3. Well explained. Para 2: Level 2 EV. Benefit given/food supplies. Para 3: Level 3. Well explained cost argument/opp cost. Para 4: Level 2 EV. Removed price volatility. KAA Level 3 8 marks and Level 2 EV 4 marks = 12 marks A diagram is not needed for full marks, but it is often a useful tool to reach this. In this case the candidate manages perfectly well without one. As the question refers to ‘Problems’ - candidates must identify more than one point but we do not expect as much depth for each problem. Para 1: Level 3 KAA. Para 1 (end): Level 1 EV. Simple evaluation point identified (not developed). Para 2: L1 KAA. Confused with a benefit of a buffer stock (not a problem). They do identify ‘not enough stock’. Para 2 (end): Level 2 EV. Large production will work to ensure they can feed everyone. KAA Level 2 5 marks and Level 2 EV 3 marks = 8 marks Underline the key words in the question. If the question is about problems, then focus on the problems.
Notes from the mark scheme and report
problems in plural: storage costs, perishability, fiscal/opportunity cost, intervention price set too high, runs of good or bad harvests, distorted price signals, unsustainable overproduction (Extract F)
describing how the scheme works earns little
a buffer stock diagram helps but is not required
June 2025 · Paper 3 · Q2(e)25 marksAO1=4, AO2=4, AO3=8, AO4=925-mark essayEither/or
Data and extracts for question 2
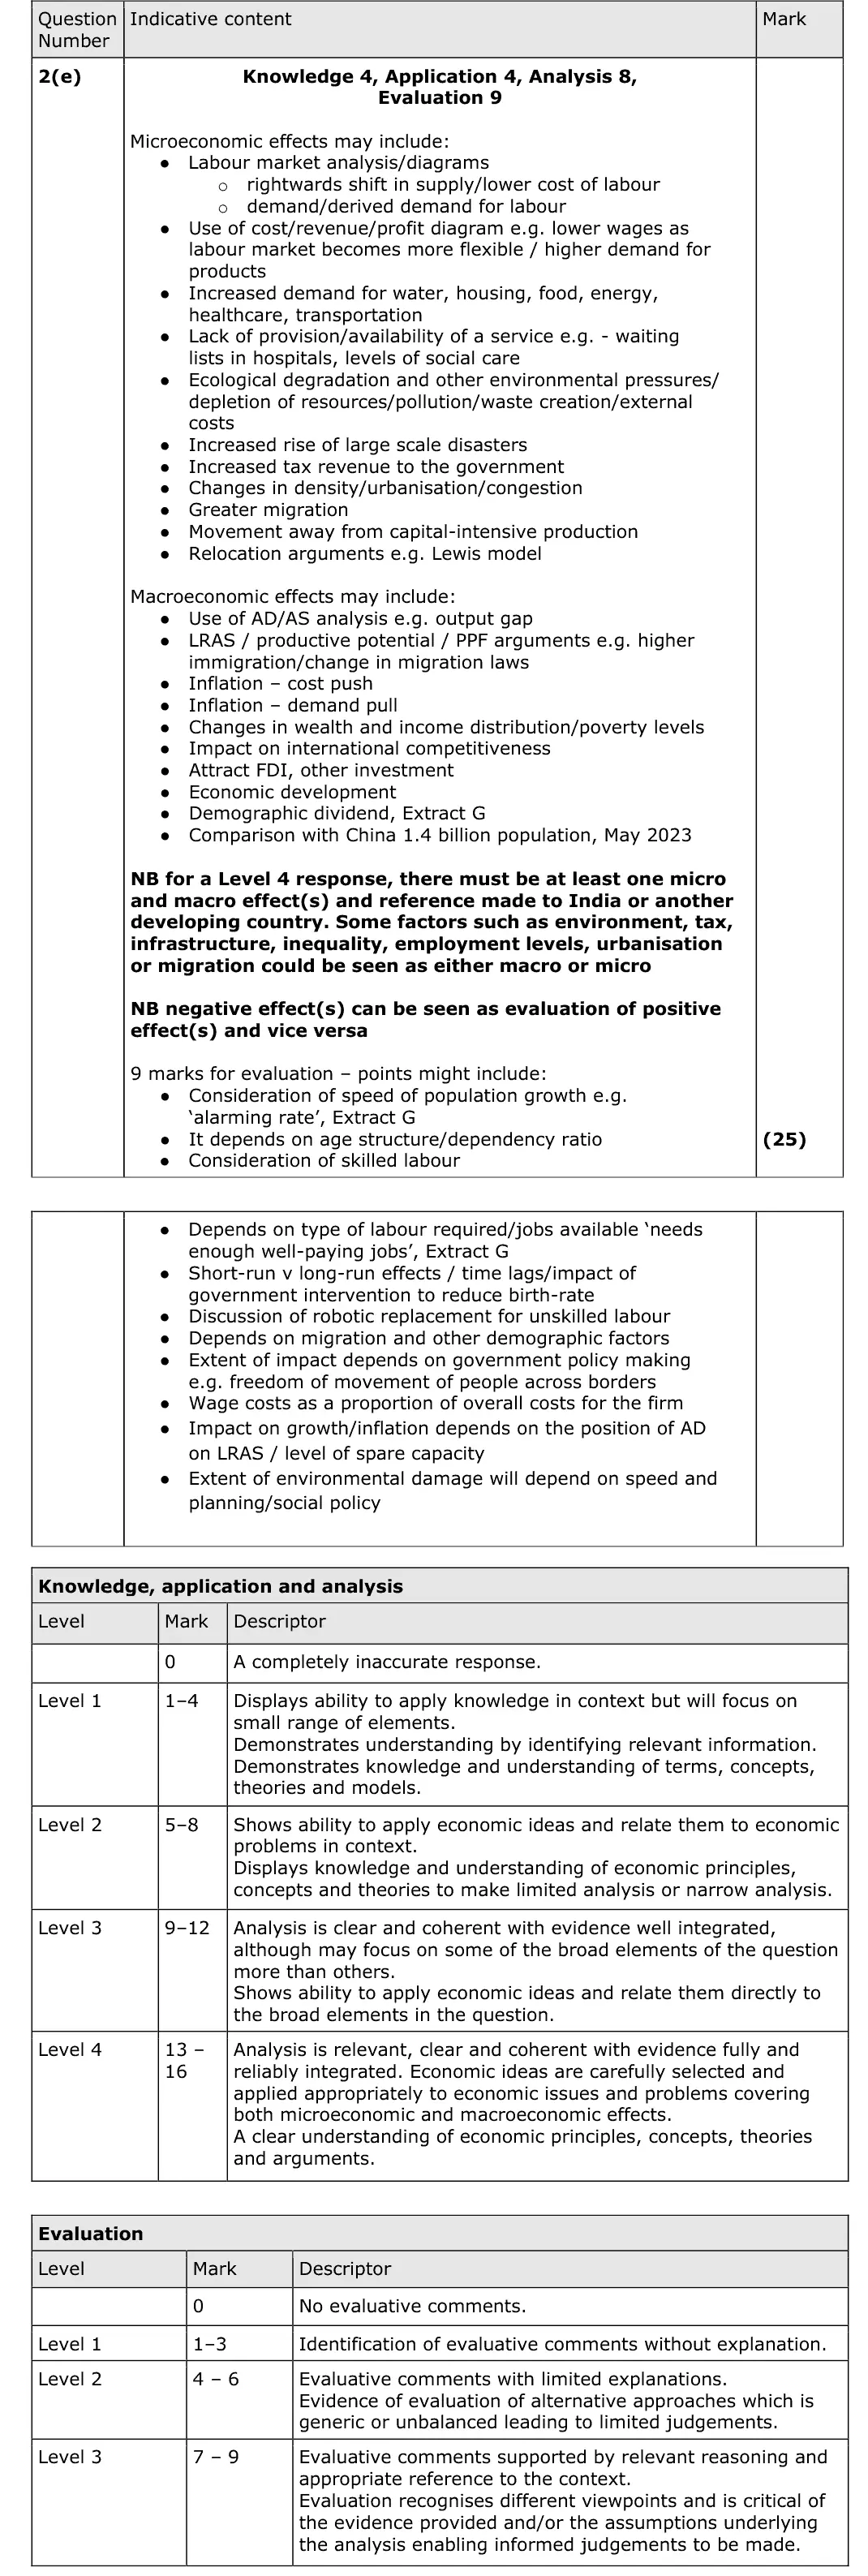
Mark scheme, including the levels grid and indicative content
Examiner's comment
Candidates were confident in shifting cost and revenue curves which led to some high scoring. Most of the candidates performed well in this question, the only issue was some analysis lacked details and development. Some very good answers included a labour supply analysis or some other relevant analysis. Many candidates focused on supply side changes in the labour market, without considering the changes in demand. This was also the case when it came to AS/AD analysis and impact on macroeconomy. Some commentators observed that they would have liked a little more data in the question on the macroeconomy to inform their analysis! Examiners use positive marking when choosing KAA between Level 3 and Level 4, so this gets Level 4. Para 1: MAC KAA Level 4. Consumption/AD/application/diagram/chains of reasoning. This is enough for Level 4. Para 2: Level 2+ EV. Needs further development/reason why for Level 3. Para 3: MIC Level 3 KAA. Higher demand, revenues, profit. Diagram is incorrect. Para 4: Level 2 EV. Greater competition (quite generic). Para 5: Not a judgement - just a repeat. Level 4- KAA 13 marks and Level 2+ EV 6 = 19 marks Do not use the evaluation opportunity as a repetition of your previous points. You need to answer the question, with carefully weighed up judgement. The response has outstanding KAA - probably more than you could expect. Para 1: MIC Level 4+ KAA. Developed arguments using labour markets & cost/revenue diagram. Para 2: - Level 3+ EV. Para 3: MAC Level 4+ KAA. Developed argument using AD and LRAS, with accurate diagrams and context. Para 4: Level 3 EV. Discussion about risk of inflation/use of diagram/shape of LRAS argument. Para 5: Judgement - effectively looks at the extent to which they will benefit Level 3 EV. Level 4+ KAA 16 marks and Level 3+ EV 9 marks = 25 marks Look at answers such as this that score full marks as a way to develop your own skills. Outstanding example of KAA - rare to see as much depth as Para 1 Para 1: MAC KAA L4+ higher consumption/AD/diagram/investment/growth arguments - well developed with lots of application Para 2: L3+ EV wage pressures/education arguments Para 3: MIC KAA L4- profit/sales/economies of scale - but context of India is not totally clear Para 4: L3+EV threat of large MNCs to local firms Para 5 - Judgement - link to poverty/macro more significant Level 4 KAA 15 and Level 3+EV 9 = 24 marks Make sure you use the context as clearly as you can.
Notes from the mark scheme and report
micro: labour supply shifts right, lower wages, higher product demand and revenues
macro: demographic dividend, AD and LRAS, unemployment, pressure on public services
consider demand as well as supply
Level 4 needs a micro and a macro effect for India
June 2024 · Paper 3 · Q2(b)8 marksAO1=2, AO2=2, AO3=2, AO4=28-mark response
Data and extracts for question 2
Mark scheme, including the levels grid and indicative content
Examiner's comment
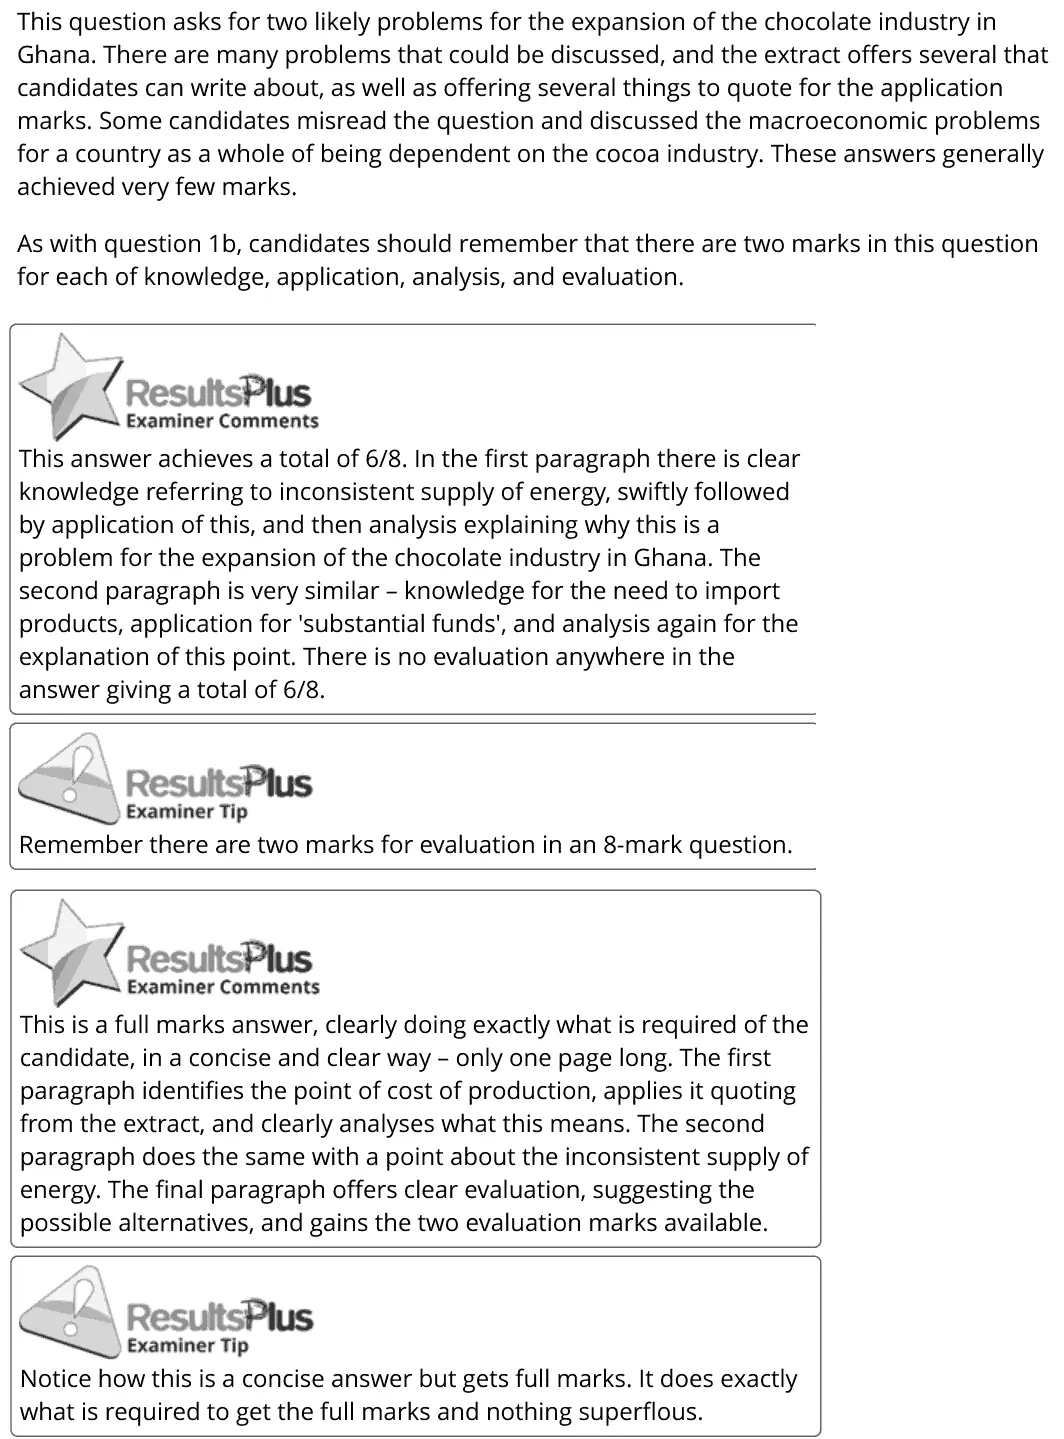
This question asks for two likely problems for the expansion of the chocolate industry in Ghana. There are many problems that could be discussed, and the extract offers several that candidates can write about, as well as offering several things to quote for the application marks. Some candidates misread the question and discussed the macroeconomic problems for a country as a whole of being dependent on the cocoa industry. These answers generally achieved very few marks. As with question 1b, candidates should remember that there are two marks in this question for each of knowledge, application, analysis, and evaluation. <6ResultsPlus This answer achieves a total of 6/8. In the first paragraph there is clear knowledge referring to inconsistent supply of energy, swiftly followed by application of this, and then analysis explaining why this is a problem for the expansion ofthe chocolate industry in Ghana. The second paragraph is very similar - knowledge for the need to import products, application for 'substantial funds', and analysis again for the explanation of this point. There is no evaluation anywhere in the answer giving a total of 6/8. aN io) ResuitsPus Remember there are two marks for evaluation in an 8-mark question. <p BesultsPtus This is a full marks answer, clearly doing exactly what is required of the candidate, in a concise and clear way - only one page long. The first paragraph identifies the point of cost of production, applies it quoting from the extract, and clearly analyses what this means. The second paragraph does the same with a point about the inconsistent supply of energy. The final paragraph offers clear evaluation, suggesting the possible alternatives, and gains the two evaluation marks available. GA, ResultsPius ~~) Examiner Tip Notice how this is a concise answer but gets full marks. It does exactly what is required to get the full marks and nothing superflous.
Notes from the mark scheme and report
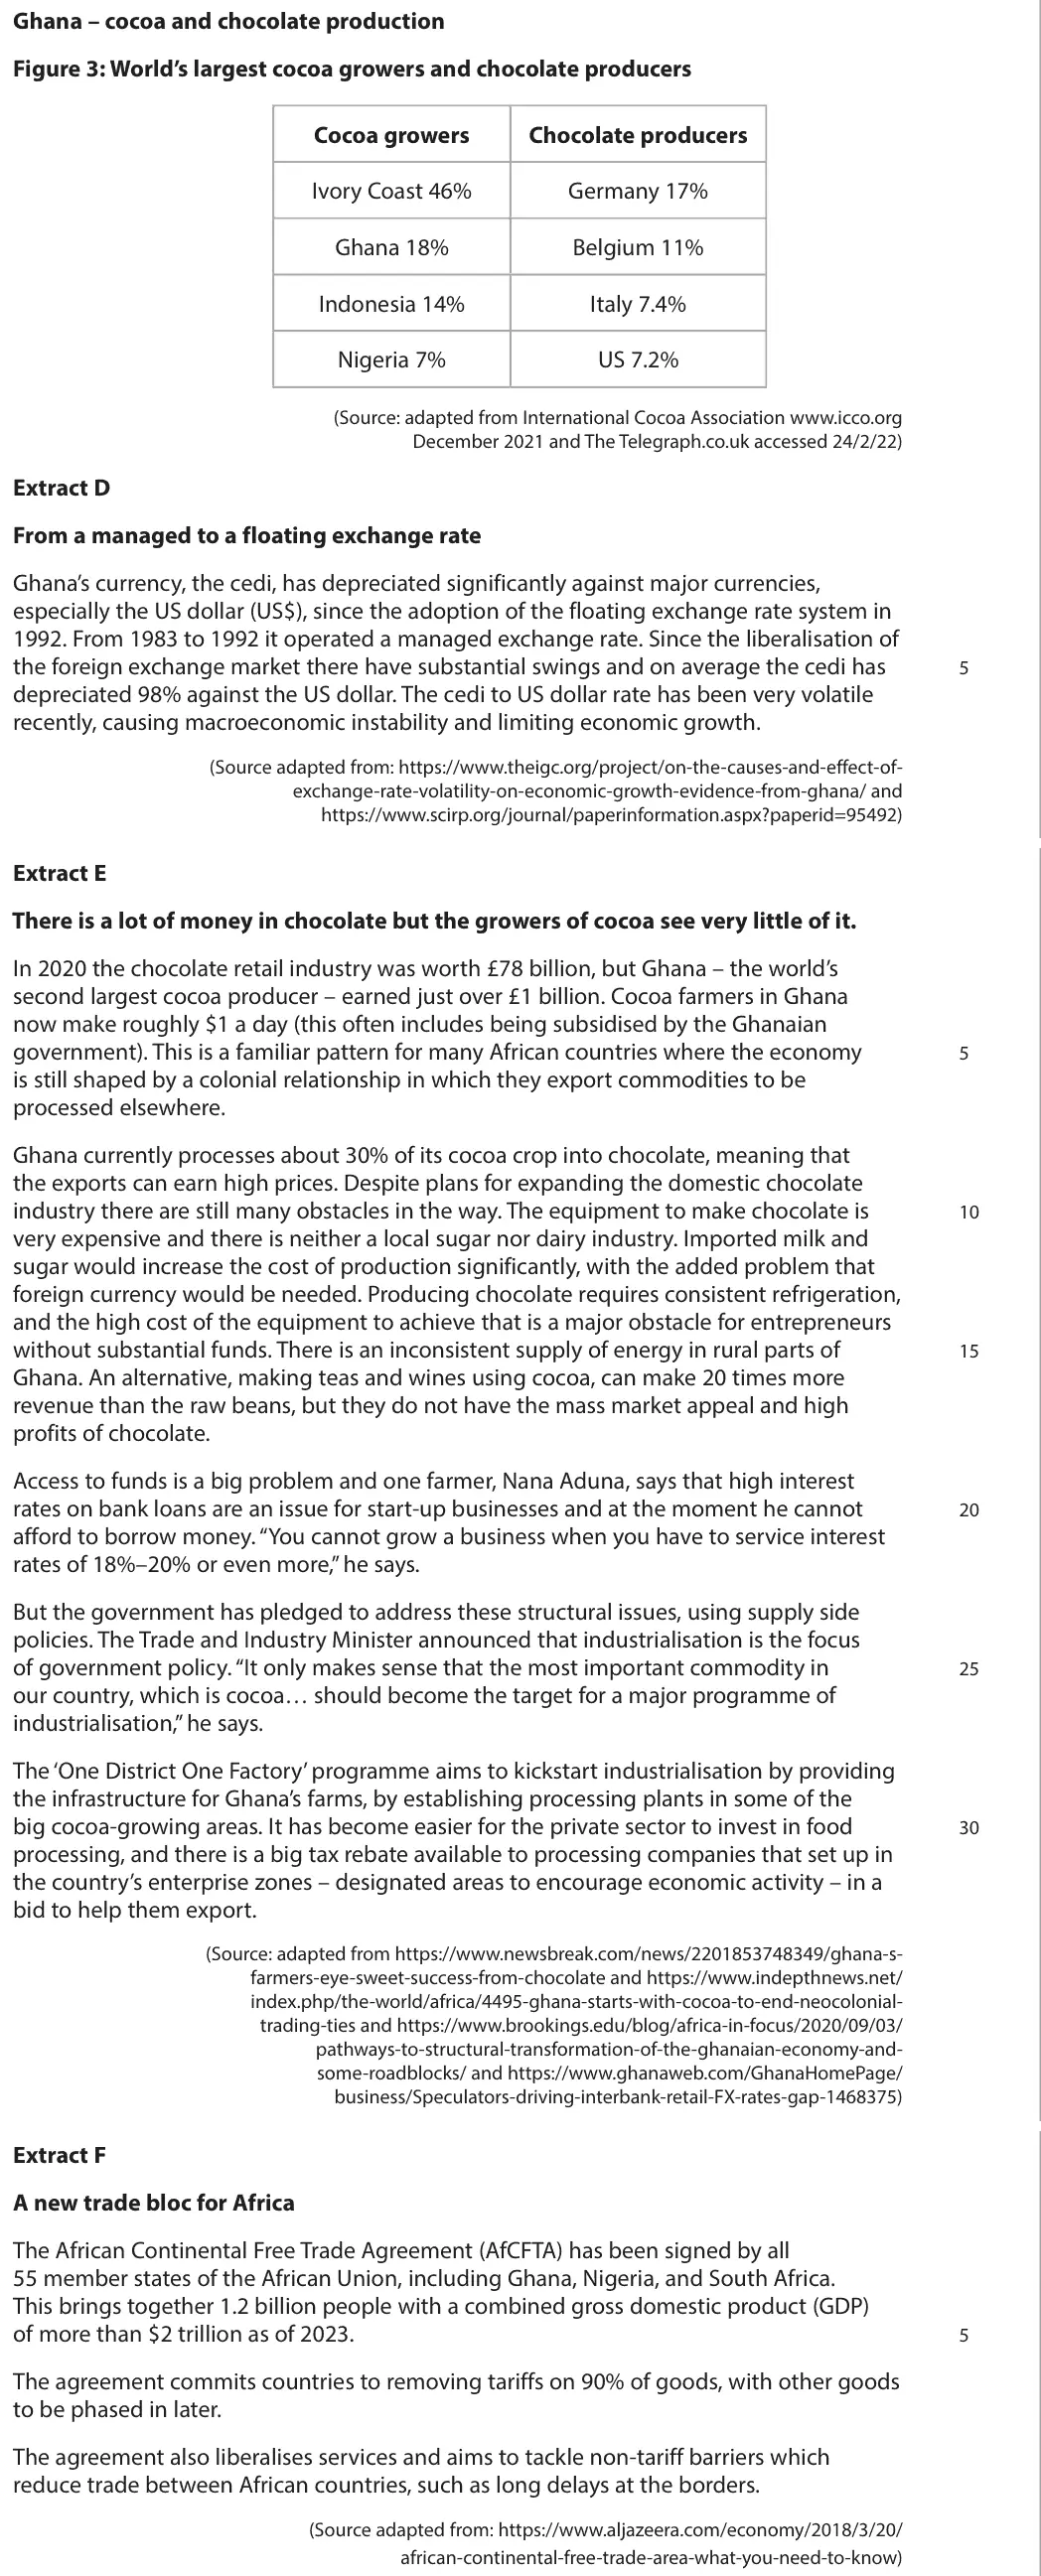
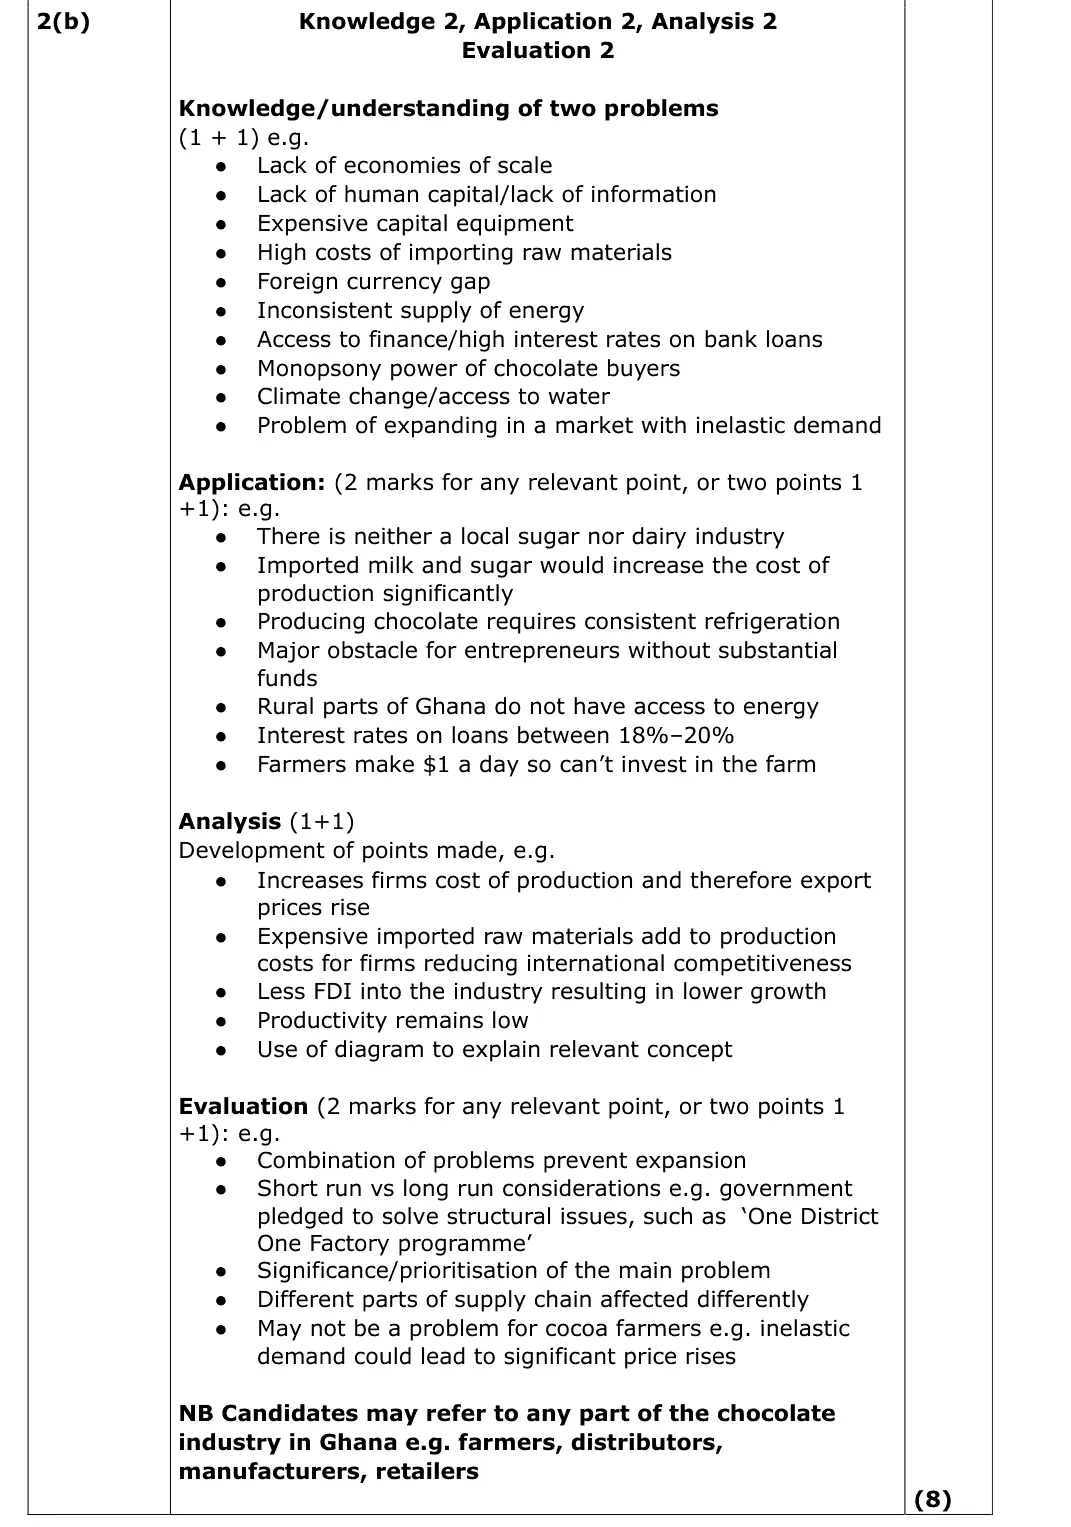
two problems from Extract E paragraph 2 (expensive equipment, imported milk and sugar needing foreign currency, refrigeration, unreliable energy, finance at 18% to 20%)
answers on macro cocoa dependency scored little
two evaluation marks often missed
Quantitative skills: QS 9 (interpret, apply and analyse information in written, graphical tabular and numerical forms)
June 2023 · Paper 2 · Q6(b)8 marksAO1=2, AO2=2, AO3=2, AO4=28-mark response
Data and extracts for question 6
Mark scheme, including the levels grid and indicative content
Examiner's comment
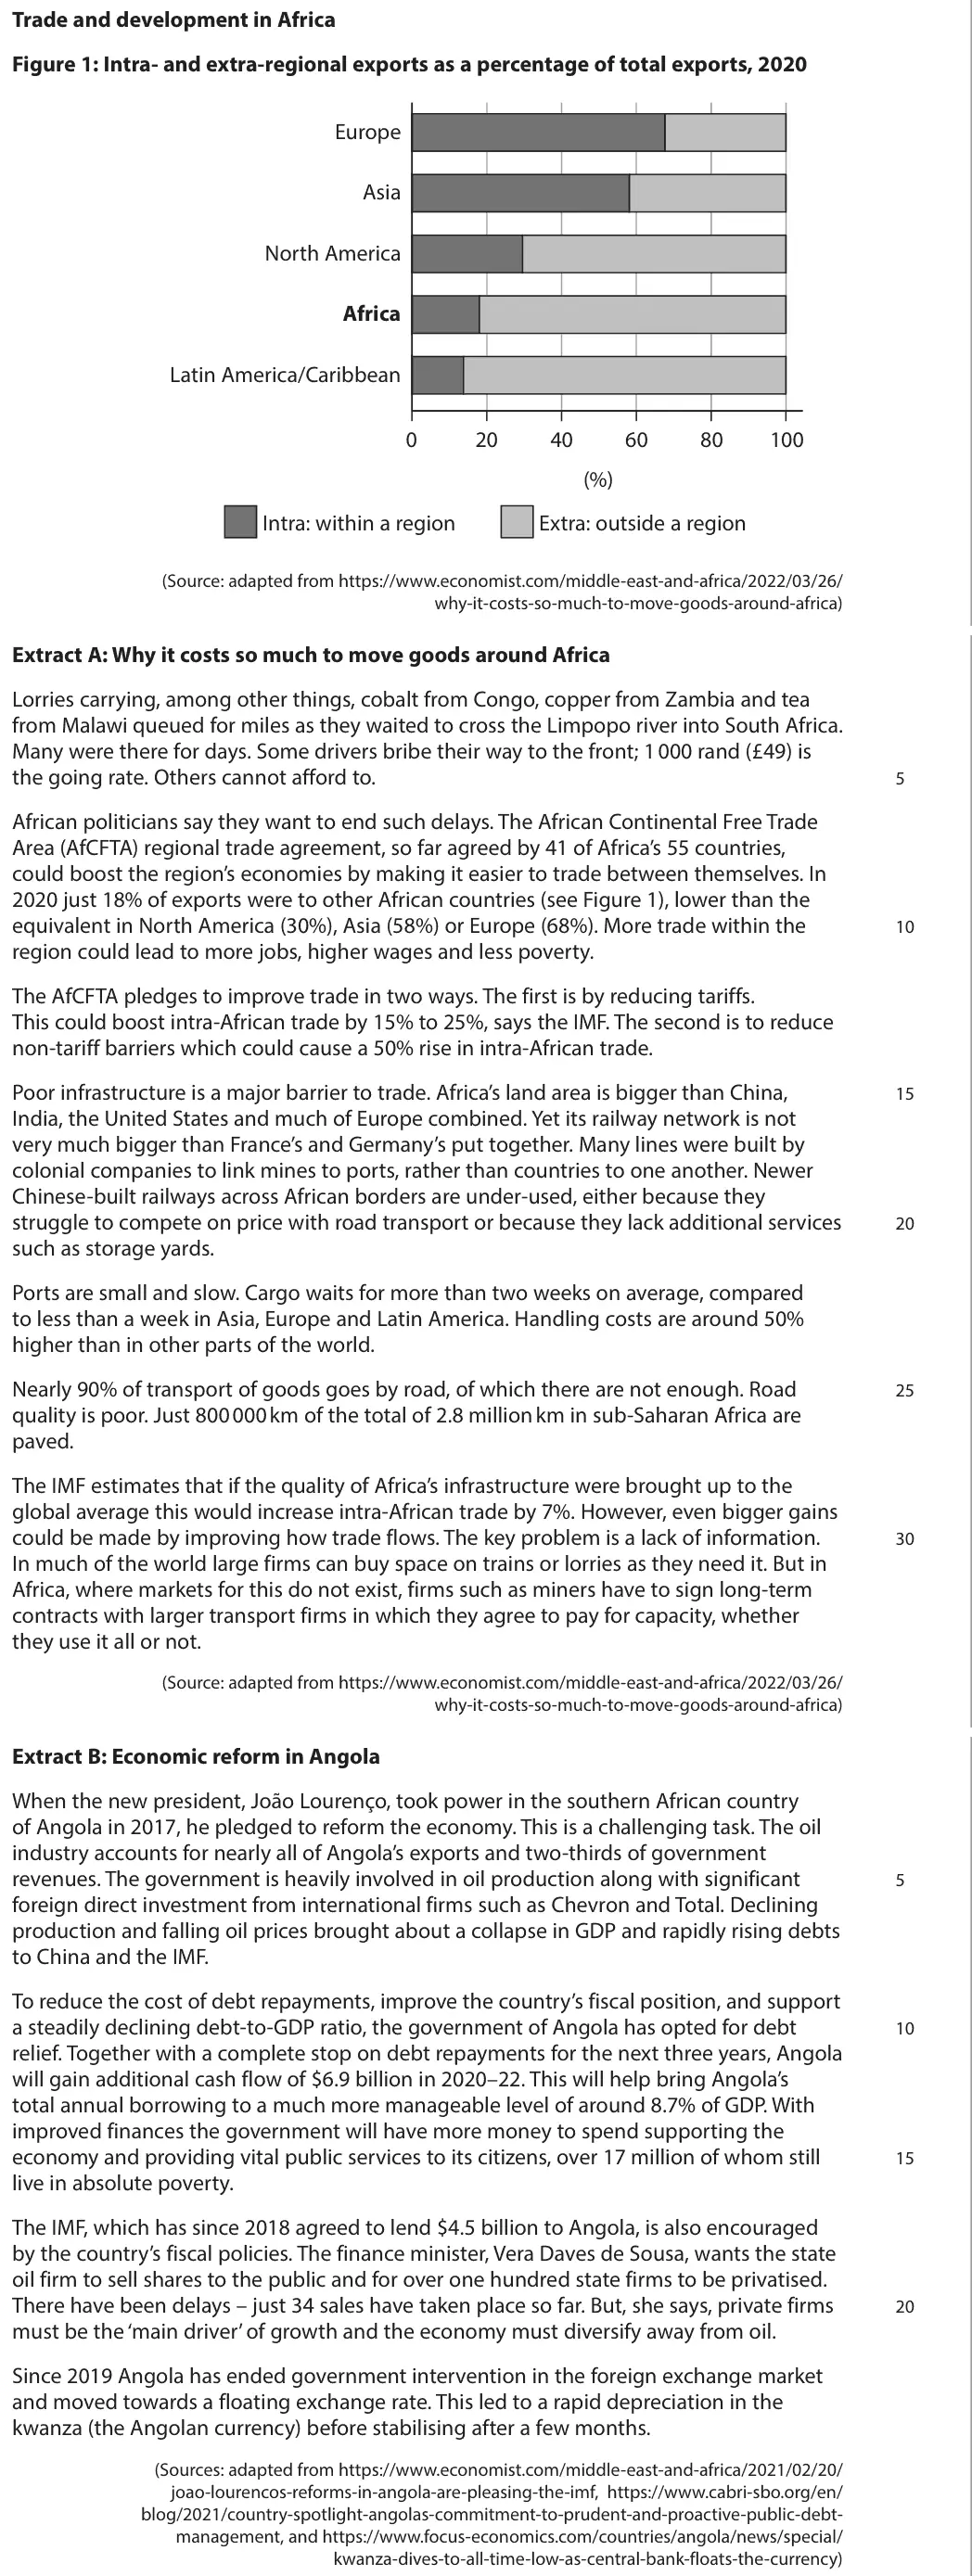
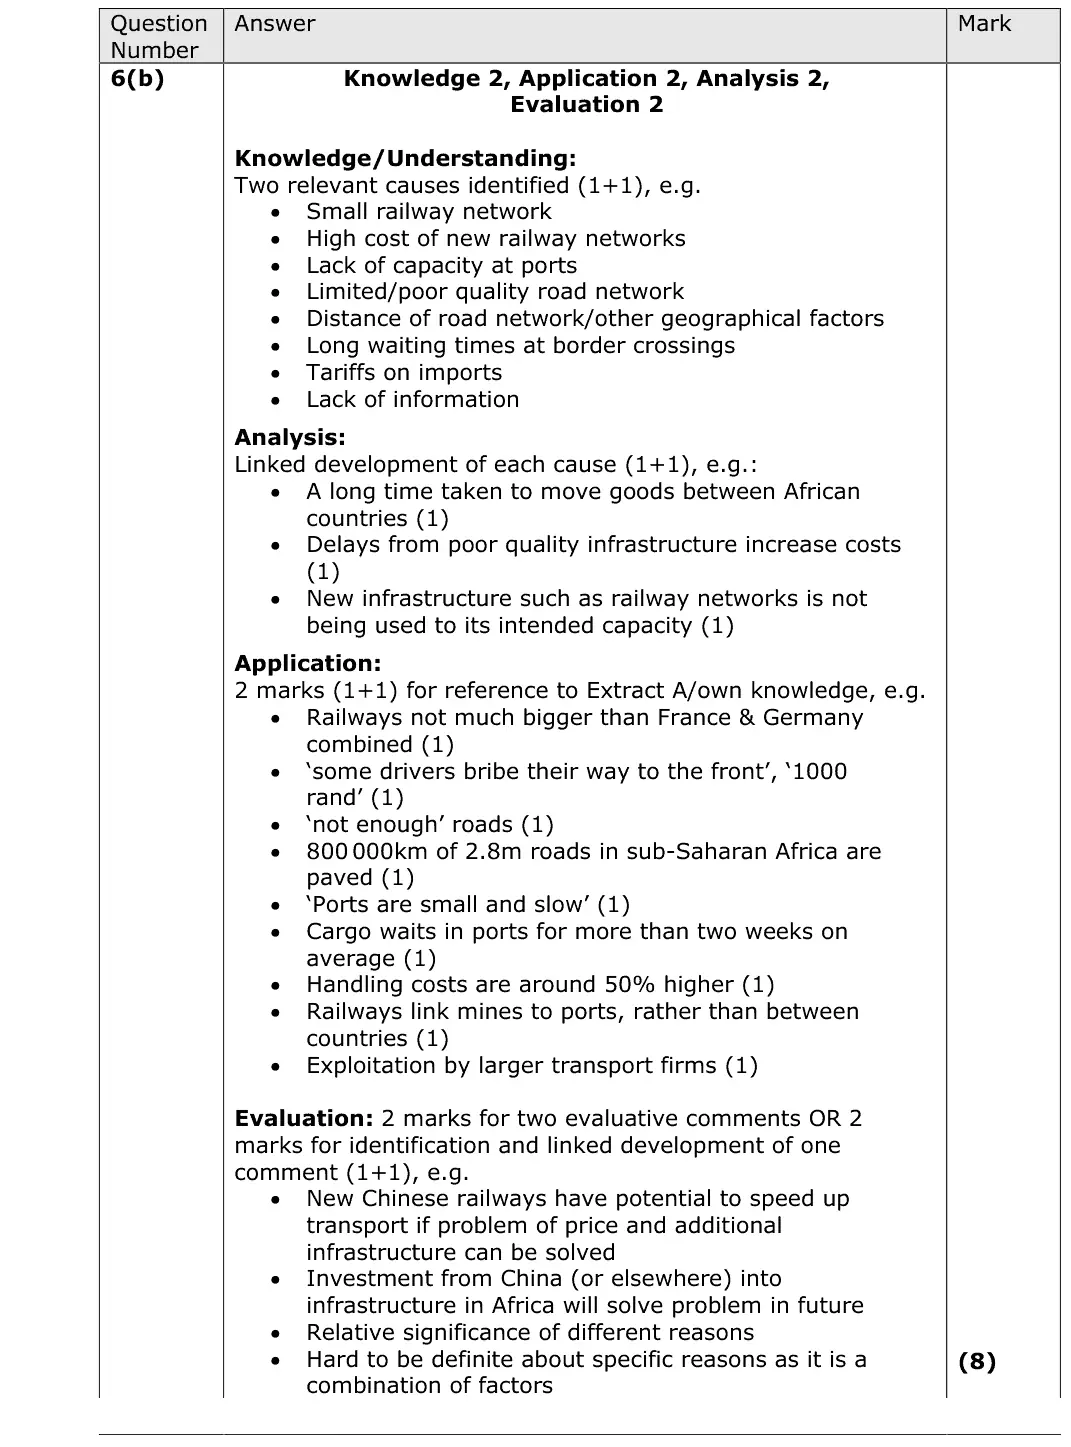
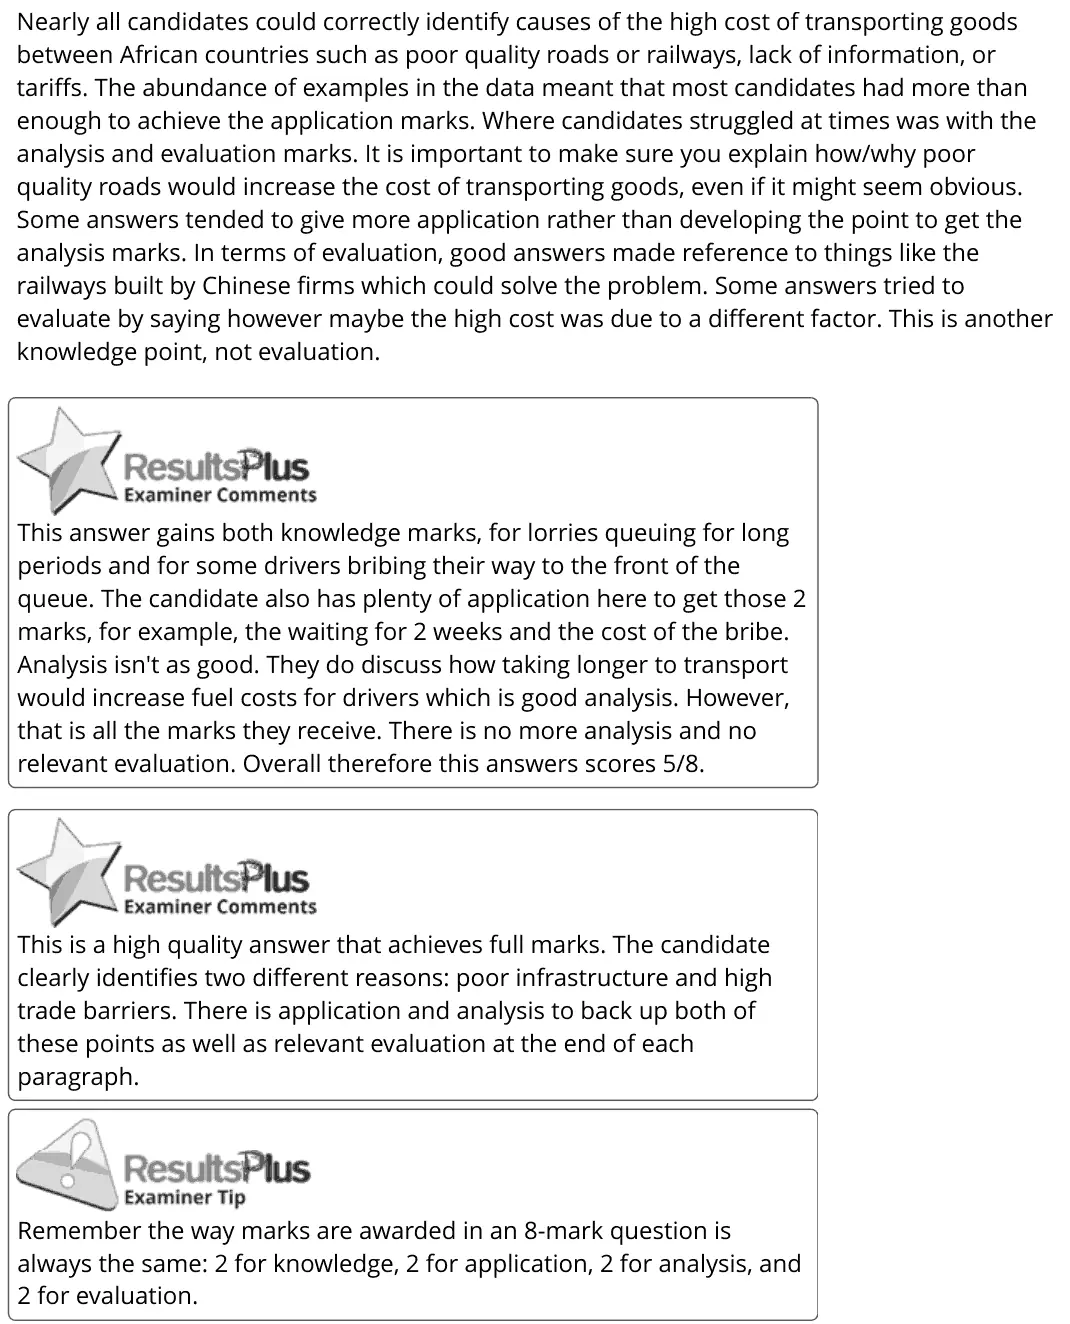
Nearly all candidates could correctly identify causes of the high cost of transporting goods between African countries such as poor quality roads or railways, lack of information, or tariffs. The abundance of examples in the data meant that most candidates had more than enough to achieve the application marks. Where candidates struggled at times was with the analysis and evaluation marks. It is important to make sure you explain how/why poor quality roads would increase the cost of transporting goods, even if it might seem obvious. Some answers tended to give more application rather than developing the point to get the analysis marks. In terms of evaluation, good answers made reference to things like the railways built by Chinese firms which could solve the problem. Some answers tried to evaluate by saying however maybe the high cost was due to a different factor. This is another knowledge point, not evaluation. This answer gains both knowledge marks, for lorries queuing for long periods and for some drivers bribing their way to the front of the queue. The candidate also has plenty of application here to get those 2 marks, for example, the waiting for 2 weeks and the cost of the bribe. Analysis isn't as good. They do discuss how taking longer to transport would increase fuel costs for drivers which is good analysis. However, that is all the marks they receive. There is no more analysis and no relevant evaluation. Overall therefore this answers scores 5/8. This is a high quality answer that achieves full marks. The candidate clearly identifies two different reasons: poor infrastructure and high trade barriers. There is application and analysis to back up both of these points as well as relevant evaluation at the end of each paragraph. Remember the way marks are awarded in an 8-mark question is always the same: 2 for knowledge, 2 for application, 2 for analysis, and 2 for evaluation.
Notes from the mark scheme and report
two causes (poor/unpaved roads, small railway network, slow ports, border delays and bribes, lack of information) with analysis of why they raise costs
giving another cause is not evaluation
Quantitative skills: QS 9 (interpret, apply and analyse information in written, graphical tabular and numerical forms)
June 2023 · Paper 2 · Q6(c)12 marksAO1=2, AO2=2, AO3=4, AO4=412-mark response
Data and extracts for question 6
Mark scheme, including the levels grid and indicative content
Examiner's comment
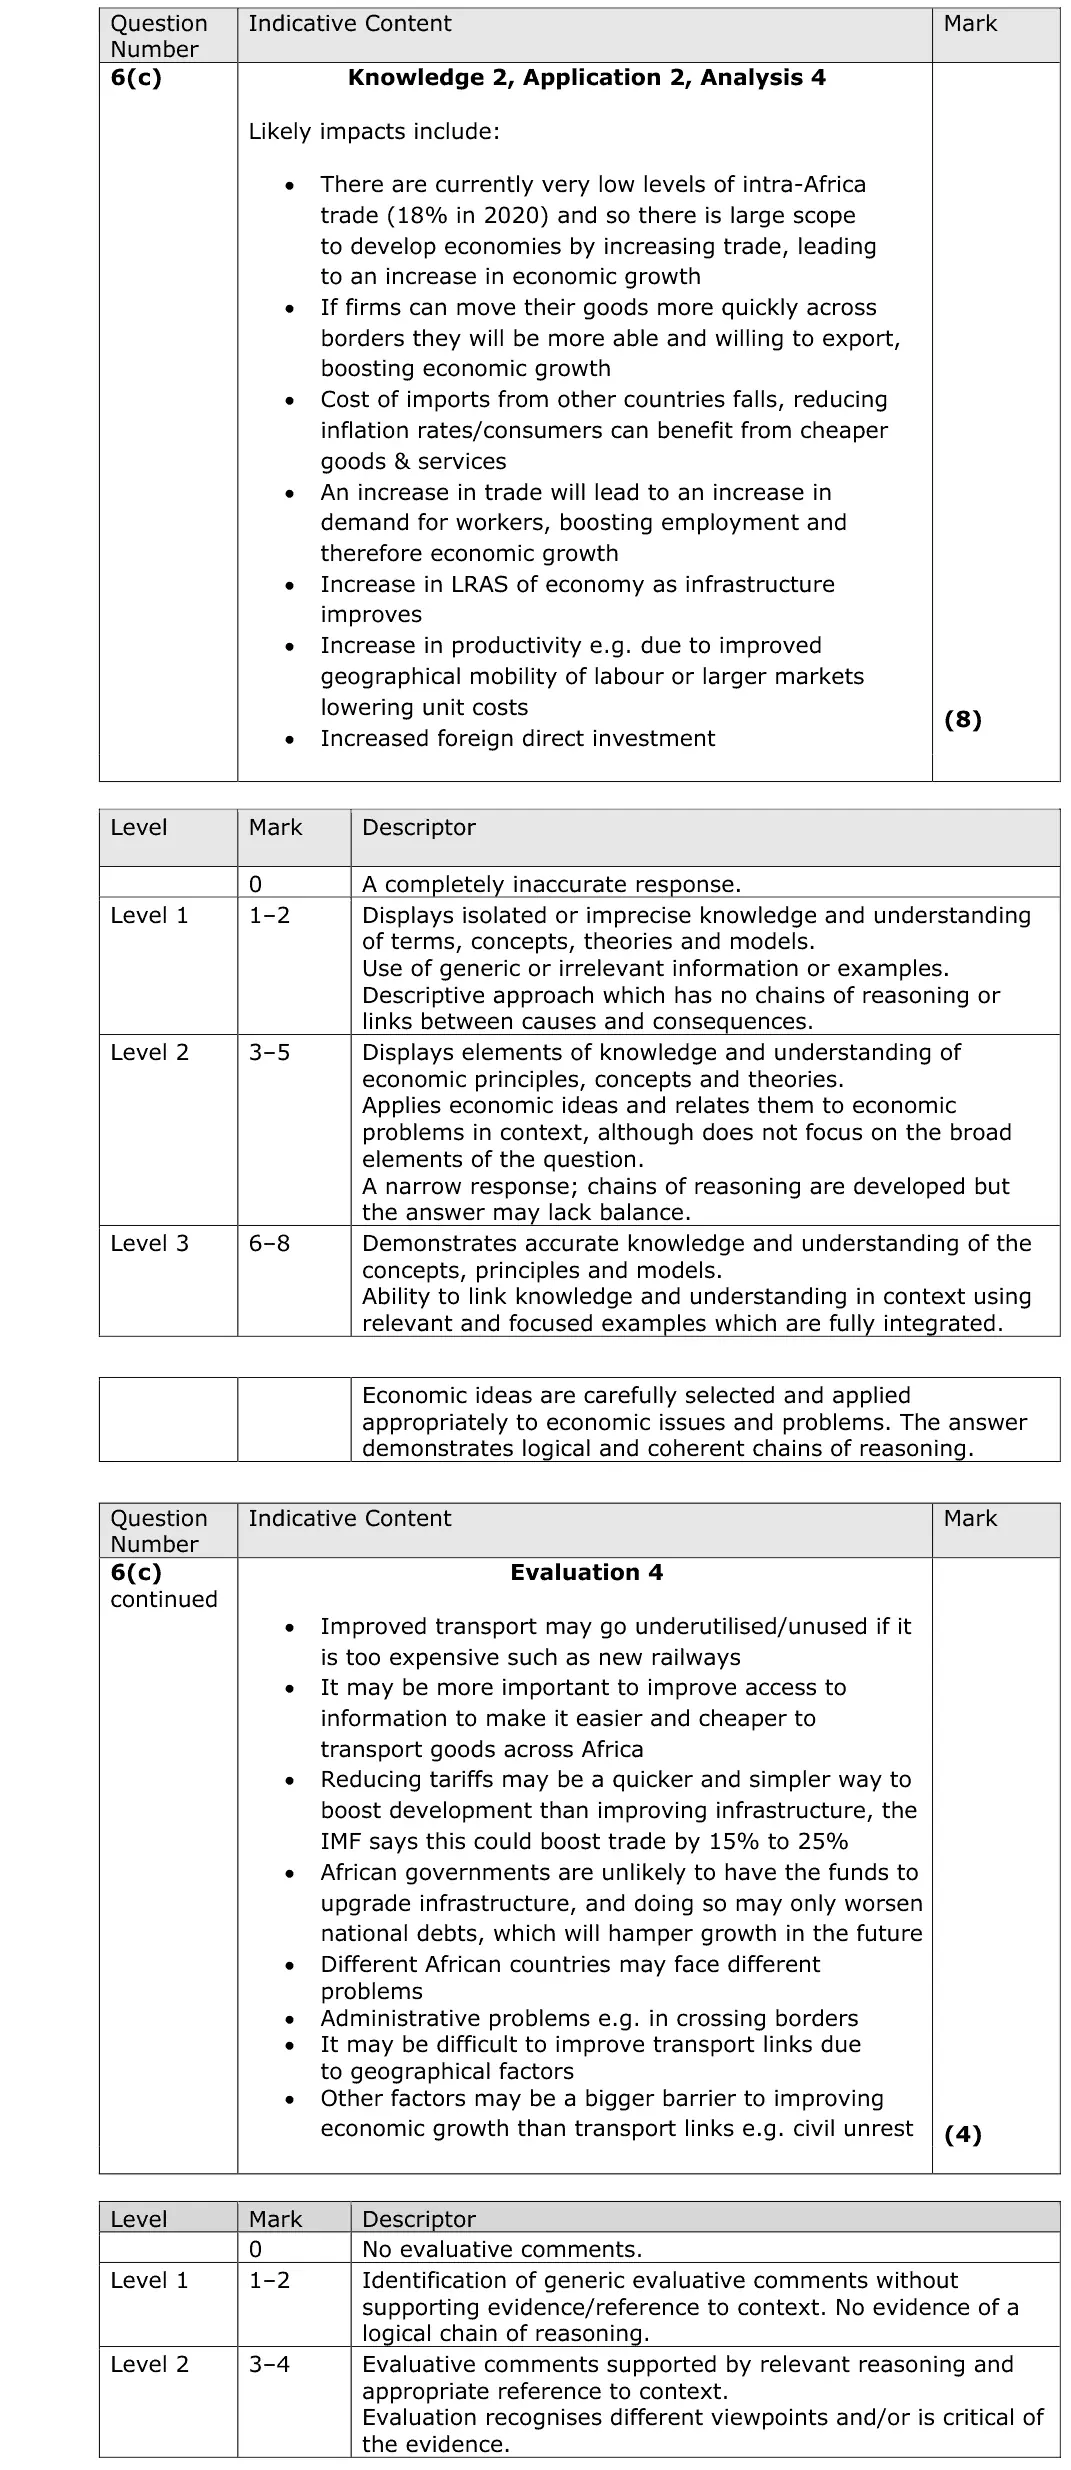
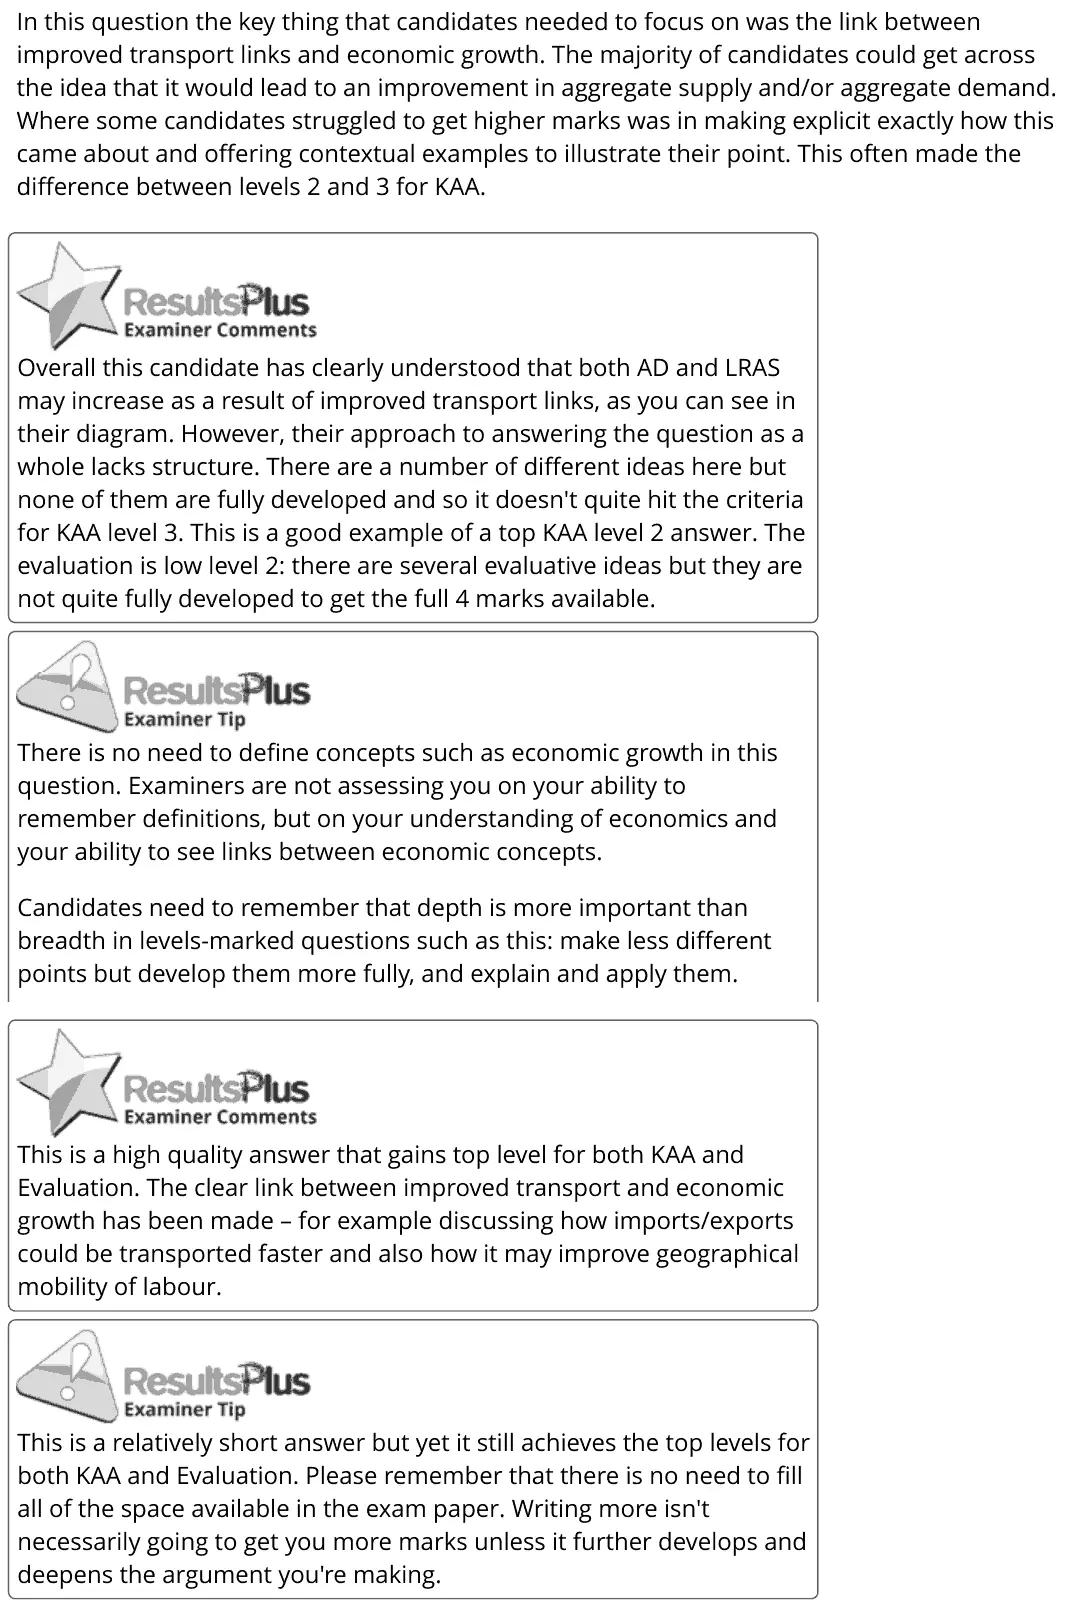
In this question the key thing that candidates needed to focus on was the link between improved transport links and economic growth. The majority of candidates could get across the idea that it would lead to an improvement in aggregate supply and/or aggregate demand. Where some candidates struggled to get higher marks was in making explicit exactly how this came about and offering contextual examples to illustrate their point. This often made the difference between levels 2 and 3 for KAA. Overall this candidate has clearly understood that both AD and LRAS may increase as a result of improved transport links, as you can see in their diagram. However, their approach to answering the question as a whole lacks structure. There are a number of different ideas here but none of them are fully developed and so it doesn't quite hit the criteria for KAA level 3. This is a good example of a top KAA level 2 answer. The evaluation is low level 2: there are several evaluative ideas but they are not quite fully developed to get the full 4 marks available. There is no need to define concepts such as economic growth in this question. Examiners are not assessing you on your ability to remember definitions, but on your understanding of economics and your ability to see links between economic concepts. Candidates need to remember that depth is more important than breadth in levels-marked questions such as this: make less different points but develop them more fully, and explain and apply them. This is a high quality answer that gains top level for both KAA and Evaluation. The clear link between improved transport and economic growth has been made – for example discussing how imports/exports could be transported faster and also how it may improve geographical mobility of labour. This is a relatively short answer but yet it still achieves the top levels for both KAA and Evaluation. Please remember that there is no need to fill all of the space available in the exam paper. Writing more isn't necessarily going to get you more marks unless it further develops and deepens the argument you're making.
Notes from the mark scheme and report
better transport raises LRAS (productivity, lower costs) and AD (exports, FDI) so growth increases
intra-Africa trade only 18%
Level 3 needs explicit links and context
evaluate with funding, under-used railways, other barriers
June 2023 · Paper 2 · Q6(d)10 marksAO1=2, AO2=2, AO3=2, AO4=410-mark response
Data and extracts for question 6
Mark scheme, including the levels grid and indicative content
Examiner's comment
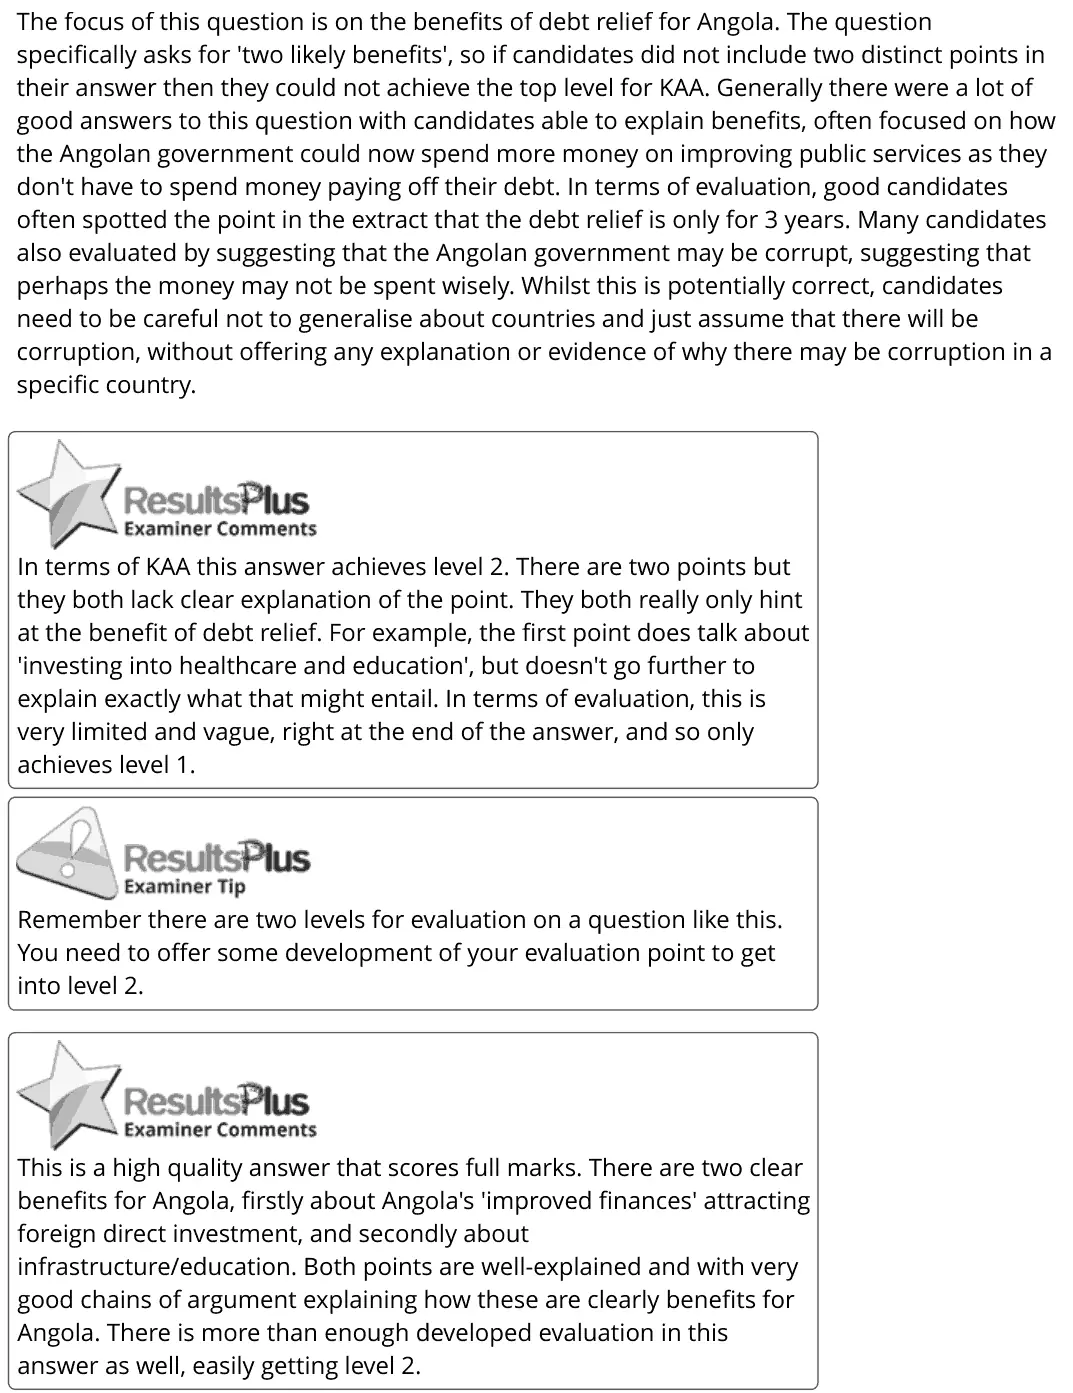
The focus of this question is on the benefits of debt relief for Angola. The question specifically asks for 'two likely benefits', so if candidates did not include two distinct points in their answer then they could not achieve the top level for KAA. Generally there were a lot of good answers to this question with candidates able to explain benefits, often focused on how the Angolan government could now spend more money on improving public services as they don't have to spend money paying off their debt. In terms of evaluation, good candidates often spotted the point in the extract that the debt relief is only for 3 years. Many candidates also evaluated by suggesting that the Angolan government may be corrupt, suggesting that perhaps the money may not be spent wisely. Whilst this is potentially correct, candidates need to be careful not to generalise about countries and just assume that there will be corruption, without offering any explanation or evidence of why there may be corruption in a specific country. In terms of KAA this answer achieves level 2. There are two points but they both lack clear explanation of the point. They both really only hint at the benefit of debt relief. For example, the first point does talk about 'investing into healthcare and education', but doesn't go further to explain exactly what that might entail. In terms of evaluation, this is very limited and vague, right at the end of the answer, and so only achieves level 1. Remember there are two levels for evaluation on a question like this. You need to offer some development of your evaluation point to get into level 2. This is a high quality answer that scores full marks. There are two clear benefits for Angola, firstly about Angola's 'improved finances' attracting foreign direct investment, and secondly about infrastructure/education. Both points are well-explained and with very good chains of argument explaining how these are clearly benefits for Angola. There is more than enough developed evaluation in this answer as well, easily getting level 2.
Notes from the mark scheme and report
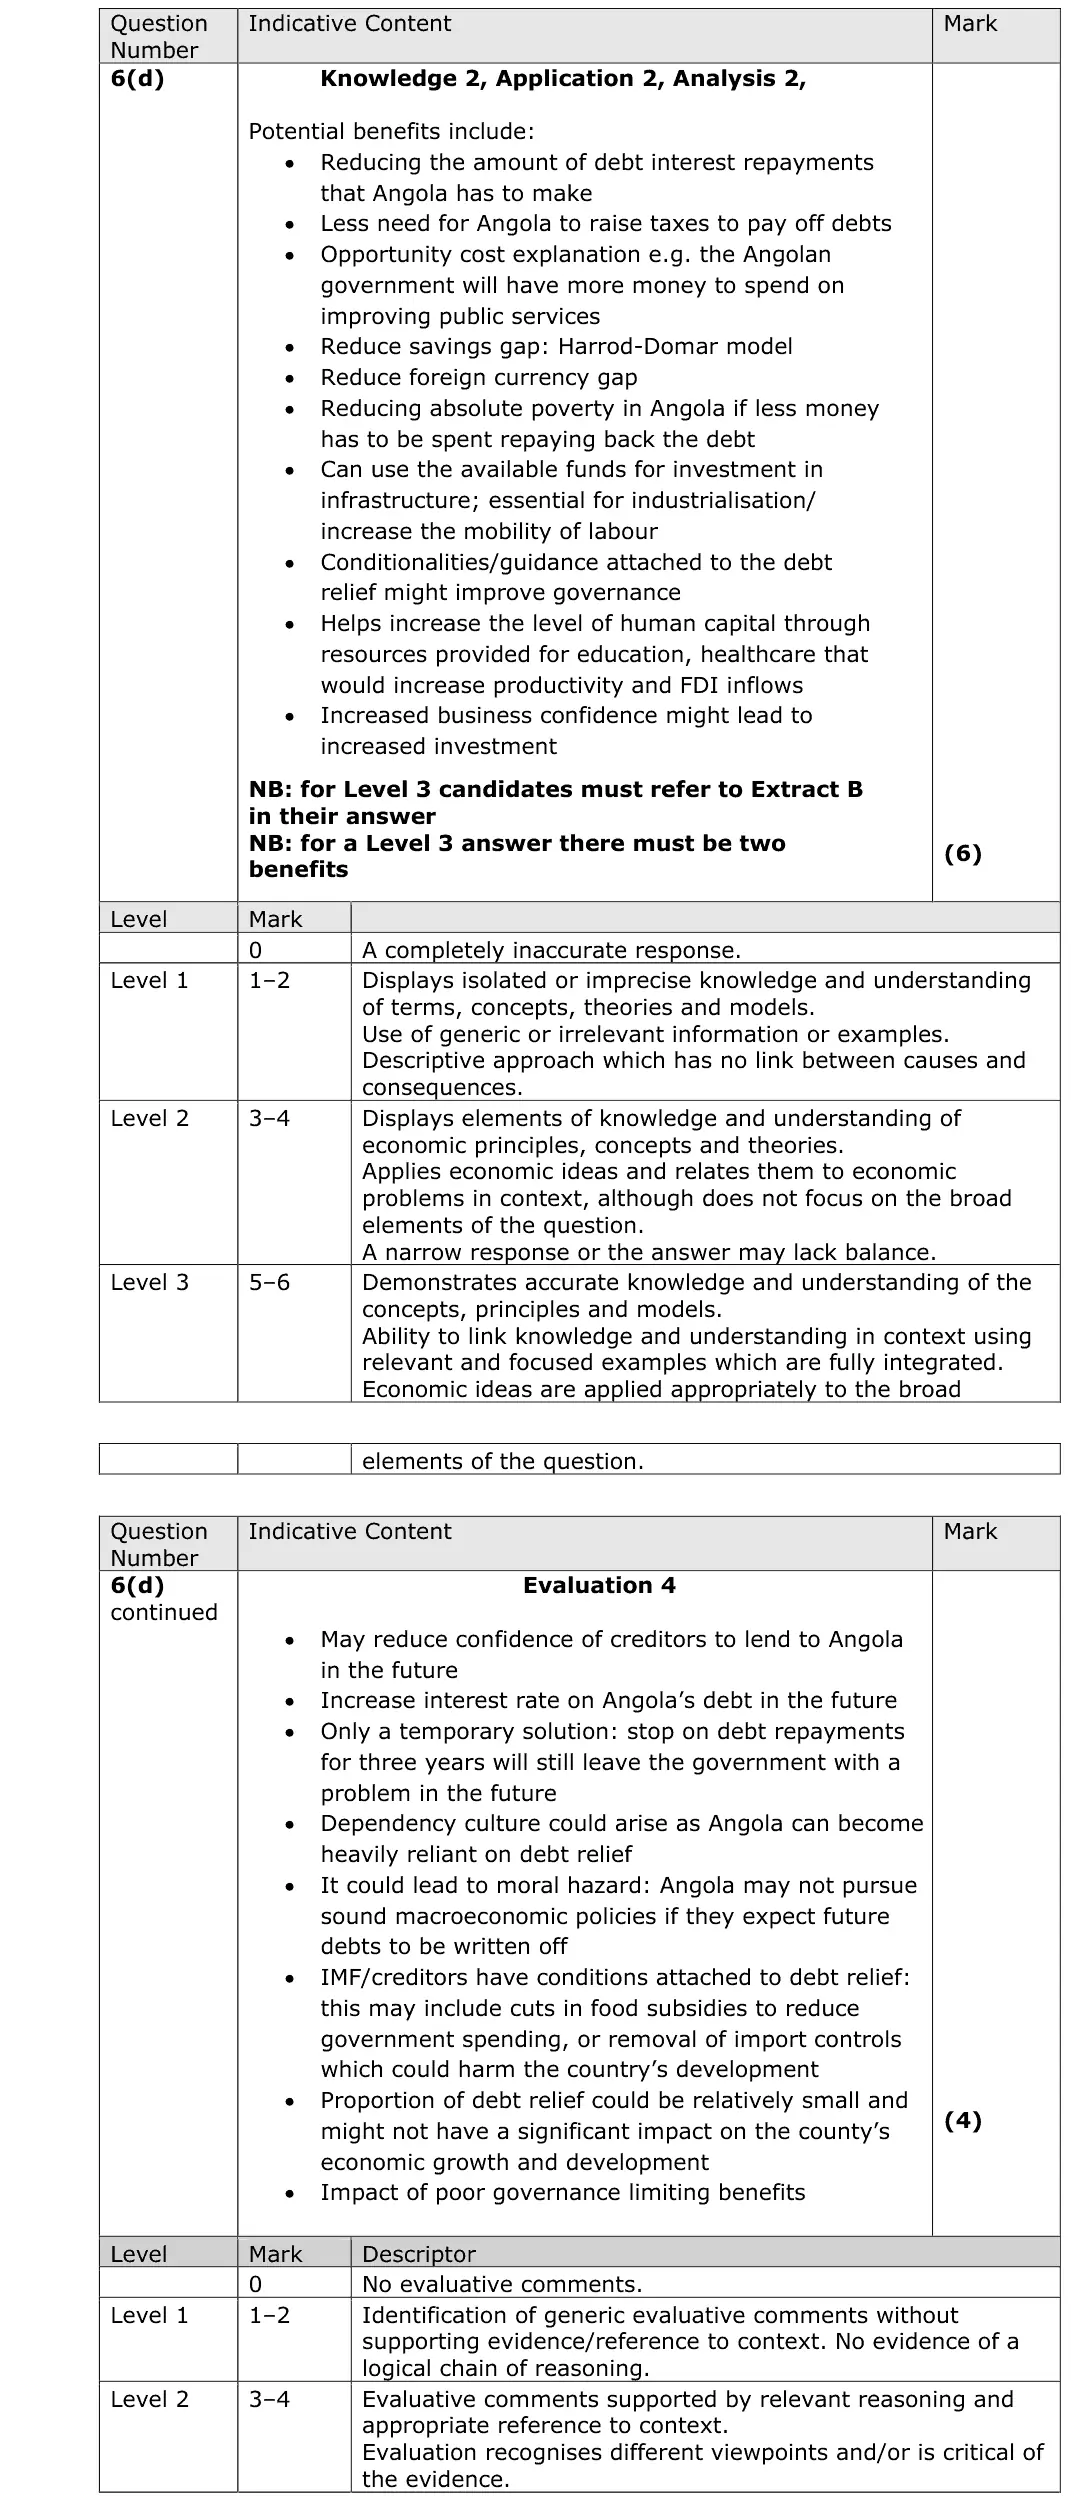
two distinct benefits needed for Level 3 (lower debt interest, more spending on public services, savings/foreign currency gap, confidence and FDI) with Extract B context
evaluate with relief only for 3 years, moral hazard, conditions
do not just assume corruption
June 2023 · Paper 2 · Q6(e)15 marksAO1=3, AO2=3, AO3=3, AO4=615-mark response
Data and extracts for question 6
Mark scheme, including the levels grid and indicative content
Examiner's comment
There are two important points that candidates needed to focus on when answering this question. Firstly, that it is about market-orientated strategies. Secondly, that they needed to explain how these policies would help to 'improve development'. Unfortunately, a significant number of candidates failed to appreciate these important points and so because they hadn't answered the question they couldn't get a very high mark. If an answer didn't focus on development then it couldn't get the top level 3 for KAA. Having said that, there were many good answers, often focusing on policies discussed in the extract, in particular privatisation, but equally there are a very wide variety of possible market-based policies that could be discussed in this question. This answer correctly identifies and does a fairly good job of explaining two different market-orientated policies. Firstly deregulation and secondly cutting corporation tax. The deregulation point is slightly more well-developed than the second point. However, neither point really has any context to make it specific to Angola (or really to any developing country). As such, overall this answer is a very good level 2 KAA answer, but it doesn't meet all the criteria to justify a level 3 mark. In terms of evaluation, both points have been evaluated, again the first point was better than the second. The second point is really very brief and only a level 1 evaluation point, however the first point is better and worthy of level 2, giving low level 2 overall for evaluation. Make sure you relate your answers to the real world. Examiners are looking to see that you can apply economic theory to real-life situations. This is an excellent answer to this question, achieving top level for both KAA and Evaluation. Both points clearly demonstrate that the candidate has very good knowledge of the policies they are discussing and they have also explained, with clear step-by-step chains of argument, how both of their policies could help to improve development in Angola. Privatisation was often a policy that candidates wrote about, but then struggled to link it to development, only focusing on efficiency, so this is a good example of how to effectively link privatisation to improved development. Both points are also well-evaluated. It was good to see the candidate also making effective use of the data and of Angola's dependence on oil to clearly illustrate their evaluation points. Make sure you fully answer a question. For example, in this question that means not just writing about market-based policies, but about how they can lead to an improvement in development.
Notes from the mark scheme and report
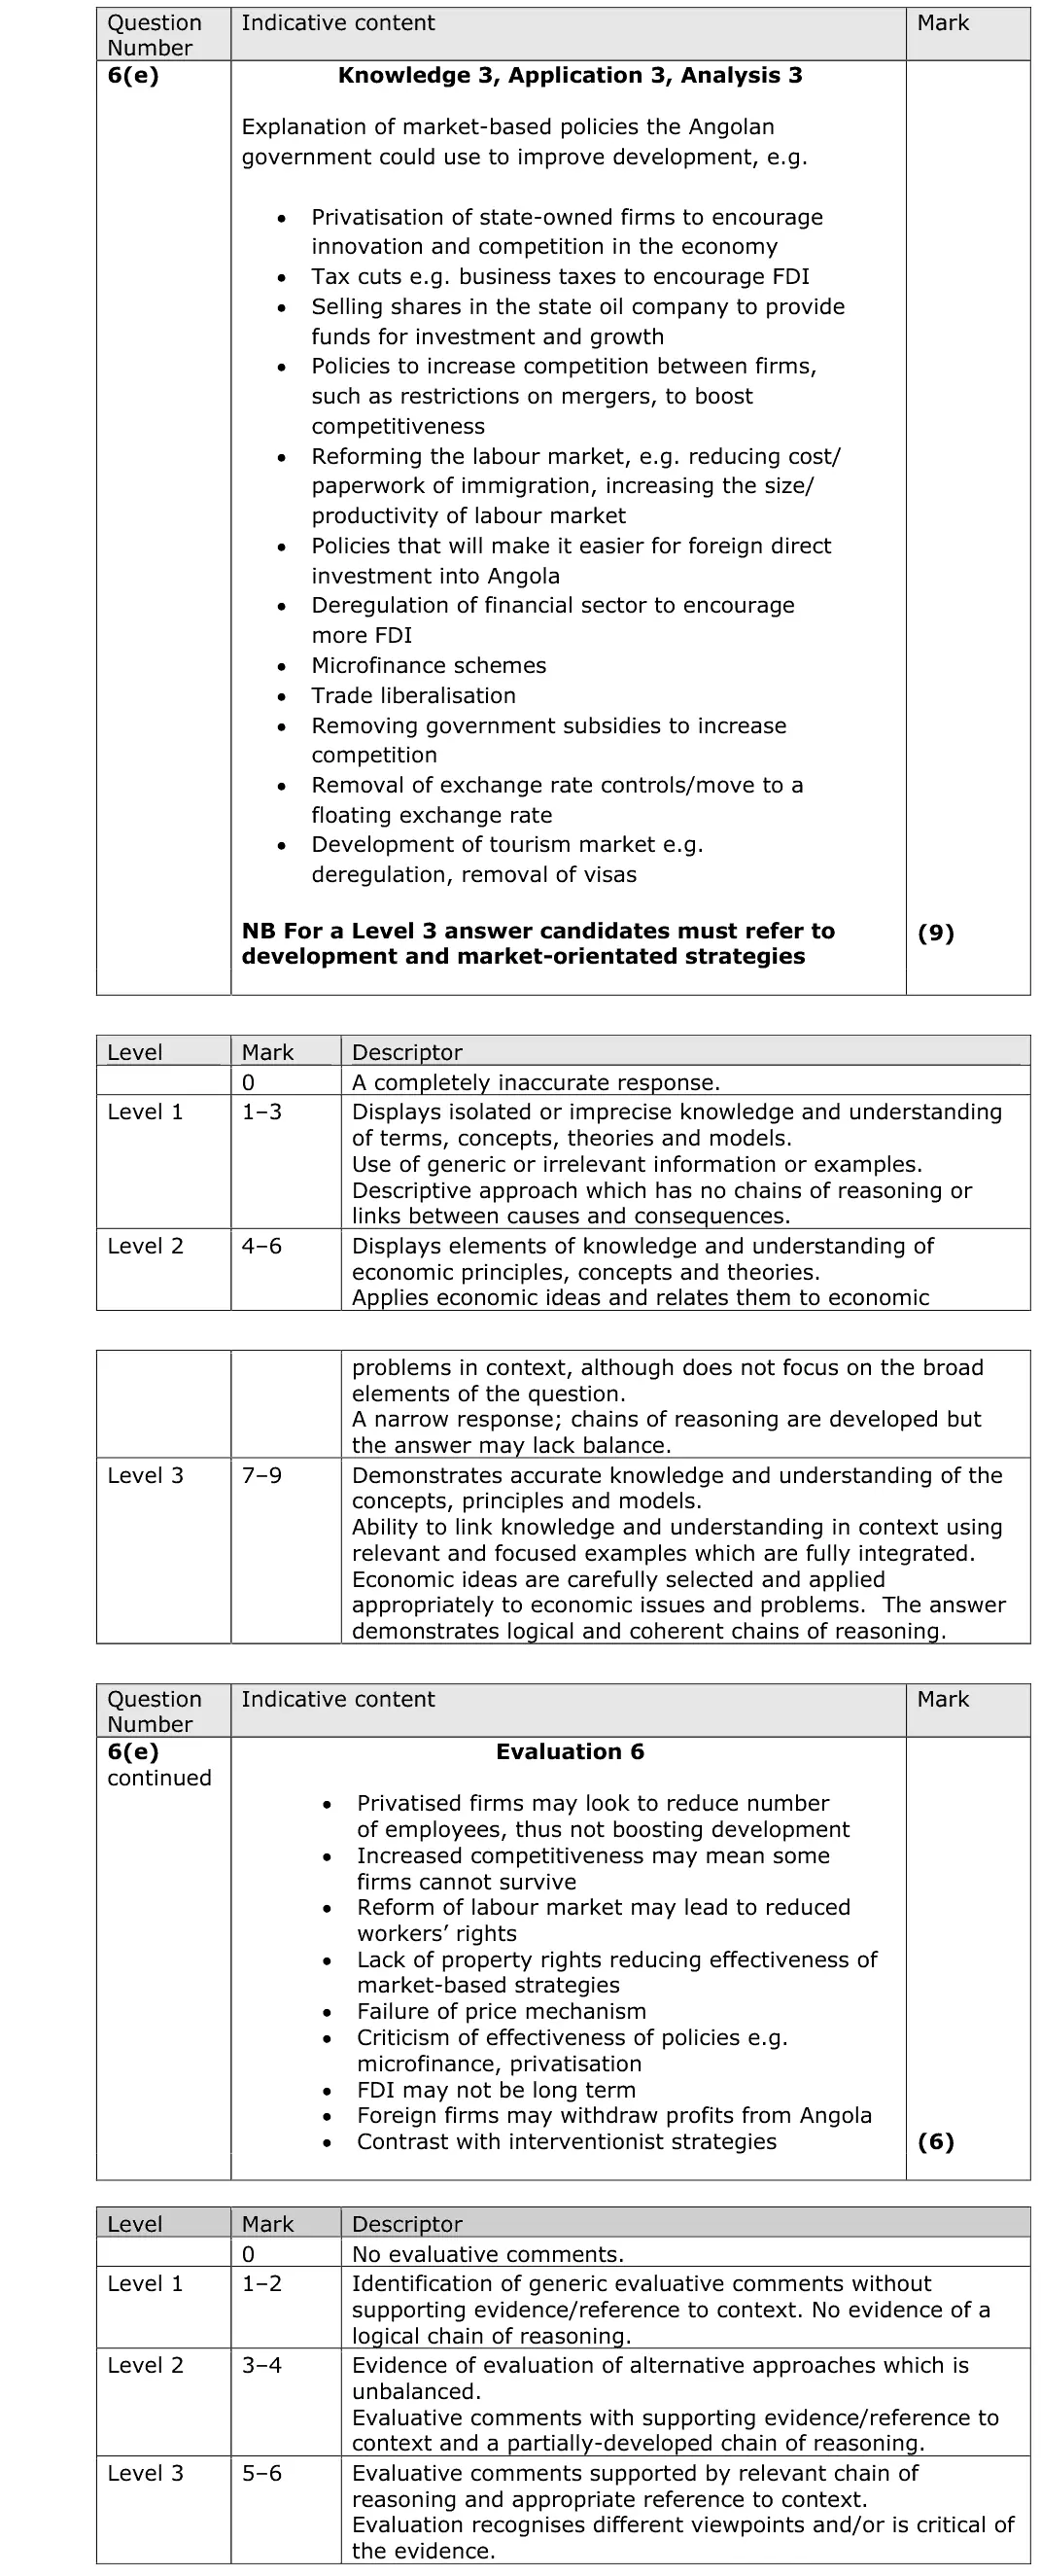
market-orientated strategies only (privatisation of the state oil firm, FDI promotion, trade liberalisation, floating exchange rate, microfinance) linked to development, not just growth
Level 3 needs a focus on development
June 2022 · Paper 3 · Q2(a)5 marksAO1=2, AO2=2, AO3=1Short answerHard
Data and extracts for question 2
Mark scheme
Examiner's comment
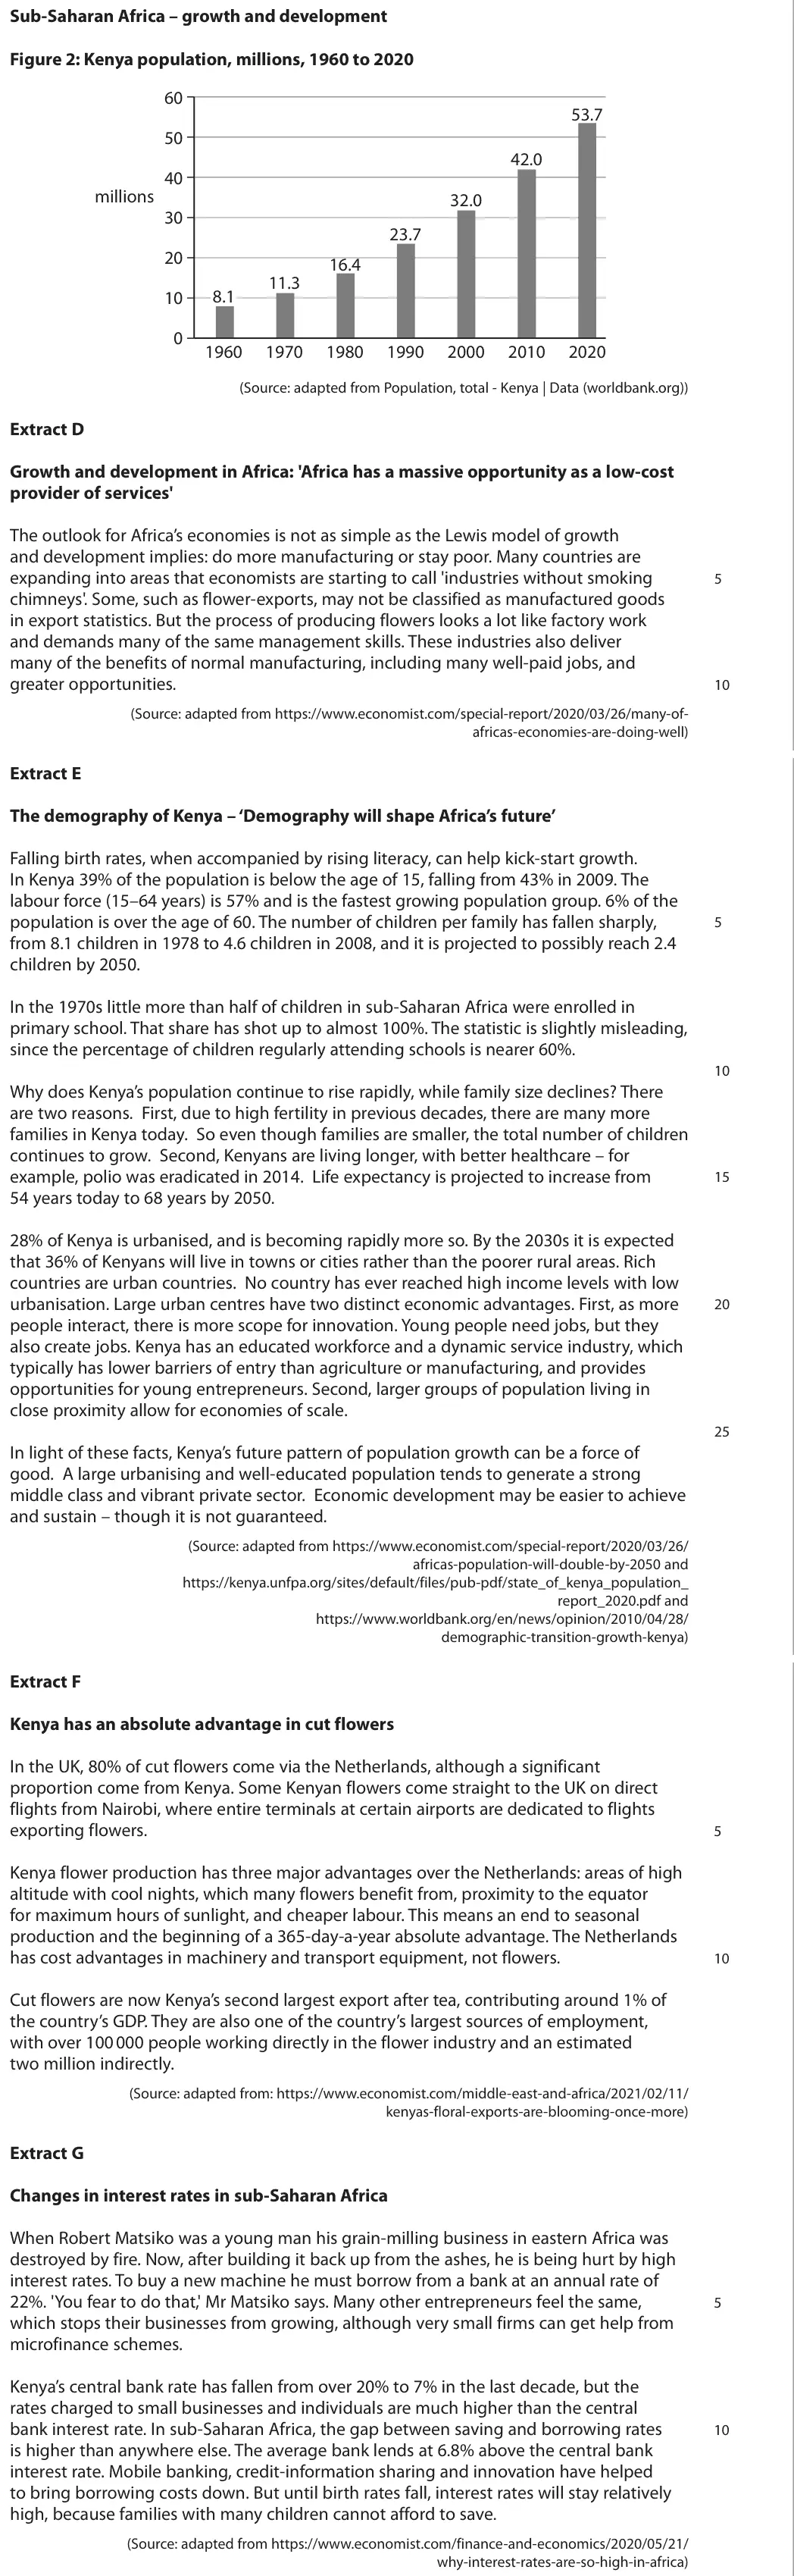
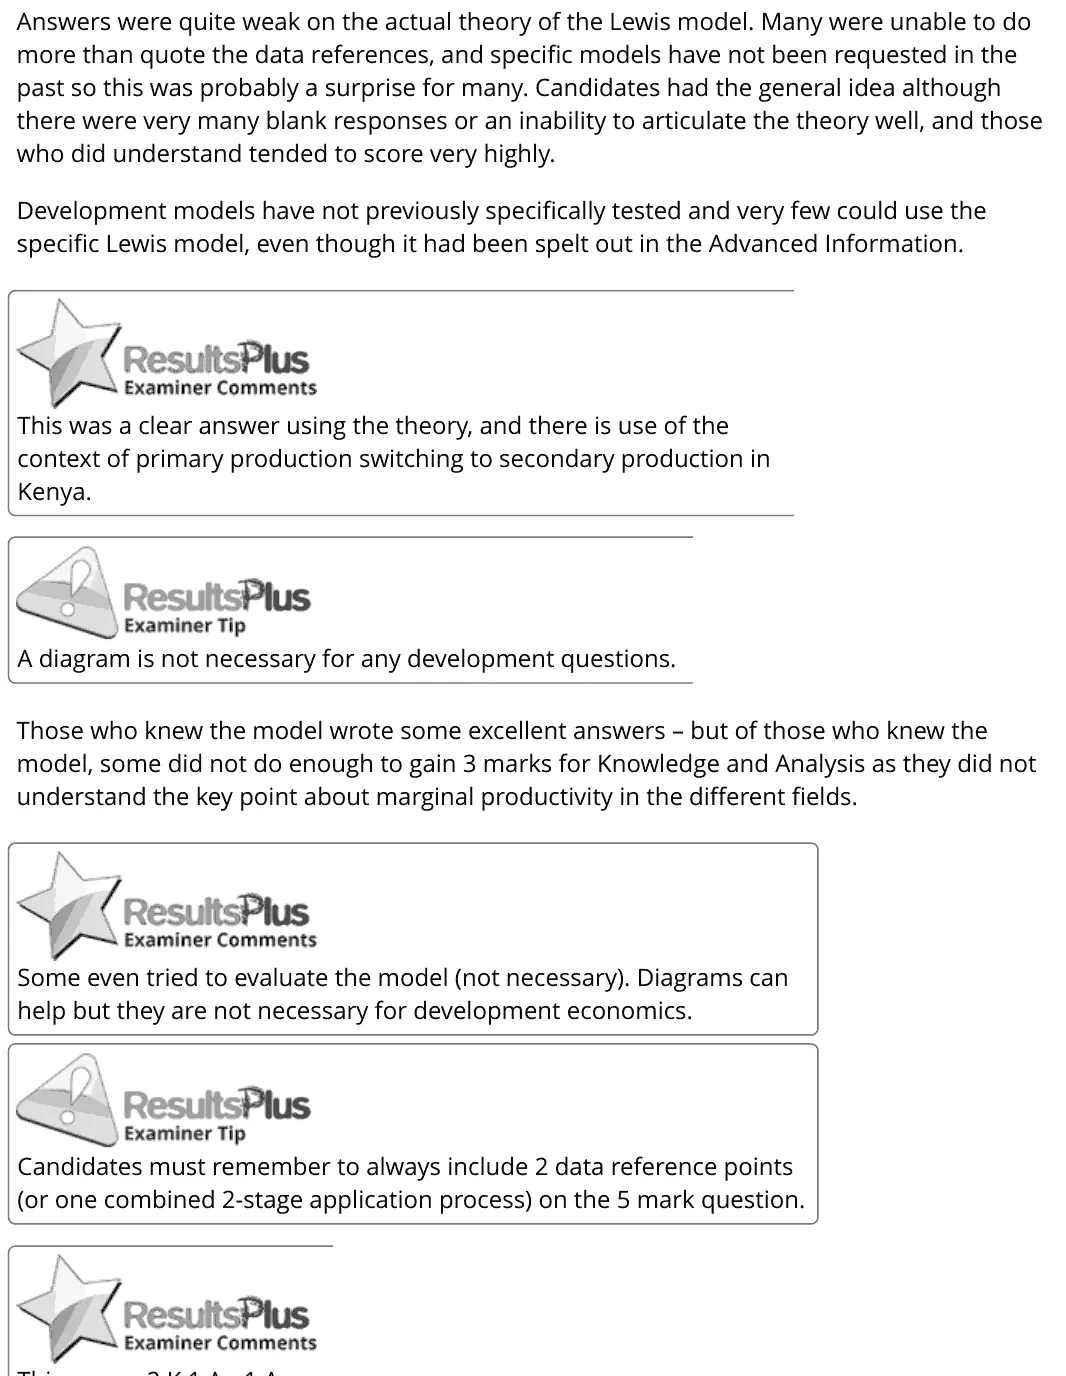
Answers were quite weak on the actual theory of the Lewis model. Many were unable to do more than quote the data references, and specific models have not been requested in the past so this was probably a surprise for many. Candidates had the general idea although there were very many blank responses or an inability to articulate the theory well, and those who did understand tended to score very highly. Development models have not previously specifically tested and very few could use the specific Lewis model, even though it had been spelt out in the Advanced Information. This was a clear answer using the theory, and there is use of the context of primary production switching to secondary production in Kenya. A diagram is not necessary for any development questions. Those who knew the model wrote some excellent answers – but of those who knew the model, some did not do enough to gain 3 marks for Knowledge and Analysis as they did not understand the key point about marginal productivity in the different fields. Some even tried to evaluate the model (not necessary). Diagrams can help but they are not necessary for development economics. Candidates must remember to always include 2 data reference points (or one combined 2-stage application process) on the 5 mark question.
Notes from the mark scheme and report
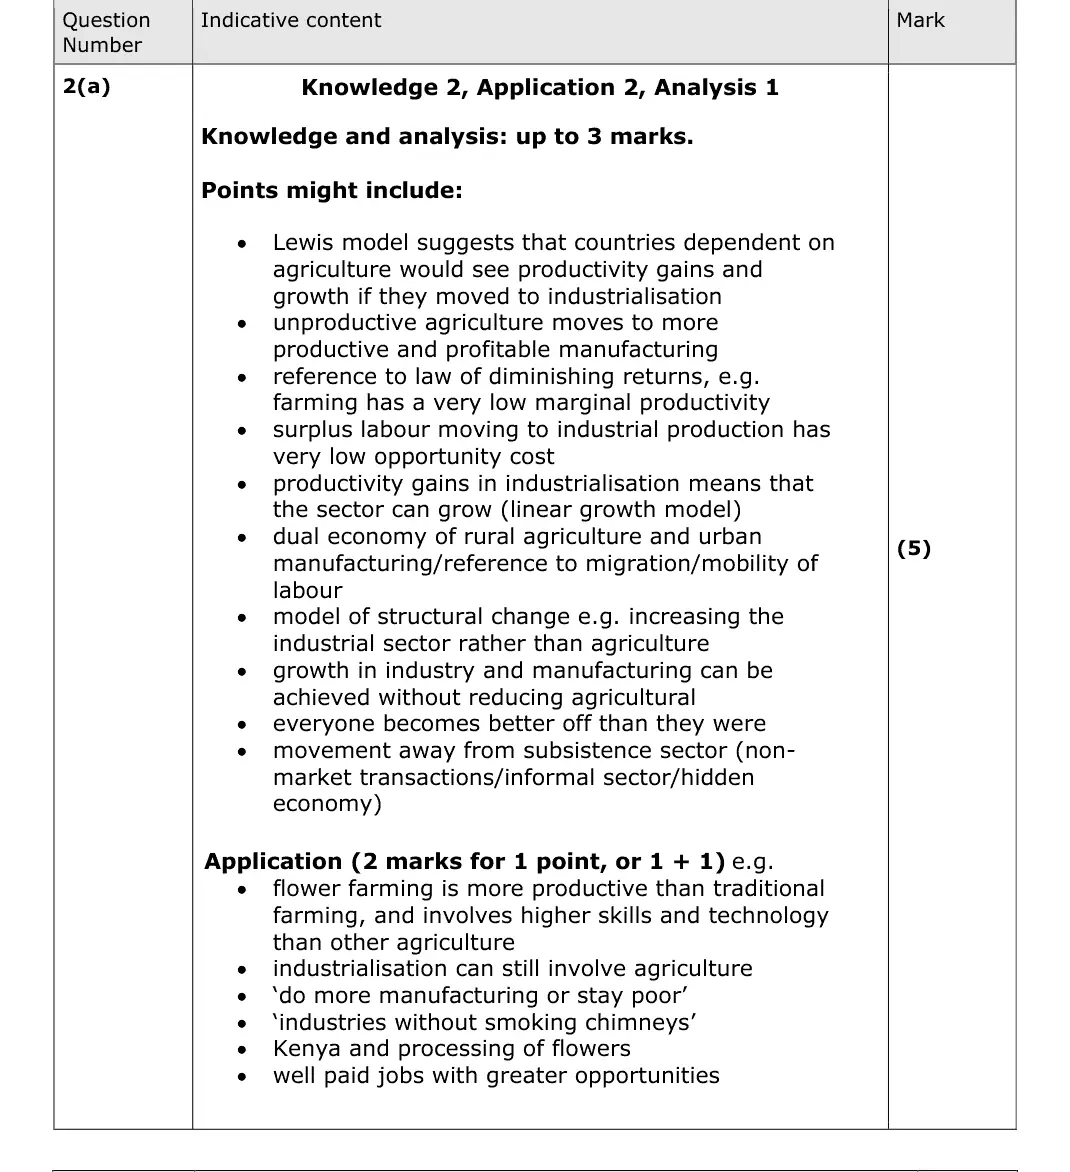
Lewis model: surplus labour with near-zero marginal productivity moves from agriculture to more productive industry at low opportunity cost
dual economy
two data references needed (e.g. 'industries without smoking chimneys', flower farming)
report: "Answers were quite weak on the actual theory of the Lewis model" with very many blank responses
Quantitative skills: QS 9 (interpret, apply and analyse information in written, graphical tabular and numerical forms)
June 2022 · Paper 3 · Q2(b)8 marksAO1=2, AO2=2, AO3=2, AO4=28-mark response
Data and extracts for question 2
Mark scheme, including the levels grid and indicative content
Examiner's comment
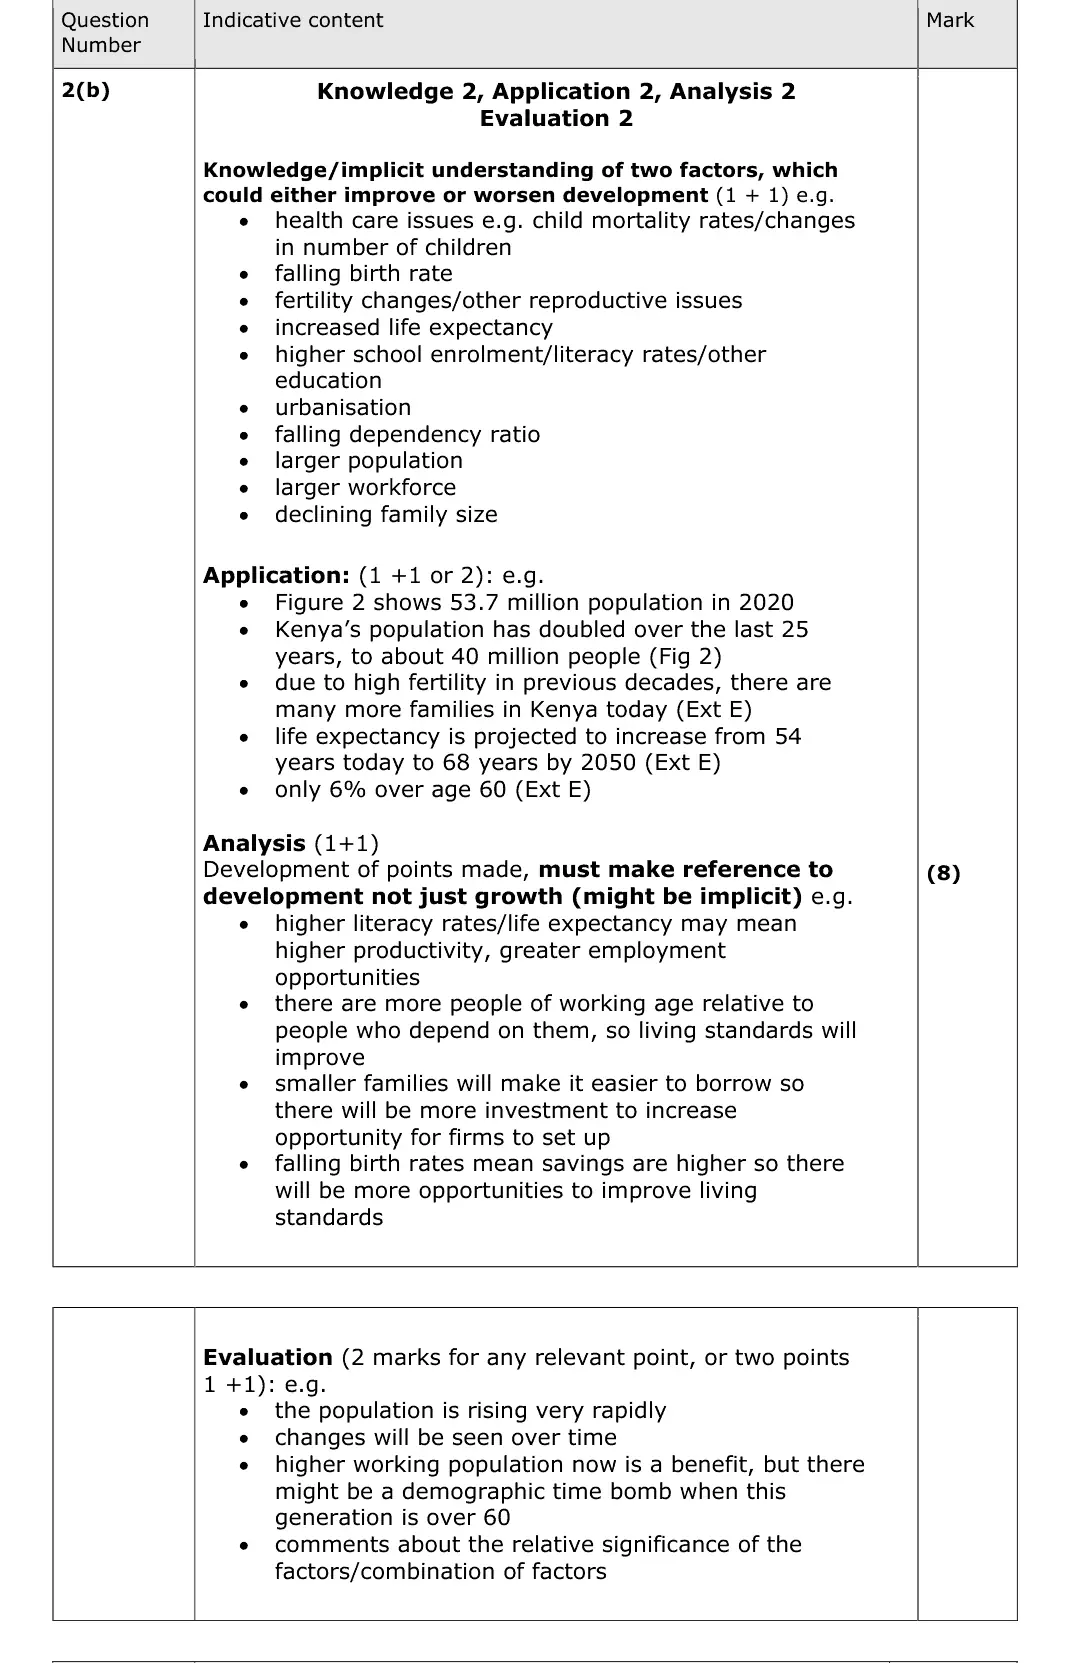
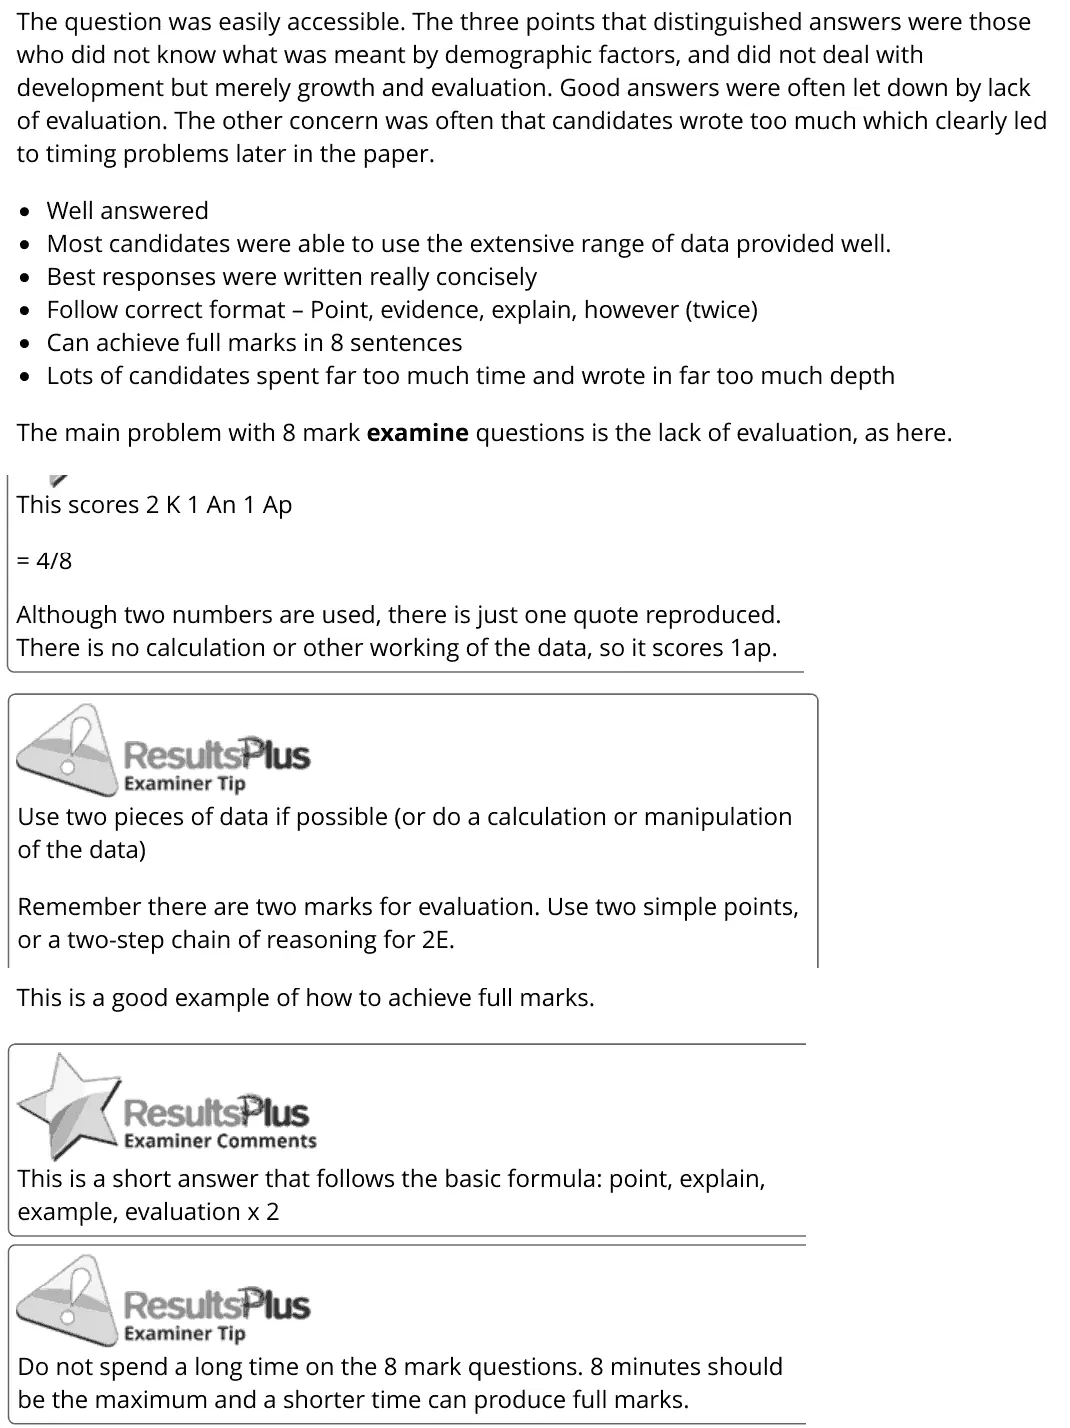
The question was easily accessible. The three points that distinguished answers were those who did not know what was meant by demographic factors, and did not deal with development but merely growth and evaluation. Good answers were often let down by lack of evaluation. The other concern was often that candidates wrote too much which clearly led to timing problems later in the paper. Well answered Most candidates were able to use the extensive range of data provided well. Best responses were written really concisely Follow correct format – Point, evidence, explain, however (twice) Can achieve full marks in 8 sentences Lots of candidates spent far too much time and wrote in far too much depth The main problem with 8 mark examine questions is the lack of evaluation, as here. This scores 2 K 1 An 1 Ap = 4/8 Although two numbers are used, there is just one quote reproduced. There is no calculation or other working of the data, so it scores 1ap. Use two pieces of data if possible (or do a calculation or manipulation of the data) Remember there are two marks for evaluation. Use two simple points, or a two-step chain of reasoning for 2E. This is a good example of how to achieve full marks. This is a short answer that follows the basic formula: point, explain, example, evaluation x 2 Do not spend a long time on the 8 mark questions. 8 minutes should be the maximum and a shorter time can produce full marks.
Notes from the mark scheme and report
two demographic factors (falling birth rate, dependency ratio, life expectancy, urbanisation) linked to development, not just growth
use two pieces of data from Figure 2 and Extract E
many lacked evaluation, e.g. a future demographic time bomb
Quantitative skills: QS 9 (interpret, apply and analyse information in written, graphical tabular and numerical forms)
June 2022 · Paper 3 · Q2(e)25 marksAO1=4, AO2=4, AO3=8, AO4=925-mark essayEither/or
Data and extracts for question 2
Mark scheme, including the levels grid and indicative content
Examiner's comment
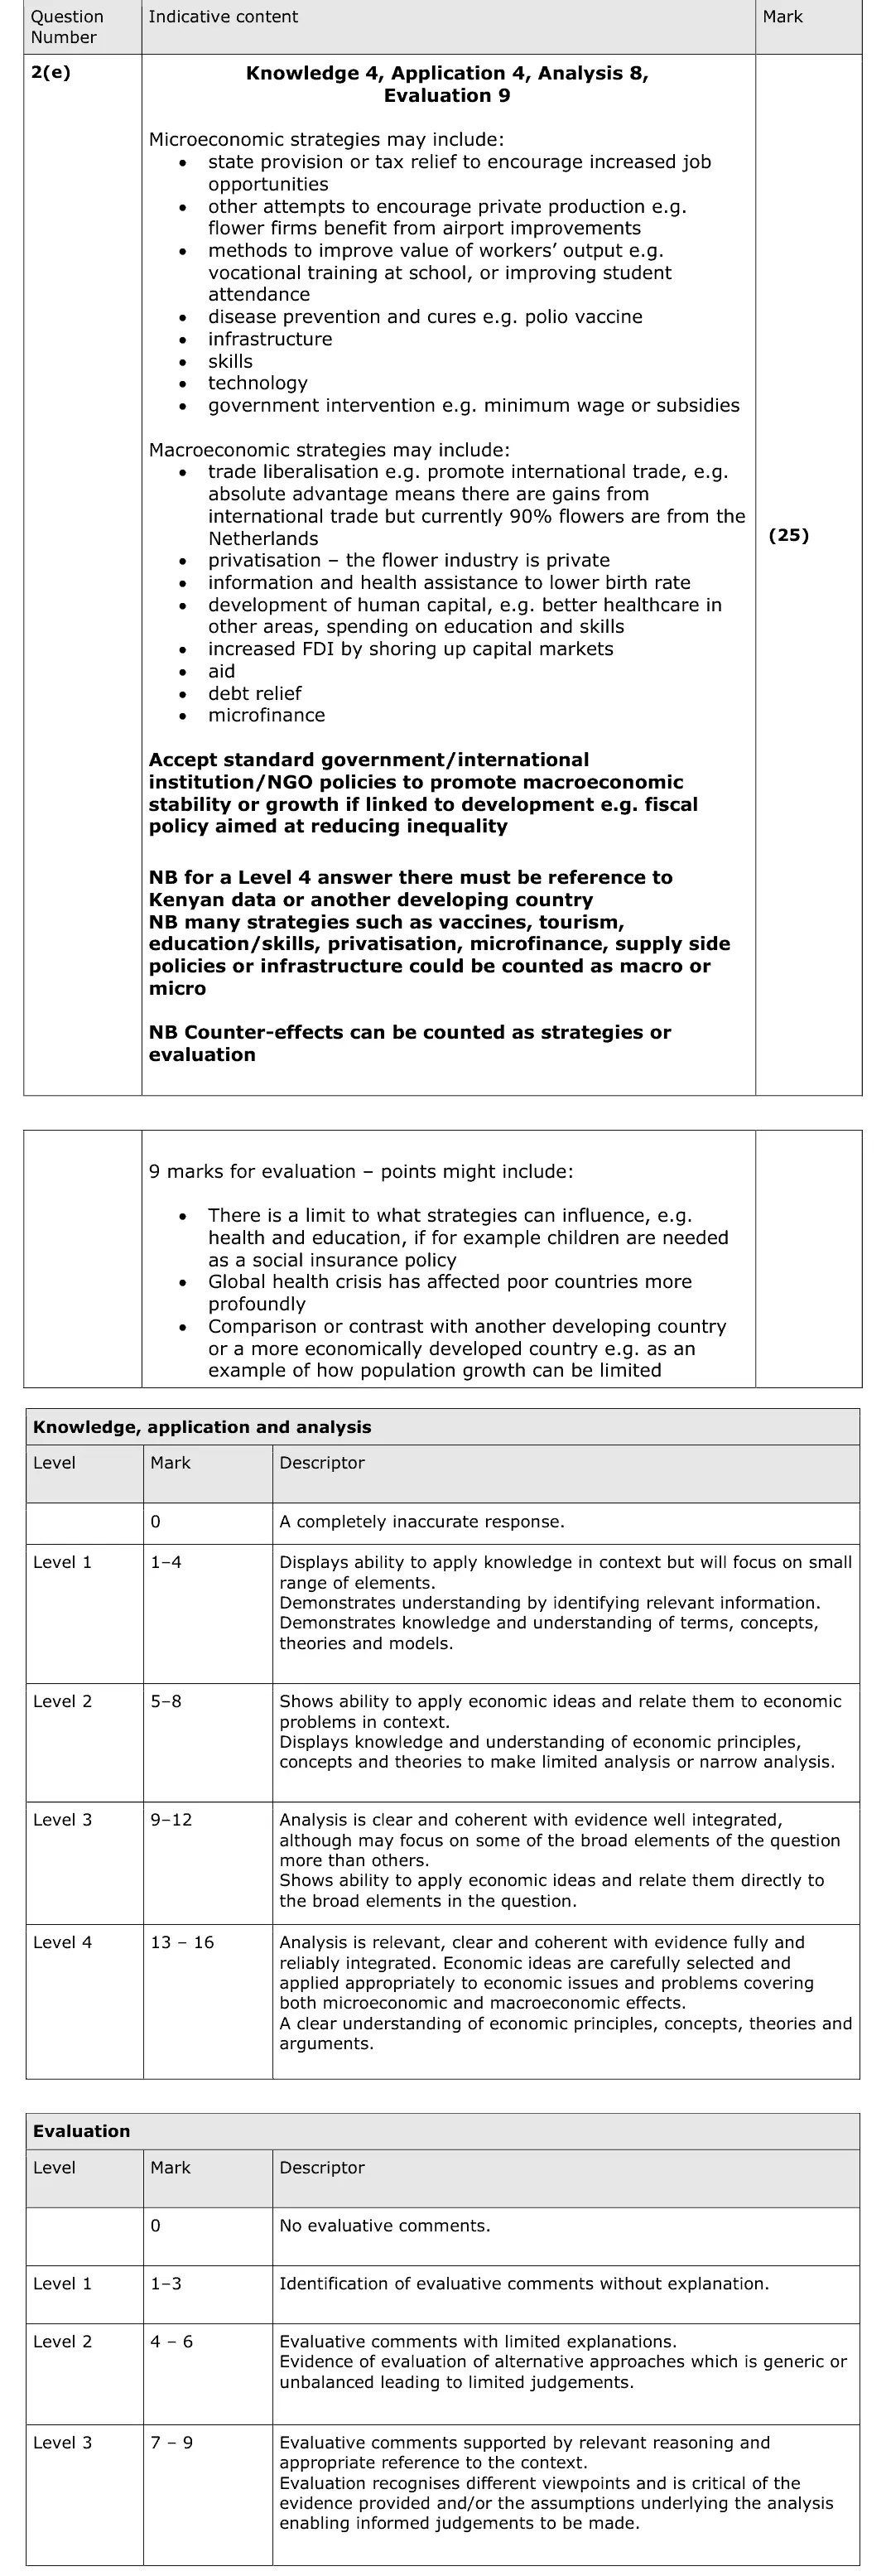
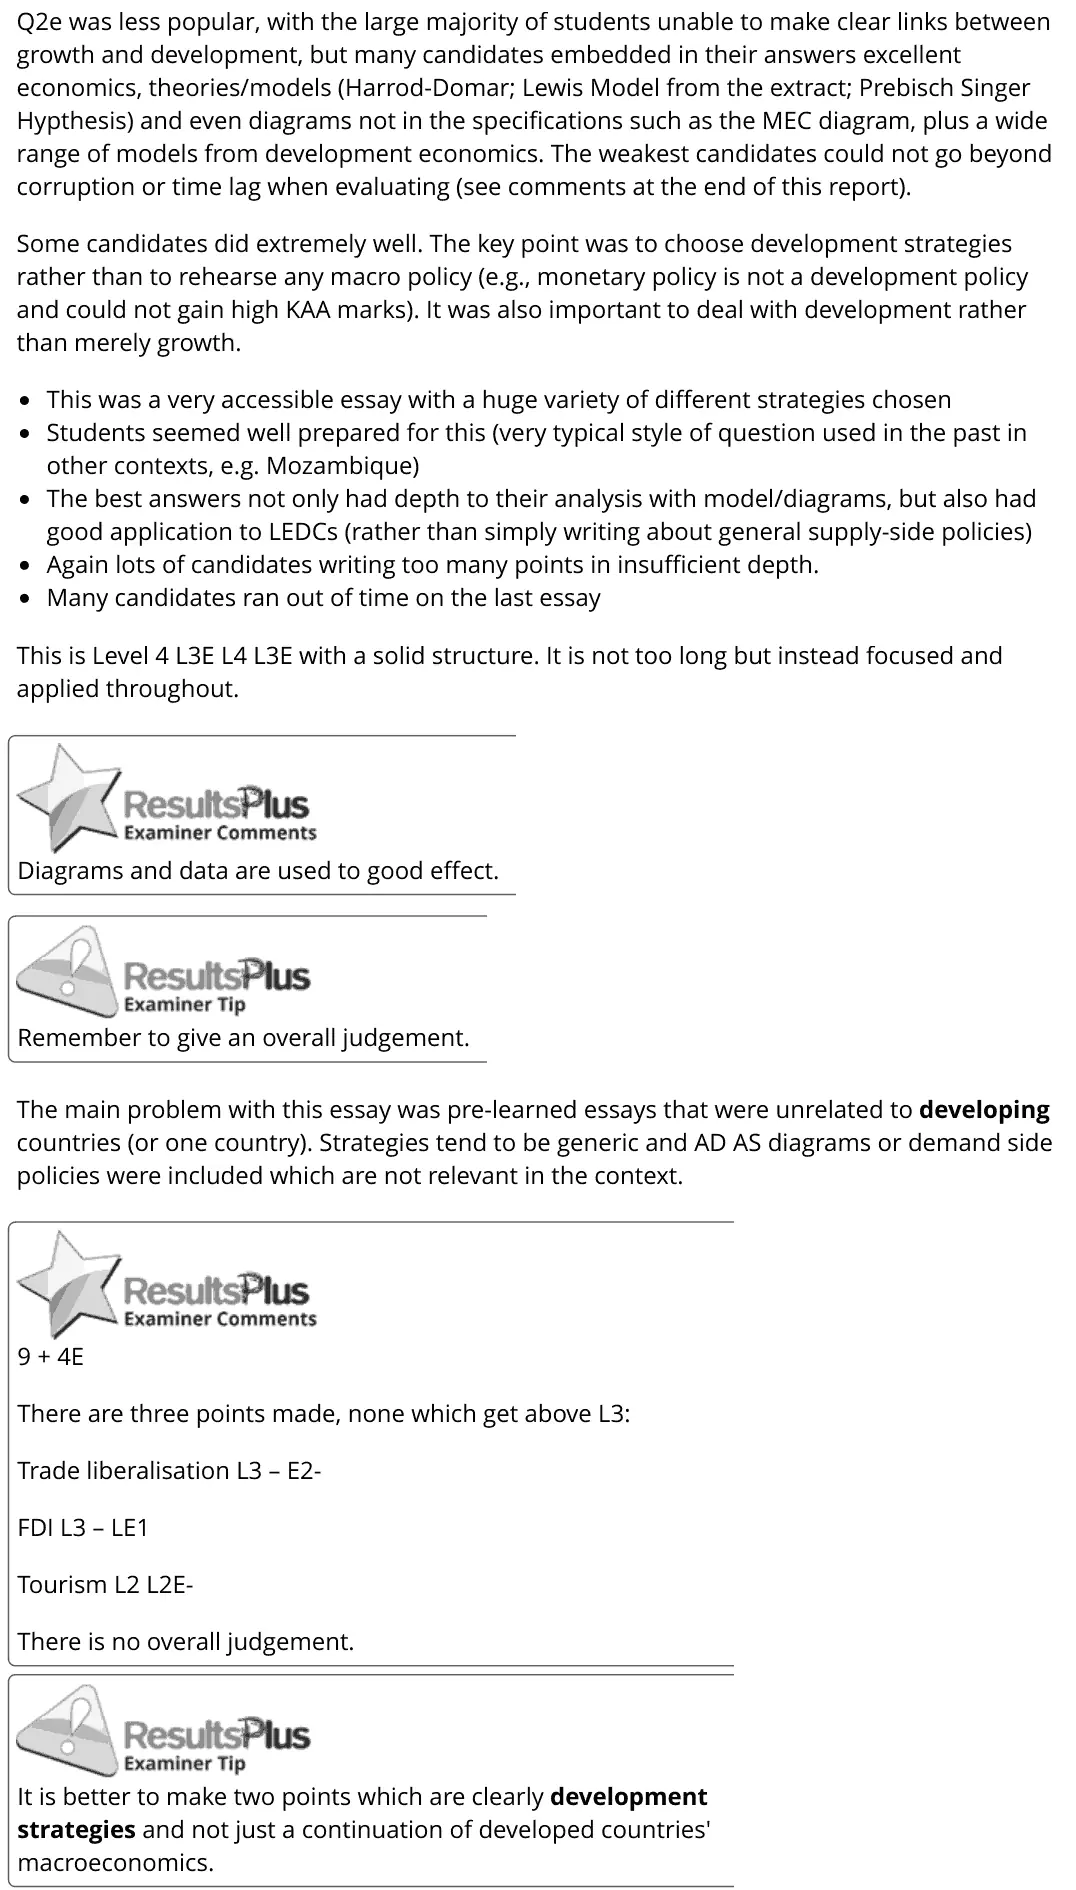
Q2e was less popular, with the large majority of students unable to make clear links between growth and development, but many candidates embedded in their answers excellent economics, theories/models (Harrod-Domar; Lewis Model from the extract; Prebisch Singer Hypthesis) and even diagrams not in the specifications such as the MEC diagram, plus a wide range of models from development economics. The weakest candidates could not go beyond corruption or time lag when evaluating (see comments at the end of this report). Some candidates did extremely well. The key point was to choose development strategies rather than to rehearse any macro policy (e.g., monetary policy is not a development policy and could not gain high KAA marks). It was also important to deal with development rather than merely growth. This was a very accessible essay with a huge variety of different strategies chosen Students seemed well prepared for this (very typical style of question used in the past in other contexts, e.g. Mozambique) The best answers not only had depth to their analysis with model/diagrams, but also had good application to LEDCs (rather than simply writing about general supply-side policies) Again lots of candidates writing too many points in insufficient depth. Many candidates ran out of time on the last essay This is Level 4 L3E L4 L3E with a solid structure. It is not too long but instead focused and applied throughout. Diagrams and data are used to good effect. Remember to give an overall judgement. The main problem with this essay was pre-learned essays that were unrelated to developing countries (or one country). Strategies tend to be generic and AD AS diagrams or demand side policies were included which are not relevant in the context. 9 + 4E There are three points made, none which get above L3: Trade liberalisation L3 – E2- FDI L3 – LE1 Tourism L2 L2E- There is no overall judgement. It is better to make two points which are clearly development strategies and not just a continuation of developed countries' macroeconomics.
Notes from the mark scheme and report
choose development strategies (human capital, infrastructure, trade liberalisation, microfinance, aid) not generic macro policy such as monetary policy
link to development not just growth
Level 4 needs Kenyan or other developing-country context
evaluate beyond corruption and time lags
November 2021 · Paper 2 · Q6(a)5 marksAO1=1, AO2=2, AO3=2Calculation
Data and extracts for question 6
Mark scheme
Examiner's comment
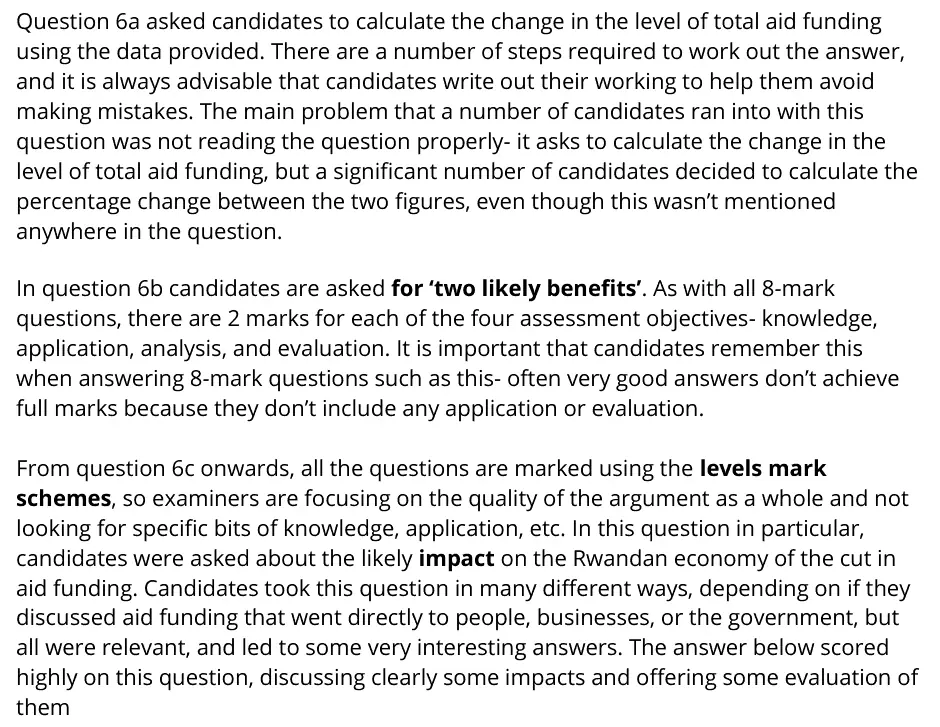
Question 6a asked candidates to calculate the change in the level of total aid funding using the data provided. There are a number of steps required to work out the answer, and it is always advisable that candidates write out their working to help them avoid making mistakes. The main problem that a number of candidates ran into with this question was not reading the question properly- it asks to calculate the change in the level of total aid funding, but a significant number of candidates decided to calculate the percentage change between the two figures, even though this wasn’t mentioned anywhere in the question. In question 6b candidates are asked for ‘two likely benefits’. As with all 8-mark questions, there are 2 marks for each of the four assessment objectives- knowledge, application, analysis, and evaluation. It is important that candidates remember this when answering 8-mark questions such as this- often very good answers don’t achieve full marks because they don’t include any application or evaluation. From question 6c onwards, all the questions are marked using the levels mark schemes, so examiners are focusing on the quality of the argument as a whole and not looking for specific bits of knowledge, application, etc. In this question in particular, candidates were asked about the likely impact on the Rwandan economy of the cut in aid funding. Candidates took this question in many different ways, depending on if they discussed aid funding that went directly to people, businesses, or the government, but all were relevant, and led to some very interesting answers. The answer below scored highly on this question, discussing clearly some impacts and offering some evaluation of them
Notes from the mark scheme and report
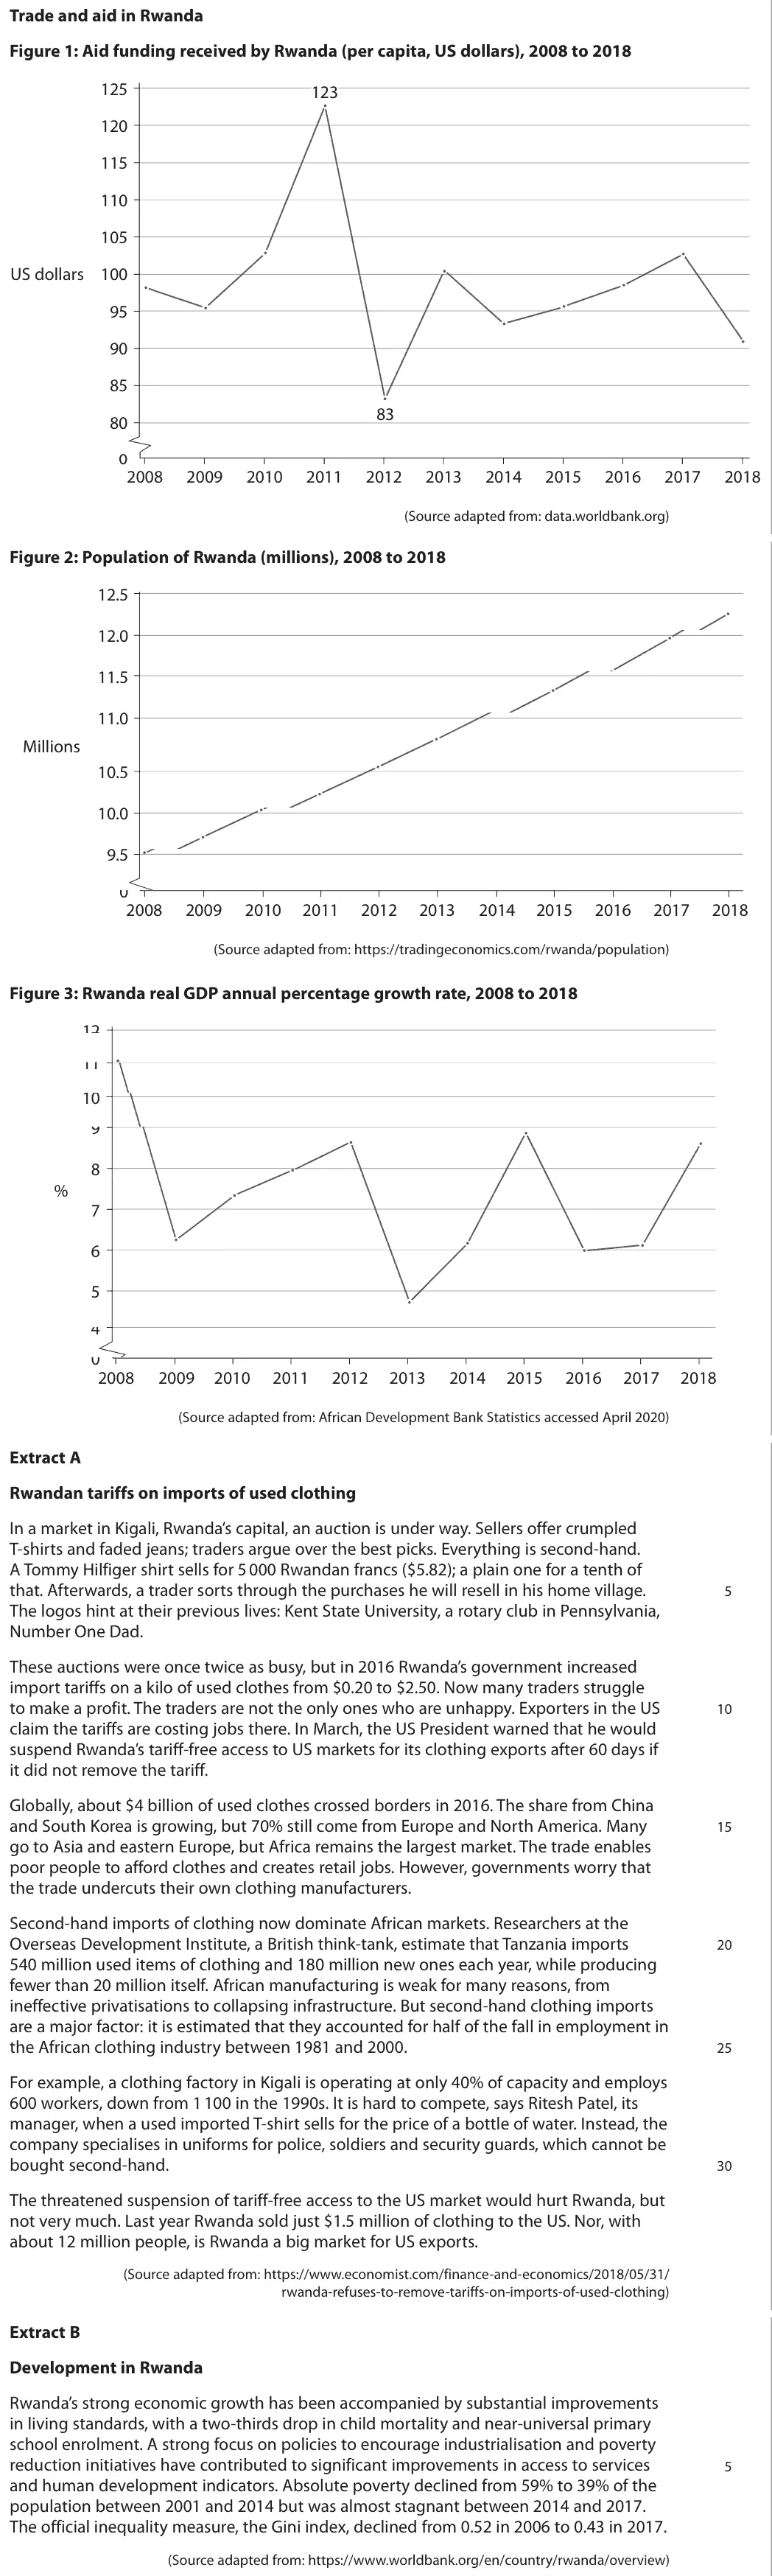
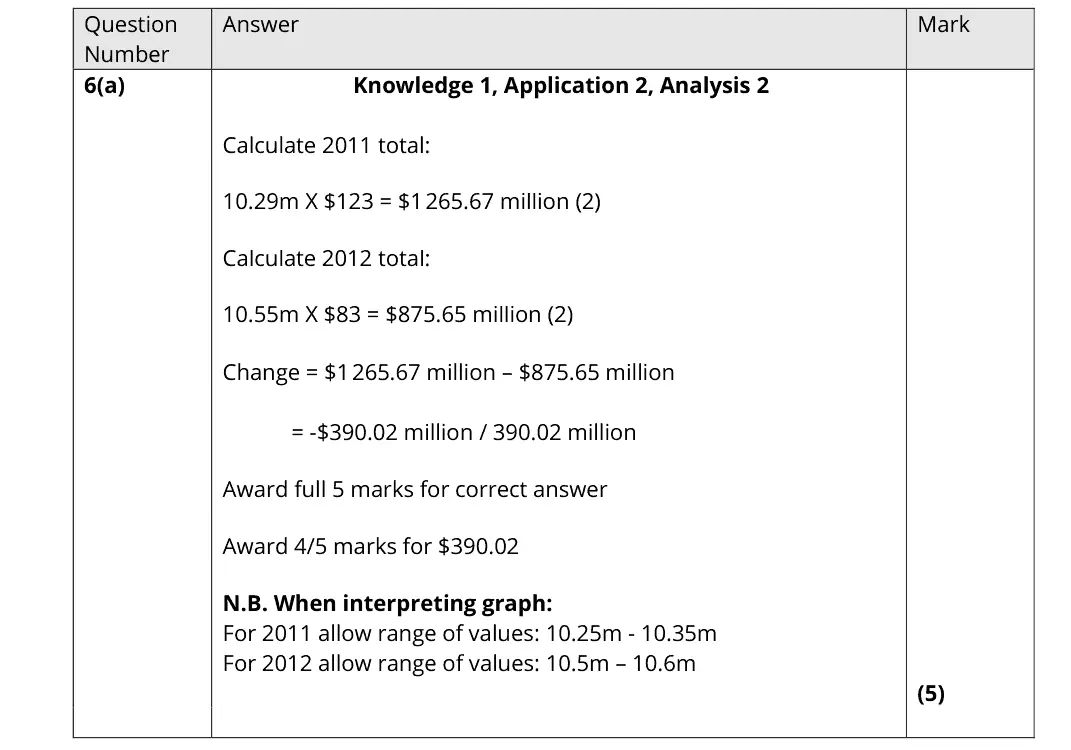
total aid = aid per capita x population: 2011 10.29m x $123 = $1 265.67m, 2012 10.55m x $83 = $875.65m, change = -$390.02m (4/5 without the minus)
many wrongly calculated a percentage change
Quantitative skills: QS 9 (interpret, apply and analyse information in written, graphical tabular and numerical forms)
November 2021 · Paper 2 · Q6(b)8 marksAO1=2, AO2=2, AO3=2, AO4=28-mark response
Data and extracts for question 6
Mark scheme, including the levels grid and indicative content
Notes from the mark scheme and report
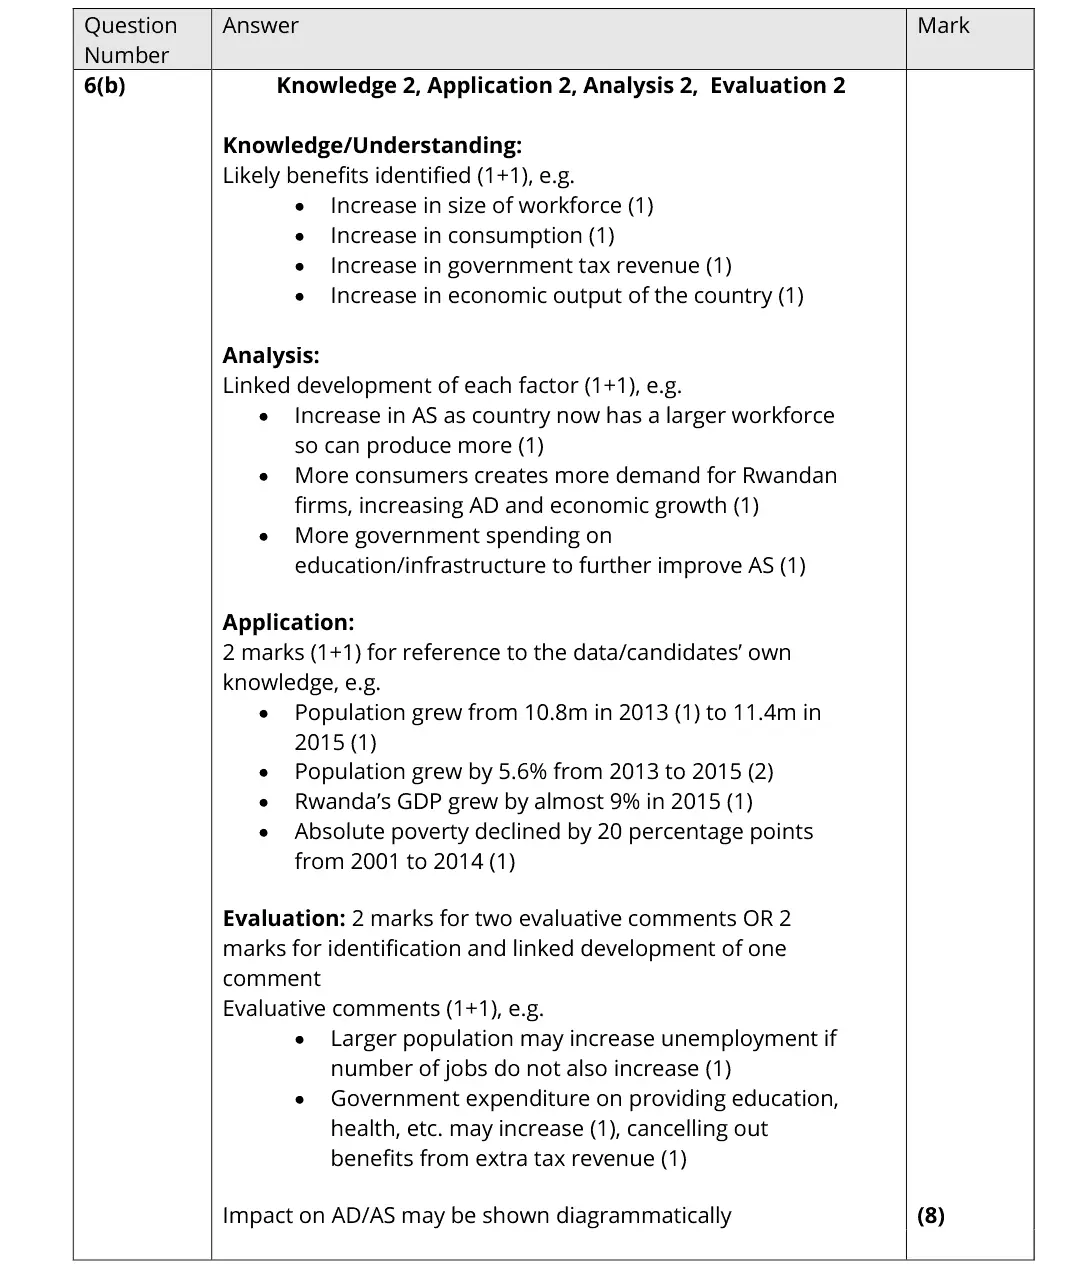
two benefits (larger workforce raising AS, more consumption and AD, more tax revenue) each developed
quote population growth (10.8m to 11.4m 2013-2015)
evaluate, e.g. unemployment if jobs do not grow
Quantitative skills: QS 9 (interpret, apply and analyse information in written, graphical tabular and numerical forms)
November 2021 · Paper 2 · Q6(c)10 marksAO1=2, AO2=2, AO3=2, AO4=410-mark response
Data and extracts for question 6
Mark scheme, including the levels grid and indicative content
Notes from the mark scheme and report
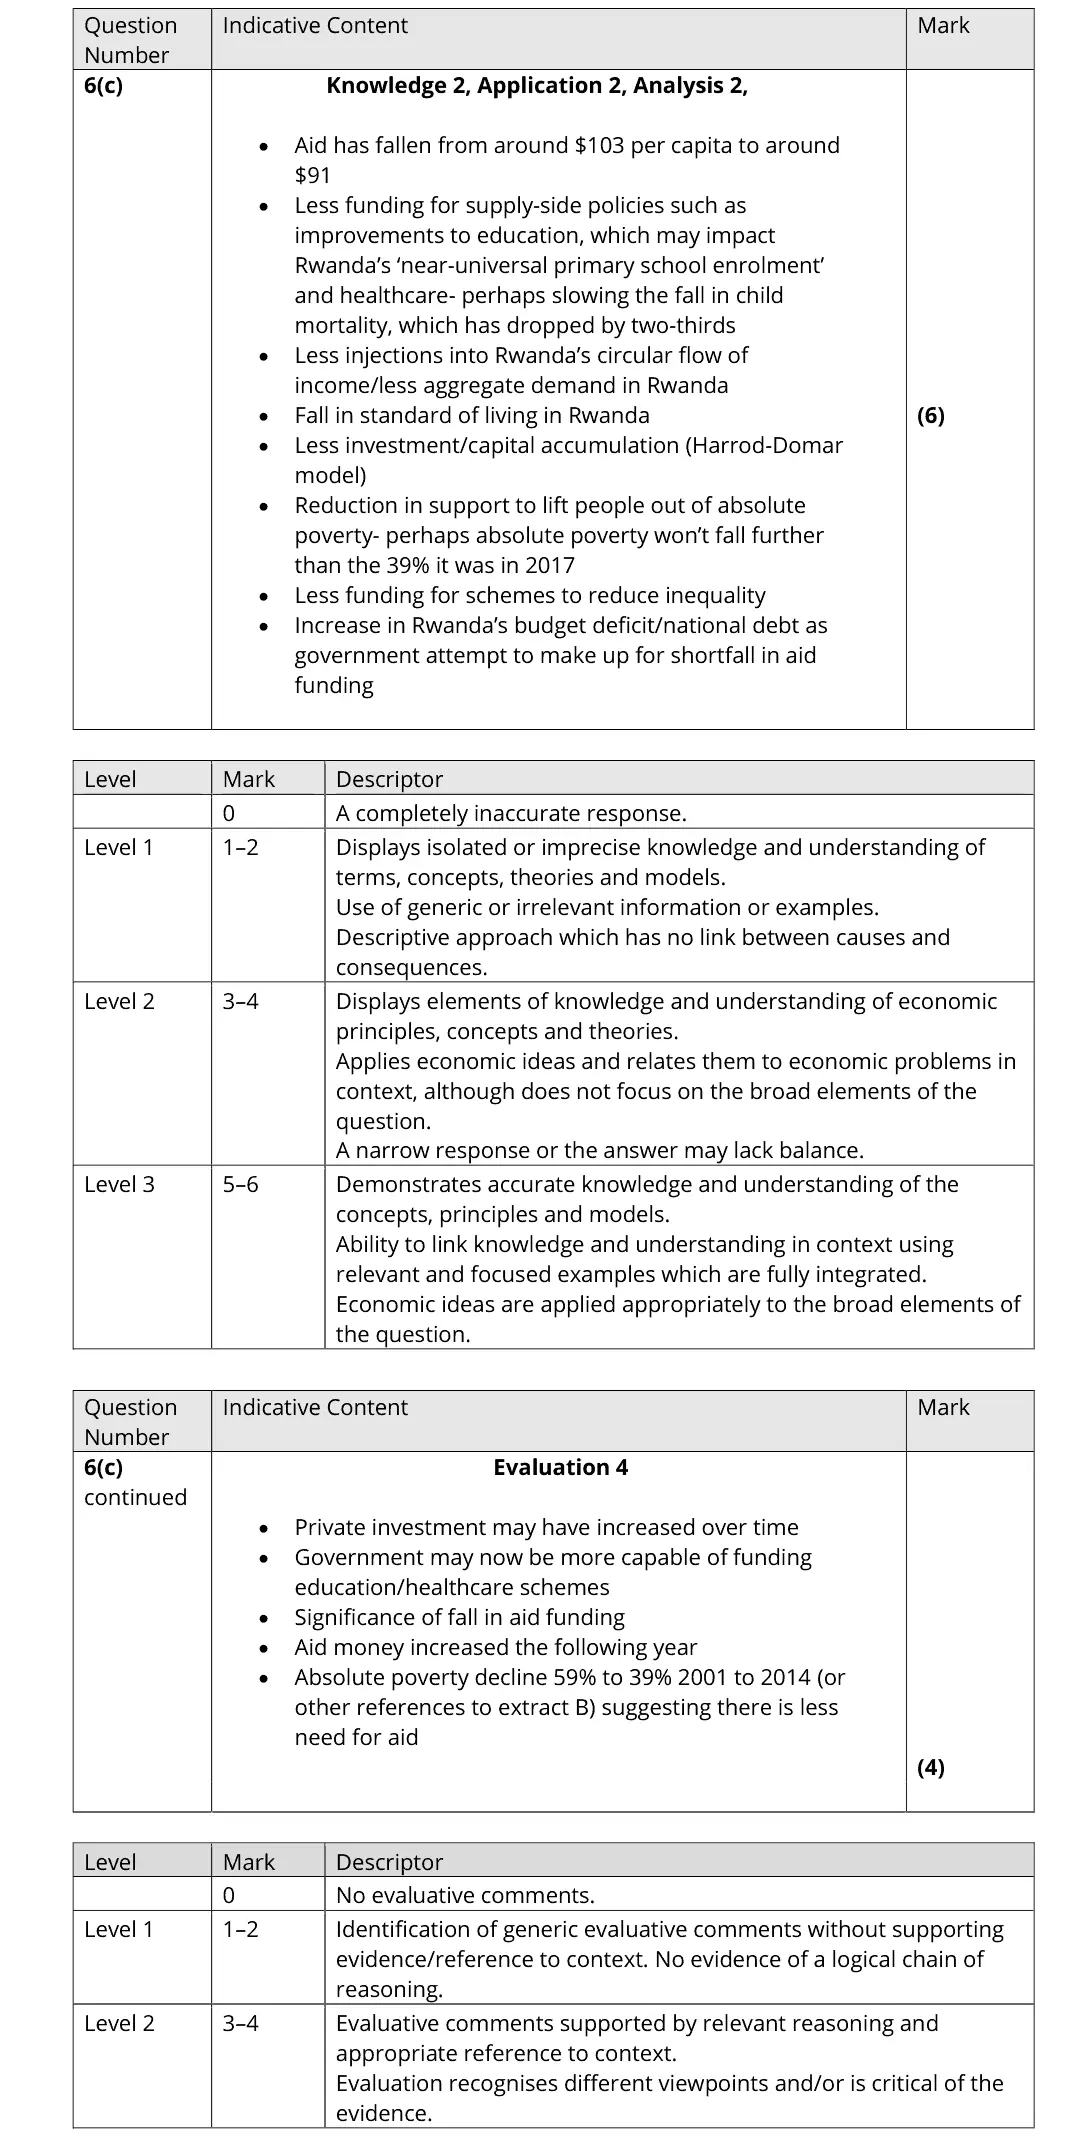
aid per capita fell from about $103 to about $91: less funding for education/health, fewer injections, savings gap (Harrod-Domar), poverty reduction stalls
evaluate with significance of the fall, rising private investment, poverty already falling
Quantitative skills: QS 9 (interpret, apply and analyse information in written, graphical tabular and numerical forms)
November 2021 · Paper 2 · Q6(e)15 marksAO1=3, AO2=3, AO3=3, AO4=615-mark response
Data and extracts for question 6
Mark scheme, including the levels grid and indicative content
Examiner's comment
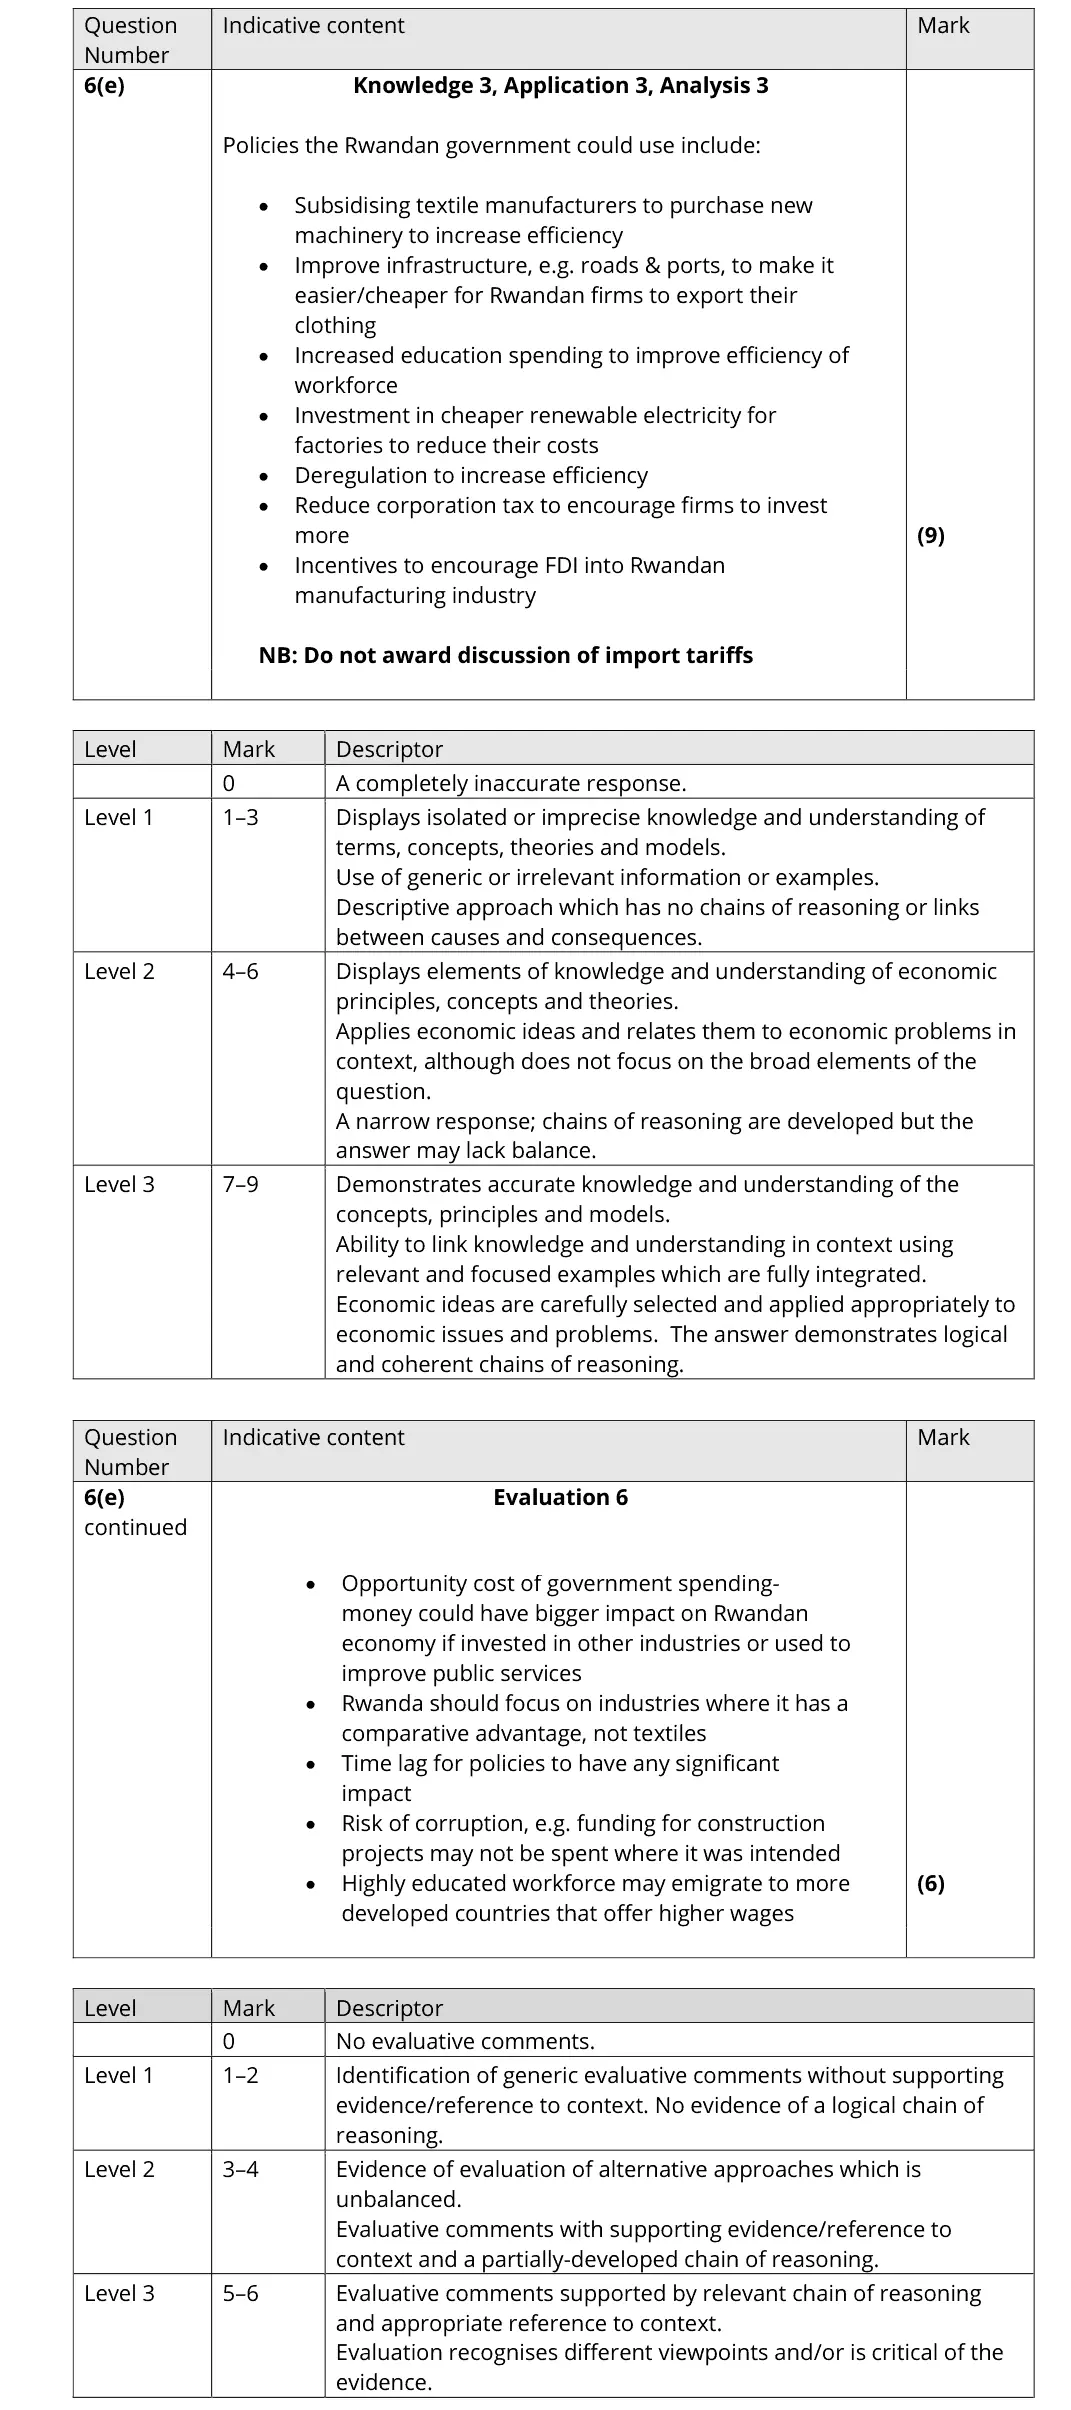
Question 6e was a broad, open question that gave candidates the chance to discuss any relevant policies that the Rwandan government could use, and led to many different ideas being discussed- such as improving infrastructure to make it easier to export, improved education to provide a more skilled workforce, or subsidies to support manufacturing firms. Candidates needed to ensure they explained their chosen policies well with good use of step-by-step chains of argument to access the higher levels, along with well-argued evaluation that clearly criticises their chosen policies. Better answers also ensured that the points were in context and focused on Rwanda’s manufacturing industries. The answer below scored highly on this question, with good KAA and EV. Section C: The number of candidates choosing each question was split almost completely evenly, and the mean mark was slightly higher on question 7. For both questions, examiners are looking for well-argued KAA and EV points- as mentioned earlier, the quality of candidates’ chains of argument and explaining in a detailed step-by-step way is crucial to reaching the higher levels. Focusing on question 7, good answers could clearly explain what quantitative easing is and how it works, whilst weaker ones tended to have some grasp of the concept and how it would affect aggregate demand, but couldn’t fully develop their arguments. The excerpt from a candidate’s answer below illustrates how to do this well. Candidates perhaps found question 8 slightly harder because a number of answers failed to focus on the trade-offs between environmental protection and other macroeconomic objectives. Some answers instead of focusing on this discussed the importance of protecting the environment and how it could help the economy, rather than on the trade-offs that may be experienced. The answer below demonstrates how to clearly focus on trade-offs, with high quality KAA and EV on this topic. This is not a perfect answer but it is of a very good standard with a clear structure.
Notes from the mark scheme and report
do not discuss import tariffs
subsidies for machinery, infrastructure, education, cheaper energy, FDI incentives, deregulation
evaluate with opportunity cost, time lags, corruption, comparative advantage elsewhere
October 2020 · Paper 2 · Q3(a)4 marksAO1=2, AO2=1, AO3=1Short answer
Data and extracts for question 3
Mark scheme
Notes from the mark scheme and report
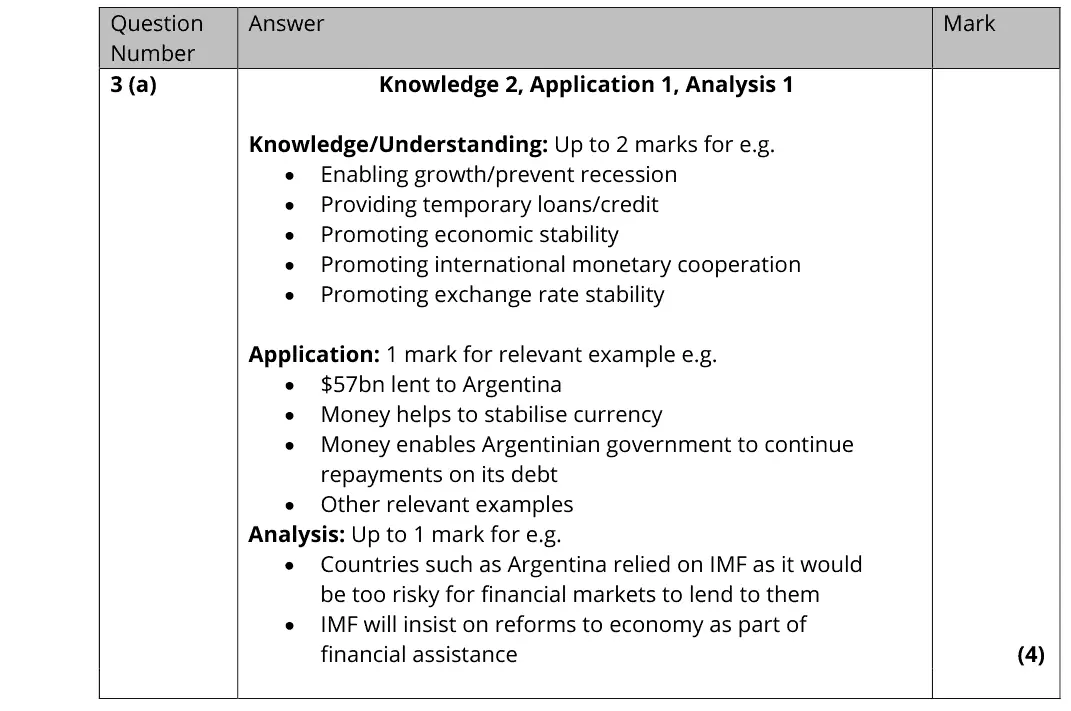
IMF provides temporary loans to promote stability, prevent default and stabilise the currency
apply with the $57bn to Argentina
analysis e.g. markets too risky to lend, IMF insists on reforms as a condition
October 2020 · Paper 2 · Q6(a)5 marksAO1=2, AO2=2, AO3=1Short answer
Data and extracts for question 6
Mark scheme
Examiner's comment
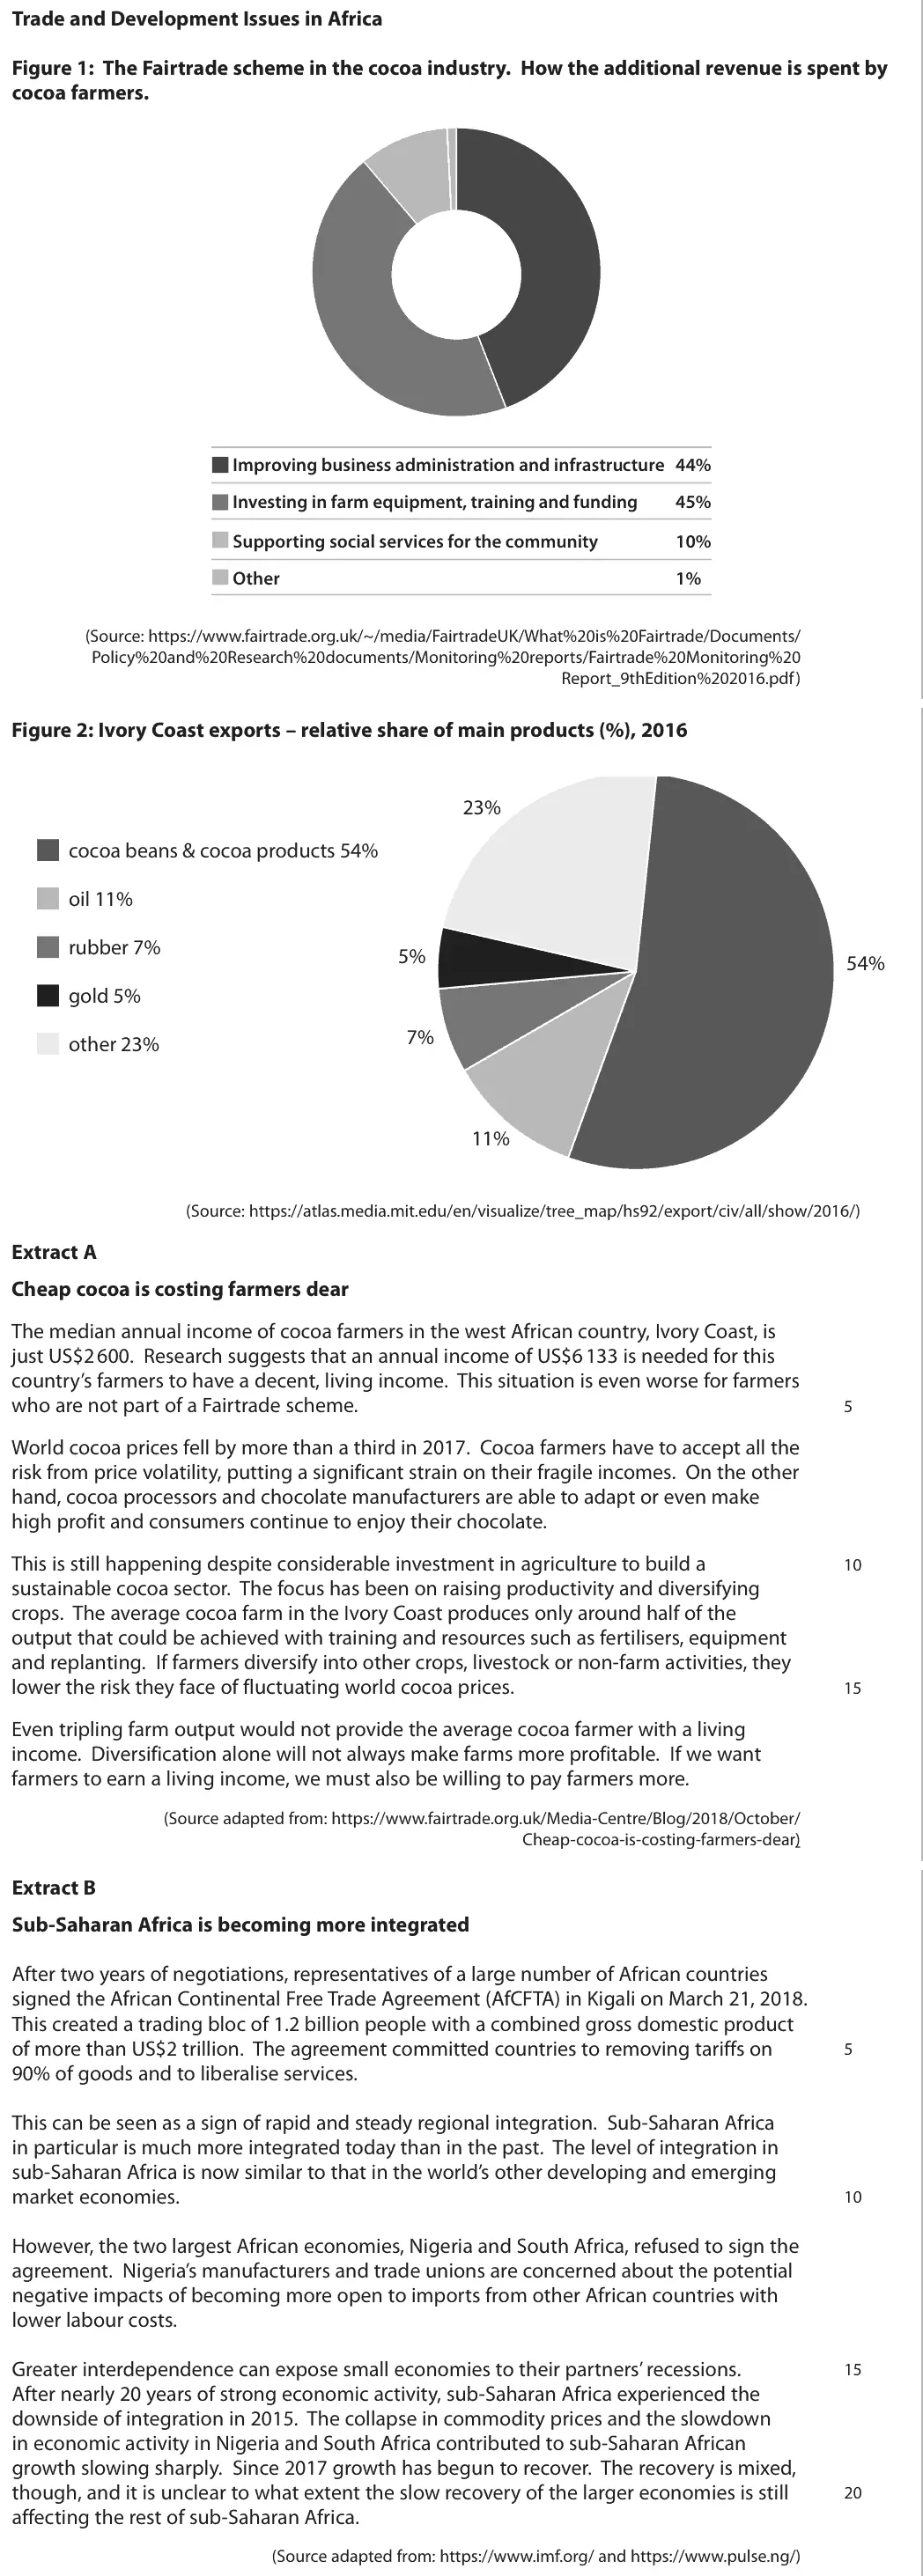
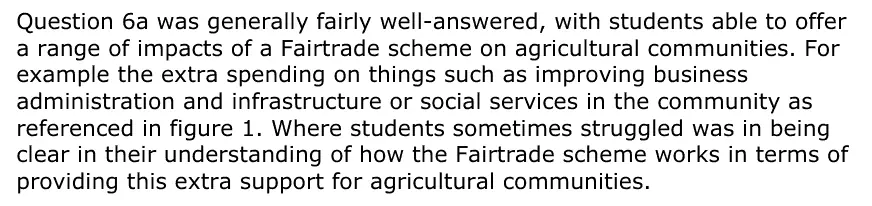
Question 6a was generally fairly well-answered, with students able to offer a range of impacts of a Fairtrade scheme on agricultural communities. For example the extra spending on things such as improving business administration and infrastructure or social services in the community as referenced in figure 1. Where students sometimes struggled was in being clear in their understanding of how the Fairtrade scheme works in terms of providing this extra support for agricultural communities.
Notes from the mark scheme and report
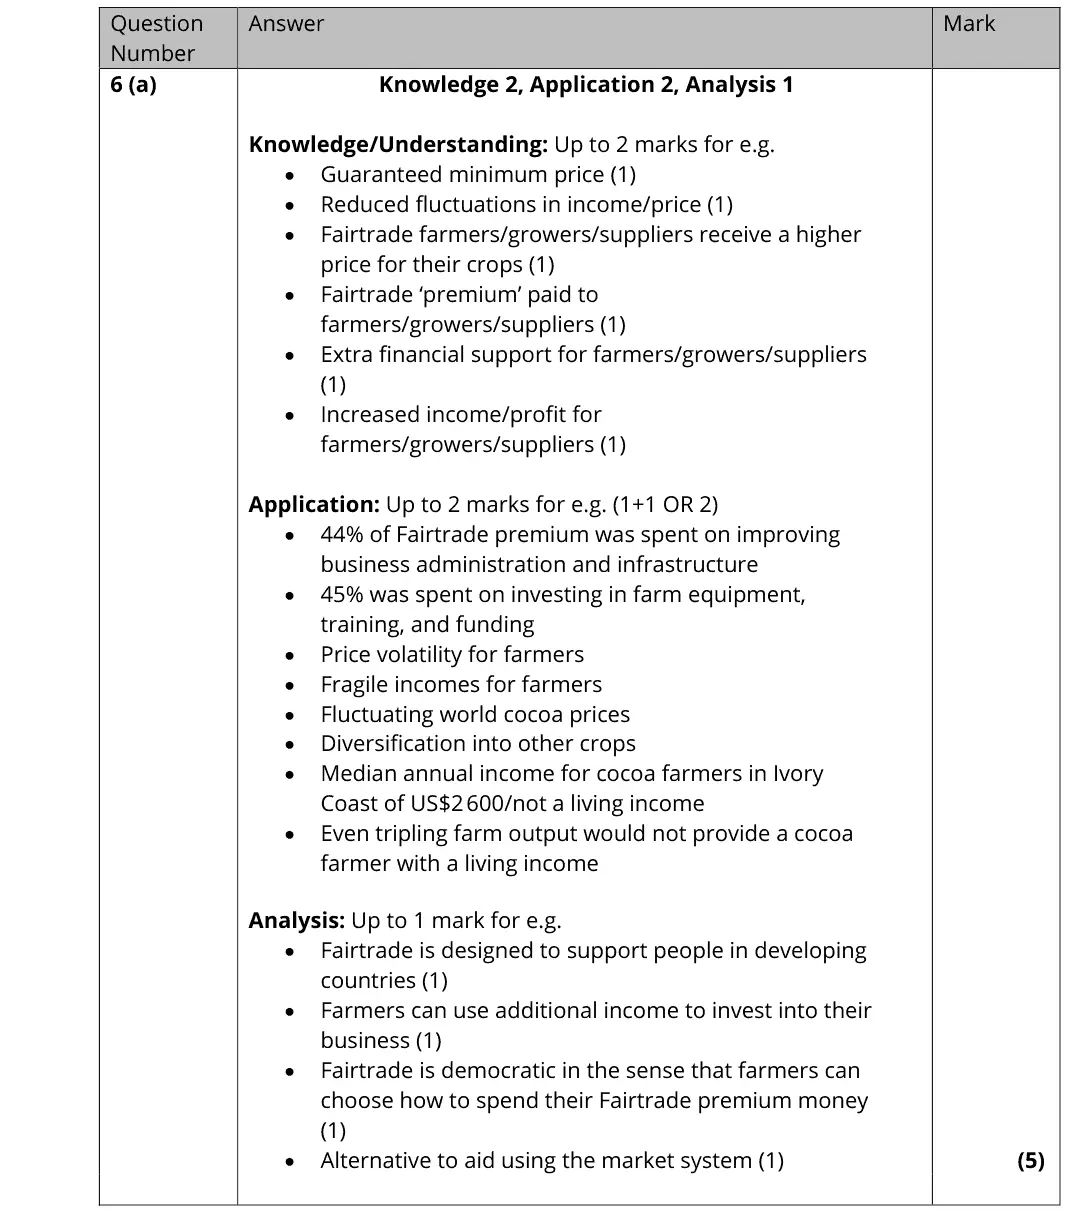
guaranteed minimum price and Fairtrade premium reduce income volatility
apply with Figure 1 (44% on business administration and infrastructure, 45% on equipment and training) or the US$2 600 median income in Extract A
some were unclear how the scheme actually works
Quantitative skills: QS 9 (interpret, apply and analyse information in written, graphical tabular and numerical forms)
October 2020 · Paper 2 · Q6(b)8 marksAO1=2, AO2=2, AO3=2, AO4=28-mark response
Data and extracts for question 6
Mark scheme, including the levels grid and indicative content
Examiner's comment
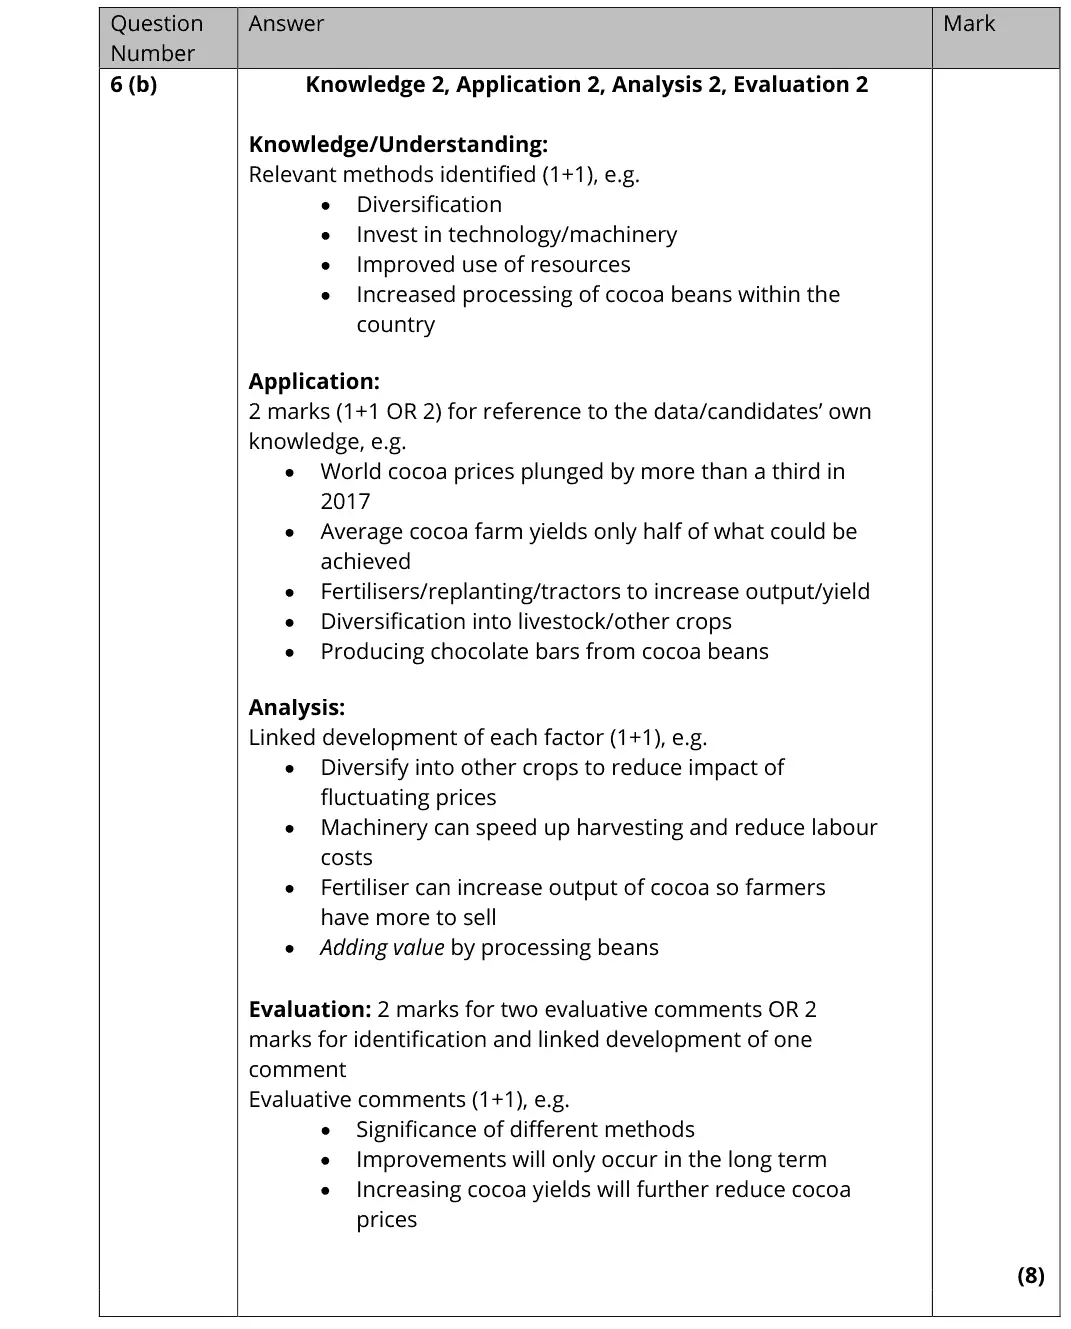
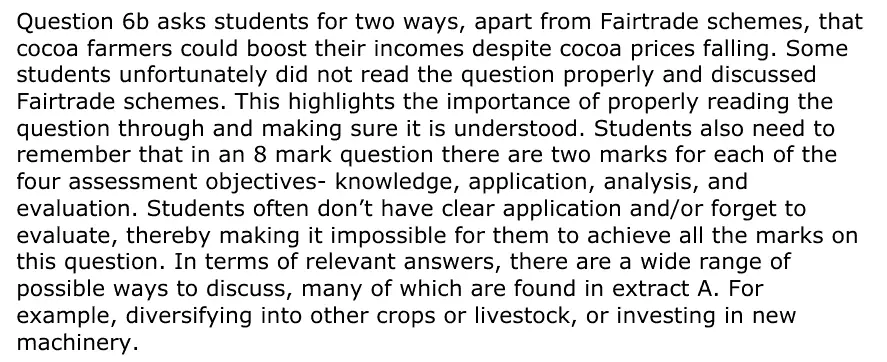
Question 6b asks students for two ways, apart from Fairtrade schemes, that cocoa farmers could boost their incomes despite cocoa prices falling. Some students unfortunately did not read the question properly and discussed Fairtrade schemes. This highlights the importance of properly reading the question through and making sure it is understood. Students also need to remember that in an 8 mark question there are two marks for each of the four assessment objectives- knowledge, application, analysis, and evaluation. Students often don’t have clear application and/or forget to evaluate, thereby making it impossible for them to achieve all the marks on this question. In terms of relevant answers, there are a wide range of possible ways to discuss, many of which are found in extract A. For example, diversifying into other crops or livestock, or investing in new machinery.
Notes from the mark scheme and report
two ways apart from Fairtrade (diversification, machinery and fertiliser to raise yields, processing beans to add value)
apply with Extract A (prices fell by over a third, yields half of potential)
evaluate e.g. higher yields push cocoa prices down further
discussing Fairtrade scores nothing
Quantitative skills: QS 9 (interpret, apply and analyse information in written, graphical tabular and numerical forms)
October 2020 · Paper 2 · Q6(c)12 marksAO1=2, AO2=2, AO3=4, AO4=412-mark response
Data and extracts for question 6
Mark scheme, including the levels grid and indicative content
Examiner's comment
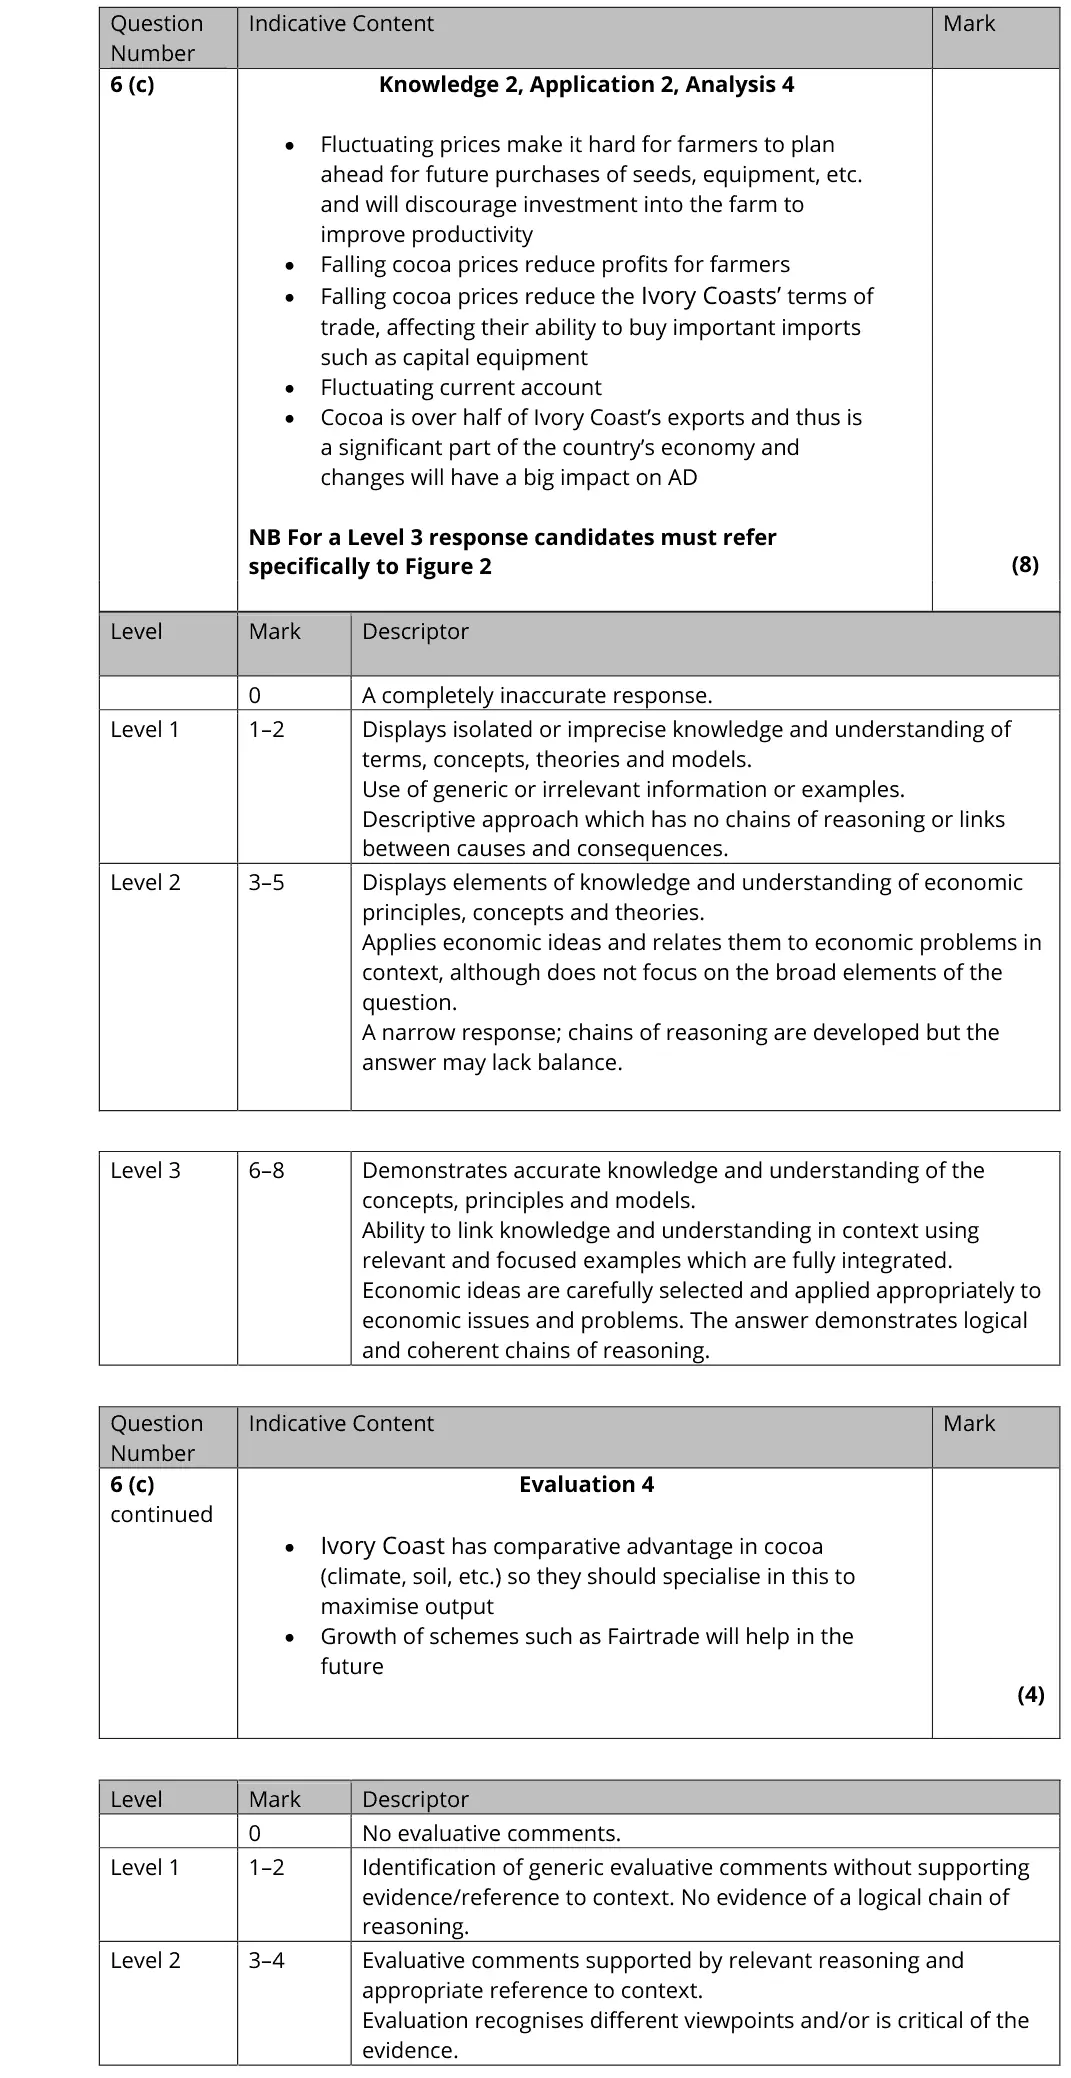
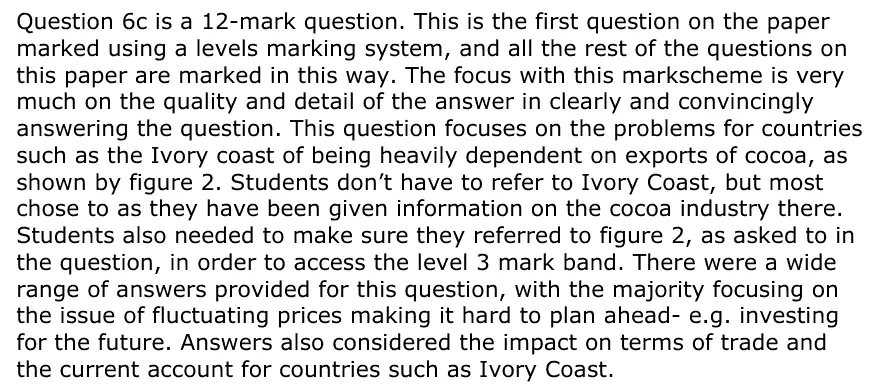
Question 6c is a 12-mark question. This is the first question on the paper marked using a levels marking system, and all the rest of the questions on this paper are marked in this way. The focus with this markscheme is very much on the quality and detail of the answer in clearly and convincingly answering the question. This question focuses on the problems for countries such as the Ivory coast of being heavily dependent on exports of cocoa, as shown by figure 2. Students don’t have to refer to Ivory Coast, but most chose to as they have been given information on the cocoa industry there. Students also needed to make sure they referred to figure 2, as asked to in the question, in order to access the level 3 mark band. There were a wide range of answers provided for this question, with the majority focusing on the issue of fluctuating prices making it hard to plan ahead- e.g. investing for the future. Answers also considered the impact on terms of trade and the current account for countries such as Ivory Coast.
Notes from the mark scheme and report
volatile prices deter investment and planning
falling cocoa prices worsen the terms of trade and current account
Level 3 needs specific reference to Figure 2 (cocoa 54% of exports)
evaluate with comparative advantage in cocoa, Fairtrade
Quantitative skills: QS 9 (interpret, apply and analyse information in written, graphical tabular and numerical forms)
June 2019 · Paper 3 · Q2(c)12 marksAO1=2, AO2=2, AO3=4, AO4=412-mark response
Data and extracts for question 2
Mark scheme, including the levels grid and indicative content
Examiner's comment
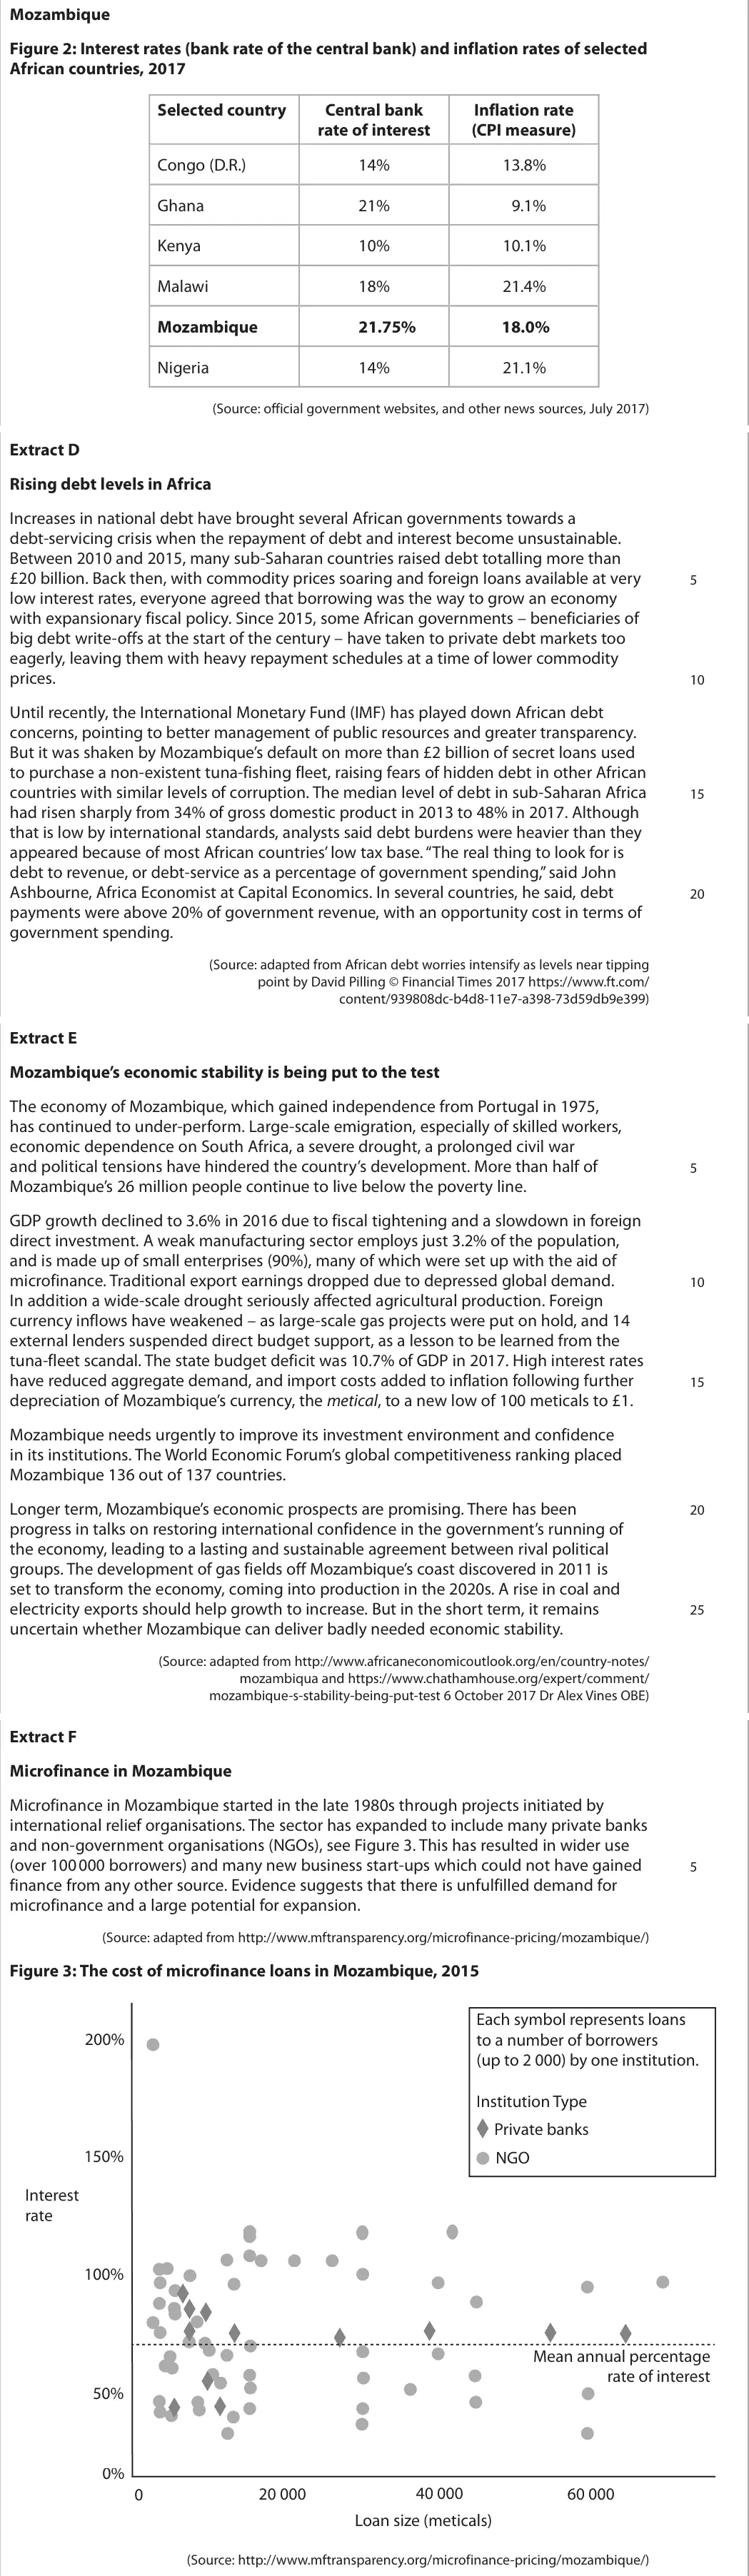
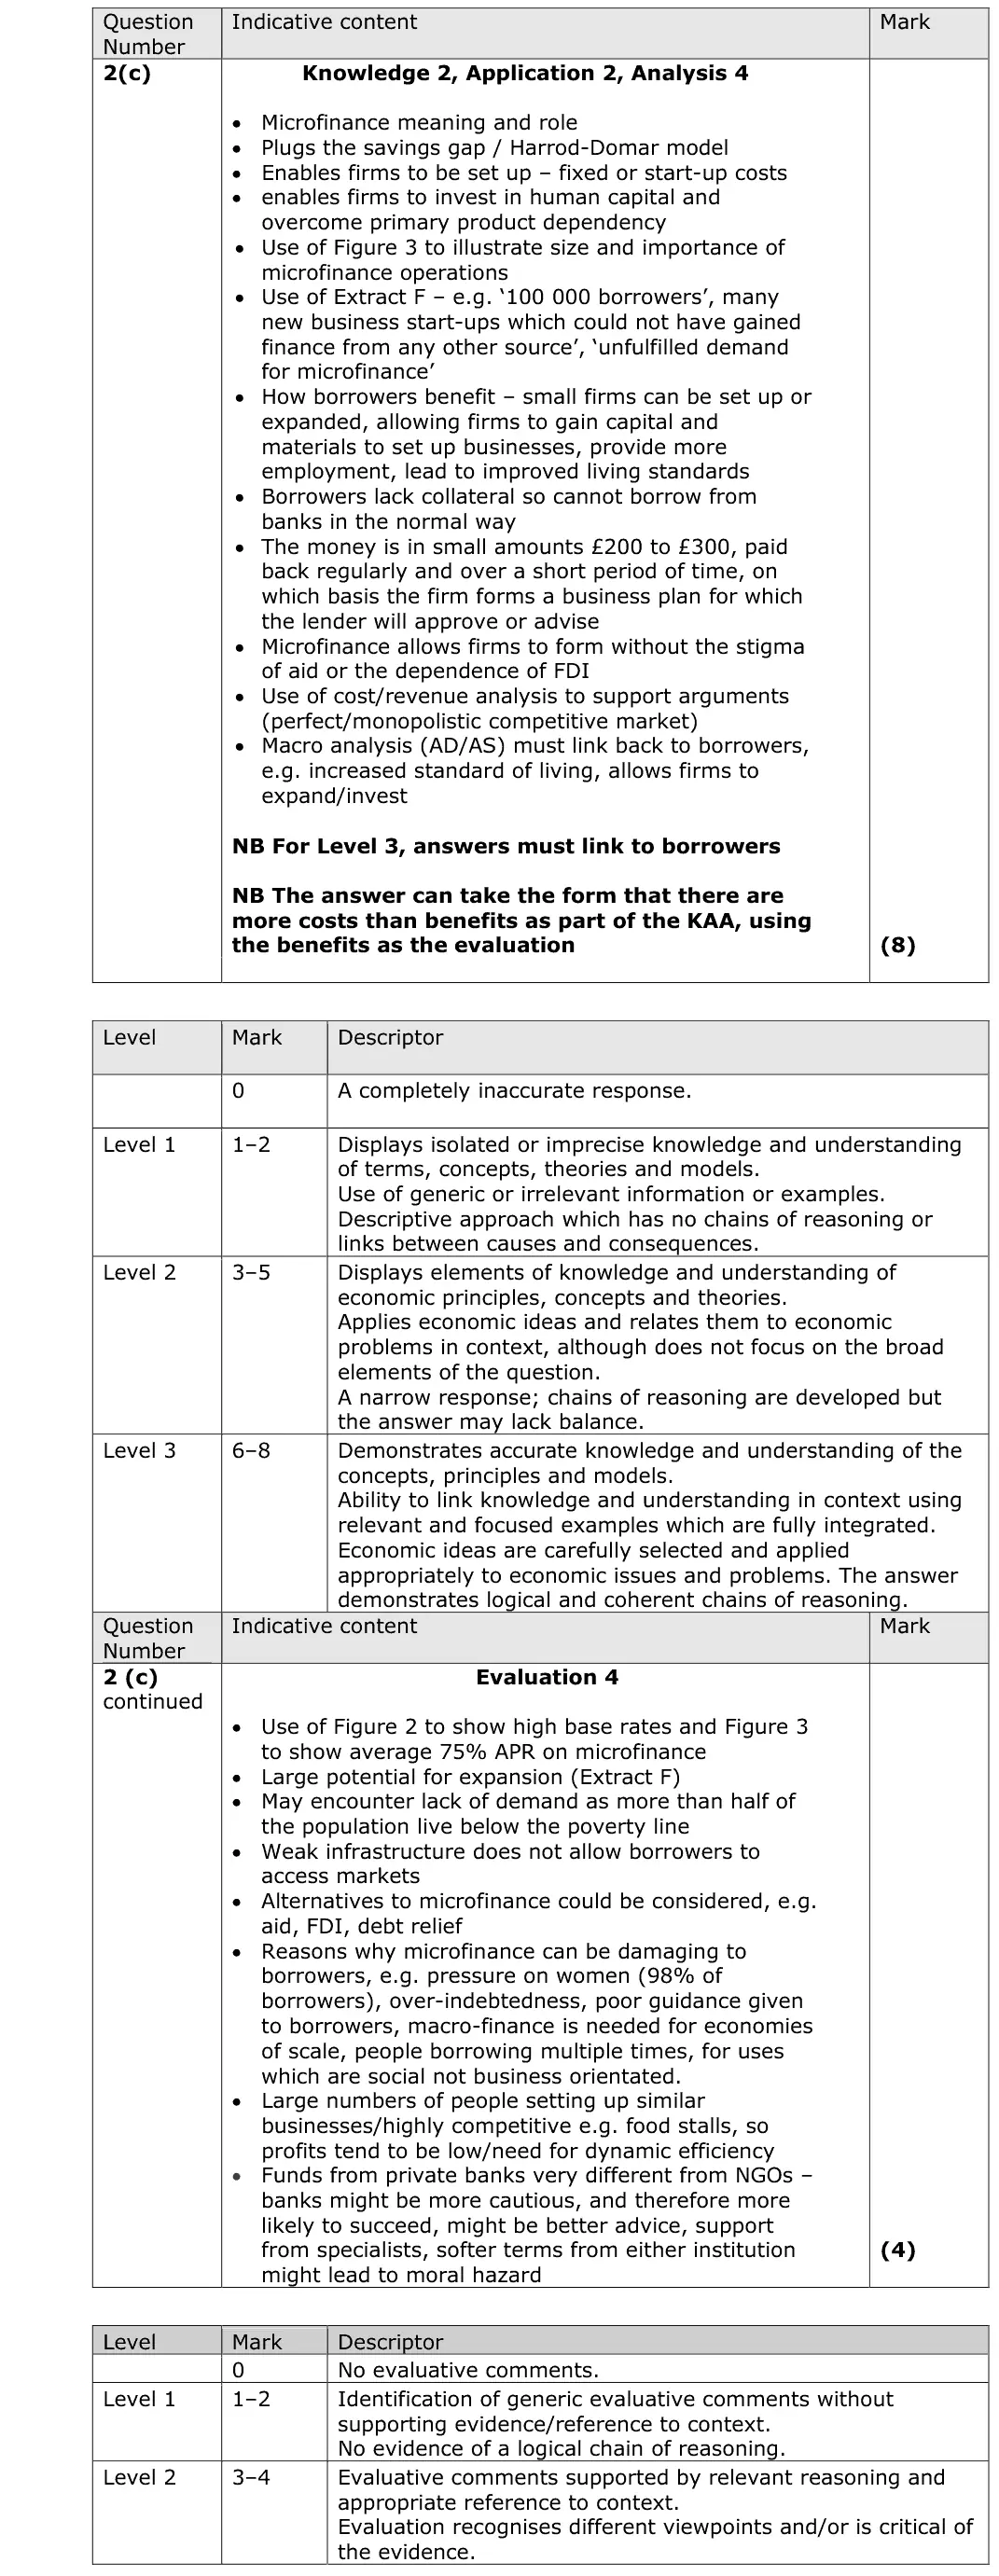
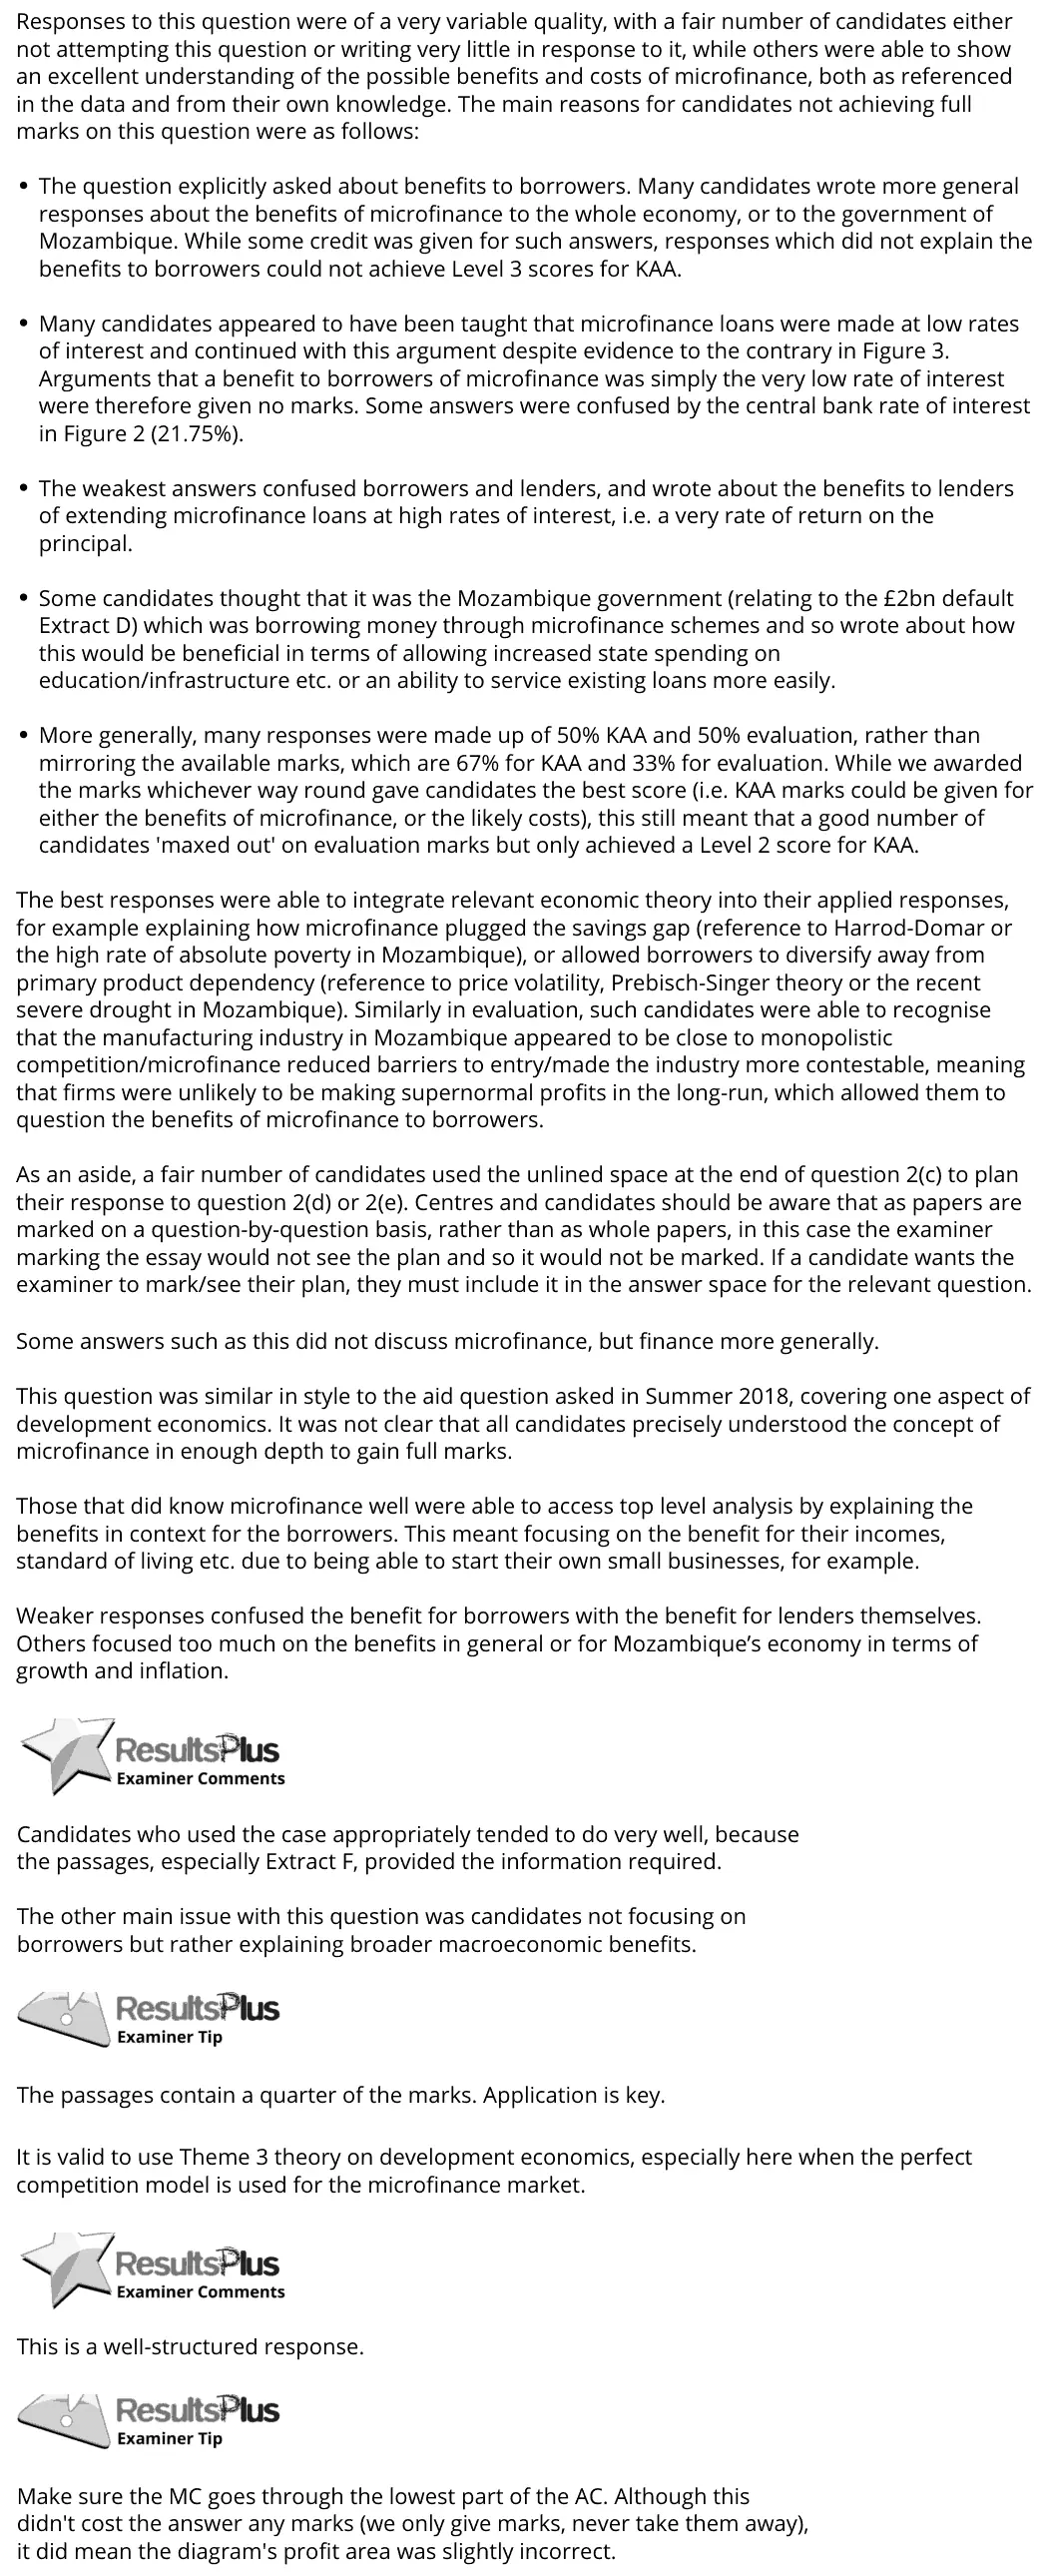
Responses to this question were of a very variable quality, with a fair number of candidates either not attempting this question or writing very little in response to it, while others were able to show an excellent understanding of the possible benefits and costs of microfinance, both as referenced in the data and from their own knowledge. The main reasons for candidates not achieving full marks on this question were as follows: The question explicitly asked about benefits to borrowers. Many candidates wrote more general responses about the benefits of microfinance to the whole economy, or to the government of Mozambique. While some credit was given for such answers, responses which did not explain the benefits to borrowers could not achieve Level 3 scores for KAA. Many candidates appeared to have been taught that microfinance loans were made at low rates of interest and continued with this argument despite evidence to the contrary in Figure 3. Arguments that a benefit to borrowers of microfinance was simply the very low rate of interest were therefore given no marks. Some answers were confused by the central bank rate of interest in Figure 2 (21.75%). The weakest answers confused borrowers and lenders, and wrote about the benefits to lenders of extending microfinance loans at high rates of interest, i.e. a very rate of return on the principal. Some candidates thought that it was the Mozambique government (relating to the £2bn default Extract D) which was borrowing money through microfinance schemes and so wrote about how this would be beneficial in terms of allowing increased state spending on education/infrastructure etc. or an ability to service existing loans more easily. More generally, many responses were made up of 50% KAA and 50% evaluation, rather than mirroring the available marks, which are 67% for KAA and 33% for evaluation. While we awarded the marks whichever way round gave candidates the best score (i.e. KAA marks could be given for either the benefits of microfinance, or the likely costs), this still meant that a good number of candidates 'maxed out' on evaluation marks but only achieved a Level 2 score for KAA. The best responses were able to integrate relevant economic theory into their applied responses, for example explaining how microfinance plugged the savings gap (reference to Harrod-Domar or the high rate of absolute poverty in Mozambique), or allowed borrowers to diversify away from primary product dependency (reference to price volatility, Prebisch-Singer theory or the recent severe drought in Mozambique). Similarly in evaluation, such candidates were able to recognise that the manufacturing industry in Mozambique appeared to be close to monopolistic competition/microfinance reduced barriers to entry/made the industry more contestable, meaning that firms were unlikely to be making supernormal profits in the long-run, which allowed them to question the benefits of microfinance to borrowers. As an aside, a fair number of candidates used the unlined space at the end of question 2(c) to plan their response to question 2(d) or 2(e). Centres and candidates should be aware that as papers are marked on a question-by-question basis, rather than as whole papers, in this case the examiner marking the essay would not see the plan and so it would not be marked. If a candidate wants the examiner to mark/see their plan, they must include it in the answer space for the relevant question. Some answers such as this did not discuss microfinance, but finance more generally. This question was similar in style to the aid question asked in Summer 2018, covering one aspect of development economics. It was not clear that all candidates precisely understood the concept of microfinance in enough depth to gain full marks. Those that did know microfinance well were able to access top level analysis by explaining the benefits in context for the borrowers. This meant focusing on the benefit for their incomes, standard of living etc. due to being able to start their own small businesses, for example. Weaker responses confused the benefit for borrowers with the benefit for lenders themselves. Others focused too much on the benefits in general or for Mozambique’s economy in terms of growth and inflation. Candidates who used the case appropriately tended to do very well, because the passages, especially Extract F, provided the information required. The other main issue with this question was candidates not focusing on borrowers but rather explaining broader macroeconomic benefits. The passages contain a quarter of the marks. Application is key. It is valid to use Theme 3 theory on development economics, especially here when the perfect competition model is used for the microfinance market. This is a well-structured response. Make sure the MC goes through the lowest part of the AC. Although this didn't cost the answer any marks (we only give marks, never take them away), it did mean the diagram's profit area was slightly incorrect.
Notes from the mark scheme and report
Level 3 needs benefits to borrowers, not the economy or lenders
microfinance rates are high (Figure 3, about 75% average), not low, so arguing low interest earns nothing
plugs the savings gap (Harrod-Domar), start-ups without collateral
evaluate with over-indebtedness, small competitive businesses
Quantitative skills: QS 9 (interpret, apply and analyse information in written, graphical tabular and numerical forms)
June 2019 · Paper 3 · Q2(d)25 marksAO1=4, AO2=4, AO3=8, AO4=925-mark essayEither/or
Data and extracts for question 2
Mark scheme, including the levels grid and indicative content
Examiner's comment
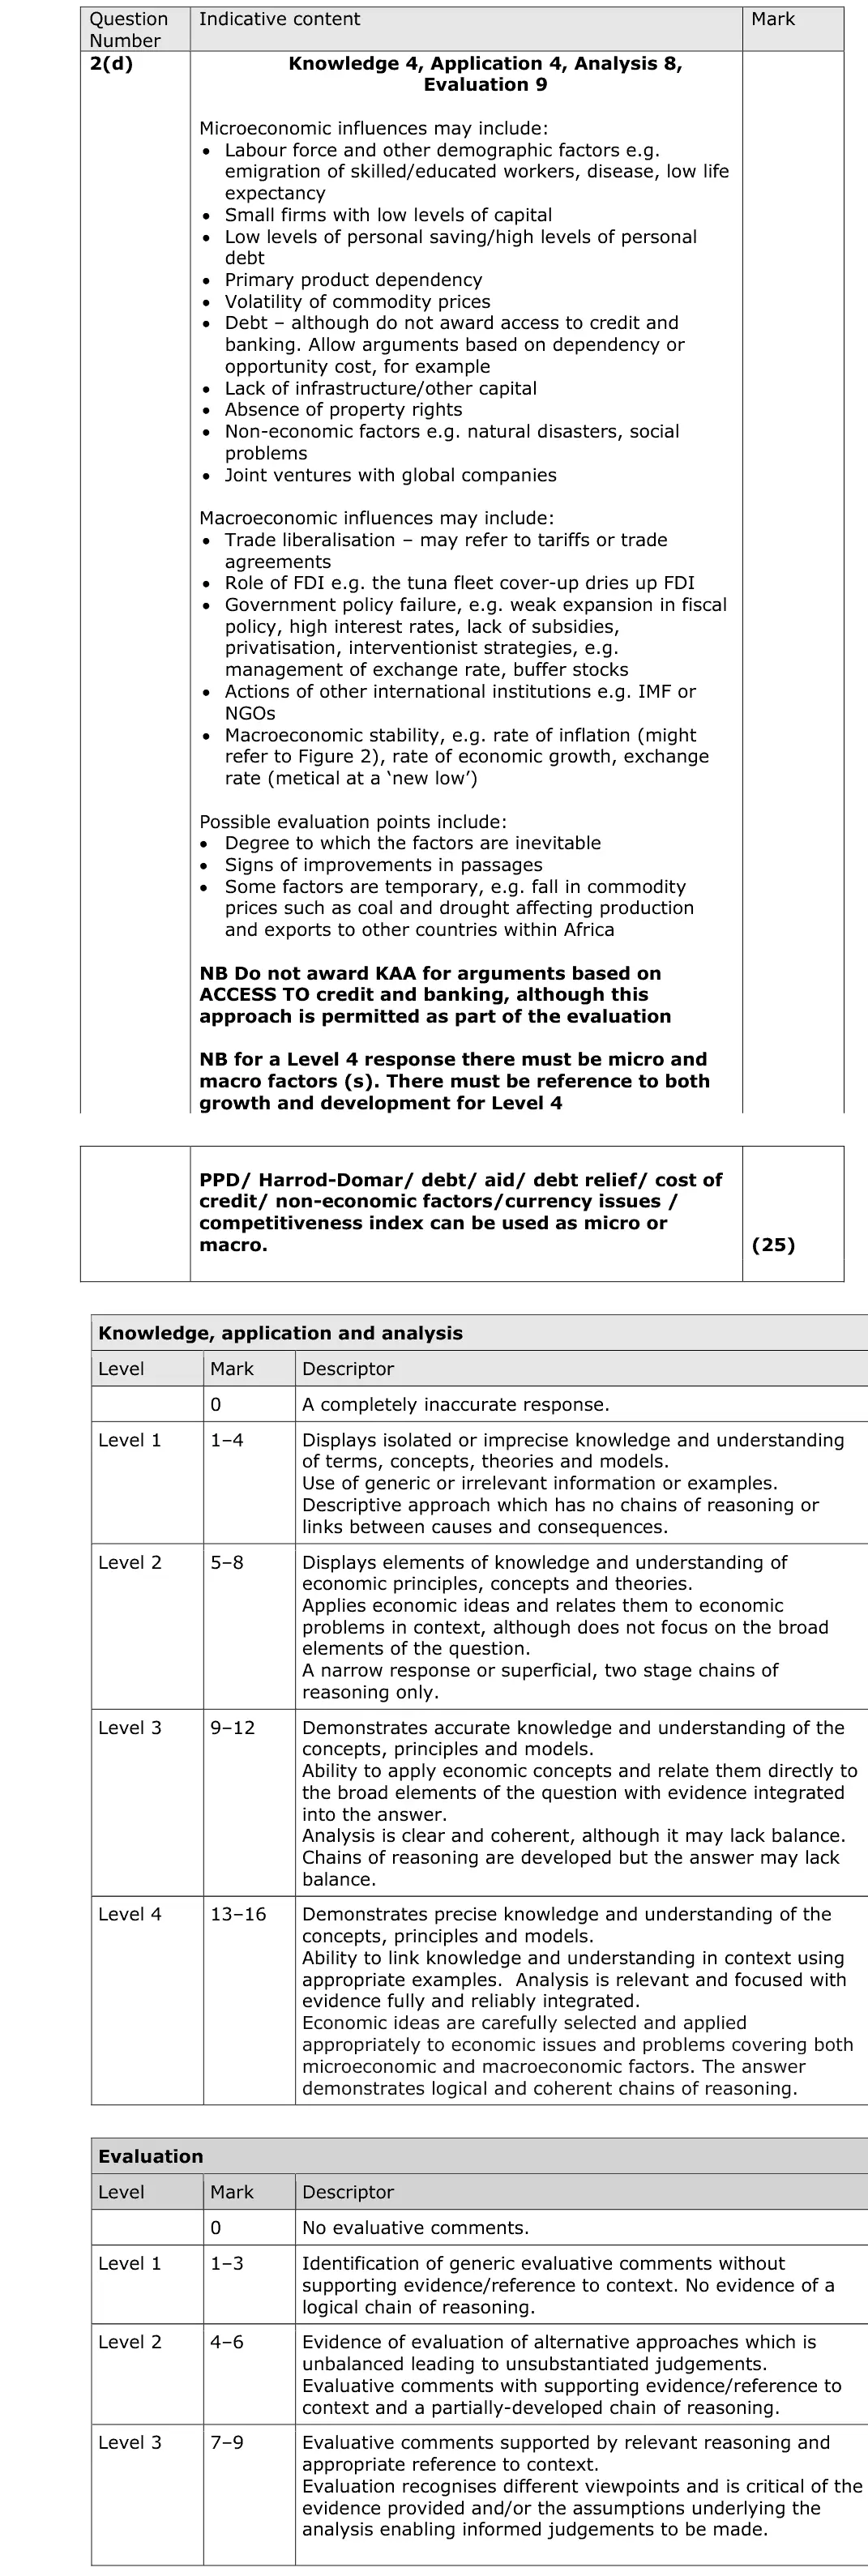
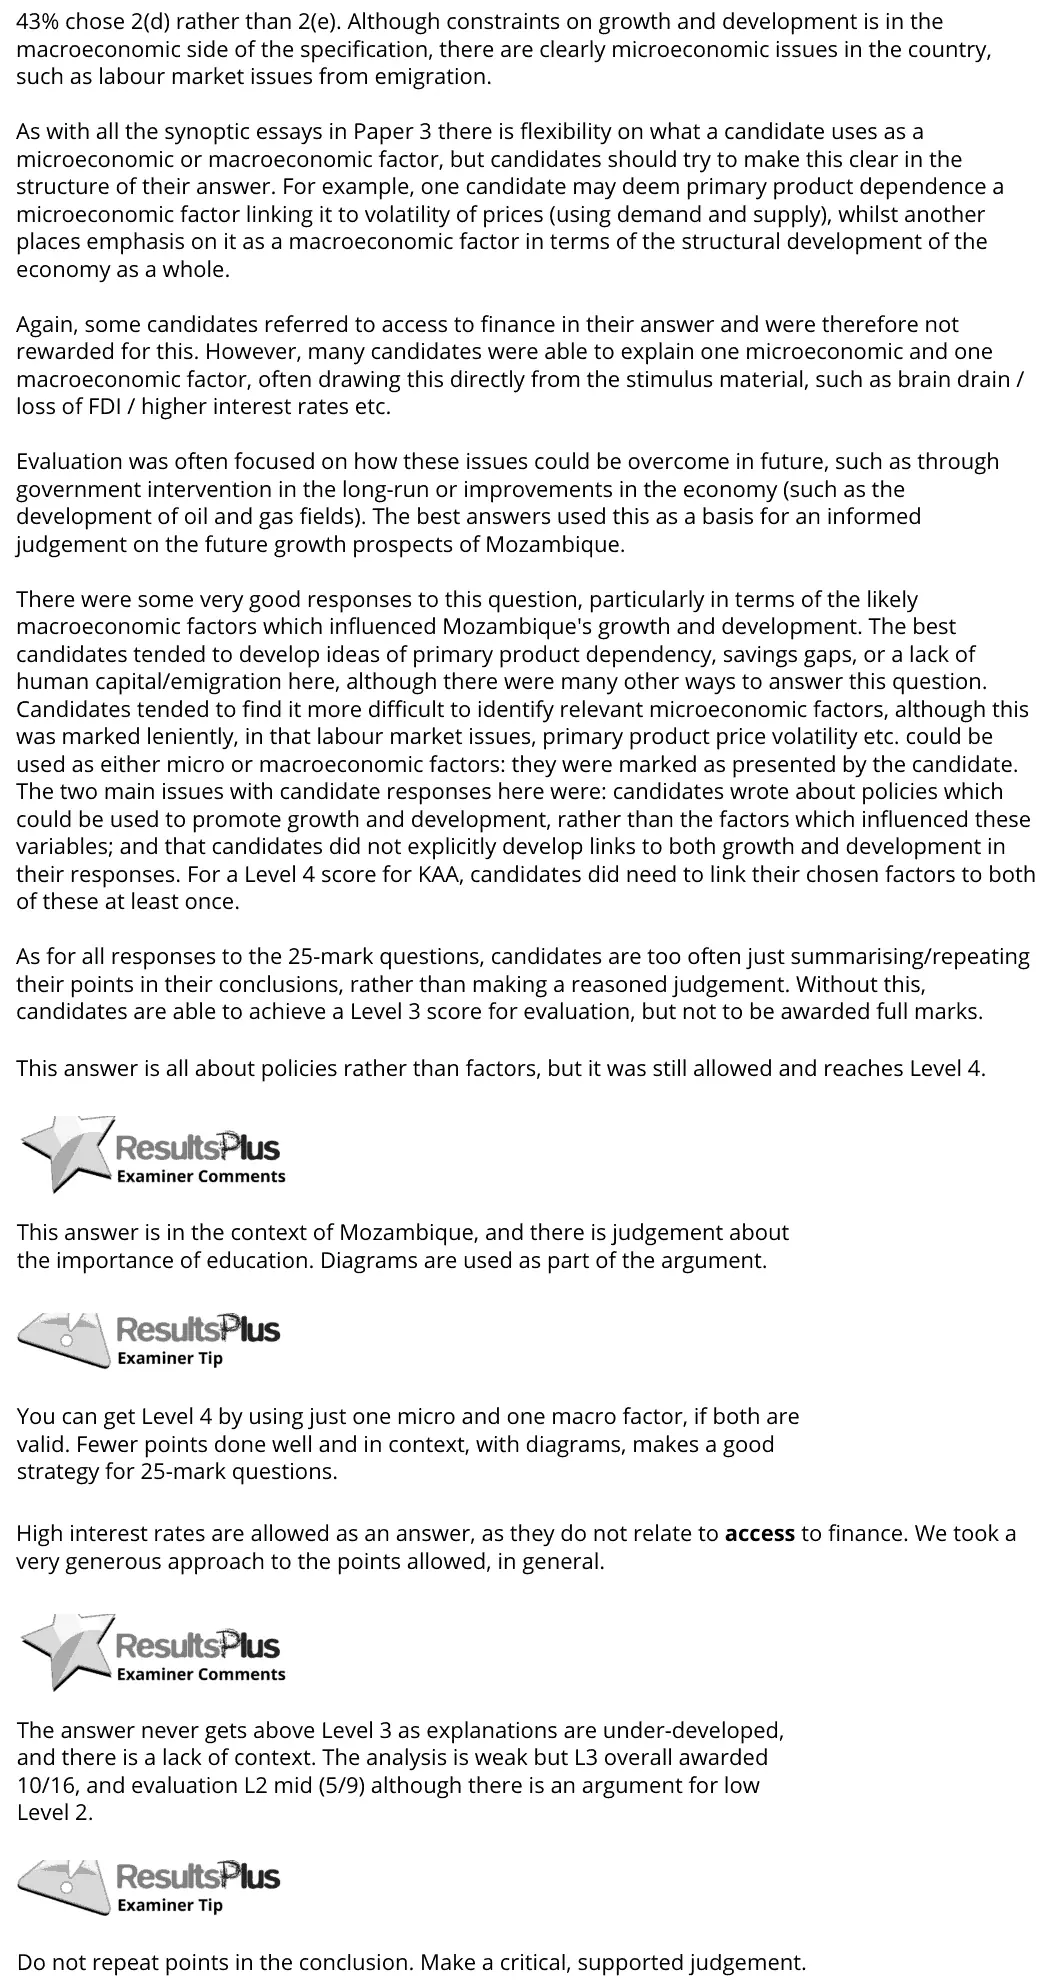
43% chose 2(d) rather than 2(e). Although constraints on growth and development is in the macroeconomic side of the specification, there are clearly microeconomic issues in the country, such as labour market issues from emigration. As with all the synoptic essays in Paper 3 there is flexibility on what a candidate uses as a microeconomic or macroeconomic factor, but candidates should try to make this clear in the structure of their answer. For example, one candidate may deem primary product dependence a microeconomic factor linking it to volatility of prices (using demand and supply), whilst another places emphasis on it as a macroeconomic factor in terms of the structural development of the economy as a whole. Again, some candidates referred to access to finance in their answer and were therefore not rewarded for this. However, many candidates were able to explain one microeconomic and one macroeconomic factor, often drawing this directly from the stimulus material, such as brain drain / loss of FDI / higher interest rates etc. Evaluation was often focused on how these issues could be overcome in future, such as through government intervention in the long-run or improvements in the economy (such as the development of oil and gas fields). The best answers used this as a basis for an informed judgement on the future growth prospects of Mozambique. There were some very good responses to this question, particularly in terms of the likely macroeconomic factors which influenced Mozambique's growth and development. The best candidates tended to develop ideas of primary product dependency, savings gaps, or a lack of human capital/emigration here, although there were many other ways to answer this question. Candidates tended to find it more difficult to identify relevant microeconomic factors, although this was marked leniently, in that labour market issues, primary product price volatility etc. could be used as either micro or macroeconomic factors: they were marked as presented by the candidate. The two main issues with candidate responses here were: candidates wrote about policies which could be used to promote growth and development, rather than the factors which influenced these variables; and that candidates did not explicitly develop links to both growth and development in their responses. For a Level 4 score for KAA, candidates did need to link their chosen factors to both of these at least once. As for all responses to the 25-mark questions, candidates are too often just summarising/repeating their points in their conclusions, rather than making a reasoned judgement. Without this, candidates are able to achieve a Level 3 score for evaluation, but not to be awarded full marks. This answer is all about policies rather than factors, but it was still allowed and reaches Level 4. This answer is in the context of Mozambique, and there is judgement about the importance of education. Diagrams are used as part of the argument. You can get Level 4 by using just one micro and one macro factor, if both are valid. Fewer points done well and in context, with diagrams, makes a good strategy for 25-mark questions. High interest rates are allowed as an answer, as they do not relate to access to finance. We took a very generous approach to the points allowed, in general. The answer never gets above Level 3 as explanations are under-developed, and there is a lack of context. The analysis is weak but L3 overall awarded 10/16, and evaluation L2 mid (5/9) although there is an argument for low Level 2. Do not repeat points in the conclusion. Make a critical, supported judgement.
Notes from the mark scheme and report
access to credit and banking is excluded from KAA
Level 4 needs micro and macro factors and both growth and development
emigration of skilled workers, primary product dependency, drought, falling FDI, high interest rates and inflation (Figure 2), depreciating metical
micro factors were harder to identify
Quantitative skills: QS 9 (interpret, apply and analyse information in written, graphical tabular and numerical forms)
June 2018 · Paper 2 · Q6(b)8 marksAO1=2, AO2=2, AO3=2, AO4=28-mark response
Data and extracts for question 6
Mark scheme, including the levels grid and indicative content
Examiner's comment
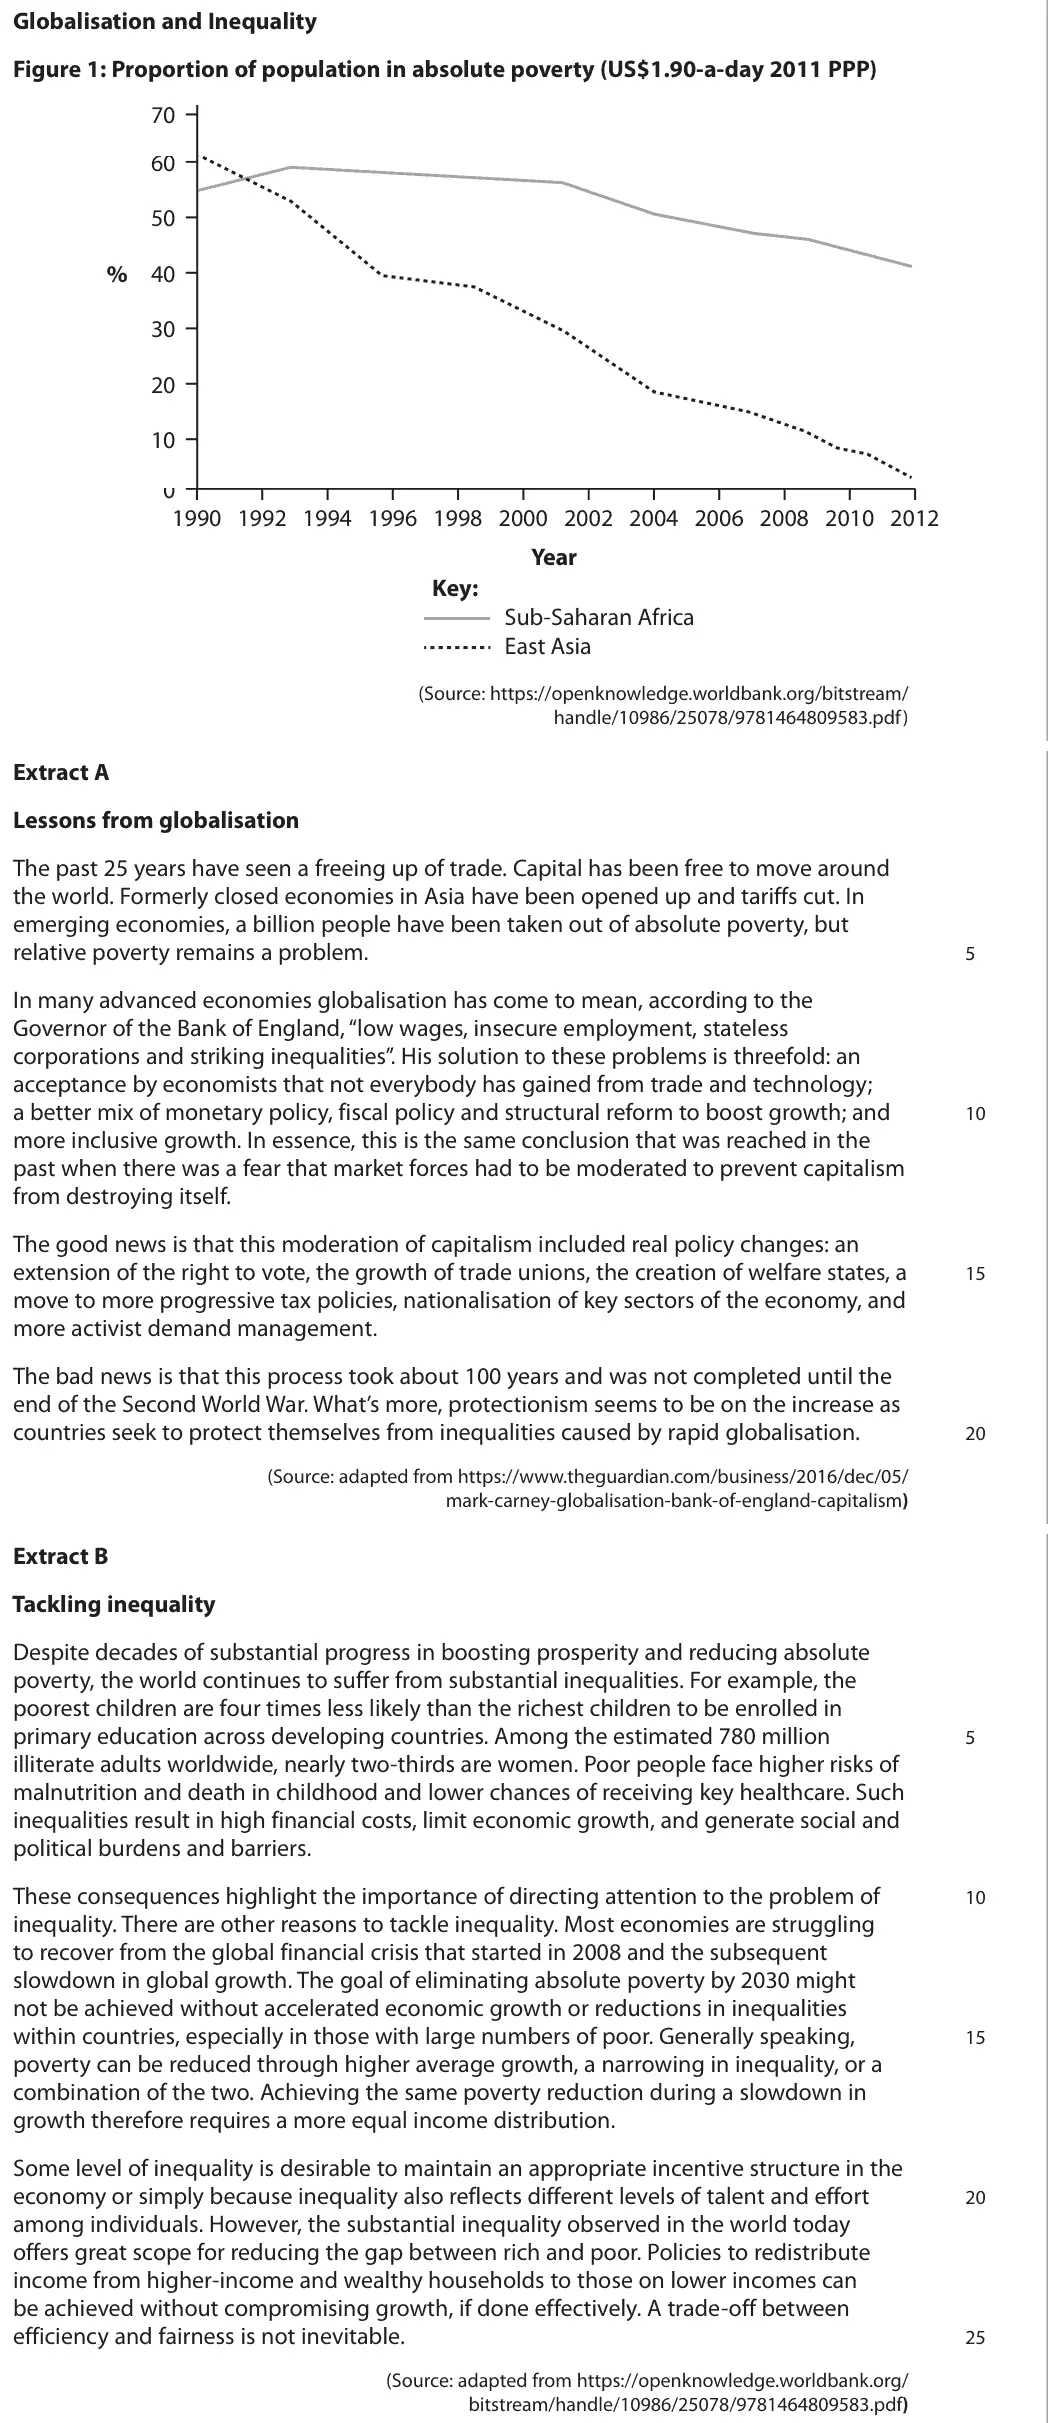
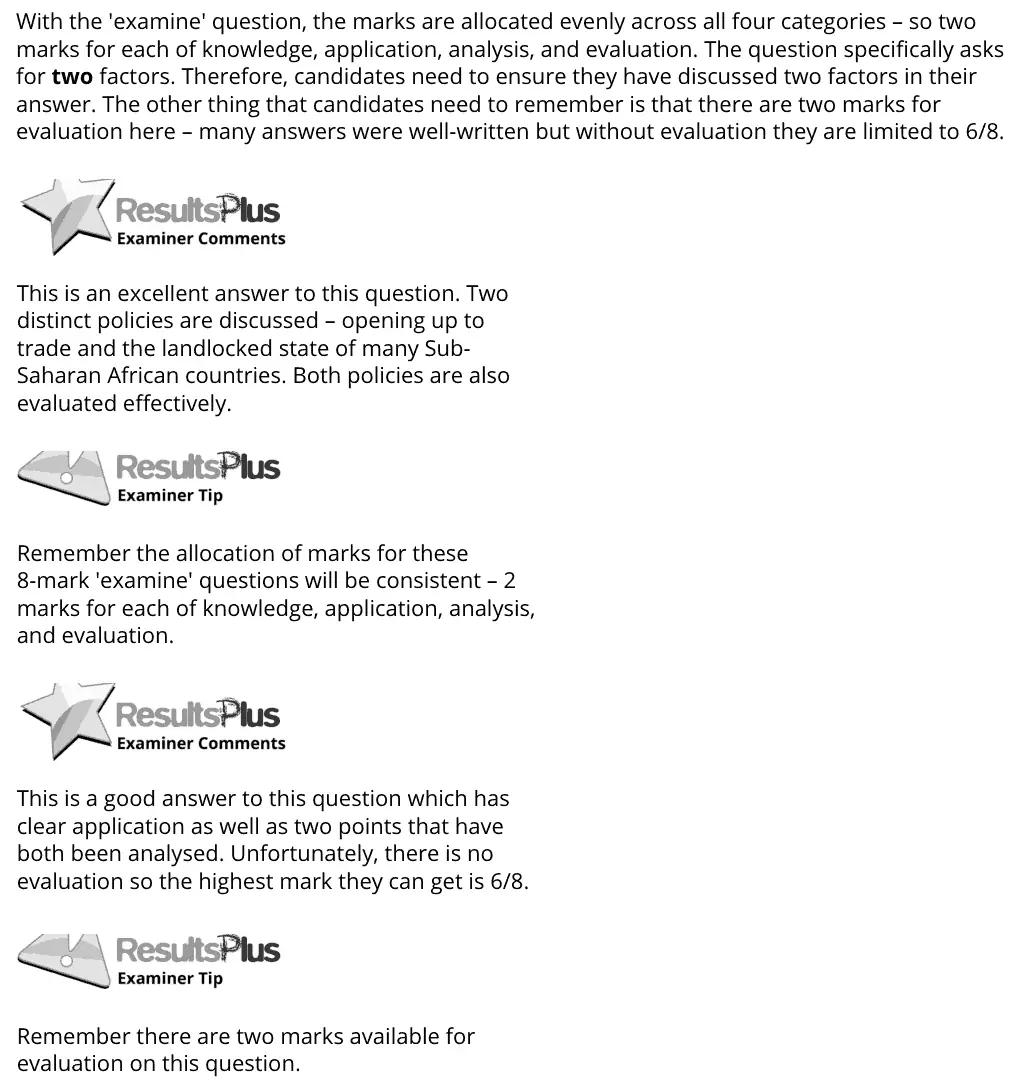
With the 'examine' question, the marks are allocated evenly across all four categories – so two marks for each of knowledge, application, analysis, and evaluation. The question specifically asks for two factors. Therefore, candidates need to ensure they have discussed two factors in their answer. The other thing that candidates need to remember is that there are two marks for evaluation here – many answers were well-written but without evaluation they are limited to 6/8. This is an excellent answer to this question. Two distinct policies are discussed – opening up to trade and the landlocked state of many Sub- Saharan African countries. Both policies are also evaluated effectively. Remember the allocation of marks for these 8-mark 'examine' questions will be consistent – 2 marks for each of knowledge, application, analysis, and evaluation. This is a good answer to this question which has clear application as well as two points that have both been analysed. Unfortunately, there is no evaluation so the highest mark they can get is 6/8. Remember there are two marks available for evaluation on this question.
Notes from the mark scheme and report
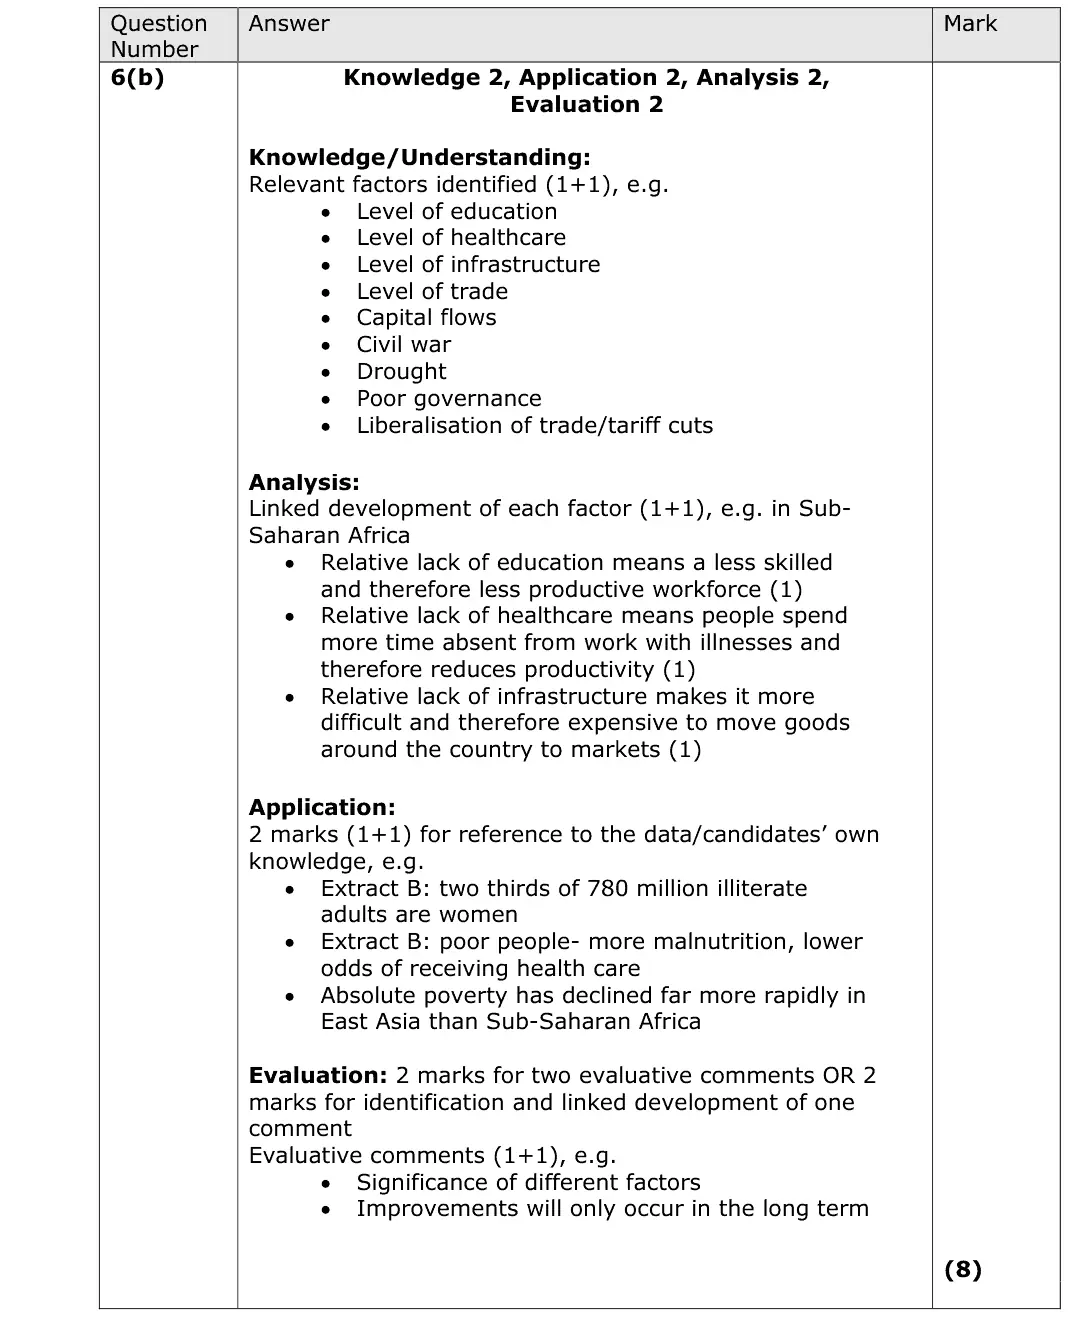
two distinct factors (education, healthcare, infrastructure, trade liberalisation, governance, conflict, landlocked) each developed and applied to Figure 1 or Extract B
without evaluation the maximum is 6 of 8
Quantitative skills: QS 9 (interpret, apply and analyse information in written, graphical tabular and numerical forms)
June 2018 · Paper 2 · Q6(e)15 marksAO1=3, AO2=3, AO3=3, AO4=615-mark response
Data and extracts for question 6
Mark scheme, including the levels grid and indicative content
Examiner's comment
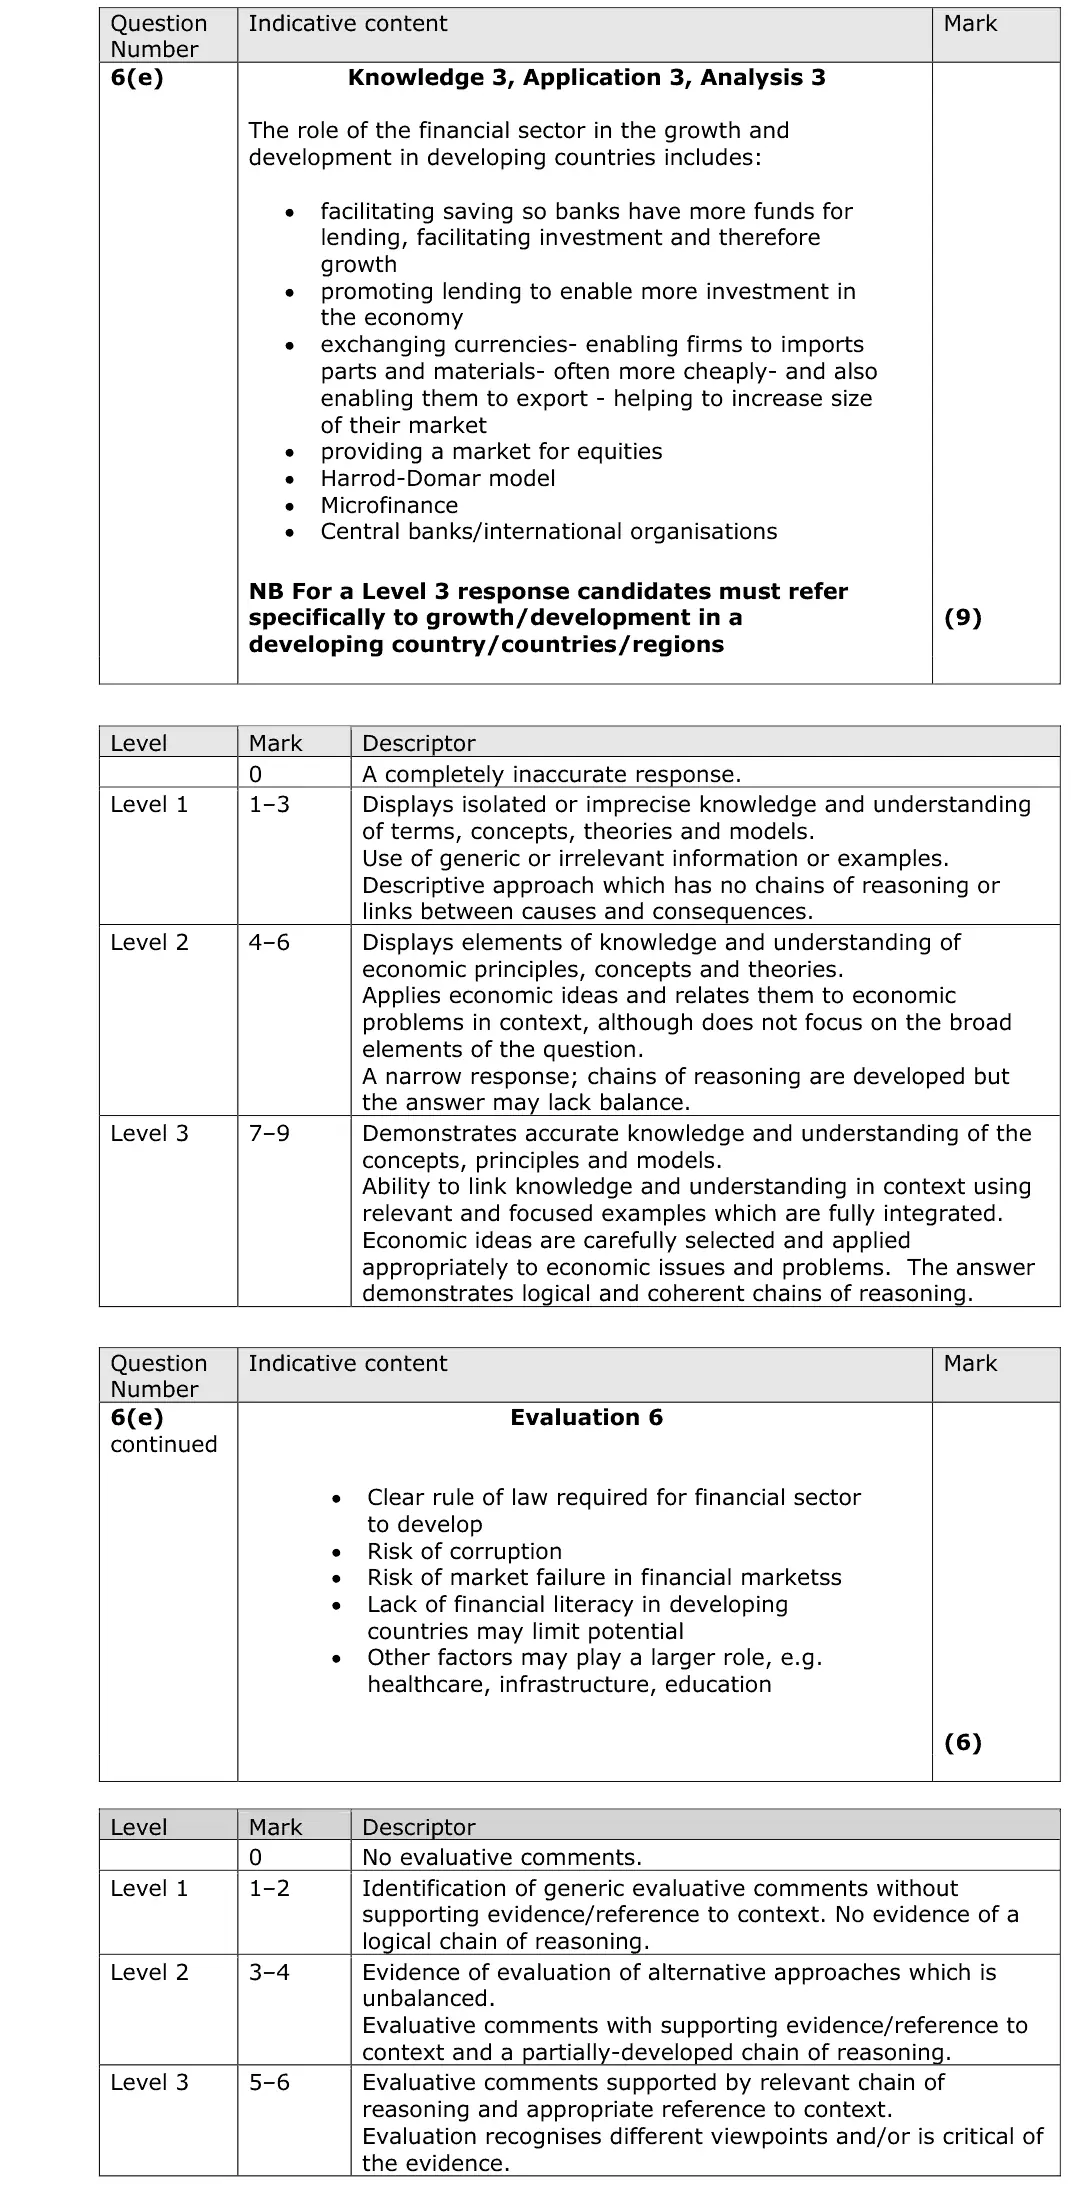
This was a nice open question which allowed candidates to bring in a wide range of issues or institutions when discussing the role of the financial markets. Many candidates discussed the 'traditional' role of banks in terms of savings and loans, with better candidates relating this to the Harrod-Domar model. Microfinance was also discussed by many candidates including the role of central banks in using monetary policy as well as international institutions such as the IMF. The main thing that held some candidates back was that they forgot this question was asking specifically about financial markets and started to answer just in terms of general development issues such as primary product dependency. This is a well-written answer to this question, particularly in terms of the KAA where there are two good points. The first one focuses on the role of banks in terms of savings and investment and the second on foreign exchange. These are also evaluated, although this isn't quite as good as the KAA points. Therefore, overall this answer achieves Level 3 KAA and Level 2 evaluation. Focus on quality rather than quantity. This answer is less than two pages in total yet still achieves very highly. This answer discusses the HIPC initiative and microfinance, although it does not explain them as well as the previous answer. The answer explains what microfinance schemes are but doesn't really explain how they are related to growth and development. It also discusses aid, although this is not relevant to the question. Overall this answer achieves Level 2 for KAA and Level 1 for evaluation.
Notes from the mark scheme and report
saving and lending for investment (Harrod-Domar), foreign exchange, equity markets, microfinance
Level 3 needs reference to specific developing countries or regions
some drifted into general development issues such as primary product dependency
evaluate with corruption, rule of law, financial literacy, market failure
June 2018 · Paper 3 · Q2(c)12 marksAO1=2, AO2=2, AO3=4, AO4=412-mark response
Data and extracts for question 2
Mark scheme, including the levels grid and indicative content
Examiner's comment
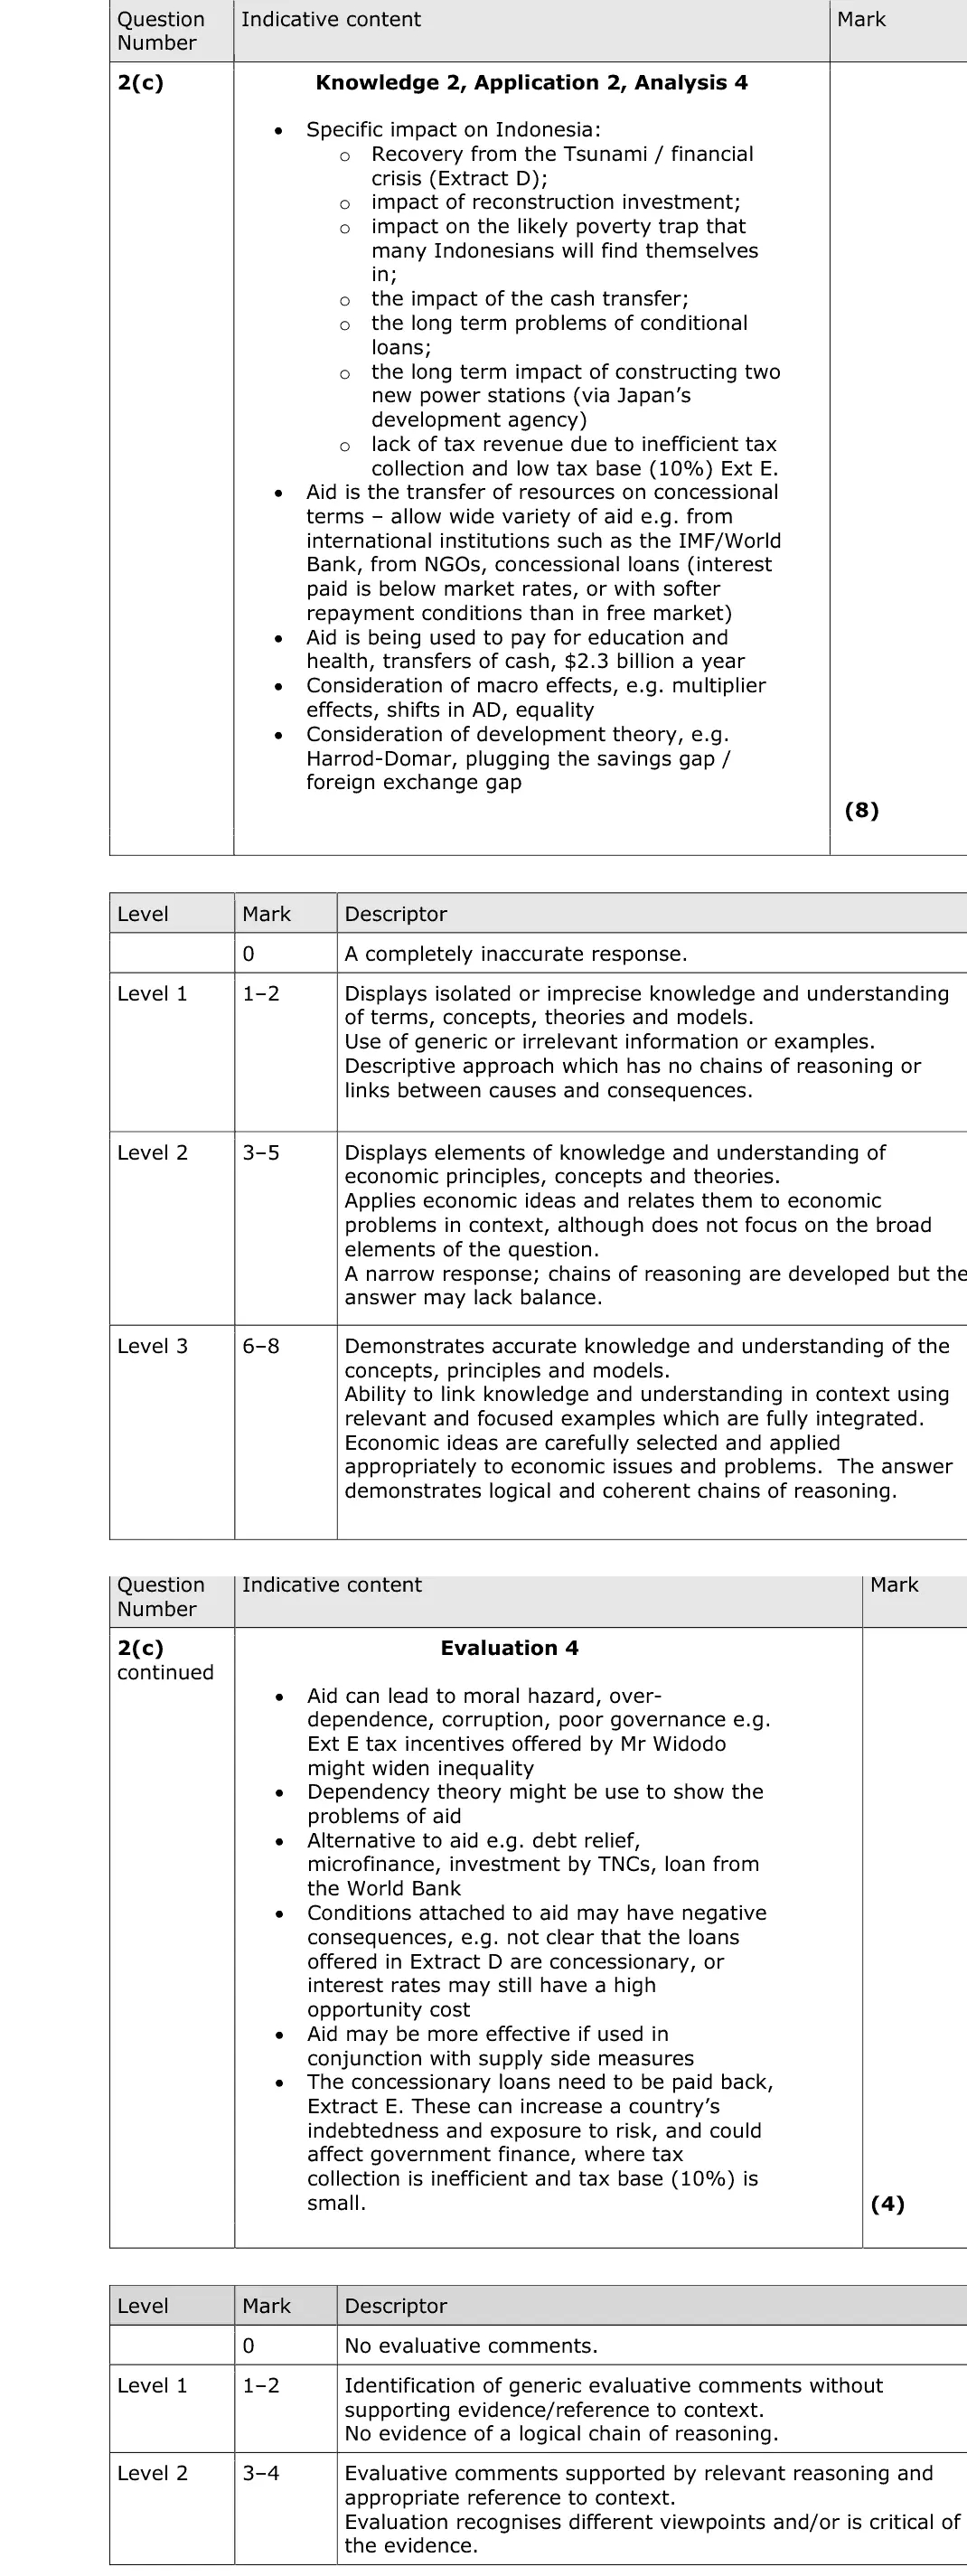
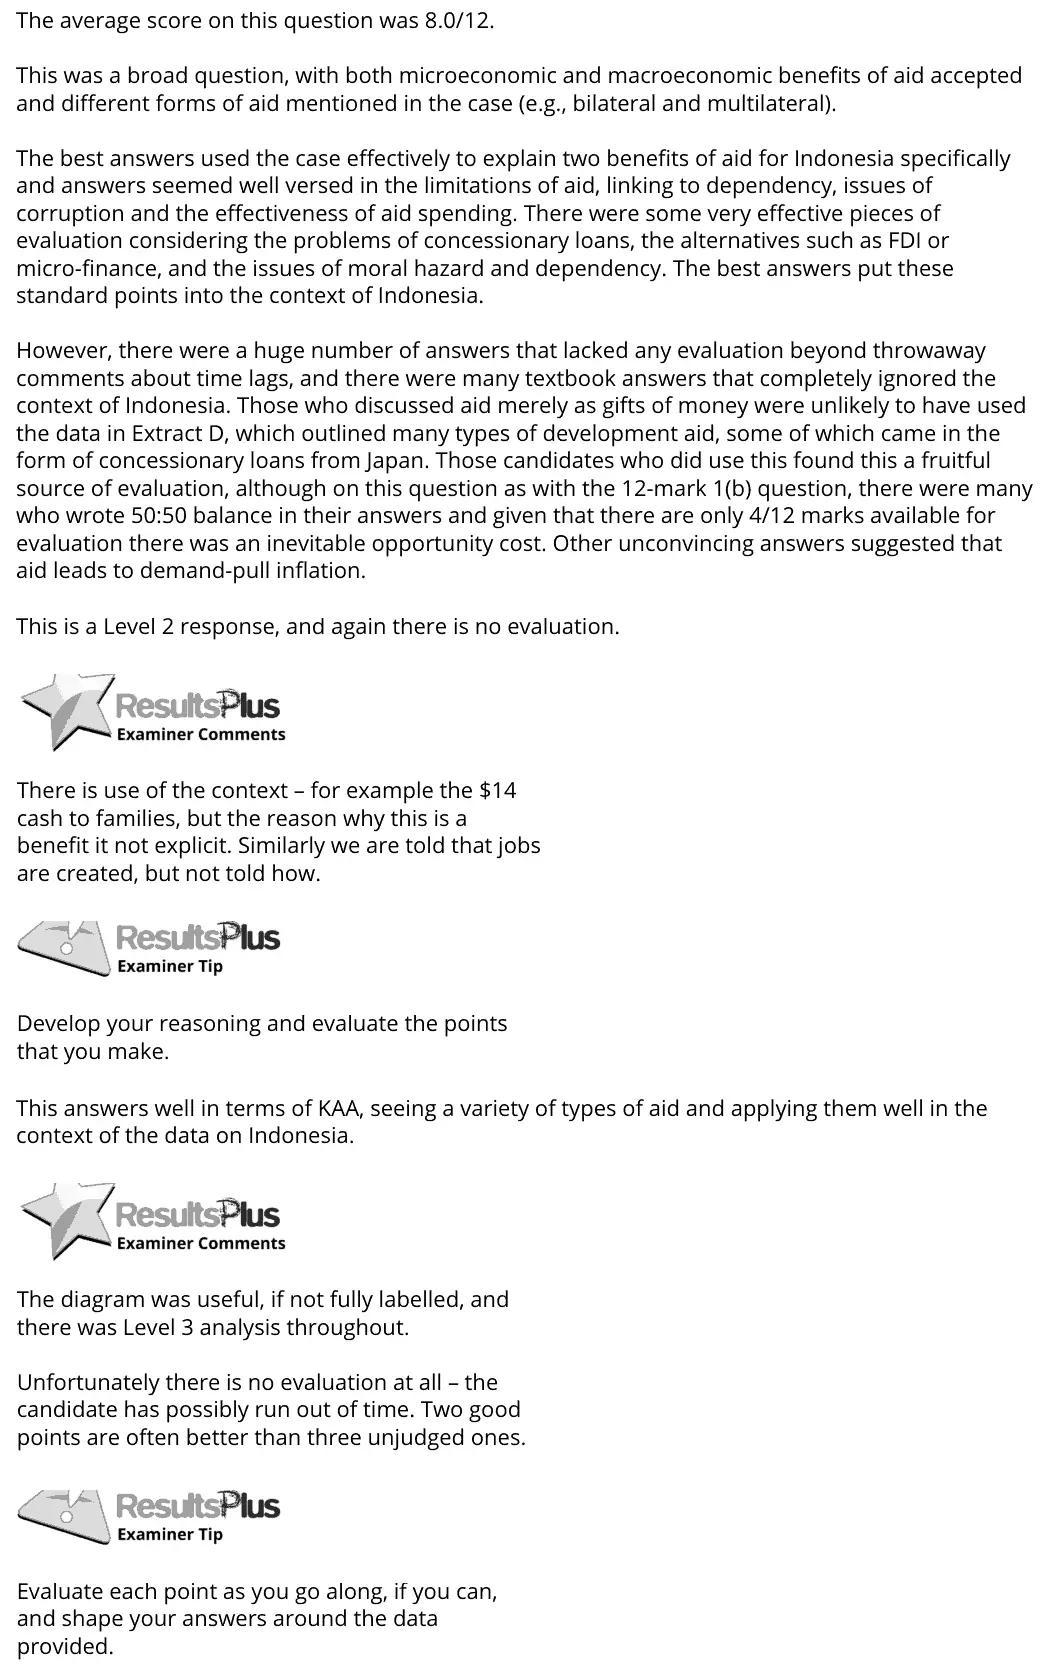
The average score on this question was 8.0/12. This was a broad question, with both microeconomic and macroeconomic benefits of aid accepted and different forms of aid mentioned in the case (e.g., bilateral and multilateral). The best answers used the case effectively to explain two benefits of aid for Indonesia specifically and answers seemed well versed in the limitations of aid, linking to dependency, issues of corruption and the effectiveness of aid spending. There were some very effective pieces of evaluation considering the problems of concessionary loans, the alternatives such as FDI or micro-finance, and the issues of moral hazard and dependency. The best answers put these standard points into the context of Indonesia. However, there were a huge number of answers that lacked any evaluation beyond throwaway comments about time lags, and there were many textbook answers that completely ignored the context of Indonesia. Those who discussed aid merely as gifts of money were unlikely to have used the data in Extract D, which outlined many types of development aid, some of which came in the form of concessionary loans from Japan. Those candidates who did use this found this a fruitful source of evaluation, although on this question as with the 12-mark 1(b) question, there were many who wrote 50:50 balance in their answers and given that there are only 4/12 marks available for evaluation there was an inevitable opportunity cost. Other unconvincing answers suggested that aid leads to demand-pull inflation. This is a Level 2 response, and again there is no evaluation. There is use of the context – for example the $14 cash to families, but the reason why this is a benefit it not explicit. Similarly we are told that jobs are created, but not told how. Develop your reasoning and evaluate the points that you make. This answers well in terms of KAA, seeing a variety of types of aid and applying them well in the context of the data on Indonesia. The diagram was useful, if not fully labelled, and there was Level 3 analysis throughout. Unfortunately there is no evaluation at all – the candidate has possibly run out of time. Two good points are often better than three unjudged ones. Evaluate each point as you go along, if you can, and shape your answers around the data provided.
Notes from the mark scheme and report
use the types of aid in Extract D (healthcare, cash transfers, concessional loans from Japan) and explain why each is a benefit for Indonesia
Harrod-Domar savings gap
evaluate with dependency, corruption, repayment of loans
many answers had no evaluation
June 2018 · Paper 3 · Q2(d)25 marksAO1=4, AO2=4, AO3=8, AO4=925-mark essayEither/or
Data and extracts for question 2
Mark scheme, including the levels grid and indicative content
Examiner's comment
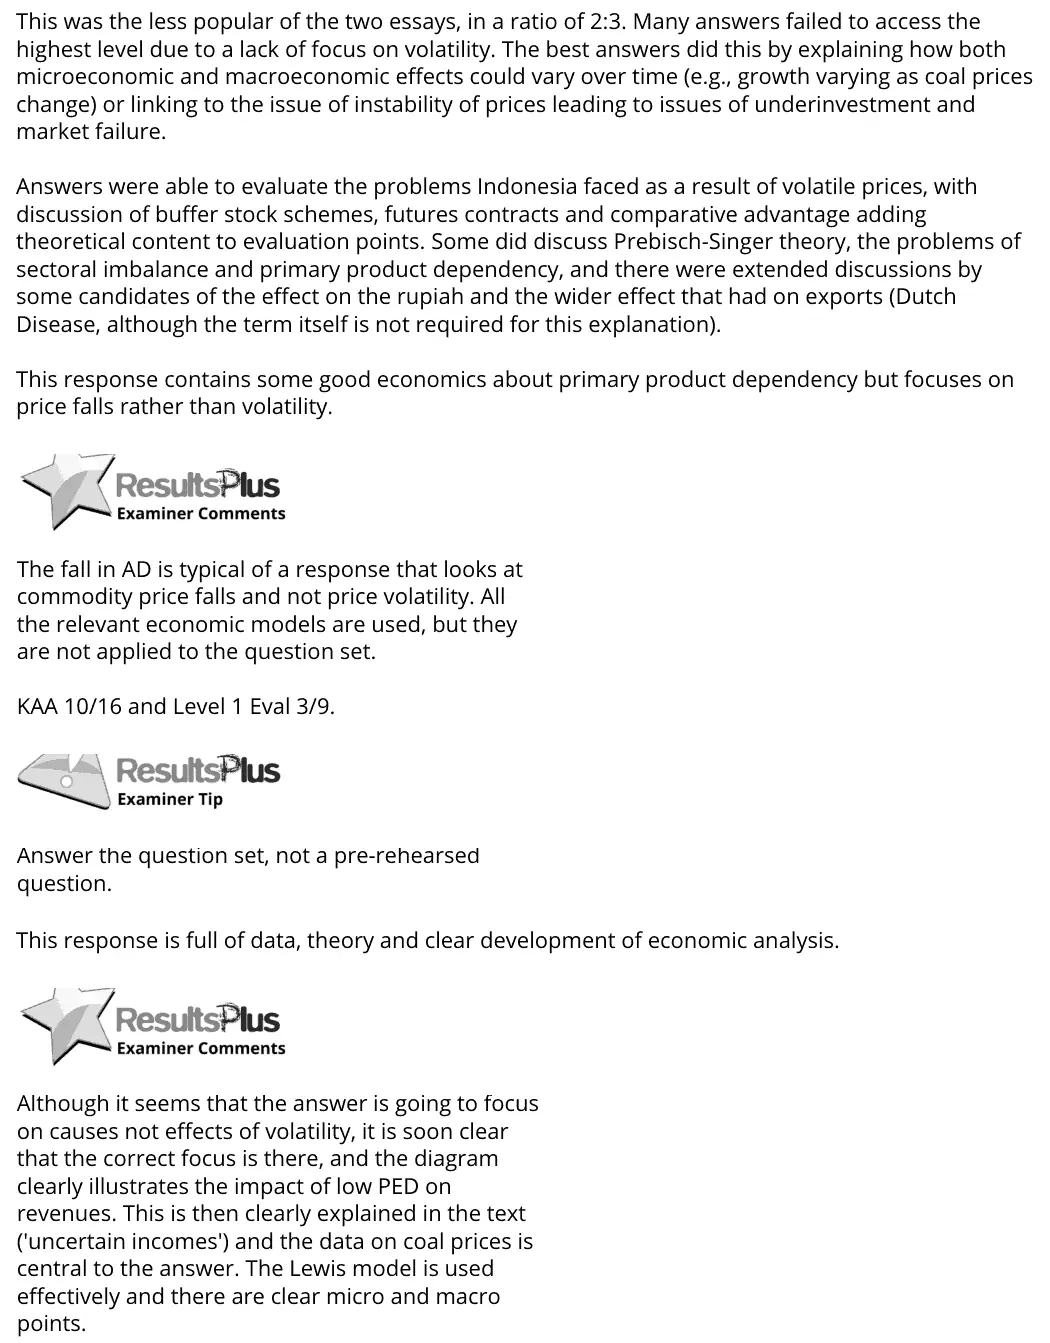
This was the less popular of the two essays, in a ratio of 2:3. Many answers failed to access the highest level due to a lack of focus on volatility. The best answers did this by explaining how both microeconomic and macroeconomic effects could vary over time (e.g., growth varying as coal prices change) or linking to the issue of instability of prices leading to issues of underinvestment and market failure. Answers were able to evaluate the problems Indonesia faced as a result of volatile prices, with discussion of buffer stock schemes, futures contracts and comparative advantage adding theoretical content to evaluation points. Some did discuss Prebisch-Singer theory, the problems of sectoral imbalance and primary product dependency, and there were extended discussions by some candidates of the effect on the rupiah and the wider effect that had on exports (Dutch Disease, although the term itself is not required for this explanation). This response contains some good economics about primary product dependency but focuses on price falls rather than volatility. The fall in AD is typical of a response that looks at commodity price falls and not price volatility. All the relevant economic models are used, but they are not applied to the question set. KAA 10/16 and Level 1 Eval 3/9. Answer the question set, not a pre-rehearsed question. This response is full of data, theory and clear development of economic analysis. Although it seems that the answer is going to focus on causes not effects of volatility, it is soon clear that the correct focus is there, and the diagram clearly illustrates the impact of low PED on revenues. This is then clearly explained in the text ('uncertain incomes') and the data on coal prices is central to the answer. The Lewis model is used effectively and there are clear micro and macro points.
Notes from the mark scheme and report
focus on volatility, not just the fall in coal prices
low PED and PES make producer revenue unstable
Level 4 needs Indonesia's context
evaluate with buffer stocks, futures contracts, fiscal expansion and GDP holding up (Figures 4 and 5)
Quantitative skills: QS 9 (interpret, apply and analyse information in written, graphical tabular and numerical forms)
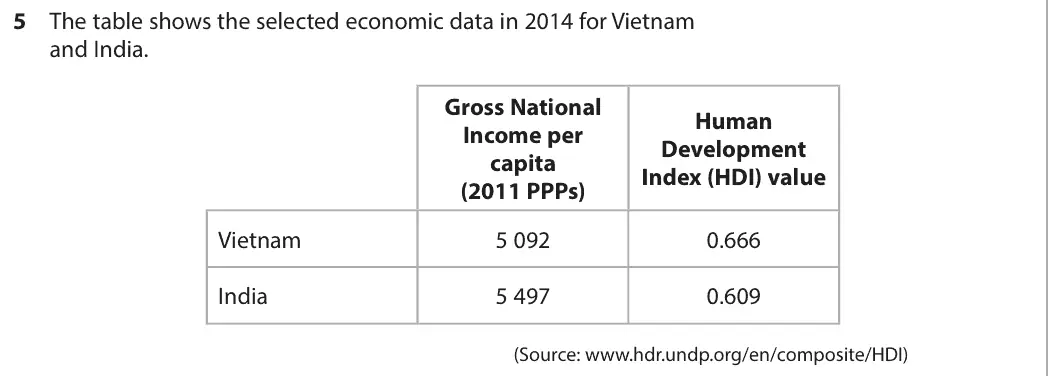
June 2017 · Paper 2 · Q5(b)4 marksAO1=2, AO2=1, AO3=1Short answer
Data and extracts for question 5
Mark scheme
Examiner's comment
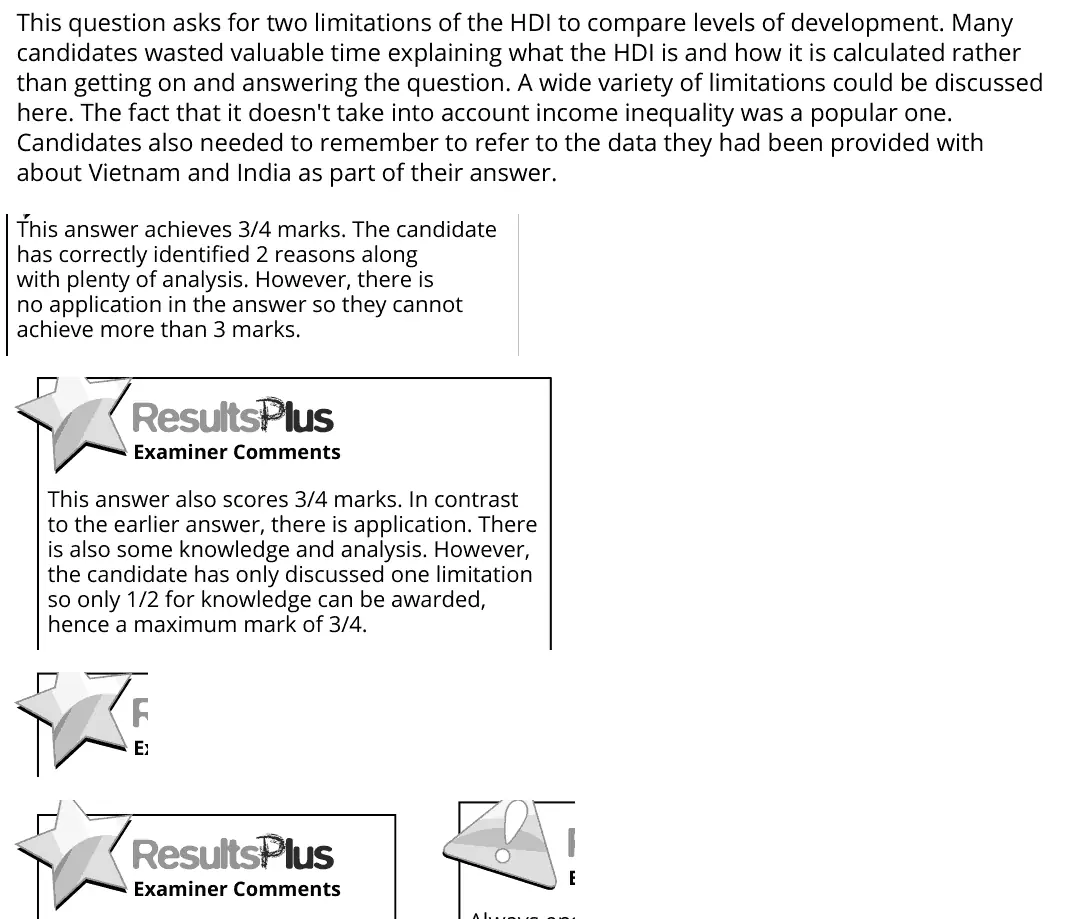
This question asks for two limitations of the HDI to compare levels of development. Many candidates wasted valuable time explaining what the HDI is and how it is calculated rather than getting on and answering the question. A wide variety of limitations could be discussed here. The fact that it doesn't take into account income inequality was a popular one. Candidates also needed to remember to refer to the data they had been provided with about Vietnam and India as part of their answer. This answer achieves 3/4 marks. The candidate has correctly identified 2 reasons along with plenty of analysis. However, there is no application in the answer so they cannot achieve more than 3 marks. This answer also scores 3/4 marks. In contrast to the earlier answer, there is application. There is also some knowledge and analysis. However, the candidate has only discussed one limitation so only 1/2 for knowledge can be awarded, hence a maximum mark of 3/4.
Notes from the mark scheme and report
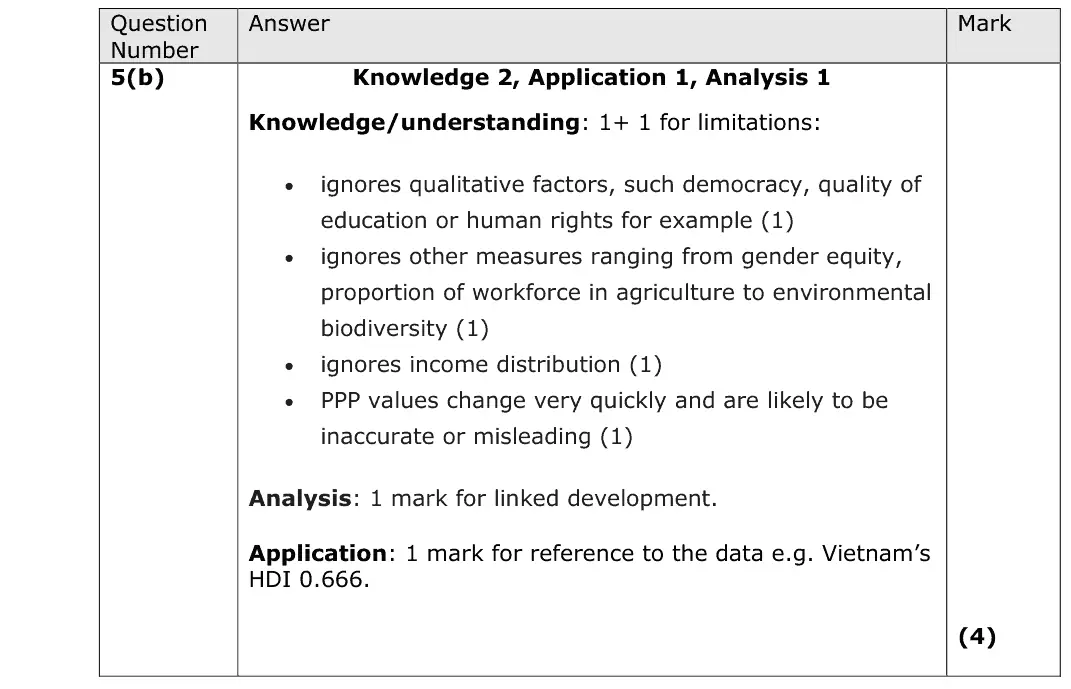
two limitations, e.g. ignores income distribution, ignores qualitative factors (democracy, human rights, quality of education), PPP values change
quote the data (e.g. Vietnam HDI 0.666) for the application mark
do not waste time explaining how HDI is calculated
Quantitative skills: QS 11 (understand composite indicators); QS 9 (interpret, apply and analyse information in written, graphical tabular and numerical forms)
June 2017 · Paper 3 · Q1(c)12 marksAO1=2, AO2=2, AO3=4, AO4=412-mark response
Data and extracts for question 1
Mark scheme, including the levels grid and indicative content
Examiner's comment
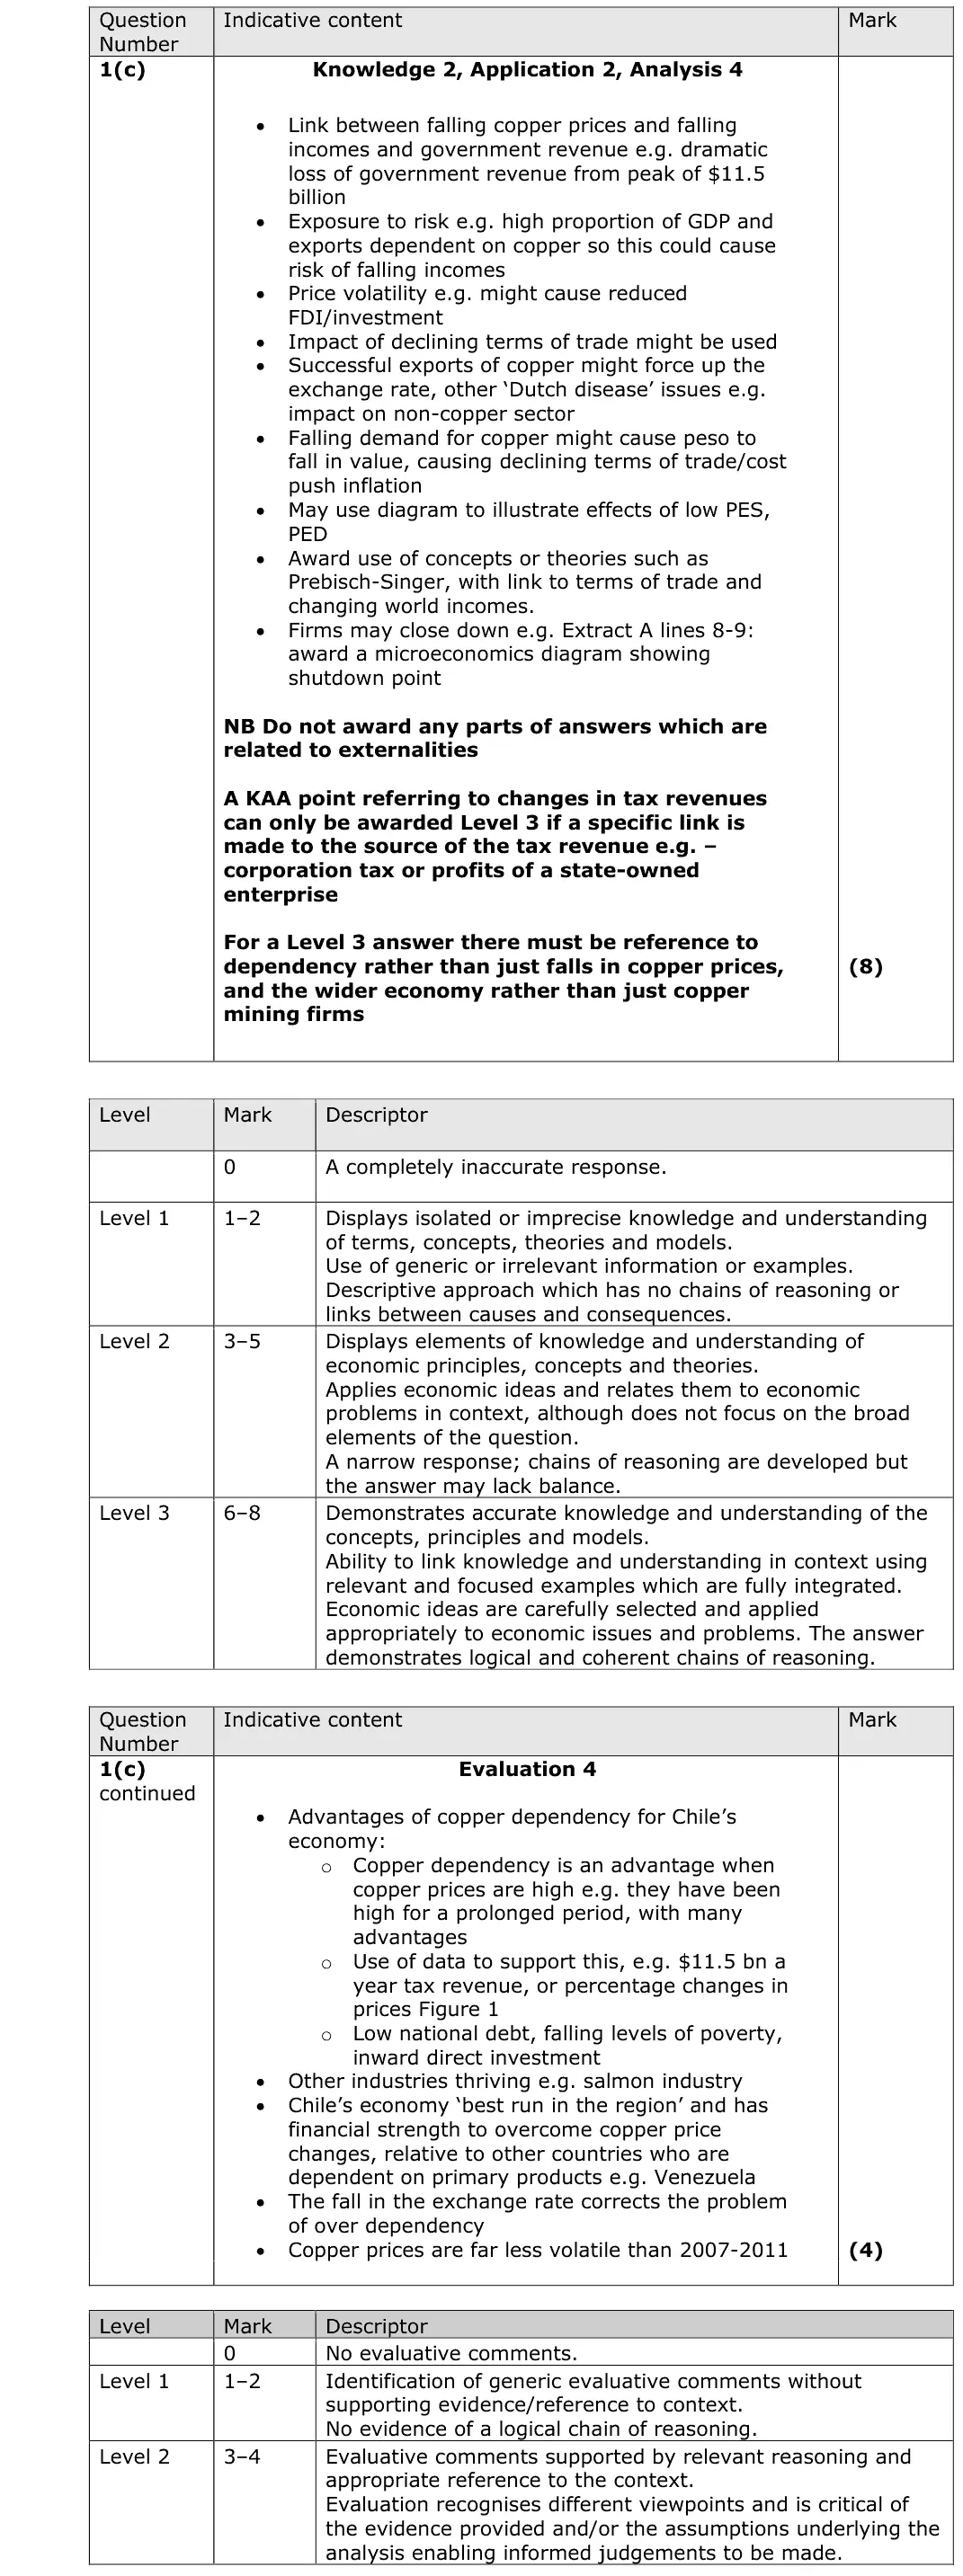
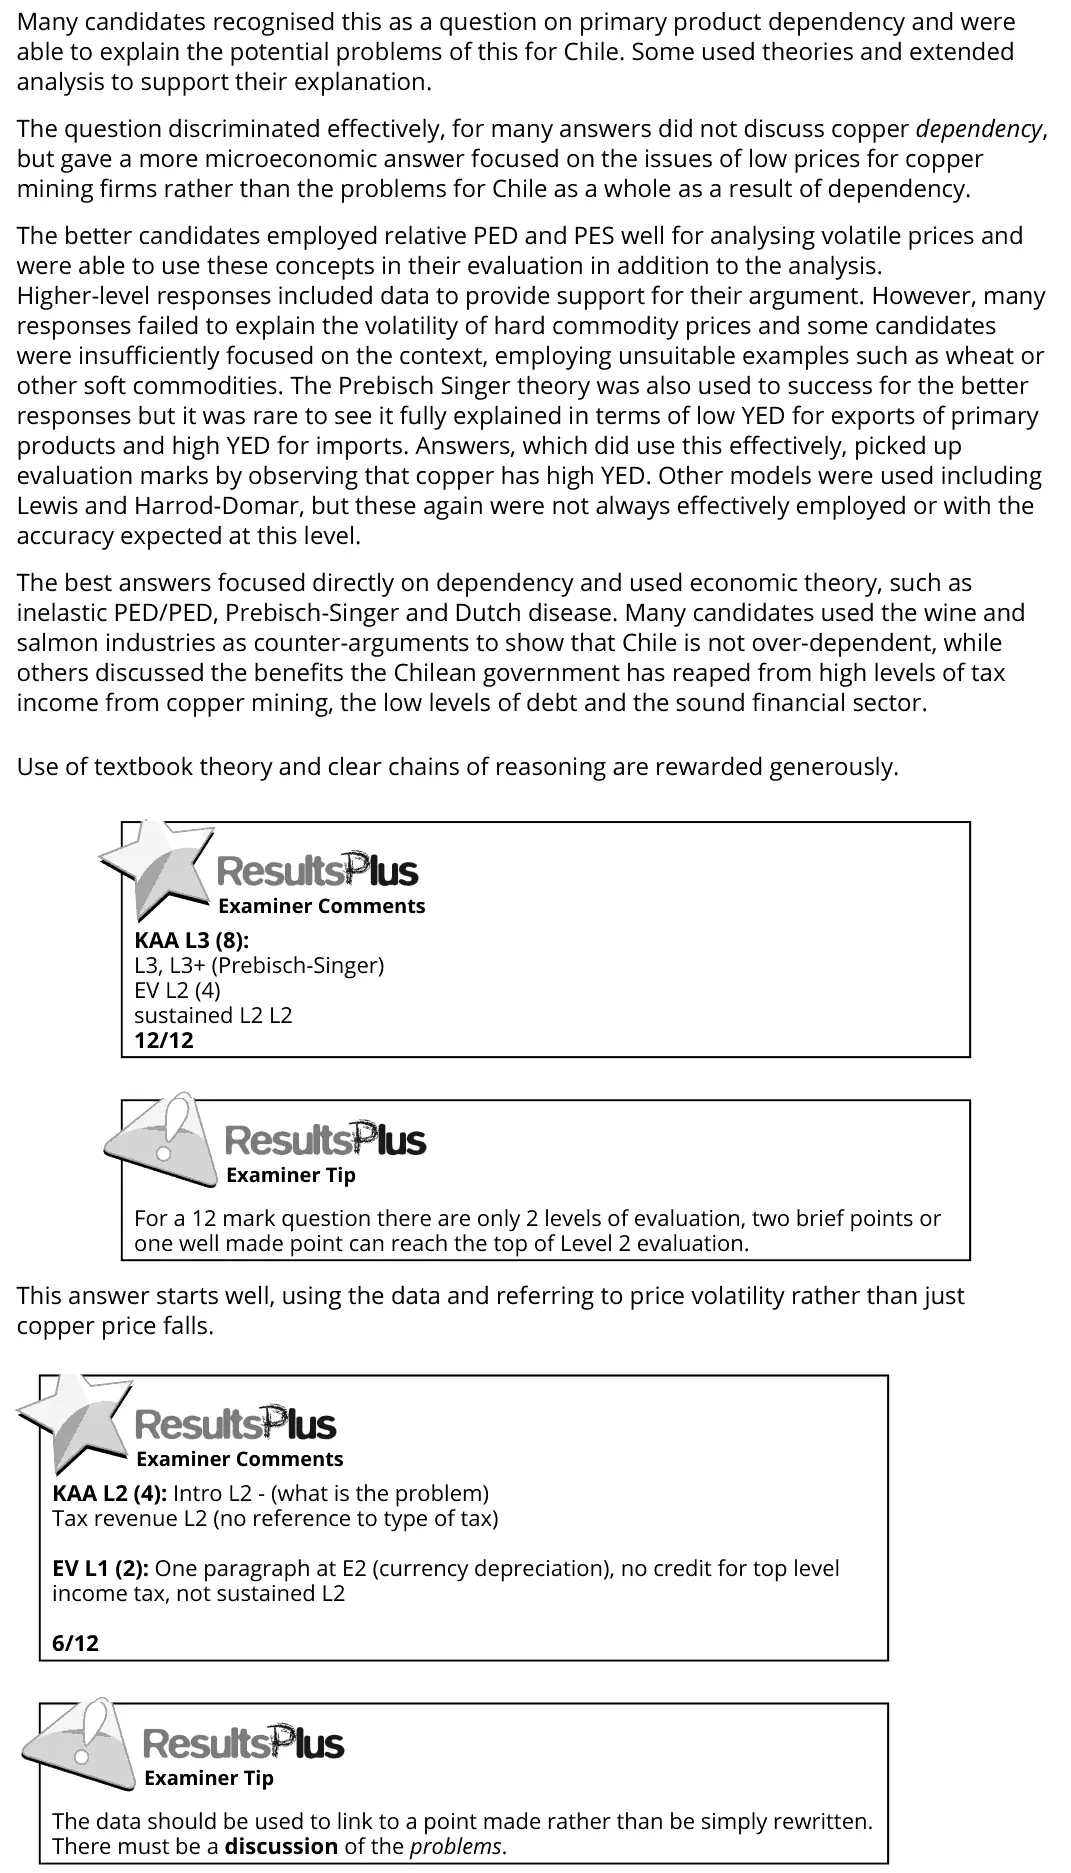
Many candidates recognised this as a question on primary product dependency and were able to explain the potential problems of this for Chile. Some used theories and extended analysis to support their explanation. The question discriminated effectively, for many answers did not discuss copper dependency, but gave a more microeconomic answer focused on the issues of low prices for copper mining firms rather than the problems for Chile as a whole as a result of dependency. The better candidates employed relative PED and PES well for analysing volatile prices and were able to use these concepts in their evaluation in addition to the analysis. Higher-level responses included data to provide support for their argument. However, many responses failed to explain the volatility of hard commodity prices and some candidates were insufficiently focused on the context, employing unsuitable examples such as wheat or other soft commodities. The Prebisch Singer theory was also used to success for the better responses but it was rare to see it fully explained in terms of low YED for exports of primary products and high YED for imports. Answers, which did use this effectively, picked up evaluation marks by observing that copper has high YED. Other models were used including Lewis and Harrod-Domar, but these again were not always effectively employed or with the accuracy expected at this level. The best answers focused directly on dependency and used economic theory, such as inelastic PED/PED, Prebisch-Singer and Dutch disease. Many candidates used the wine and salmon industries as counter-arguments to show that Chile is not over-dependent, while others discussed the benefits the Chilean government has reaped from high levels of tax income from copper mining, the low levels of debt and the sound financial sector. Use of textbook theory and clear chains of reasoning are rewarded generously. This answer starts well, using the data and referring to price volatility rather than just copper price falls. KAA L3 (8): L3, L3+ (Prebisch-Singer) EV L2 (4) sustained L2 L2 12/12 For a 12 mark question there are only 2 levels of evaluation, two brief points or one well made point can reach the top of Level 2 evaluation. KAA L2 (4): Intro L2 - (what is the problem) Tax revenue L2 (no reference to type of tax) EV L1 (2): One paragraph at E2 (currency depreciation), no credit for top level income tax, not sustained L2 6/12 The data should be used to link to a point made rather than be simply rewritten. There must be a discussion of the problems.
Notes from the mark scheme and report
Level 3 needs dependency and the wider economy, not just low copper prices for mining firms
volatile commodity prices (inelastic PED and PES), falling tax revenue, Prebisch-Singer terms of trade
nothing for externalities
evaluate: copper has high YED, other industries thriving
Quantitative skills: QS 9 (interpret, apply and analyse information in written, graphical tabular and numerical forms)
June 2017 · Paper 3 · Q1(d)25 marksAO1=4, AO2=4, AO3=8, AO4=925-mark essayEither/or
Data and extracts for question 1
Mark scheme, including the levels grid and indicative content
Examiner's comment
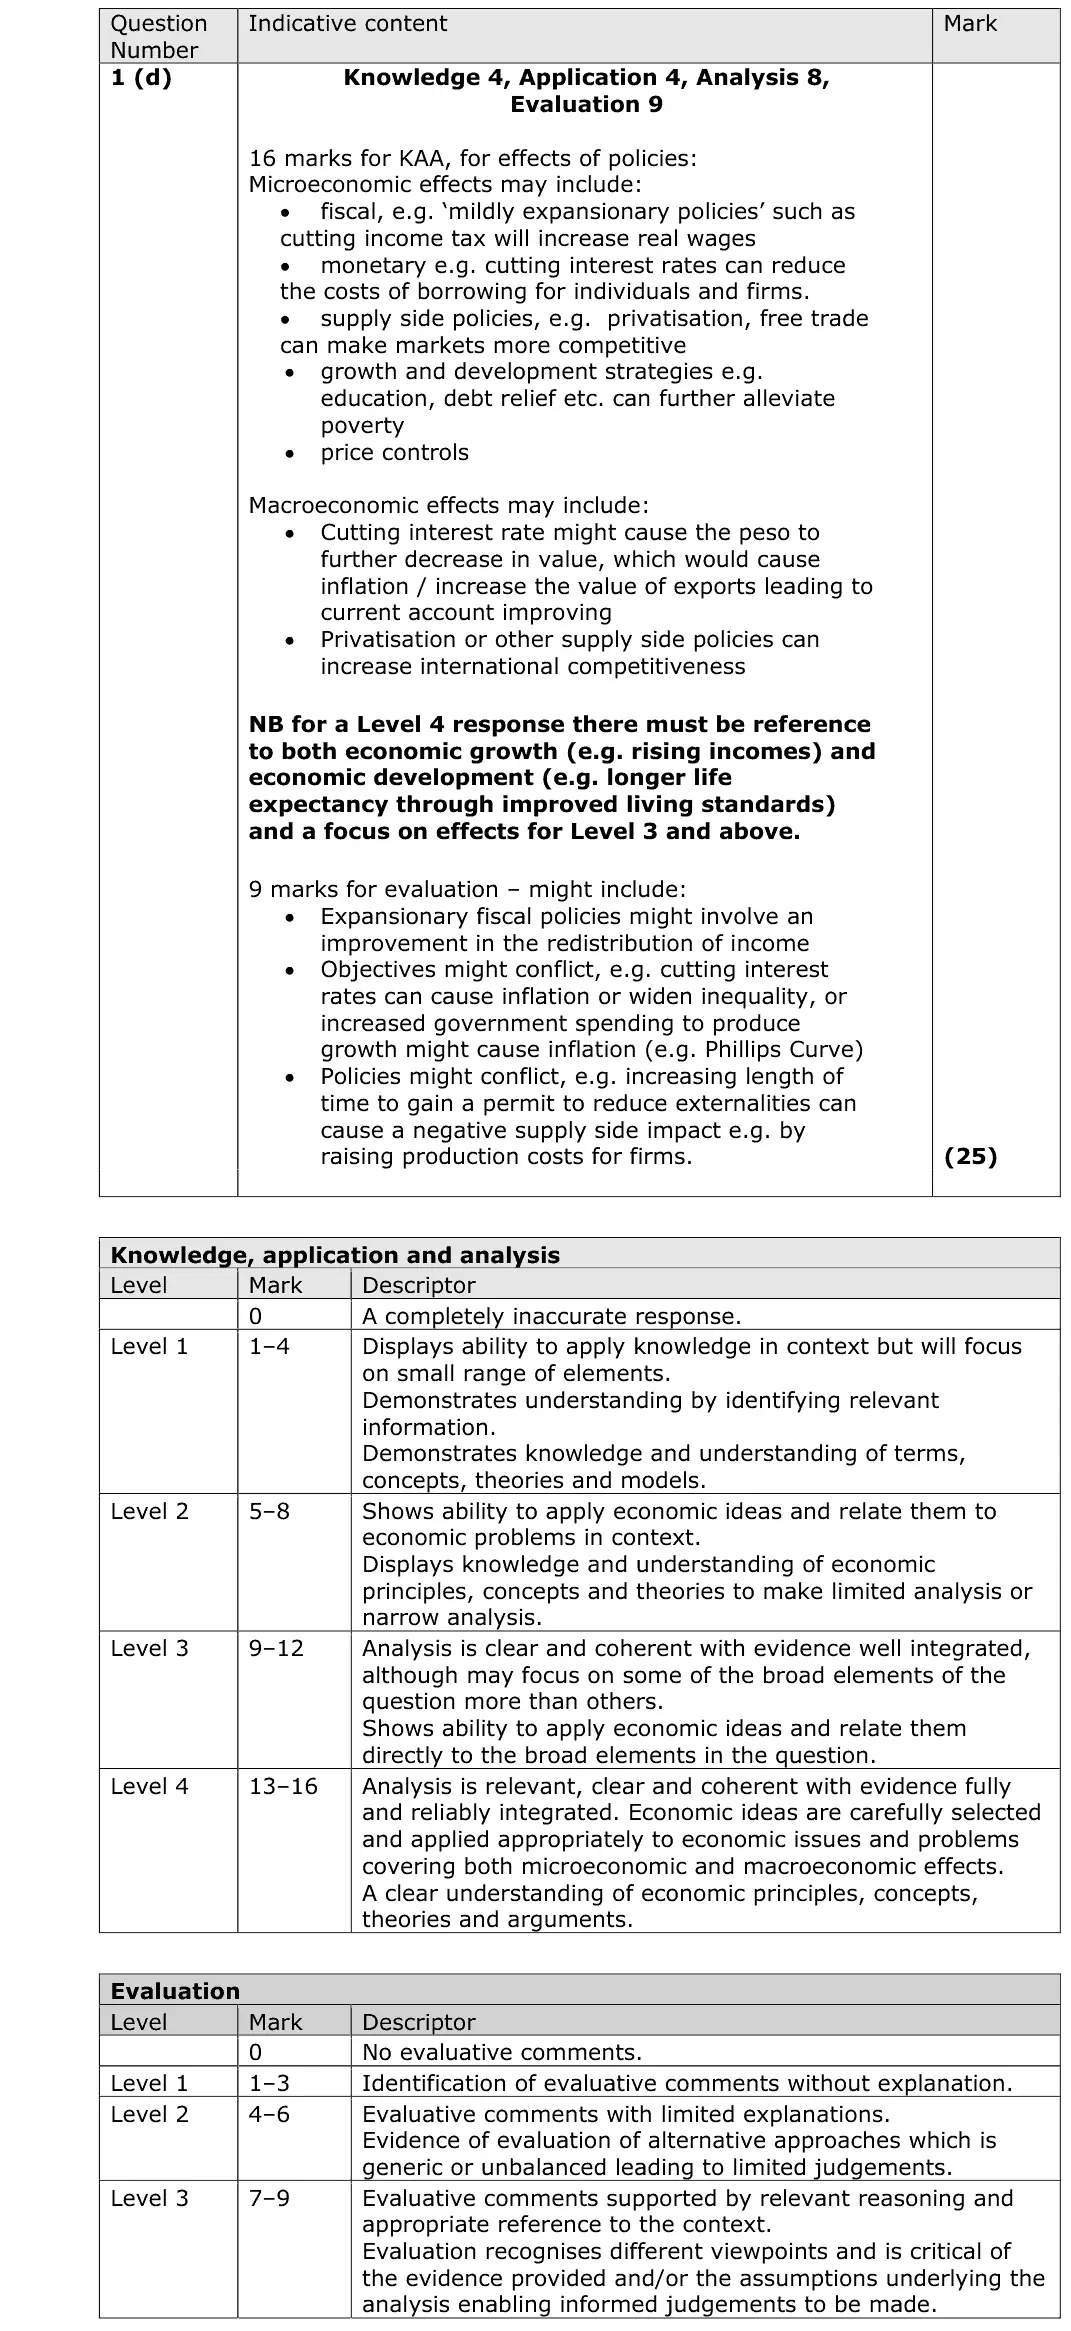
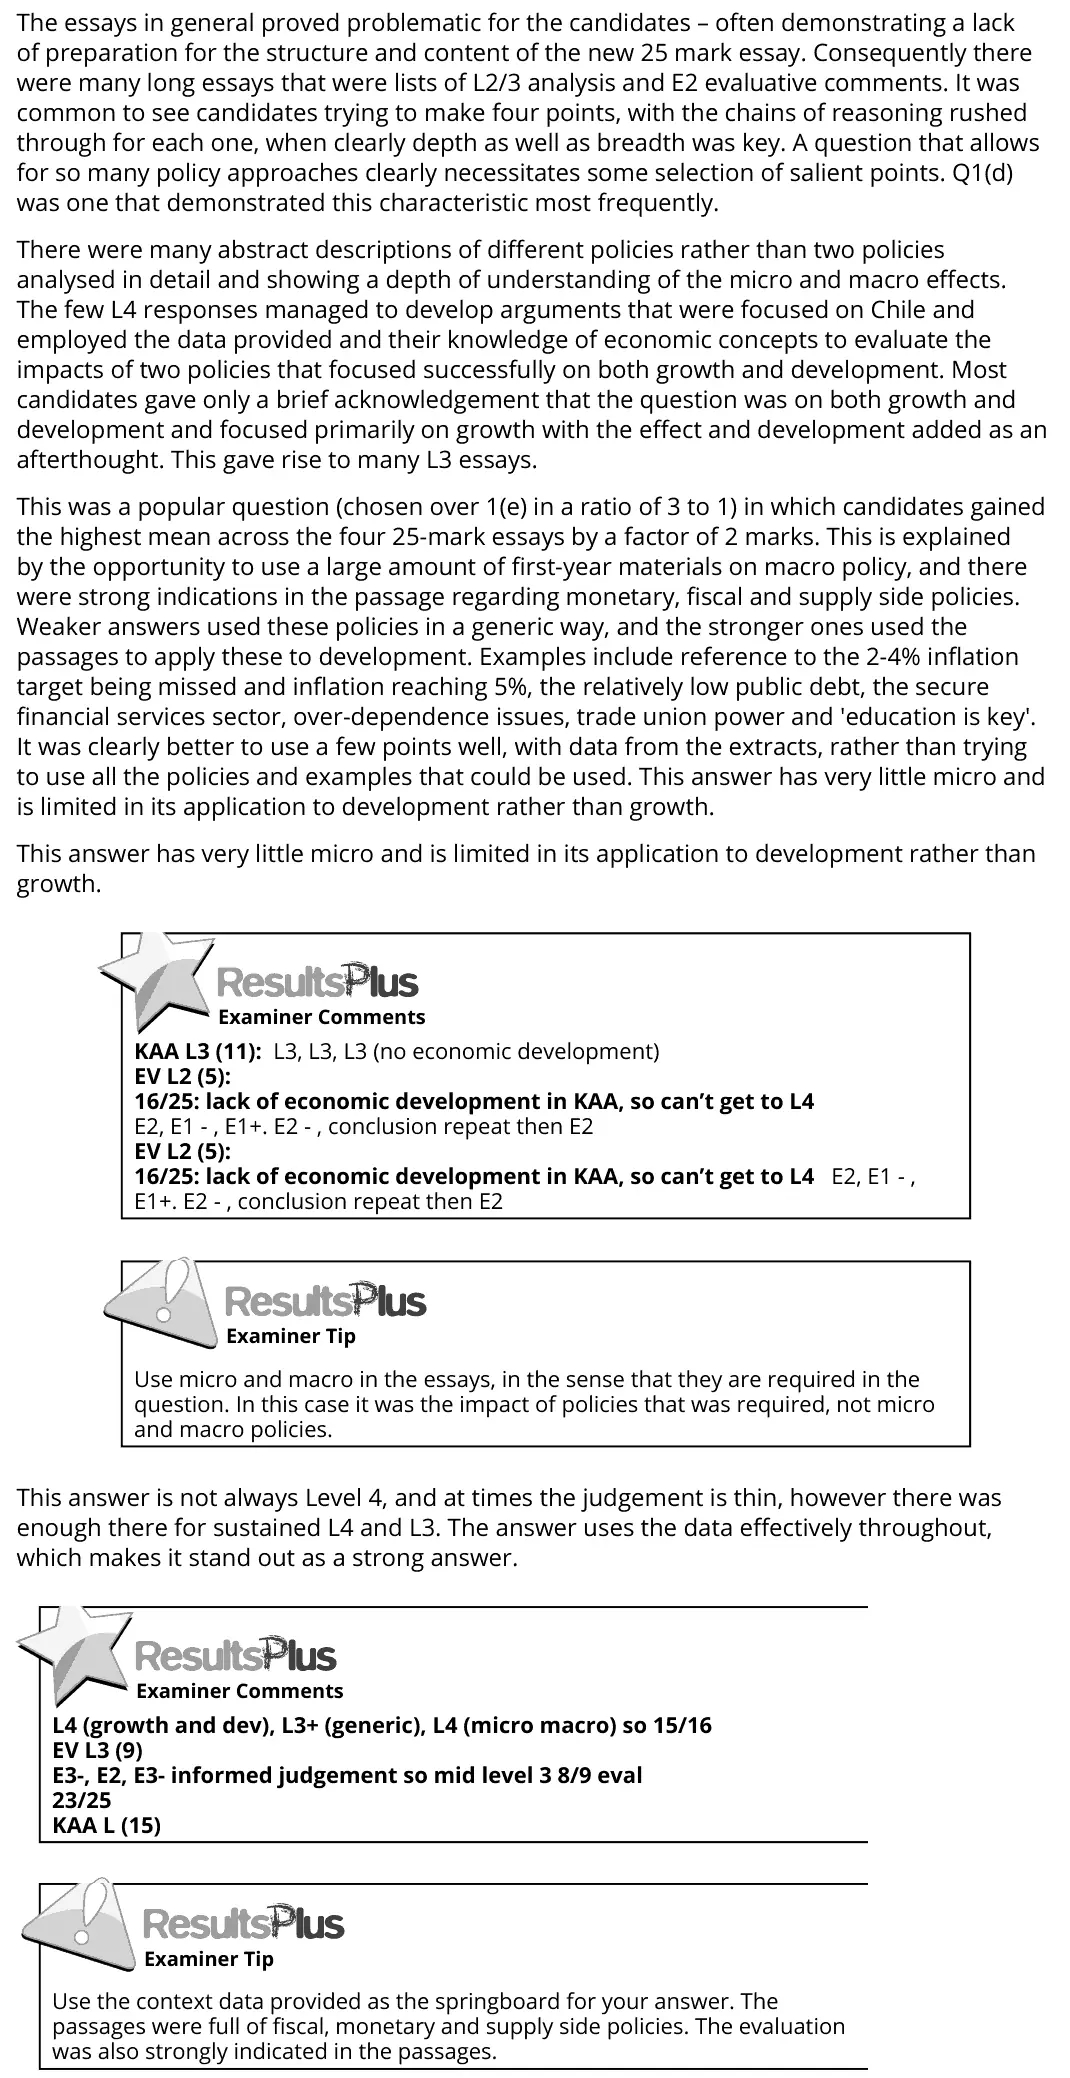
The essays in general proved problematic for the candidates – often demonstrating a lack of preparation for the structure and content of the new 25 mark essay. Consequently there were many long essays that were lists of L2/3 analysis and E2 evaluative comments. It was common to see candidates trying to make four points, with the chains of reasoning rushed through for each one, when clearly depth as well as breadth was key. A question that allows for so many policy approaches clearly necessitates some selection of salient points. Q1(d) was one that demonstrated this characteristic most frequently. There were many abstract descriptions of different policies rather than two policies analysed in detail and showing a depth of understanding of the micro and macro effects. The few L4 responses managed to develop arguments that were focused on Chile and employed the data provided and their knowledge of economic concepts to evaluate the impacts of two policies that focused successfully on both growth and development. Most candidates gave only a brief acknowledgement that the question was on both growth and development and focused primarily on growth with the effect and development added as an afterthought. This gave rise to many L3 essays. This was a popular question (chosen over 1(e) in a ratio of 3 to 1) in which candidates gained the highest mean across the four 25-mark essays by a factor of 2 marks. This is explained by the opportunity to use a large amount of first-year materials on macro policy, and there were strong indications in the passage regarding monetary, fiscal and supply side policies. Weaker answers used these policies in a generic way, and the stronger ones used the passages to apply these to development. Examples include reference to the 2-4% inflation target being missed and inflation reaching 5%, the relatively low public debt, the secure financial services sector, over-dependence issues, trade union power and 'education is key'. It was clearly better to use a few points well, with data from the extracts, rather than trying to use all the policies and examples that could be used. This answer has very little micro and is limited in its application to development rather than growth. This answer has very little micro and is limited in its application to development rather than growth. This answer is not always Level 4, and at times the judgement is thin, however there was enough there for sustained L4 and L3. The answer uses the data effectively throughout, which makes it stand out as a strong answer. KAA L3 (11): L3, L3, L3 (no economic development) EV L2 (5): 16/25: lack of economic development in KAA, so can’t get to L4 E2, E1 - , E1+. E2 - , conclusion repeat then E2 EV L2 (5): 16/25: lack of economic development in KAA, so can’t get to L4 E2, E1 - , E1+. E2 - , conclusion repeat then E2 Use micro and macro in the essays, in the sense that they are required in the question. In this case it was the impact of policies that was required, not micro and macro policies. L4 (growth and dev), L3+ (generic), L4 (micro macro) so 15/16 EV L3 (9) E3-, E2, E3- informed judgement so mid level 3 8/9 eval 23/25 KAA L (15) Use the context data provided as the springboard for your answer. The passages were full of fiscal, monetary and supply side policies. The evaluation was also strongly indicated in the passages.
Notes from the mark scheme and report
Level 4 needs effects on both growth and development and micro and macro effects
two policies analysed in depth beat a list of many
most answers treated development as an afterthought
evaluate with conflicts e.g. lower interest rates and inflation
Work with an Edexcel economics tutor
Essays stuck in Level 2, or losing the easy marks in Section A? Book a trial session with Lianne, a former Edexcel examiner.