Diagram questions

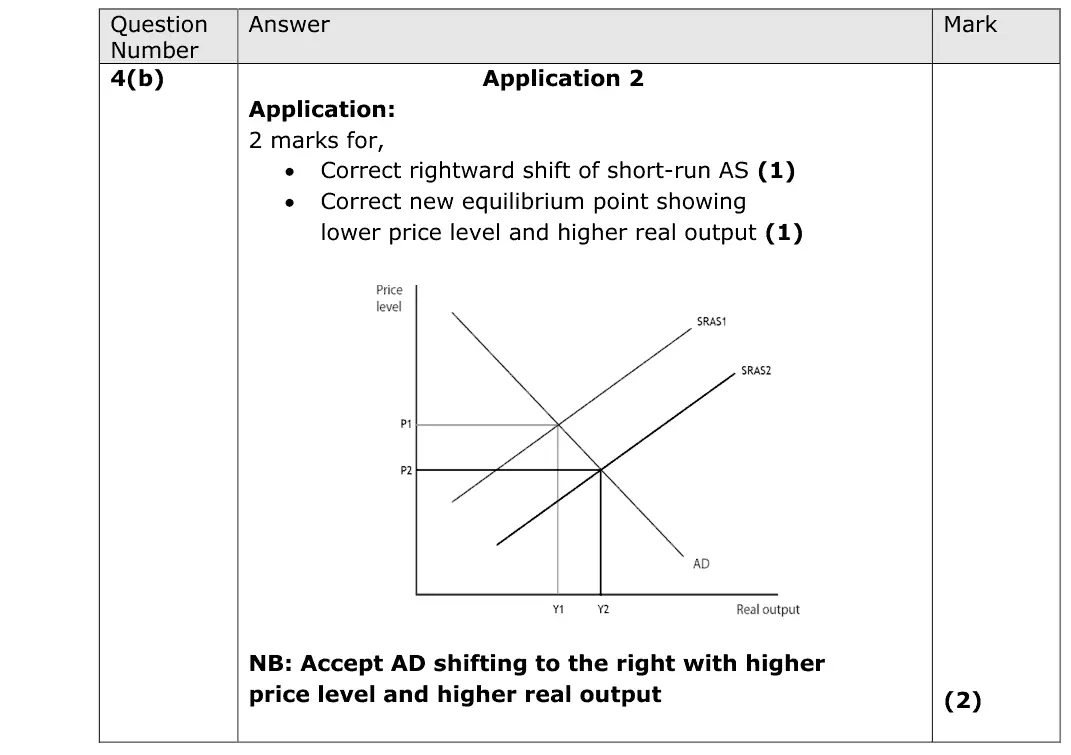
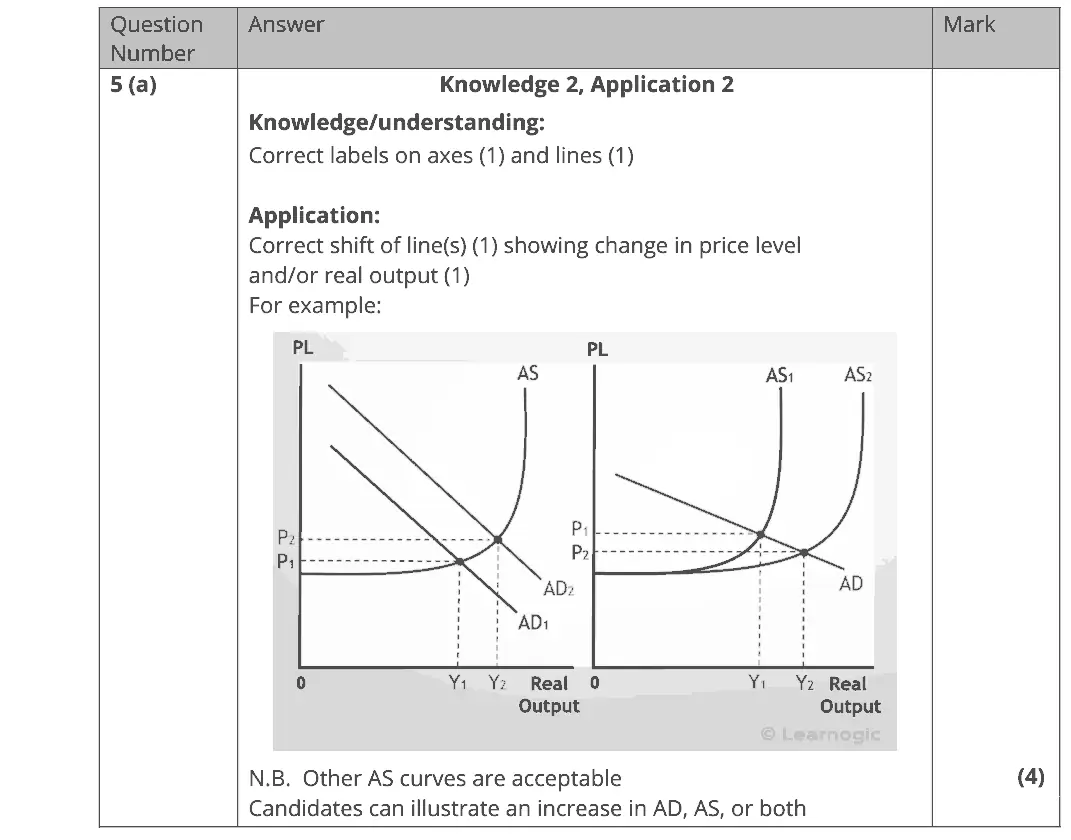
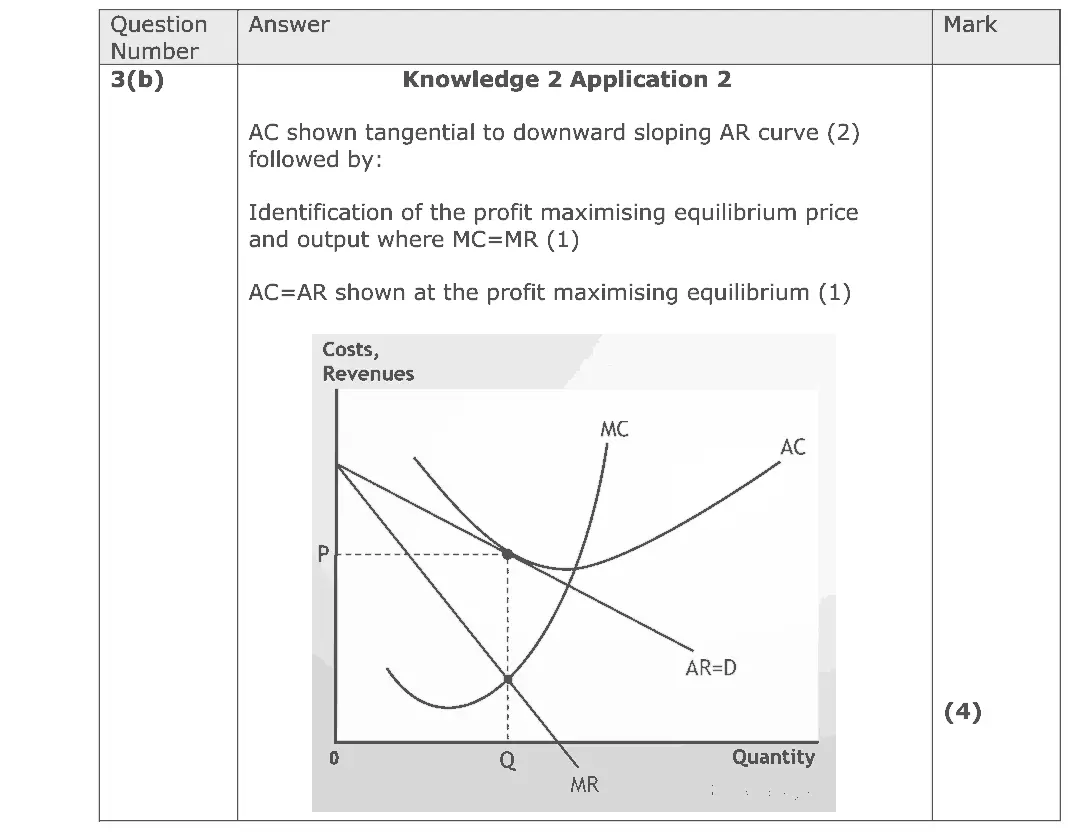
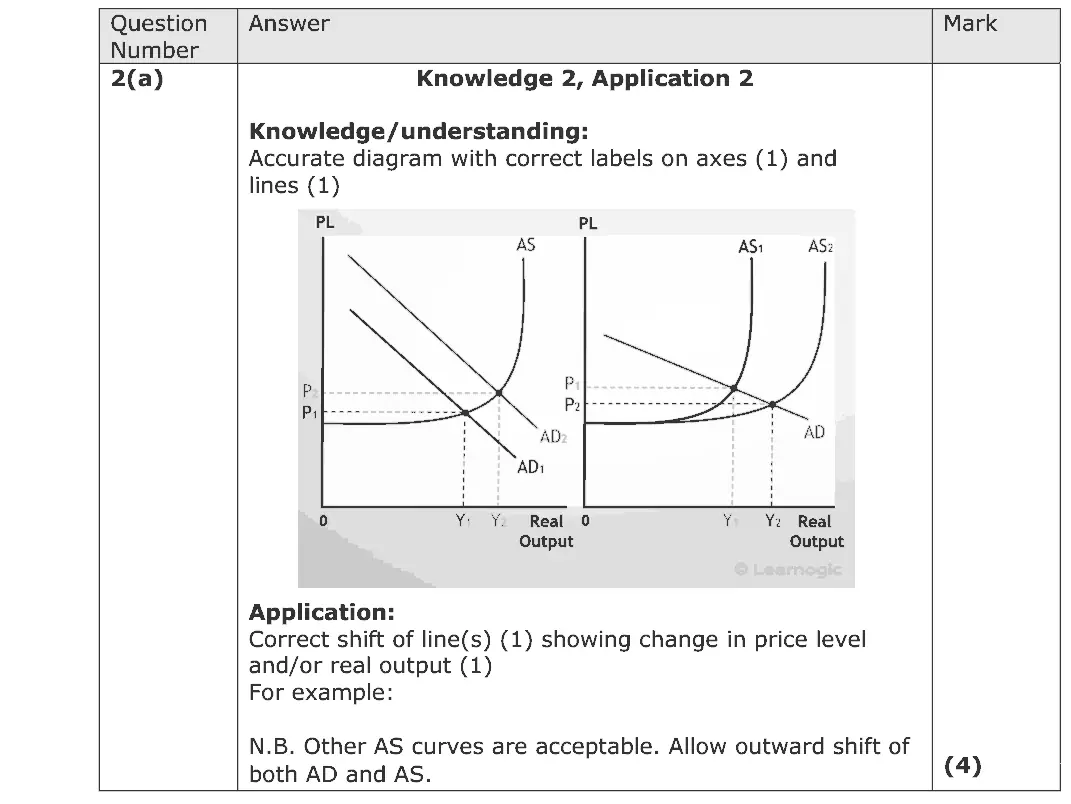
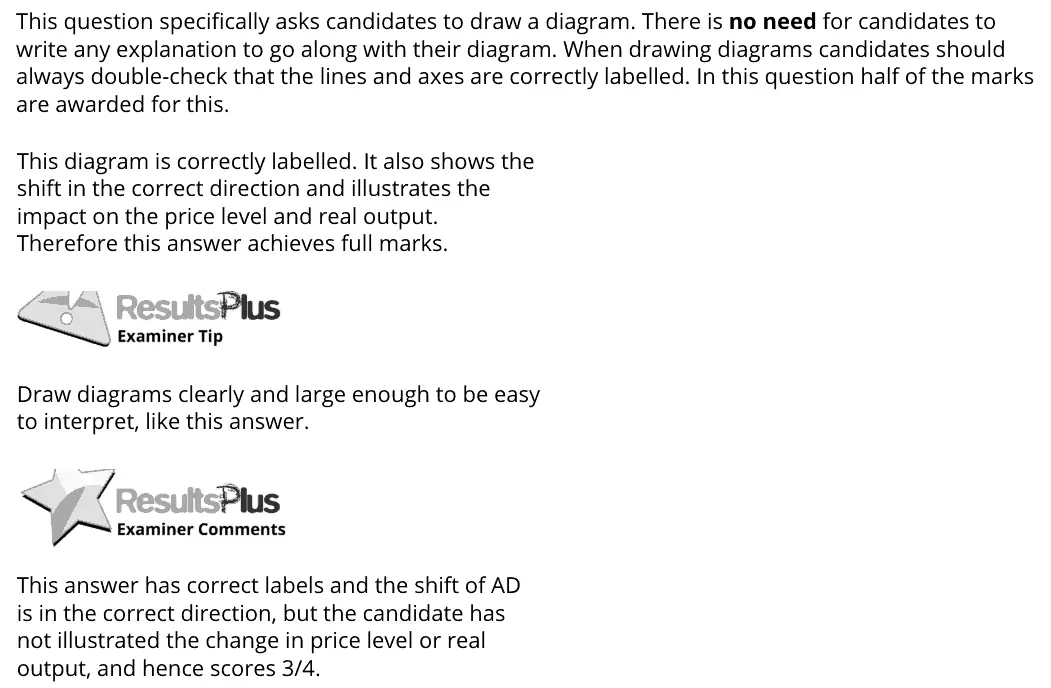
Questions that ask you to draw or complete a diagram, with the mark scheme's own diagram behind the button. Labelled axes, curves and equilibria each earn a mark. 43 questions.

Other types: Multiple-choice questions · Definition questions · Calculation questions · Short explain questions (2–6 marks) · 8- to 15-mark responses · 20- and 25-mark essays · Data-response questions

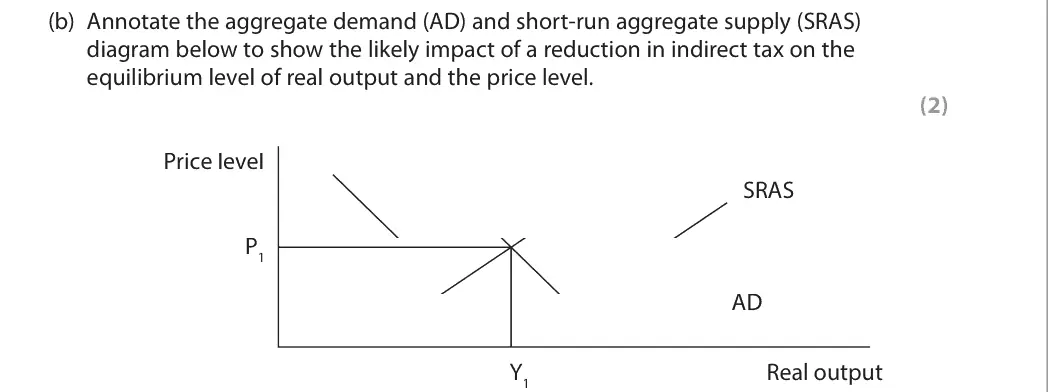
June 2025 · AS Paper 2 · Q4(b) 2 marks AO2=2 Diagram aggregate supplynational income and the multiplier
Data and extracts for question 44 In 2023 the UK government reduced indirect tax on certain goods and services.
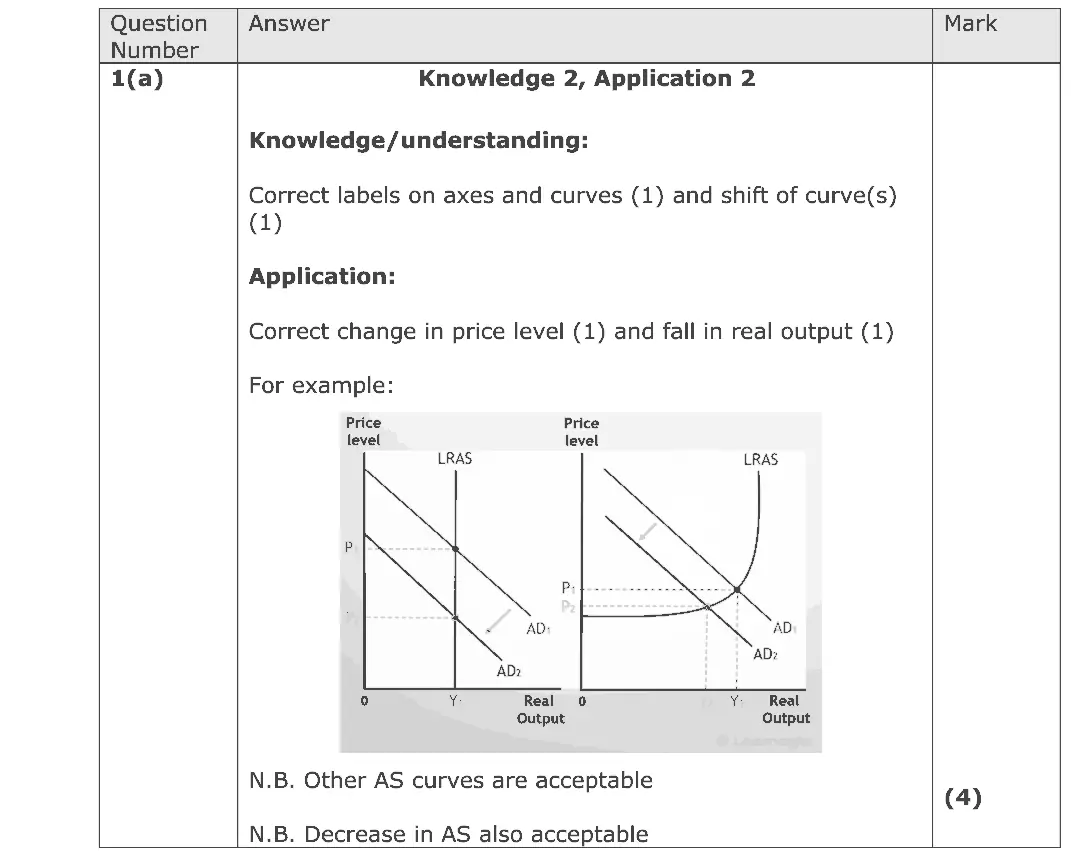
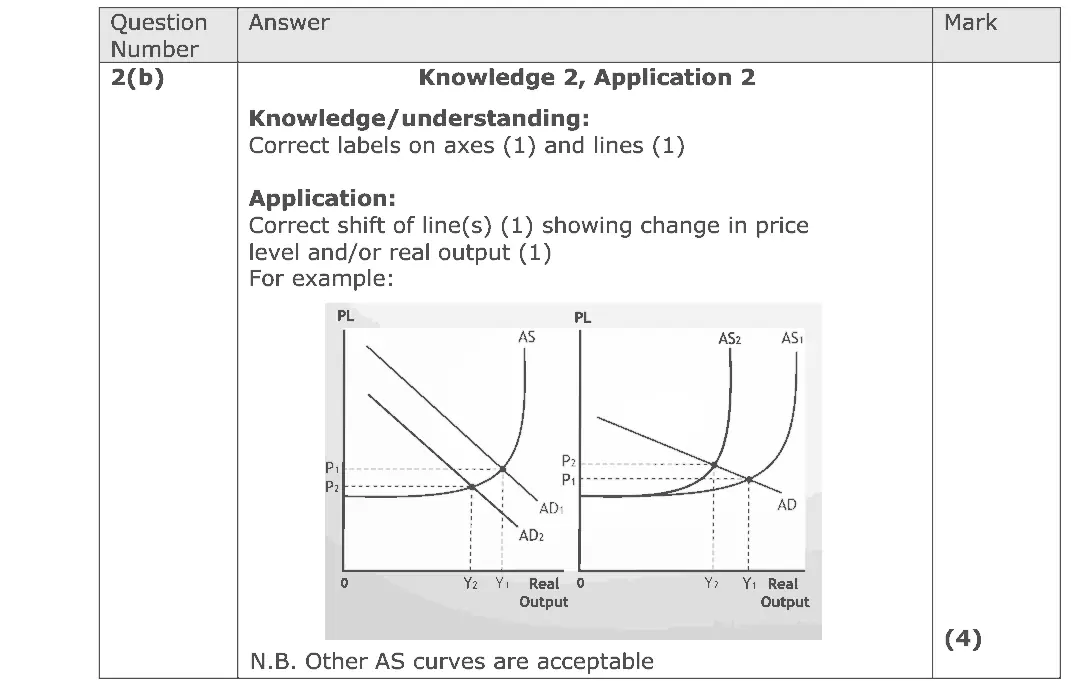
(b) Annotate the aggregate demand (AD) and short-run aggregate supply (SRAS) diagram below to show the likely impact of a reduction in indirect tax on the equilibrium level of real output and the price level. (2) Price level SRAS P1 AD Y1 Real output
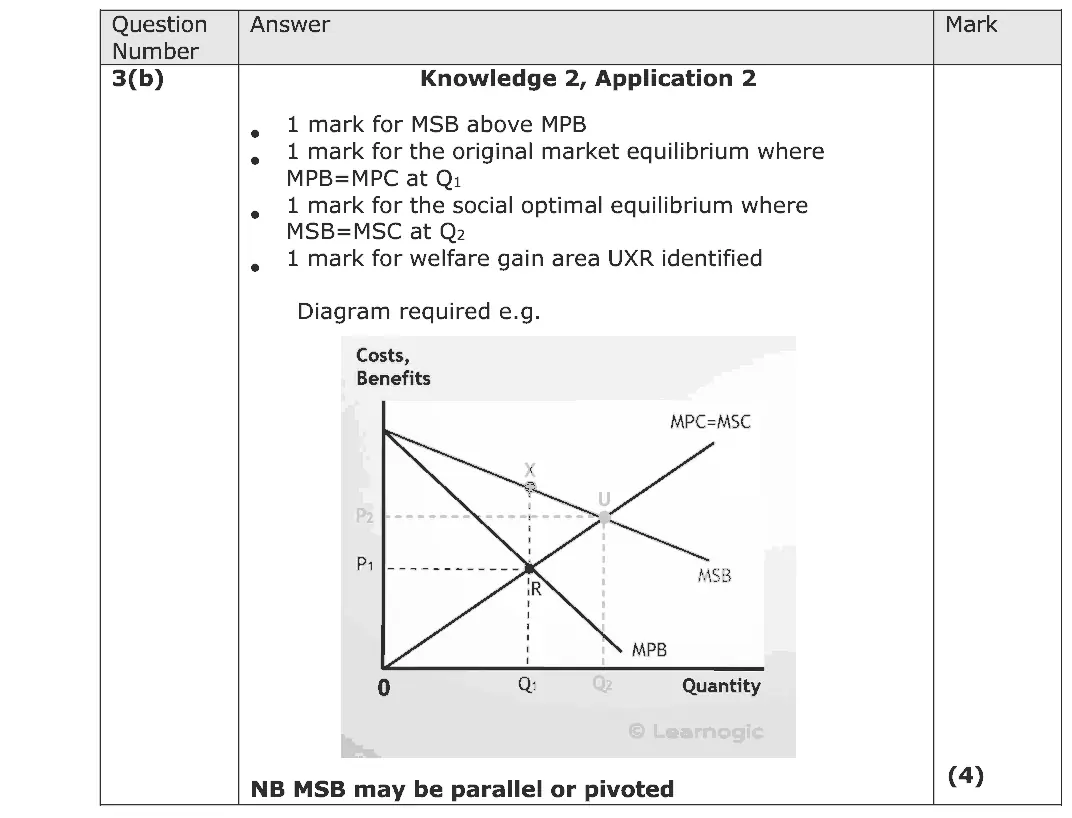
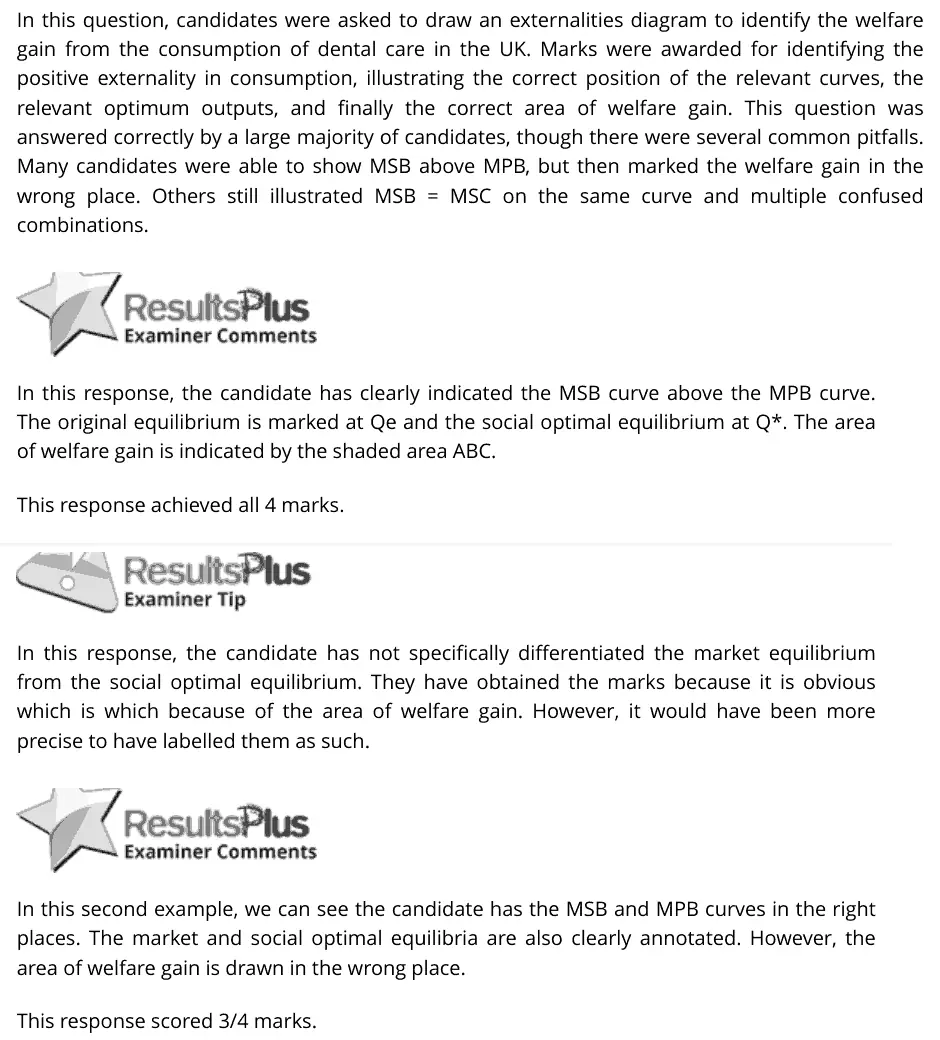
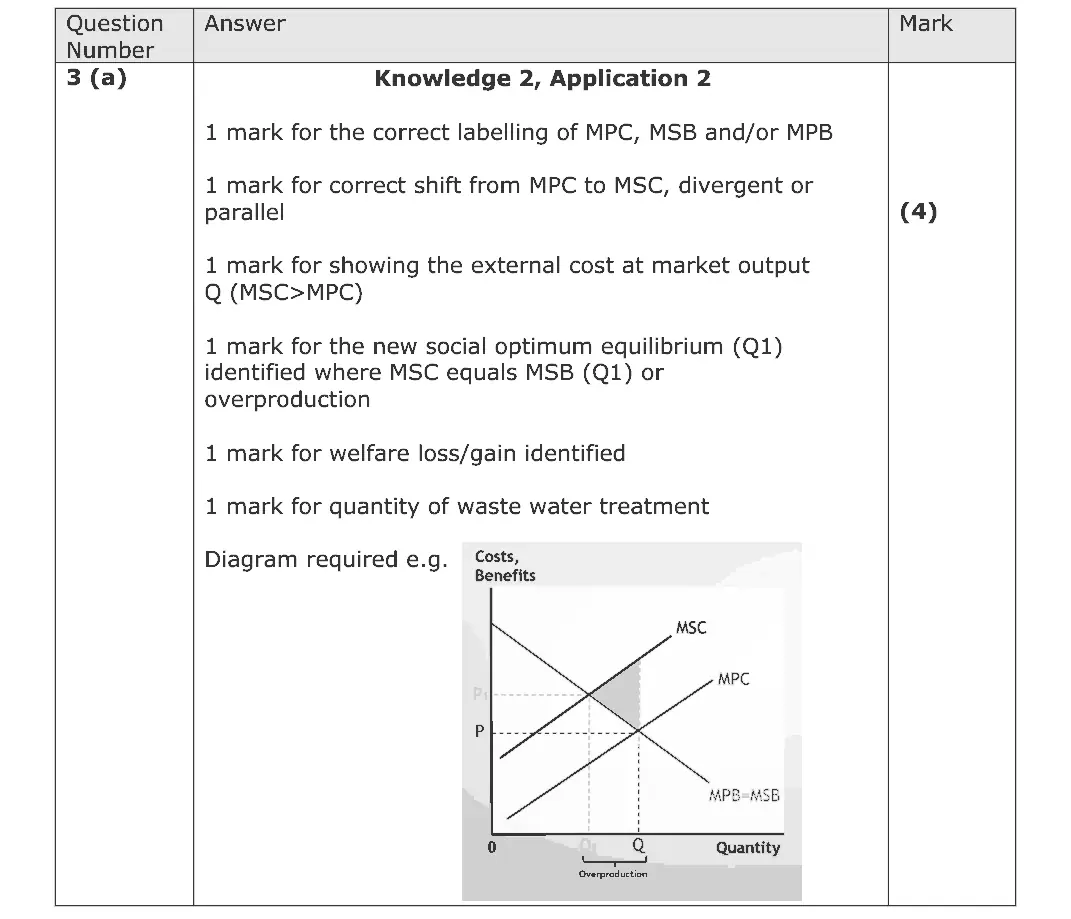
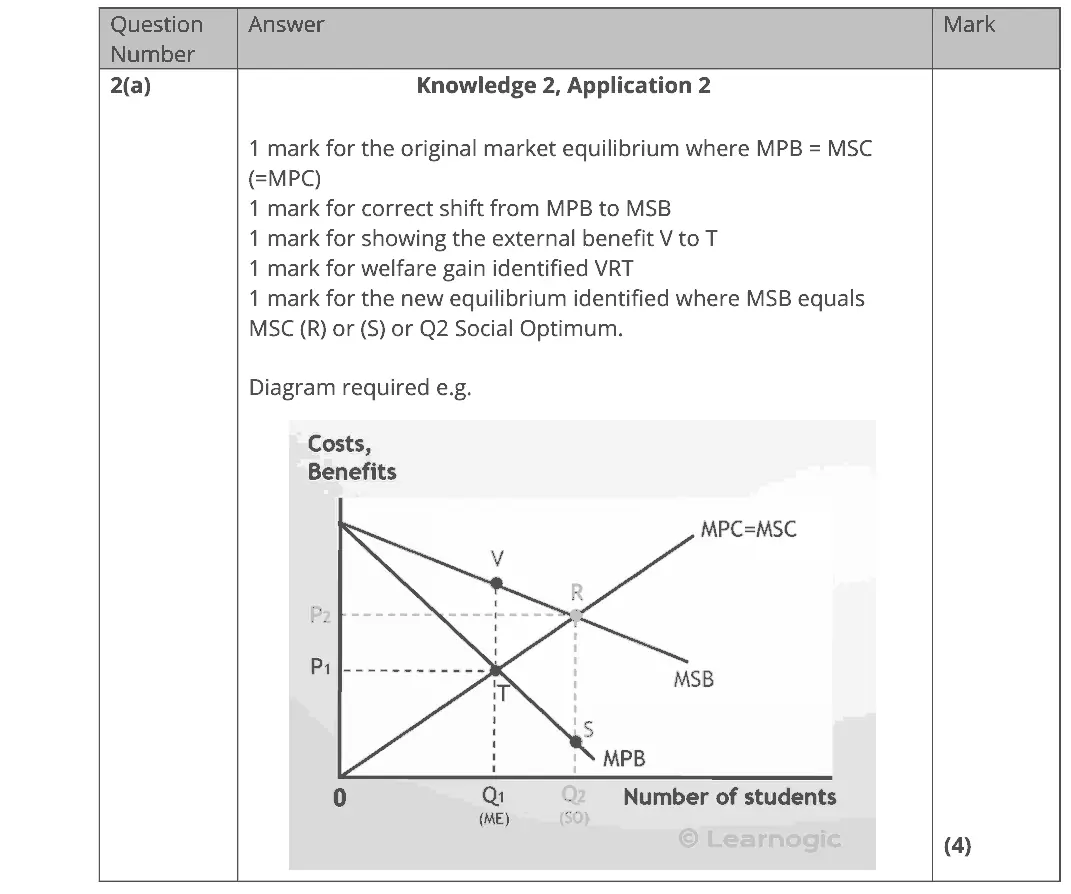
June 2025 · Paper 1 · Q3(b) 4 marks AO1=2, AO2=2 Diagram externalities
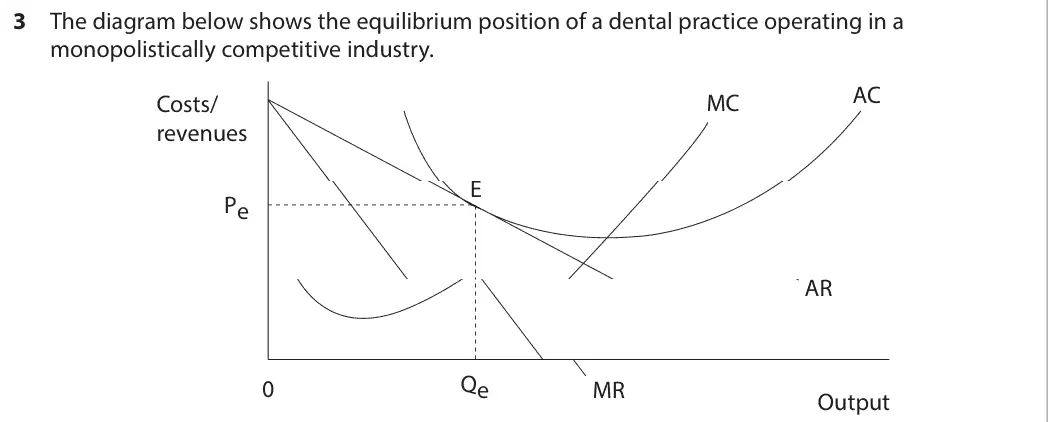
Data and extracts for question 33 The diagram below shows the equilibrium position of a dental practice operating in a monopolistically competitive industry. AC Costs/ MC revenues E Pe AR Qe 0 MR Output
(b) The government subsidises dental care in the UK through the National Health Service (NHS). There has been a large decrease in the work carried out by NHS dentists. Up to 90% of practices are not accepting new NHS patients. (Source: adapted from https://www.theguardian.com/society/2023/jul/14/ mps-demand-urgent-reform-nhs-dental-services-report) Draw an externalities diagram to identify the welfare gain area from the consumption of dental care in the UK. (4)
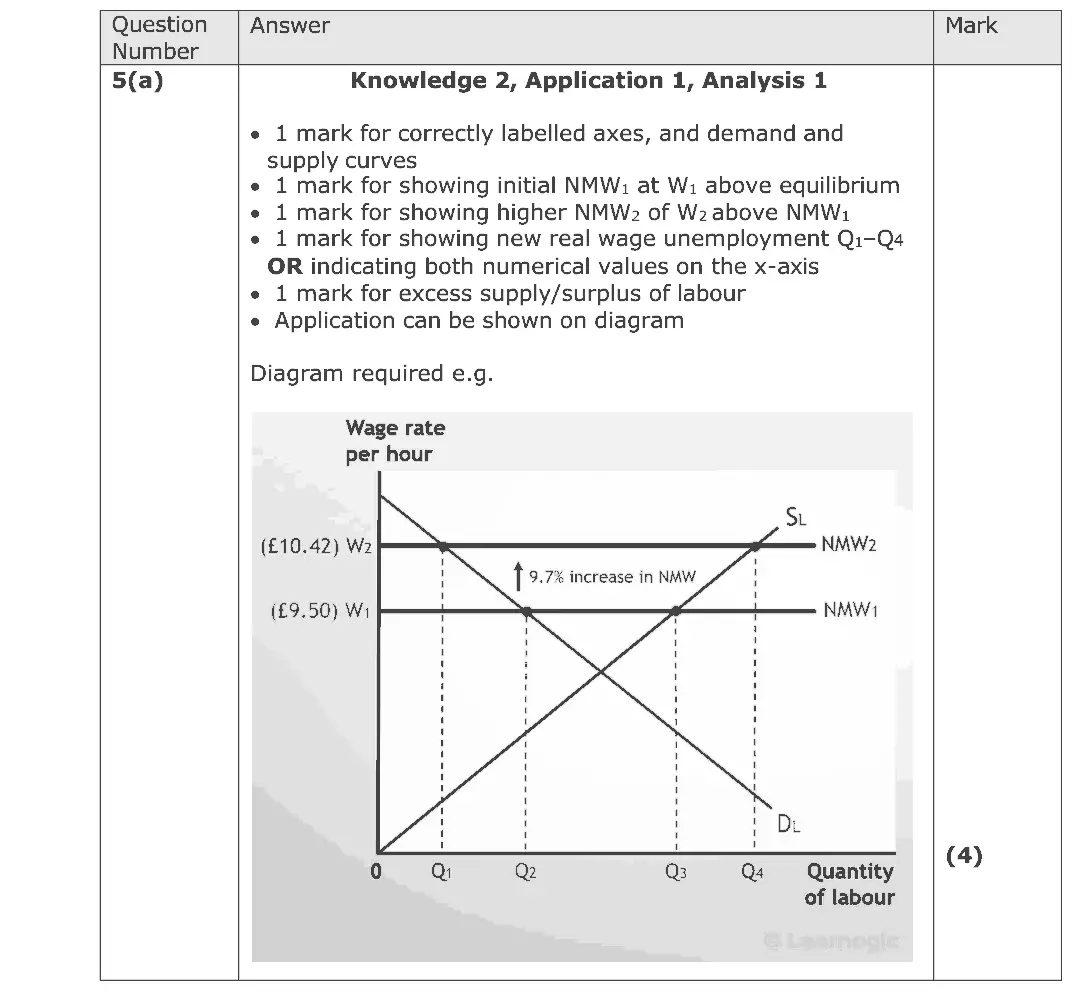
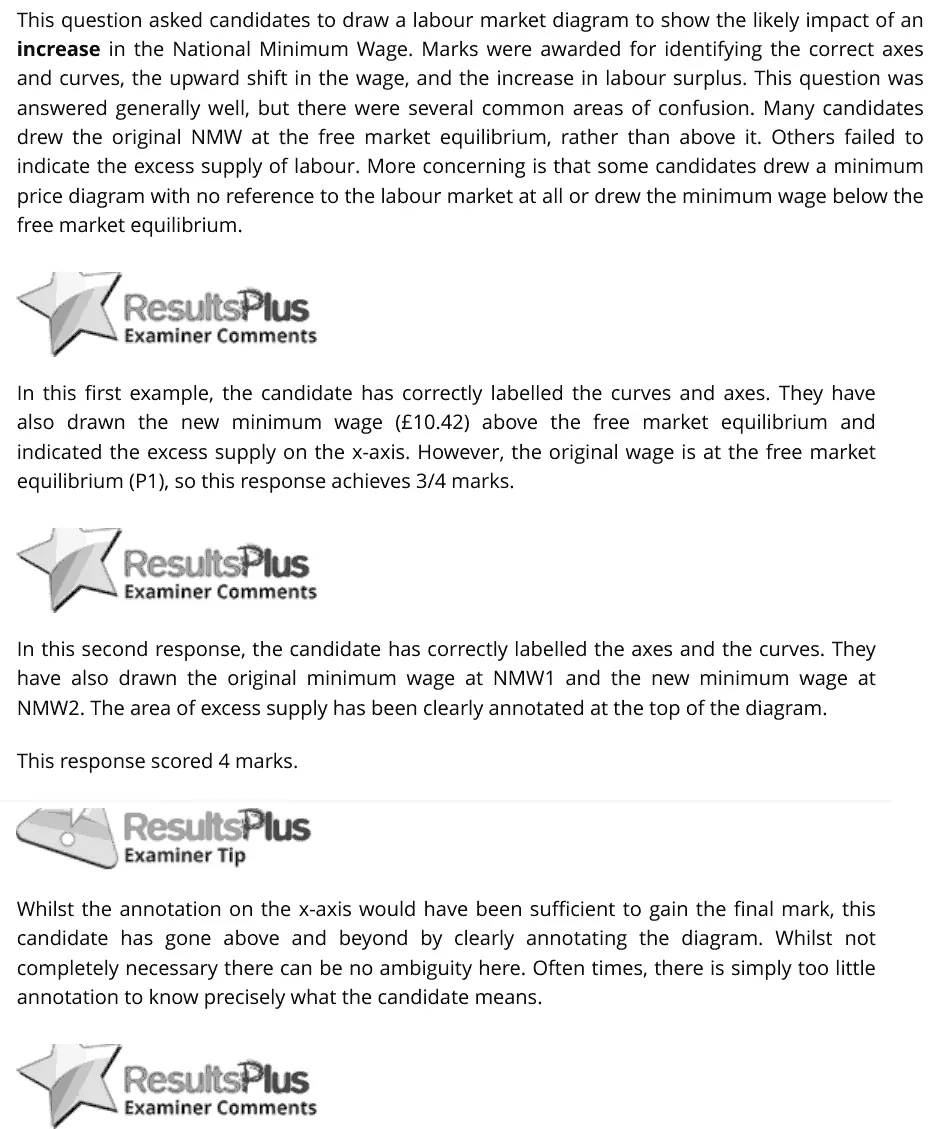
June 2025 · Paper 1 · Q5(a) 4 marks AO1=2, AO2=1, AO3=1 Diagram labour market
Data and extracts for question 55 The National Minimum Wage for people over 23 rose by 9.7% to £10.42 in April 2023. The industry most affected is hospitality. (Source: adapted from https://www.gov.uk/government/publications/the-national- minimum-wage-in-2023/the-national-minimum-wage-in-2023)
(a) Draw a labour market diagram to show the likely impact of the increase in the National Minimum Wage for hospitality employees. (4)
June 2025 · Paper 3 · Q2(a) 5 marks AO1=2, AO2=2, AO3=1 Diagram Hard indirect taxes and subsidies
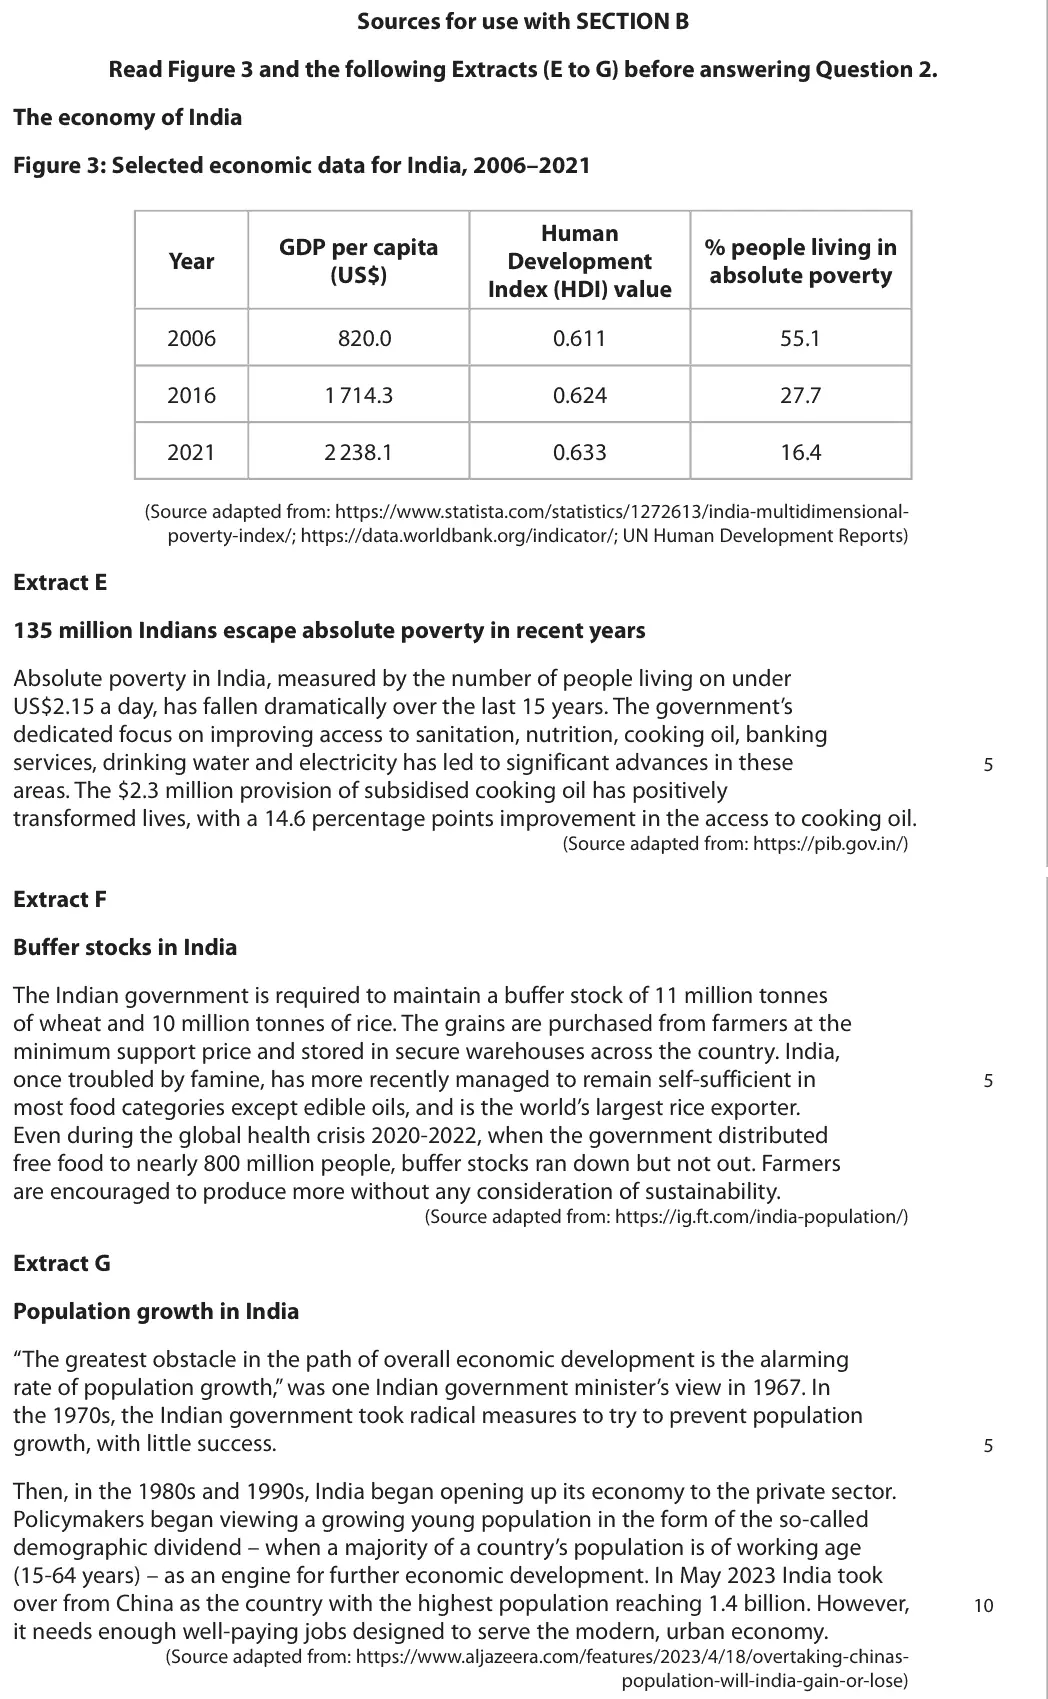
Data and extracts for question 2Sources for use with SECTION B Read Figure 3 and the following Extracts (E to G) before answering Question 2. The economy of India Figure 3: Selected economic data for India, 2006–2021 Human GDP per capita % people living in Year Development (US$) absolute poverty Index (HDI) value 2006 820.0 0.611 55.1 2016 1 714.3 0.624 27.7 2021 2 238.1 0.633 16.4 (Source adapted from: https://www.statista.com/statistics/1272613/india-multidimensional- poverty-index/; https://data.worldbank.org/indicator/; UN Human Development Reports) Extract E 135 million Indians escape absolute poverty in recent years Absolute poverty in India, measured by the number of people living on under US$2.15 a day, has fallen dramatically over the last 15 years. The government’s dedicated focus on improving access to sanitation, nutrition, cooking oil, banking services, drinking water and electricity has led to significant advances in these 5 areas. The $2.3 million provision of subsidised cooking oil has positively transformed lives, with a 14.6 percentage points improvement in the access to cooking oil. (Source adapted from: https://pib.gov.in/) Extract F Buffer stocks in India The Indian government is required to maintain a buffer stock of 11 million tonnes of wheat and 10 million tonnes of rice. The grains are purchased from farmers at the minimum support price and stored in secure warehouses across the country. India, once troubled by famine, has more recently managed to remain self-sufficient in 5 most food categories except edible oils, and is the world’s largest rice exporter. Even during the global health crisis 2020-2022, when the government distributed free food to nearly 800 million people, buffer stocks ran down but not out. Farmers are encouraged to produce more without any consideration of sustainability. (Source adapted from: https://ig.ft.com/india-population/) Extract G Population growth in India “The greatest obstacle in the path of overall economic development is the alarming rate of population growth,” was one Indian government minister’s view in 1967. In the 1970s, the Indian government took radical measures to try to prevent population growth, with little success. 5 Then, in the 1980s and 1990s, India began opening up its economy to the private sector. Policymakers began viewing a growing young population in the form of the so-called demographic dividend – when a majority of a country’s population is of working age (15-64 years) – as an engine for further economic development. In May 2023 India took over from China as the country with the highest population reaching 1.4 billion. However, 10 it needs enough well-paying jobs designed to serve the modern, urban economy. (Source adapted from: https://www.aljazeera.com/features/2023/4/18/overtaking-chinas- population-will-india-gain-or-lose)
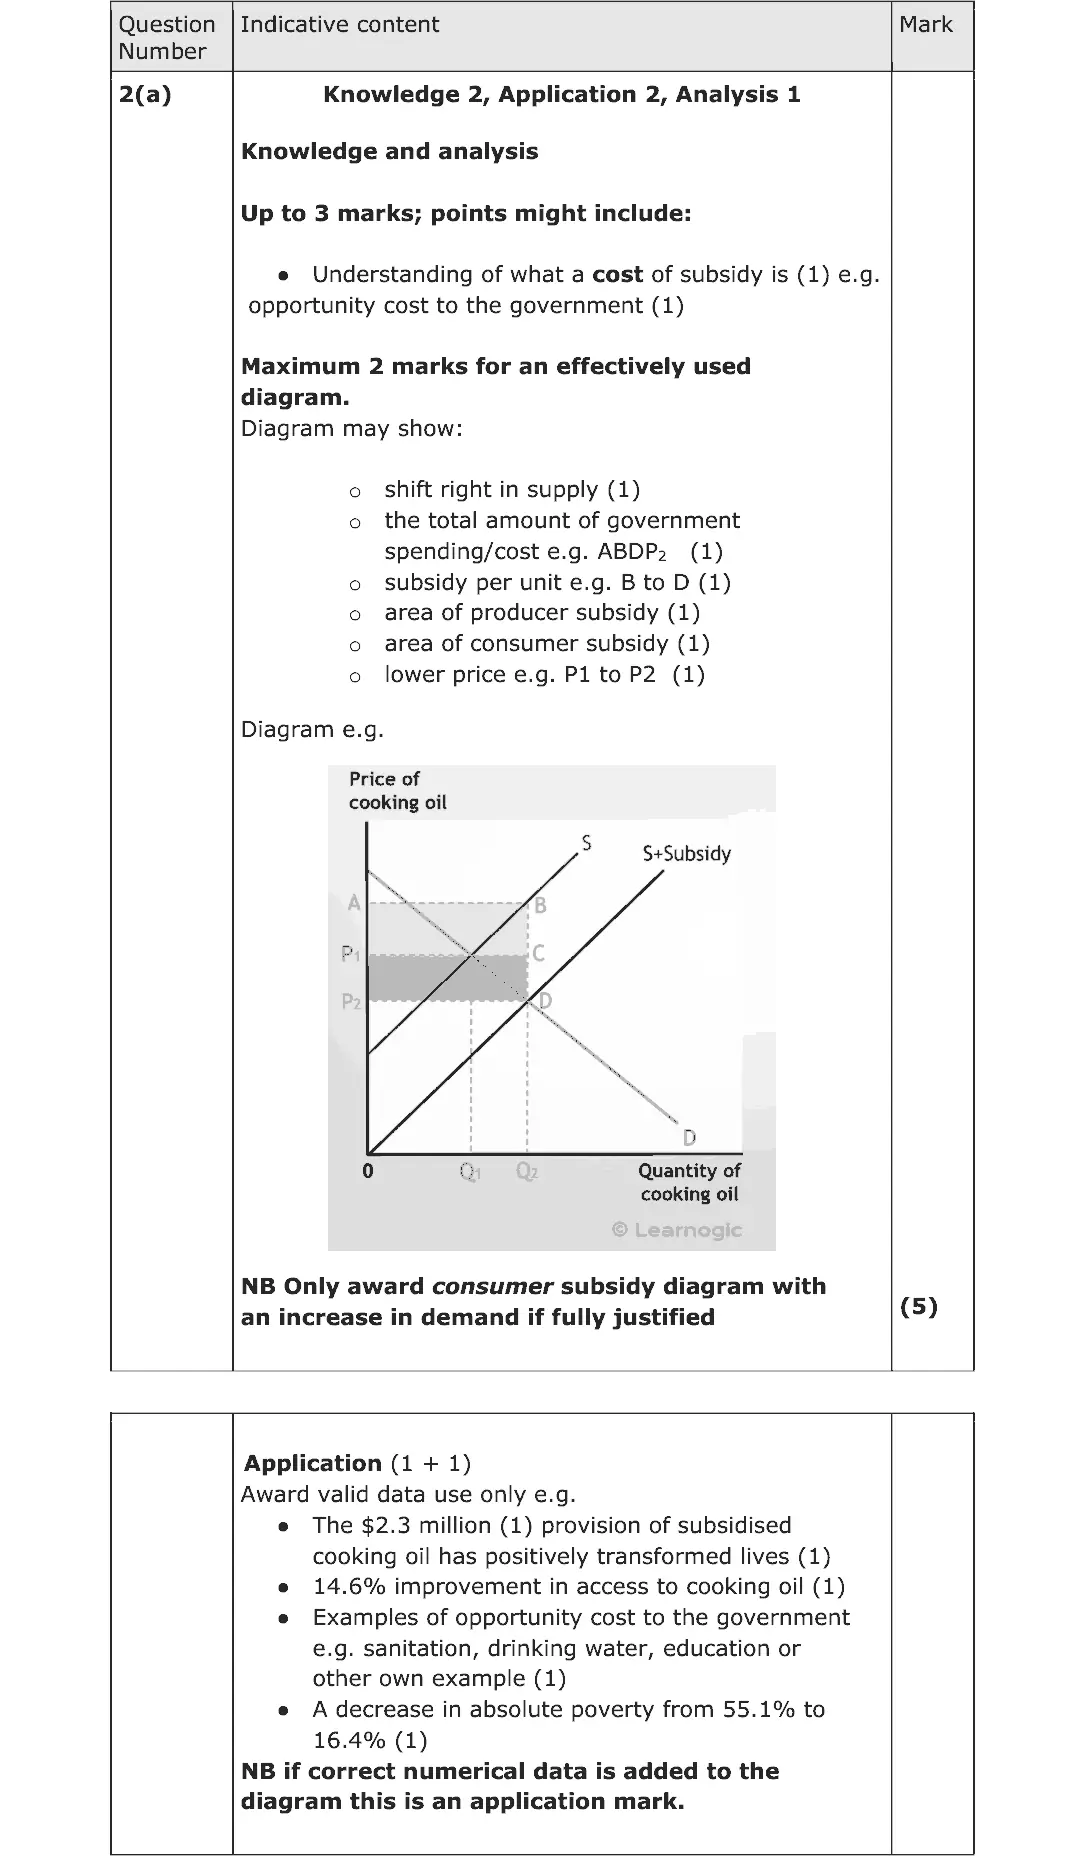
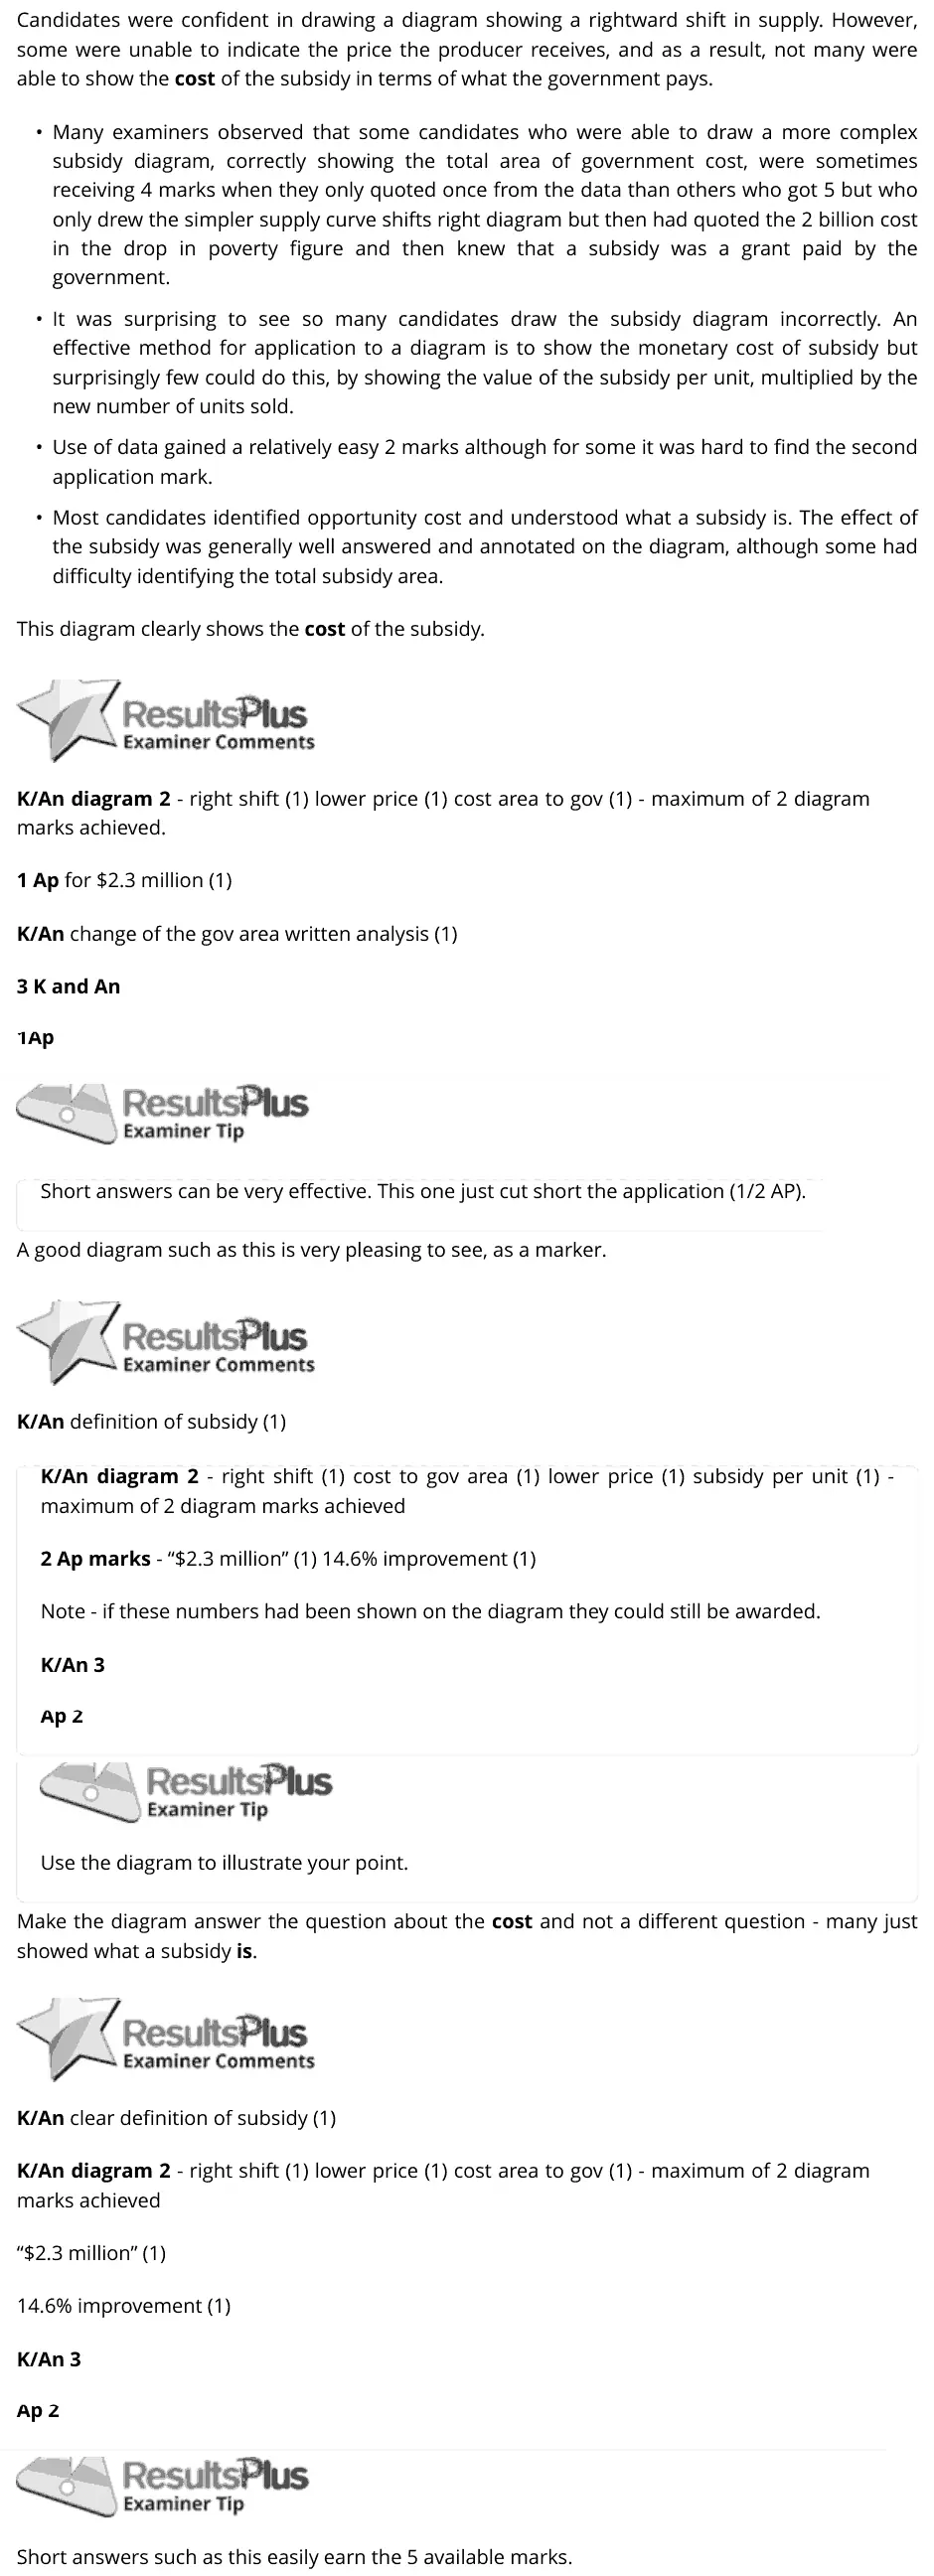
(a) Using a demand and supply diagram, explain the cost of a subsidy on the market for cooking oil to the Indian government (Extract E, line 6). (5)
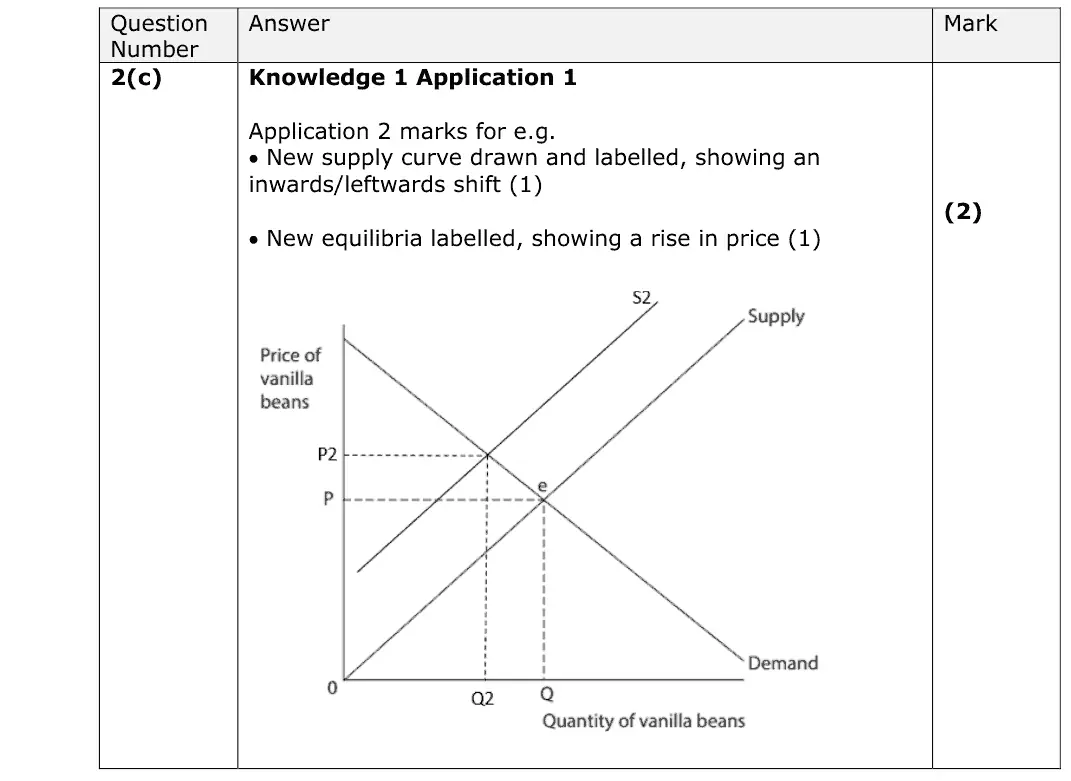
June 2024 · AS Paper 1 · Q2(c) 2 marks AO1=1, AO2=1 Diagram supply and demand
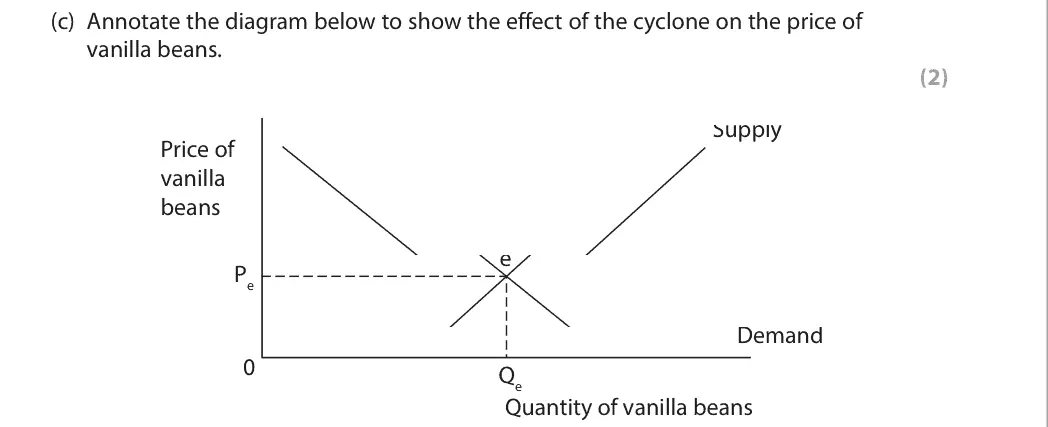
Data and extracts for question 22 Vanilla bean prices increased to a record $600 a kilogramme in 2018 after a cyclone hit the tropical island of Madagascar, damaging crops. Madagascar supplies 75% to 80% of the world vanilla bean market.
(c) Annotate the diagram below to show the effect of the cyclone on the price of vanilla beans. (2) Supply Price of vanilla beans e Pe Demand 0 Qe Quantity of vanilla beans
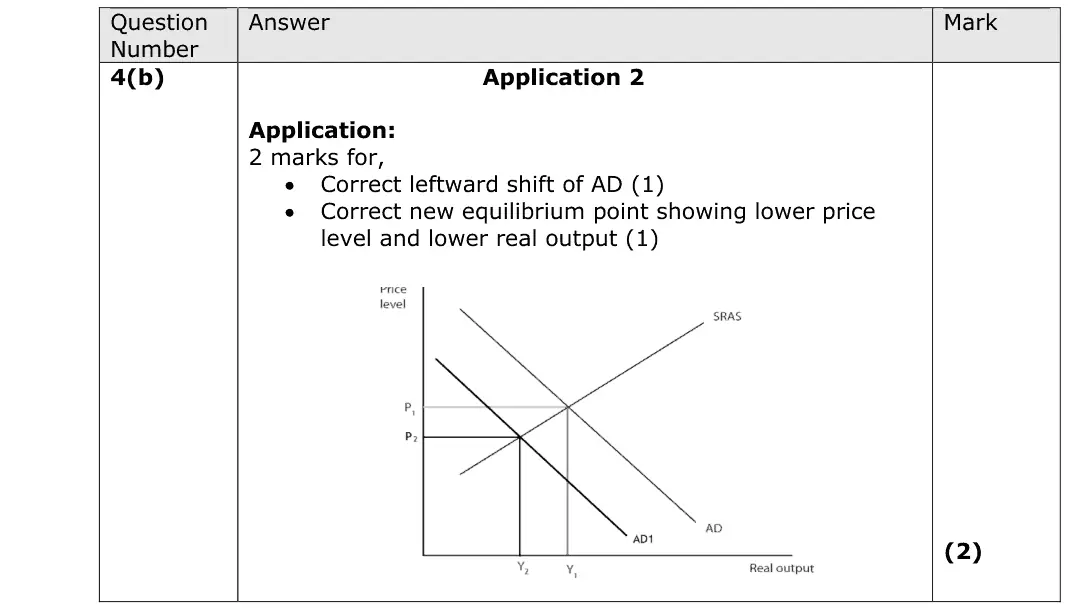
June 2024 · AS Paper 2 · Q4(b) 2 marks AO2=2 Diagram national income and the multiplieraggregate demand
Data and extracts for question 44 Business investment fell by 0.5% between Quarter 3 2019 and Quarter 4 2019. (Source: adapted from https://www.ons.gov.uk)
(b) Annotate the aggregate demand (AD) and short-run aggregate supply (SRAS) diagram below to show the likely impact of a fall in business investment on the equilibrium level of real output and the price level. (2)
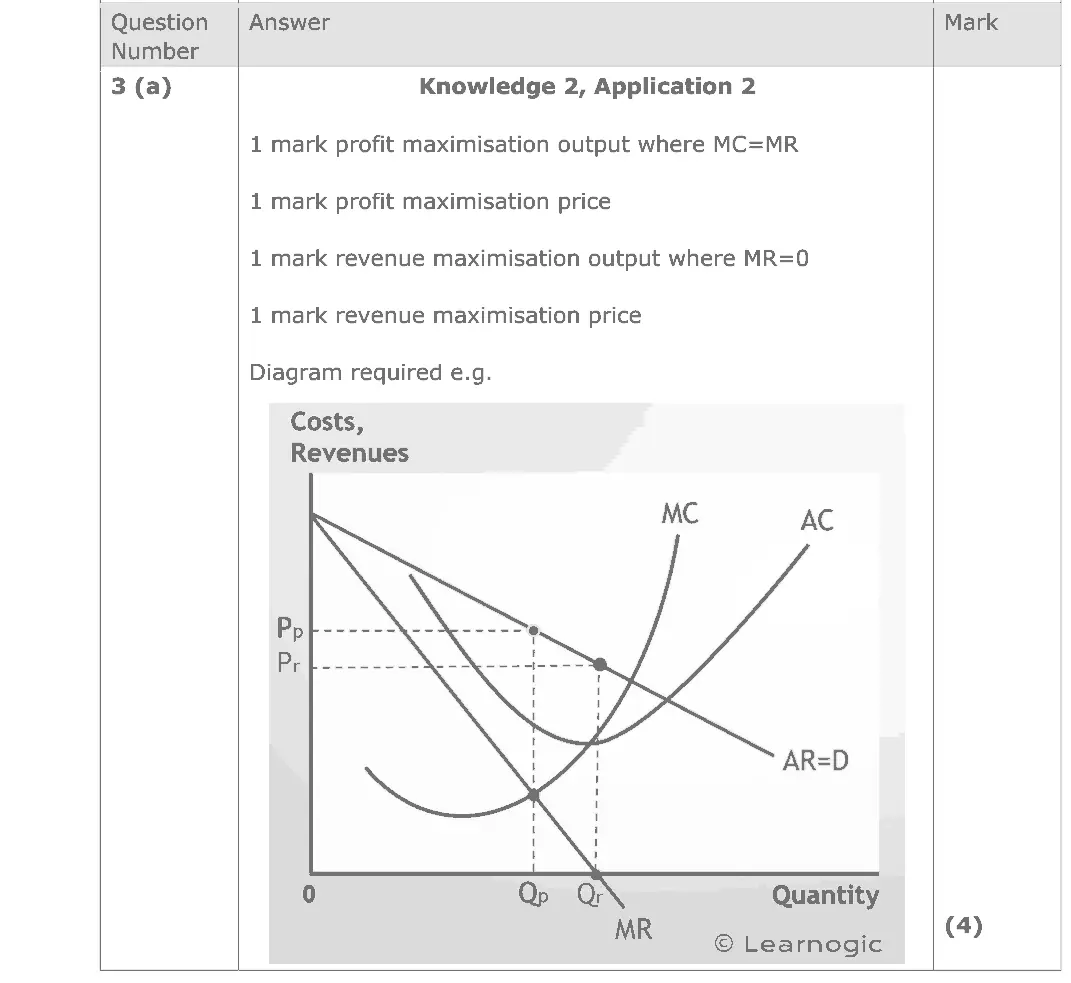
June 2024 · Paper 1 · Q3(a) 4 marks AO1=2, AO2=2 Diagram business growth and objectives
Data and extracts for question 33 Peloton is a firm which makes exercise bikes. Peloton’s objective is to prioritise selling fitness services rather than to achieve short-term profit maximisation. (Source adapted from: https://www.forbes.com/sites/shelleykohan/2022/01/26/ peloton-prioritizes-access-and-acquisition-over-profits/?sh=13d8ee474f40 )
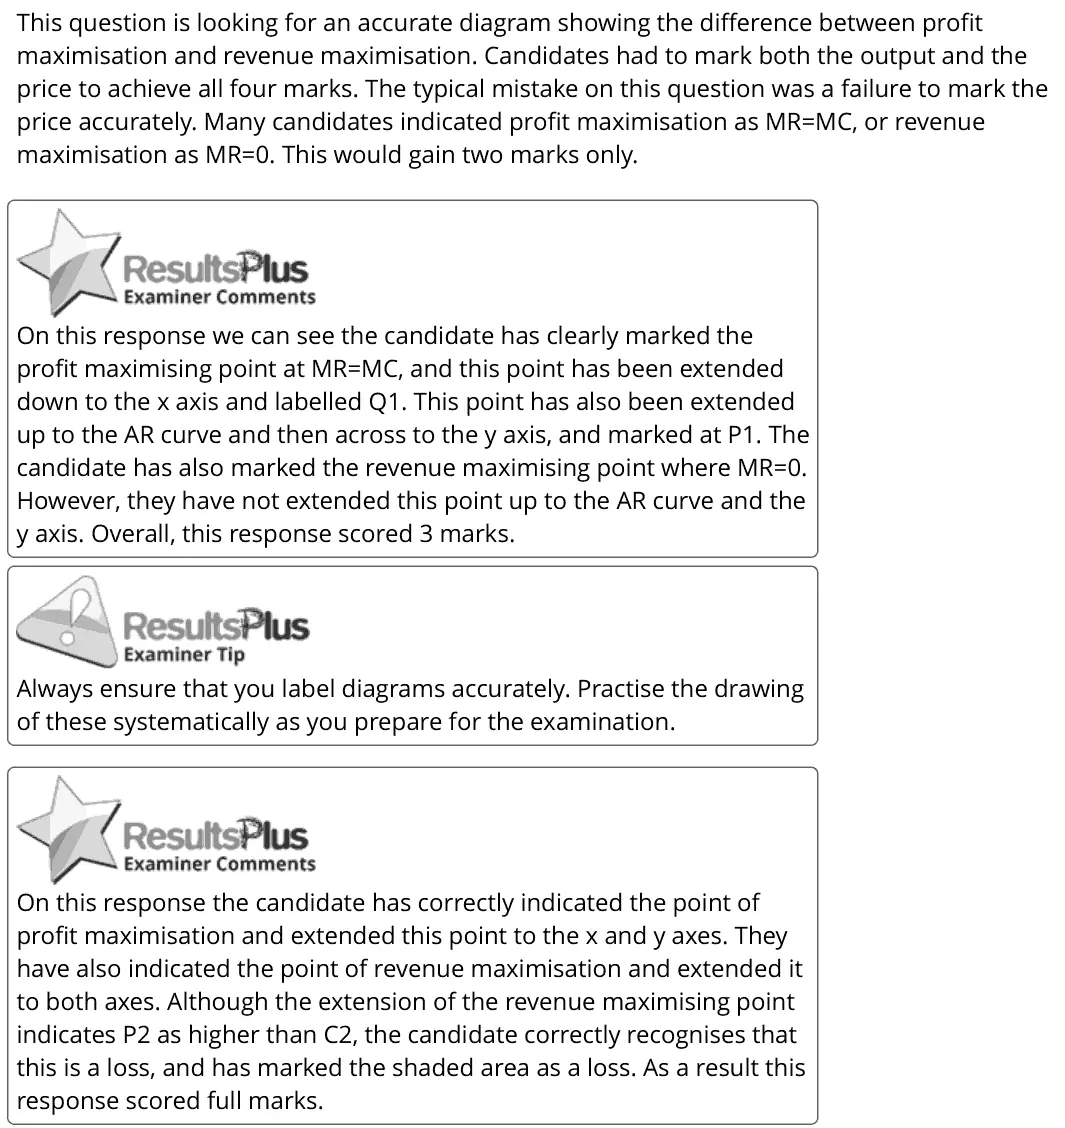
(a) Draw a cost and revenue diagram to illustrate the different business objectives: profit maximisation and revenue maximisation. (4)
June 2024 · Paper 1 · Q6(a) 5 marks AO1=1, AO2=1, AO3=3 Diagram supply and demand
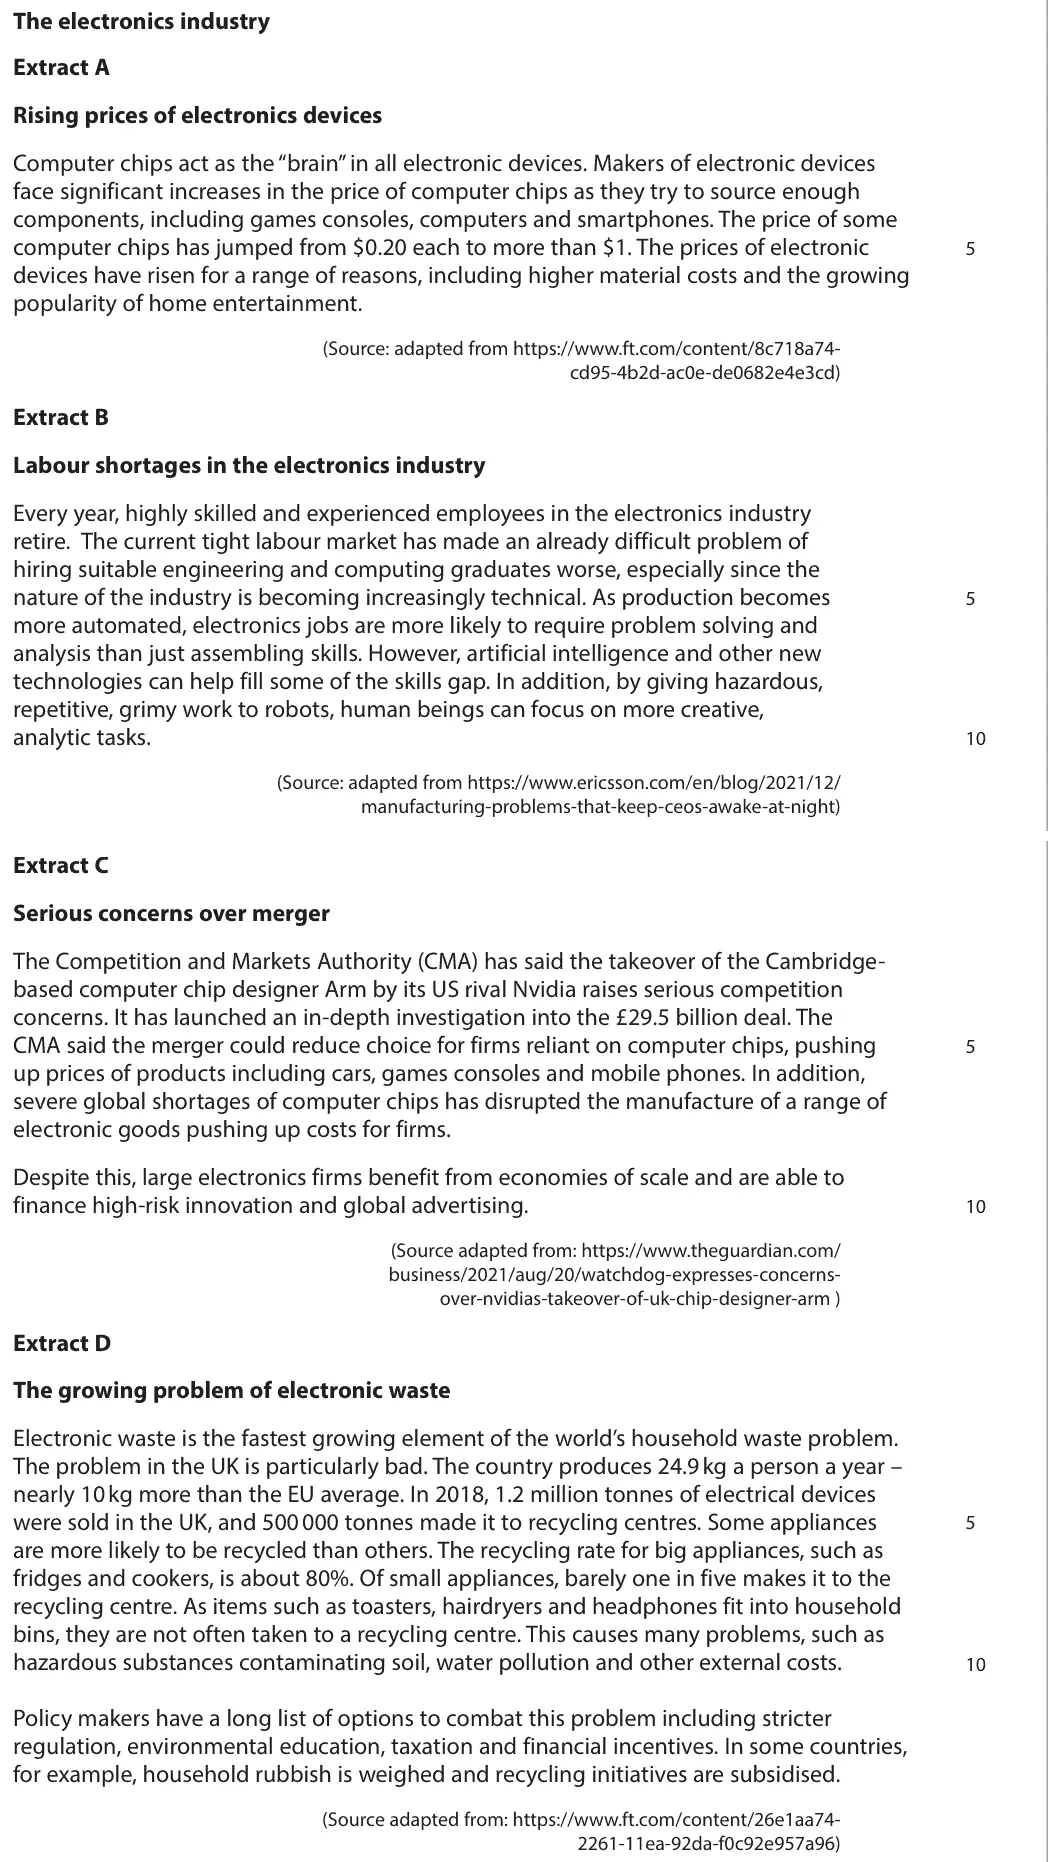
Data and extracts for question 6The electronics industry Extract A Rising prices of electronics devices Computer chips act as the “brain” in all electronic devices. Makers of electronic devices face significant increases in the price of computer chips as they try to source enough components, including games consoles, computers and smartphones. The price of some computer chips has jumped from $0.20 each to more than $1. The prices of electronic 5 devices have risen for a range of reasons, including higher material costs and the growing popularity of home entertainment. (Source: adapted from https://www.ft.com/content/8c718a74- cd95-4b2d-ac0e-de0682e4e3cd) Extract B Labour shortages in the electronics industry Every year, highly skilled and experienced employees in the electronics industry retire. The current tight labour market has made an already difficult problem of hiring suitable engineering and computing graduates worse, especially since the nature of the industry is becoming increasingly technical. As production becomes 5 more automated, electronics jobs are more likely to require problem solving and analysis than just assembling skills. However, artificial intelligence and other new technologies can help fill some of the skills gap. In addition, by giving hazardous, repetitive, grimy work to robots, human beings can focus on more creative, analytic tasks. 10 (Source: adapted from https://www.ericsson.com/en/blog/2021/12/ manufacturing-problems-that-keep-ceos-awake-at-night) Extract C Serious concerns over merger The Competition and Markets Authority (CMA) has said the takeover of the Cambridge- based computer chip designer Arm by its US rival Nvidia raises serious competition concerns. It has launched an in-depth investigation into the £29.5 billion deal. The CMA said the merger could reduce choice for firms reliant on computer chips, pushing 5 up prices of products including cars, games consoles and mobile phones. In addition, severe global shortages of computer chips has disrupted the manufacture of a range of electronic goods pushing up costs for firms. Despite this, large electronics firms benefit from economies of scale and are able to finance high-risk innovation and global advertising. 10 (Source adapted from: https://www.theguardian.com/ business/2021/aug/20/watchdog-expresses-concerns- over-nvidias-takeover-of-uk-chip-designer-arm ) Extract D The growing problem of electronic waste Electronic waste is the fastest growing element of the world’s household waste problem. The problem in the UK is particularly bad. The country produces 24.9 kg a person a year – nearly 10 kg more than the EU average. In 2018, 1.2 million tonnes of electrical devices were sold in the UK, and 500 000 tonnes made it to recycling centres. Some appliances 5 are more likely to be recycled than others. The recycling rate for big appliances, such as fridges and cookers, is about 80%. Of small appliances, barely one in five makes it to the recycling centre. As items such as toasters, hairdryers and headphones fit into household bins, they are not often taken to a recycling centre. This causes many problems, such as hazardous substances contaminating soil, water pollution and other external costs. 10 Policy makers have a long list of options to combat this problem including stricter regulation, environmental education, taxation and financial incentives. In some countries, for example, household rubbish is weighed and recycling initiatives are subsidised. (Source adapted from: https://www.ft.com/content/26e1aa74- 2261-11ea-92da-f0c92e957a96)
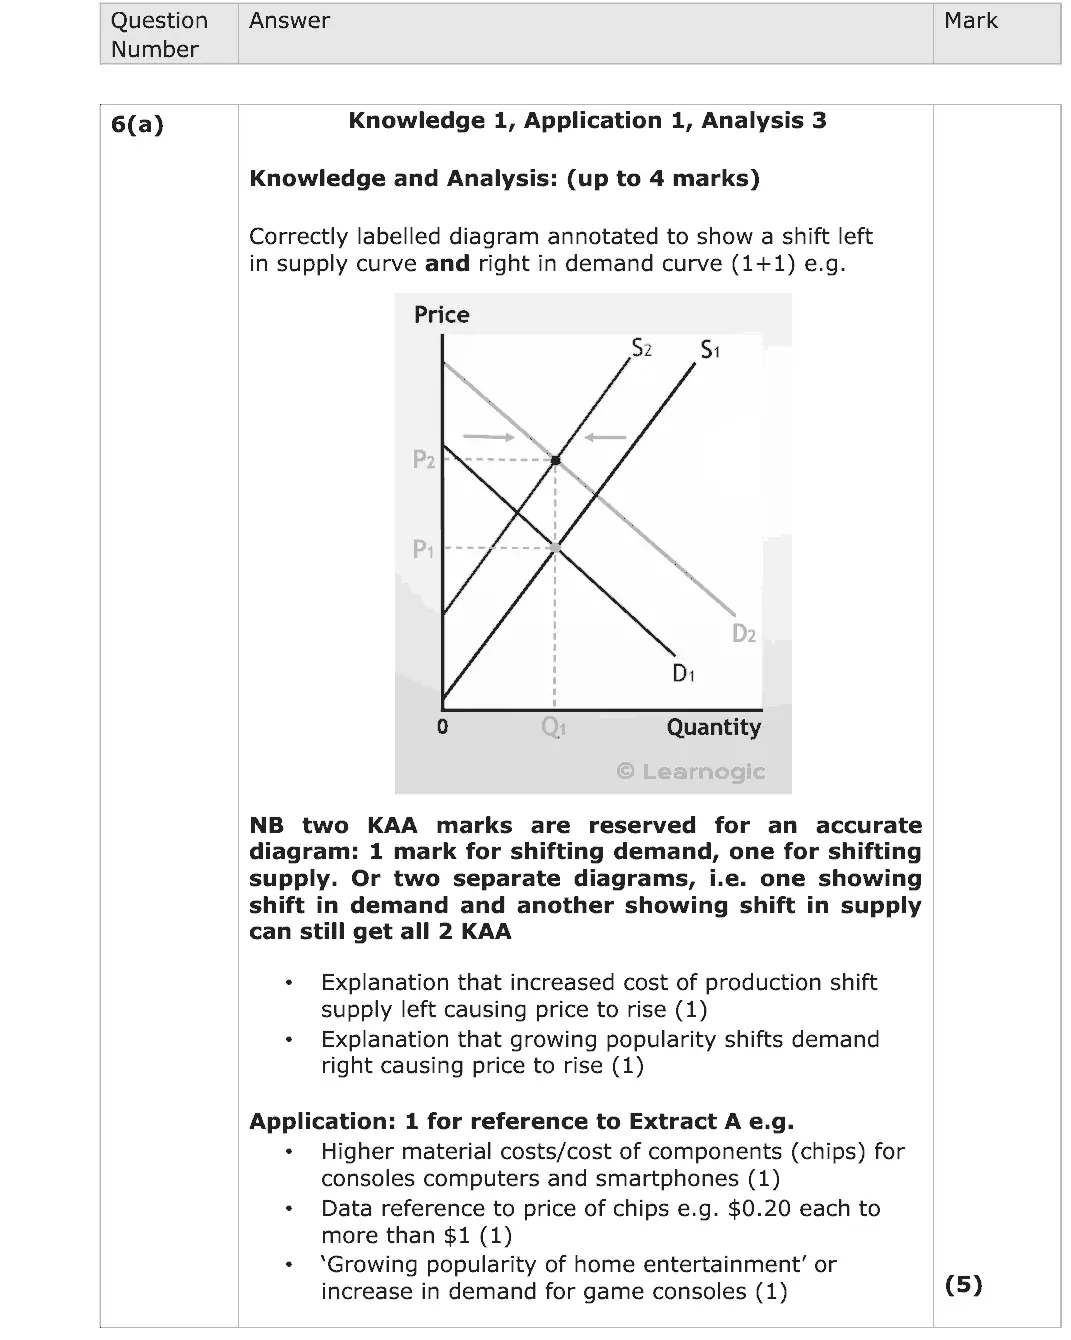
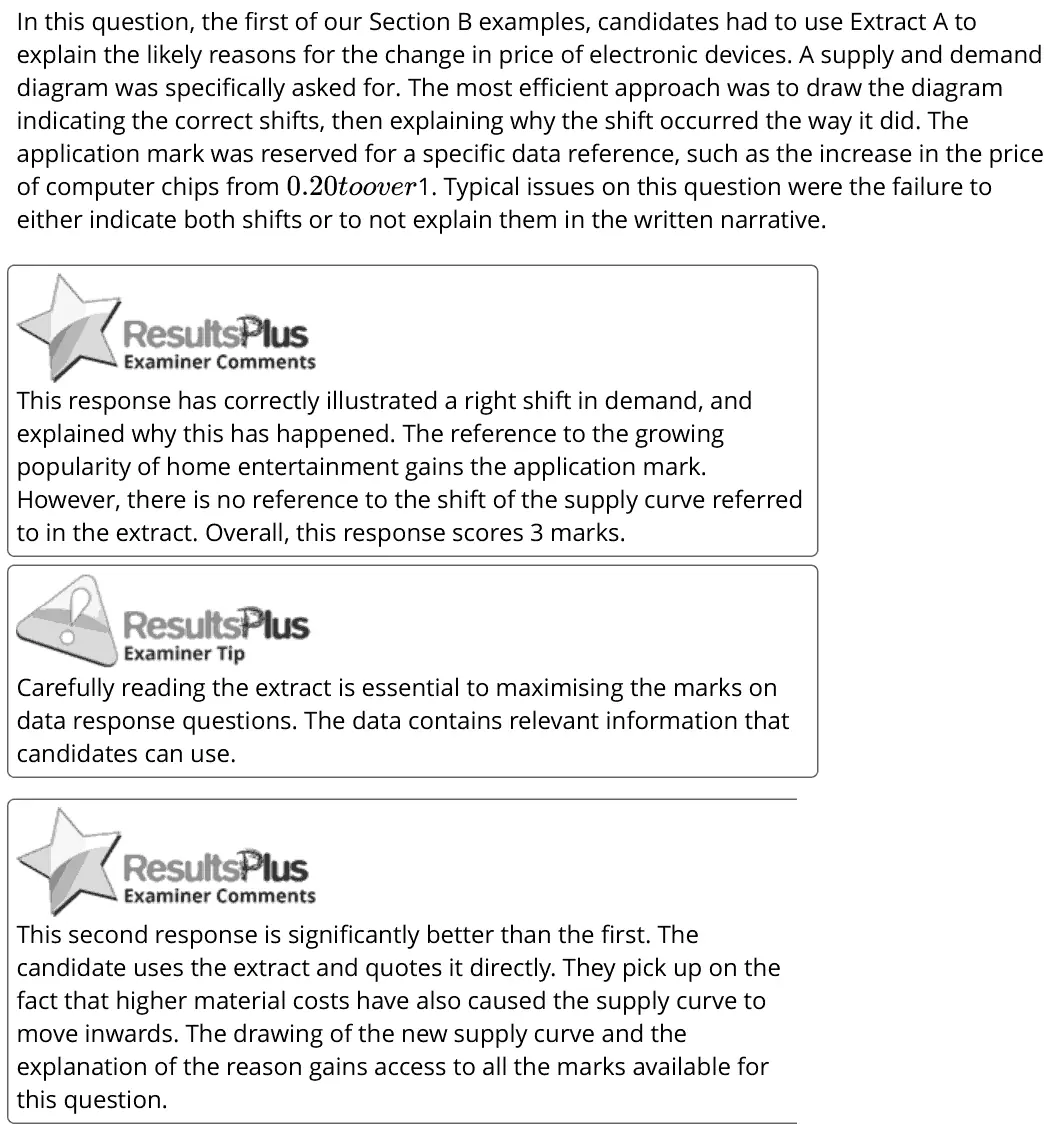
(a) With reference to Extract A, explain the likely reasons for the change in price of electronic devices. Include a supply and demand diagram in your answer. (5)
June 2023 · AS Paper 2 · Q4(c) 2 marks AO2=2 Diagram national income and the multiplieraggregate demand
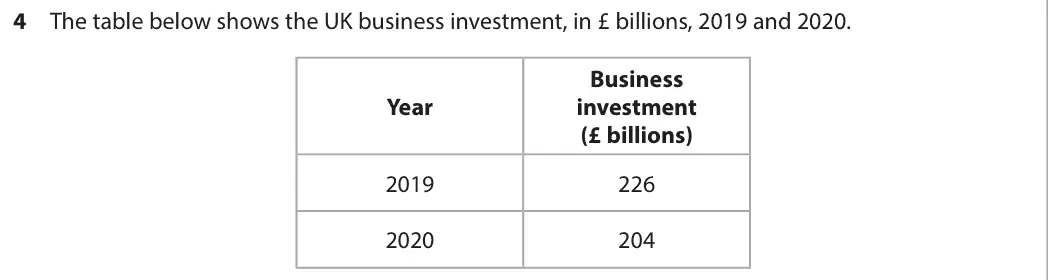
Data and extracts for question 44 The table below shows the UK business investment, in £ billions, 2019 and 2020. Business Year investment (£ billions) 2019 226 2020 204
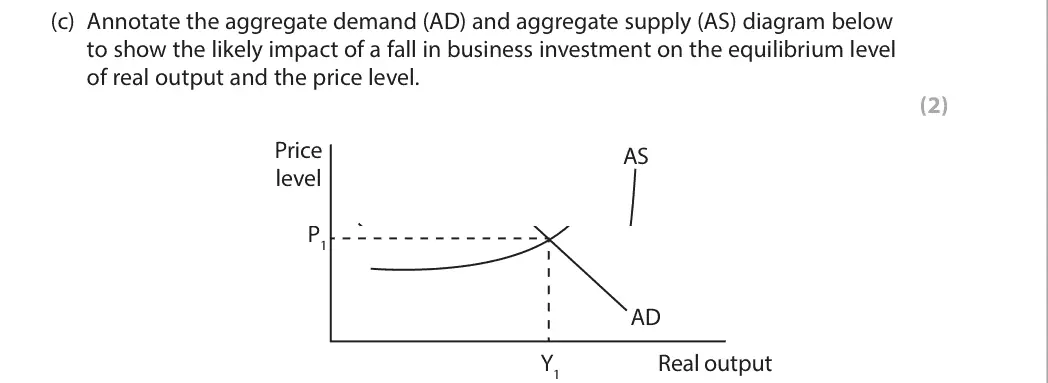
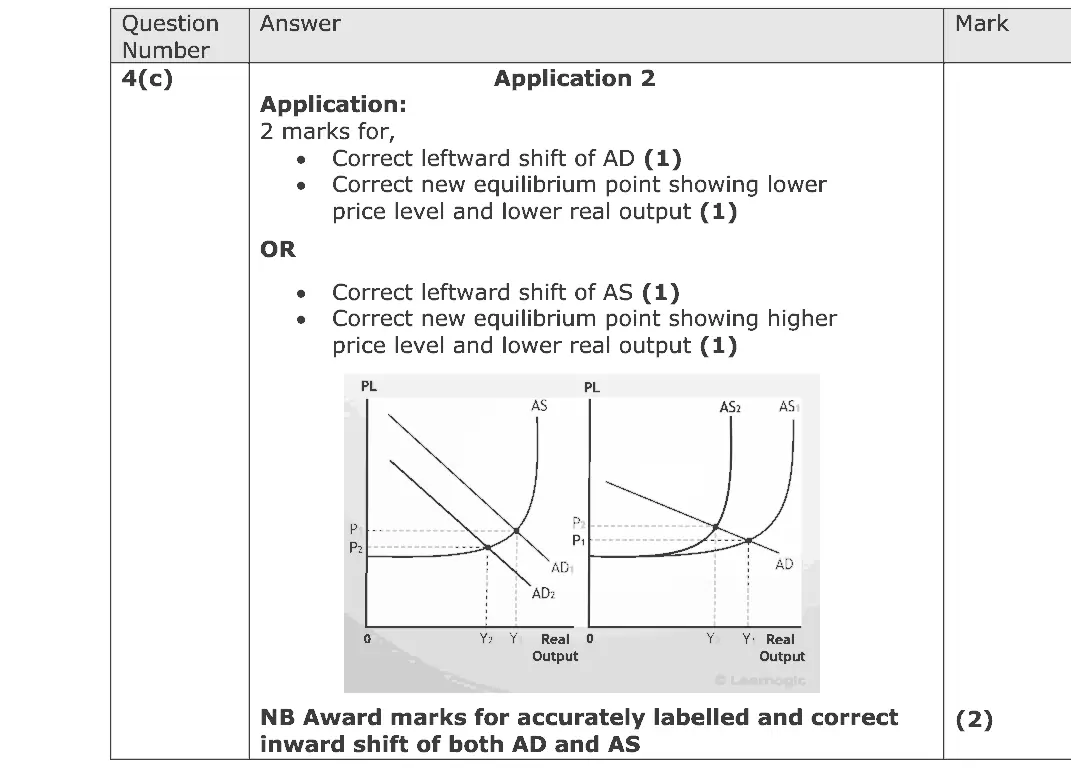
(c) Annotate the aggregate demand (AD) and aggregate supply (AS) diagram below to show the likely impact of a fall in business investment on the equilibrium level of real output and the price level. (2) Price AS level P1 AD Y1 Real output
June 2023 · Paper 1 · Q3(b) 4 marks AO1=2, AO2=2 Diagram market structures and efficiency
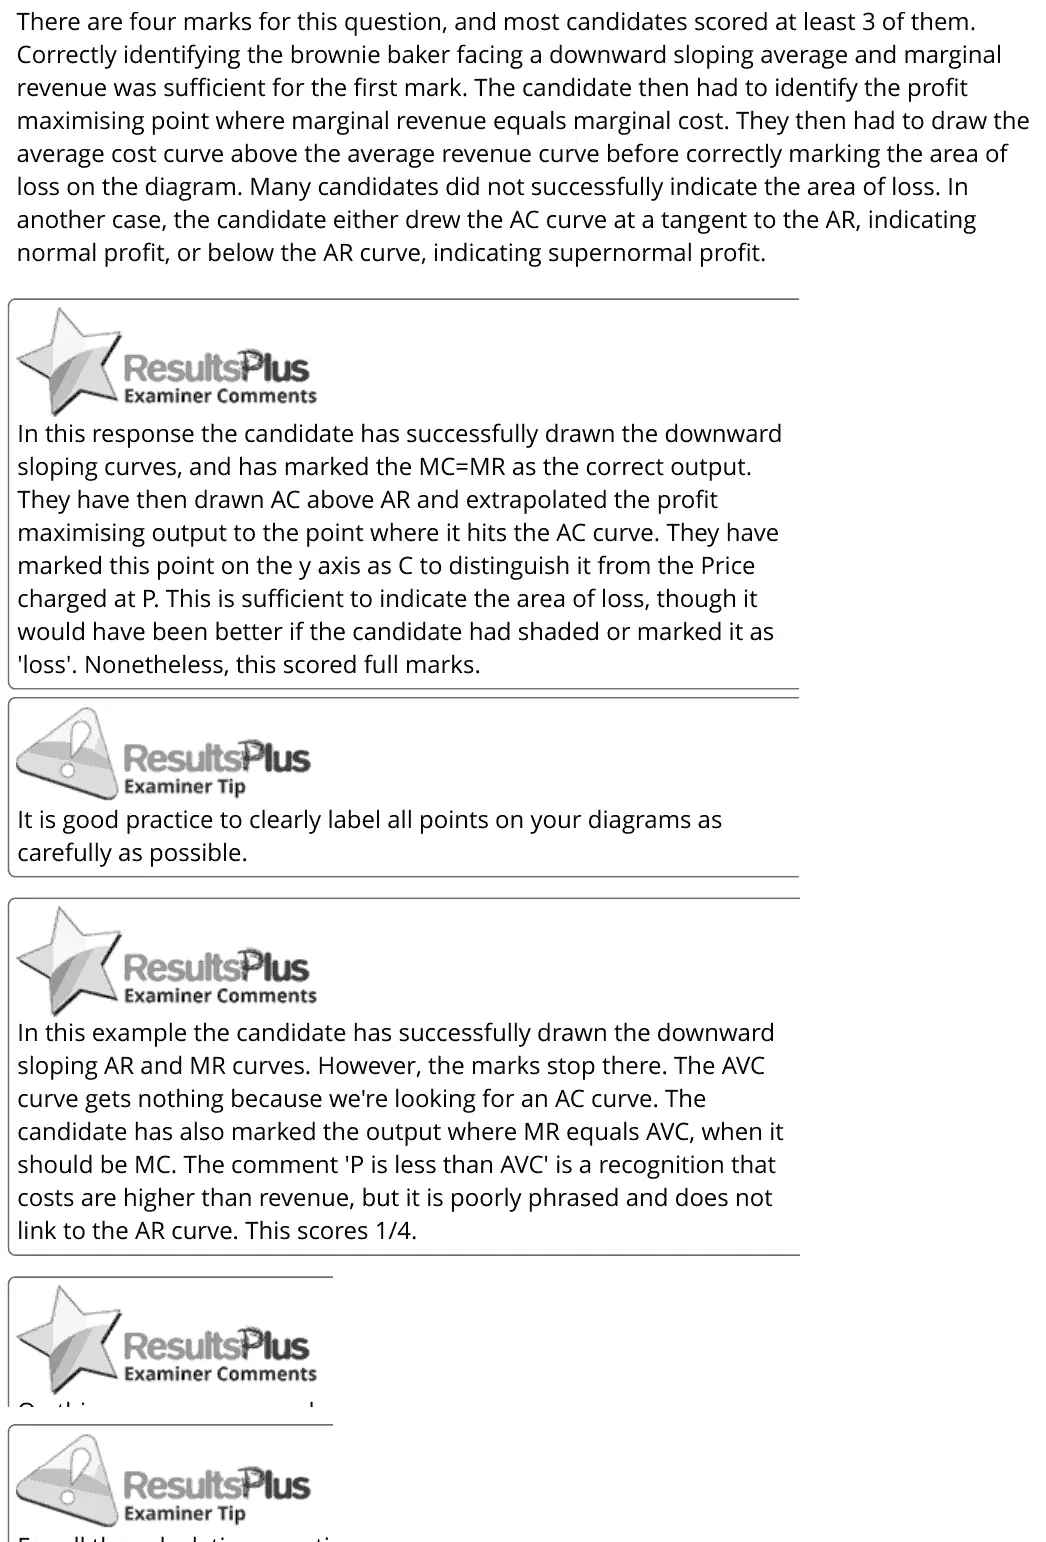
Data and extracts for question 33 A luxury brownie baker is faced with falling demand as incomes fall.
(b) Small local bakeries have many of the characteristics of monopolistic competition. Draw the short run profit maximising equilibrium of a loss‑making luxury brownie baker. (4)
June 2023 · Paper 2 · Q1(a) 4 marks AO1=2, AO2=2 Diagram fiscal and monetary policynational income and the multiplier
Data and extracts for question 11 In September 2022 the Bank of England increased the base interest rate from 1.75% to 2.25%. (Source: adapted from https://www.bankofengland.co.uk/boeapps/database/Bank-Rate.asp)
(a) Draw an aggregate demand and aggregate supply diagram to illustrate the likely impact of an increase in the UK base interest rate on the average price level and real output. (4)
June 2022 · AS Paper 1 · Q6(a) 5 marks AO1=1, AO2=2, AO3=2 Diagram supply and demandgovernment intervention in markets
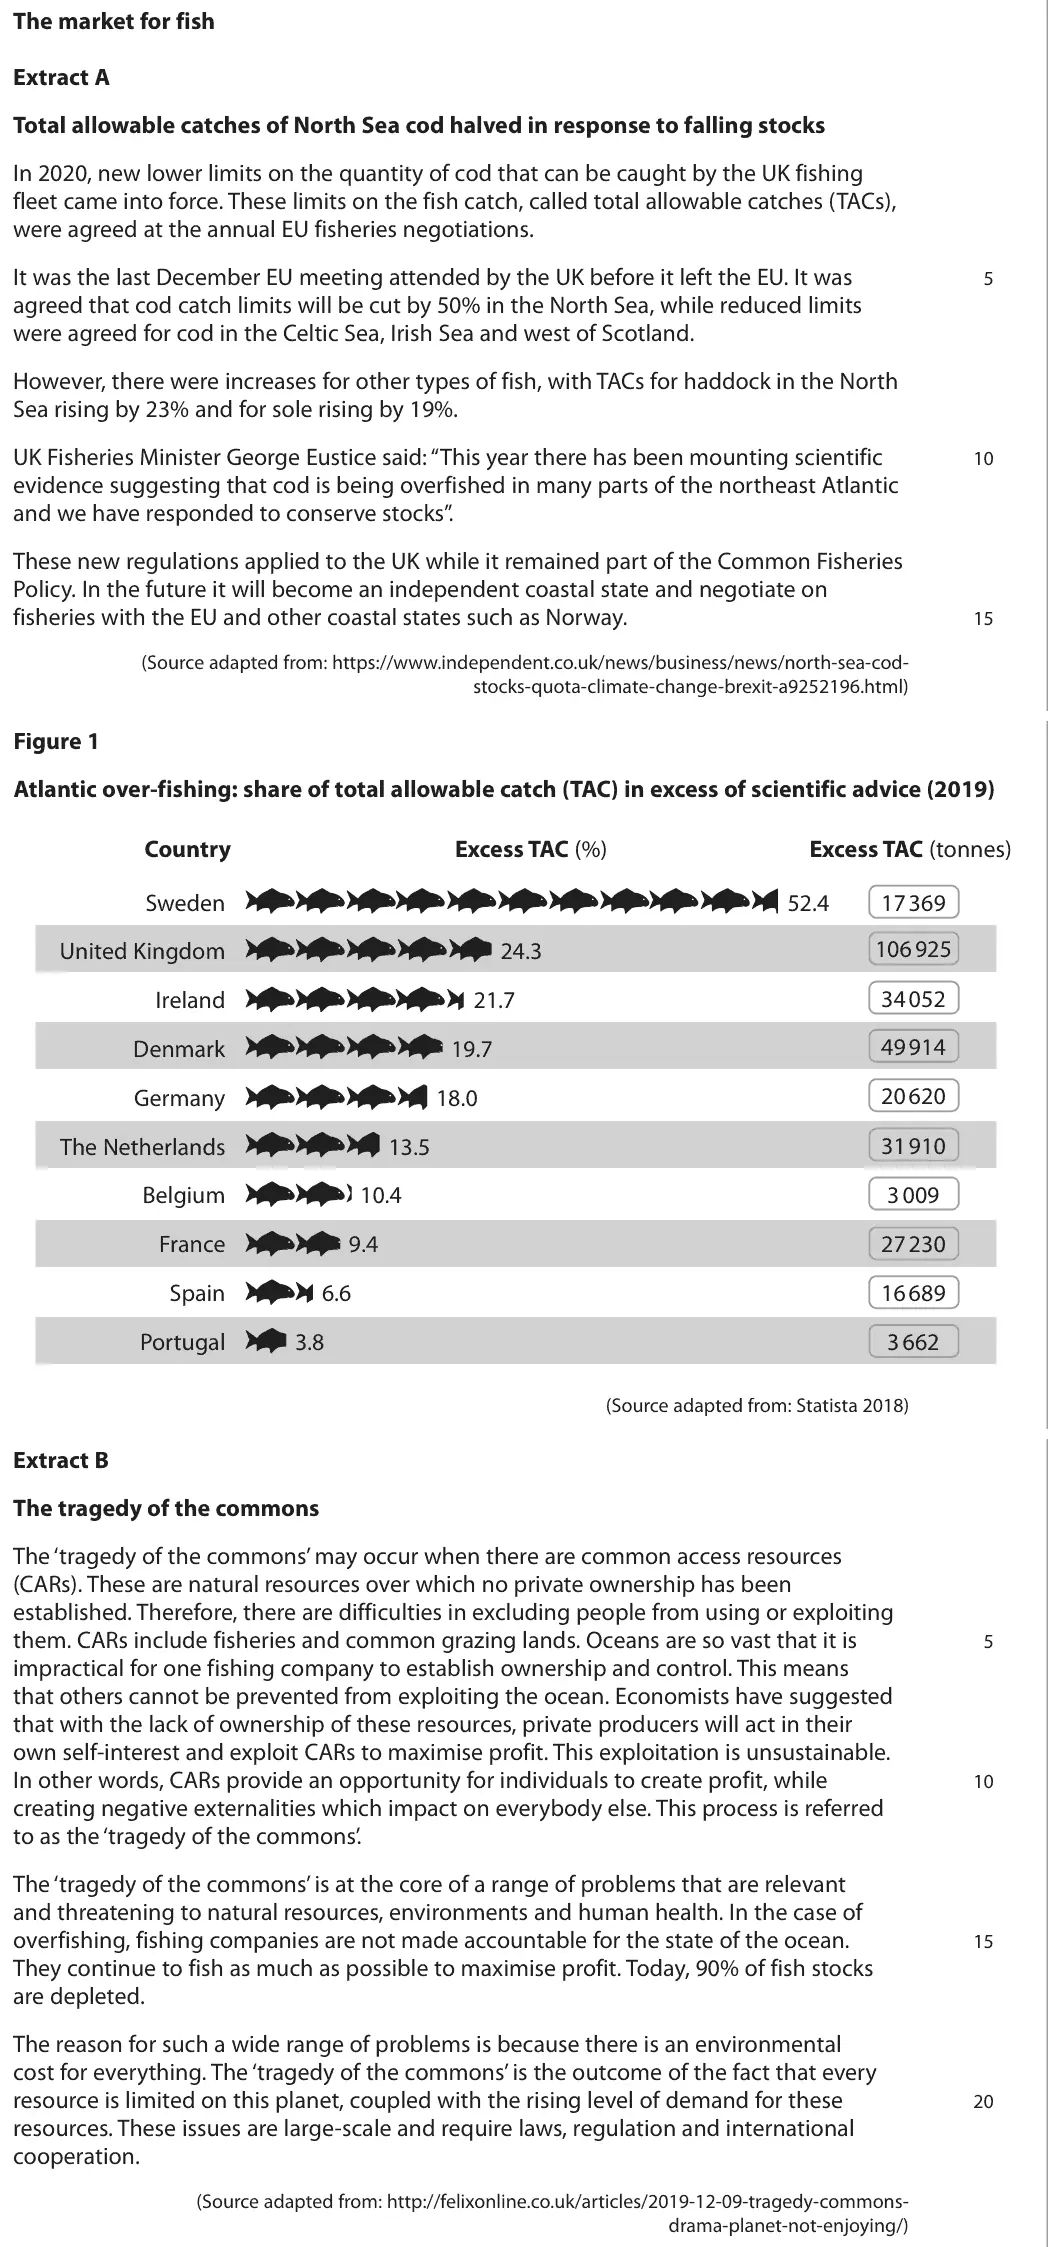
Data and extracts for question 6The market for fish Extract A Total allowable catches of North Sea cod halved in response to falling stocks In 2020, new lower limits on the quantity of cod that can be caught by the UK fishing fleet came into force. These limits on the fish catch, called total allowable catches (TACs), were agreed at the annual EU fisheries negotiations. It was the last December EU meeting attended by the UK before it left the EU. It was 5 agreed that cod catch limits will be cut by 50% in the North Sea, while reduced limits were agreed for cod in the Celtic Sea, Irish Sea and west of Scotland. However, there were increases for other types of fish, with TACs for haddock in the North Sea rising by 23% and for sole rising by 19%. UK Fisheries Minister George Eustice said: “This year there has been mounting scientific 10 evidence suggesting that cod is being overfished in many parts of the northeast Atlantic and we have responded to conserve stocks”. These new regulations applied to the UK while it remained part of the Common Fisheries Policy. In the future it will become an independent coastal state and negotiate on fisheries with the EU and other coastal states such as Norway. 15 (Source adapted from: https://www.independent.co.uk/news/business/news/north-sea-cod- stocks-quota-climate-change-brexit-a9252196.html) Figure 1 Atlantic over-fishing: share of total allowable catch (TAC) in excess of scientific advice (2019) Country Excess TAC (%) Excess TAC (tonnes) Sweden 52.4 17 369 106 925 United Kingdom 24.3 34 052 Ireland 21.7 49 914 Denmark 19.7 20 620 Germany 18.0 The Netherlands 13.5 31 910 3 009 Belgium 10.4 France 9.4 27 230 Spain 6.6 16 689 Portugal 3.8 3 662 (Source adapted from: Statista 2018) Extract B The tragedy of the commons The ‘tragedy of the commons’ may occur when there are common access resources (CARs). These are natural resources over which no private ownership has been established. Therefore, there are difficulties in excluding people from using or exploiting them. CARs include fisheries and common grazing lands. Oceans are so vast that it is 5 impractical for one fishing company to establish ownership and control. This means that others cannot be prevented from exploiting the ocean. Economists have suggested that with the lack of ownership of these resources, private producers will act in their own self-interest and exploit CARs to maximise profit. This exploitation is unsustainable. In other words, CARs provide an opportunity for individuals to create profit, while 10 creating negative externalities which impact on everybody else. This process is referred to as the ‘tragedy of the commons’. The ‘tragedy of the commons’ is at the core of a range of problems that are relevant and threatening to natural resources, environments and human health. In the case of overfishing, fishing companies are not made accountable for the state of the ocean. 15 They continue to fish as much as possible to maximise profit. Today, 90% of fish stocks are depleted. The reason for such a wide range of problems is because there is an environmental cost for everything. The ‘tragedy of the commons’ is the outcome of the fact that every resource is limited on this planet, coupled with the rising level of demand for these 20 resources. These issues are large-scale and require laws, regulation and international cooperation. (Source adapted from: http://felixonline.co.uk/articles/2019-12-09-tragedy-commons- drama-planet-not-enjoying/)
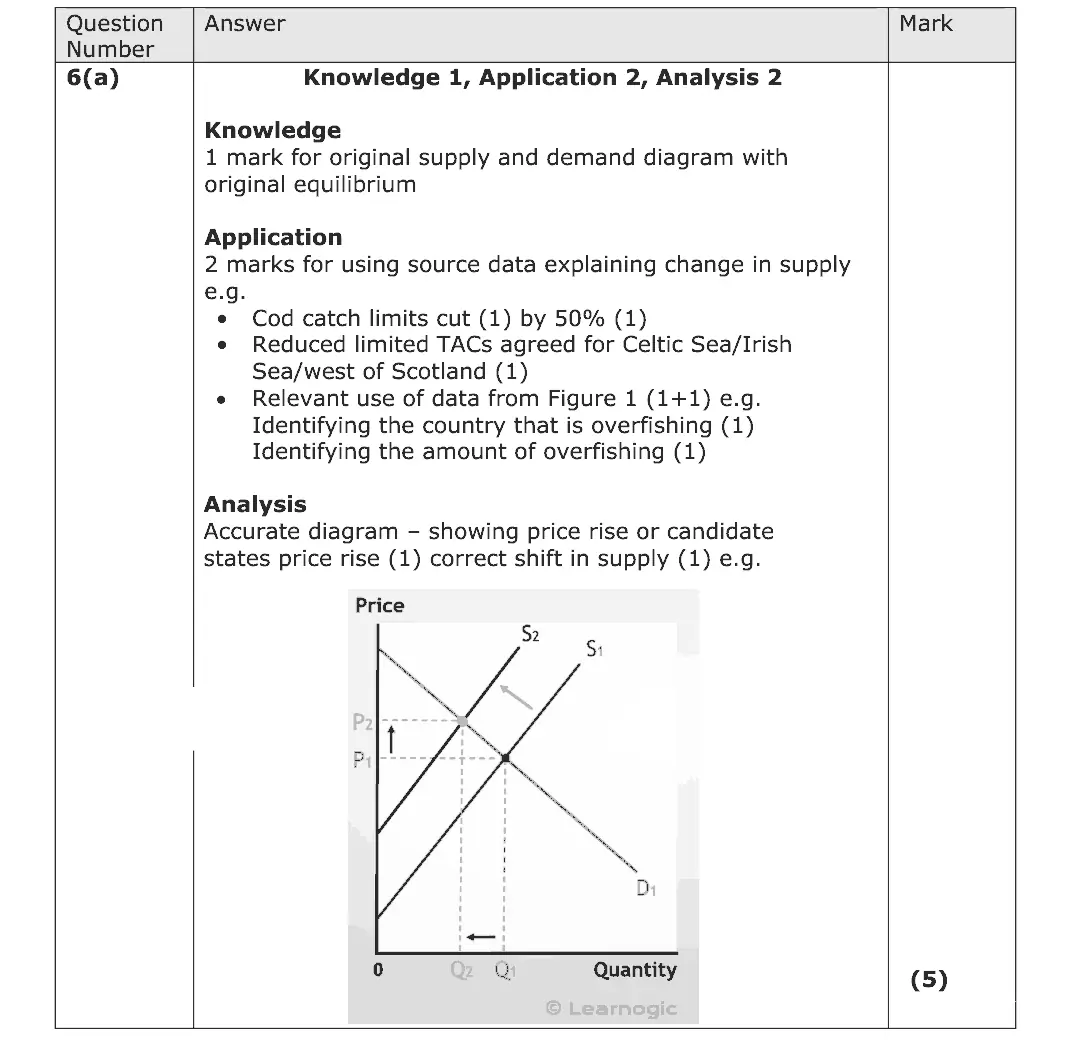
(a) Explain the likely impact of the new 2020 TACs on the price of cod. Include a supply and demand diagram in your answer. (5)
June 2022 · AS Paper 2 · Q4(c) 2 marks AO2=2 Diagram aggregate demandnational income and the multiplier
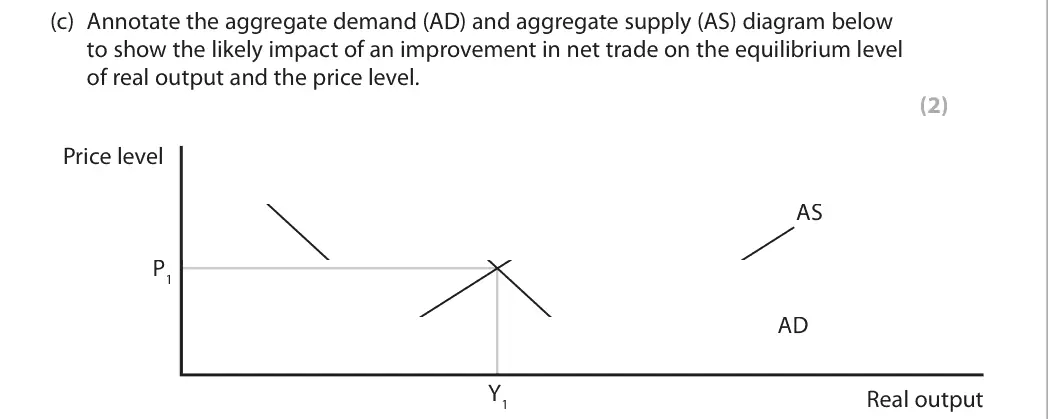
Data and extracts for question 44 The UK exchange rate changed from £1 = $1.53 in January 2015 to £1 = $1.22 in October 2019.
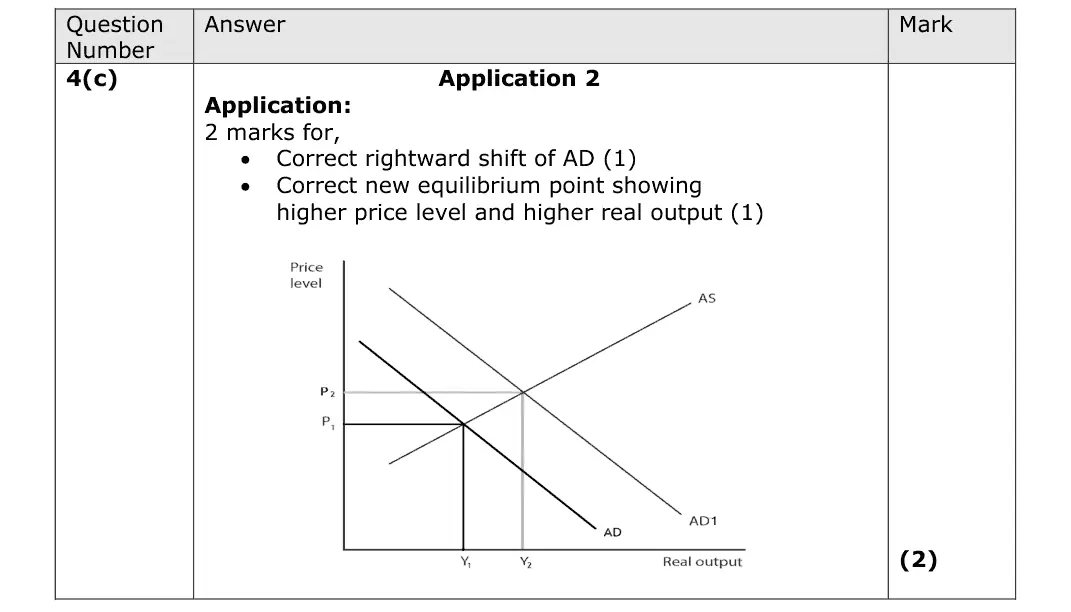
(c) Annotate the aggregate demand (AD) and aggregate supply (AS) diagram below to show the likely impact of an improvement in net trade on the equilibrium level of real output and the price level. (2) Price level AS P1 AD Y1 Real output
June 2022 · Paper 1 · Q1(b) 4 marks AO1=2, AO2=2 Diagram supply and demand
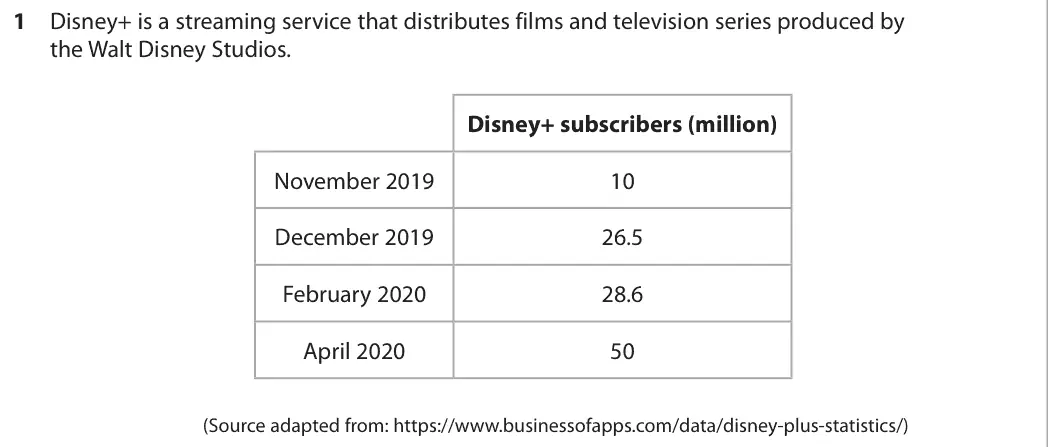
Data and extracts for question 11 Disney+ is a streaming service that distributes films and television series produced by the Walt Disney Studios. Disney+ subscribers (million) November 2019 10 December 2019 26.5 February 2020 28.6 April 2020 50 (Source adapted from: https://www.businessofapps.com/data/disney-plus-statistics/)
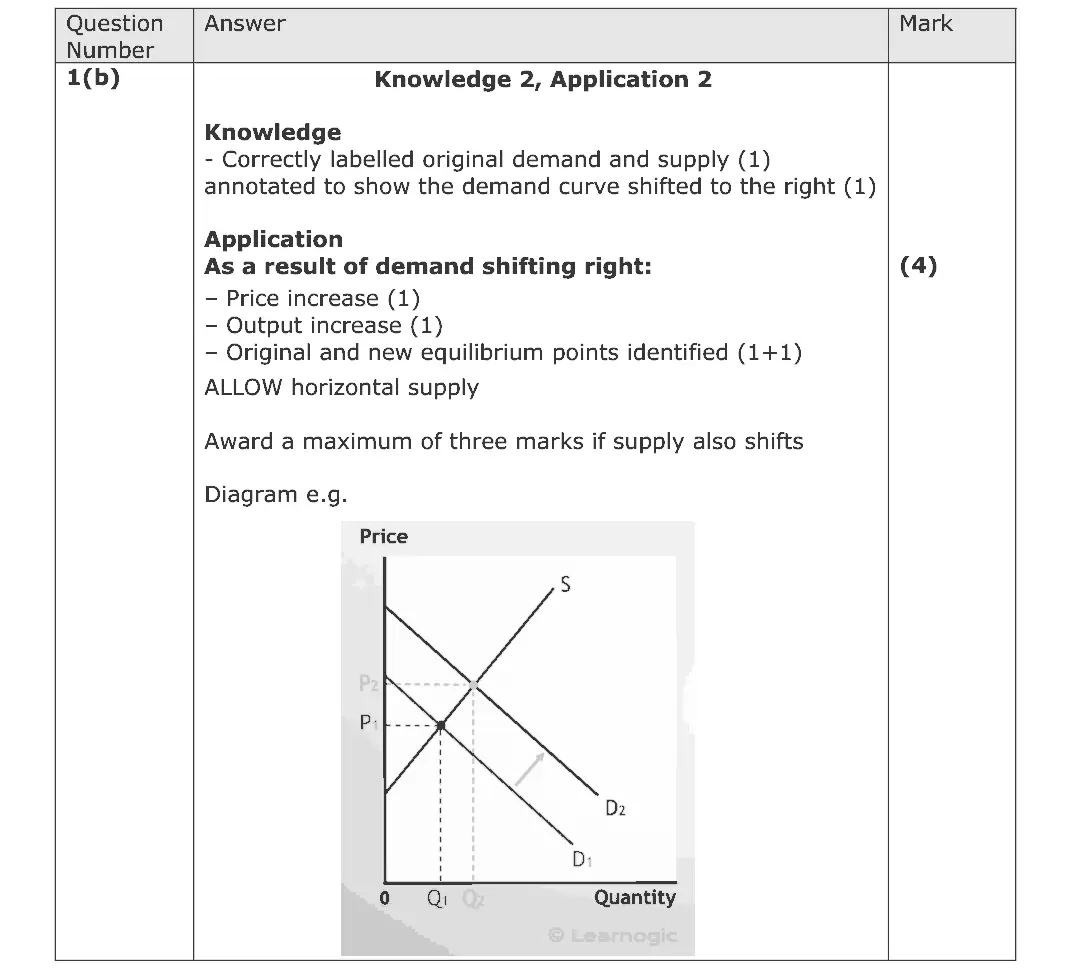
(b) Draw a supply and demand diagram to show the likely effect of the change in the number of subscribers on the market equilibrium for Disney+ services. (4)
June 2022 · Paper 1 · Q3(a) 4 marks AO1=2, AO2=2 Diagram externalities
Data and extracts for question 33 A company that provides drinking water and treats waste water has been fined £180 000 after an incident that killed about 2 500 fish. The charges relate to an illegal discharge of sewage from the waste water treatment plant that polluted nine kilometres of the River Severn, a popular tourist destination. (Source: adapted from https://www.leaderlive.co.uk/news/wrexham/ 19393552.water-company-fined-today-sewage-leaked-wrexham-river-killing-2-500-fish/)
(a) Draw an externalities diagram to show the likely impact of the sewage discharge on the local tourist industry. (4)
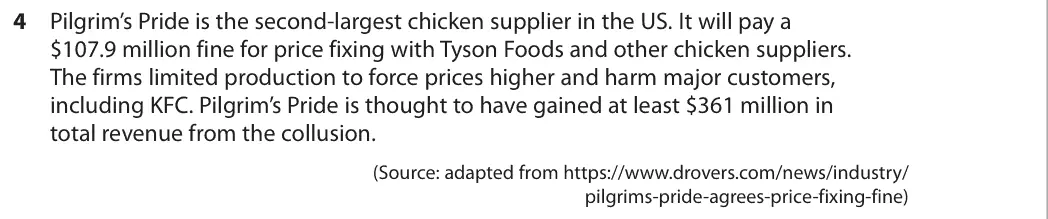
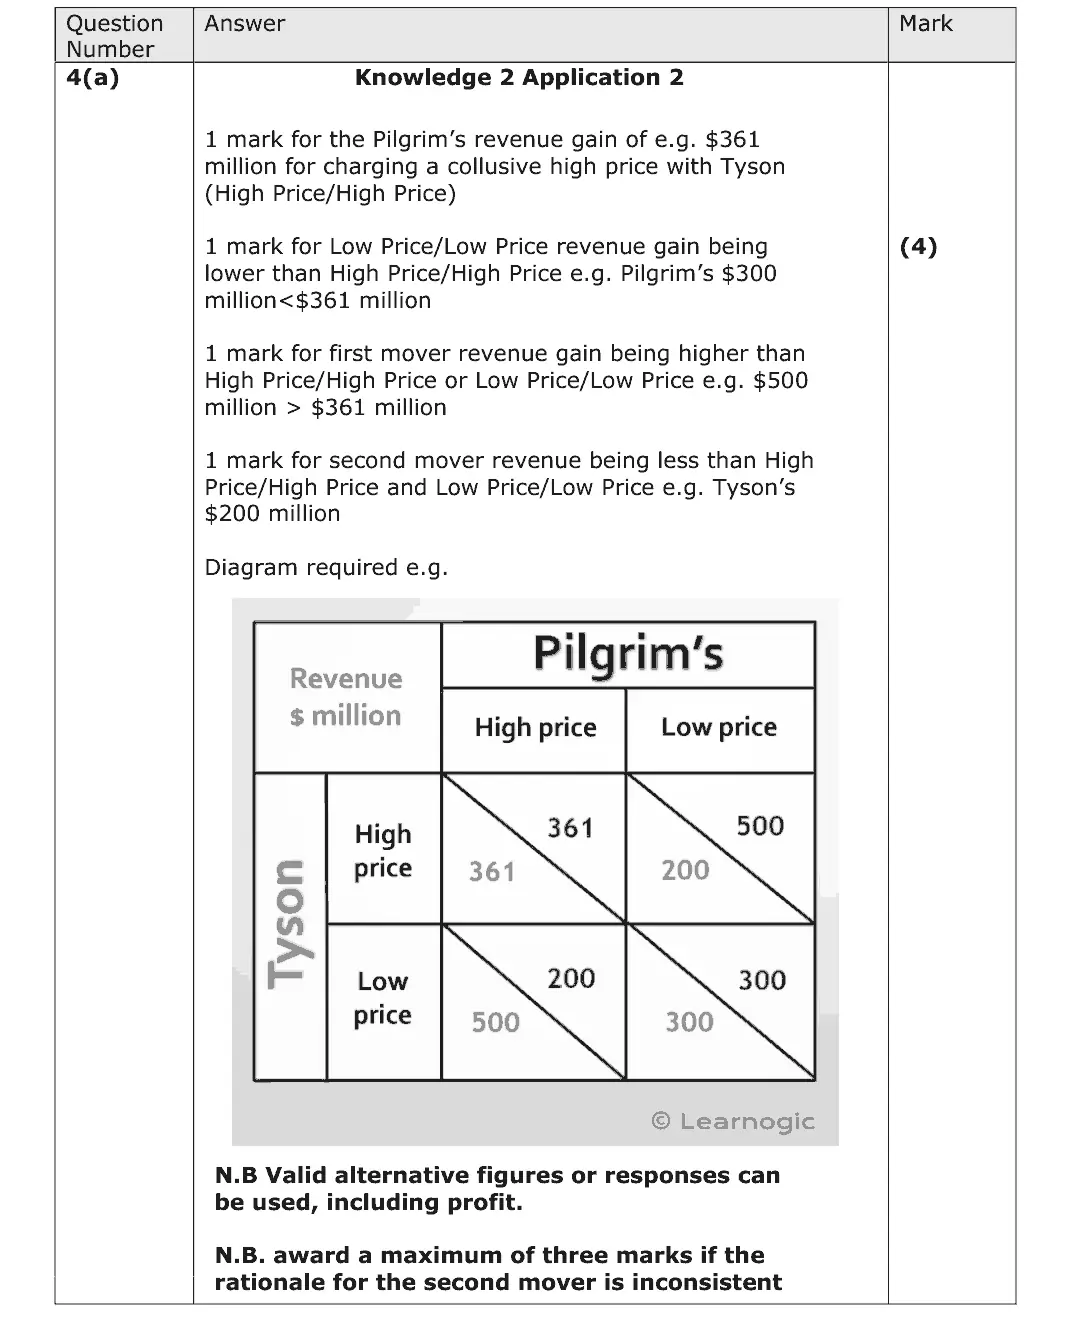
June 2022 · Paper 1 · Q4(a) 4 marks AO1=2, AO2=2 Diagram oligopoly
Data and extracts for question 44 Pilgrim’s Pride is the second-largest chicken supplier in the US. It will pay a $107.9 million fine for price fixing with Tyson Foods and other chicken suppliers. The firms limited production to force prices higher and harm major customers, including KFC. Pilgrim’s Pride is thought to have gained at least $361 million in total revenue from the collusion. (Source: adapted from https://www.drovers.com/news/industry/ pilgrims-pride-agrees-price-fixing-fine)
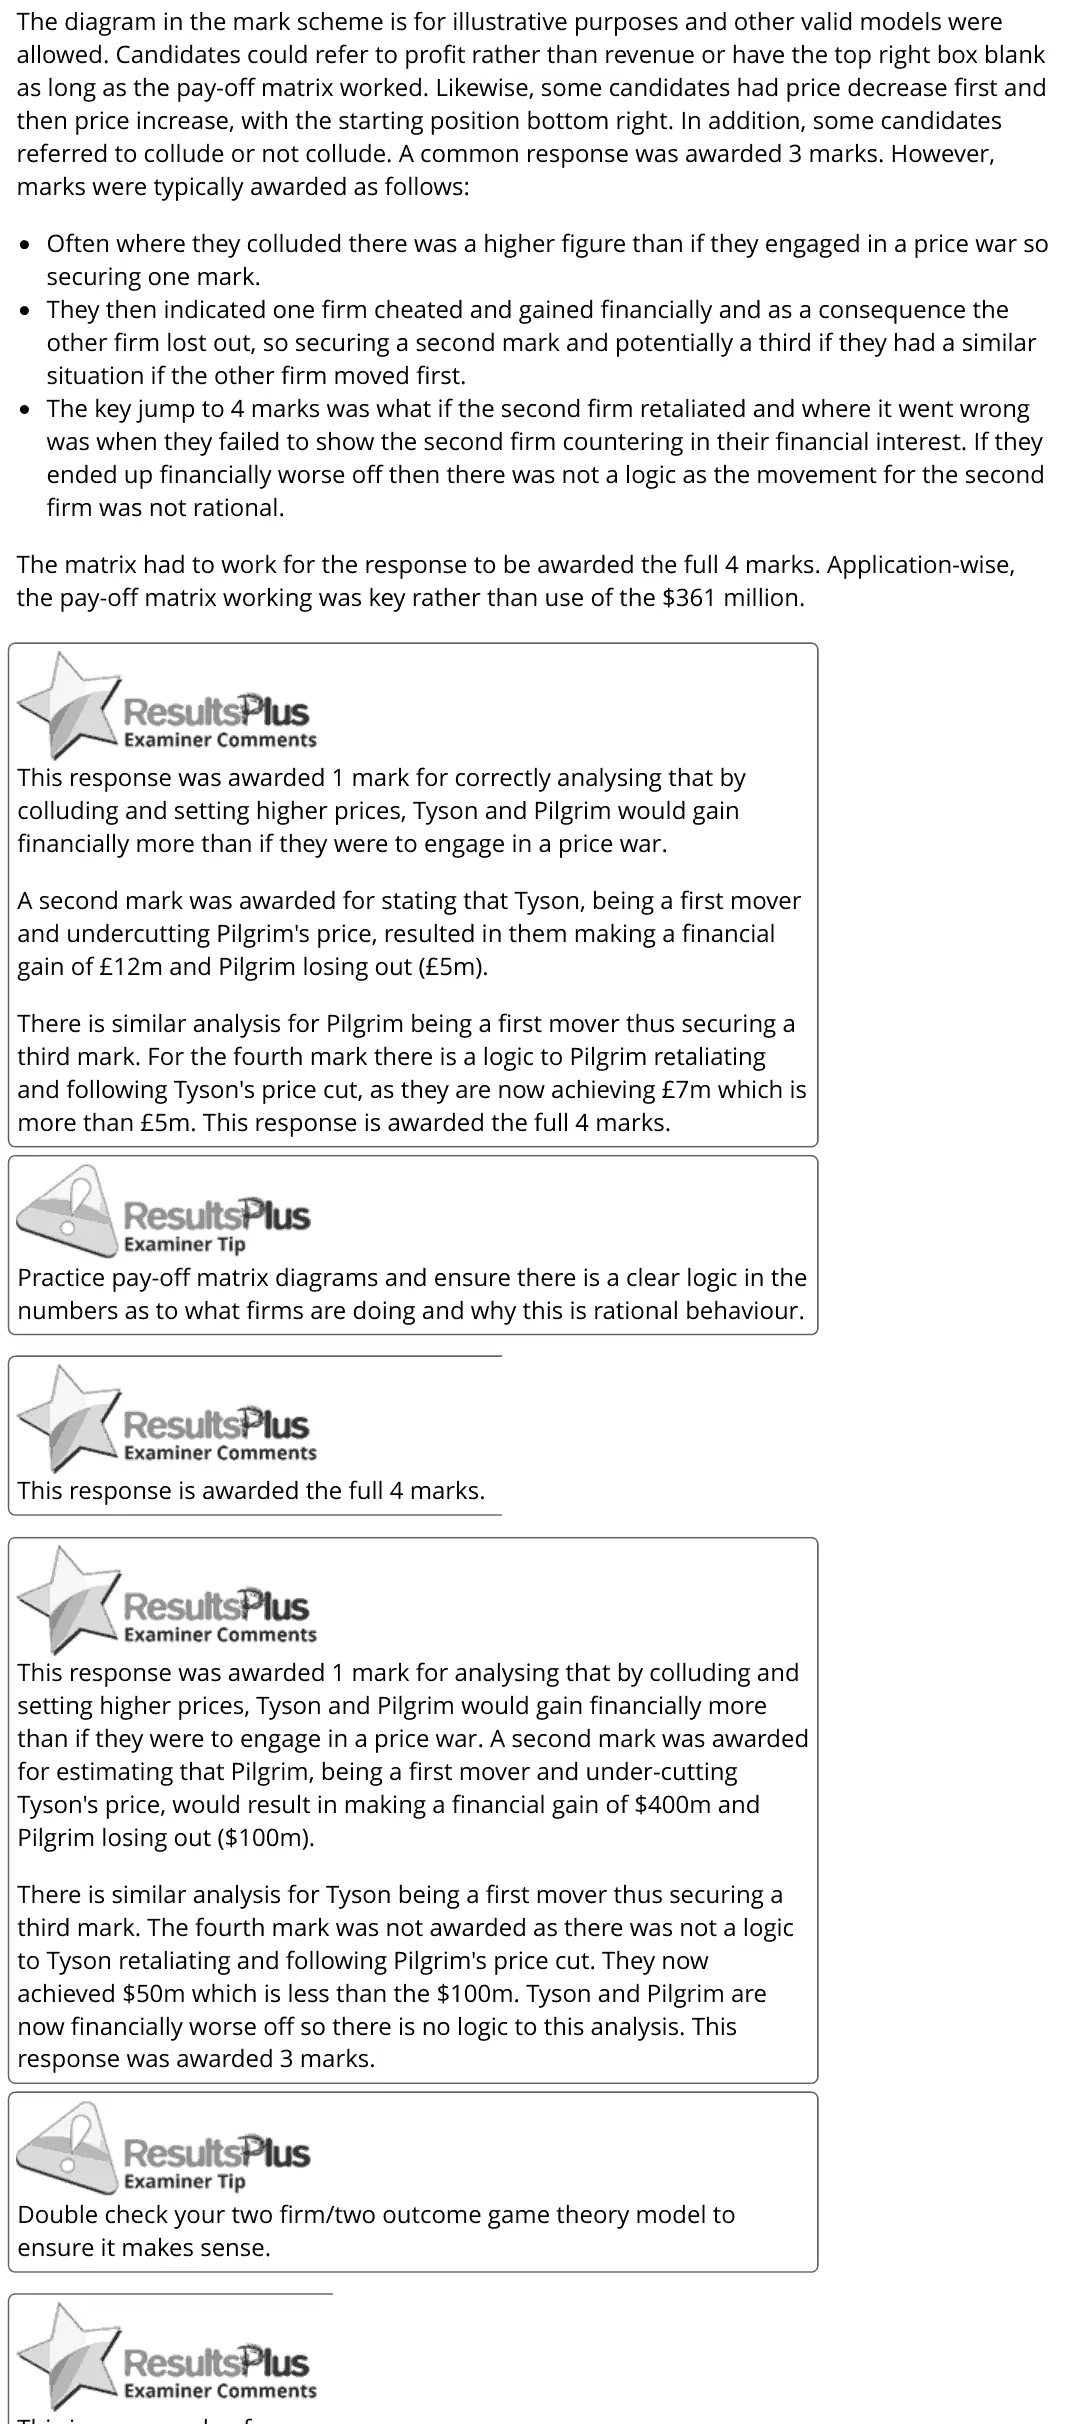
(a) Draw a simple two firm/two outcome game theory model to show why the chicken suppliers may have colluded. (4)
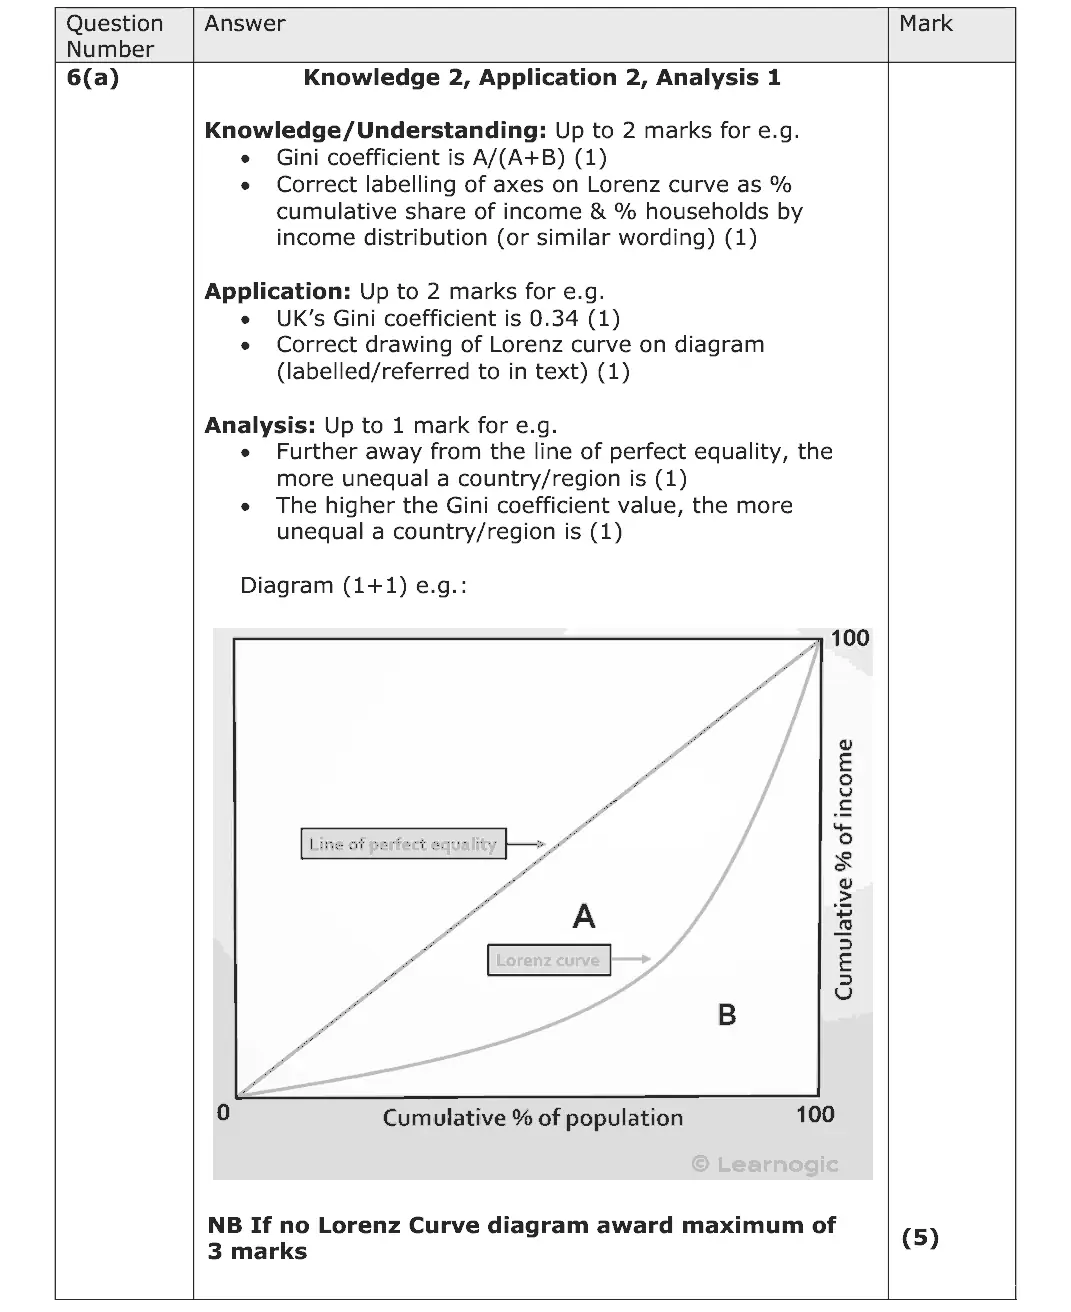
June 2022 · Paper 2 · Q6(a) 5 marks AO1=2, AO2=2, AO3=1 Diagram poverty and inequality
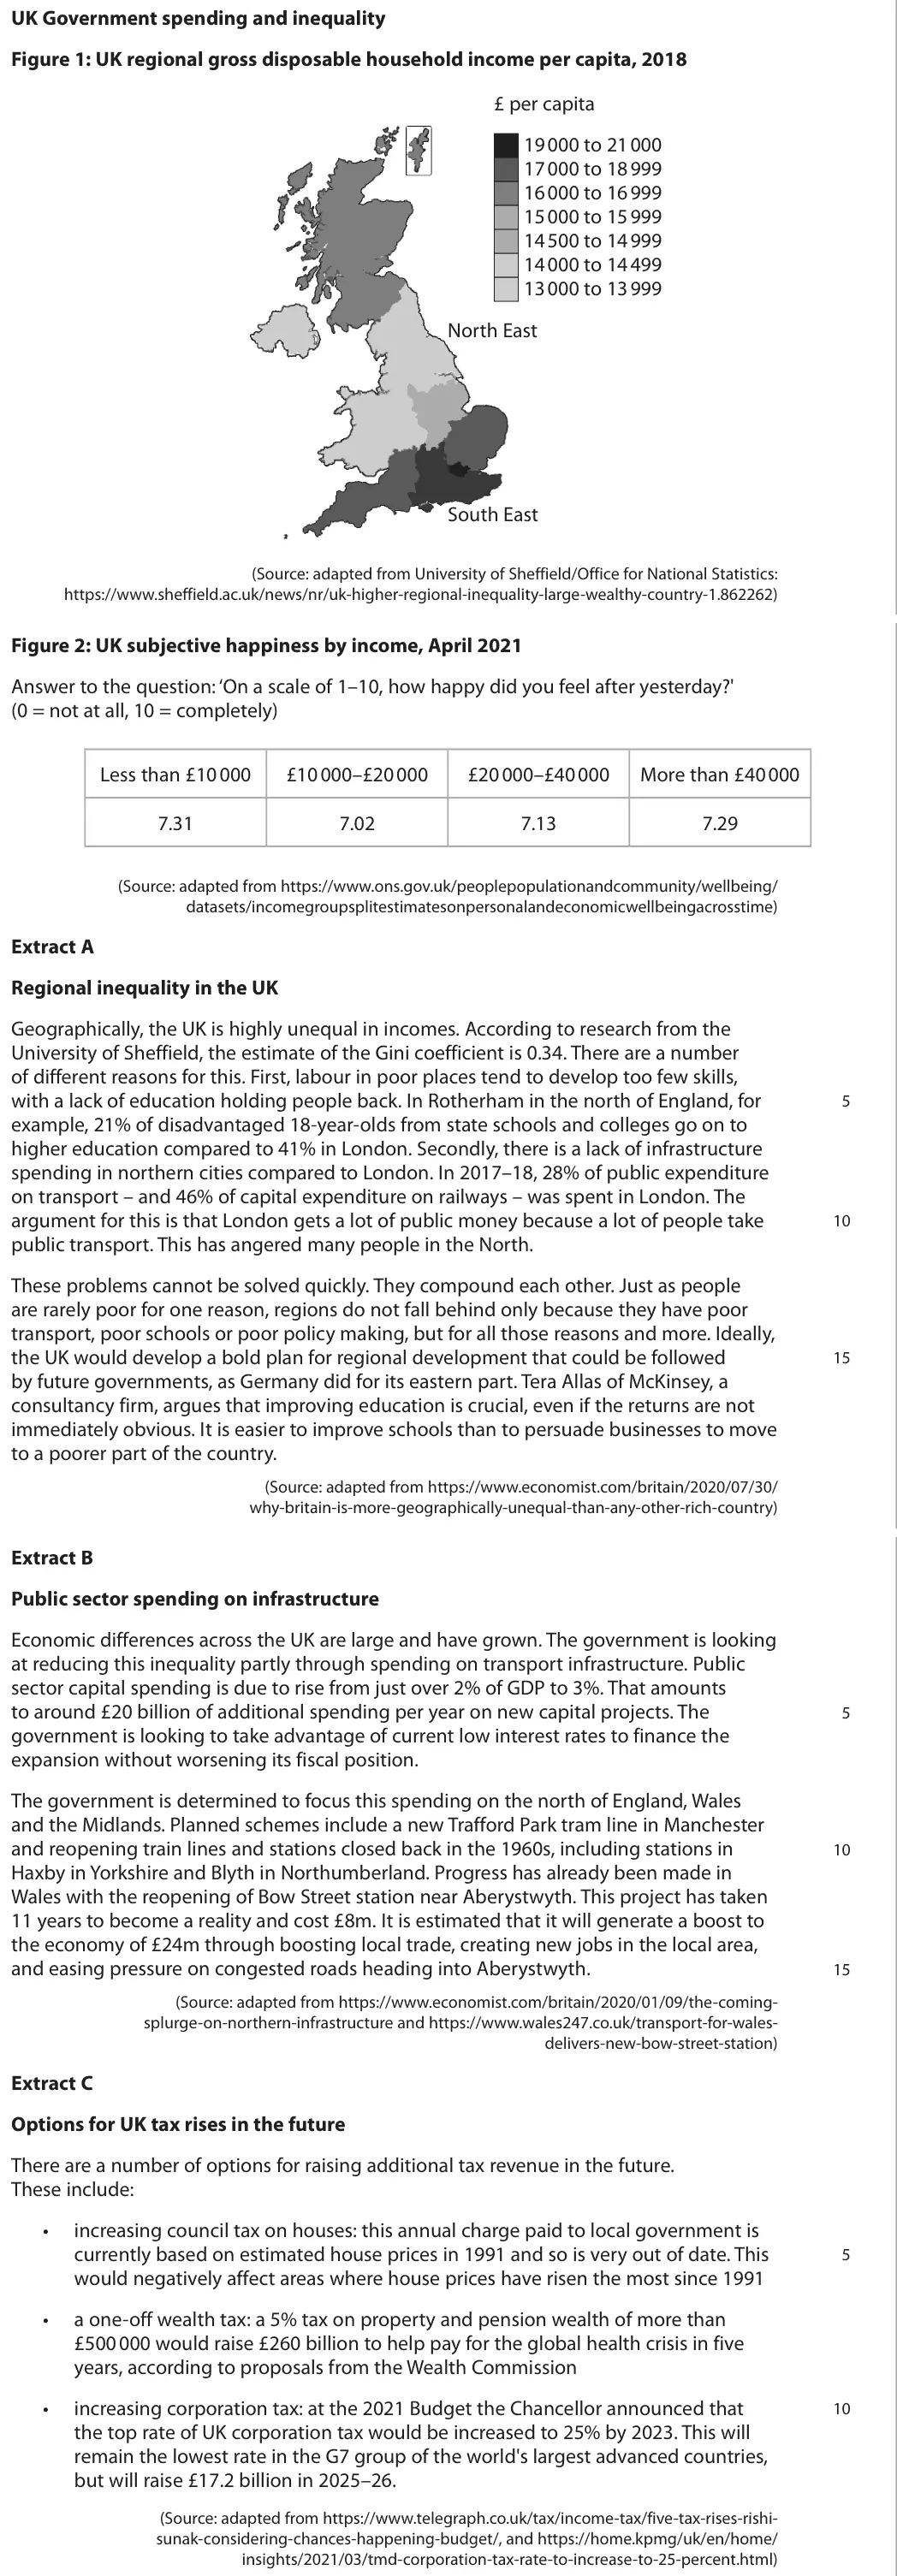
Data and extracts for question 6UK Government spending and inequality Figure 1: UK regional gross disposable household income per capita, 2018 £ per capita 19 000 to 21 000 17 000 to 18 999 16 000 to 16 999 15 000 to 15 999 14 500 to 14 999 14 000 to 14 499 13 000 to 13 999 North East South East (Source: adapted from University of Sheffield/Office for National Statistics: https://www.sheffield.ac.uk/news/nr/uk-higher-regional-inequality-large-wealthy-country-1.862262) Figure 2: UK subjective happiness by income, April 2021 Answer to the question: ‘On a scale of 1–10, how happy did you feel after yesterday?' (0 = not at all, 10 = completely) Less than £10 000 £10 000–£20 000 £20 000–£40 000 More than £40 000 7.31 7.02 7.13 7.29 (Source: adapted from https://www.ons.gov.uk/peoplepopulationandcommunity/wellbeing/ datasets/incomegroupsplitestimatesonpersonalandeconomicwellbeingacrosstime) Extract A Regional inequality in the UK Geographically, the UK is highly unequal in incomes. According to research from the University of Sheffield, the estimate of the Gini coefficient is 0.34. There are a number of different reasons for this. First, labour in poor places tend to develop too few skills, with a lack of education holding people back. In Rotherham in the north of England, for 5 example, 21% of disadvantaged 18-year-olds from state schools and colleges go on to higher education compared to 41% in London. Secondly, there is a lack of infrastructure spending in northern cities compared to London. In 2017–18, 28% of public expenditure on transport – and 46% of capital expenditure on railways – was spent in London. The argument for this is that London gets a lot of public money because a lot of people take 10 public transport. This has angered many people in the North. These problems cannot be solved quickly. They compound each other. Just as people are rarely poor for one reason, regions do not fall behind only because they have poor transport, poor schools or poor policy making, but for all those reasons and more. Ideally, the UK would develop a bold plan for regional development that could be followed 15 by future governments, as Germany did for its eastern part. Tera Allas of McKinsey, a consultancy firm, argues that improving education is crucial, even if the returns are not immediately obvious. It is easier to improve schools than to persuade businesses to move to a poorer part of the country. (Source: adapted from https://www.economist.com/britain/2020/07/30/ why-britain-is-more-geographically-unequal-than-any-other-rich-country) Extract B Public sector spending on infrastructure Economic differences across the UK are large and have grown. The government is looking at reducing this inequality partly through spending on transport infrastructure. Public sector capital spending is due to rise from just over 2% of GDP to 3%. That amounts to around £20 billion of additional spending per year on new capital projects. The 5 government is looking to take advantage of current low interest rates to finance the expansion without worsening its fiscal position. The government is determined to focus this spending on the north of England, Wales and the Midlands. Planned schemes include a new Trafford Park tram line in Manchester and reopening train lines and stations closed back in the 1960s, including stations in 10 Haxby in Yorkshire and Blyth in Northumberland. Progress has already been made in Wales with the reopening of Bow Street station near Aberystwyth. This project has taken 11 years to become a reality and cost £8m. It is estimated that it will generate a boost to the economy of £24m through boosting local trade, creating new jobs in the local area, and easing pressure on congested roads heading into Aberystwyth. 15 (Source: adapted from https://www.economist.com/britain/2020/01/09/the-coming- splurge-on-northern-infrastructure and https://www.wales247.co.uk/transport-for-wales- delivers-new-bow-street-station) Extract C Options for UK tax rises in the future There are a number of options for raising additional tax revenue in the future. These include: • increasing council tax on houses: this annual charge paid to local government is currently based on estimated house prices in 1991 and so is very out of date. This 5 would negatively affect areas where house prices have risen the most since 1991 • a one-off wealth tax: a 5% tax on property and pension wealth of more than £500 000 would raise £260 billion to help pay for the global health crisis in five years, according to proposals from the Wealth Commission • increasing corporation tax: at the 2021 Budget the Chancellor announced that 10 the top rate of UK corporation tax would be increased to 25% by 2023. This will remain the lowest rate in the G7 group of the world's largest advanced countries, but will raise £17.2 billion in 2025–26. (Source: adapted from https://www.telegraph.co.uk/tax/income-tax/five-tax-rises-rishi- sunak-considering-chances-happening-budget/, and https://home.kpmg/uk/en/home/ insights/2021/03/tmd-corporation-tax-rate-to-increase-to-25-percent.html)
(a) Using a Lorenz curve diagram, explain how income inequality is measured using the Gini coefficient. Refer to Extract A in your answer. (5)
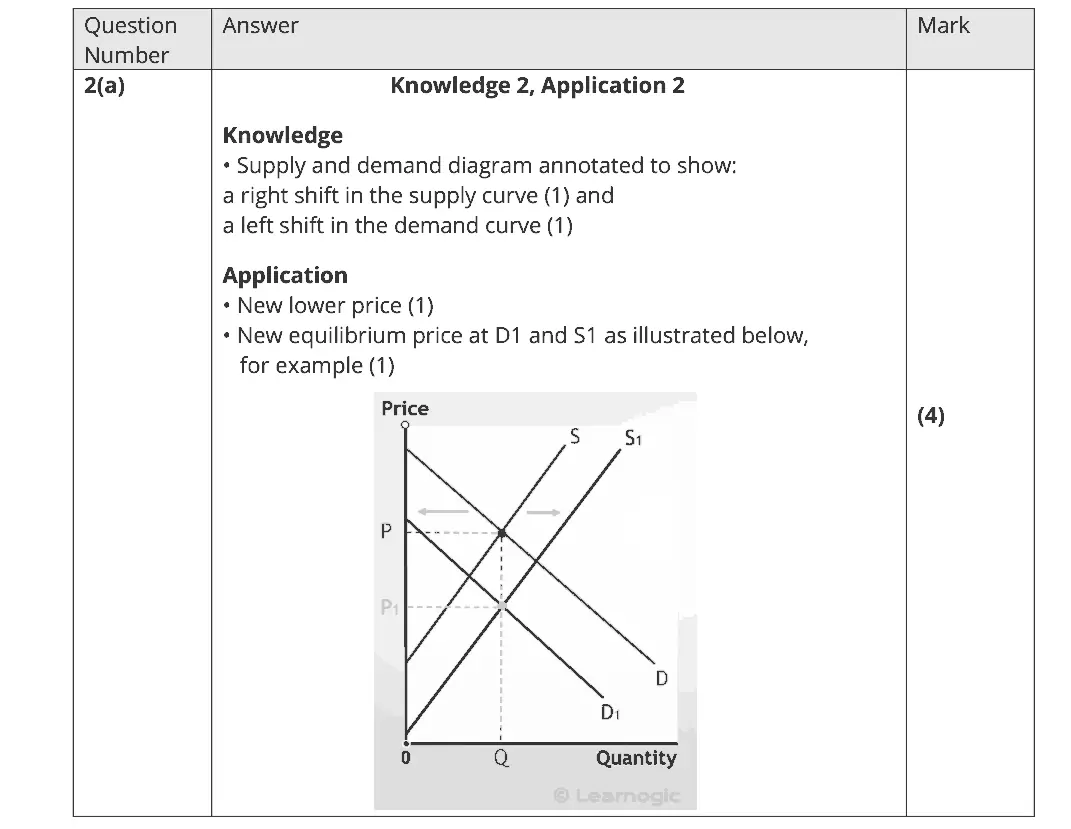
November 2021 · Paper 1 · Q2(a) 4 marks AO1=2, AO2=2 Diagram supply and demand
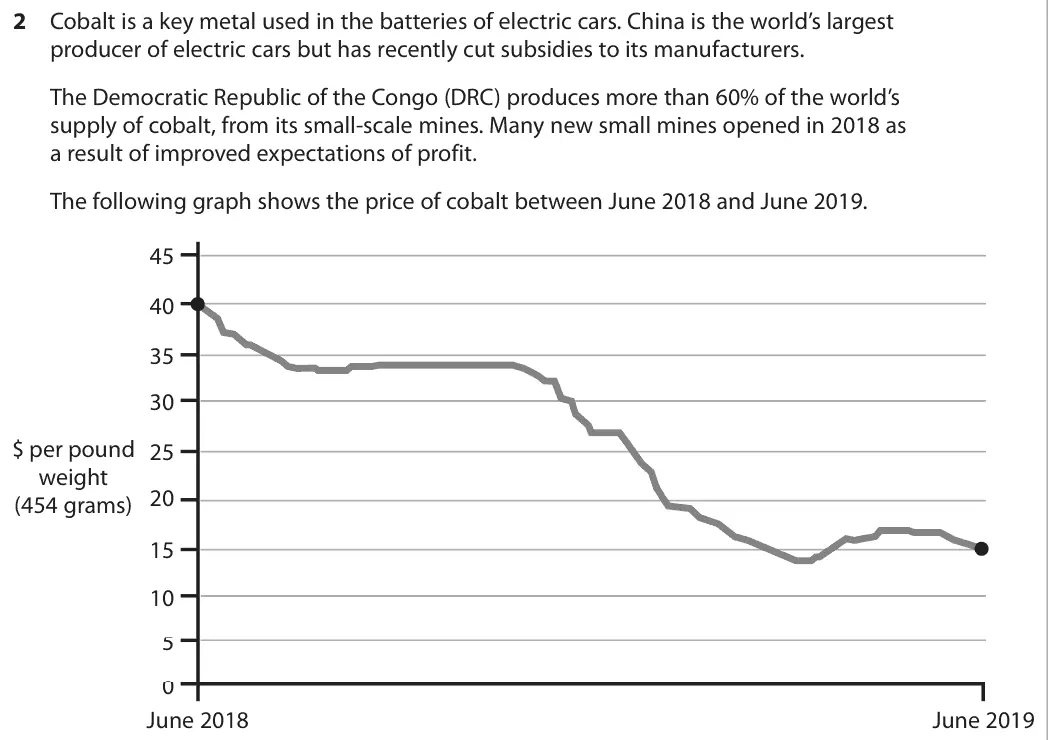
Data and extracts for question 22 Cobalt is a key metal used in the batteries of electric cars. China is the world’s largest producer of electric cars but has recently cut subsidies to its manufacturers. The Democratic Republic of the Congo (DRC) produces more than 60% of the world’s supply of cobalt, from its small-scale mines. Many new small mines opened in 2018 as a result of improved expectations of profit. The following graph shows the price of cobalt between June 2018 and June 2019. 45 40 35 30 $ per pound 25 weight 20 (454 grams) 15 10 5 0 June 2018 June 2019

(a) With reference to the information provided, draw a supply and demand diagram to show why the price of cobalt fell between June 2018 and June 2019. (4)
November 2021 · Paper 1 · Q3(a) 4 marks AO1=2, AO2=2 Diagram monopoly
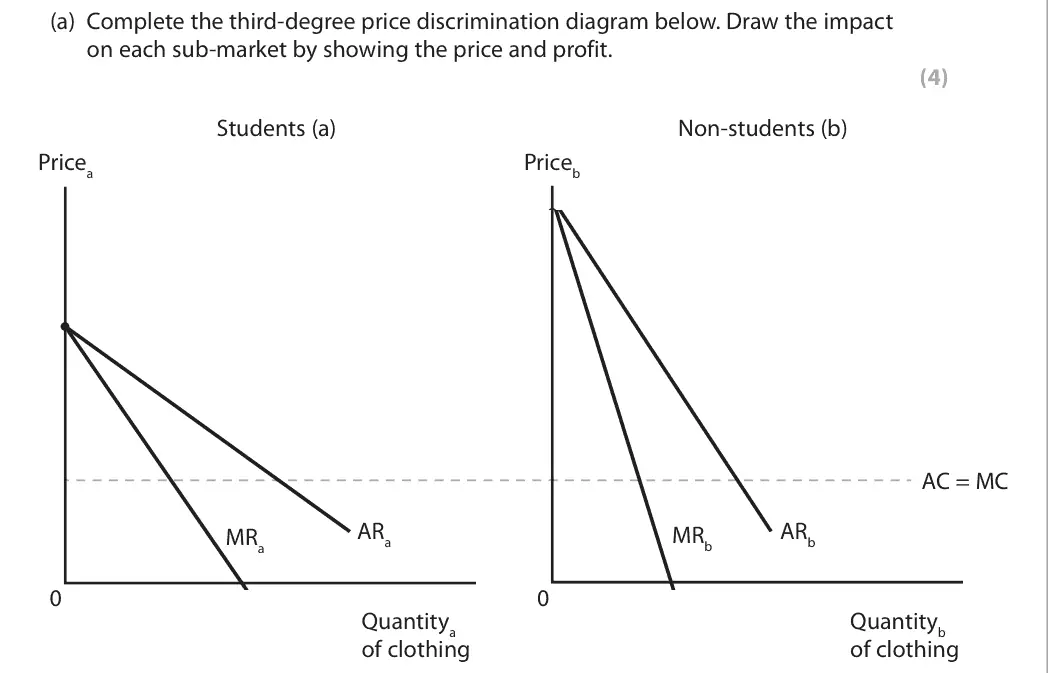
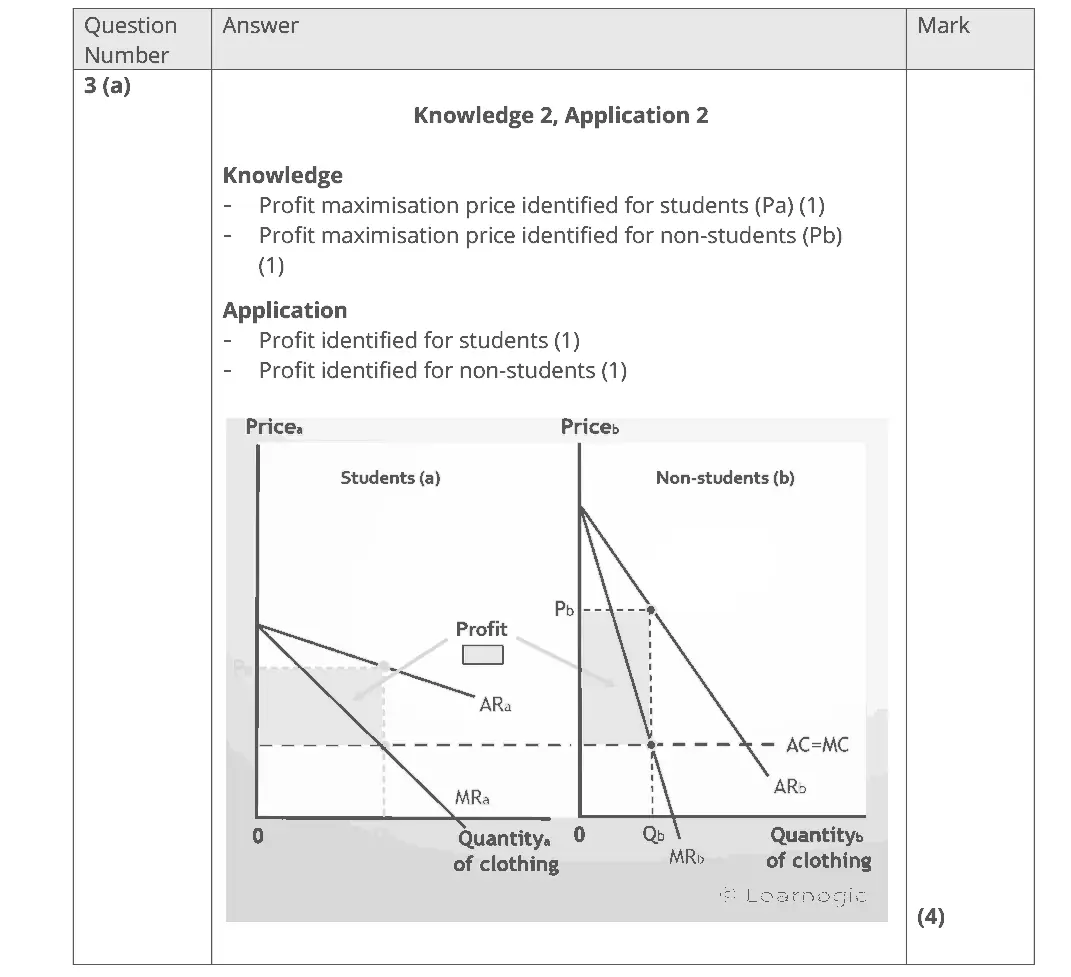
Data and extracts for question 33 River Island is a clothing retailer. Students are offered a River Island student discount code to benefit from a 10% price reduction as an attempt by the firm to increase profit.
(a) Complete the third-degree price discrimination diagram below. Draw the impact on each sub-market by showing the price and profit. (4) Students (a) Non-students (b) Pricea Priceb AC = MC ARa ARb MRb MRa 0 0 Quantitya Quantityb of clothing of clothing
November 2021 · Paper 1 · Q5(a) 4 marks AO1=2, AO2=2 Diagram market structures and efficiency
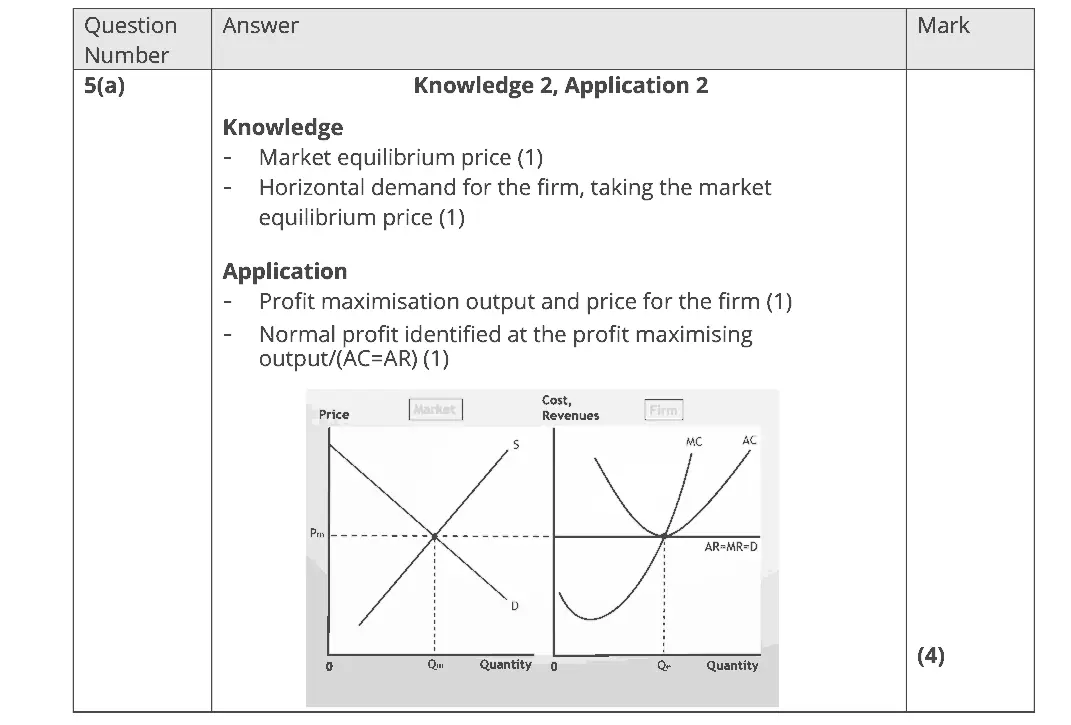
Data and extracts for question 55 In Sicily, many households can grow lemons of the same quality as each other. Chiara decides to sell lemons at her local market, expecting to make a normal profit. She notices that all of the many lemon sellers are charging exactly the same price.
(a) Draw diagrams showing the equilibrium positions for both the lemon market and a typical firm in the long run. (4) Firm Market
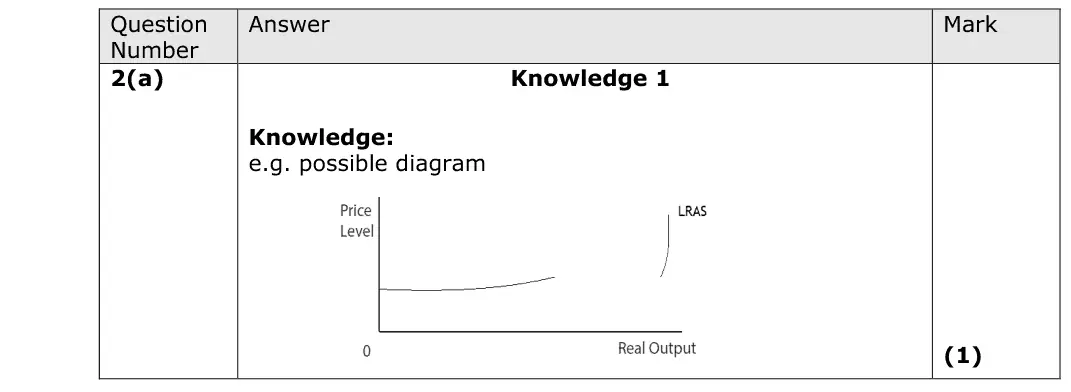
October 2020 · AS Paper 2 · Q2(a) 1 mark AO1=1 Diagram aggregate supply
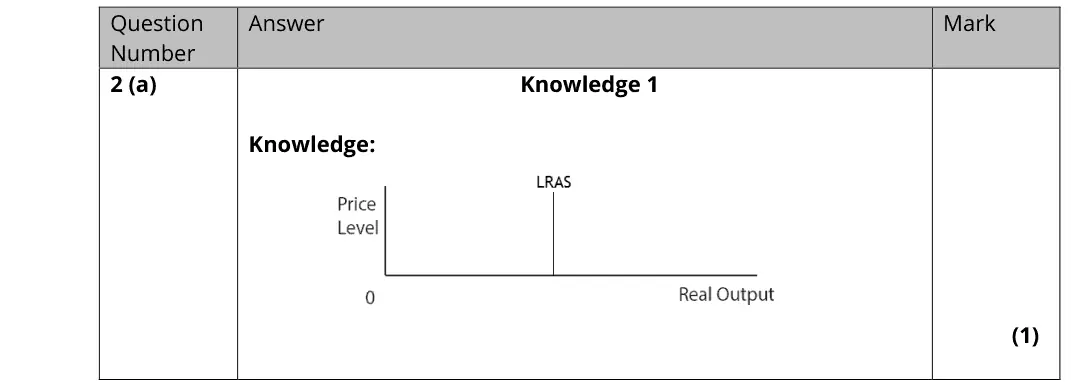
(a) Illustrate the shape of the Classical long-run aggregate supply (AS) curve on the diagram below. (1)
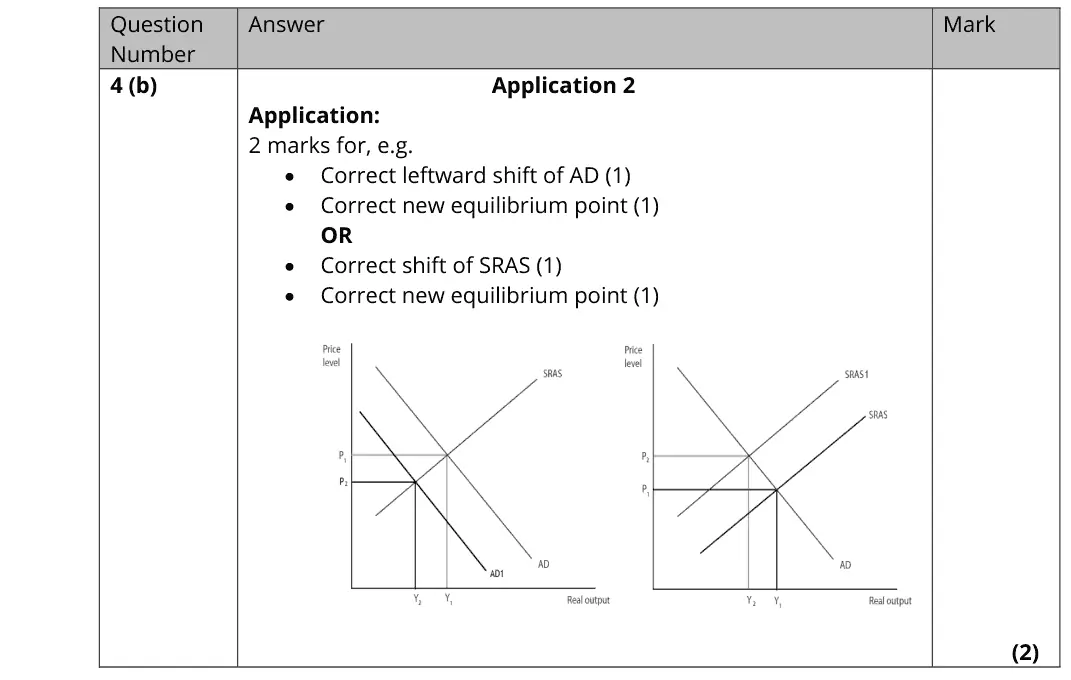
October 2020 · AS Paper 2 · Q4(b) 2 marks AO2=2 Diagram fiscal and monetary policynational income and the multiplier
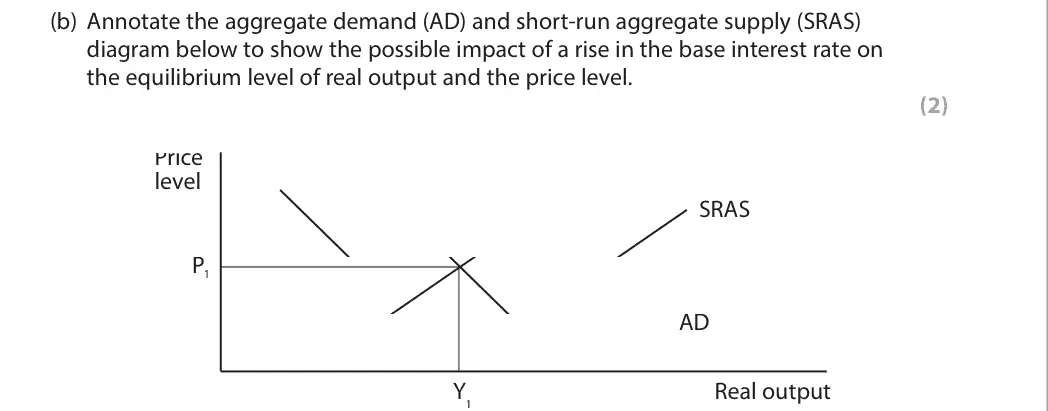
Data and extracts for question 44 In August 2018 the Monetary Policy Committee of the Bank of England raised the UK’s base interest rate from 0.5% to 0.75%.
(b) Annotate the aggregate demand (AD) and short-run aggregate supply (SRAS) diagram below to show the possible impact of a rise in the base interest rate on the equilibrium level of real output and the price level. (2) Price level SRAS P1 AD Y Real output 1
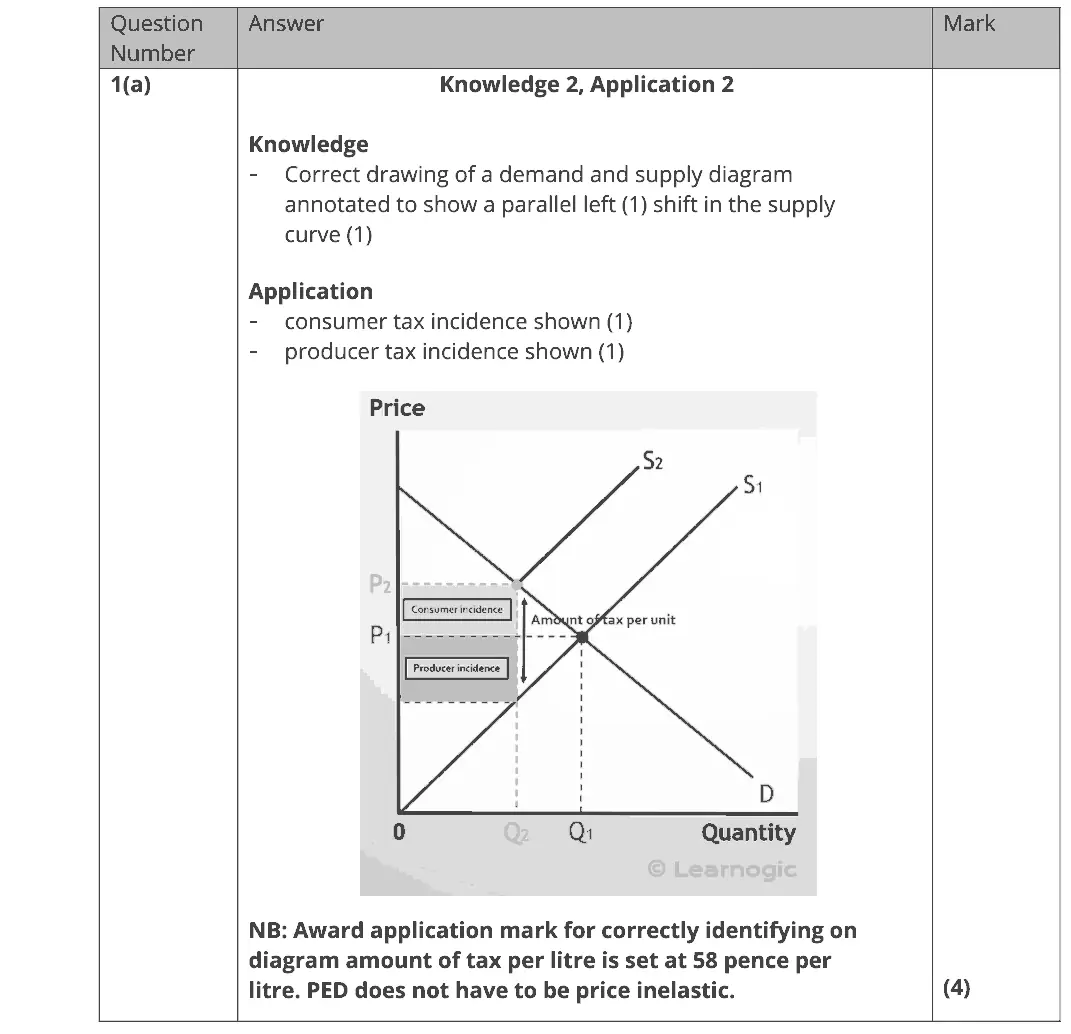
October 2020 · Paper 1 · Q1(a) 4 marks AO1=2, AO2=2 Diagram indirect taxes and subsidies
Data and extracts for question 11 Fuel duty is an excise tax imposed on the sale of petrol, included in the price paid by consumers, set at 58 pence per litre. (Source: https://www.gov.uk/tax-on-shopping/fuel-duty)
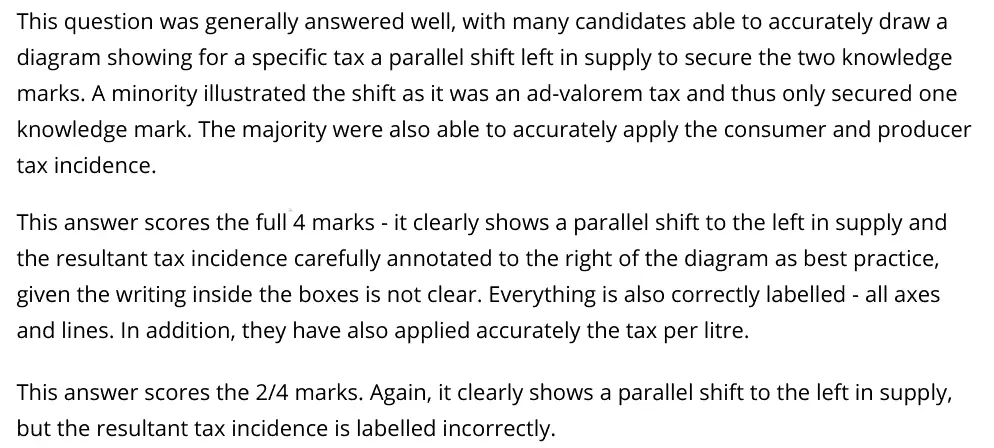
(a) Draw a supply and demand diagram to show the incidence of a specific petrol tax on consumers and producers. (4)
October 2020 · Paper 1 · Q2(a) 4 marks AO1=2, AO2=2 Diagram externalities
Data and extracts for question 22 The external benefits of higher education include increased tax revenue, faster economic growth, greater innovation and labour market flexibility. (Source adapted from: https://www.timeshighereducation.com/news/higher-education-its- good-for-you-and-society/2008681.article#survey-answer)
(a) Draw an externalities diagram to show the likely impact of the consumption of higher education. (4)
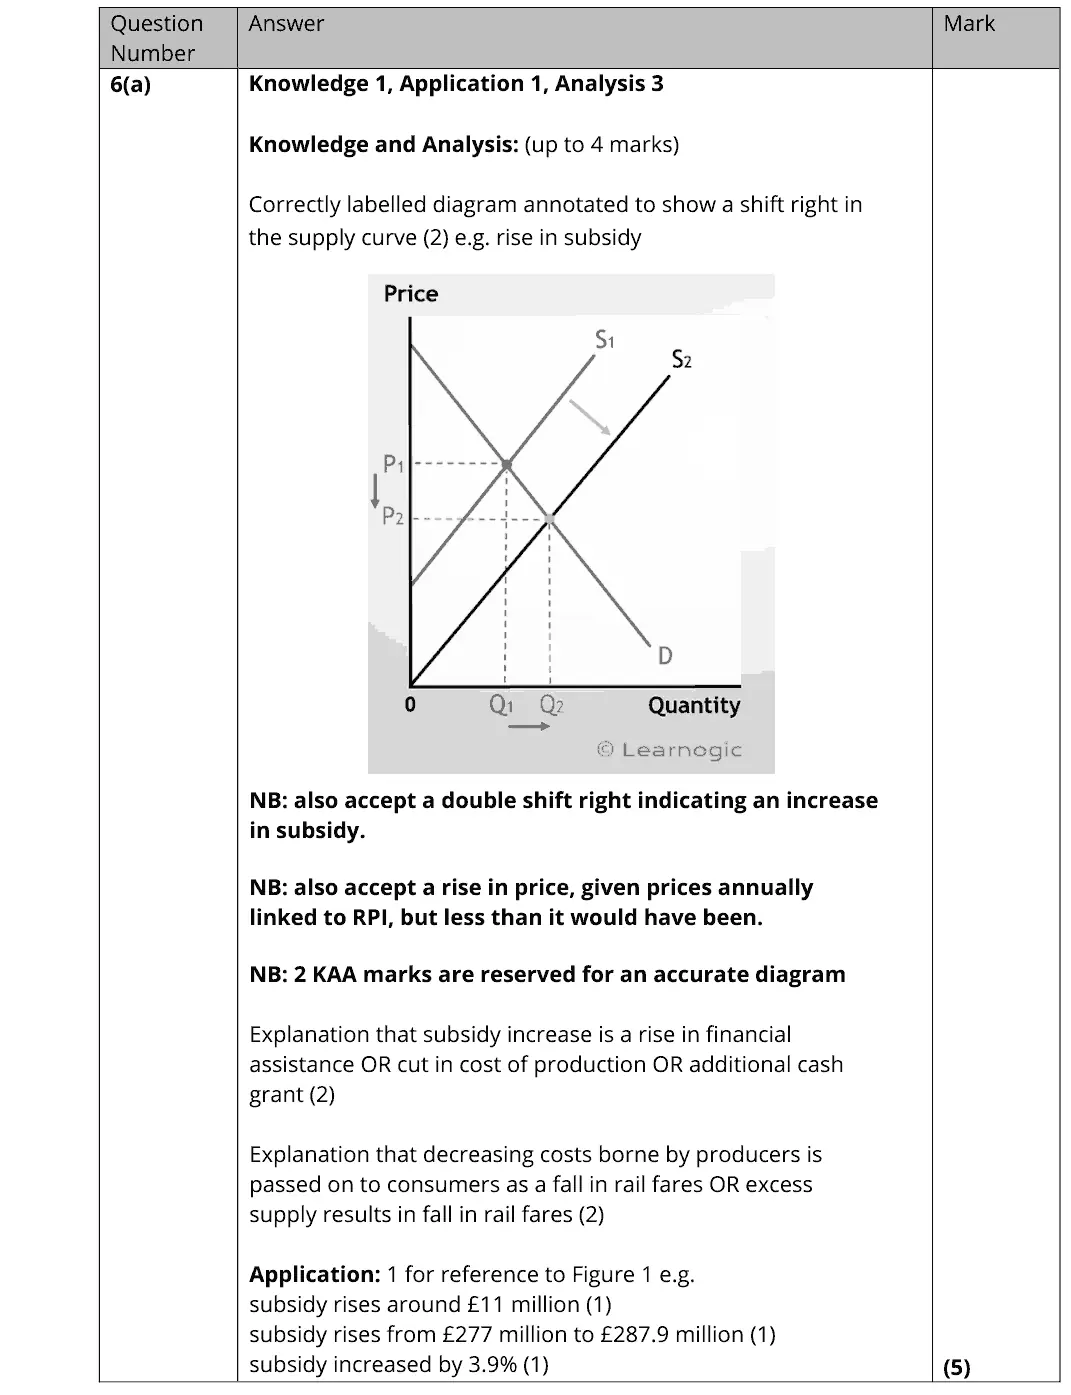
October 2020 · Paper 1 · Q6(a) 5 marks AO1=1, AO2=1, AO3=3 Diagram indirect taxes and subsidiessupply and demand
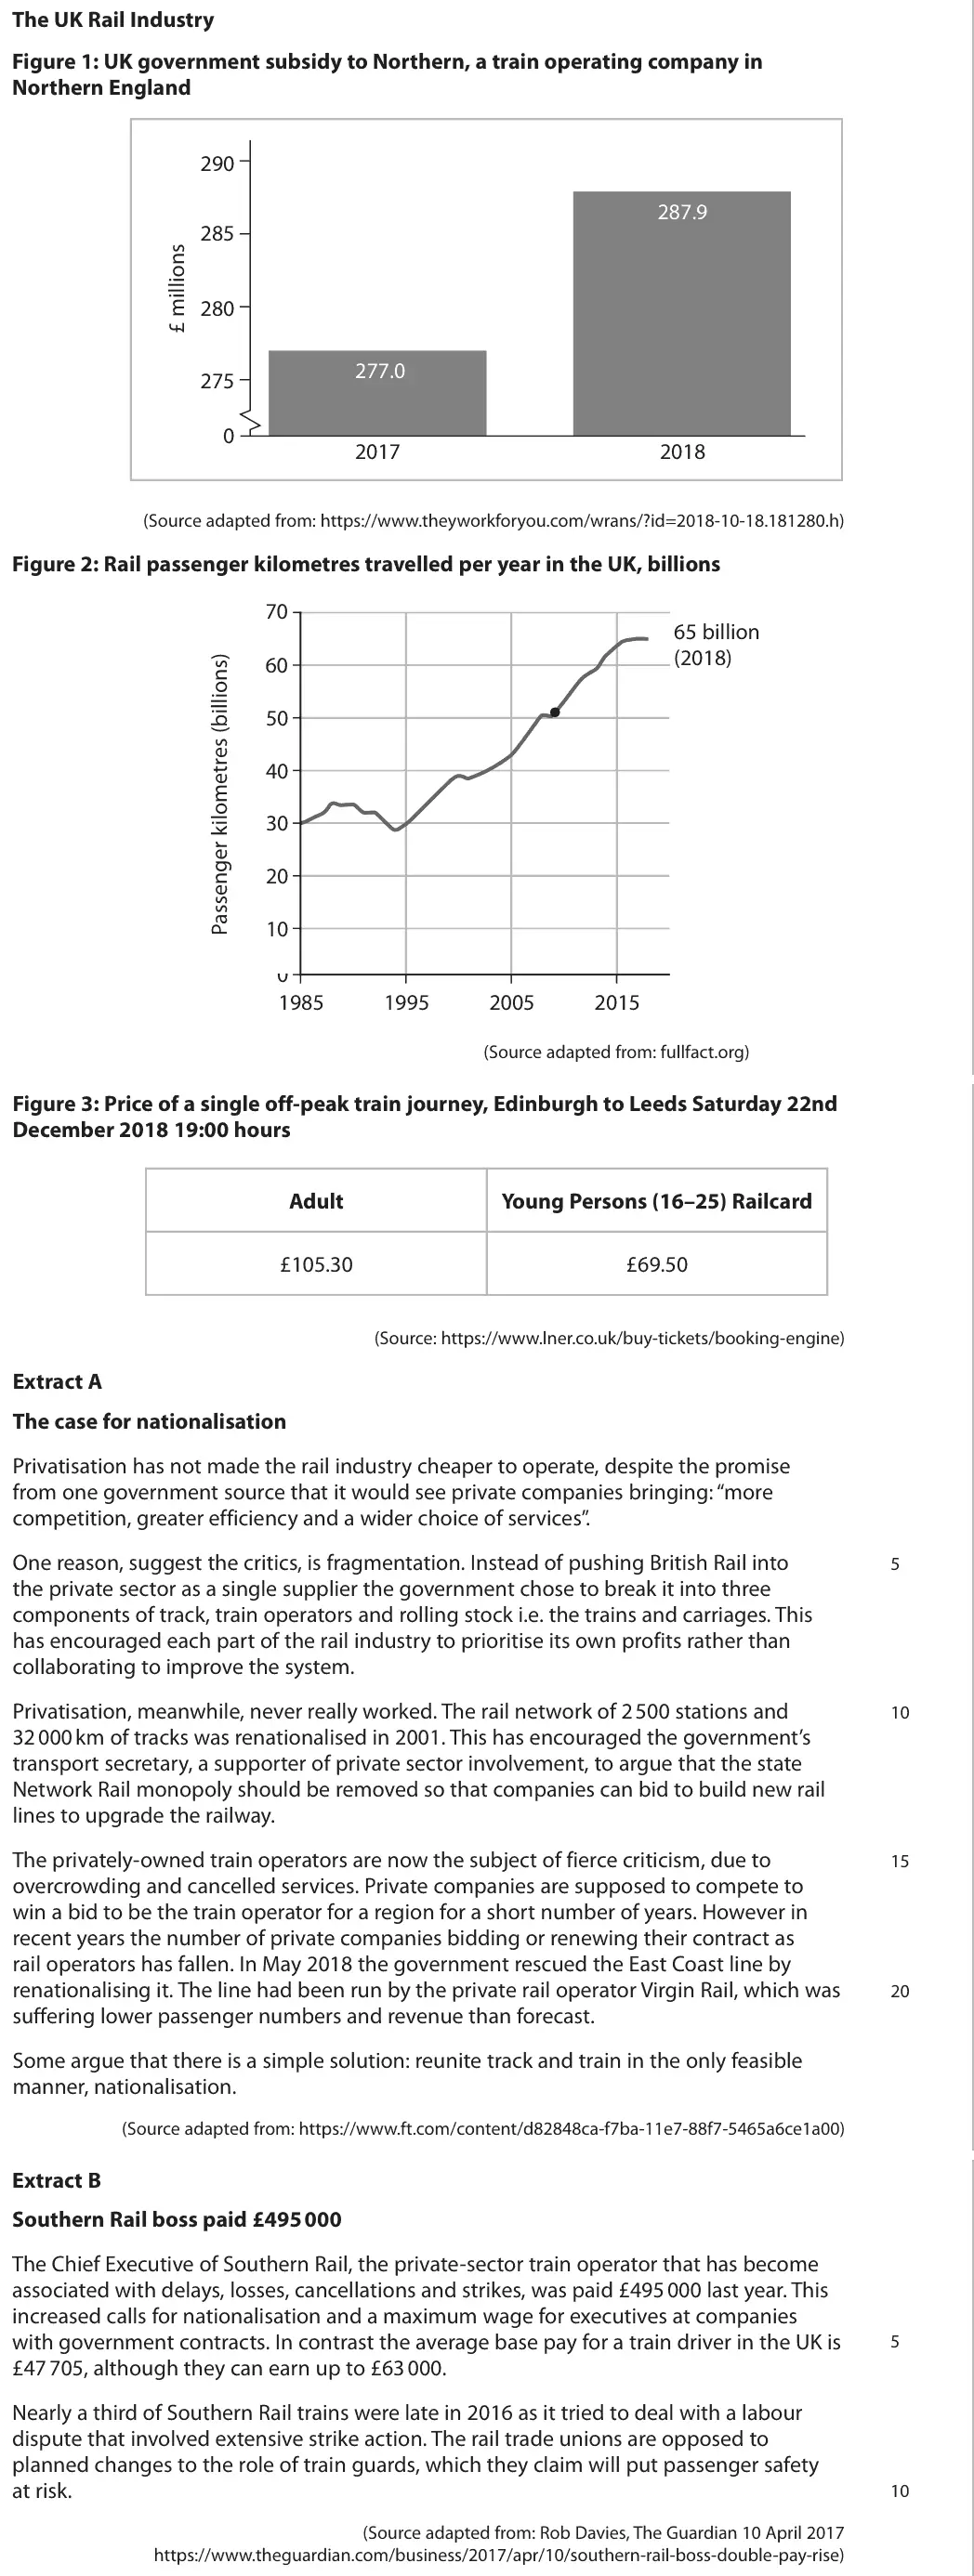
Data and extracts for question 6The UK Rail Industry Figure 1: UK government subsidy to Northern, a train operating company in Northern England 290 287.9 285 280 277.0 275 0 2017 2018 (Source adapted from: https://www.theyworkforyou.com/wrans/?id=2018-10-18.181280.h) Figure 2: Rail passenger kilometres travelled per year in the UK, billions 70 65 billion (2018) 60 50 40 30 20 10 0 1985 1995 2005 2015 (Source adapted from: fullfact.org) Figure 3: Price of a single off-peak train journey, Edinburgh to Leeds Saturday 22nd December 2018 19:00 hours Adult Young Persons (16–25) Railcard £105.30 £69.50 (Source: https://www.lner.co.uk/buy-tickets/booking-engine) Extract A The case for nationalisation Privatisation has not made the rail industry cheaper to operate, despite the promise from one government source that it would see private companies bringing: “more competition, greater efficiency and a wider choice of services”. One reason, suggest the critics, is fragmentation. Instead of pushing British Rail into 5 the private sector as a single supplier the government chose to break it into three components of track, train operators and rolling stock i.e. the trains and carriages. This has encouraged each part of the rail industry to prioritise its own profits rather than collaborating to improve the system. Privatisation, meanwhile, never really worked. The rail network of 2 500 stations and 10 32 000 km of tracks was renationalised in 2001. This has encouraged the government’s transport secretary, a supporter of private sector involvement, to argue that the state Network Rail monopoly should be removed so that companies can bid to build new rail lines to upgrade the railway. The privately-owned train operators are now the subject of fierce criticism, due to 15 overcrowding and cancelled services. Private companies are supposed to compete to win a bid to be the train operator for a region for a short number of years. However in recent years the number of private companies bidding or renewing their contract as rail operators has fallen. In May 2018 the government rescued the East Coast line by renationalising it. The line had been run by the private rail operator Virgin Rail, which was 20 suffering lower passenger numbers and revenue than forecast. Some argue that there is a simple solution: reunite track and train in the only feasible manner, nationalisation. (Source adapted from: https://www.ft.com/content/d82848ca-f7ba-11e7-88f7-5465a6ce1a00) Extract B Southern Rail boss paid £495 000 The Chief Executive of Southern Rail, the private-sector train operator that has become associated with delays, losses, cancellations and strikes, was paid £495 000 last year. This increased calls for nationalisation and a maximum wage for executives at companies with government contracts. In contrast the average base pay for a train driver in the UK is 5 £47 705, although they can earn up to £63 000. Nearly a third of Southern Rail trains were late in 2016 as it tried to deal with a labour dispute that involved extensive strike action. The rail trade unions are opposed to planned changes to the role of train guards, which they claim will put passenger safety at risk. 10 (Source adapted from: Rob Davies, The Guardian 10 April 2017 https://www.theguardian.com/business/2017/apr/10/southern-rail-boss-double-pay-rise)
(a) Refer to Figure 1. Explain the likely effect of the change in subsidy levels between 2017 and 2018 on rail fares. Include a supply and demand diagram in your answer. (5)
October 2020 · Paper 2 · Q5(a) 4 marks AO1=2, AO2=2 Diagram national income and the multiplieraggregate supply
Data and extracts for question 55 The Hong Kong‑Zhuhai‑Macau Bridge is the world’s longest sea bridge. It reduces the journey time from Hong Kong to Zhuhai from 4 hours to just 30 minutes. It cost the equivalent of $18.8 billion and was government funded. (Source adapted from: www.theguardian.com)
(a) Draw an aggregate demand and aggregate supply diagram to show the likely impact of this new bridge on the price level and real output in the region. (4)
June 2019 · AS Paper 2 · Q2(a) 1 mark AO1=1 Diagram aggregate supply
(a) Illustrate the shape of the Keynesian long-run AS curve on the diagram below. (1)
June 2019 · AS Paper 2 · Q4(b) 2 marks AO2=2 Diagram supply side policiesnational income and the multiplier
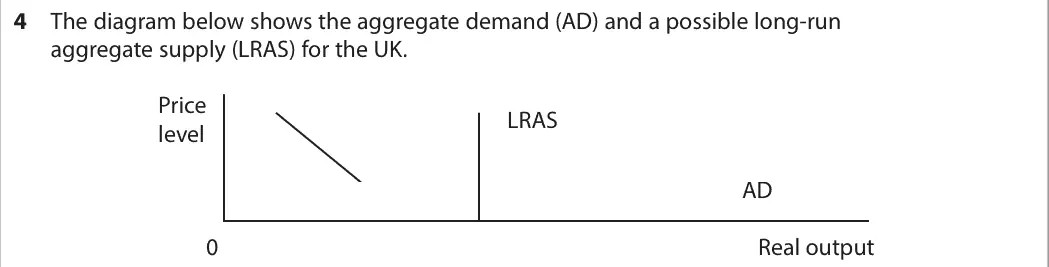
Data and extracts for question 44 The diagram below shows the aggregate demand (AD) and a possible long-run aggregate supply (LRAS) for the UK. Price LRAS level AD 0 Real output
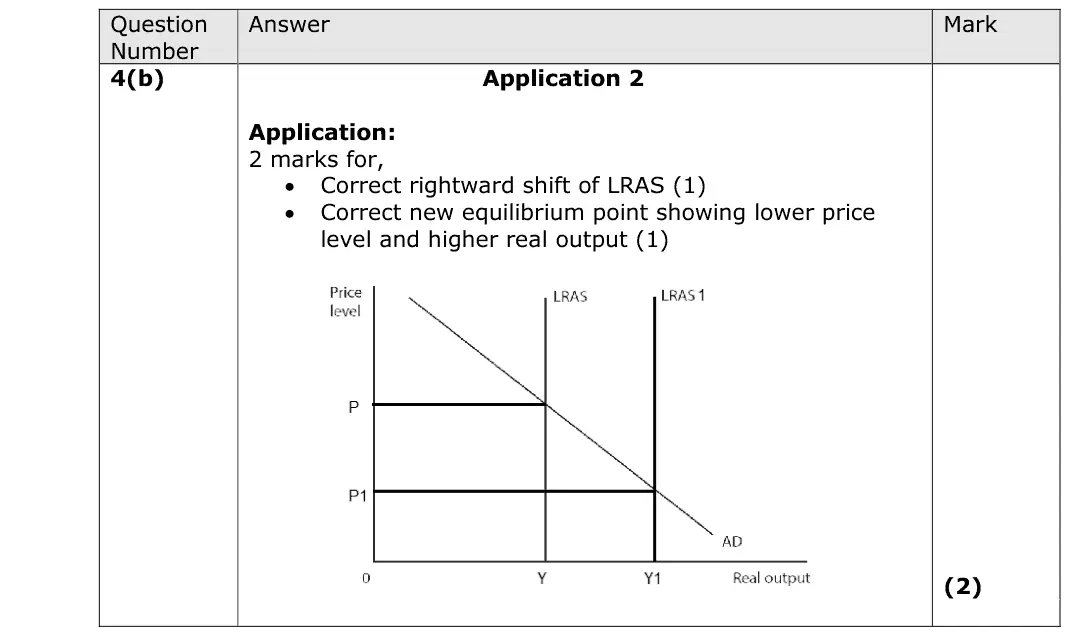
(b) Annotate the diagram above to show the likely impact of government policy to promote business competition on the equilibrium level of real output and price level. (2)
June 2019 · Paper 1 · Q2(a) 4 marks AO1=2, AO2=2 Diagram supply and demand
Data and extracts for question 22 In August 2017 Hurricane Harvey caused the closure of nearly a quarter of the oil production capacity in the United States.
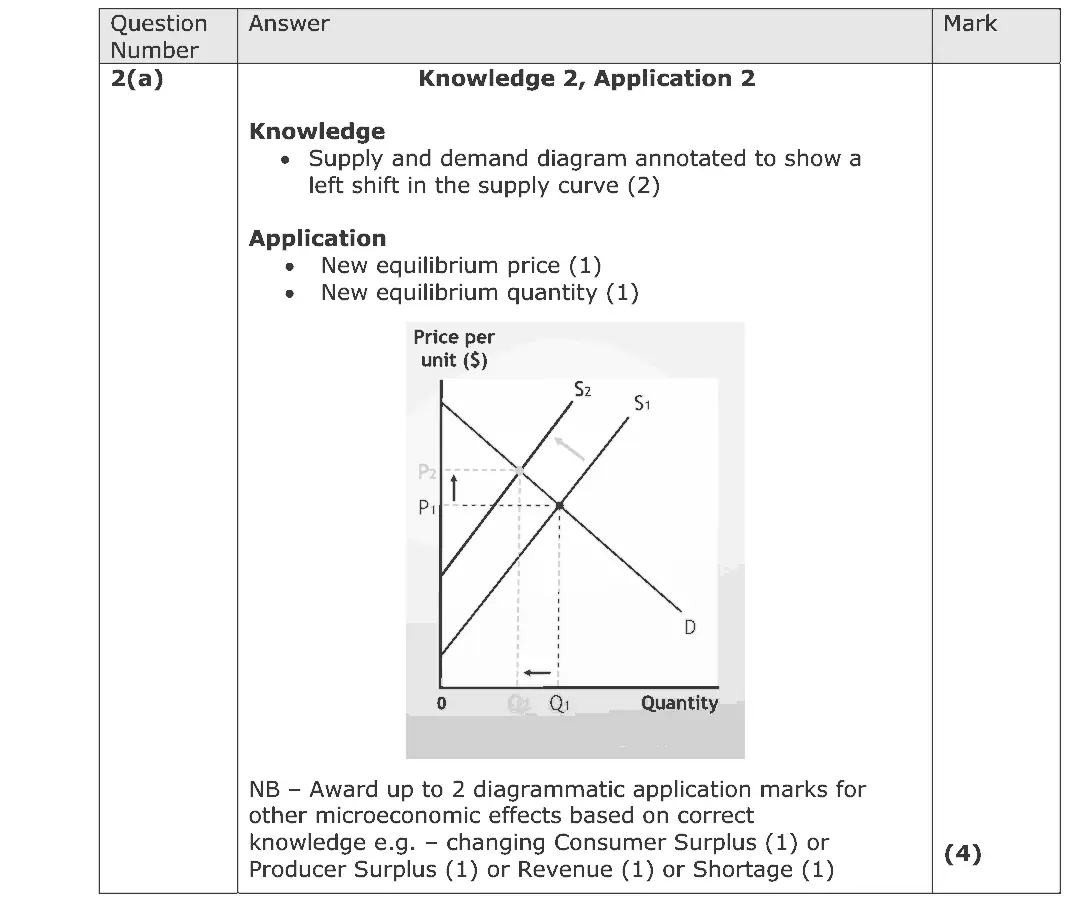
(a) Draw a supply and demand diagram to show the likely microeconomic effects of the hurricane on the US oil market. (4)
June 2019 · Paper 1 · Q3(b) 4 marks AO1=2, AO2=2 Diagram Hard market structures and efficiency
Data and extracts for question 33 According to the Royal Mail, more hair and beauty salons opened on UK high streets last year than any other type of independent business, with a net increase of 10%, representing 626 new salons. (Source: adapted from https://www.theguardian.com/small-business-network/2016/nov/18/ beauty-boom-or-bust-uk-too-many-salons)

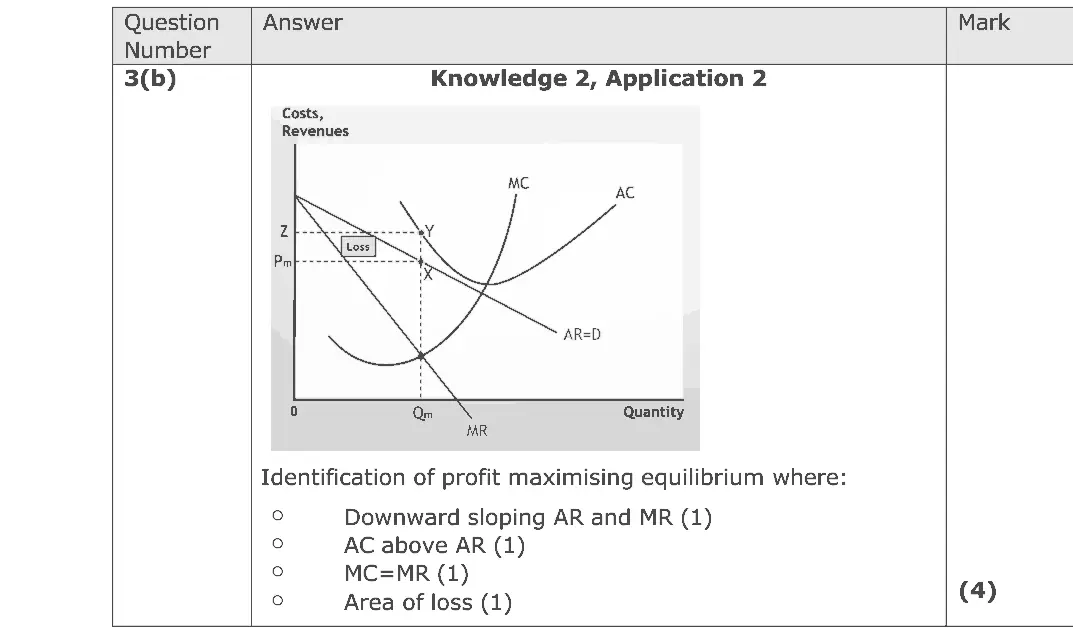
(b) Draw a cost and revenue diagram to show the long-run equilibrium of a firm in monopolistic competition. (4)
June 2019 · Paper 2 · Q2(a) 4 marks AO1=2, AO2=2 Diagram national income and the multiplier
Data and extracts for question 22 The International Monetary Fund has called on the G20 group of large industrialised countries to boost government spending on infrastructure. (Source: https://www.theguardian.com/business/2016/jul/23/ imf-calls-for-more-government-spending-as-rate-cuts-lose-their-impact)
(a) Draw an aggregate demand and aggregate supply diagram to show the likely impact of an increase in government spending on infrastructure on a country’s price level and real output. (4)
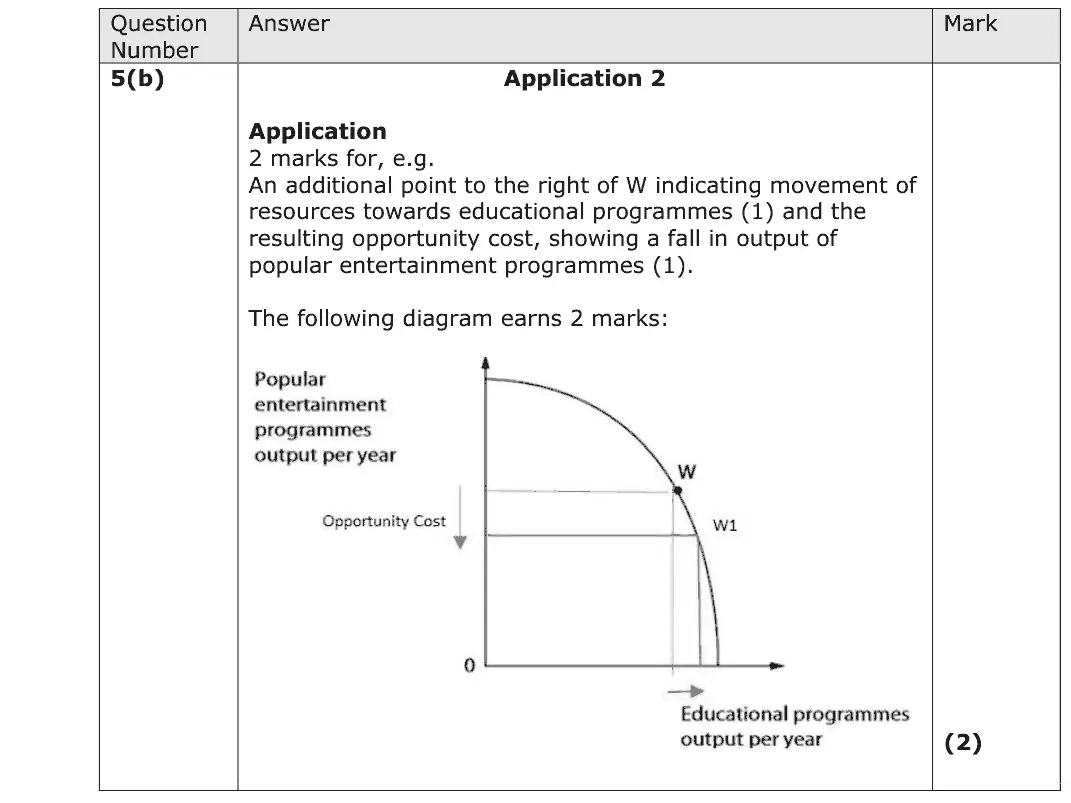
June 2018 · AS Paper 1 · Q5(b) 2 marks AO2=2 Diagram production possibility frontiers
Data and extracts for question 55 The British Broadcasting Corporation (BBC) is a TV broadcaster. It is financed through an annual TV licence fee of £145.50. At this fee level many TV owners benefit from consumer surplus.
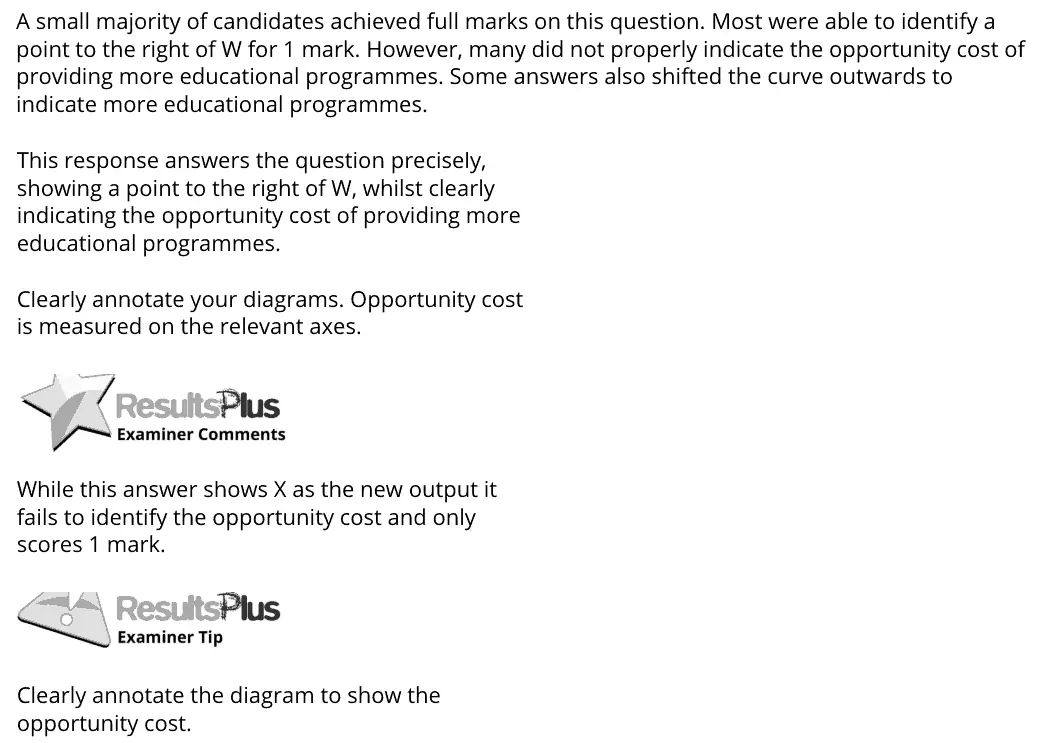
(b) The diagram shows the production possibility frontier for the BBC. Assuming the BBC is at point W, annotate the diagram to show the opportunity cost of providing more educational programmes. (2)
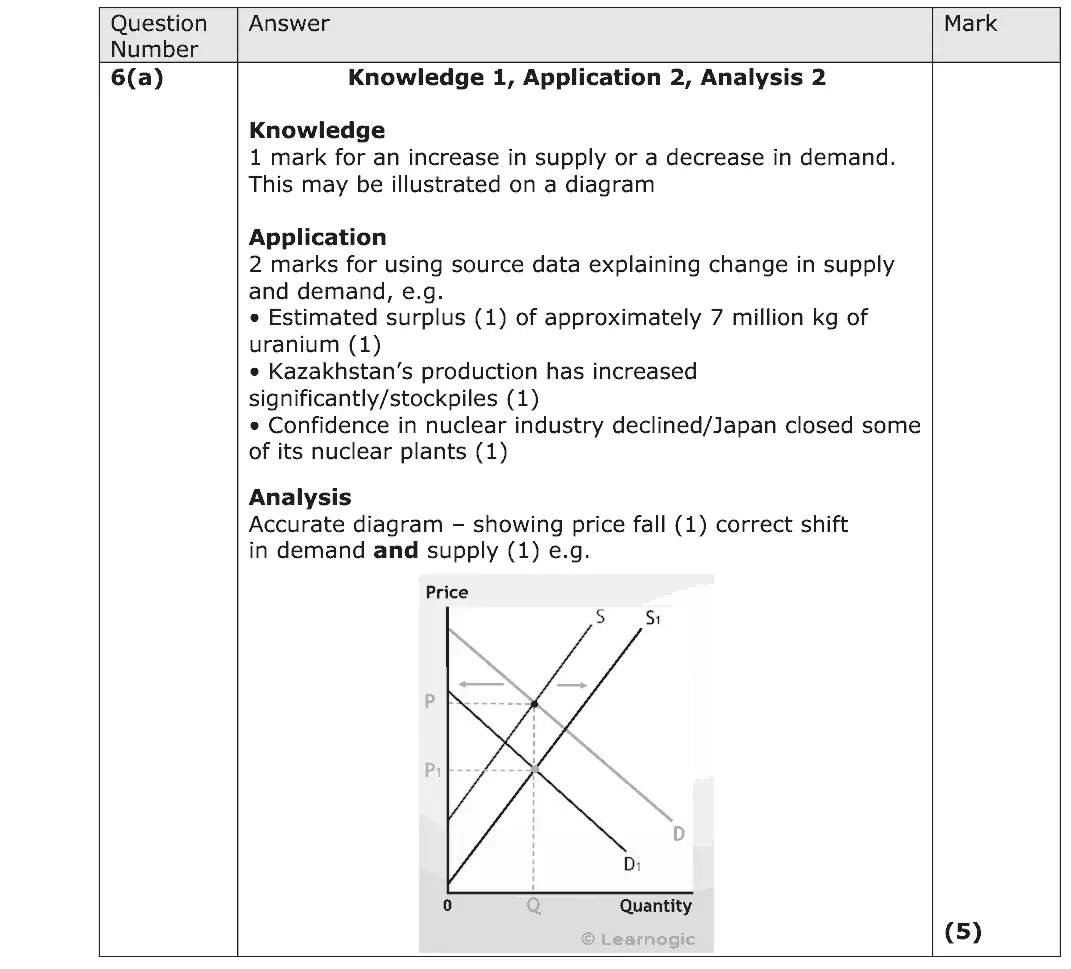
June 2018 · AS Paper 1 · Q6(a) 5 marks AO1=1, AO2=2, AO3=2 Diagram supply and demand
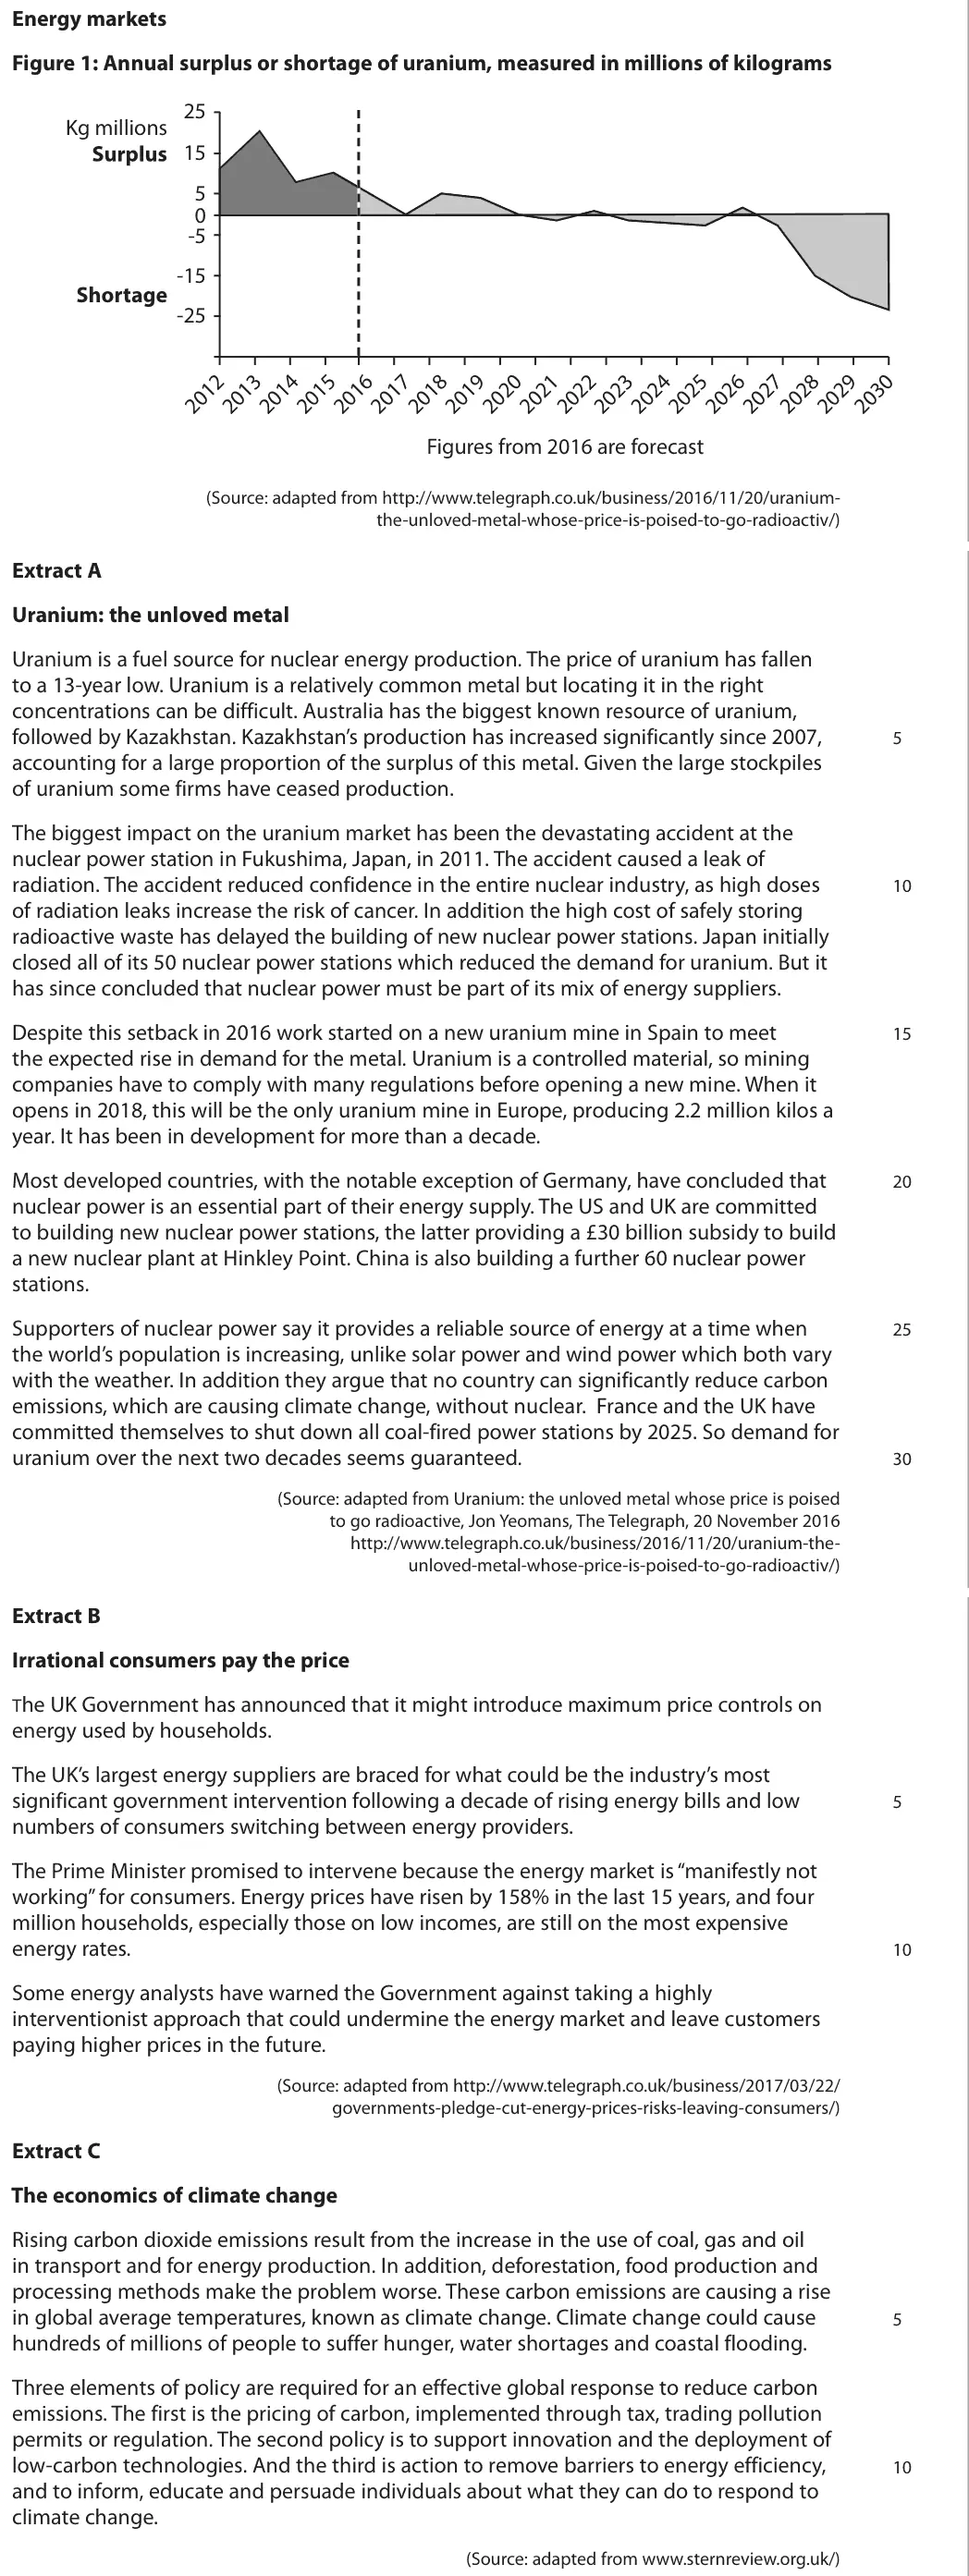
Data and extracts for question 6Energy markets Figure 1: Annual surplus or shortage of uranium, measured in millions of kilograms 25 Kg millions 15 5 0 -5 -15 -25 Figures from 2016 are forecast (Source: adapted from http://www.telegraph.co.uk/business/2016/11/20/uranium- the-unloved-metal-whose-price-is-poised-to-go-radioactiv/) Extract A Uranium: the unloved metal Uranium is a fuel source for nuclear energy production. The price of uranium has fallen to a 13-year low. Uranium is a relatively common metal but locating it in the right concentrations can be difficult. Australia has the biggest known resource of uranium, followed by Kazakhstan. Kazakhstan’s production has increased significantly since 2007, 5 accounting for a large proportion of the surplus of this metal. Given the large stockpiles of uranium some firms have ceased production. The biggest impact on the uranium market has been the devastating accident at the nuclear power station in Fukushima, Japan, in 2011. The accident caused a leak of radiation. The accident reduced confidence in the entire nuclear industry, as high doses 10 of radiation leaks increase the risk of cancer. In addition the high cost of safely storing radioactive waste has delayed the building of new nuclear power stations. Japan initially closed all of its 50 nuclear power stations which reduced the demand for uranium. But it has since concluded that nuclear power must be part of its mix of energy suppliers. Despite this setback in 2016 work started on a new uranium mine in Spain to meet 15 the expected rise in demand for the metal. Uranium is a controlled material, so mining companies have to comply with many regulations before opening a new mine. When it opens in 2018, this will be the only uranium mine in Europe, producing 2.2 million kilos a year. It has been in development for more than a decade. Most developed countries, with the notable exception of Germany, have concluded that 20 nuclear power is an essential part of their energy supply. The US and UK are committed to building new nuclear power stations, the latter providing a £30 billion subsidy to build a new nuclear plant at Hinkley Point. China is also building a further 60 nuclear power stations. Supporters of nuclear power say it provides a reliable source of energy at a time when 25 the world’s population is increasing, unlike solar power and wind power which both vary with the weather. In addition they argue that no country can significantly reduce carbon emissions, which are causing climate change, without nuclear. France and the UK have committed themselves to shut down all coal-fired power stations by 2025. So demand for uranium over the next two decades seems guaranteed. 30 (Source: adapted from Uranium: the unloved metal whose price is poised to go radioactive, Jon Yeomans, The Telegraph, 20 November 2016 http://www.telegraph.co.uk/business/2016/11/20/uranium-the- unloved-metal-whose-price-is-poised-to-go-radioactiv/) Extract B Irrational consumers pay the price The UK Government has announced that it might introduce maximum price controls on energy used by households. The UK’s largest energy suppliers are braced for what could be the industry’s most significant government intervention following a decade of rising energy bills and low 5 numbers of consumers switching between energy providers. The Prime Minister promised to intervene because the energy market is “manifestly not working” for consumers. Energy prices have risen by 158% in the last 15 years, and four million households, especially those on low incomes, are still on the most expensive energy rates. 10 Some energy analysts have warned the Government against taking a highly interventionist approach that could undermine the energy market and leave customers paying higher prices in the future. (Source: adapted from http://www.telegraph.co.uk/business/2017/03/22/ governments-pledge-cut-energy-prices-risks-leaving-consumers/) Extract C The economics of climate change Rising carbon dioxide emissions result from the increase in the use of coal, gas and oil in transport and for energy production. In addition, deforestation, food production and processing methods make the problem worse. These carbon emissions are causing a rise in global average temperatures, known as climate change. Climate change could cause 5 hundreds of millions of people to suffer hunger, water shortages and coastal flooding. Three elements of policy are required for an effective global response to reduce carbon emissions. The first is the pricing of carbon, implemented through tax, trading pollution permits or regulation. The second policy is to support innovation and the deployment of low-carbon technologies. And the third is action to remove barriers to energy efficiency, 10 and to inform, educate and persuade individuals about what they can do to respond to climate change. (Source: adapted from www.sternreview.org.uk/)
(a) With reference to Figure 1 and Extract A, explain why the price of uranium has ‘fallen to a 13-year low’ (Extract A, lines 2 and 3) in 2016. Include a supply and demand diagram in your answer. (5)
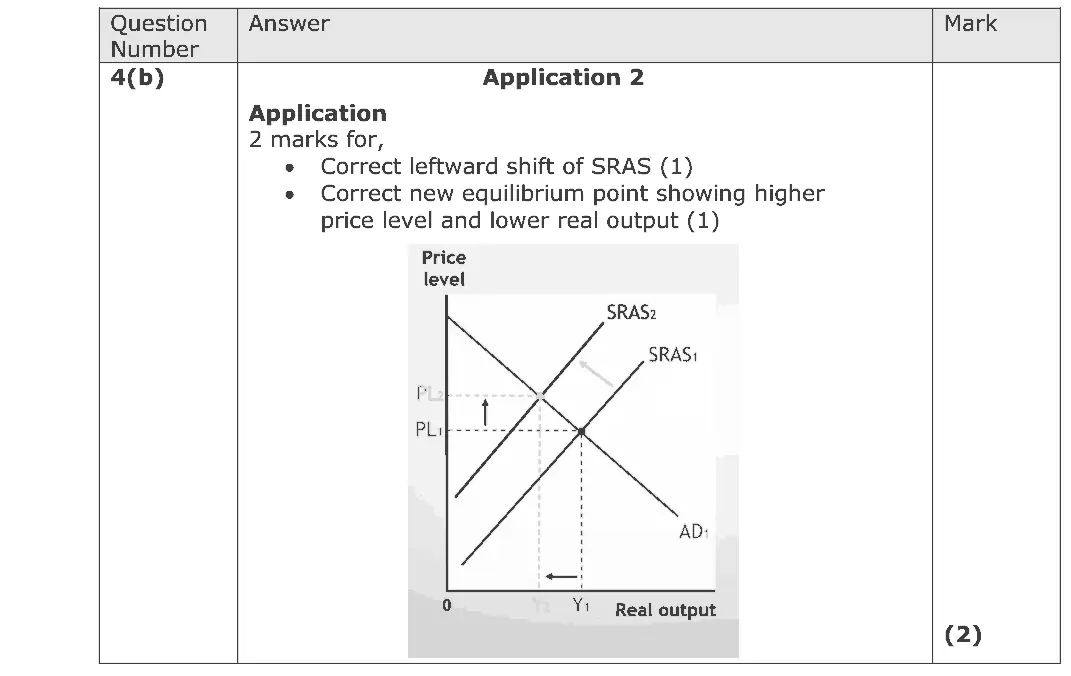
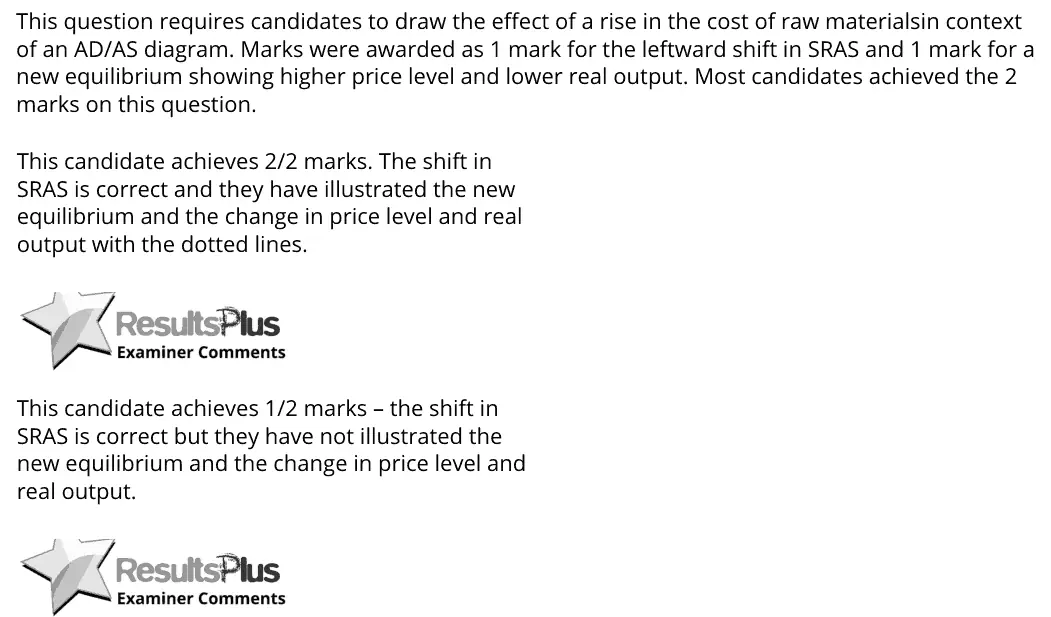
June 2018 · AS Paper 2 · Q4(b) 2 marks AO2=2 Diagram aggregate supplynational income and the multiplier
Data and extracts for question 44 The diagram below shows the aggregate demand (AD) and short-run aggregate supply (SRAS) for the UK. Price level SRAS P1 AD Real output Y1
(b) Annotate the diagram above to show the likely impact of a rise in the cost of raw materials on the UK’s equilibrium level of real output and price level. (2)
June 2018 · Paper 2 · Q2(b) 4 marks AO1=2, AO2=2 Diagram fiscal and monetary policynational income and the multiplier
(b) Draw an aggregate demand and aggregate supply diagram illustrating the likely impact of a rise in interest rates on the price level and real output. (4)
June 2017 · AS Paper 1 · Q3(c) 2 marks AO2=2 Diagram indirect taxes and subsidiessupply and demand
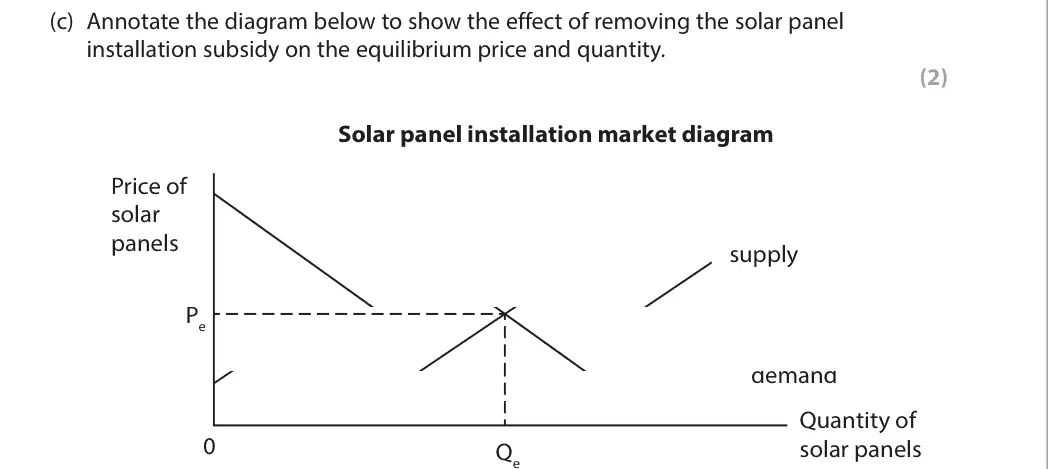
Data and extracts for question 33 In 2015 the UK government cut subsidies for the installation of solar energy panels.
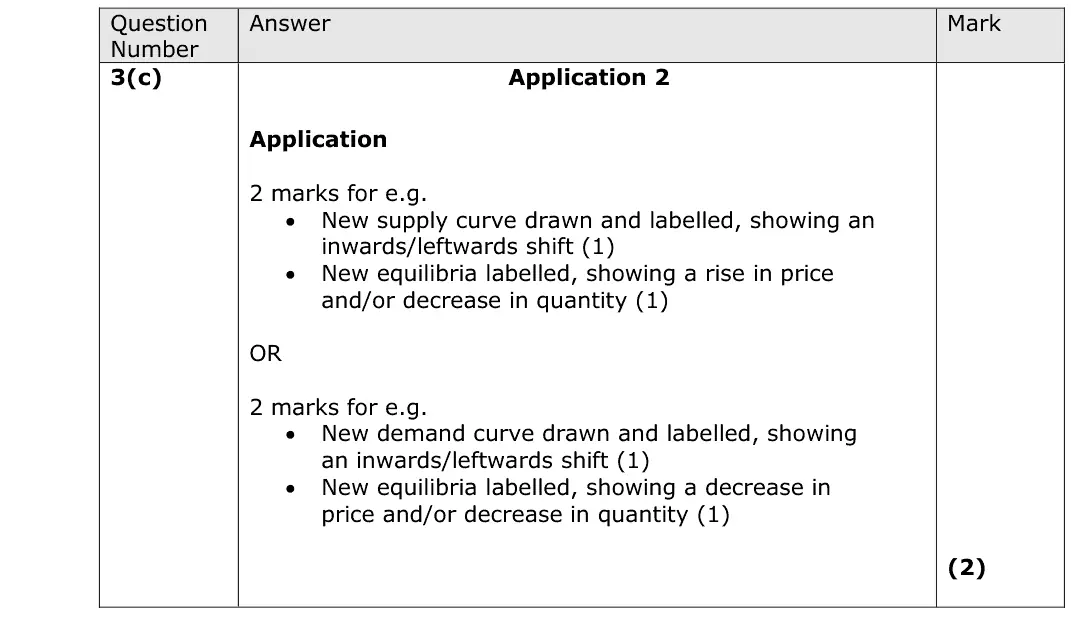
(c) Annotate the diagram below to show the effect of removing the solar panel installation subsidy on the equilibrium price and quantity. (2) Solar panel installation market diagram Price of solar panels supply Pe demand Quantity of 0 solar panels Qe
June 2017 · AS Paper 1 · Q6(a) 5 marks AO1=1, AO2=2, AO3=2 Diagram supply and demand
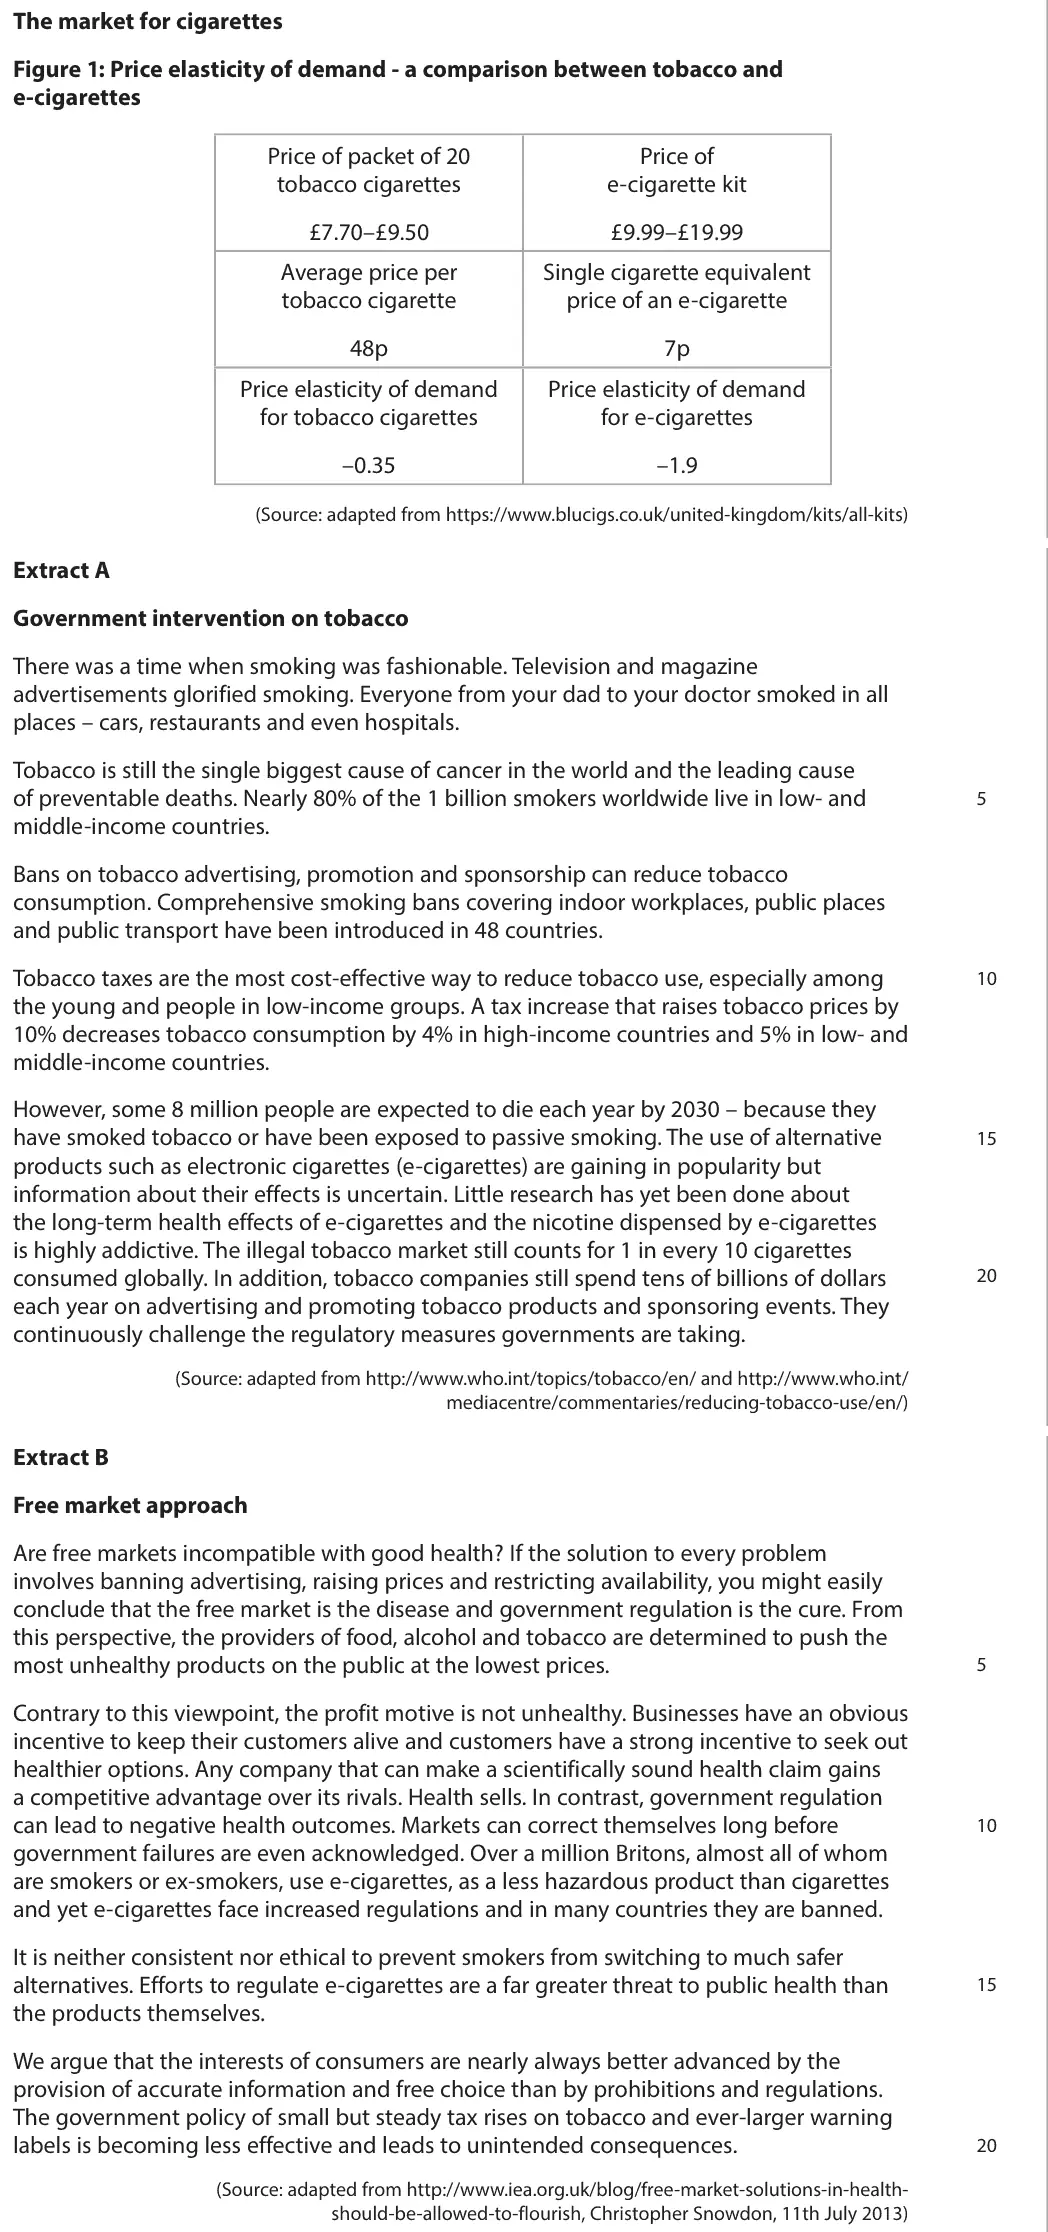
Data and extracts for question 6The market for cigarettes Figure 1: Price elasticity of demand - a comparison between tobacco and e-cigarettes Price of packet of 20 Price of tobacco cigarettes e-cigarette kit £7.70–£9.50 £9.99–£19.99 Average price per Single cigarette equivalent tobacco cigarette price of an e-cigarette 48p 7p Price elasticity of demand Price elasticity of demand for tobacco cigarettes for e-cigarettes –0.35 –1.9 (Source: adapted from https://www.blucigs.co.uk/united-kingdom/kits/all-kits) Extract A Government intervention on tobacco There was a time when smoking was fashionable. Television and magazine advertisements glorified smoking. Everyone from your dad to your doctor smoked in all places – cars, restaurants and even hospitals. Tobacco is still the single biggest cause of cancer in the world and the leading cause of preventable deaths. Nearly 80% of the 1 billion smokers worldwide live in low- and 5 middle-income countries. Bans on tobacco advertising, promotion and sponsorship can reduce tobacco consumption. Comprehensive smoking bans covering indoor workplaces, public places and public transport have been introduced in 48 countries. Tobacco taxes are the most cost-effective way to reduce tobacco use, especially among 10 the young and people in low-income groups. A tax increase that raises tobacco prices by 10% decreases tobacco consumption by 4% in high-income countries and 5% in low- and middle-income countries. However, some 8 million people are expected to die each year by 2030 – because they have smoked tobacco or have been exposed to passive smoking. The use of alternative 15 products such as electronic cigarettes (e-cigarettes) are gaining in popularity but information about their effects is uncertain. Little research has yet been done about the long-term health effects of e-cigarettes and the nicotine dispensed by e-cigarettes is highly addictive. The illegal tobacco market still counts for 1 in every 10 cigarettes consumed globally. In addition, tobacco companies still spend tens of billions of dollars 20 each year on advertising and promoting tobacco products and sponsoring events. They continuously challenge the regulatory measures governments are taking. (Source: adapted from http://www.who.int/topics/tobacco/en/ and http://www.who.int/ mediacentre/commentaries/reducing-tobacco-use/en/) Extract B Free market approach Are free markets incompatible with good health? If the solution to every problem involves banning advertising, raising prices and restricting availability, you might easily conclude that the free market is the disease and government regulation is the cure. From this perspective, the providers of food, alcohol and tobacco are determined to push the most unhealthy products on the public at the lowest prices. 5 Contrary to this viewpoint, the profit motive is not unhealthy. Businesses have an obvious incentive to keep their customers alive and customers have a strong incentive to seek out healthier options. Any company that can make a scientifically sound health claim gains a competitive advantage over its rivals. Health sells. In contrast, government regulation can lead to negative health outcomes. Markets can correct themselves long before 10 government failures are even acknowledged. Over a million Britons, almost all of whom are smokers or ex-smokers, use e-cigarettes, as a less hazardous product than cigarettes and yet e-cigarettes face increased regulations and in many countries they are banned. It is neither consistent nor ethical to prevent smokers from switching to much safer alternatives. Efforts to regulate e-cigarettes are a far greater threat to public health than 15 the products themselves. We argue that the interests of consumers are nearly always better advanced by the provision of accurate information and free choice than by prohibitions and regulations. The government policy of small but steady tax rises on tobacco and ever-larger warning labels is becoming less effective and leads to unintended consequences. 20 (Source: adapted from http://www.iea.org.uk/blog/free-market-solutions-in-health- should-be-allowed-to-flourish, Christopher Snowdon, 11th July 2013)


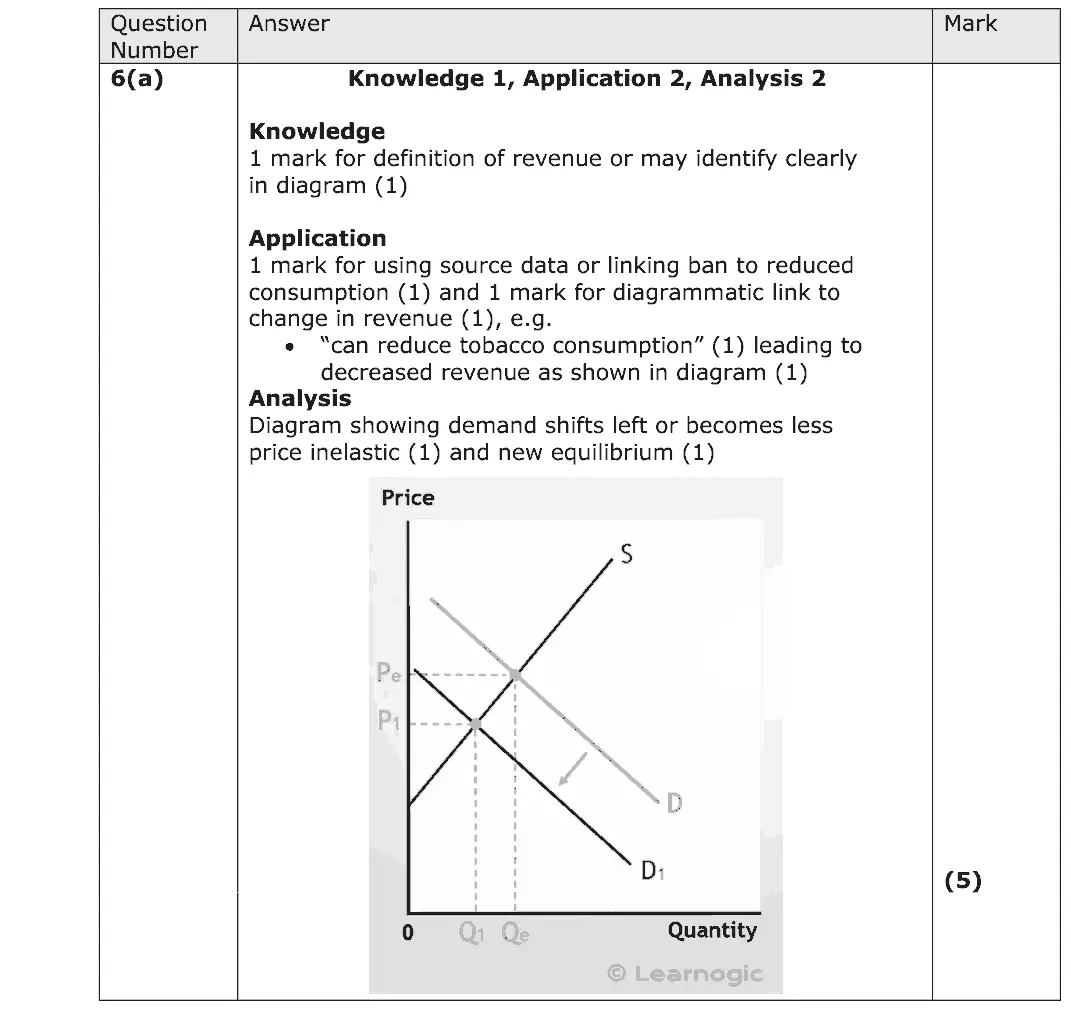
(a) Explain why ‘bans on tobacco advertising’ (Extract A, line 7) may result in a decrease in the revenue of tobacco firms. Include a supply and demand diagram in your answer. (5)
June 2017 · AS Paper 2 · Q3(c) 1 mark AO1=1 Diagram economic growth and the trade cycle
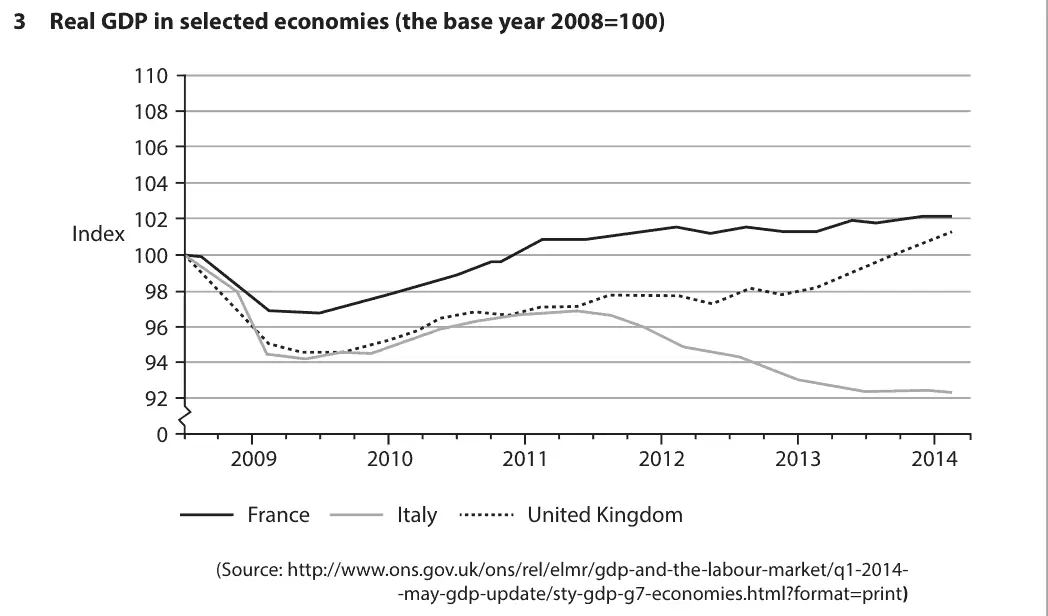
Data and extracts for question 33 Real GDP in selected economies (the base year 2008=100) 110 108 106 104 102 Index 100 98 96 94 92 0 2009 2010 2011 2012 2013 2014 France Italy United Kingdom (Source: http://www.ons.gov.uk/ons/rel/elmr/gdp-and-the-labour-market/q1-2014- -may-gdp-update/sty-gdp-g7-economies.html?format=print)
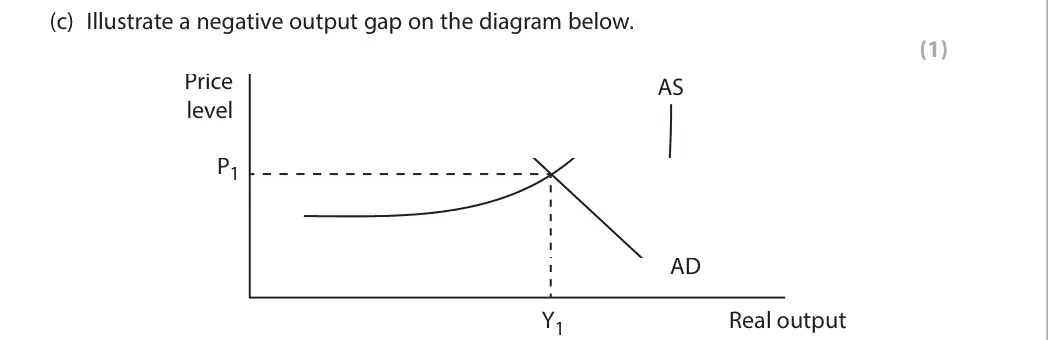
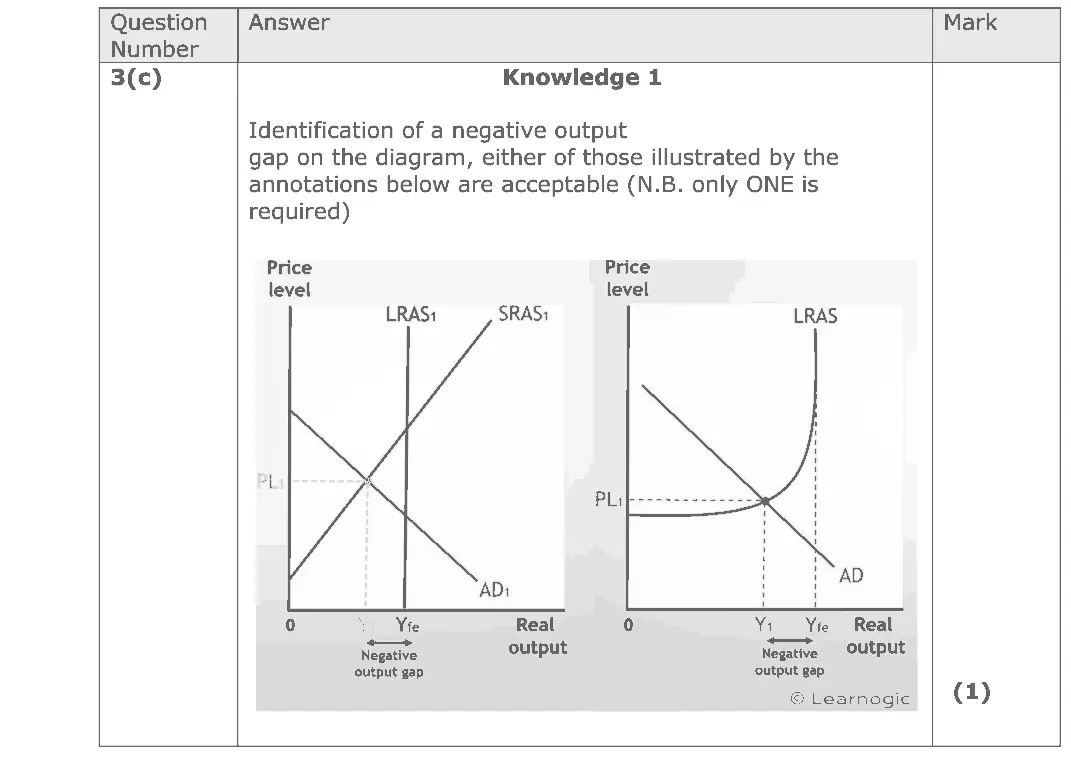
(c) Illustrate a negative output gap on the diagram below. (1) Price AS level P1 AD Y1 Real output
June 2017 · AS Paper 2 · Q4(a) 2 marks AO2=2 Diagram national income and the multiplierfiscal and monetary policy
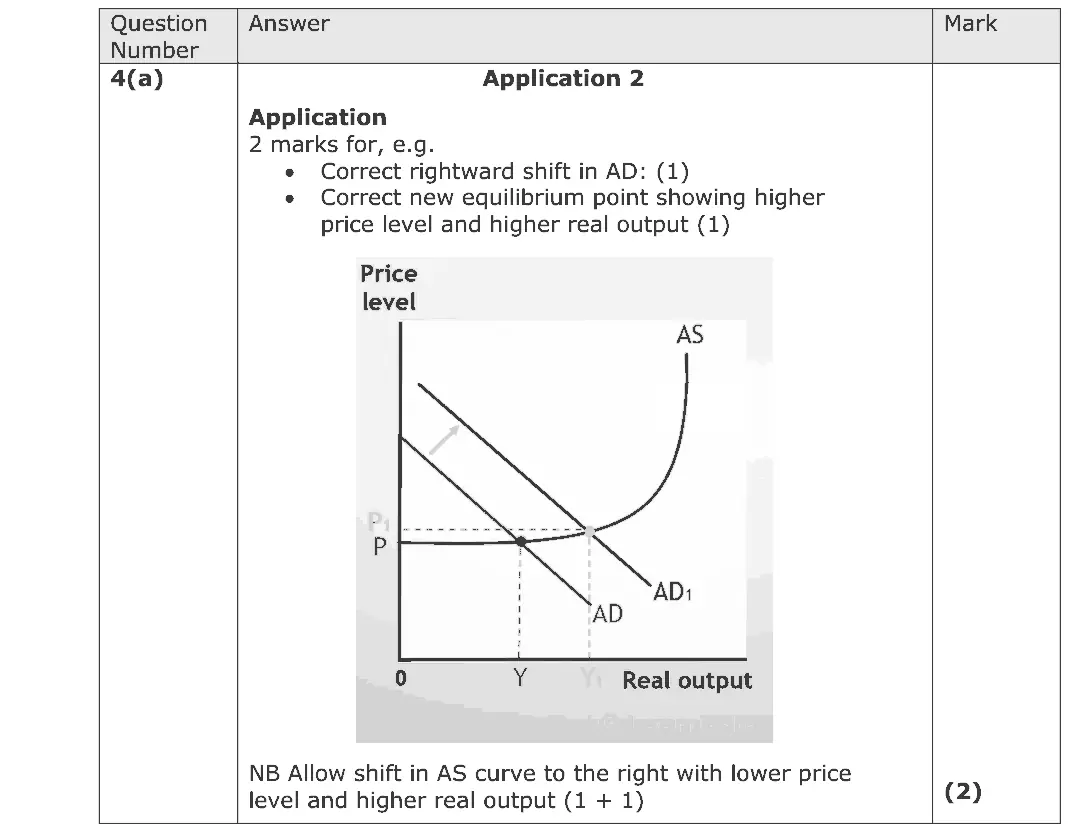
Data and extracts for question 44 The Chancellor announced in the 2015 Budget that the personal allowance (the annual income that can be earned before starting to pay income tax) would increase from £10 600 to £11 000 in April 2016. This means most consumers will pay less income tax. (Source: adapted from http://www.telegraph.co.uk/finance/personalfinance/ how-budget-affect-me/11721785/Budget-2015-what-to-expect- for-income-tax-and-the-personal-allowance.html)
(a) Annotate the aggregate demand and aggregate supply diagram below to show the likely impact of the increase in the personal allowance on the UK’s price level and real output. (2)
June 2017 · Paper 1 · Q4(a) 4 marks AO1=2, AO2=2 Diagram revenues costs and profits
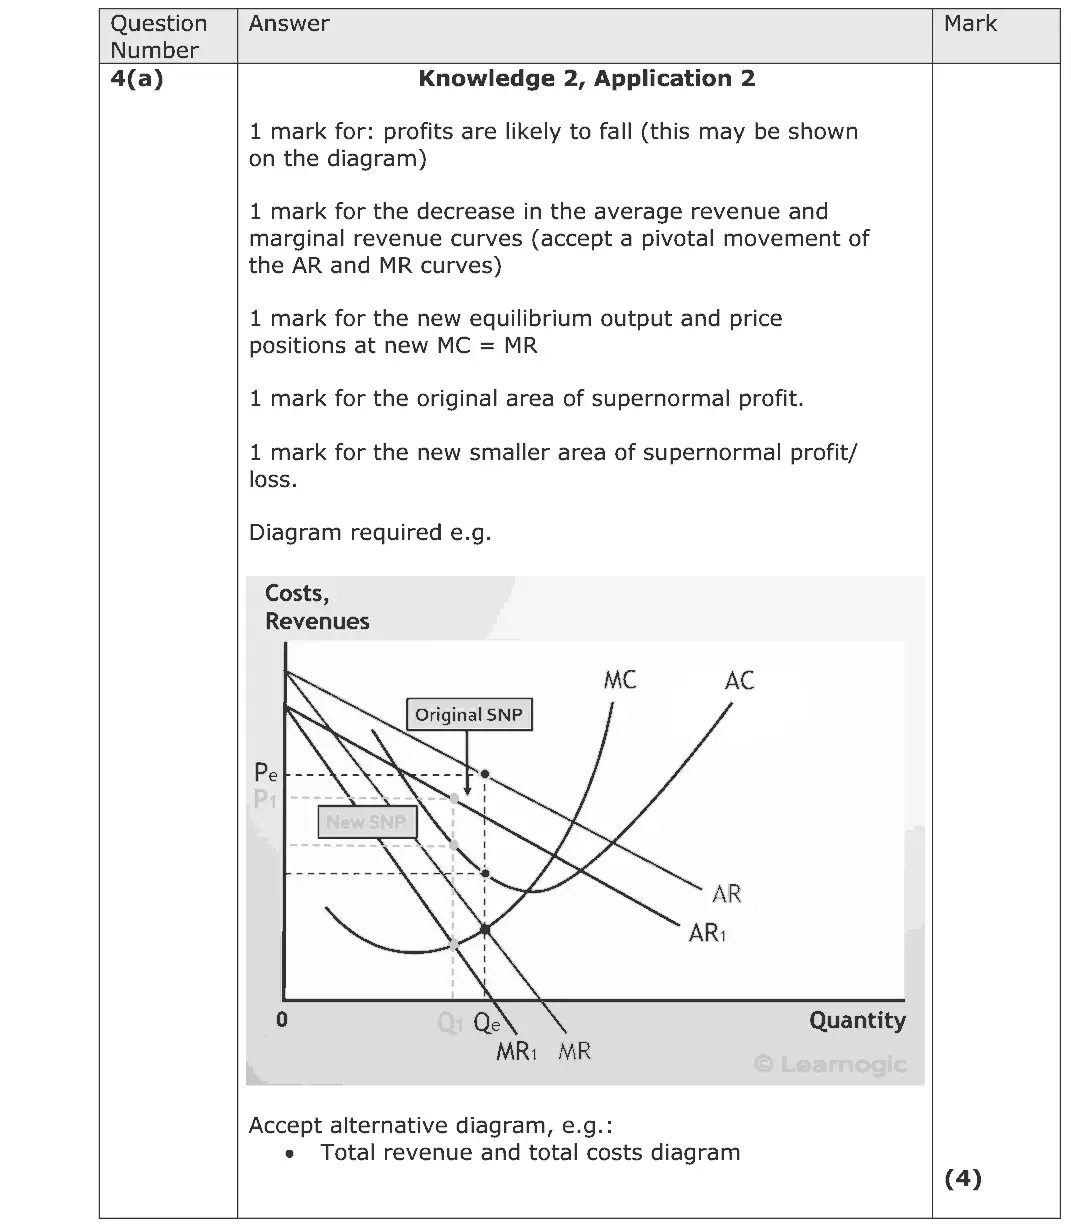
Data and extracts for question 44 In 2015 JCB, the construction equipment manufacturer, experienced a 6% fall in revenue. This resulted from a reduction in sales of construction equipment to emerging markets.
(a) Draw a cost and revenue diagram to show the likely impact of a reduction in sales of construction equipment on JCB’s profits. (4)
June 2017 · Paper 3 · Q2(a) 5 marks AO1=2, AO2=2, AO3=1 Diagram economic growth and the trade cycle
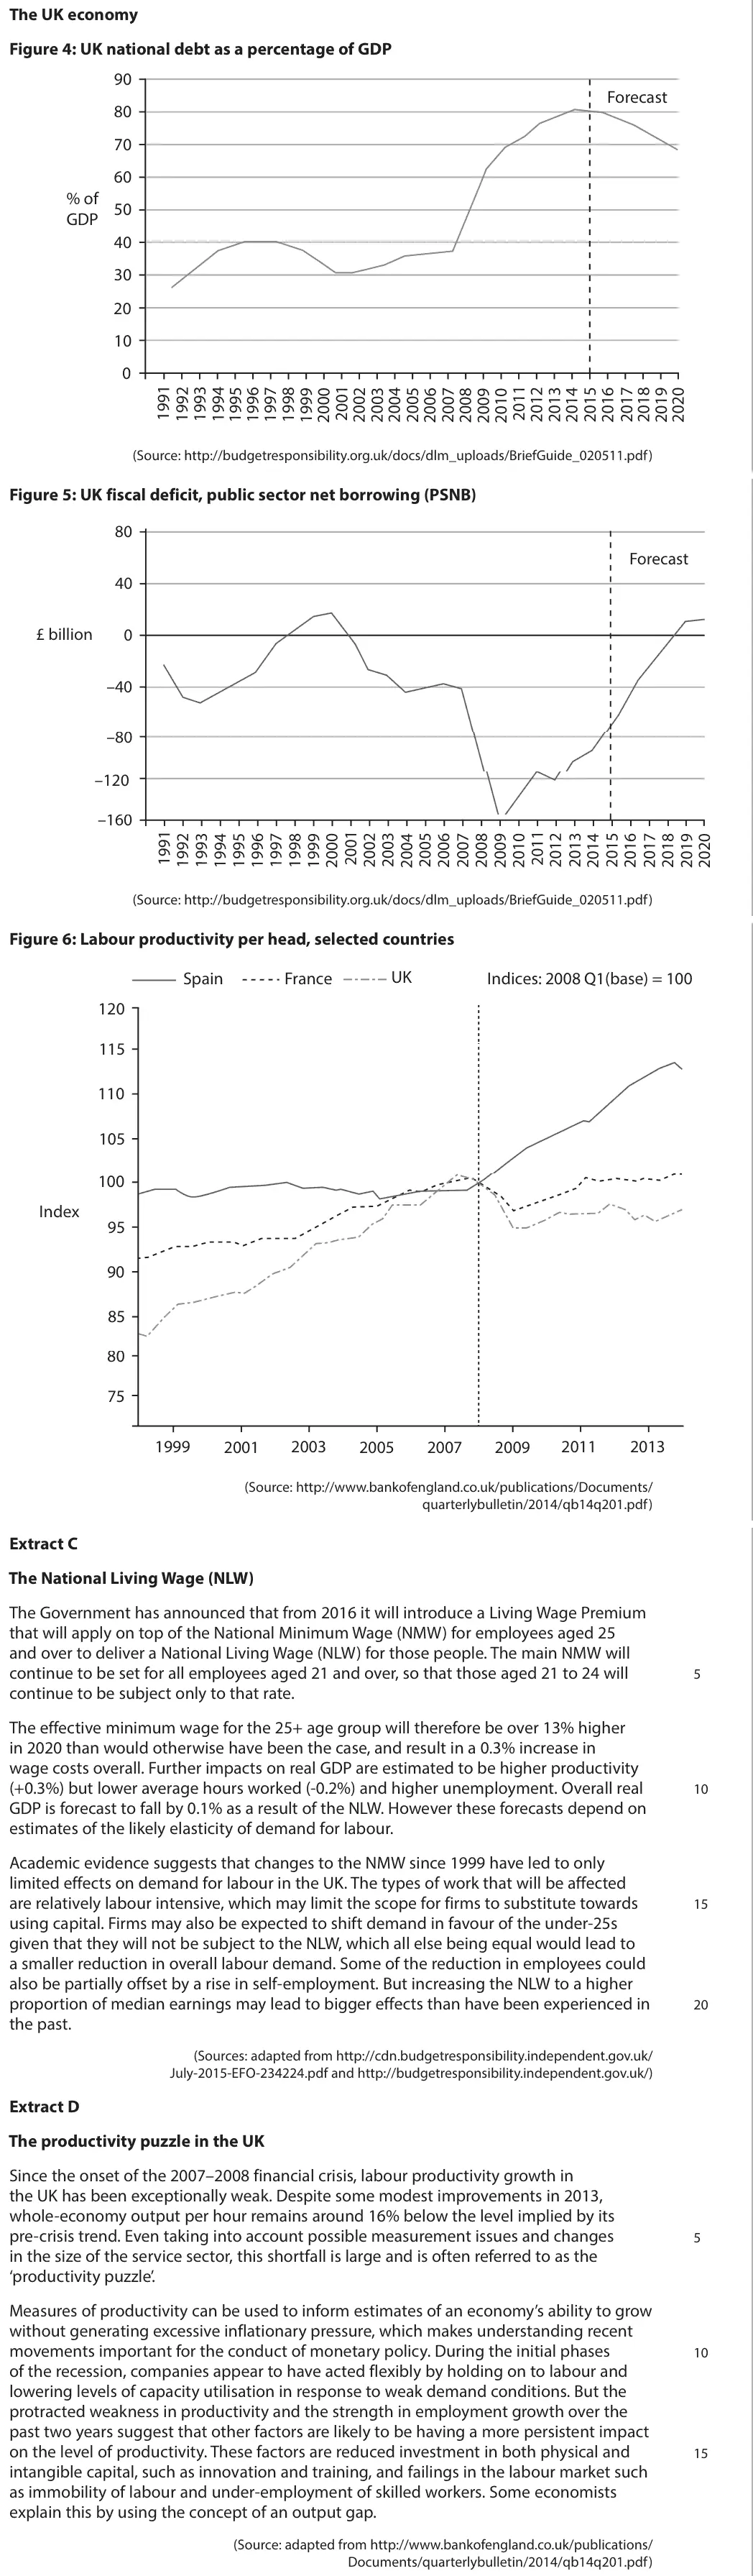
Data and extracts for question 2The UK economy Figure 4: UK national debt as a percentage of GDP 90 Forecast 80 70 60 % of 50 GDP 40 30 20 10 0 (Source: http://budgetresponsibility.org.uk/docs/dlm_uploads/BriefGuide_020511.pdf) Figure 5: UK fiscal deficit, public sector net borrowing (PSNB) 80 Forecast 40 £ billion 0 –40 –80 –120 –160 (Source: http://budgetresponsibility.org.uk/docs/dlm_uploads/BriefGuide_020511.pdf) Figure 6: Labour productivity per head, selected countries UK Spain France Indices: 2008 Q1(base) = 100 120 115 110 105 100 Index 95 90 85 80 75 1999 2001 2003 2005 2007 2009 2011 2013 (Source: http://www.bankofengland.co.uk/publications/Documents/ quarterlybulletin/2014/qb14q201.pdf) Extract C The National Living Wage (NLW) The Government has announced that from 2016 it will introduce a Living Wage Premium that will apply on top of the National Minimum Wage (NMW) for employees aged 25 and over to deliver a National Living Wage (NLW) for those people. The main NMW will continue to be set for all employees aged 21 and over, so that those aged 21 to 24 will 5 continue to be subject only to that rate. The effective minimum wage for the 25+ age group will therefore be over 13% higher in 2020 than would otherwise have been the case, and result in a 0.3% increase in wage costs overall. Further impacts on real GDP are estimated to be higher productivity (+0.3%) but lower average hours worked (-0.2%) and higher unemployment. Overall real 10 GDP is forecast to fall by 0.1% as a result of the NLW. However these forecasts depend on estimates of the likely elasticity of demand for labour. Academic evidence suggests that changes to the NMW since 1999 have led to only limited effects on demand for labour in the UK. The types of work that will be affected are relatively labour intensive, which may limit the scope for firms to substitute towards 15 using capital. Firms may also be expected to shift demand in favour of the under-25s given that they will not be subject to the NLW, which all else being equal would lead to a smaller reduction in overall labour demand. Some of the reduction in employees could also be partially offset by a rise in self-employment. But increasing the NLW to a higher proportion of median earnings may lead to bigger effects than have been experienced in 20 the past. (Sources: adapted from http://cdn.budgetresponsibility.independent.gov.uk/ July-2015-EFO-234224.pdf and http://budgetresponsibility.independent.gov.uk/) Extract D The productivity puzzle in the UK Since the onset of the 2007–2008 financial crisis, labour productivity growth in the UK has been exceptionally weak. Despite some modest improvements in 2013, whole-economy output per hour remains around 16% below the level implied by its pre-crisis trend. Even taking into account possible measurement issues and changes 5 in the size of the service sector, this shortfall is large and is often referred to as the ‘productivity puzzle’. Measures of productivity can be used to inform estimates of an economy’s ability to grow without generating excessive inflationary pressure, which makes understanding recent movements important for the conduct of monetary policy. During the initial phases 10 of the recession, companies appear to have acted flexibly by holding on to labour and lowering levels of capacity utilisation in response to weak demand conditions. But the protracted weakness in productivity and the strength in employment growth over the past two years suggest that other factors are likely to be having a more persistent impact on the level of productivity. These factors are reduced investment in both physical and 15 intangible capital, such as innovation and training, and failings in the labour market such as immobility of labour and under-employment of skilled workers. Some economists explain this by using the concept of an output gap. (Source: adapted from http://www.bankofengland.co.uk/publications/ Documents/quarterlybulletin/2014/qb14q201.pdf)
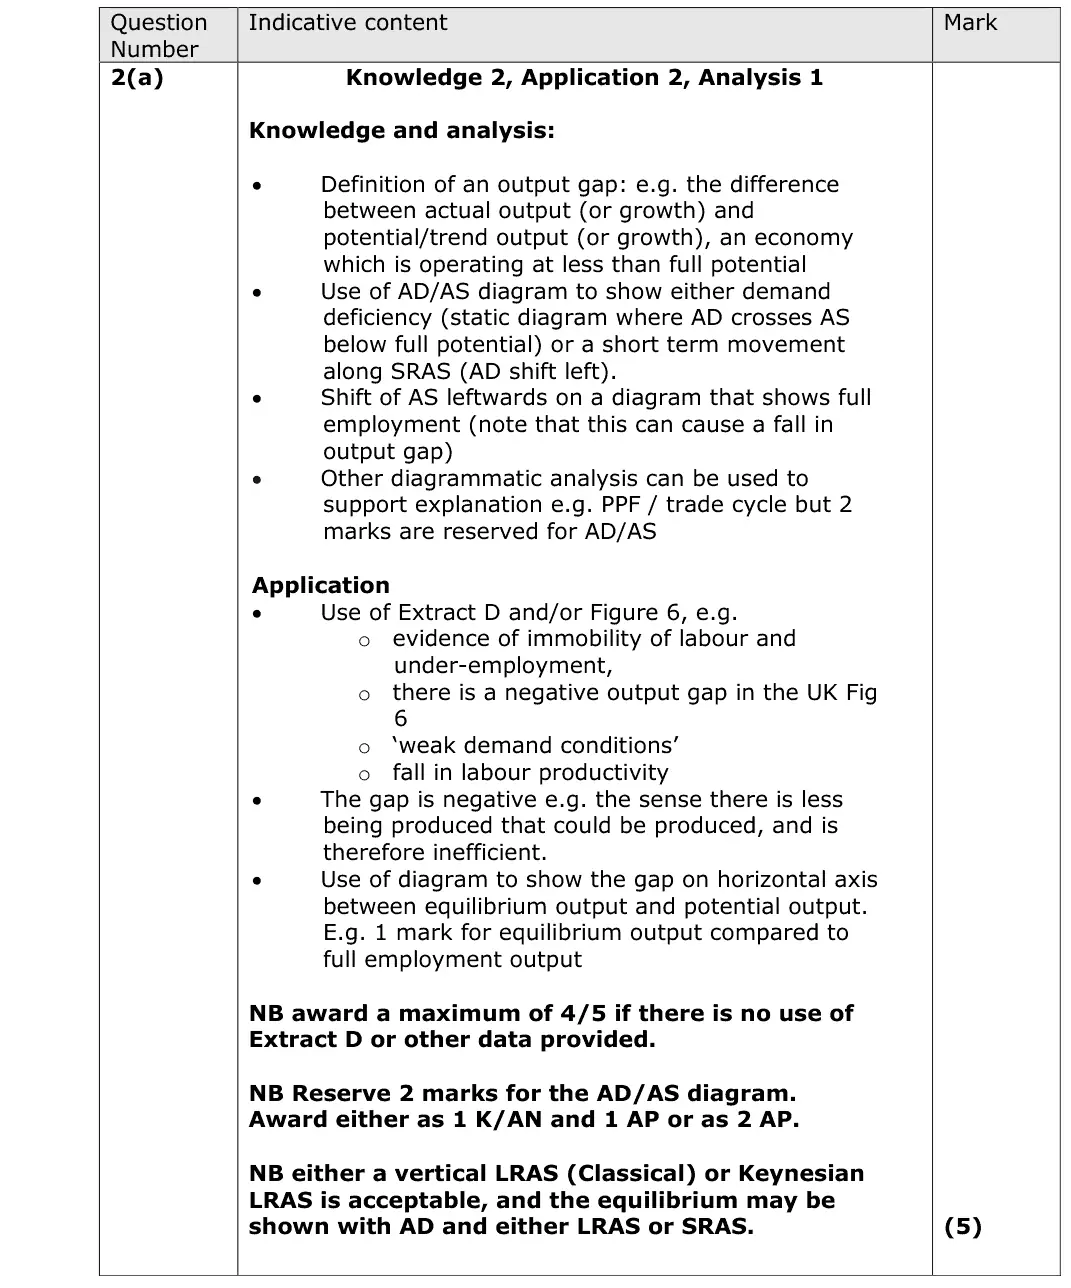
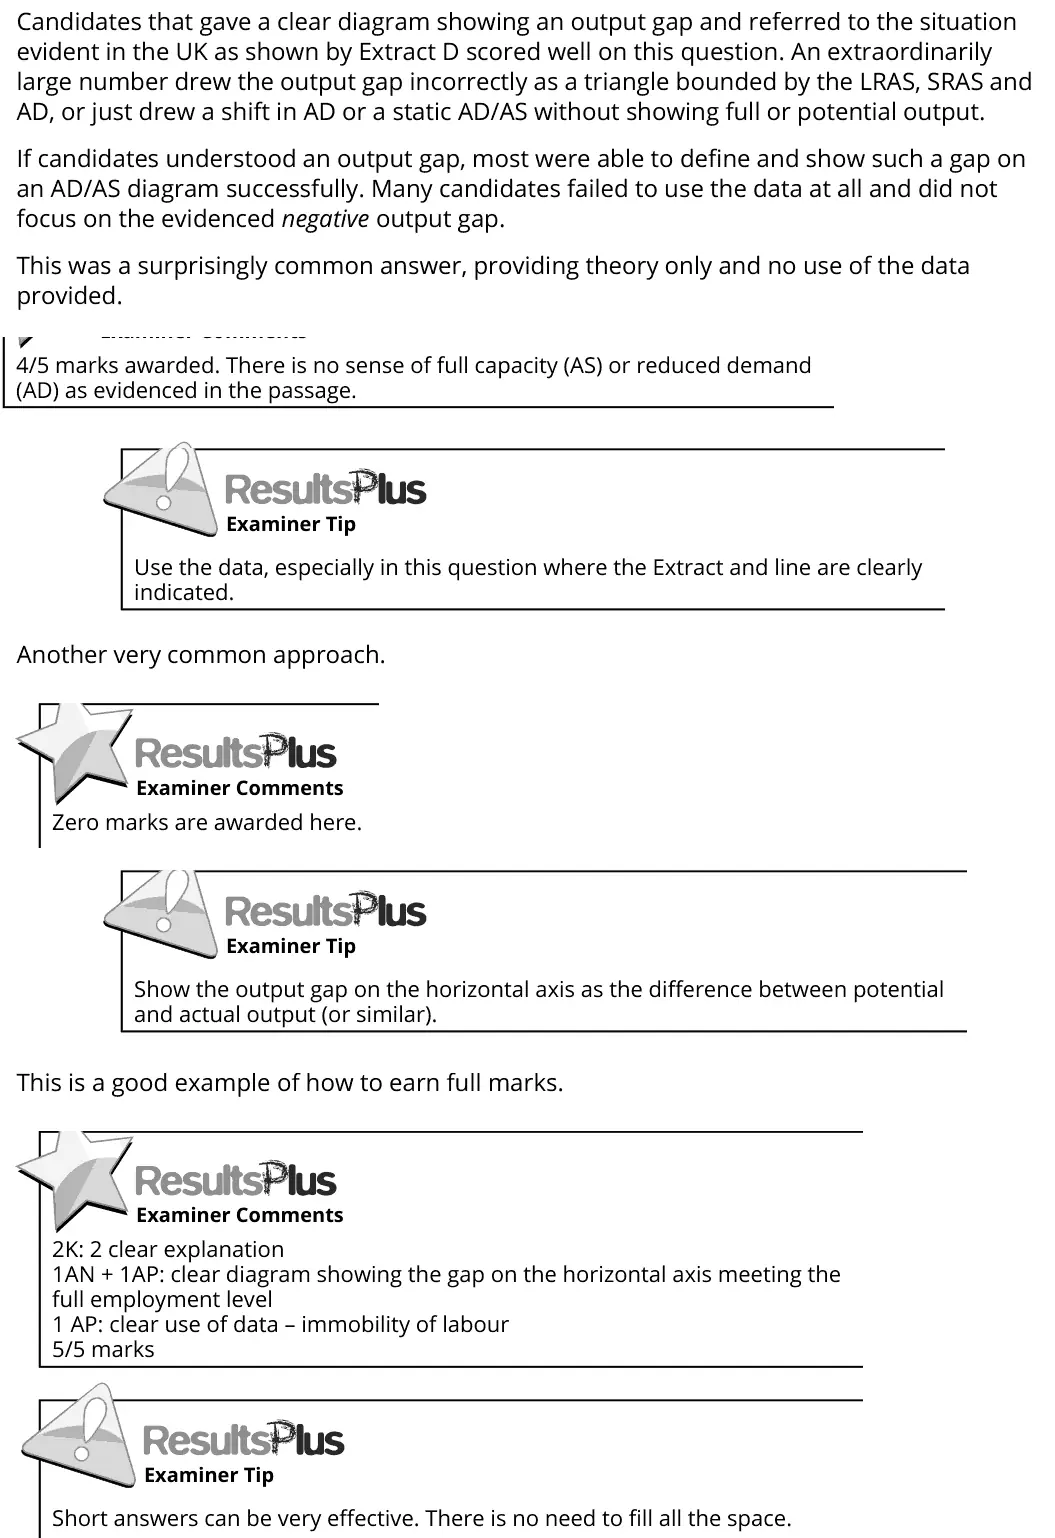
(a) With reference to Extract D (line 18), explain the meaning of the term ‘output gap’. Use an aggregate demand and aggregate supply diagram in your answer. (5)
June 2016 · AS Paper 1 · Q6(c) 6 marks AO1=2, AO2=2, AO3=2 Diagram price mechanism and surplus
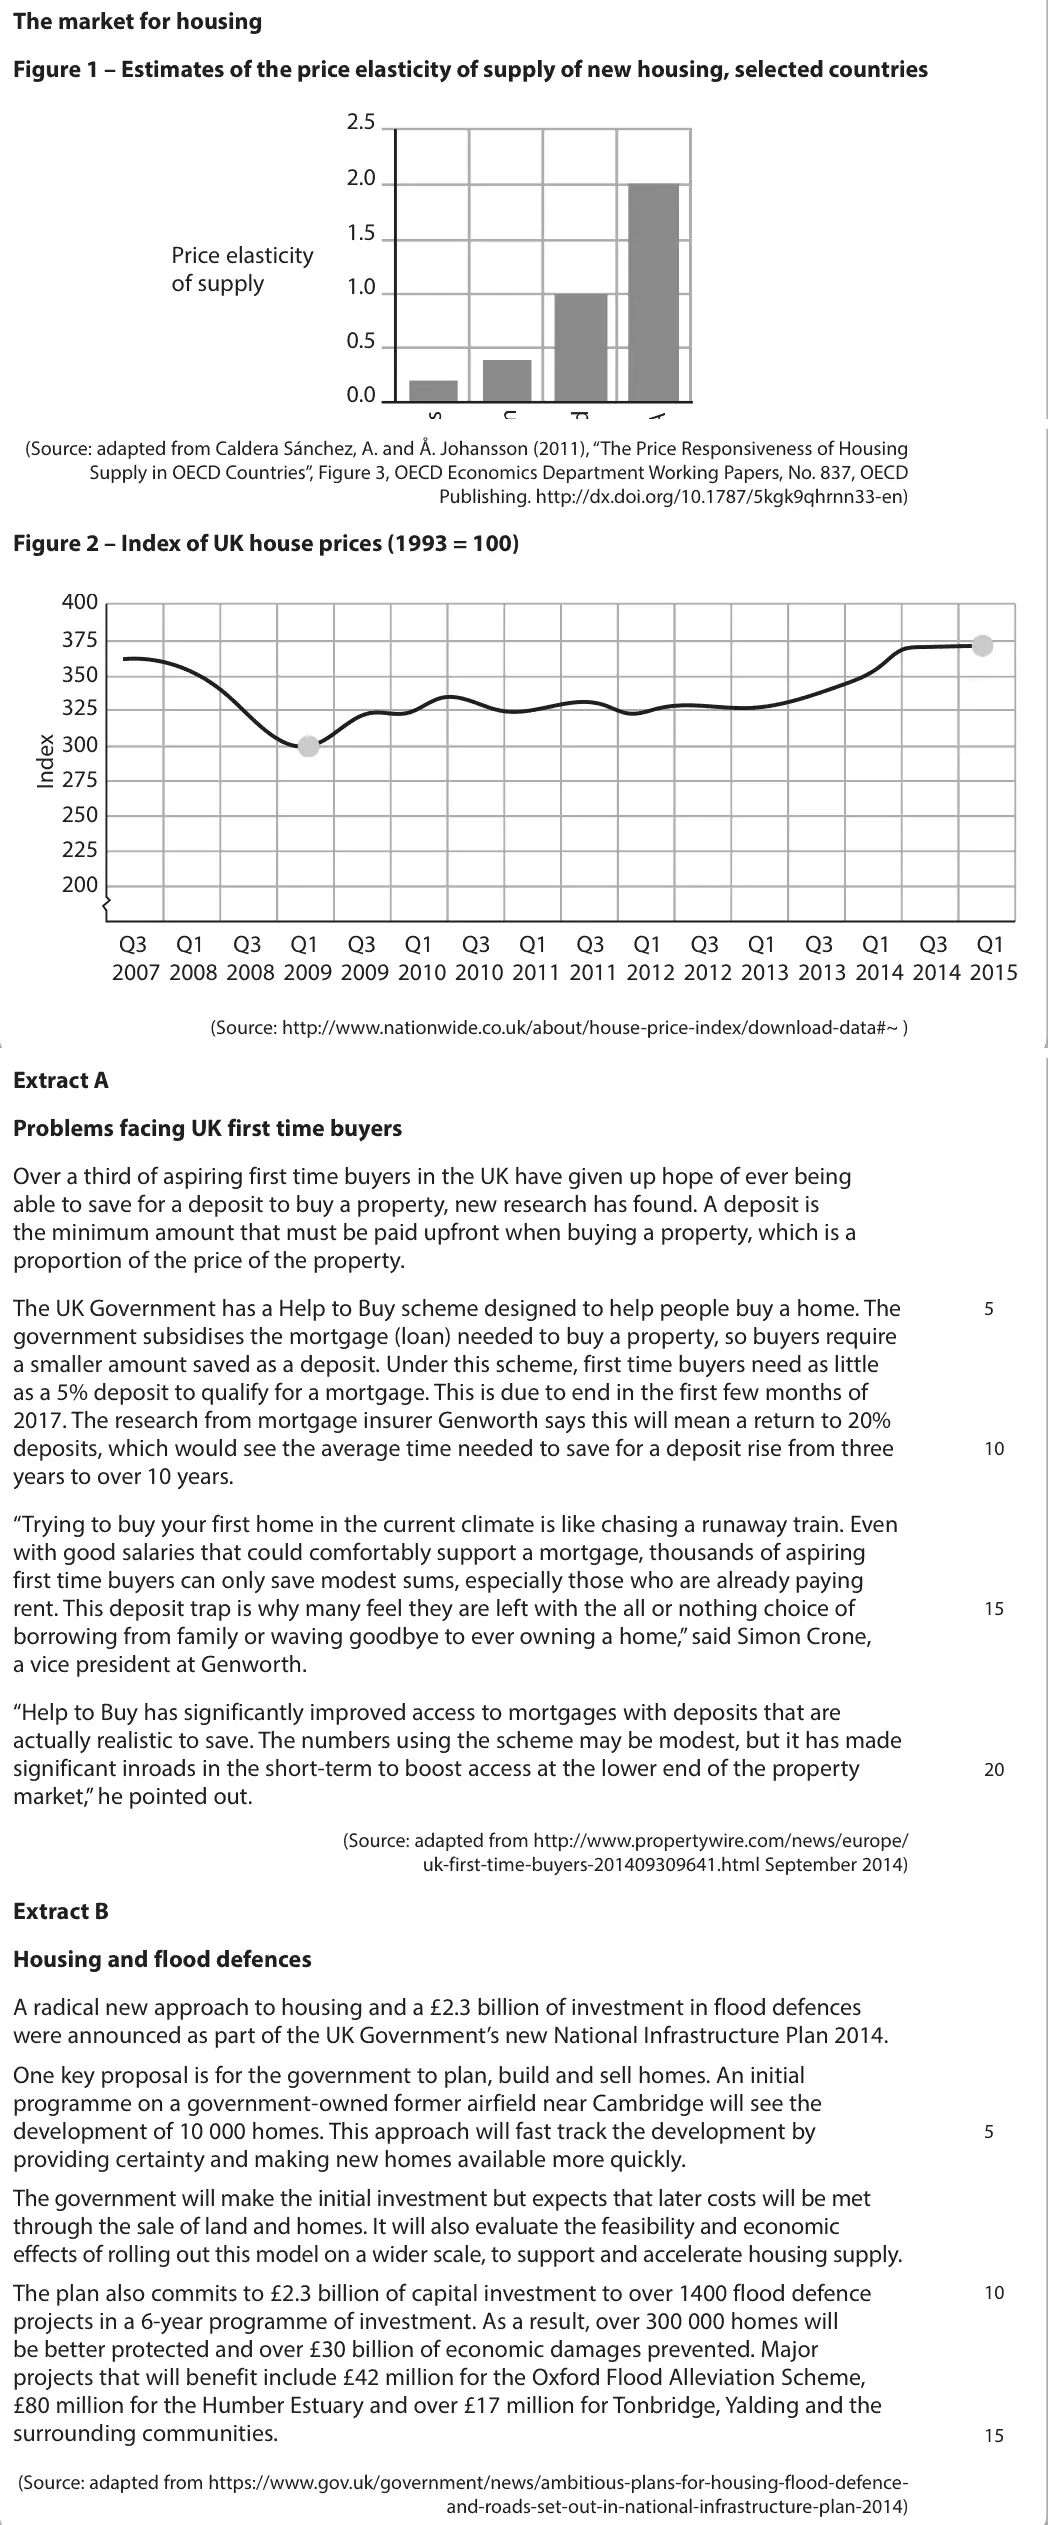
Data and extracts for question 6The market for housing Figure 1 – Estimates of the price elasticity of supply of new housing, selected countries 2.5 2.0 1.5 Price elasticity of supply 1.0 0.5 0.0 (Source: adapted from Caldera Sánchez, A. and Å. Johansson (2011), “The Price Responsiveness of Housing Supply in OECD Countries”, Figure 3, OECD Economics Department Working Papers, No. 837, OECD Publishing. http://dx.doi.org/10.1787/5kgk9qhrnn33-en) Figure 2 – Index of UK house prices (1993 = 100) 400 375 350 325 300 275 250 225 200 Q3 Q1 Q3 Q1 Q3 Q1 Q3 Q1 Q3 Q1 Q3 Q1 Q3 Q1 Q3 Q1 2007 2008 2008 2009 2009 2010 2010 2011 2011 2012 2012 2013 2013 2014 2014 2015 (Source: http://www.nationwide.co.uk/about/house-price-index/download-data#~ ) Extract A Problems facing UK first time buyers Over a third of aspiring first time buyers in the UK have given up hope of ever being able to save for a deposit to buy a property, new research has found. A deposit is the minimum amount that must be paid upfront when buying a property, which is a proportion of the price of the property. The UK Government has a Help to Buy scheme designed to help people buy a home. The 5 government subsidises the mortgage (loan) needed to buy a property, so buyers require a smaller amount saved as a deposit. Under this scheme, first time buyers need as little as a 5% deposit to qualify for a mortgage. This is due to end in the first few months of 2017. The research from mortgage insurer Genworth says this will mean a return to 20% deposits, which would see the average time needed to save for a deposit rise from three 10 years to over 10 years. “Trying to buy your first home in the current climate is like chasing a runaway train. Even with good salaries that could comfortably support a mortgage, thousands of aspiring first time buyers can only save modest sums, especially those who are already paying rent. This deposit trap is why many feel they are left with the all or nothing choice of 15 borrowing from family or waving goodbye to ever owning a home,” said Simon Crone, a vice president at Genworth. “Help to Buy has significantly improved access to mortgages with deposits that are actually realistic to save. The numbers using the scheme may be modest, but it has made significant inroads in the short-term to boost access at the lower end of the property 20 market,” he pointed out. (Source: adapted from http://www.propertywire.com/news/europe/ uk-first-time-buyers-201409309641.html September 2014) Extract B Housing and flood defences A radical new approach to housing and a £2.3 billion of investment in flood defences were announced as part of the UK Government’s new National Infrastructure Plan 2014. One key proposal is for the government to plan, build and sell homes. An initial programme on a government-owned former airfield near Cambridge will see the development of 10 000 homes. This approach will fast track the development by 5 providing certainty and making new homes available more quickly. The government will make the initial investment but expects that later costs will be met through the sale of land and homes. It will also evaluate the feasibility and economic effects of rolling out this model on a wider scale, to support and accelerate housing supply. The plan also commits to £2.3 billion of capital investment to over 1400 flood defence 10 projects in a 6-year programme of investment. As a result, over 300 000 homes will be better protected and over £30 billion of economic damages prevented. Major projects that will benefit include £42 million for the Oxford Flood Alleviation Scheme, £80 million for the Humber Estuary and over £17 million for Tonbridge, Yalding and the surrounding communities. 15 (Source: adapted from https://www.gov.uk/government/news/ambitious-plans-for-housing-flood-defence- and-roads-set-out-in-national-infrastructure-plan-2014)
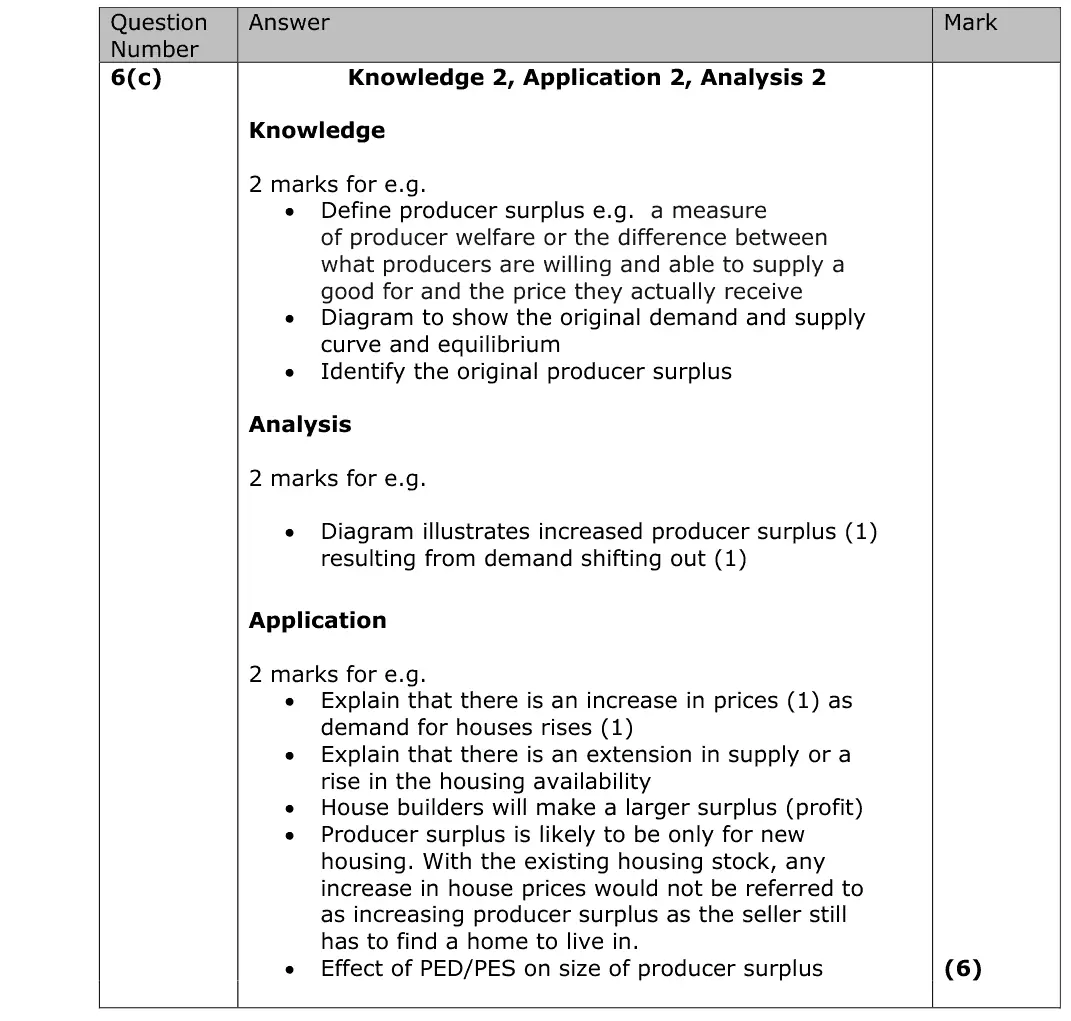
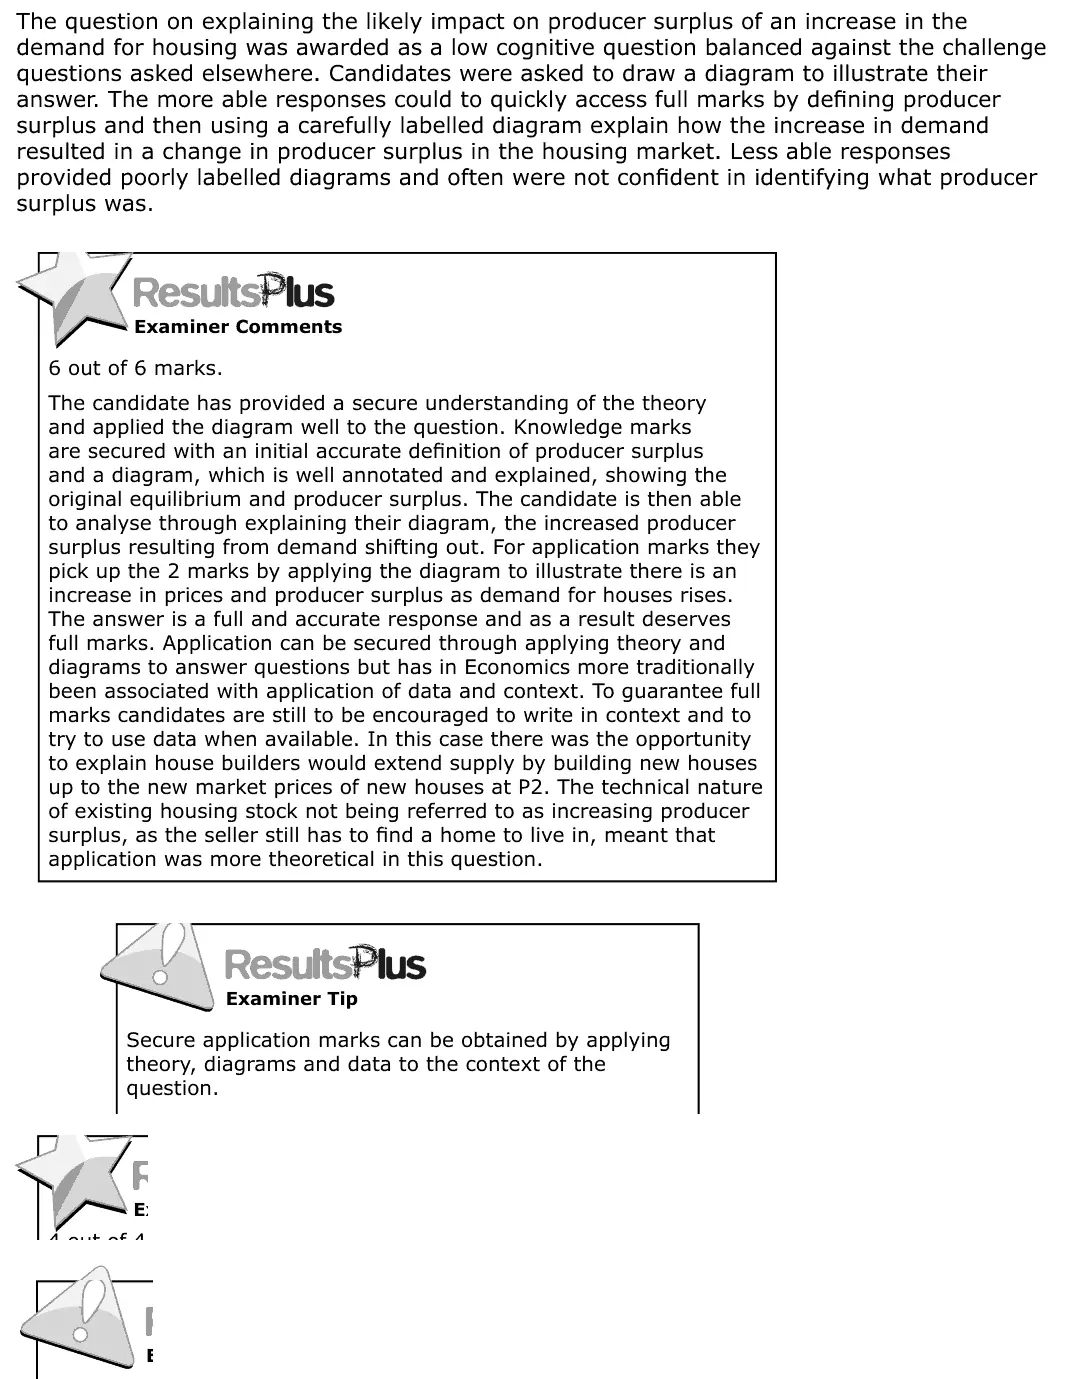
(c) Explain the likely impact on producer surplus of an increase in the demand for housing. Use a diagram to illustrate your answer. (6)
June 2016 · AS Paper 2 · Q2(c) 1 mark AO1=1 Diagram economic growth and the trade cyclenational income and the multiplier
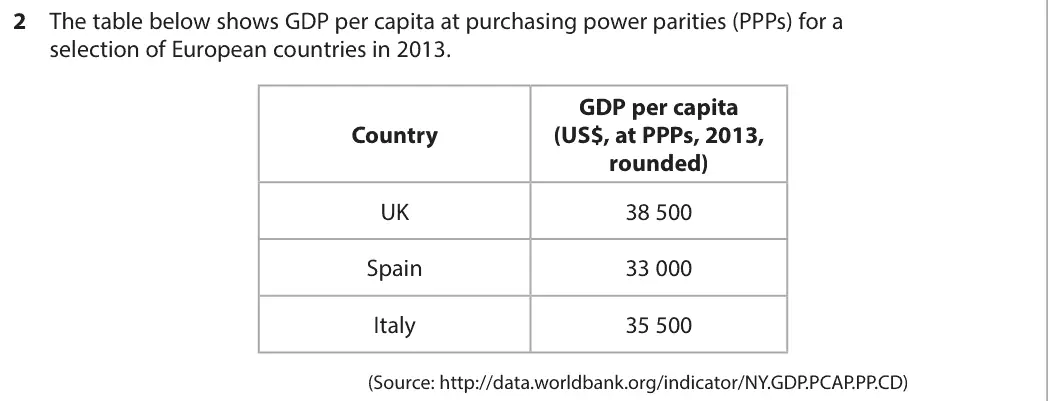
Data and extracts for question 22 The table below shows GDP per capita at purchasing power parities (PPPs) for a selection of European countries in 2013. GDP per capita Country (US$, at PPPs, 2013, rounded) UK 38 500 Spain 33 000 Italy 35 500 (Source: http://data.worldbank.org/indicator/NY.GDP.PCAP.PP.CD)
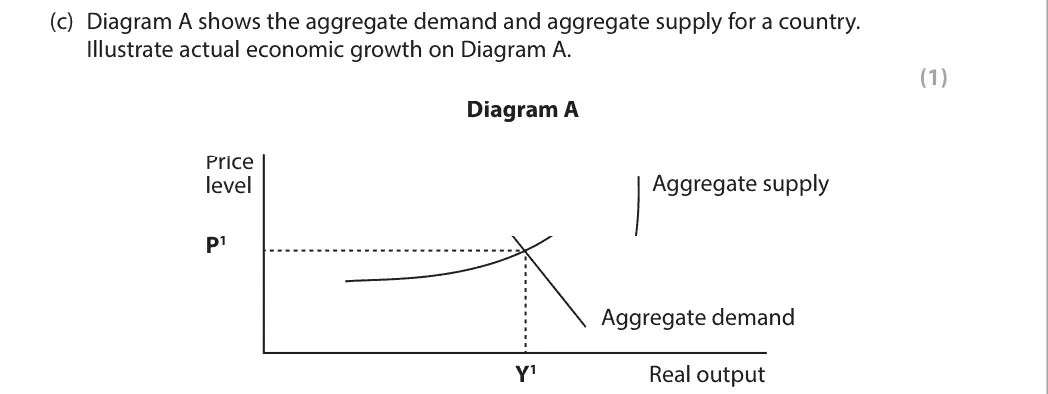
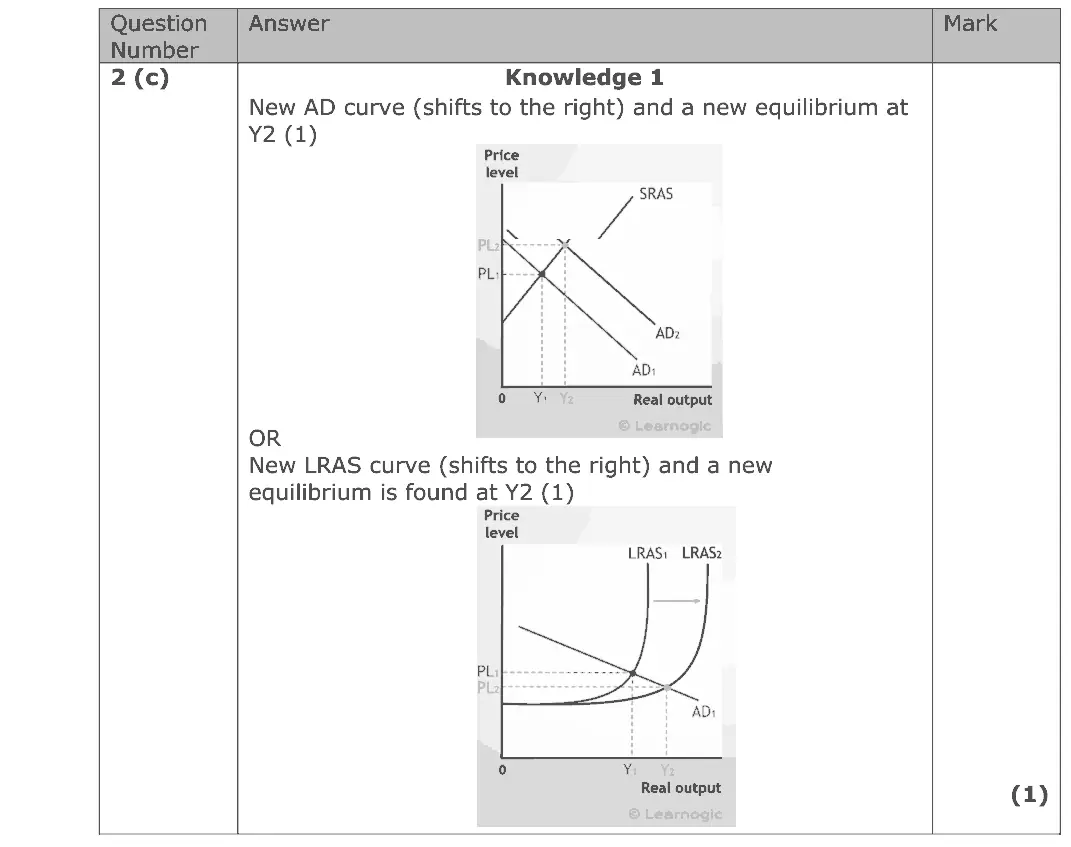
(c) Diagram A shows the aggregate demand and aggregate supply for a country. Illustrate actual economic growth on Diagram A. (1) Diagram A Price Aggregate supply level P1 Aggregate demand Y1 Real output

Work with an Edexcel economics tutor

Essays stuck in Level 2, or losing the easy marks in Section A? Book a trial session with Lianne, a former Edexcel examiner.

Prefer email? Send an enquiry

If you are under 18, please include a parent's contact details. Enquiries go to enquiries@economicsaleveltutor.com and are deleted once handled. All tutoring is online.