Answer
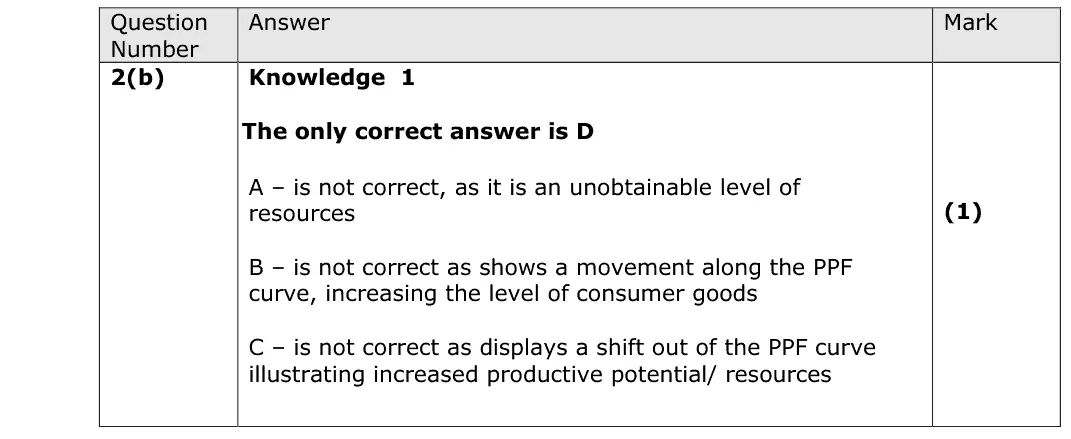
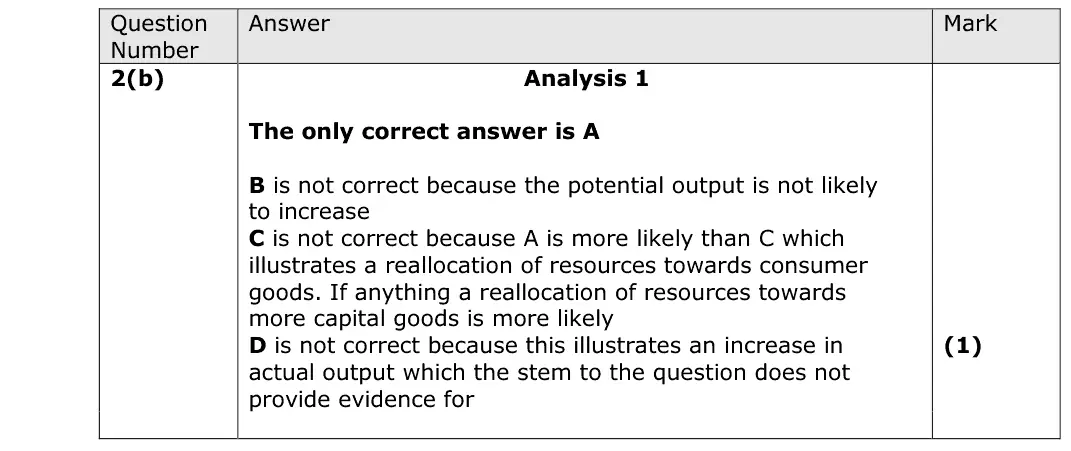
A
Mark scheme
Notes from the mark scheme and report
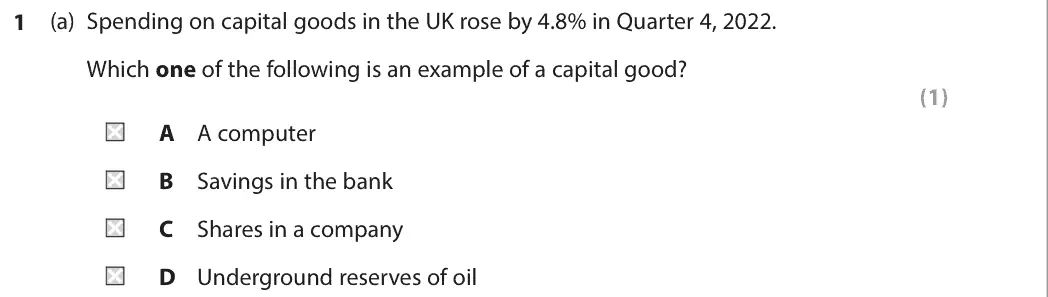
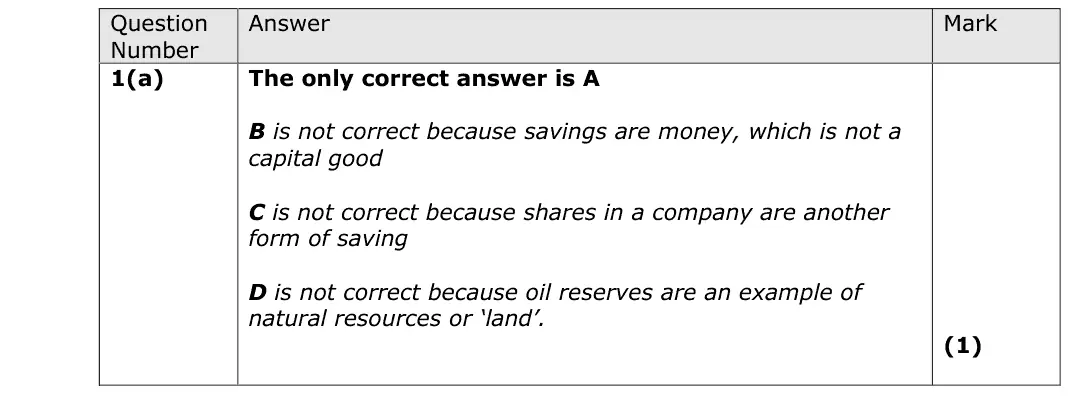
- a computer is a capital good used to produce other goods (A)
- savings and shares are financial assets, not capital goods
- underground oil reserves are natural resources (land)
Notes and key-term cards for this topic are being written by our tutors. The past-paper questions below are ready now.
A
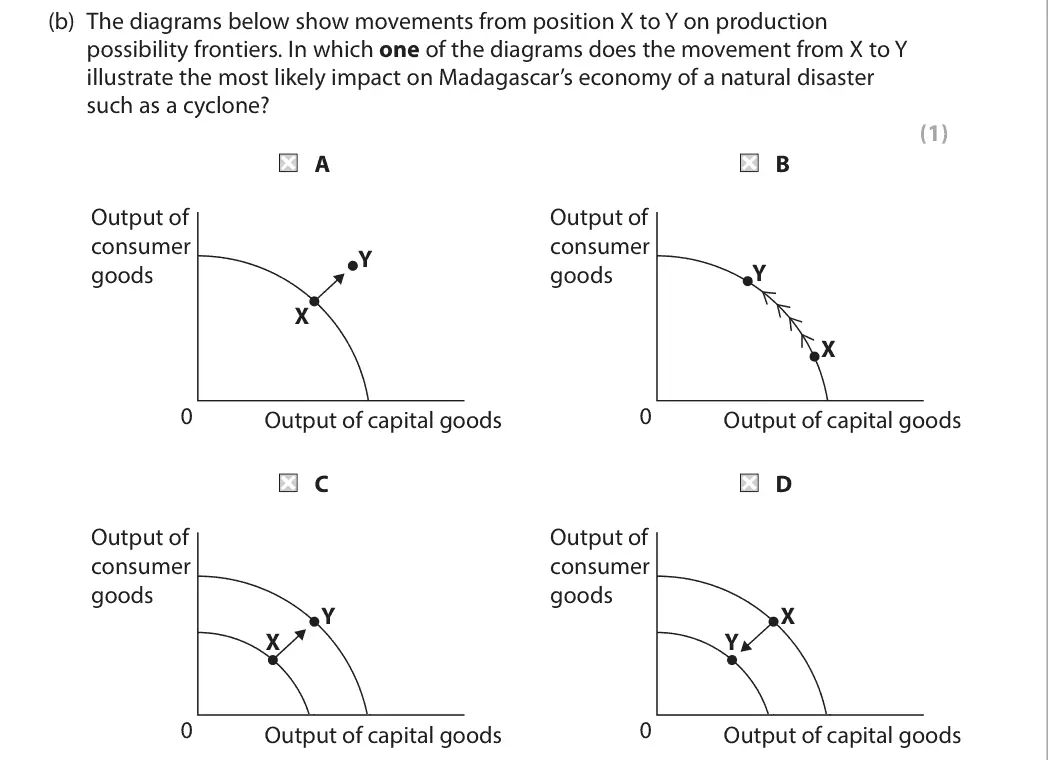
D
Quantitative skills: QS 4 (construct and interpret a range of standard graphical forms)

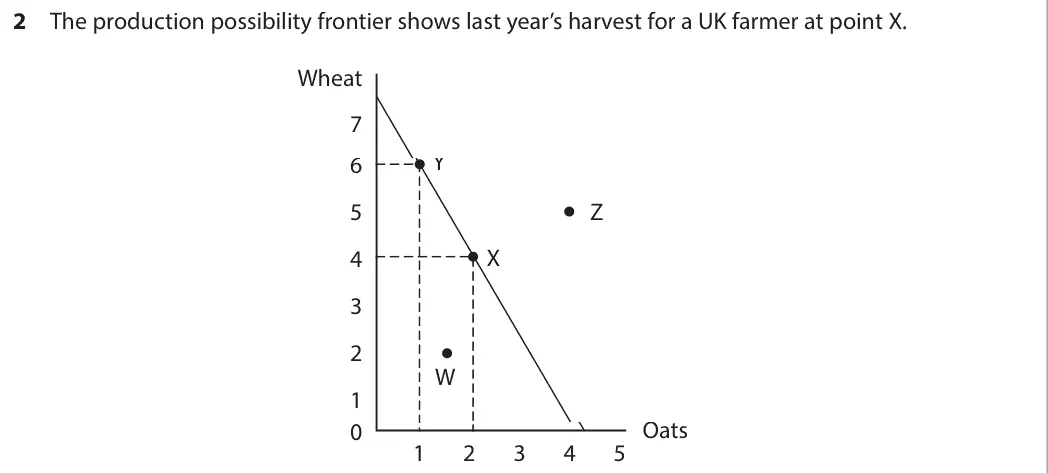
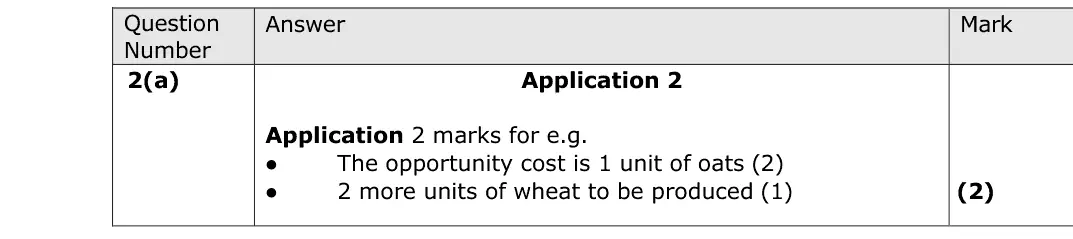
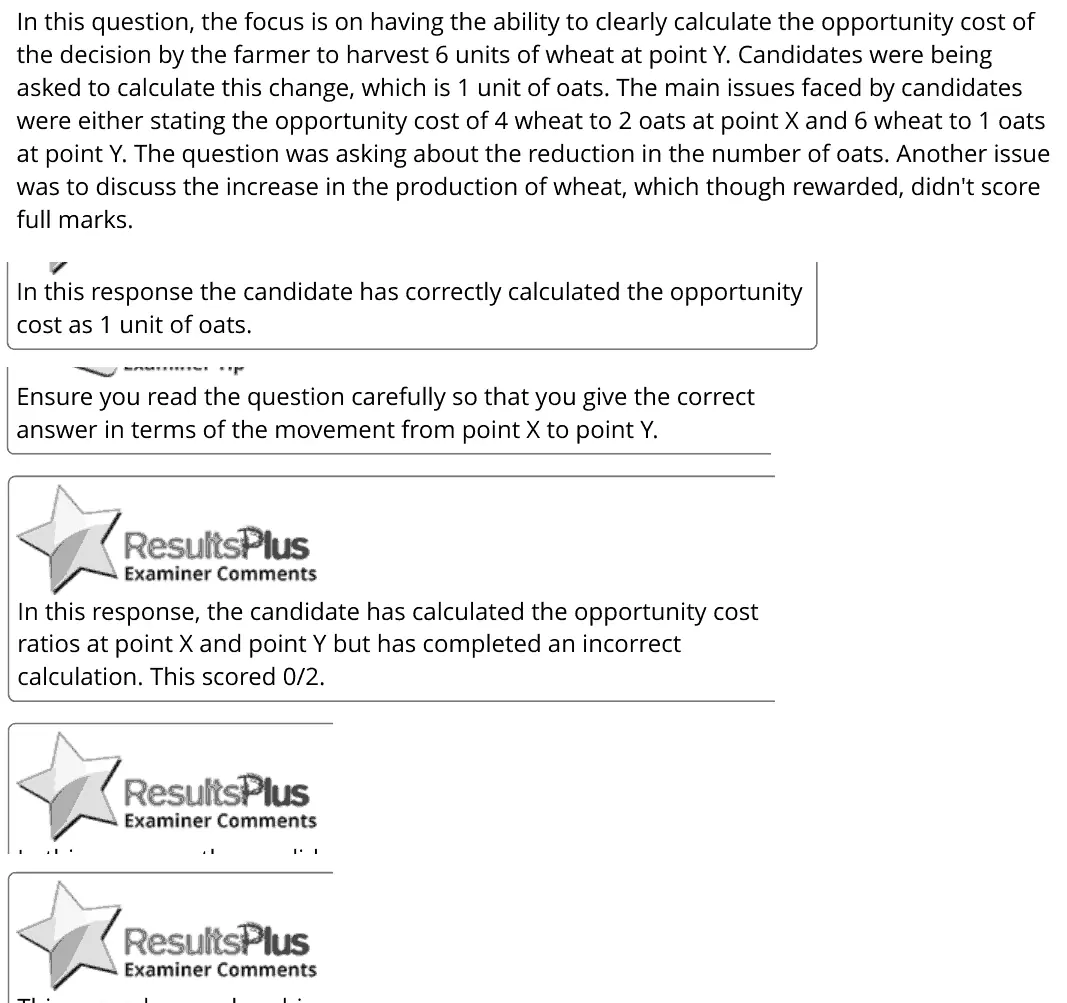
In this question, the focus is on having the ability to clearly calculate the opportunity cost of the decision by the farmer to harvest 6 units of wheat at point Y. Candidates were being asked to calculate this change, which is 1 unit of oats. The main issues faced by candidates were either stating the opportunity cost of 4 wheat to 2 oats at point X and 6 wheat to 1 oats at point Y. The question was asking about the reduction in the number of oats. Another issue was to discuss the increase in the production of wheat, which though rewarded, didn't score full marks. In this response the candidate has correctly calculated the opportunity cost as 1 unit of oats. Ensure you read the question carefully so that you give the correct answer in terms of the movement from point X to point Y. In this response, the candidate has calculated the opportunity cost ratios at point X and point Y but has completed an incorrect calculation. This scored 0/2.
Quantitative skills: QS 4 (construct and interpret a range of standard graphical forms); QS 9 (interpret, apply and analyse information in written, graphical tabular and numerical forms)

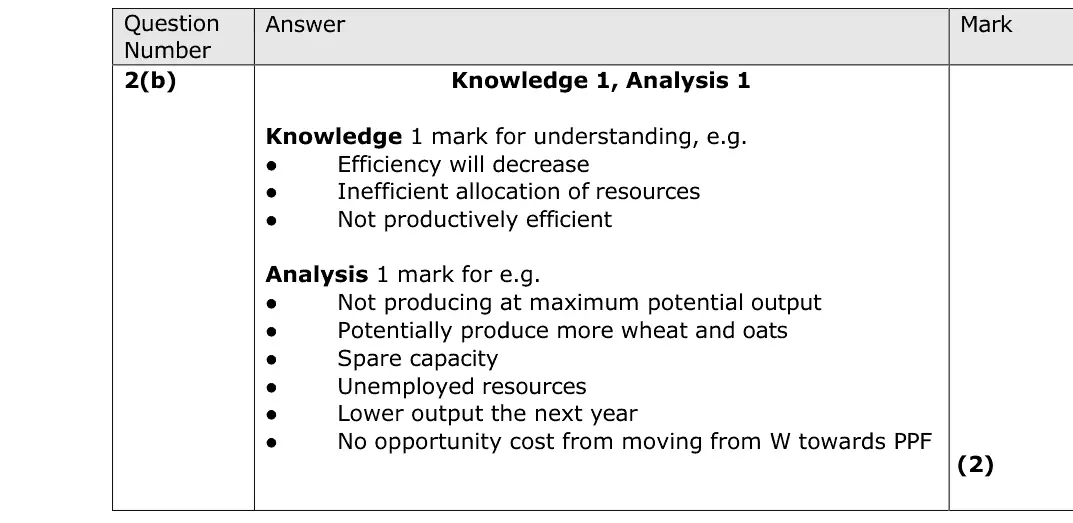
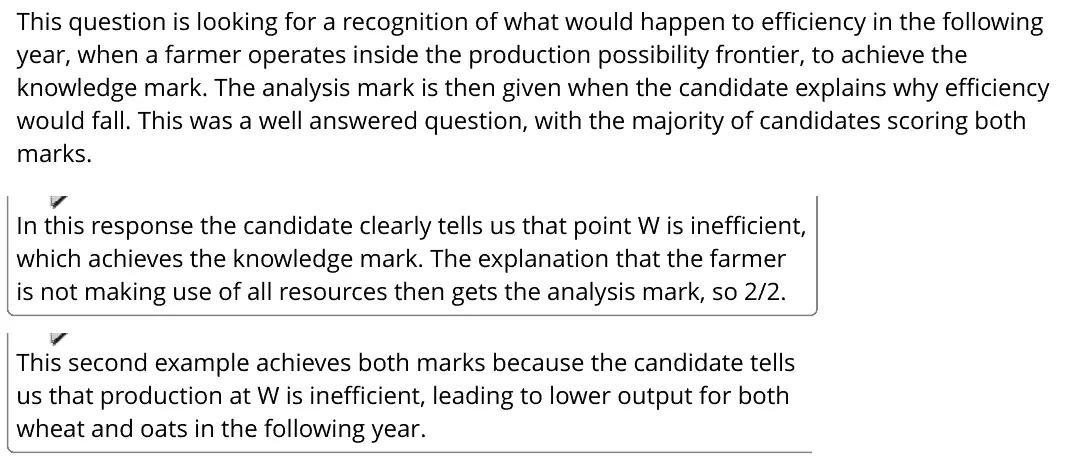
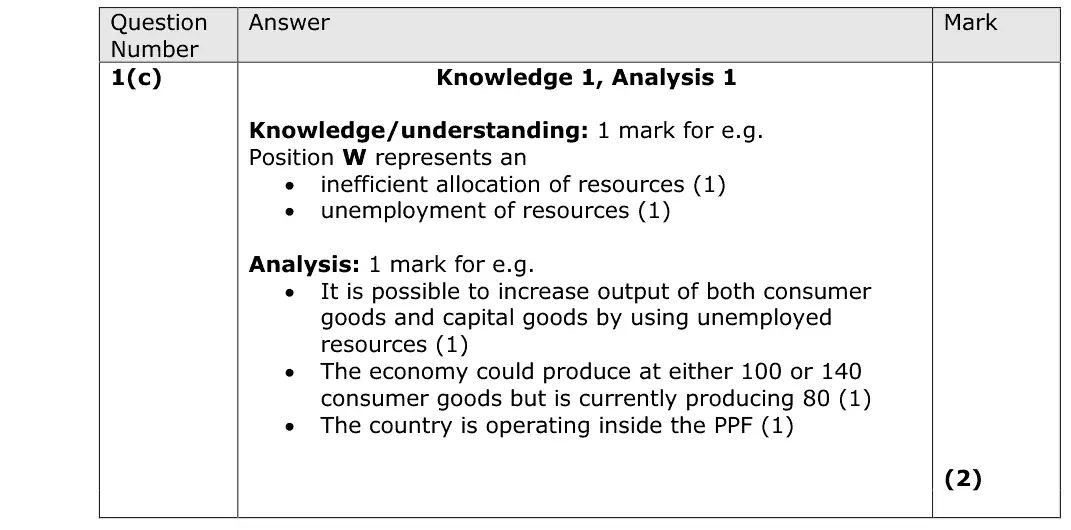
This question is looking for a recognition of what would happen to efficiency in the following year, when a farmer operates inside the production possibility frontier, to achieve the knowledge mark. The analysis mark is then given when the candidate explains why efficiency would fall. This was a well answered question, with the majority of candidates scoring both marks. In this response the candidate clearly tells us that point W is inefficient, which achieves the knowledge mark. The explanation that the farmer is not making use of all resources then gets the analysis mark, so 2/2. This second example achieves both marks because the candidate tells us that production at W is inefficient, leading to lower output for both wheat and oats in the following year.
Quantitative skills: QS 4 (construct and interpret a range of standard graphical forms)
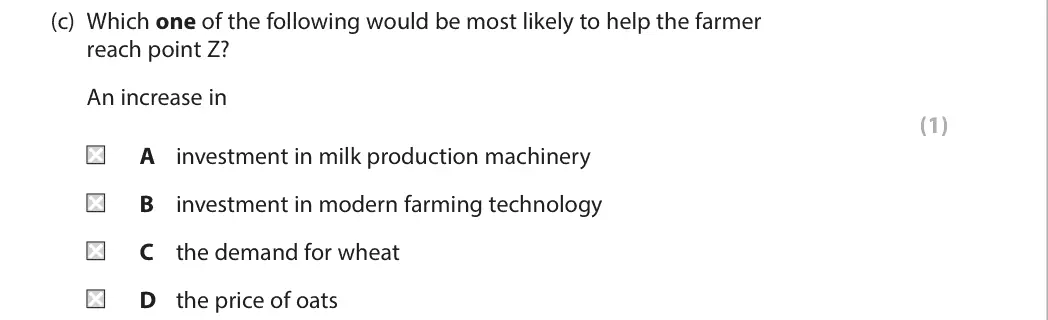
B

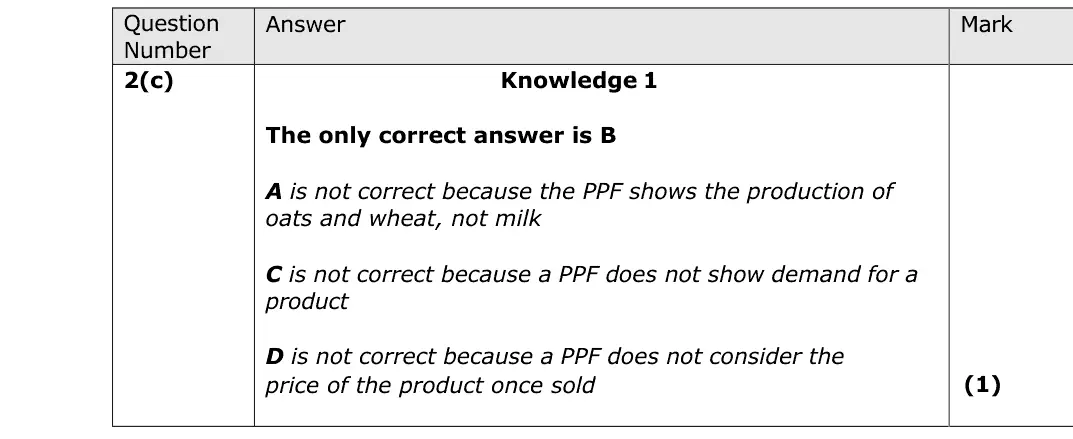
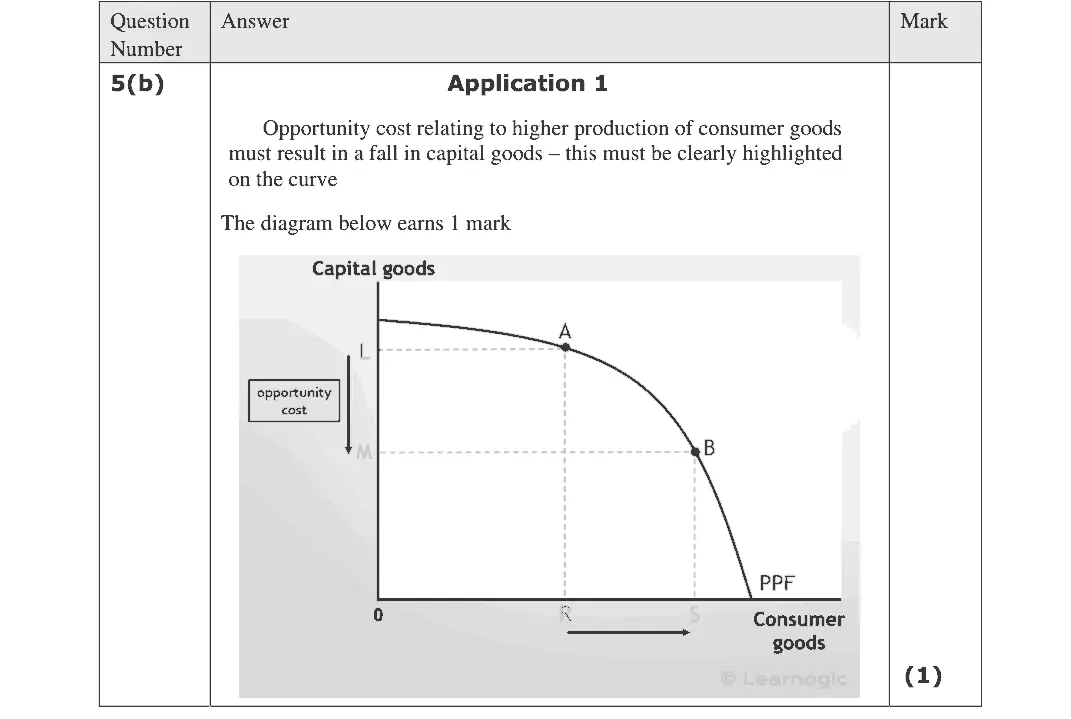
This question was diagrammatical and identified opportunity cost along a PPF curve. Some responses indicated a lack of understanding of opportunity cost and illustrated shifts in the curve, although the majority understood the question well.
Quantitative skills: QS 4 (construct and interpret a range of standard graphical forms)

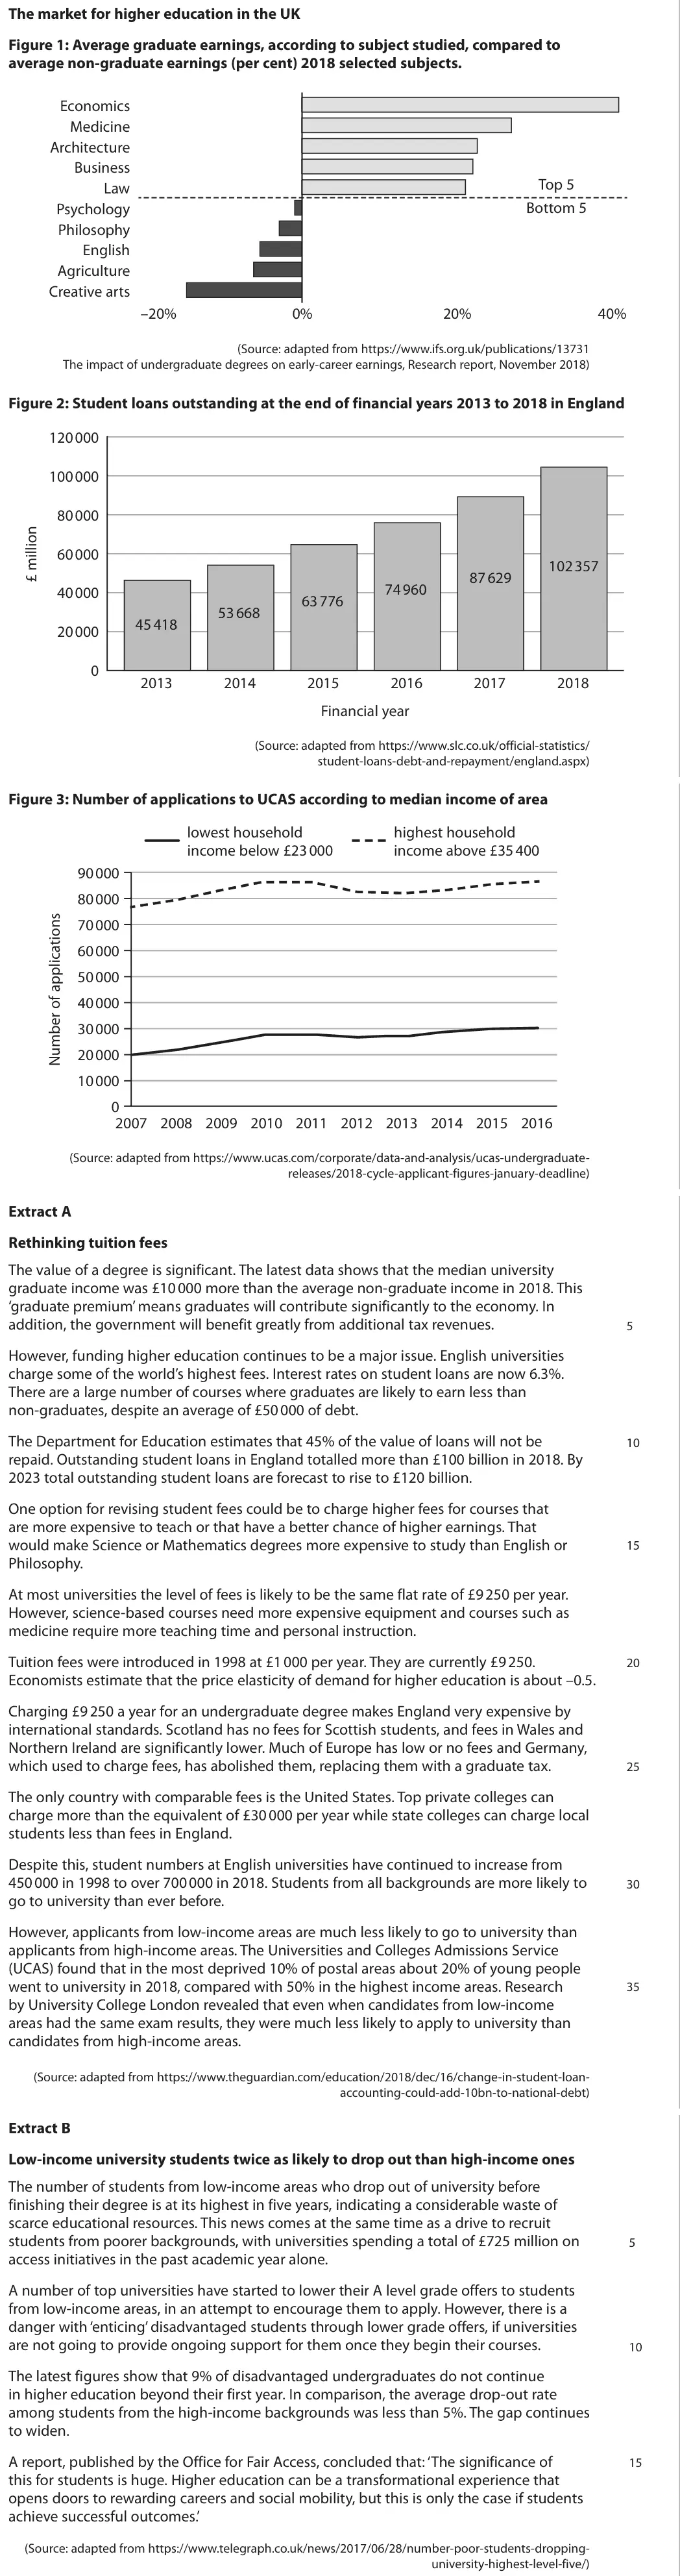
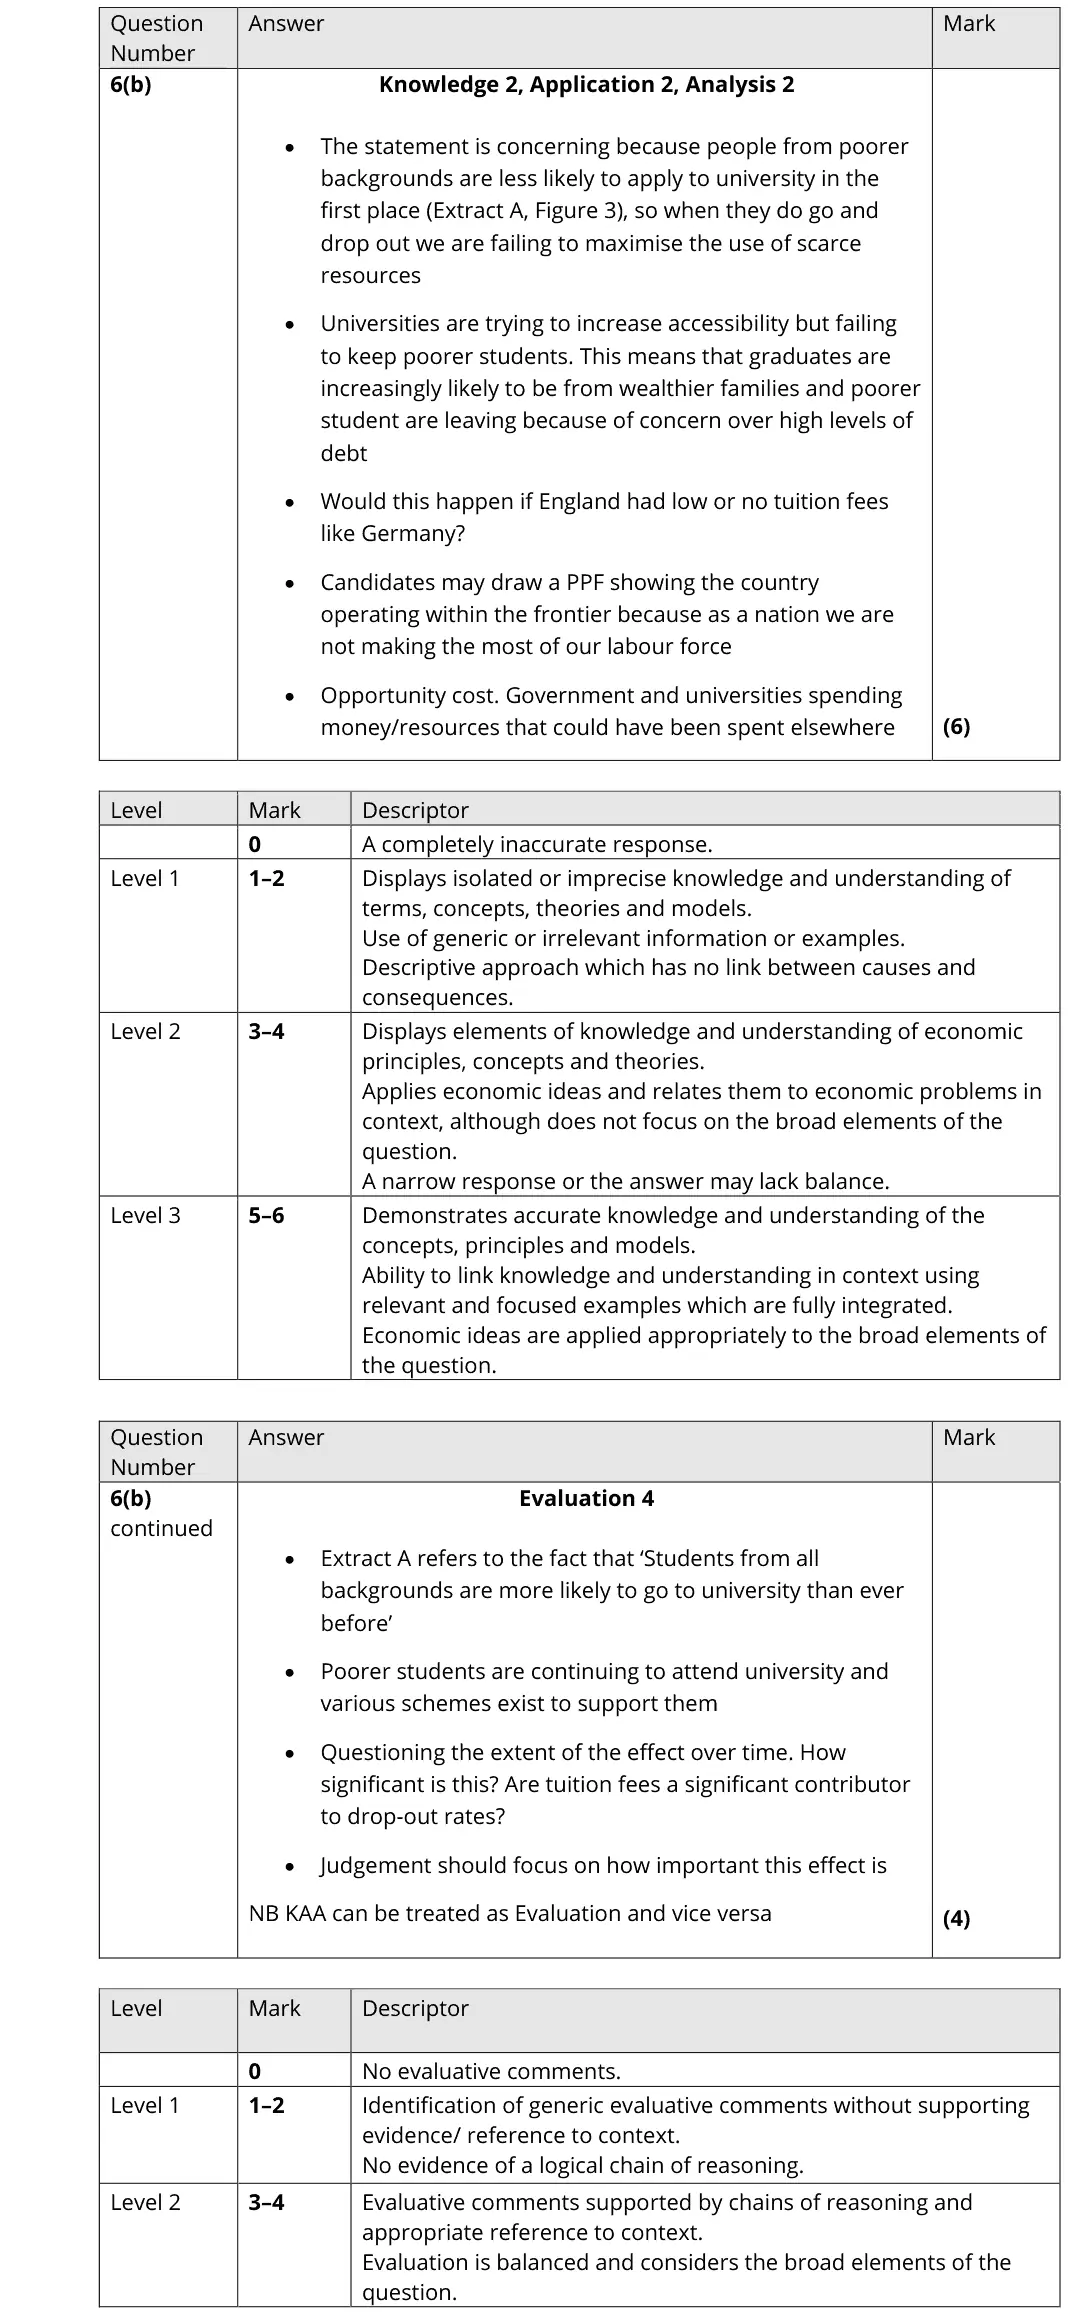
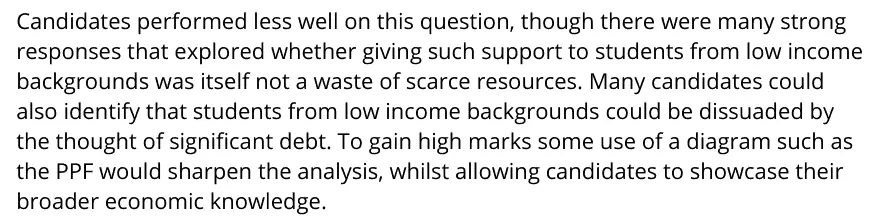
Candidates performed less well on this question, though there were many strong responses that explored whether giving such support to students from low income backgrounds was itself not a waste of scarce resources. Many candidates could also identify that students from low income backgrounds could be dissuaded by the thought of significant debt. To gain high marks some use of a diagram such as the PPF would sharpen the analysis, whilst allowing candidates to showcase their broader economic knowledge.
Quantitative skills: QS 9 (interpret, apply and analyse information in written, graphical tabular and numerical forms)
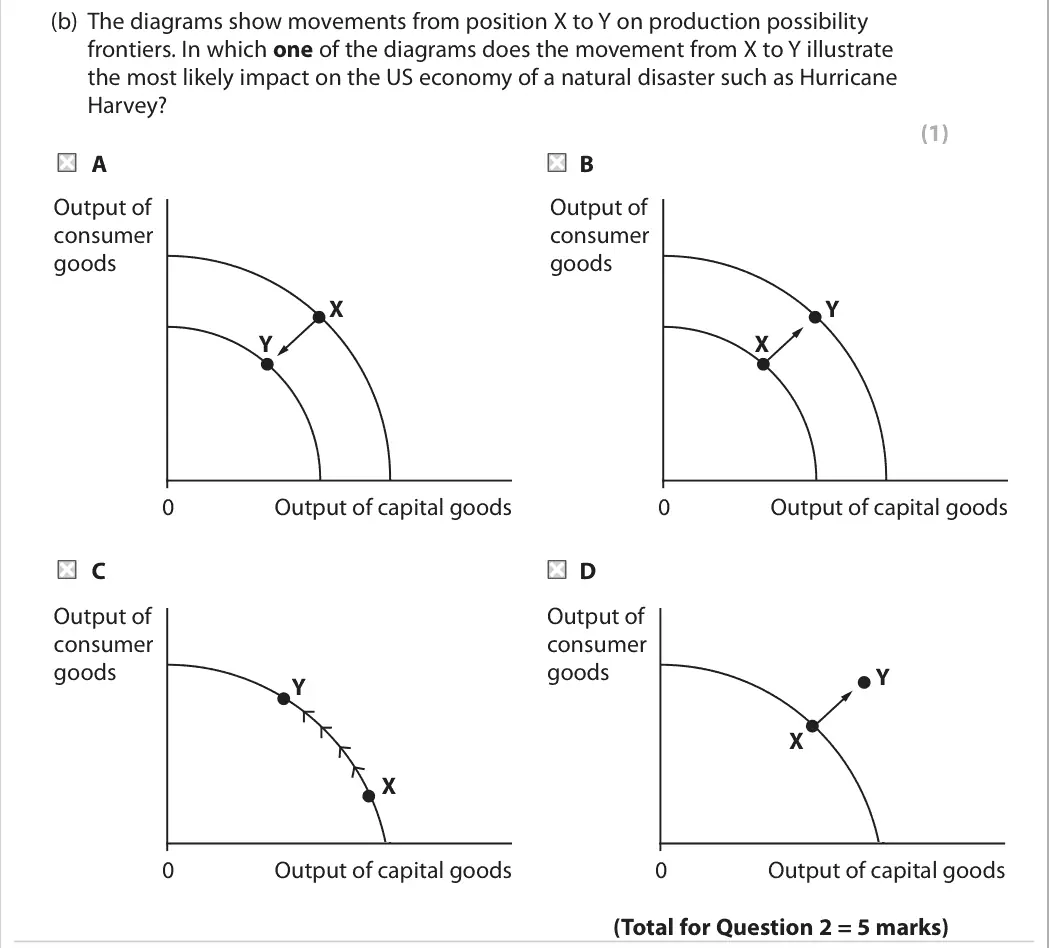
A
Quantitative skills: QS 4 (construct and interpret a range of standard graphical forms)

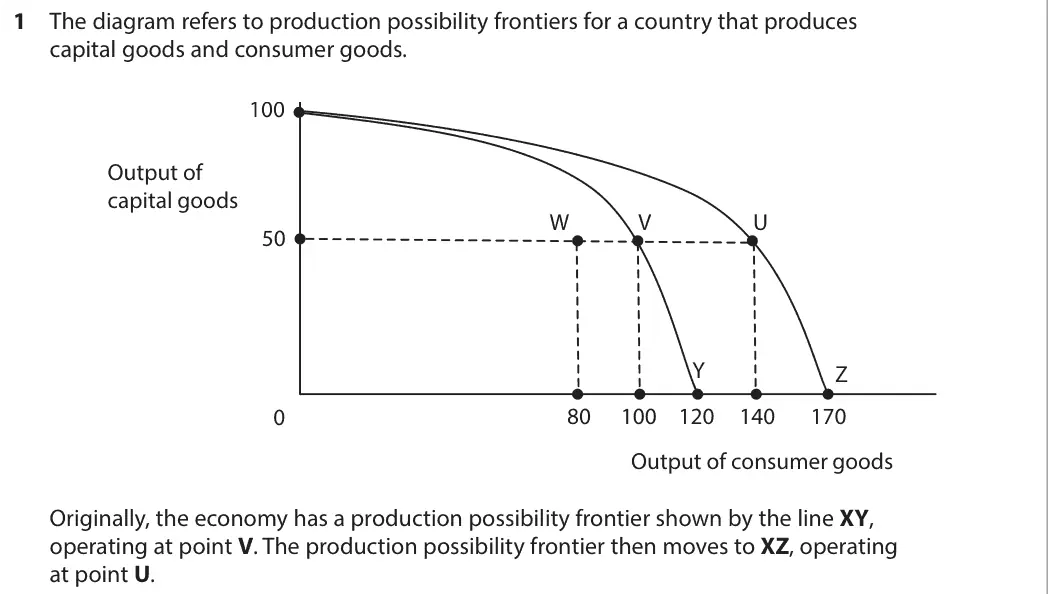
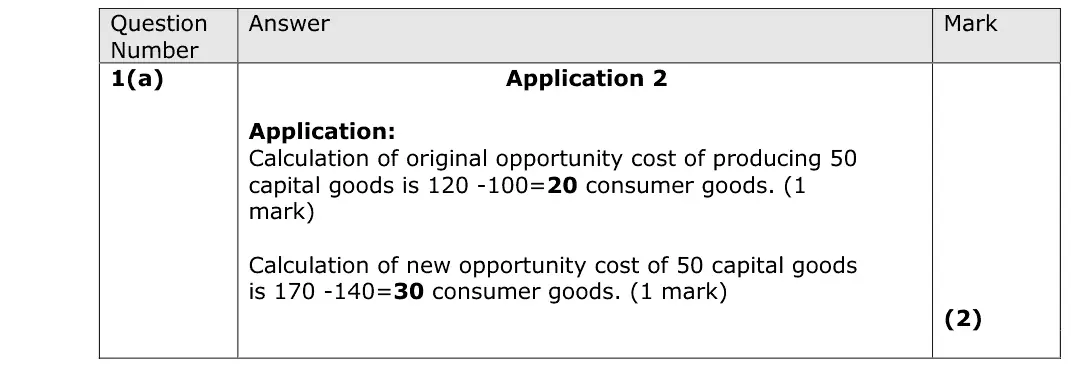
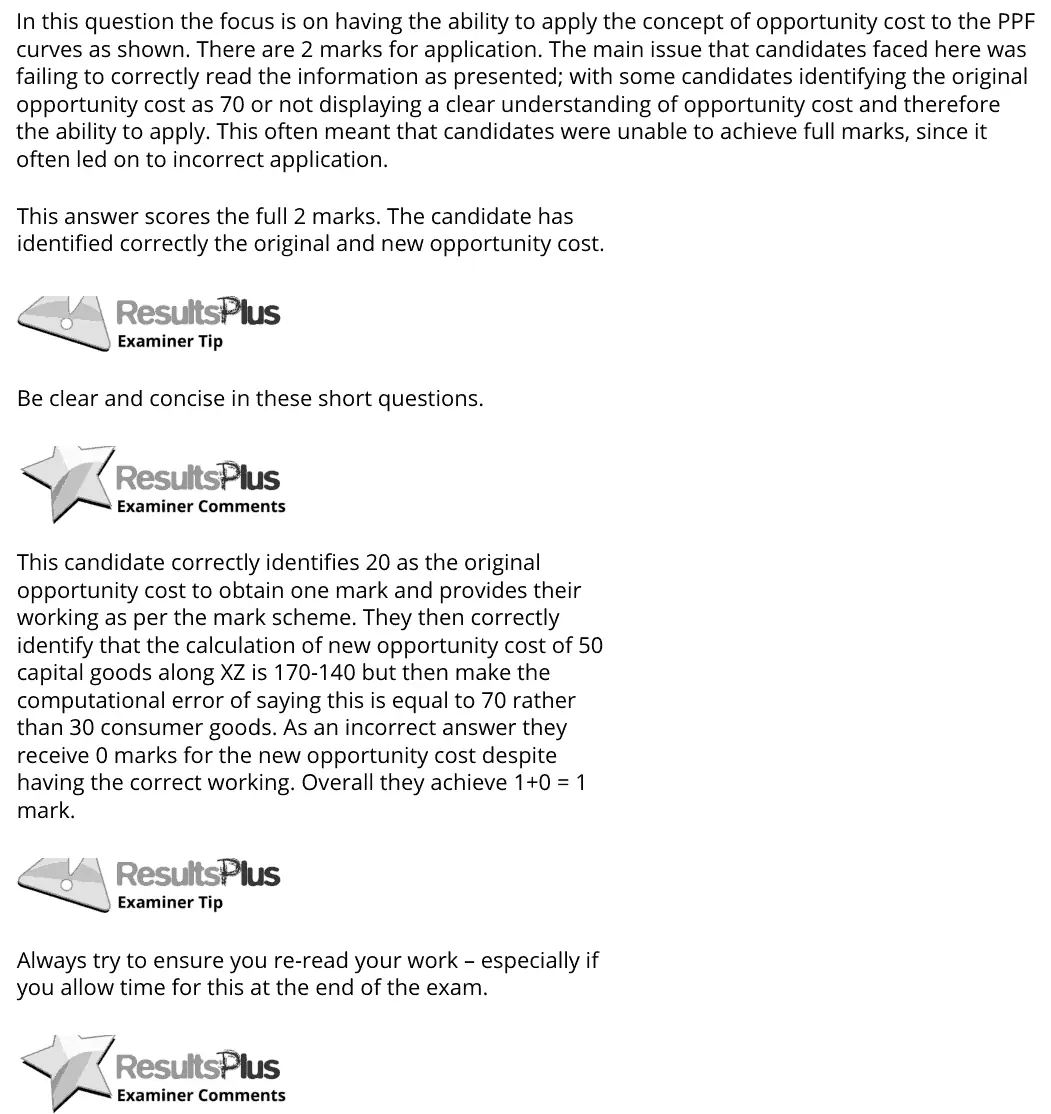
In this question the focus is on having the ability to apply the concept of opportunity cost to the PPF curves as shown. There are 2 marks for application. The main issue that candidates faced here was failing to correctly read the information as presented; with some candidates identifying the original opportunity cost as 70 or not displaying a clear understanding of opportunity cost and therefore the ability to apply. This often meant that candidates were unable to achieve full marks, since it often led on to incorrect application. This answer scores the full 2 marks. The candidate has identified correctly the original and new opportunity cost. Be clear and concise in these short questions. This candidate correctly identifies 20 as the original opportunity cost to obtain one mark and provides their working as per the mark scheme. They then correctly identify that the calculation of new opportunity cost of 50 capital goods along XZ is 170-140 but then make the computational error of saying this is equal to 70 rather than 30 consumer goods. As an incorrect answer they receive 0 marks for the new opportunity cost despite having the correct working. Overall they achieve 1+0 = 1 mark. Always try to ensure you re-read your work – especially if you allow time for this at the end of the exam.
Quantitative skills: QS 4 (construct and interpret a range of standard graphical forms); QS 9 (interpret, apply and analyse information in written, graphical tabular and numerical forms)
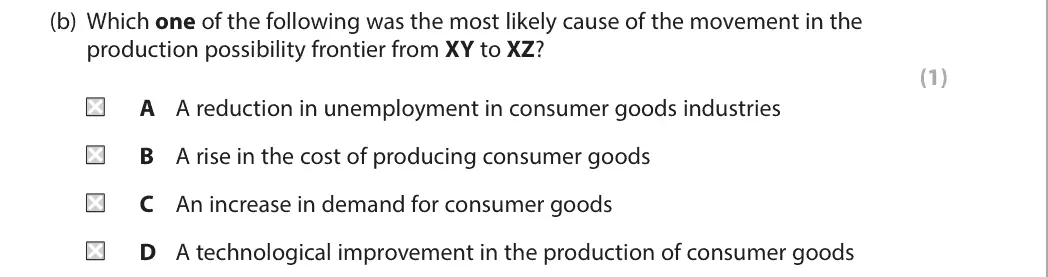
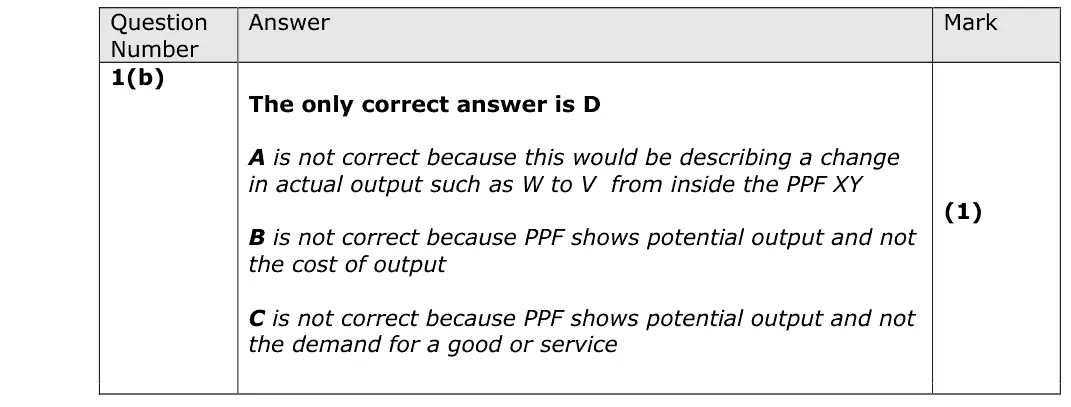
D

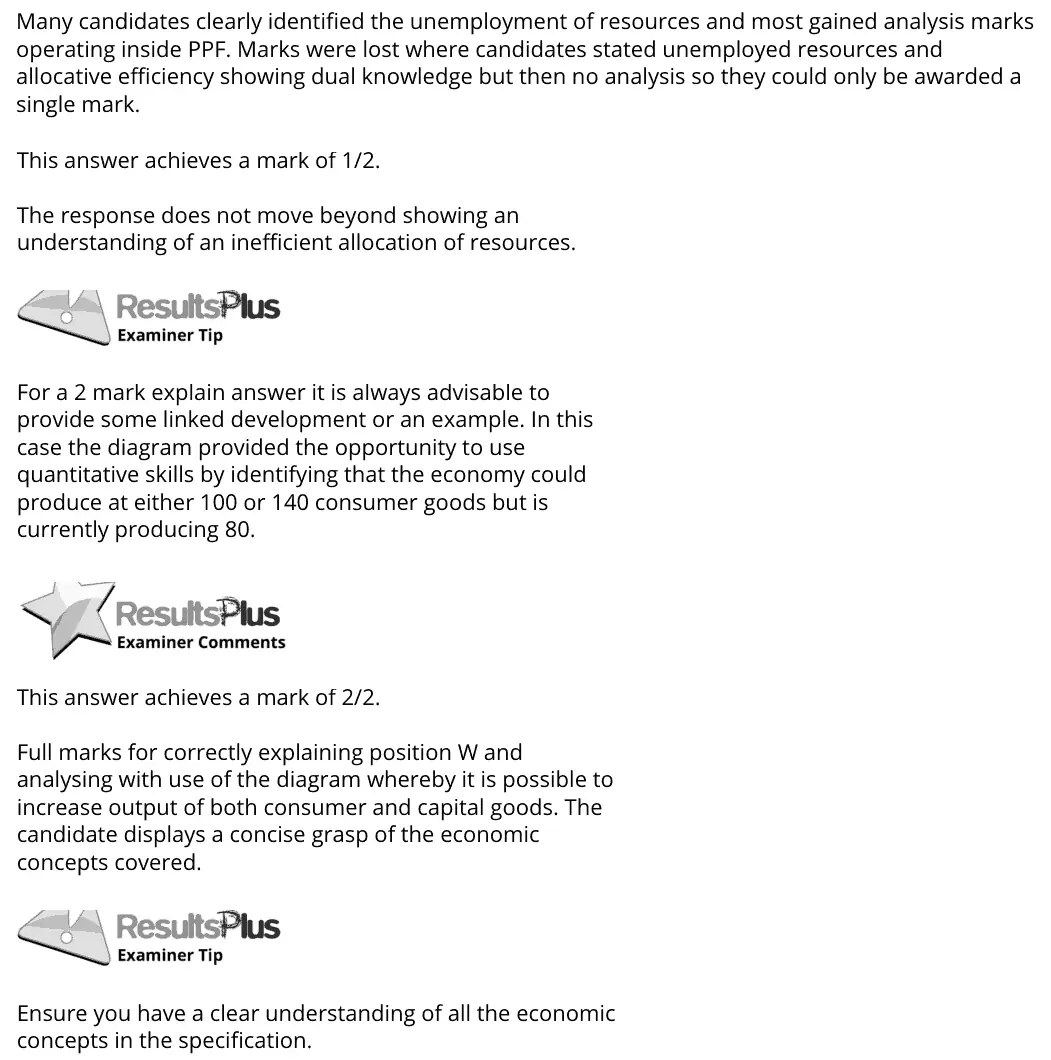
Many candidates clearly identified the unemployment of resources and most gained analysis marks operating inside PPF. Marks were lost where candidates stated unemployed resources and allocative efficiency showing dual knowledge but then no analysis so they could only be awarded a single mark. This answer achieves a mark of 1/2. The response does not move beyond showing an understanding of an inefficient allocation of resources. For a 2 mark explain answer it is always advisable to provide some linked development or an example. In this case the diagram provided the opportunity to use quantitative skills by identifying that the economy could produce at either 100 or 140 consumer goods but is currently producing 80. This answer achieves a mark of 2/2. Full marks for correctly explaining position W and analysing with use of the diagram whereby it is possible to increase output of both consumer and capital goods. The candidate displays a concise grasp of the economic concepts covered. Ensure you have a clear understanding of all the economic concepts in the specification.
Quantitative skills: QS 4 (construct and interpret a range of standard graphical forms)

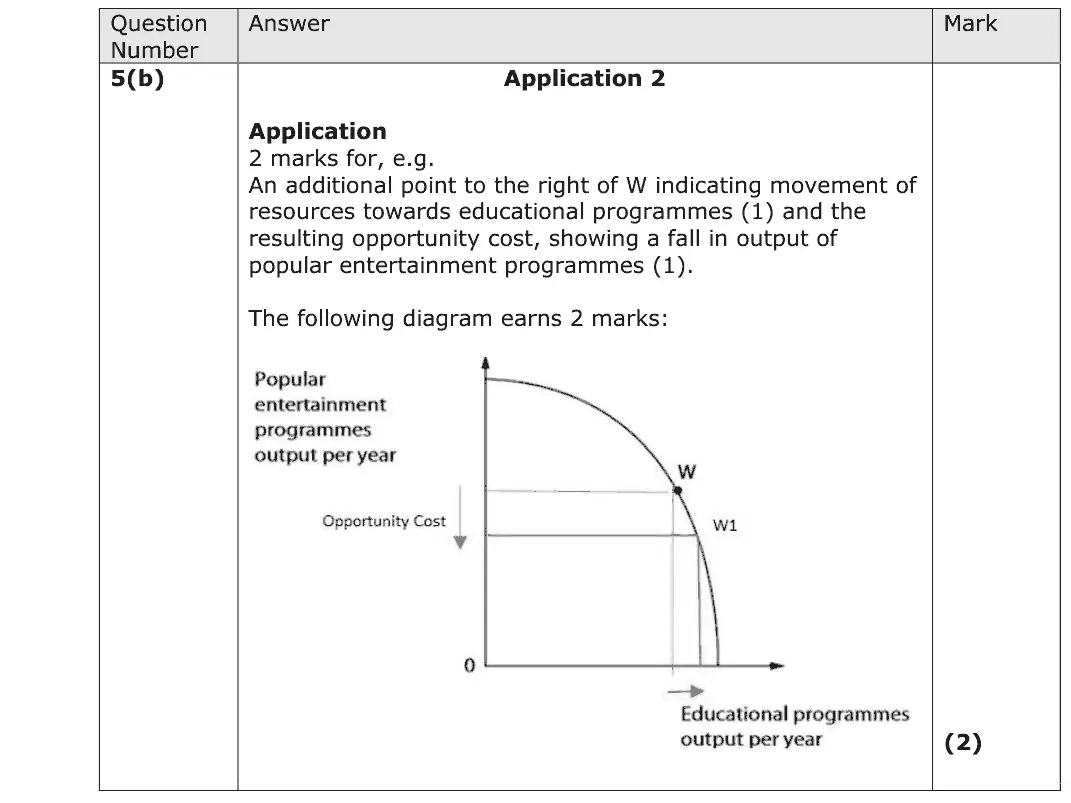
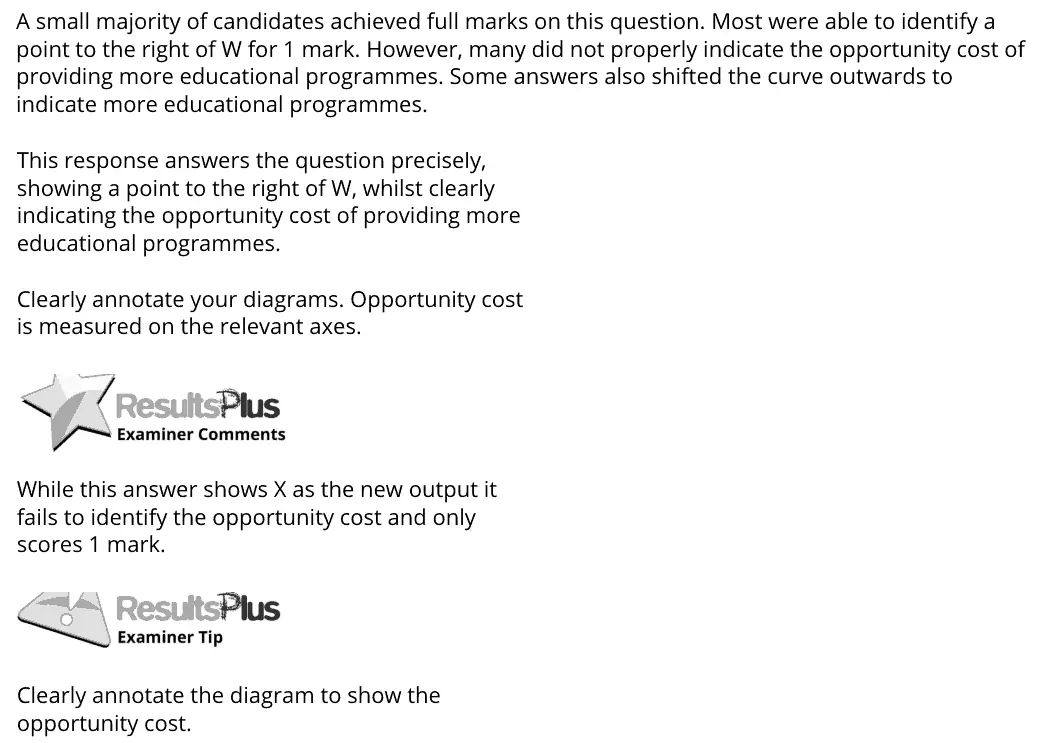
A small majority of candidates achieved full marks on this question. Most were able to identify a point to the right of W for 1 mark. However, many did not properly indicate the opportunity cost of providing more educational programmes. Some answers also shifted the curve outwards to indicate more educational programmes. This response answers the question precisely, showing a point to the right of W, whilst clearly indicating the opportunity cost of providing more educational programmes. Clearly annotate your diagrams. Opportunity cost is measured on the relevant axes. While this answer shows X as the new output it fails to identify the opportunity cost and only scores 1 mark. Clearly annotate the diagram to show the opportunity cost.
Quantitative skills: QS 4 (construct and interpret a range of standard graphical forms)

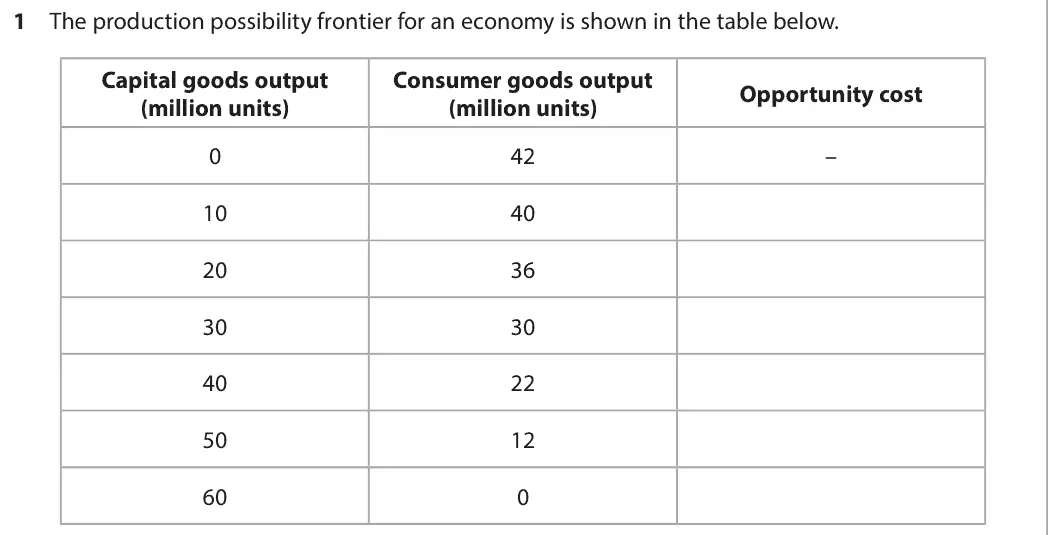
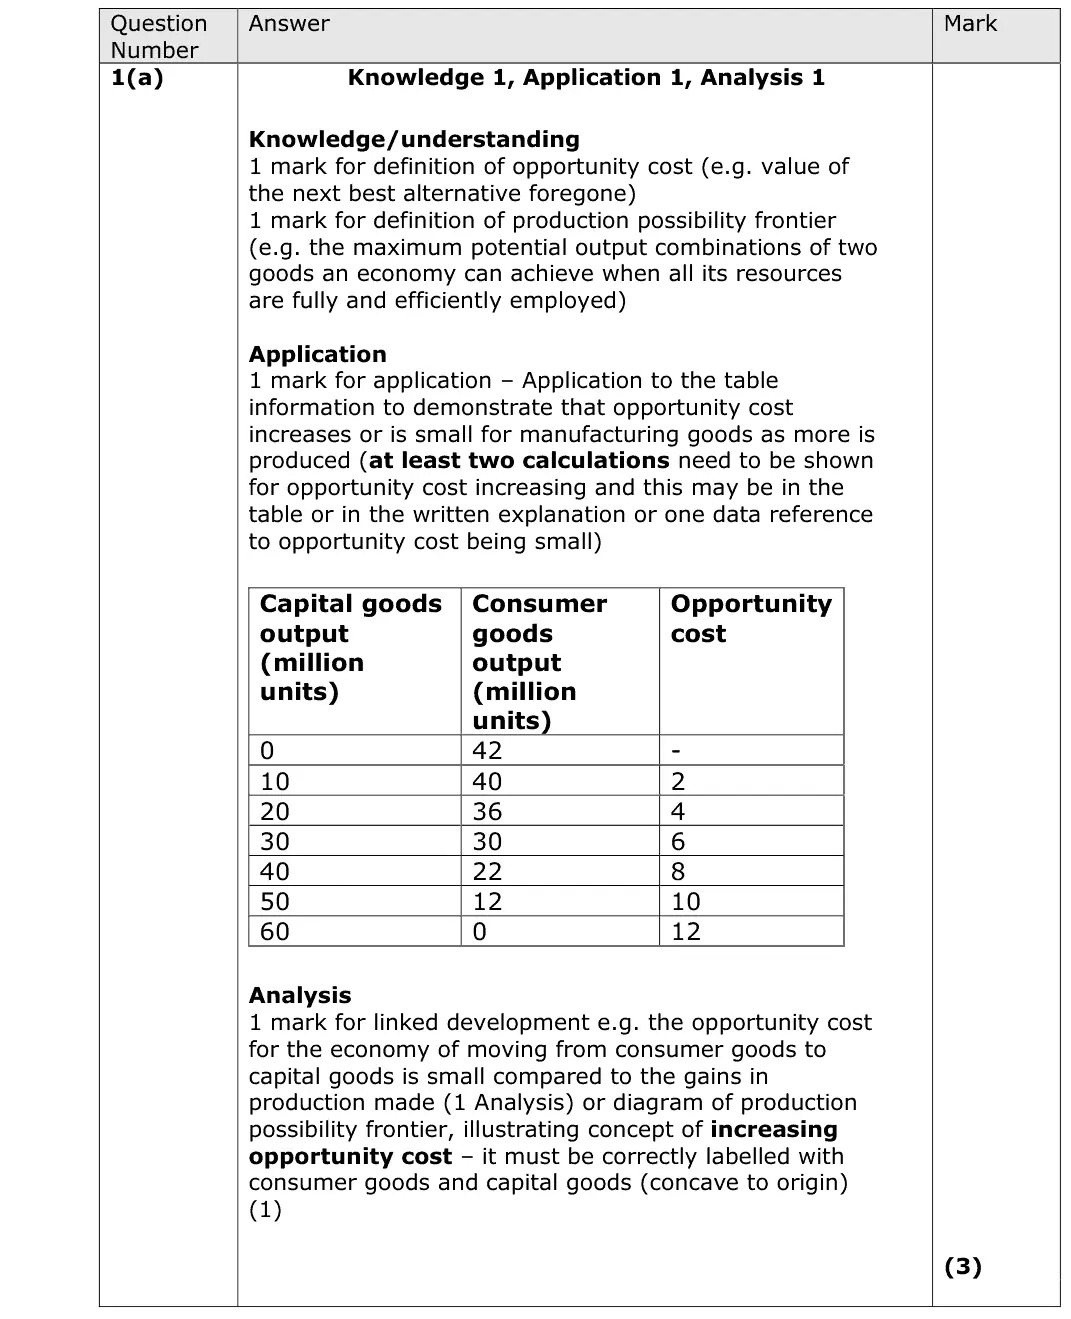
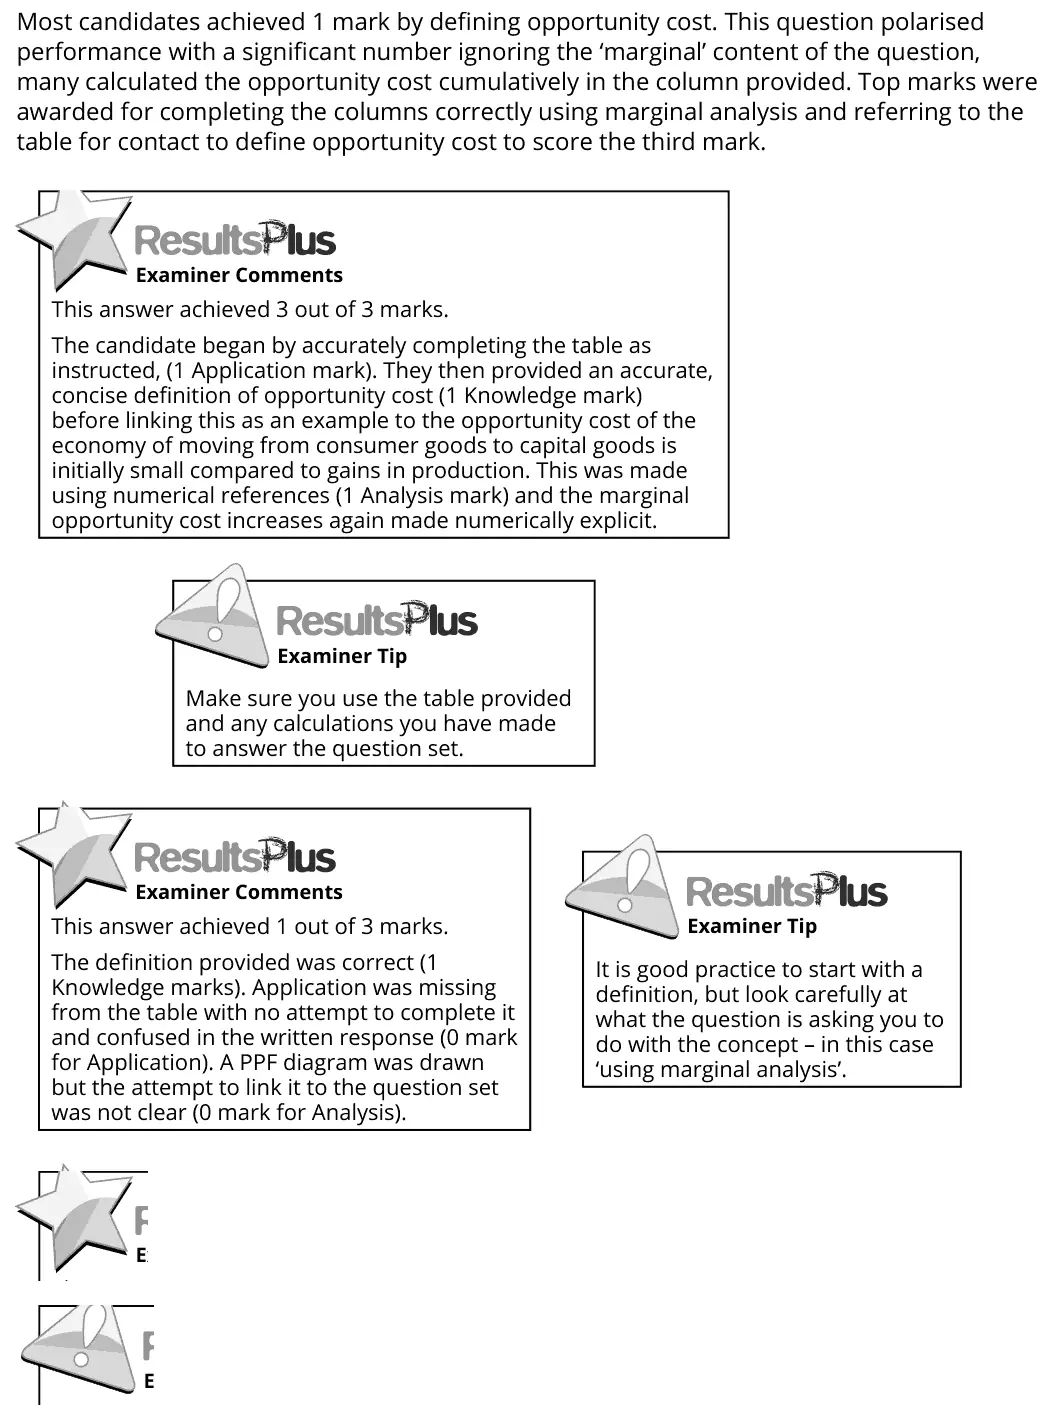
Most candidates achieved 1 mark by defining opportunity cost. This question polarised performance with a significant number ignoring the ‘marginal’ content of the question, many calculated the opportunity cost cumulatively in the column provided. Top marks were awarded for completing the columns correctly using marginal analysis and referring to the table for contact to define opportunity cost to score the third mark. This answer achieved 3 out of 3 marks. The candidate began by accurately completing the table as instructed, (1 Application mark). They then provided an accurate, concise definition of opportunity cost (1 Knowledge mark) before linking this as an example to the opportunity cost of the economy of moving from consumer goods to capital goods is initially small compared to gains in production. This was made using numerical references (1 Analysis mark) and the marginal opportunity cost increases again made numerically explicit. Make sure you use the table provided and any calculations you have made to answer the question set. This answer achieved 1 out of 3 marks. The definition provided was correct (1 Knowledge marks). Application was missing from the table with no attempt to complete it and confused in the written response (0 mark for Application). A PPF diagram was drawn but the attempt to link it to the question set was not clear (0 mark for Analysis). It is good practice to start with a definition, but look carefully at what the question is asking you to do with the concept – in this case ‘using marginal analysis’.
Quantitative skills: QS 9 (interpret, apply and analyse information in written, graphical tabular and numerical forms)
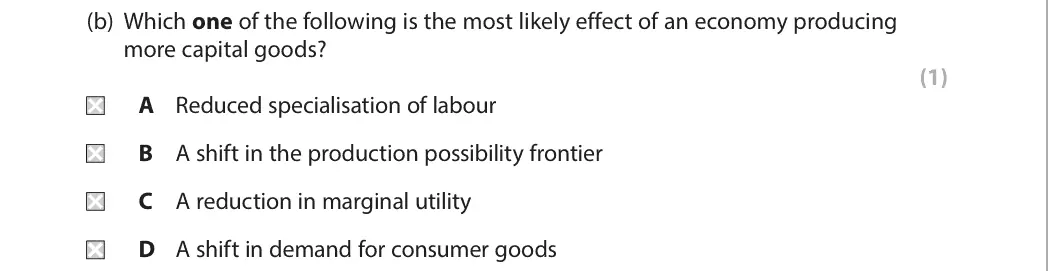
B
Essays stuck in Level 2, or losing the easy marks in Section A? Book a trial session with Lianne, a former Edexcel examiner.