International competitiveness Theme 4

Where it is examined
A-level Paper 2 (and Paper 3)
Level
A level only
Specification
Section 4.1, 1 statement
Since 2016
8 question parts: 4 essays, 1 levels-marked responses, 1 multiple-choice items

Notes and key-term cards for this topic are being written by our tutors. The past-paper questions below are ready now.

Specification statements

Every essay set on this topic

SeriesPaperQMarksTitle
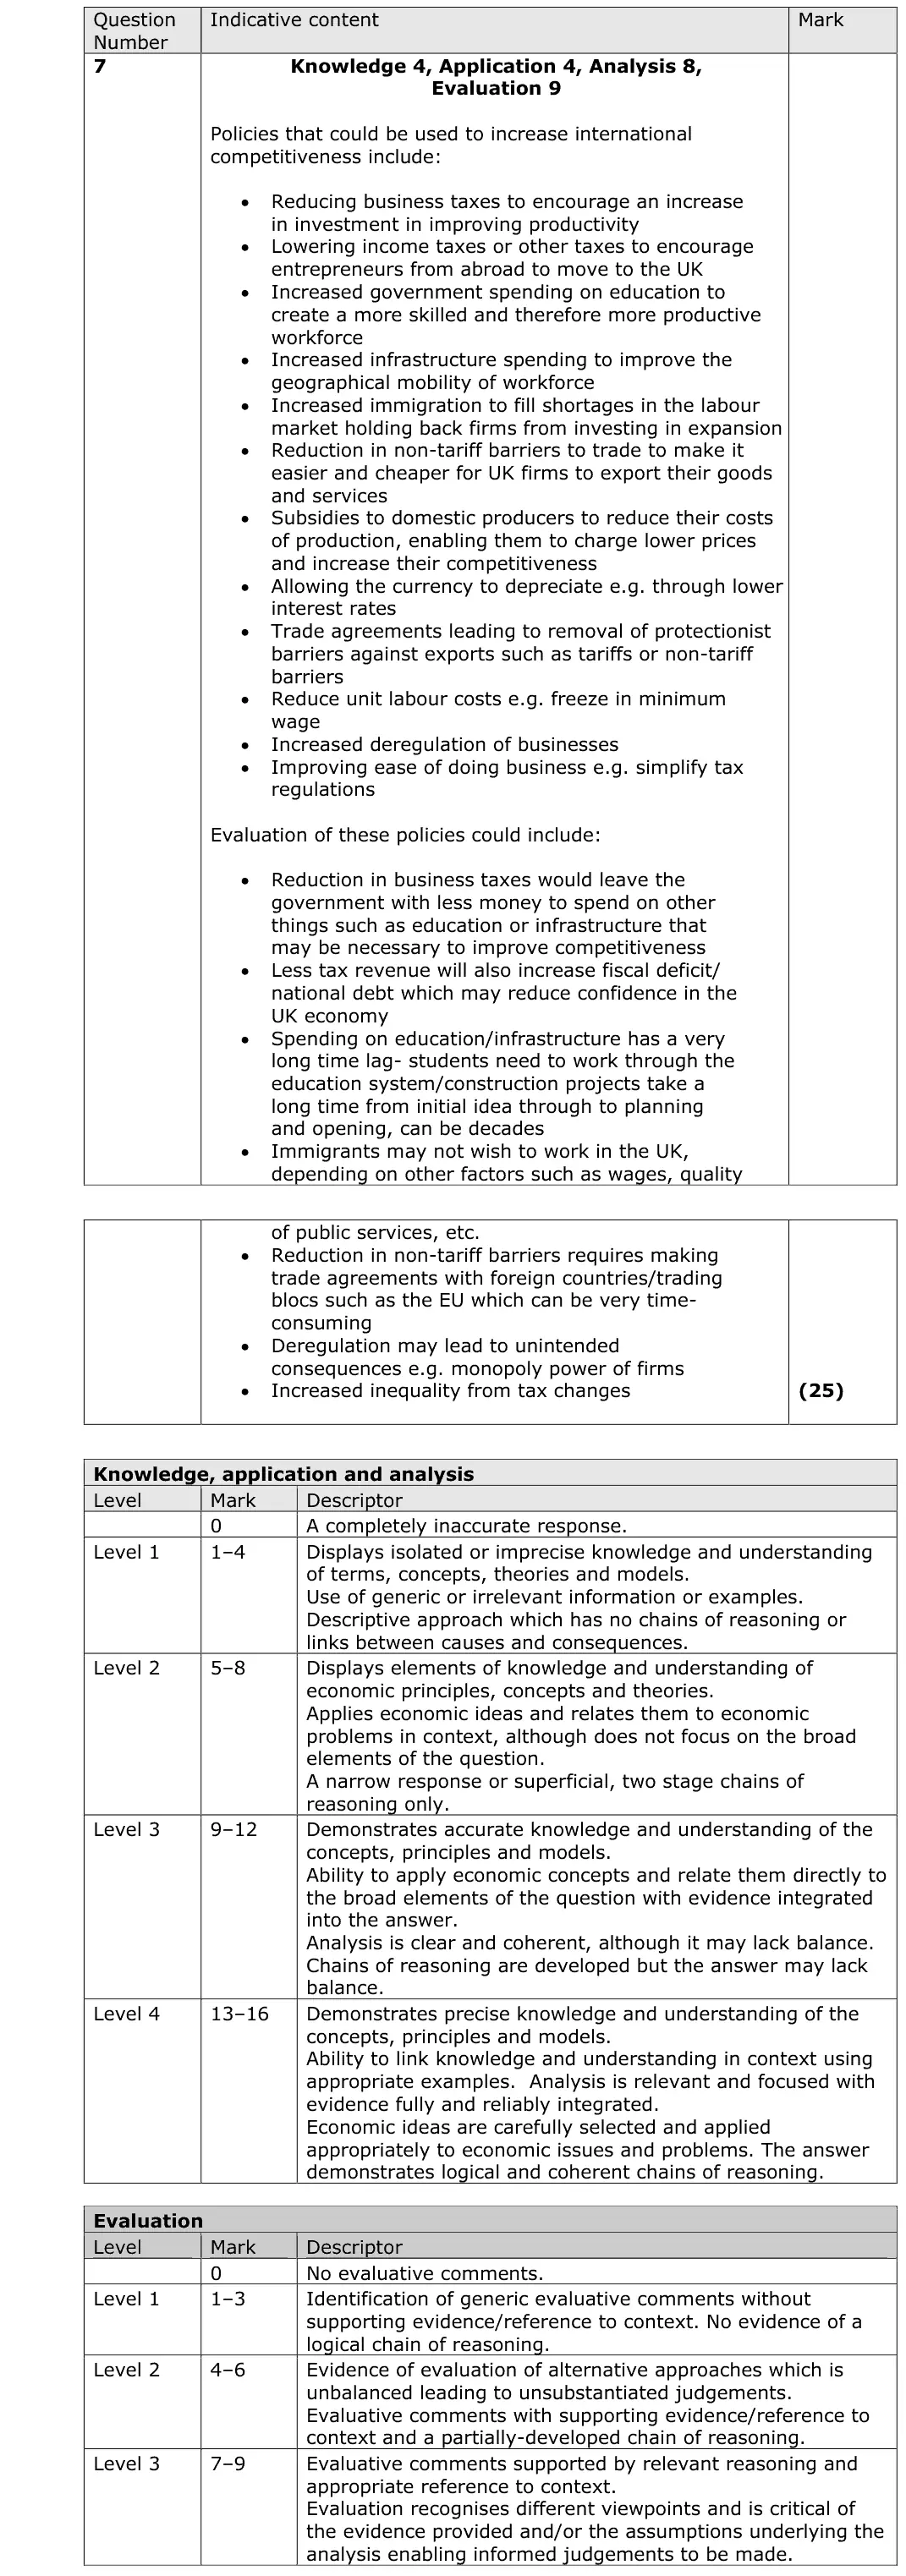
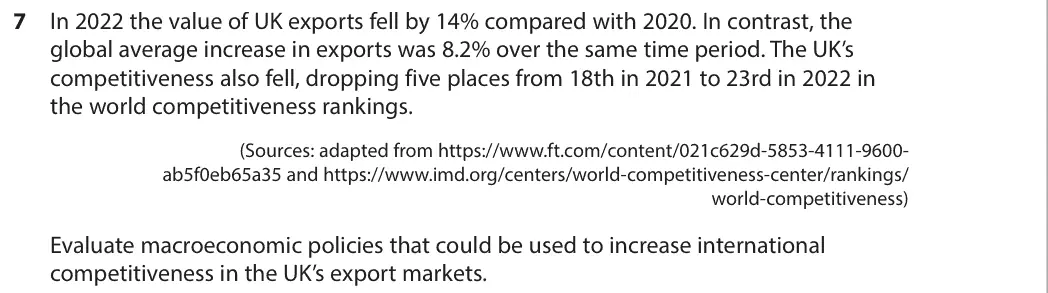
June 2023Paper 2725In 2022 the value of UK exports fell by 14% compared with 2020. In contrast, the global average increase in exports was 8.2% over the same time period. The UK’s competitiveness also fell, dropping five places from 18th in 2021 to 23rd in 2022 in the world competitiveness rankings. (Sources: adapted from https://www.ft.com/content/021c629d-5853-4111-9600- ab5f0eb65a35 and https://www.imd.org/centers/world-competitiveness-center/rankings/ world-competitiveness) Evaluate macroeconomic policies that could be used to increase international competitiveness in the UK’s export markets.
November 2021Paper 32(d)25Evaluate the microeconomic and macroeconomic factors which are likely to determine the rate of economic growth in Germany relative to other developed economies.
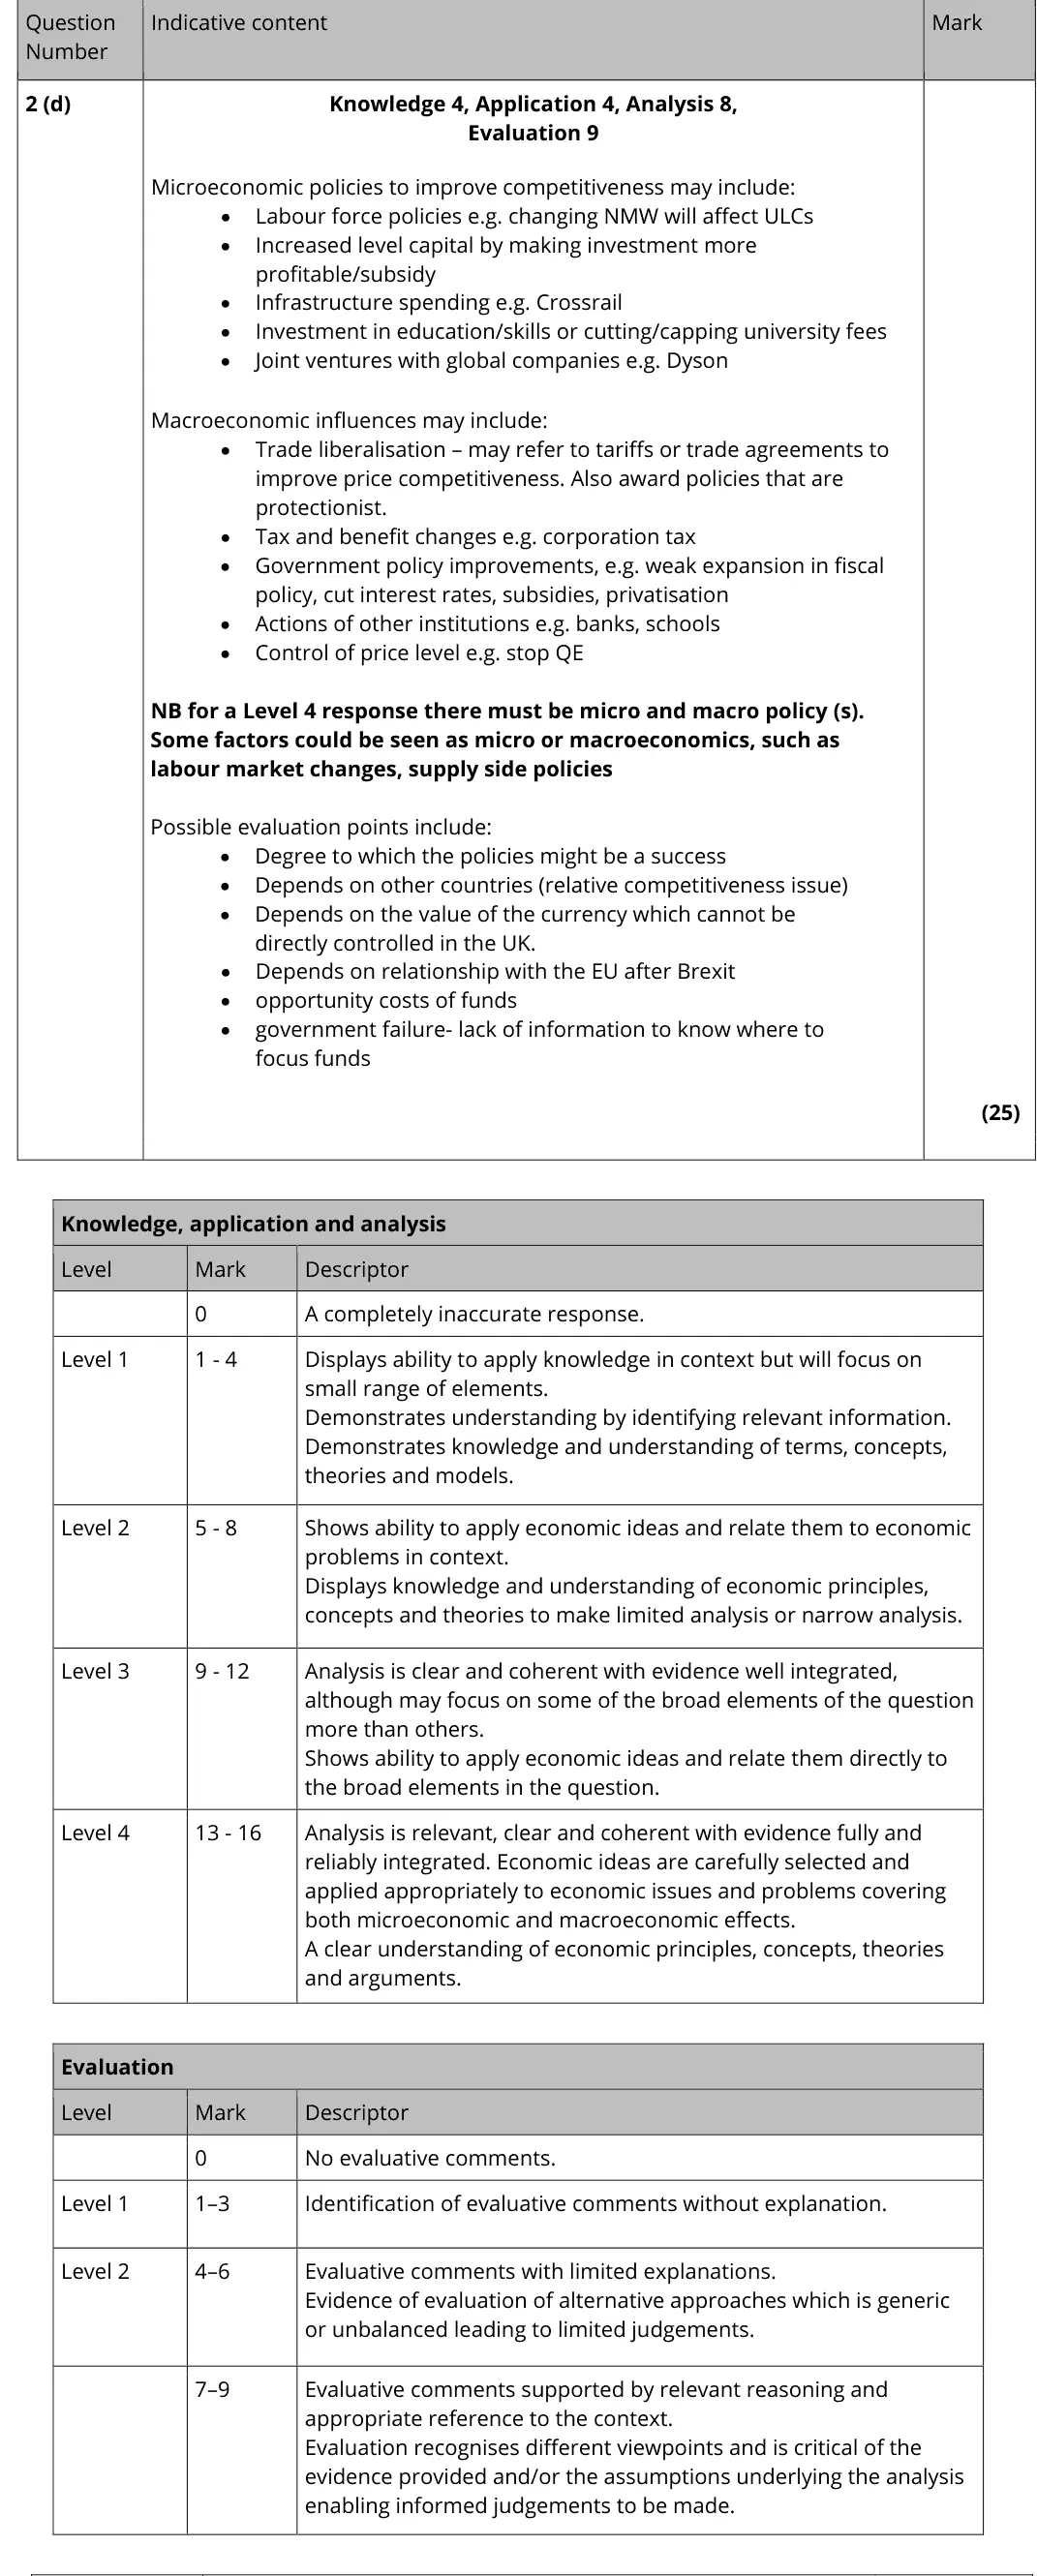
October 2020Paper 32(d)25Evaluate possible microeconomic and macroeconomic policies which could be used to improve UK competitiveness.
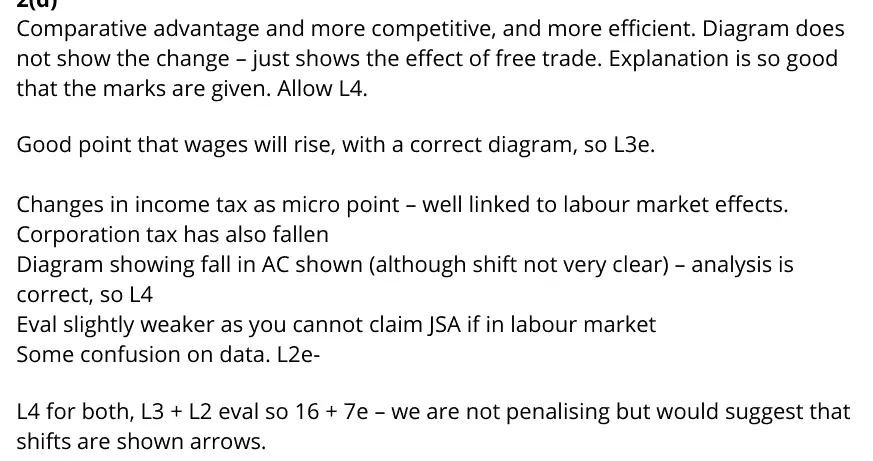
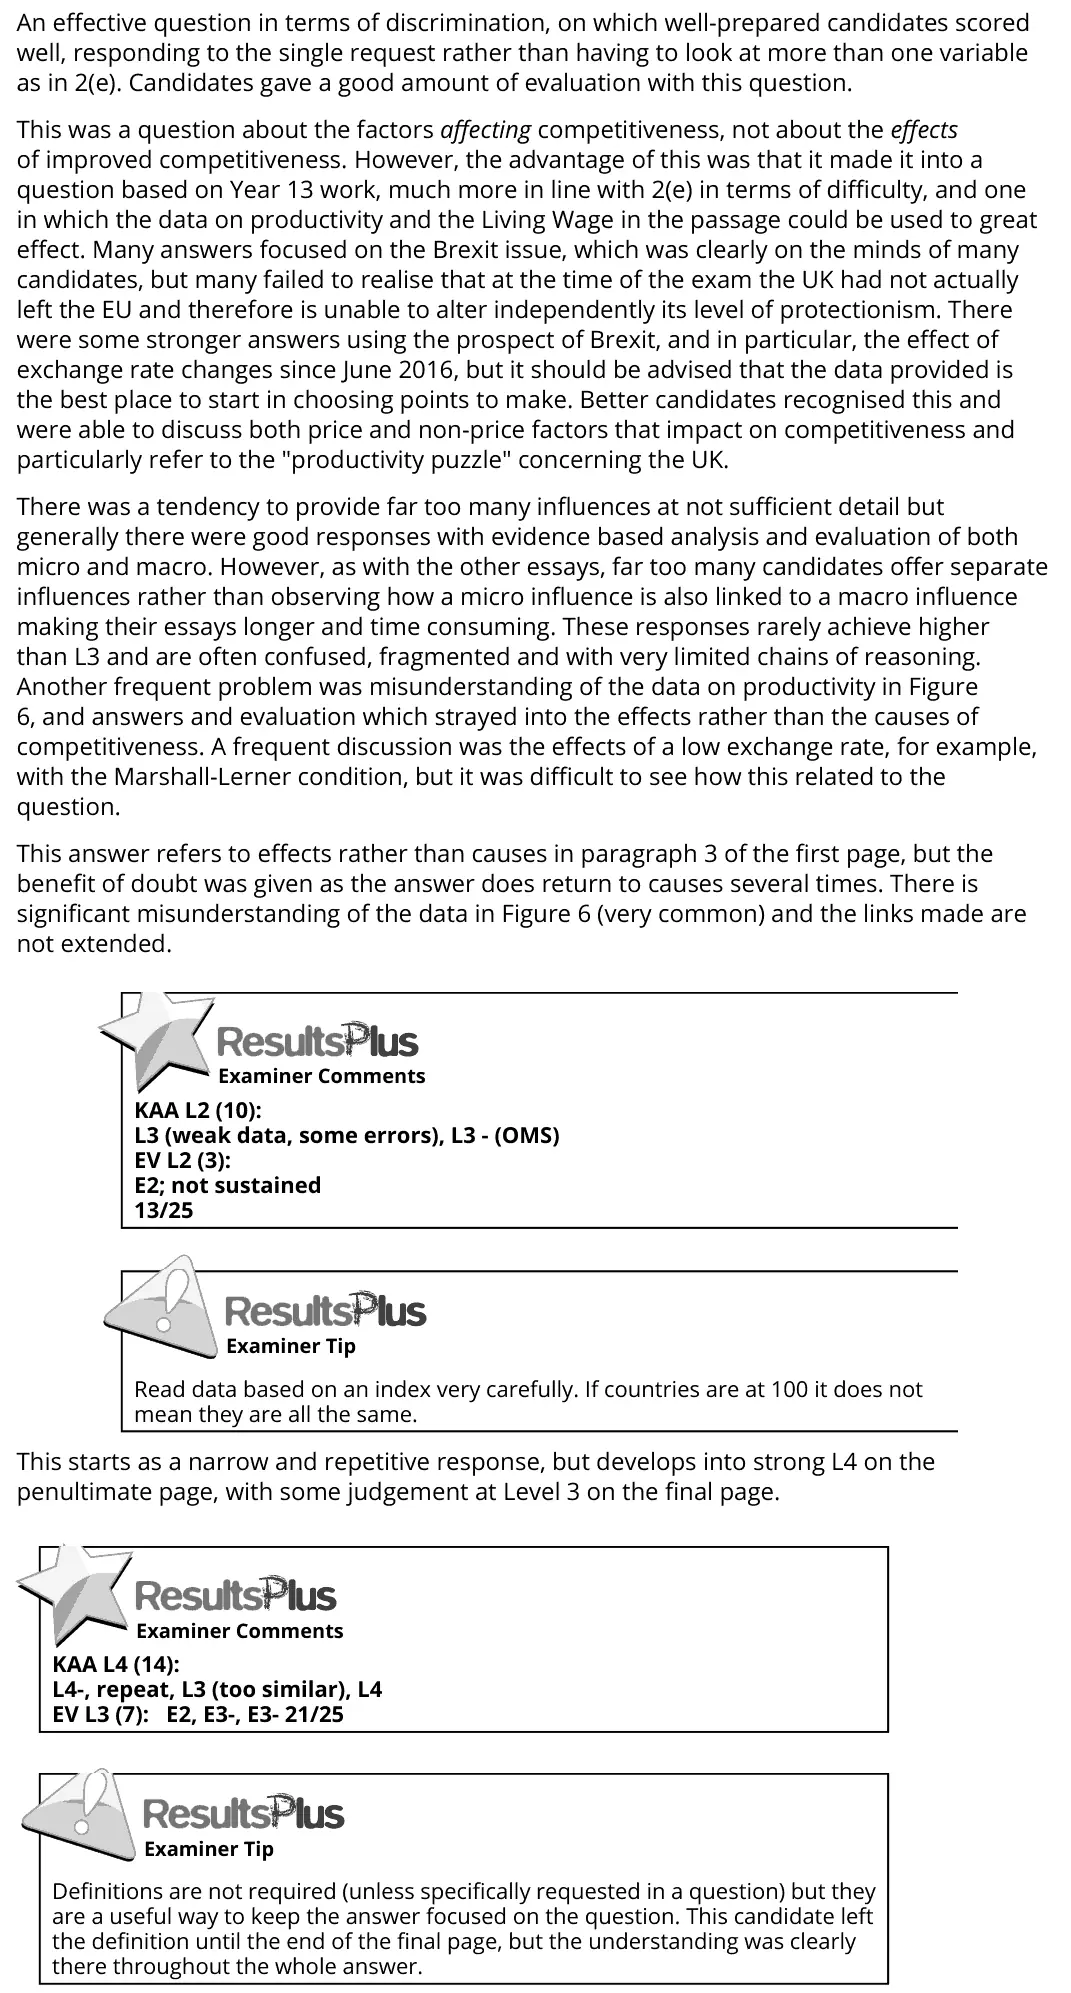
June 2017Paper 32(d)25With reference to the information provided and your own knowledge, evaluate the likely microeconomic and macroeconomic influences on the UK’s international competitiveness.

Past-paper questions

Print this topic as a pack

Tap a question to zoom it. The data and extracts fold out above each question; the mark scheme and examiner's comment open underneath.
June 2023 · Paper 2 · Q7 25 marks AO1=4, AO2=4, AO3=8, AO4=9 25-mark essay Either/or
7 In 2022 the value of UK exports fell by 14% compared with 2020. In contrast, the global average increase in exports was 8.2% over the same time period. The UK’s competitiveness also fell, dropping five places from 18th in 2021 to 23rd in 2022 in the world competitiveness rankings. (Sources: adapted from https://www.ft.com/content/021c629d-5853-4111-9600- ab5f0eb65a35 and https://www.imd.org/centers/world-competitiveness-center/rankings/ world-competitiveness) Evaluate macroeconomic policies that could be used to increase international competitiveness in the UK’s export markets.
November 2021 · Paper 3 · Q2(d) 25 marks AO1=4, AO2=4, AO3=8, AO4=9 25-mark essay Either/or
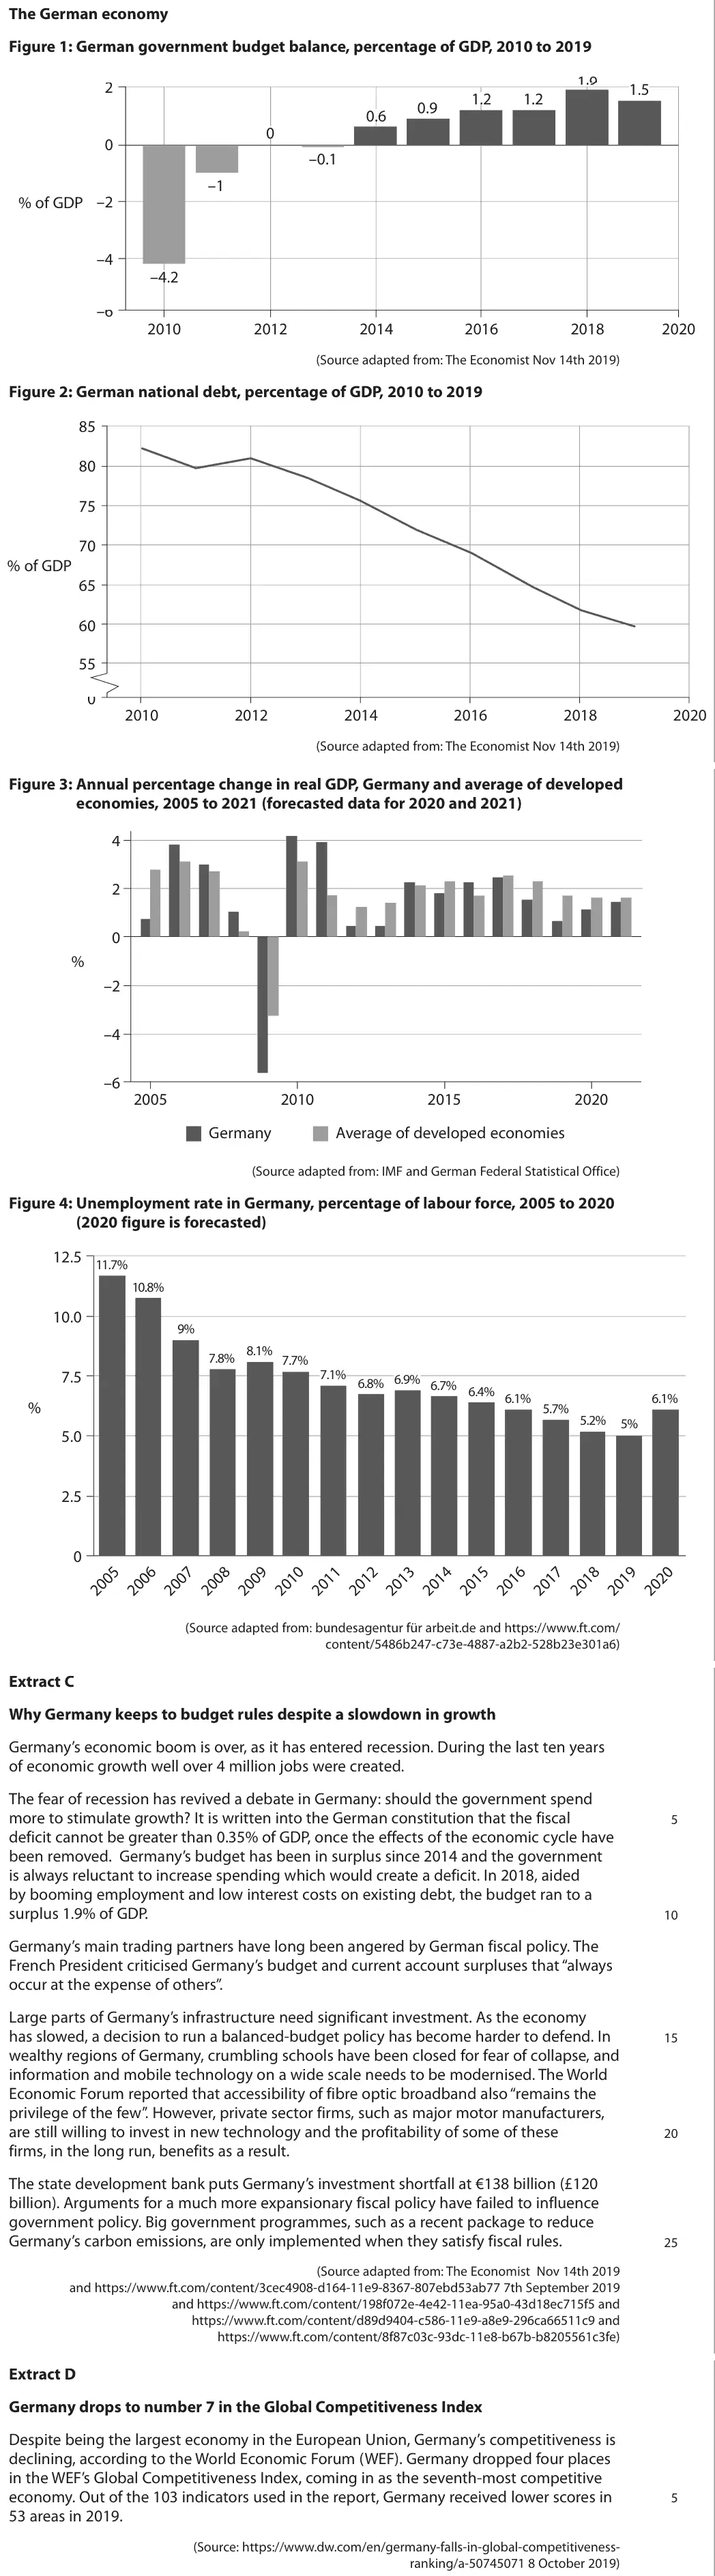
Data and extracts for question 2The German economy Figure 1: German government budget balance, percentage of GDP, 2010 to 2019 1.9 2 1.5 1.2 1.2 0.9 0.6 0 0 –0.1 –1 % of GDP –2 –4 –4.2 –6 2010 2012 2014 2016 2018 2020 (Source adapted from: The Economist Nov 14th 2019) Figure 2: German national debt, percentage of GDP, 2010 to 2019 85 80 75 70 % of GDP 65 60 55 0 2010 2012 2014 2016 2018 2020 (Source adapted from: The Economist Nov 14th 2019) Figure 3: Annual percentage change in real GDP, Germany and average of developed economies, 2005 to 2021 (forecasted data for 2020 and 2021) 4 2 0 % –2 –4 –6 2005 2010 2015 2020 Germany Average of developed economies (Source adapted from: IMF and German Federal Statistical Office) Figure 4: Unemployment rate in Germany, percentage of labour force, 2005 to 2020 (2020 figure is forecasted) 12.5 11 . 7 % 10 . 8 % 10.0 9 % 8 . 1 % 7 . 7 % 7 . 8 % 7.5 7 . 1 % 6 . 8 % 6 . 9 % 6 . 7 % 6 . 4 % 6 . 1 % 6 . 1 % % 5 . 7 % 5 . 2 % 5 % 5.0 2.5 0 (Source adapted from: bundesagentur für arbeit.de and https://www.ft.com/ content/5486b247-c73e-4887-a2b2-528b23e301a6) Extract C Why Germany keeps to budget rules despite a slowdown in growth Germany’s economic boom is over, as it has entered recession. During the last ten years of economic growth well over 4 million jobs were created. The fear of recession has revived a debate in Germany: should the government spend more to stimulate growth? It is written into the German constitution that the fiscal 5 deficit cannot be greater than 0.35% of GDP, once the effects of the economic cycle have been removed. Germany’s budget has been in surplus since 2014 and the government is always reluctant to increase spending which would create a deficit. In 2018, aided by booming employment and low interest costs on existing debt, the budget ran to a surplus 1.9% of GDP. 10 Germany’s main trading partners have long been angered by German fiscal policy. The French President criticised Germany’s budget and current account surpluses that “always occur at the expense of others”. Large parts of Germany’s infrastructure need significant investment. As the economy has slowed, a decision to run a balanced-budget policy has become harder to defend. In 15 wealthy regions of Germany, crumbling schools have been closed for fear of collapse, and information and mobile technology on a wide scale needs to be modernised. The World Economic Forum reported that accessibility of fibre optic broadband also “remains the privilege of the few”. However, private sector firms, such as major motor manufacturers, are still willing to invest in new technology and the profitability of some of these 20 firms, in the long run, benefits as a result. The state development bank puts Germany’s investment shortfall at €138 billion (£120 billion). Arguments for a much more expansionary fiscal policy have failed to influence government policy. Big government programmes, such as a recent package to reduce Germany’s carbon emissions, are only implemented when they satisfy fiscal rules. 25 (Source adapted from: The Economist Nov 14th 2019 and https://www.ft.com/content/3cec4908-d164-11e9-8367-807ebd53ab77 7th September 2019 and https://www.ft.com/content/198f072e-4e42-11ea-95a0-43d18ec715f5 and https://www.ft.com/content/d89d9404-c586-11e9-a8e9-296ca66511c9 and https://www.ft.com/content/8f87c03c-93dc-11e8-b67b-b8205561c3fe) Extract D Germany drops to number 7 in the Global Competitiveness Index Despite being the largest economy in the European Union, Germany’s competitiveness is declining, according to the World Economic Forum (WEF). Germany dropped four places in the WEF’s Global Competitiveness Index, coming in as the seventh-most competitive economy. Out of the 103 indicators used in the report, Germany received lower scores in 5 53 areas in 2019. (Source: https://www.dw.com/en/germany-falls-in-global-competitiveness- ranking/a-50745071 8 October 2019)
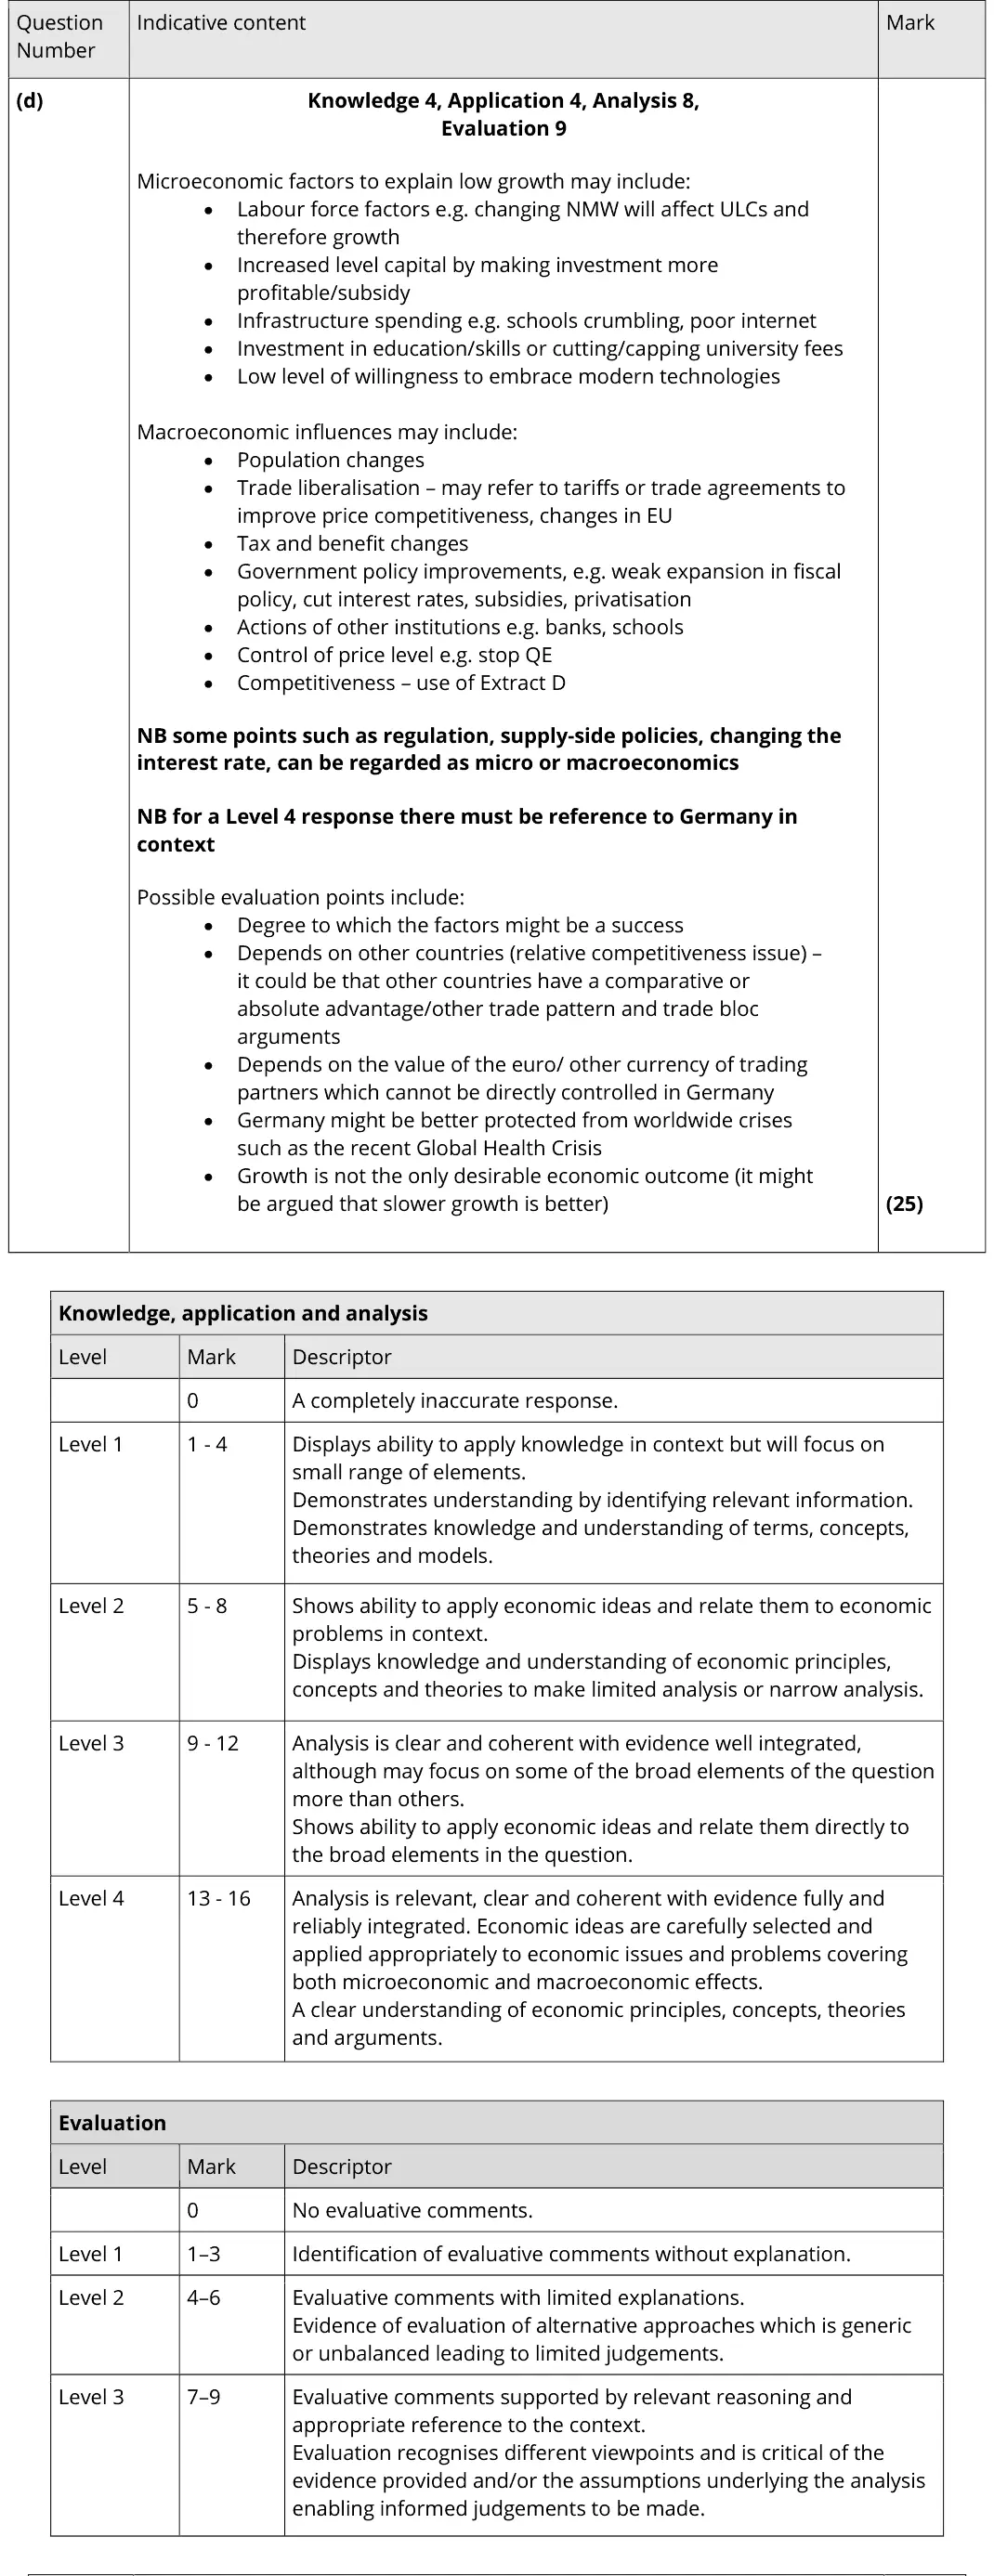
(d) Evaluate the microeconomic and macroeconomic factors which are likely to determine the rate of economic growth in Germany relative to other developed economies. (25)
October 2020 · Paper 2 · Q6(d) 10 marks AO1=2, AO2=2, AO3=2, AO4=4 10-mark response
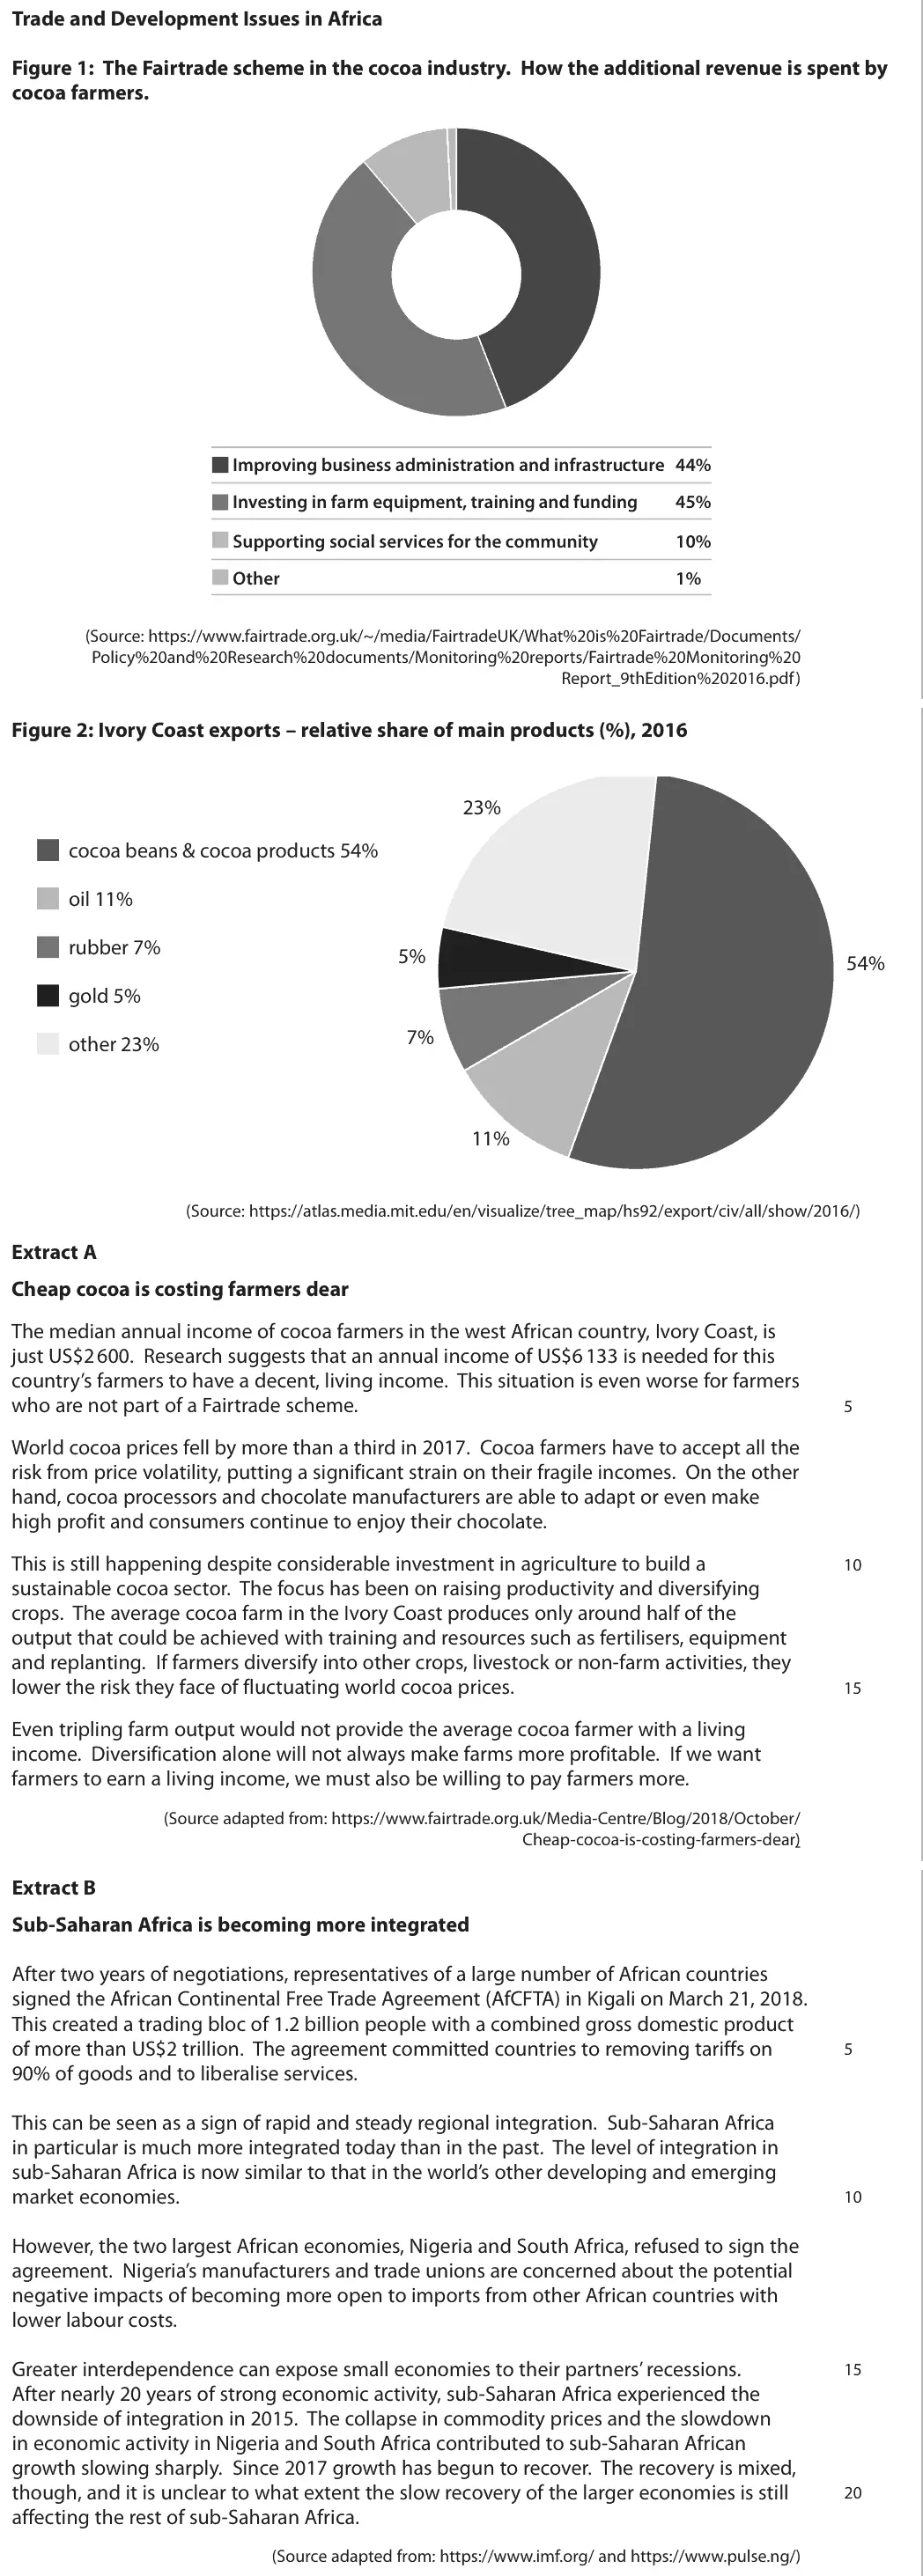
Data and extracts for question 6Trade and Development Issues in Africa Figure 1: The Fairtrade scheme in the cocoa industry. How the additional revenue is spent by cocoa farmers. Improving business administration and infrastructure 44% Investing in farm equipment, training and funding 45% Supporting social services for the community 10% Other 1% (Source: https://www.fairtrade.org.uk/~/media/FairtradeUK/What%20is%20Fairtrade/Documents/ Policy%20and%20Research%20documents/Monitoring%20reports/Fairtrade%20Monitoring%20 Report_9thEdition%202016.pdf) Figure 2: Ivory Coast exports – relative share of main products (%), 2016 23% cocoa beans & cocoa products 54% oil 11% rubber 7% 5% 54% gold 5% 7% other 23% 11% (Source: https://atlas.media.mit.edu/en/visualize/tree_map/hs92/export/civ/all/show/2016/) Extract A Cheap cocoa is costing farmers dear The median annual income of cocoa farmers in the west African country, Ivory Coast, is just US$2 600. Research suggests that an annual income of US$6 133 is needed for this country’s farmers to have a decent, living income. This situation is even worse for farmers who are not part of a Fairtrade scheme. 5 World cocoa prices fell by more than a third in 2017. Cocoa farmers have to accept all the risk from price volatility, putting a significant strain on their fragile incomes. On the other hand, cocoa processors and chocolate manufacturers are able to adapt or even make high profit and consumers continue to enjoy their chocolate. This is still happening despite considerable investment in agriculture to build a 10 sustainable cocoa sector. The focus has been on raising productivity and diversifying crops. The average cocoa farm in the Ivory Coast produces only around half of the output that could be achieved with training and resources such as fertilisers, equipment and replanting. If farmers diversify into other crops, livestock or non‑farm activities, they lower the risk they face of fluctuating world cocoa prices. 15 Even tripling farm output would not provide the average cocoa farmer with a living income. Diversification alone will not always make farms more profitable. If we want farmers to earn a living income, we must also be willing to pay farmers more. (Source adapted from: https://www.fairtrade.org.uk/Media‑Centre/Blog/2018/October/ Cheap‑cocoa‑is‑costing‑farmers‑dear) Extract B Sub‑Saharan Africa is becoming more integrated After two years of negotiations, representatives of a large number of African countries signed the African Continental Free Trade Agreement (AfCFTA) in Kigali on March 21, 2018. This created a trading bloc of 1.2 billion people with a combined gross domestic product of more than US$2 trillion. The agreement committed countries to removing tariffs on 5 90% of goods and to liberalise services. This can be seen as a sign of rapid and steady regional integration. Sub‑Saharan Africa in particular is much more integrated today than in the past. The level of integration in sub‑Saharan Africa is now similar to that in the world’s other developing and emerging market economies. 10 However, the two largest African economies, Nigeria and South Africa, refused to sign the agreement. Nigeria’s manufacturers and trade unions are concerned about the potential negative impacts of becoming more open to imports from other African countries with lower labour costs. Greater interdependence can expose small economies to their partners’ recessions. 15 After nearly 20 years of strong economic activity, sub‑Saharan Africa experienced the downside of integration in 2015. The collapse in commodity prices and the slowdown in economic activity in Nigeria and South Africa contributed to sub‑Saharan African growth slowing sharply. Since 2017 growth has begun to recover. The recovery is mixed, though, and it is unclear to what extent the slow recovery of the larger economies is still 20 affecting the rest of sub‑Saharan Africa. (Source adapted from: https://www.imf.org/ and https://www.pulse.ng/)
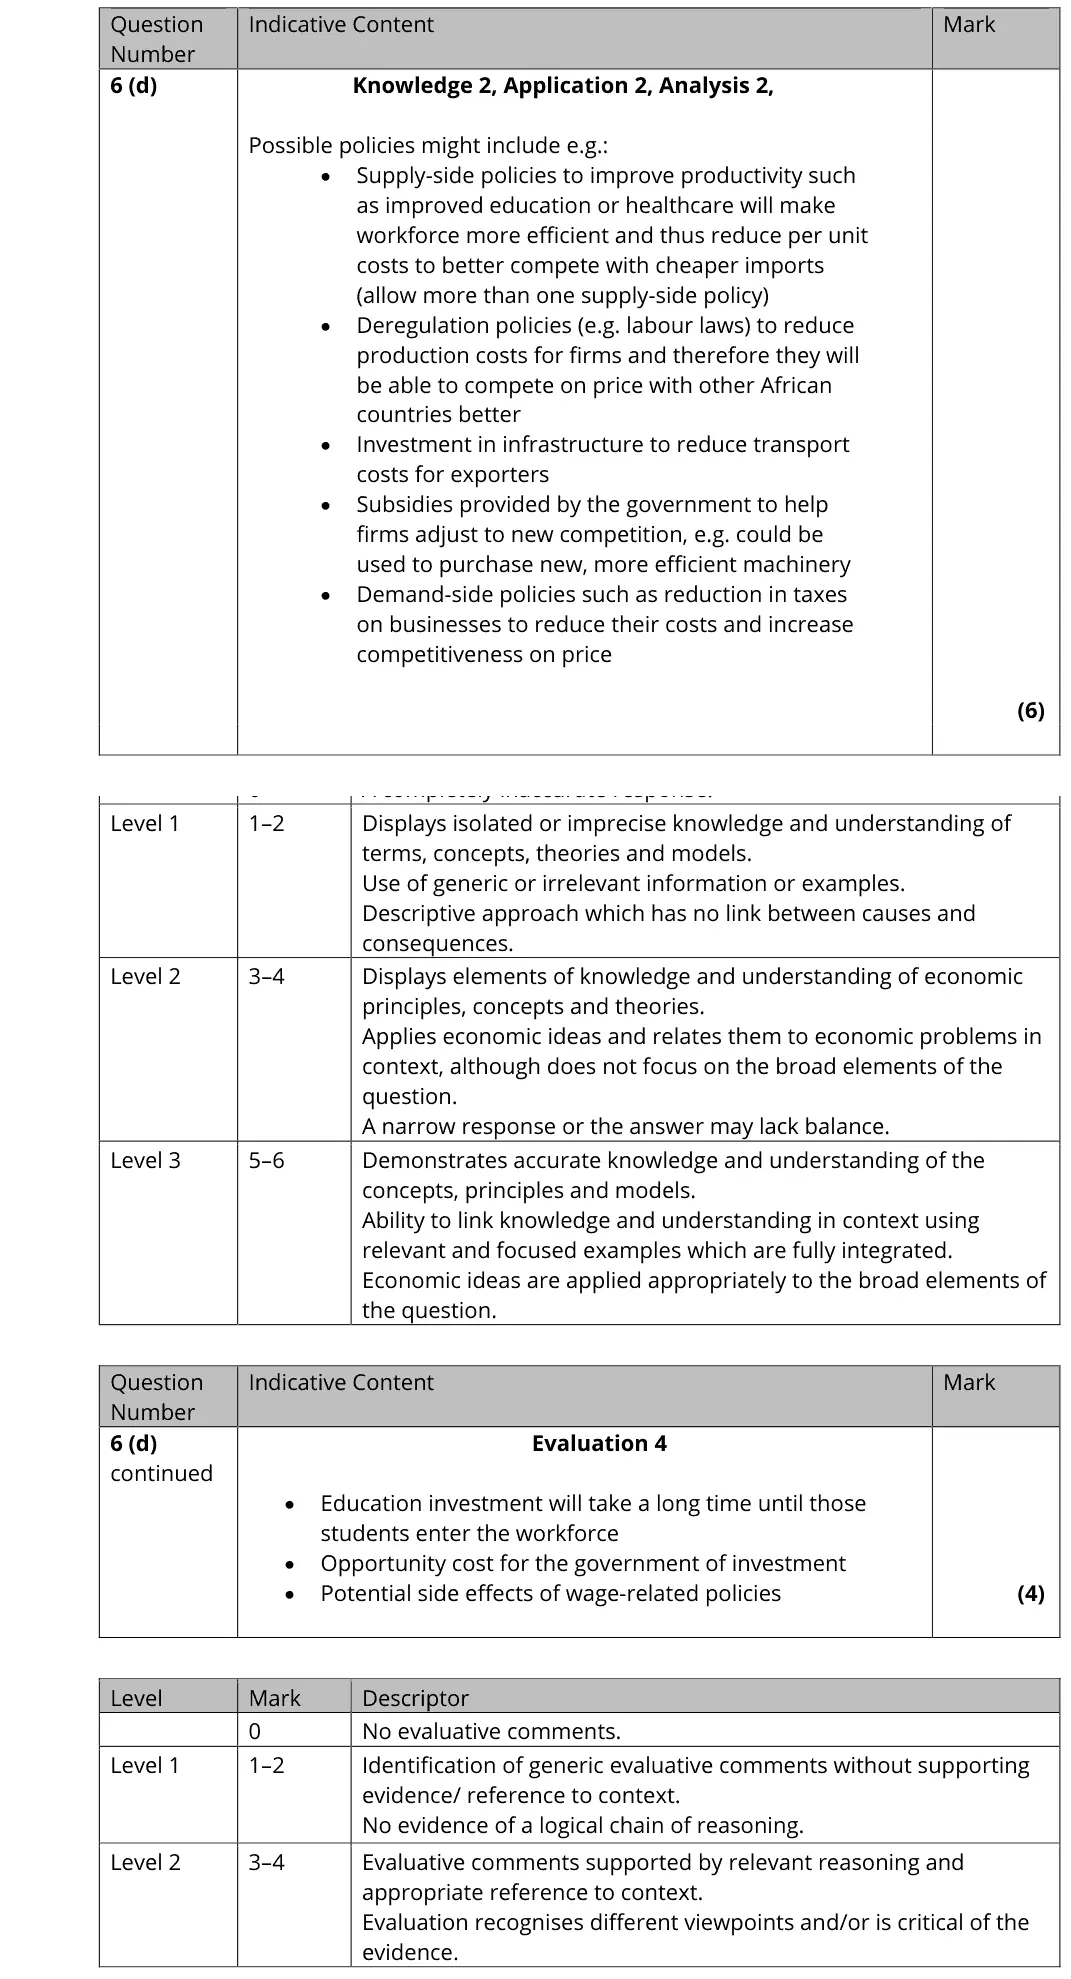
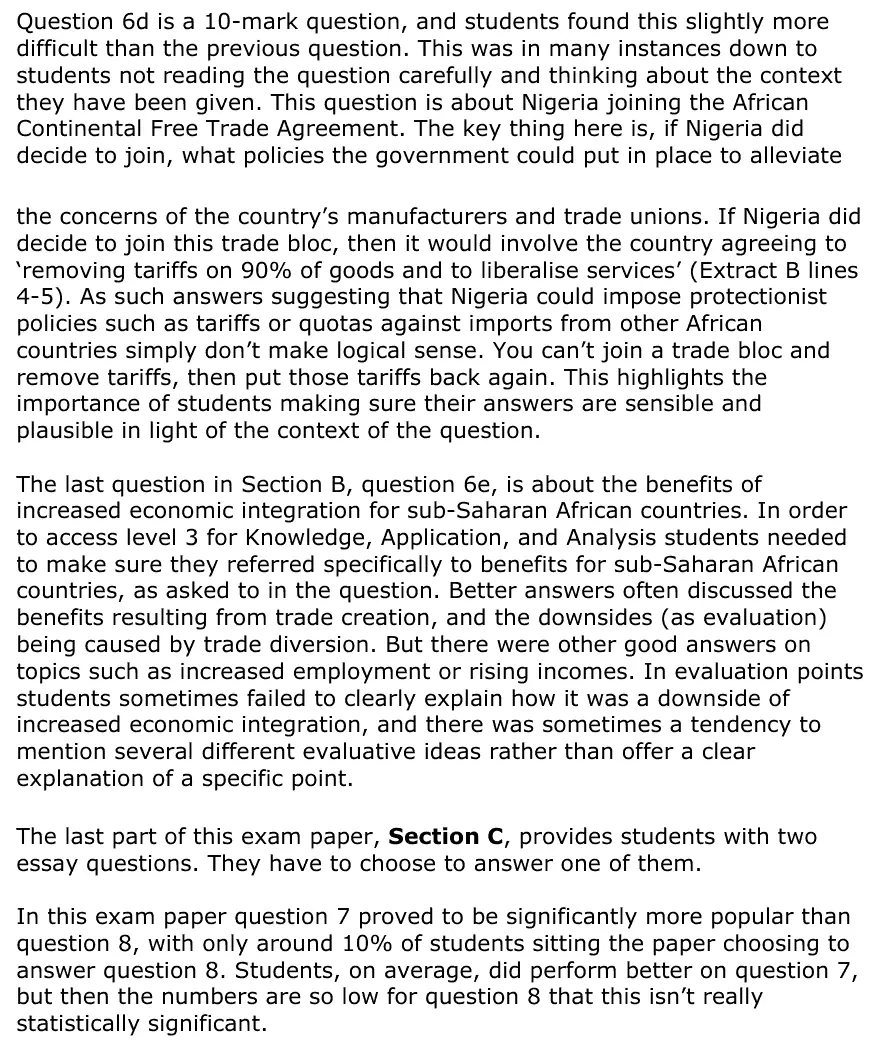
(d) Nigeria is considering joining the African Continental Free Trade Agreement. Assess policies the Nigerian government could use in response to the concerns of the country’s ‘manufacturers and trade unions’ (Extract B paragraph 3) if they join this trading bloc. (10)
October 2020 · Paper 3 · Q2(d) 25 marks AO1=4, AO2=4, AO3=8, AO4=9 25-mark essay Either/or
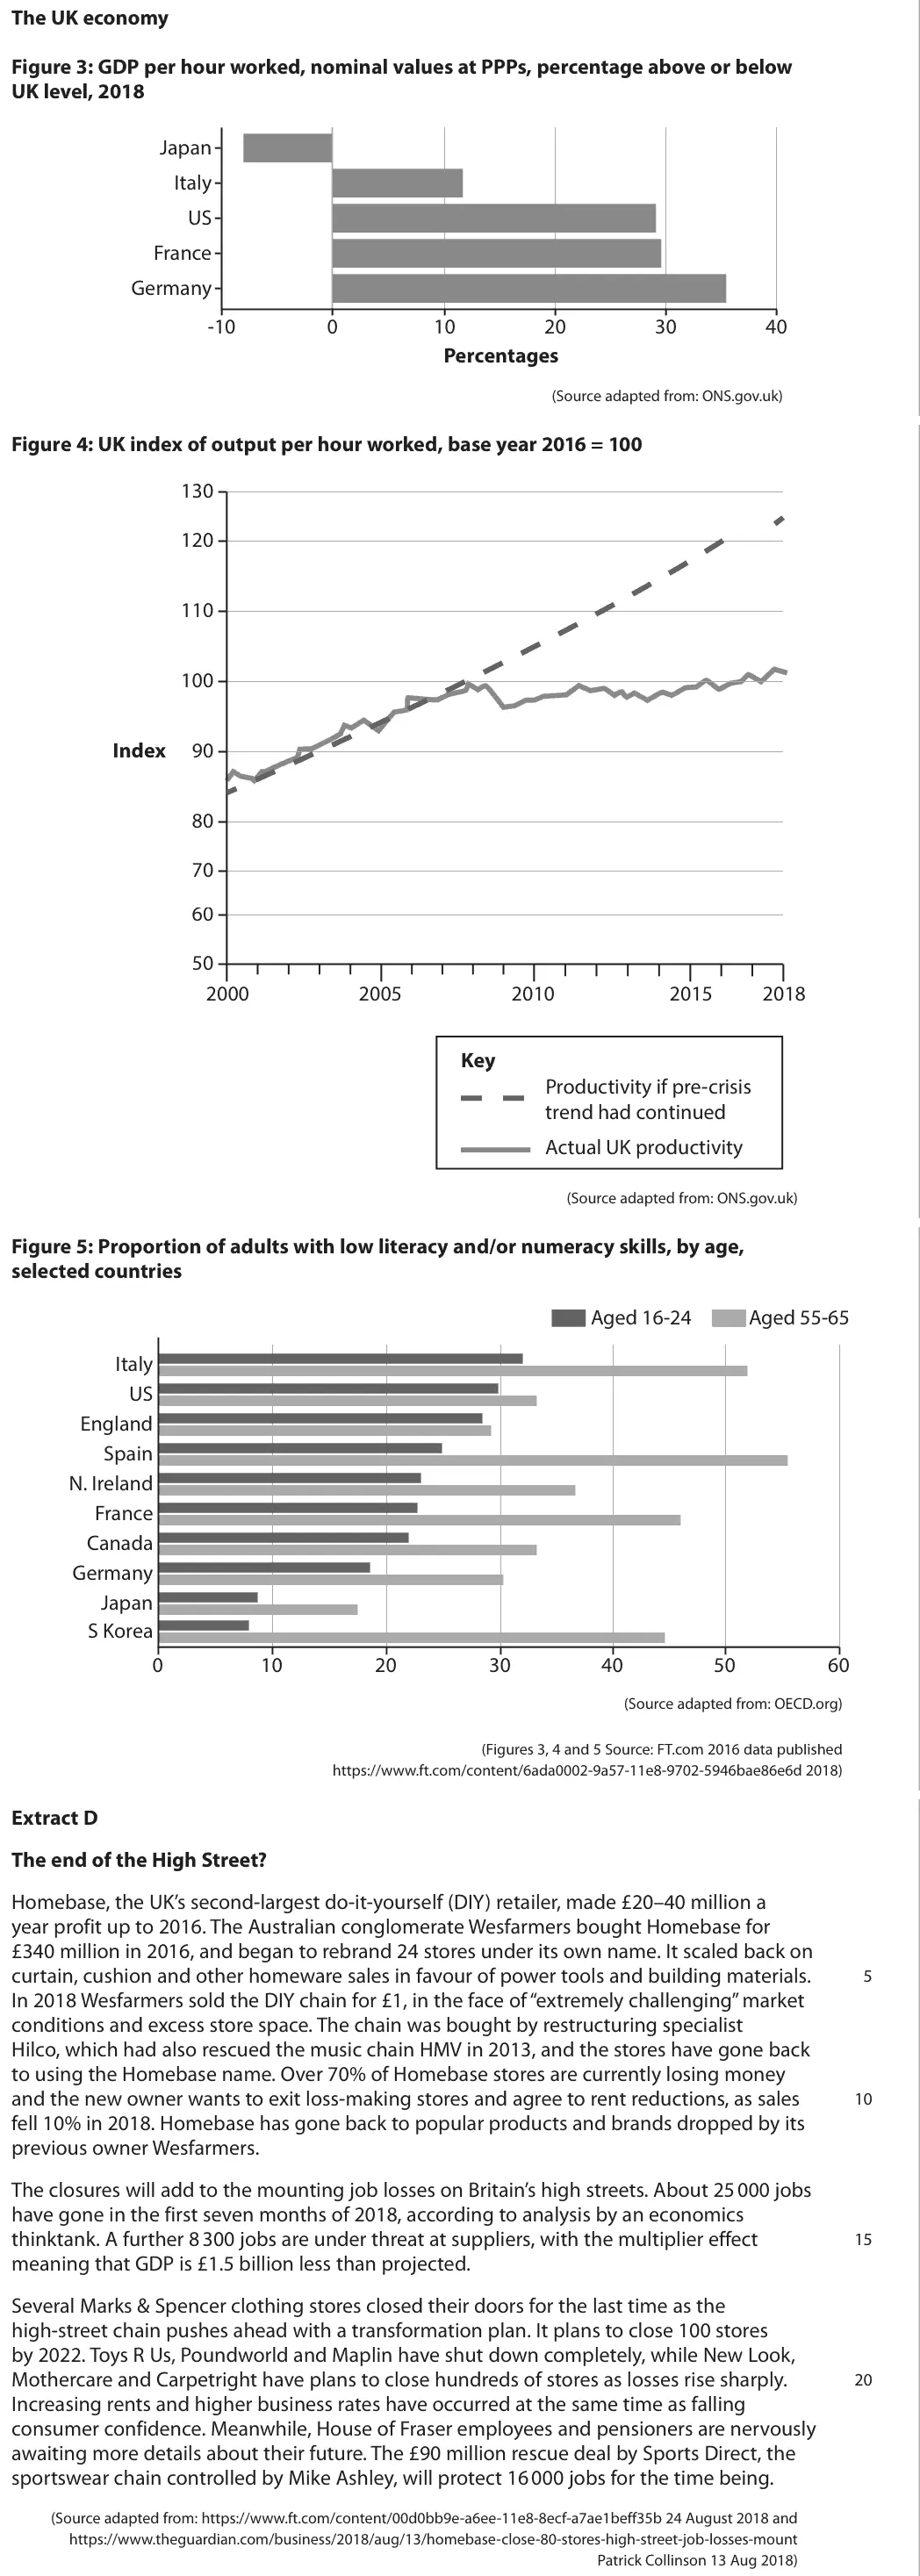
Data and extracts for question 2The UK economy Figure 3: GDP per hour worked, nominal values at PPPs, percentage above or below UK level, 2018 Japan Italy US France Germany -10 0 10 20 30 40 Percentages (Source adapted from: ONS.gov.uk) Figure 4: UK index of output per hour worked, base year 2016 = 100 130 120 110 100 Index 90 80 70 60 50 2000 2005 2010 2015 2018 Key Productivity if pre-crisis trend had continued Actual UK productivity (Source adapted from: ONS.gov.uk) Figure 5: Proportion of adults with low literacy and/or numeracy skills, by age, selected countries Aged 16-24 Aged 55-65 Italy US England Spain N. Ireland France Canada Germany Japan S Korea 0 10 20 30 40 50 60 (Source adapted from: OECD.org) (Figures 3, 4 and 5 Source: FT.com 2016 data published https://www.ft.com/content/6ada0002‑9a57‑11e8‑9702‑5946bae86e6d 2018) Extract D The end of the High Street? Homebase, the UK’s second‑largest do‑it‑yourself (DIY) retailer, made £20–40 million a year profit up to 2016. The Australian conglomerate Wesfarmers bought Homebase for £340 million in 2016, and began to rebrand 24 stores under its own name. It scaled back on curtain, cushion and other homeware sales in favour of power tools and building materials. 5 In 2018 Wesfarmers sold the DIY chain for £1, in the face of “extremely challenging” market conditions and excess store space. The chain was bought by restructuring specialist Hilco, which had also rescued the music chain HMV in 2013, and the stores have gone back to using the Homebase name. Over 70% of Homebase stores are currently losing money and the new owner wants to exit loss‑making stores and agree to rent reductions, as sales 10 fell 10% in 2018. Homebase has gone back to popular products and brands dropped by its previous owner Wesfarmers. The closures will add to the mounting job losses on Britain’s high streets. About 25 000 jobs have gone in the first seven months of 2018, according to analysis by an economics thinktank. A further 8 300 jobs are under threat at suppliers, with the multiplier effect 15 meaning that GDP is £1.5 billion less than projected. Several Marks & Spencer clothing stores closed their doors for the last time as the high‑street chain pushes ahead with a transformation plan. It plans to close 100 stores by 2022. Toys R Us, Poundworld and Maplin have shut down completely, while New Look, Mothercare and Carpetright have plans to close hundreds of stores as losses rise sharply. 20 Increasing rents and higher business rates have occurred at the same time as falling consumer confidence. Meanwhile, House of Fraser employees and pensioners are nervously awaiting more details about their future. The £90 million rescue deal by Sports Direct, the sportswear chain controlled by Mike Ashley, will protect 16 000 jobs for the time being. (Source adapted from: https://www.ft.com/content/00d0bb9e‑a6ee‑11e8‑8ecf‑a7ae1beff35b 24 August 2018 and https://www.theguardian.com/business/2018/aug/13/homebase‑close‑80‑stores‑high‑street‑job‑losses‑mount Patrick Collinson 13 Aug 2018)
(d) Evaluate possible microeconomic and macroeconomic policies which could be used to improve UK competitiveness. (25)
June 2019 · Paper 2 · Q3(a) 2 marks AO1=1, AO3=1 Short answer
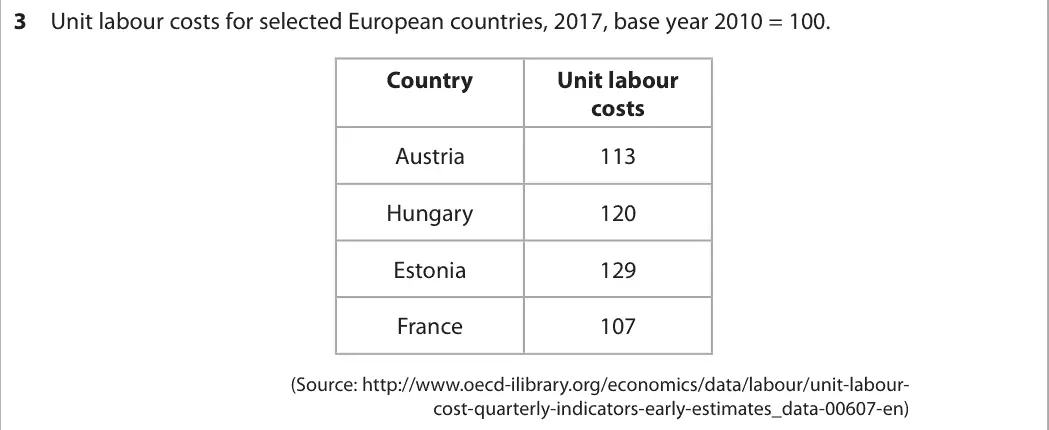
Data and extracts for question 33 Unit labour costs for selected European countries, 2017, base year 2010 = 100. Country Unit labour costs Austria 113 Hungary 120 Estonia 129 France 107 (Source: http://www.oecd-ilibrary.org/economics/data/labour/unit-labour- cost-quarterly-indicators-early-estimates_data-00607-en)
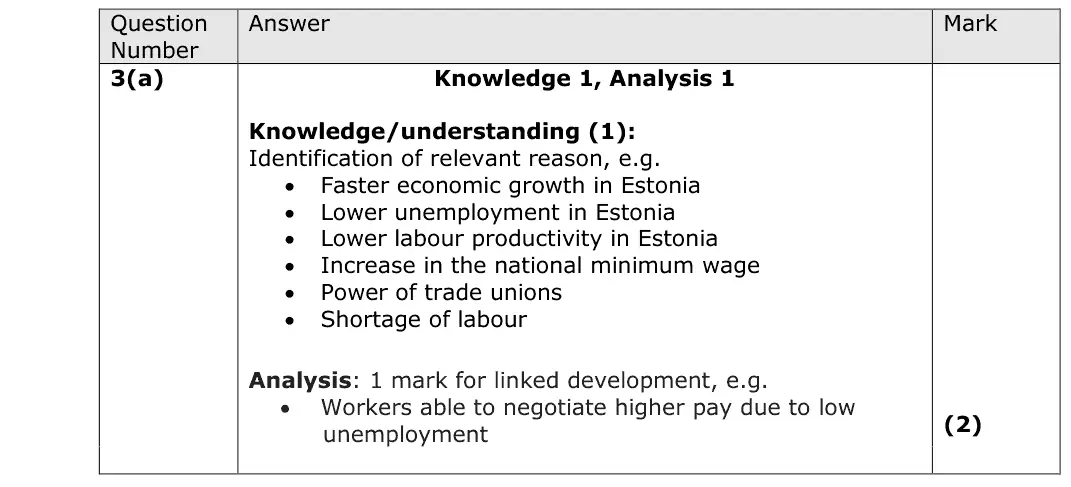
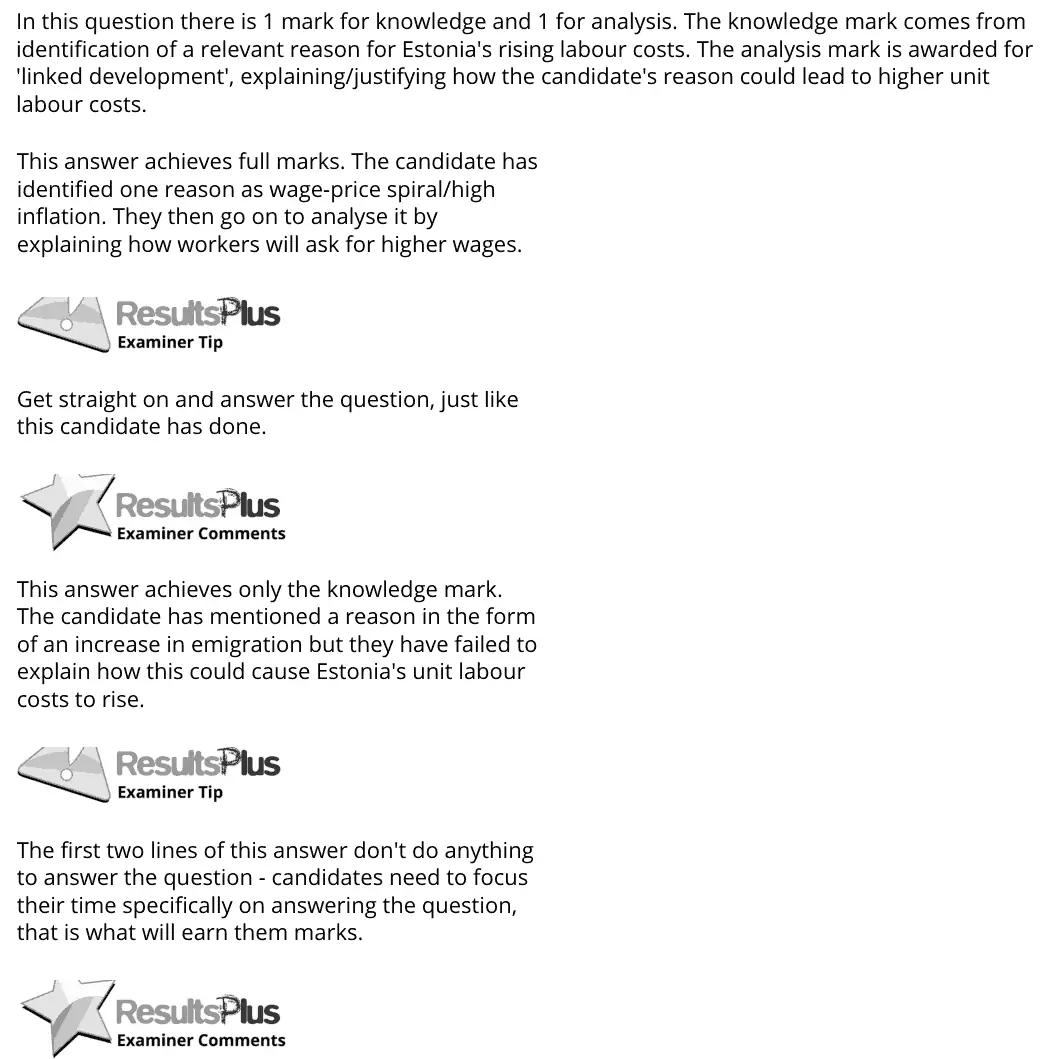
(a) Explain one likely reason for Estonia’s unit labour costs rising faster than in other European countries. (2)
June 2019 · Paper 2 · Q3(b) 2 marks AO1=1, AO3=1 Short answer
Data and extracts for question 33 Unit labour costs for selected European countries, 2017, base year 2010 = 100. Country Unit labour costs Austria 113 Hungary 120 Estonia 129 France 107 (Source: http://www.oecd-ilibrary.org/economics/data/labour/unit-labour- cost-quarterly-indicators-early-estimates_data-00607-en)
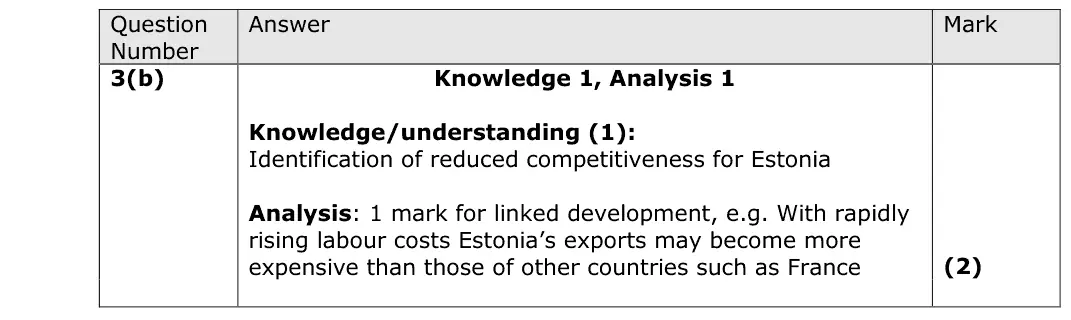
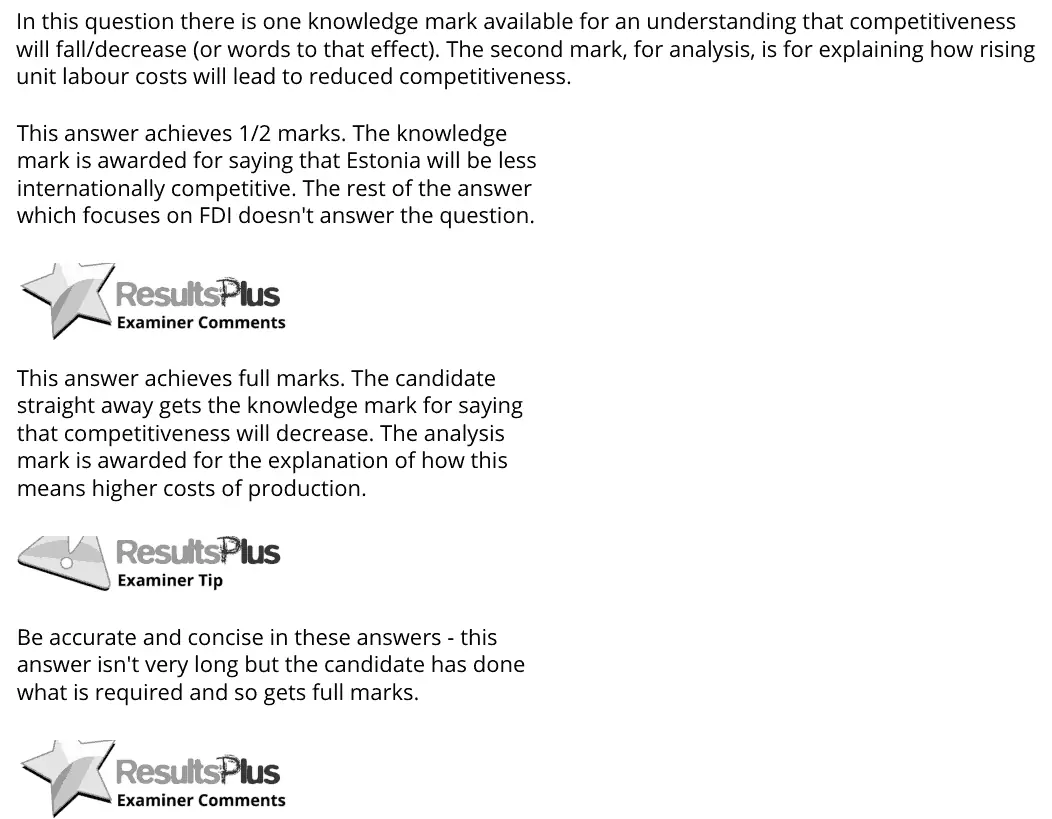
(b) Explain how Estonia’s competitiveness could be affected by rising unit labour costs. (2)
June 2019 · Paper 2 · Q3(c) 1 mark Multiple choice
Data and extracts for question 33 Unit labour costs for selected European countries, 2017, base year 2010 = 100. Country Unit labour costs Austria 113 Hungary 120 Estonia 129 France 107 (Source: http://www.oecd-ilibrary.org/economics/data/labour/unit-labour- cost-quarterly-indicators-early-estimates_data-00607-en)
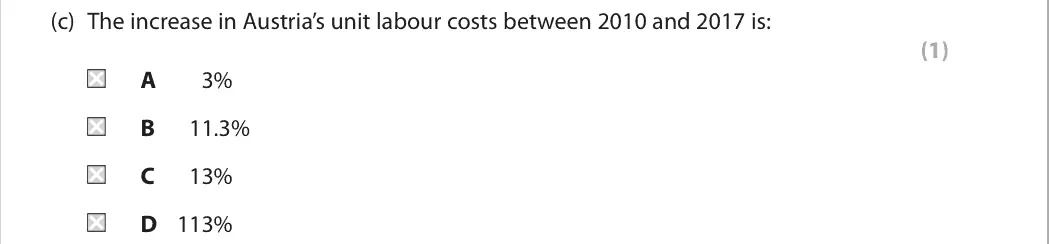
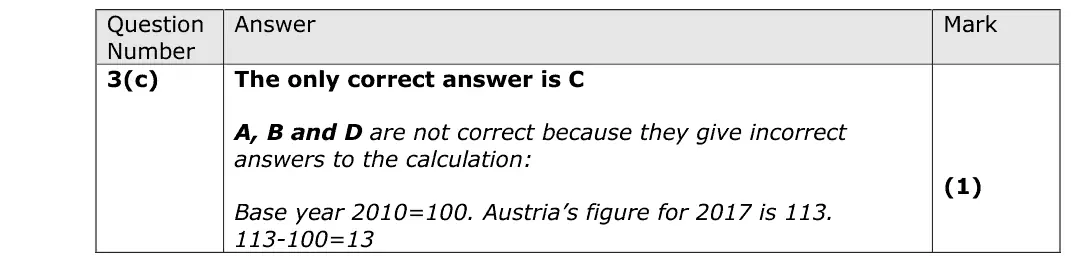
(c) The increase in Austria’s unit labour costs between 2010 and 2017 is: (1) A 3% B 11.3% C 13% D 113%
June 2017 · Paper 3 · Q2(d) 25 marks AO1=4, AO2=4, AO3=8, AO4=9 25-mark essay Either/or
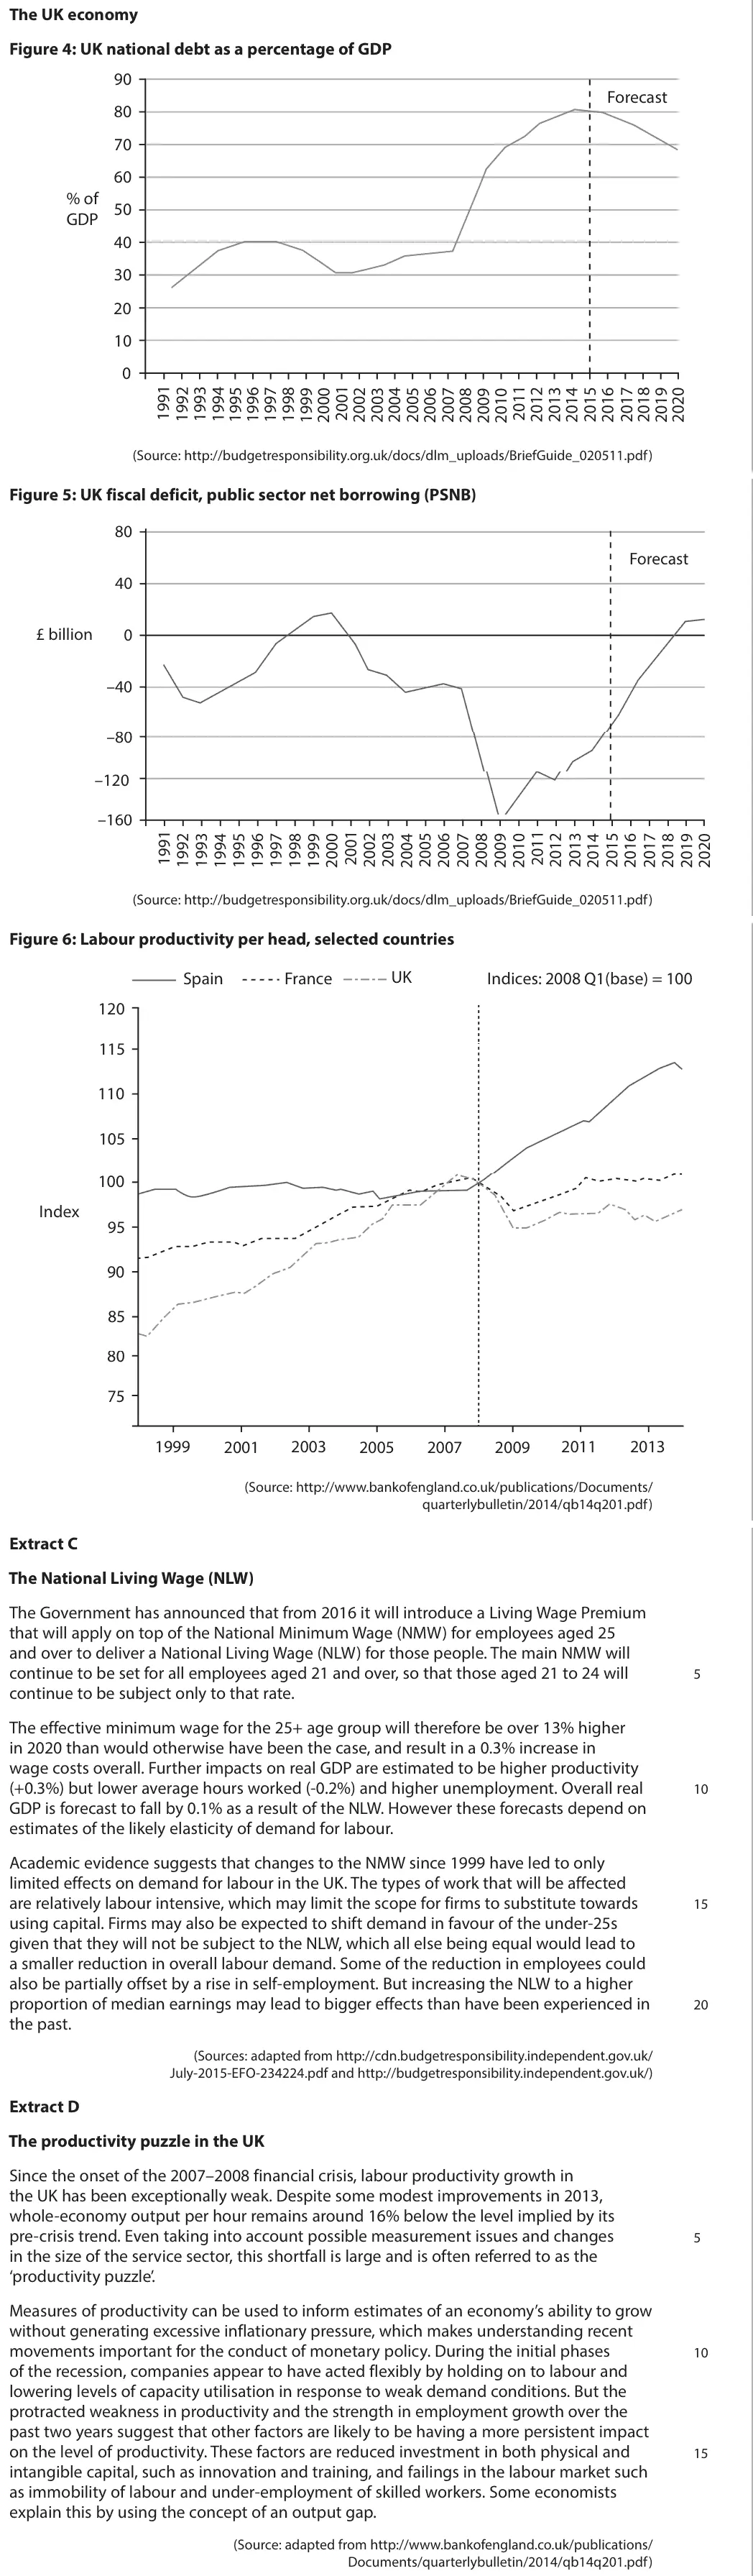
Data and extracts for question 2The UK economy Figure 4: UK national debt as a percentage of GDP 90 Forecast 80 70 60 % of 50 GDP 40 30 20 10 0 (Source: http://budgetresponsibility.org.uk/docs/dlm_uploads/BriefGuide_020511.pdf) Figure 5: UK fiscal deficit, public sector net borrowing (PSNB) 80 Forecast 40 £ billion 0 –40 –80 –120 –160 (Source: http://budgetresponsibility.org.uk/docs/dlm_uploads/BriefGuide_020511.pdf) Figure 6: Labour productivity per head, selected countries UK Spain France Indices: 2008 Q1(base) = 100 120 115 110 105 100 Index 95 90 85 80 75 1999 2001 2003 2005 2007 2009 2011 2013 (Source: http://www.bankofengland.co.uk/publications/Documents/ quarterlybulletin/2014/qb14q201.pdf) Extract C The National Living Wage (NLW) The Government has announced that from 2016 it will introduce a Living Wage Premium that will apply on top of the National Minimum Wage (NMW) for employees aged 25 and over to deliver a National Living Wage (NLW) for those people. The main NMW will continue to be set for all employees aged 21 and over, so that those aged 21 to 24 will 5 continue to be subject only to that rate. The effective minimum wage for the 25+ age group will therefore be over 13% higher in 2020 than would otherwise have been the case, and result in a 0.3% increase in wage costs overall. Further impacts on real GDP are estimated to be higher productivity (+0.3%) but lower average hours worked (-0.2%) and higher unemployment. Overall real 10 GDP is forecast to fall by 0.1% as a result of the NLW. However these forecasts depend on estimates of the likely elasticity of demand for labour. Academic evidence suggests that changes to the NMW since 1999 have led to only limited effects on demand for labour in the UK. The types of work that will be affected are relatively labour intensive, which may limit the scope for firms to substitute towards 15 using capital. Firms may also be expected to shift demand in favour of the under-25s given that they will not be subject to the NLW, which all else being equal would lead to a smaller reduction in overall labour demand. Some of the reduction in employees could also be partially offset by a rise in self-employment. But increasing the NLW to a higher proportion of median earnings may lead to bigger effects than have been experienced in 20 the past. (Sources: adapted from http://cdn.budgetresponsibility.independent.gov.uk/ July-2015-EFO-234224.pdf and http://budgetresponsibility.independent.gov.uk/) Extract D The productivity puzzle in the UK Since the onset of the 2007–2008 financial crisis, labour productivity growth in the UK has been exceptionally weak. Despite some modest improvements in 2013, whole-economy output per hour remains around 16% below the level implied by its pre-crisis trend. Even taking into account possible measurement issues and changes 5 in the size of the service sector, this shortfall is large and is often referred to as the ‘productivity puzzle’. Measures of productivity can be used to inform estimates of an economy’s ability to grow without generating excessive inflationary pressure, which makes understanding recent movements important for the conduct of monetary policy. During the initial phases 10 of the recession, companies appear to have acted flexibly by holding on to labour and lowering levels of capacity utilisation in response to weak demand conditions. But the protracted weakness in productivity and the strength in employment growth over the past two years suggest that other factors are likely to be having a more persistent impact on the level of productivity. These factors are reduced investment in both physical and 15 intangible capital, such as innovation and training, and failings in the labour market such as immobility of labour and under-employment of skilled workers. Some economists explain this by using the concept of an output gap. (Source: adapted from http://www.bankofengland.co.uk/publications/ Documents/quarterlybulletin/2014/qb14q201.pdf)
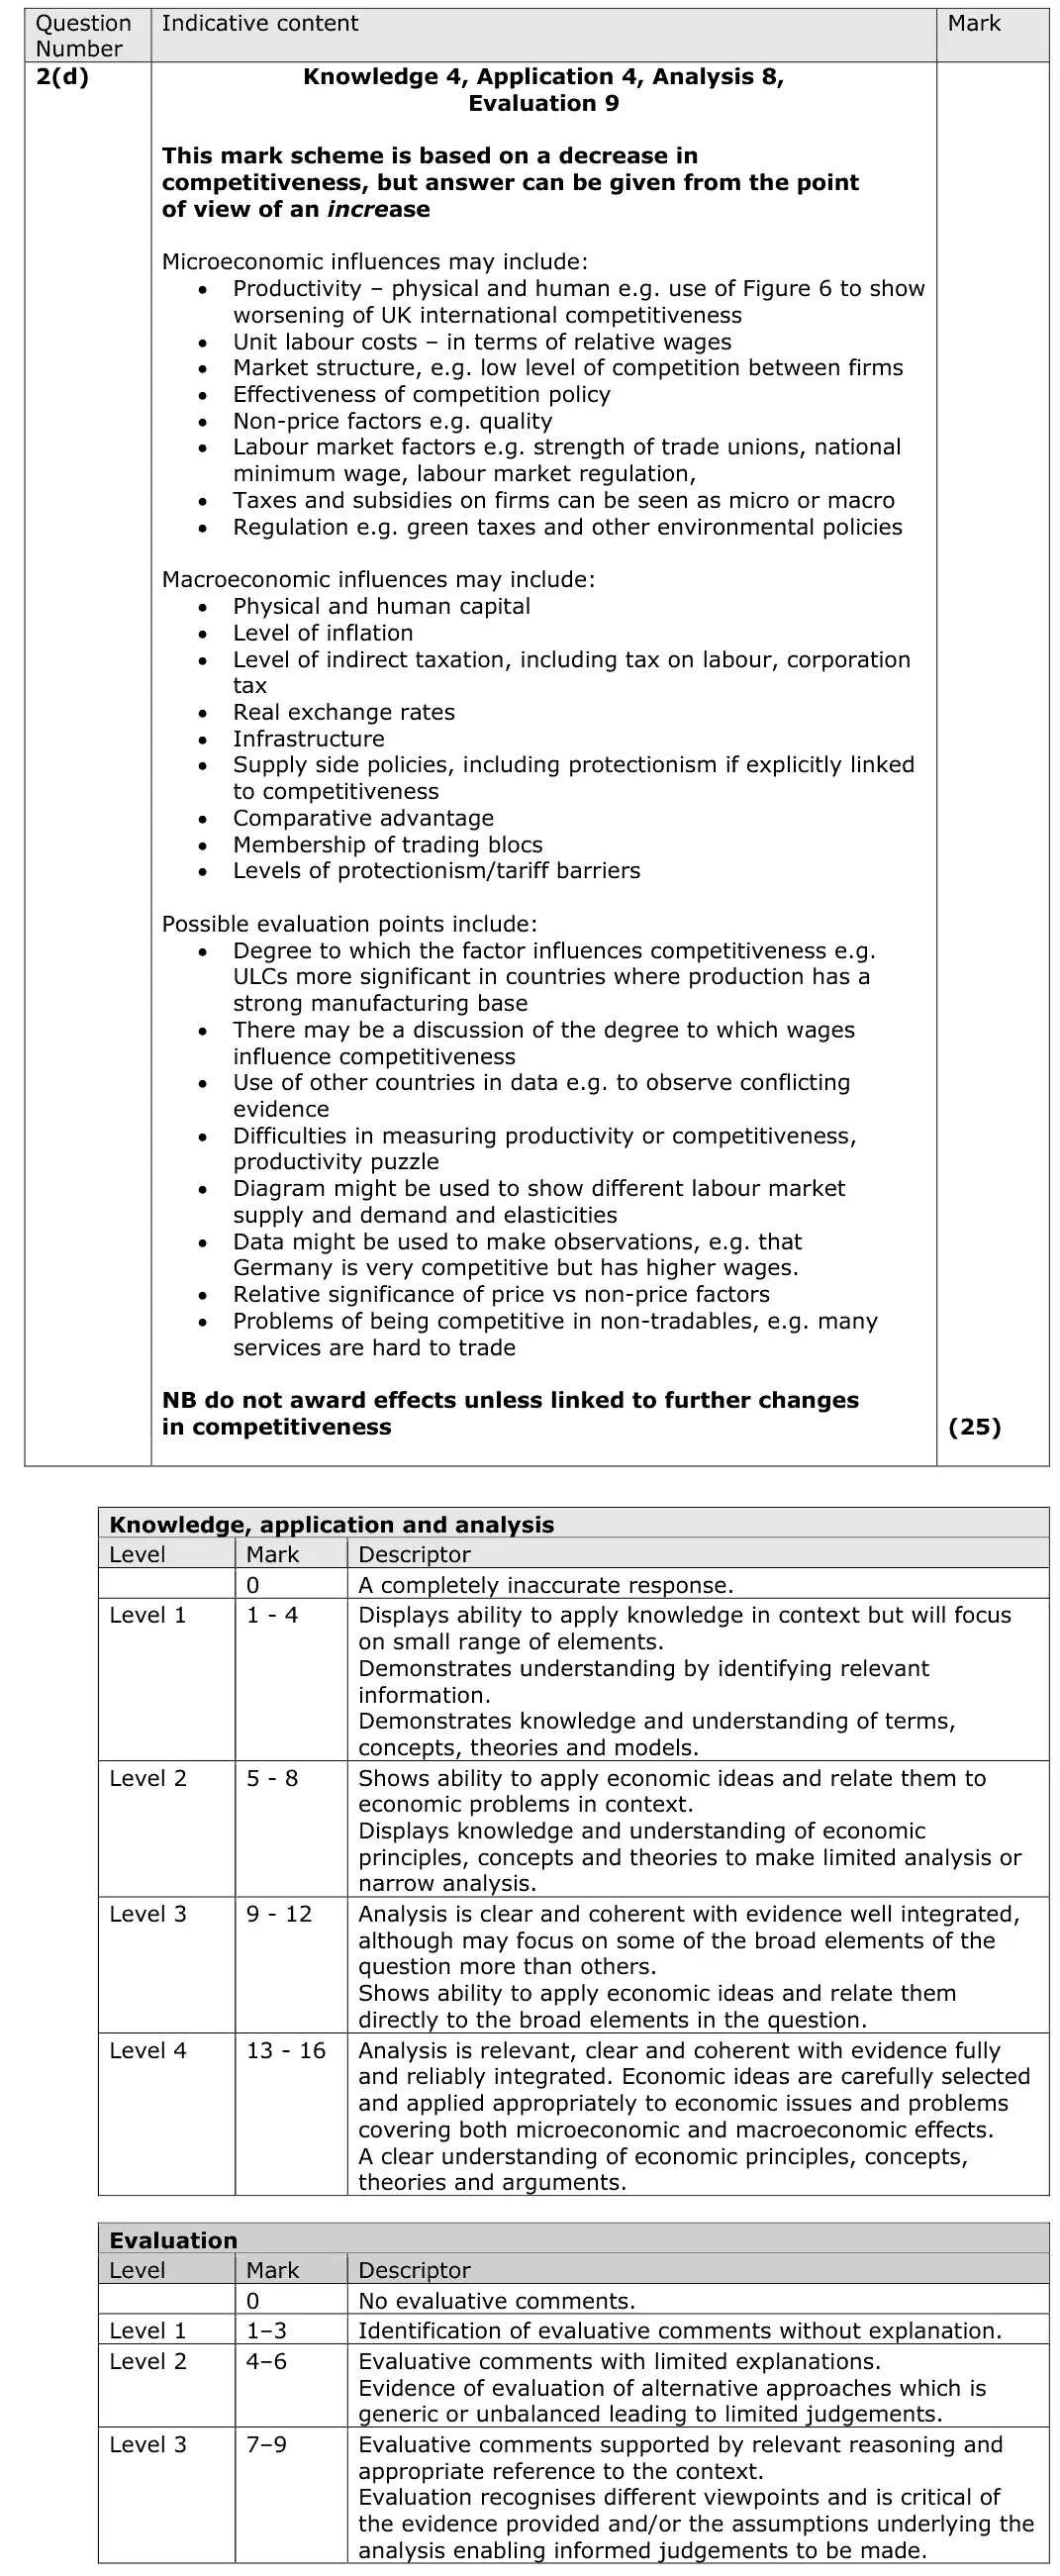
(d) With reference to the information provided and your own knowledge, evaluate the likely microeconomic and macroeconomic influences on the UK’s international competitiveness. (25)

Work with an Edexcel economics tutor

Essays stuck in Level 2, or losing the easy marks in Section A? Book a trial session with Lianne, a former Edexcel examiner.

Prefer email? Send an enquiry

If you are under 18, please include a parent's contact details. Enquiries go to enquiries@economicsaleveltutor.com and are deleted once handled. All tutoring is online.