1.2.3Price, income and cross elasticities of demand: a) Understanding of price, income and cross elasticities of demand b) Use formulae to calculate price, income and cross elasticities of demand c) Interpret numerical values of • price elasticity of demand: unitary elastic, perfectly and relatively elastic, and perfectly and relatively inelastic • income elasticity of demand: inferior, normal and luxury goods; relatively elastic and relatively inelastic • cross elasticity of demand: substitutes, complementary and unrelated goods d) The factors influencing elasticities of demand e) The significance of elasticities of demand to firms and government in terms of: • the imposition of indirect taxes and subsidies • changes in real income • changes in the prices of substitute and complementary goods f) The relationship between price elasticity of demand and total revenue (including calculation)AS
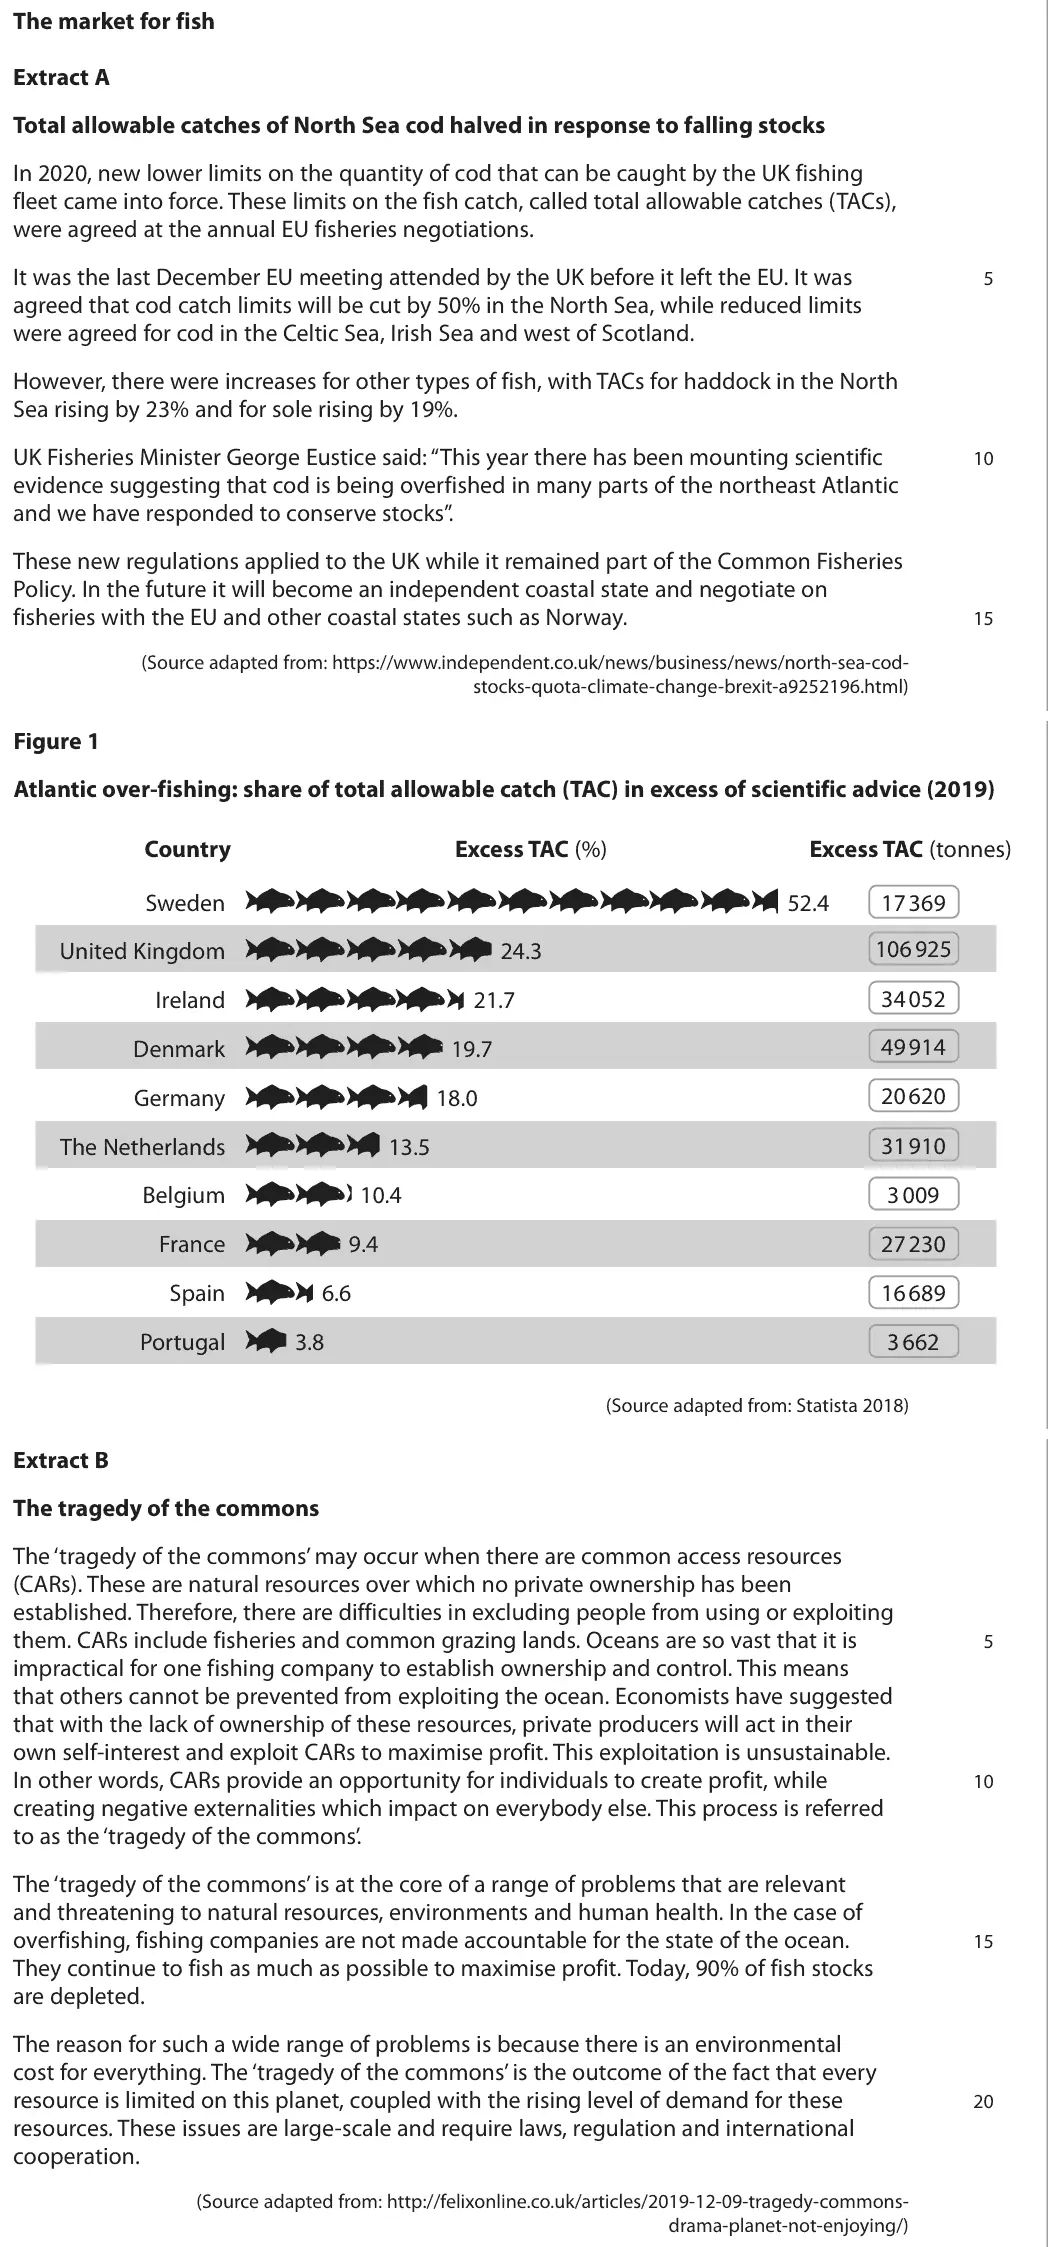
The International Energy Agency has predicted that oil use by cars will peak in 2025 because of the increasing number of drivers switching to electric vehicles. (Source adapted from: https://www.thetimes.co.uk) Evaluate the likely microeconomic consequences of consumers shifting from vehicles powered by fuel obtained from oil to electric‑powered vehicles.
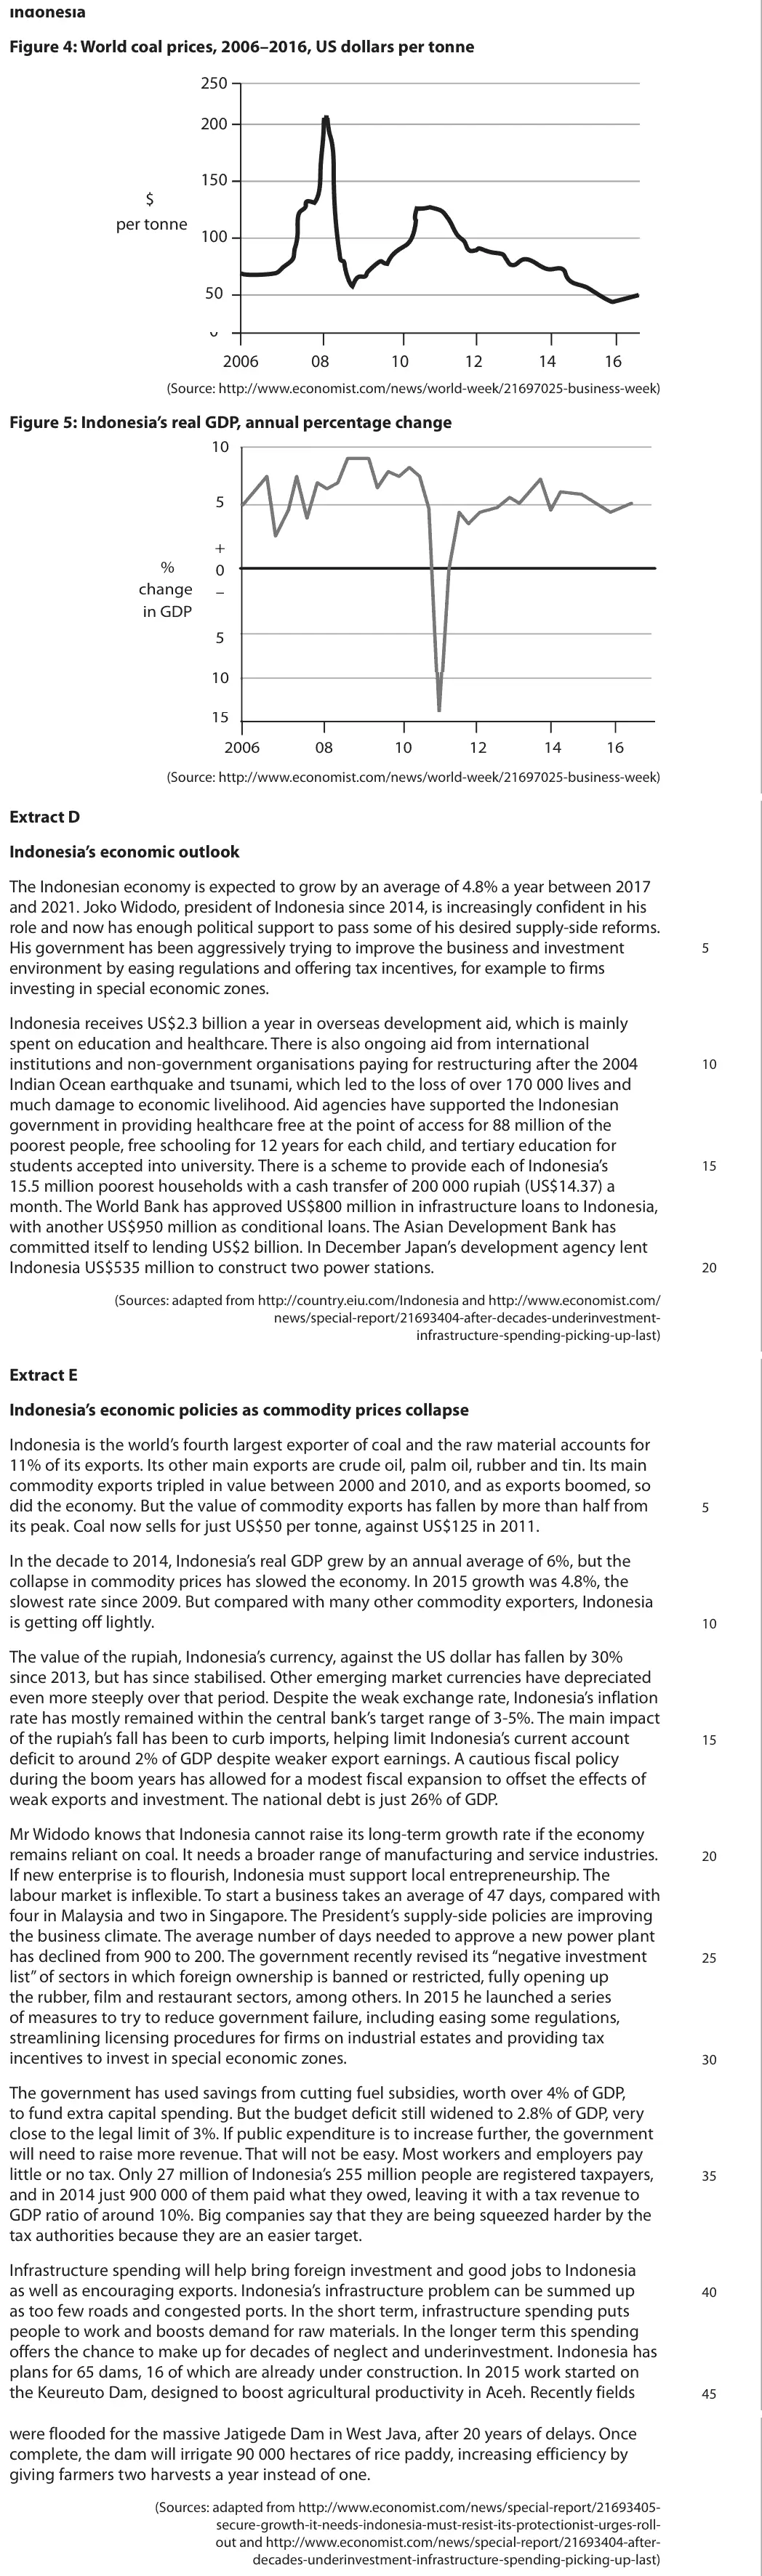
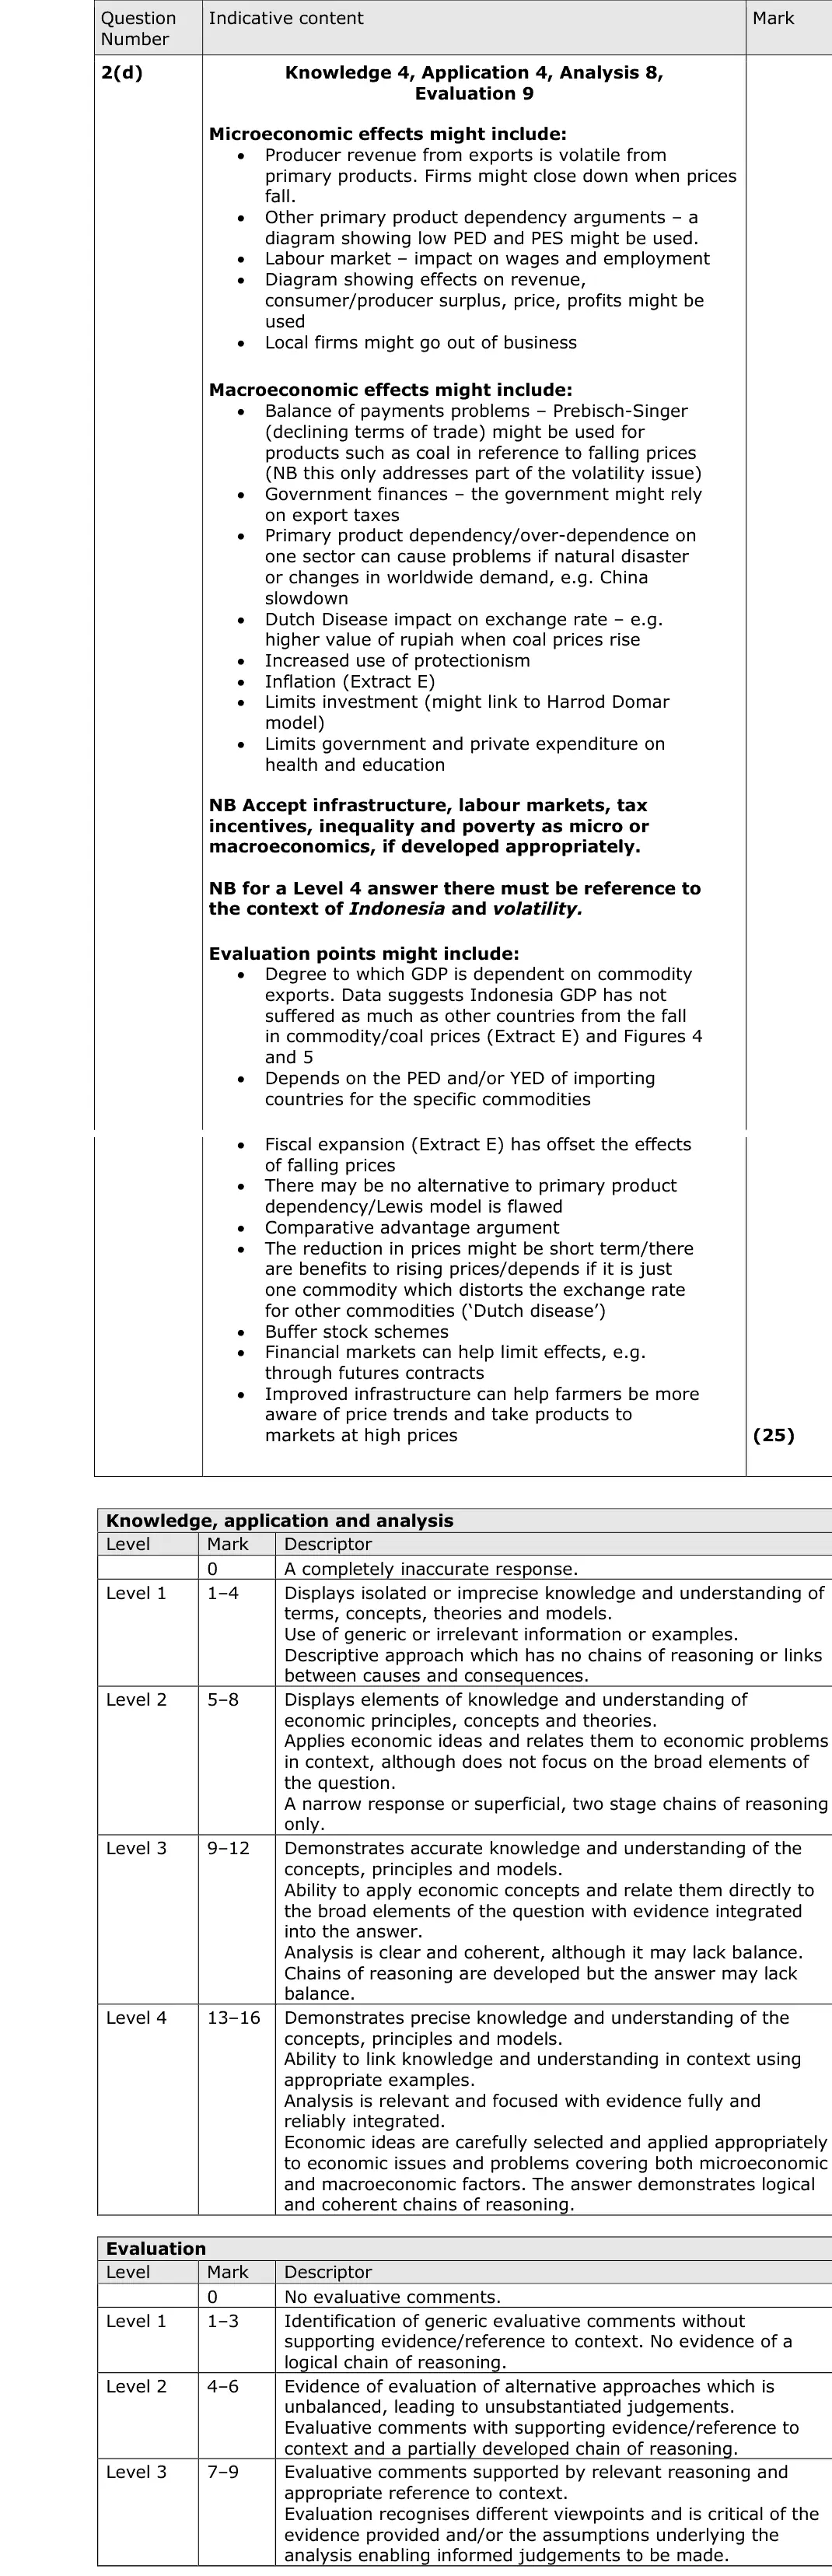
With reference to the information provided and your own knowledge, evaluate the microeconomic and macroeconomic effects on Indonesia of the volatility of prices of commodities such as coal.
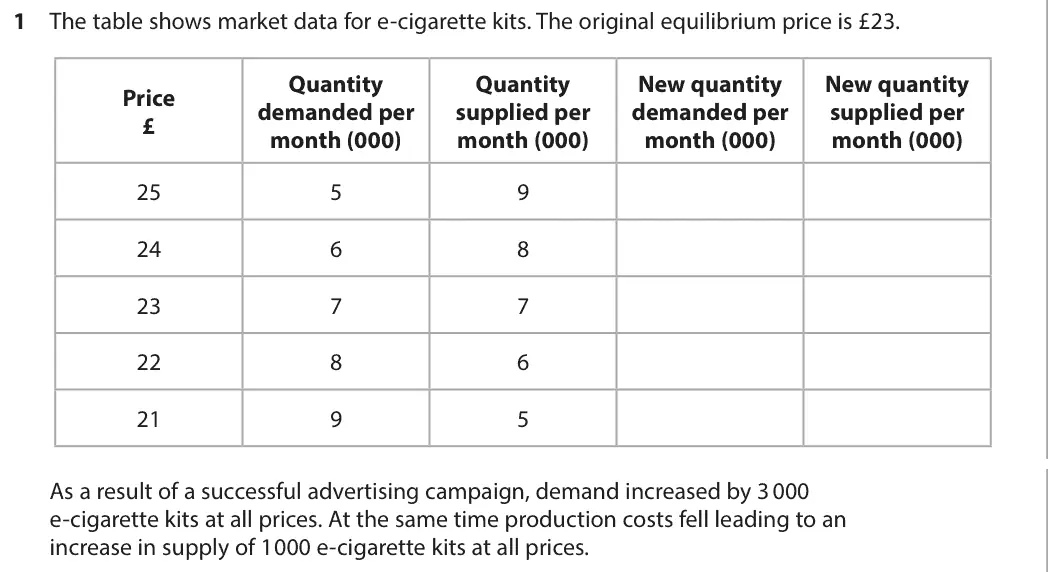
Tap a question to zoom it. The data and extracts fold out above each question; the mark scheme and examiner's comment open underneath.
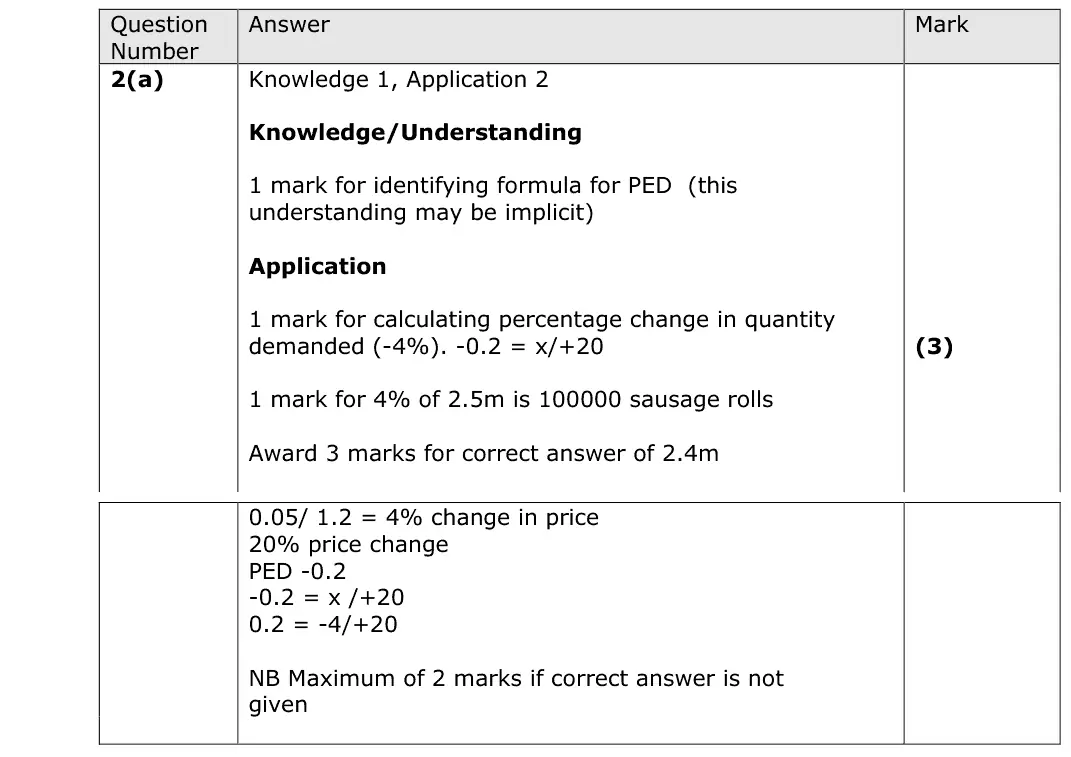
June 2025 · AS Paper 1 · Q2(a)3 marksAO1=1, AO2=2Calculation
Mark scheme
Examiner's comment
This question was designed to test quantitative ability and was focused on price elasticity. Candidates who lost marks did not manage to understand how to use the PED figure within the equation to complete the new quantity demanded, however on the whole was very well answered by the vast majority of candidates.
Notes from the mark scheme and report
%change in P = 20%
%change in Qd = PED x %change in P = -0.2 x 20 = -4%
4% of 2.5m = 100 000, so new quantity = 2.4 million per week
maximum 2 marks without the correct answer
report: some could not use the PED to find the new quantity
Quantitative skills: QS 2 (calculate, use and understand percentages, percentage changes and percentage point changes); QS 8 (make calculations of elasticity and interpret the result)
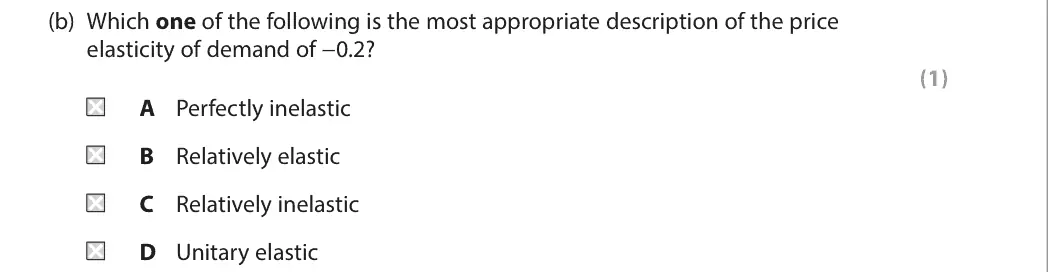
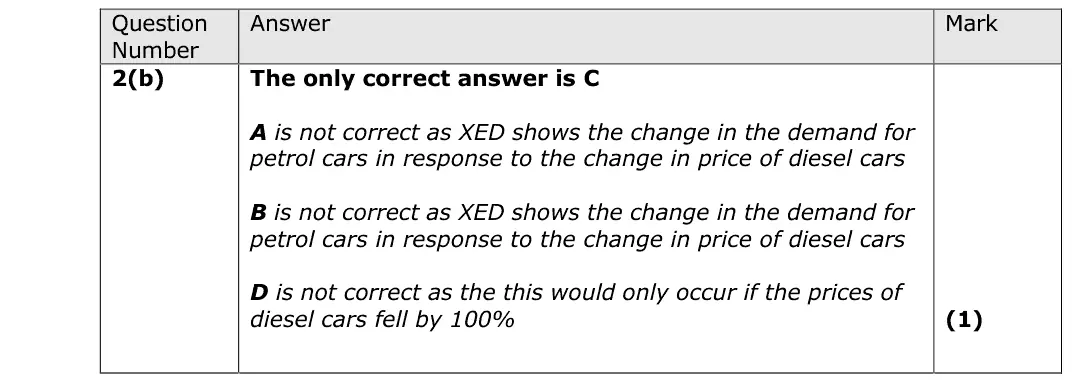
June 2025 · AS Paper 1 · Q2(b)1 markMultiple choice
Answer
C
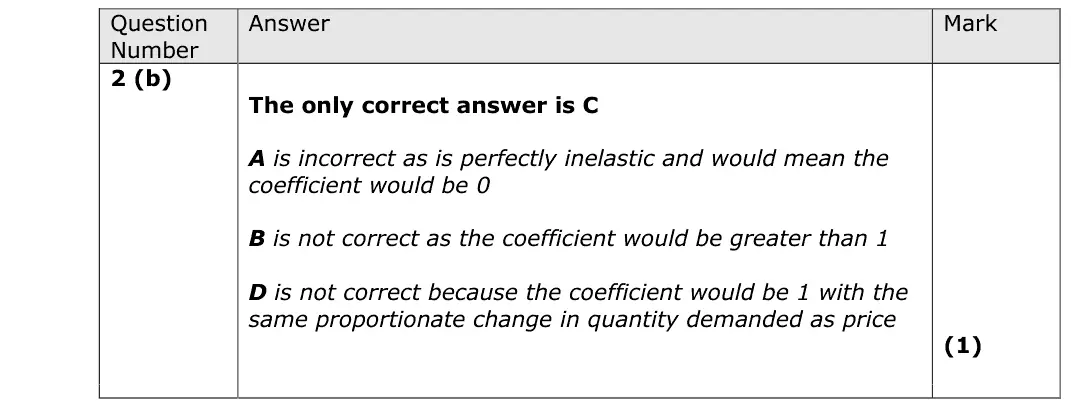
Mark scheme
Notes from the mark scheme and report
-0.2 lies between 0 and -1, so demand is relatively inelastic (C)
perfectly inelastic is 0, relatively elastic above 1, unitary 1
Quantitative skills: QS 8 (make calculations of elasticity and interpret the result)
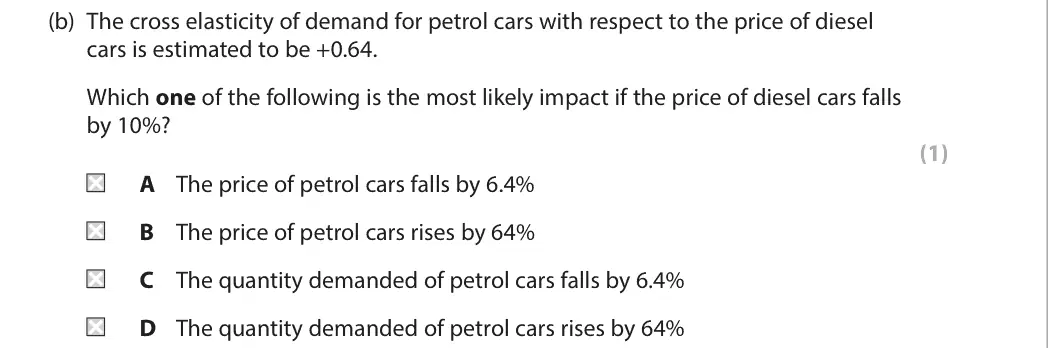
June 2025 · Paper 1 · Q2(b)1 markMultiple choice
Data and extracts for question 2
Answer
C
Mark scheme
Notes from the mark scheme and report
%change in Qd of petrol cars = XED x %change in price of diesel cars = +0.64 x -10% = -6.4% (C)
A and B change the price of petrol cars, not quantity
D would need a 100% price change
Quantitative skills: QS 2 (calculate, use and understand percentages, percentage changes and percentage point changes); QS 8 (make calculations of elasticity and interpret the result)
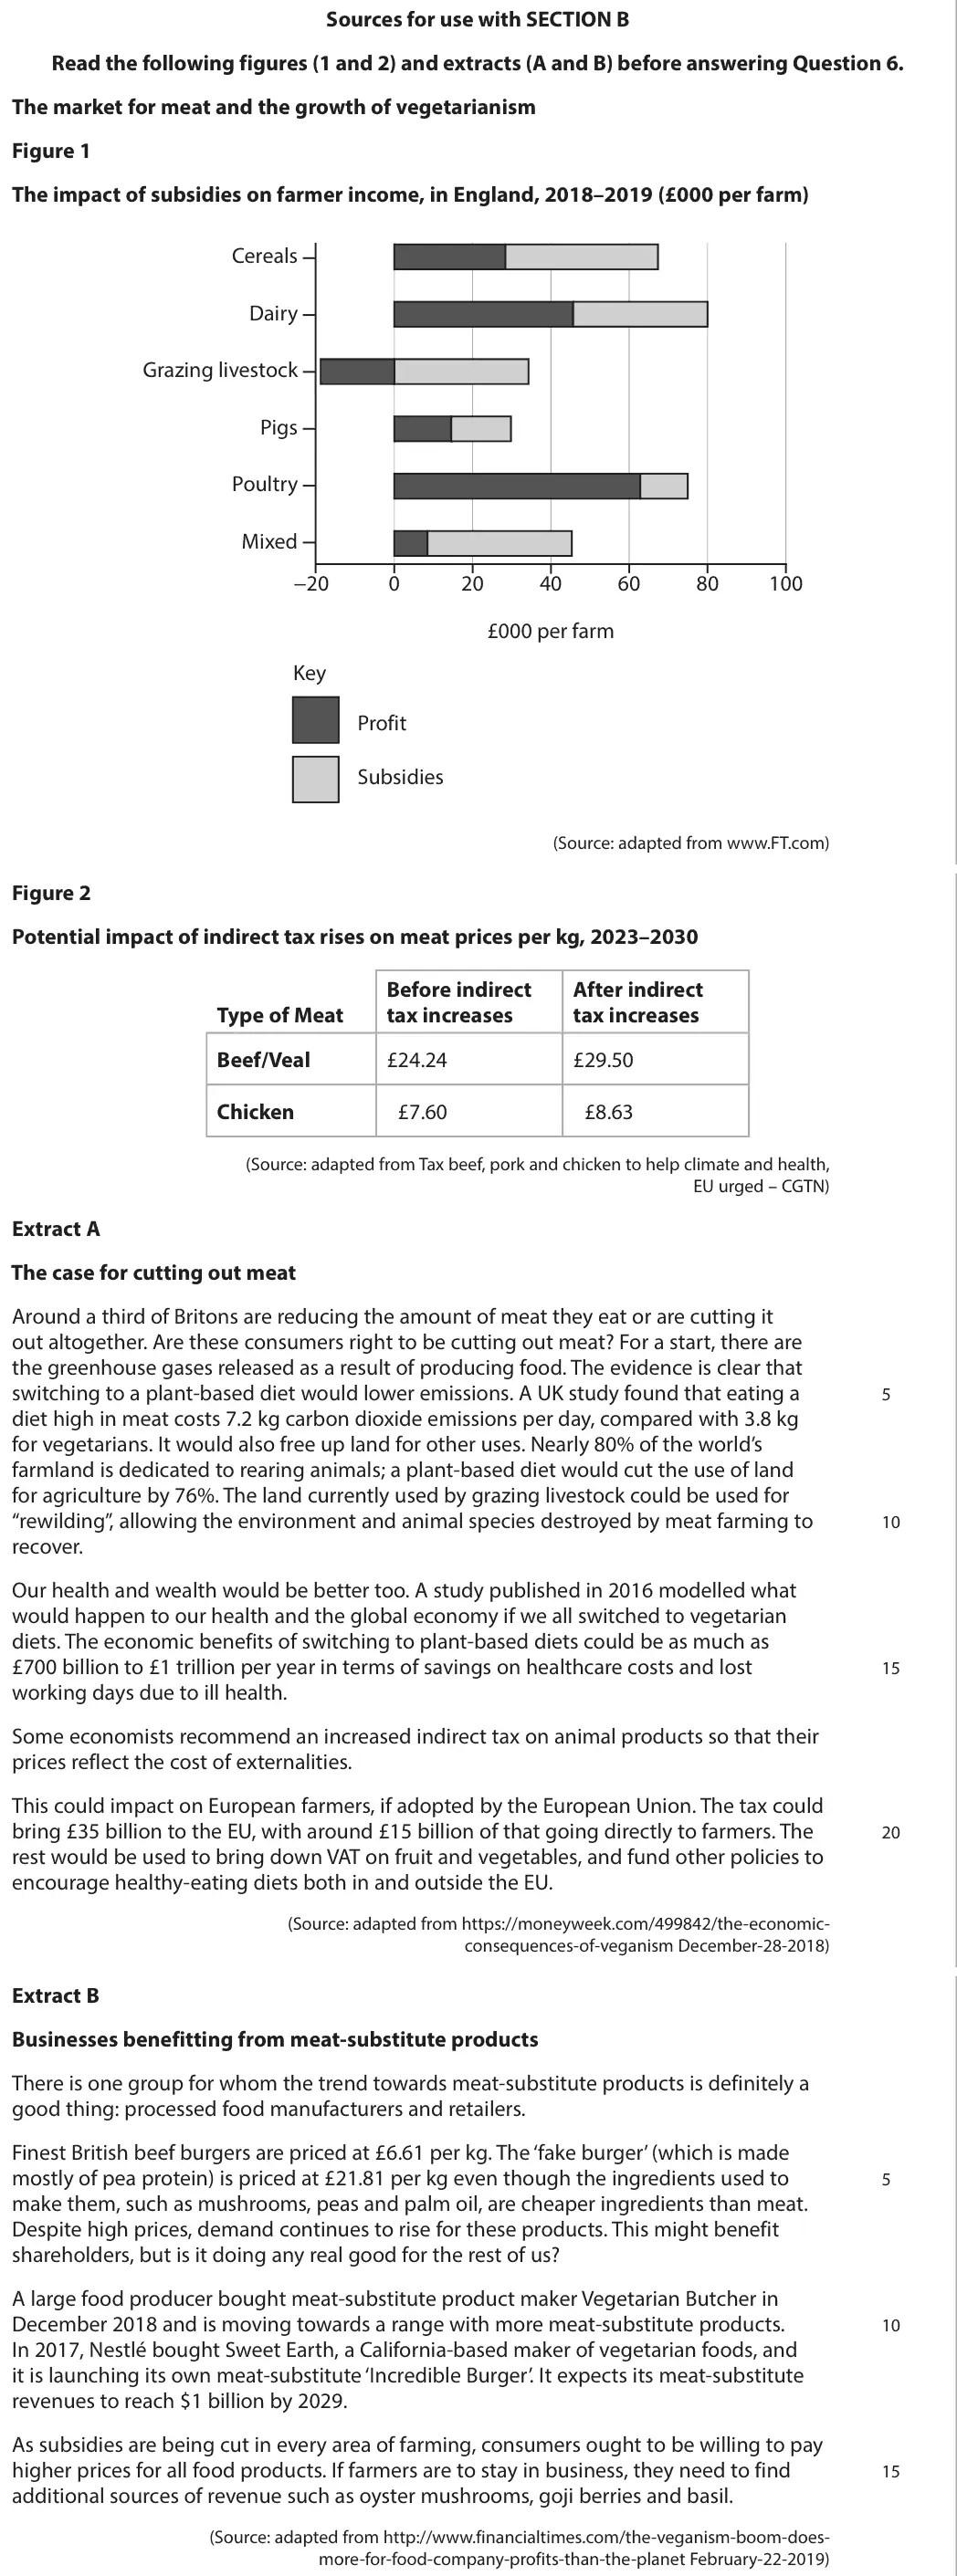
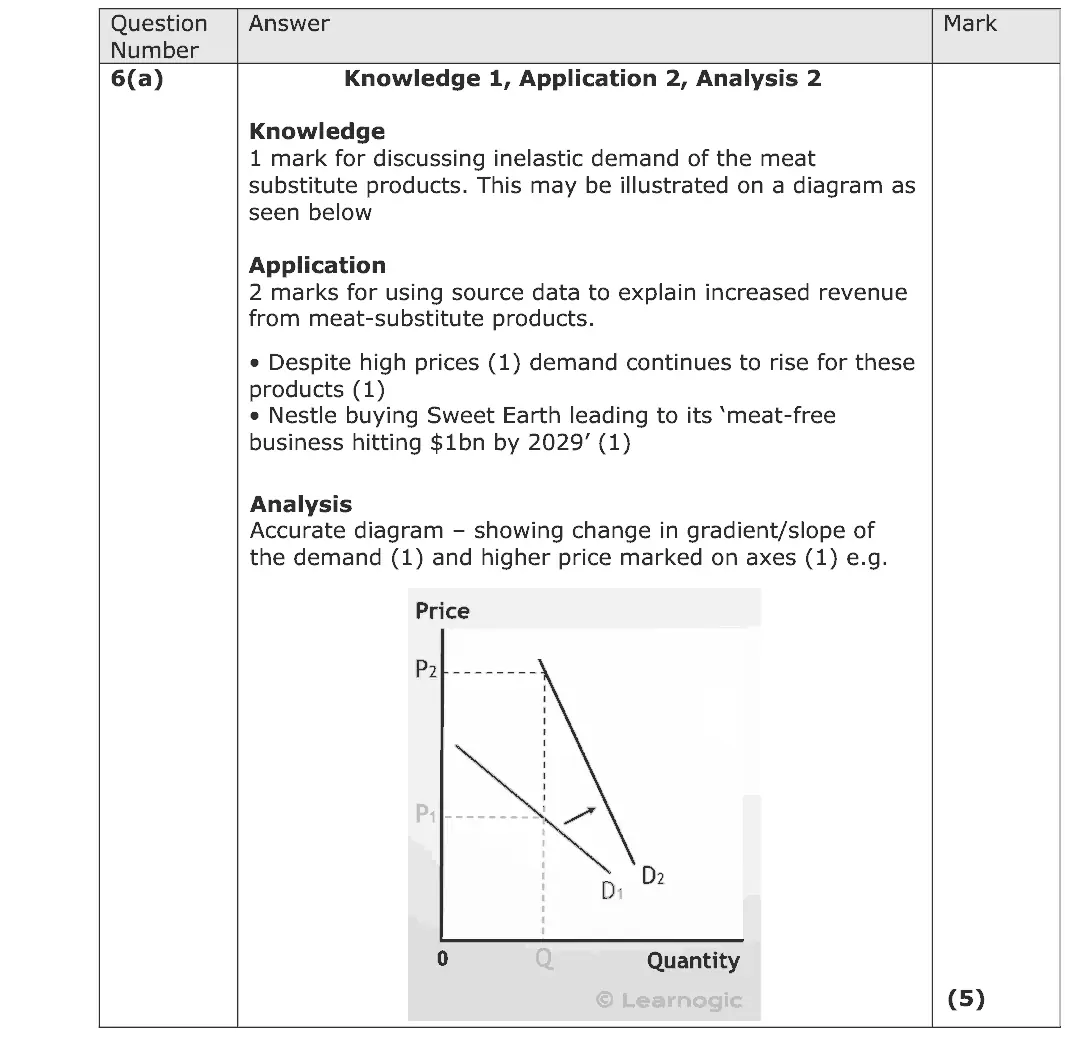
June 2025 · AS Paper 1 · Q6(a)5 marksAO1=1, AO2=2, AO3=2Short answer
Data and extracts for question 6
Mark scheme
Notes from the mark scheme and report
demand for meat substitutes is price inelastic (demand rises despite £21.81 per kg vs £6.61 for beef), so higher prices raise total revenue
apply Nestlé and Vegetarian Butcher acquisitions
report: good extract use but limited explanation of how revenue increases
Quantitative skills: QS 4 (construct and interpret a range of standard graphical forms)
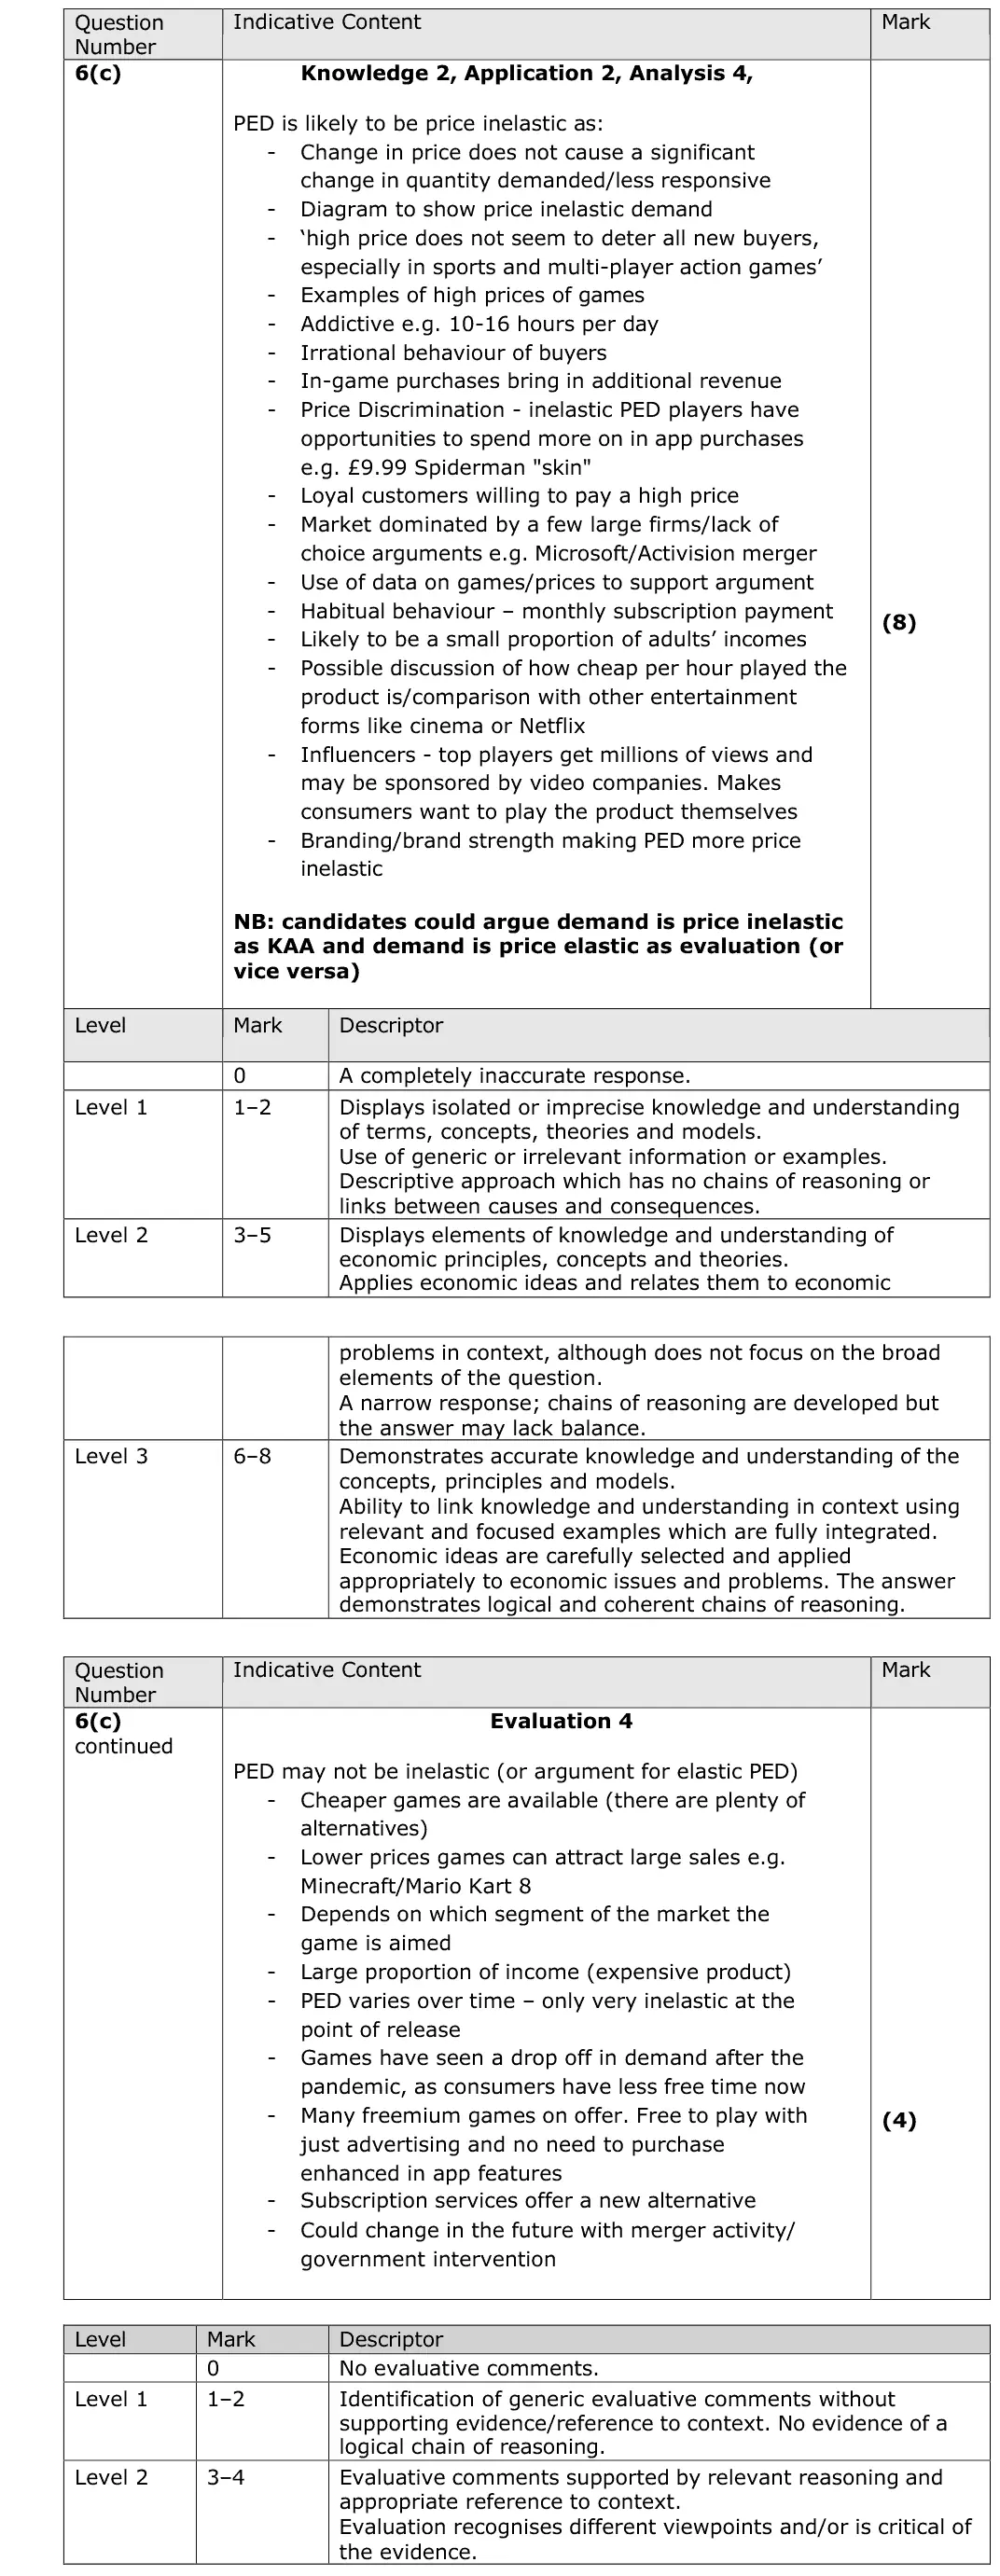
June 2025 · Paper 1 · Q6(c)12 marksAO1=2, AO2=2, AO3=4, AO4=412-mark response
Data and extracts for question 6
Mark scheme, including the levels grid and indicative content
Examiner's comment
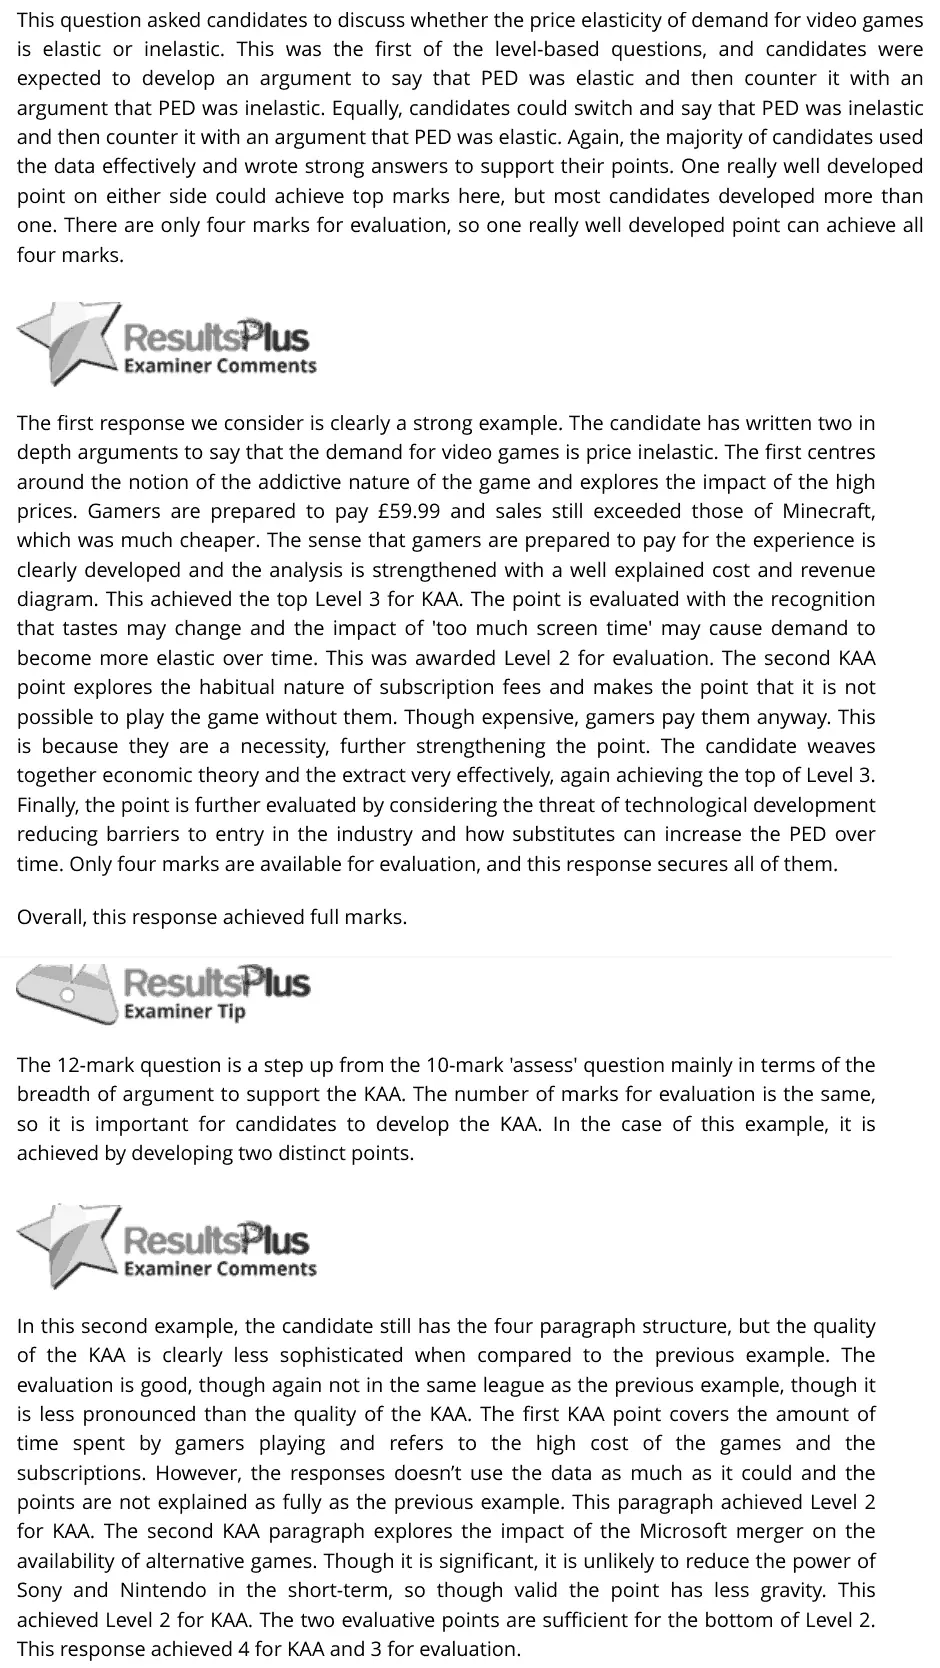
This question asked candidates to discuss whether the price elasticity of demand for video games is elastic or inelastic. This was the first of the level-based questions, and candidates were expected to develop an argument to say that PED was elastic and then counter it with an argument that PED was inelastic. Equally, candidates could switch and say that PED was inelastic and then counter it with an argument that PED was elastic. Again, the majority of candidates used the data effectively and wrote strong answers to support their points. One really well developed point on either side could achieve top marks here, but most candidates developed more than one. There are only four marks for evaluation, so one really well developed point can achieve all four marks. The first response we consider is clearly a strong example. The candidate has written two in depth arguments to say that the demand for video games is price inelastic. The first centres around the notion of the addictive nature of the game and explores the impact of the high prices. Gamers are prepared to pay £59.99 and sales still exceeded those of Minecraft, which was much cheaper. The sense that gamers are prepared to pay for the experience is clearly developed and the analysis is strengthened with a well explained cost and revenue diagram. This achieved the top Level 3 for KAA. The point is evaluated with the recognition that tastes may change and the impact of 'too much screen time' may cause demand to become more elastic over time. This was awarded Level 2 for evaluation. The second KAA point explores the habitual nature of subscription fees and makes the point that it is not possible to play the game without them. Though expensive, gamers pay them anyway. This is because they are a necessity, further strengthening the point. The candidate weaves together economic theory and the extract very effectively, again achieving the top of Level 3. Finally, the point is further evaluated by considering the threat of technological development reducing barriers to entry in the industry and how substitutes can increase the PED over time. Only four marks are available for evaluation, and this response secures all of them. Overall, this response achieved full marks. The 12-mark question is a step up from the 10-mark 'assess' question mainly in terms of the breadth of argument to support the KAA. The number of marks for evaluation is the same, so it is important for candidates to develop the KAA. In the case of this example, it is achieved by developing two distinct points. In this second example, the candidate still has the four paragraph structure, but the quality of the KAA is clearly less sophisticated when compared to the previous example. The evaluation is good, though again not in the same league as the previous example, though it is less pronounced than the quality of the KAA. The first KAA point covers the amount of time spent by gamers playing and refers to the high cost of the games and the subscriptions. However, the responses doesn’t use the data as much as it could and the points are not explained as fully as the previous example. This paragraph achieved Level 2 for KAA. The second KAA paragraph explores the impact of the Microsoft merger on the availability of alternative games. Though it is significant, it is unlikely to reduce the power of Sony and Nintendo in the short-term, so though valid the point has less gravity. This achieved Level 2 for KAA. The two evaluative points are sufficient for the bottom of Level 2. This response achieved 4 for KAA and 3 for evaluation.
Notes from the mark scheme and report
inelastic: addictive habit (10-16 hours a day), brand loyalty, few substitutes after the merger, high prices do not deter buyers
elastic counter-argument e.g. cheaper games such as Minecraft at £14.99 and free alternatives
one well developed point each way is enough
Quantitative skills: QS 9 (interpret, apply and analyse information in written, graphical tabular and numerical forms)
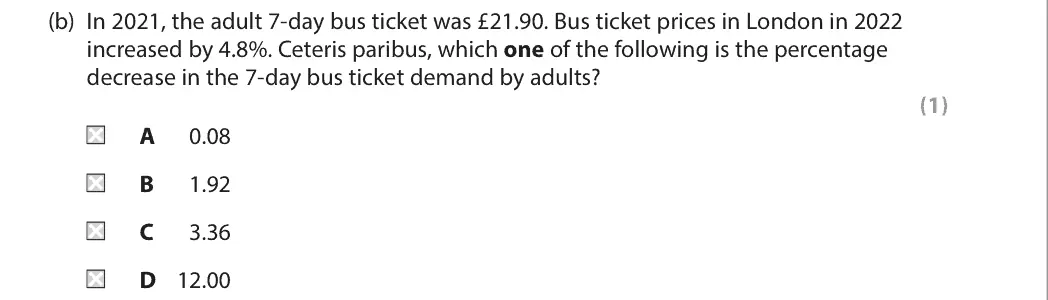
June 2024 · Paper 1 · Q1(a)4 marksAO1=2, AO2=1, AO3=1Short answer
Data and extracts for question 1
Mark scheme
Examiner's comment
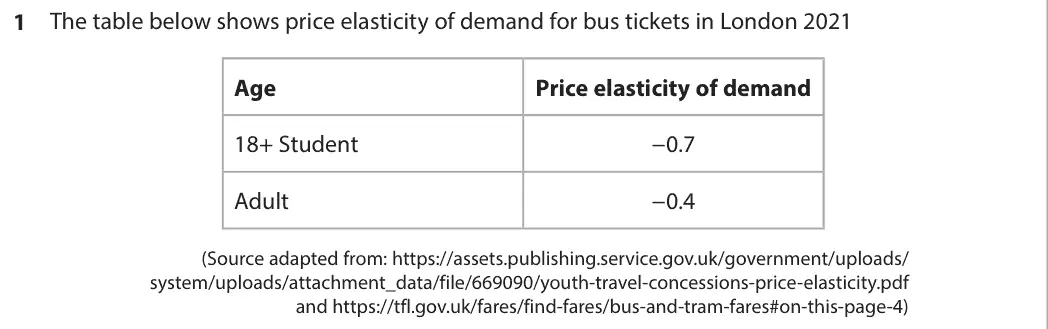
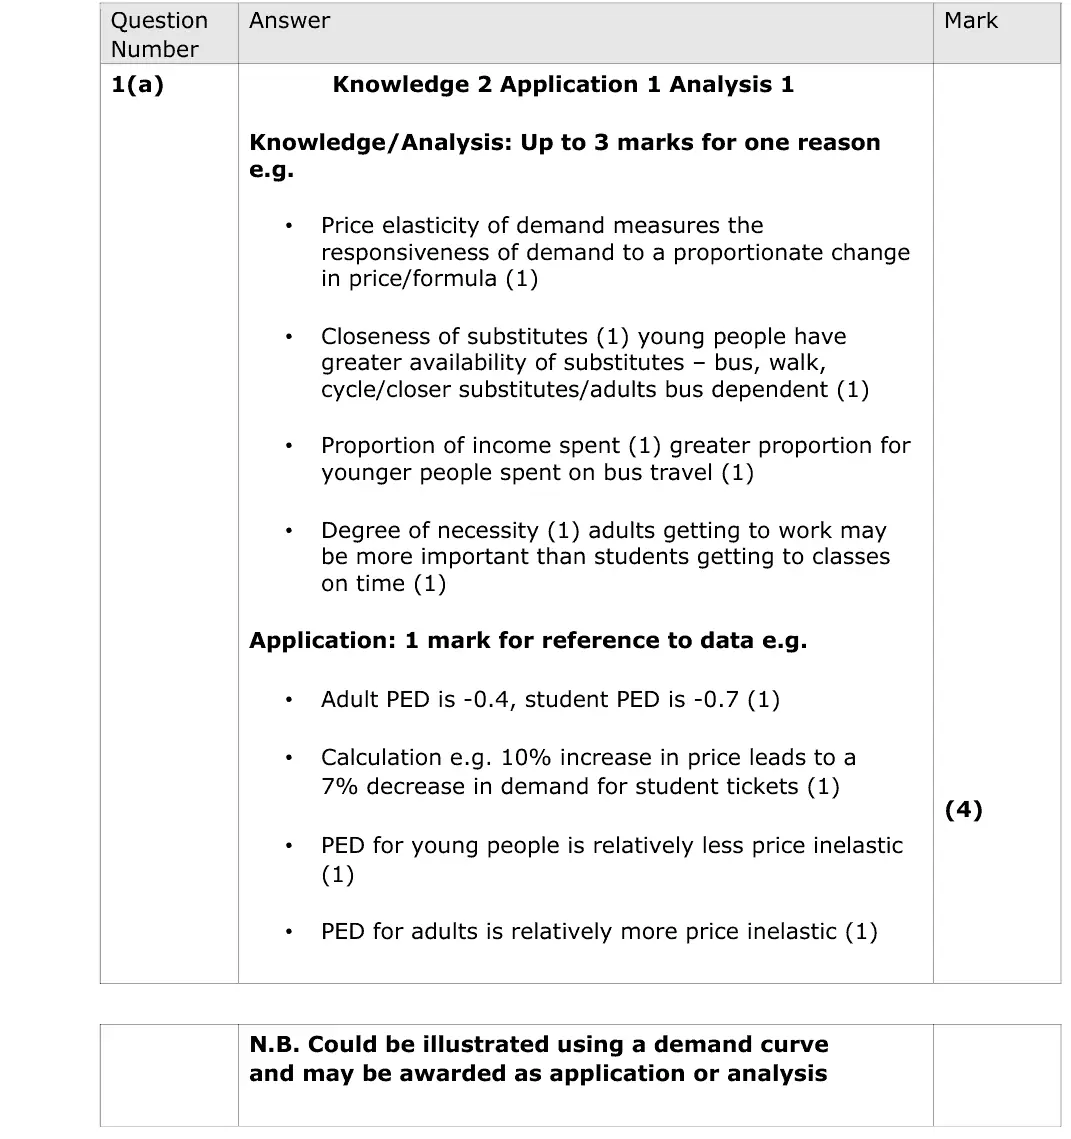
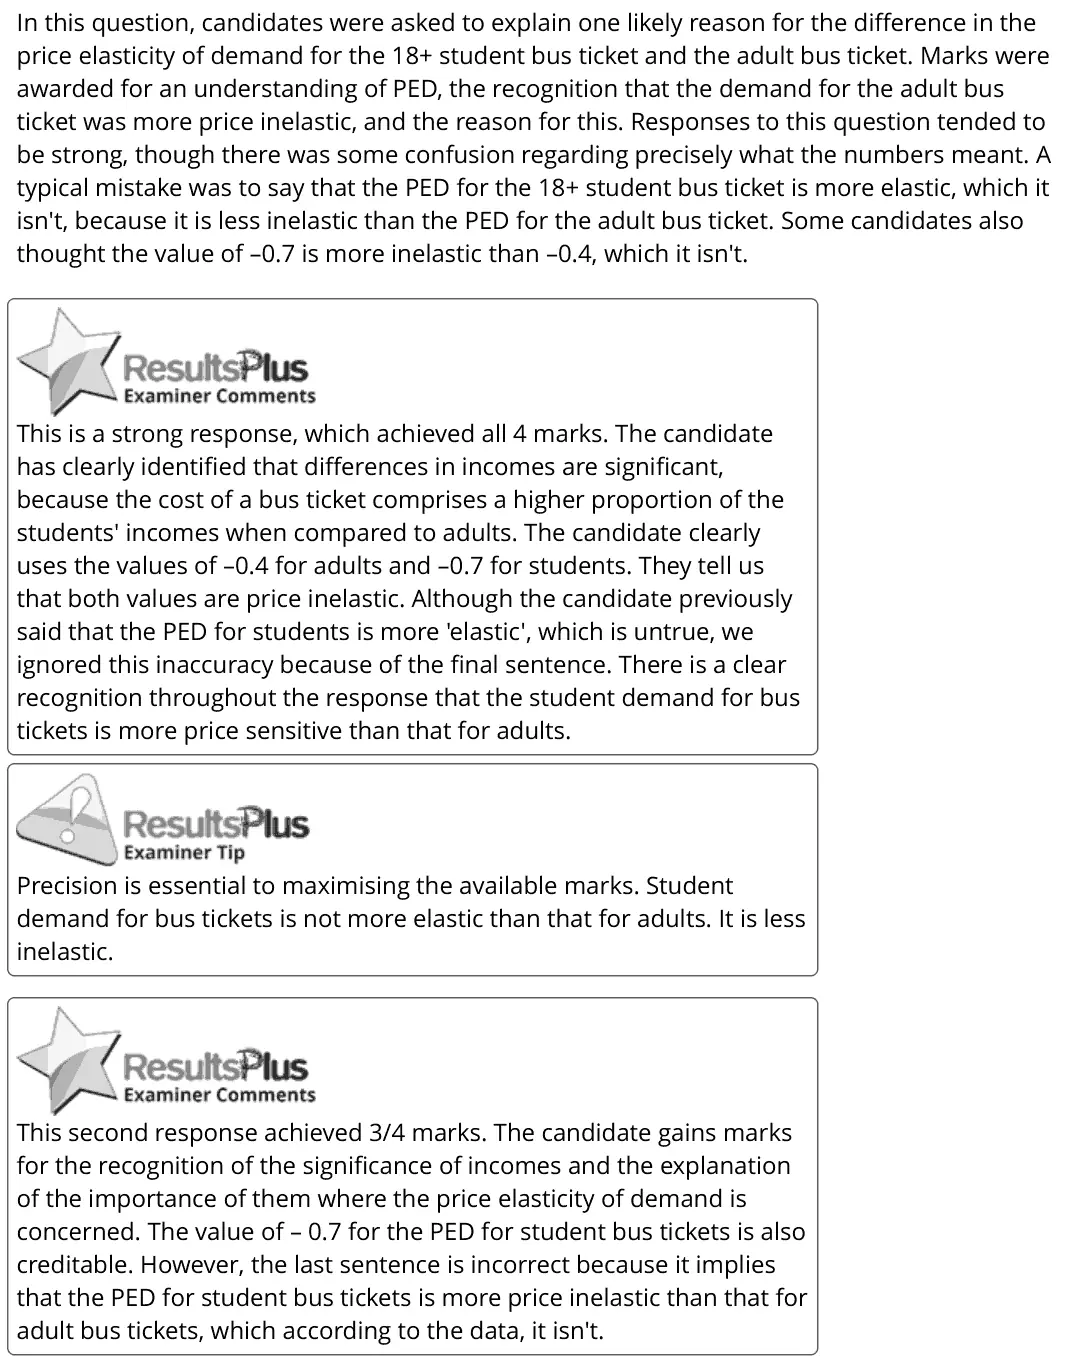
In this question, candidates were asked to explain one likely reason for the difference in the price elasticity of demand for the 18+ student bus ticket and the adult bus ticket. Marks were awarded for an understanding of PED, the recognition that the demand for the adult bus ticket was more price inelastic, and the reason for this. Responses to this question tended to be strong, though there was some confusion regarding precisely what the numbers meant. A typical mistake was to say that the PED for the 18+ student bus ticket is more elastic, which it isn't, because it is less inelastic than the PED for the adult bus ticket. Some candidates also thought the value of –0.7 is more inelastic than –0.4, which it isn't. This is a strong response, which achieved all 4 marks. The candidate has clearly identified that differences in incomes are significant, because the cost of a bus ticket comprises a higher proportion of the students' incomes when compared to adults. The candidate clearly uses the values of –0.4 for adults and –0.7 for students. They tell us that both values are price inelastic. Although the candidate previously said that the PED for students is more 'elastic', which is untrue, we ignored this inaccuracy because of the final sentence. There is a clear recognition throughout the response that the student demand for bus tickets is more price sensitive than that for adults. Precision is essential to maximising the available marks. Student demand for bus tickets is not more elastic than that for adults. It is less inelastic. This second response achieved 3/4 marks. The candidate gains marks for the recognition of the significance of incomes and the explanation of the importance of them where the price elasticity of demand is concerned. The value of – 0.7 for the PED for student bus tickets is also creditable. However, the last sentence is incorrect because it implies that the PED for student bus tickets is more price inelastic than that for adult bus tickets, which according to the data, it isn't.
Notes from the mark scheme and report
-0.7 is less price inelastic than -0.4, not "more elastic" or "more inelastic"
quote the PED values for the application mark
reasons: substitutes, share of income, necessity
Quantitative skills: QS 8 (make calculations of elasticity and interpret the result); QS 9 (interpret, apply and analyse information in written, graphical tabular and numerical forms)
June 2024 · Paper 1 · Q1(b)1 markMultiple choice
Data and extracts for question 1
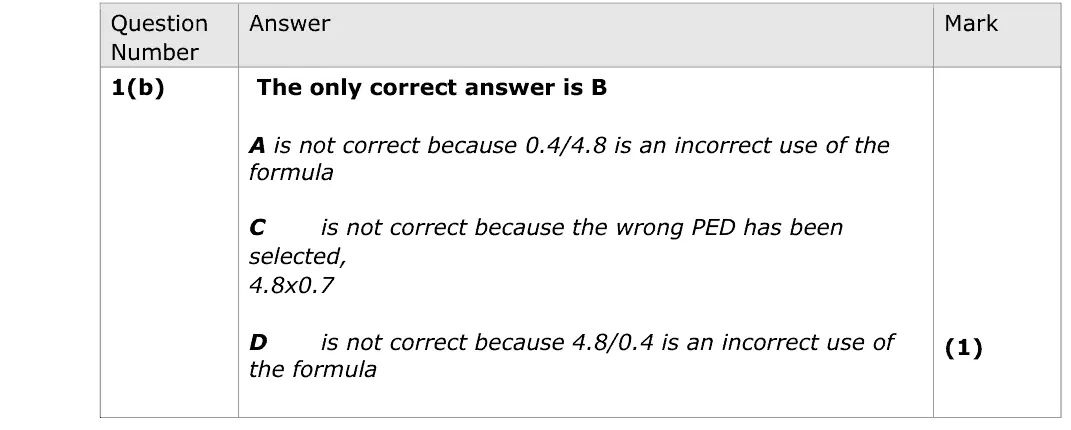
Answer
B
Mark scheme
Notes from the mark scheme and report
%change in Qd = PED x %change in P = -0.4 x 4.8 = -1.92 (B)
C uses the student PED
A and D divide instead of multiply
Quantitative skills: QS 2 (calculate, use and understand percentages, percentage changes and percentage point changes); QS 8 (make calculations of elasticity and interpret the result)
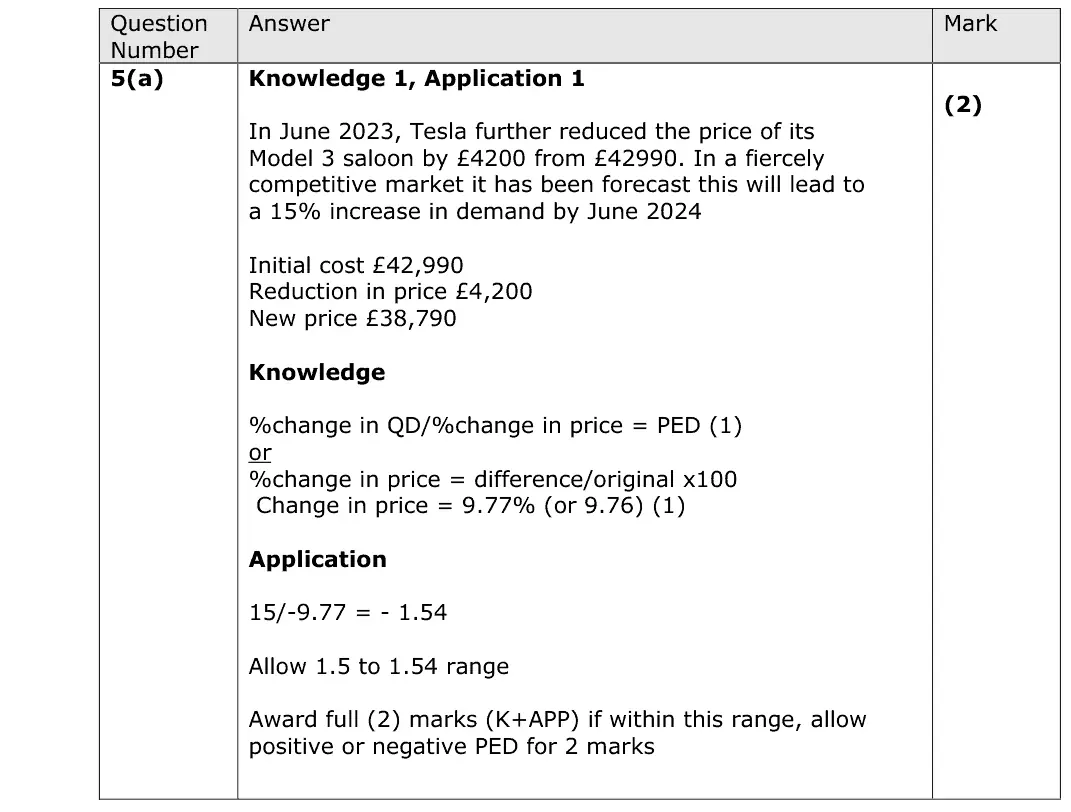
June 2024 · AS Paper 1 · Q5(a)2 marksAO1=1, AO2=1Calculation
Data and extracts for question 5
Mark scheme
Examiner's comment
Question 5 (a) Many students performed very well on the price elasticity of demand question and produced an elasticity coefficient between -1.5 and -1.54. As within previous series, students did struggle to find the change in price, as a percentage. The formula appeared very well recalled by the majority of candidates.
Notes from the mark scheme and report
%change in price = -4 200 / 42 990 x 100 = -9.77%
PED = 15 / -9.77 = -1.54 (allow 1.5 to 1.54)
many struggled to find the percentage change in price
Quantitative skills: QS 2 (calculate, use and understand percentages, percentage changes and percentage point changes); QS 8 (make calculations of elasticity and interpret the result)
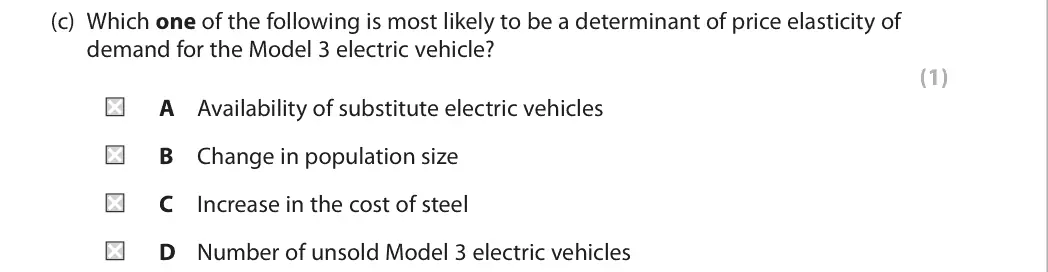
June 2024 · AS Paper 1 · Q5(c)1 markAO1=1Multiple choice
Data and extracts for question 5
Answer
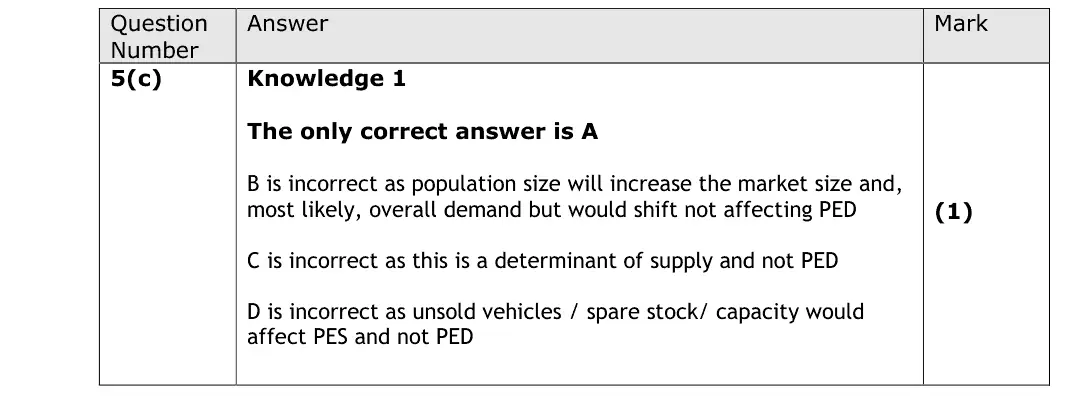
A
Mark scheme
Notes from the mark scheme and report
availability of substitutes determines PED (A)
population size shifts demand, steel costs shift supply, unsold stock relates to PES
June 2024 · AS Paper 1 · Q6(c)4 marksAO1=2, AO2=2Short answer
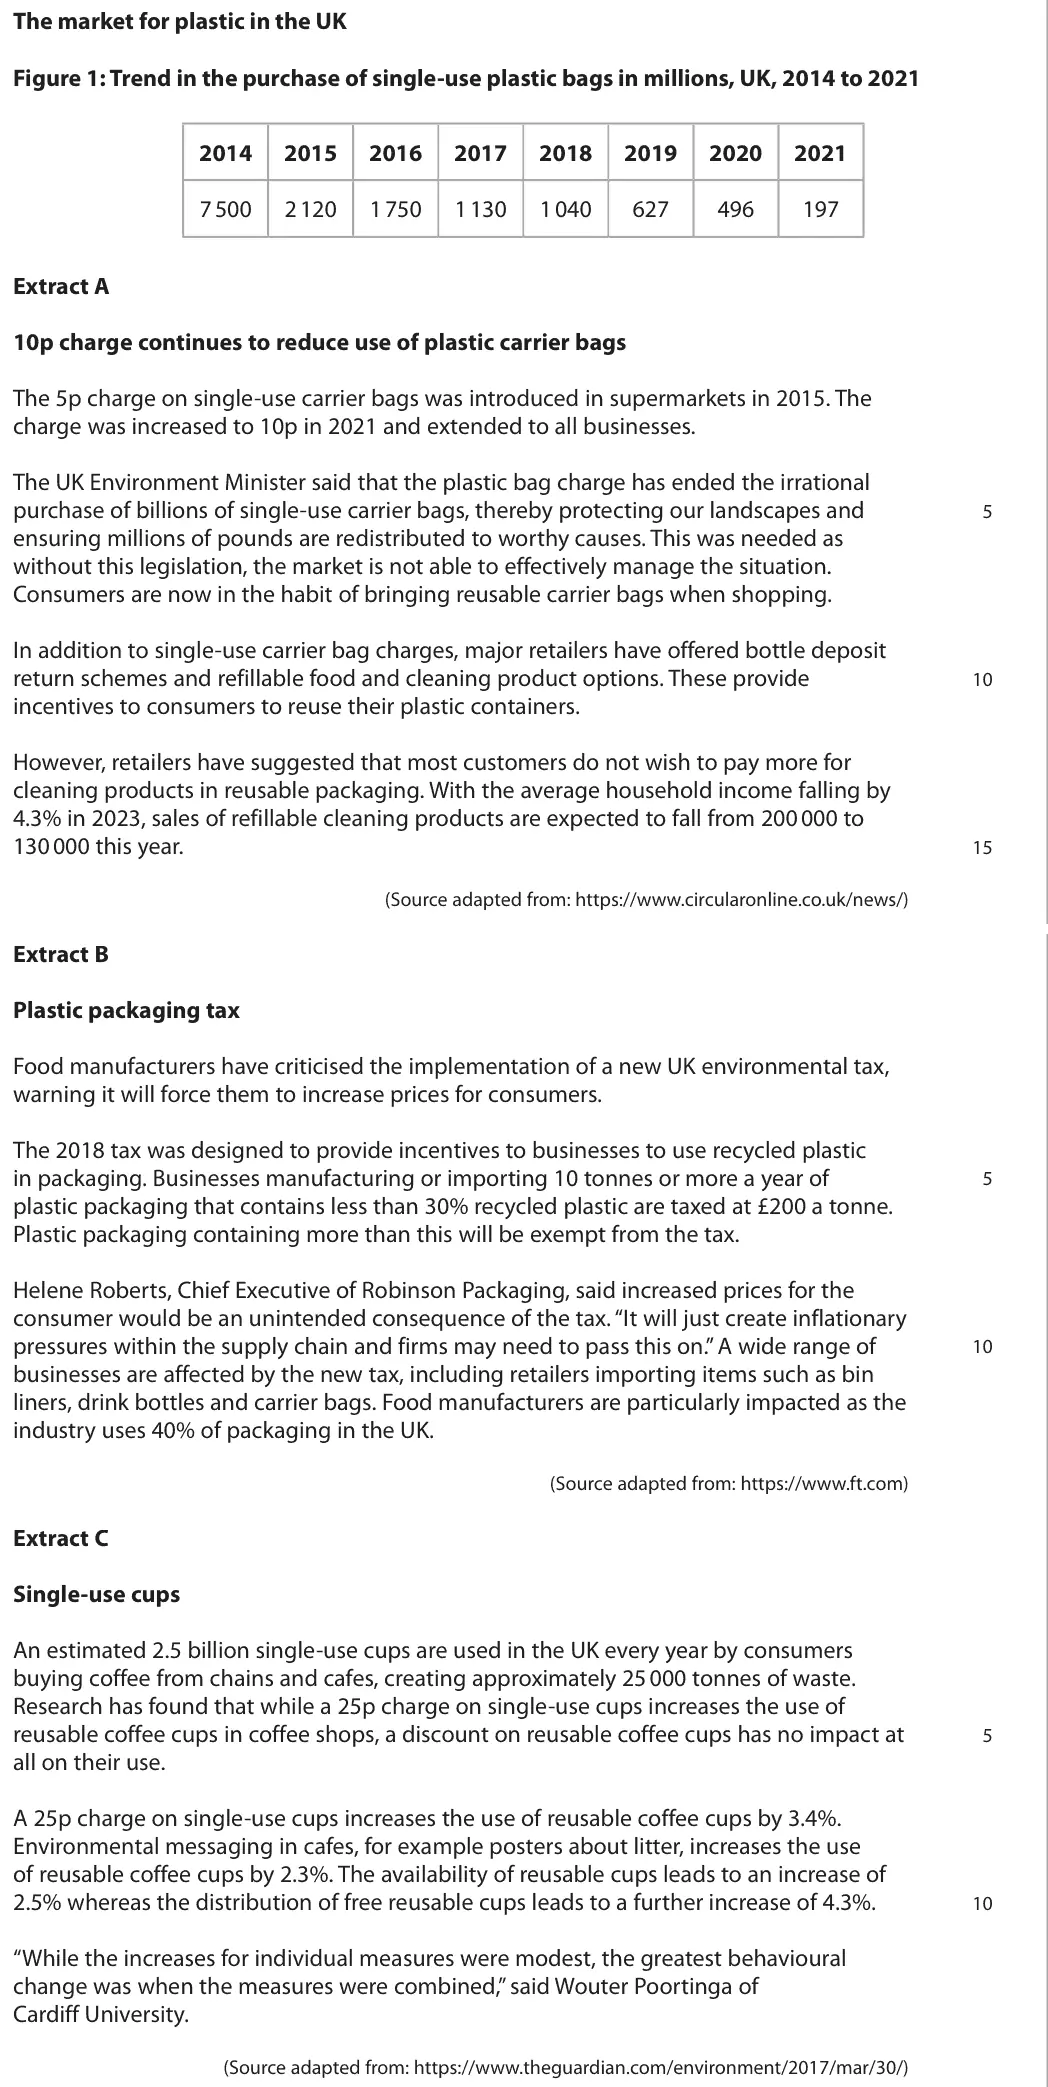
Data and extracts for question 6
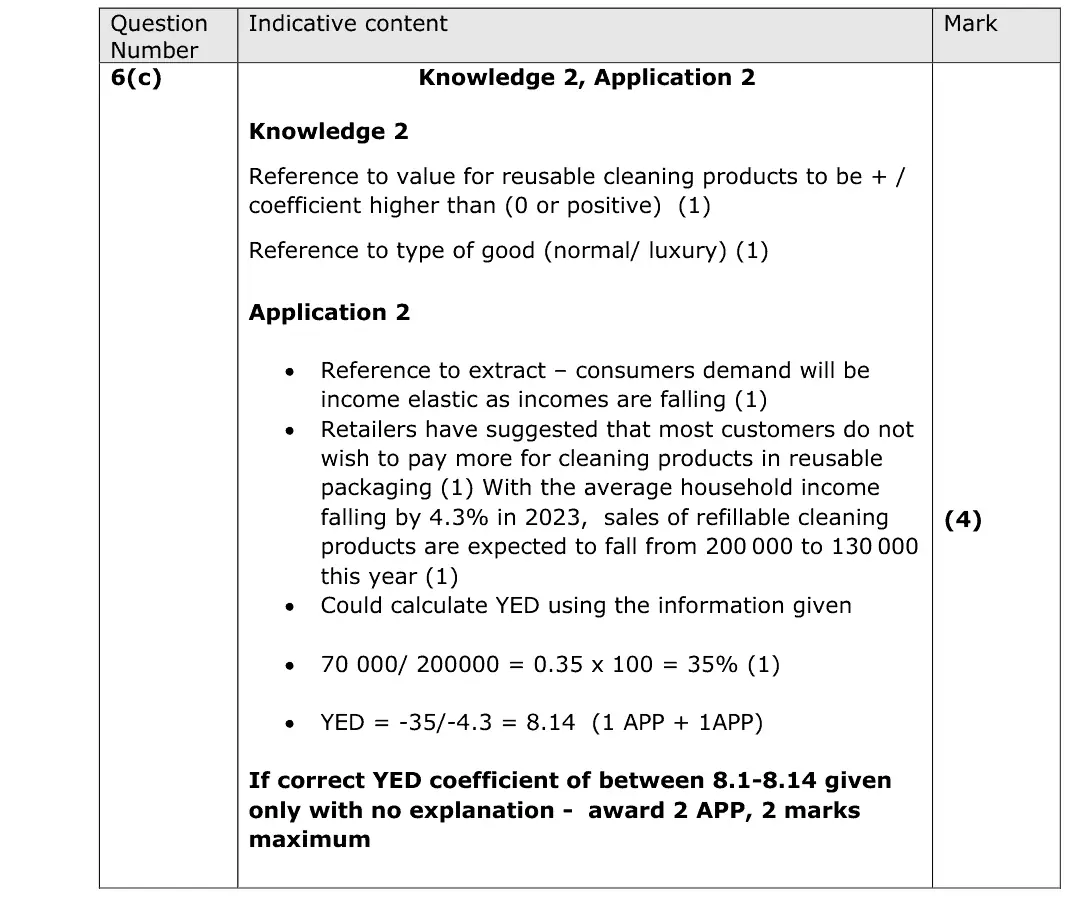
Mark scheme
Examiner's comment
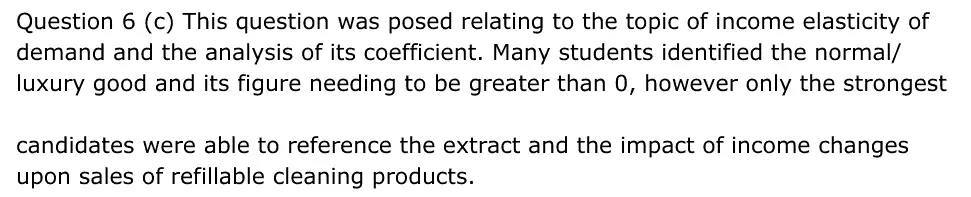
Question 6 (c) This question was posed relating to the topic of income elasticity of demand and the analysis of its coefficient. Many students identified the normal/ luxury good and its figure needing to be greater than 0, however only the strongest candidates were able to reference the extract and the impact of income changes upon sales of refillable cleaning products.
Notes from the mark scheme and report
positive YED, normal and income elastic (luxury)
income fell 4.3% and sales fall from 200 000 to 130 000 (-35%), so YED = -35 / -4.3 = 8.1
only the strongest used the extract data
Quantitative skills: QS 2 (calculate, use and understand percentages, percentage changes and percentage point changes); QS 8 (make calculations of elasticity and interpret the result)
June 2024 · AS Paper 1 · Q6(d)6 marksAO1=2, AO2=2, AO3=2Short answer
Data and extracts for question 6
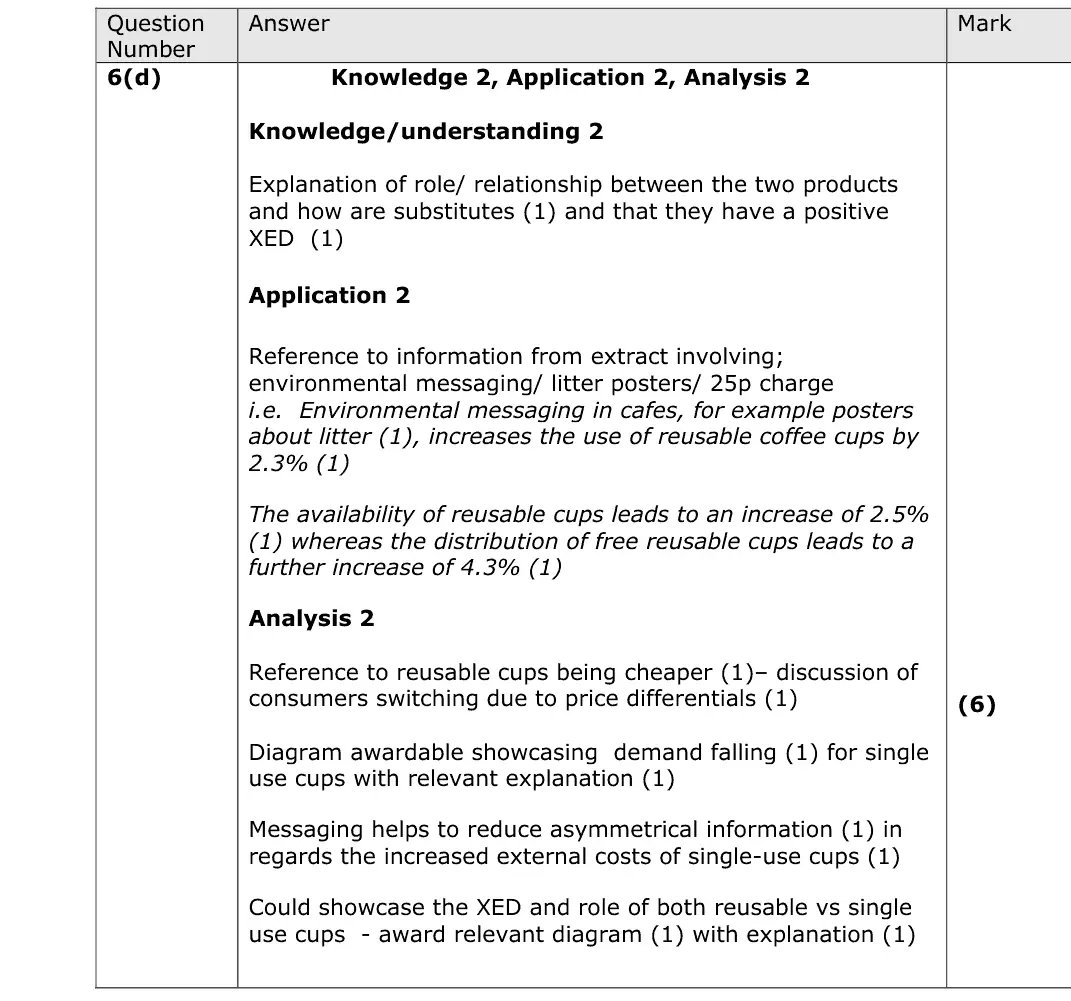
Mark scheme
Examiner's comment
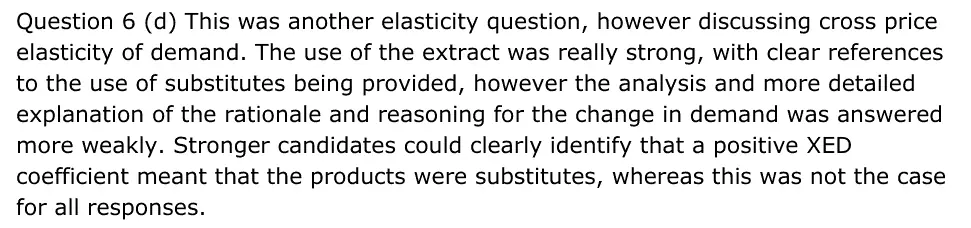
Question 6 (d) This was another elasticity question, however discussing cross price elasticity of demand. The use of the extract was really strong, with clear references to the use of substitutes being provided, however the analysis and more detailed explanation of the rationale and reasoning for the change in demand was answered more weakly. Stronger candidates could clearly identify that a positive XED coefficient meant that the products were substitutes, whereas this was not the case for all responses.
Notes from the mark scheme and report
reusable and single-use cups are substitutes with positive XED: incentives that make reusables cheaper or more attractive shift demand for single-use cups left
Quantitative skills: QS 8 (make calculations of elasticity and interpret the result)
June 2024 · Paper 3 · Q1(a)5 marksAO1=2, AO2=2, AO3=1Short answer
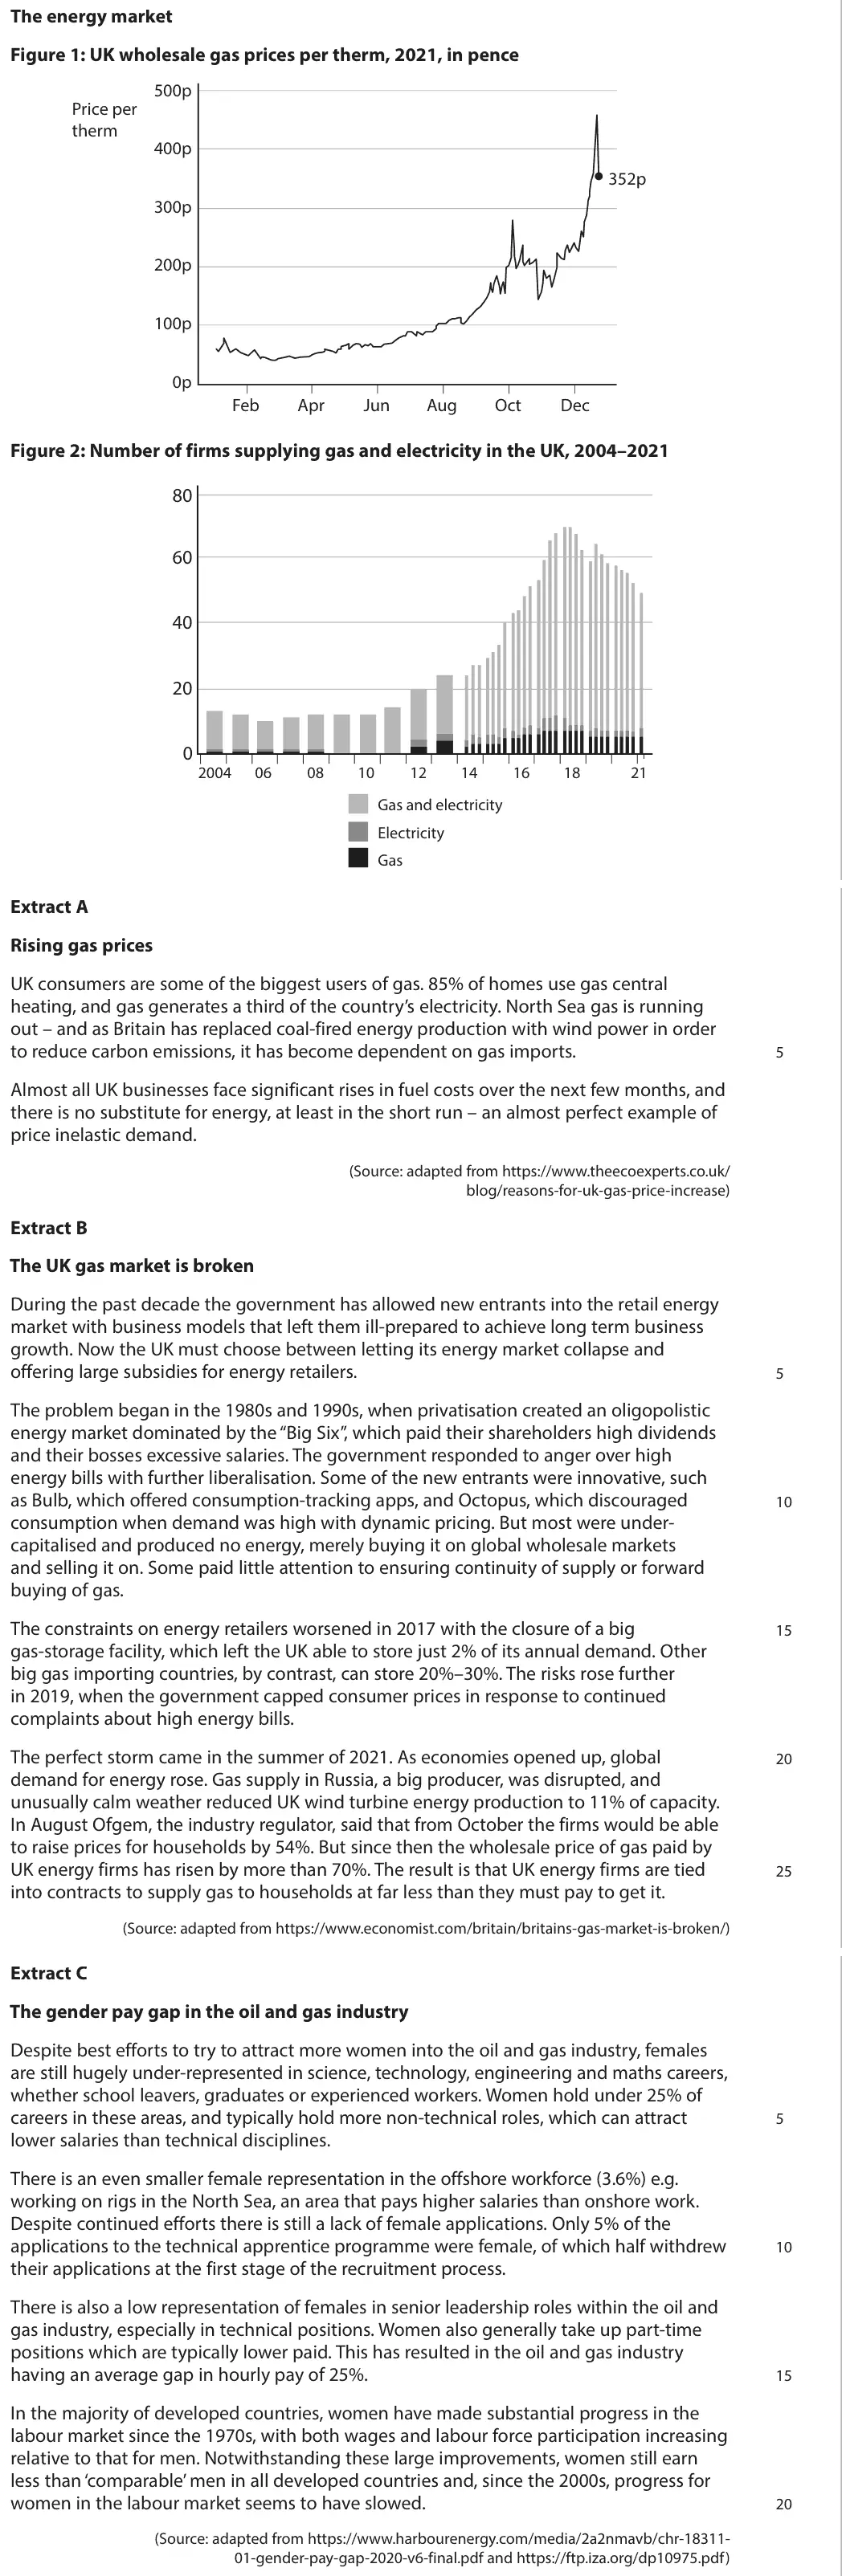
Data and extracts for question 1
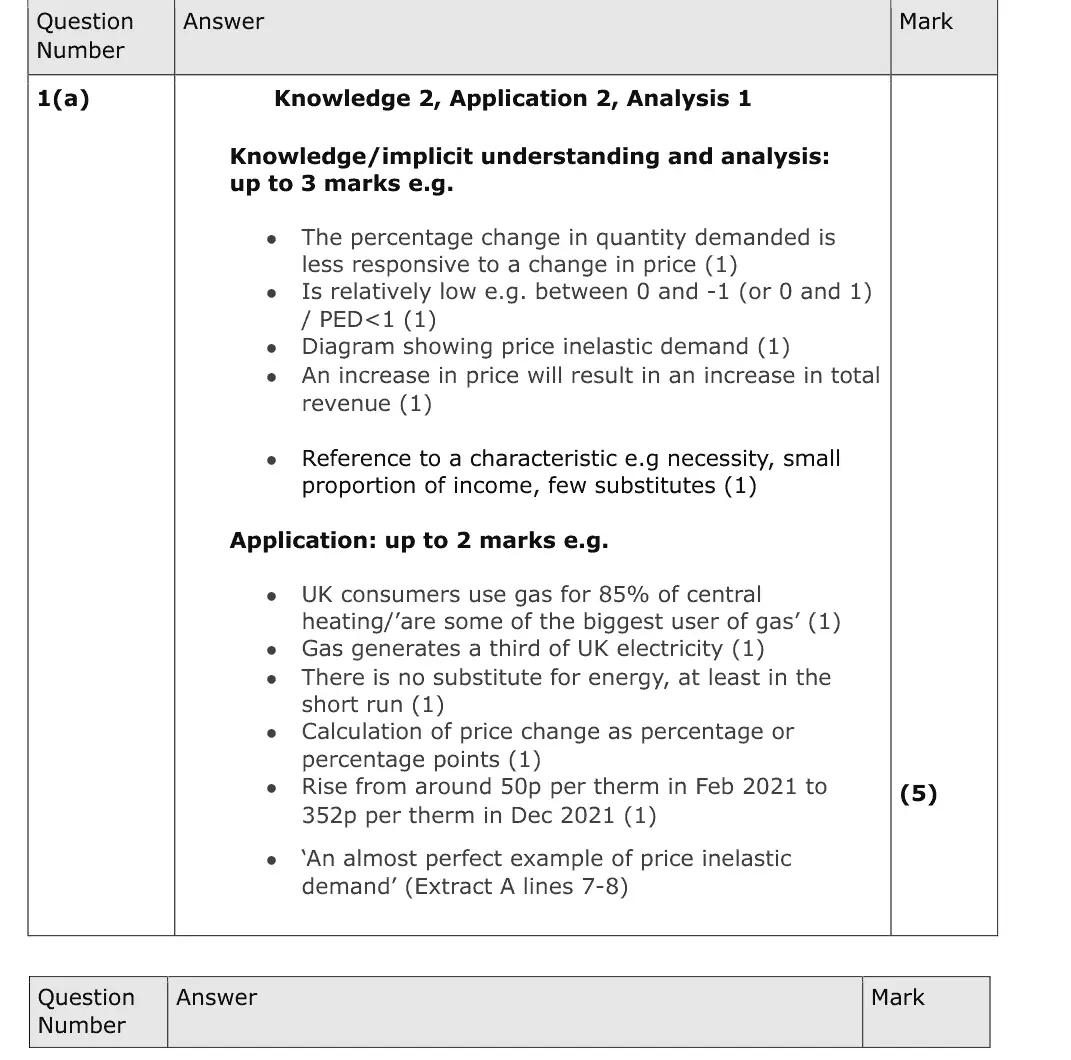
Mark scheme
Examiner's comment
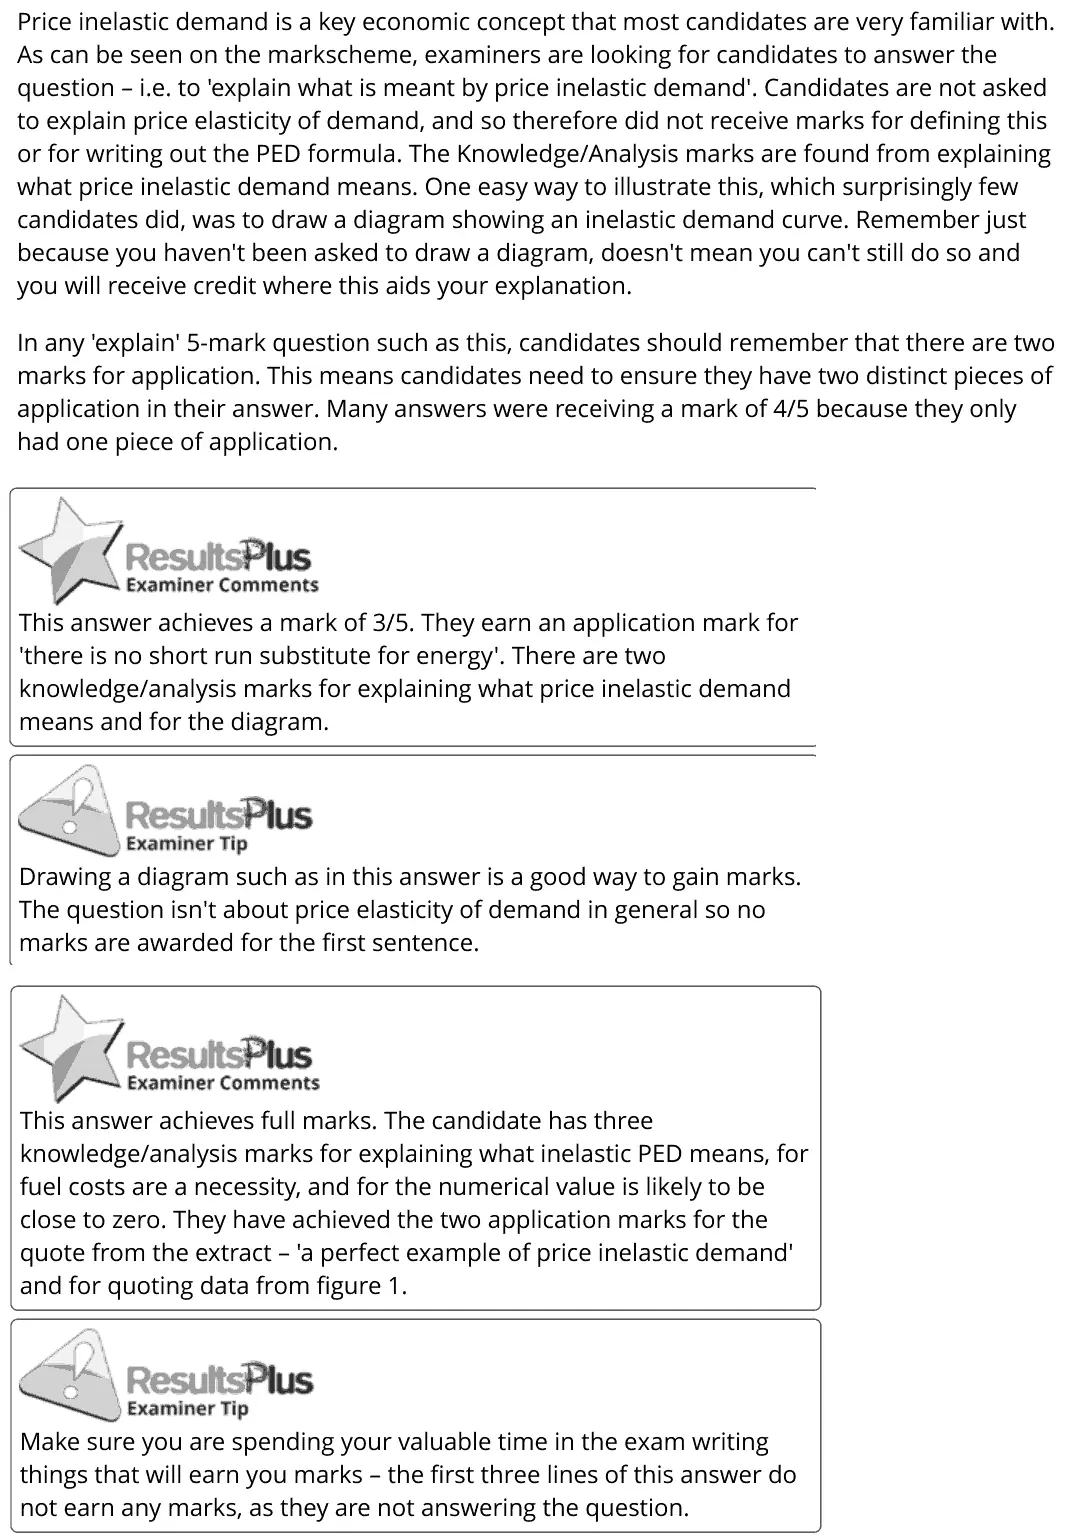
Price inelastic demand is a key economic concept that most candidates are very familiar with. As can be seen on the markscheme, examiners are looking for candidates to answer the question - i.e. to ‘explain what is meant by price inelastic demand’. Candidates are not asked to explain price elasticity of demand, and so therefore did not receive marks for defining this or for writing out the PED formula. The Knowledge/Analysis marks are found from explaining what price inelastic demand means. One easy way to illustrate this, which surprisingly few candidates did, was to draw a diagram showing an inelastic demand curve. Remember just because you haven't been asked to draw a diagram, doesn't mean you can't still do so and you will receive credit where this aids your explanation. In any 'explain' 5-mark question such as this, candidates should remember that there are two marks for application. This means candidates need to ensure they have two distinct pieces of application in their answer. Many answers were receiving a mark of 4/5 because they only had one piece of application. <6ResultsPlus This answer achieves a mark of 3/5. They earn an application mark for ‘there is no short run substitute for energy’. There are two knowledge/analysis marks for explaining what price inelastic demand means and for the diagram. \ ip ResuitsPlus Drawing a diagram such as in this answer is a good way to gain marks. The question isn't about price elasticity of demand in general so no marks are awarded for the first sentence. <iResultsPlus This answer achieves full marks. The candidate has three knowledge/analysis marks for explaining what inelastic PED means, for fuel costs are a necessity, and for the numerical value is likely to be close to zero. They have achieved the two application marks for the quote from the extract - 'a perfect example of price inelastic demand' and for quoting data from figure 1. aN ots,ResultsPlus Make sure you are spending your valuable time in the exam writing things that will earn you marks - the first three lines of this answer do not earn any marks, as they are not answering the question.
Notes from the mark scheme and report
explain price inelastic demand (Qd less responsive than price, PED between 0 and -1, necessity with few substitutes)
defining PED in general or writing the formula earns nothing
an inelastic demand diagram earns a mark but few drew one
two distinct application points needed (85% of homes, no short-run substitute, 50p to 352p per therm) and many scored 4 of 5 with only one
Quantitative skills: QS 8 (make calculations of elasticity and interpret the result); QS 9 (interpret, apply and analyse information in written, graphical tabular and numerical forms)
June 2023 · AS Paper 1 · Q2(b)1 markMultiple choice
Data and extracts for question 2
Answer
C
Mark scheme
Notes from the mark scheme and report
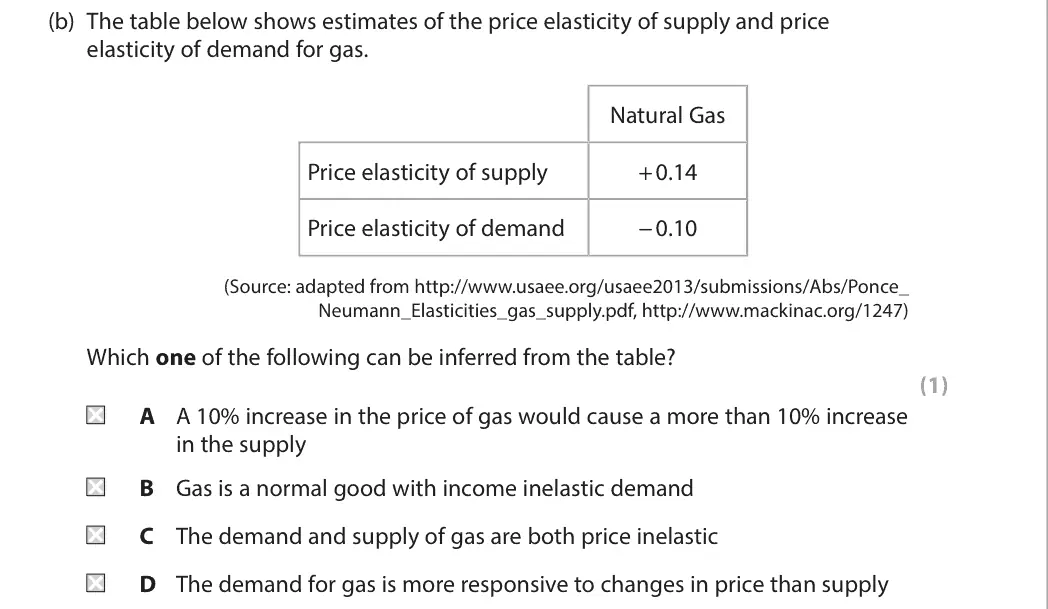
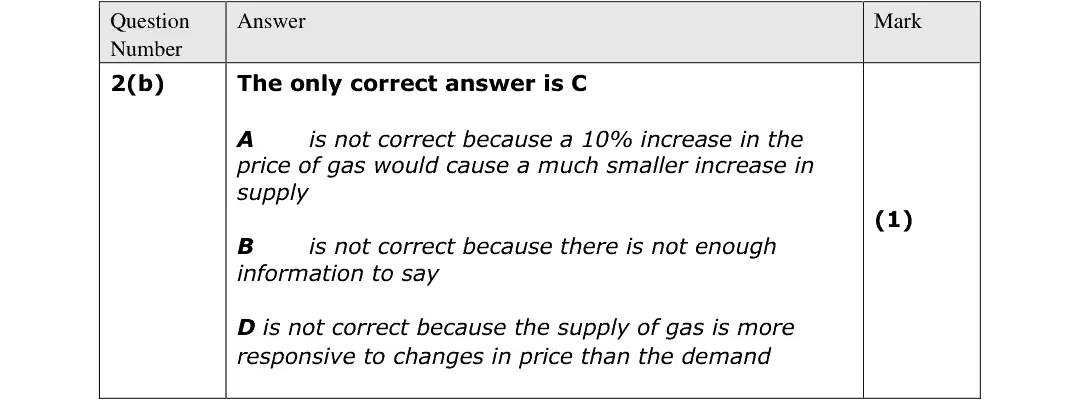
both coefficients are below 1 in absolute value, so demand and supply are price inelastic (C)
a 10% price rise raises supply only 1.4%
no YED is given
supply (0.14) is more responsive than demand (0.10)
Quantitative skills: QS 8 (make calculations of elasticity and interpret the result)
June 2023 · Paper 1 · Q3(a)1 markAO2=1Multiple choice
Data and extracts for question 3
Answer
D
Mark scheme
Notes from the mark scheme and report
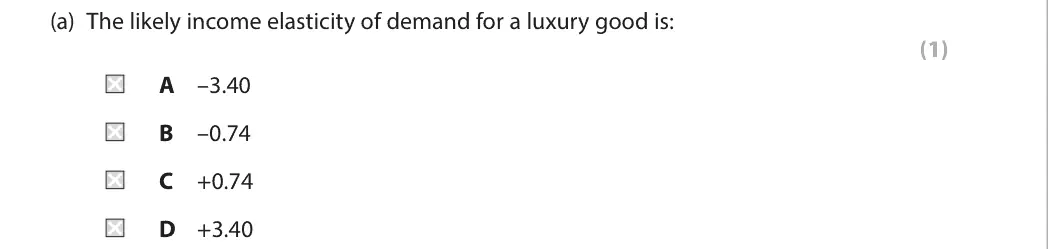
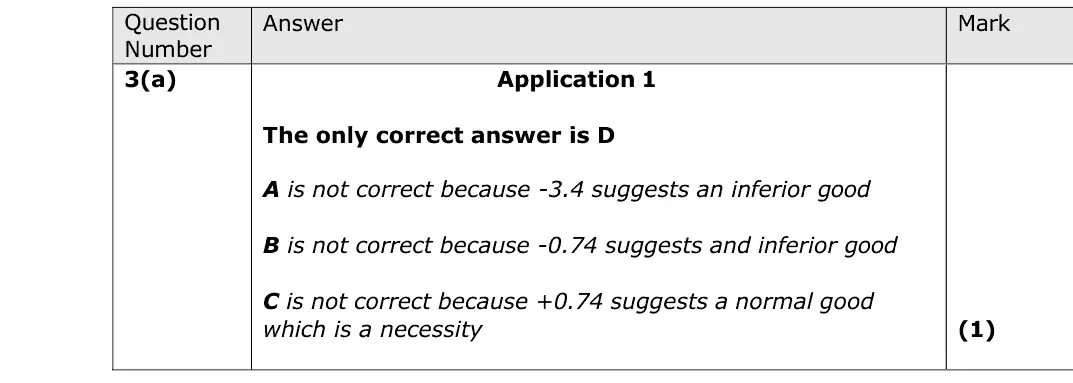
a luxury good has a positive income elasticity greater than 1, e.g. +3.40 (D)
negative values are inferior goods, +0.74 is a normal necessity
Quantitative skills: QS 8 (make calculations of elasticity and interpret the result)
June 2023 · AS Paper 1 · Q4(b)1 markMultiple choice
Data and extracts for question 4
Answer
D
Mark scheme
Notes from the mark scheme and report
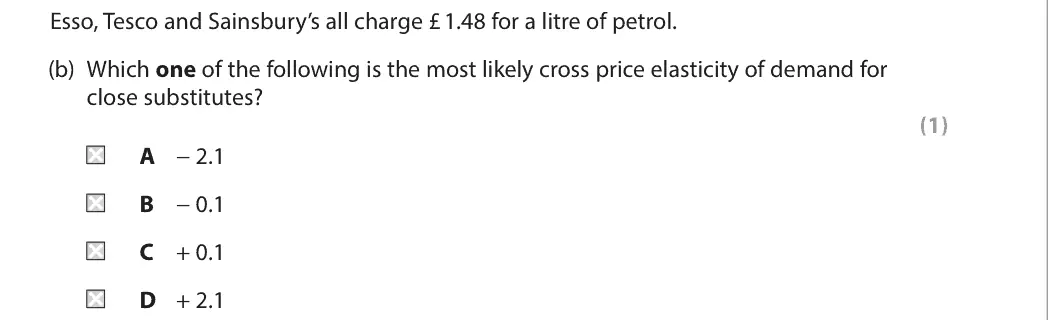
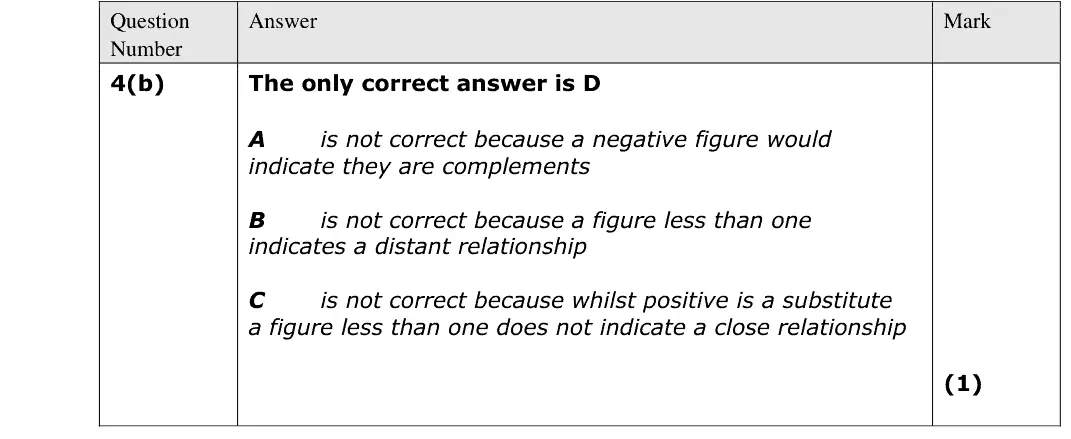
close substitutes (petrol at Esso, Tesco and Sainsbury's) have a high positive XED: +2.1 (D)
negative values mean complements
+0.1 is a weak substitute
Quantitative skills: QS 8 (make calculations of elasticity and interpret the result)
June 2023 · AS Paper 1 · Q6(a)5 marksAO1=1, AO2=2, AO3=2Short answer
Data and extracts for question 6
Mark scheme
Examiner's comment
This question required candidates to consider the relationship between price elasticity of demand and total revenue. Candidates in the majority of answers did understand that price increasing with a good or service is price inelastic would lead to higher revenue, although some did not explain this particularly well.
Notes from the mark scheme and report
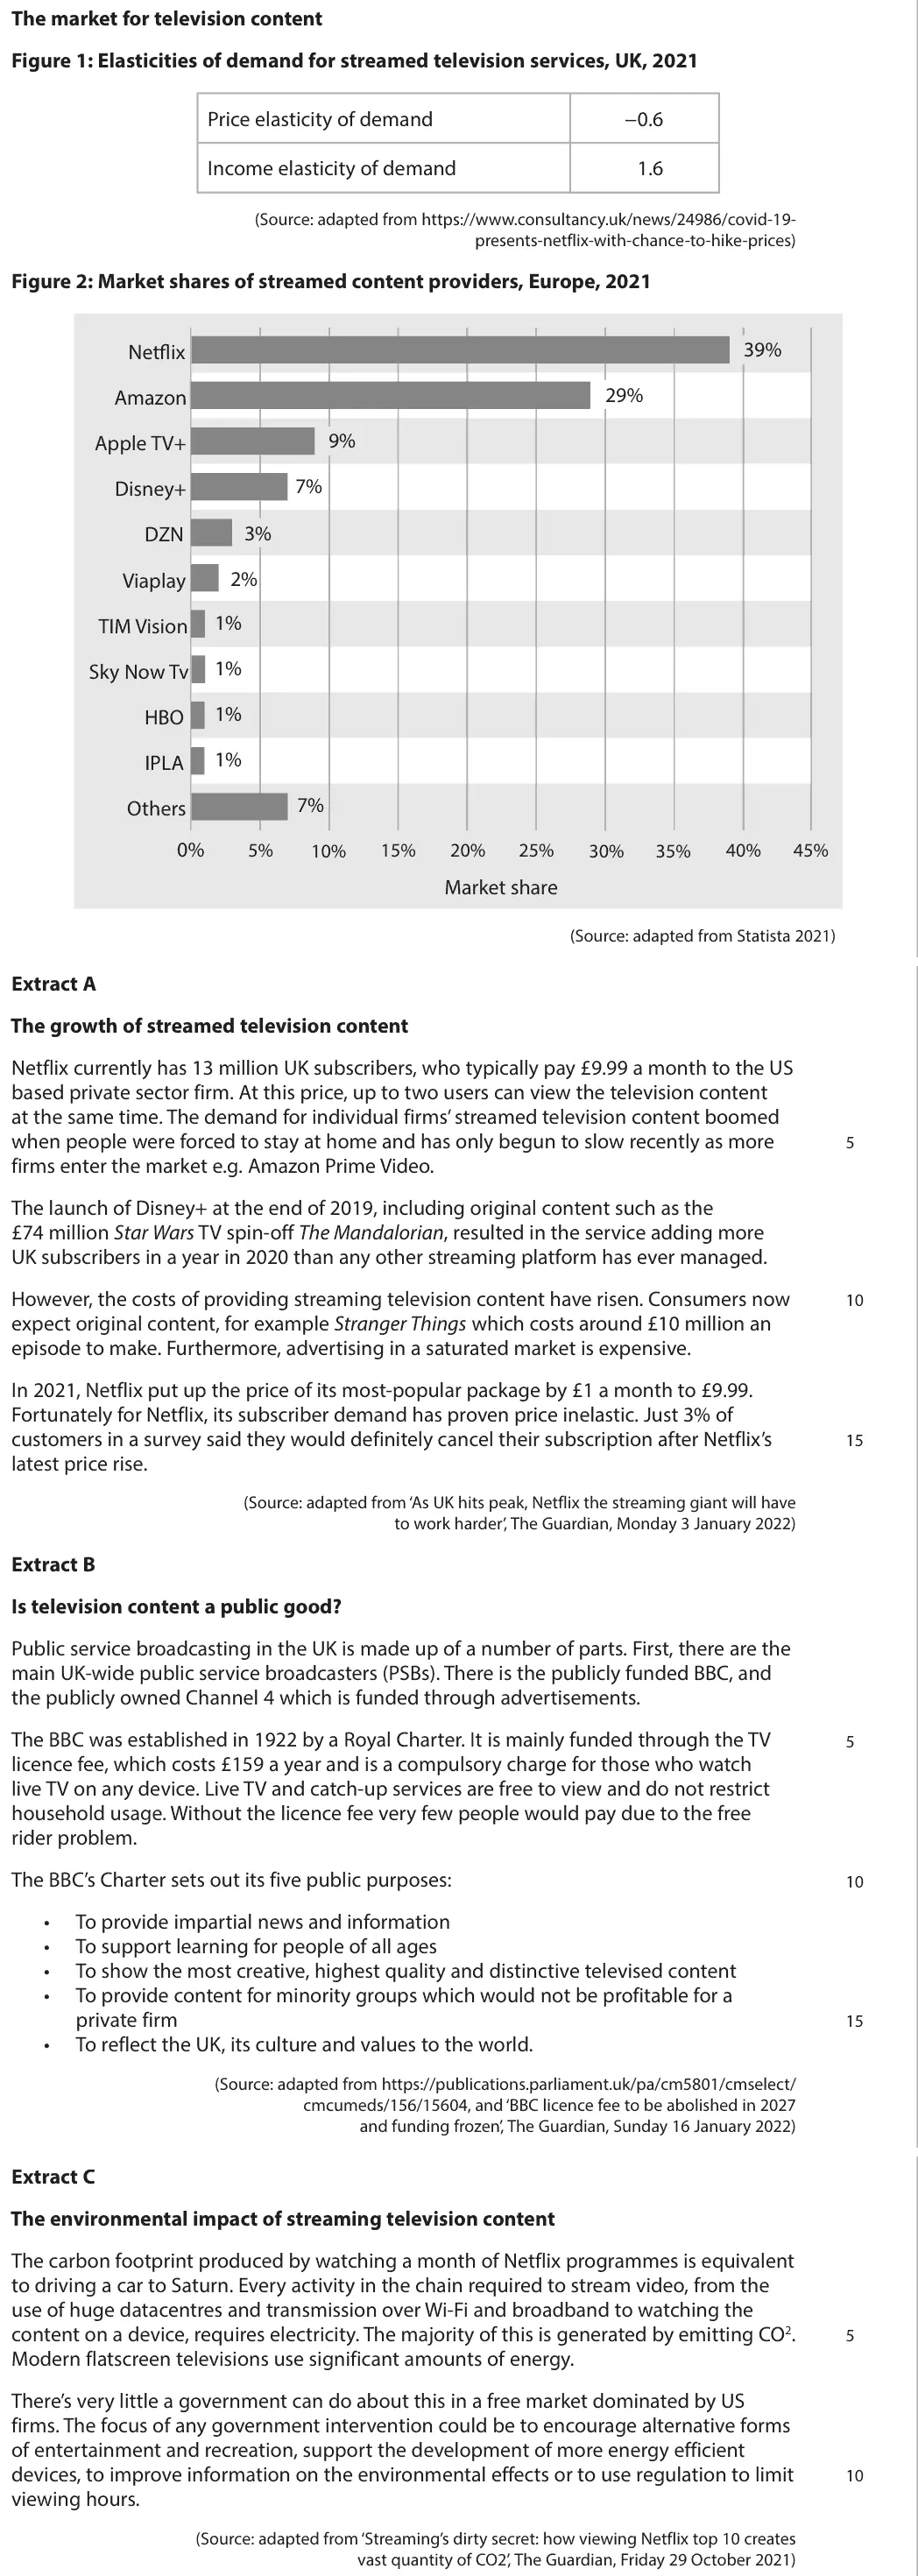
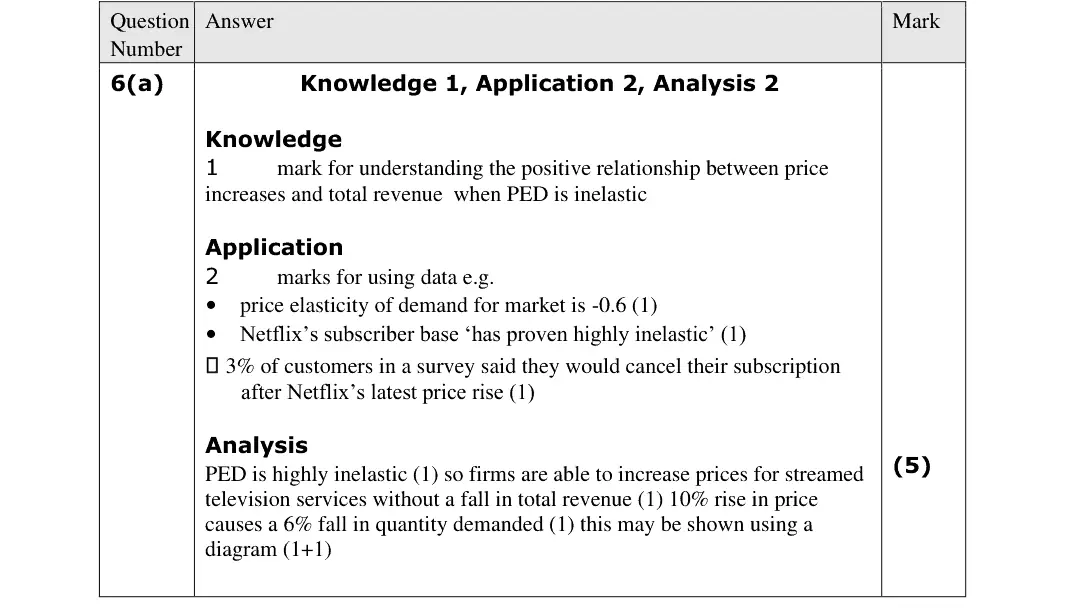
PED of -0.6 is inelastic, so a price rise increases total revenue (10% price rise, 6% fall in quantity)
quote Figure 1 or Extract A (only 3% would cancel after the £1 rise)
explain the relationship, not just state it
Quantitative skills: QS 8 (make calculations of elasticity and interpret the result); QS 9 (interpret, apply and analyse information in written, graphical tabular and numerical forms)
June 2023 · Paper 1 · Q6(c)8 marksAO1=2, AO2=2, AO3=2, AO4=28-mark response
Data and extracts for question 6
Mark scheme, including the levels grid and indicative content
Examiner's comment
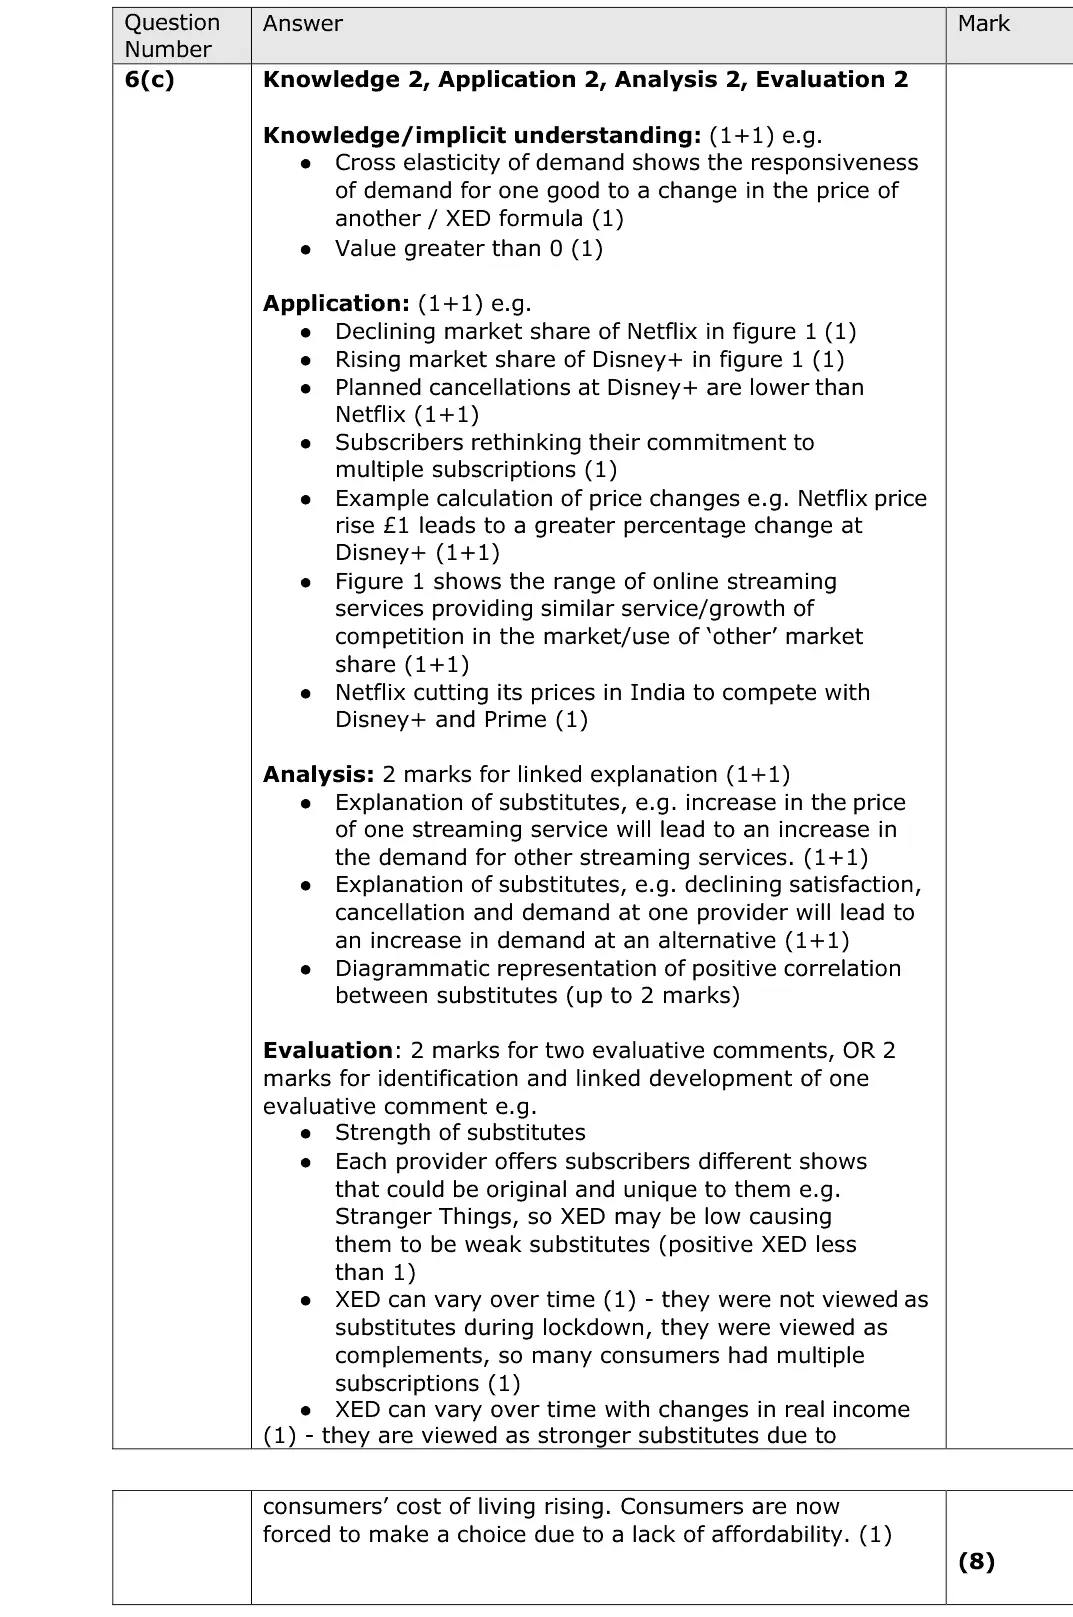
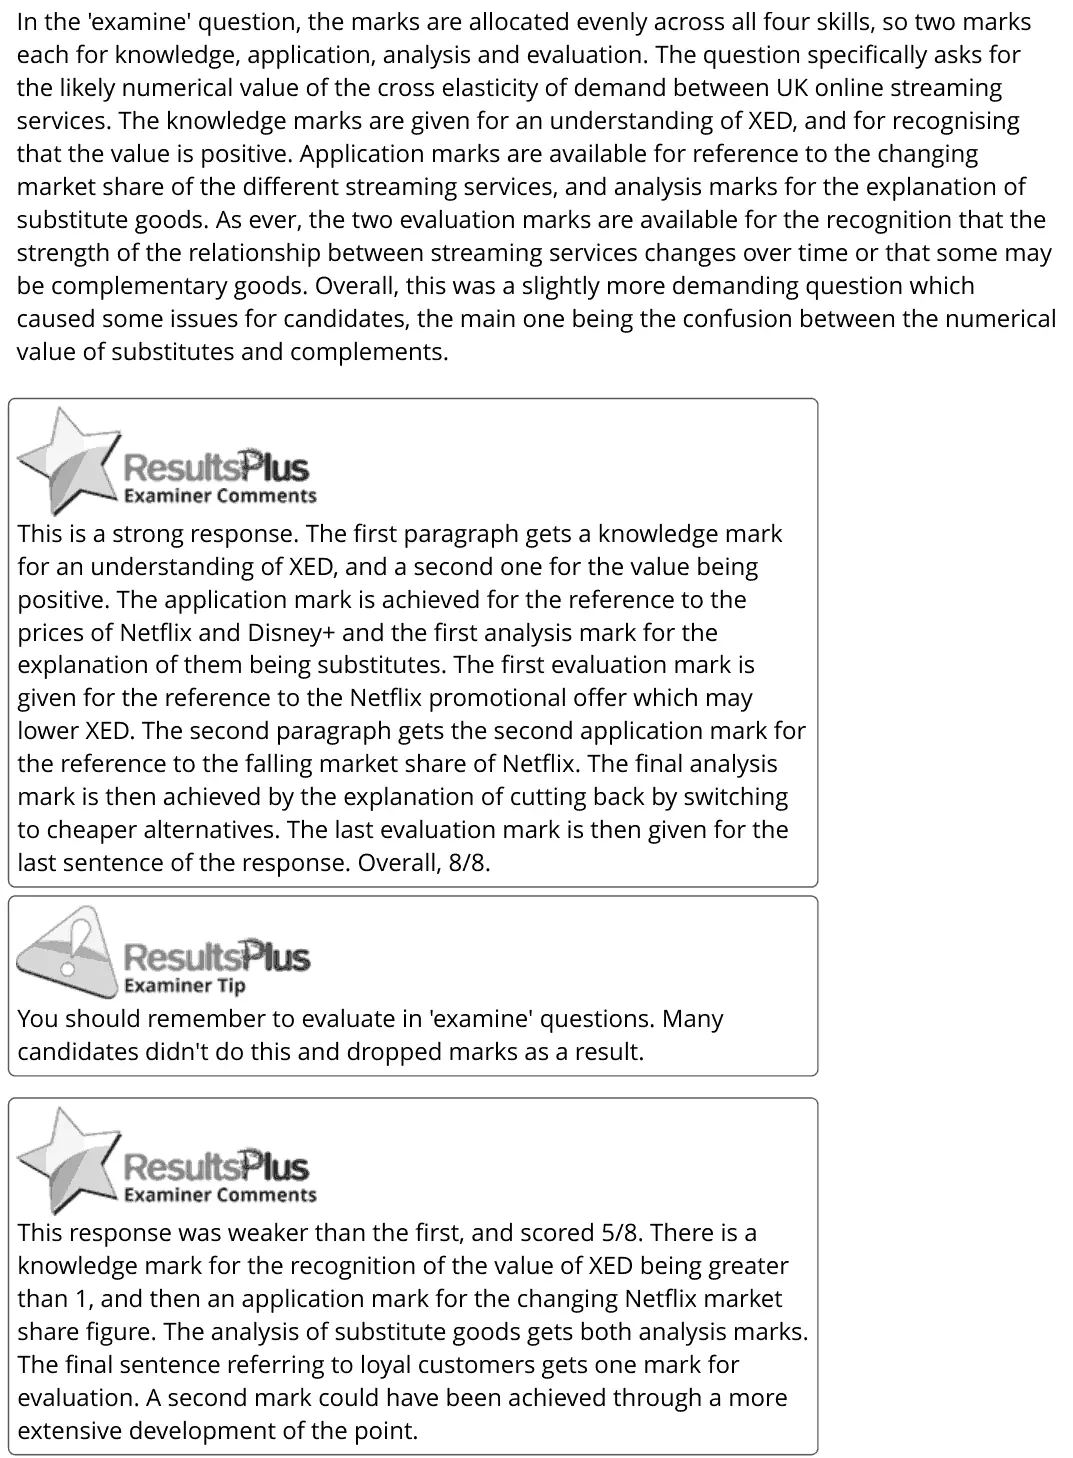
In the 'examine' question, the marks are allocated evenly across all four skills, so two marks each for knowledge, application, analysis and evaluation. The question specifically asks for the likely numerical value of the cross elasticity of demand between UK online streaming services. The knowledge marks are given for an understanding of XED, and for recognising that the value is positive. Application marks are available for reference to the changing market share of the different streaming services, and analysis marks for the explanation of substitute goods. As ever, the two evaluation marks are available for the recognition that the strength of the relationship between streaming services changes over time or that some may be complementary goods. Overall, this was a slightly more demanding question which caused some issues for candidates, the main one being the confusion between the numerical value of substitutes and complements. This is a strong response. The first paragraph gets a knowledge mark for an understanding of XED, and a second one for the value being positive. The application mark is achieved for the reference to the prices of Netflix and Disney+ and the first analysis mark for the explanation of them being substitutes. The first evaluation mark is given for the reference to the Netflix promotional offer which may lower XED. The second paragraph gets the second application mark for the reference to the falling market share of Netflix. The final analysis mark is then achieved by the explanation of cutting back by switching to cheaper alternatives. The last evaluation mark is then given for the last sentence of the response. Overall, 8/8. You should remember to evaluate in 'examine' questions. Many candidates didn't do this and dropped marks as a result. This response was weaker than the first, and scored 5/8. There is a knowledge mark for the recognition of the value of XED being greater than 1, and then an application mark for the changing Netflix market share figure. The analysis of substitute goods gets both analysis marks. The final sentence referring to loyal customers gets one mark for evaluation. A second mark could have been achieved through a more extensive development of the point.
Notes from the mark scheme and report
streaming services are substitutes so XED is positive
apply falling Netflix and rising Disney+ shares (Figure 1)
evaluate: weak substitutes (unique content) so XED below 1, varies over time, some households take several (complements)
report: candidates confused the signs for substitutes and complements
Quantitative skills: QS 8 (make calculations of elasticity and interpret the result); QS 9 (interpret, apply and analyse information in written, graphical tabular and numerical forms)
June 2023 · AS Paper 1 · Q6(d)4 marksAO1=2, AO2=2Short answer
Data and extracts for question 6
Mark scheme
Examiner's comment
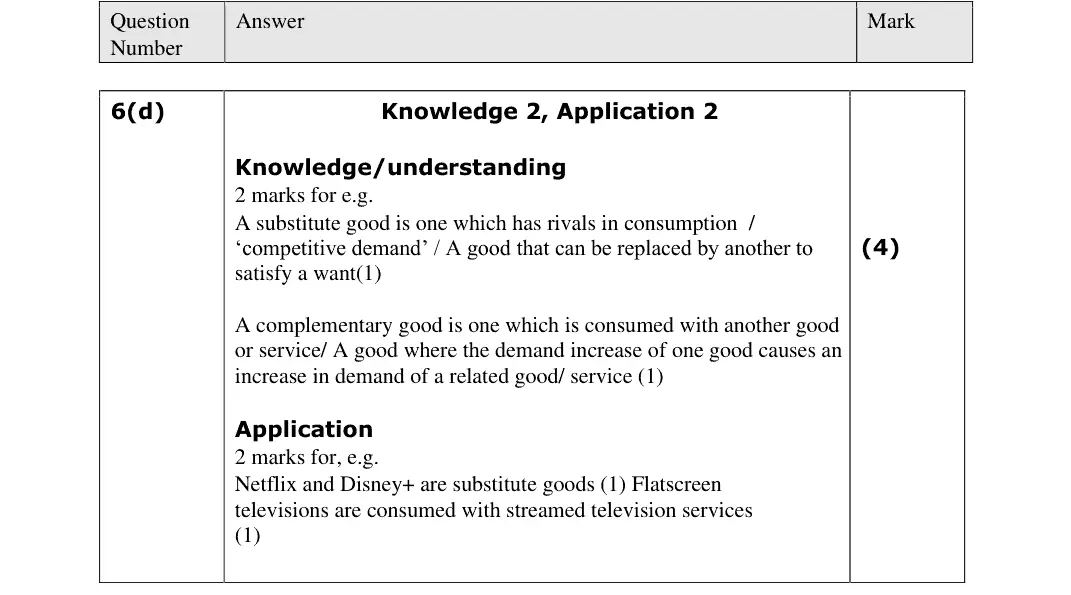
This was a four-mark questions focused upon substitutes and compliments and was answered very well in almost all candidates work. Examples were given and good definitions including reference to elasticity coefficients, highlighting excellent understanding of the topic.
Notes from the mark scheme and report
substitutes are in competitive demand (Netflix and Disney+)
complements are consumed together (flatscreen TVs and streamed services)
one data example for each
June 2022 · Paper 1 · Q2(a)2 marksAO2=2Calculation
Data and extracts for question 2
Mark scheme
Examiner's comment
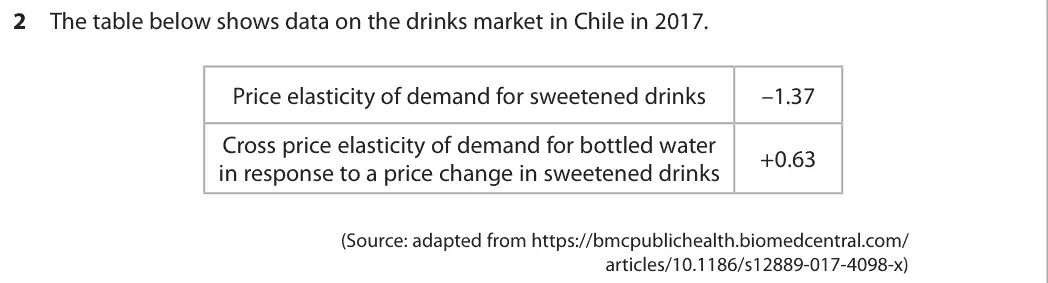
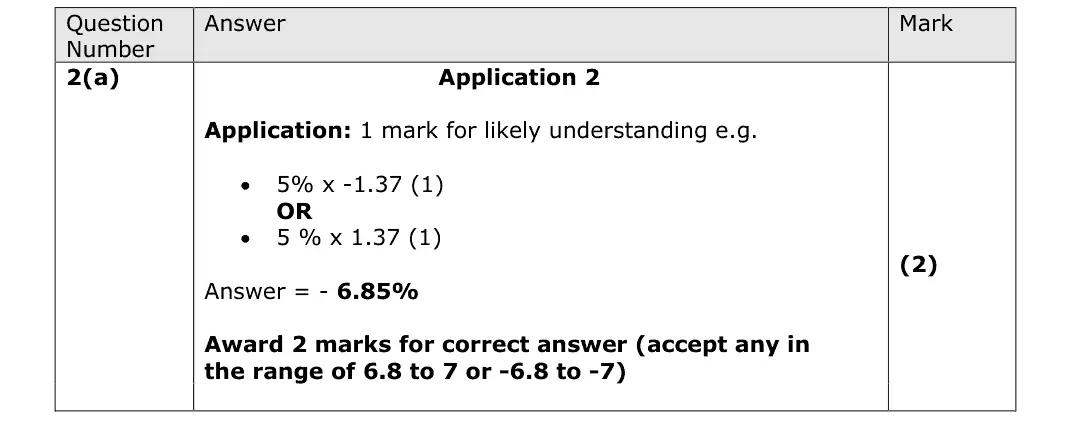
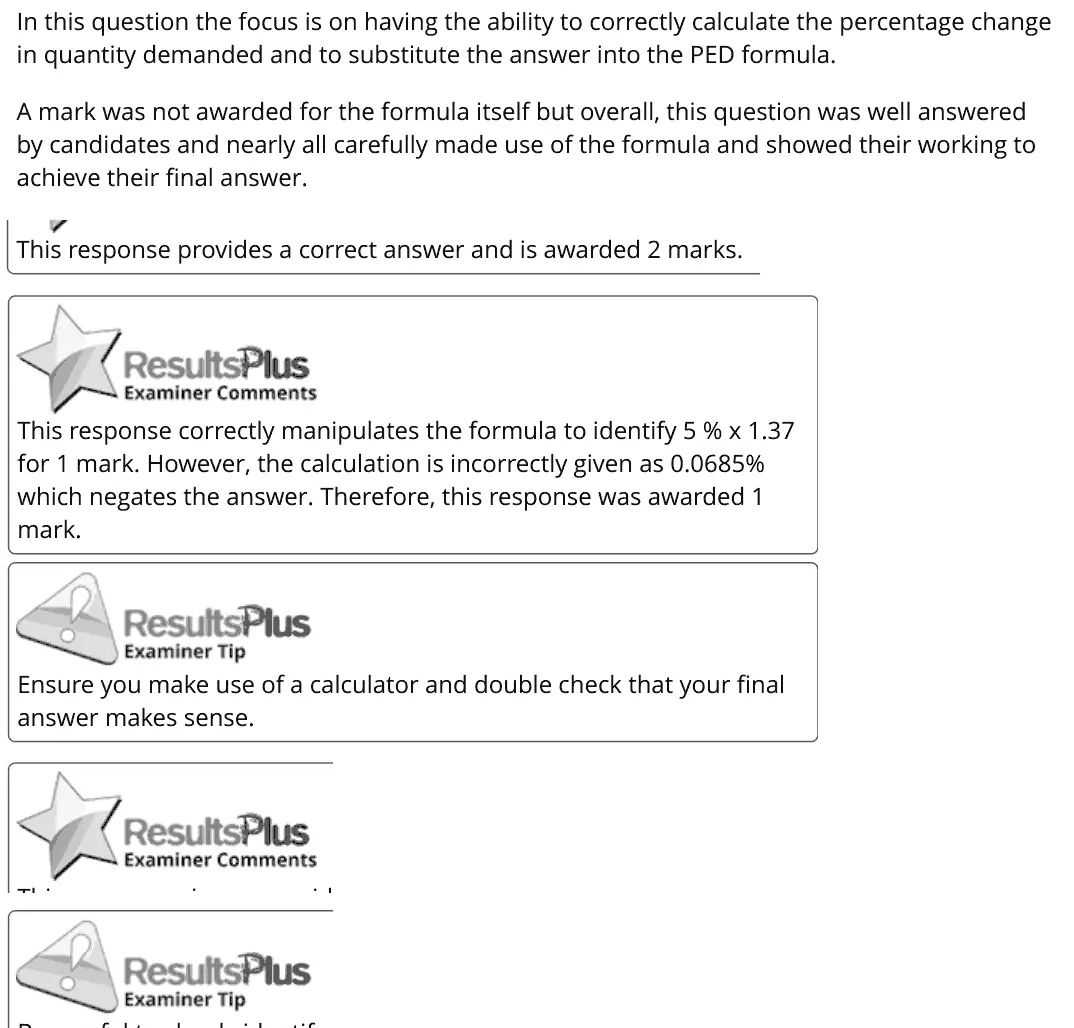
In this question the focus is on having the ability to correctly calculate the percentage change in quantity demanded and to substitute the answer into the PED formula. A mark was not awarded for the formula itself but overall, this question was well answered by candidates and nearly all carefully made use of the formula and showed their working to achieve their final answer. This response provides a correct answer and is awarded 2 marks. This response correctly manipulates the formula to identify 5 % x 1.37 for 1 mark. However, the calculation is incorrectly given as 0.0685% which negates the answer. Therefore, this response was awarded 1 mark. Ensure you make use of a calculator and double check that your final answer makes sense.
Notes from the mark scheme and report
%change in Qd = PED x %change in P = -1.37 x 5 = -6.85%
report: some slipped to 0.0685%
Quantitative skills: QS 2 (calculate, use and understand percentages, percentage changes and percentage point changes); QS 8 (make calculations of elasticity and interpret the result)
June 2022 · Paper 1 · Q2(b)2 marksAO2=2Calculation
Data and extracts for question 2
Mark scheme
Examiner's comment
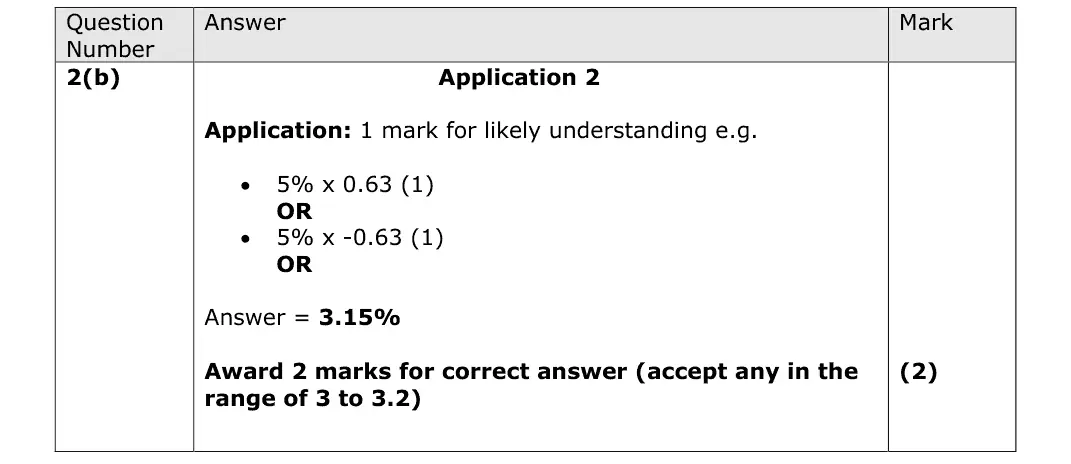
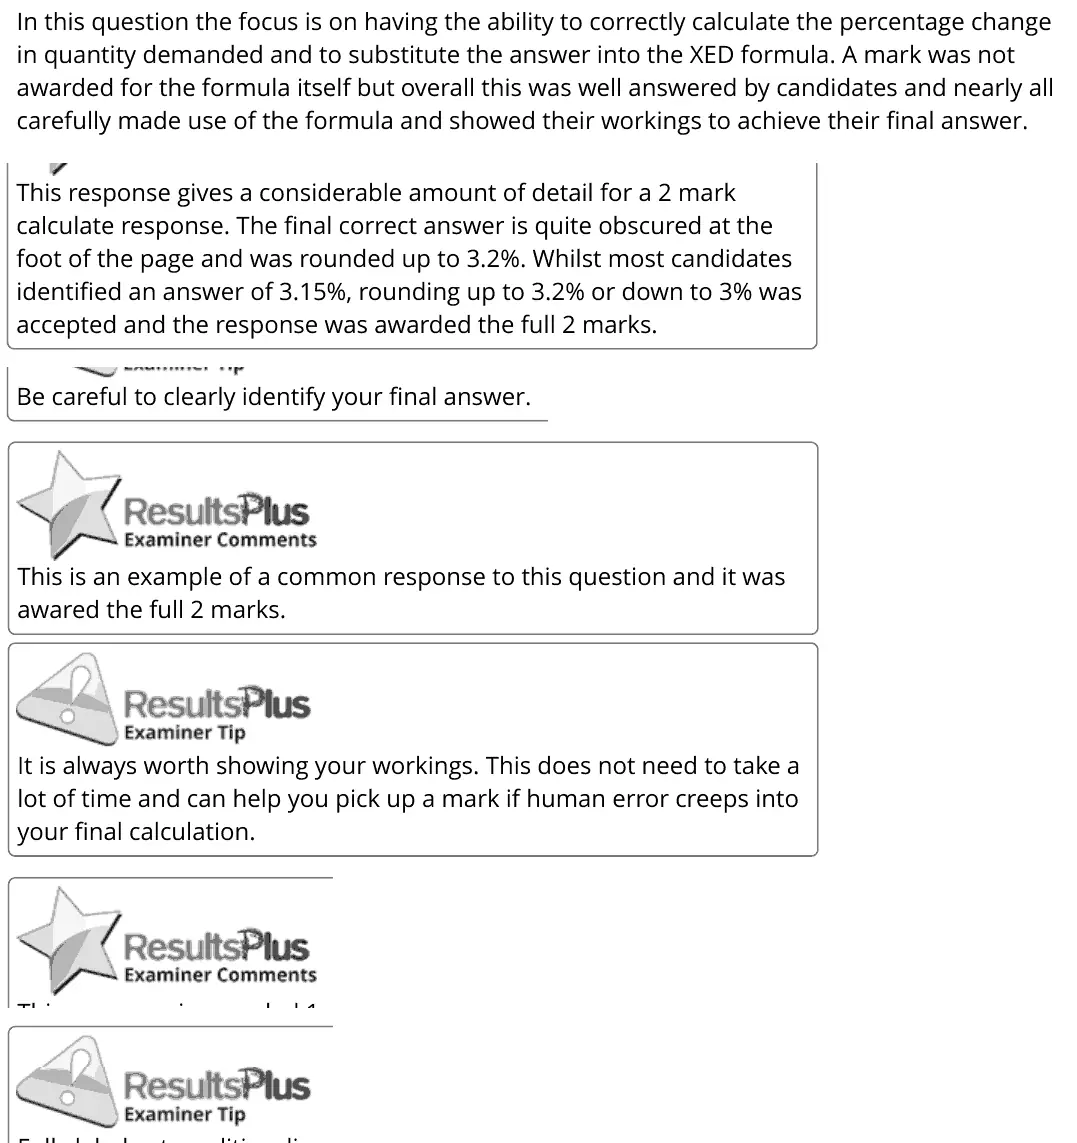
In this question the focus is on having the ability to correctly calculate the percentage change in quantity demanded and to substitute the answer into the XED formula. A mark was not awarded for the formula itself but overall this was well answered by candidates and nearly all carefully made use of the formula and showed their workings to achieve their final answer. This response gives a considerable amount of detail for a 2 mark calculate response. The final correct answer is quite obscured at the foot of the page and was rounded up to 3.2%. Whilst most candidates identified an answer of 3.15%, rounding up to 3.2% or down to 3% was accepted and the response was awarded the full 2 marks. Be careful to clearly identify your final answer. This is an example of a common response to this question and it was awared the full 2 marks. It is always worth showing your workings. This does not need to take a lot of time and can help you pick up a mark if human error creeps into your final calculation.
Notes from the mark scheme and report
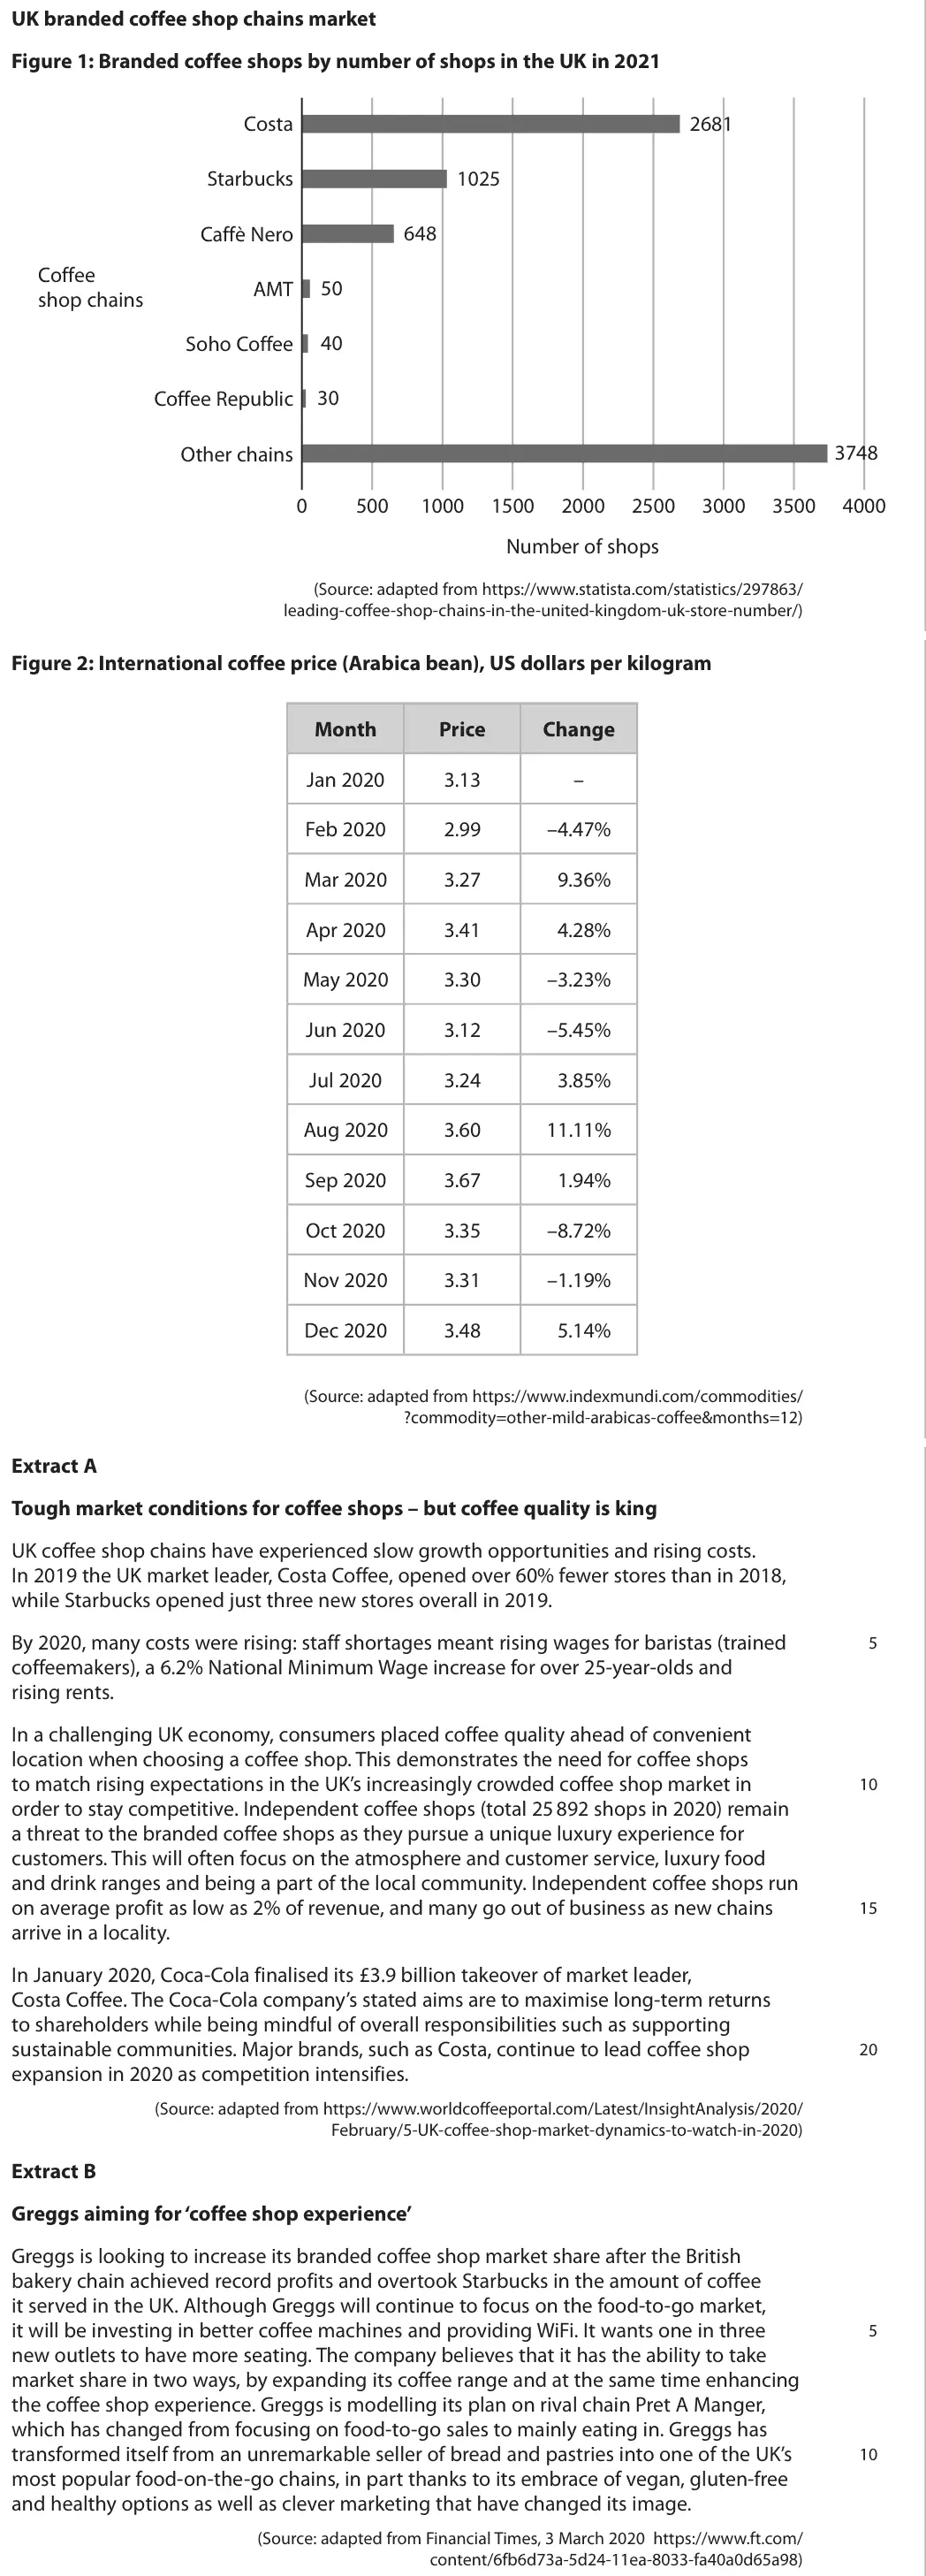
%change in Qd of water = XED x %change in price of sweetened drinks = 0.63 x 5 = +3.15%
Quantitative skills: QS 2 (calculate, use and understand percentages, percentage changes and percentage point changes); QS 8 (make calculations of elasticity and interpret the result)
June 2022 · Paper 1 · Q2(c)1 markAO1=1Multiple choice
Data and extracts for question 2
Answer
D
Mark scheme
Notes from the mark scheme and report
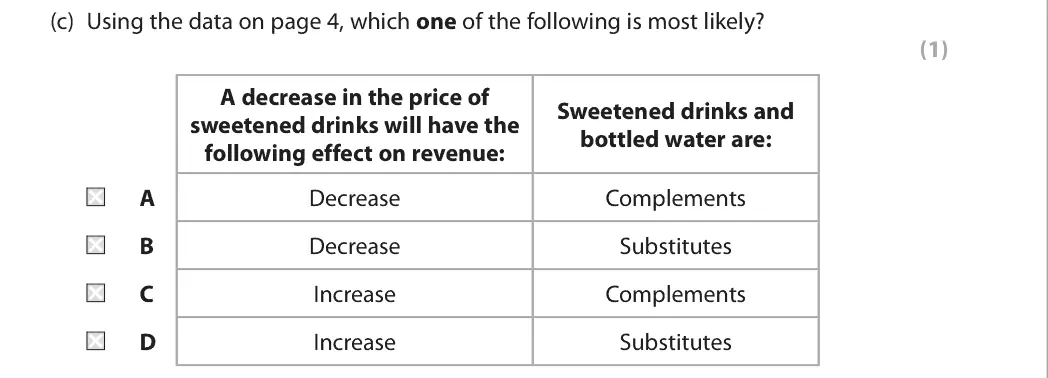
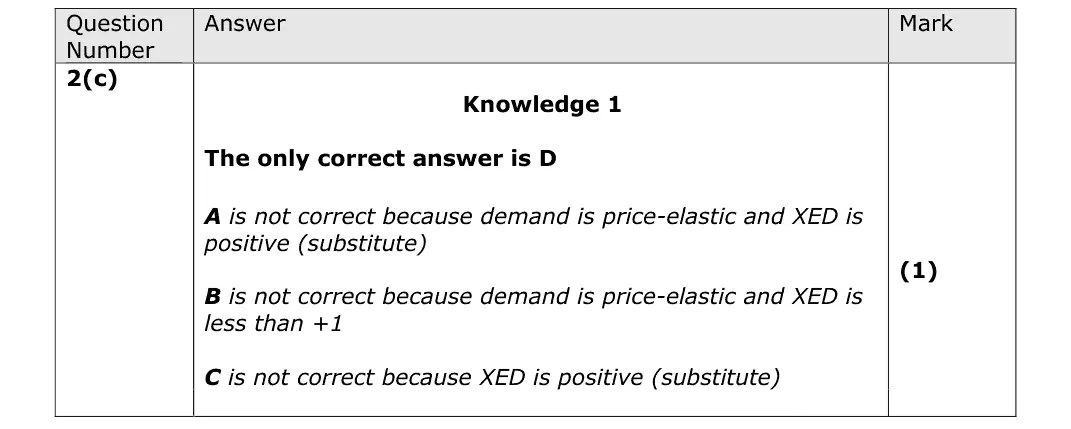
PED -1.37 is price elastic so a price cut raises total revenue, and XED +0.63 means substitutes (D)
A and C wrongly treat the goods as complements
B wrongly says revenue falls
Quantitative skills: QS 8 (make calculations of elasticity and interpret the result)
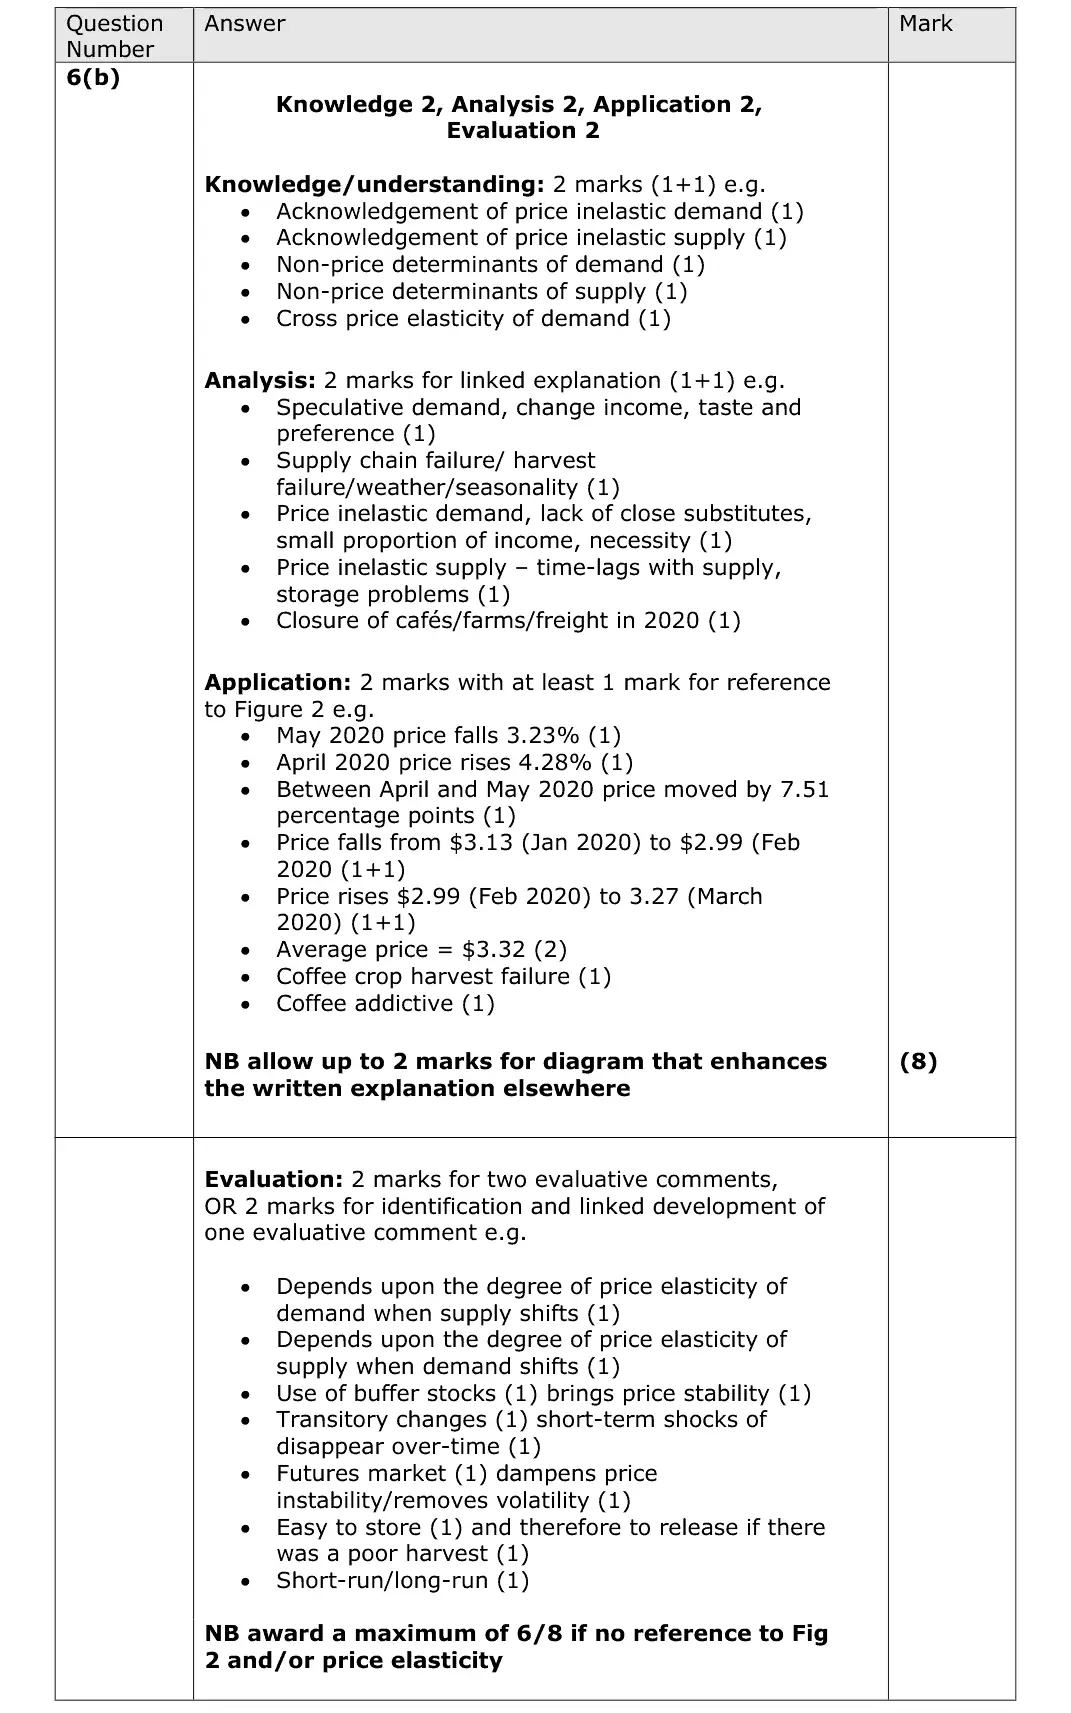
June 2022 · Paper 1 · Q6(b)8 marksAO1=2, AO2=2, AO3=2, AO4=28-mark responseHard
Data and extracts for question 6
Mark scheme, including the levels grid and indicative content
Examiner's comment
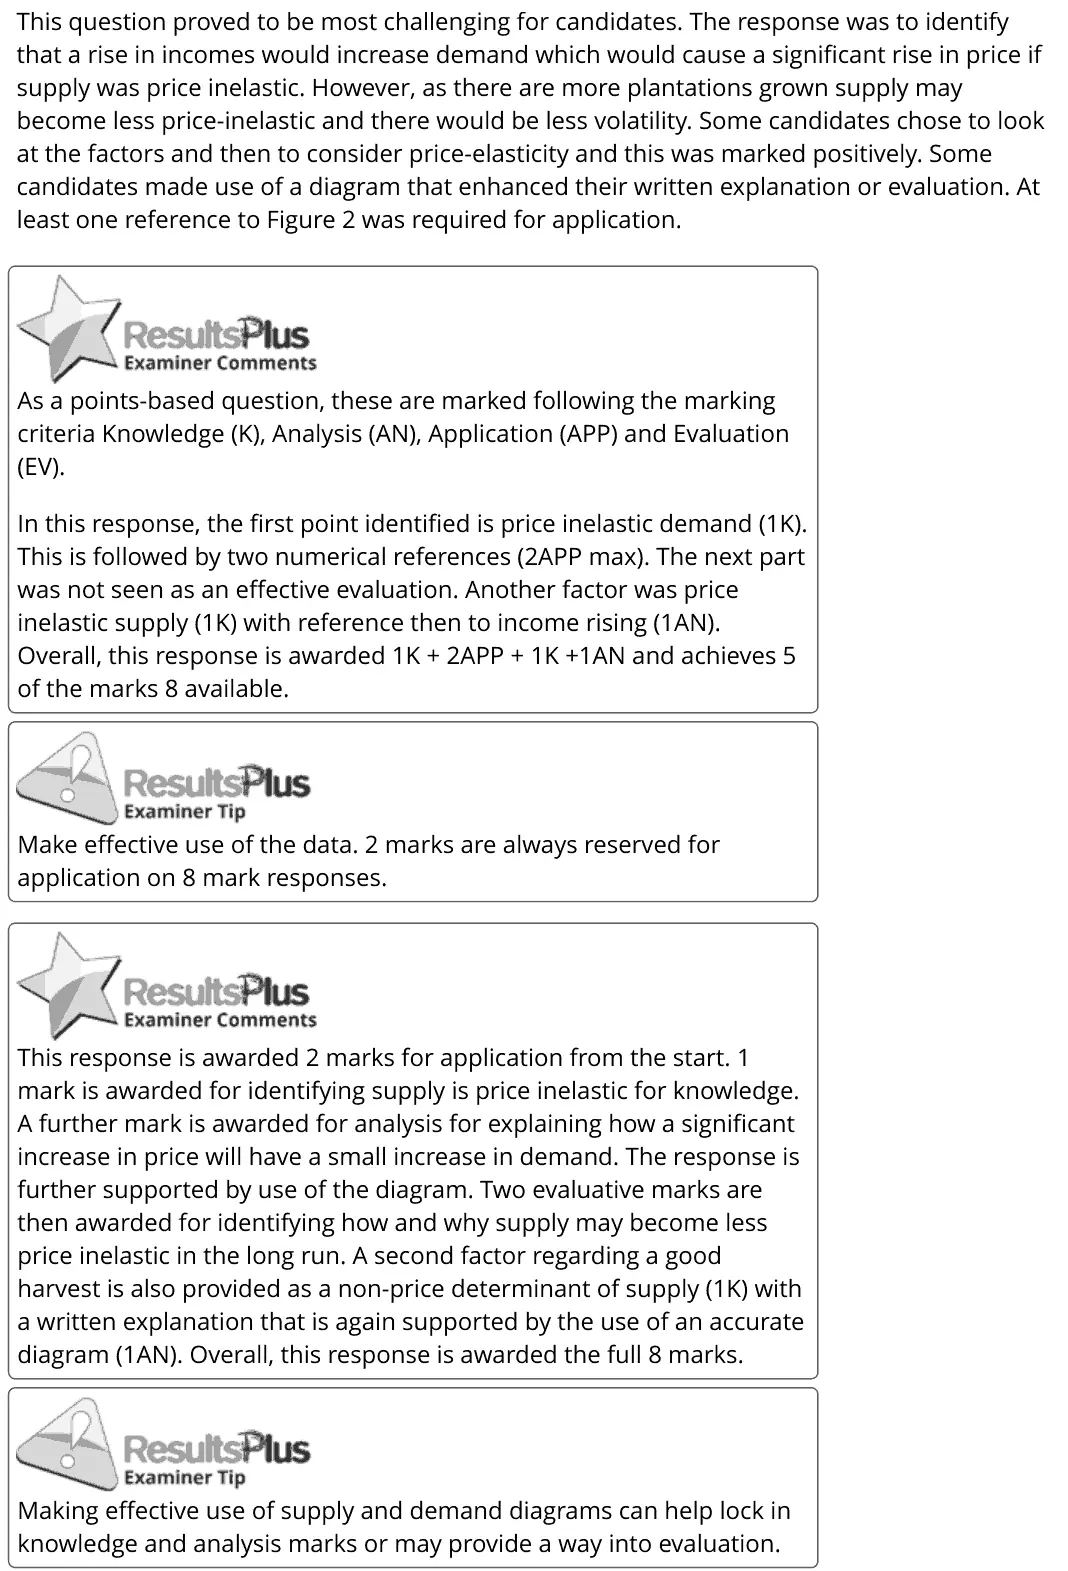
This question proved to be most challenging for candidates. The response was to identify that a rise in incomes would increase demand which would cause a significant rise in price if supply was price inelastic. However, as there are more plantations grown supply may become less price-inelastic and there would be less volatility. Some candidates chose to look at the factors and then to consider price-elasticity and this was marked positively. Some candidates made use of a diagram that enhanced their written explanation or evaluation. At least one reference to Figure 2 was required for application. As a points-based question, these are marked following the marking criteria Knowledge (K), Analysis (AN), Application (APP) and Evaluation (EV). In this response, the first point identified is price inelastic demand (1K). This is followed by two numerical references (2APP max). The next part was not seen as an effective evaluation. Another factor was price inelastic supply (1K) with reference then to income rising (1AN). Overall, this response is awarded 1K + 2APP + 1K +1AN and achieves 5 of the marks 8 available. Make effective use of the data. 2 marks are always reserved for application on 8 mark responses. This response is awarded 2 marks for application from the start. 1 mark is awarded for identifying supply is price inelastic for knowledge. A further mark is awarded for analysis for explaining how a significant increase in price will have a small increase in demand. The response is further supported by use of the diagram. Two evaluative marks are then awarded for identifying how and why supply may become less price inelastic in the long run. A second factor regarding a good harvest is also provided as a non-price determinant of supply (1K) with a written explanation that is again supported by the use of an accurate diagram (1AN). Overall, this response is awarded the full 8 marks. Making effective use of supply and demand diagrams can help lock in knowledge and analysis marks or may provide a way into evaluation.
Notes from the mark scheme and report
price inelastic demand and supply make shifts cause large price swings
report: "This question proved to be most challenging for candidates"
Quantitative skills: QS 2 (calculate, use and understand percentages, percentage changes and percentage point changes); QS 9 (interpret, apply and analyse information in written, graphical tabular and numerical forms)
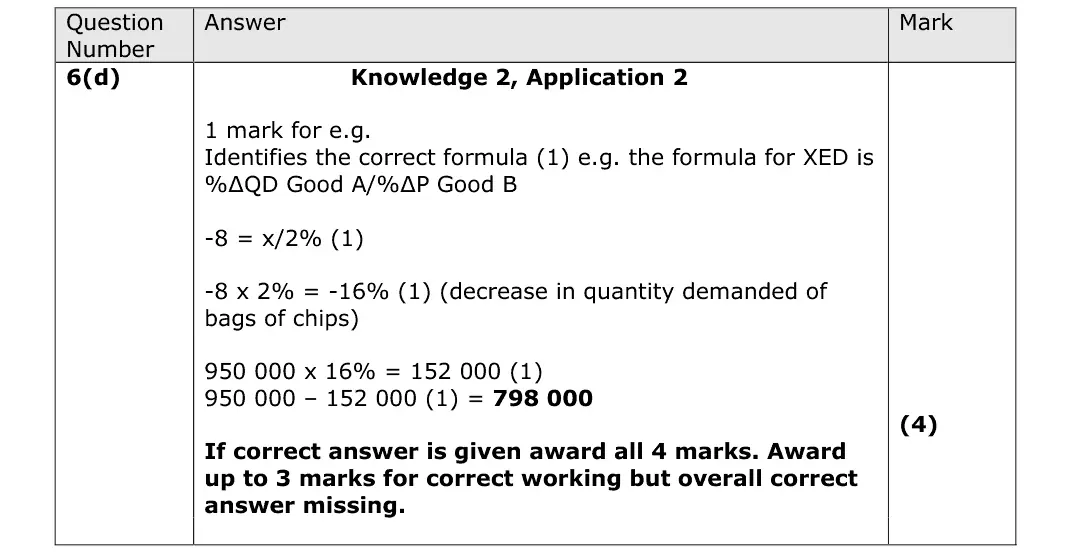
June 2022 · AS Paper 1 · Q6(d)4 marksAO1=2, AO2=2Calculation
Data and extracts for question 6
Mark scheme
Examiner's comment
This question was a four-mark calculation based on the concept of cross elasticity of demand. A majority of candidates were able to complete this successfully, which is a pleasing indicator of the improving numeracy of the cohort each year.
Notes from the mark scheme and report
XED = -8: %change in Qd chips = -8 x 2% = -16%
950 000 x 0.16 = 152 000
new Qd = 798 000 bags
up to 3 marks for working
Quantitative skills: QS 2 (calculate, use and understand percentages, percentage changes and percentage point changes); QS 8 (make calculations of elasticity and interpret the result)
June 2022 · Paper 3 · Q1(b)8 marksAO1=2, AO2=2, AO3=2, AO4=28-mark responseHard
Data and extracts for question 1
Mark scheme, including the levels grid and indicative content
Examiner's comment
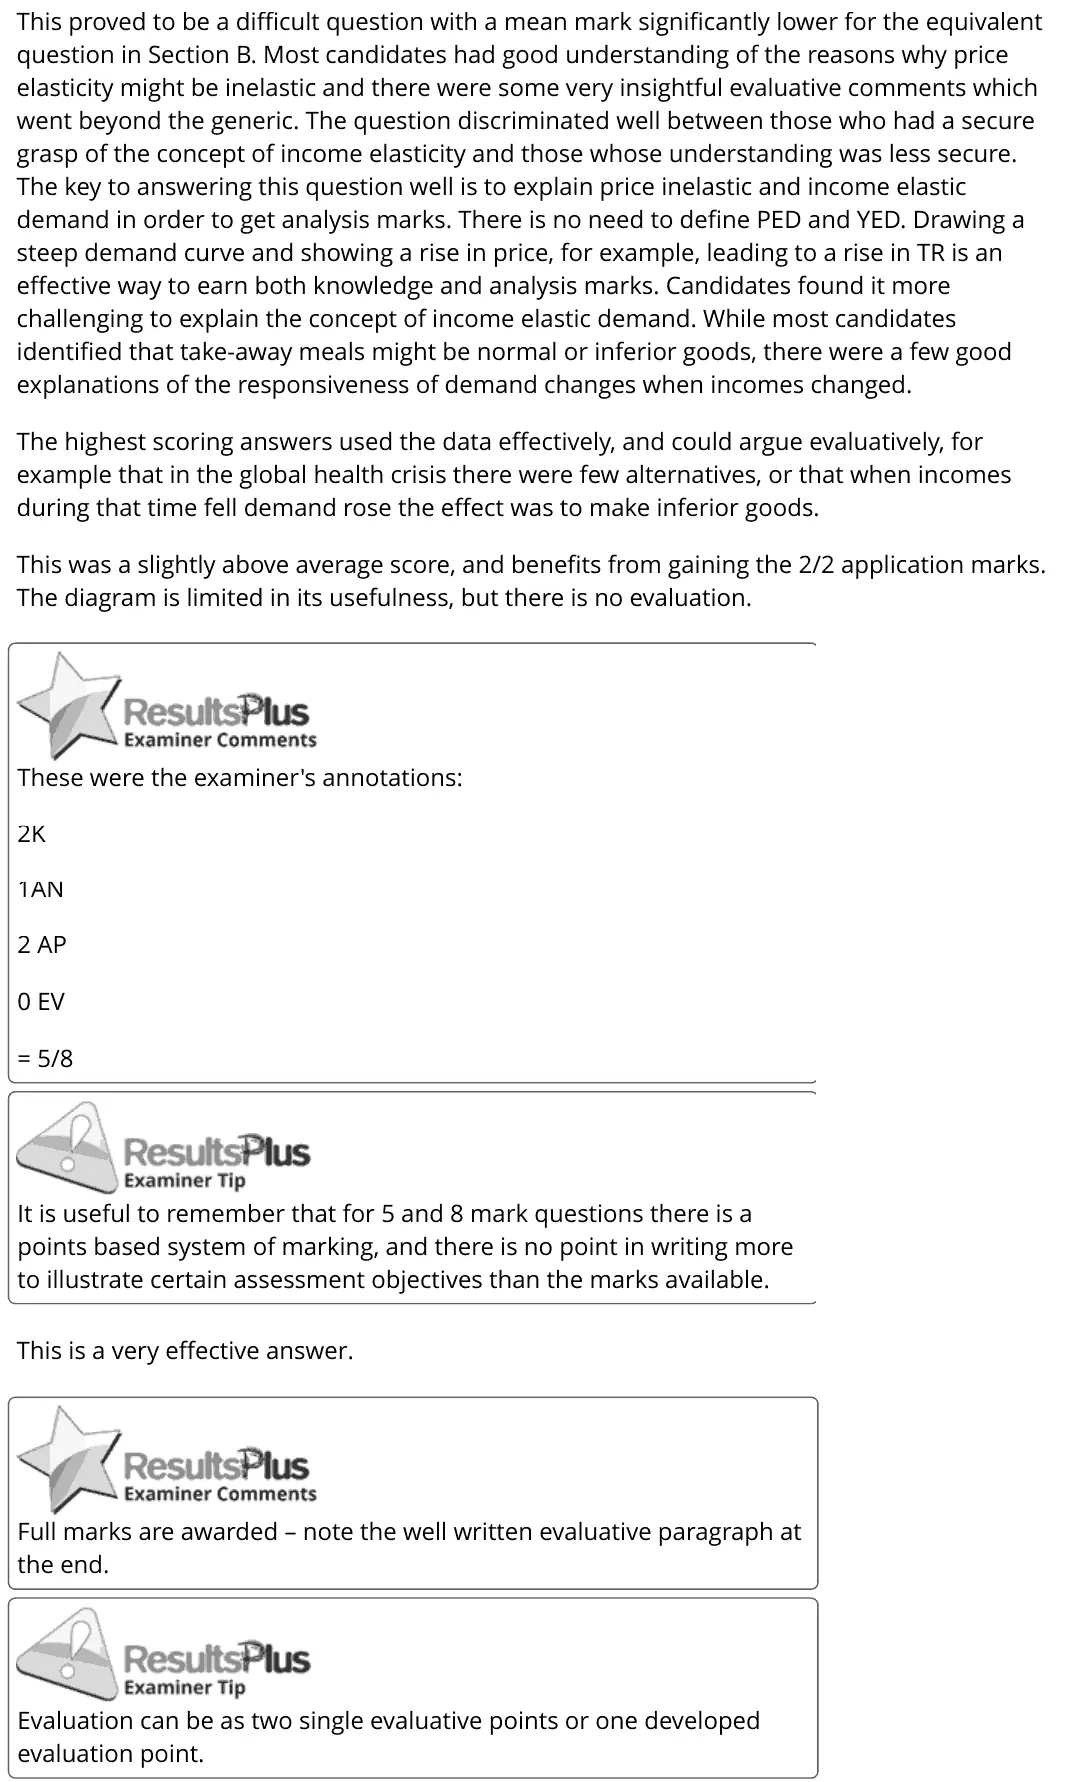
This proved to be a difficult question with a mean mark significantly lower for the equivalent question in Section B. Most candidates had good understanding of the reasons why price elasticity might be inelastic and there were some very insightful evaluative comments which went beyond the generic. The question discriminated well between those who had a secure grasp of the concept of income elasticity and those whose understanding was less secure. The key to answering this question well is to explain price inelastic and income elastic demand in order to get analysis marks. There is no need to define PED and YED. Drawing a steep demand curve and showing a rise in price, for example, leading to a rise in TR is an effective way to earn both knowledge and analysis marks. Candidates found it more challenging to explain the concept of income elastic demand. While most candidates identified that take-away meals might be normal or inferior goods, there were a few good explanations of the responsiveness of demand changes when incomes changed. The highest scoring answers used the data effectively, and could argue evaluatively, for example that in the global health crisis there were few alternatives, or that when incomes during that time fell demand rose the effect was to make inferior goods. This was a slightly above average score, and benefits from gaining the 2/2 application marks. The diagram is limited in its usefulness, but there is no evaluation. These were the examiner's annotations: 2K 1AN 2 AP 0 EV = 5/8 It is useful to remember that for 5 and 8 mark questions there is a points based system of marking, and there is no point in writing more to illustrate certain assessment objectives than the marks available. This is a very effective answer. Full marks are awarded – note the well written evaluative paragraph at the end. Evaluation can be as two single evaluative points or one developed evaluation point.
Notes from the mark scheme and report
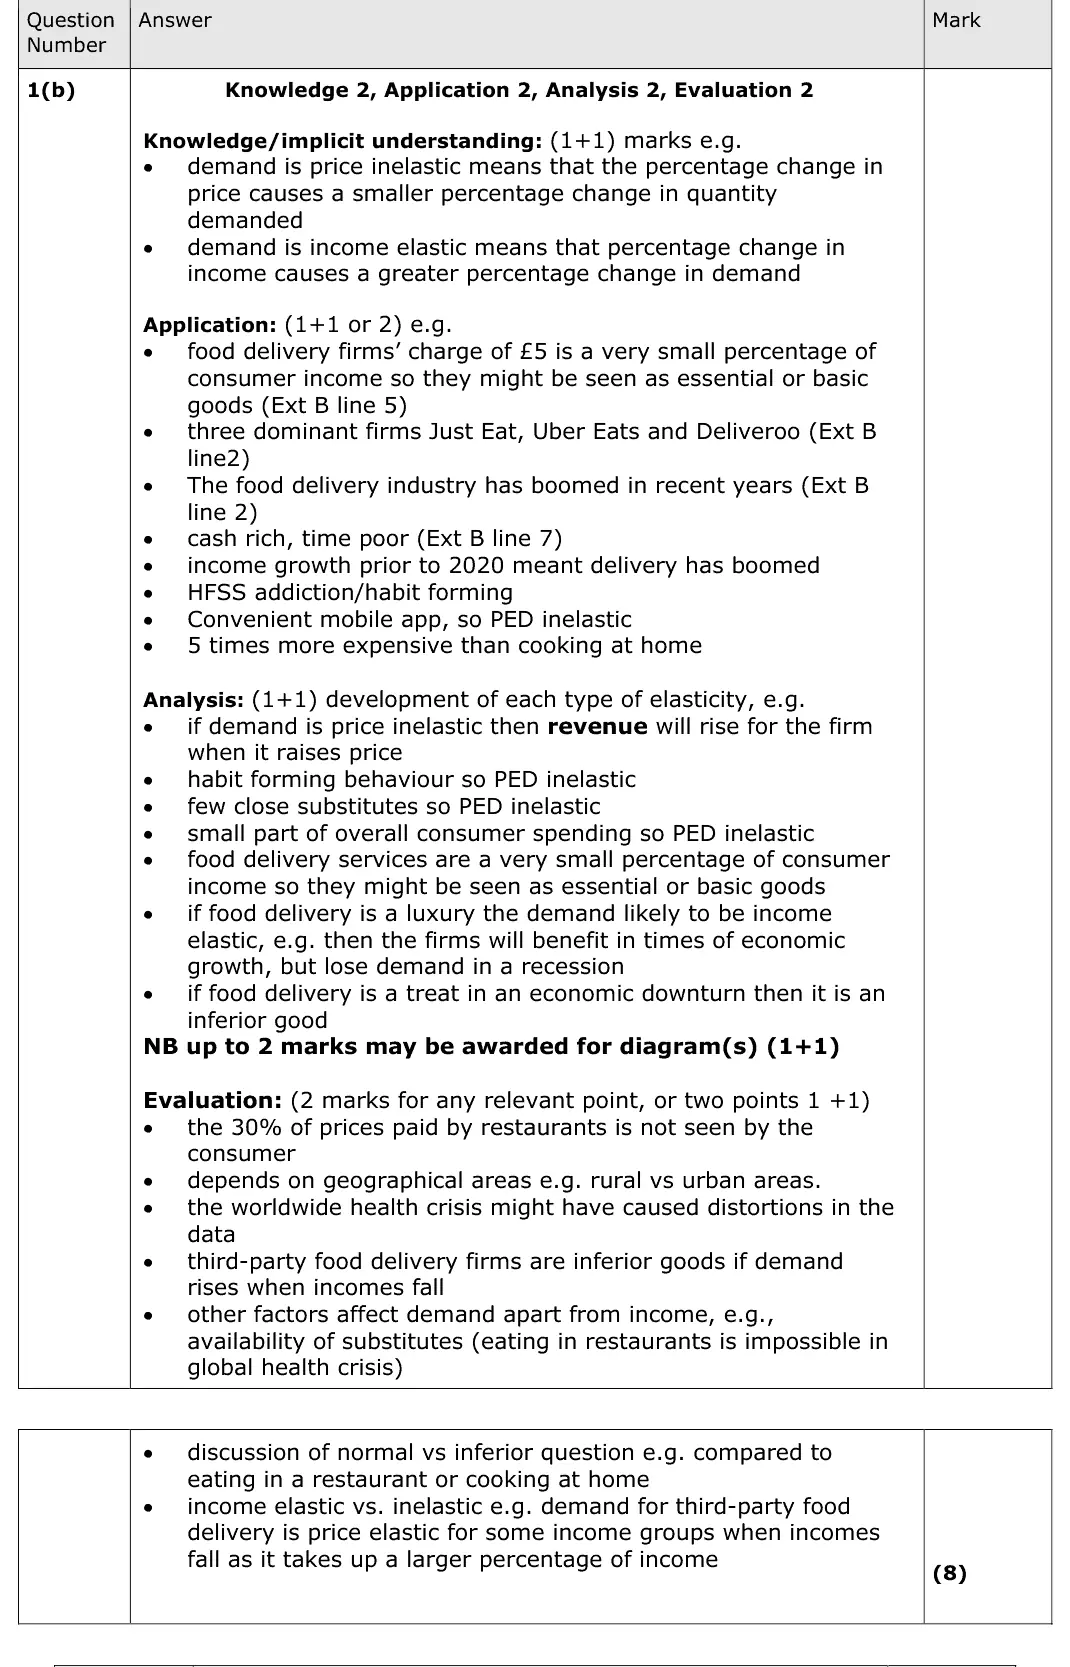
explain both: few close substitutes, habit and small share of income make PED inelastic (steep demand curve, TR rises with price)
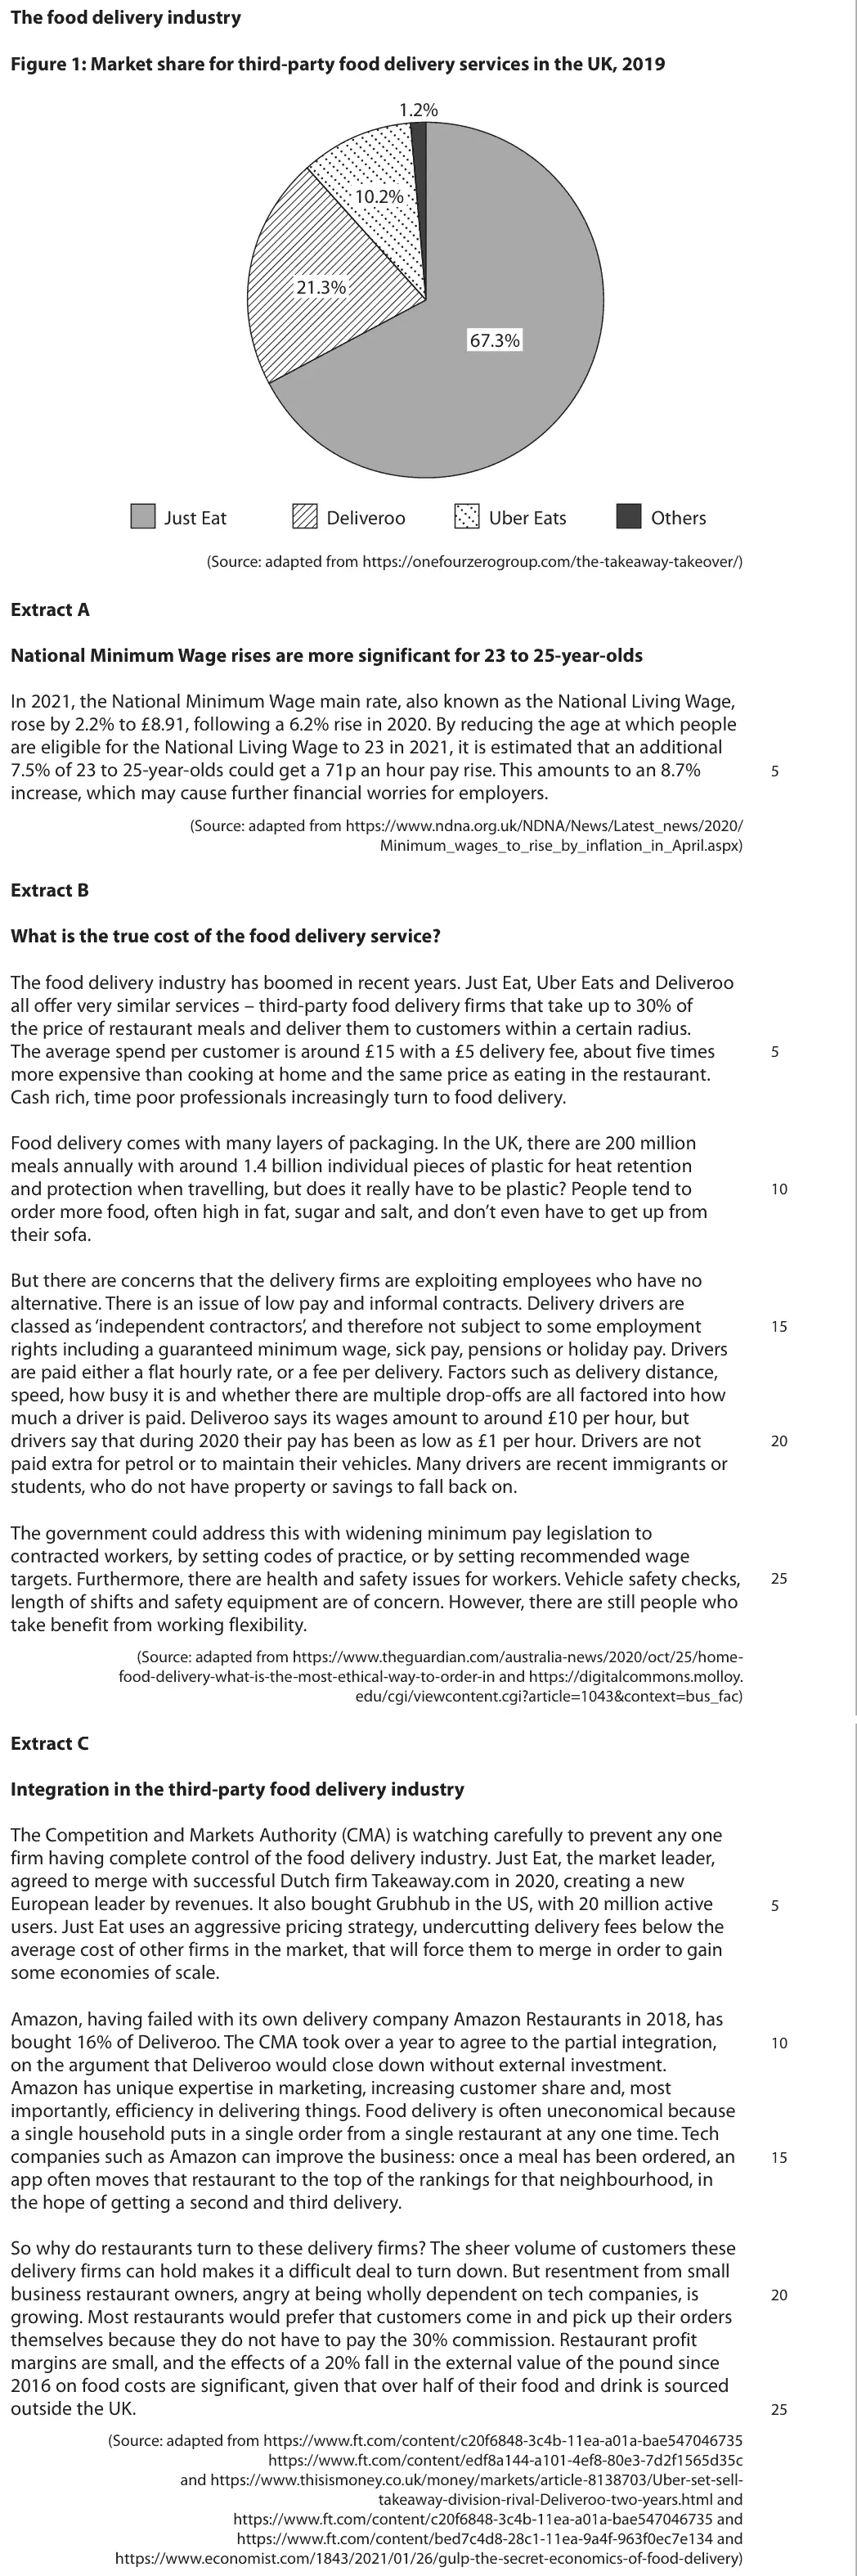
'cash rich, time poor' and the delivery boom suggest income elastic luxury
no need to define PED and YED
report: "This proved to be a difficult question", income elasticity poorly explained
Quantitative skills: QS 8 (make calculations of elasticity and interpret the result); QS 9 (interpret, apply and analyse information in written, graphical tabular and numerical forms)
November 2021 · Paper 3 · Q1(b)8 marksAO1=2, AO2=2, AO3=2, AO4=28-mark response
Data and extracts for question 1
Mark scheme, including the levels grid and indicative content
Examiner's comment
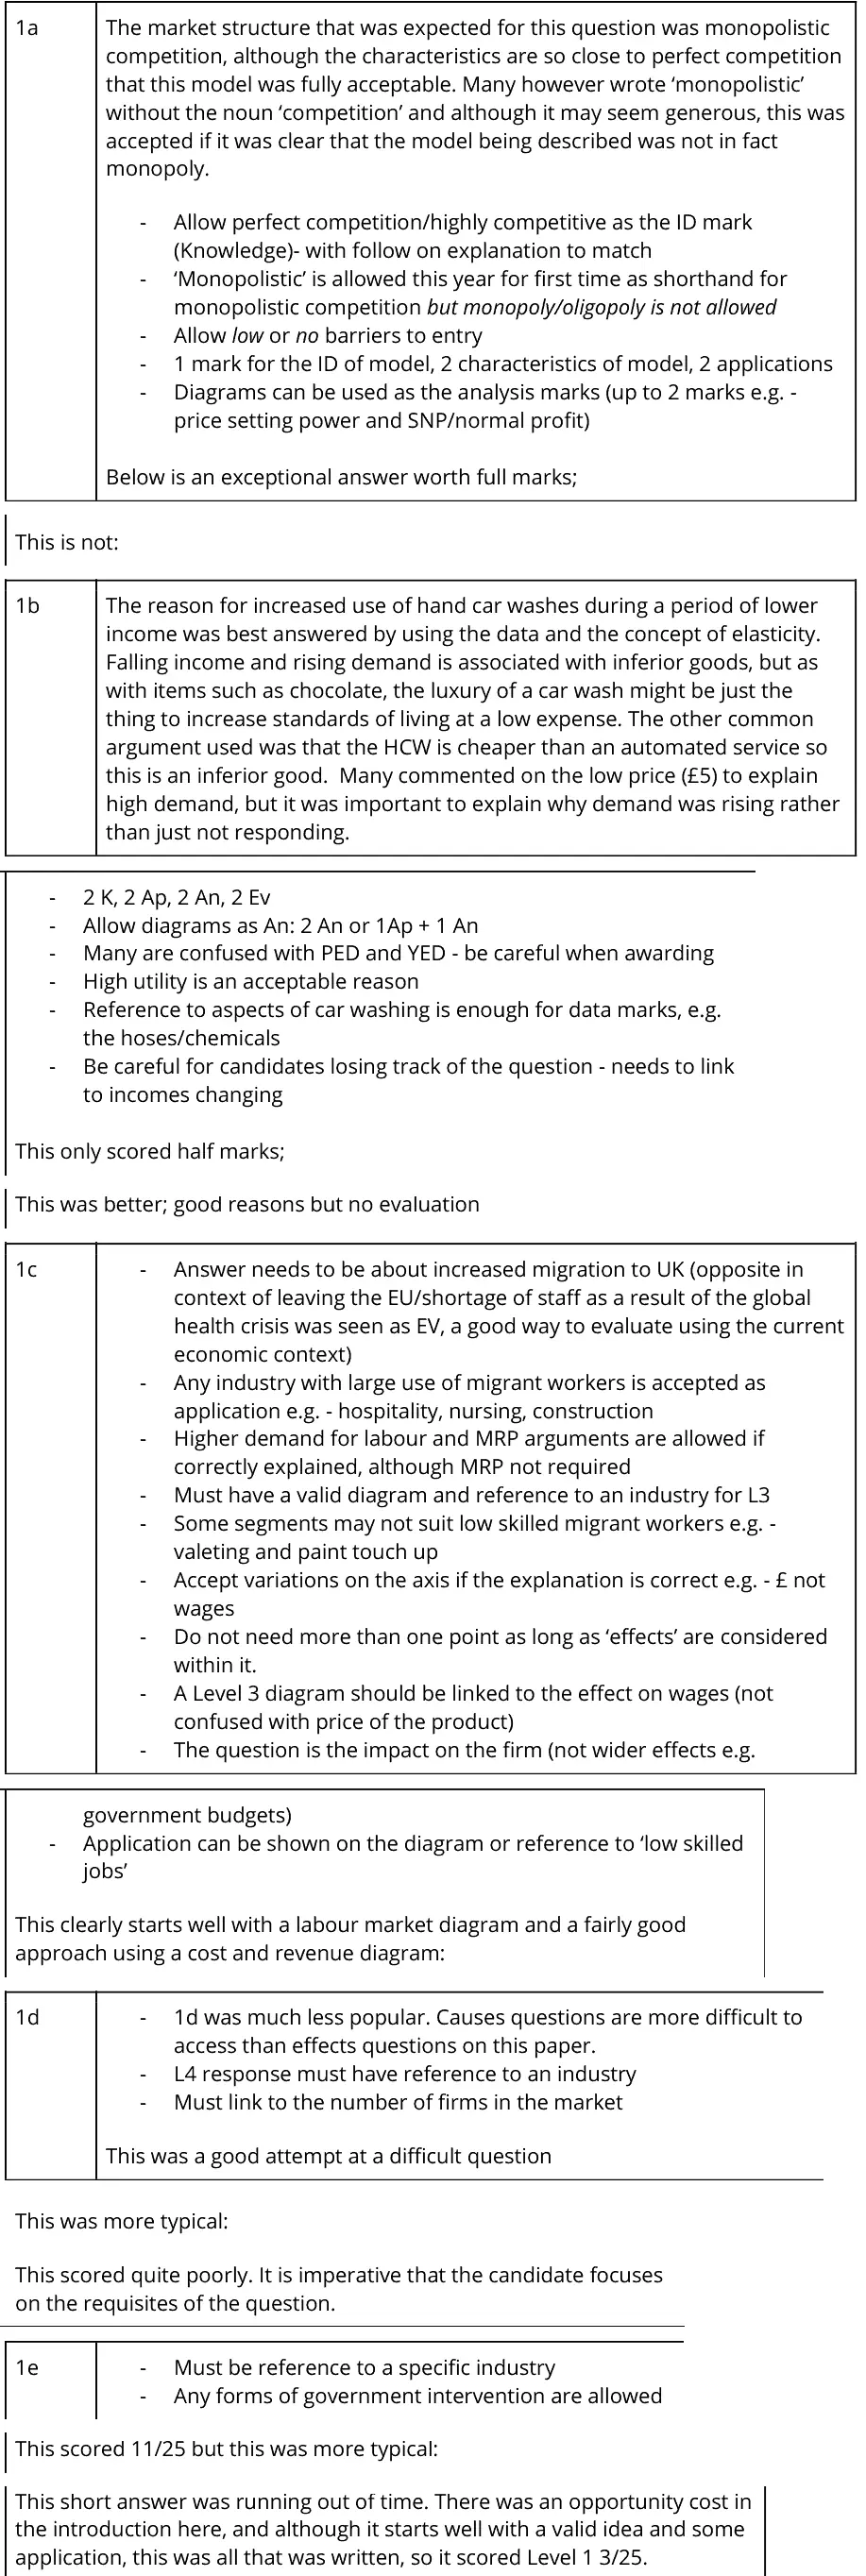
1a The market structure that was expected for this question was monopolistic competition, although the characteristics are so close to perfect competition that this model was fully acceptable. Many however wrote ‘monopolistic’ without the noun ‘competition’ and although it may seem generous, this was accepted if it was clear that the model being described was not in fact monopoly. - Allow perfect competition/highly competitive as the ID mark (Knowledge)- with follow on explanation to match - ‘Monopolistic’ is allowed this year for first time as shorthand for monopolistic competition but monopoly/oligopoly is not allowed - Allow low or no barriers to entry - 1 mark for the ID of model, 2 characteristics of model, 2 applications - Diagrams can be used as the analysis marks (up to 2 marks e.g. - price setting power and SNP/normal profit) Below is an exceptional answer worth full marks; This is not: 1b The reason for increased use of hand car washes during a period of lower income was best answered by using the data and the concept of elasticity. Falling income and rising demand is associated with inferior goods, but as with items such as chocolate, the luxury of a car wash might be just the thing to increase standards of living at a low expense. The other common argument used was that the HCW is cheaper than an automated service so this is an inferior good. Many commented on the low price (£5) to explain high demand, but it was important to explain why demand was rising rather than just not responding. - 2 K, 2 Ap, 2 An, 2 Ev - Allow diagrams as An: 2 An or 1Ap + 1 An - Many are confused with PED and YED - be careful when awarding - High utility is an acceptable reason - Reference to aspects of car washing is enough for data marks, e.g. the hoses/chemicals - Be careful for candidates losing track of the question - needs to link to incomes changing This only scored half marks; This was better; good reasons but no evaluation 1c - Answer needs to be about increased migration to UK (opposite in context of leaving the EU/shortage of staff as a result of the global health crisis was seen as EV, a good way to evaluate using the current economic context) - Any industry with large use of migrant workers is accepted as application e.g. - hospitality, nursing, construction - Higher demand for labour and MRP arguments are allowed if correctly explained, although MRP not required - Must have a valid diagram and reference to an industry for L3 - Some segments may not suit low skilled migrant workers e.g. - valeting and paint touch up - Accept variations on the axis if the explanation is correct e.g. - £ not wages - Do not need more than one point as long as ‘effects’ are considered within it. - A Level 3 diagram should be linked to the effect on wages (not confused with price of the product) - The question is the impact on the firm (not wider effects e.g. government budgets) - Application can be shown on the diagram or reference to ‘low skilled jobs’ This clearly starts well with a labour market diagram and a fairly good approach using a cost and revenue diagram: 1d - 1d was much less popular. Causes questions are more difficult to access than effects questions on this paper. - L4 response must have reference to an industry - Must link to the number of firms in the market This was a good attempt at a difficult question This was more typical: This scored quite poorly. It is imperative that the candidate focuses on the requisites of the question. 1e - Must be reference to a specific industry - Any forms of government intervention are allowed This scored 11/25 but this was more typical: This short answer was running out of time. There was an opportunity cost in the introduction here, and although it starts well with a valid idea and some application, this was all that was written, so it scored Level 1 3/25.
Notes from the mark scheme and report
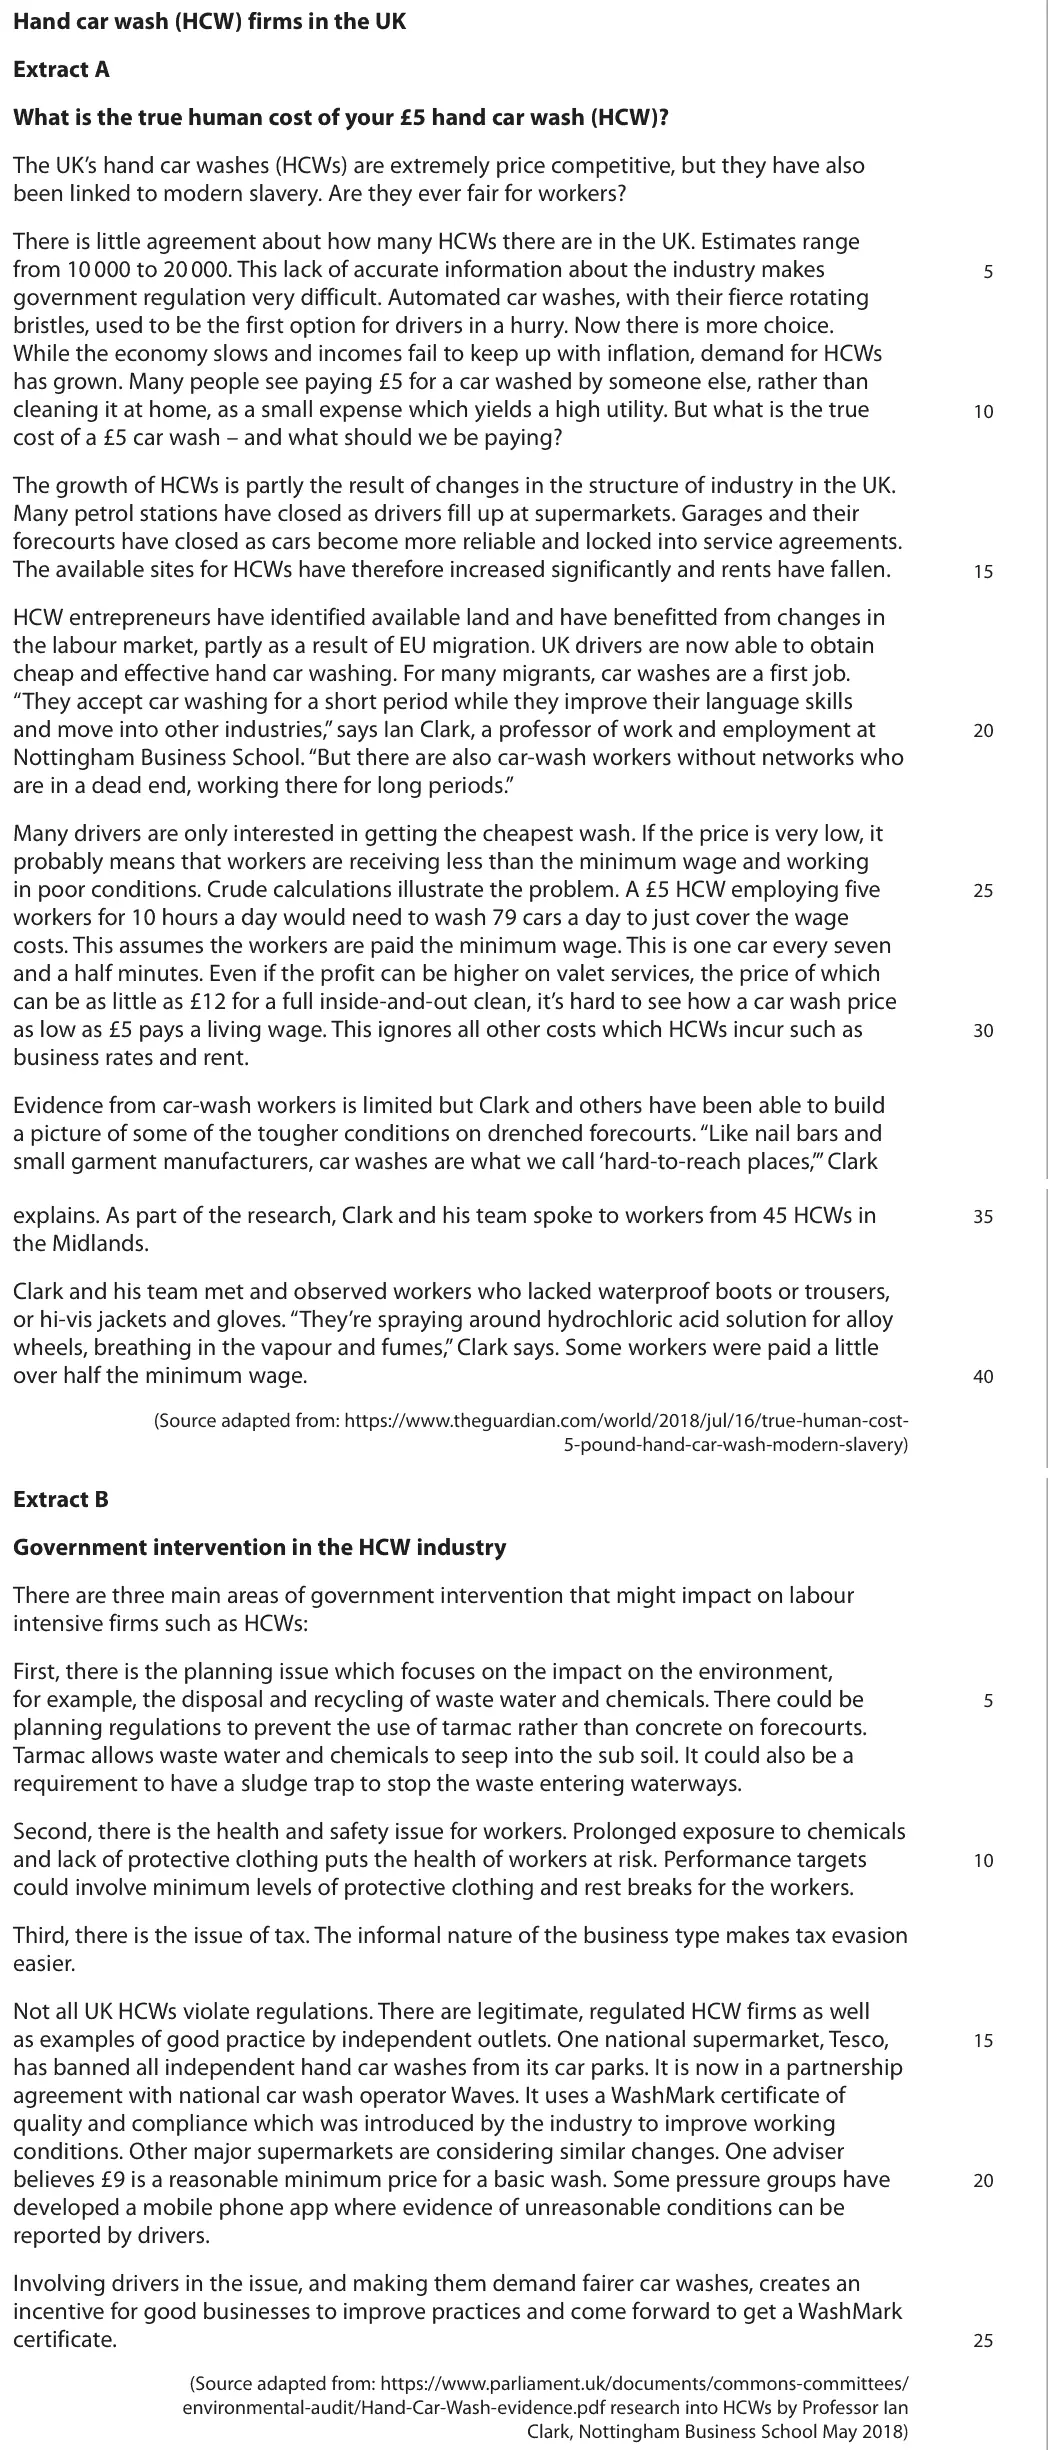
real incomes are falling, so rising demand suggests an inferior good (negative YED)
£5 is a small share of income, high utility, fewer automatic washes as petrol stations close
explain why demand rises, not just why it holds up
do not confuse PED with YED
Quantitative skills: QS 9 (interpret, apply and analyse information in written, graphical tabular and numerical forms)
October 2020 · AS Paper 1 · Q2(a)1 markMultiple choice
Answer
D
Mark scheme
Notes from the mark scheme and report
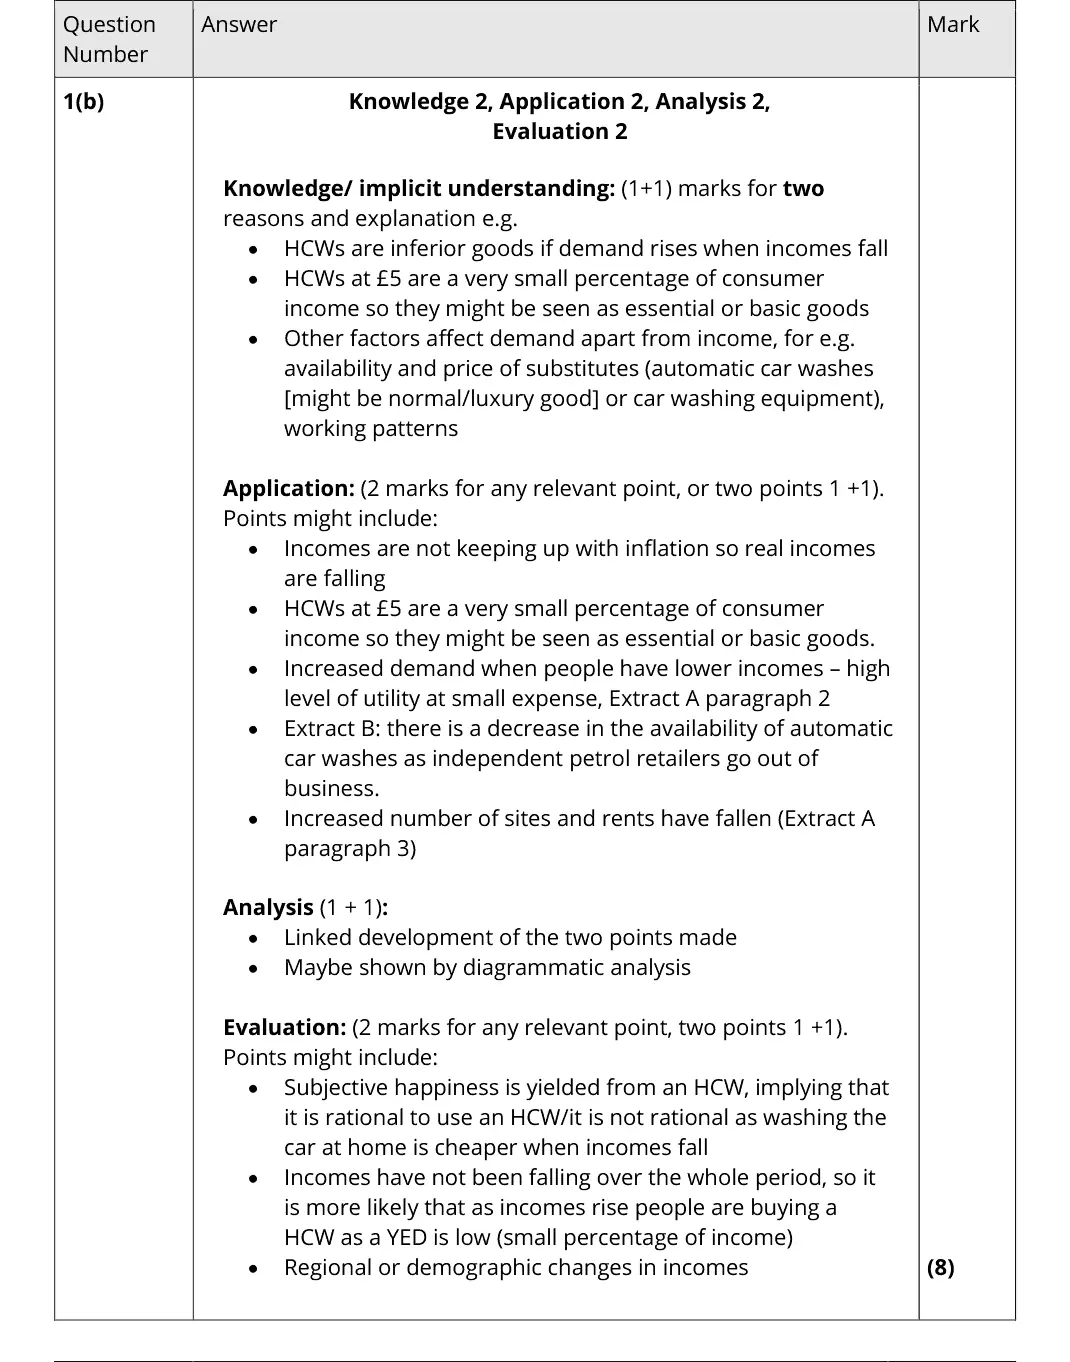
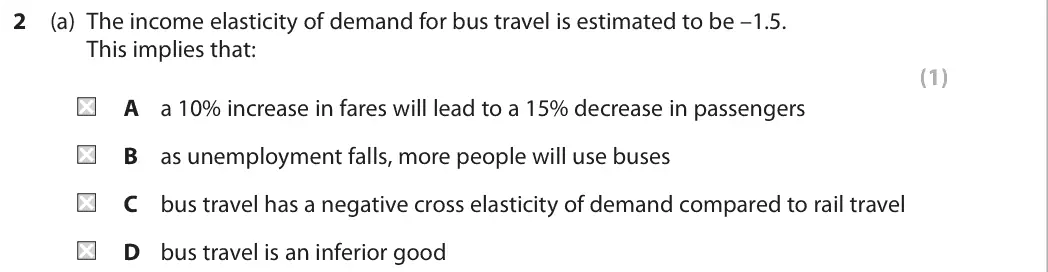
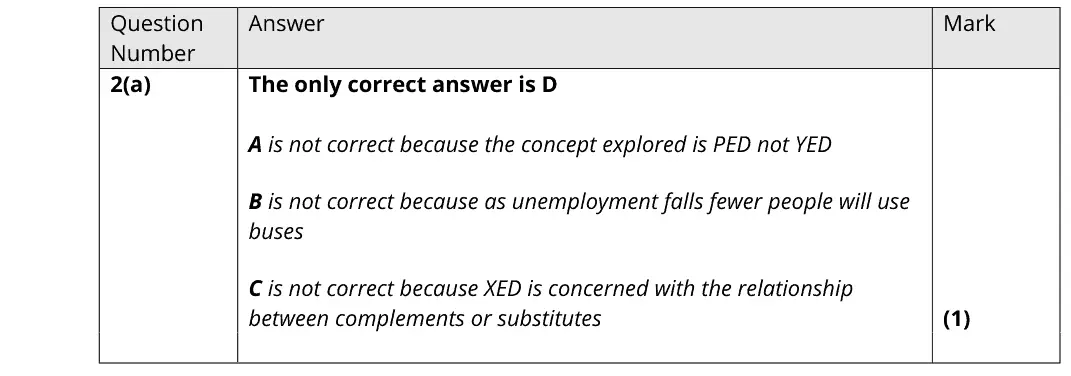
a negative YED means demand falls as income rises, so bus travel is an inferior good (D)
A describes PED
B is wrong as falling unemployment raises incomes and reduces bus use
C is about XED
Quantitative skills: QS 8 (make calculations of elasticity and interpret the result)
October 2020 · AS Paper 1 · Q2(b)3 marksAO1=1, AO2=1, AO3=1Short answer
Mark scheme
Examiner's comment
Though many candidates were able to achieve the mark available here, lack of precision in exploring the concept of total revenue was an obvious issue for many. Typically, we were looking for some link to the data provided, and perhaps manipulation of it to show why firms might try to reduce PED.
Notes from the mark scheme and report
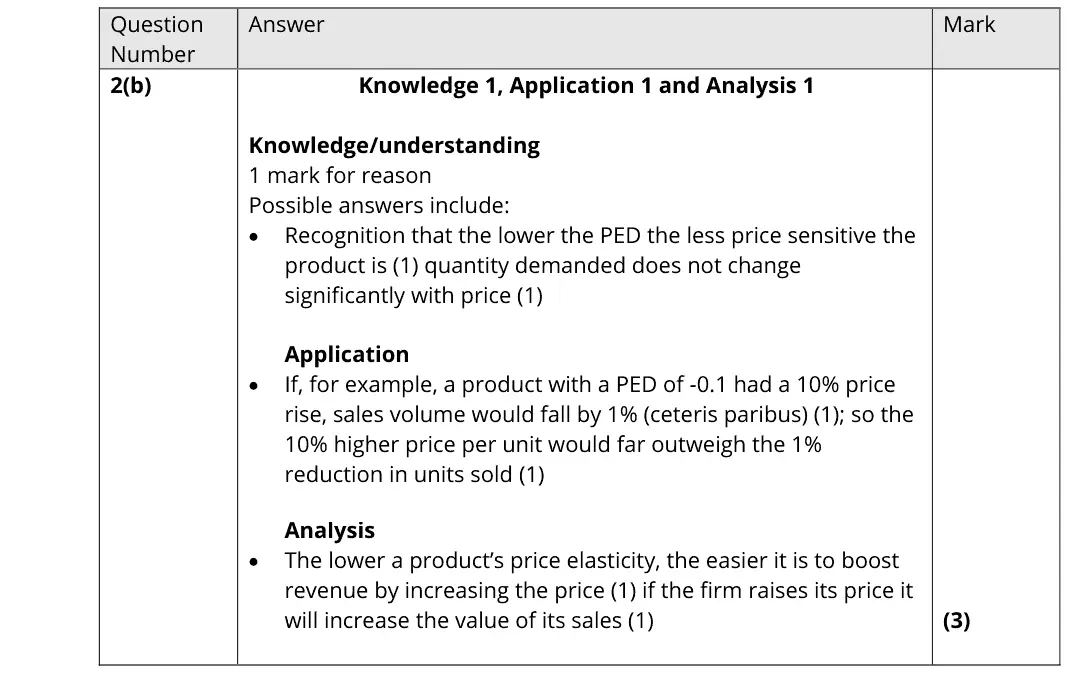
lower PED means quantity demanded is less responsive, so the firm can raise price and increase total revenue
a numerical example earns application (e.g. PED -0.1: 10% price rise cuts sales by 1%)
many were imprecise about total revenue
Quantitative skills: QS 8 (make calculations of elasticity and interpret the result)
October 2020 · AS Paper 1 · Q6(a)5 marksAO1=1, AO2=2, AO3=2Short answer
Data and extracts for question 6
Mark scheme
Examiner's comment
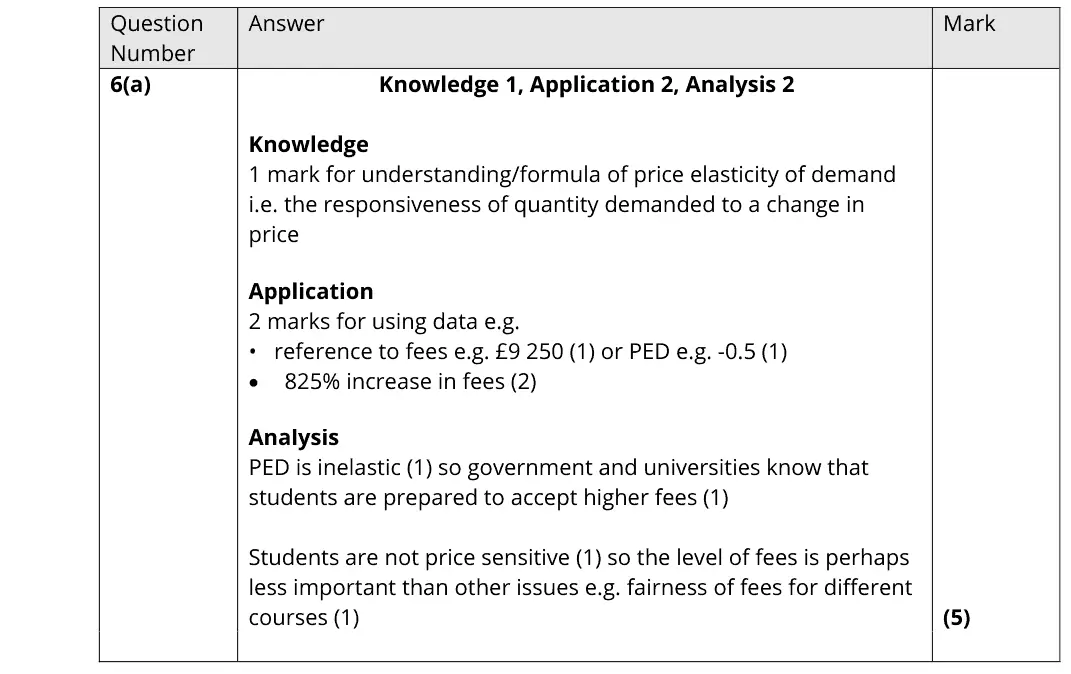
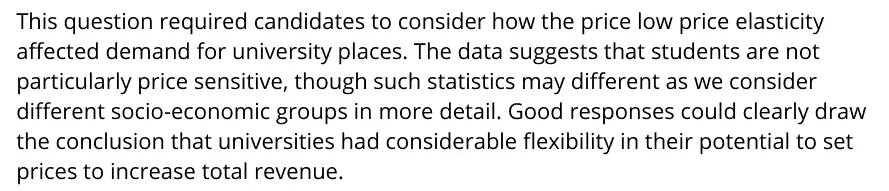
This question required candidates to consider how the price low price elasticity affected demand for university places. The data suggests that students are not particularly price sensitive, though such statistics may different as we consider different socio-economic groups in more detail. Good responses could clearly draw the conclusion that universities had considerable flexibility in their potential to set prices to increase total revenue.
Notes from the mark scheme and report
PED of -0.5 is inelastic, so universities can raise fees and increase revenue without much fall in applications
quote £9 250, -0.5, or the 825% rise in fees since £1 000 in 1998 (2 marks)
Quantitative skills: QS 8 (make calculations of elasticity and interpret the result); QS 9 (interpret, apply and analyse information in written, graphical tabular and numerical forms)
October 2020 · Paper 1 · Q725 marksAO1=4, AO2=4, AO3=8, AO4=925-mark essayEither/or
Mark scheme, including the levels grid and indicative content
Examiner's comment
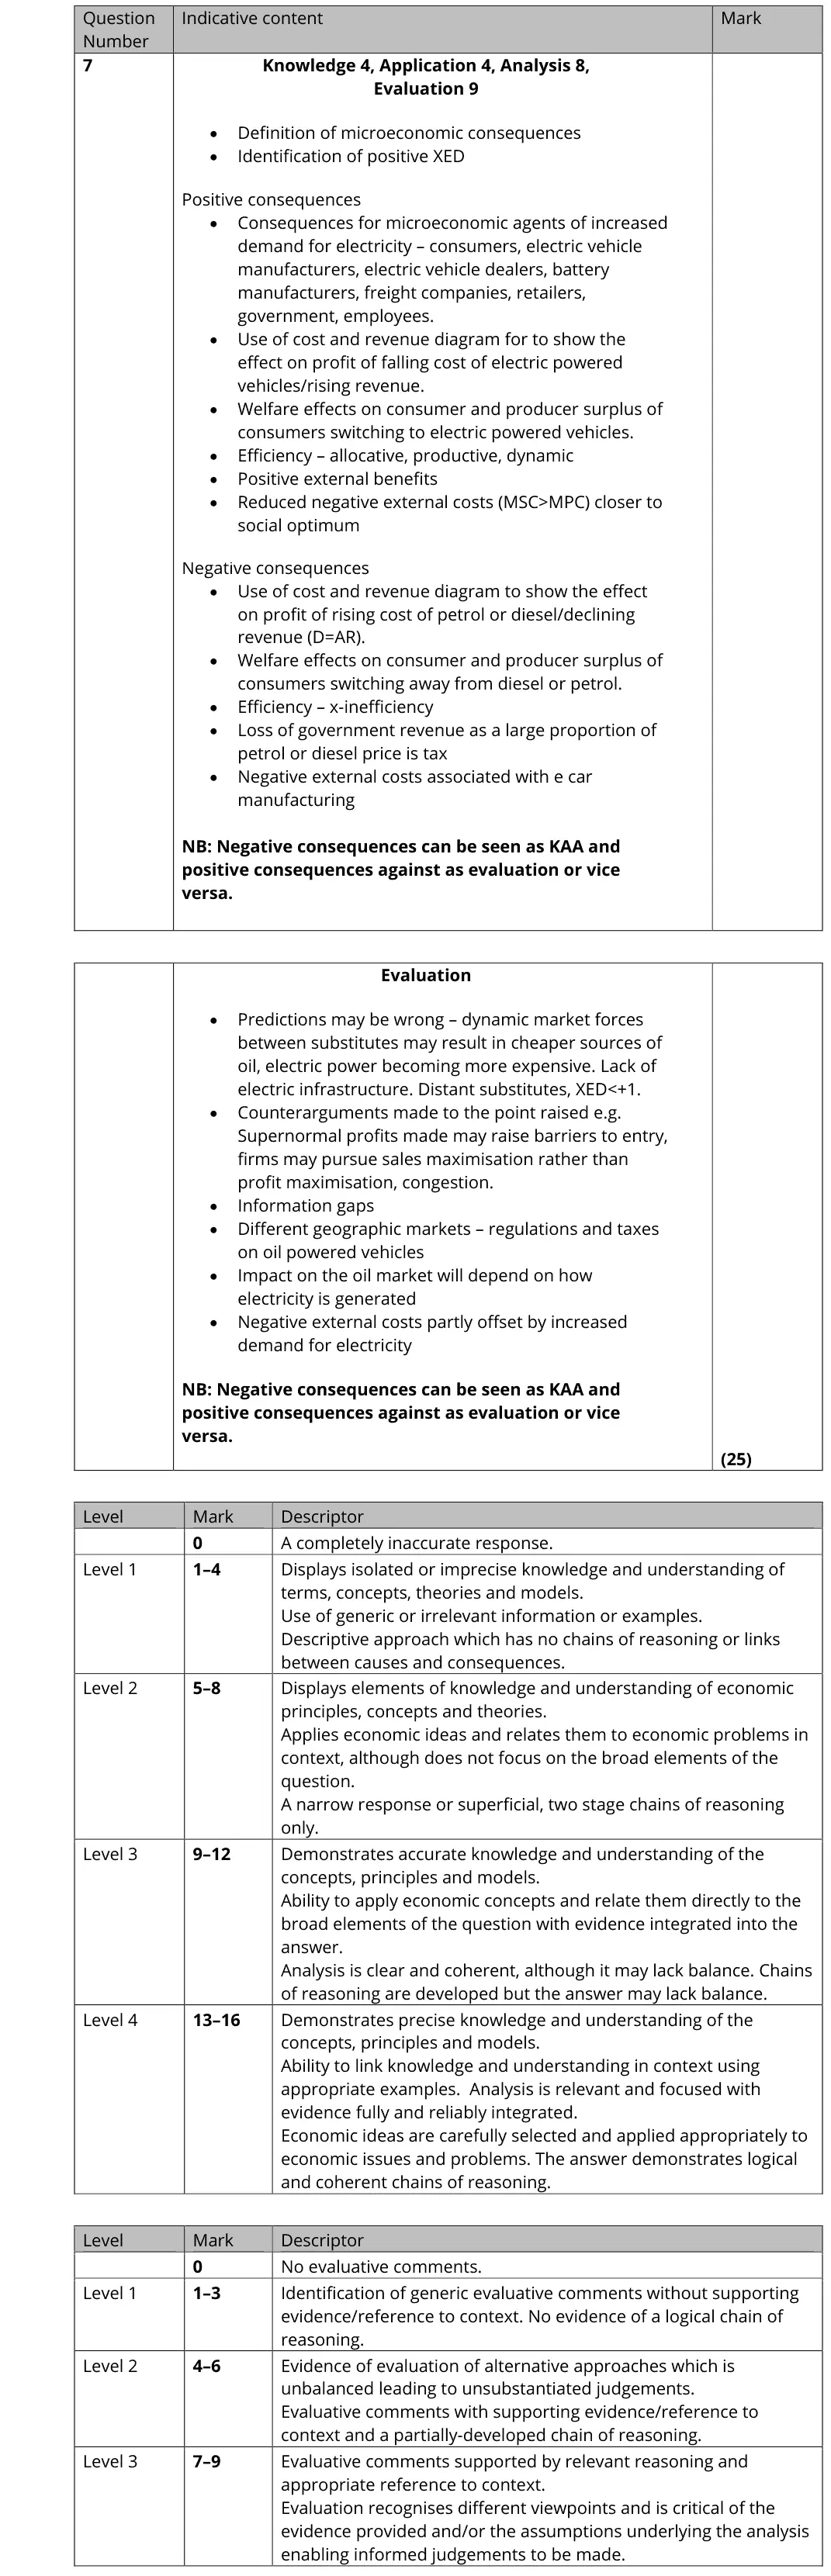
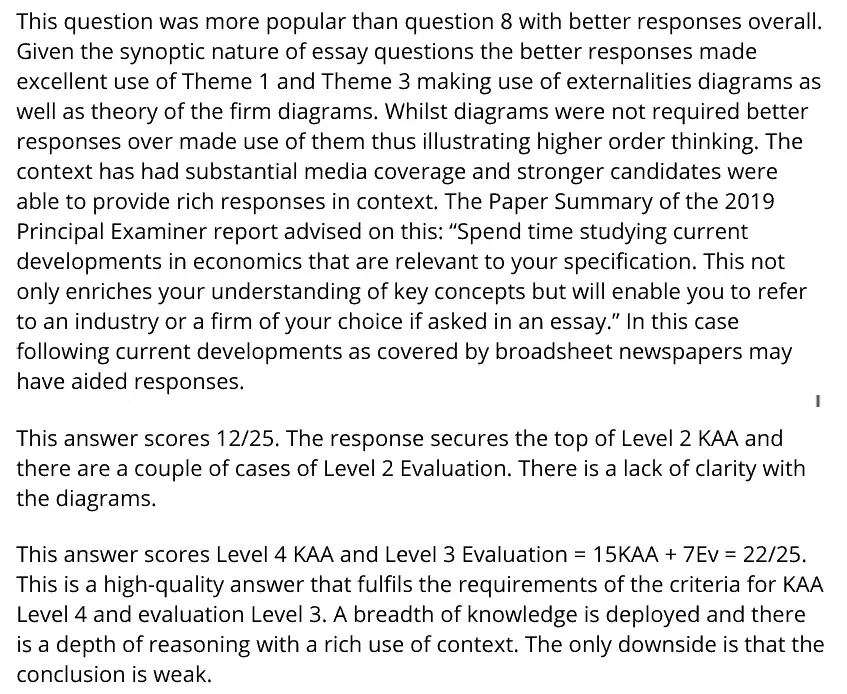
This question was more popular than question 8 with better responses overall. Given the synoptic nature of essay questions the better responses made excellent use of Theme 1 and Theme 3 making use of externalities diagrams as well as theory of the firm diagrams. Whilst diagrams were not required better responses over made use of them thus illustrating higher order thinking. The context has had substantial media coverage and stronger candidates were able to provide rich responses in context. The Paper Summary of the 2019 Principal Examiner report advised on this: “Spend time studying current developments in economics that are relevant to your specification. This not only enriches your understanding of key concepts but will enable you to refer to an industry or a firm of your choice if asked in an essay.” In this case following current developments as covered by broadsheet newspapers may have aided responses. This answer scores 12/25. The response secures the top of Level 2 KAA and there are a couple of cases of Level 2 Evaluation. There is a lack of clarity with the diagrams. This answer scores Level 4 KAA and Level 3 Evaluation = 15KAA + 7Ev = 22/25. This is a high-quality answer that fulfils the requirements of the criteria for KAA Level 4 and evaluation Level 3. A breadth of knowledge is deployed and there is a depth of reasoning with a rich use of context. The only downside is that the conclusion is weak.
Notes from the mark scheme and report
microeconomic effects of switching: positive XED with electricity, demand shifts in car and fuel markets, profits of EV and oil firms, consumer and producer surplus, reduced negative externalities, lost fuel duty
better answers used externality and theory of the firm diagrams (not required)
evaluate with uncertain forecasts, charging infrastructure, external costs of battery production
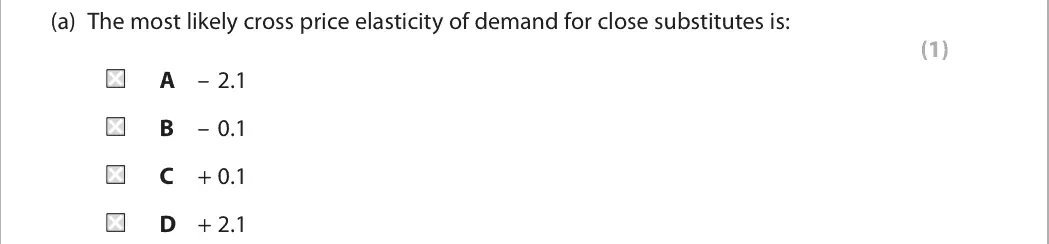
June 2019 · AS Paper 1 · Q3(a)1 markAO2=1Multiple choice
Data and extracts for question 3
Answer
D
Mark scheme
Notes from the mark scheme and report
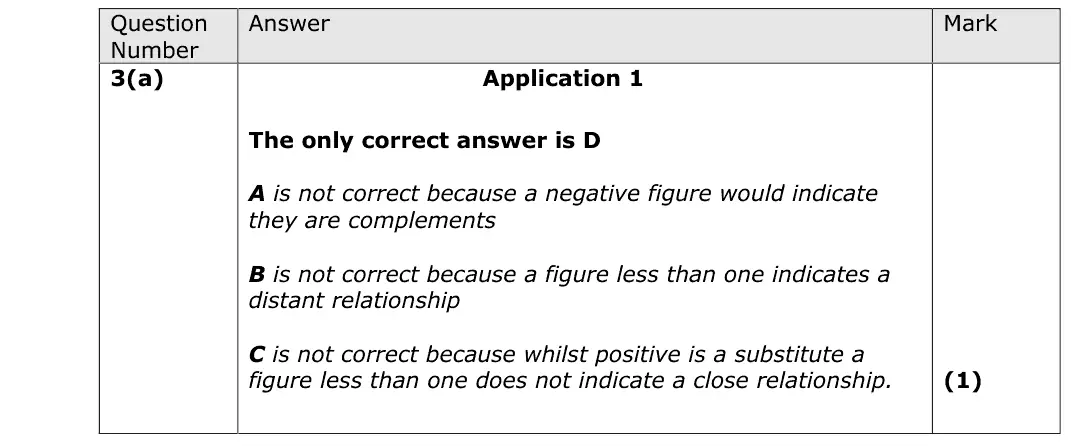
close substitutes have a high positive XED: +2.1 (D)
negative values mean complements
+0.1 is only a weak substitute
Quantitative skills: QS 8 (make calculations of elasticity and interpret the result)
June 2019 · AS Paper 1 · Q3(b)3 marksAO1=1, AO2=2Calculation
Data and extracts for question 3
Mark scheme
Examiner's comment
This question was a challenge for some. Many candidates were able to do the maths but not link the numbers to the requirements of the question, which was asking about total revenue. There was an acknowledgement that a correct percentage change calculation could access the application mark even if the answer was incorrect.
Notes from the mark scheme and report
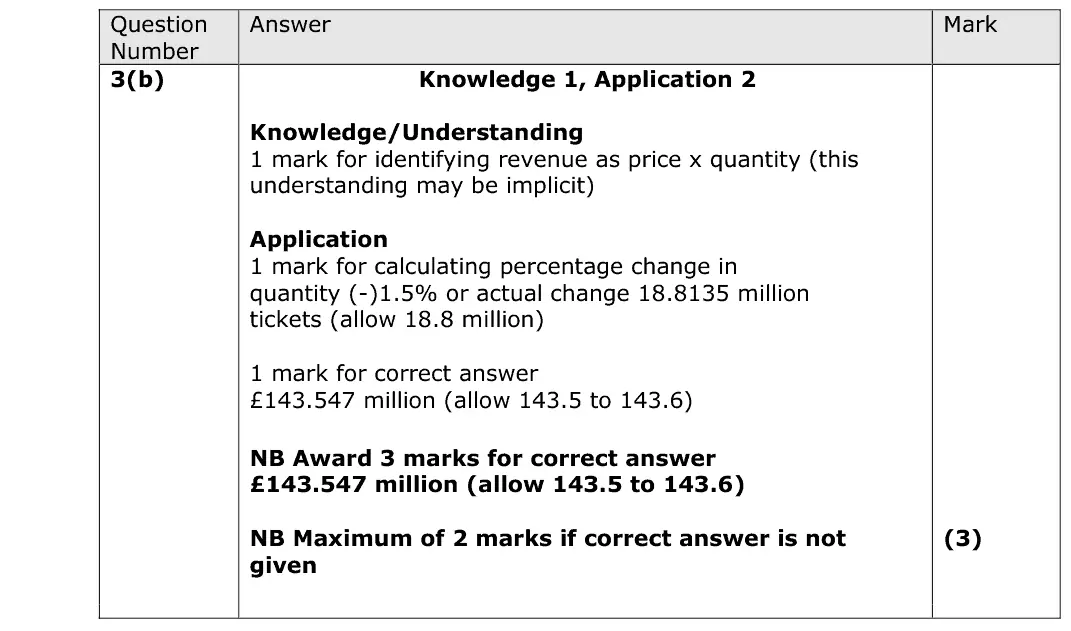
%change in Qd = -0.5 x 3% = -1.5%, so 19.1m x 0.985 = 18.8135m tickets
TR = £7.63 x 18.8135m = £143.547m (allow 143.5 to 143.6)
many did the percentages but never reached total revenue
max 2 without the correct answer
Quantitative skills: QS 2 (calculate, use and understand percentages, percentage changes and percentage point changes); QS 6 (calculate cost, revenue and profit (marginal, average, totals)); QS 8 (make calculations of elasticity and interpret the result)
June 2019 · AS Paper 1 · Q5(a)1 markAO2=1Multiple choice
Data and extracts for question 5
Answer
C
Mark scheme
Notes from the mark scheme and report
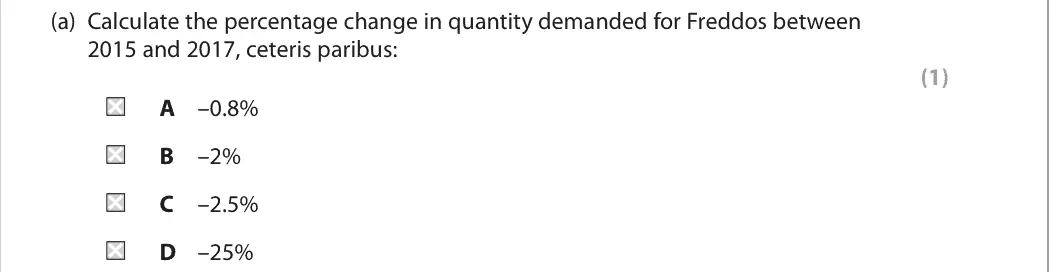
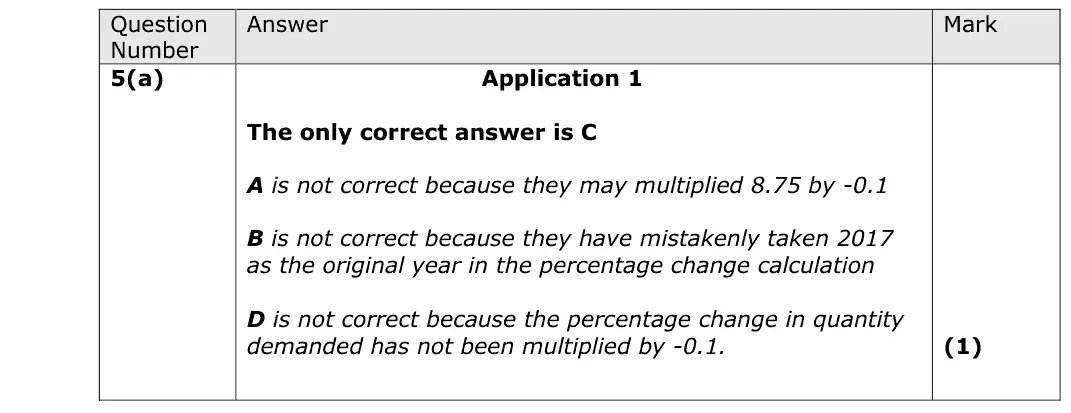
%change in income = (8.75 - 7)/7 = 25%
%change in Qd = -0.1 x 25 = -2.5% (C)
A multiplies 8.75 by -0.1, B uses 2017 as the base year, D forgets to multiply by -0.1
Quantitative skills: QS 2 (calculate, use and understand percentages, percentage changes and percentage point changes); QS 8 (make calculations of elasticity and interpret the result)
June 2019 · AS Paper 1 · Q5(b)3 marksAO1=1, AO2=1, AO3=1Short answer
Data and extracts for question 5
Mark scheme
Examiner's comment
Candidates were able to recognise the impact of a change in income on the demand for Freddos in most cases but many struggled to identify Freddos as an inferior good and few were able to then move on to effectively suggest how the producers of Freddos could respond to this information.
Notes from the mark scheme and report
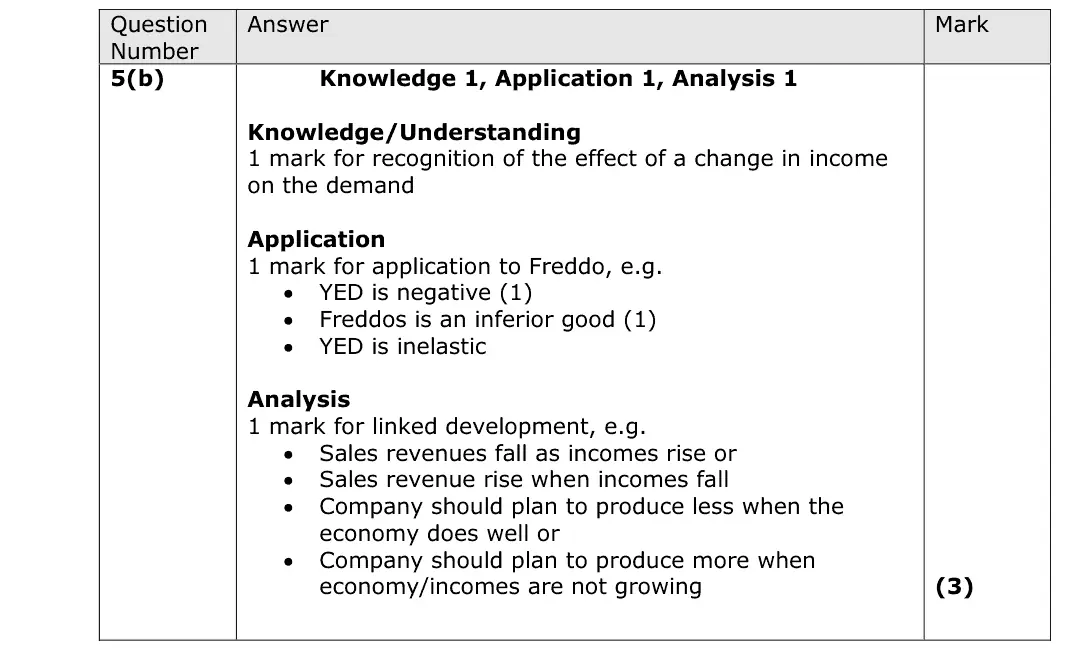
YED of -0.1 means Freddos are an inferior good (and income inelastic)
develop: sales fall as incomes rise, so plan output over the economic cycle
many could not identify the inferior good or suggest how the producer should respond
Quantitative skills: QS 8 (make calculations of elasticity and interpret the result)
June 2018 · AS Paper 1 · Q2(a)2 marksAO2=2Calculation
Data and extracts for question 2
Mark scheme
Examiner's comment
This question was answered well by a large majority of candidates and again the use of a two-step method using the data was essential. It was important for candidates to use the data to obtain the first mark, with both marks being reserved for a correct answer. A common mistake was for candidates to get the formula for Price Elasticity of Demand the wrong way around, dividing 8.3 by -5.4 and getting -1.54. In this example the candidate has clearly worked through the steps of the calculation, gaining the first mark for 8.3, and the second for the correct answer of -0.65. Writing the correct formula doesn't in itself gain any marks here but it is the first step in obtaining the correct percentage change in price. This then enables the correct final answer to be calculated.
Notes from the mark scheme and report
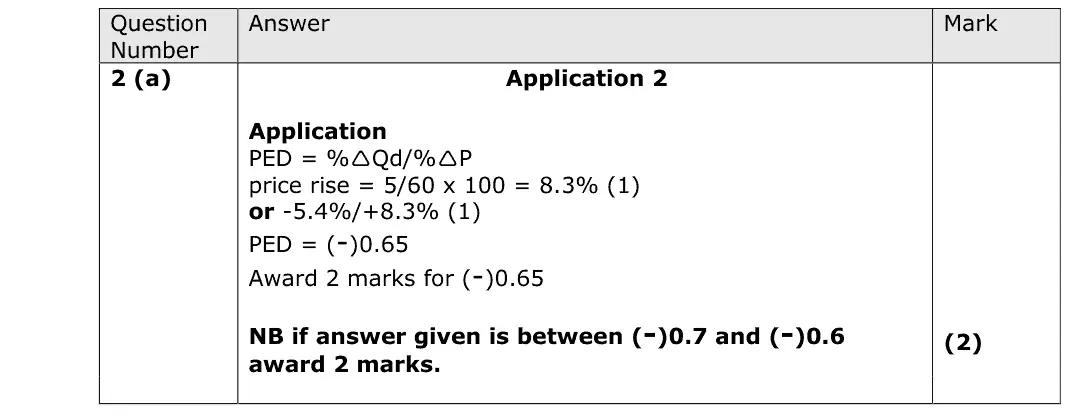
%change in P = 5 / 60 x 100 = 8.3%
PED = -5.41 / 8.3 = -0.65
report: common mistake was the formula upside down (8.3 / -5.4 = -1.54)
Quantitative skills: QS 2 (calculate, use and understand percentages, percentage changes and percentage point changes); QS 8 (make calculations of elasticity and interpret the result)
June 2018 · AS Paper 1 · Q2(b)1 markMultiple choice
Data and extracts for question 2
Answer
A
Mark scheme
Notes from the mark scheme and report
availability of rival newspapers (substitutes) determines PED (A)
population size and expected price rises shift demand, a fall in production cost shifts supply
June 2018 · Paper 1 · Q2(b)2 marksAO1=1, AO3=1Short answer
Data and extracts for question 2
Mark scheme
Examiner's comment
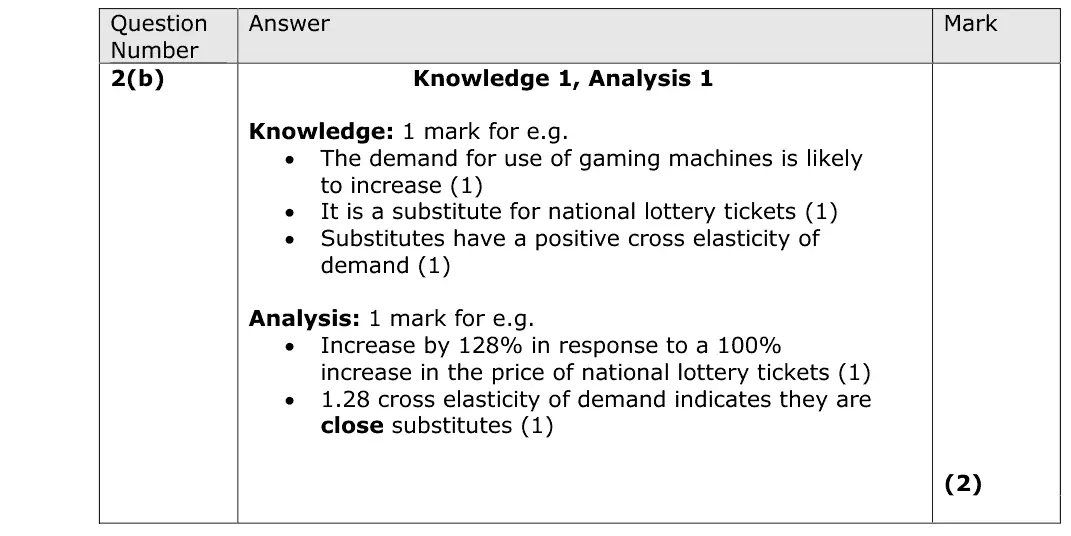
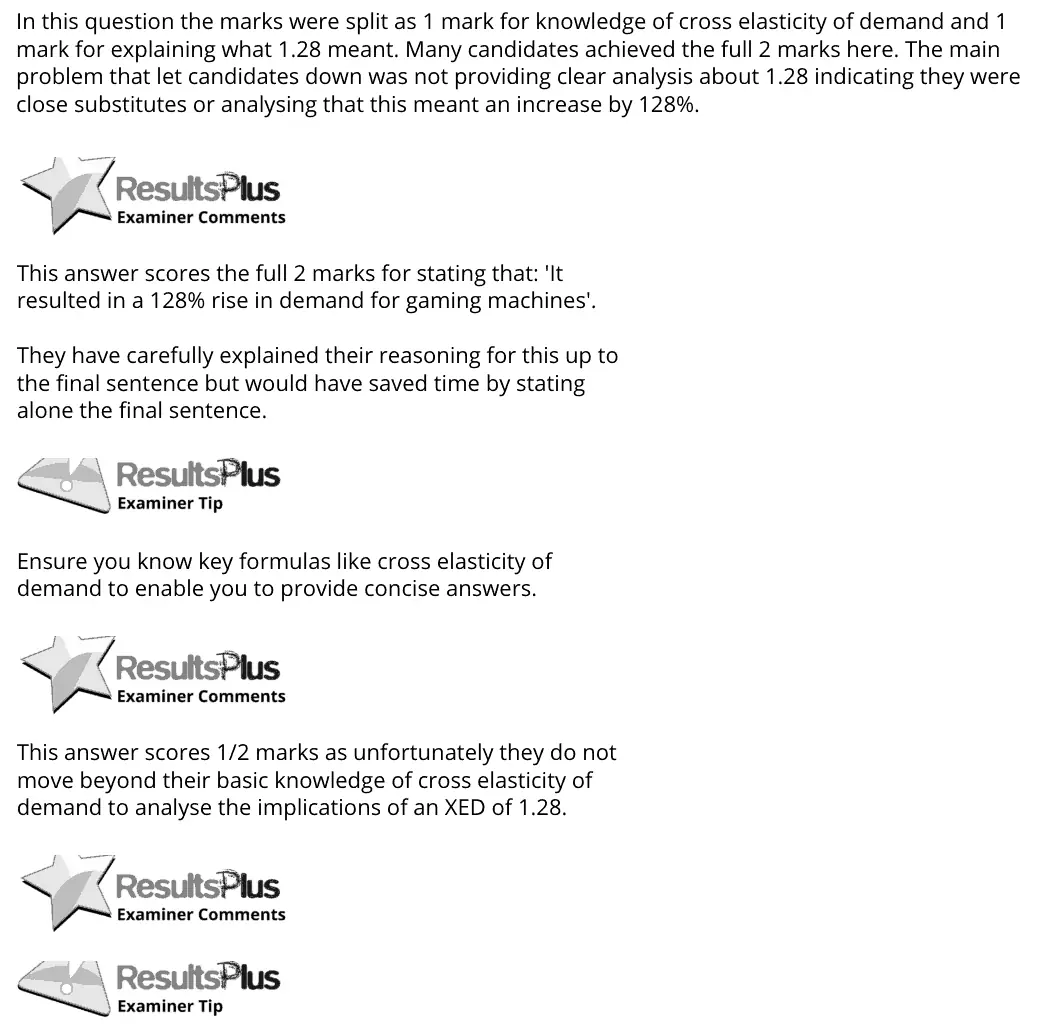
In this question the marks were split as 1 mark for knowledge of cross elasticity of demand and 1 mark for explaining what 1.28 meant. Many candidates achieved the full 2 marks here. The main problem that let candidates down was not providing clear analysis about 1.28 indicating they were close substitutes or analysing that this meant an increase by 128%. This answer scores the full 2 marks for stating that: 'It resulted in a 128% rise in demand for gaming machines'. They have carefully explained their reasoning for this up to the final sentence but would have saved time by stating alone the final sentence. Ensure you know key formulas like cross elasticity of demand to enable you to provide concise answers. This answer scores 1/2 marks as unfortunately they do not move beyond their basic knowledge of cross elasticity of demand to analyse the implications of an XED of 1.28.
Notes from the mark scheme and report
positive XED of 1.28 means substitutes, so demand for gaming machines rises
analysis: 128% rise for a 100% lottery price rise or close substitutes
report: many did not analyse what 1.28 means
Quantitative skills: QS 8 (make calculations of elasticity and interpret the result); QS 9 (interpret, apply and analyse information in written, graphical tabular and numerical forms)
June 2018 · AS Paper 1 · Q4(a)1 markMultiple choice
Data and extracts for question 4
Answer
B
Mark scheme
Notes from the mark scheme and report
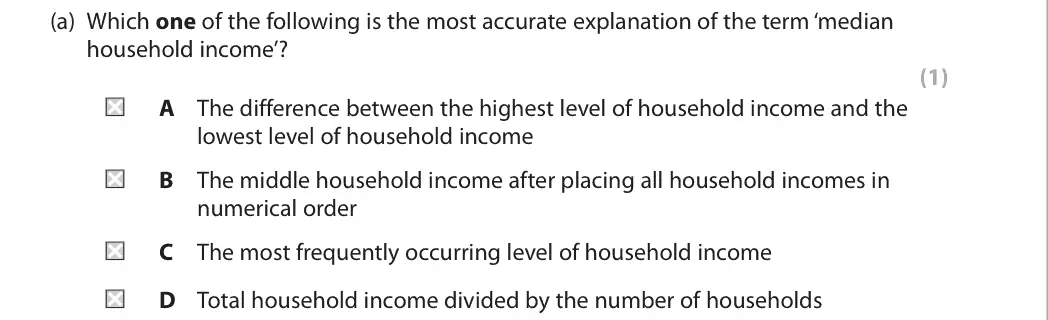
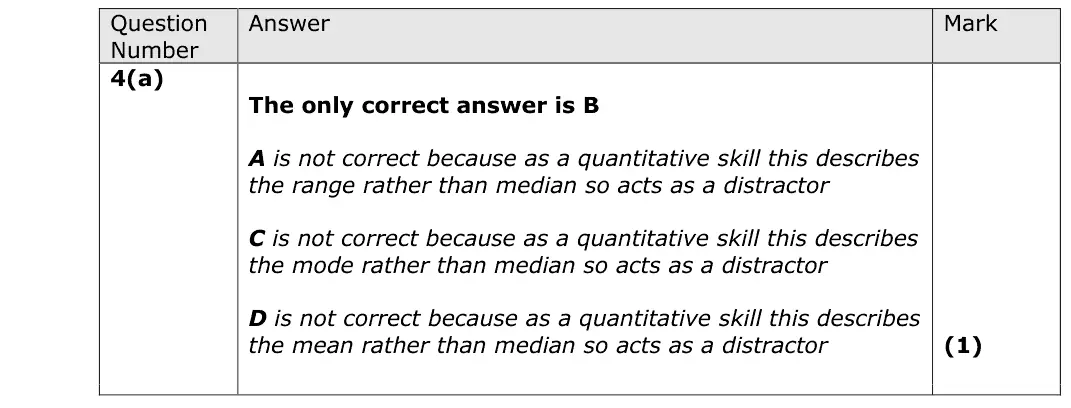
median = the middle income when all household incomes are placed in order (B)
A is the range, C the mode, D the mean
Quantitative skills: QS 3 (understand and use the terms mean, median and relevant quantiles)
June 2018 · AS Paper 1 · Q4(b)3 marksAO1=1, AO2=1, AO3=1Calculation
Data and extracts for question 4
Mark scheme
Examiner's comment
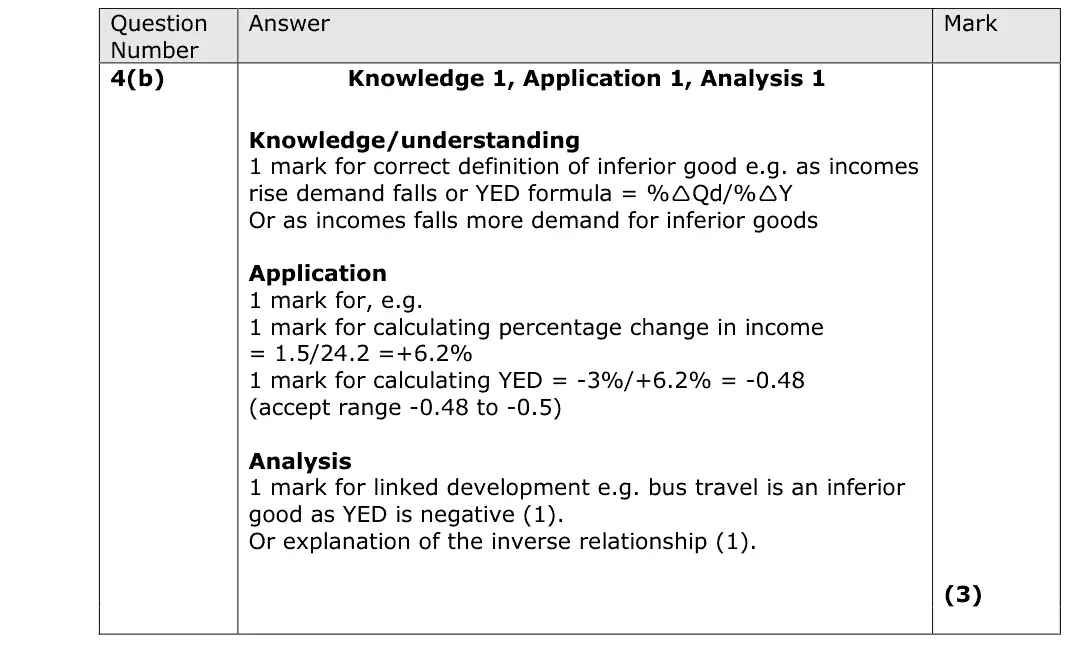
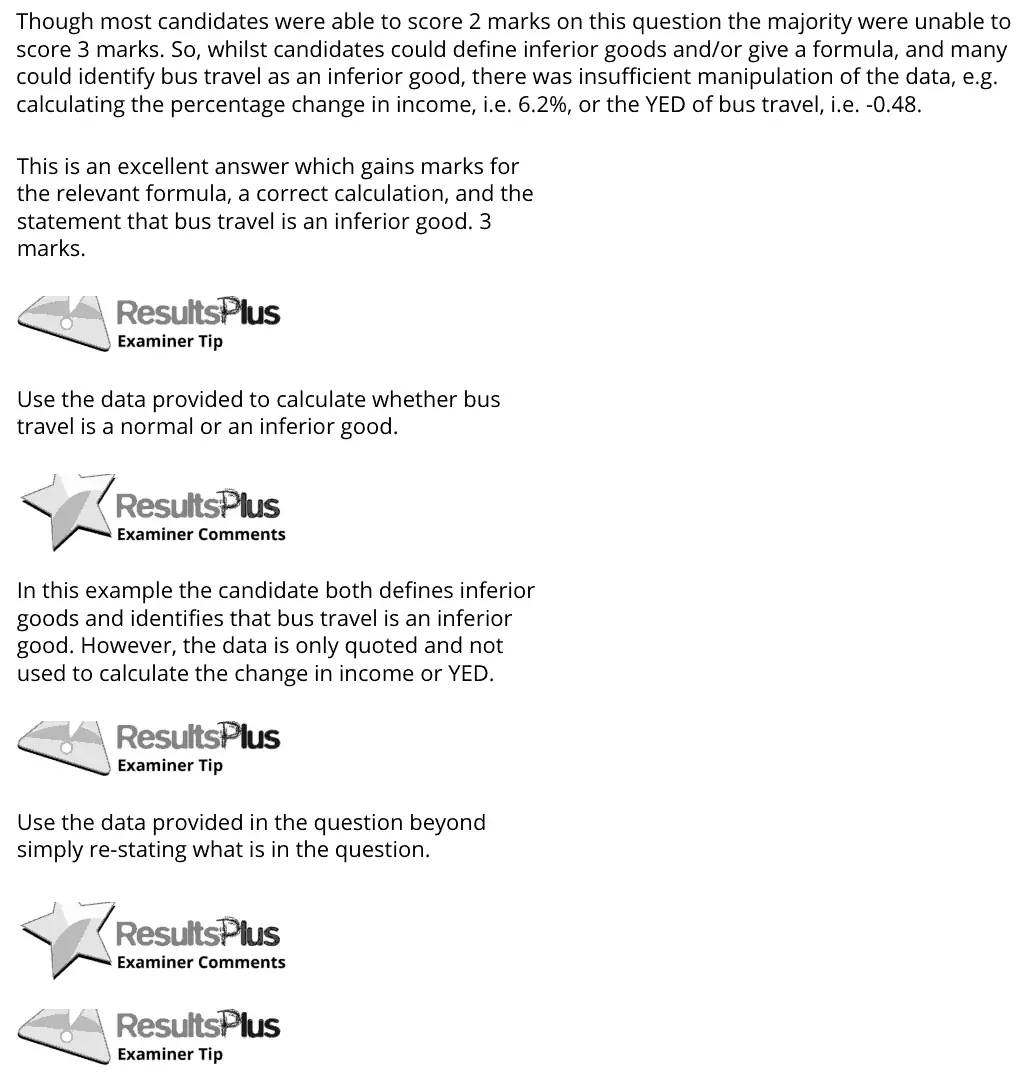
Though most candidates were able to score 2 marks on this question the majority were unable to score 3 marks. So, whilst candidates could define inferior goods and/or give a formula, and many could identify bus travel as an inferior good, there was insufficient manipulation of the data, e.g. calculating the percentage change in income, i.e. 6.2%, or the YED of bus travel, i.e. -0.48. This is an excellent answer which gains marks for the relevant formula, a correct calculation, and the statement that bus travel is an inferior good. 3 marks. Use the data provided to calculate whether bus travel is a normal or an inferior good. In this example the candidate both defines inferior goods and identifies that bus travel is an inferior good. However, the data is only quoted and not used to calculate the change in income or YED. Use the data provided in the question beyond simply re-stating what is in the question.
Notes from the mark scheme and report
%change in income = 1 500 / 24 200 = +6.2%
YED = -3 / 6.2 = -0.48, negative so bus travel is an inferior good
report: most scored only 2 of 3 as they quoted the data without calculating
Quantitative skills: QS 2 (calculate, use and understand percentages, percentage changes and percentage point changes); QS 8 (make calculations of elasticity and interpret the result)
June 2018 · Paper 1 · Q6(d)8 marksAO1=2, AO2=2, AO3=2, AO4=28-mark response
Data and extracts for question 6
Mark scheme, including the levels grid and indicative content
Examiner's comment
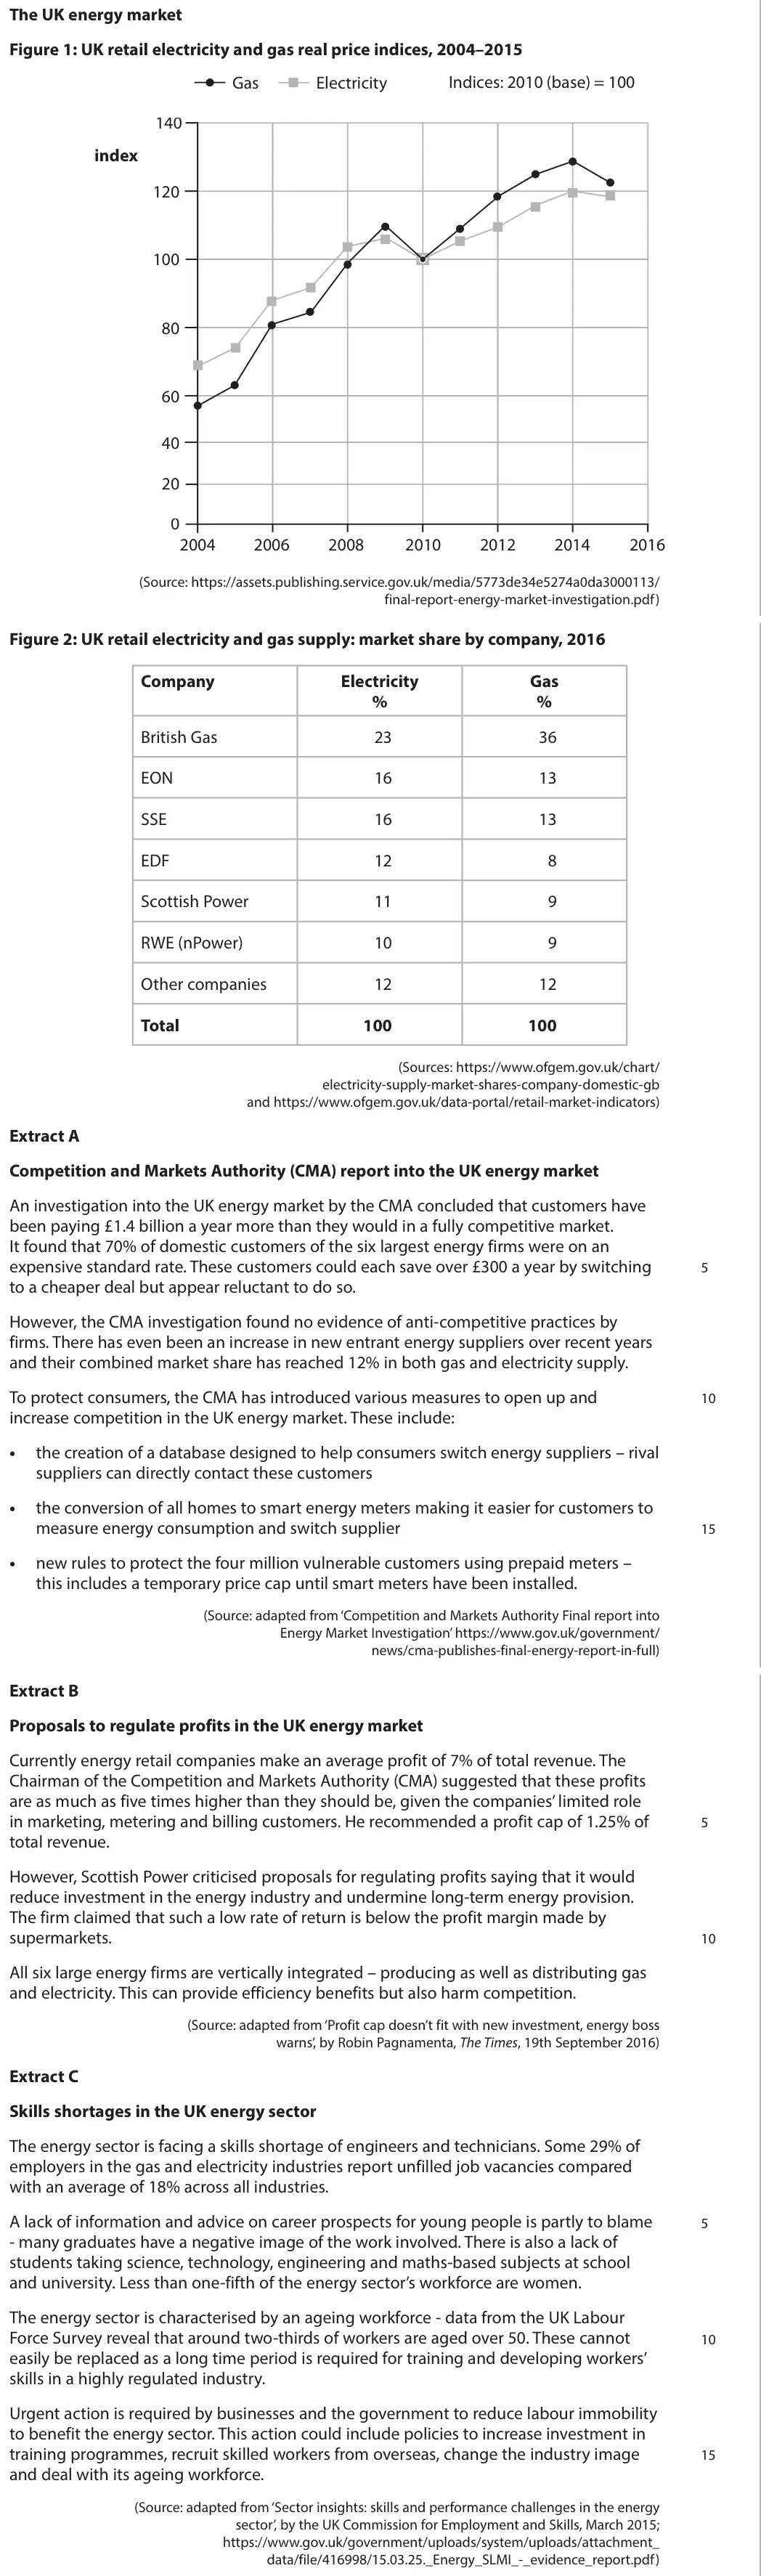
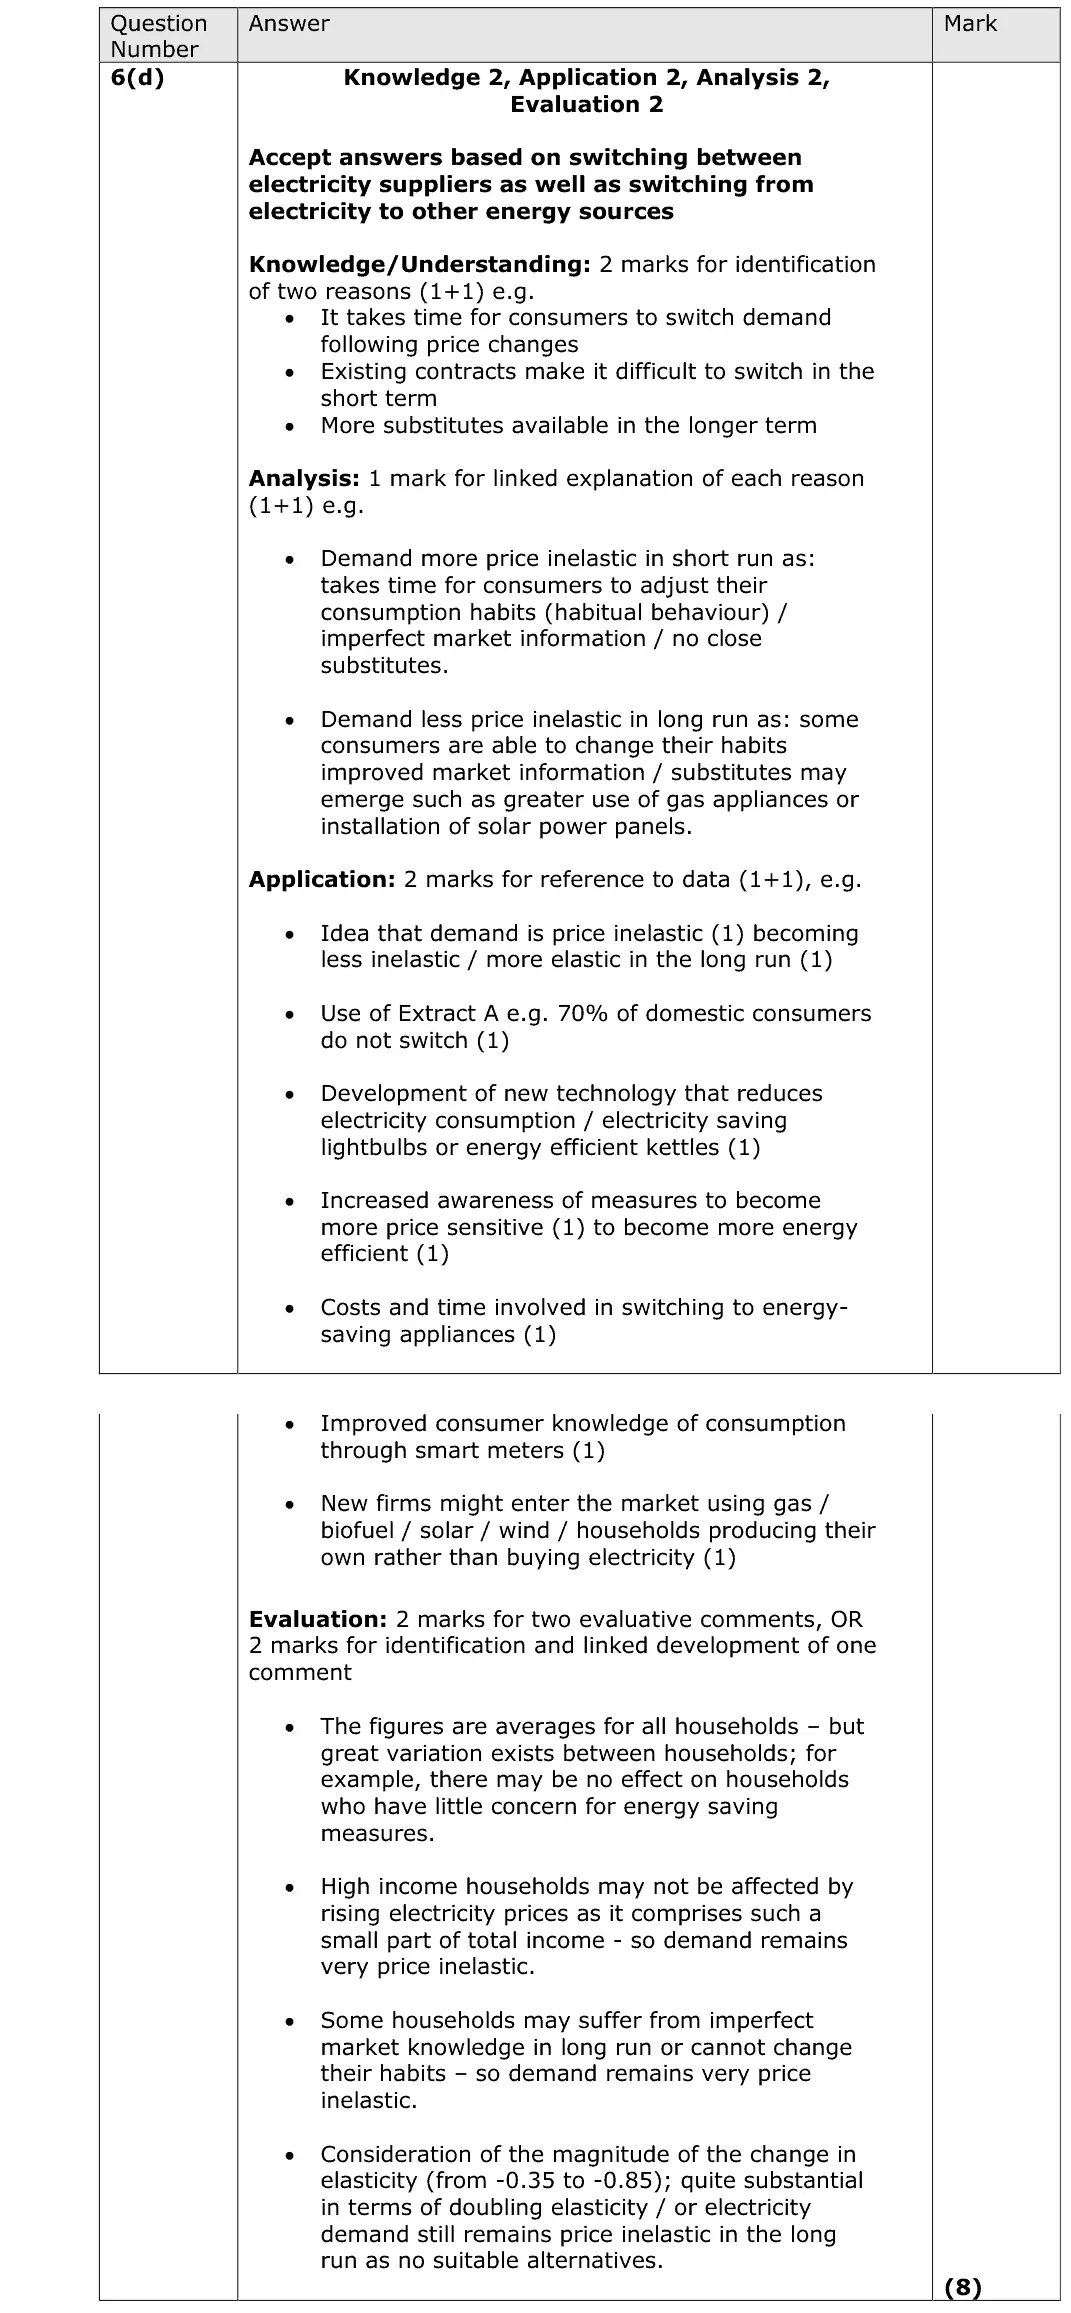
Two possible reasons for the change in price elasticity of demand in context with either two evaluative comments per reason, or one evaluation point well developed was required here. Weaker responses tended to not spot that the PED became less price inelastic in the long run and explained that it became more price inelastic with inevitably wrong reasons scoring at most 2 marks for identifying that demand was price inelastic (1) and for evaluation remains inelastic (1). Candidates seemed to have acted on the advice from last year and did usually provide two separate reasons as covered in the mark scheme; although energy prices becoming a larger proportion of income in light of falling real incomes and rising prices as illustrated in figure 1 was also a common reason. Unfortunately, with the latter there was some confusion with some candidates incorrectly stating that demand becomes less price inelastic as electricity bills take up a smaller proportion of income. Few candidates considered switching from electricity to gas and given the nature of Extract A and the majority of responses: taking time to switch demand, leave a contract or switch to substitutes such as solar panel implicitly meaning going off grid – was allowed as valid KAA. There was no mark for providing a definition but this does normally enable candidates to move their thinking and correctly respond to the question set. In this case they incorrectly defined price inelastic but by identifying electricity as price inelastic they secure one application mark and a further application mark for 70% not switching as per Extract A. Using more appliances does not answer the question indicating that they may not have been aware of what the numerical change in PED meant and its associated determinants. Ensure you carefully study and understand the entire specification – understanding of the numerical value of price elasticity of demand and its determinants was weaker than it should have been.
Notes from the mark scheme and report
PED moved from -0.35 to -0.85: demand becomes less inelastic in the long run as consumers switch suppliers or to substitutes (gas, solar), contracts end and smart meters inform them
use 70% not switching
report: weaker responses said demand became more inelastic
Quantitative skills: QS 8 (make calculations of elasticity and interpret the result); QS 9 (interpret, apply and analyse information in written, graphical tabular and numerical forms)
June 2018 · Paper 3 · Q2(d)25 marksAO1=4, AO2=4, AO3=8, AO4=925-mark essayEither/or
Data and extracts for question 2
Mark scheme, including the levels grid and indicative content
Examiner's comment
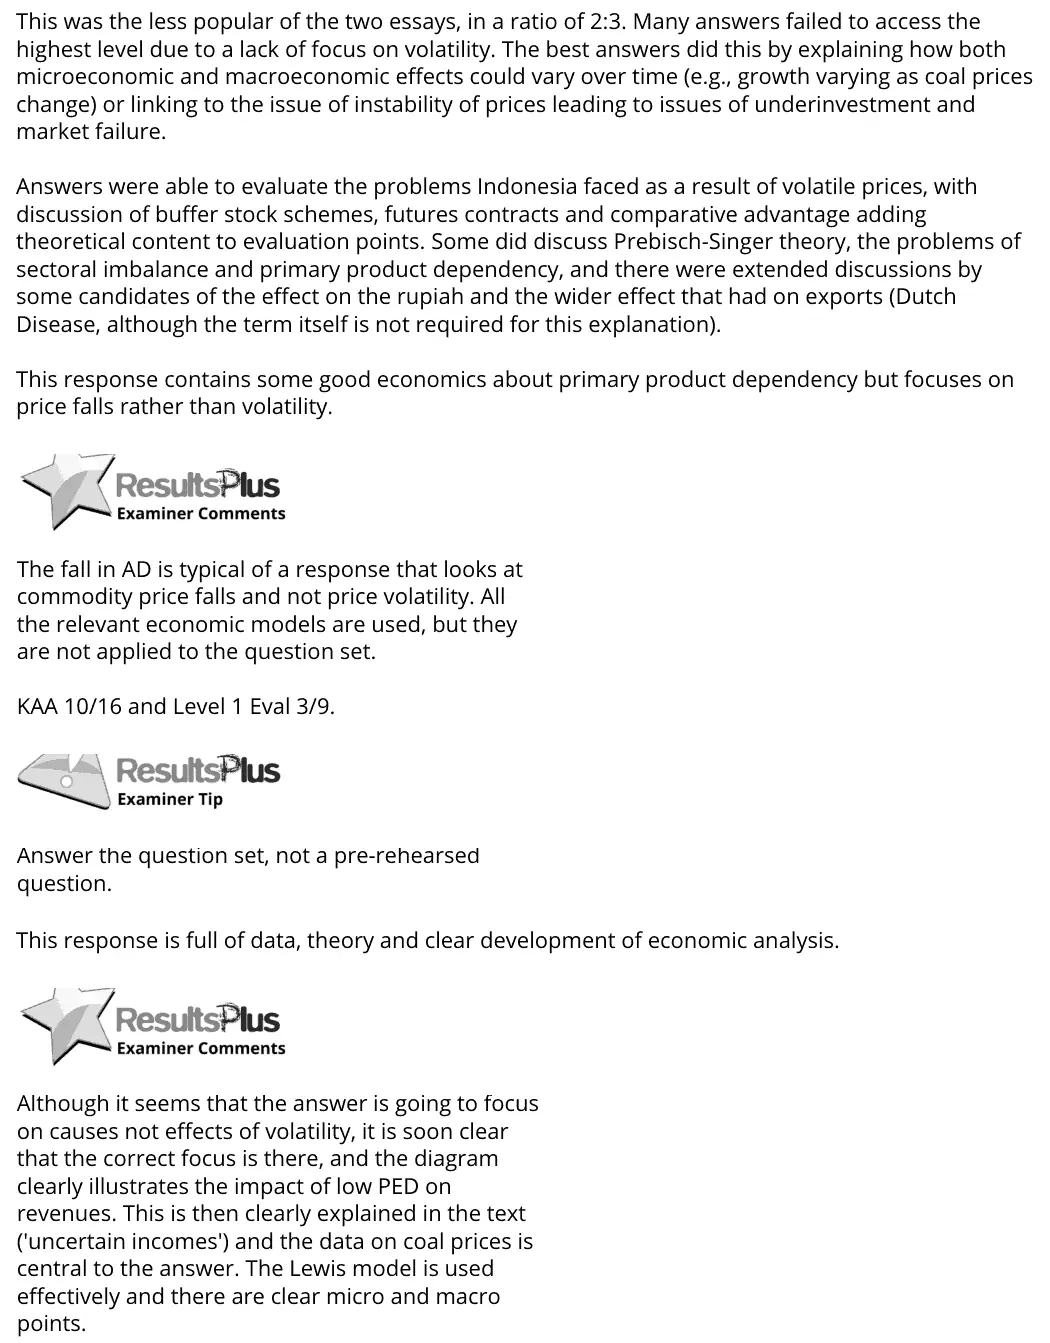
This was the less popular of the two essays, in a ratio of 2:3. Many answers failed to access the highest level due to a lack of focus on volatility. The best answers did this by explaining how both microeconomic and macroeconomic effects could vary over time (e.g., growth varying as coal prices change) or linking to the issue of instability of prices leading to issues of underinvestment and market failure. Answers were able to evaluate the problems Indonesia faced as a result of volatile prices, with discussion of buffer stock schemes, futures contracts and comparative advantage adding theoretical content to evaluation points. Some did discuss Prebisch-Singer theory, the problems of sectoral imbalance and primary product dependency, and there were extended discussions by some candidates of the effect on the rupiah and the wider effect that had on exports (Dutch Disease, although the term itself is not required for this explanation). This response contains some good economics about primary product dependency but focuses on price falls rather than volatility. The fall in AD is typical of a response that looks at commodity price falls and not price volatility. All the relevant economic models are used, but they are not applied to the question set. KAA 10/16 and Level 1 Eval 3/9. Answer the question set, not a pre-rehearsed question. This response is full of data, theory and clear development of economic analysis. Although it seems that the answer is going to focus on causes not effects of volatility, it is soon clear that the correct focus is there, and the diagram clearly illustrates the impact of low PED on revenues. This is then clearly explained in the text ('uncertain incomes') and the data on coal prices is central to the answer. The Lewis model is used effectively and there are clear micro and macro points.
Notes from the mark scheme and report
focus on volatility, not just the fall in coal prices
low PED and PES make producer revenue unstable
Level 4 needs Indonesia's context
evaluate with buffer stocks, futures contracts, fiscal expansion and GDP holding up (Figures 4 and 5)
Quantitative skills: QS 9 (interpret, apply and analyse information in written, graphical tabular and numerical forms)
June 2017 · Paper 1 · Q1(b)1 markMultiple choice
Data and extracts for question 1
Answer
C
Mark scheme
Notes from the mark scheme and report
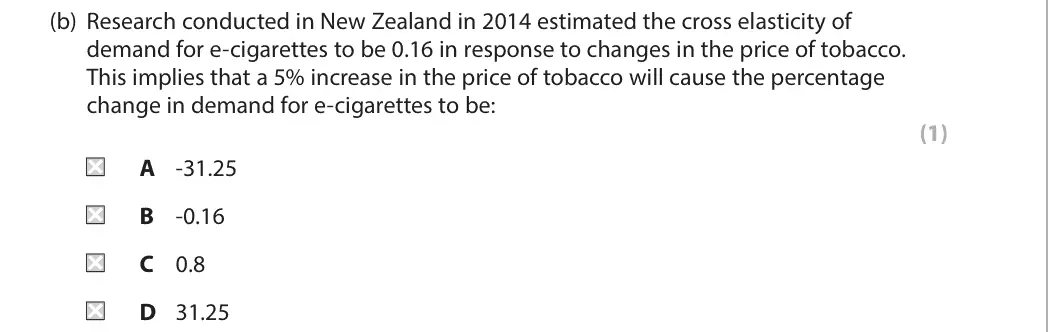
%change in Qd = XED x %change in P = 0.16 x 5 = 0.8 (C)
positive because e-cigarettes and tobacco are substitutes
A and D divide 5 by 0.16
B just restates the XED with a minus sign
Quantitative skills: QS 2 (calculate, use and understand percentages, percentage changes and percentage point changes); QS 8 (make calculations of elasticity and interpret the result)
June 2017 · Paper 1 · Q2(a)2 marksAO2=2Calculation
Data and extracts for question 2
Mark scheme
Examiner's comment
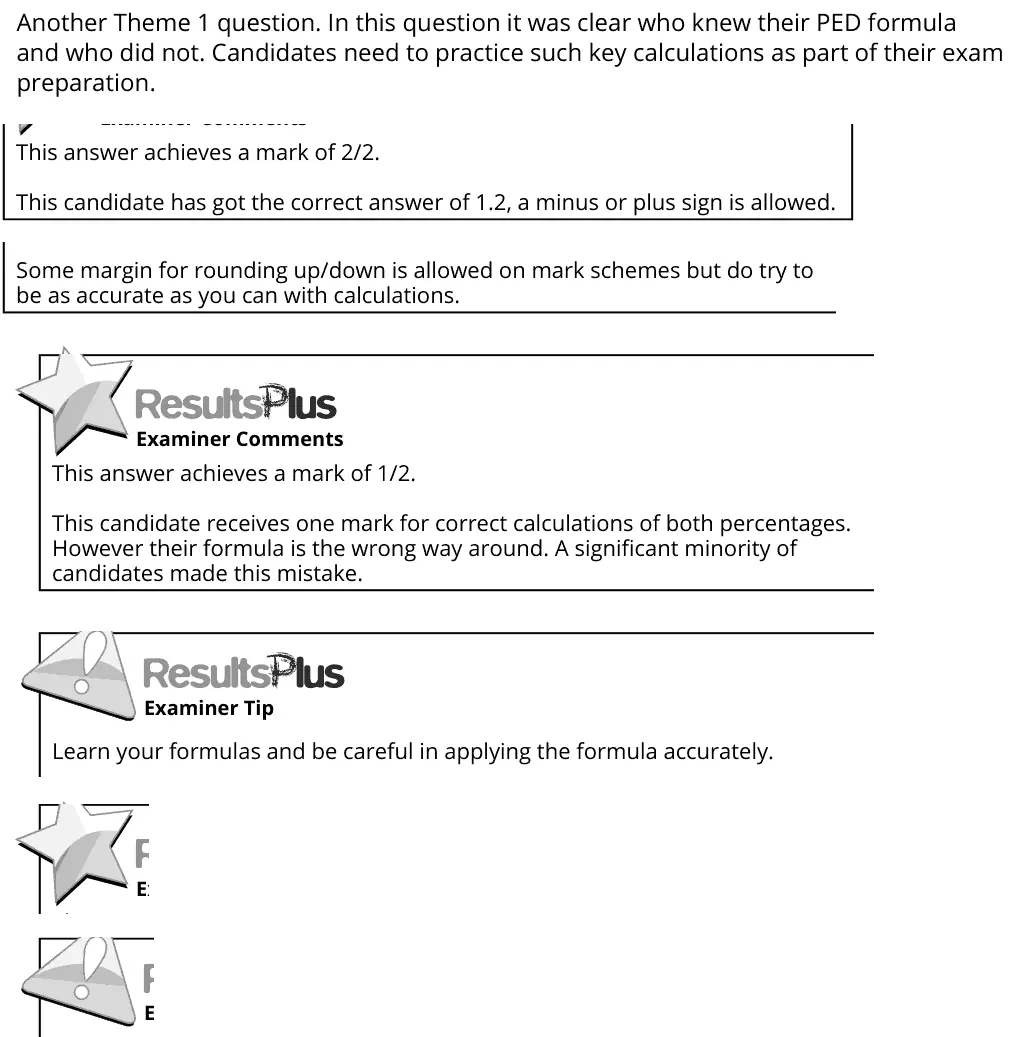
Another Theme 1 question. In this question it was clear who knew their PED formula and who did not. Candidates need to practice such key calculations as part of their exam preparation. This answer achieves a mark of 2/2. This candidate has got the correct answer of 1.2, a minus or plus sign is allowed. Some margin for rounding up/down is allowed on mark schemes but do try to be as accurate as you can with calculations. This answer achieves a mark of 1/2. This candidate receives one mark for correct calculations of both percentages. However their formula is the wrong way around. A significant minority of candidates made this mistake. Learn your formulas and be careful in applying the formula accurately.
Notes from the mark scheme and report
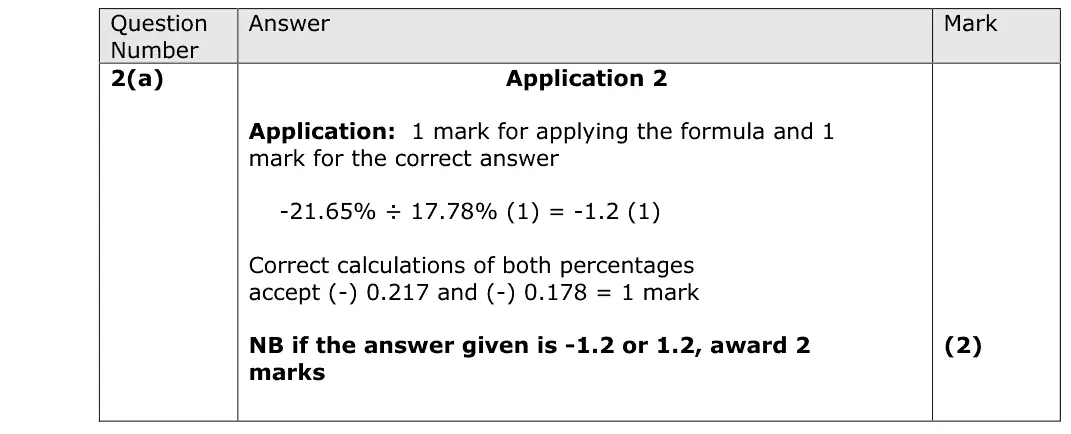
PED = %change in Qd / %change in P = -21.65 / 17.78 = -1.2
1 mark for both percentages
report: a significant minority put the formula the wrong way round
Quantitative skills: QS 2 (calculate, use and understand percentages, percentage changes and percentage point changes); QS 8 (make calculations of elasticity and interpret the result)
June 2017 · Paper 1 · Q2(b)2 marksAO1=1, AO3=1Calculation
Data and extracts for question 2
Mark scheme
Examiner's comment
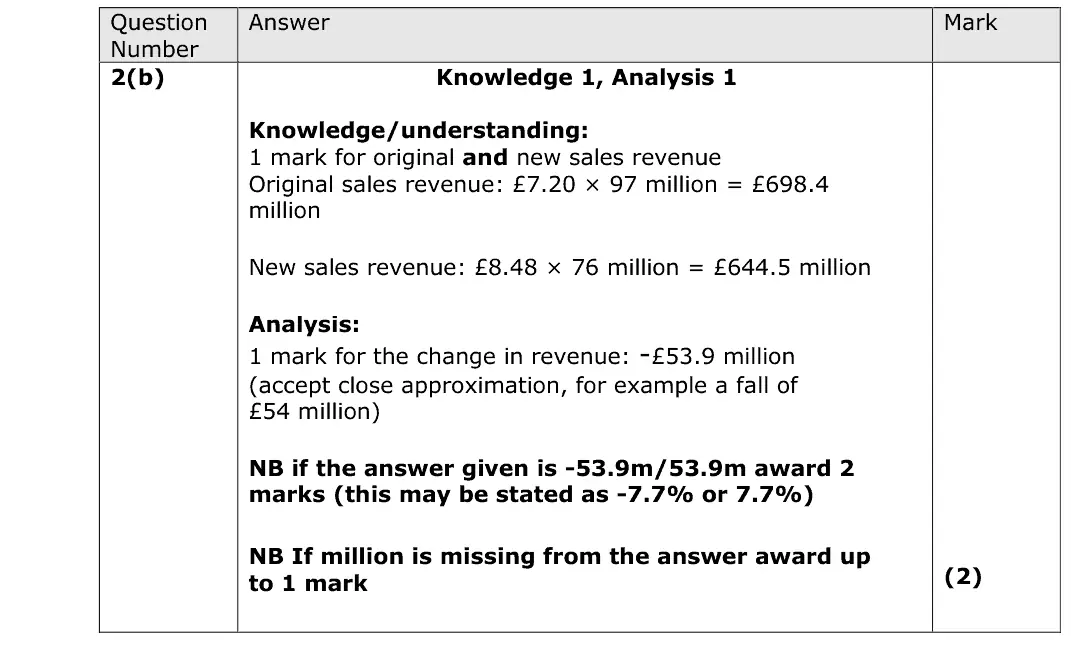
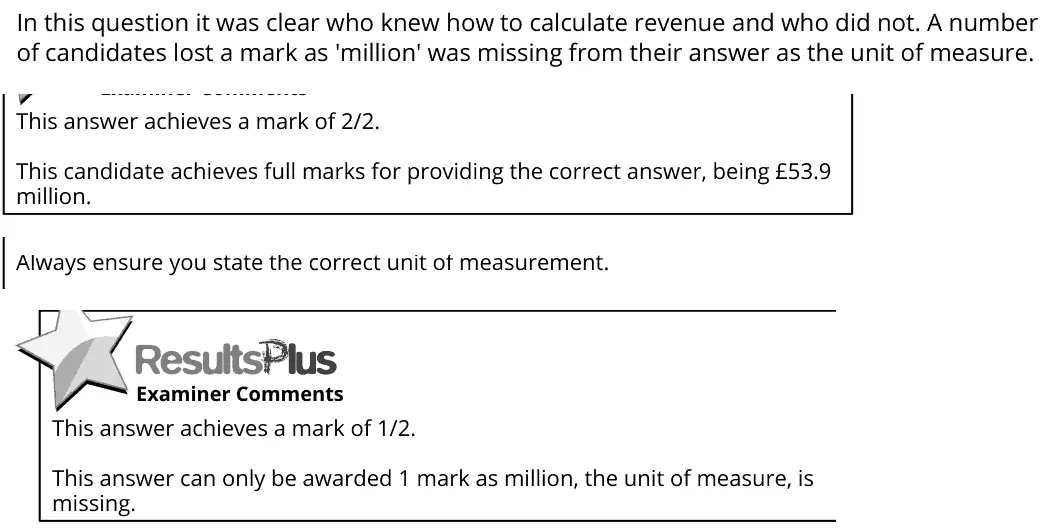
In this question it was clear who knew how to calculate revenue and who did not. A number of candidates lost a mark as 'million' was missing from their answer as the unit of measure. This answer achieves a mark of 2/2. This candidate achieves full marks for providing the correct answer, being £53.9 million. Always ensure you state the correct unit of measurement. This answer achieves a mark of 1/2. This answer can only be awarded 1 mark as million, the unit of measure, is missing.
Notes from the mark scheme and report
TR = P x Q: £7.20 x 97m = £698.4m and £8.48 x 76m = £644.5m, a fall of £53.9 million
leaving out "million" loses a mark (common, per report)
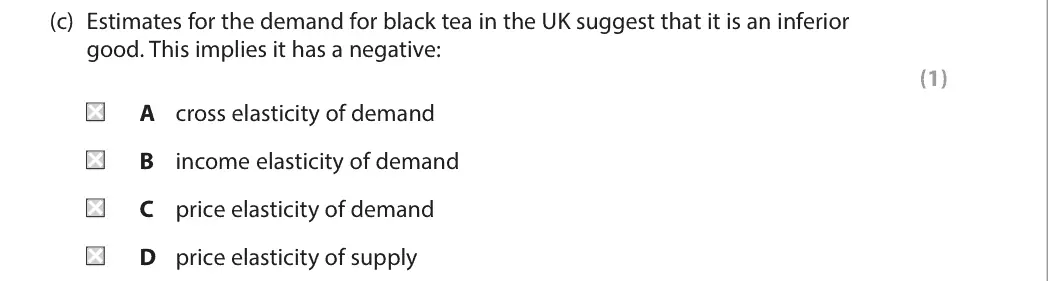
an inferior good has a negative income elasticity of demand (B)
negative XED means complements, negative PED is normal for any good, PES is a supply concept
June 2017 · AS Paper 1 · Q6(c)6 marksAO1=2, AO2=2, AO3=2Short answer
Data and extracts for question 6
Mark scheme
Examiner's comment
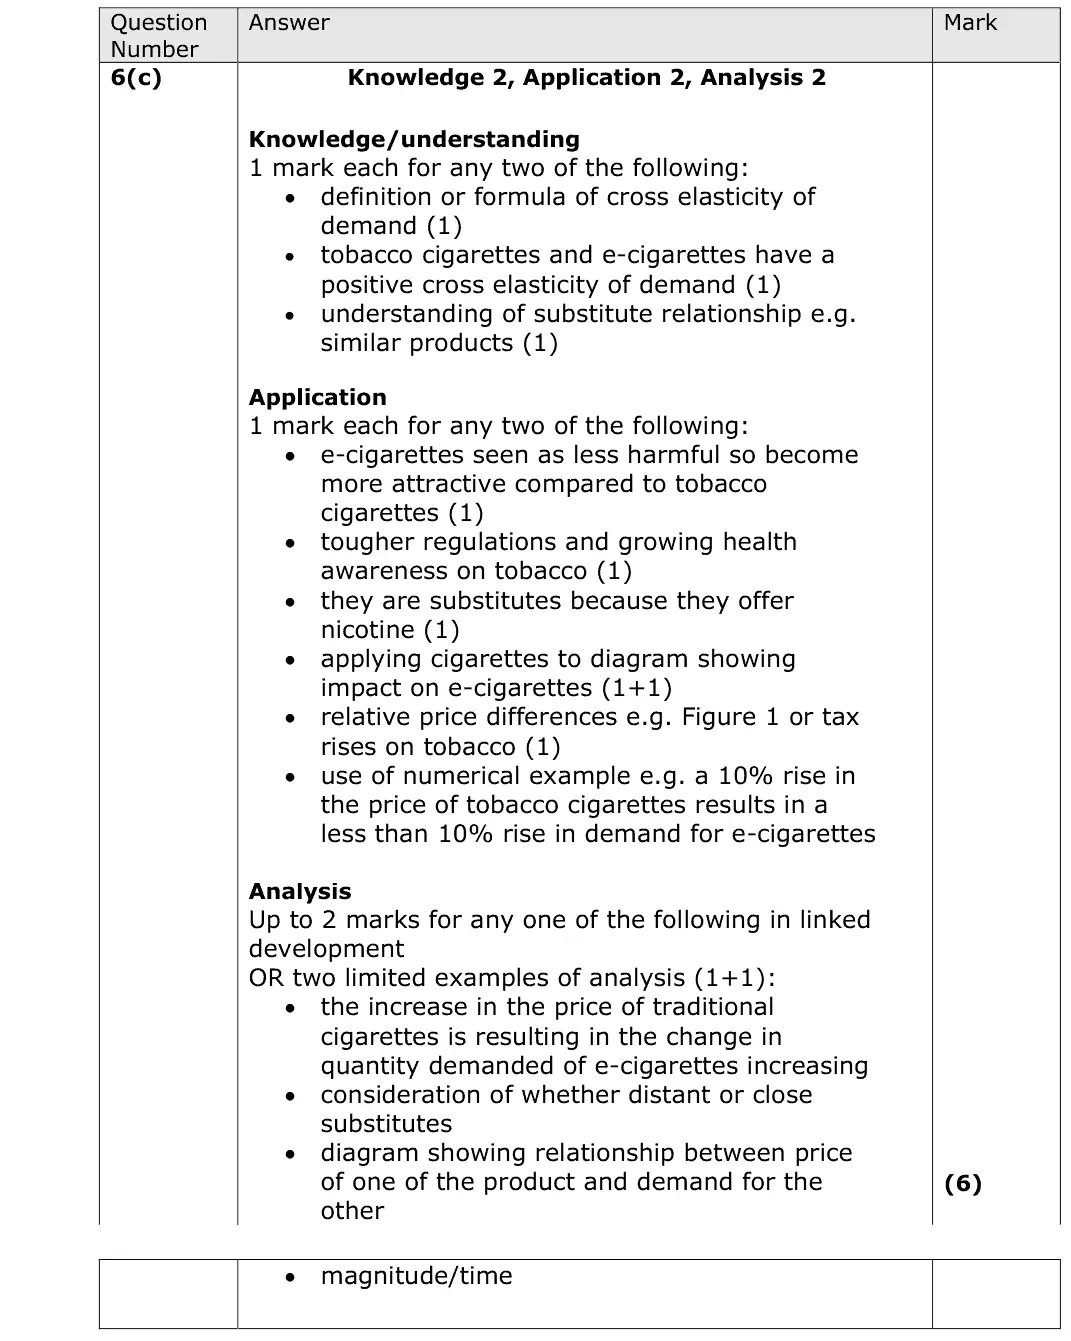
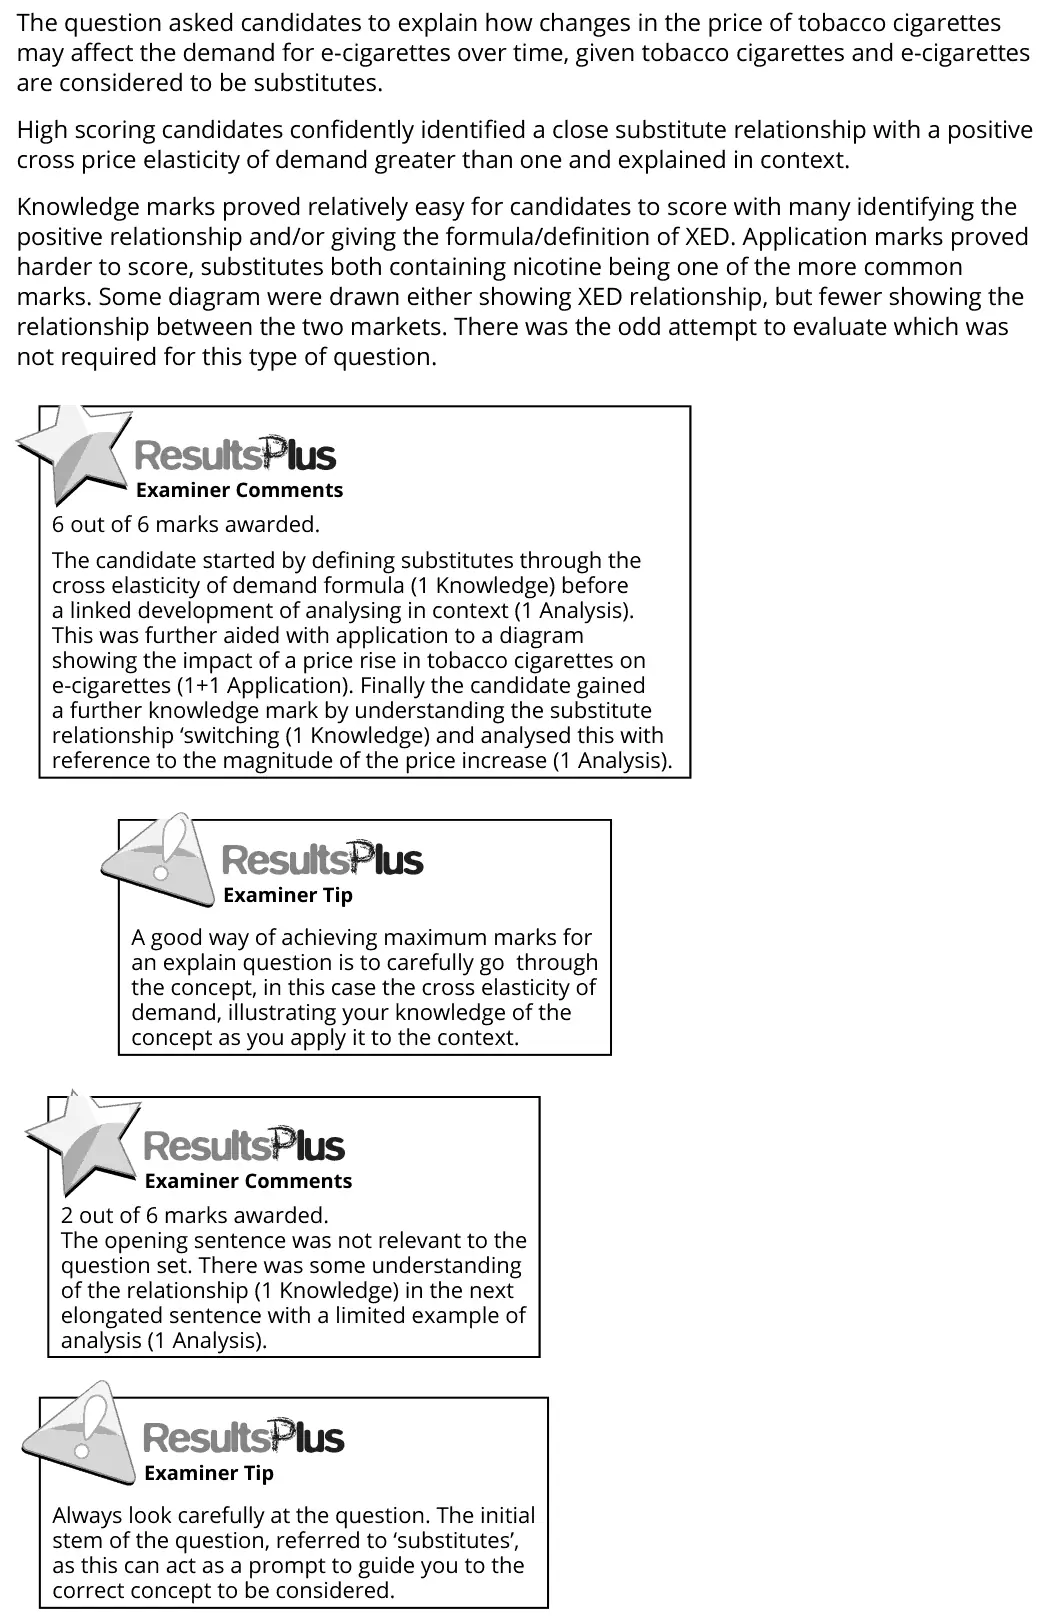
The question asked candidates to explain how changes in the price of tobacco cigarettes may affect the demand for e-cigarettes over time, given tobacco cigarettes and e-cigarettes are considered to be substitutes. High scoring candidates confidently identified a close substitute relationship with a positive cross price elasticity of demand greater than one and explained in context. Knowledge marks proved relatively easy for candidates to score with many identifying the positive relationship and/or giving the formula/definition of XED. Application marks proved harder to score, substitutes both containing nicotine being one of the more common marks. Some diagram were drawn either showing XED relationship, but fewer showing the relationship between the two markets. There was the odd attempt to evaluate which was not required for this type of question. 6 out of 6 marks awarded. The candidate started by defining substitutes through the cross elasticity of demand formula (1 Knowledge) before a linked development of analysing in context (1 Analysis). This was further aided with application to a diagram showing the impact of a price rise in tobacco cigarettes on e-cigarettes (1+1 Application). Finally the candidate gained a further knowledge mark by understanding the substitute relationship ‘switching (1 Knowledge) and analysed this with reference to the magnitude of the price increase (1 Analysis). A good way of achieving maximum marks for an explain question is to carefully go through the concept, in this case the cross elasticity of demand, illustrating your knowledge of the concept as you apply it to the context. 2 out of 6 marks awarded. The opening sentence was not relevant to the question set. There was some understanding of the relationship (1 Knowledge) in the next elongated sentence with a limited example of analysis (1 Analysis). Always look carefully at the question. The initial stem of the question, referred to ‘substitutes’, as this can act as a prompt to guide you to the correct concept to be considered.
Notes from the mark scheme and report
substitutes with positive cross elasticity of demand: a rise in the price of tobacco cigarettes raises demand for e-cigarettes, more so over time
application was harder (both contain nicotine, health awareness, Figure 1 prices)
no evaluation needed
Quantitative skills: QS 8 (make calculations of elasticity and interpret the result)
June 2017 · AS Paper 1 · Q6(d)4 marksAO1=2, AO2=2Calculation
Data and extracts for question 6
Mark scheme
Examiner's comment
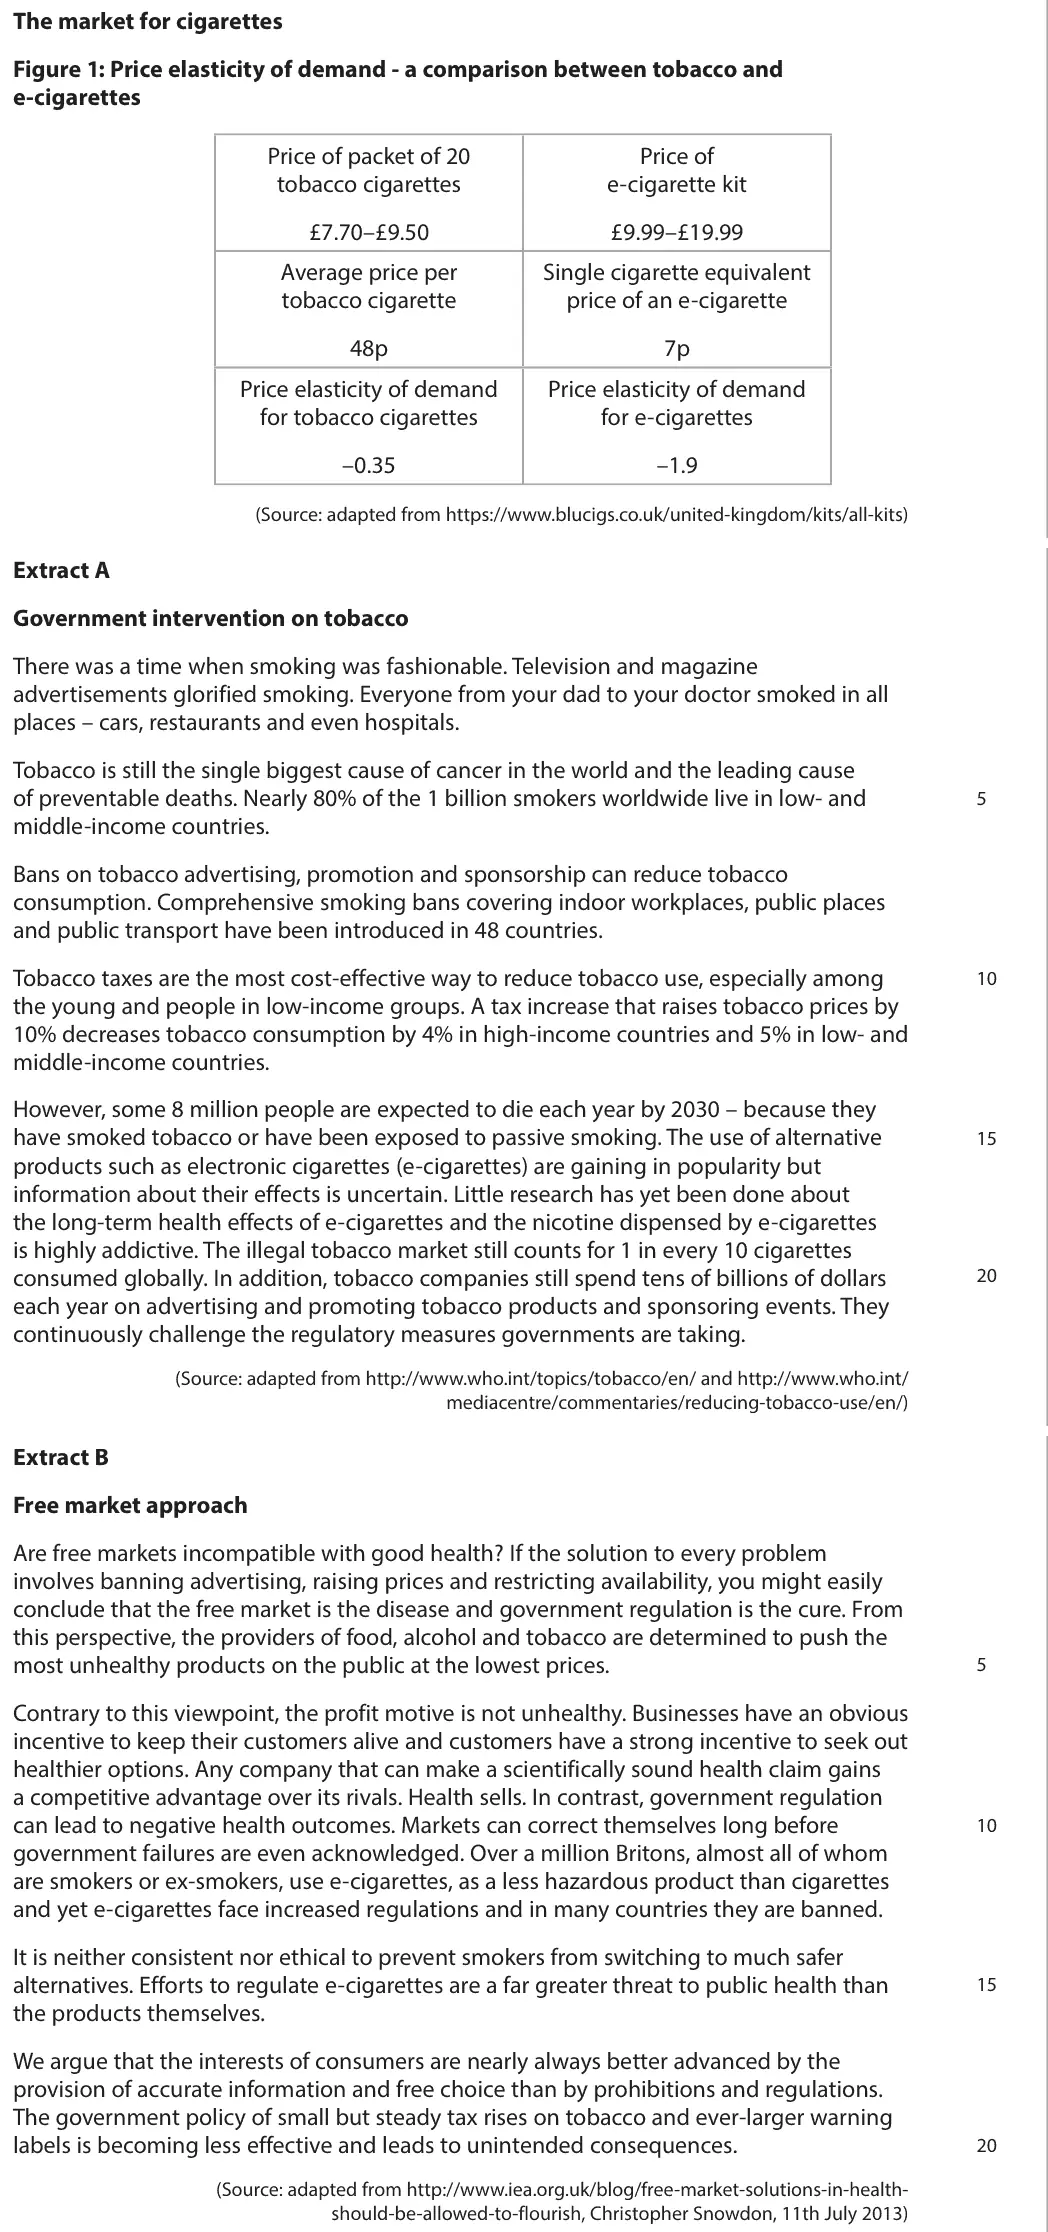
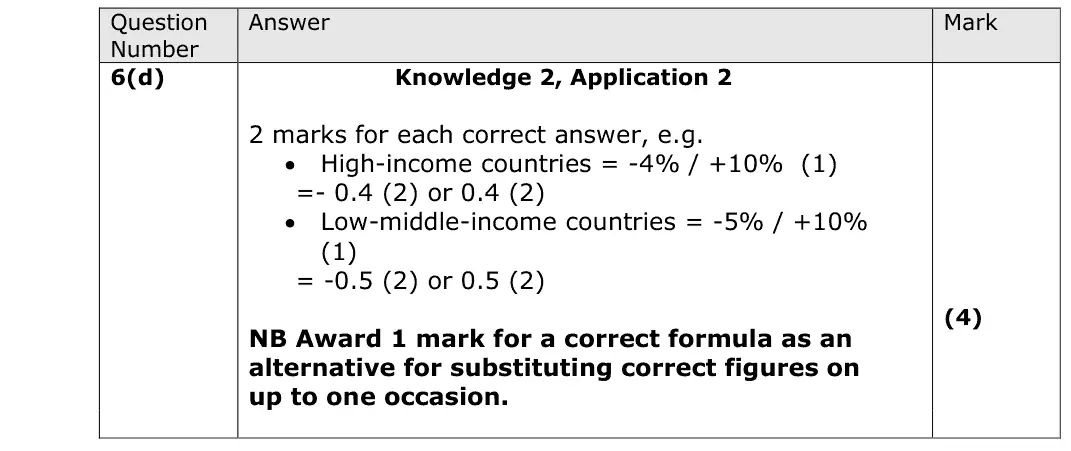
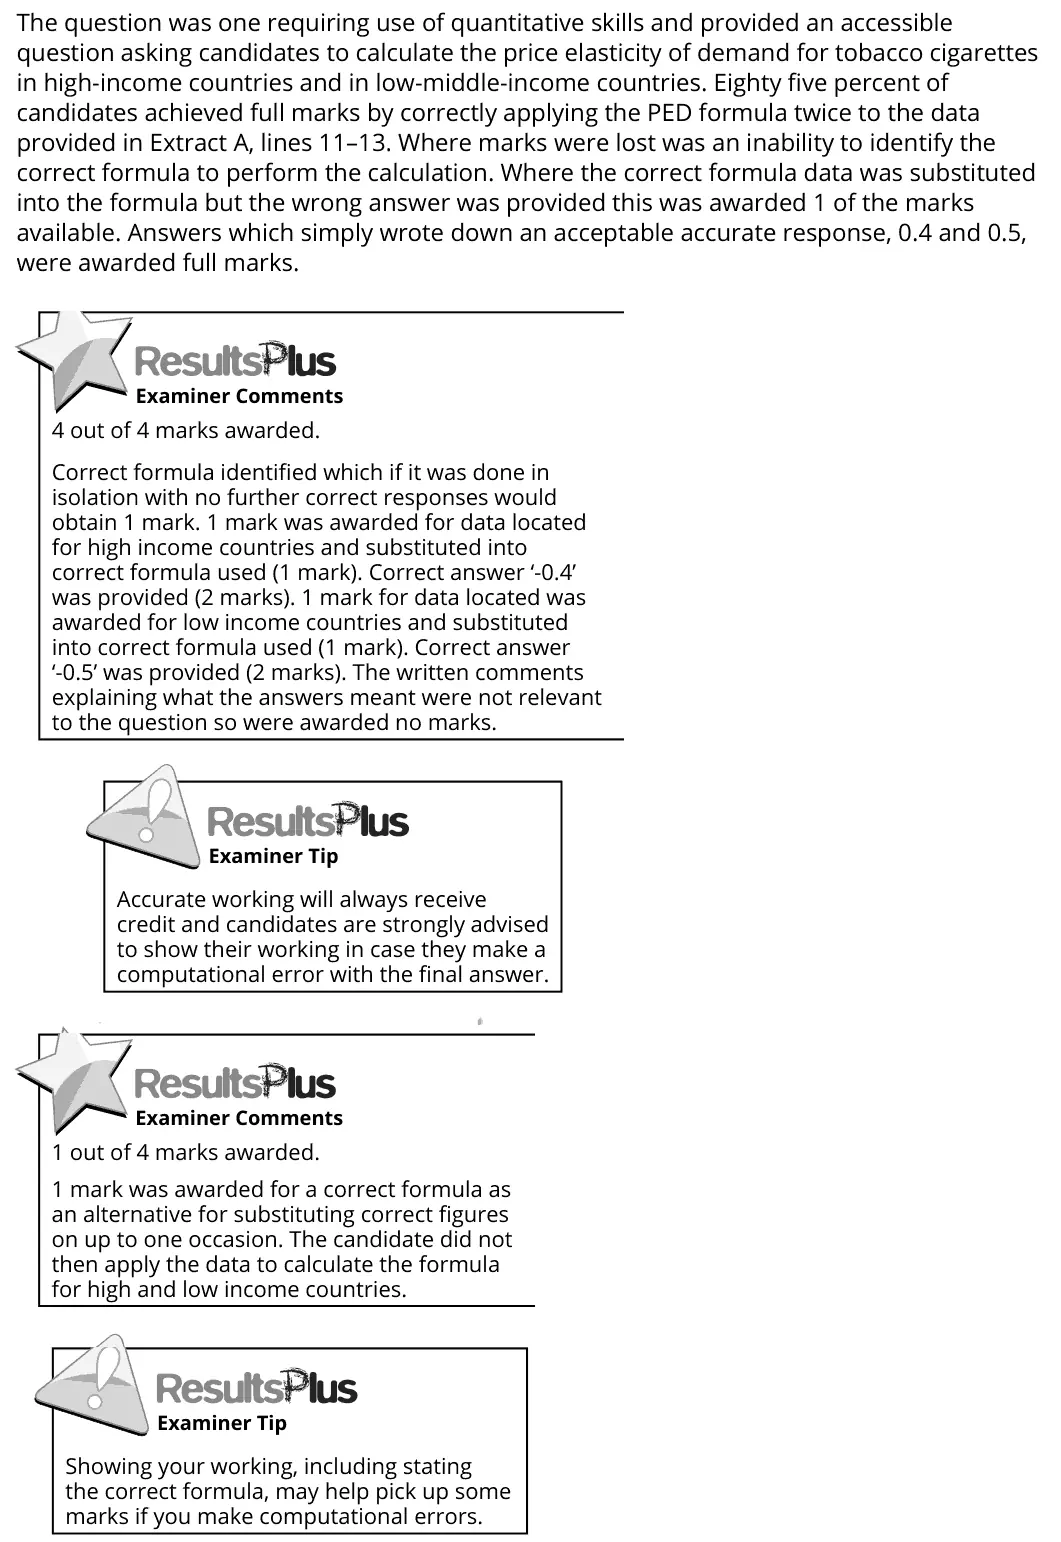
The question was one requiring use of quantitative skills and provided an accessible question asking candidates to calculate the price elasticity of demand for tobacco cigarettes in high-income countries and in low-middle-income countries. Eighty five percent of candidates achieved full marks by correctly applying the PED formula twice to the data provided in Extract A, lines 11–13. Where marks were lost was an inability to identify the correct formula to perform the calculation. Where the correct formula data was substituted into the formula but the wrong answer was provided this was awarded 1 of the marks available. Answers which simply wrote down an acceptable accurate response, 0.4 and 0.5, were awarded full marks. 4 out of 4 marks awarded. Correct formula identified which if it was done in isolation with no further correct responses would obtain 1 mark. 1 mark was awarded for data located for high income countries and substituted into correct formula used (1 mark). Correct answer ‘-0.4’ was provided (2 marks). 1 mark for data located was awarded for low income countries and substituted into correct formula used (1 mark). Correct answer ‘-0.5’ was provided (2 marks). The written comments explaining what the answers meant were not relevant to the question so were awarded no marks. Accurate working will always receive credit and candidates are strongly advised to show their working in case they make a computational error with the final answer. 1 out of 4 marks awarded. 1 mark was awarded for a correct formula as an alternative for substituting correct figures on up to one occasion. The candidate did not then apply the data to calculate the formula for high and low income countries. Showing your working, including stating the correct formula, may help pick up some marks if you make computational errors.
Notes from the mark scheme and report
PED = %change Qd / %change P: high income -4 / 10 = -0.4
low-middle income -5 / 10 = -0.5
85% scored full marks
a correct formula alone earns 1
Quantitative skills: QS 2 (calculate, use and understand percentages, percentage changes and percentage point changes); QS 8 (make calculations of elasticity and interpret the result)
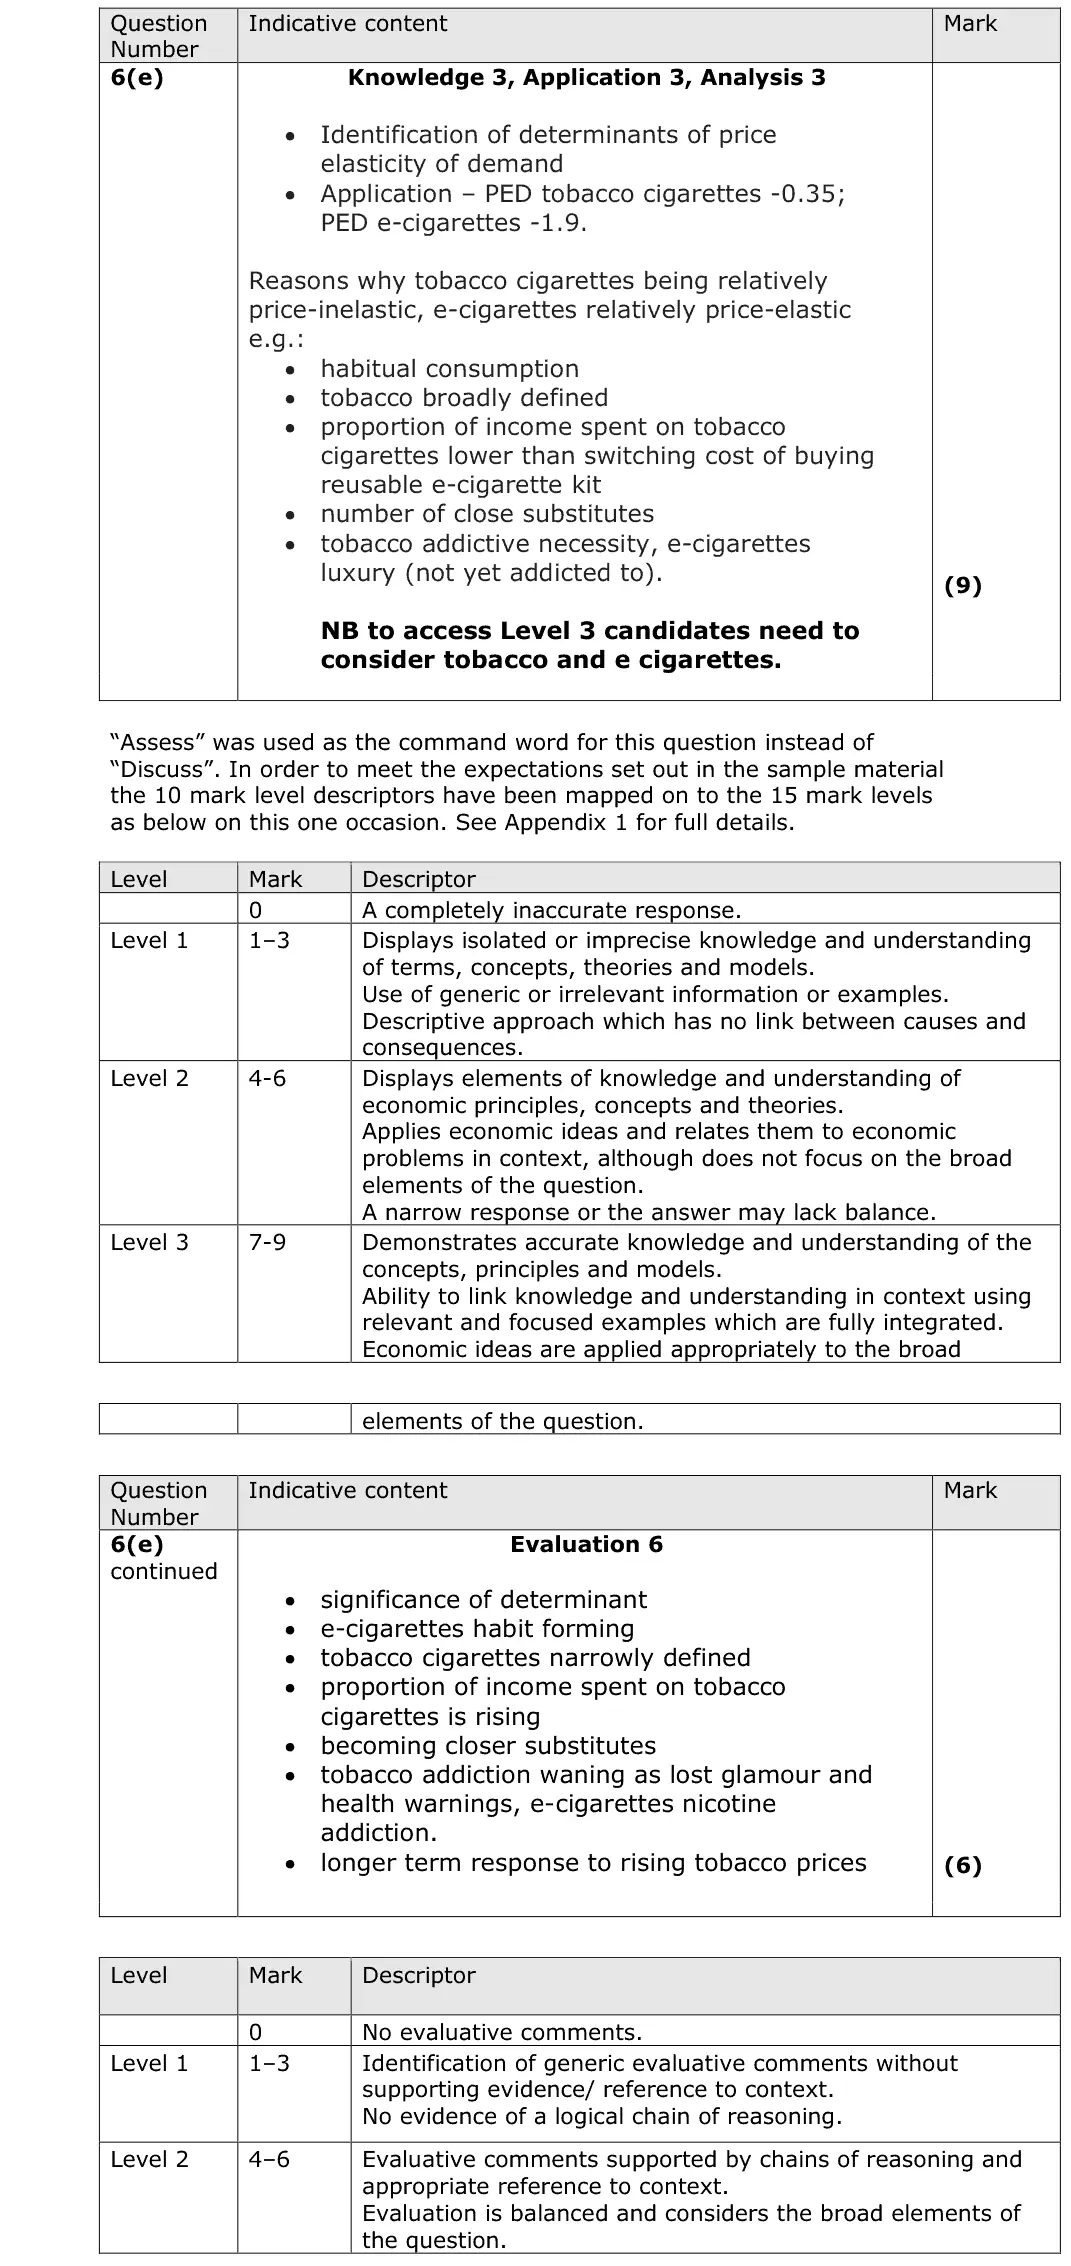
June 2017 · AS Paper 1 · Q6(e)15 marksAO1=3, AO2=3, AO3=3, AO4=615-mark response
Data and extracts for question 6
Mark scheme, including the levels grid and indicative content
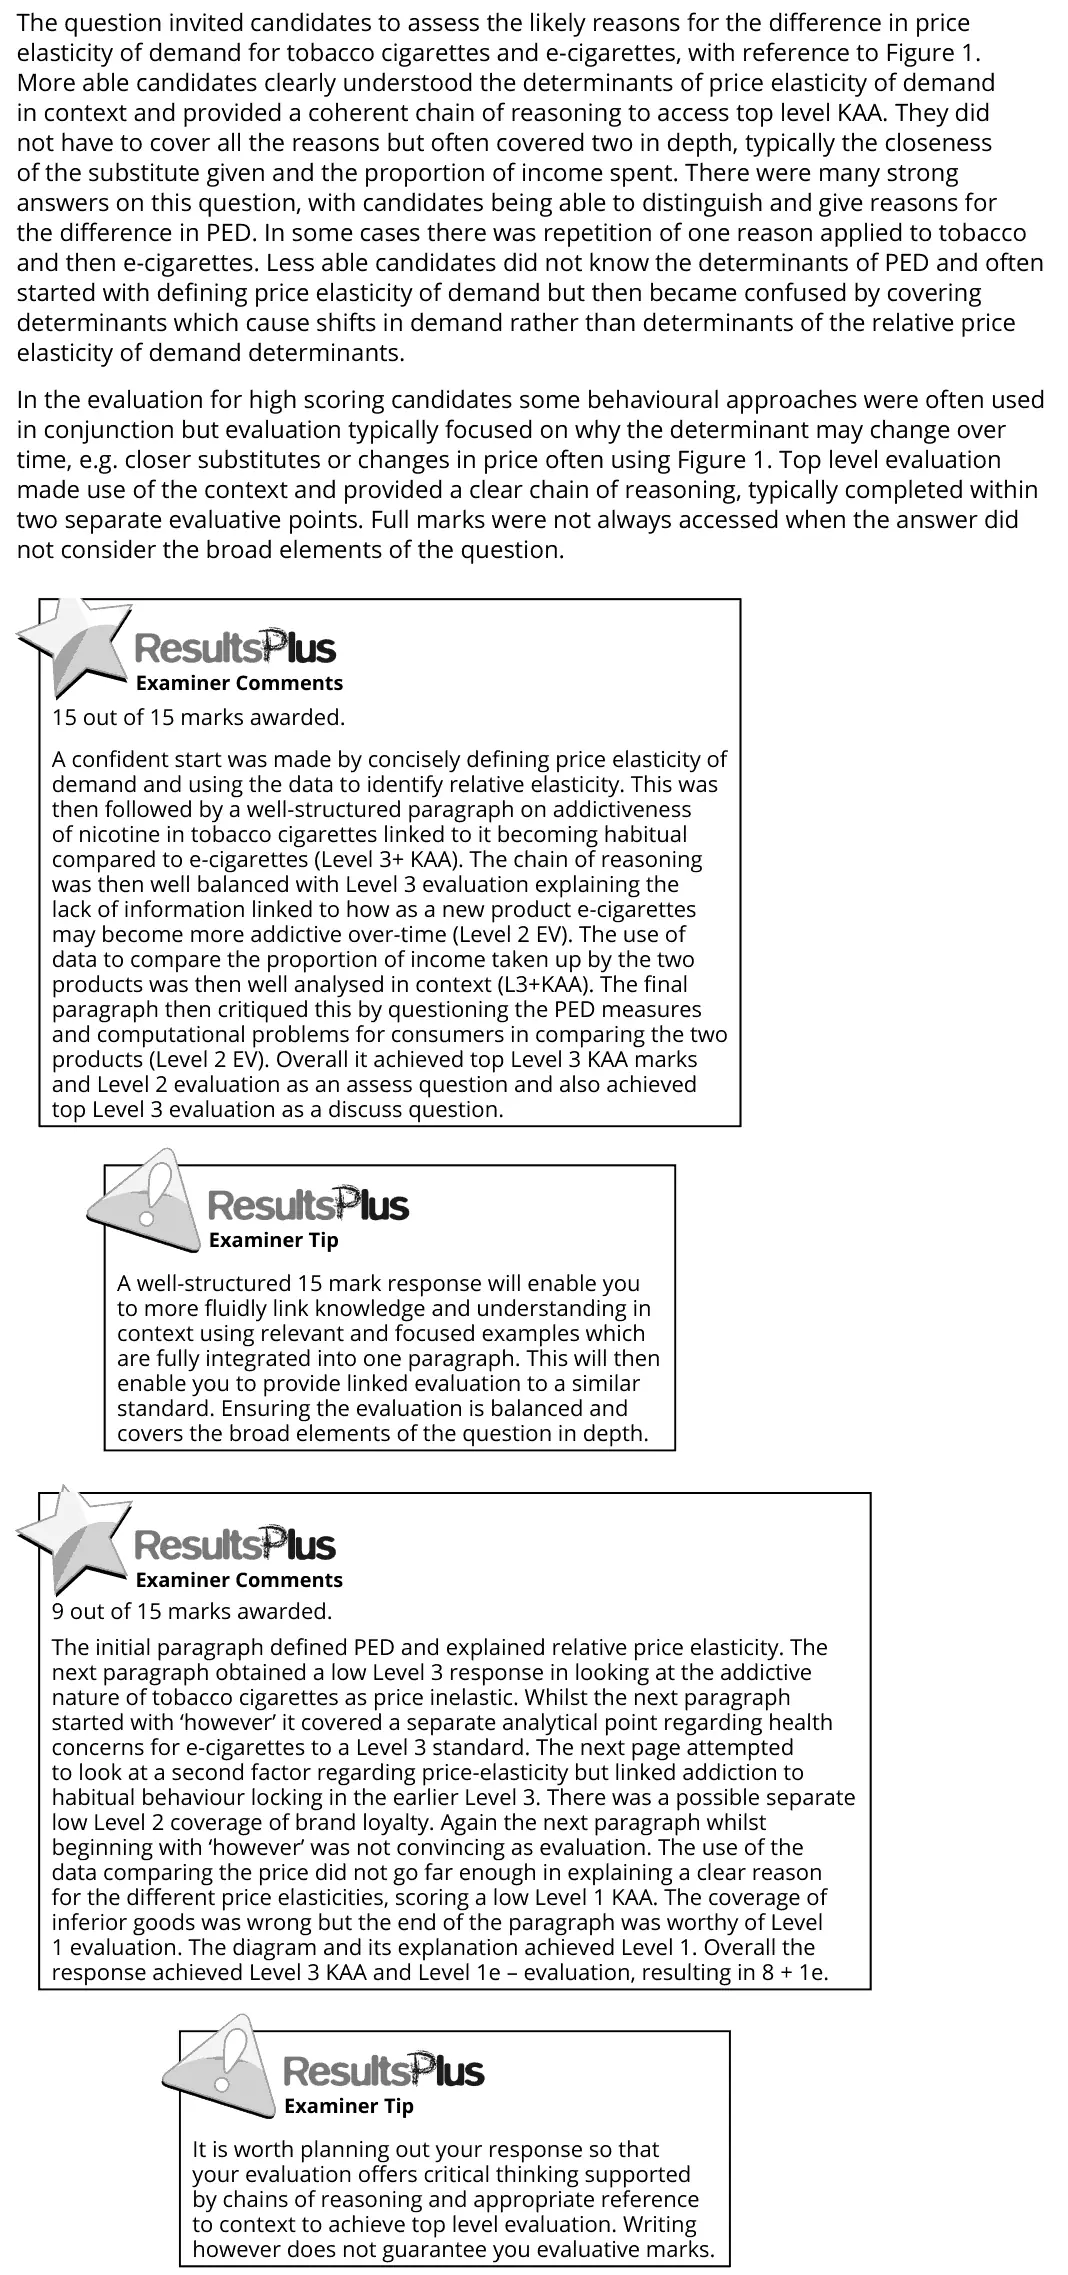
Examiner's comment
The question invited candidates to assess the likely reasons for the difference in price elasticity of demand for tobacco cigarettes and e-cigarettes, with reference to Figure 1. More able candidates clearly understood the determinants of price elasticity of demand in context and provided a coherent chain of reasoning to access top level KAA. They did not have to cover all the reasons but often covered two in depth, typically the closeness of the substitute given and the proportion of income spent. There were many strong answers on this question, with candidates being able to distinguish and give reasons for the difference in PED. In some cases there was repetition of one reason applied to tobacco and then e-cigarettes. Less able candidates did not know the determinants of PED and often started with defining price elasticity of demand but then became confused by covering determinants which cause shifts in demand rather than determinants of the relative price elasticity of demand determinants. In the evaluation for high scoring candidates some behavioural approaches were often used in conjunction but evaluation typically focused on why the determinant may change over time, e.g. closer substitutes or changes in price often using Figure 1. Top level evaluation made use of the context and provided a clear chain of reasoning, typically completed within two separate evaluative points. Full marks were not always accessed when the answer did not consider the broad elements of the question. 15 out of 15 marks awarded. A confident start was made by concisely defining price elasticity of demand and using the data to identify relative elasticity. This was then followed by a well-structured paragraph on addictiveness of nicotine in tobacco cigarettes linked to it becoming habitual compared to e-cigarettes (Level 3+ KAA). The chain of reasoning was then well balanced with Level 3 evaluation explaining the lack of information linked to how as a new product e-cigarettes may become more addictive over-time (Level 2 EV). The use of data to compare the proportion of income taken up by the two products was then well analysed in context (L3+KAA). The final paragraph then critiqued this by questioning the PED measures and computational problems for consumers in comparing the two products (Level 2 EV). Overall it achieved top Level 3 KAA marks and Level 2 evaluation as an assess question and also achieved top Level 3 evaluation as a discuss question. A well-structured 15 mark response will enable you to more fluidly link knowledge and understanding in context using relevant and focused examples which are fully integrated into one paragraph. This will then enable you to provide linked evaluation to a similar standard. Ensuring the evaluation is balanced and covers the broad elements of the question in depth. 9 out of 15 marks awarded. The initial paragraph defined PED and explained relative price elasticity. The next paragraph obtained a low Level 3 response in looking at the addictive nature of tobacco cigarettes as price inelastic. Whilst the next paragraph started with ‘however’ it covered a separate analytical point regarding health concerns for e-cigarettes to a Level 3 standard. The next page attempted to look at a second factor regarding price-elasticity but linked addiction to habitual behaviour locking in the earlier Level 3. There was a possible separate low Level 2 coverage of brand loyalty. Again the next paragraph whilst beginning with ‘however’ was not convincing as evaluation. The use of the data comparing the price did not go far enough in explaining a clear reason for the different price elasticities, scoring a low Level 1 KAA. The coverage of inferior goods was wrong but the end of the paragraph was worthy of Level 1 evaluation. The diagram and its explanation achieved Level 1. Overall the response achieved Level 3 KAA and Level 1e – evaluation, resulting in 8 + 1e. It is worth planning out your response so that your evaluation offers critical thinking supported by chains of reasoning and appropriate reference to context to achieve top level evaluation. Writing however does not guarantee you evaluative marks.
Notes from the mark scheme and report
-0.35 vs -1.9: habit and addiction, closeness of substitutes, how broadly defined, proportion of income
Level 3 needs both tobacco and e-cigarettes
weaker answers gave factors that shift demand instead of determinants of PED
evaluate how determinants change over time
Quantitative skills: QS 8 (make calculations of elasticity and interpret the result); QS 9 (interpret, apply and analyse information in written, graphical tabular and numerical forms)
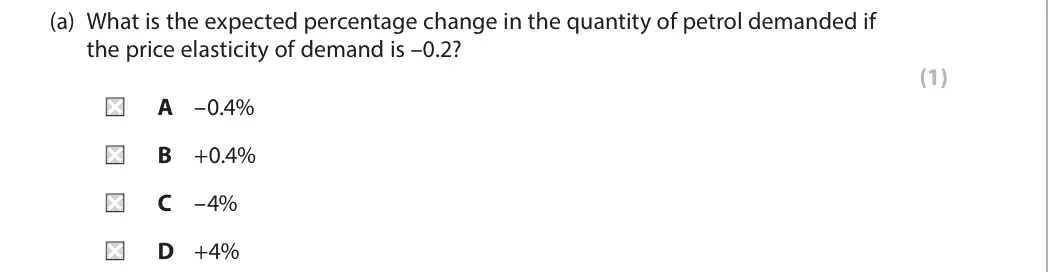
June 2016 · AS Paper 1 · Q5(a)1 markMultiple choice
Data and extracts for question 5
Answer
D
Mark scheme
Notes from the mark scheme and report
%change in Qd = PED x %change in P = -0.2 x -20 = +4% (D)
A and B misplace the decimal, C has the wrong sign
Quantitative skills: QS 2 (calculate, use and understand percentages, percentage changes and percentage point changes); QS 8 (make calculations of elasticity and interpret the result)
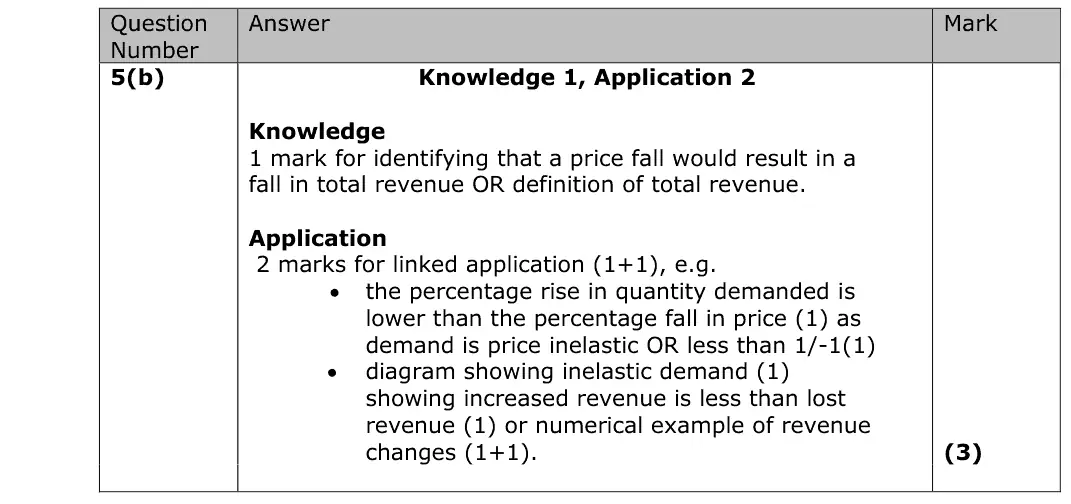
June 2016 · AS Paper 1 · Q5(b)3 marksAO1=1, AO2=2Short answer
Data and extracts for question 5
Mark scheme
Examiner's comment
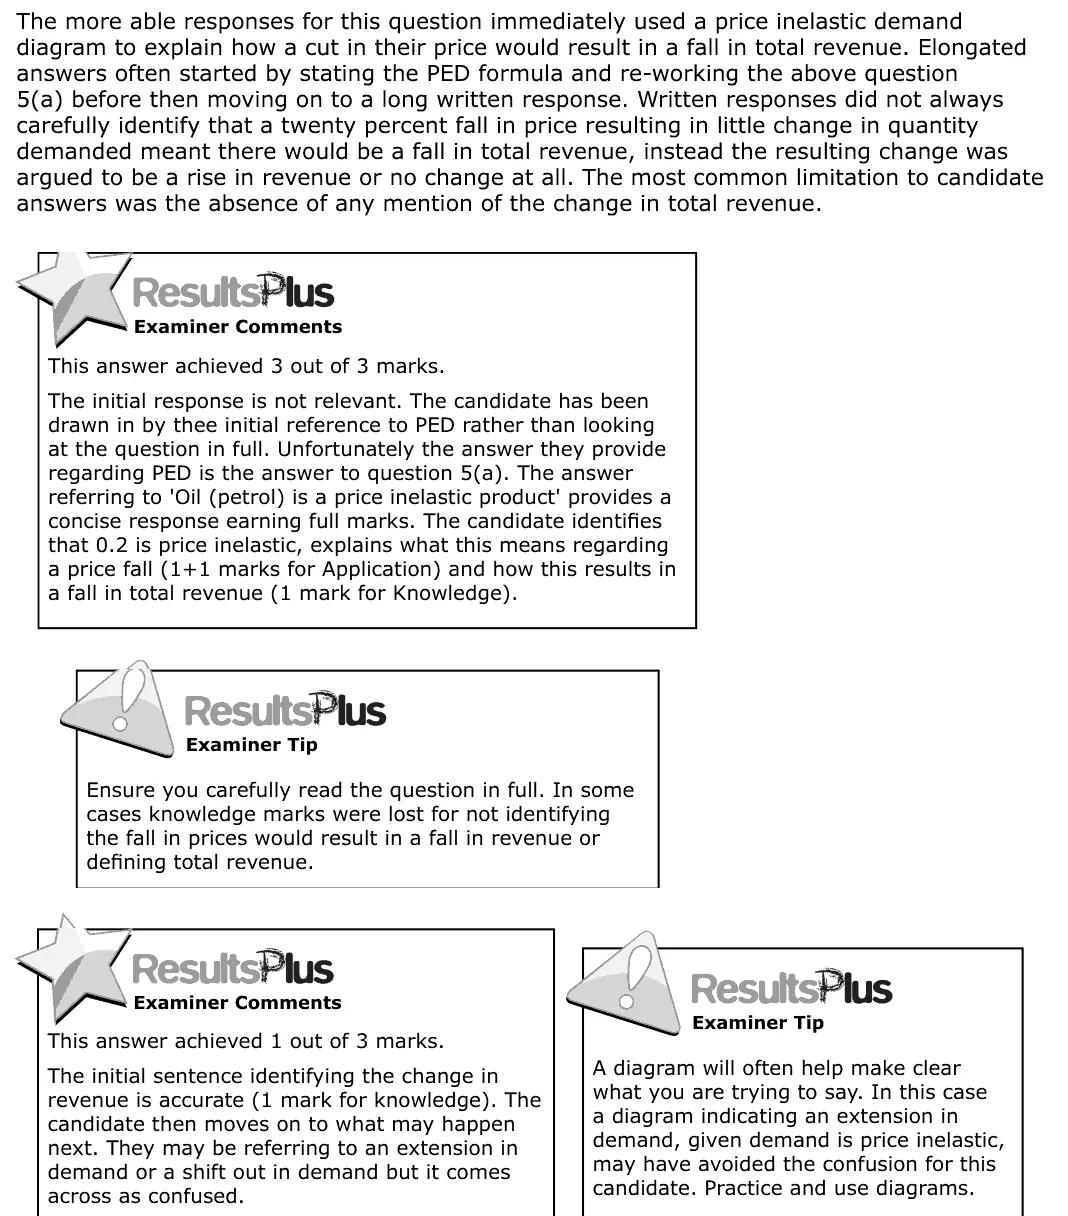
The more able responses for this question immediately used a price inelastic demand diagram to explain how a cut in their price would result in a fall in total revenue. Elongated answers often started by stating the PED formula and re-working the above question 5(a) before then moving on to a long written response. Written responses did not always carefully identify that a twenty percent fall in price resulting in little change in quantity demanded meant there would be a fall in total revenue, instead the resulting change was argued to be a rise in revenue or no change at all. The most common limitation to candidate answers was the absence of any mention of the change in total revenue. This answer achieved 3 out of 3 marks. The initial response is not relevant. The candidate has been drawn in by thee initial reference to PED rather than looking at the question in full. Unfortunately the answer they provide regarding PED is the answer to question 5(a). The answer referring to 'Oil (petrol) is a price inelastic product' provides a concise response earning full marks. The candidate identifies that 0.2 is price inelastic, explains what this means regarding a price fall (1+1 marks for Application) and how this results in a fall in total revenue (1 mark for Knowledge). Ensure you carefully read the question in full. In some cases knowledge marks were lost for not identifying the fall in prices would result in a fall in revenue or defining total revenue. This answer achieved 1 out of 3 marks. The initial sentence identifying the change in revenue is accurate (1 mark for knowledge). The candidate then moves on to what may happen next. They may be referring to an extension in demand or a shift out in demand but it comes across as confused. A diagram will often help make clear what you are trying to say. In this case a diagram indicating an extension in demand, given demand is price inelastic, may have avoided the confusion for this candidate. Practice and use diagrams.
Notes from the mark scheme and report
demand is price inelastic (less than 1), so the % rise in quantity is smaller than the 20% fall in price and total revenue falls
many said revenue rises or did not state the change in total revenue at all
Quantitative skills: QS 8 (make calculations of elasticity and interpret the result)
June 2016 · AS Paper 1 · Q6(b)10 marksAO1=2, AO2=2, AO3=2, AO4=410-mark response
Data and extracts for question 6
Mark scheme, including the levels grid and indicative content
Examiner's comment
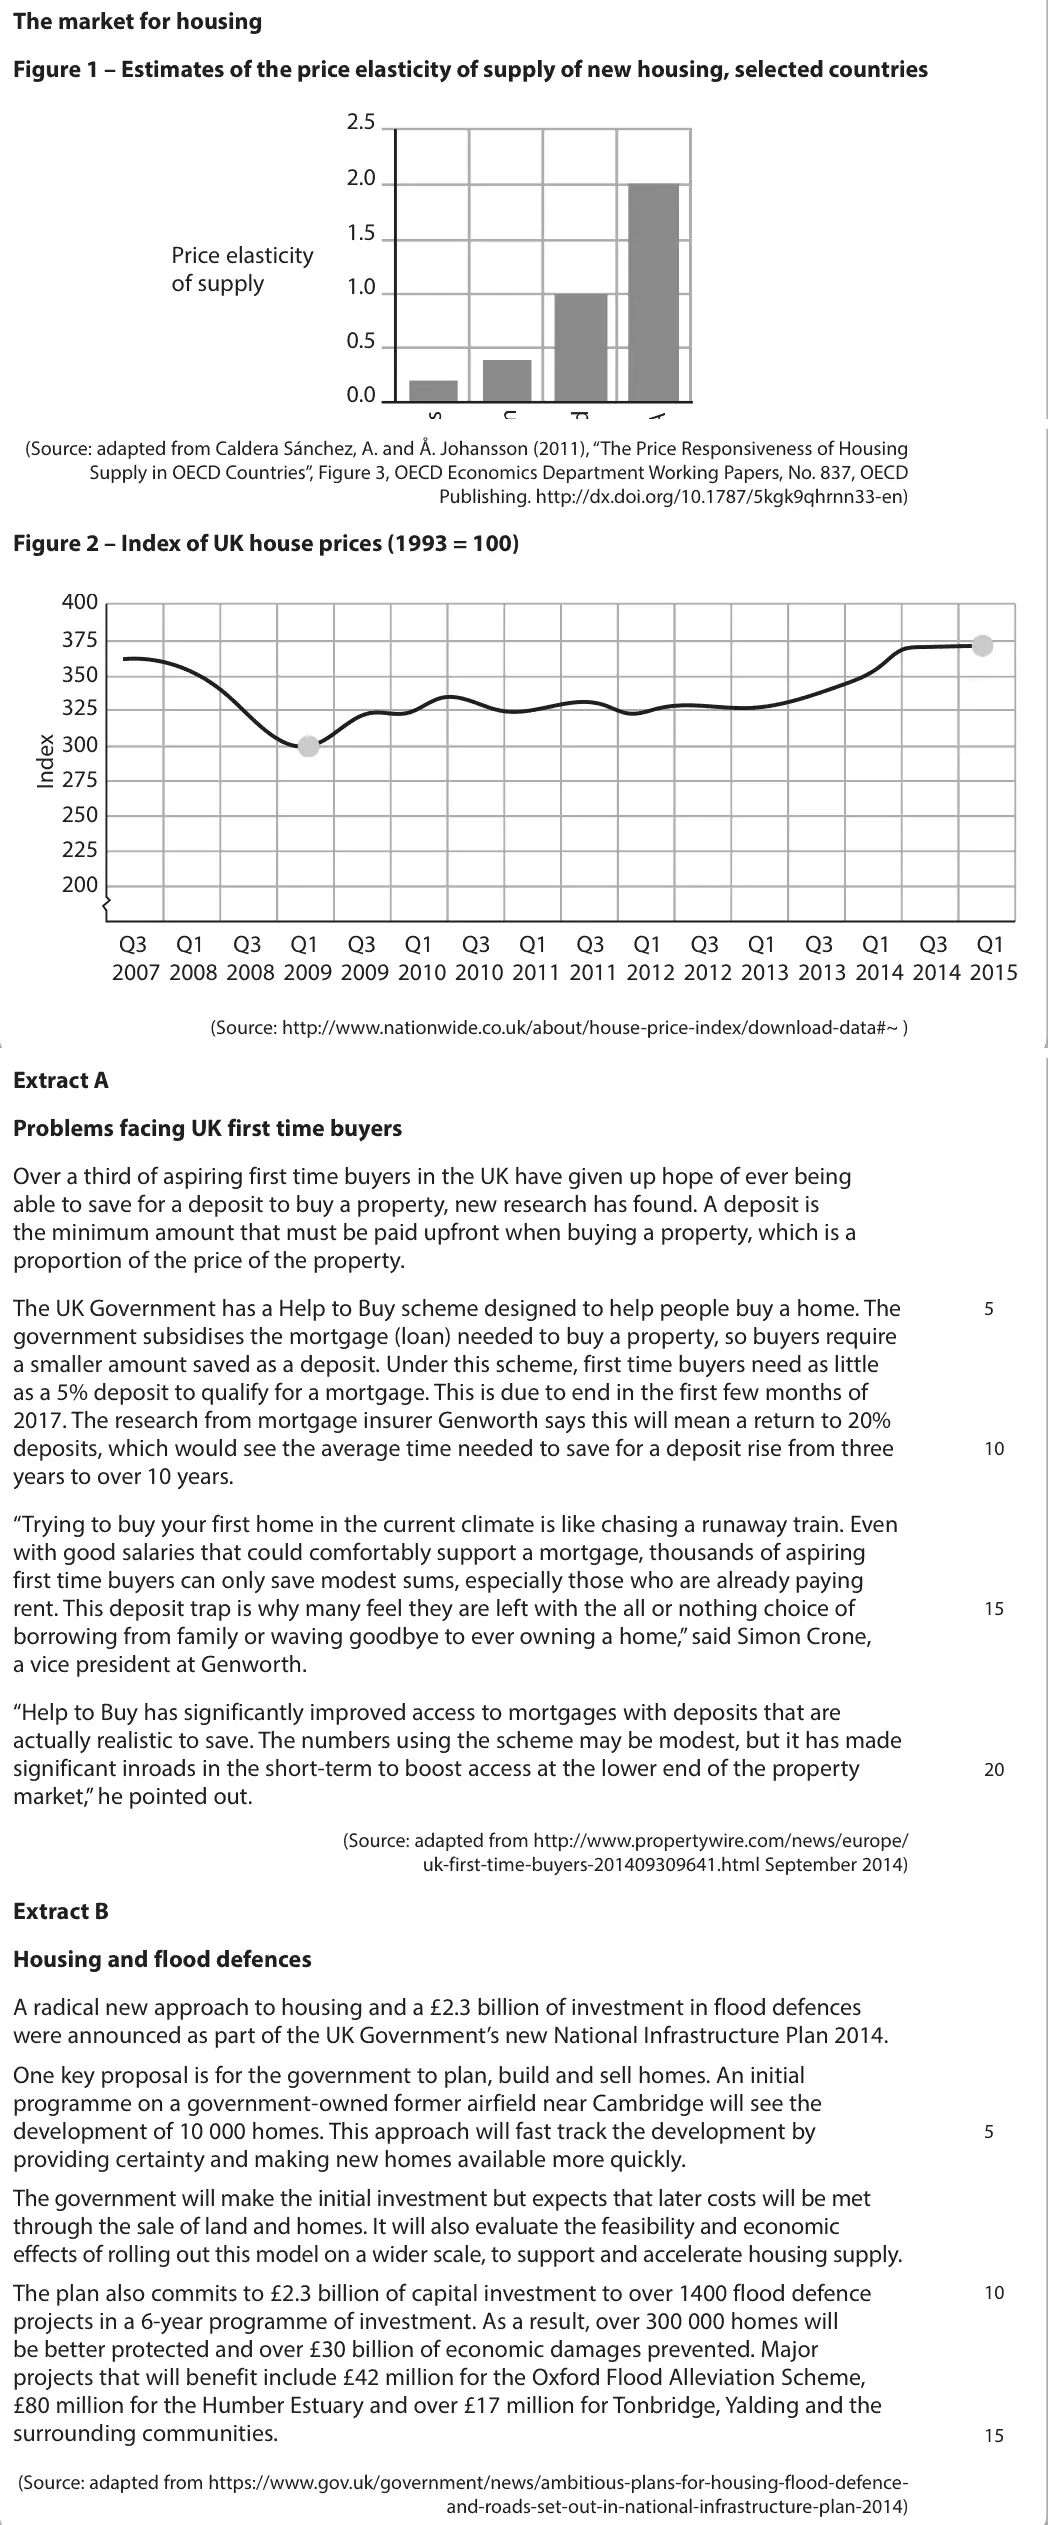
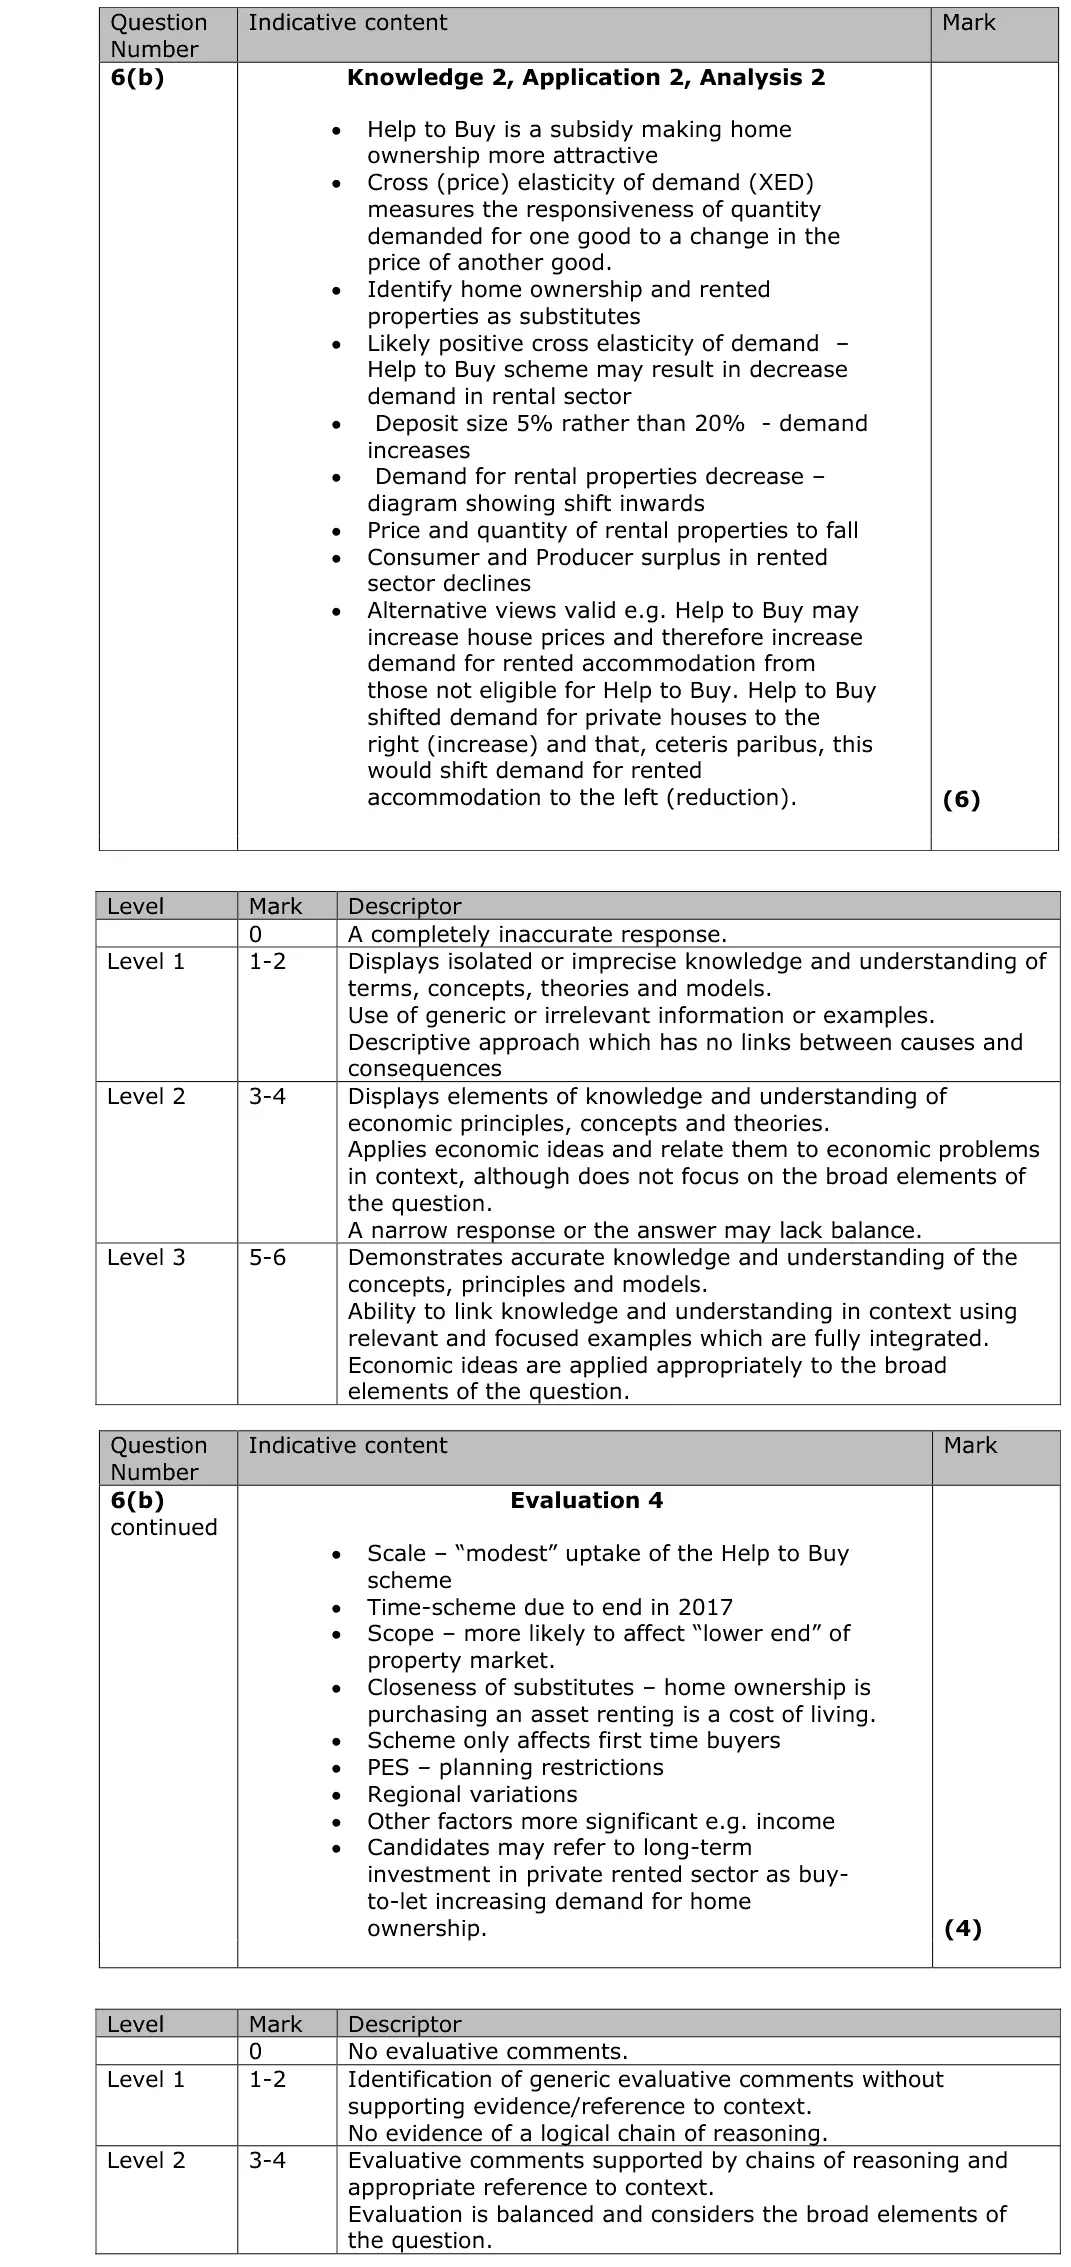
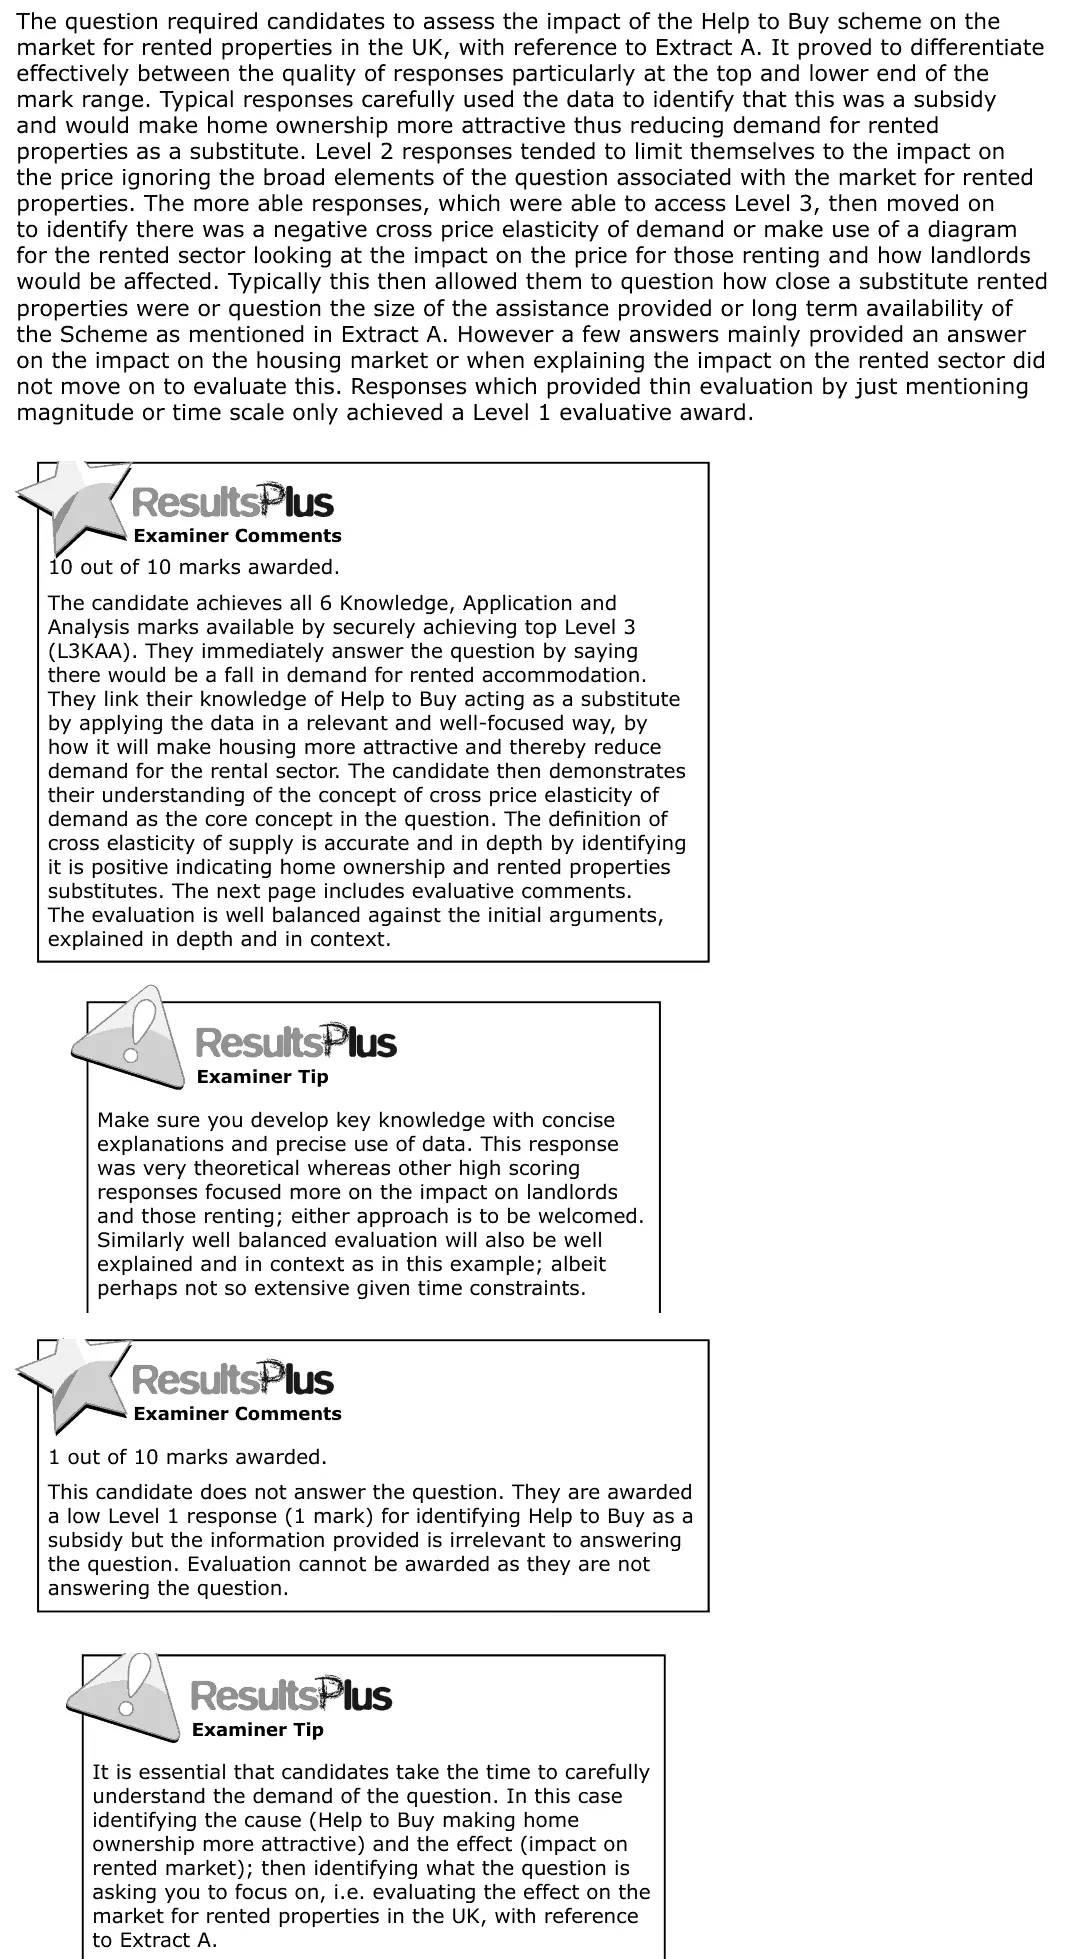
The question required candidates to assess the impact of the Help to Buy scheme on the market for rented properties in the UK, with reference to Extract A. It proved to differentiate effectively between the quality of responses particularly at the top and lower end of the mark range. Typical responses carefully used the data to identify that this was a subsidy and would make home ownership more attractive thus reducing demand for rented properties as a substitute. Level 2 responses tended to limit themselves to the impact on the price ignoring the broad elements of the question associated with the market for rented properties. The more able responses, which were able to access Level 3, then moved on to identify there was a negative cross price elasticity of demand or make use of a diagram for the rented sector looking at the impact on the price for those renting and how landlords would be affected. Typically this then allowed them to question how close a substitute rented properties were or question the size of the assistance provided or long term availability of the Scheme as mentioned in Extract A. However a few answers mainly provided an answer on the impact on the housing market or when explaining the impact on the rented sector did not move on to evaluate this. Responses which provided thin evaluation by just mentioning magnitude or time scale only achieved a Level 1 evaluative award. 10 out of 10 marks awarded. The candidate achieves all 6 Knowledge, Application and Analysis marks available by securely achieving top Level 3 (L3KAA). They immediately answer the question by saying there would be a fall in demand for rented accommodation. They link their knowledge of Help to Buy acting as a substitute by applying the data in a relevant and well-focused way, by how it will make housing more attractive and thereby reduce demand for the rental sector. The candidate then demonstrates their understanding of the concept of cross price elasticity of demand as the core concept in the question. The definition of cross elasticity of supply is accurate and in depth by identifying it is positive indicating home ownership and rented properties substitutes. The next page includes evaluative comments. The evaluation is well balanced against the initial arguments, explained in depth and in context. Make sure you develop key knowledge with concise explanations and precise use of data. This response was very theoretical whereas other high scoring responses focused more on the impact on landlords and those renting; either approach is to be welcomed. Similarly well balanced evaluation will also be well explained and in context as in this example; albeit perhaps not so extensive given time constraints. 1 out of 10 marks awarded. This candidate does not answer the question. They are awarded a low Level 1 response (1 mark) for identifying Help to Buy as a subsidy but the information provided is irrelevant to answering the question. Evaluation cannot be awarded as they are not answering the question. It is essential that candidates take the time to carefully understand the demand of the question. In this case identifying the cause (Help to Buy making home ownership more attractive) and the effect (impact on rented market); then identifying what the question is asking you to focus on, i.e. evaluating the effect on the market for rented properties in the UK, with reference to Extract A.
Notes from the mark scheme and report
Help to Buy is a subsidy making ownership more attractive
owning and renting are substitutes so demand for rented property falls (positive XED)
Level 3 needs effects on the rental market not just price
evaluate: modest uptake, ends in 2017, only first-time buyers, higher house prices may raise renting
Quantitative skills: QS 9 (interpret, apply and analyse information in written, graphical tabular and numerical forms)
Work with an Edexcel economics tutor
Essays stuck in Level 2, or losing the easy marks in Section A? Book a trial session with Lianne, a former Edexcel examiner.