Notes and key-term cards for this topic are being written by our tutors. The past-paper questions below are ready now.
Specification statements
2.1.1Economic growth: a) Rates of change of real Gross Domestic Product (GDP) as a measure of economic growth b) Distinction between: • real and nominal • total and per capita • value and volume c) Other national income measures: • Gross National Income (GNI) d) Comparison of rates of growth between countries and over time e) Understanding of Purchasing Power Parities (PPPs) and the use of PPP-adjusted figures in international comparisons f) The limitations of using GDP to compare living standards between countries and over time g) National happiness: • UK national wellbeing • The relationship between real incomes and subjective happinessAS
Tap a question to zoom it. The data and extracts fold out above each question; the mark scheme and examiner's comment open underneath.
June 2025 · Paper 2 · Q1(b)4 marksAO1=2, AO2=1, AO3=1Short answer
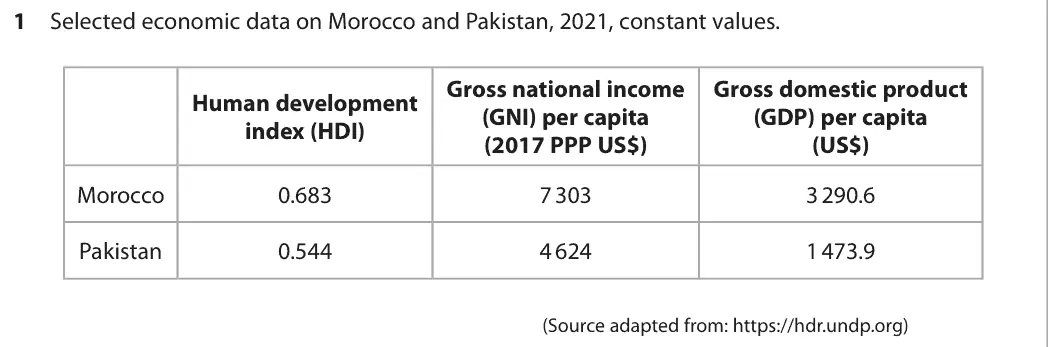
Data and extracts for question 1
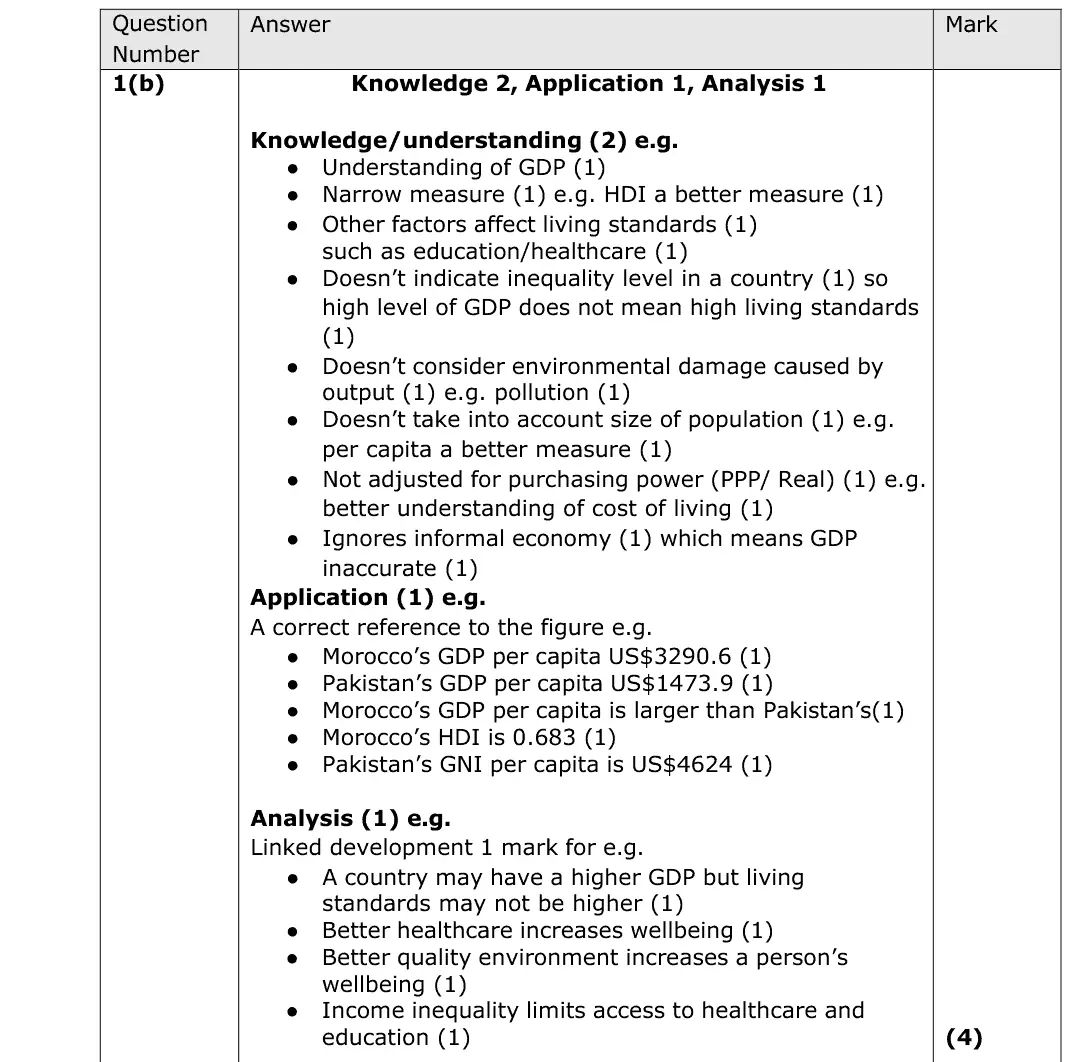
Mark scheme
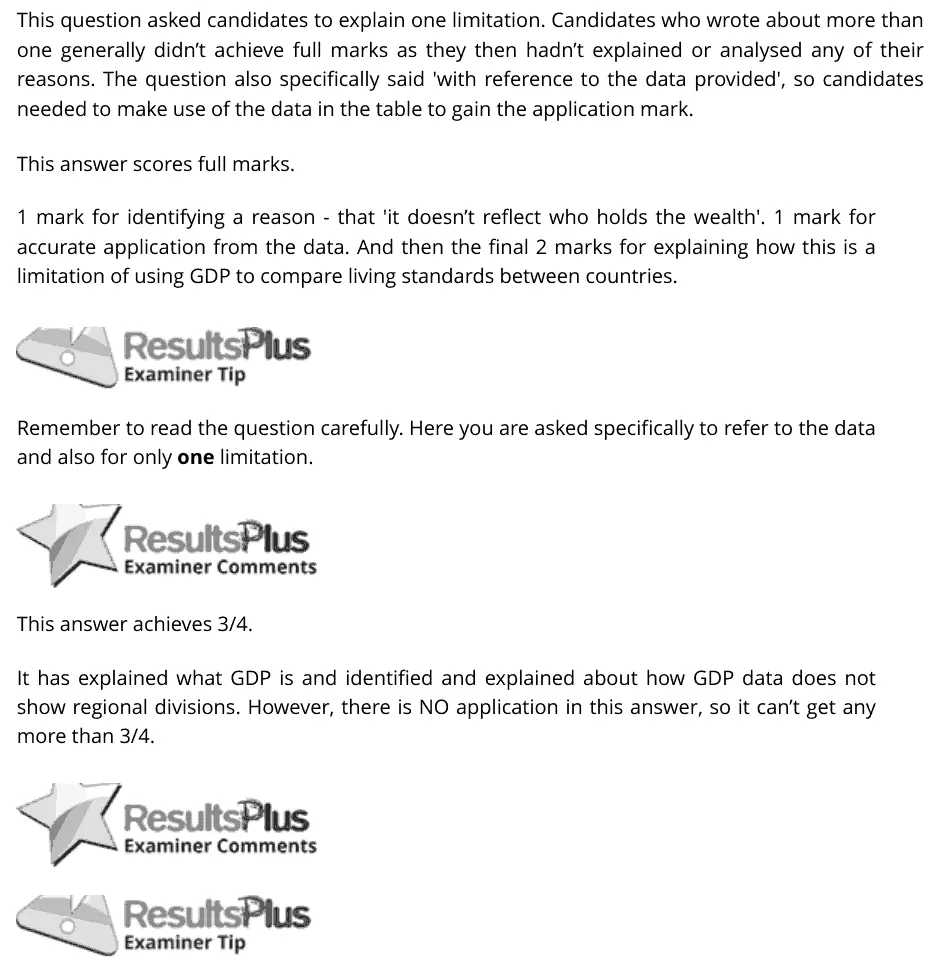
Examiner's comment
This question asked candidates to explain one limitation. Candidates who wrote about more than one generally didn’t achieve full marks as they then hadn’t explained or analysed any of their reasons. The question also specifically said 'with reference to the data provided', so candidates needed to make use of the data in the table to gain the application mark. This answer scores full marks. 1 mark for identifying a reason - that 'it doesn’t reflect who holds the wealth'. 1 mark for accurate application from the data. And then the final 2 marks for explaining how this is a limitation of using GDP to compare living standards between countries. Remember to read the question carefully. Here you are asked specifically to refer to the data and also for only one limitation. This answer achieves 3/4. It has explained what GDP is and identified and explained about how GDP data does not show regional divisions. However, there is NO application in this answer, so it can’t get any more than 3/4.
Notes from the mark scheme and report
explain ONE limitation (narrow measure ignoring health and education, inequality, informal economy, environment) and use the table (e.g. HDI or GNI per capita PPP figures)
report: answers listing several limitations did not develop any, and no data use caps the mark at 3/4
Quantitative skills: QS 9 (interpret, apply and analyse information in written, graphical tabular and numerical forms)
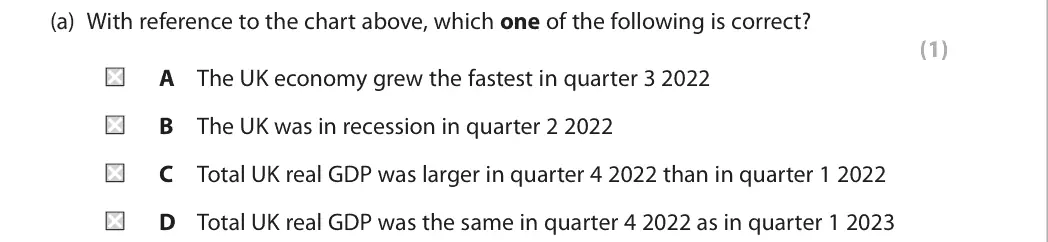
June 2025 · Paper 2 · Q3(a)1 markMultiple choice
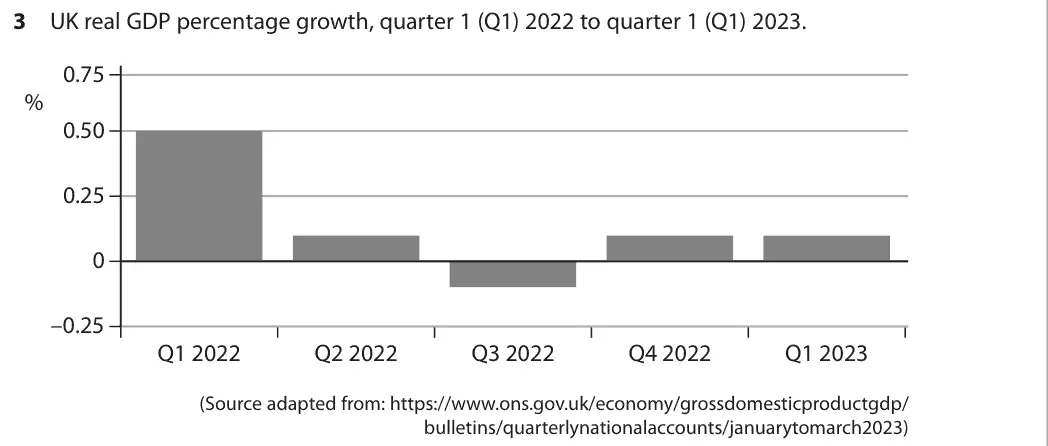
Data and extracts for question 3
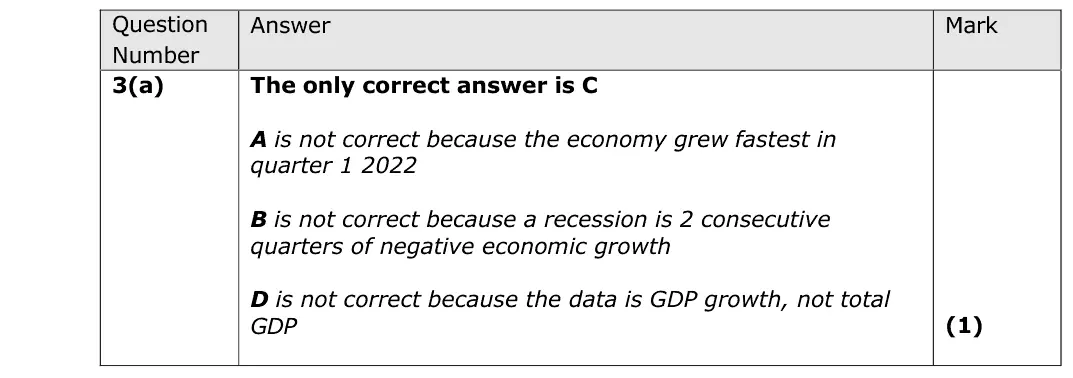
Answer
C
Mark scheme
Notes from the mark scheme and report
growth was positive in Q2 and Q4 2022, so real GDP in Q4 2022 was larger than in Q1 2022 (C)
fastest growth was Q1 2022, one negative quarter is not a recession, and equal growth rates do not mean equal GDP levels
Quantitative skills: QS 10 (distinguish between changes in the level of a variable, and the rate of change); QS 9 (interpret, apply and analyse information in written, graphical tabular and numerical forms)
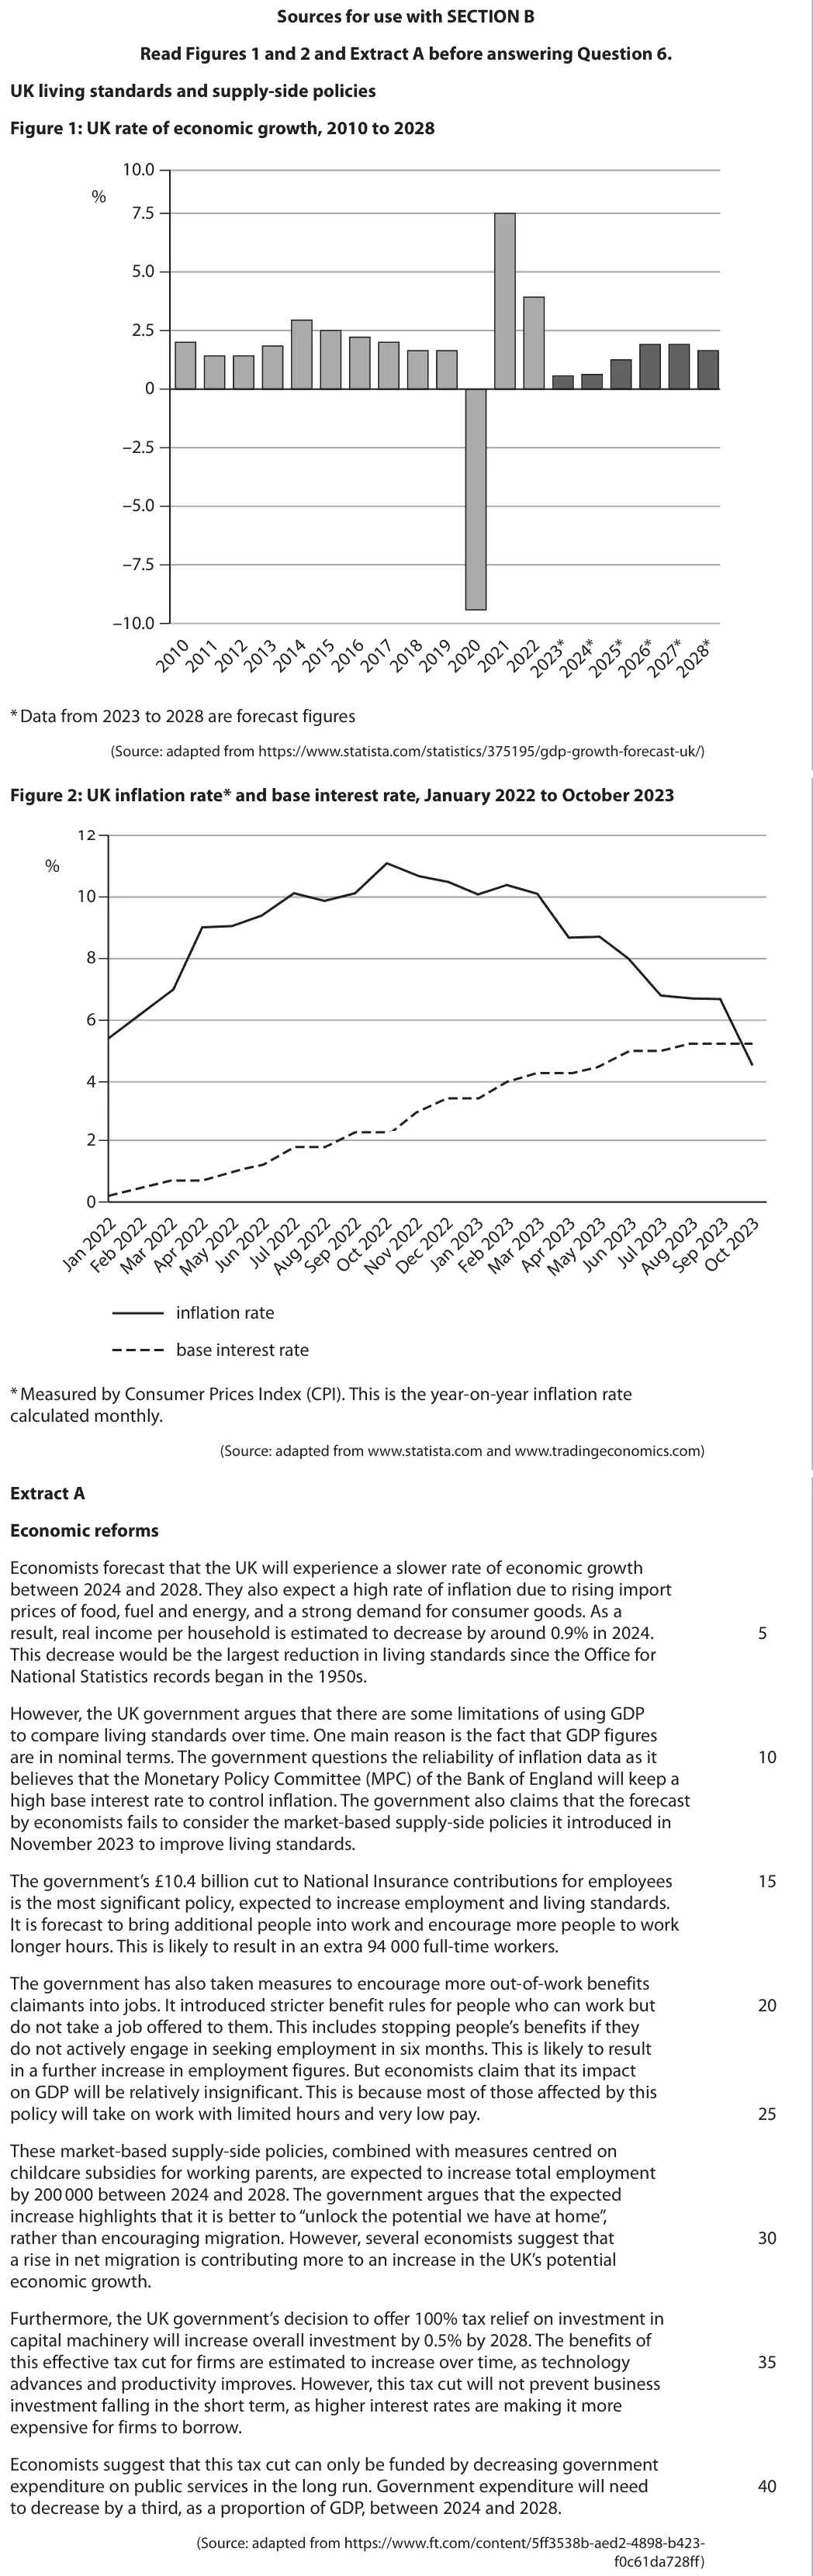
June 2025 · AS Paper 2 · Q6(a)4 marksAO1=2, AO2=2Short answer
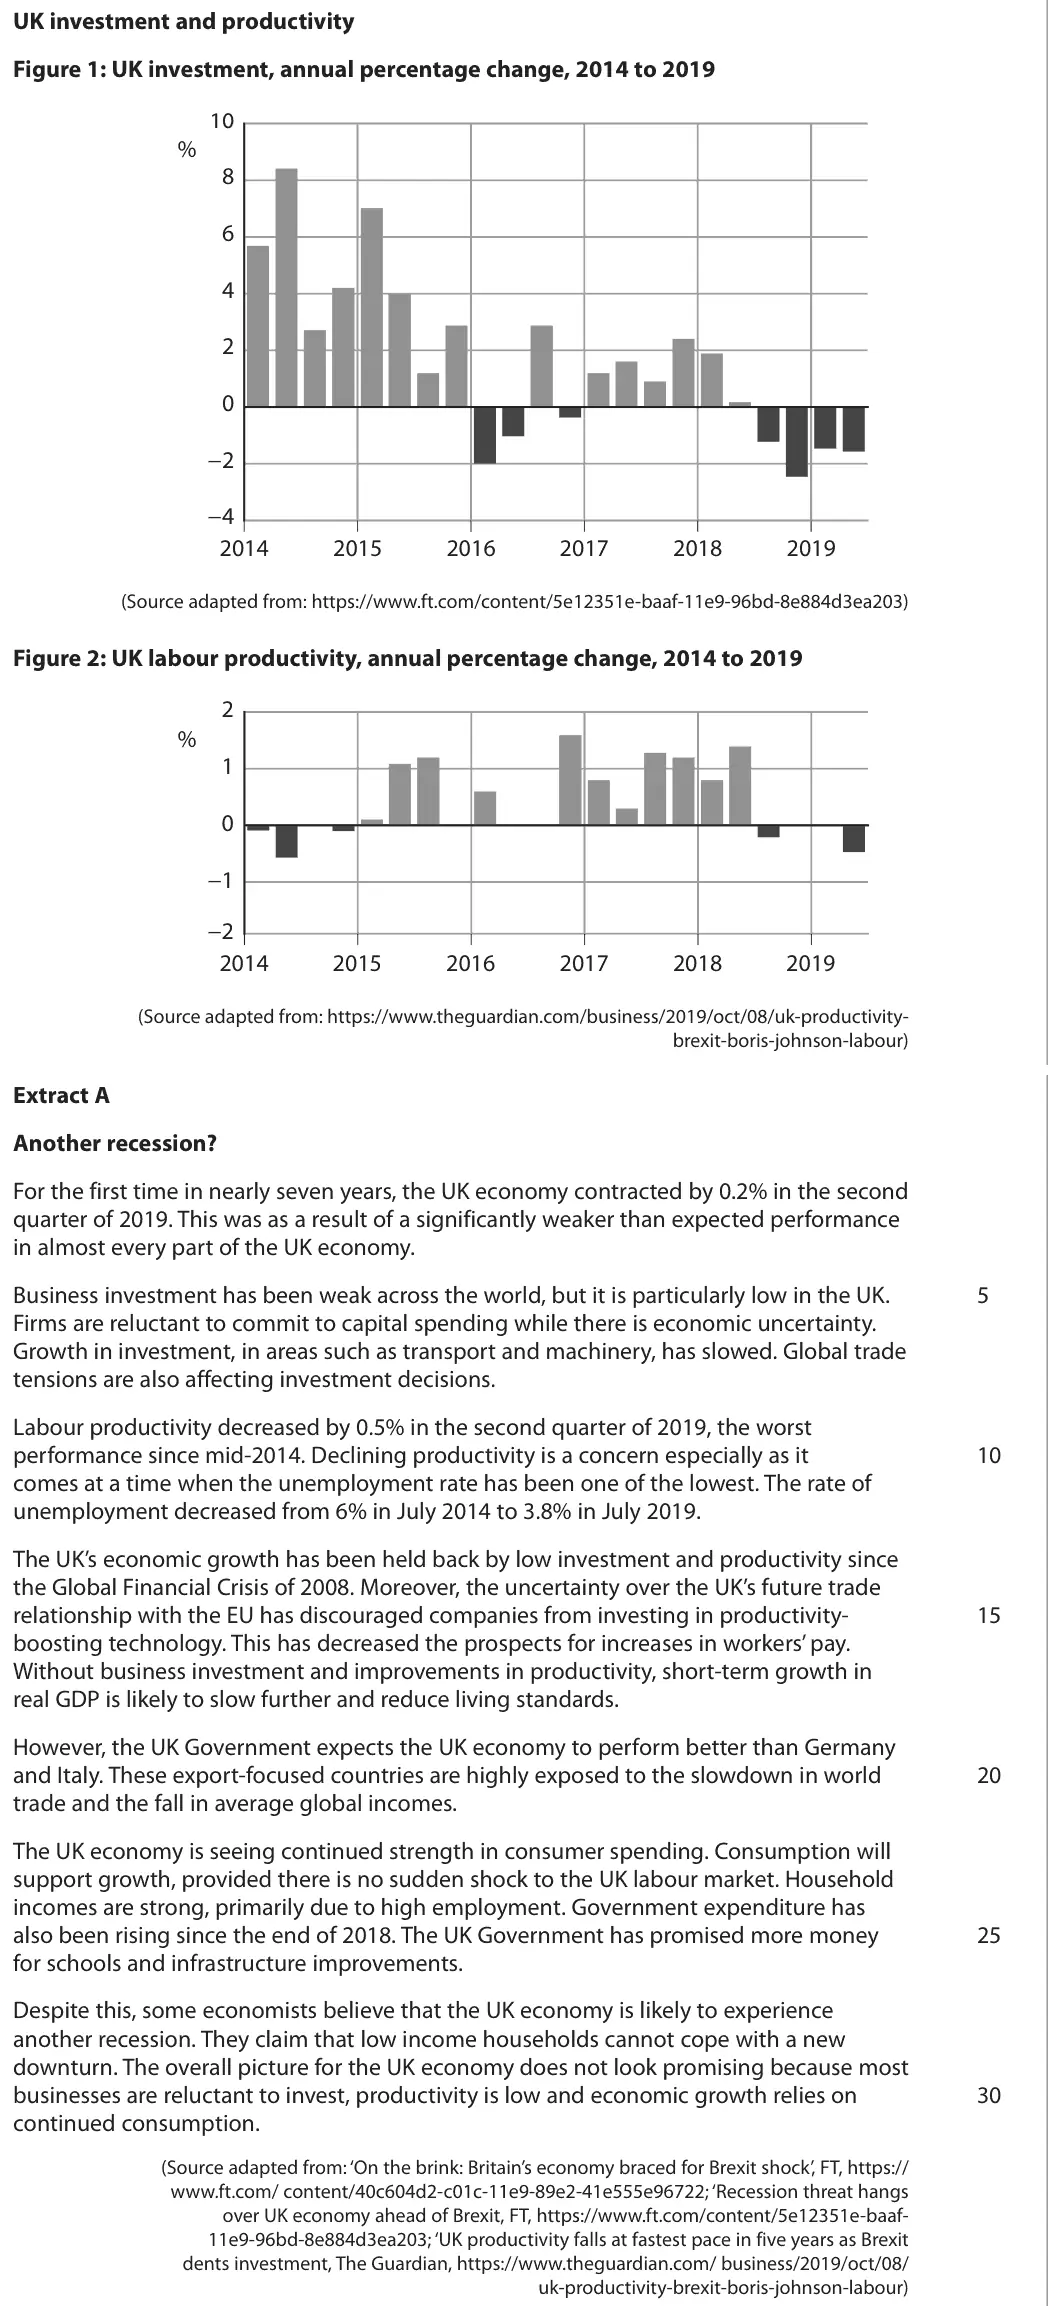
Data and extracts for question 6
Mark scheme
Examiner's comment
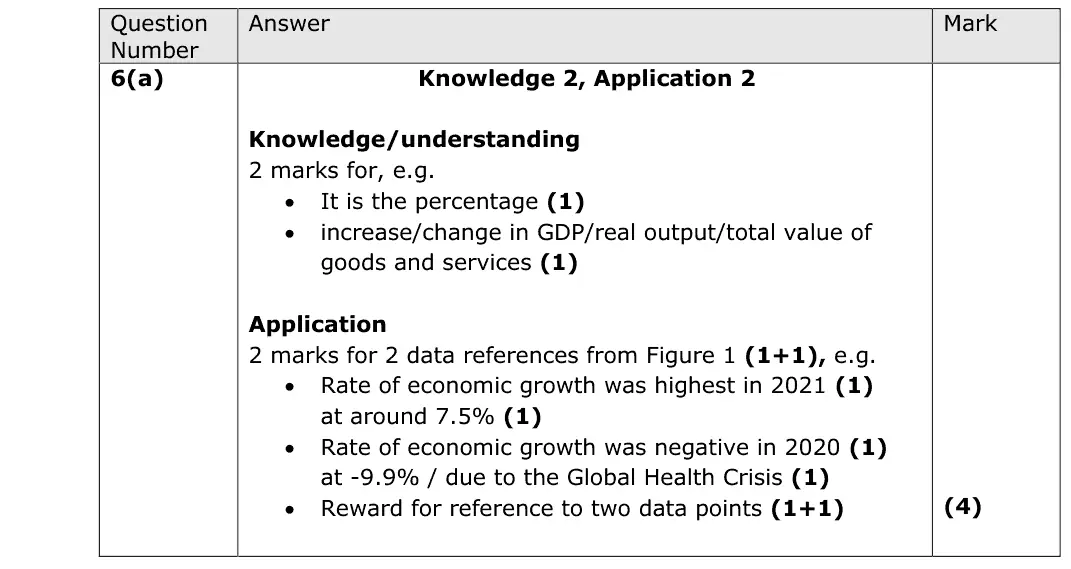
The four marks for this question are split in half between knowledge and application. Candidates achieved 2 marks for explanation of the term ‘rate of economic growth’ and 2 marks for relevant application from Figure 1 only.
Notes from the mark scheme and report
the percentage change in real GDP over a period
two data references from Figure 1 (e.g. about -9.9% in 2020, about 7.5% in 2021)
Quantitative skills: QS 2 (calculate, use and understand percentages, percentage changes and percentage point changes); QS 9 (interpret, apply and analyse information in written, graphical tabular and numerical forms)
June 2025 · AS Paper 2 · Q6(b)5 marksAO1=1, AO2=2, AO3=2Short answer
Data and extracts for question 6
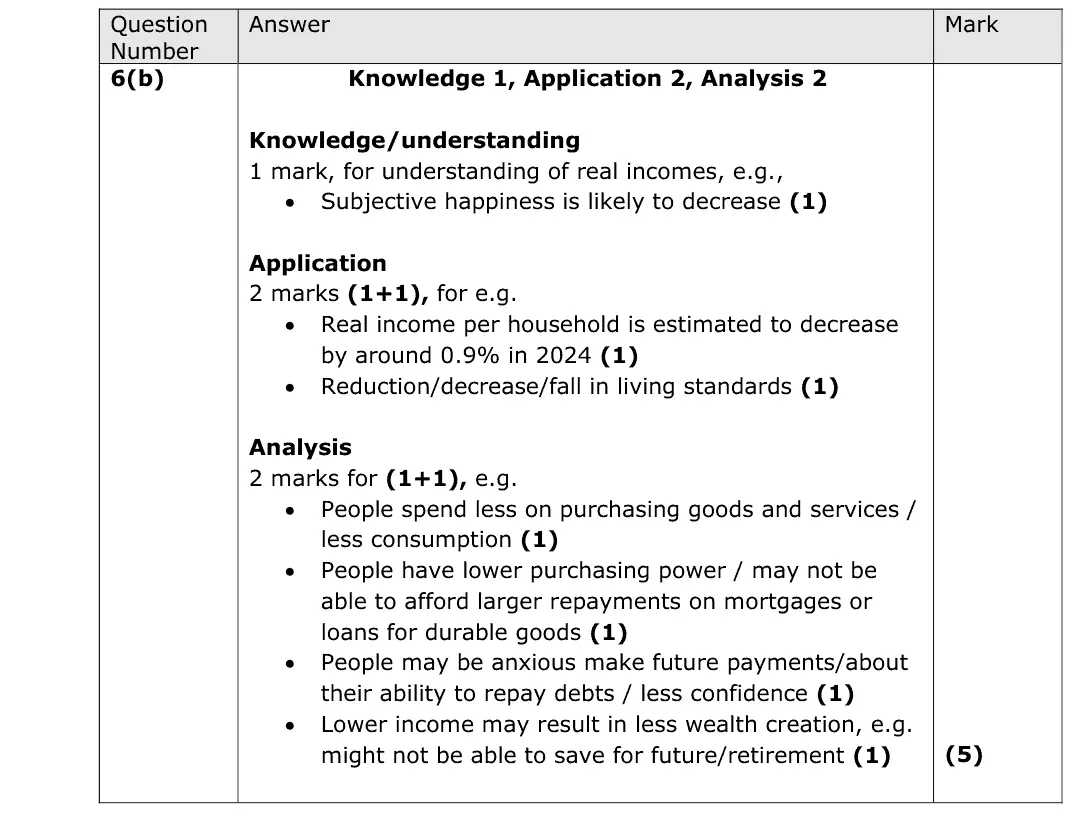
Mark scheme
Examiner's comment
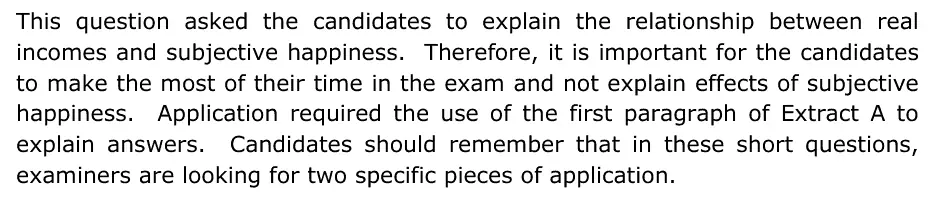
This question asked the candidates to explain the relationship between real incomes and subjective happiness. Therefore, it is important for the candidates to make the most of their time in the exam and not explain effects of subjective happiness. Application required the use of the first paragraph of Extract A to explain answers. Candidates should remember that in these short questions, examiners are looking for two specific pieces of application.
Notes from the mark scheme and report
lower real incomes reduce purchasing power and living standards so subjective happiness is likely to fall
two pieces of application from paragraph 1 (real income per household -0.9% in 2024, largest fall since the 1950s)
do not explain effects of happiness
June 2025 · AS Paper 2 · Q6(c)10 marksAO1=2, AO2=2, AO3=2, AO4=410-mark response
Data and extracts for question 6
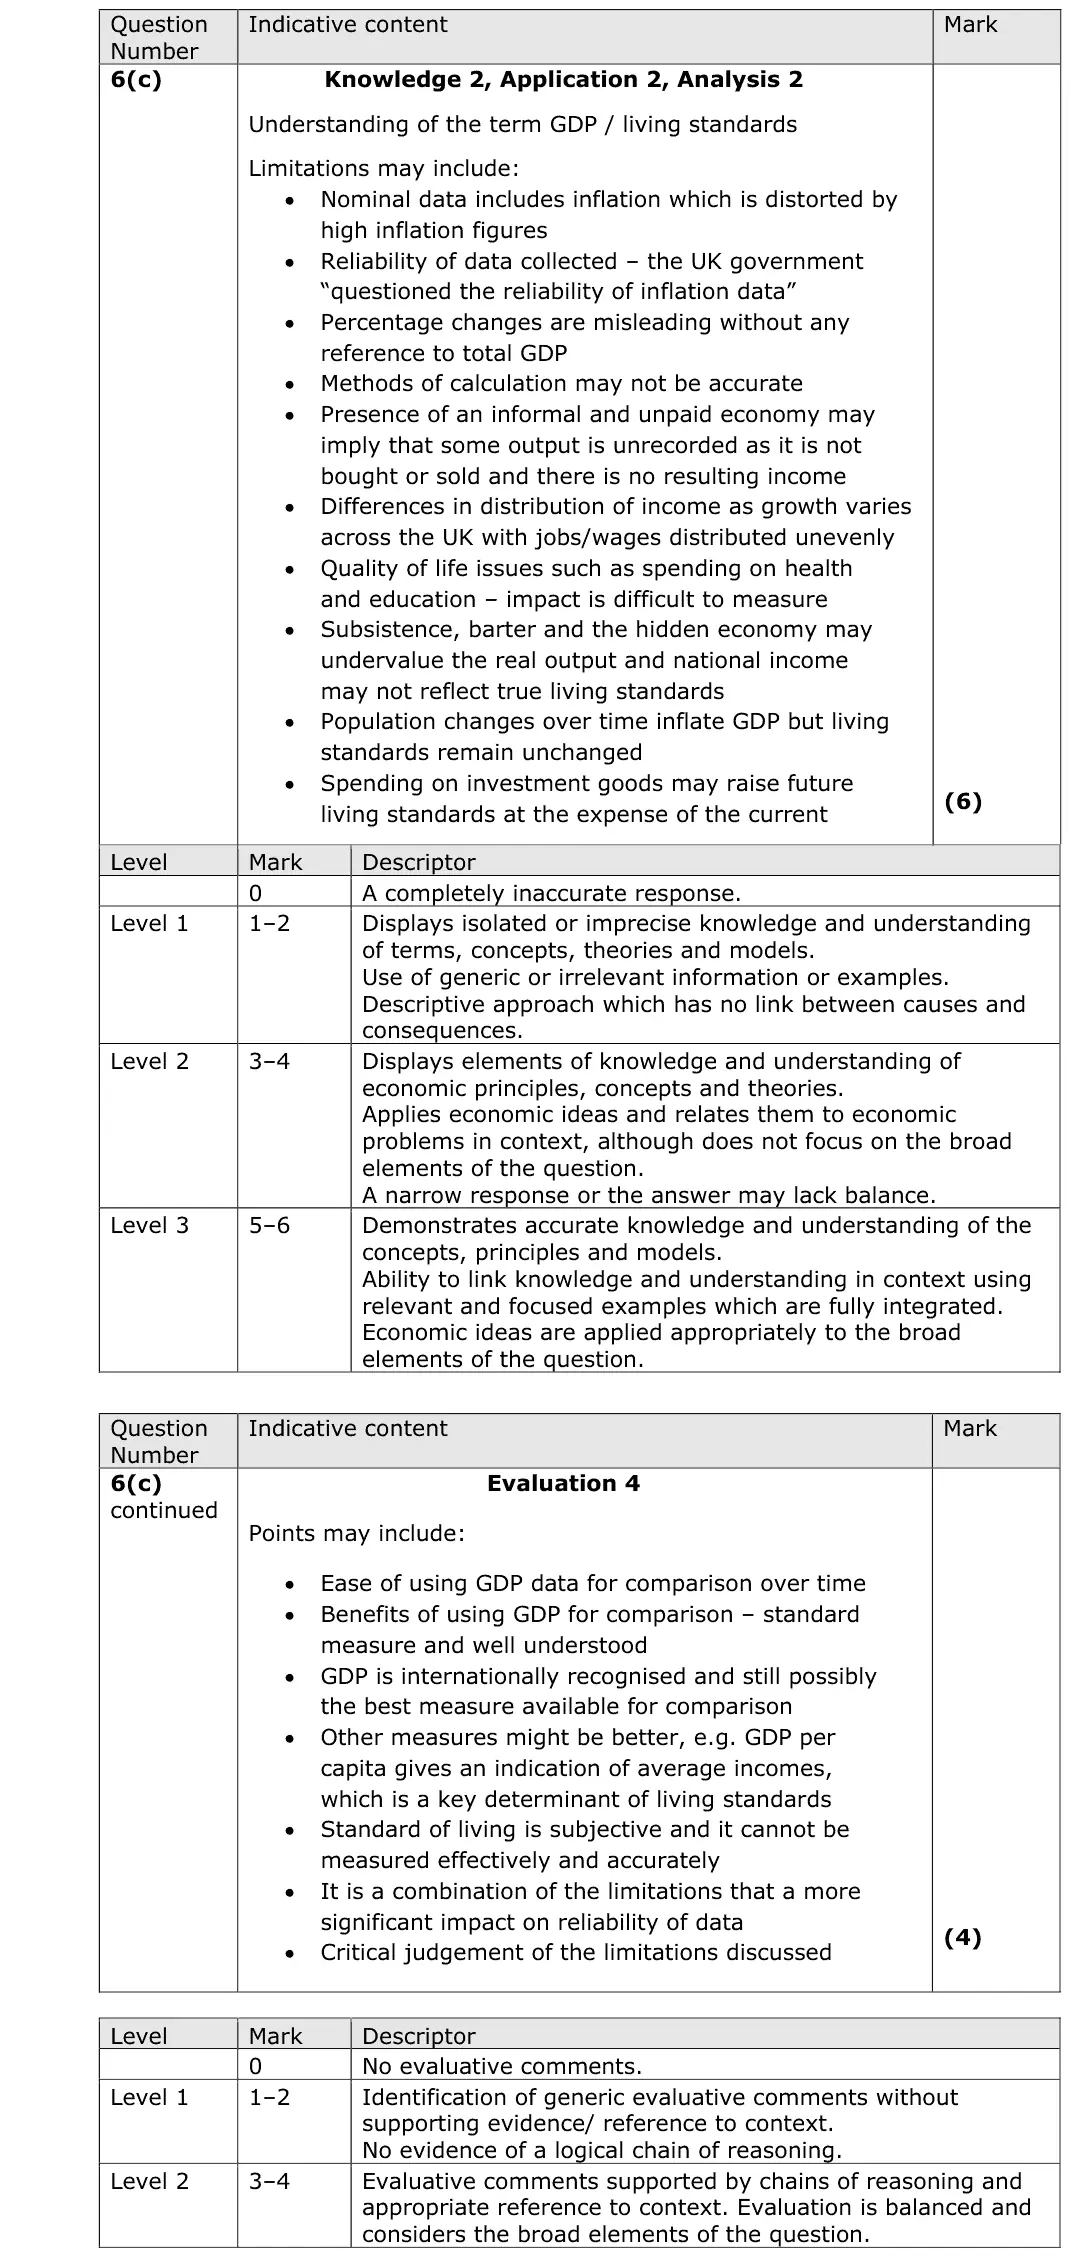
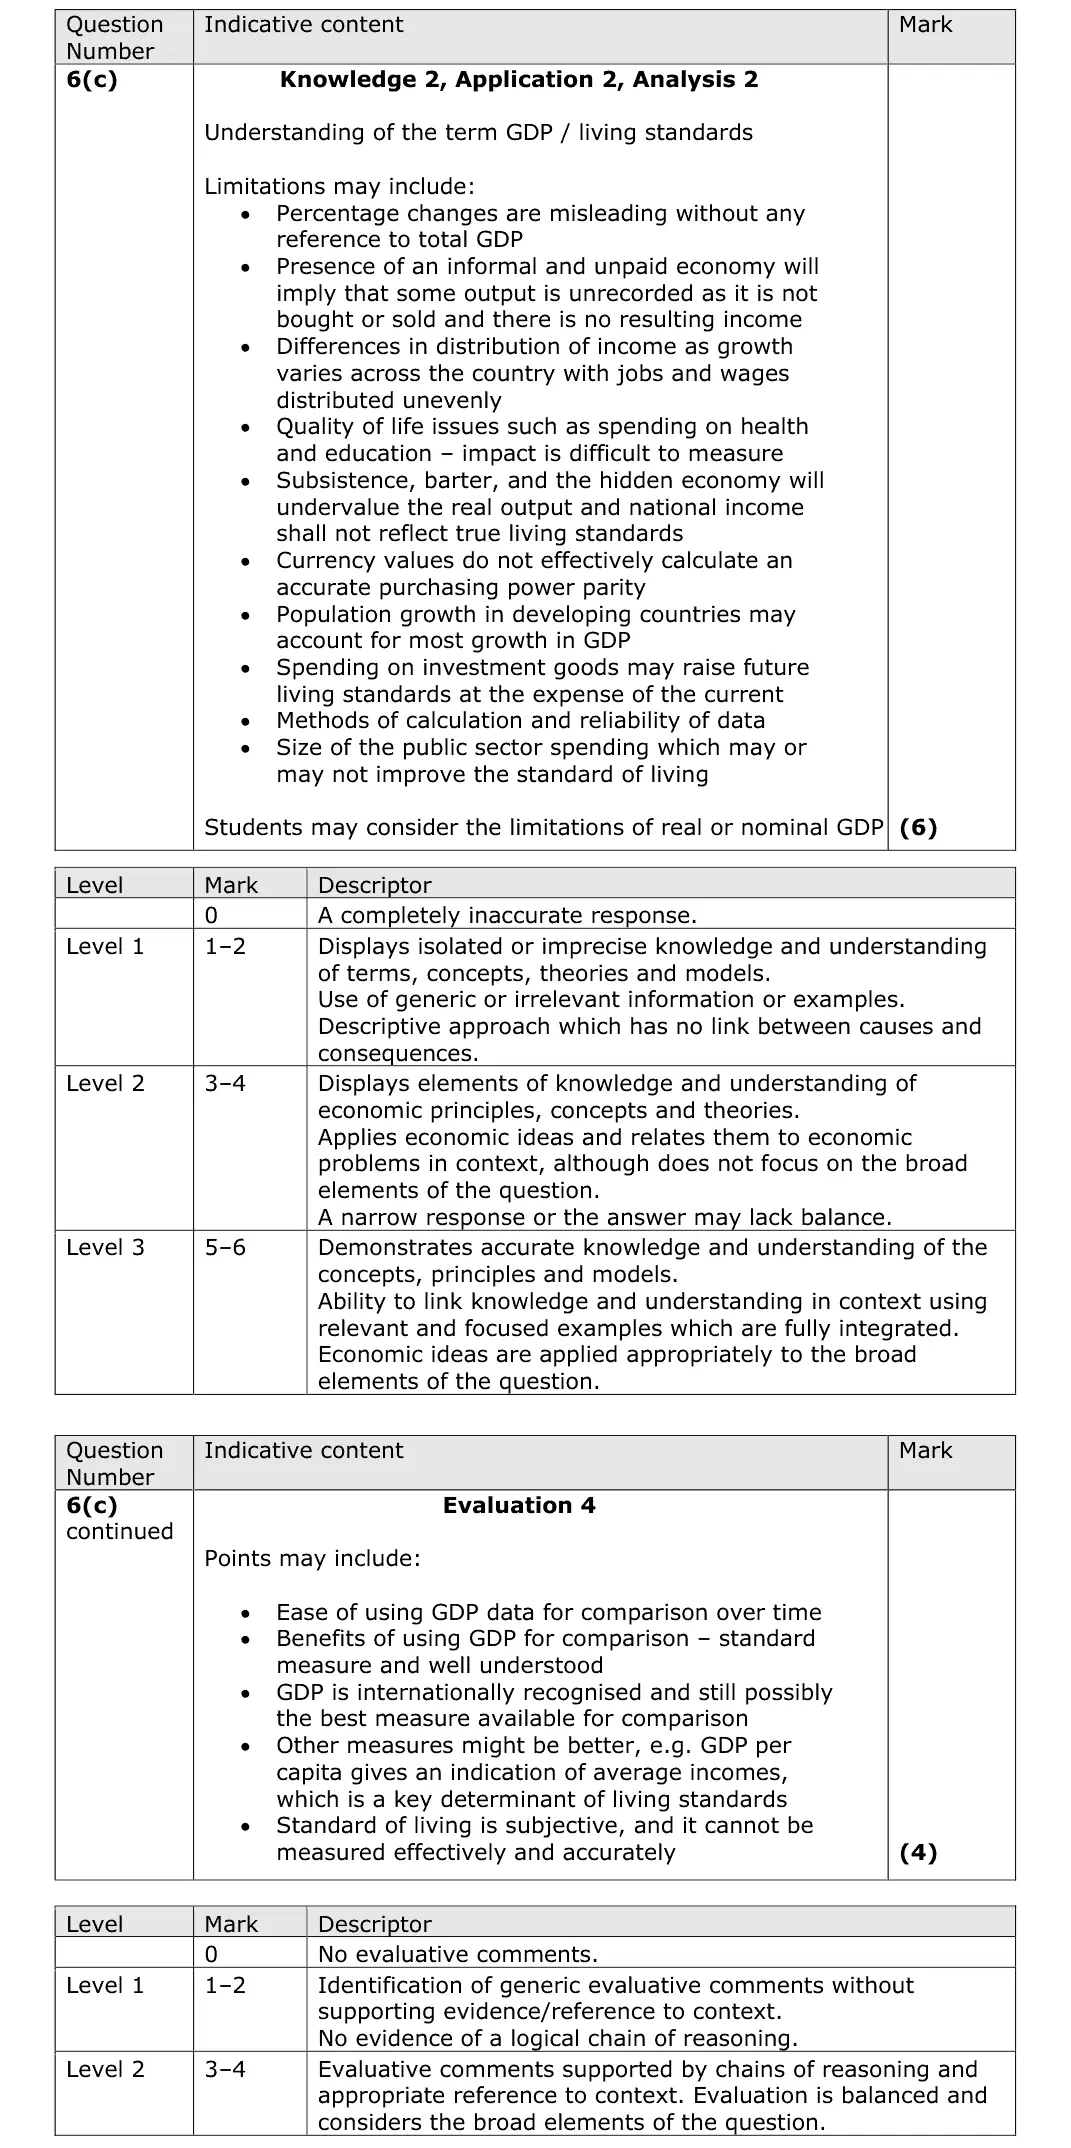
Mark scheme, including the levels grid and indicative content
Examiner's comment
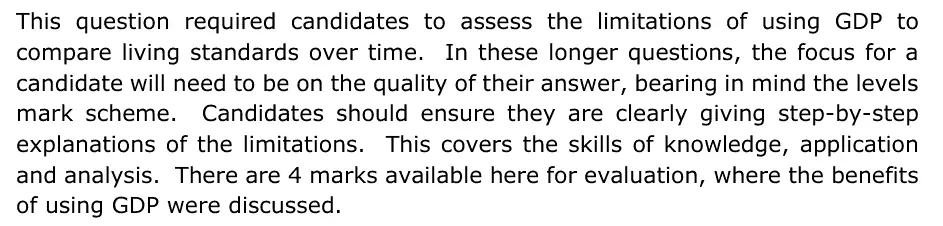
This question required candidates to assess the limitations of using GDP to compare living standards over time. In these longer questions, the focus for a candidate will need to be on the quality of their answer, bearing in mind the levels mark scheme. Candidates should ensure they are clearly giving step-by-step explanations of the limitations. This covers the skills of knowledge, application and analysis. There are 4 marks available here for evaluation, where the benefits of using GDP were discussed.
Notes from the mark scheme and report
limitations: nominal figures distorted by inflation, data reliability, informal economy, income distribution, quality of life
evaluate with ease of use and GDP per capita as the standard measure
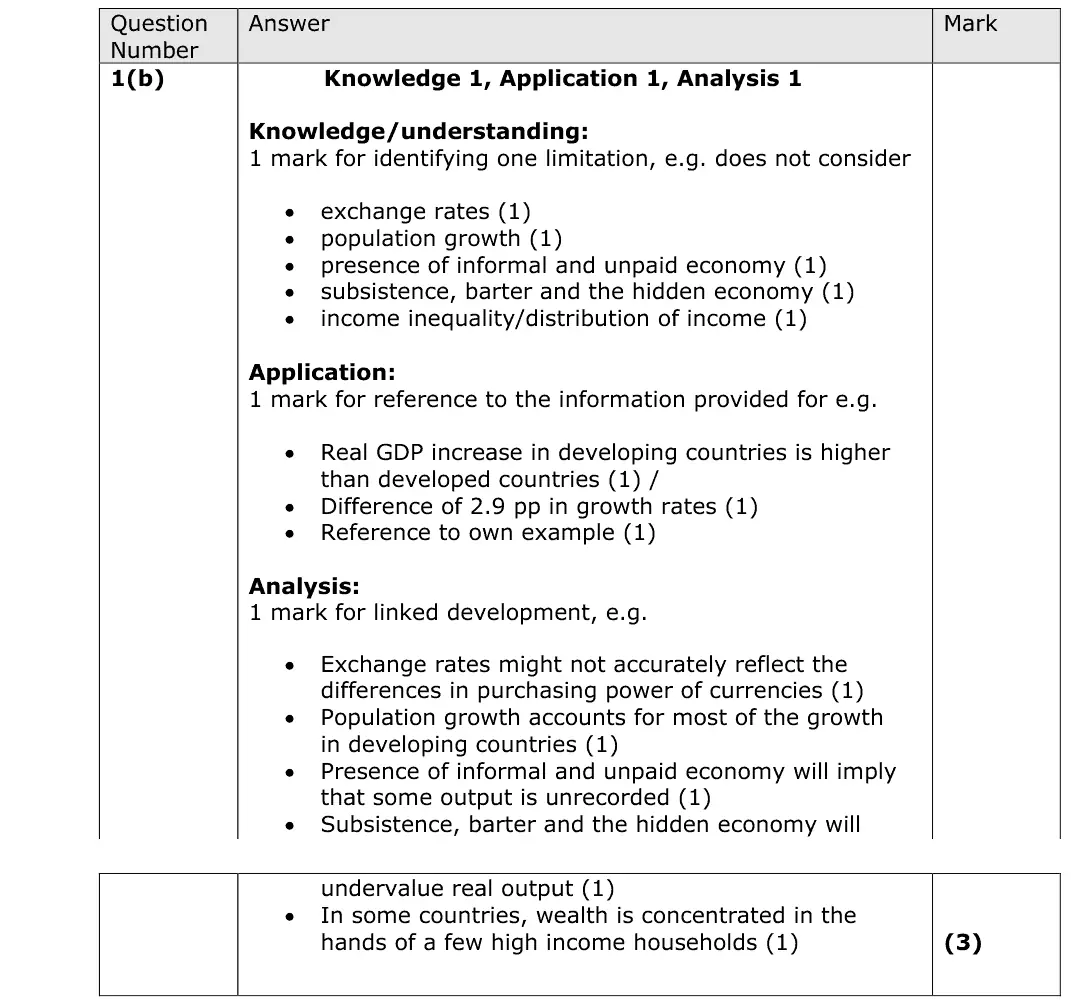
June 2024 · AS Paper 2 · Q1(b)3 marksAO1=1, AO2=1, AO3=1Short answer
Data and extracts for question 1
Mark scheme
Examiner's comment
In this question the marks are split as 1 for knowledge, 1 for application, and 1 for analysis. The knowledge comes from identifying one impact, the application for explaining the data, and analysis for development building on the knowledge. Most candidates were able to access knowledge and application marks but were unable to develop the point identified.
Notes from the mark scheme and report
one limitation (exchange rates vs PPP, population growth, informal/subsistence economy, income distribution) then develop it
data e.g. 4.6% vs 1.7% growth (2.9 percentage points)
most failed to develop the point
Quantitative skills: QS 9 (interpret, apply and analyse information in written, graphical tabular and numerical forms)
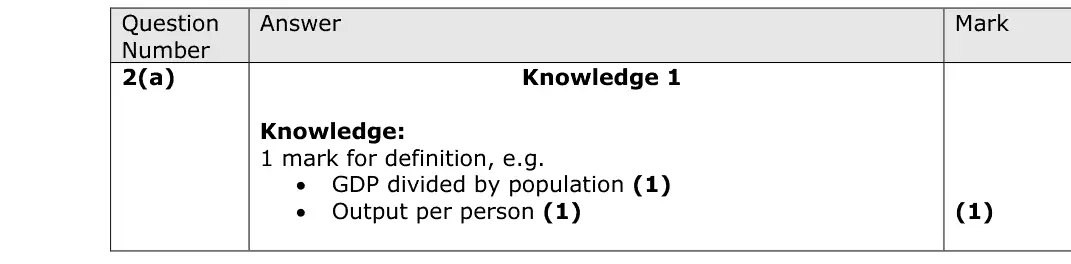
June 2023 · AS Paper 2 · Q2(a)1 markAO1=1Definition
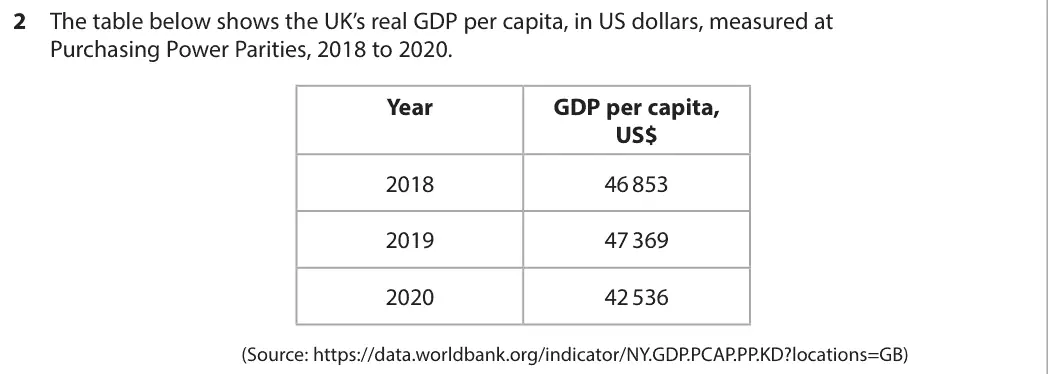
Data and extracts for question 2
Mark scheme
Examiner's comment
This question requires a precise definition of GDP per capita. It is important that candidates are clear in their answers. Candidates could access marks through a range of approaches.
Notes from the mark scheme and report
GDP divided by the population (output per person)
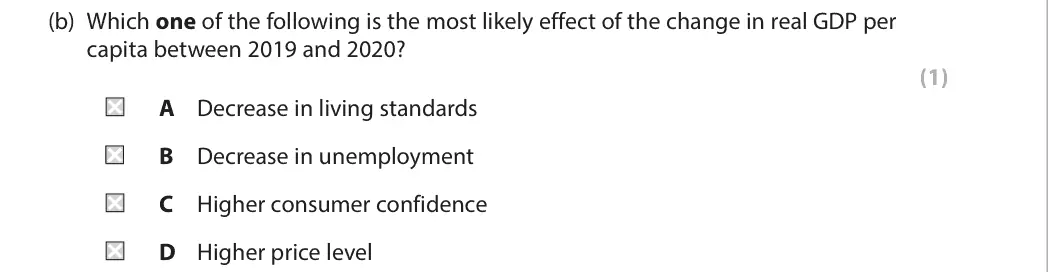
June 2023 · AS Paper 2 · Q2(b)1 markMultiple choice
Data and extracts for question 2
Answer
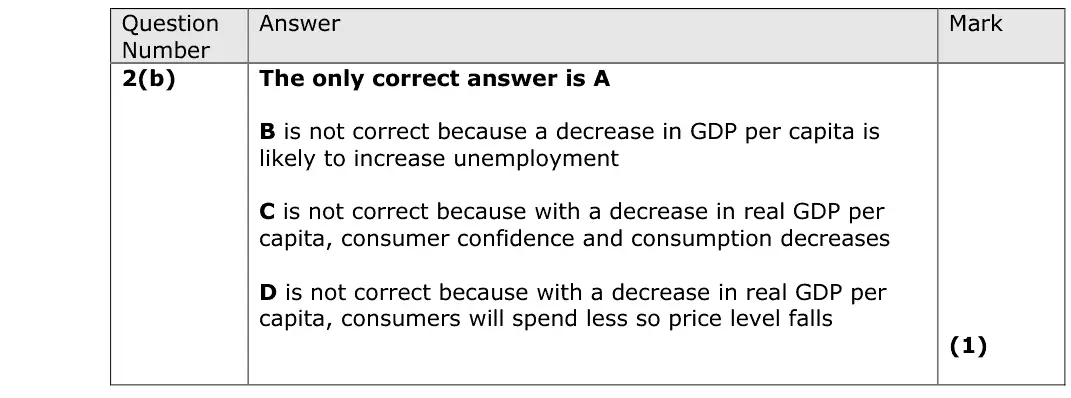
A
Mark scheme
Notes from the mark scheme and report
real GDP per capita fell from $47 369 to $42 536, so A (options not in the crop)
B wrong as unemployment rises
C wrong as confidence and consumption fall
D wrong as lower spending lowers the price level
Quantitative skills: QS 9 (interpret, apply and analyse information in written, graphical tabular and numerical forms)
June 2023 · AS Paper 2 · Q2(c)2 marksAO1=2Short answer
Data and extracts for question 2
Mark scheme
Examiner's comment
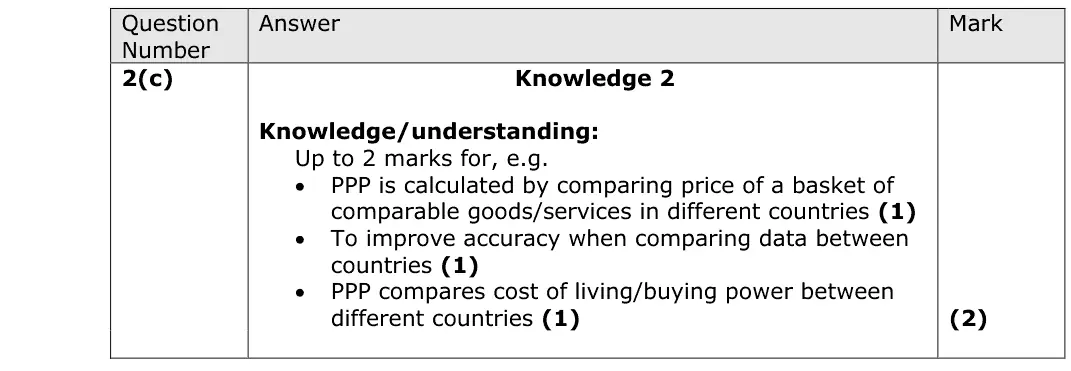
This question requires candidates to explain why PPPs are used. Candidates were able to answer this question relatively easily. However, some candidates lost all marks because they selected the wrong two pieces of data.
Notes from the mark scheme and report
PPPs compare the price of a common basket in each country so output and living standards can be compared accurately, removing exchange rate distortions
June 2023 · Paper 2 · Q3(a)2 marksAO2=2Calculation
Data and extracts for question 3
Mark scheme
Examiner's comment
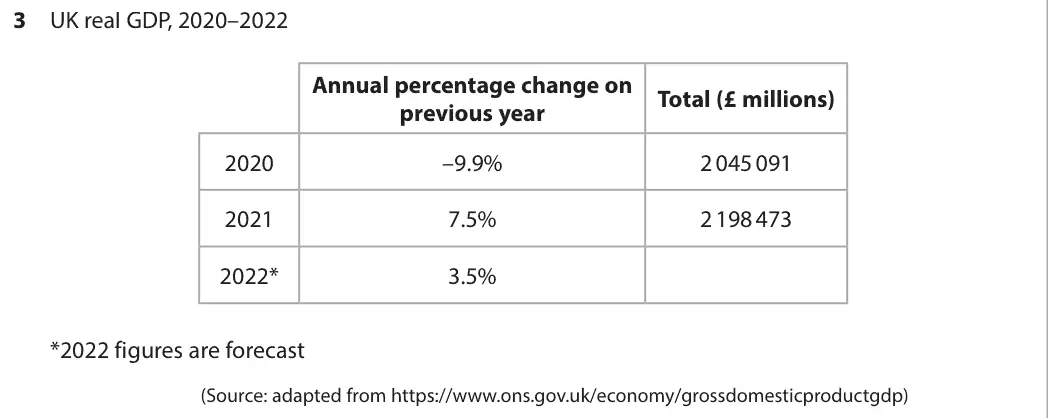
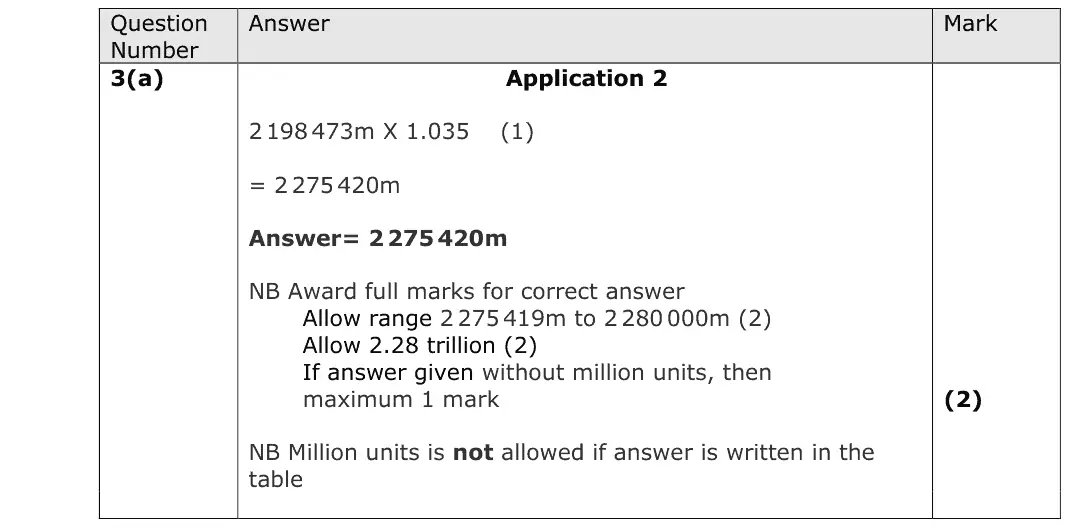
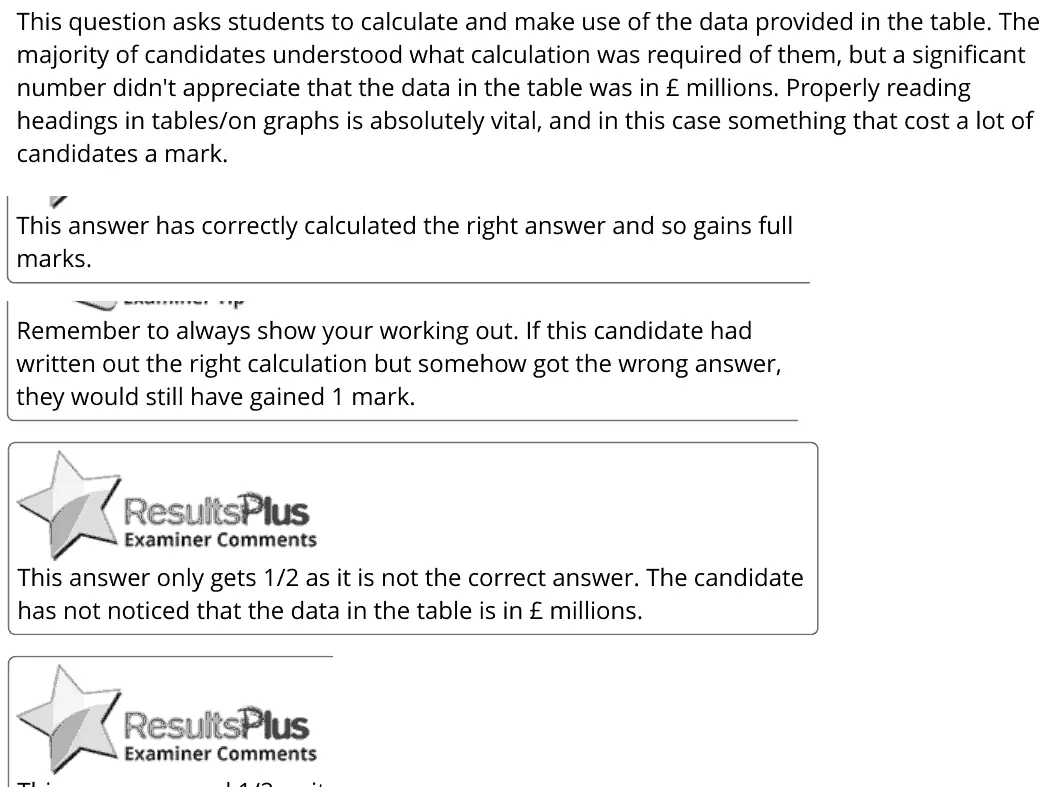
This question asks students to calculate and make use of the data provided in the table. The majority of candidates understood what calculation was required of them, but a significant number didn't appreciate that the data in the table was in £ millions. Properly reading headings in tables/on graphs is absolutely vital, and in this case something that cost a lot of candidates a mark. This answer has correctly calculated the right answer and so gains full marks. Remember to always show your working out. If this candidate had written out the right calculation but somehow got the wrong answer, they would still have gained 1 mark. This answer only gets 1/2 as it is not the correct answer. The candidate has not noticed that the data in the table is in £ millions.
Notes from the mark scheme and report
2 198 473m x 1.035 = £2 275 420 million
many lost a mark by omitting 'million' (data are in £ millions)
Quantitative skills: QS 2 (calculate, use and understand percentages, percentage changes and percentage point changes); QS 9 (interpret, apply and analyse information in written, graphical tabular and numerical forms)
June 2023 · AS Paper 2 · Q5(a)1 markMultiple choice
Data and extracts for question 5
Answer
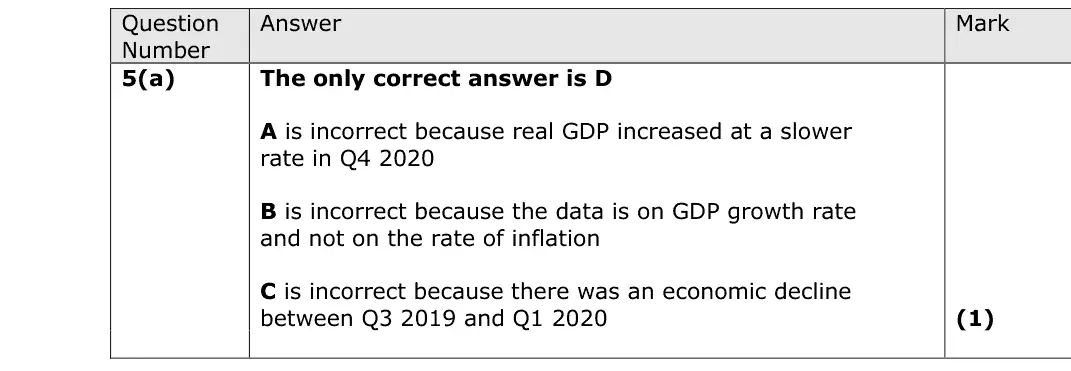
D
Mark scheme
Notes from the mark scheme and report
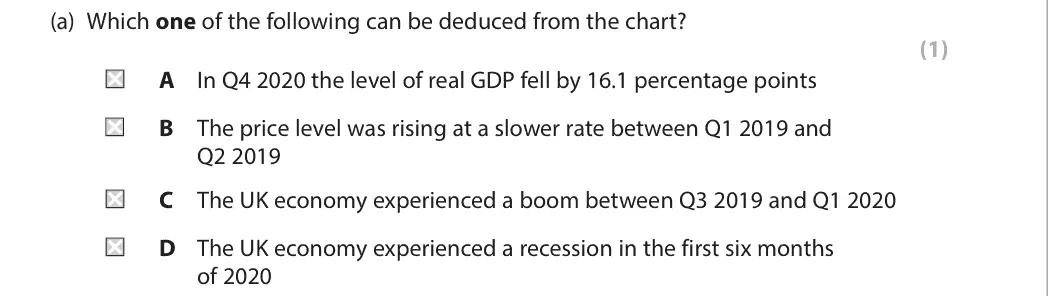
answer D (options not in the crop)
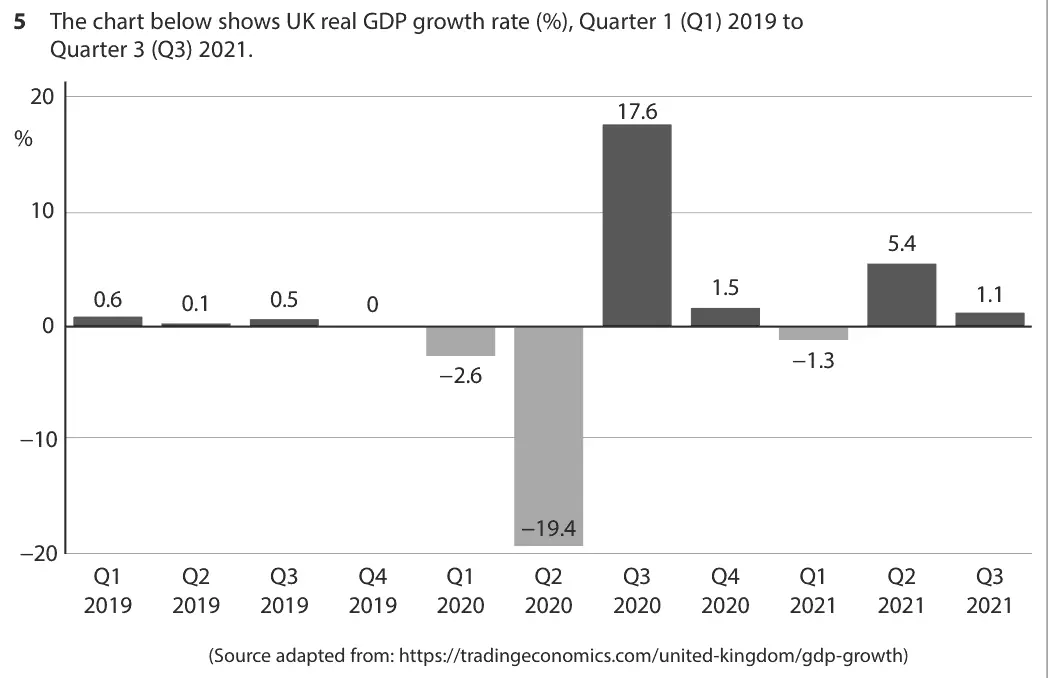
A wrong as Q4 2020 growth was positive but slower
B confuses GDP growth with inflation
C wrong as there was a decline between Q3 2019 and Q1 2020
Quantitative skills: QS 10 (distinguish between changes in the level of a variable, and the rate of change); QS 9 (interpret, apply and analyse information in written, graphical tabular and numerical forms)
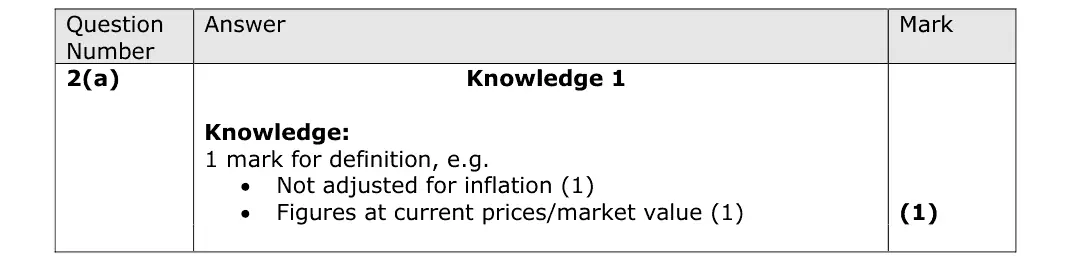
June 2022 · AS Paper 2 · Q2(a)1 markAO1=1Definition
Data and extracts for question 2
Mark scheme
Examiner's comment
This question requires a short but precise definition of nominal. It is important that candidates are clear in their answers. Candidates could access marks through a range of approaches.
Notes from the mark scheme and report
nominal = not adjusted for inflation, at current prices
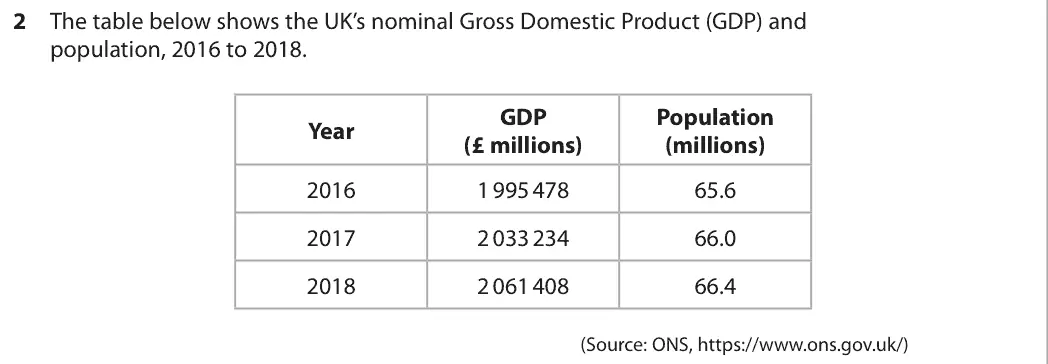
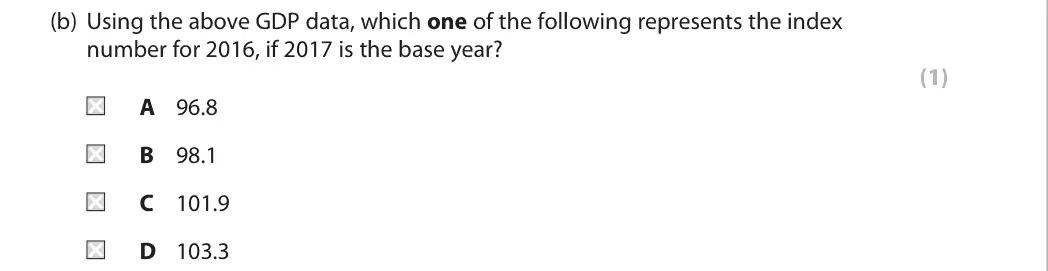
June 2022 · AS Paper 2 · Q2(b)1 markMultiple choice
Data and extracts for question 2
Answer
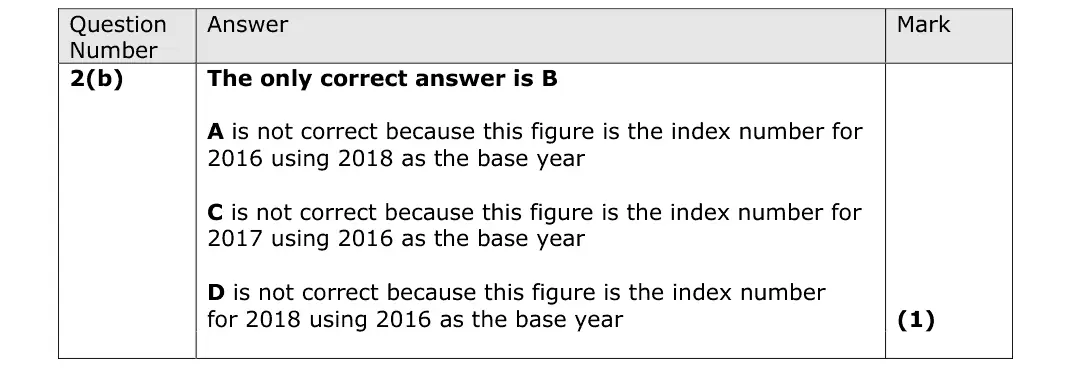
B
Mark scheme
Notes from the mark scheme and report
1 995 478 / 2 033 234 x 100 = 98.1 (B)
A uses 2018 as base, C is 2017 on a 2016 base, D is 2018 on a 2016 base
Quantitative skills: QS 5 (calculate and interpret index numbers); QS 9 (interpret, apply and analyse information in written, graphical tabular and numerical forms)
June 2022 · AS Paper 2 · Q2(c)2 marksAO2=2Calculation
Data and extracts for question 2
Mark scheme
Examiner's comment
This question requires candidates to calculate GDP per capita. Many candidates were able to answer this question relatively easily. However, some candidates lost all marks because they selected the wrong two pieces of data.
Notes from the mark scheme and report
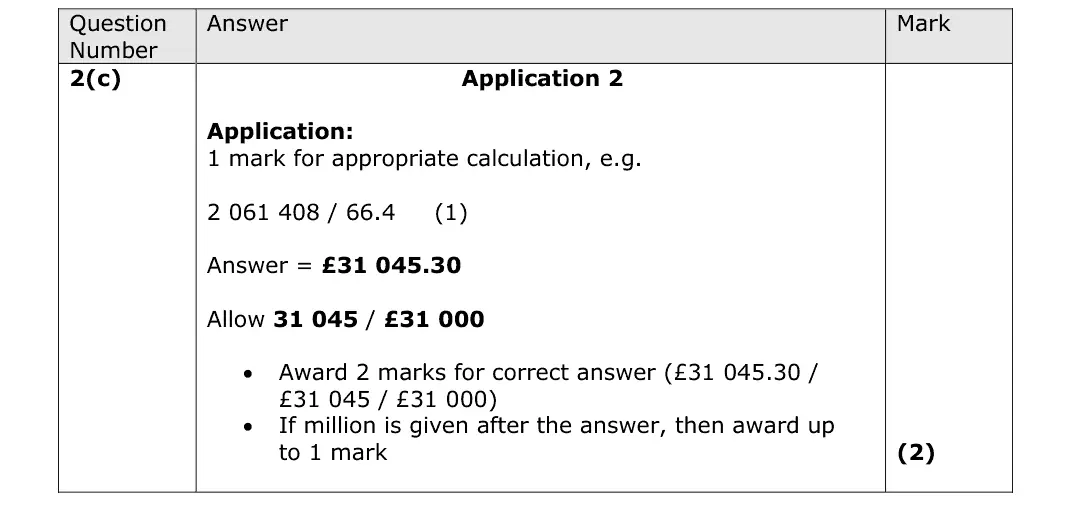
2 061 408 / 66.4 = £31 045.30
adding 'million' to the answer caps at 1 mark
some used the wrong data
Quantitative skills: QS 1 (calculate, use and understand ratios and fractions); QS 9 (interpret, apply and analyse information in written, graphical tabular and numerical forms)
June 2022 · AS Paper 2 · Q3(a)1 markMultiple choice
Data and extracts for question 3
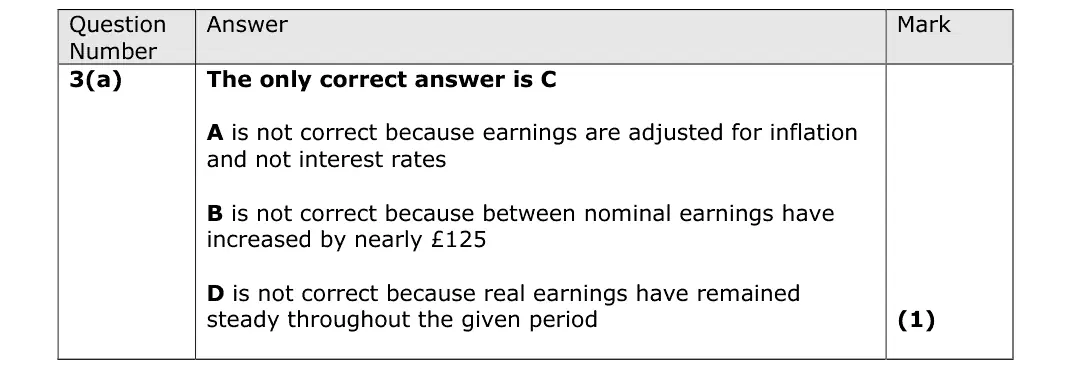
Answer
C
Mark scheme
Notes from the mark scheme and report
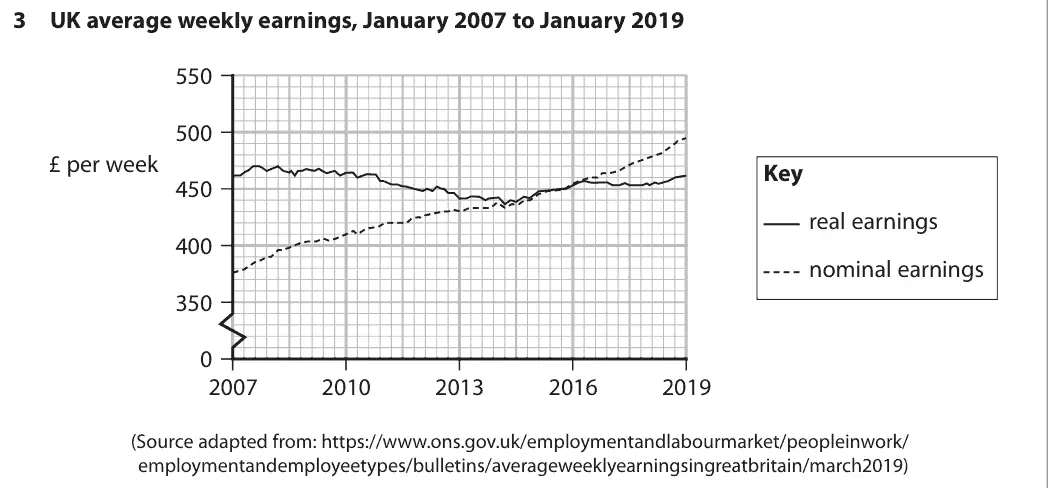
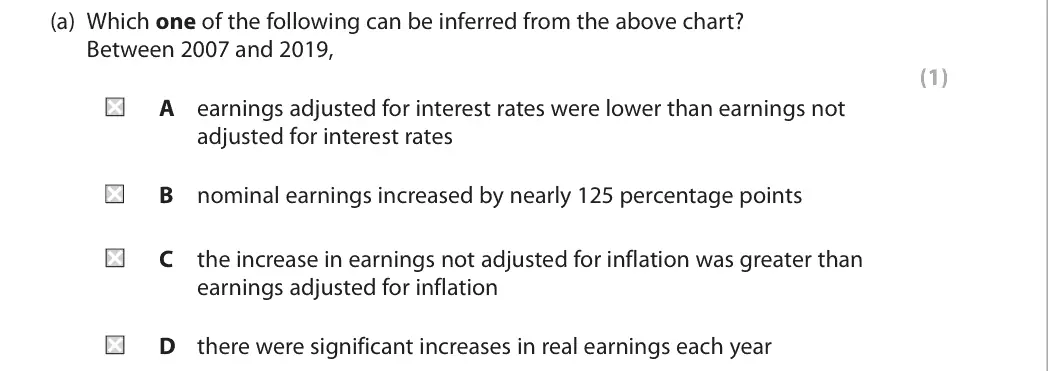
nominal earnings rose from about £375 to £495 a week while real earnings stayed about £450-460, so the increase not adjusted for inflation was greater (C)
A says interest rates, not inflation
B confuses £125 with percentage points
D real earnings were flat
Quantitative skills: QS 7 (make calculations to convert from money to real terms); QS 9 (interpret, apply and analyse information in written, graphical tabular and numerical forms)
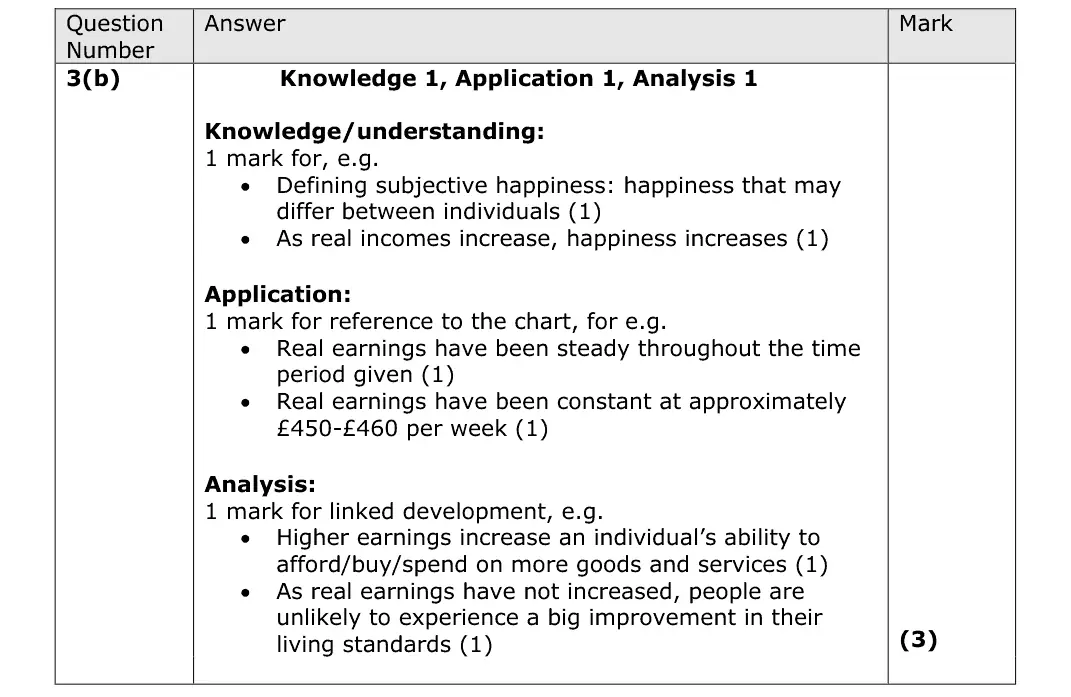
June 2022 · AS Paper 2 · Q3(b)3 marksAO1=1, AO2=1, AO3=1Short answer
Data and extracts for question 3
Mark scheme
Examiner's comment
In this question the marks are split with 1 mark for knowledge, 1 for application, and 1 for analysis. This is a subjective happiness question that candidates were able to answer relatively easily, and the majority were able to do this. Candidates also need to be careful to read the question and the data carefully, as some candidates lost marks because they did not understand the requirements of the question.
Notes from the mark scheme and report
higher real incomes usually raise subjective happiness as people can buy more
real earnings were flat at about £450-460 a week, so little improvement in living standards
Quantitative skills: QS 7 (make calculations to convert from money to real terms); QS 9 (interpret, apply and analyse information in written, graphical tabular and numerical forms)
June 2022 · AS Paper 2 · Q6(c)10 marksAO1=2, AO2=2, AO3=2, AO4=410-mark response
Data and extracts for question 6
Mark scheme, including the levels grid and indicative content
Examiner's comment
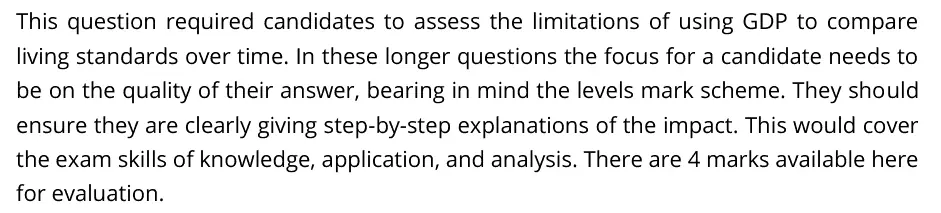
This question required candidates to assess the limitations of using GDP to compare living standards over time. In these longer questions the focus for a candidate needs to be on the quality of their answer, bearing in mind the levels mark scheme. They should ensure they are clearly giving step-by-step explanations of the impact. This would cover the exam skills of knowledge, application, and analysis. There are 4 marks available here for evaluation.
Notes from the mark scheme and report
limitations: informal/unpaid economy, distribution of income, quality of life (health, education), percentages without totals, real vs nominal
evaluate that GDP per capita remains a standard, widely understood measure
Quantitative skills: QS 9 (interpret, apply and analyse information in written, graphical tabular and numerical forms)
June 2022 · Paper 2 · Q6(c)10 marksAO1=2, AO2=2, AO3=2, AO4=410-mark response
Data and extracts for question 6
Mark scheme, including the levels grid and indicative content
Examiner's comment
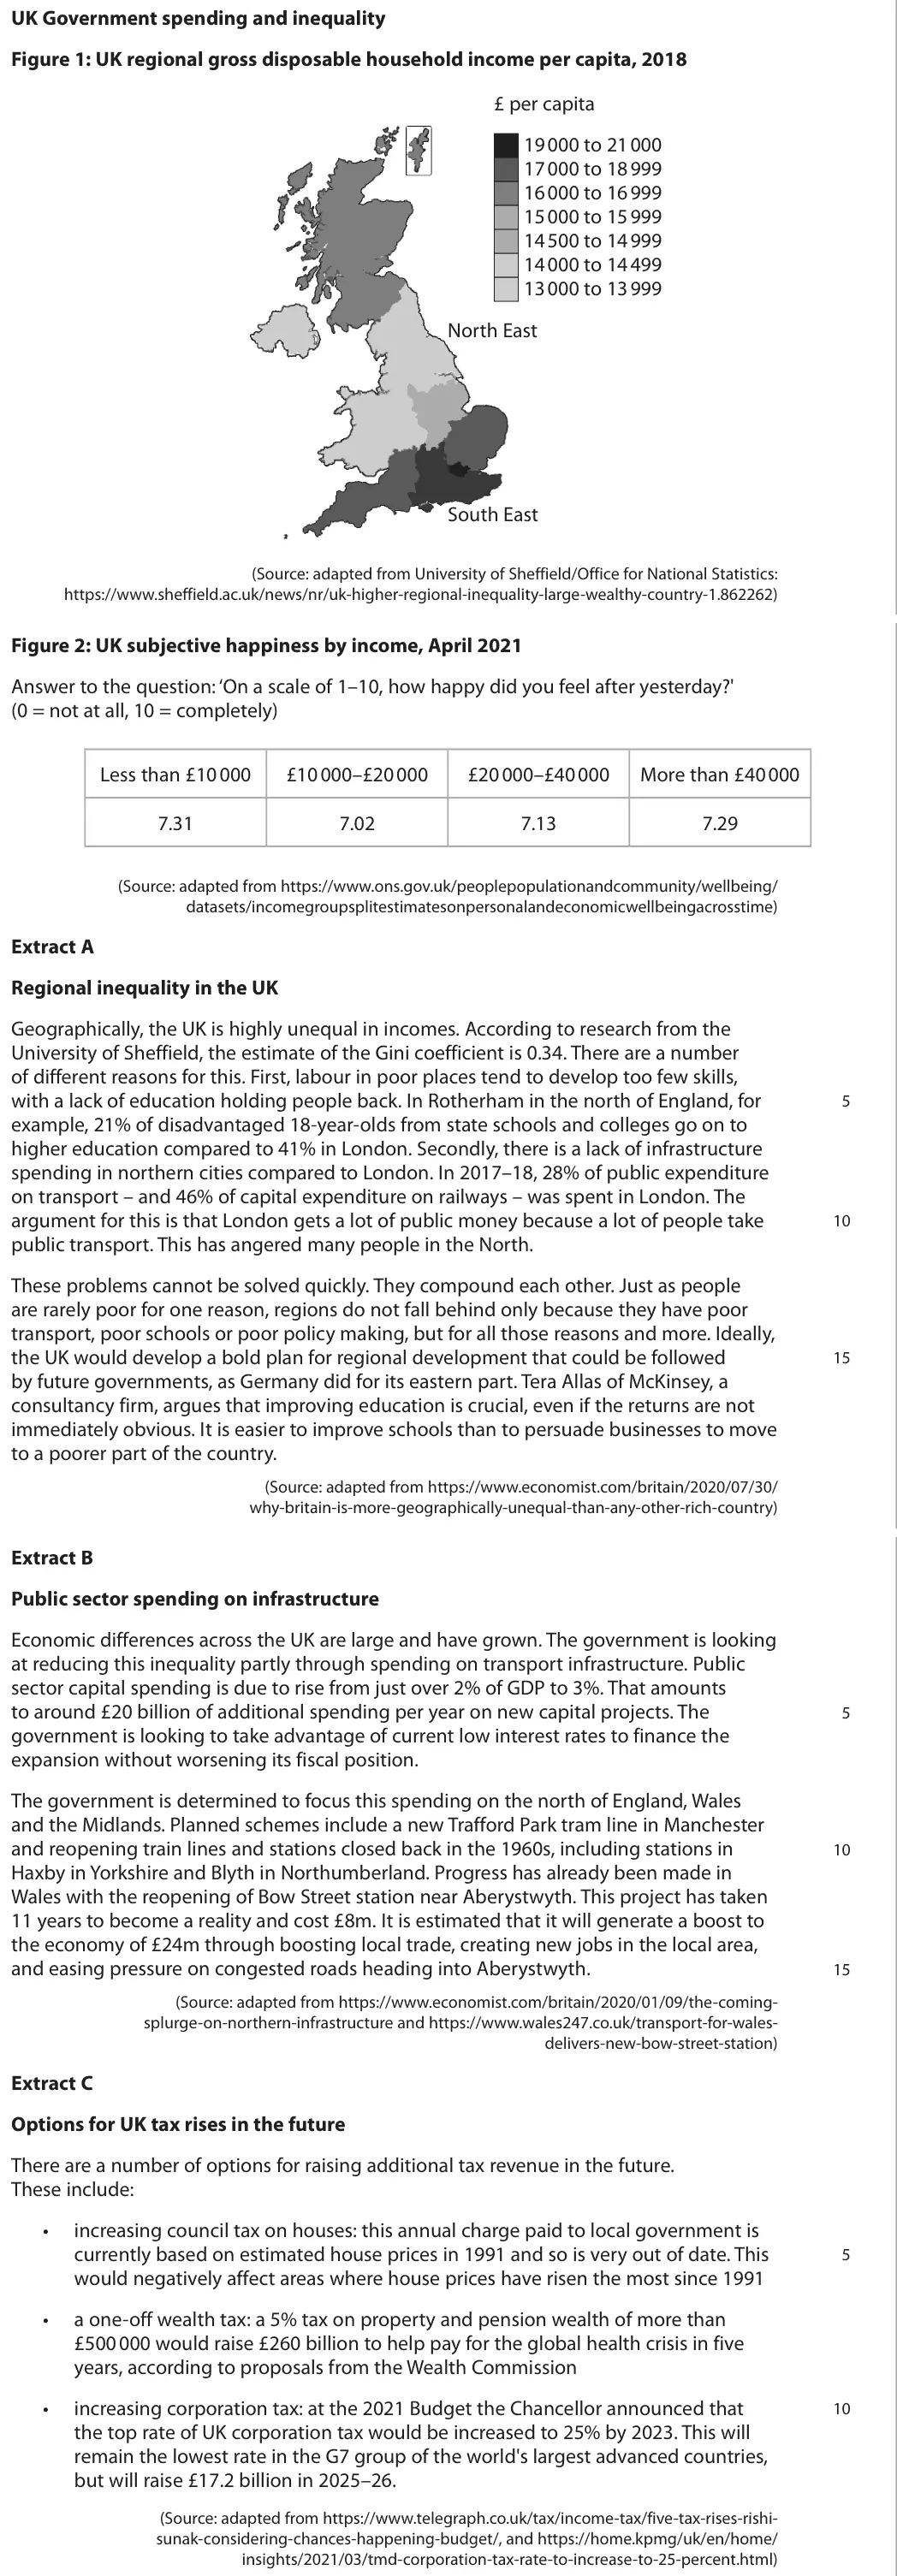
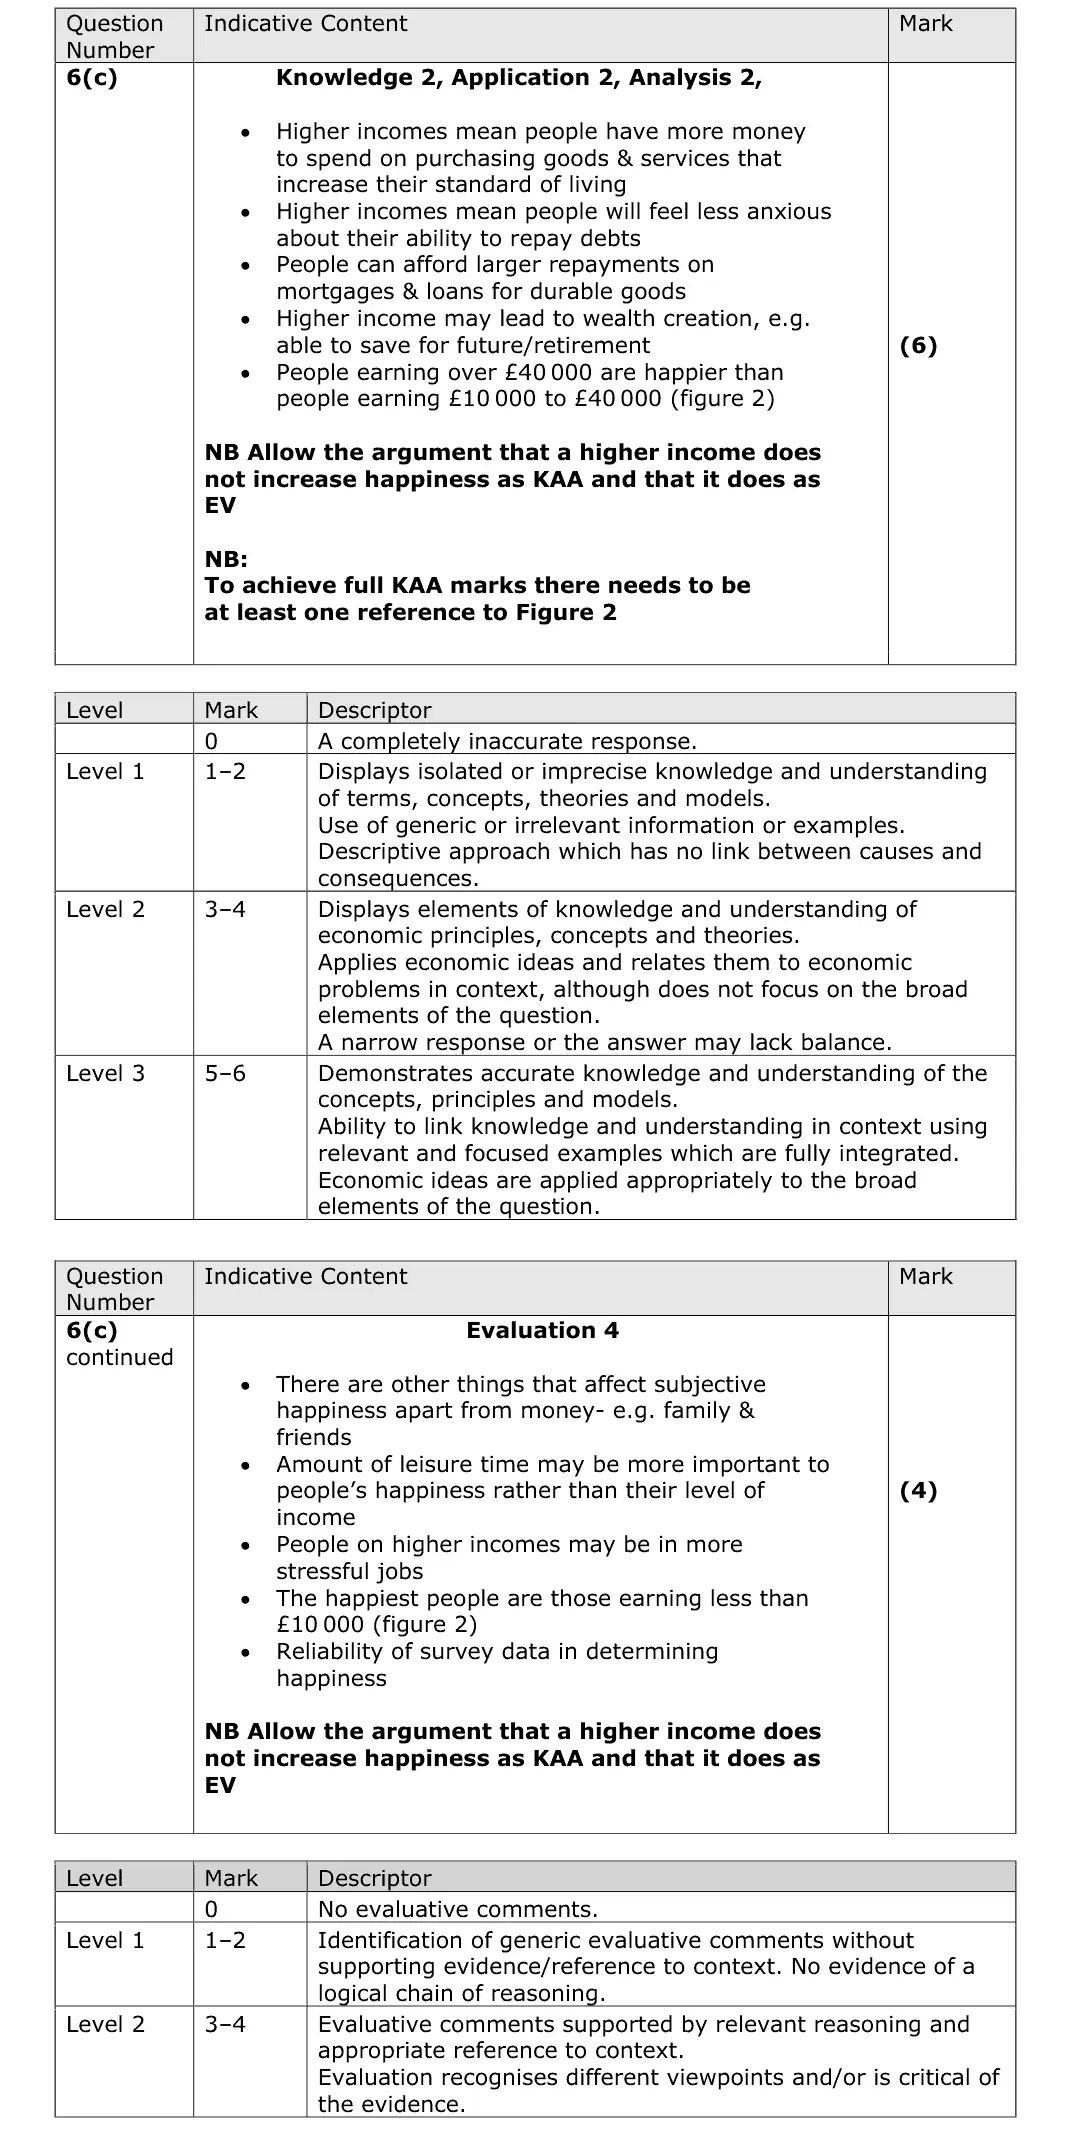
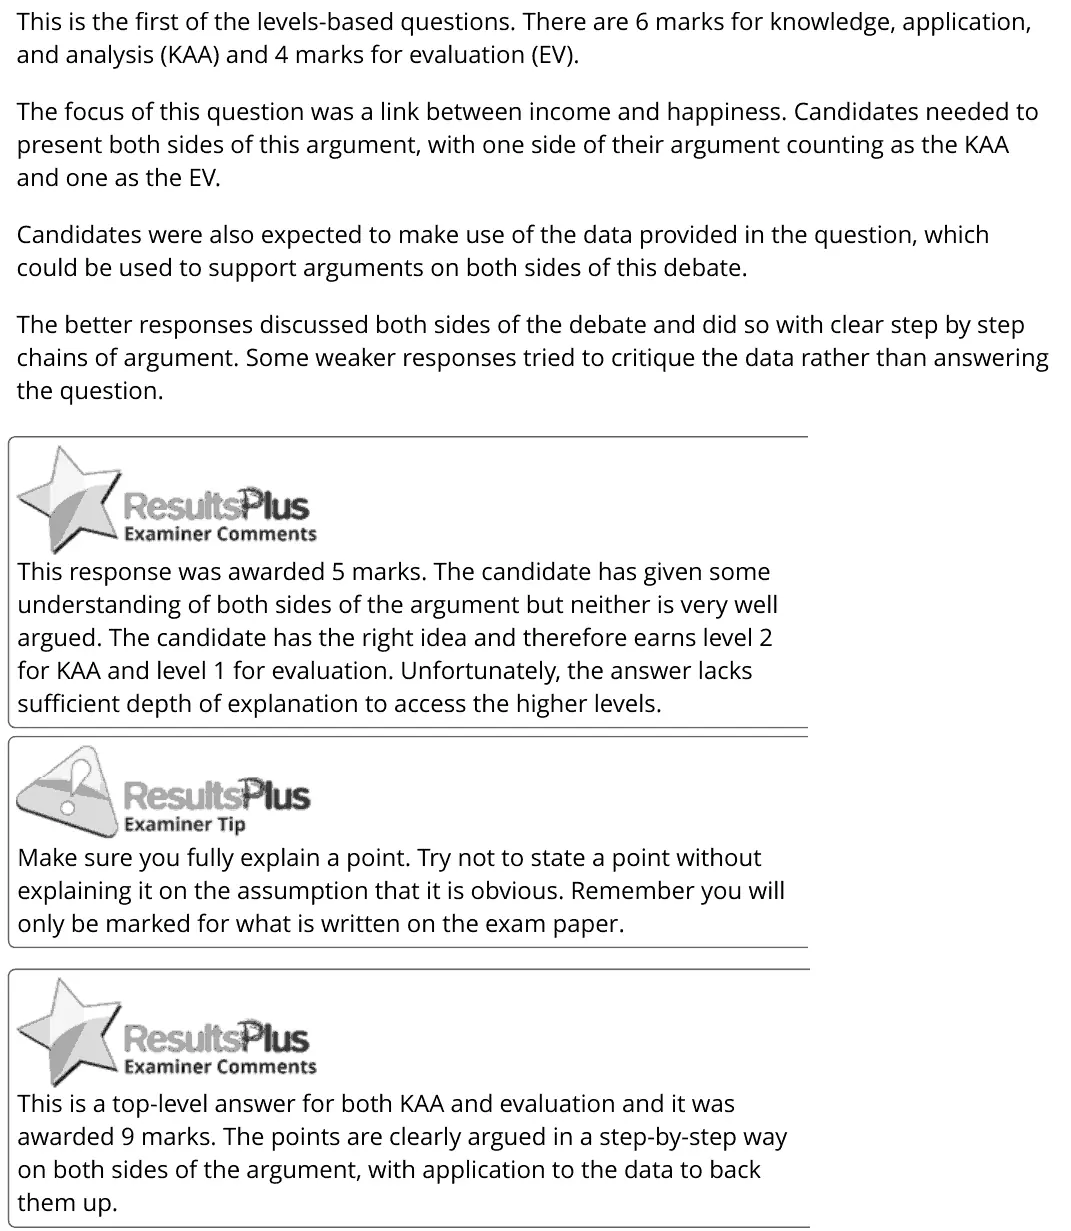
This is the first of the levels-based questions. There are 6 marks for knowledge, application, and analysis (KAA) and 4 marks for evaluation (EV). The focus of this question was a link between income and happiness. Candidates needed to present both sides of this argument, with one side of their argument counting as the KAA and one as the EV. Candidates were also expected to make use of the data provided in the question, which could be used to support arguments on both sides of this debate. The better responses discussed both sides of the debate and did so with clear step by step chains of argument. Some weaker responses tried to critique the data rather than answering the question. This response was awarded 5 marks. The candidate has given some understanding of both sides of the argument but neither is very well argued. The candidate has the right idea and therefore earns level 2 for KAA and level 1 for evaluation. Unfortunately, the answer lacks sufficient depth of explanation to access the higher levels. Make sure you fully explain a point. Try not to state a point without explaining it on the assumption that it is obvious. Remember you will only be marked for what is written on the exam paper. This is a top-level answer for both KAA and evaluation and it was awarded 9 marks. The points are clearly argued in a step-by-step way on both sides of the argument, with application to the data to back them up.
Notes from the mark scheme and report
real income vs subjective happiness (national wellbeing)
full KAA needs at least one reference to Figure 2 (under £10 000 scores 7.31, the highest)
one side counts as KAA, the other as evaluation
weaker answers critiqued the data instead of answering
Quantitative skills: QS 9 (interpret, apply and analyse information in written, graphical tabular and numerical forms)
November 2021 · Paper 2 · Q5(a)1 markMultiple choice
Data and extracts for question 5
Answer
C
Mark scheme
Notes from the mark scheme and report
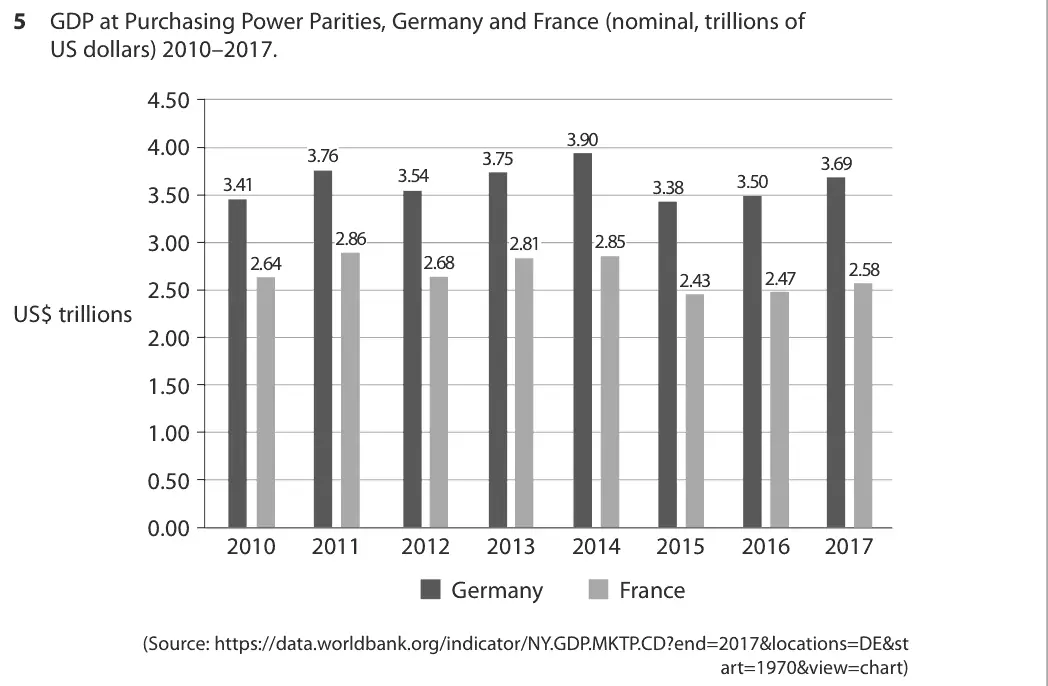
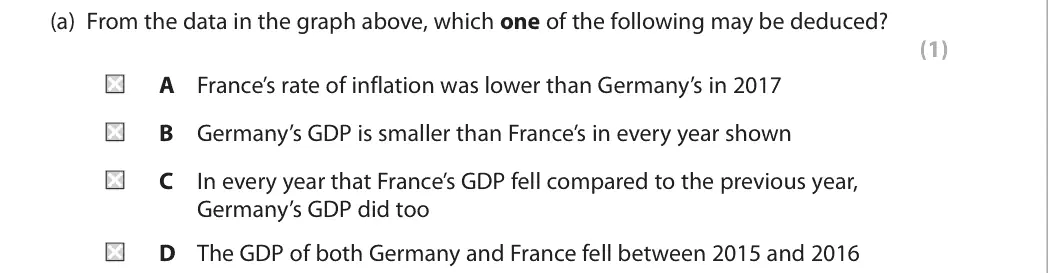
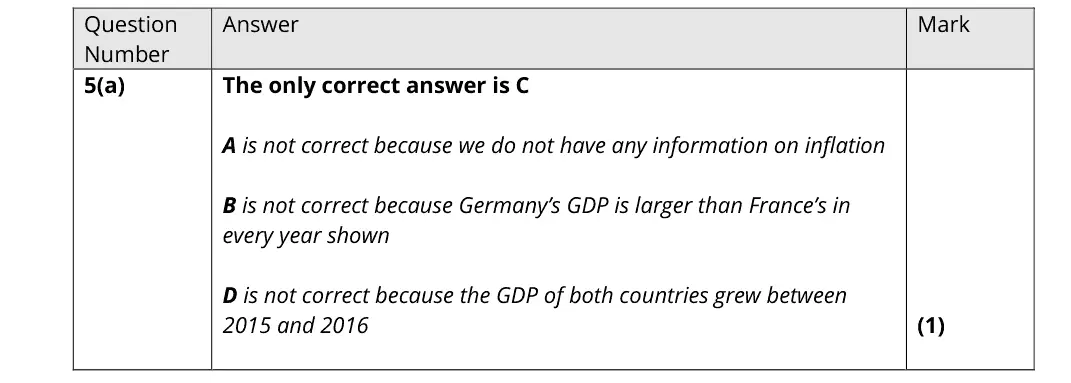
every year France's GDP fell (2012, 2015) Germany's fell too (C)
no inflation data, Germany is larger every year, both grew 2015-16
Quantitative skills: QS 9 (interpret, apply and analyse information in written, graphical tabular and numerical forms)
November 2021 · Paper 2 · Q5(b)2 marksAO2=2Calculation
Data and extracts for question 5
Mark scheme
Notes from the mark scheme and report
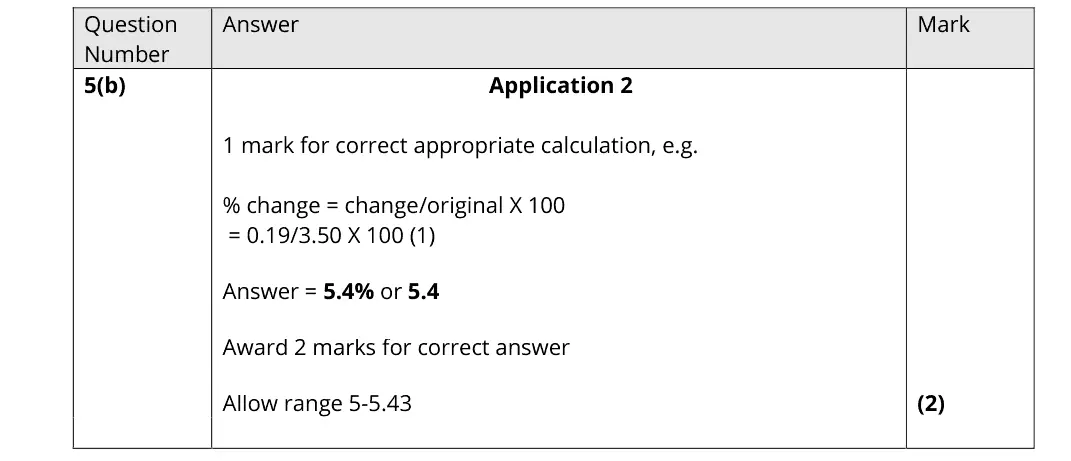
(3.69 - 3.50)/3.50 x 100 = 5.4%
Quantitative skills: QS 2 (calculate, use and understand percentages, percentage changes and percentage point changes); QS 9 (interpret, apply and analyse information in written, graphical tabular and numerical forms)
November 2021 · Paper 2 · Q5(c)2 marksAO1=1, AO3=1Short answerHard
Data and extracts for question 5
Mark scheme
Notes from the mark scheme and report
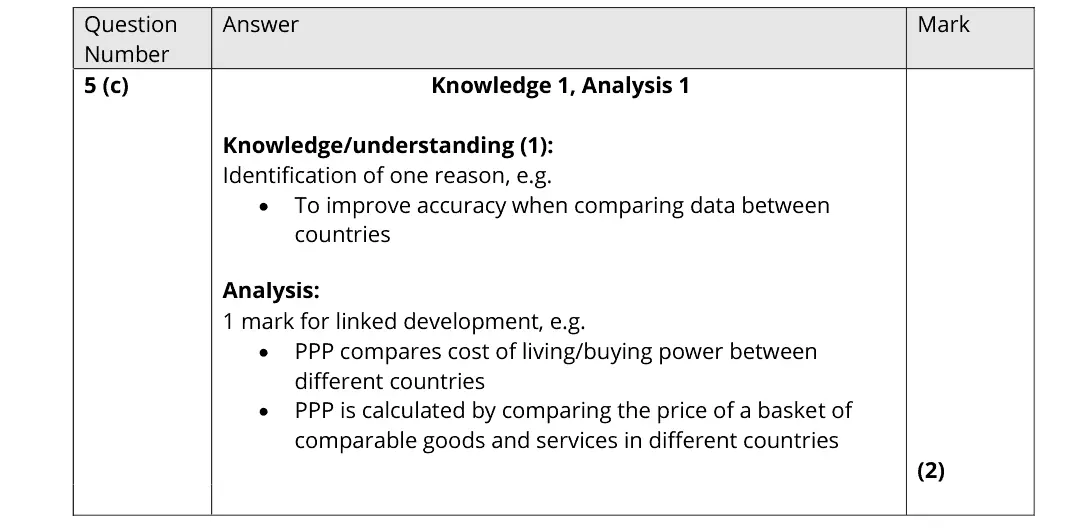
PPPs adjust for differences in the cost of living (price of a common basket) so international comparisons are more accurate
report: "many candidates struggled to explain why Purchasing Power Parities are used, with many not understanding what the term means"
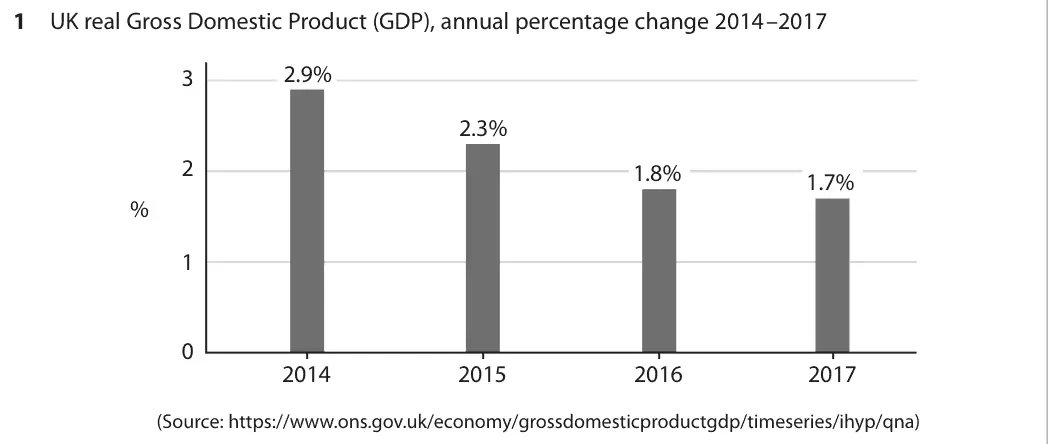
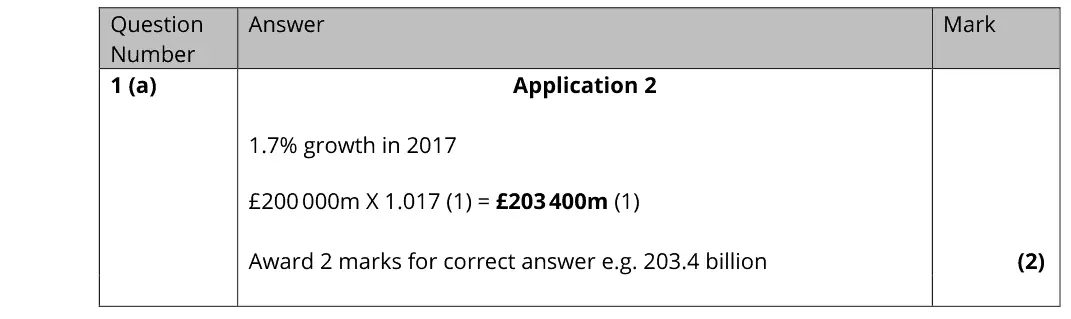
October 2020 · Paper 2 · Q1(a)2 marksAO2=2CalculationHard
Data and extracts for question 1
Mark scheme
Notes from the mark scheme and report
growth in 2017 was 1.7%: £200 000m x 1.017 = £203 400m
report: "students found this a fairly difficult calculation" and scored much lower than on the Q4(a) calculation
Quantitative skills: QS 2 (calculate, use and understand percentages, percentage changes and percentage point changes); QS 9 (interpret, apply and analyse information in written, graphical tabular and numerical forms)
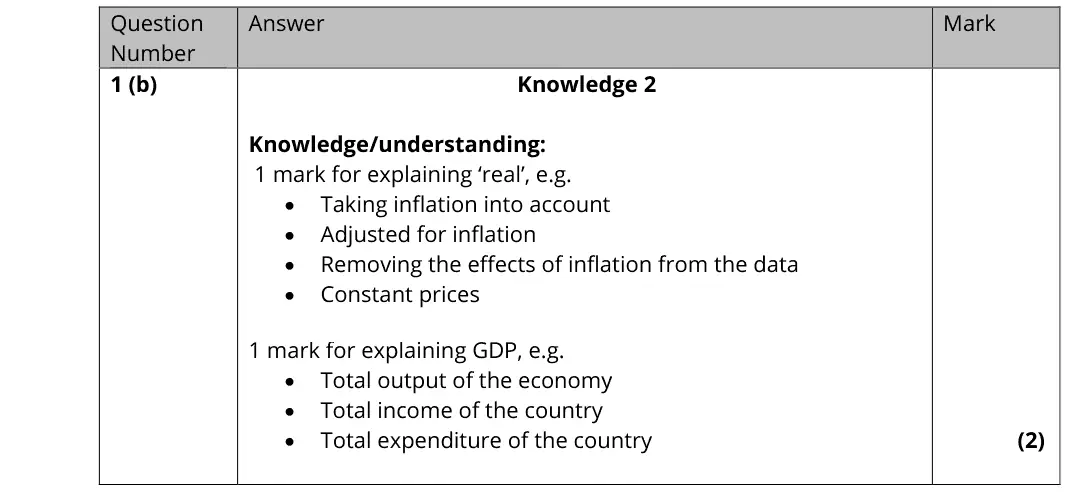
October 2020 · Paper 2 · Q1(b)2 marksAO1=2Short answer
Data and extracts for question 1
Mark scheme
Notes from the mark scheme and report
1 mark for 'real' (adjusted for inflation, constant prices) and 1 mark for GDP (total output, income or expenditure of the economy)
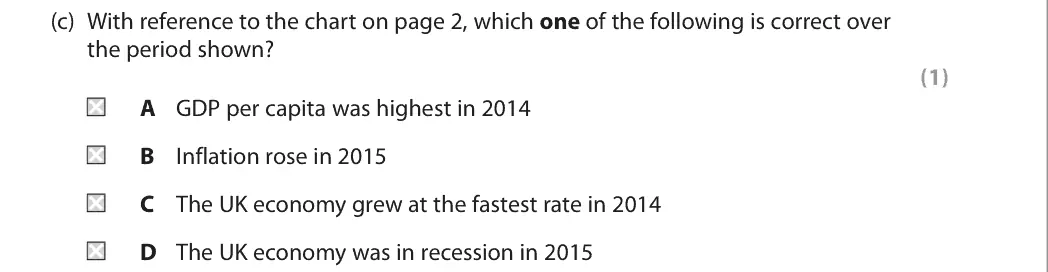
October 2020 · Paper 2 · Q1(c)1 markAO2=1Multiple choice
Data and extracts for question 1
Answer
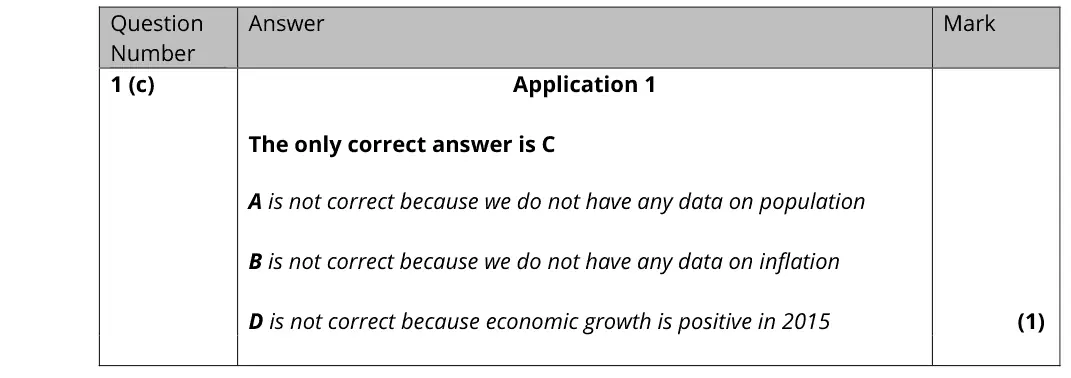
C
Mark scheme
Notes from the mark scheme and report
the tallest bar is 2014 (2.9%), so growth was fastest then (C)
no population data for per capita (A)
no inflation data (B)
growth was positive in 2015, so no recession (D)
Quantitative skills: QS 10 (distinguish between changes in the level of a variable, and the rate of change); QS 9 (interpret, apply and analyse information in written, graphical tabular and numerical forms)
October 2020 · AS Paper 2 · Q5(a)1 markAO1=1Definition
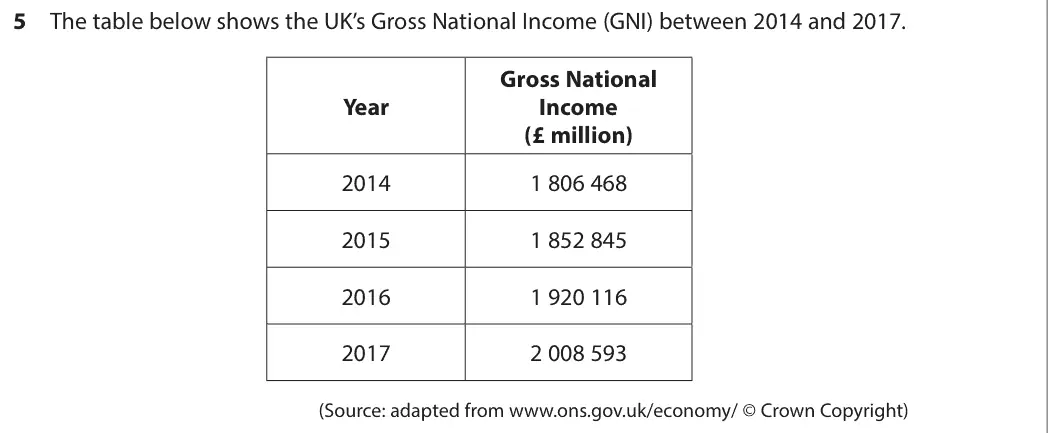
Data and extracts for question 5
Mark scheme
Examiner's comment
This question requires a definition of GNI. Many candidates were not able to provide an accurate definition, as they confused GNI with GDP, and hence did not get the mark for this question.
Notes from the mark scheme and report
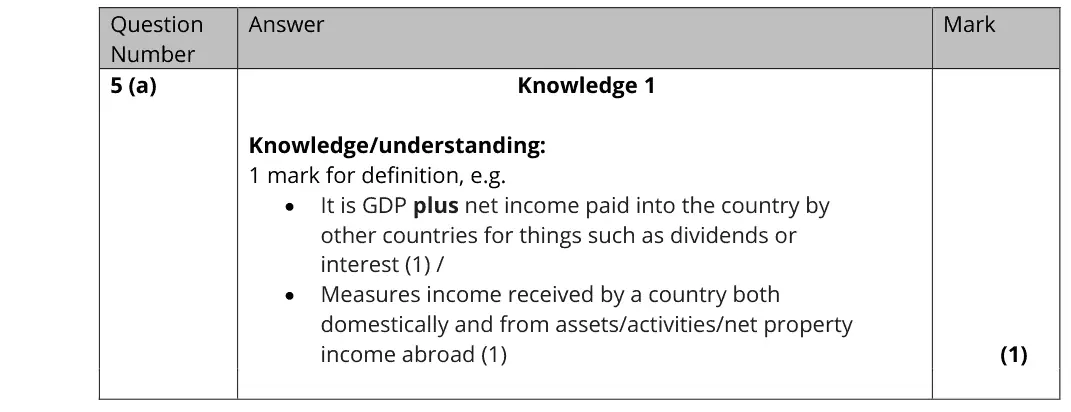
GNI = GDP plus net income from abroad (e.g. dividends, interest)
many confused GNI with GDP
October 2020 · AS Paper 2 · Q5(b)1 markMultiple choice
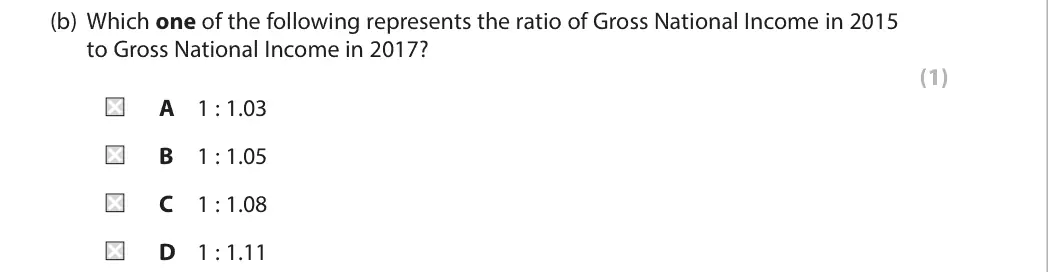
Data and extracts for question 5
Answer
C
Mark scheme
Notes from the mark scheme and report
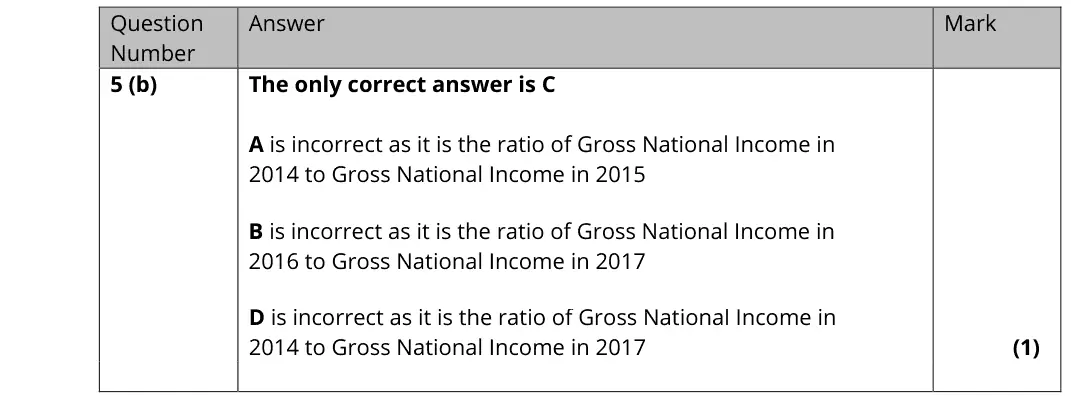
2 008 593 / 1 852 845 = 1.08, so 1 : 1.08 (C)
A is 2014 to 2015, B 2016 to 2017, D 2014 to 2017
Quantitative skills: QS 1 (calculate, use and understand ratios and fractions); QS 9 (interpret, apply and analyse information in written, graphical tabular and numerical forms)
October 2020 · AS Paper 2 · Q5(c)2 marksAO2=2Calculation
Data and extracts for question 5
Mark scheme
Examiner's comment
This question asked candidates to calculate index numbers for 2016. Many candidates were able to answer this question relatively easily. However, some candidates lost marks because they selected the wrong two pieces of data.
Notes from the mark scheme and report
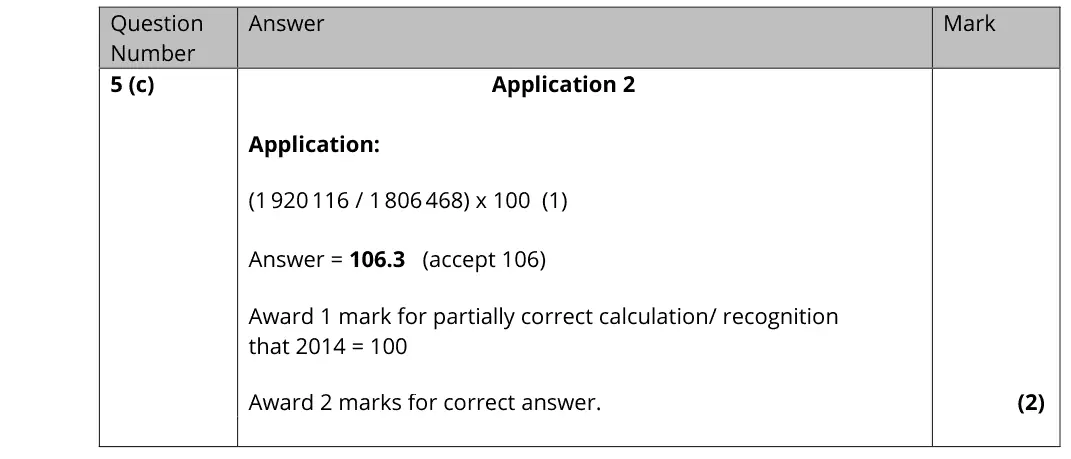
(1 920 116 / 1 806 468) x 100 = 106.3
1 mark for 2014 = 100 or partial working
some used the wrong years
Quantitative skills: QS 5 (calculate and interpret index numbers)
October 2020 · Paper 3 · Q2(a)5 marksAO1=2, AO2=2, AO3=1Short answer
Data and extracts for question 2
Mark scheme
Examiner's comment
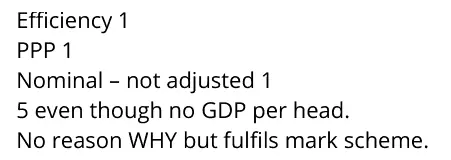
Efficiency 1 PPP 1 Nominal – not adjusted 1 5 even though no GDP per head. No reason WHY but fulfils mark scheme.
Notes from the mark scheme and report
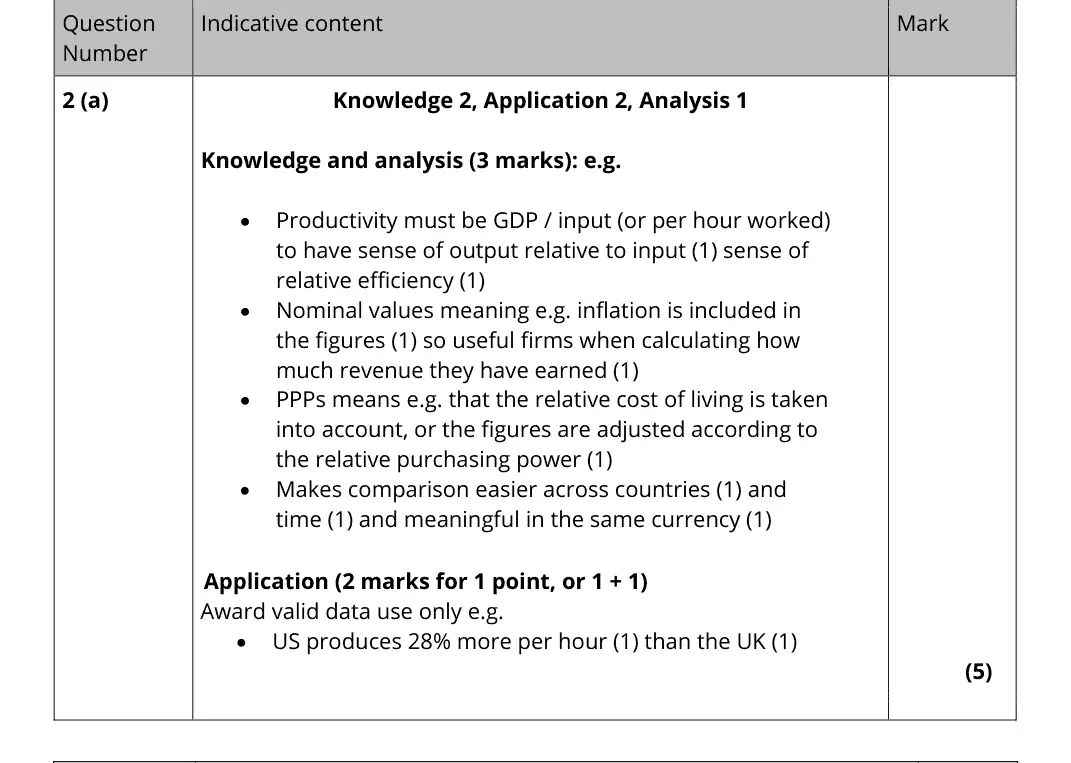
per hour worked measures output relative to input (efficiency)
PPPs adjust for relative cost of living so countries can be compared in one currency
nominal means not adjusted for inflation
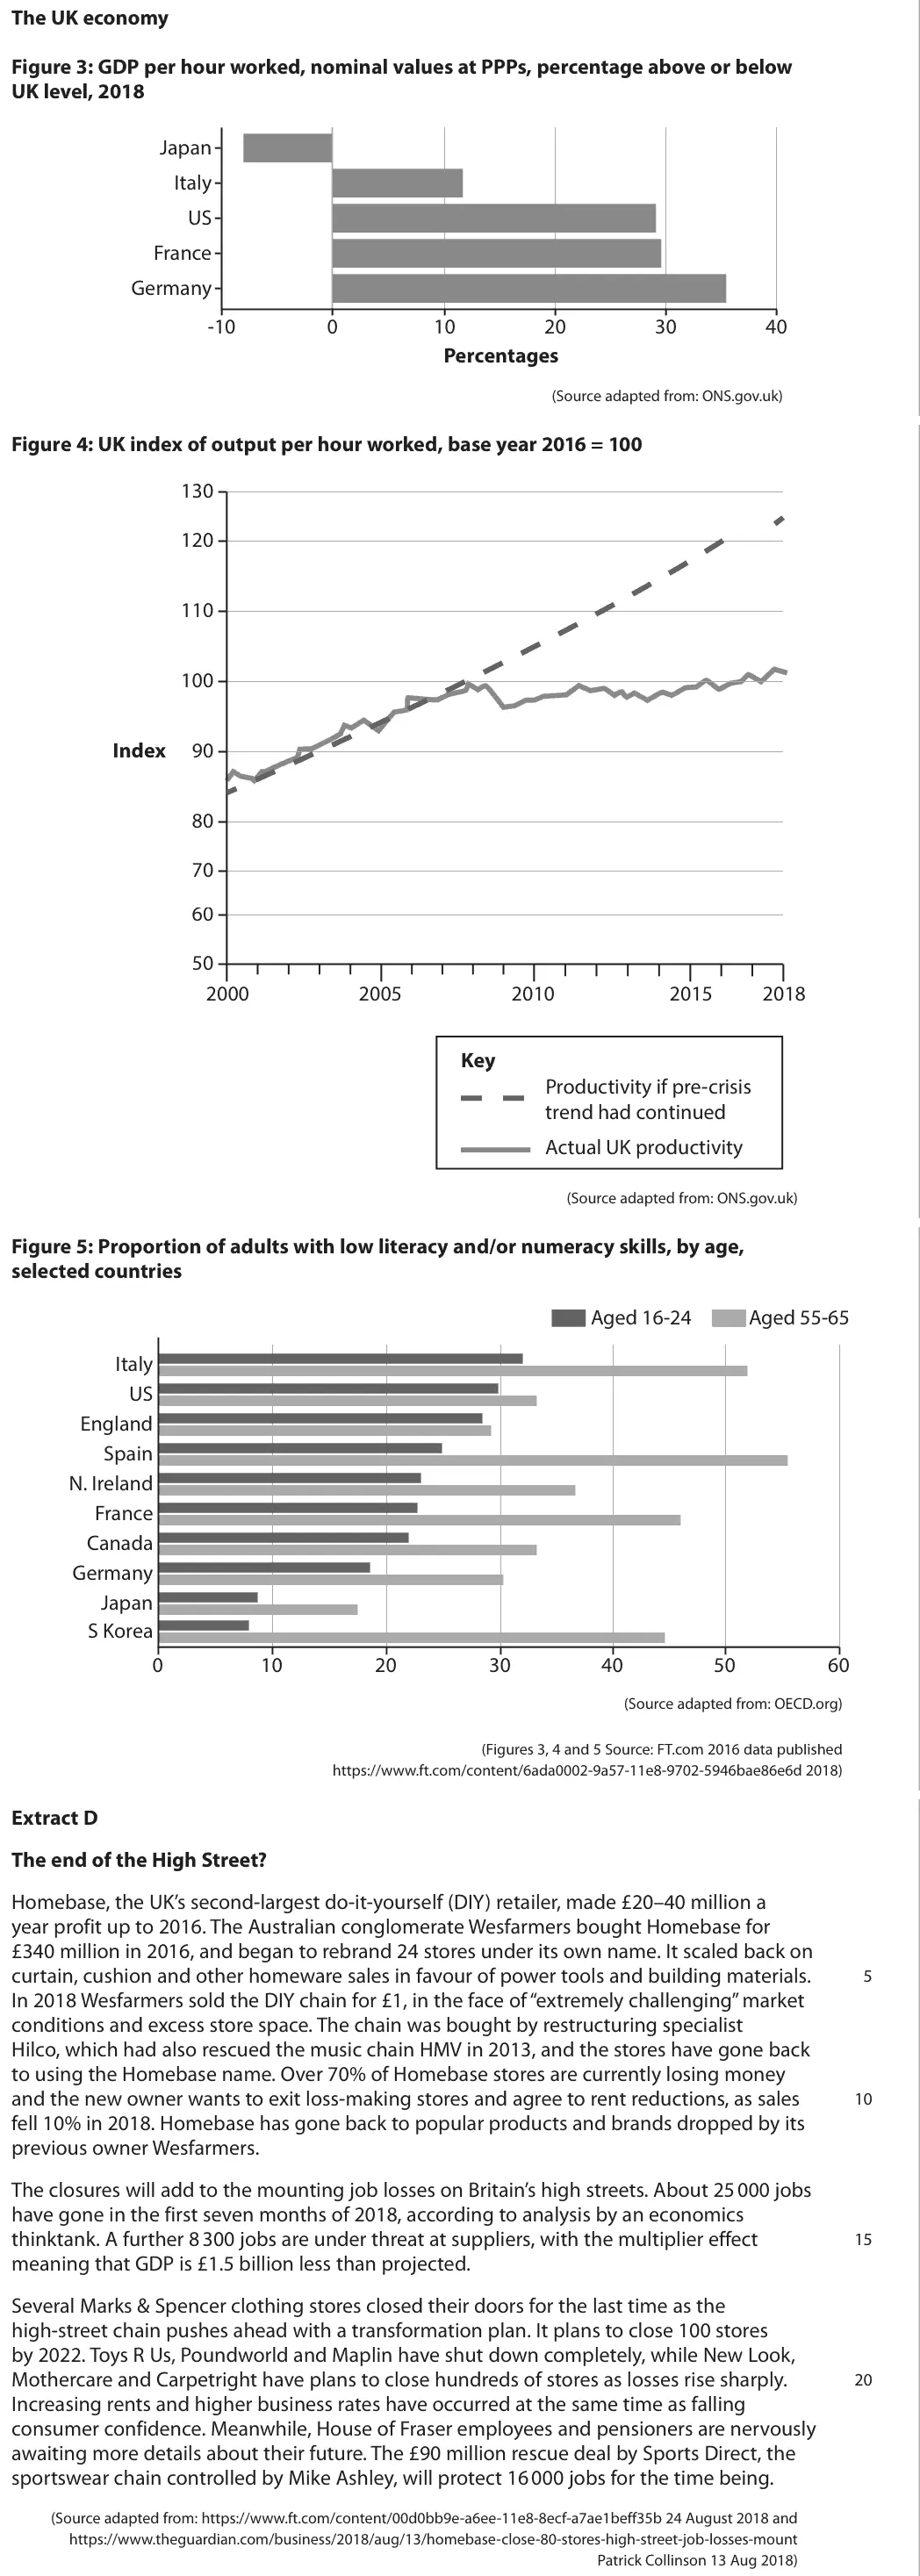
application only for valid data e.g. US produces about 28% more per hour than the UK
Quantitative skills: QS 9 (interpret, apply and analyse information in written, graphical tabular and numerical forms)
June 2019 · Paper 2 · Q6(c)10 marksAO1=2, AO2=2, AO3=2, AO4=410-mark response
Data and extracts for question 6
Mark scheme, including the levels grid and indicative content
Examiner's comment
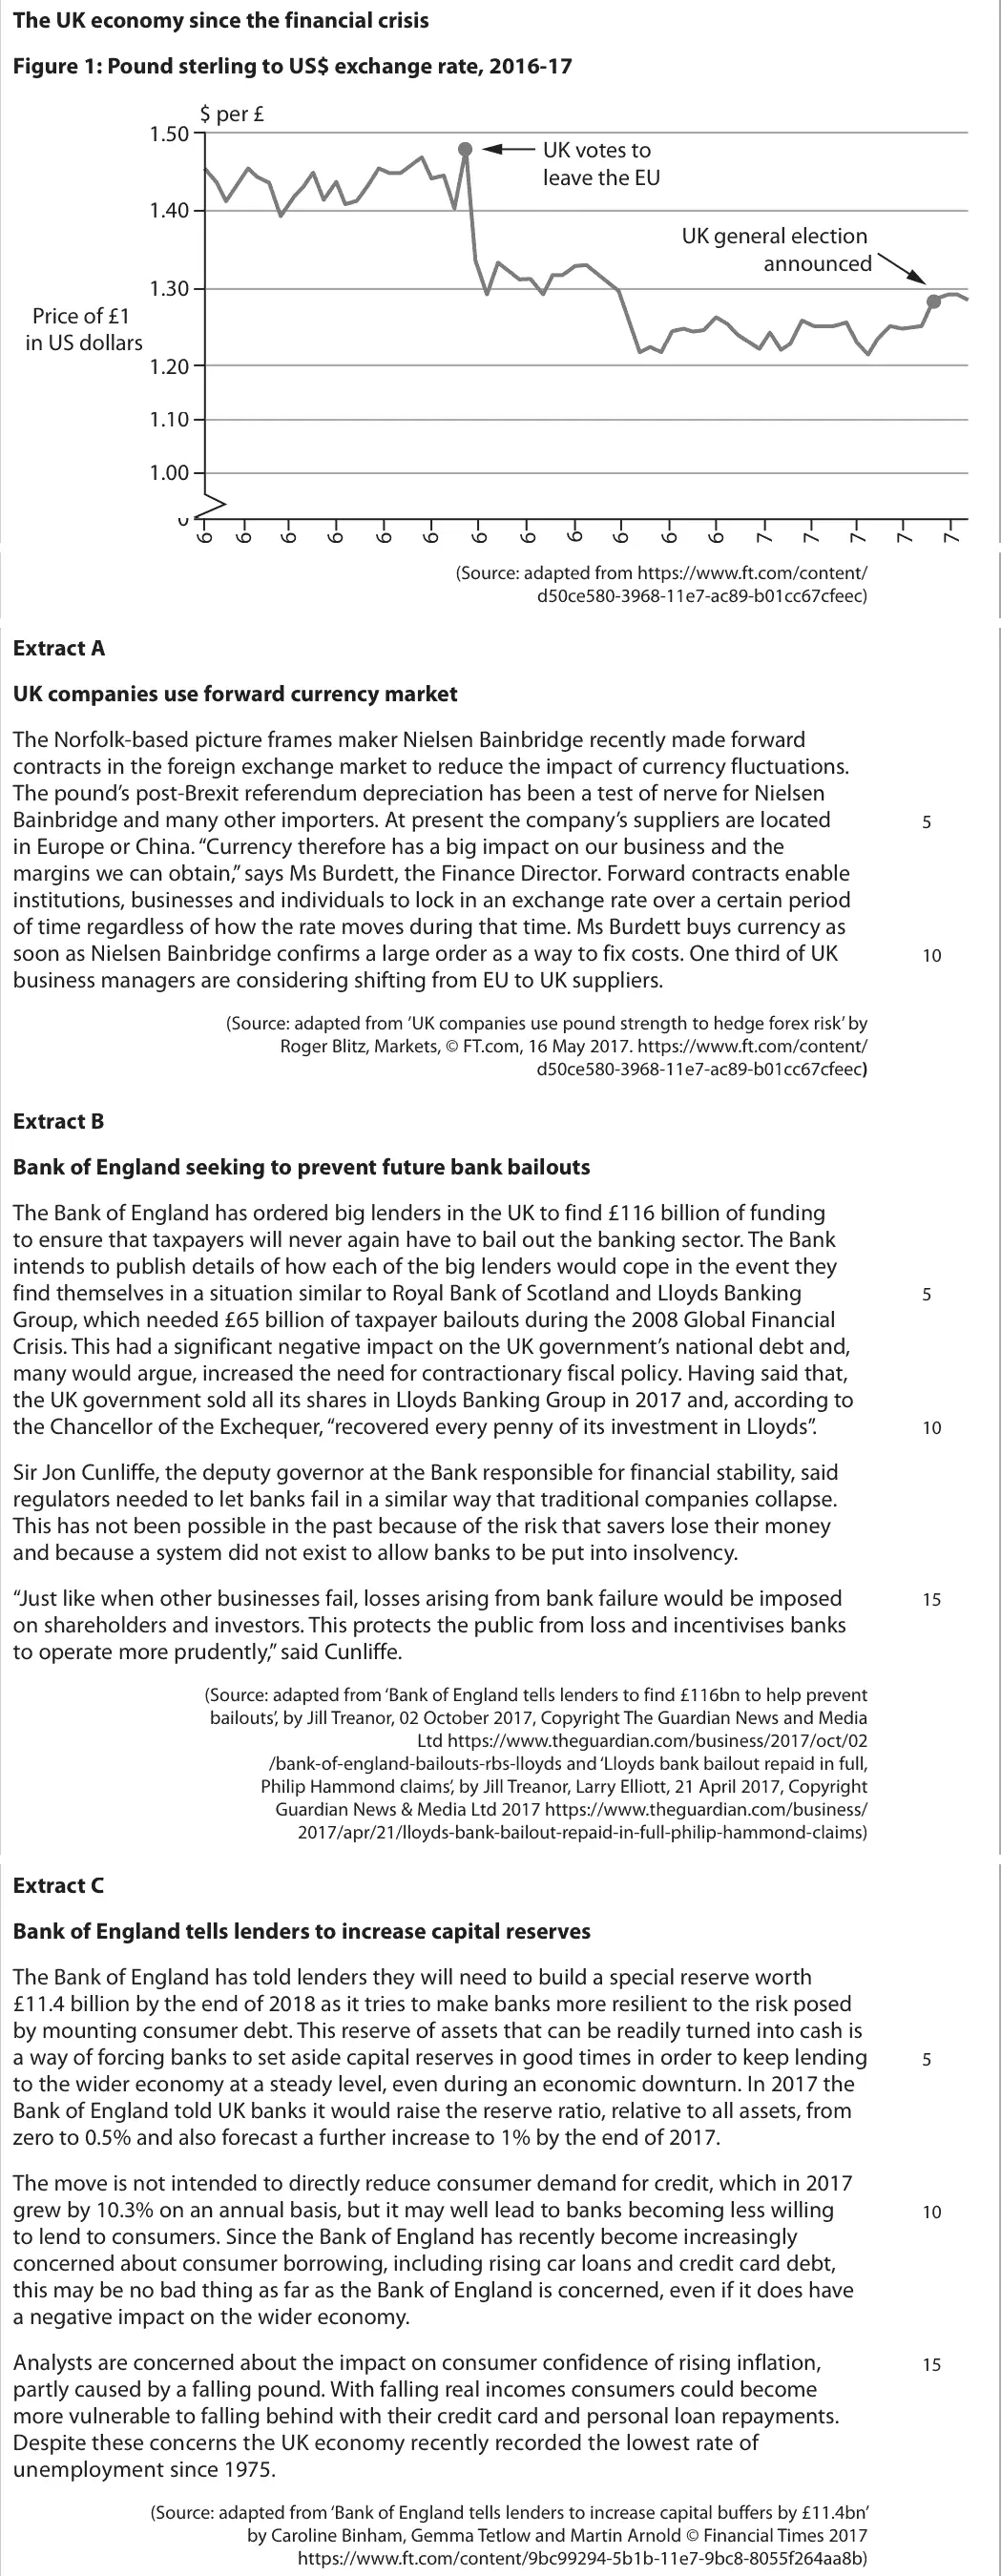
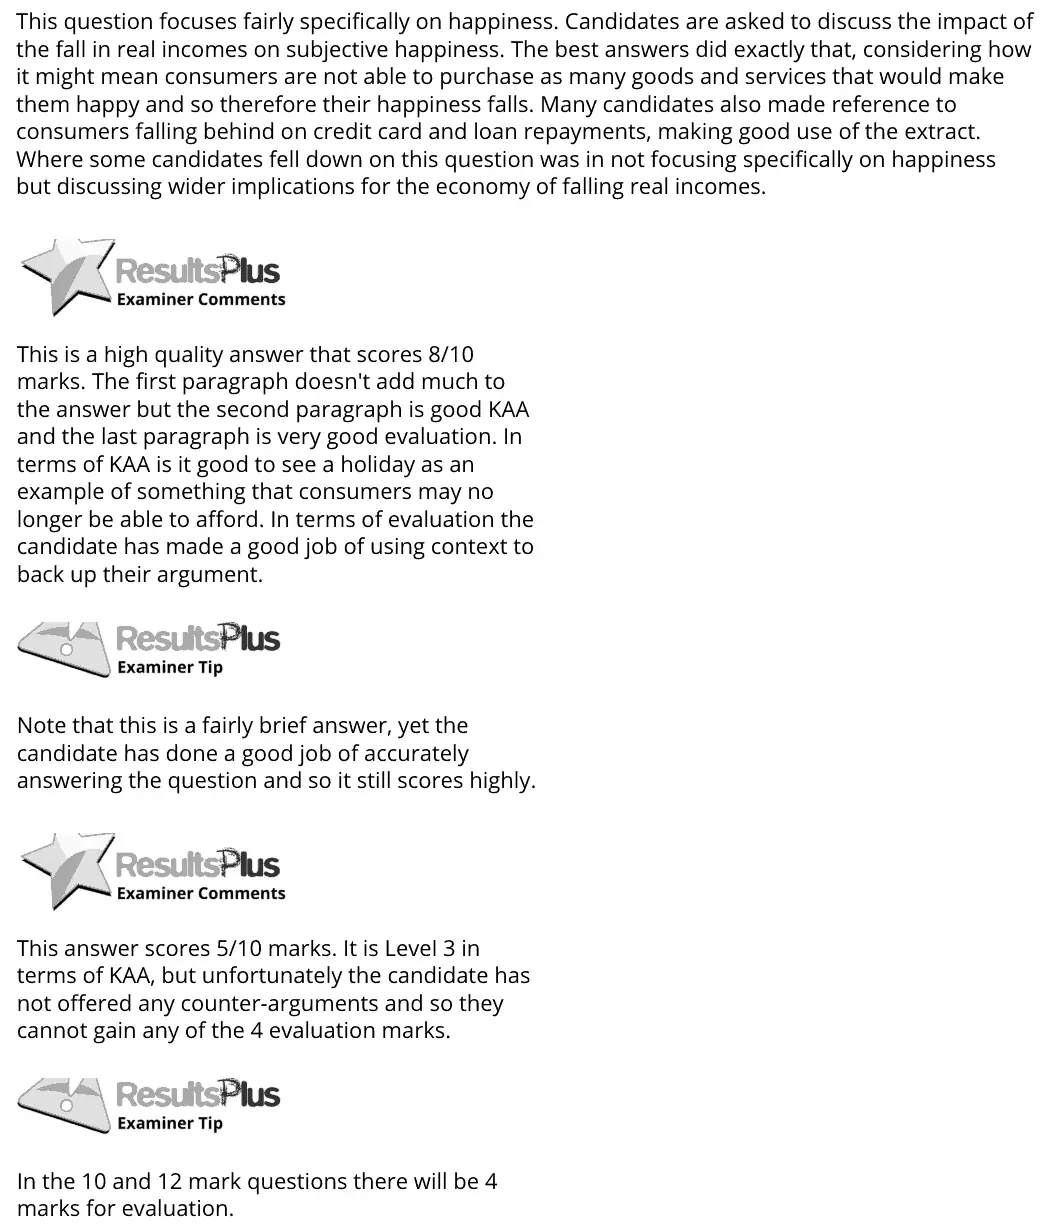
This question focuses fairly specifically on happiness. Candidates are asked to discuss the impact of the fall in real incomes on subjective happiness. The best answers did exactly that, considering how it might mean consumers are not able to purchase as many goods and services that would make them happy and so therefore their happiness falls. Many candidates also made reference to consumers falling behind on credit card and loan repayments, making good use of the extract. Where some candidates fell down on this question was in not focusing specifically on happiness but discussing wider implications for the economy of falling real incomes. This is a high quality answer that scores 8/10 marks. The first paragraph doesn't add much to the answer but the second paragraph is good KAA and the last paragraph is very good evaluation. In terms of KAA is it good to see a holiday as an example of something that consumers may no longer be able to afford. In terms of evaluation the candidate has made a good job of using context to back up their argument. Note that this is a fairly brief answer, yet the candidate has done a good job of accurately answering the question and so it still scores highly. This answer scores 5/10 marks. It is Level 3 in terms of KAA, but unfortunately the candidate has not offered any counter-arguments and so they cannot gain any of the 4 evaluation marks. In the 10 and 12 mark questions there will be 4 marks for evaluation.
Notes from the mark scheme and report
focus on subjective happiness, not wider macro effects of falling real incomes
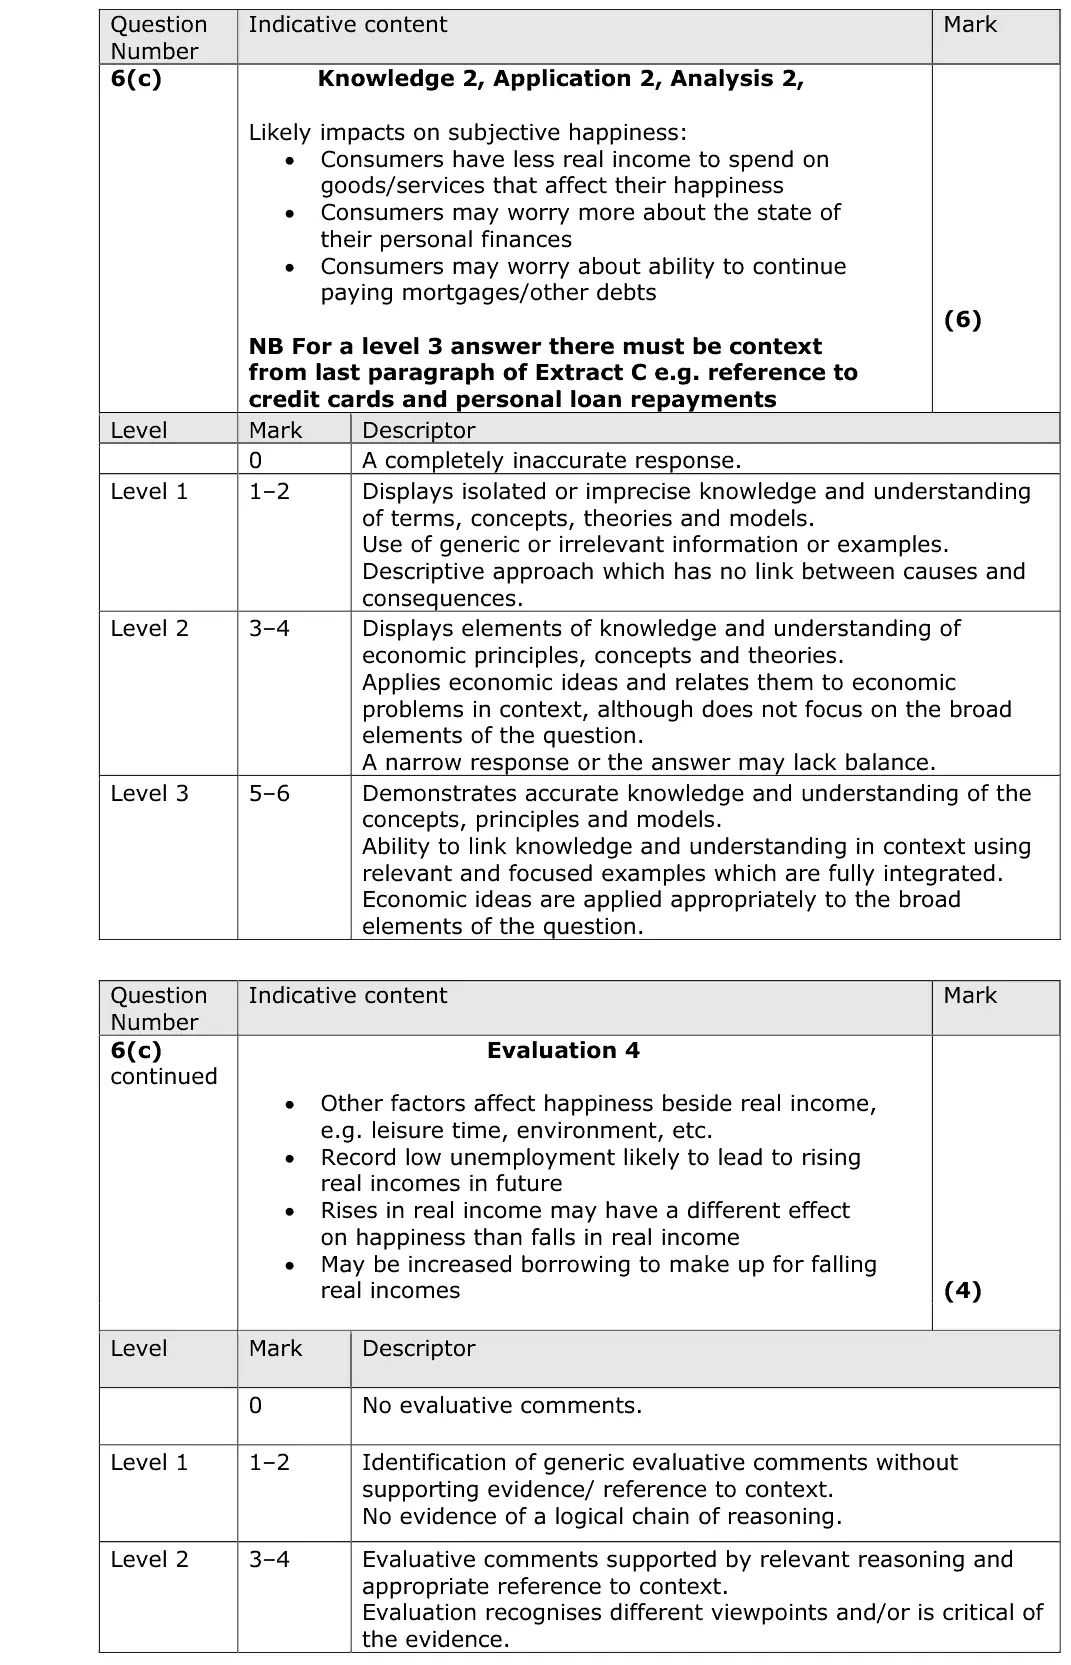
Level 3 needs context from the last paragraph of Extract C (credit card and loan repayments)
evaluate with other influences on happiness and record low unemployment
June 2019 · AS Paper 2 · Q6(e)15 marksAO1=3, AO2=3, AO3=3, AO4=615-mark response
Data and extracts for question 6
Mark scheme, including the levels grid and indicative content
Examiner's comment
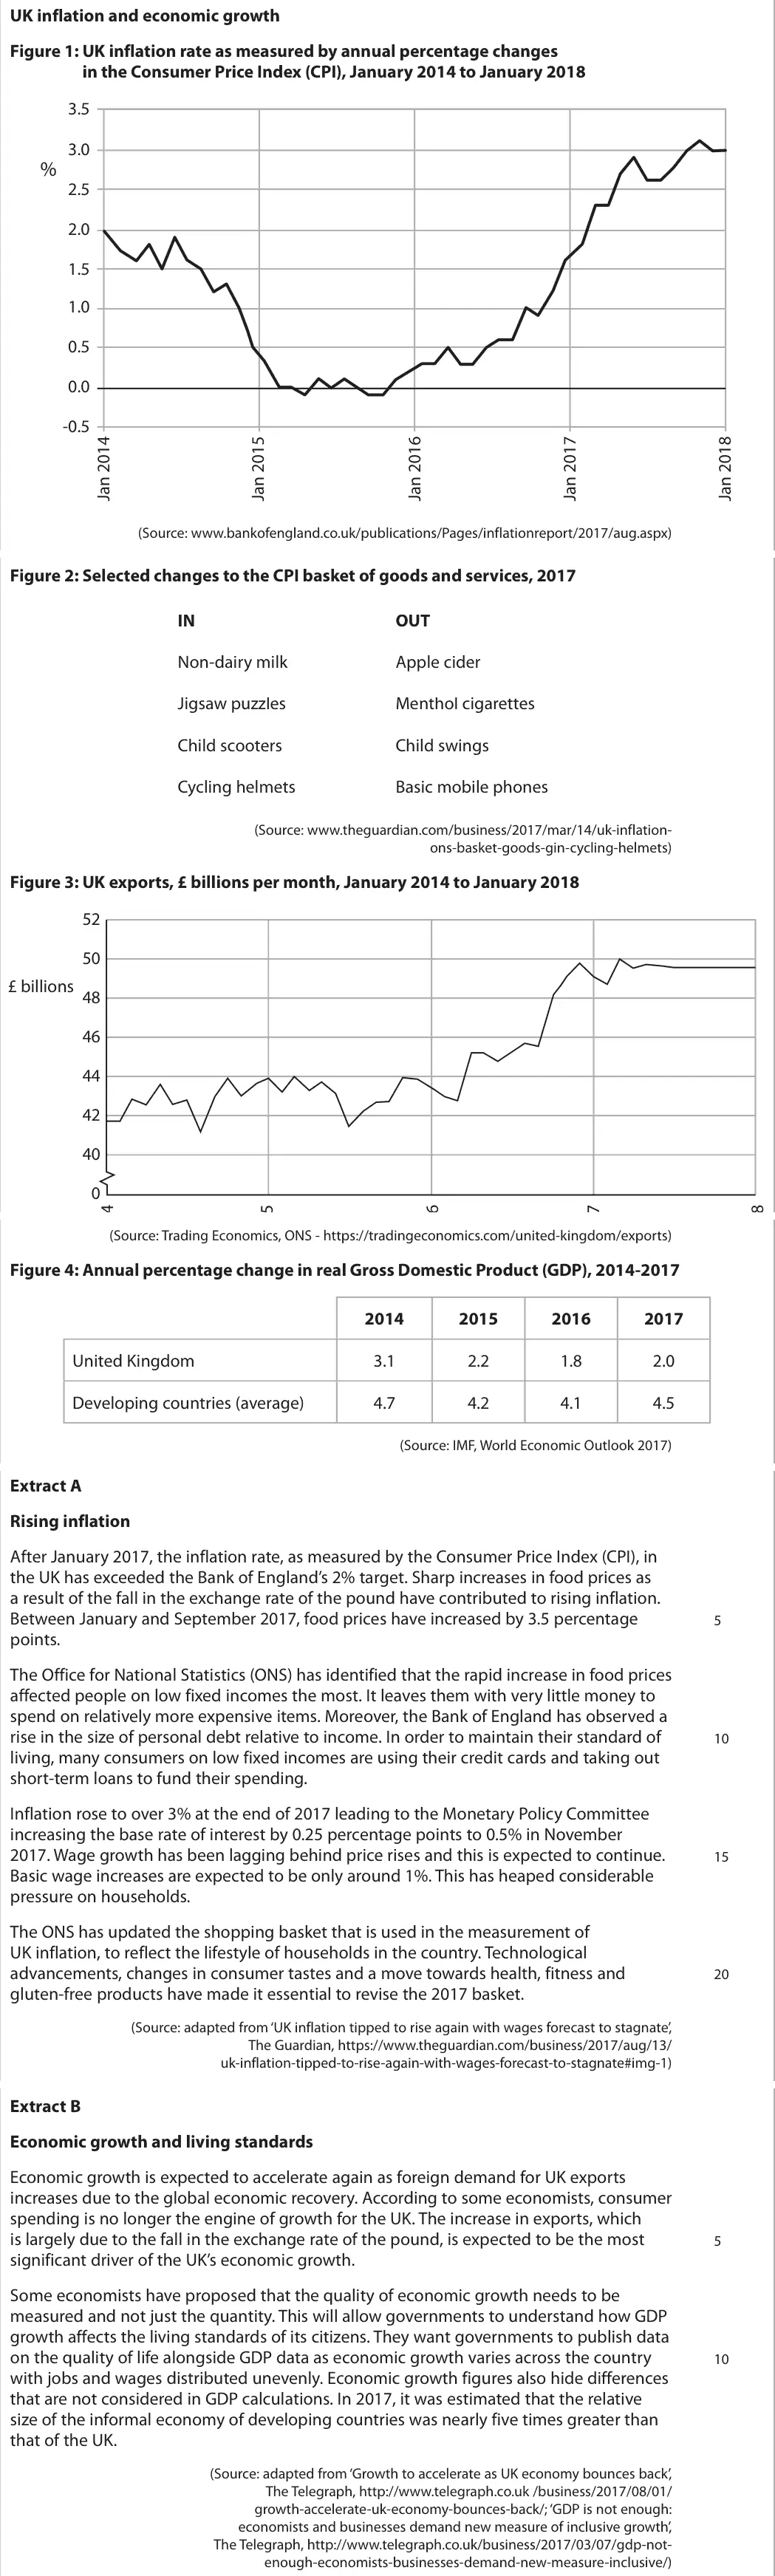
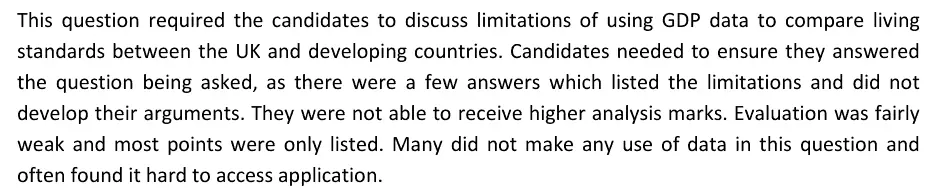
This question required the candidates to discuss limitations of using GDP data to compare living standards between the UK and developing countries. Candidates needed to ensure they answered the question being asked, as there were a few answers which listed the limitations and did not develop their arguments. They were not able to receive higher analysis marks. Evaluation was fairly weak and most points were only listed. Many did not make any use of data in this question and often found it hard to access application.
Notes from the mark scheme and report
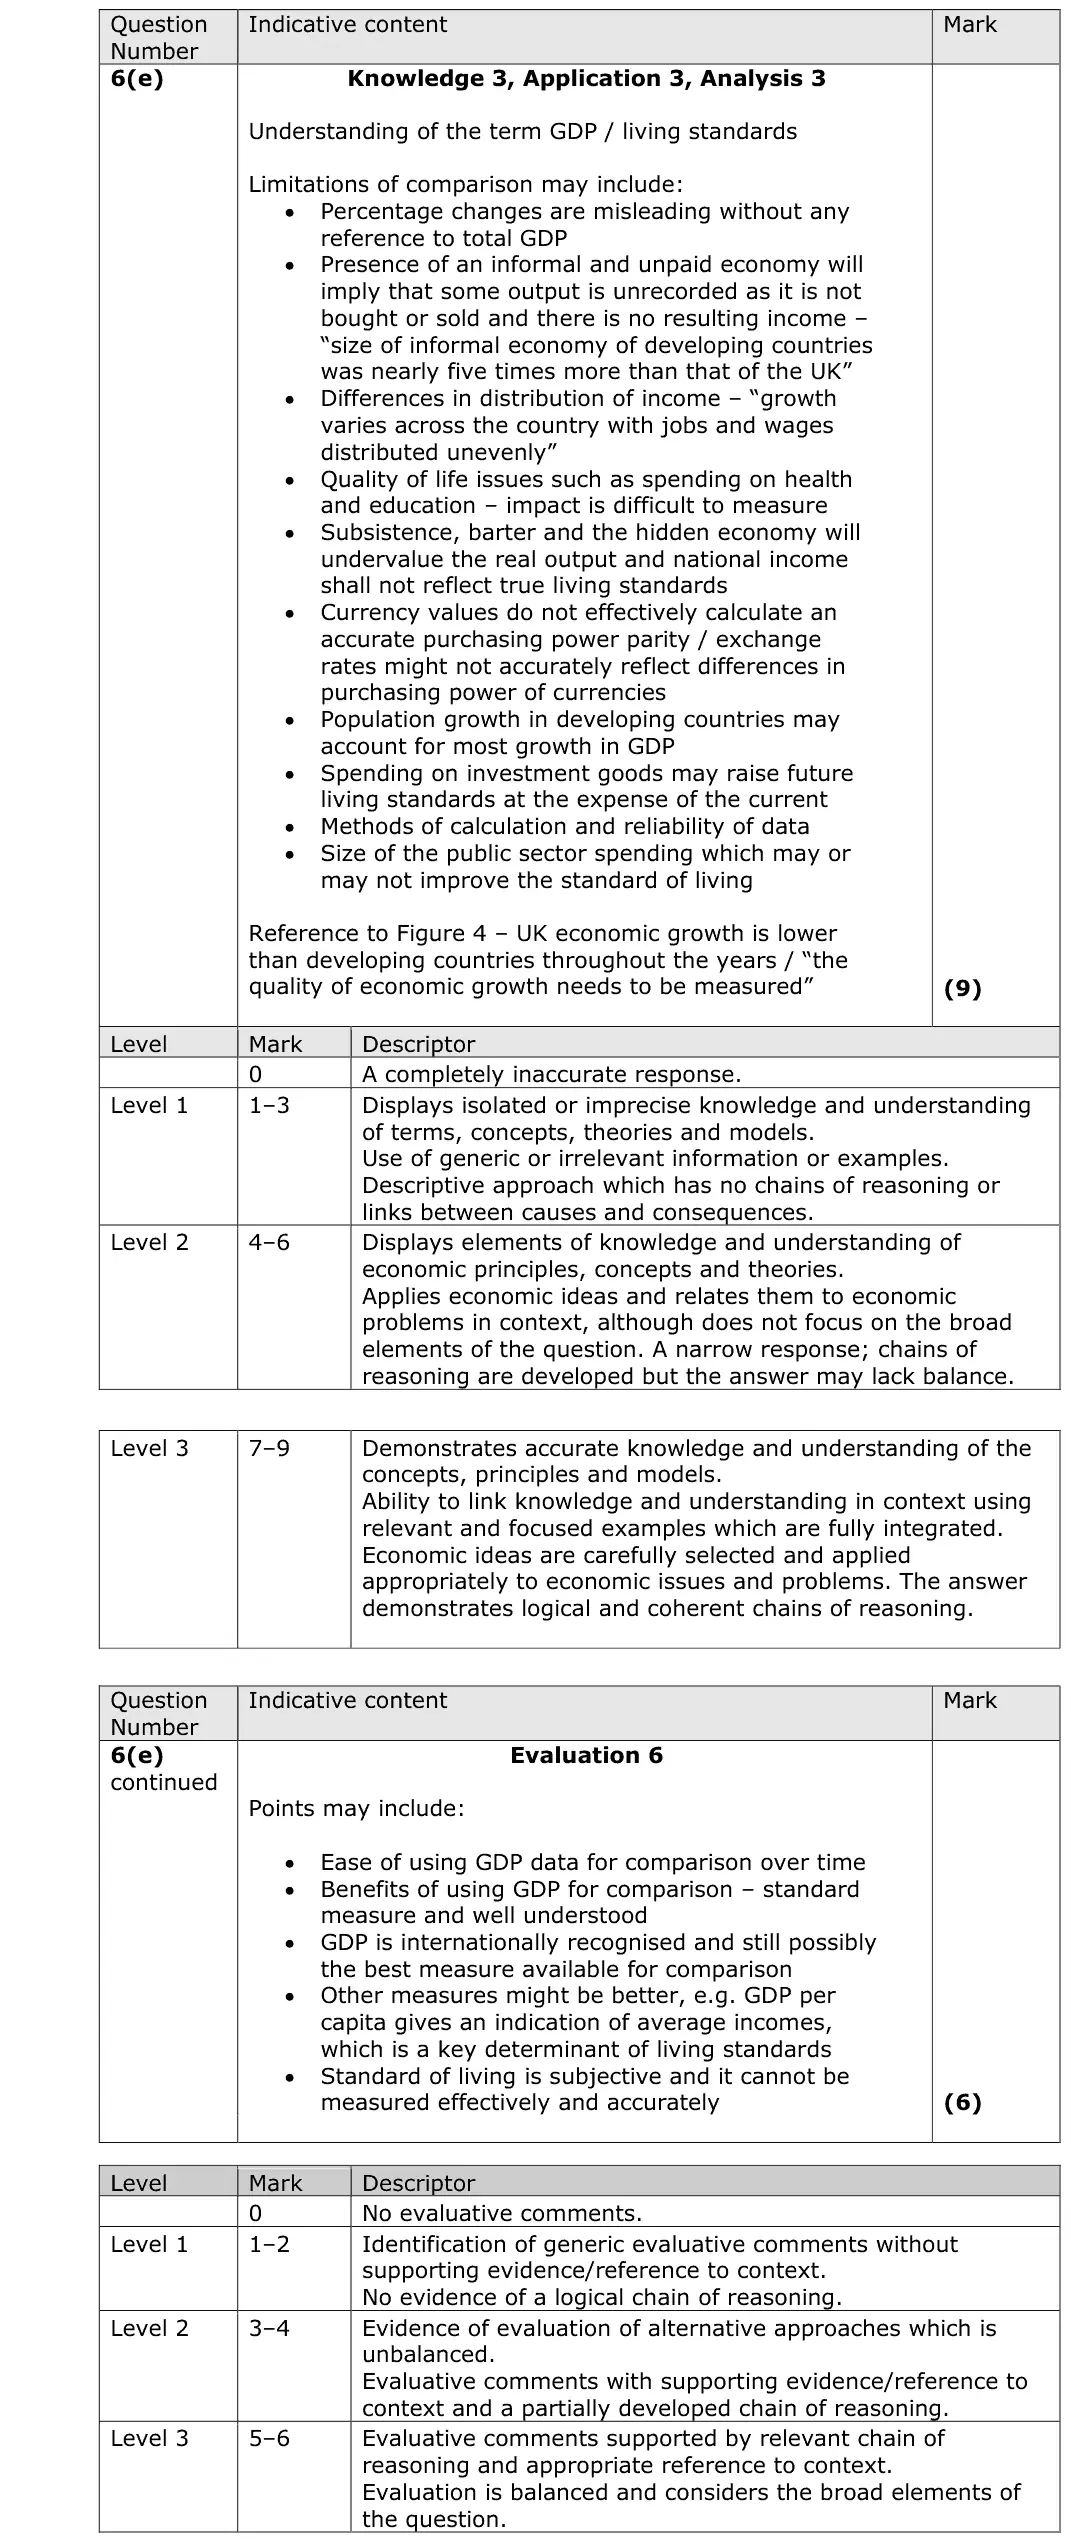
limitations: growth rates without the level of GDP, informal economy (five times larger in developing countries), income distribution, PPP and exchange rates, population, quality of life
report: limitations only listed, evaluation weak, many ignored the data
Quantitative skills: QS 2 (calculate, use and understand percentages, percentage changes and percentage point changes); QS 9 (interpret, apply and analyse information in written, graphical tabular and numerical forms)
June 2018 · AS Paper 2 · Q1(a)1 markAO1=1Definition
Data and extracts for question 1
Mark scheme
Examiner's comment
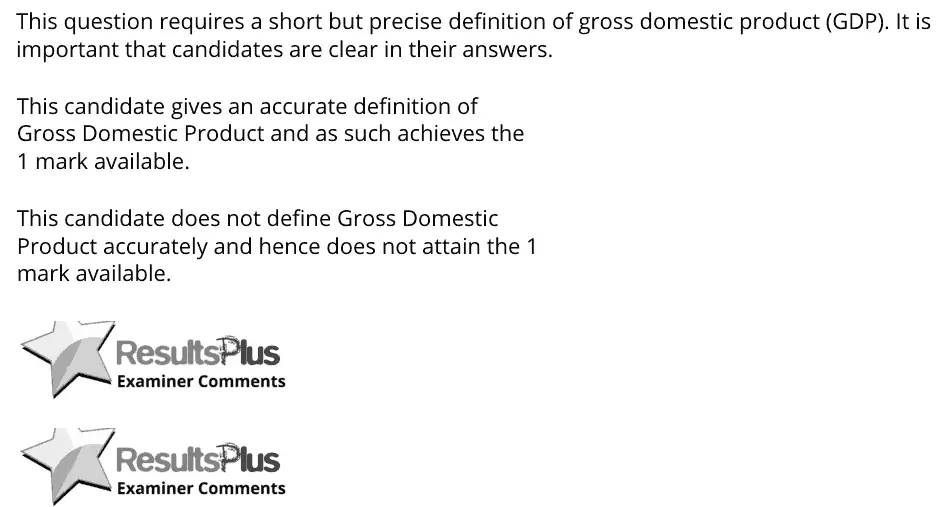
This question requires a short but precise definition of gross domestic product (GDP). It is important that candidates are clear in their answers. This candidate gives an accurate definition of Gross Domestic Product and as such achieves the 1 mark available. This candidate does not define Gross Domestic Product accurately and hence does not attain the 1 mark available.
Notes from the mark scheme and report
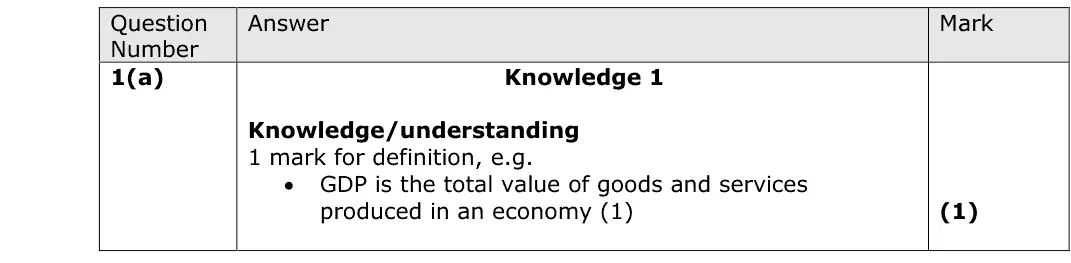
the total value of goods and services produced in an economy (in a year)
be precise
June 2018 · AS Paper 2 · Q1(b)2 marksAO2=2Calculation
Data and extracts for question 1
Mark scheme
Examiner's comment
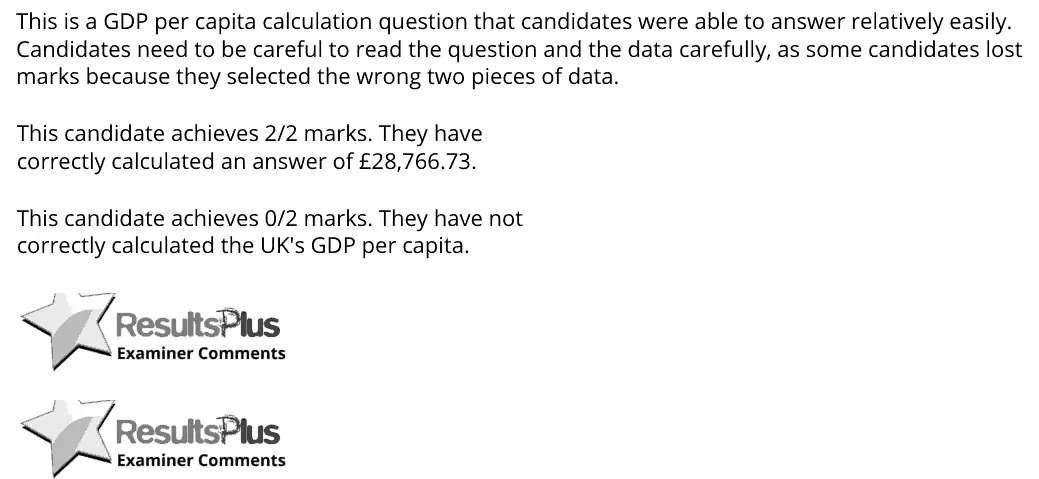
This is a GDP per capita calculation question that candidates were able to answer relatively easily. Candidates need to be careful to read the question and the data carefully, as some candidates lost marks because they selected the wrong two pieces of data. This candidate achieves 2/2 marks. They have correctly calculated an answer of £28,766.73. This candidate achieves 0/2 marks. They have not correctly calculated the UK's GDP per capita.
Notes from the mark scheme and report
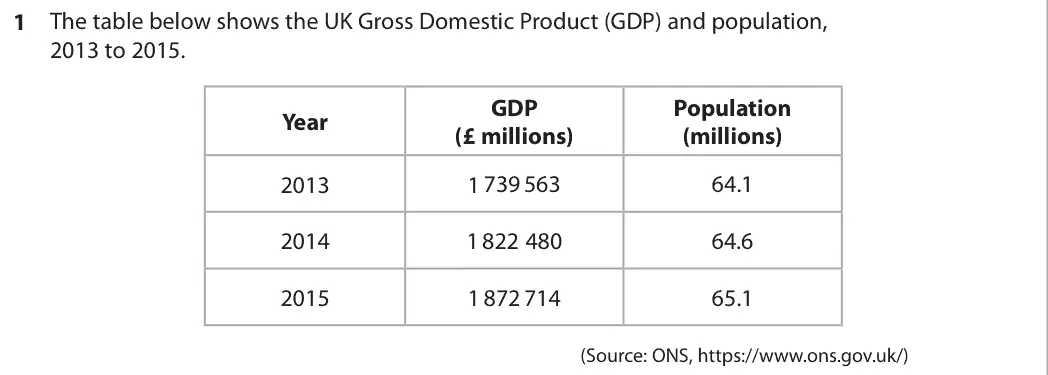
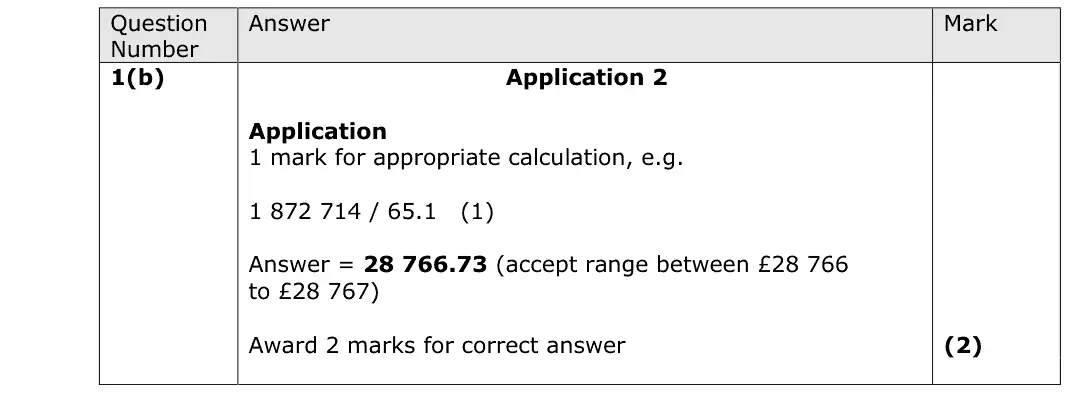
GDP / population = 1 872 714 / 65.1 = £28 766.73
some selected the wrong two figures
Quantitative skills: QS 1 (calculate, use and understand ratios and fractions); QS 9 (interpret, apply and analyse information in written, graphical tabular and numerical forms)
June 2018 · AS Paper 2 · Q1(c)1 markMultiple choice
Data and extracts for question 1
Answer
A
Mark scheme
Notes from the mark scheme and report
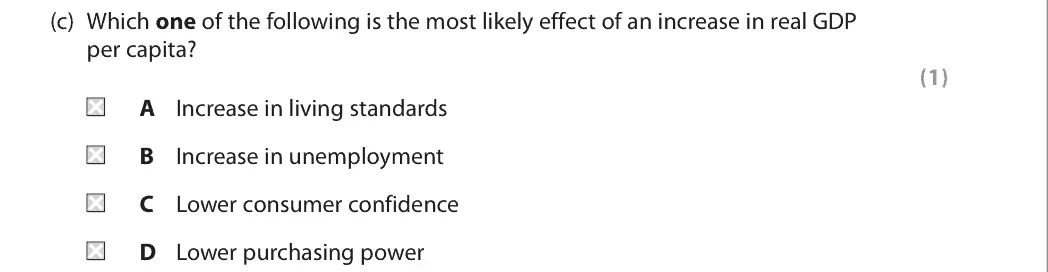
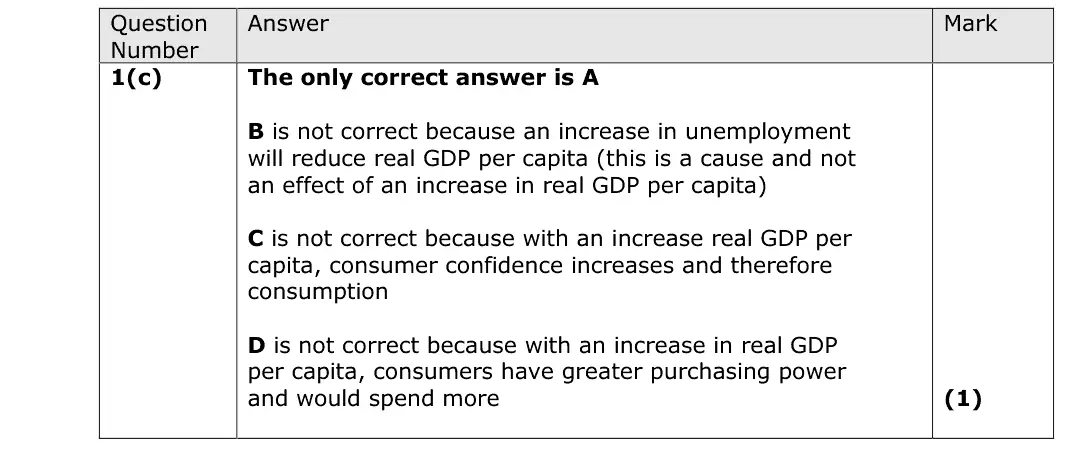
higher real GDP per capita usually means higher living standards (A)
rising unemployment is a cause of lower GDP, not an effect
confidence and purchasing power would rise
June 2017 · AS Paper 2 · Q3(a)1 markMultiple choice
Data and extracts for question 3
Answer
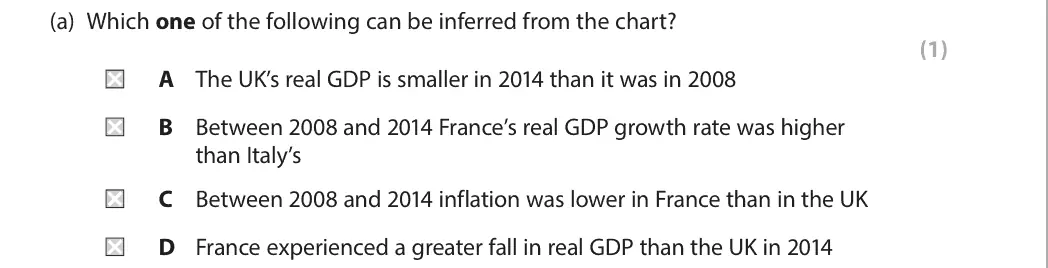
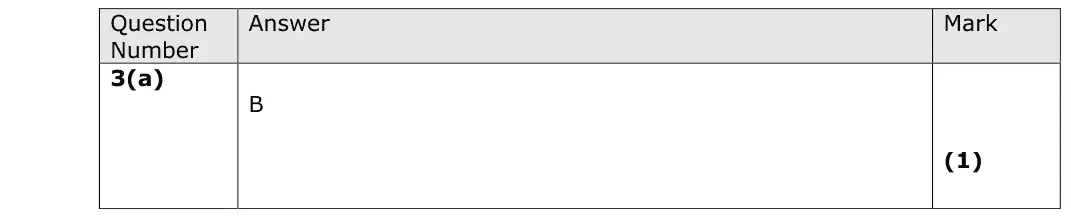
B
Mark scheme
Notes from the mark scheme and report
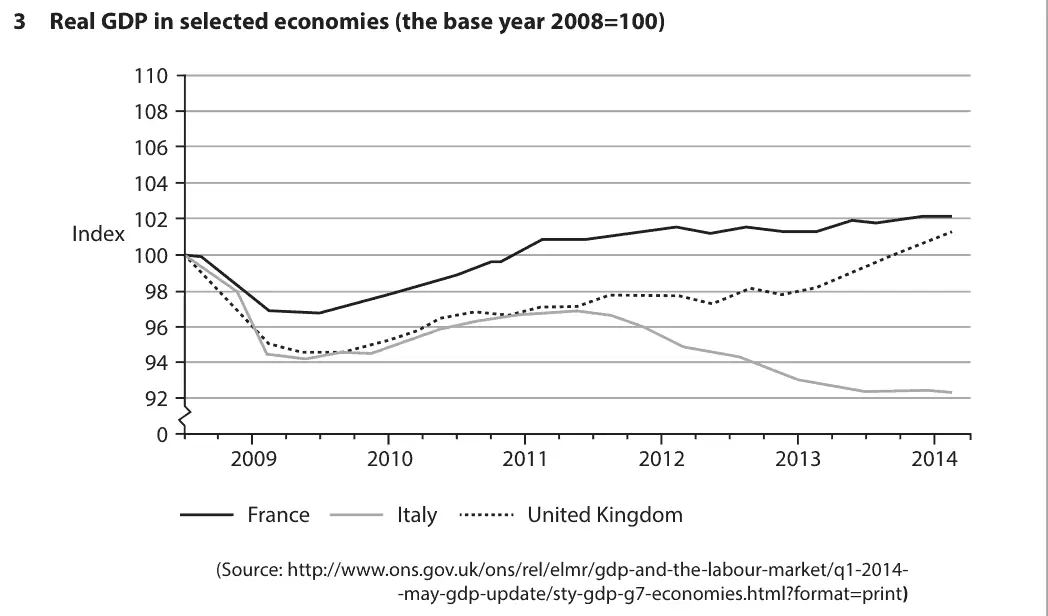
France's index rose to about 102 while Italy's fell to about 92, so France grew faster (B)
the UK index is above 100 in 2014 (A wrong)
real GDP says nothing about inflation (C)
France did not fall in 2014 (D)
Quantitative skills: QS 5 (calculate and interpret index numbers); QS 9 (interpret, apply and analyse information in written, graphical tabular and numerical forms)
June 2017 · AS Paper 2 · Q3(b)2 marksAO1=2Definition
Data and extracts for question 3
Mark scheme
Examiner's comment
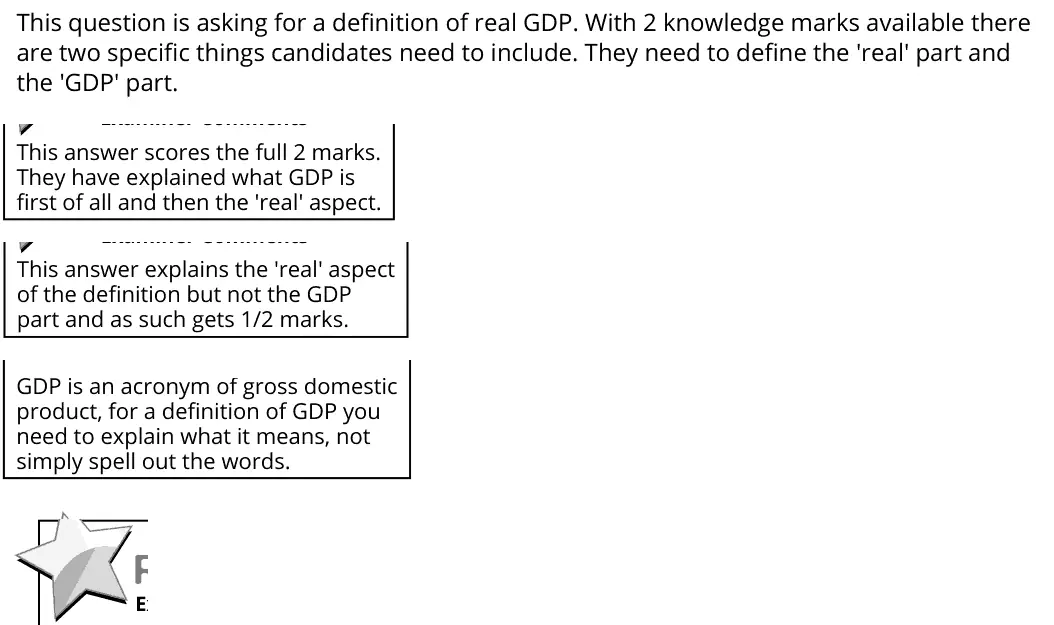
This question is asking for a definition of real GDP. With 2 knowledge marks available there are two specific things candidates need to include. They need to define the 'real' part and the 'GDP' part. This answer scores the full 2 marks. They have explained what GDP is first of all and then the 'real' aspect. This answer explains the 'real' aspect of the definition but not the GDP part and as such gets 1/2 marks. GDP is an acronym of gross domestic product, for a definition of GDP you need to explain what it means, not simply spell out the words.
Notes from the mark scheme and report
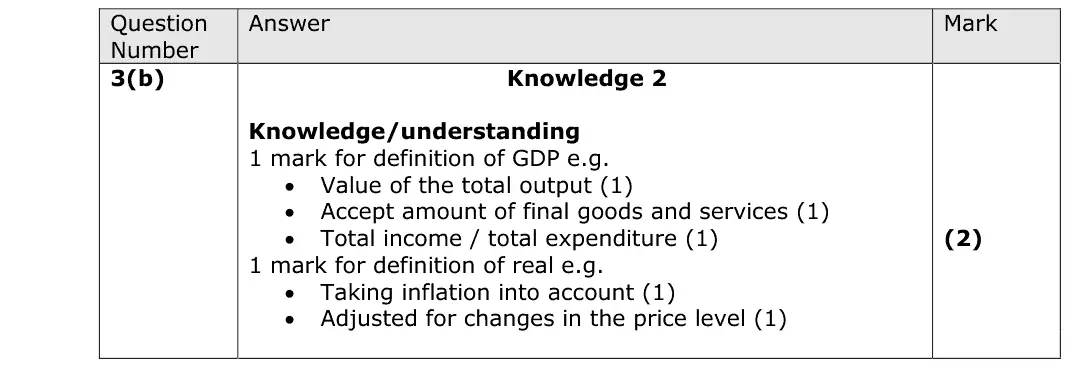
1 mark for GDP (total value of output/income/expenditure in an economy) and 1 for real (adjusted for inflation)
spelling out 'gross domestic product' is not a definition
June 2017 · Paper 2 · Q5(a)1 markMultiple choice
Data and extracts for question 5
Answer
A
Mark scheme
Notes from the mark scheme and report
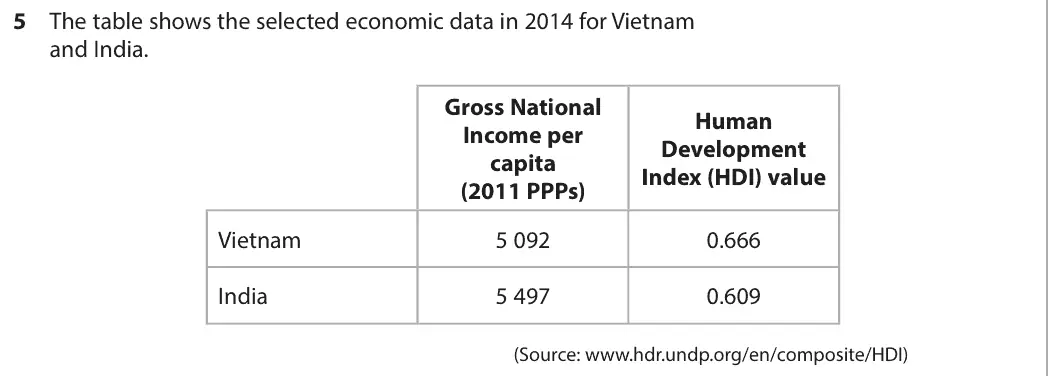
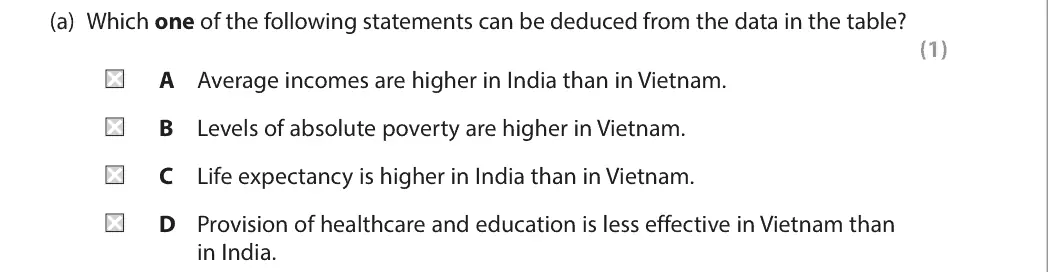
GNI per capita (PPP) is higher in India (5 497) than Vietnam (5 092) so A
poverty and life expectancy cannot be read from the table
D is the reverse, as Vietnam has the higher HDI on a lower income
Quantitative skills: QS 9 (interpret, apply and analyse information in written, graphical tabular and numerical forms)
June 2017 · AS Paper 2 · Q6(d)6 marksAO1=2, AO2=2, AO3=2Short answer
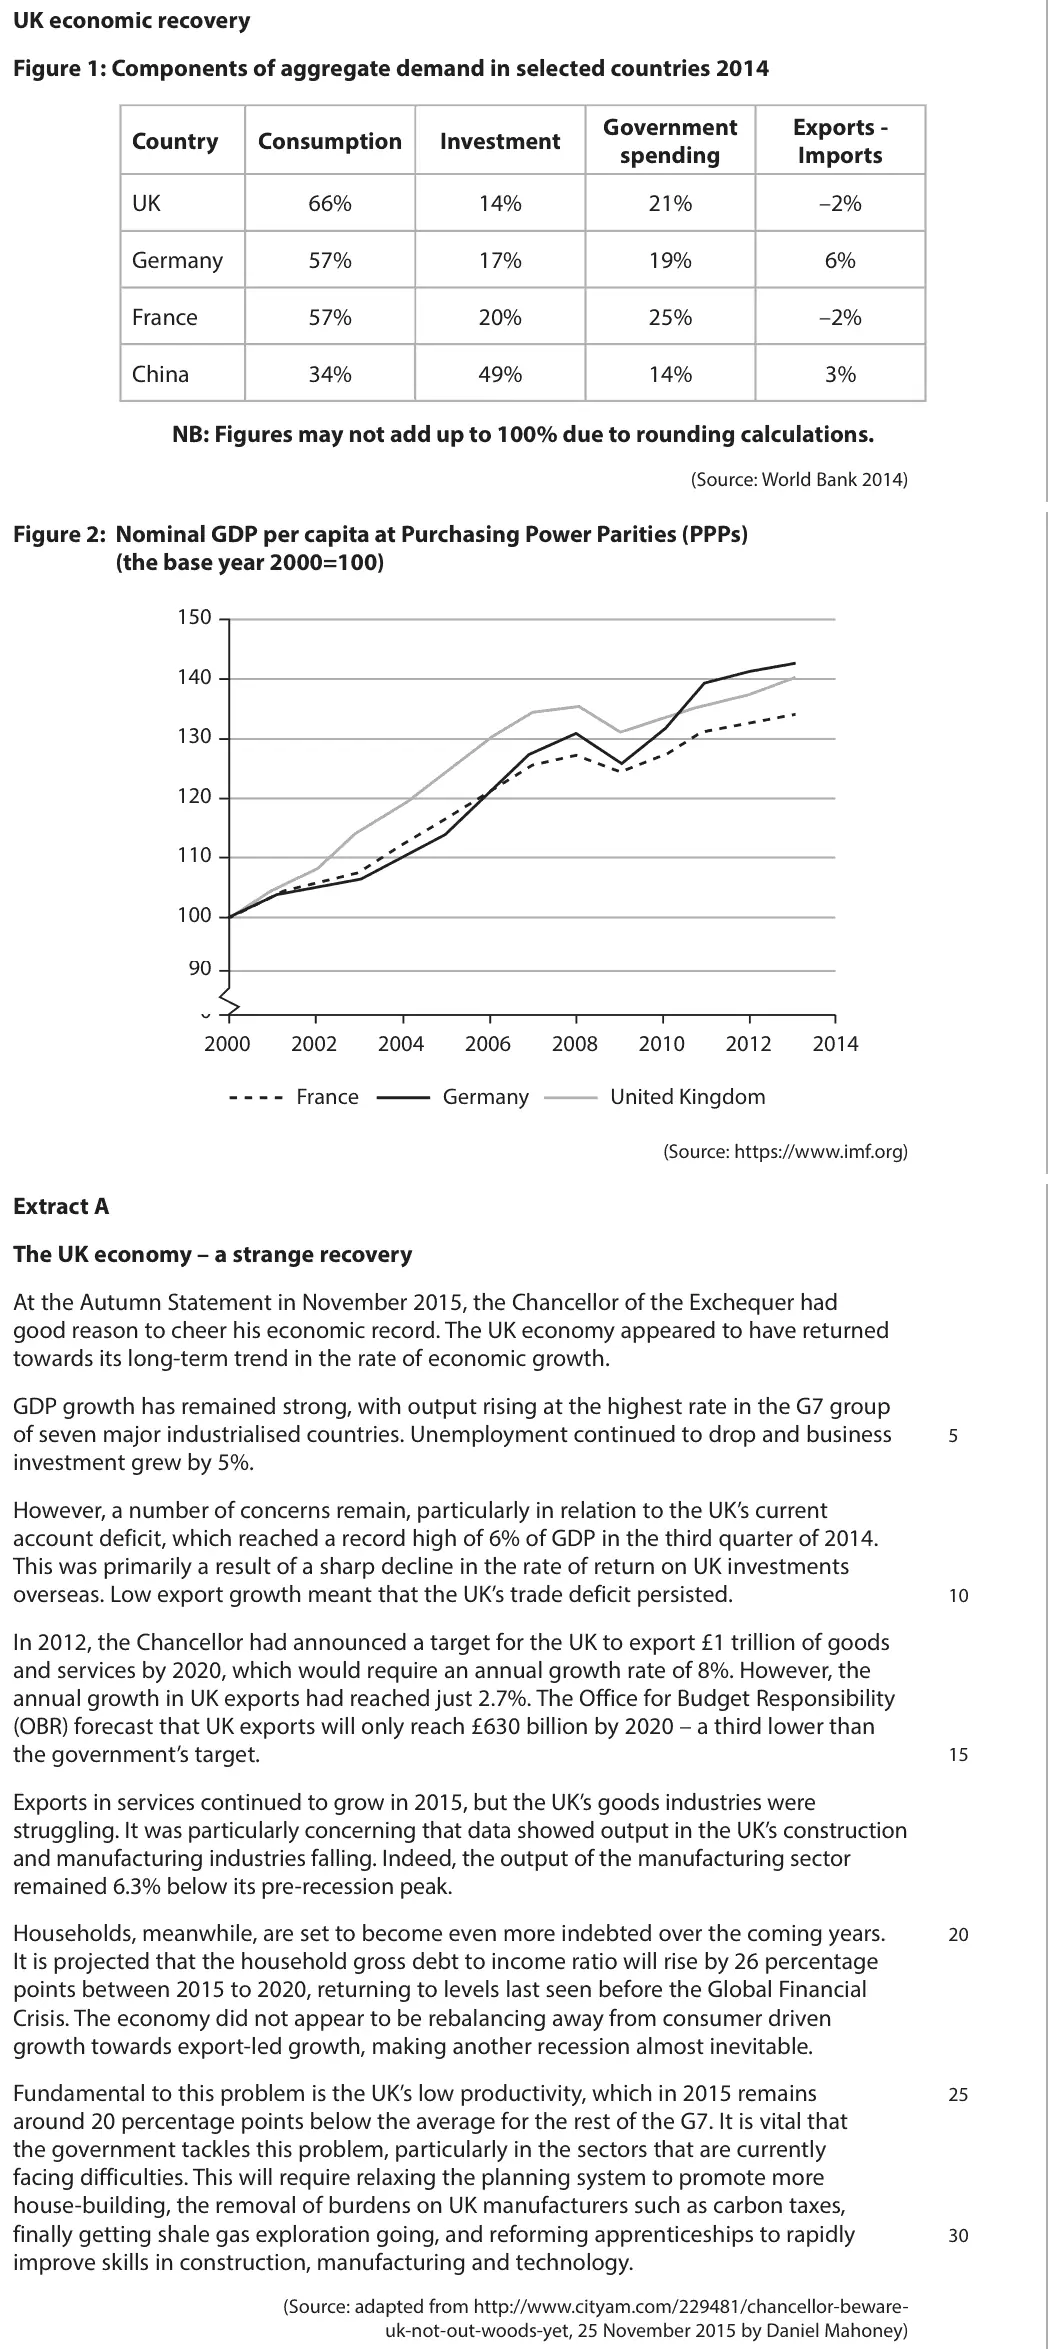
Data and extracts for question 6
Mark scheme
Examiner's comment
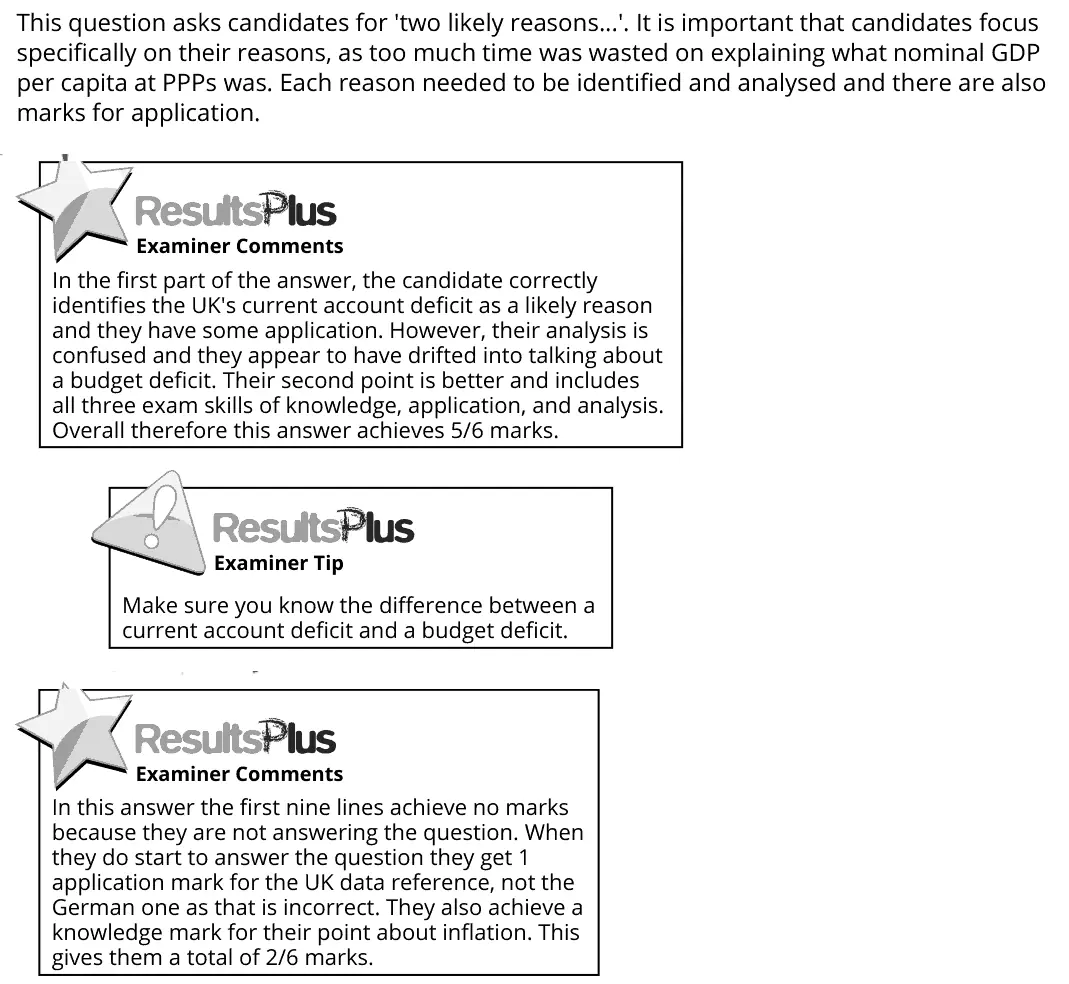
This question asks candidates for 'two likely reasons...'. It is important that candidates focus specifically on their reasons, as too much time was wasted on explaining what nominal GDP per capita at PPPs was. Each reason needed to be identified and analysed and there are also marks for application. In the first part of the answer, the candidate correctly identifies the UK's current account deficit as a likely reason and they have some application. However, their analysis is confused and they appear to have drifted into talking about a budget deficit. Their second point is better and includes all three exam skills of knowledge, application, and analysis. Overall therefore this answer achieves 5/6 marks. Make sure you know the difference between a current account deficit and a budget deficit. In this answer the first nine lines achieve no marks because they are not answering the question. When they do start to answer the question they get 1 application mark for the UK data reference, not the German one as that is incorrect. They also achieve a knowledge mark for their point about inflation. This gives them a total of 2/6 marks.
Notes from the mark scheme and report
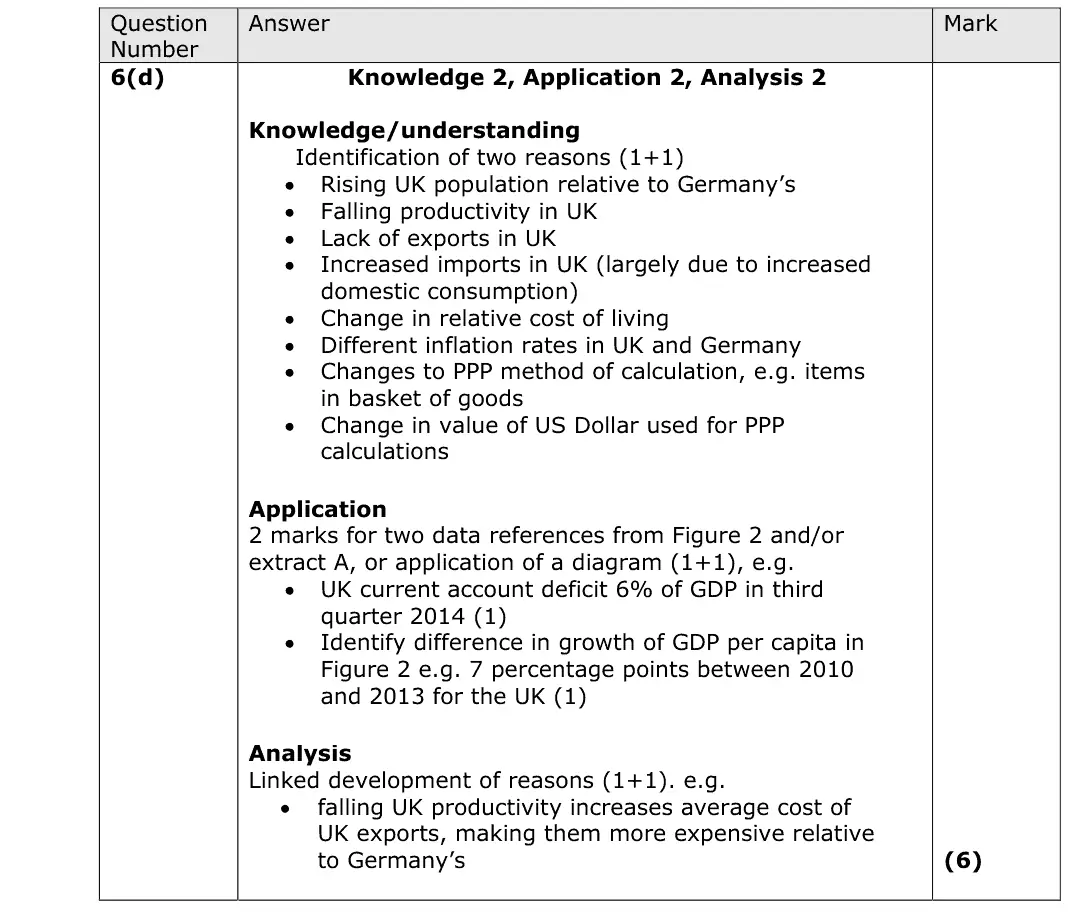
two reasons (faster UK population growth, falling productivity, weak exports, different inflation or PPP changes) each developed with data from Figure 2 or Extract A
do not spend time defining GDP per capita at PPPs
current account deficit is not the budget deficit
Quantitative skills: QS 5 (calculate and interpret index numbers); QS 9 (interpret, apply and analyse information in written, graphical tabular and numerical forms)
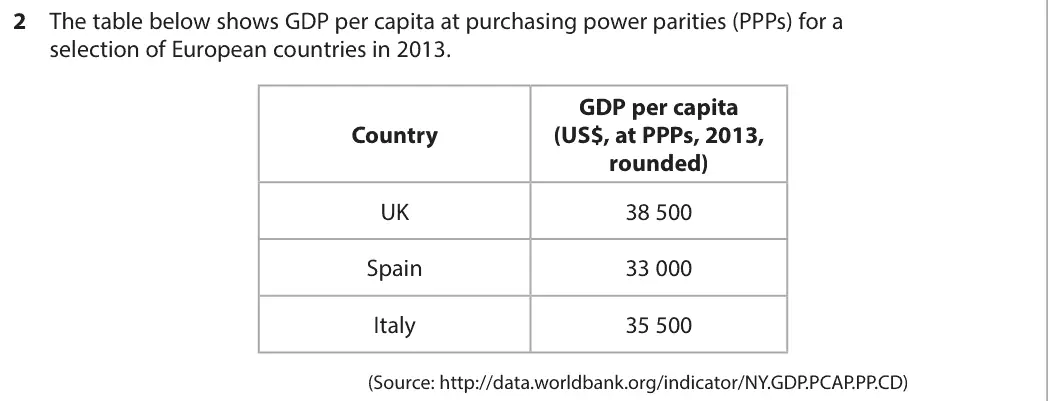
June 2016 · AS Paper 2 · Q2(a)2 marksAO1=2DefinitionHard
Data and extracts for question 2
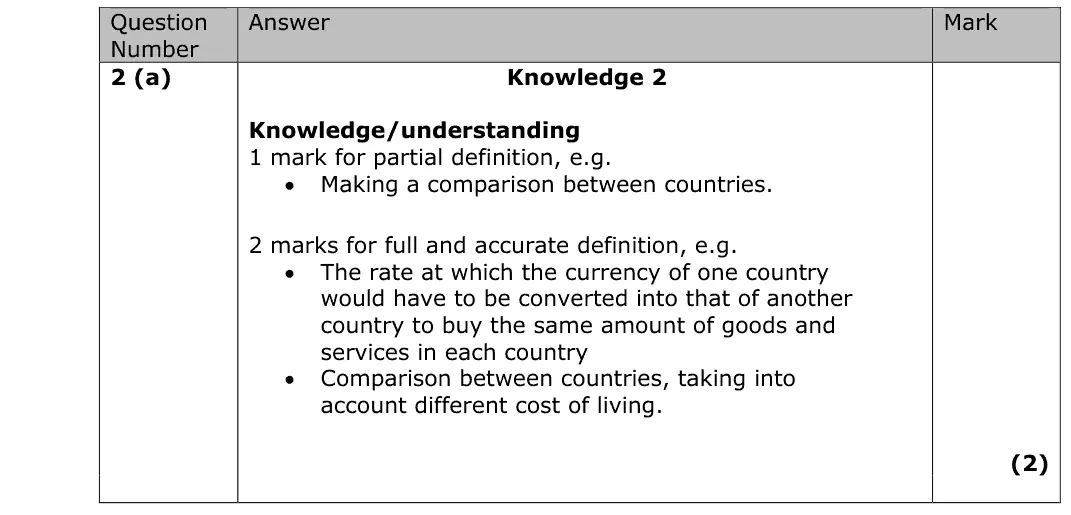
Mark scheme
Examiner's comment
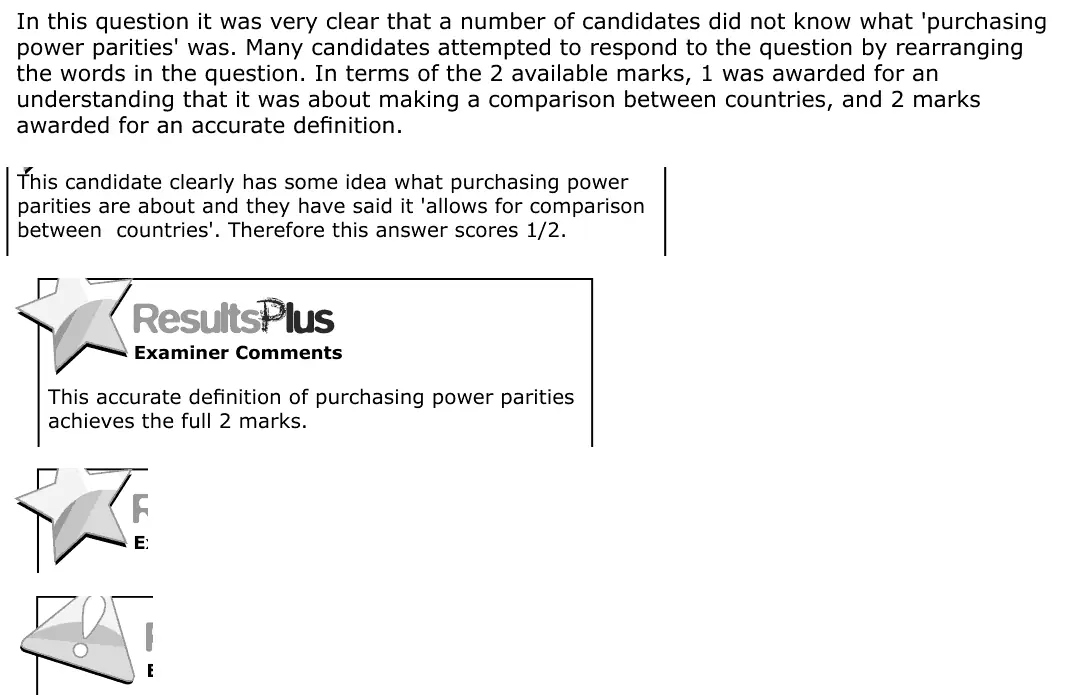
In this question it was very clear that a number of candidates did not know what 'purchasing power parities' was. Many candidates attempted to respond to the question by rearranging the words in the question. In terms of the 2 available marks, 1 was awarded for an understanding that it was about making a comparison between countries, and 2 marks awarded for an accurate definition. This candidate clearly has some idea what purchasing power parities are about and they have said it 'allows for comparison between countries'. Therefore this answer scores 1/2. This accurate definition of purchasing power parities achieves the full 2 marks.
Notes from the mark scheme and report
the exchange rate at which the same basket of goods costs the same in each country, used to compare living standards
"a comparison between countries" scores only 1
report: "it was very clear that a number of candidates did not know what 'purchasing power parities' was", many just rearranged the words of the question
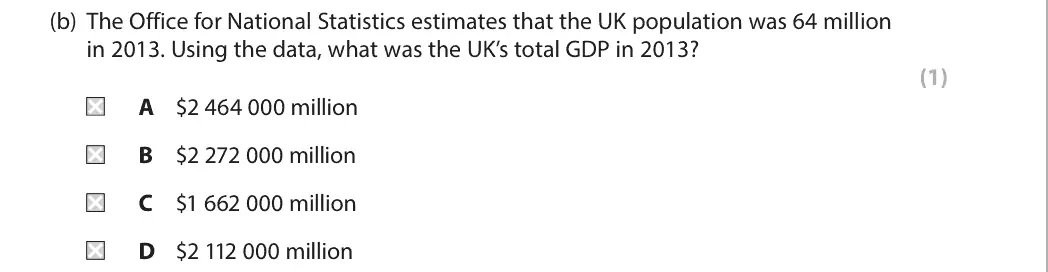
June 2016 · AS Paper 2 · Q2(b)1 markMultiple choice
Data and extracts for question 2
Answer
A
Mark scheme
Notes from the mark scheme and report
total GDP = GDP per capita x population = US$38 500 x 64 million = about US$2.46 trillion (A)
options not shown in the crop and the mark scheme gives only the letter
Quantitative skills: QS 9 (interpret, apply and analyse information in written, graphical tabular and numerical forms)
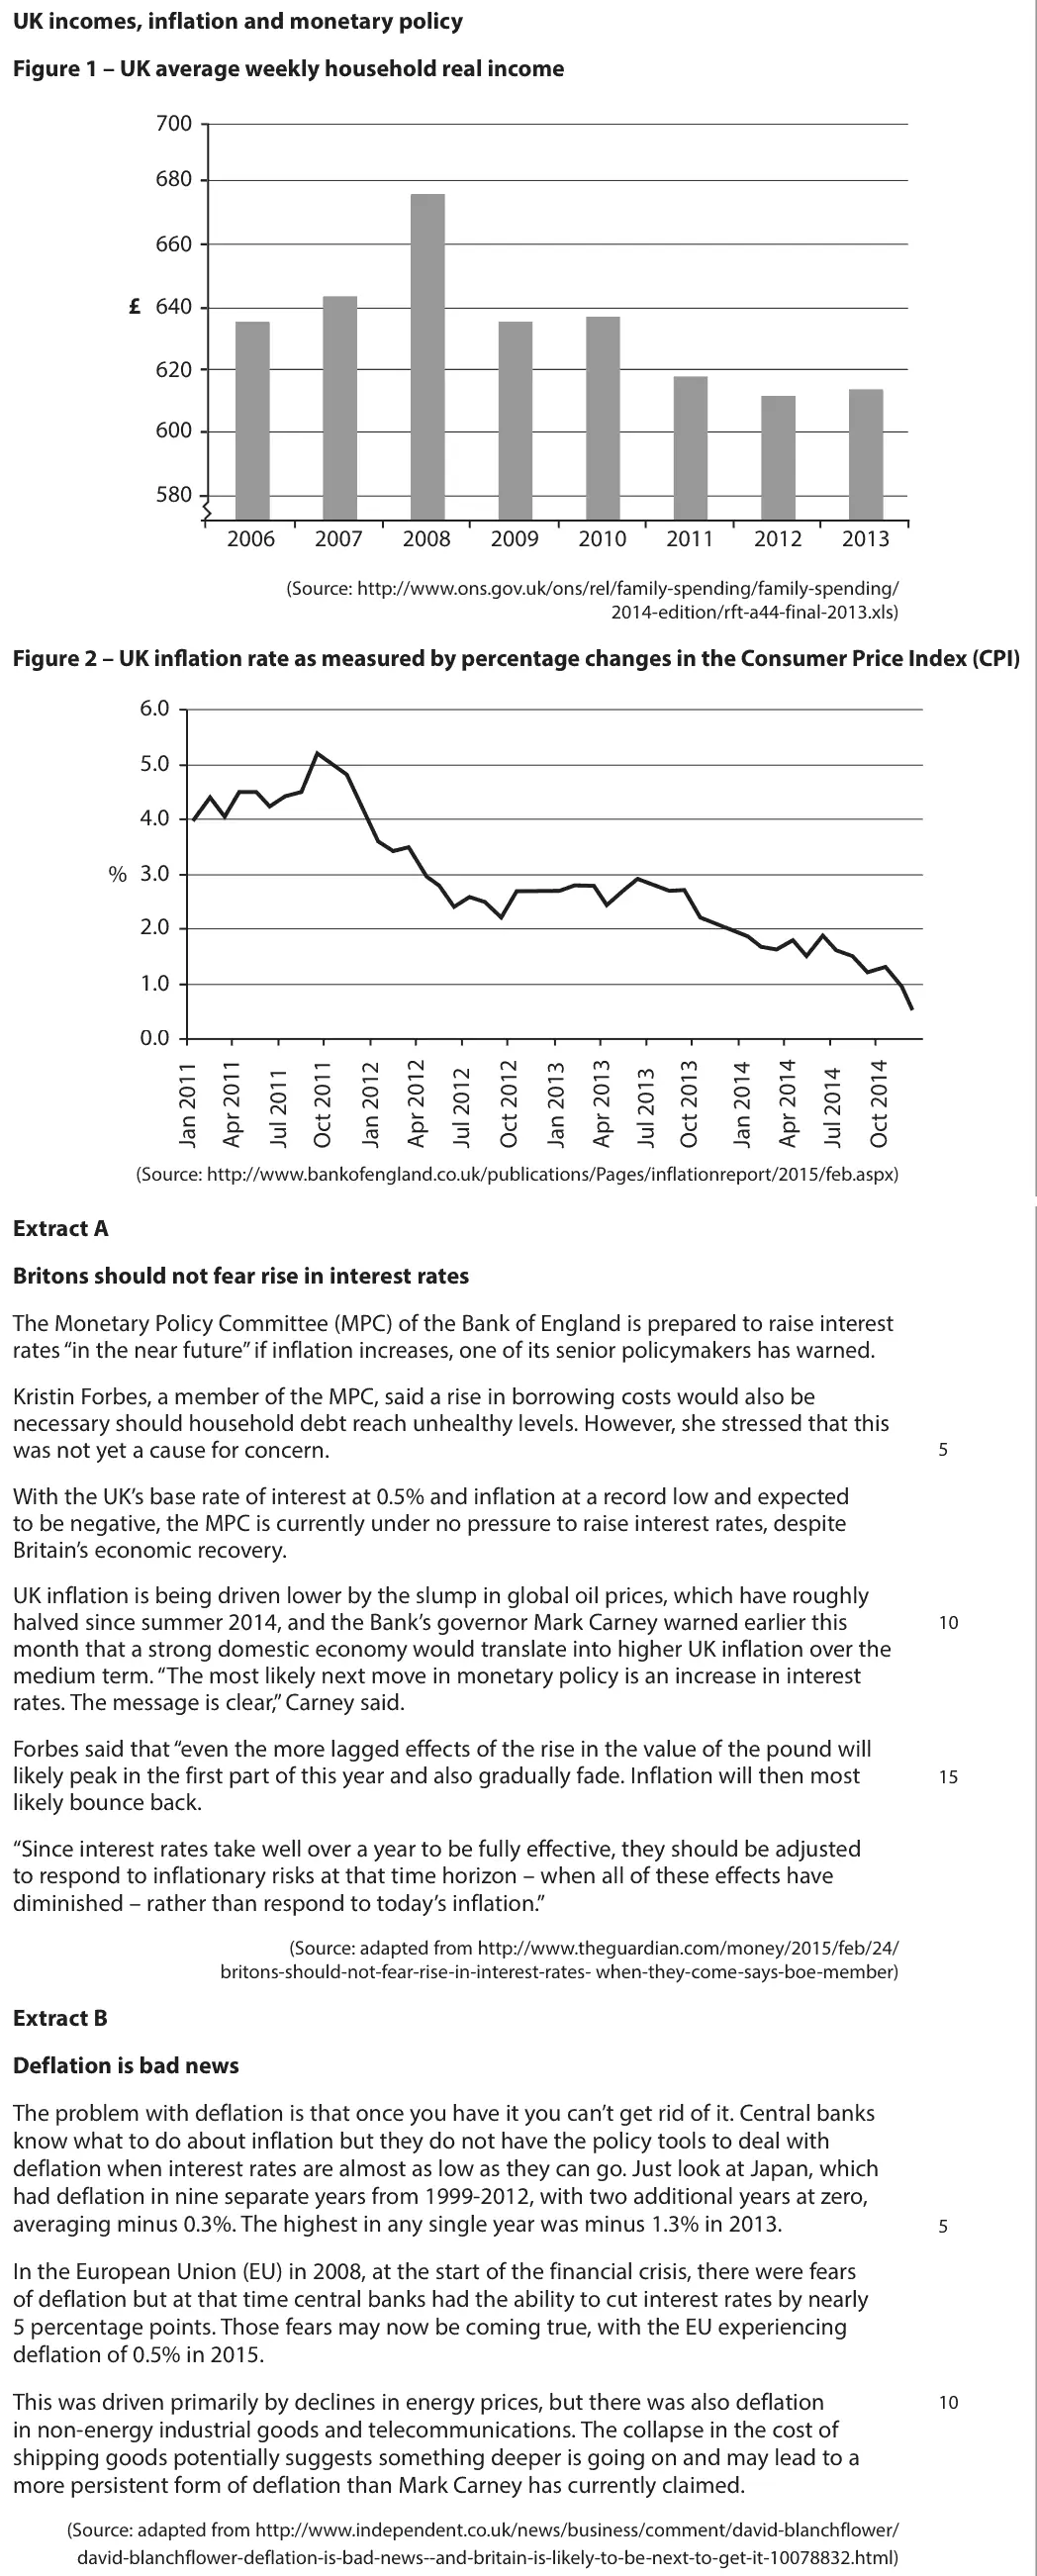
June 2016 · AS Paper 2 · Q6(a)4 marksAO1=2, AO2=2Short answer
Data and extracts for question 6
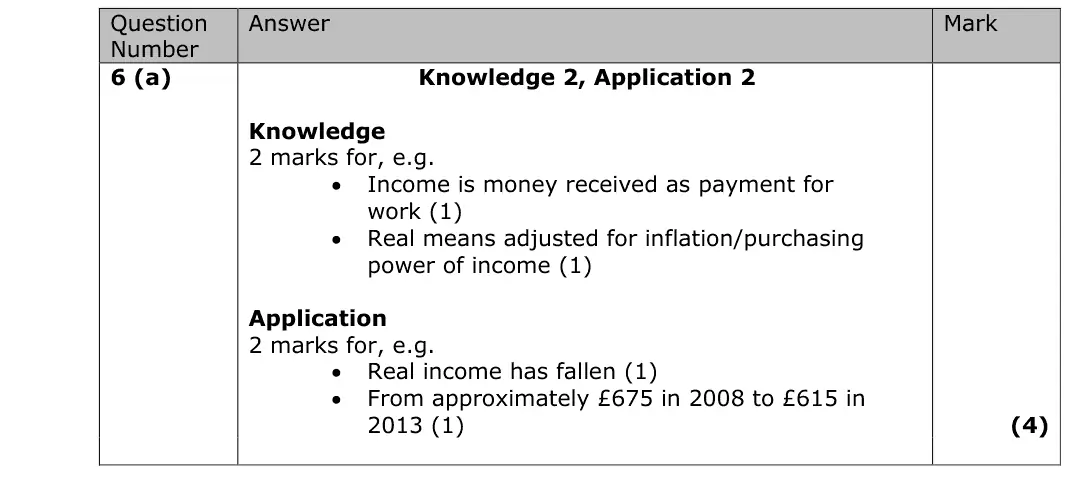
Mark scheme
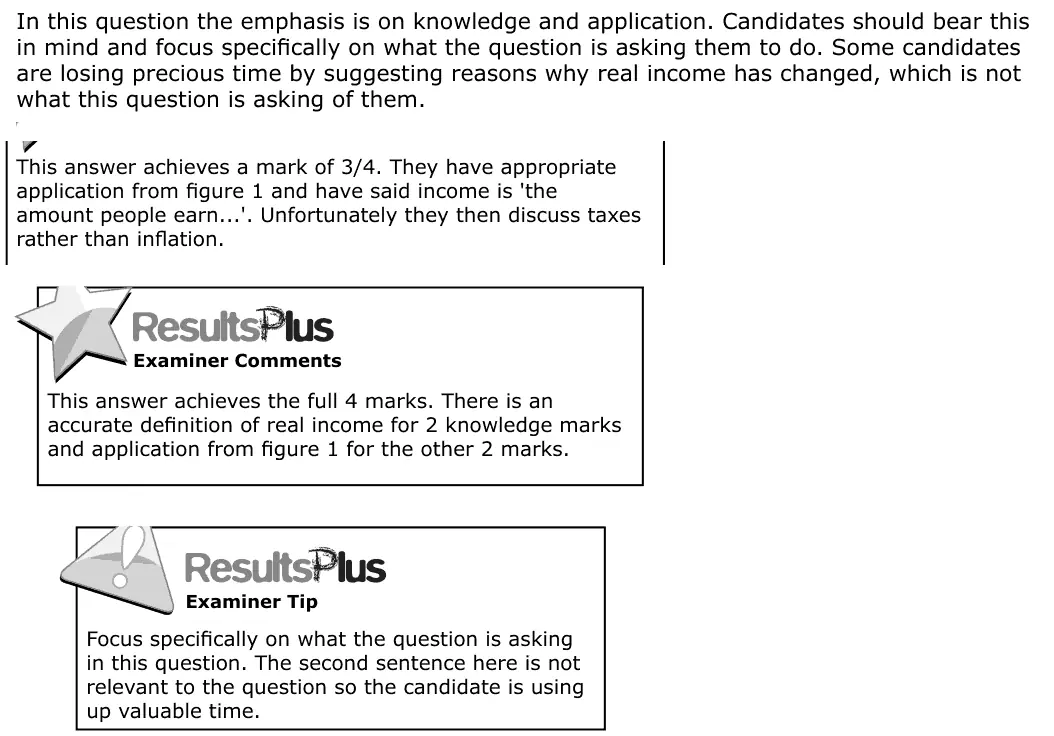
Examiner's comment
In this question the emphasis is on knowledge and application. Candidates should bear this in mind and focus specifically on what the question is asking them to do. Some candidates are losing precious time by suggesting reasons why real income has changed, which is not what this question is asking of them. This answer achieves a mark of 3/4. They have appropriate application from figure 1 and have said income is 'the amount people earn...'. Unfortunately they then discuss taxes rather than inflation. This answer achieves the full 4 marks. There is an accurate definition of real income for 2 knowledge marks and application from figure 1 for the other 2 marks. Focus specifically on what the question is asking in this question. The second sentence here is not relevant to the question so the candidate is using up valuable time.
Notes from the mark scheme and report
income adjusted for inflation (purchasing power)
quote Figure 1, e.g. about £675 in 2008 falling to about £615 in 2013
report: do not explain why real income changed
Quantitative skills: QS 7 (make calculations to convert from money to real terms); QS 9 (interpret, apply and analyse information in written, graphical tabular and numerical forms)
Work with an Edexcel economics tutor
Essays stuck in Level 2, or losing the easy marks in Section A? Book a trial session with Lianne, a former Edexcel examiner.