Notes and key-term cards for this topic are being written by our tutors. The past-paper questions below are ready now.
Specification statements
4.1.8Exchange rates: a) Exchange rate systems: • floating • fixed • managed b) Distinction between revaluation and appreciation of a currency c) Distinction between devaluation and depreciation of a currency d) Factors influencing floating exchange rates e) Government intervention in currency markets through foreign currency transactions and the use of interest rates f) Competitive devaluation/depreciation and its consequences g) Impact of changes in exchange rates: • the current account of the balance of payments (reference to Marshall-Lerner condition and J curve effect) • economic growth and employment/unemployment • rate of inflation • foreign direct investment (FDI) flows
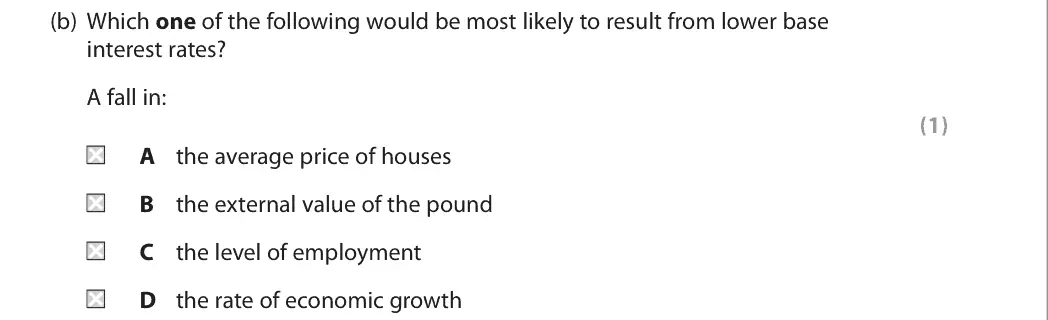
Evaluate the microeconomic and macroeconomic effects of a depreciation of the pound. Refer to restaurants or other food delivery services in your answer.
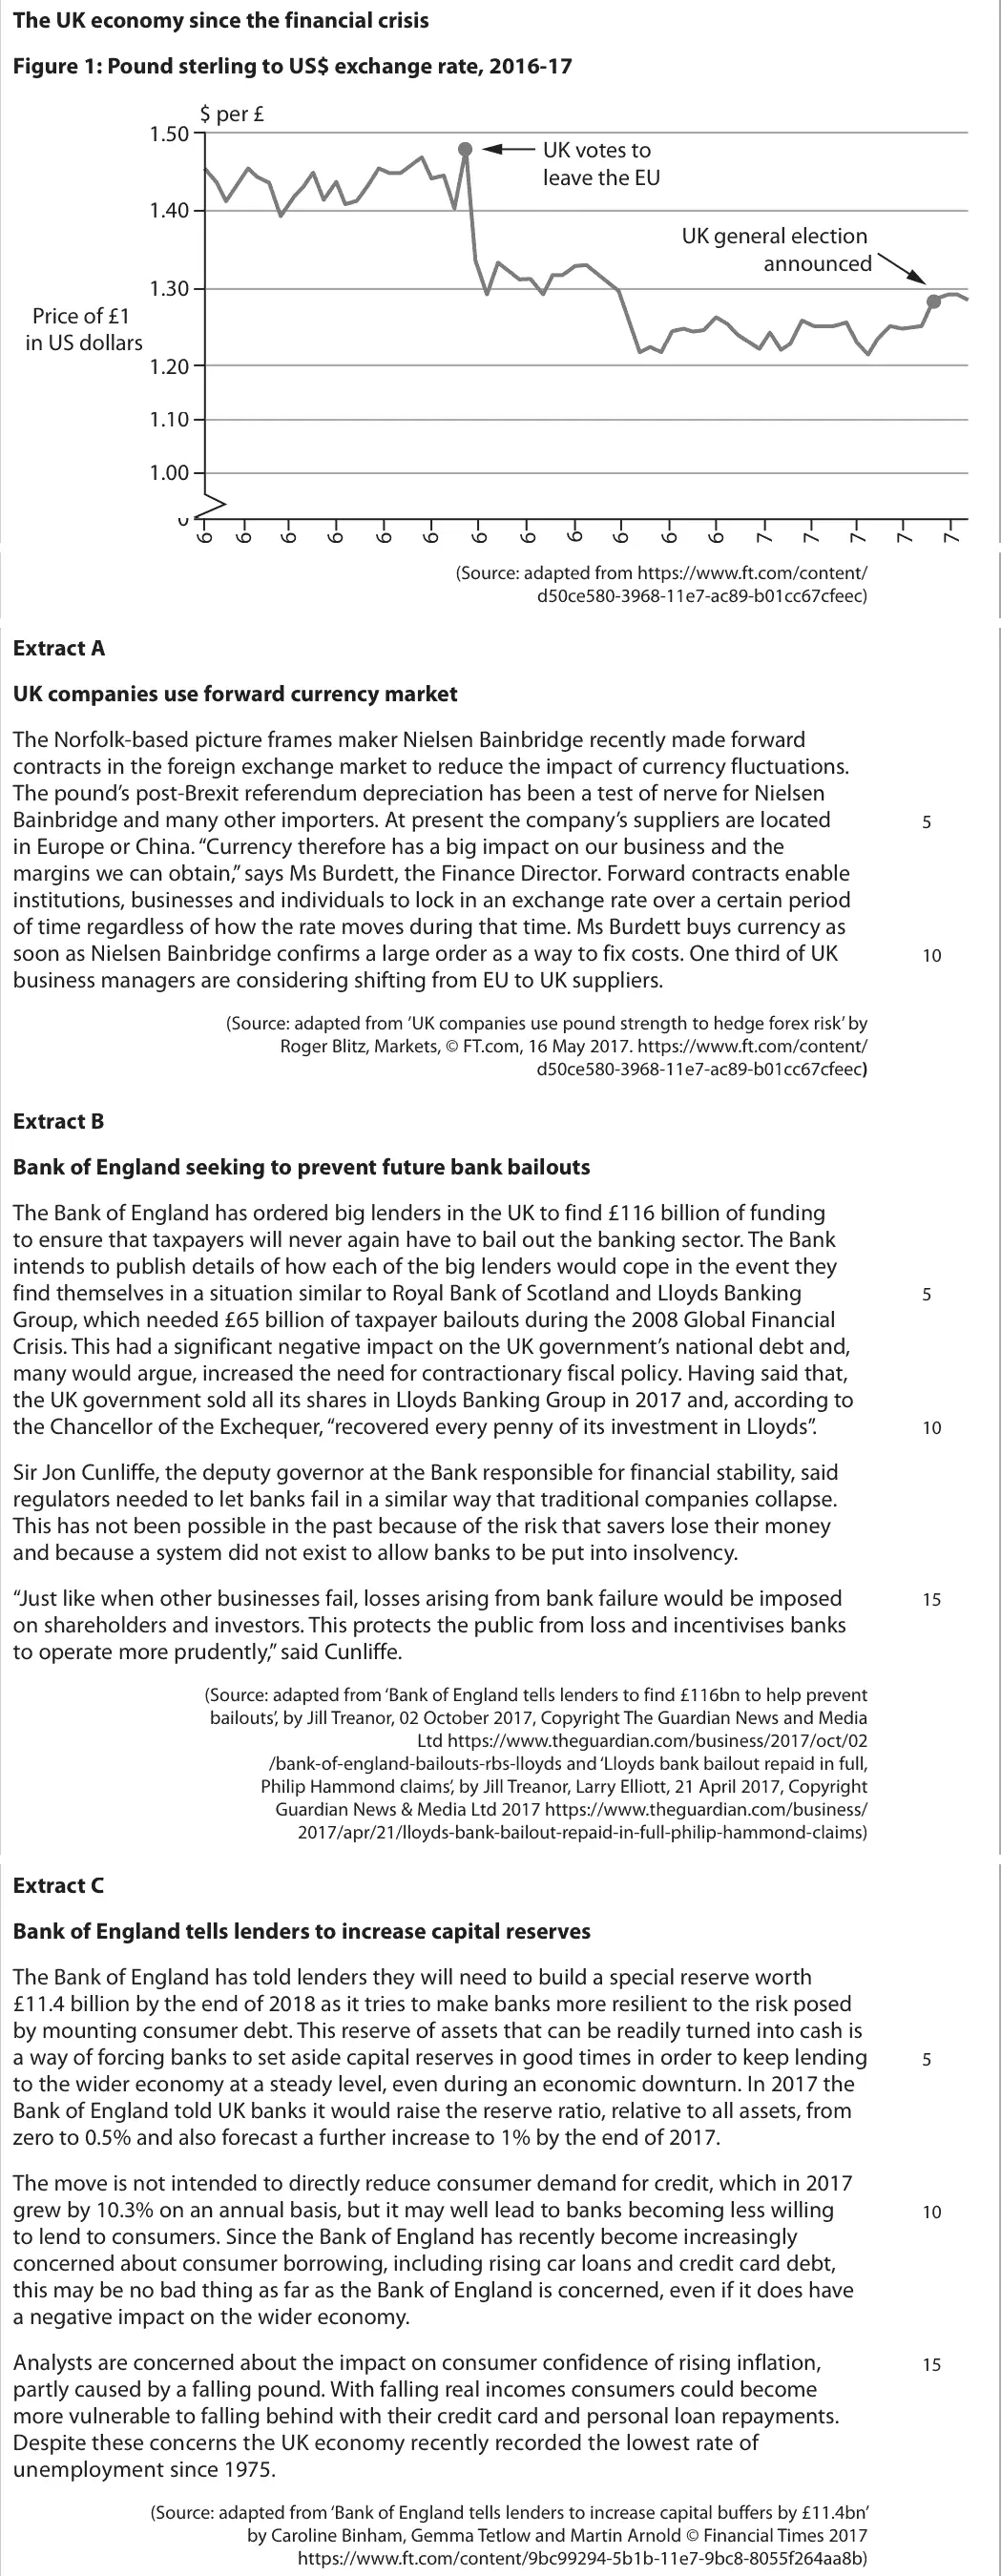
The British pound fell by over 10% to a 30-year low against the US dollar after the UK voted to leave the European Union. To what extent will this depreciation impact on future economic growth in the UK?
Tap a question to zoom it. The data and extracts fold out above each question; the mark scheme and examiner's comment open underneath.
June 2024 · Paper 3 · Q2(a)5 marksAO1=2, AO2=2, AO3=1Short answer
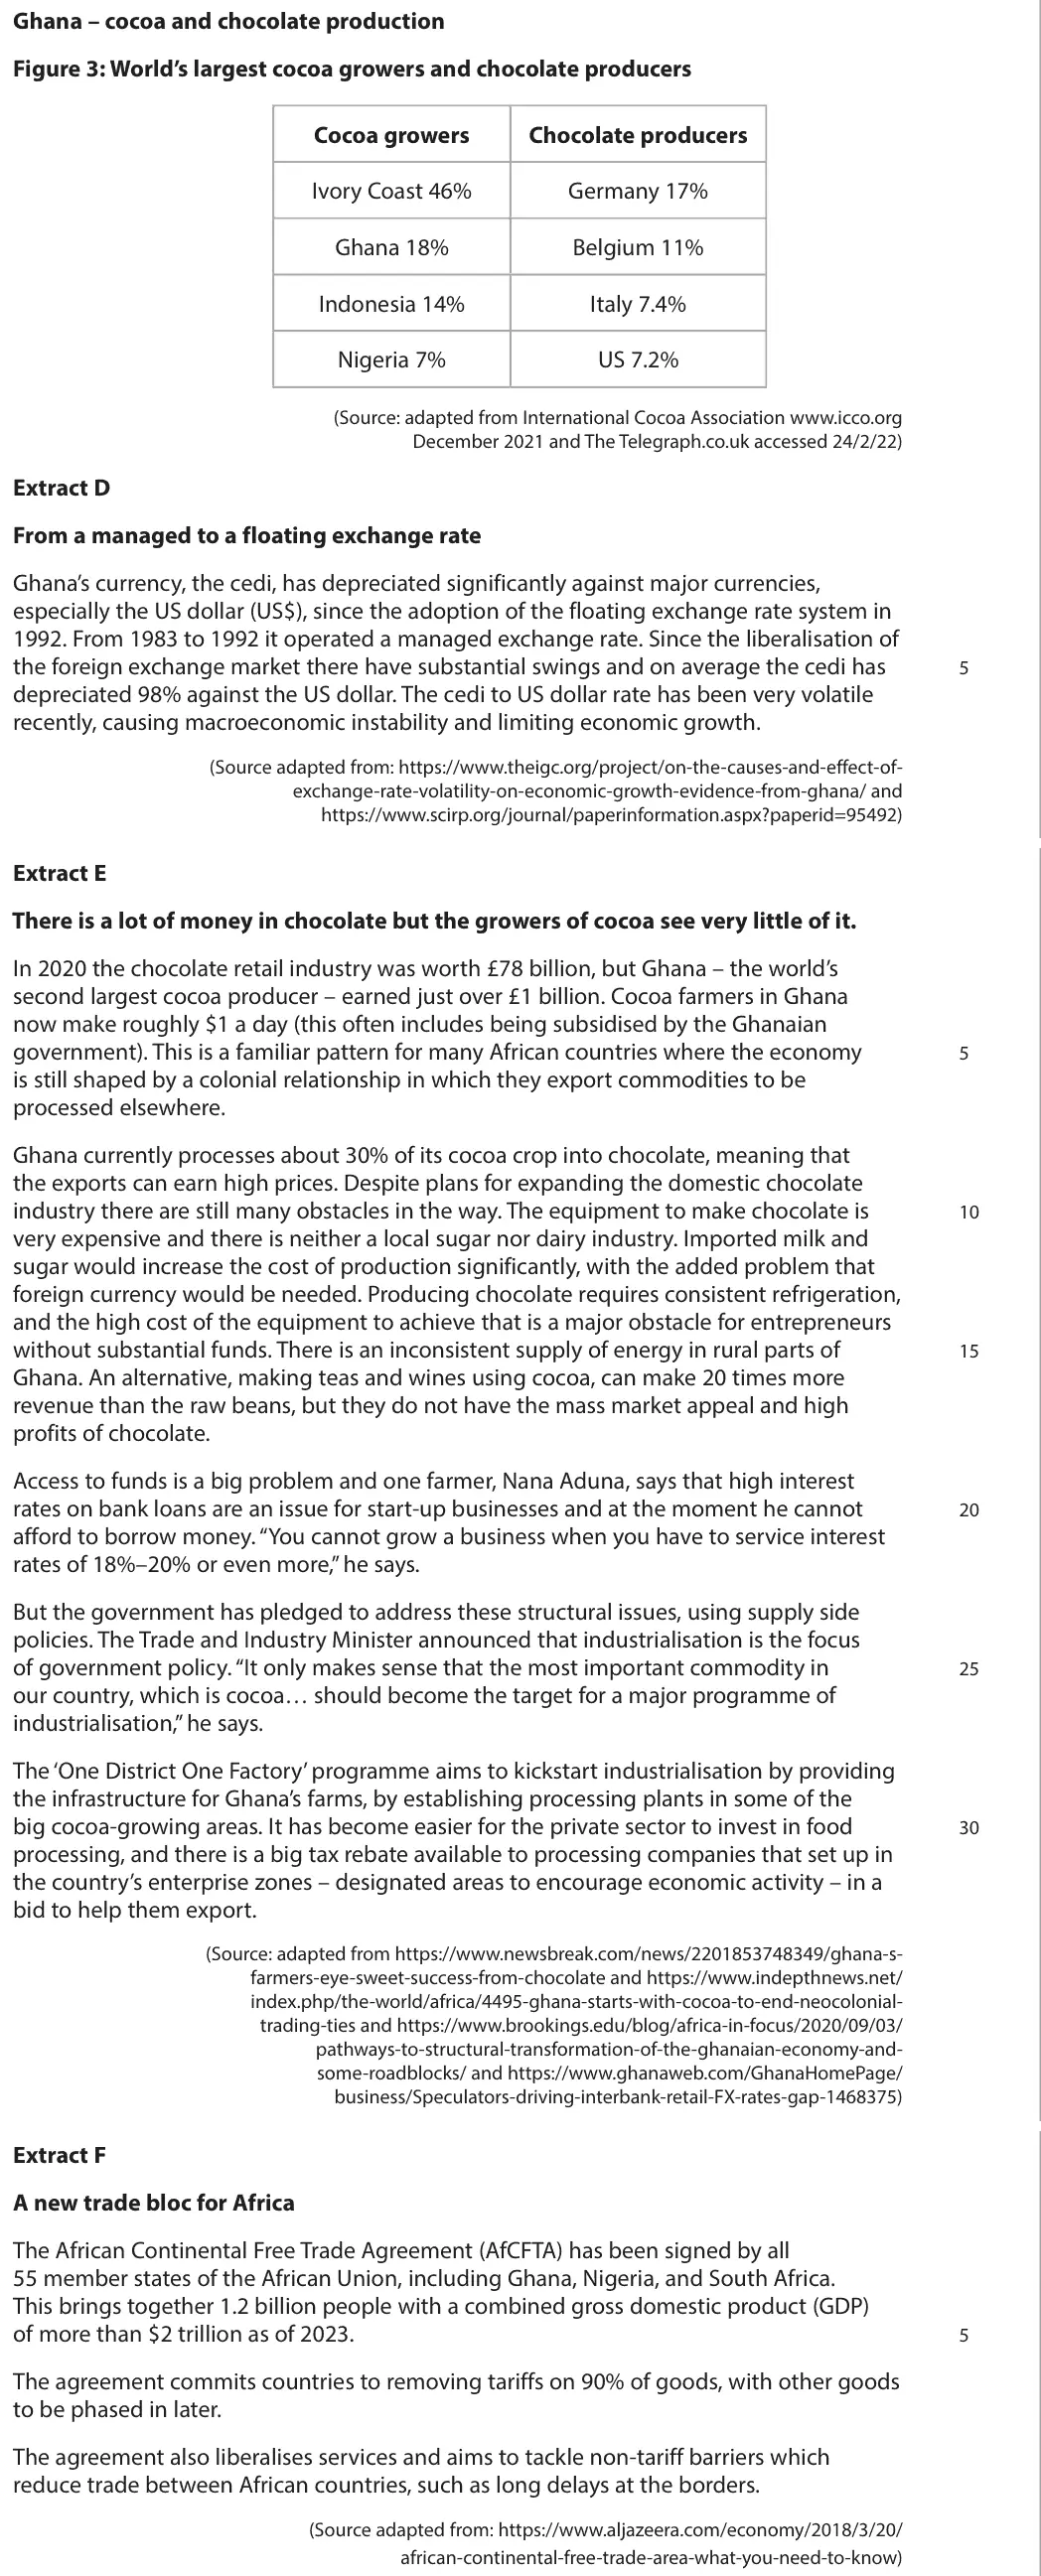
Data and extracts for question 2
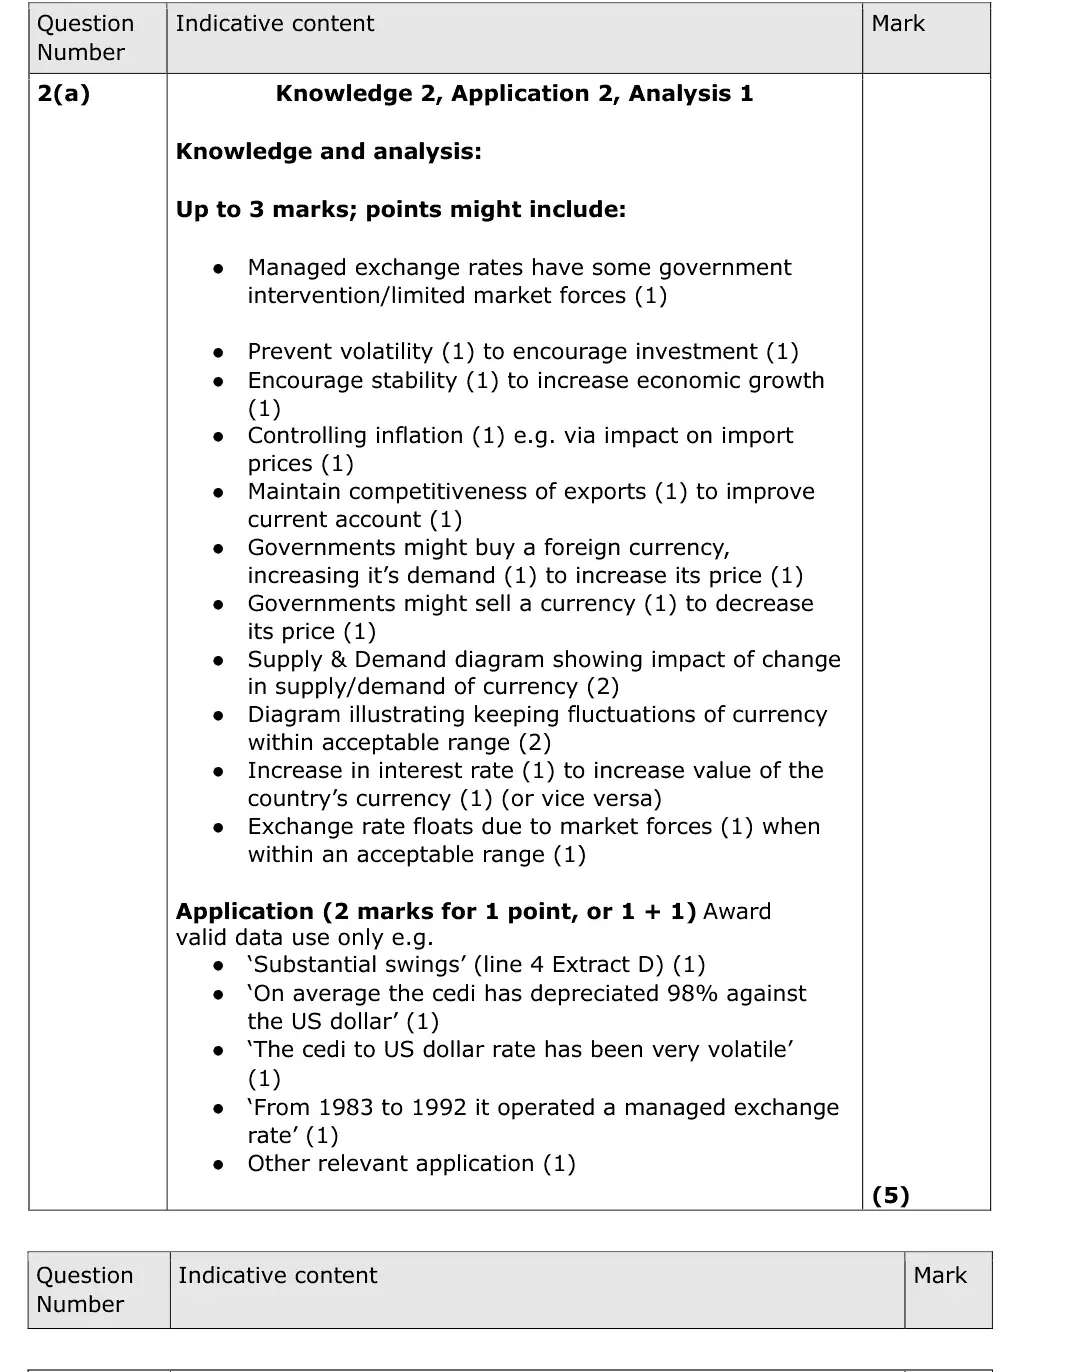
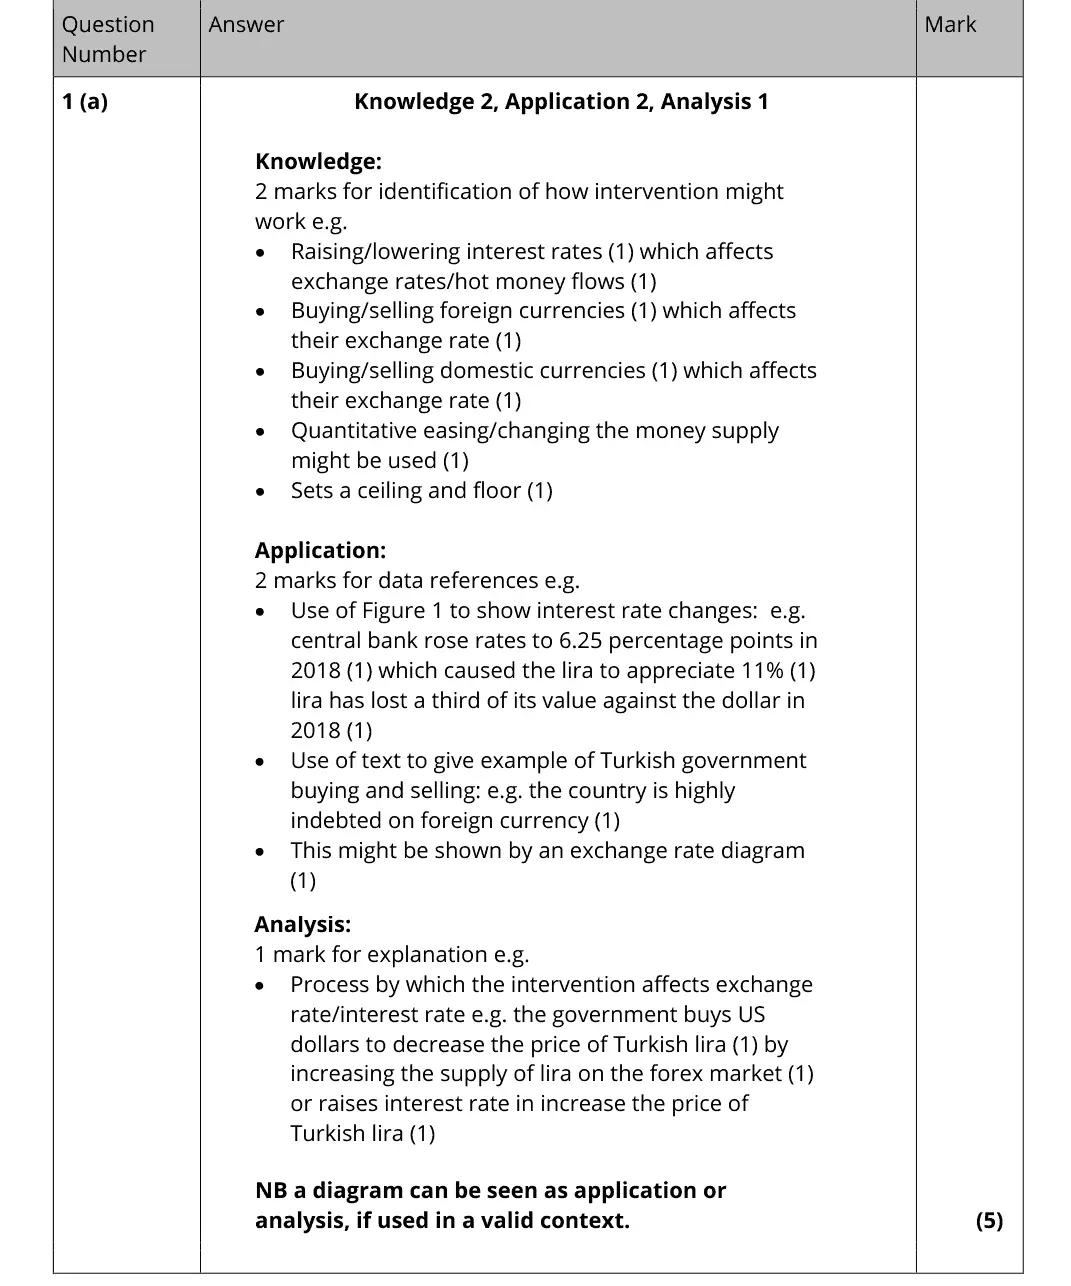
Mark scheme
Examiner's comment
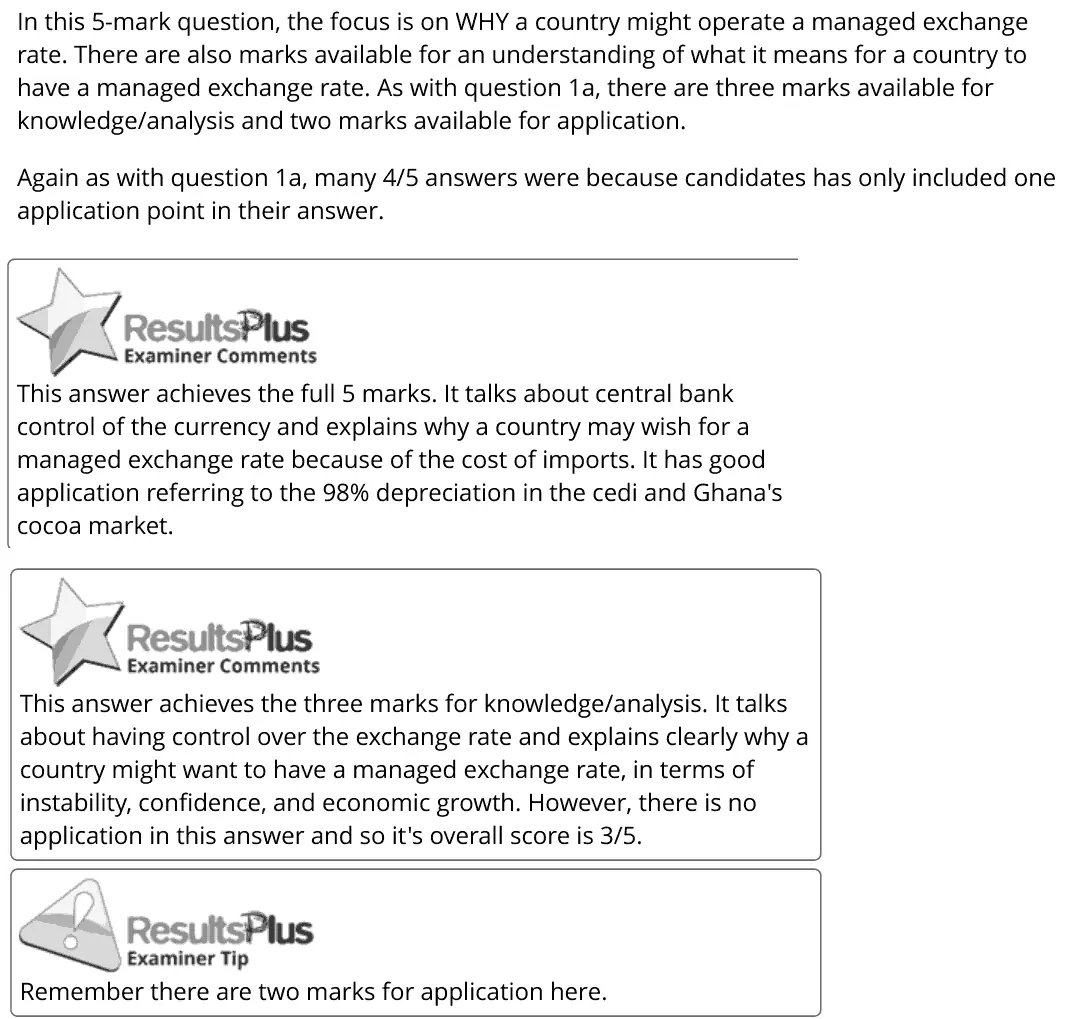
In this 5-mark question, the focus is on WHY a country might operate a managed exchange rate. There are also marks available for an understanding of what it means for a country to have a managed exchange rate. As with question 1a, there are three marks available for knowledge/analysis and two marks available for application. Again as with question 1a, many 4/5 answers were because candidates has only included one application point in their answer. <iResultsPlus This answer achieves the full 5 marks. It talks about central bank control of the currency and explains why a country may wish for a managed exchange rate because of the cost of imports. It has good application referring to the 98% depreciation in the cedi and Ghana's cocoa market. <iResultsPlus This answer achieves the three marks for knowledge/analysis. It talks about having control over the exchange rate and explains clearly why a country might want to have a managed exchange rate, in terms of instability, confidence, and economic growth. However, there is no application in this answer and so it's overall score is 3/5. \ ots,ResultsPlus Remember there are two marks for application here.
Notes from the mark scheme and report
why manage the rate: reduce volatility, stability for investment and growth, control imported inflation, keep exports competitive
buying or selling currency and interest rates
two application points from Extract D (98% depreciation, very volatile cedi, managed 1983 to 1992)
many lost one application mark
Quantitative skills: QS 9 (interpret, apply and analyse information in written, graphical tabular and numerical forms)
June 2022 · Paper 2 · Q3(b)1 markMultiple choice
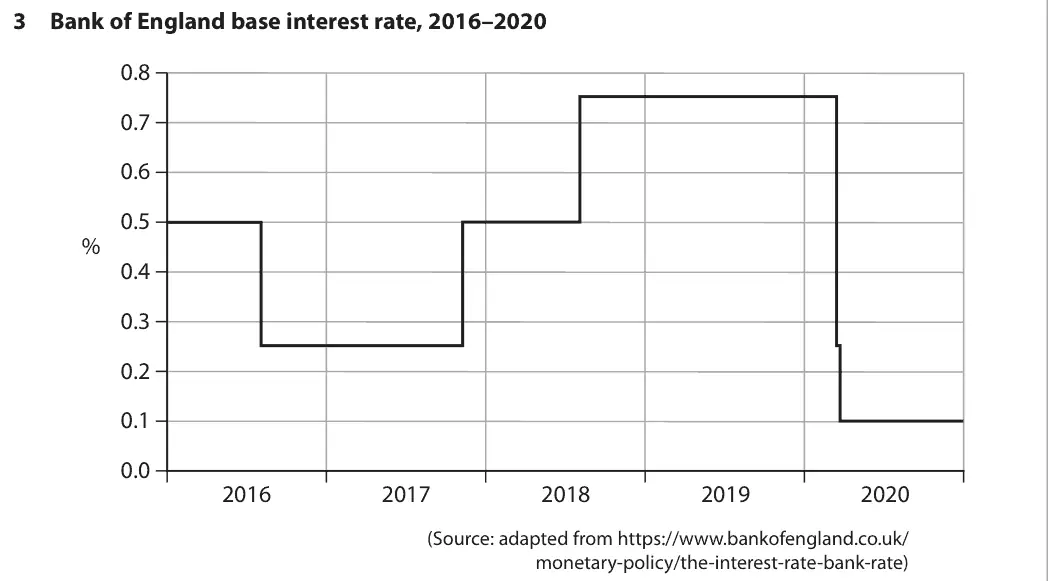
Data and extracts for question 3
Answer
B
Mark scheme
Notes from the mark scheme and report
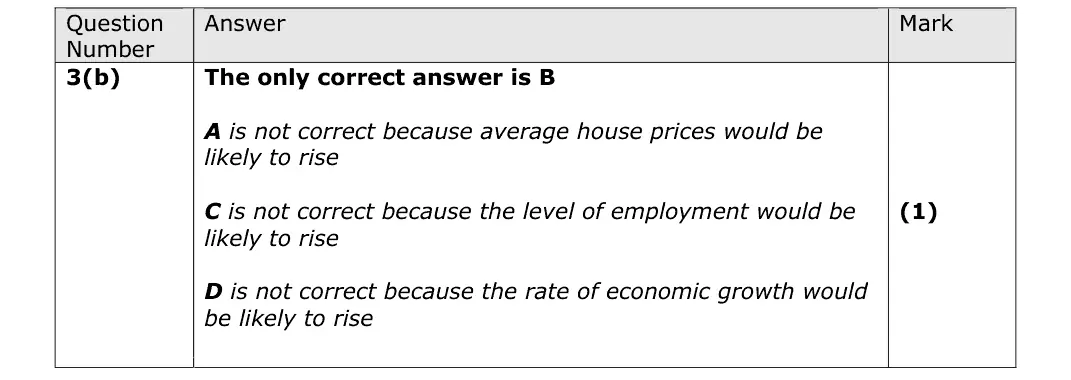
lower interest rates reduce hot money inflows, so the external value of the pound falls (B)
house prices, employment and growth would all be likely to rise
June 2022 · Paper 3 · Q1(d)25 marksAO1=4, AO2=4, AO3=8, AO4=925-mark essayEither/or
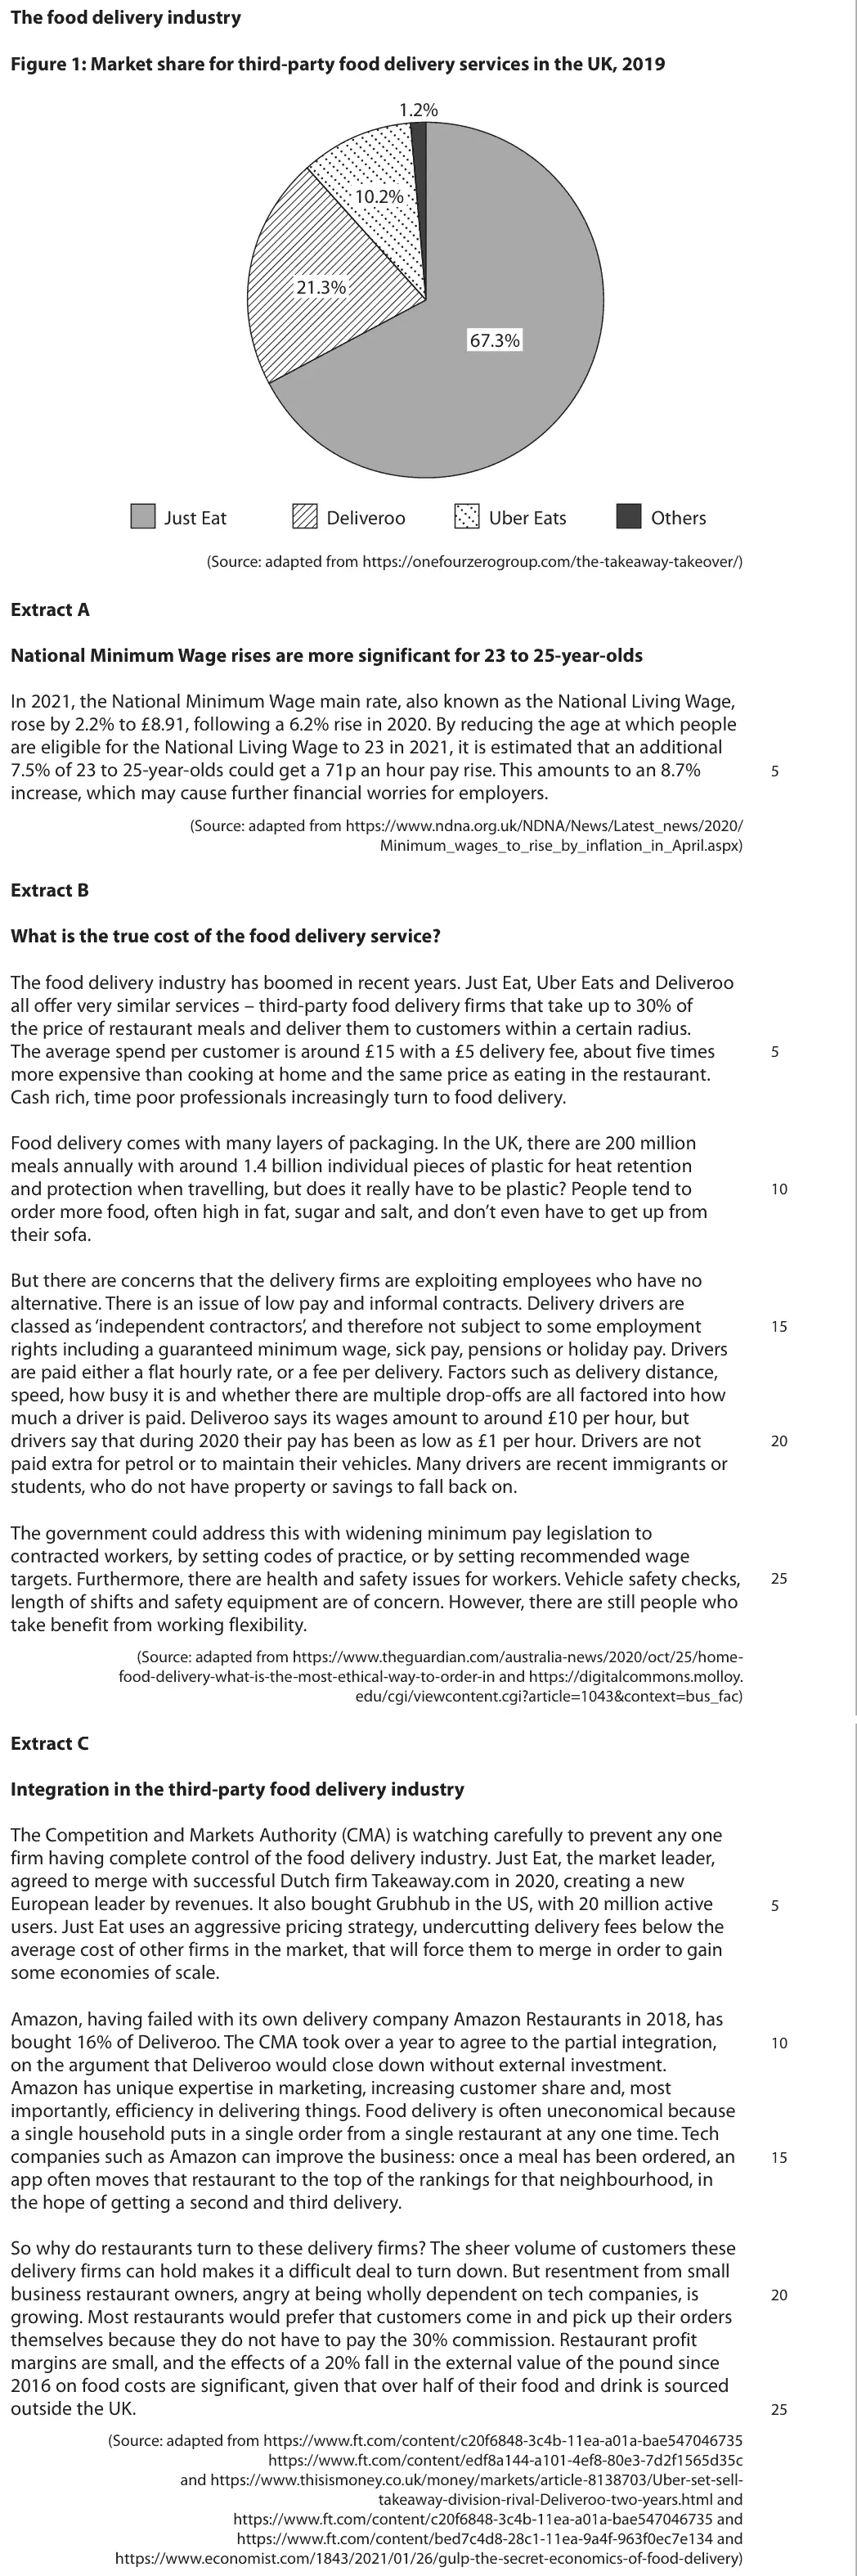
Data and extracts for question 1
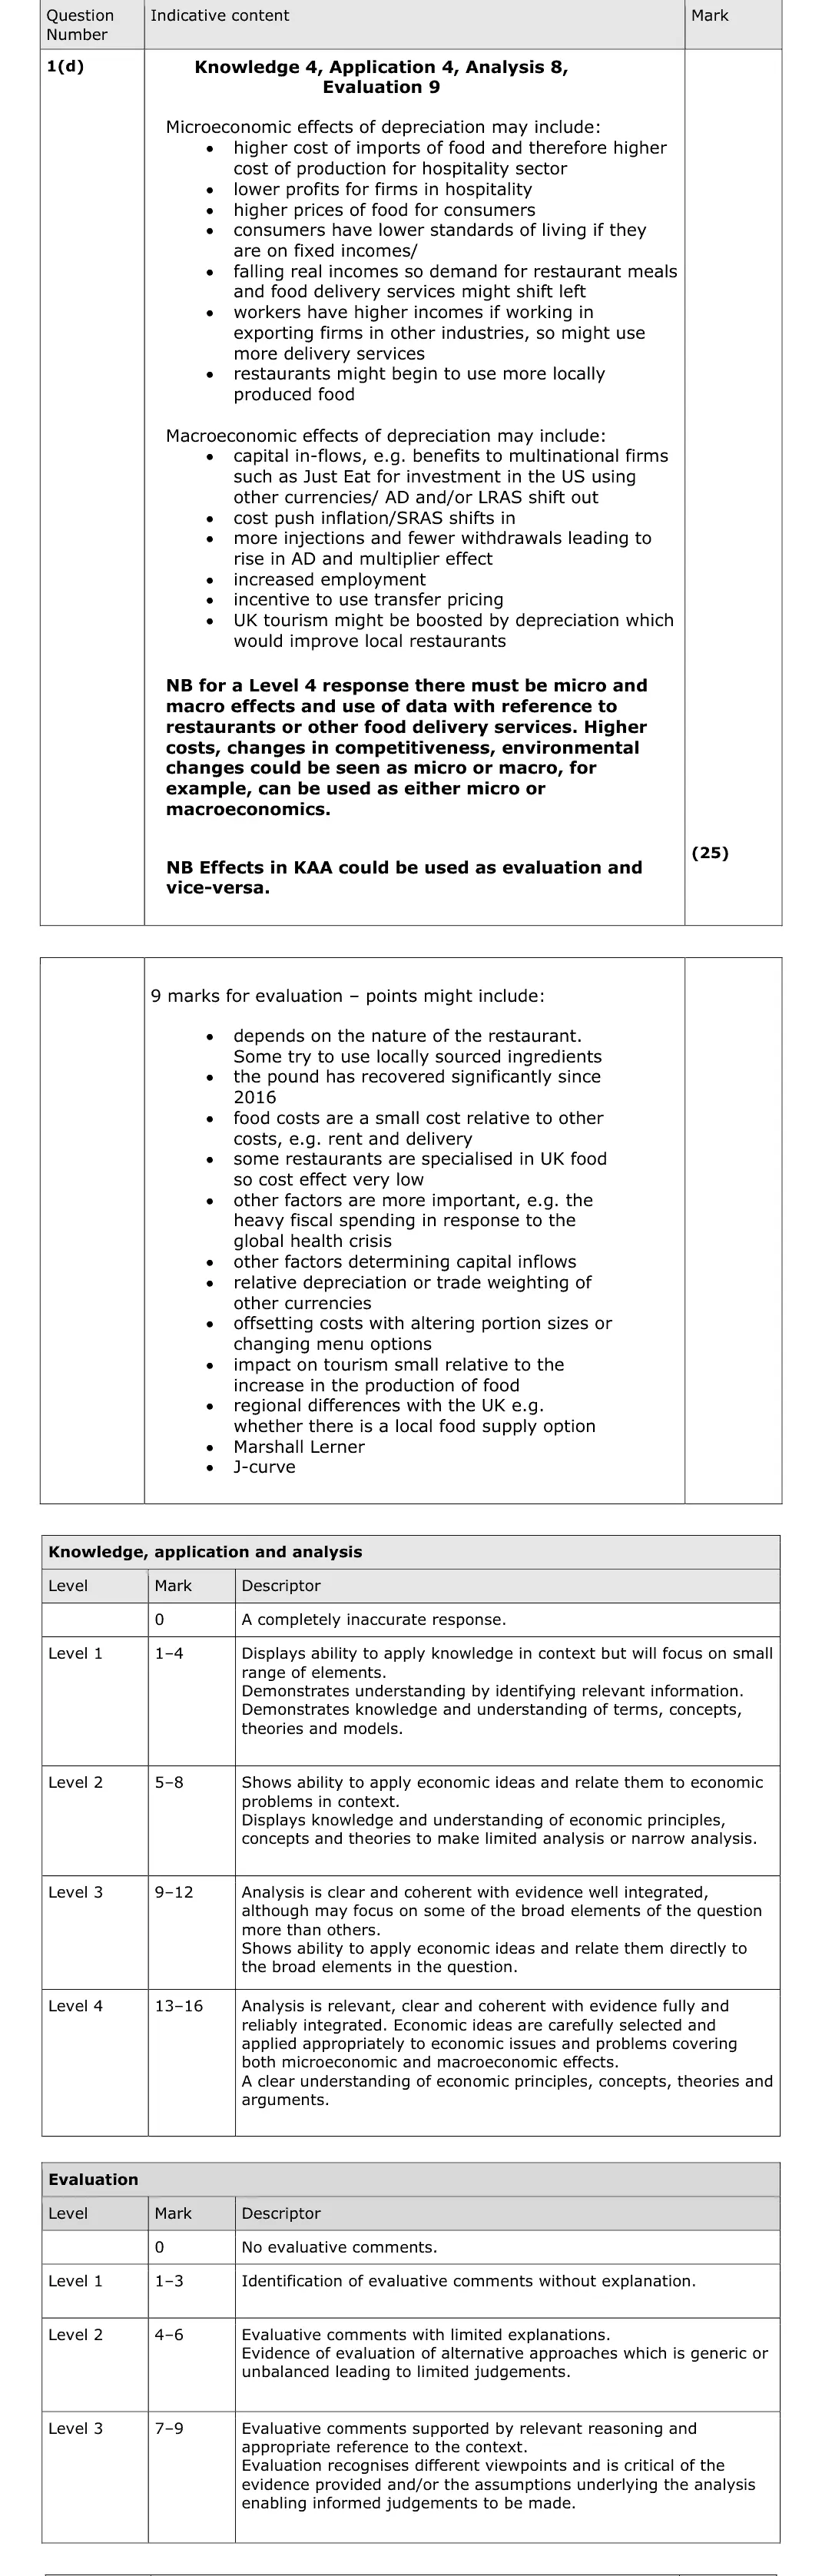
Mark scheme, including the levels grid and indicative content
Examiner's comment
There were some very good essays which showed good understanding of the microeconomics of an exchange rate depreciation on the price of imported ingredients, with many showing a shift in MC as well as AC and a new profit area highlighted. In the macro context some argued effectively that when there is a depreciation, it is likely that the SRAS curve will shift left to reflect the rising cost of imported inputs. A few candidates made explicit links along the lines that a depreciation might increase the popularity of the UK as a tourist destination and so the demand for restaurant meals might increase. Restaurant meals are not typically internationally traded and so it was surprising to see the number of candidates who argued that UK restaurants will sell more meals abroad following a depreciation, or other reasons for a rise in AD. Nevertheless there were some very well informed candidates who showed excellent knowledge of recent developments in the UK economy with regard to the difficulty of attracting staff to this sector. Micro effects of exchange rate depreciation on the food delivery and/or restaurant sector were well explained and were often supported by an accurately drawn cost and revenue diagram showing a rise in AC and MC. The stronger candidates used type of restaurant to really develop their answers where ingredients would need to be sourced from abroad e.g. Japanese and Asian restaurants. Macro effects were more challenging in terms of application to food delivery and/or restaurant sector. Quite a few candidates wrote about how exchange rate depreciation could lead to food delivery companies increasing their export which was unconvincing. Candidates who developed the macroeconomics effects using the AD/AS model, typically with a well explained diagram, were able to offer more developed responses, which scored higher marks. A reminder to centres that at least one good detailed application to the context provided (i.e. the restaurant or food delivery services) was required to score highly. Generic response to the effects of depreciation, tended to score Level 3 KAA. There was good understanding shown of the Marshall-Lerner condition and J Curve in many responses. The micro side of depreciation was best linked to costs, as here. The candidate then links the costs of food in restaurants to the diagram by making it clear that variable costs shift, and therefore both MC and AC shift. This is a good answer but the candidate keeps crossing out work, which is a problem because of opportunity cost. In this case the chains of reasoning are not extended fully so this does not reach the very top of the top levels for KAA and Eval. But at 22/25 there are lessons to be learned from using the right vocabulary and tools of analysis. The economics student should not aim for perfection either in terms of wording or presentation, but instead purity of logic and strength in the links of the analysis and evaluation. This is similarly a good answer in terms of logic and the link to costs is again strong. But the noticeable difference is in terms of the chains of reasoning which stay in Level 3 KAA and Level 2 Eval. So for example the costs are not linked to the variable costs of food imports for restaurants, and that is merely assumed. 12 KAA marks and 6 Eval. This was the modal score for this question. Do not force the examiner to do the work for you. If your costs shift, say whether they are fixed or variable then link your application to the diagram that you draw.
Notes from the mark scheme and report
micro: dearer imported ingredients raise variable costs so MC and AC shift up and profit falls
macro: SRAS shifts left (cost-push inflation), AD effects via net trade and tourism
restaurant meals are not exported, so do not argue they sell more abroad
Level 4 needs micro, macro and the restaurant context
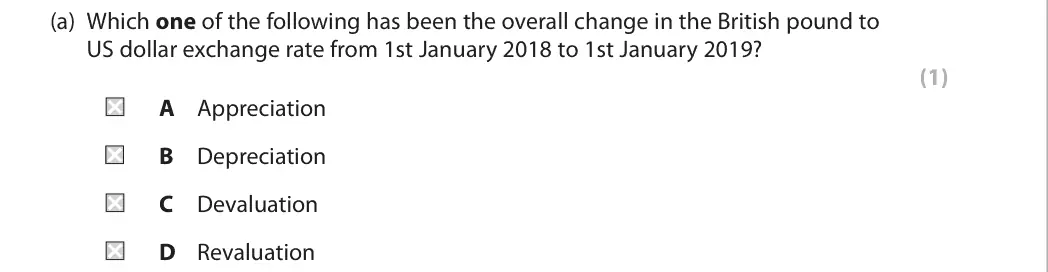
November 2021 · Paper 2 · Q3(a)1 markMultiple choice
Data and extracts for question 3
Answer
B
Mark scheme
Notes from the mark scheme and report
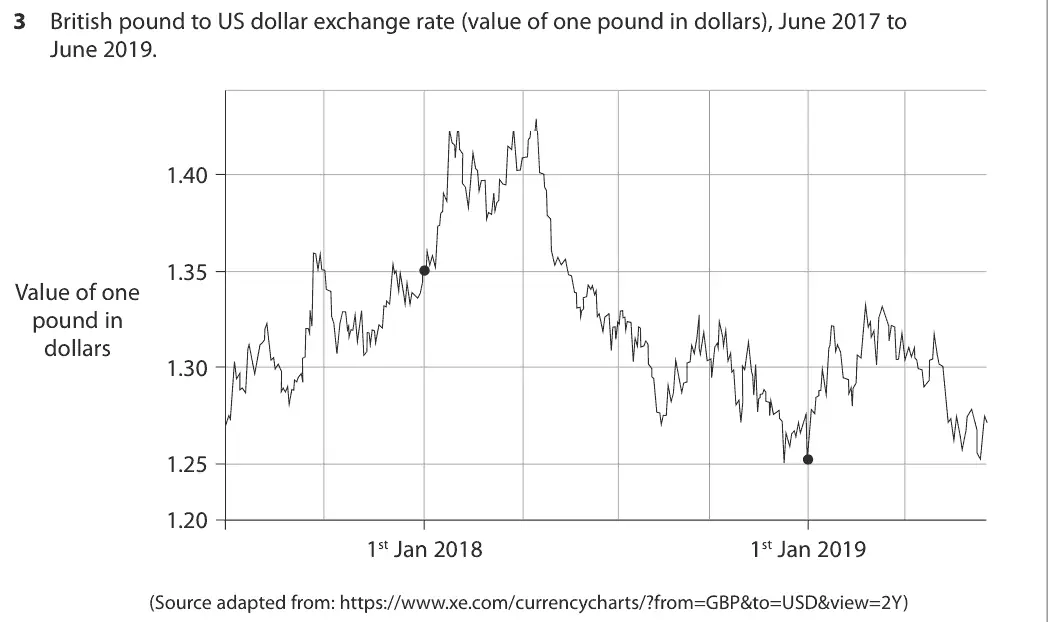
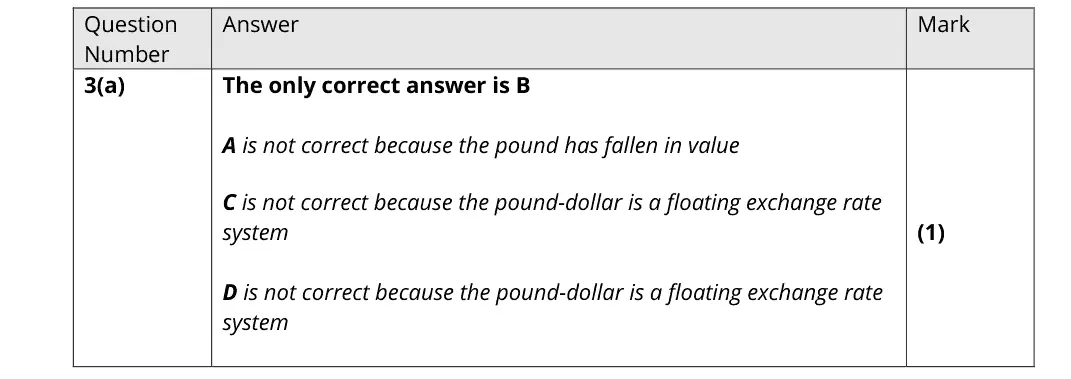
the pound fell from about $1.35 to about $1.25 under a floating system = depreciation (B)
devaluation and revaluation apply to fixed rates
Quantitative skills: QS 9 (interpret, apply and analyse information in written, graphical tabular and numerical forms)
November 2021 · Paper 2 · Q3(b)4 marksAO1=2, AO2=1, AO3=1Short answer
Data and extracts for question 3
Mark scheme
Examiner's comment
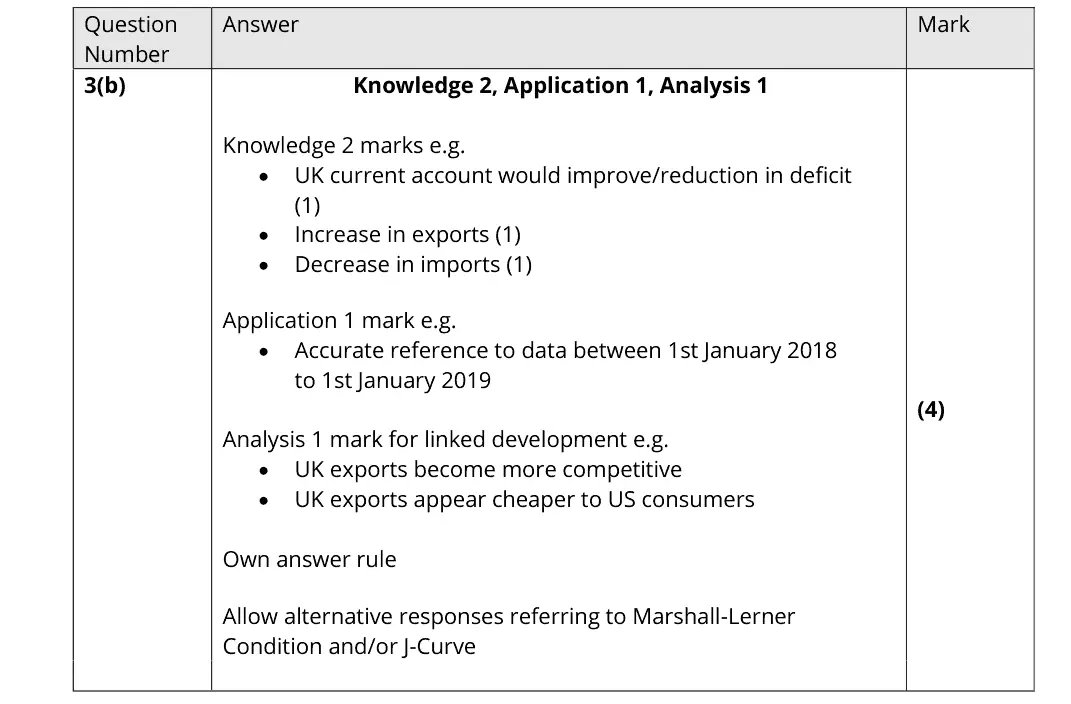
Question 3b required candidates to explain the link between exchange rates and the current account. There were many good answers here that explained this link clearly, such as the example below. Some good answers lacked application, missing out on 1 of the marks.
Notes from the mark scheme and report
depreciation makes UK exports cheaper and imports dearer so the current account deficit narrows
quote the data (about $1.35 to $1.25) for the application mark, often missing
Marshall-Lerner/J-curve accepted
Quantitative skills: QS 9 (interpret, apply and analyse information in written, graphical tabular and numerical forms)
October 2020 · Paper 2 · Q3(b)1 markMultiple choice
Data and extracts for question 3
Answer
B
Mark scheme
Notes from the mark scheme and report
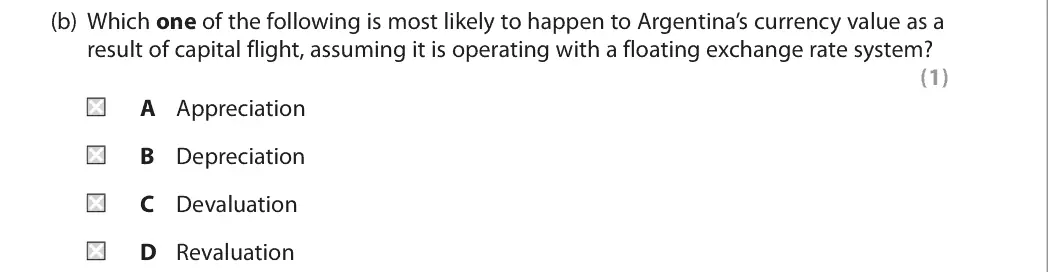
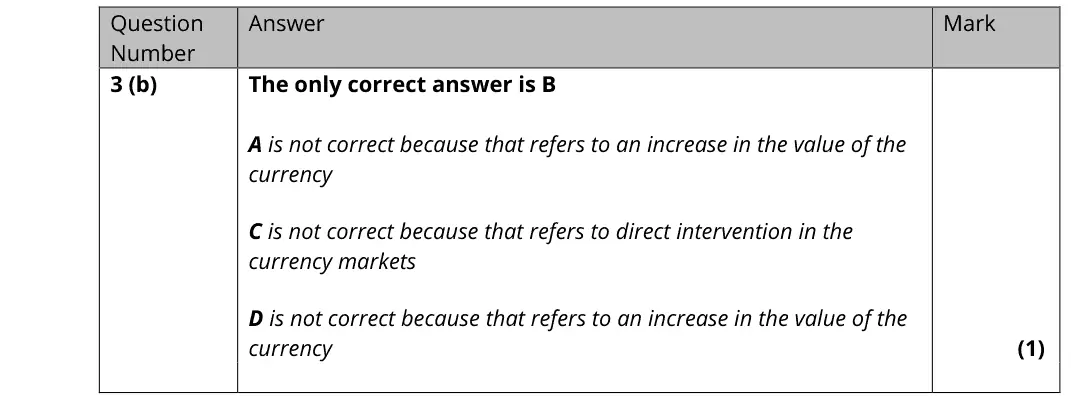
capital flight increases supply of the peso on the forex market, so under a floating system it depreciates (B)
devaluation and revaluation refer to fixed systems
appreciation is a rise
report: the hardest of the five MCQs
October 2020 · Paper 3 · Q1(a)5 marksAO1=2, AO2=2, AO3=1Short answer
Data and extracts for question 1
Mark scheme
Examiner's comment
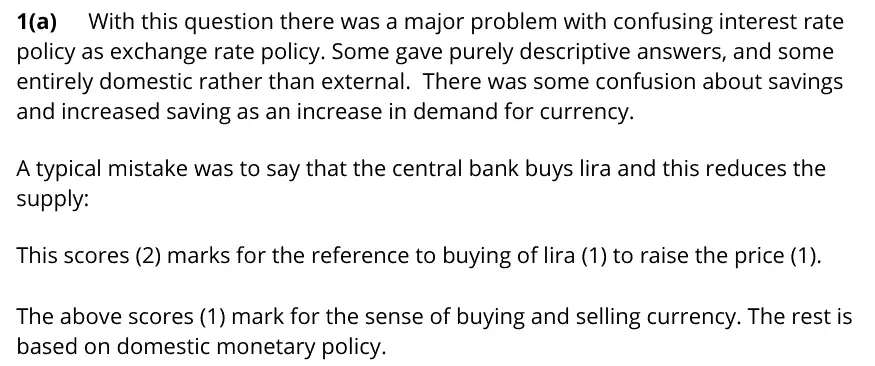
With this question there was a major problem with confusing interest rate policy as exchange rate policy. Some gave purely descriptive answers, and some entirely domestic rather than external. There was some confusion about savings and increased saving as an increase in demand for currency. A typical mistake was to say that the central bank buys lira and this reduces the supply: This scores (2) marks for the reference to buying of lira (1) to raise the price (1). The above scores (1) mark for the sense of buying and selling currency. The rest is based on domestic monetary policy.
Notes from the mark scheme and report
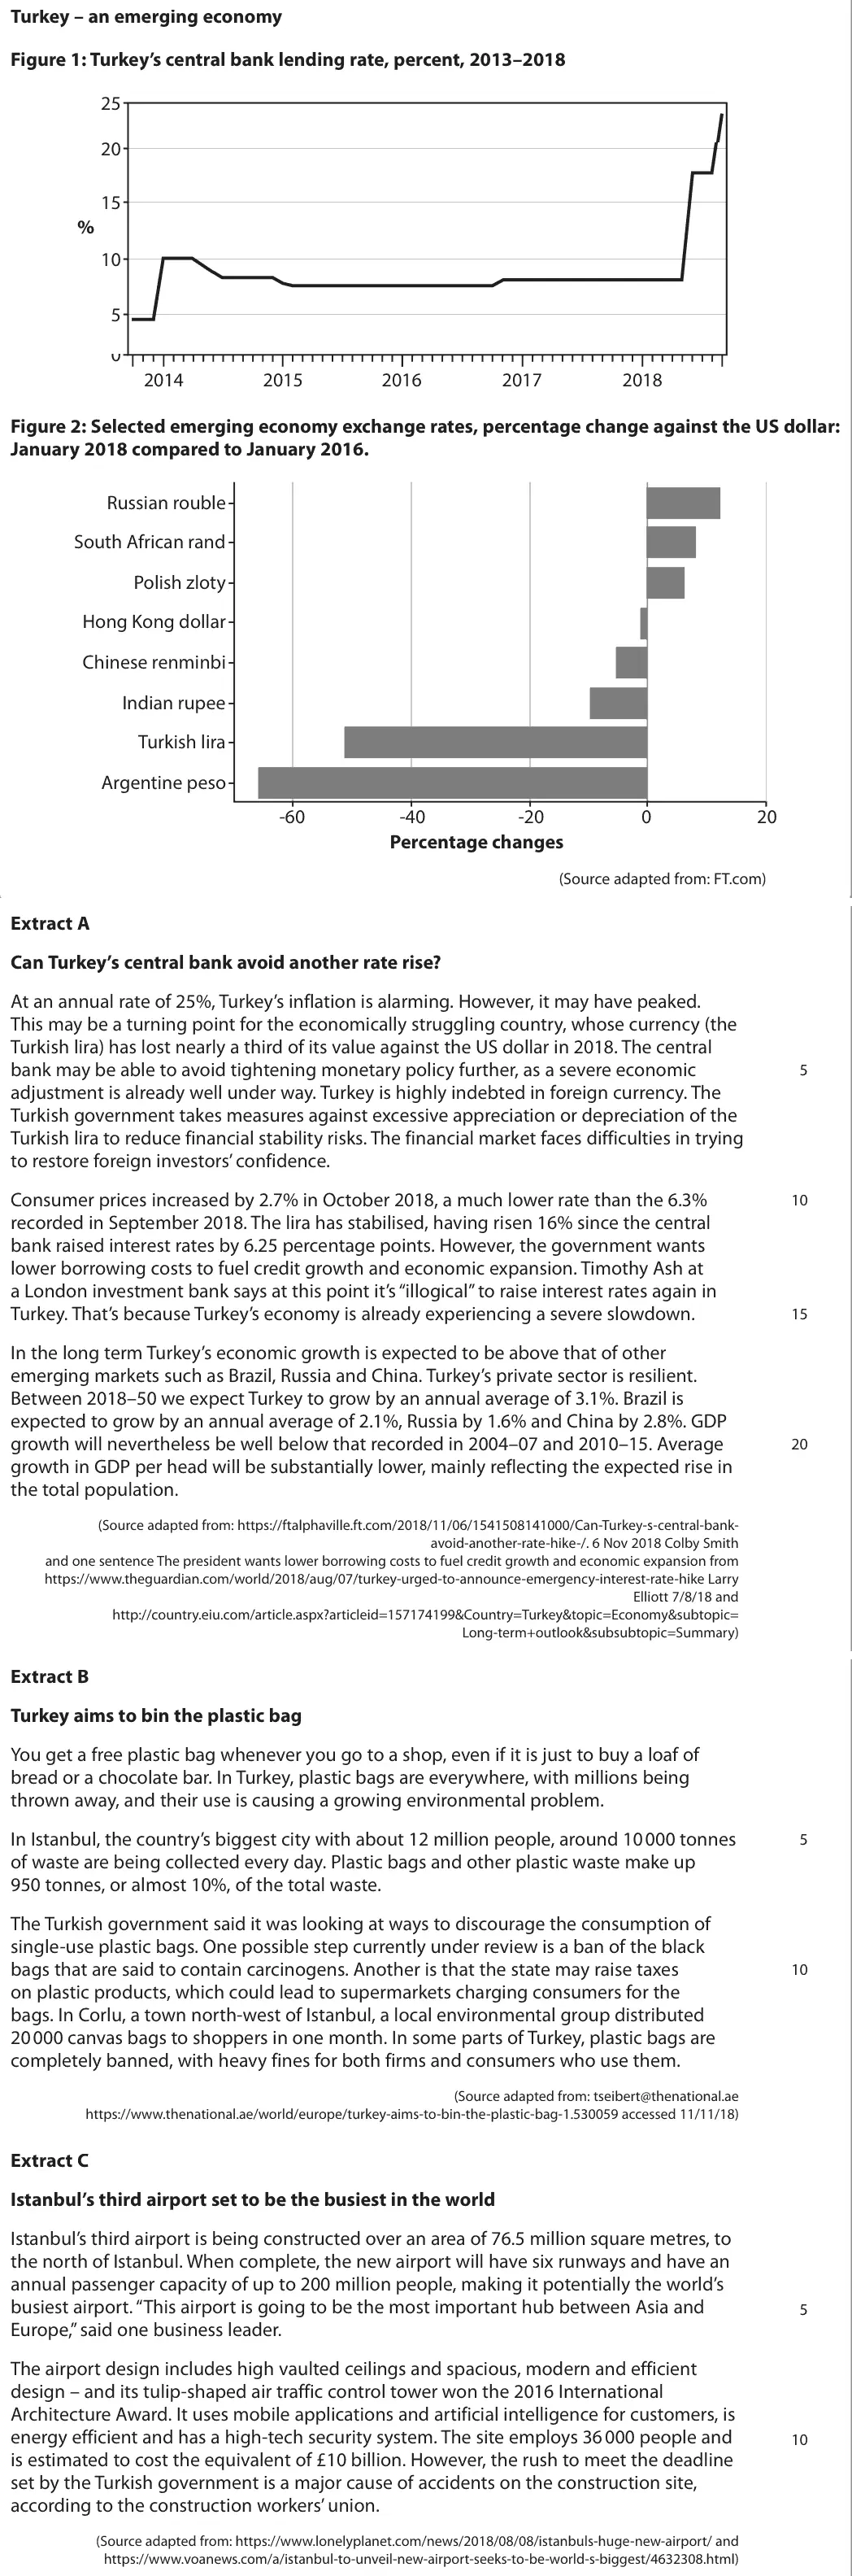
intervention means buying/selling lira or foreign currency on the forex market, or changing interest rates to shift hot money flows
buying lira raises demand for it (not 'reduces supply')
many confused domestic interest rate policy with exchange rate policy
use the 6.25 percentage point rise and the 16% recovery of the lira
Quantitative skills: QS 9 (interpret, apply and analyse information in written, graphical tabular and numerical forms)
October 2020 · Paper 3 · Q1(b)8 marksAO1=2, AO2=2, AO3=2, AO4=28-mark response
Data and extracts for question 1
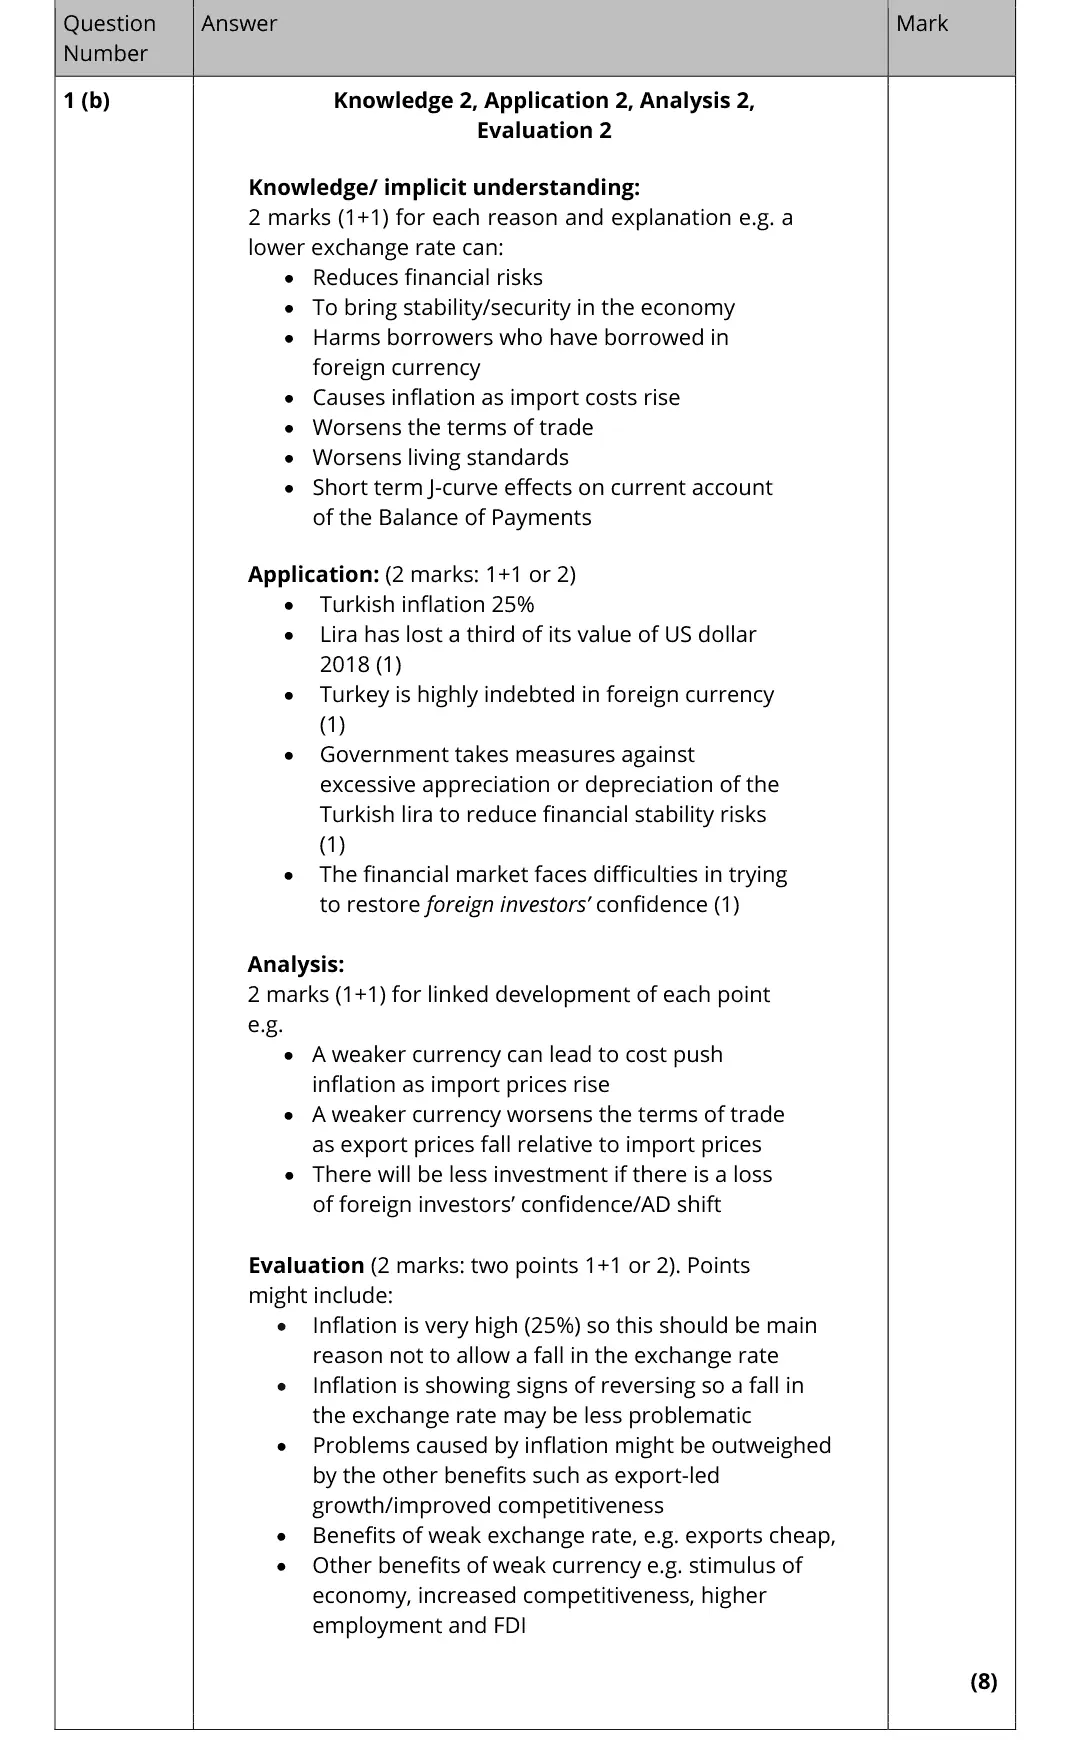
Mark scheme, including the levels grid and indicative content
Examiner's comment
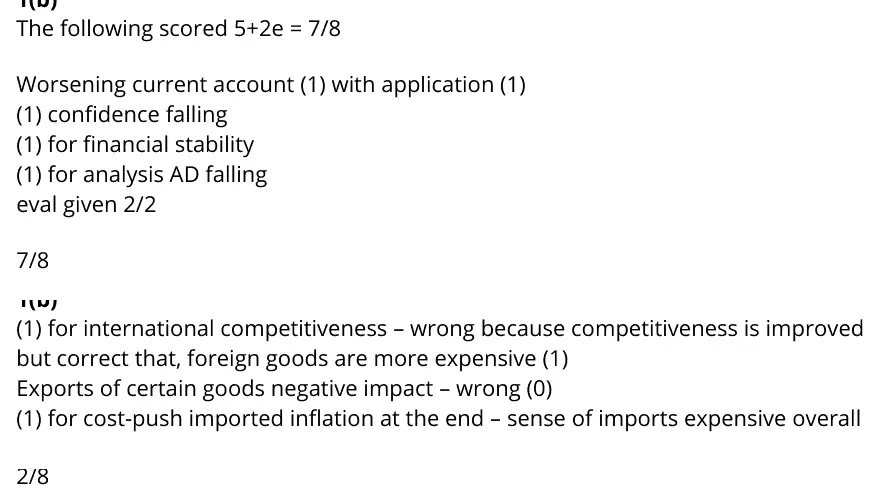
The following scored 5+2e = 7/8 Worsening current account (1) with application (1) (1) confidence falling (1) for financial stability (1) for analysis AD falling eval given 2/2 7/8 (1) for international competitiveness – wrong because competitiveness is improved but correct that, foreign goods are more expensive (1) Exports of certain goods negative impact – wrong (0) (1) for cost-push imported inflation at the end – sense of imports expensive overall 2/8
Notes from the mark scheme and report
two reasons each developed: imported cost-push inflation (already 25%), dearer foreign-currency debt, worse terms of trade, loss of investor confidence
a lower lira improves (not worsens) price competitiveness of exports
evaluate with export-led growth benefits or inflation already falling
Quantitative skills: QS 9 (interpret, apply and analyse information in written, graphical tabular and numerical forms)
June 2019 · Paper 2 · Q6(b)8 marksAO1=2, AO2=2, AO3=2, AO4=28-mark response
Data and extracts for question 6
Mark scheme, including the levels grid and indicative content
Examiner's comment
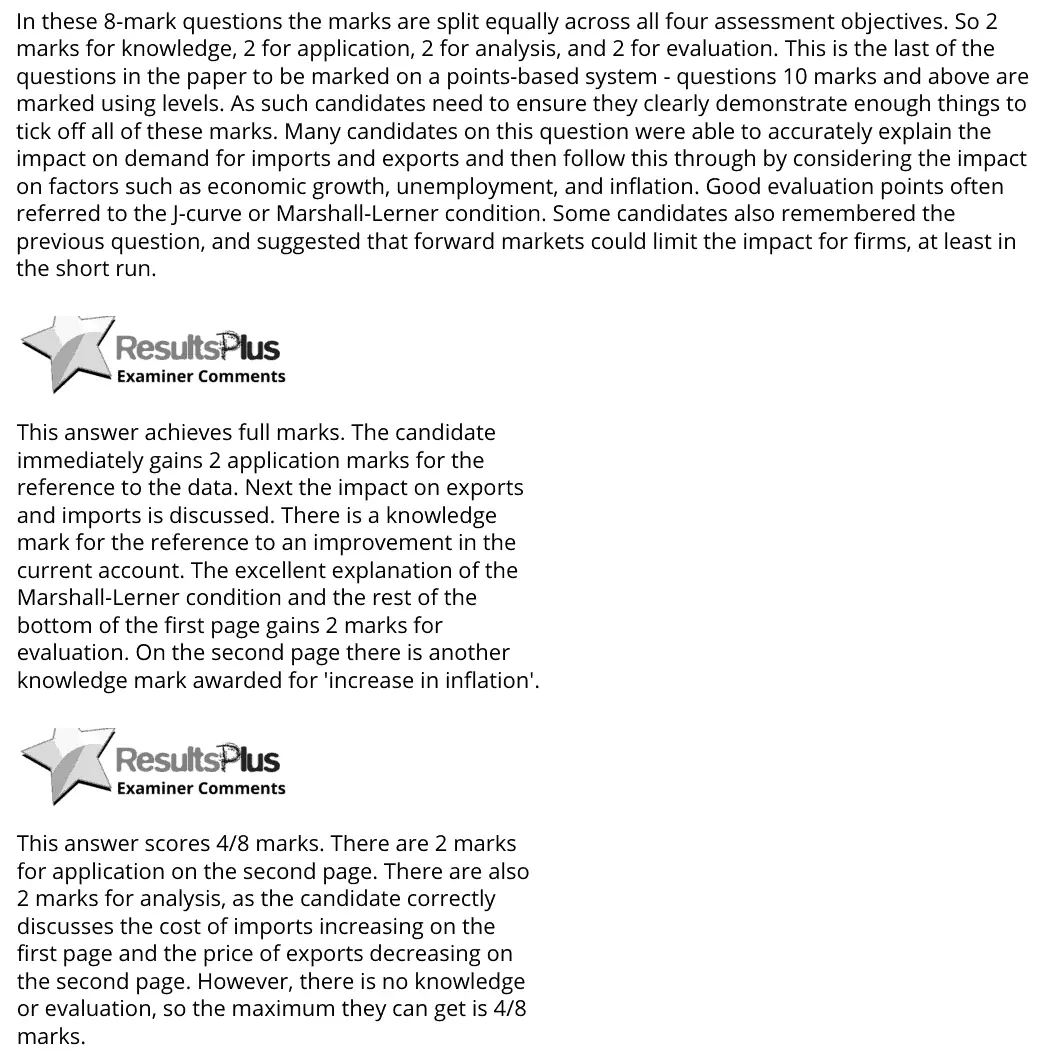
In these 8-mark questions the marks are split equally across all four assessment objectives. So 2 marks for knowledge, 2 for application, 2 for analysis, and 2 for evaluation. This is the last of the questions in the paper to be marked on a points-based system - questions 10 marks and above are marked using levels. As such candidates need to ensure they clearly demonstrate enough things to tick off all of these marks. Many candidates on this question were able to accurately explain the impact on demand for imports and exports and then follow this through by considering the impact on factors such as economic growth, unemployment, and inflation. Good evaluation points often referred to the J-curve or Marshall-Lerner condition. Some candidates also remembered the previous question, and suggested that forward markets could limit the impact for firms, at least in the short run. This answer achieves full marks. The candidate immediately gains 2 application marks for the reference to the data. Next the impact on exports and imports is discussed. There is a knowledge mark for the reference to an improvement in the current account. The excellent explanation of the Marshall-Lerner condition and the rest of the bottom of the first page gains 2 marks for evaluation. On the second page there is another knowledge mark awarded for 'increase in inflation'. This answer scores 4/8 marks. There are 2 marks for application on the second page. There are also 2 marks for analysis, as the candidate correctly discusses the cost of imports increasing on the first page and the price of exports decreasing on the second page. However, there is no knowledge or evaluation, so the maximum they can get is 4/8 marks.
Notes from the mark scheme and report
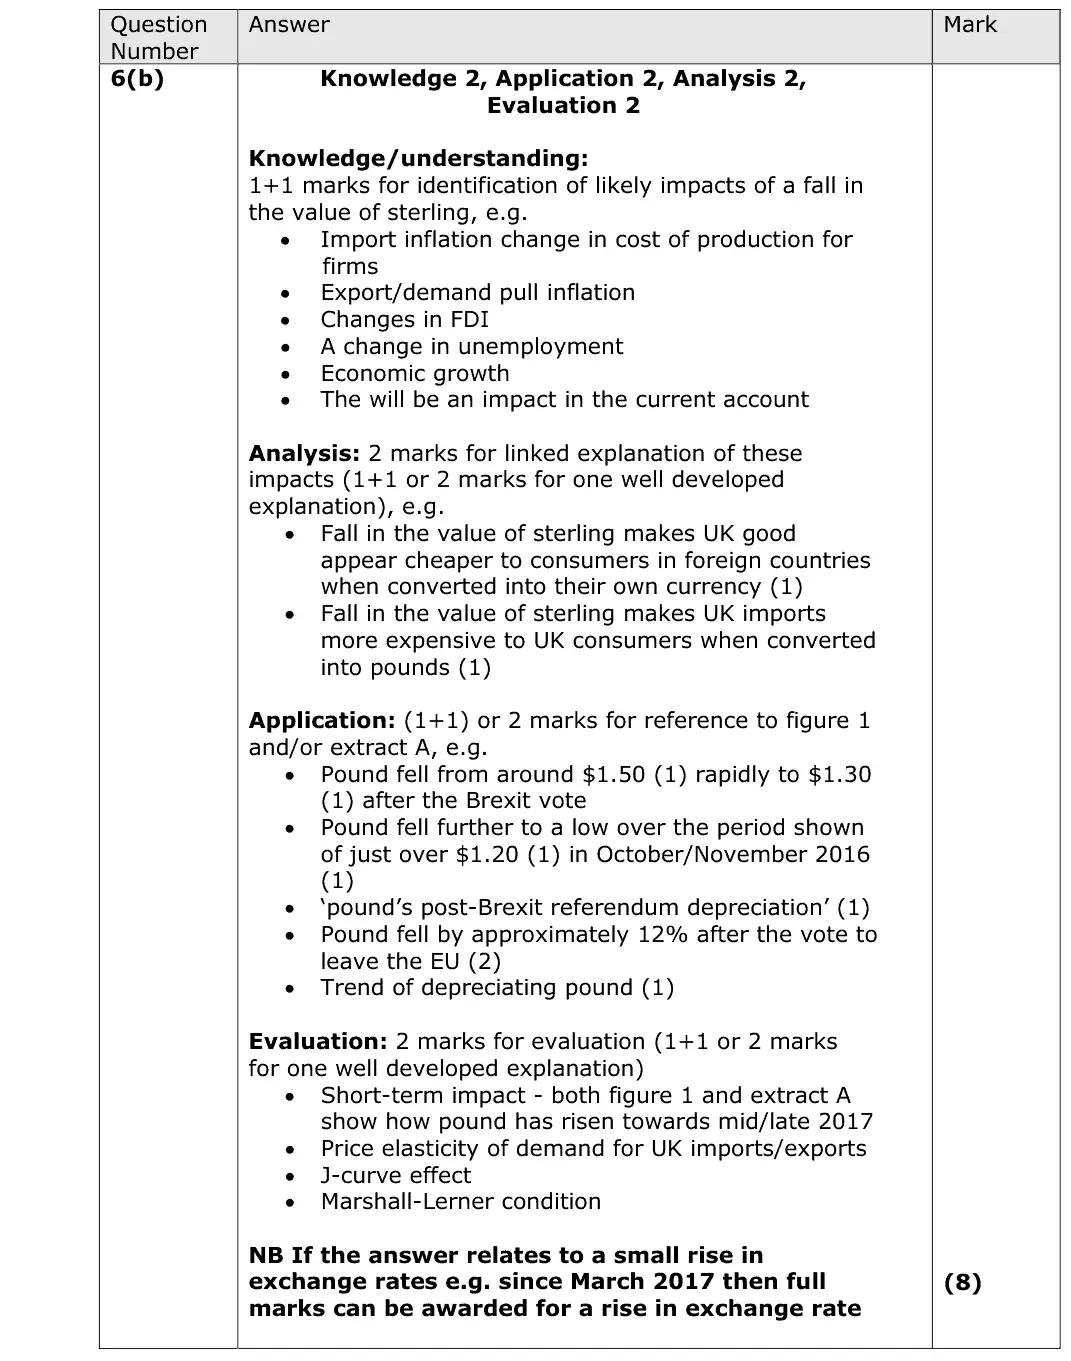
pound fell from about $1.50 to $1.30 after the EU vote and to just over $1.20 by late 2016: exports cheaper, imports dearer, imported inflation, growth, current account
evaluate with J-curve, Marshall-Lerner, forward contracts limiting short-run effects
Quantitative skills: QS 9 (interpret, apply and analyse information in written, graphical tabular and numerical forms)
June 2018 · Paper 2 · Q825 marksAO1=4, AO2=4, AO3=8, AO4=925-mark essayEither/or
Mark scheme, including the levels grid and indicative content
Examiner's comment
This question was accessible to the vast majority of candidates. In particular most candidates picked up on the impact of a depreciation on both the current account and, consequently, on aggregate demand. Strong candidates drew an AD/AS diagram to clearly illustrate their point. Common evaluation points centred on the J-curve and the Marshall-Lerner condition, although some candidates were better able to explain the logic behind these than others. The best answers offered some context to their answers and moved beyond simply theoretical explanations to relate their answers to the current situation of the UK economy, e.g. record low unemployment or the uncertainties surrounding the Brexit negotiations. This answer largely fails to answer the question and therefore is unable to access many of the marks. The candidate has correctly identified the impact of a depreciation on demand for imports and exports. After that the answer drifts off and discusses Brexit, investment, and other issues. There is no logical link from a depreciation of the currency to these impacts so unfortunately the candidate is only going to achieve a low mark of low Level 2 for KAA and Level 1 for evaluation. Always look back at the question whilst you are answering it. In the pressure of an exam, it's easy to forget the precise question asked and start going off in a different direction. This is a high-quality answer to this question that achieves top levels on both KAA and evaluation. The candidate starts with an explanation of the impact on AD, via imports and exports. This is clearly explained both in words and a diagram. It is also convincingly evaluated regarding the elasticity of demand for imports and exports. The answer continues well, discussing in detail other impacts. What is also good here is the candidate has included some context in their answer, for example declining power of trade unions and the ongoing uncertainty in the UK's Brexit negotiations. This was used to particularly good effect at the end of the candidates' answer in their judgement. Remember a judgement is expected to get the very top marks for evaluation on the 25-mark question.
Notes from the mark scheme and report
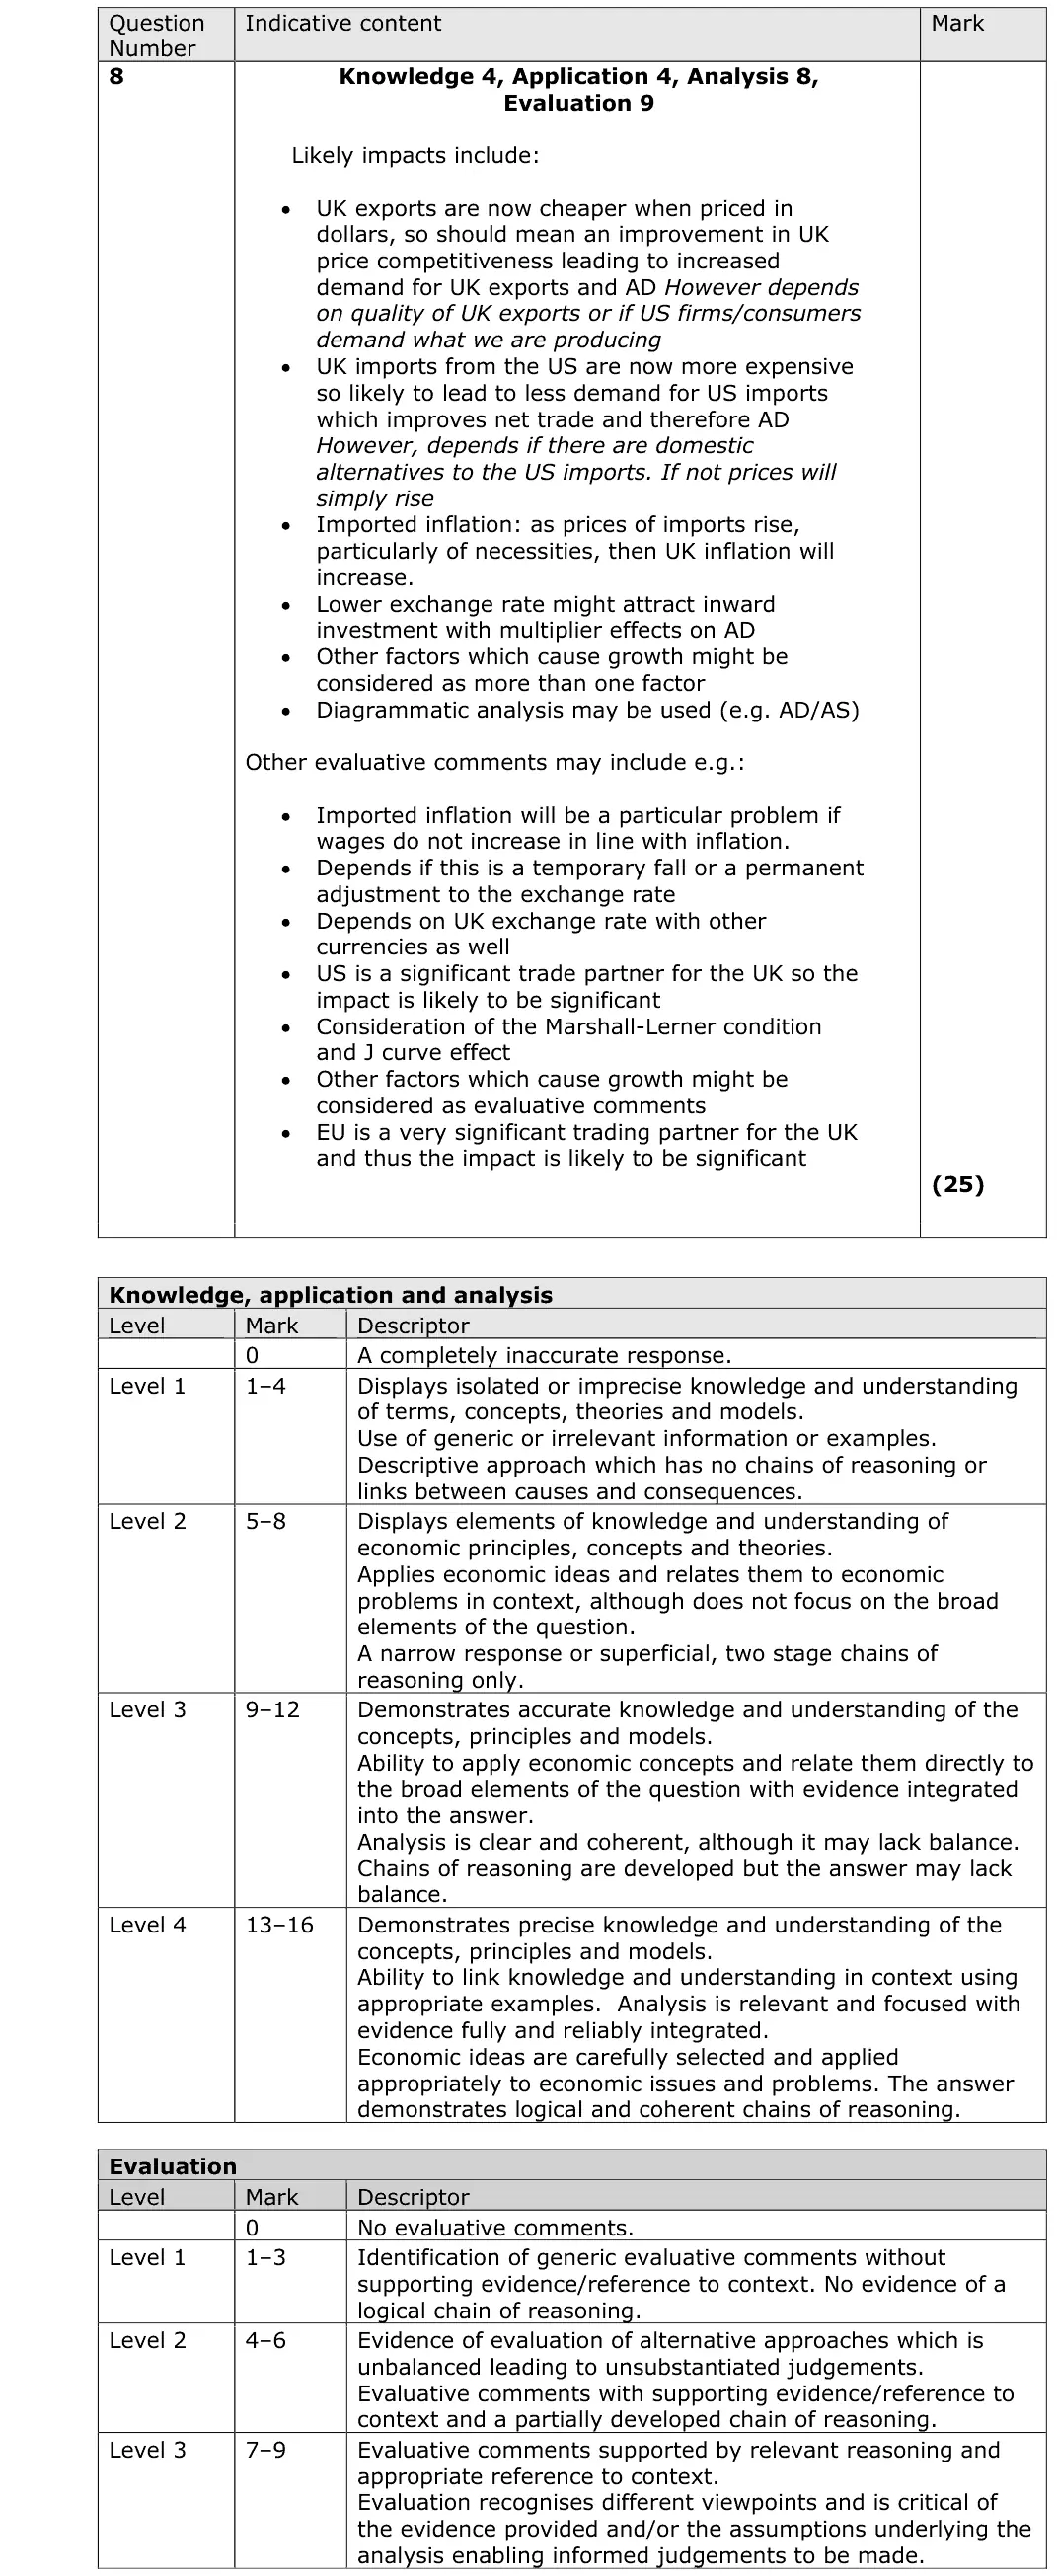
depreciation makes exports cheaper and imports dearer, raising net trade and AD
evaluate with Marshall-Lerner and J curve, imported inflation, temporary vs permanent fall, other exchange rates and the EU
the question is 'to what extent'
best answers related it to UK context e.g. low unemployment, Brexit uncertainty
June 2017 · Paper 2 · Q6(a)5 marksAO1=1, AO2=2, AO3=2Calculation
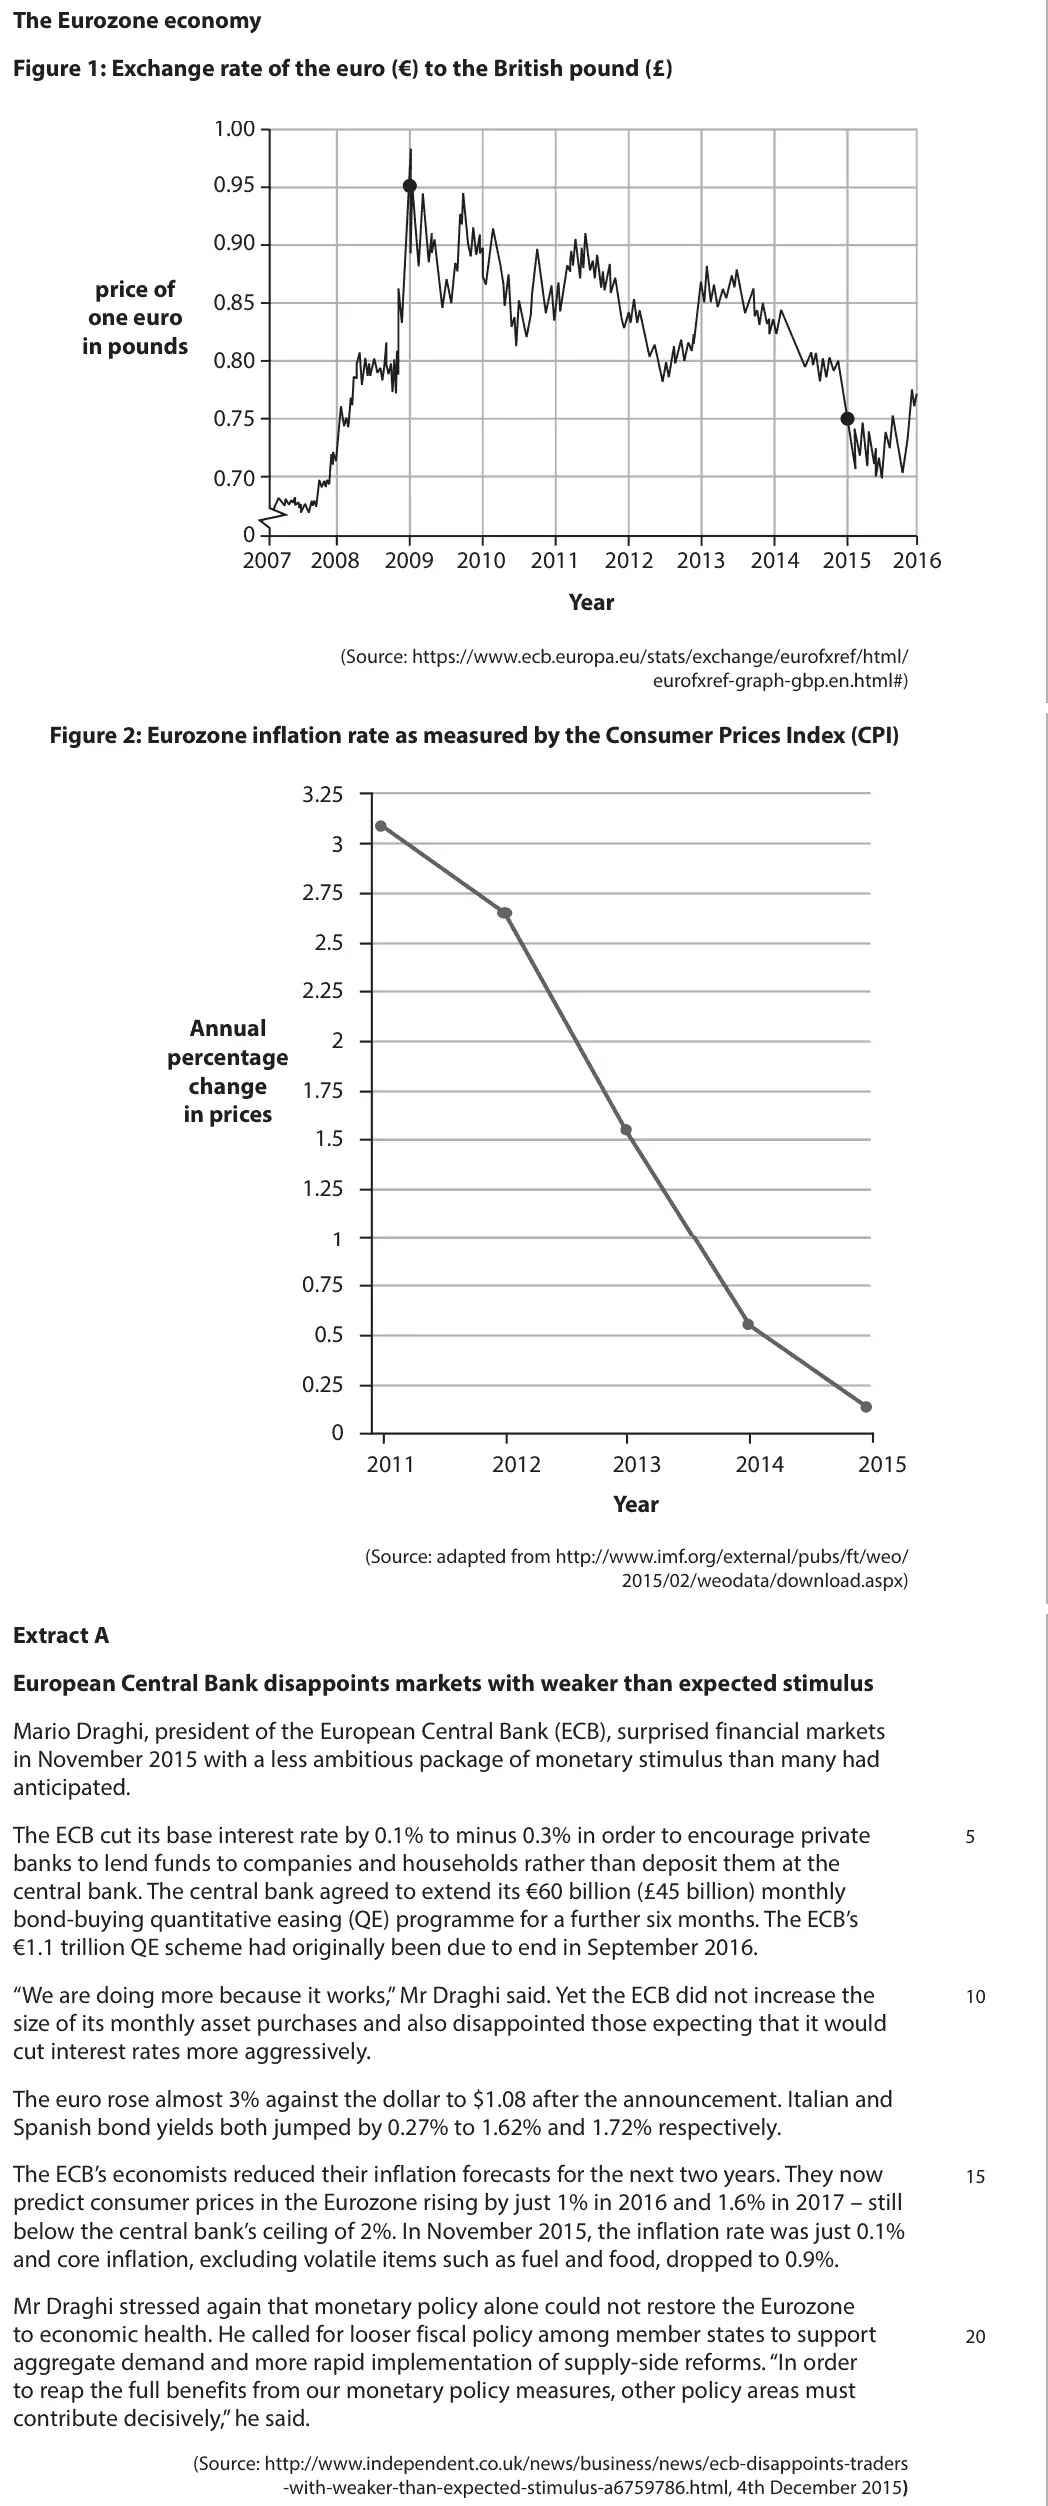
Data and extracts for question 6
Mark scheme
Examiner's comment
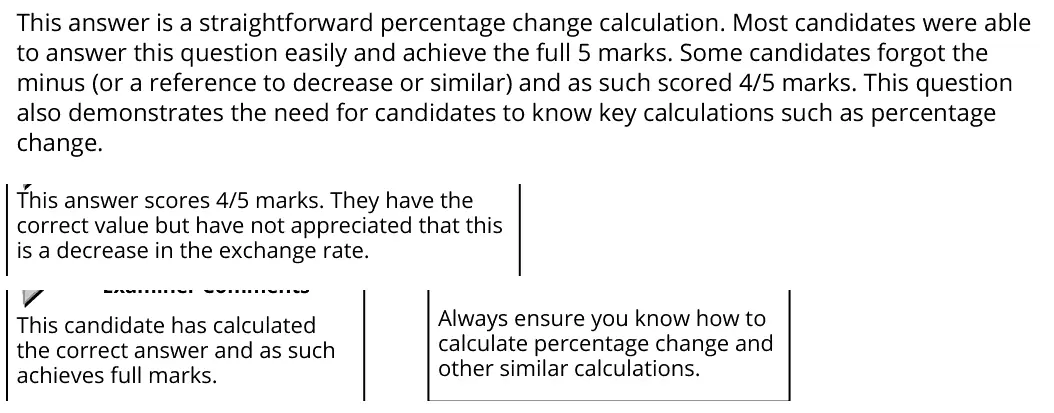
This answer is a straightforward percentage change calculation. Most candidates were able to answer this question easily and achieve the full 5 marks. Some candidates forgot the minus (or a reference to decrease or similar) and as such scored 4/5 marks. This question also demonstrates the need for candidates to know key calculations such as percentage change. This answer scores 4/5 marks. They have the correct value but have not appreciated that this is a decrease in the exchange rate. This candidate has calculated the correct answer and as such achieves full marks. Always ensure you know how to calculate percentage change and other similar calculations.
Notes from the mark scheme and report
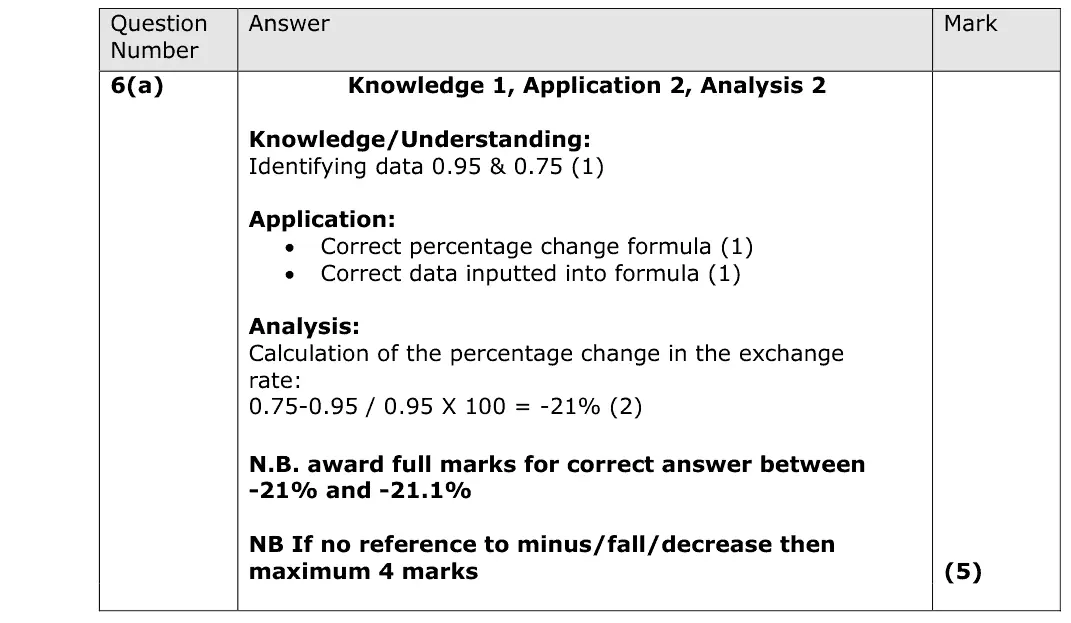
(0.75 - 0.95)/0.95 x 100 = -21% (accept -21 to -21.1)
no minus sign or reference to a fall = max 4
Quantitative skills: QS 2 (calculate, use and understand percentages, percentage changes and percentage point changes); QS 9 (interpret, apply and analyse information in written, graphical tabular and numerical forms)
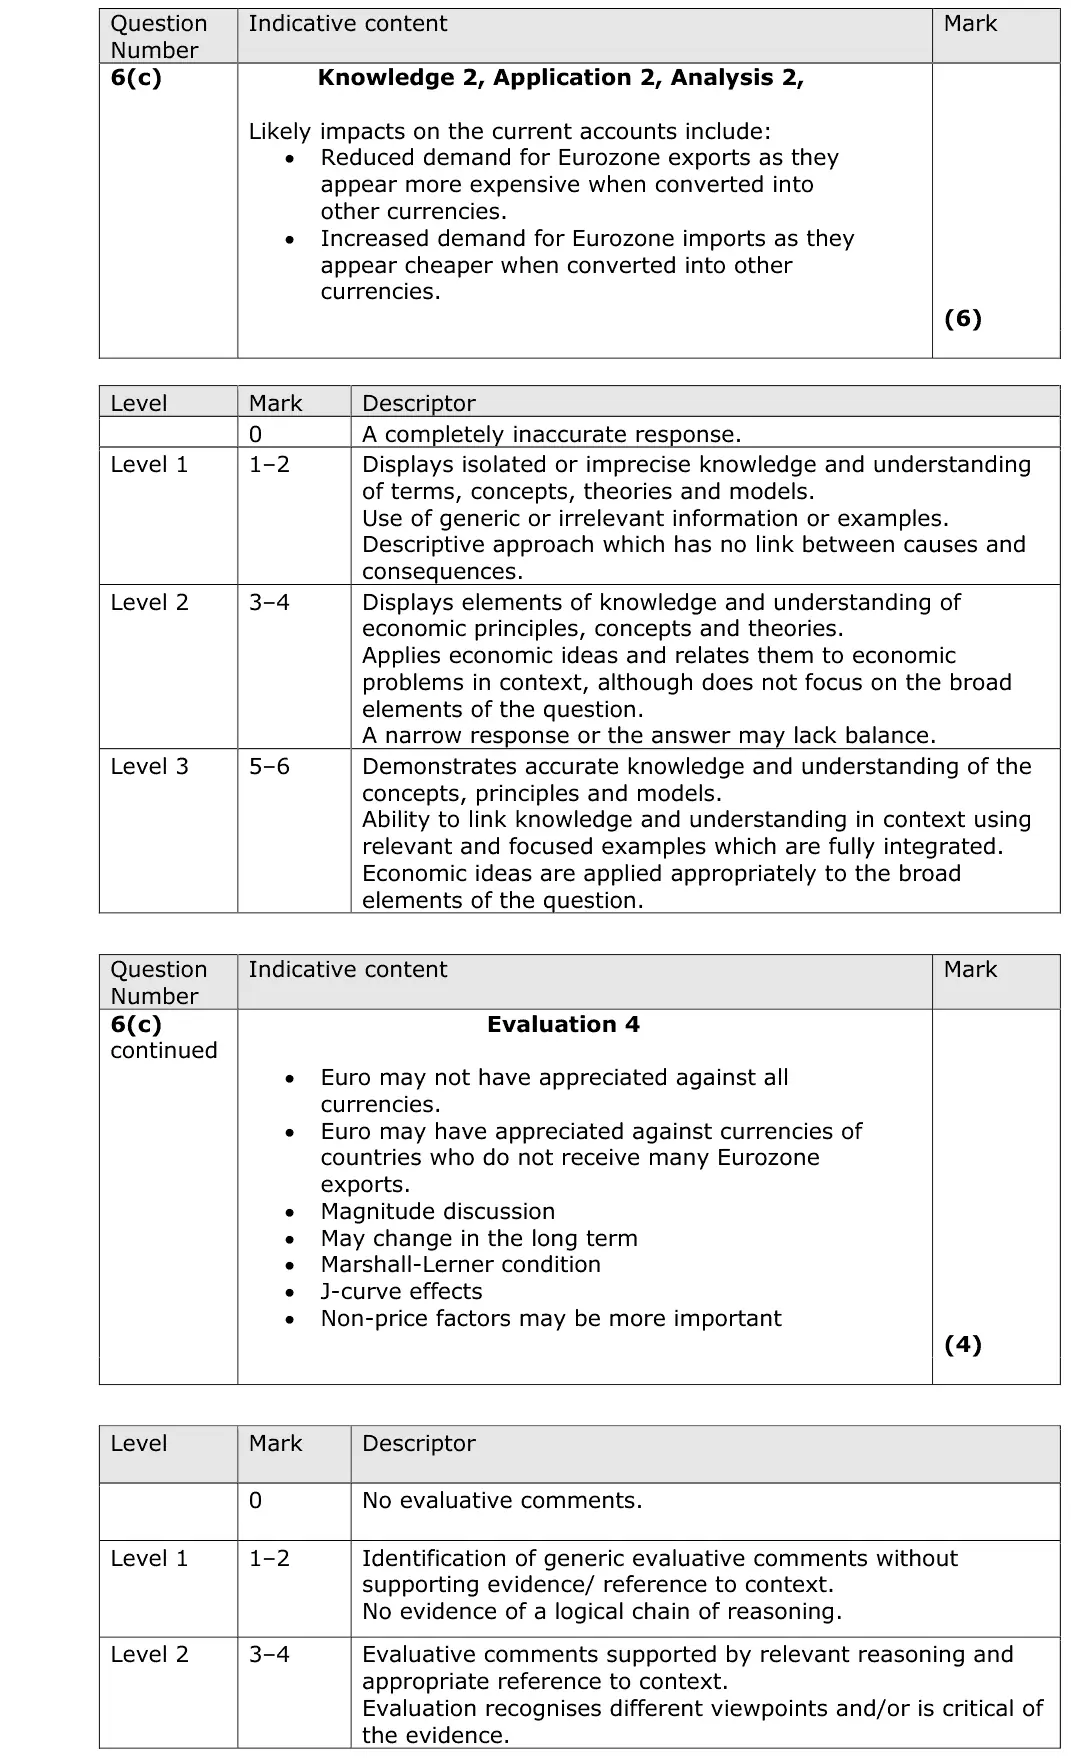
June 2017 · Paper 2 · Q6(c)10 marksAO1=2, AO2=2, AO3=2, AO4=410-mark response
Data and extracts for question 6
Mark scheme, including the levels grid and indicative content
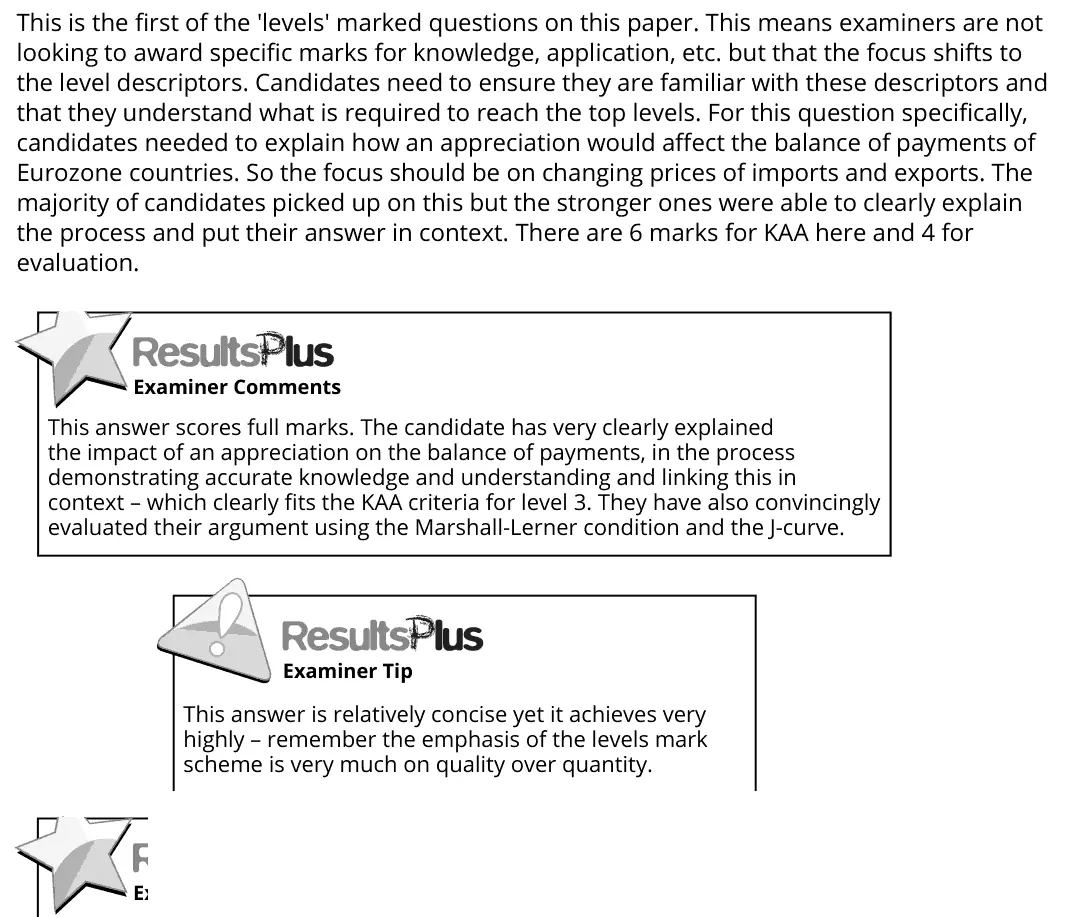
Examiner's comment
This is the first of the 'levels' marked questions on this paper. This means examiners are not looking to award specific marks for knowledge, application, etc. but that the focus shifts to the level descriptors. Candidates need to ensure they are familiar with these descriptors and that they understand what is required to reach the top levels. For this question specifically, candidates needed to explain how an appreciation would affect the balance of payments of Eurozone countries. So the focus should be on changing prices of imports and exports. The majority of candidates picked up on this but the stronger ones were able to clearly explain the process and put their answer in context. There are 6 marks for KAA here and 4 for evaluation. This answer scores full marks. The candidate has very clearly explained the impact of an appreciation on the balance of payments, in the process demonstrating accurate knowledge and understanding and linking this in context – which clearly fits the KAA criteria for level 3. They have also convincingly evaluated their argument using the Marshall-Lerner condition and the J-curve. This answer is relatively concise yet it achieves very highly – remember the emphasis of the levels mark scheme is very much on quality over quantity.
Notes from the mark scheme and report
appreciation makes exports dearer and imports cheaper so the current account worsens
evaluate with the Marshall-Lerner condition, J-curve, price elasticities, non-price factors and which currencies it rose against
June 2017 · Paper 3 · Q1(a)5 marksAO1=2, AO2=2, AO3=1Short answer
Data and extracts for question 1
Mark scheme
Examiner's comment
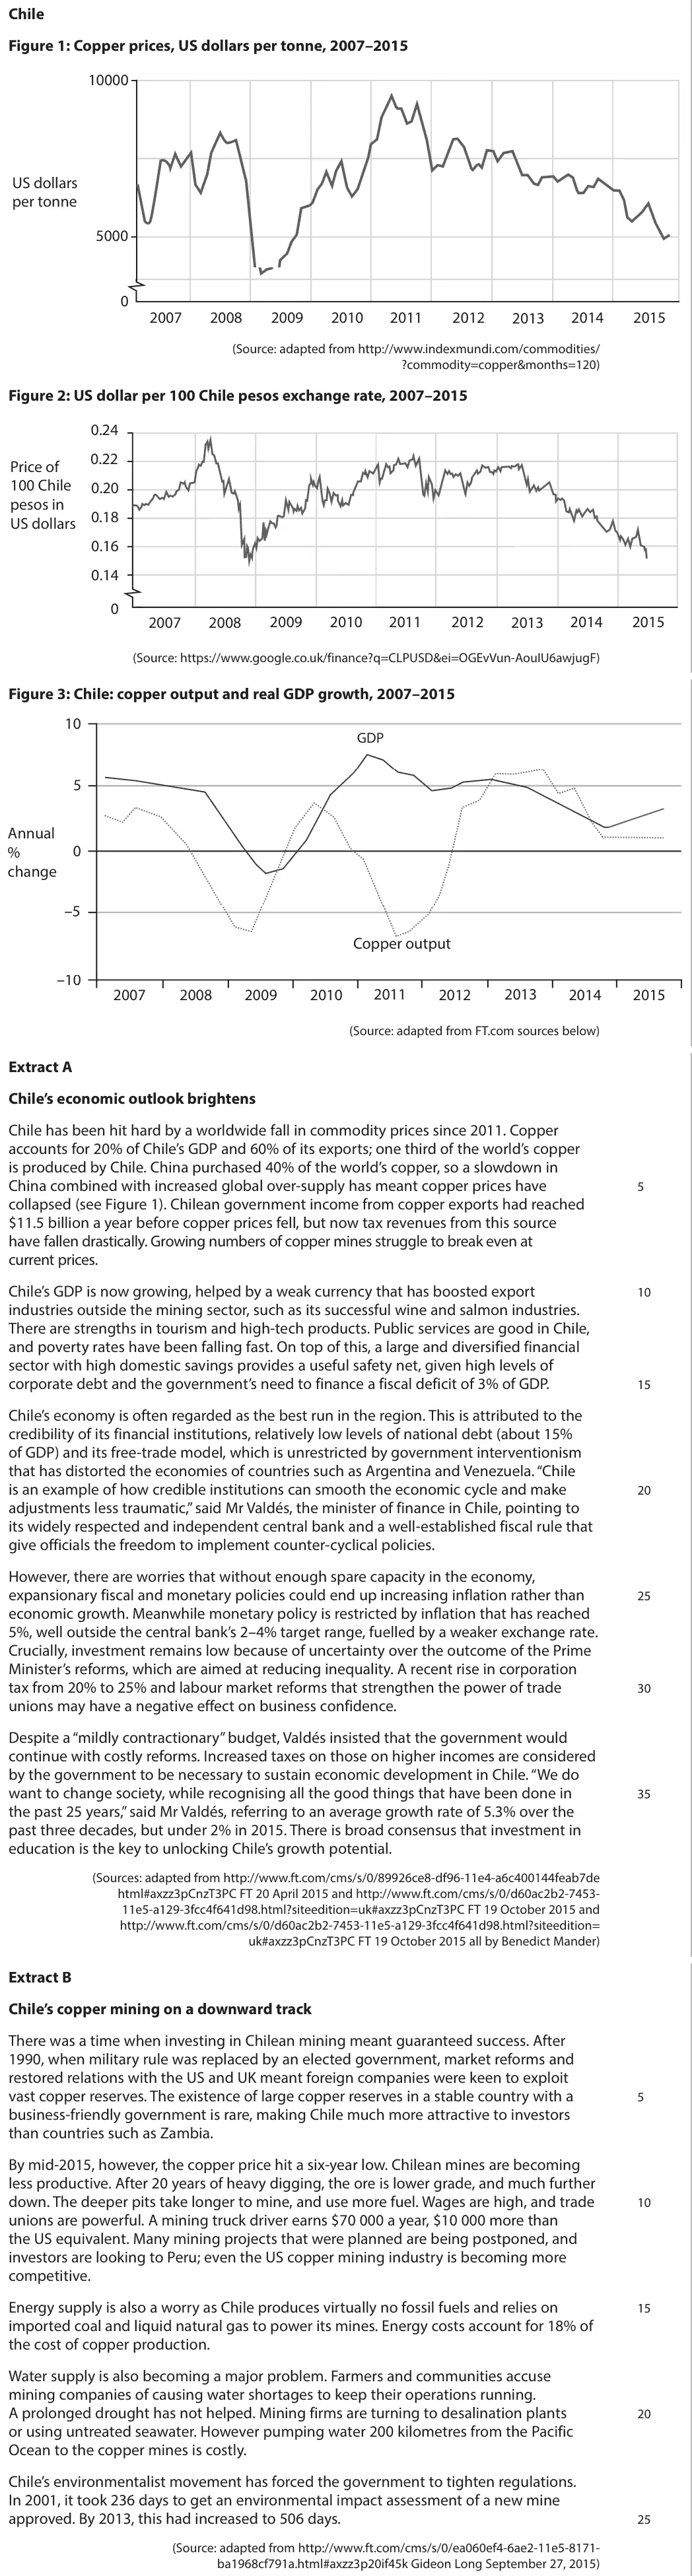
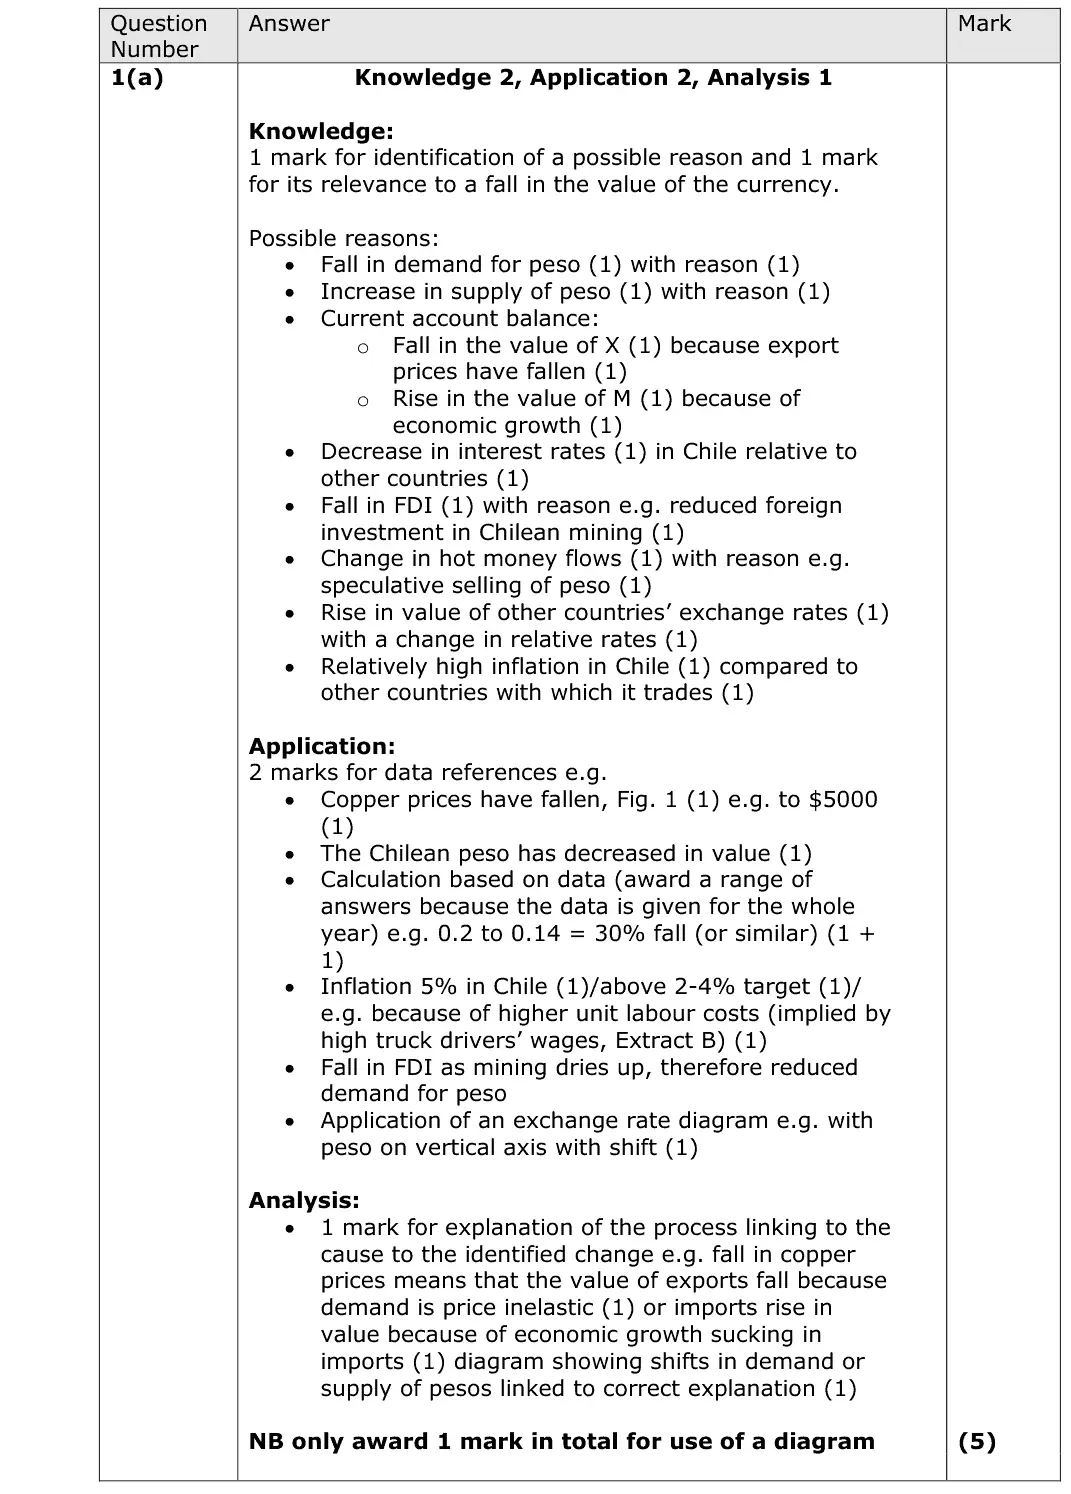
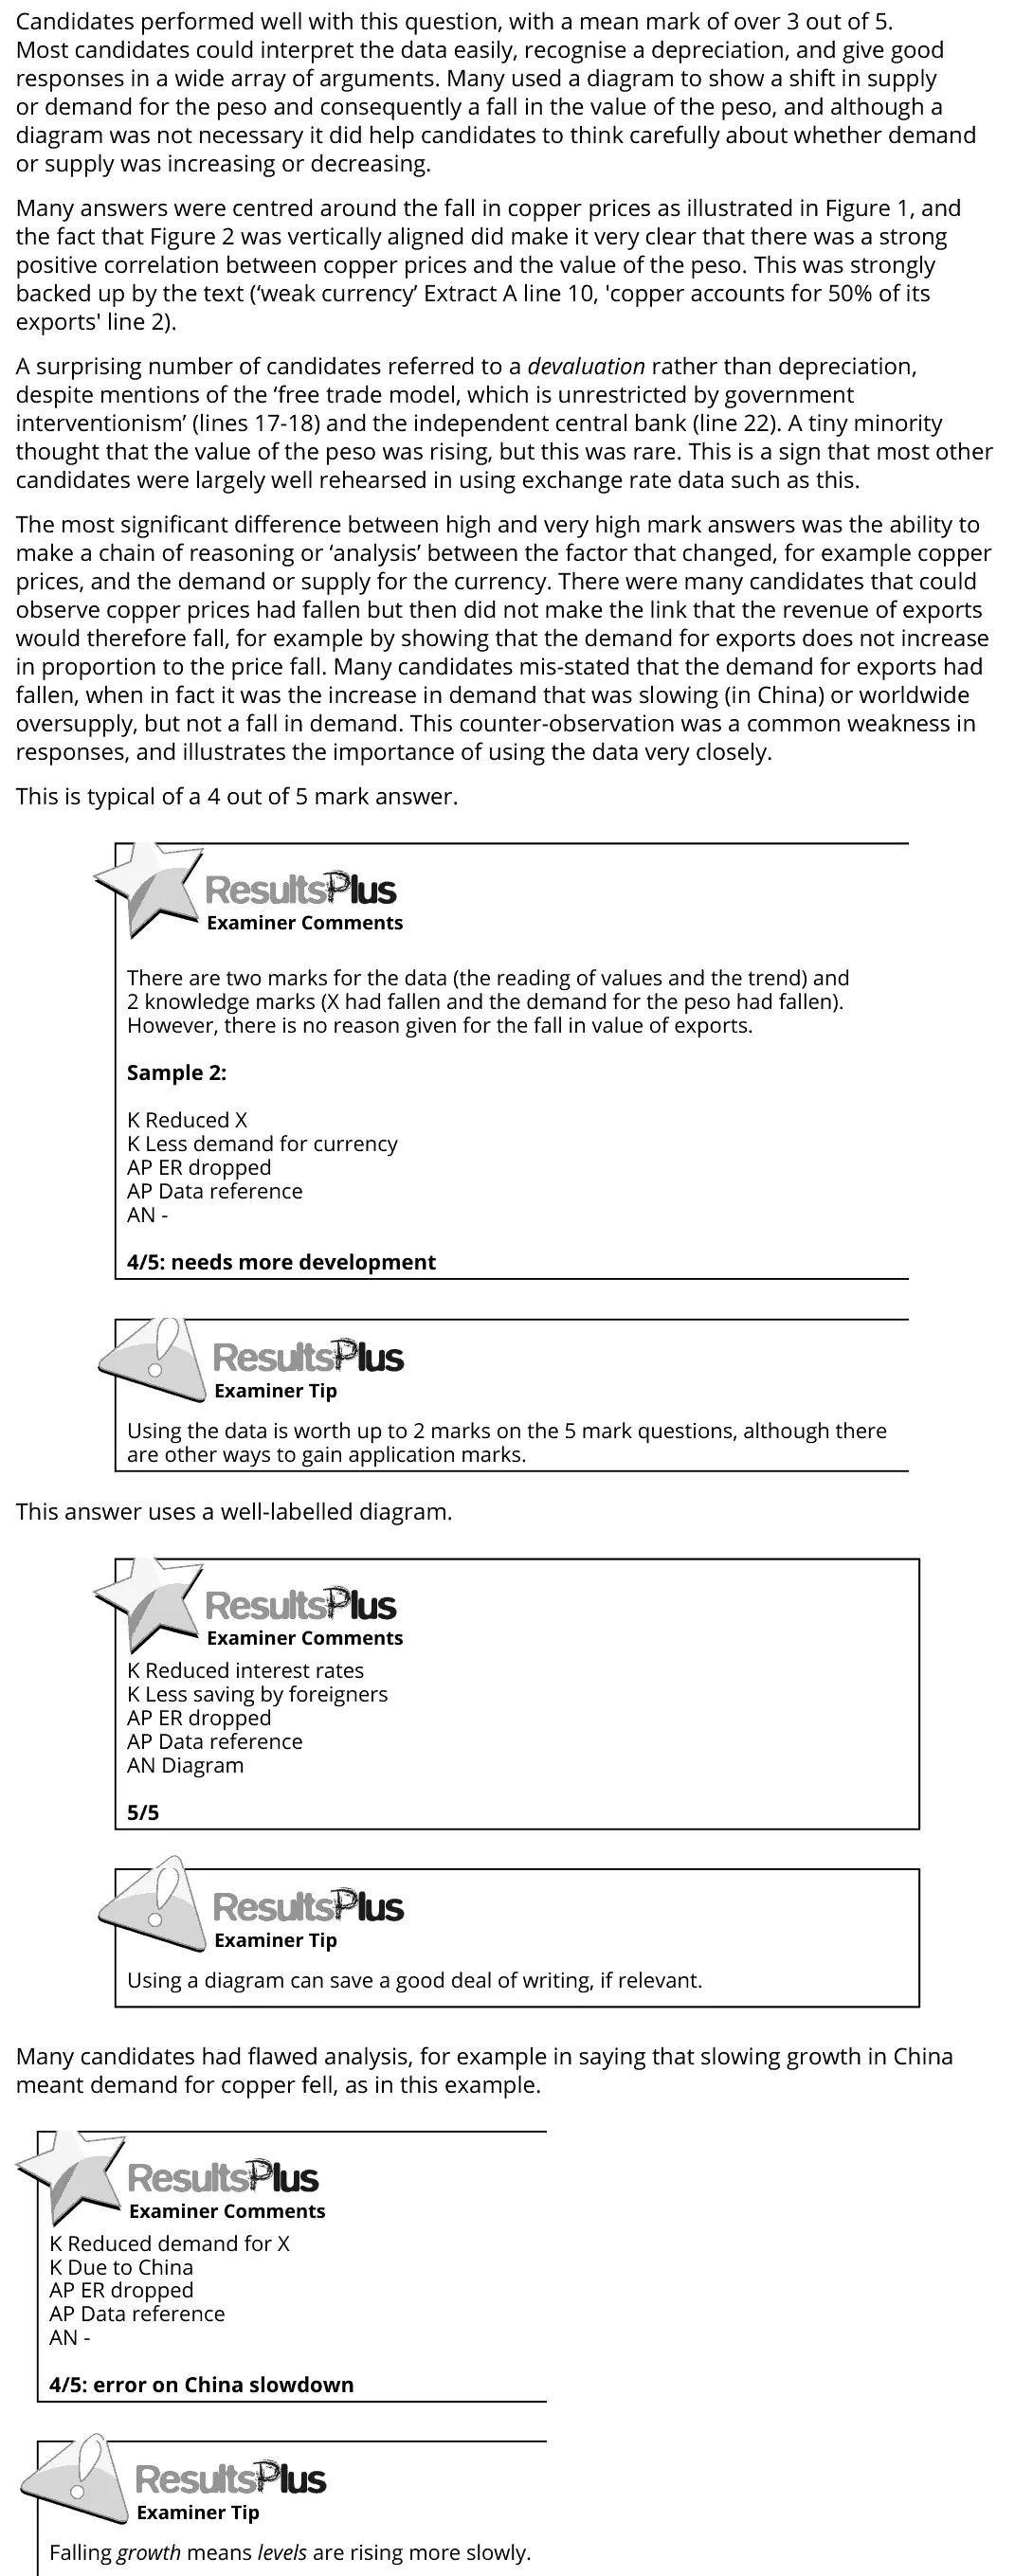
Candidates performed well with this question, with a mean mark of over 3 out of 5. Most candidates could interpret the data easily, recognise a depreciation, and give good responses in a wide array of arguments. Many used a diagram to show a shift in supply or demand for the peso and consequently a fall in the value of the peso, and although a diagram was not necessary it did help candidates to think carefully about whether demand or supply was increasing or decreasing. Many answers were centred around the fall in copper prices as illustrated in Figure 1, and the fact that Figure 2 was vertically aligned did make it very clear that there was a strong positive correlation between copper prices and the value of the peso. This was strongly backed up by the text (‘weak currency’ Extract A line 10, 'copper accounts for 50% of its exports' line 2). A surprising number of candidates referred to a devaluation rather than depreciation, despite mentions of the ‘free trade model, which is unrestricted by government interventionism’ (lines 17-18) and the independent central bank (line 22). A tiny minority thought that the value of the peso was rising, but this was rare. This is a sign that most other candidates were largely well rehearsed in using exchange rate data such as this. The most significant difference between high and very high mark answers was the ability to make a chain of reasoning or ‘analysis’ between the factor that changed, for example copper prices, and the demand or supply for the currency. There were many candidates that could observe copper prices had fallen but then did not make the link that the revenue of exports would therefore fall, for example by showing that the demand for exports does not increase in proportion to the price fall. Many candidates mis-stated that the demand for exports had fallen, when in fact it was the increase in demand that was slowing (in China) or worldwide oversupply, but not a fall in demand. This counter-observation was a common weakness in responses, and illustrates the importance of using the data very closely. This is typical of a 4 out of 5 mark answer. This answer uses a well-labelled diagram. There are two marks for the data (the reading of values and the trend) and 2 knowledge marks (X had fallen and the demand for the peso had fallen). However, there is no reason given for the fall in value of exports. Sample 2: K Reduced X K Less demand for currency AP ER dropped AP Data reference AN - 4/5: needs more development Using the data is worth up to 2 marks on the 5 mark questions, although there are other ways to gain application marks. Many candidates had flawed analysis, for example in saying that slowing growth in China meant demand for copper fell, as in this example. K Reduced interest rates K Less saving by foreigners AP ER dropped AP Data reference AN Diagram 5/5 Using a diagram can save a good deal of writing, if relevant. K Reduced demand for X K Due to China AP ER dropped AP Data reference AN - 4/5: error on China slowdown Falling growth means levels are rising more slowly.
Notes from the mark scheme and report
it is a depreciation (floating peso), not a devaluation
link the fall in copper prices (Fig 1) to lower export earnings and lower demand for pesos
quote the fall e.g. 0.20 to 0.14 (about 30%)
only 1 mark in total for a diagram
Quantitative skills: QS 9 (interpret, apply and analyse information in written, graphical tabular and numerical forms)
Work with an Edexcel economics tutor
Essays stuck in Level 2, or losing the easy marks in Section A? Book a trial session with Lianne, a former Edexcel examiner.