Notes and key-term cards for this topic are being written by our tutors. The past-paper questions below are ready now.
Specification statements
2.5.1Causes of growth: a) Factors which could cause economic growth b) The distinction between actual and potential growth c) The importance of international trade for (export-led) economic growthAS
2.5.2Output gaps: a) Distinction between actual growth rates and long-term trends in growth rates b) Understanding of positive and negative output gaps and the difficulties of measurement c) Use of an AD/AS diagram to illustrate an output gap (level of spare capacity) in an economyAS
2.5.3Trade (business) cycle: a) Understanding of the trade (business) cycle b) Characteristics of a boom c) Characteristics of a recessionAS
2.5.4The impact of economic growth: a) The benefits and costs of economic growth and the impact on: • consumers • firms • the government • current and future living standardsAS
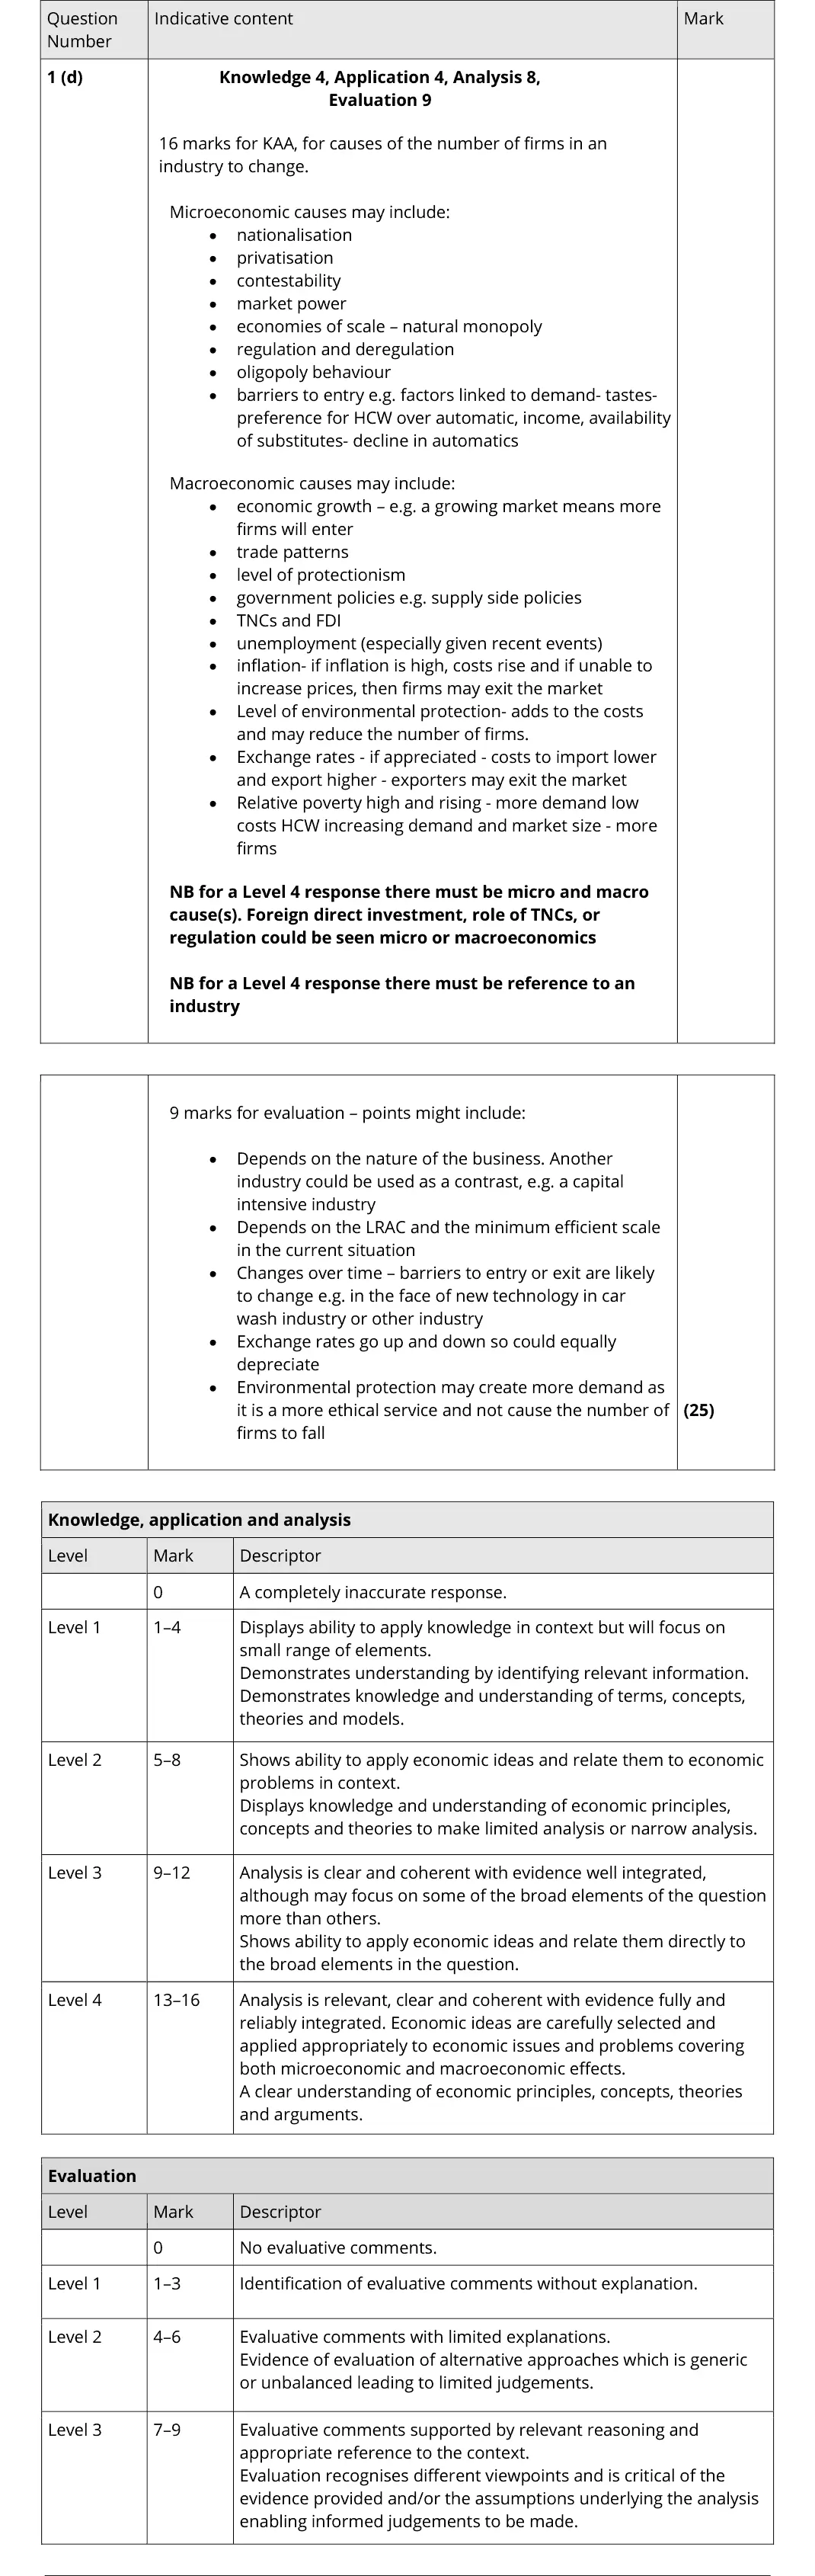
Evaluate the microeconomic and macroeconomic factors which determine the number of firms in an industry. Refer to HCWs or another industry of your choice.
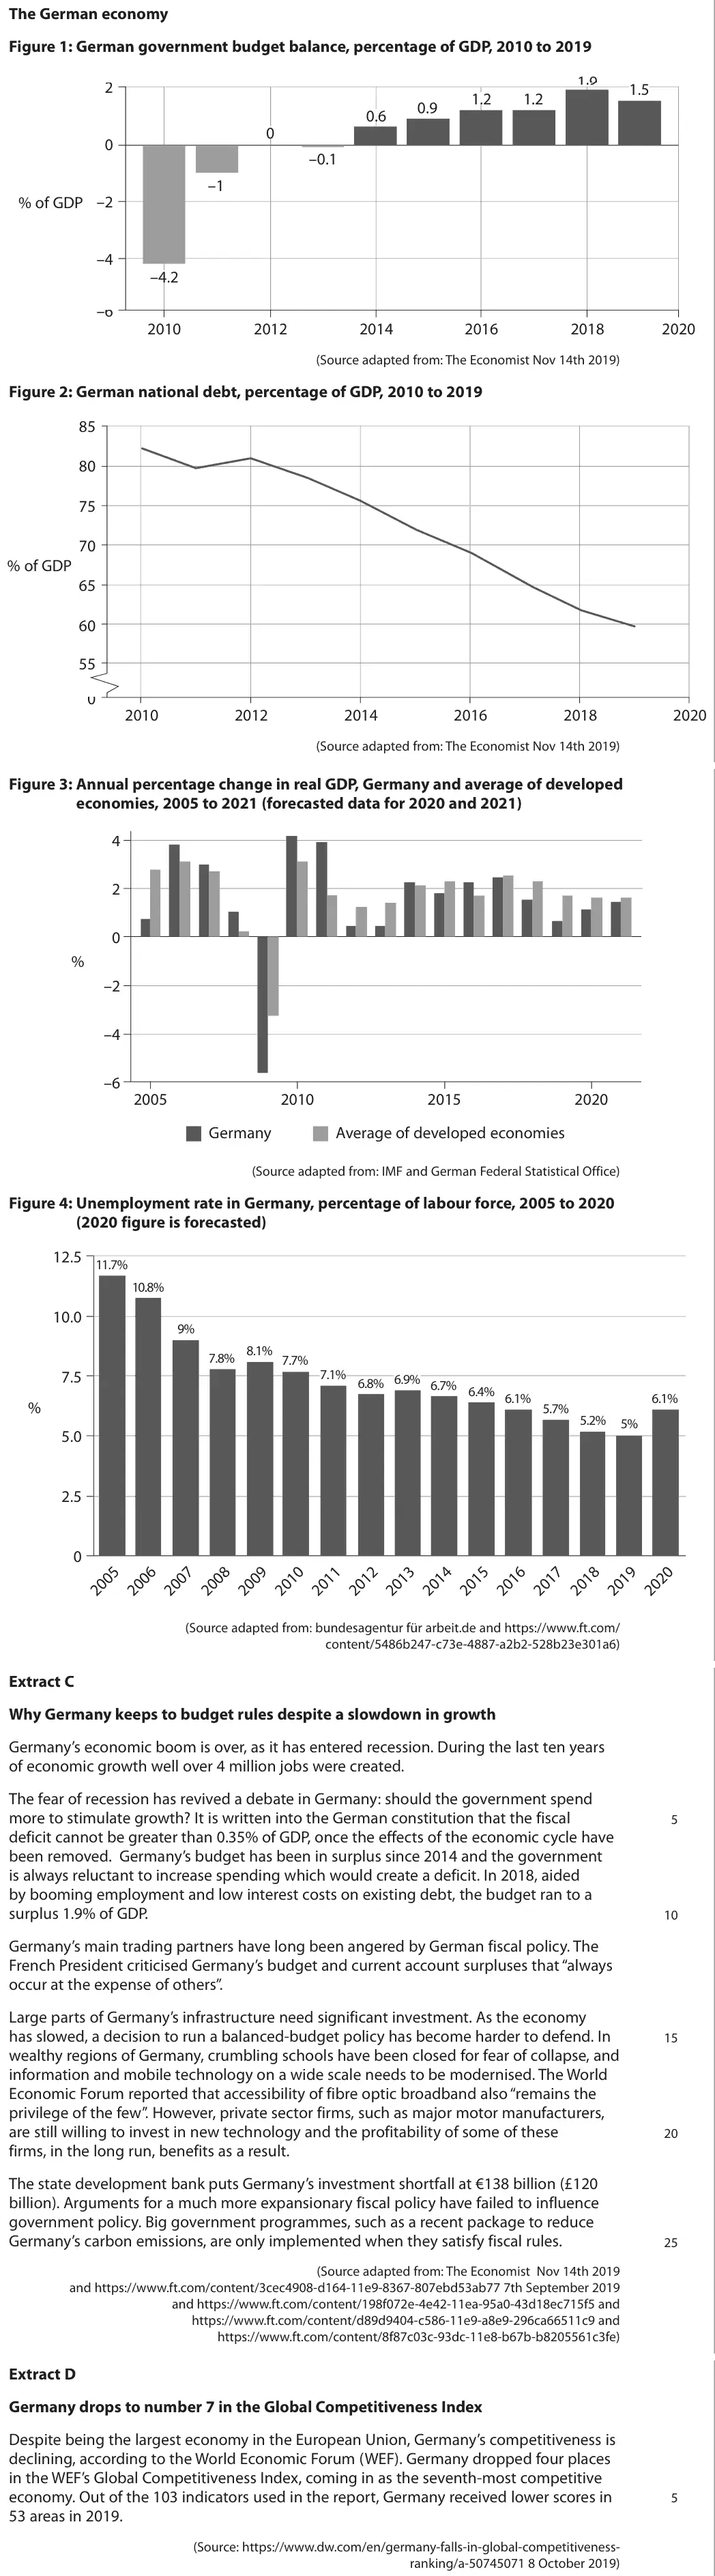
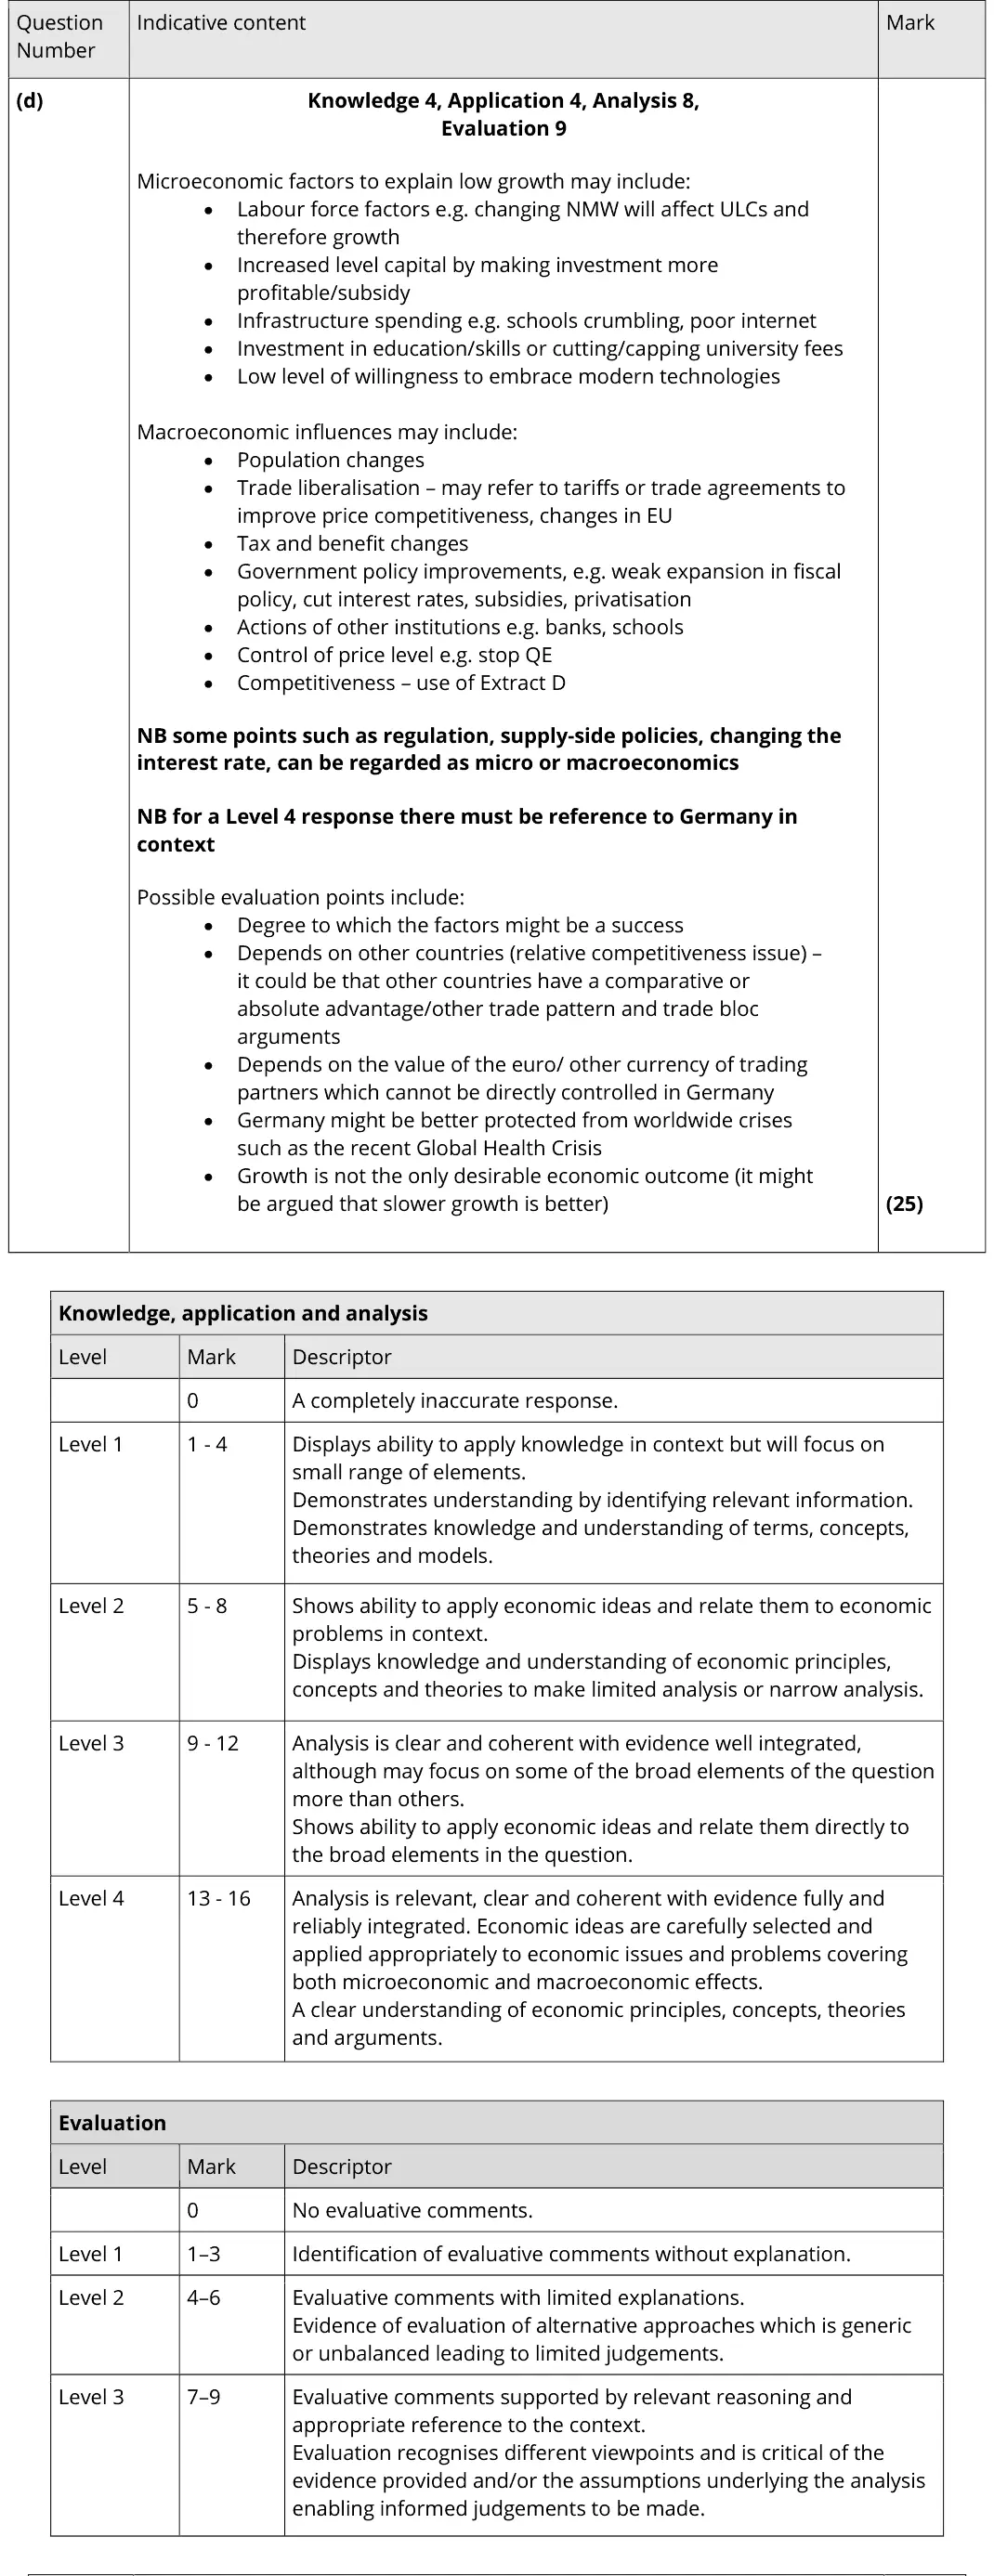
Evaluate the microeconomic and macroeconomic factors which are likely to determine the rate of economic growth in Germany relative to other developed economies.
Tap a question to zoom it. The data and extracts fold out above each question; the mark scheme and examiner's comment open underneath.
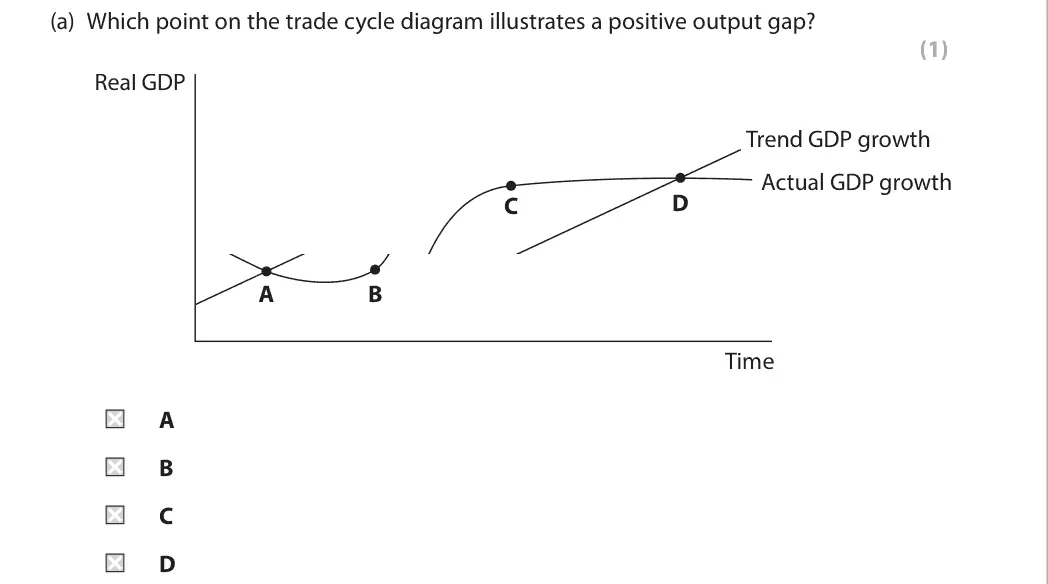
June 2025 · AS Paper 2 · Q3(a)1 markMultiple choice
Data and extracts for question 3
Answer
C
Mark scheme
Notes from the mark scheme and report
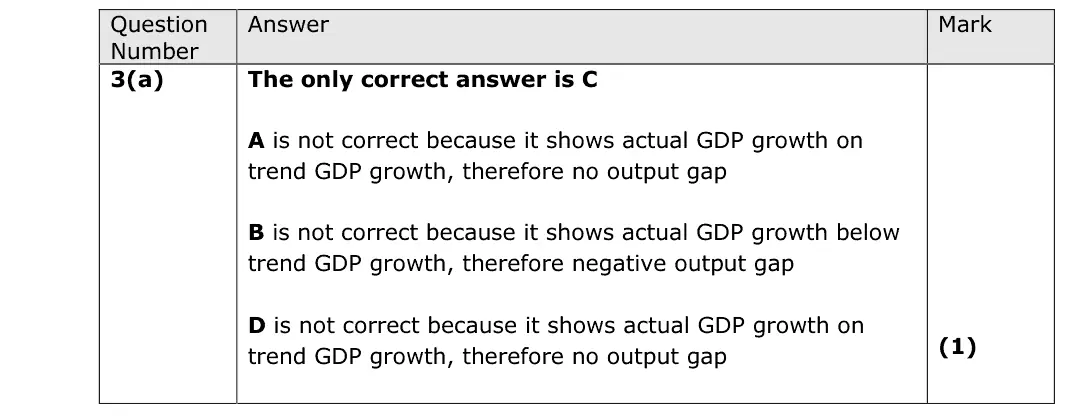
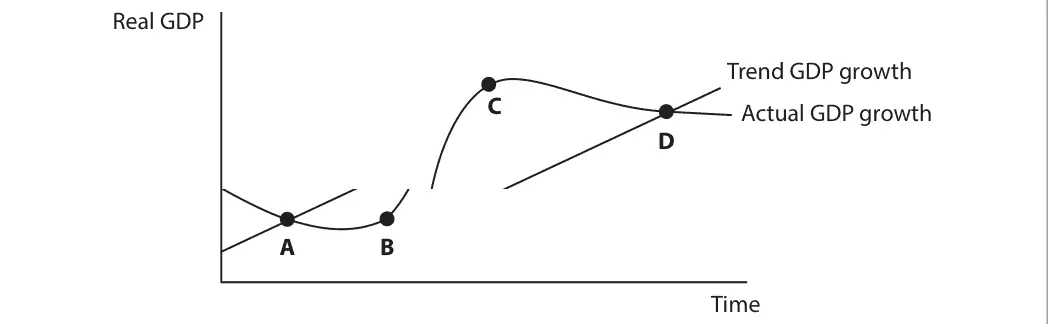
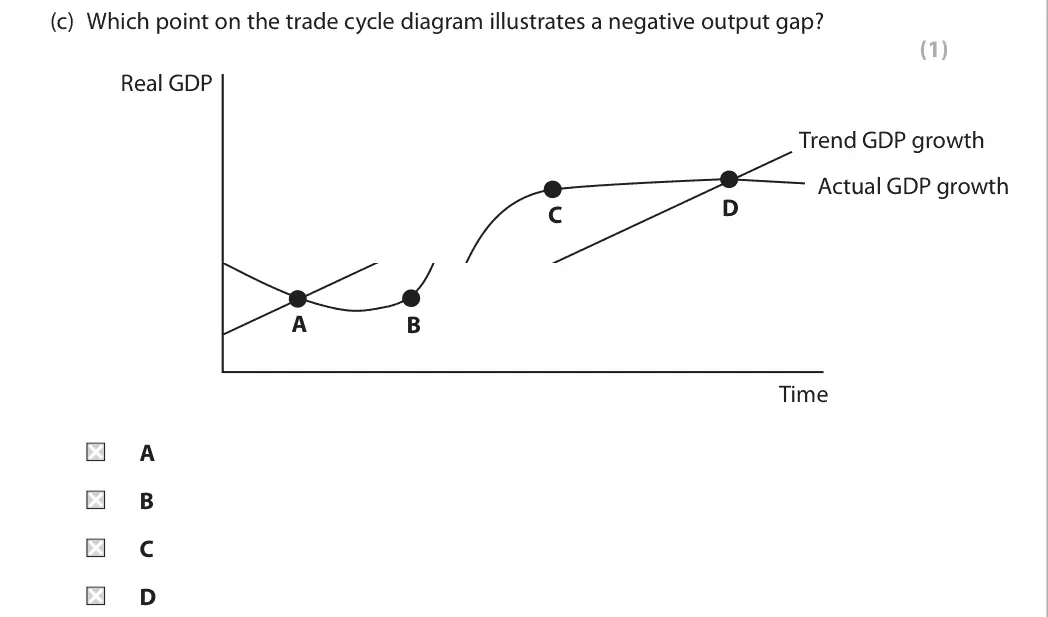
C is where actual GDP is above trend GDP = positive output gap
A and D are on trend (no gap), B is below trend (negative gap)
Quantitative skills: QS 4 (construct and interpret a range of standard graphical forms)
June 2025 · AS Paper 2 · Q3(b)2 marksAO1=2Short answer
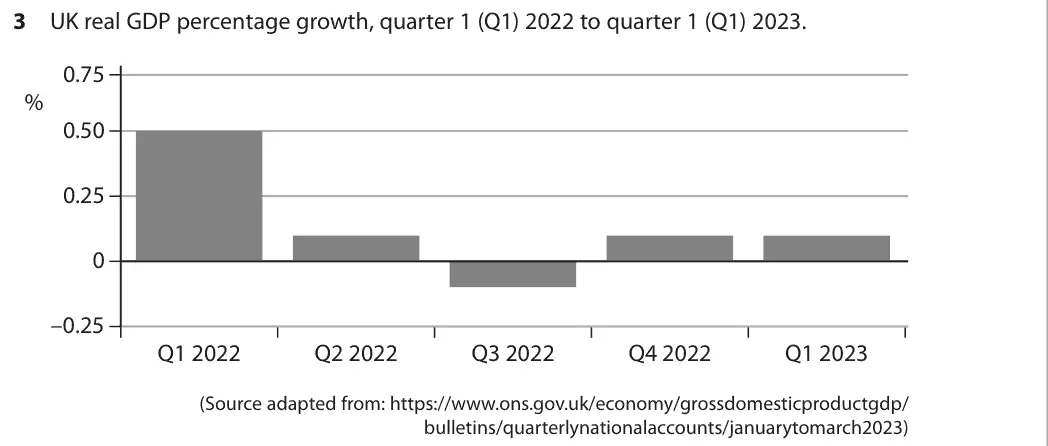
Data and extracts for question 3
Mark scheme
Examiner's comment
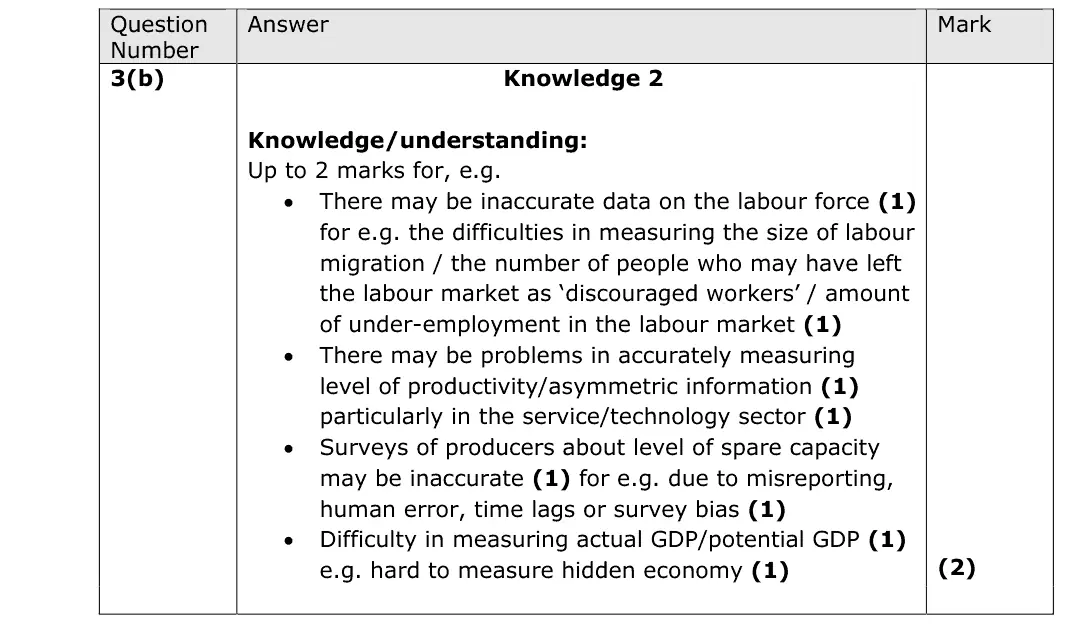
This question required candidates to explain one reason why it is difficult to measure the size of an output gap in an economy. Candidates were not able to answer this question relatively easily. They could identify a reason but often struggled to explain it.
Notes from the mark scheme and report
difficult to measure potential output: inaccurate labour force data (migration, discouraged workers, under-employment), productivity hard to measure, hidden economy, biased surveys of spare capacity
report: candidates "could identify a reason but often struggled to explain it"
June 2025 · Paper 2 · Q3(b)(i)2 marksAO1=1, AO3=1Short answer
Data and extracts for question 3
Mark scheme
Examiner's comment
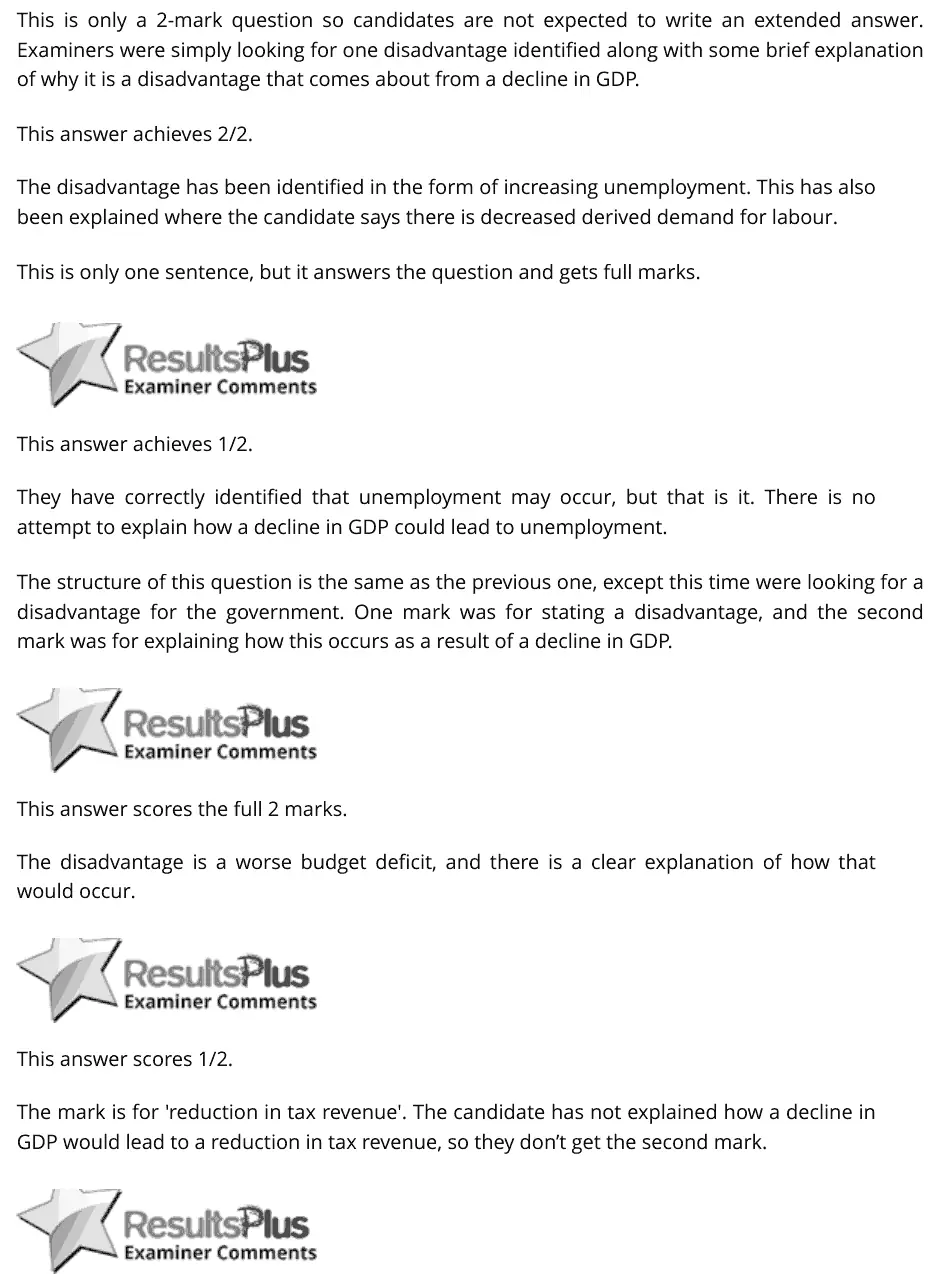
This is only a 2-mark question so candidates are not expected to write an extended answer. Examiners were simply looking for one disadvantage identified along with some brief explanation of why it is a disadvantage that comes about from a decline in GDP. This answer achieves 2/2. The disadvantage has been identified in the form of increasing unemployment. This has also been explained where the candidate says there is decreased derived demand for labour. This is only one sentence, but it answers the question and gets full marks. This answer achieves 1/2. They have correctly identified that unemployment may occur, but that is it. There is no attempt to explain how a decline in GDP could lead to unemployment. The structure of this question is the same as the previous one, except this time were looking for a disadvantage for the government. One mark was for stating a disadvantage, and the second mark was for explaining how this occurs as a result of a decline in GDP. This answer scores the full 2 marks. The disadvantage is a worse budget deficit, and there is a clear explanation of how that would occur. This answer scores 1/2. The mark is for 'reduction in tax revenue'. The candidate has not explained how a decline in GDP would lead to a reduction in tax revenue, so they don’t get the second mark.
Notes from the mark scheme and report
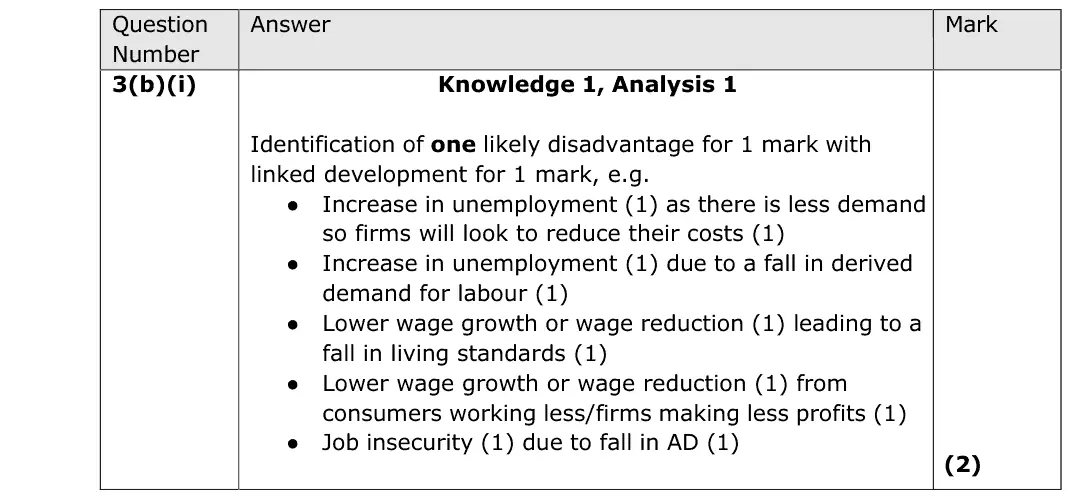
one disadvantage of falling GDP for workers with a linked development: higher unemployment as derived demand for labour falls, lower wage growth, job insecurity
June 2025 · Paper 2 · Q3(b)(ii)2 marksAO1=1, AO3=1Short answer
Data and extracts for question 3
Mark scheme
Examiner's comment
This is only a 2-mark question so candidates are not expected to write an extended answer. Examiners were simply looking for one disadvantage identified along with some brief explanation of why it is a disadvantage that comes about from a decline in GDP. This answer achieves 2/2. The disadvantage has been identified in the form of increasing unemployment. This has also been explained where the candidate says there is decreased derived demand for labour. This is only one sentence, but it answers the question and gets full marks. This answer achieves 1/2. They have correctly identified that unemployment may occur, but that is it. There is no attempt to explain how a decline in GDP could lead to unemployment. The structure of this question is the same as the previous one, except this time were looking for a disadvantage for the government. One mark was for stating a disadvantage, and the second mark was for explaining how this occurs as a result of a decline in GDP. This answer scores the full 2 marks. The disadvantage is a worse budget deficit, and there is a clear explanation of how that would occur. This answer scores 1/2. The mark is for 'reduction in tax revenue'. The candidate has not explained how a decline in GDP would lead to a reduction in tax revenue, so they don’t get the second mark.
Notes from the mark scheme and report
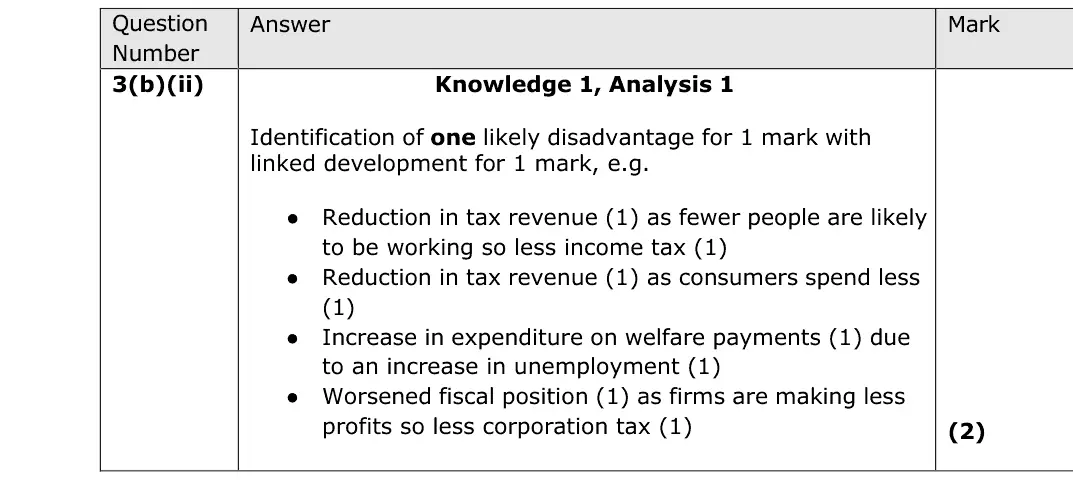
one disadvantage for government: lower tax revenue (income tax, VAT, corporation tax) or higher welfare spending as unemployment rises, worsening the fiscal position
June 2025 · AS Paper 2 · Q3(c)1 markAO1=1Definition
Data and extracts for question 3
Mark scheme
Examiner's comment
This question required a precise definition of trade cycle. It is important that candidates are clear in their answers. Candidates could access marks through a range of approaches. Most of them were able to get the mark.
Notes from the mark scheme and report
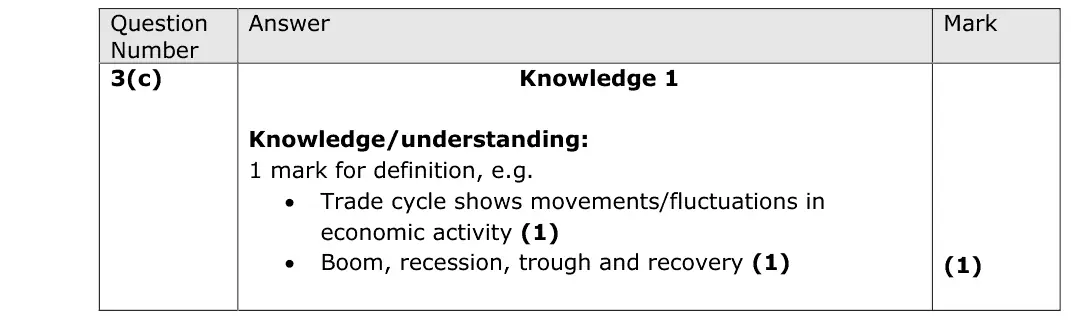
fluctuations in economic activity (real GDP) around the trend: boom, recession, trough, recovery
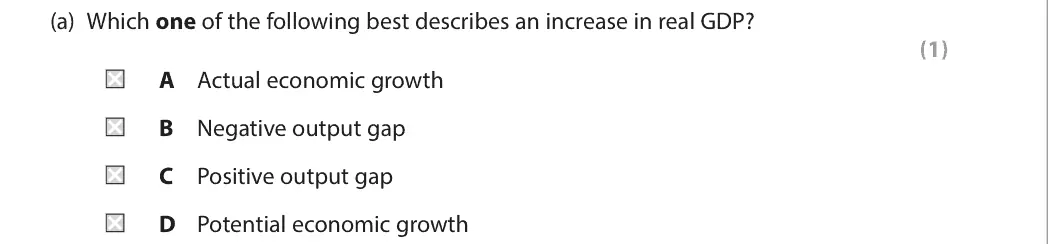
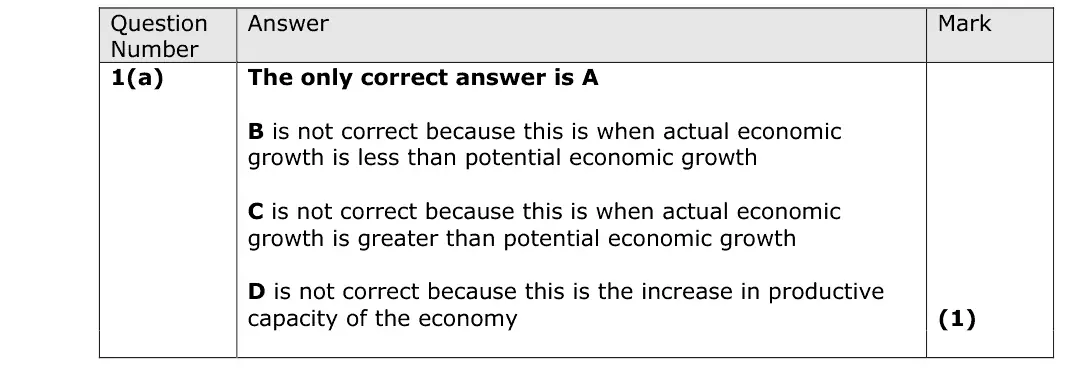
June 2024 · AS Paper 2 · Q1(a)1 markMultiple choice
Data and extracts for question 1
Answer
A
Mark scheme
Notes from the mark scheme and report
a rise in real GDP is actual economic growth (A)
B and C are output gaps (actual below or above potential)
D potential growth is a rise in productive capacity
June 2024 · Paper 2 · Q4(a)1 markMultiple choice
Data and extracts for question 4
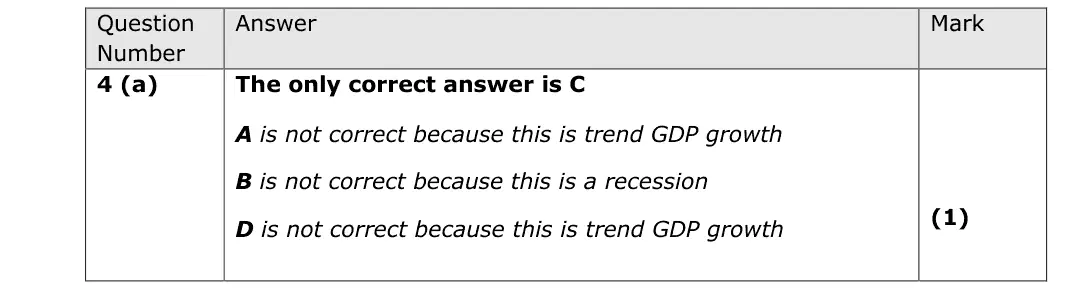
Answer
C
Mark scheme
Notes from the mark scheme and report
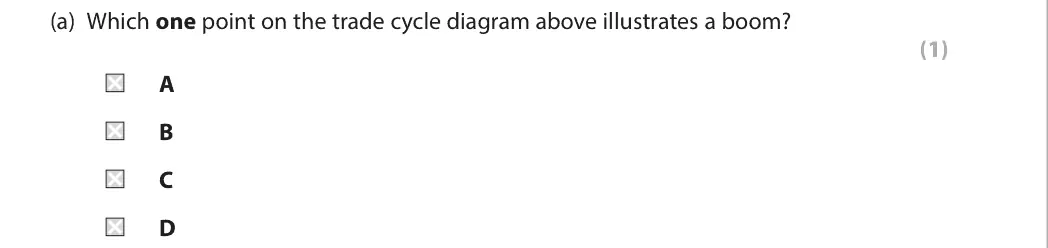
a boom is where actual GDP is furthest above trend (C)
A and D lie on the trend line
B is a recession below trend
Quantitative skills: QS 4 (construct and interpret a range of standard graphical forms)
June 2024 · AS Paper 2 · Q6(c)6 marksAO1=2, AO2=2, AO3=2Short answer
Data and extracts for question 6
Mark scheme
Examiner's comment
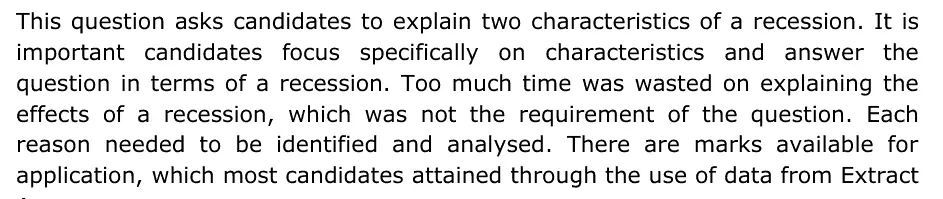
This question asks candidates to explain two characteristics of a recession. It is important candidates focus specifically on characteristics and answer the question in terms of a recession. Too much time was wasted on explaining the effects of a recession, which was not the requirement of the question. Each reason needed to be identified and analysed. There are marks available for application, which most candidates attained through the use of data from Extract A.
Notes from the mark scheme and report
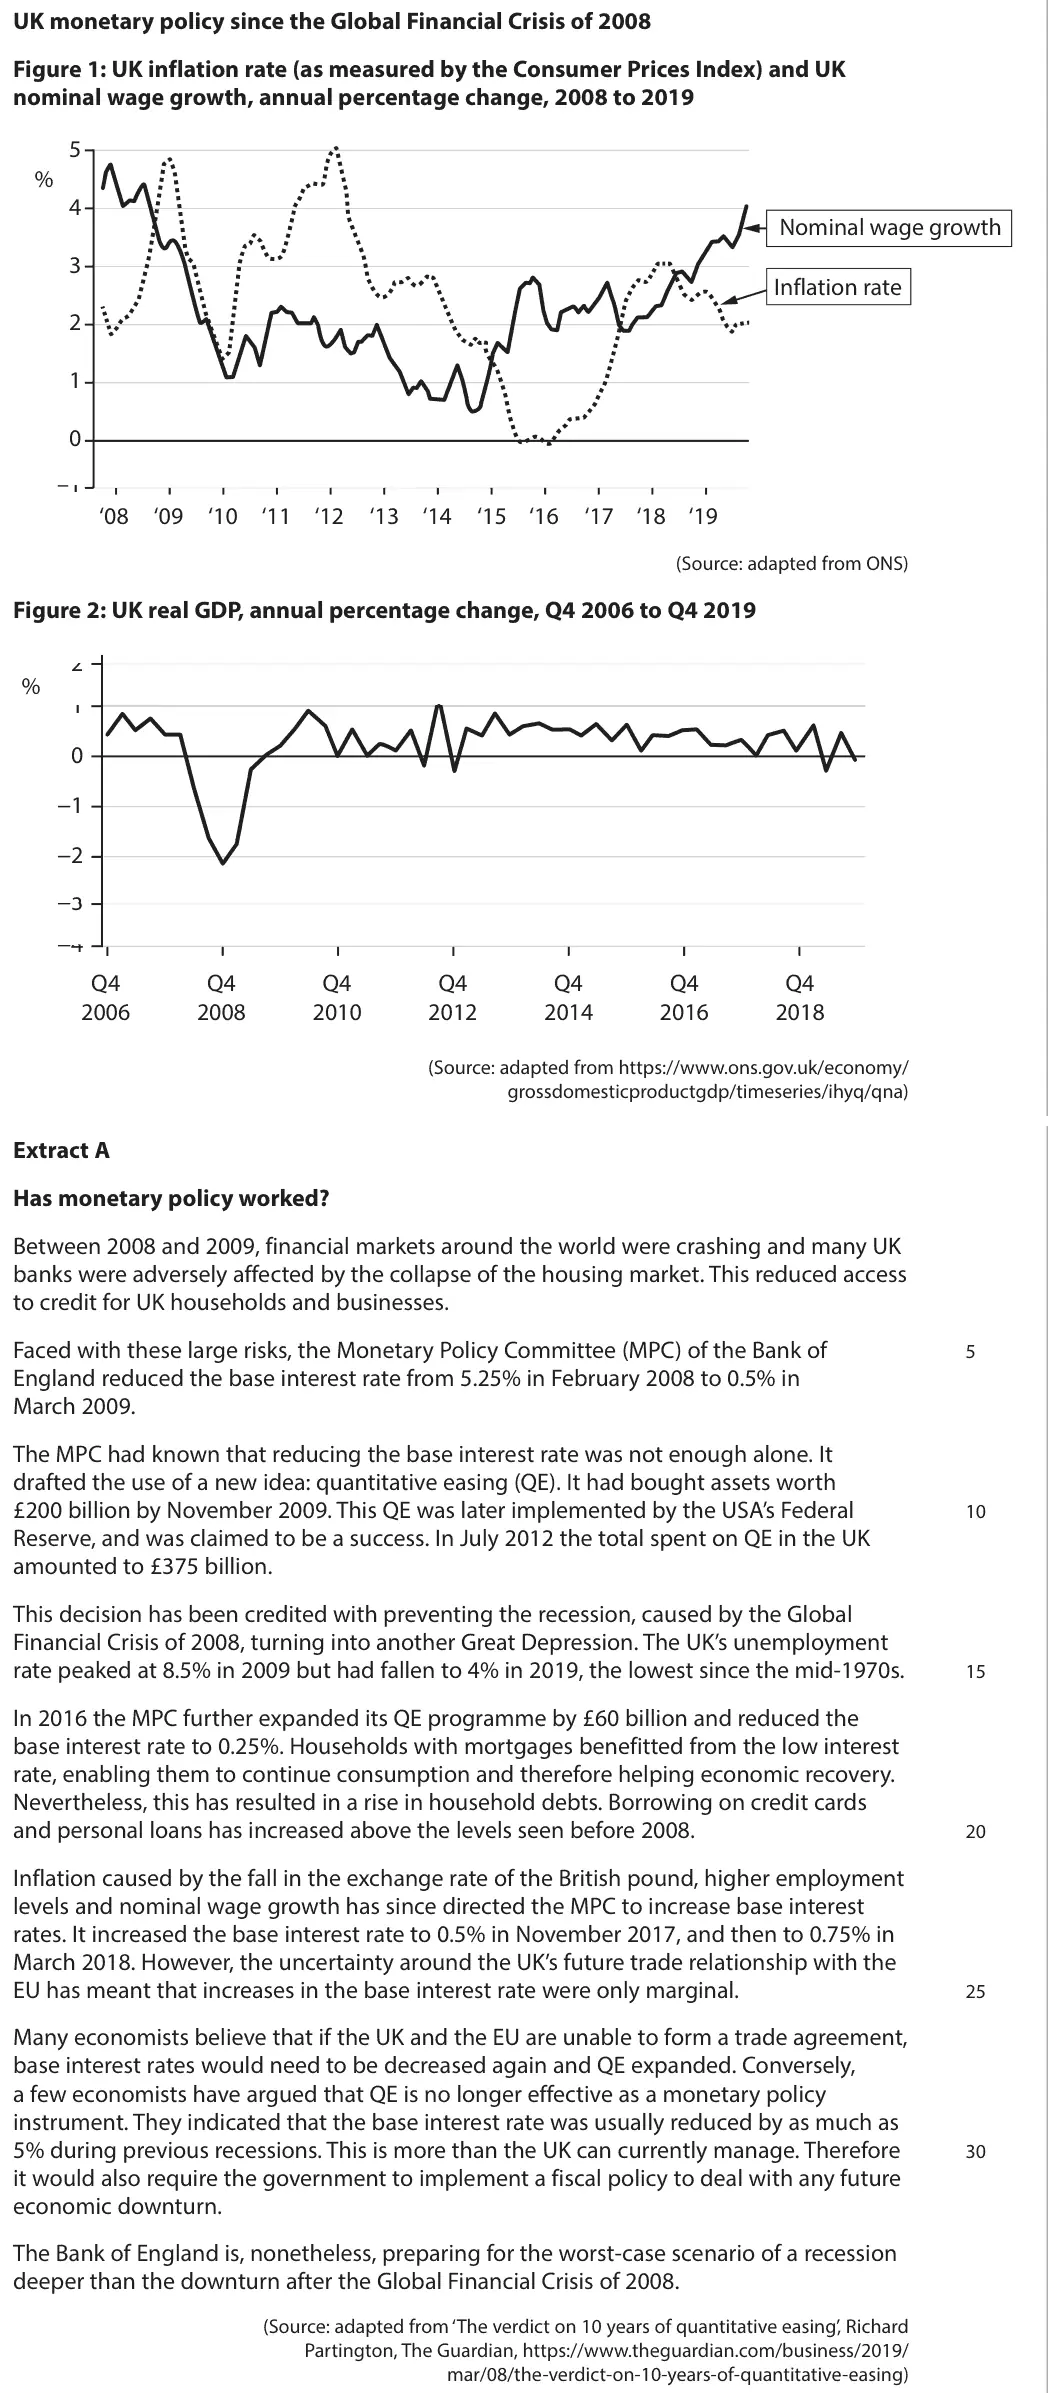
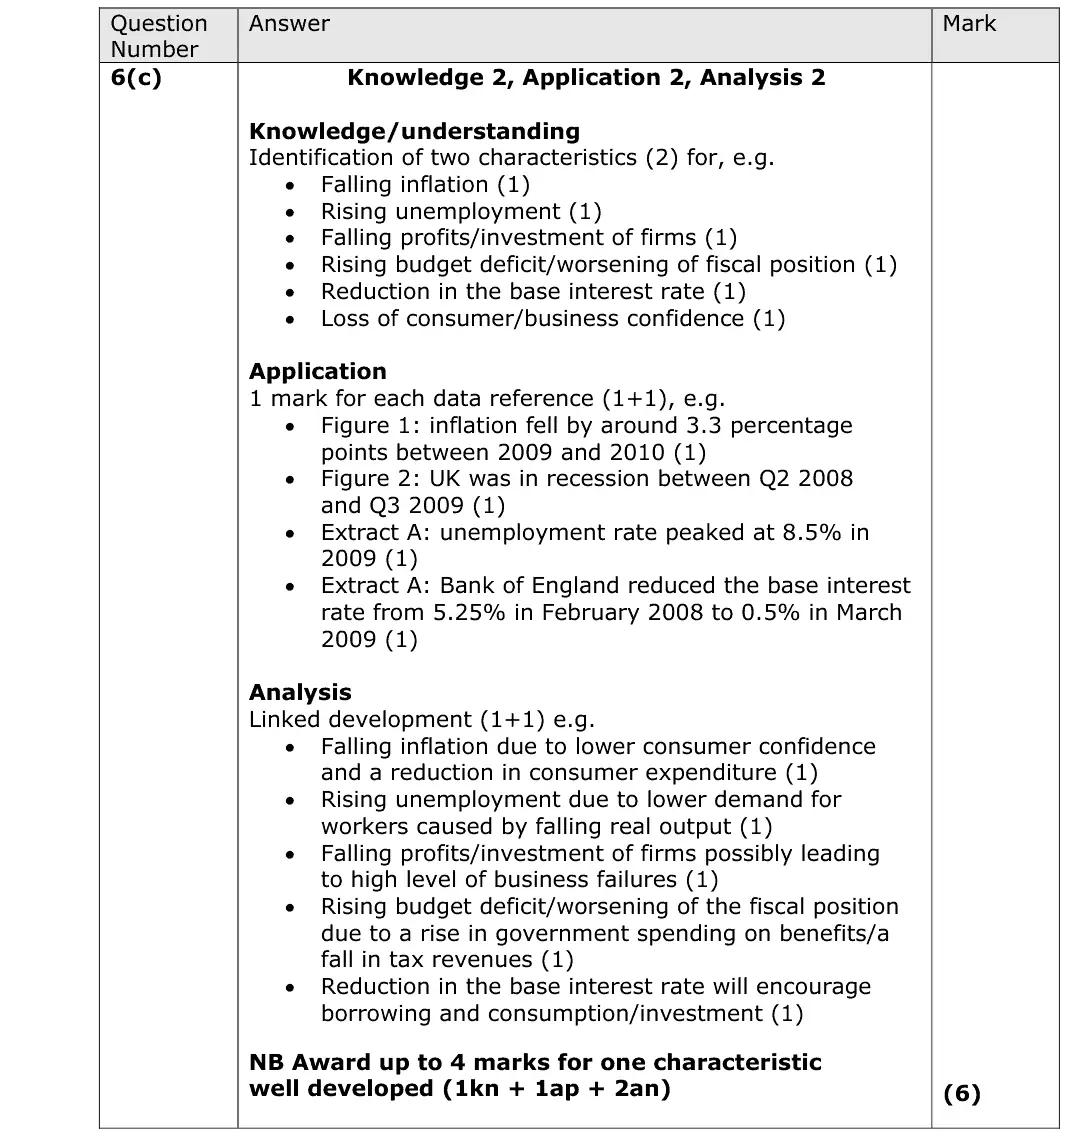
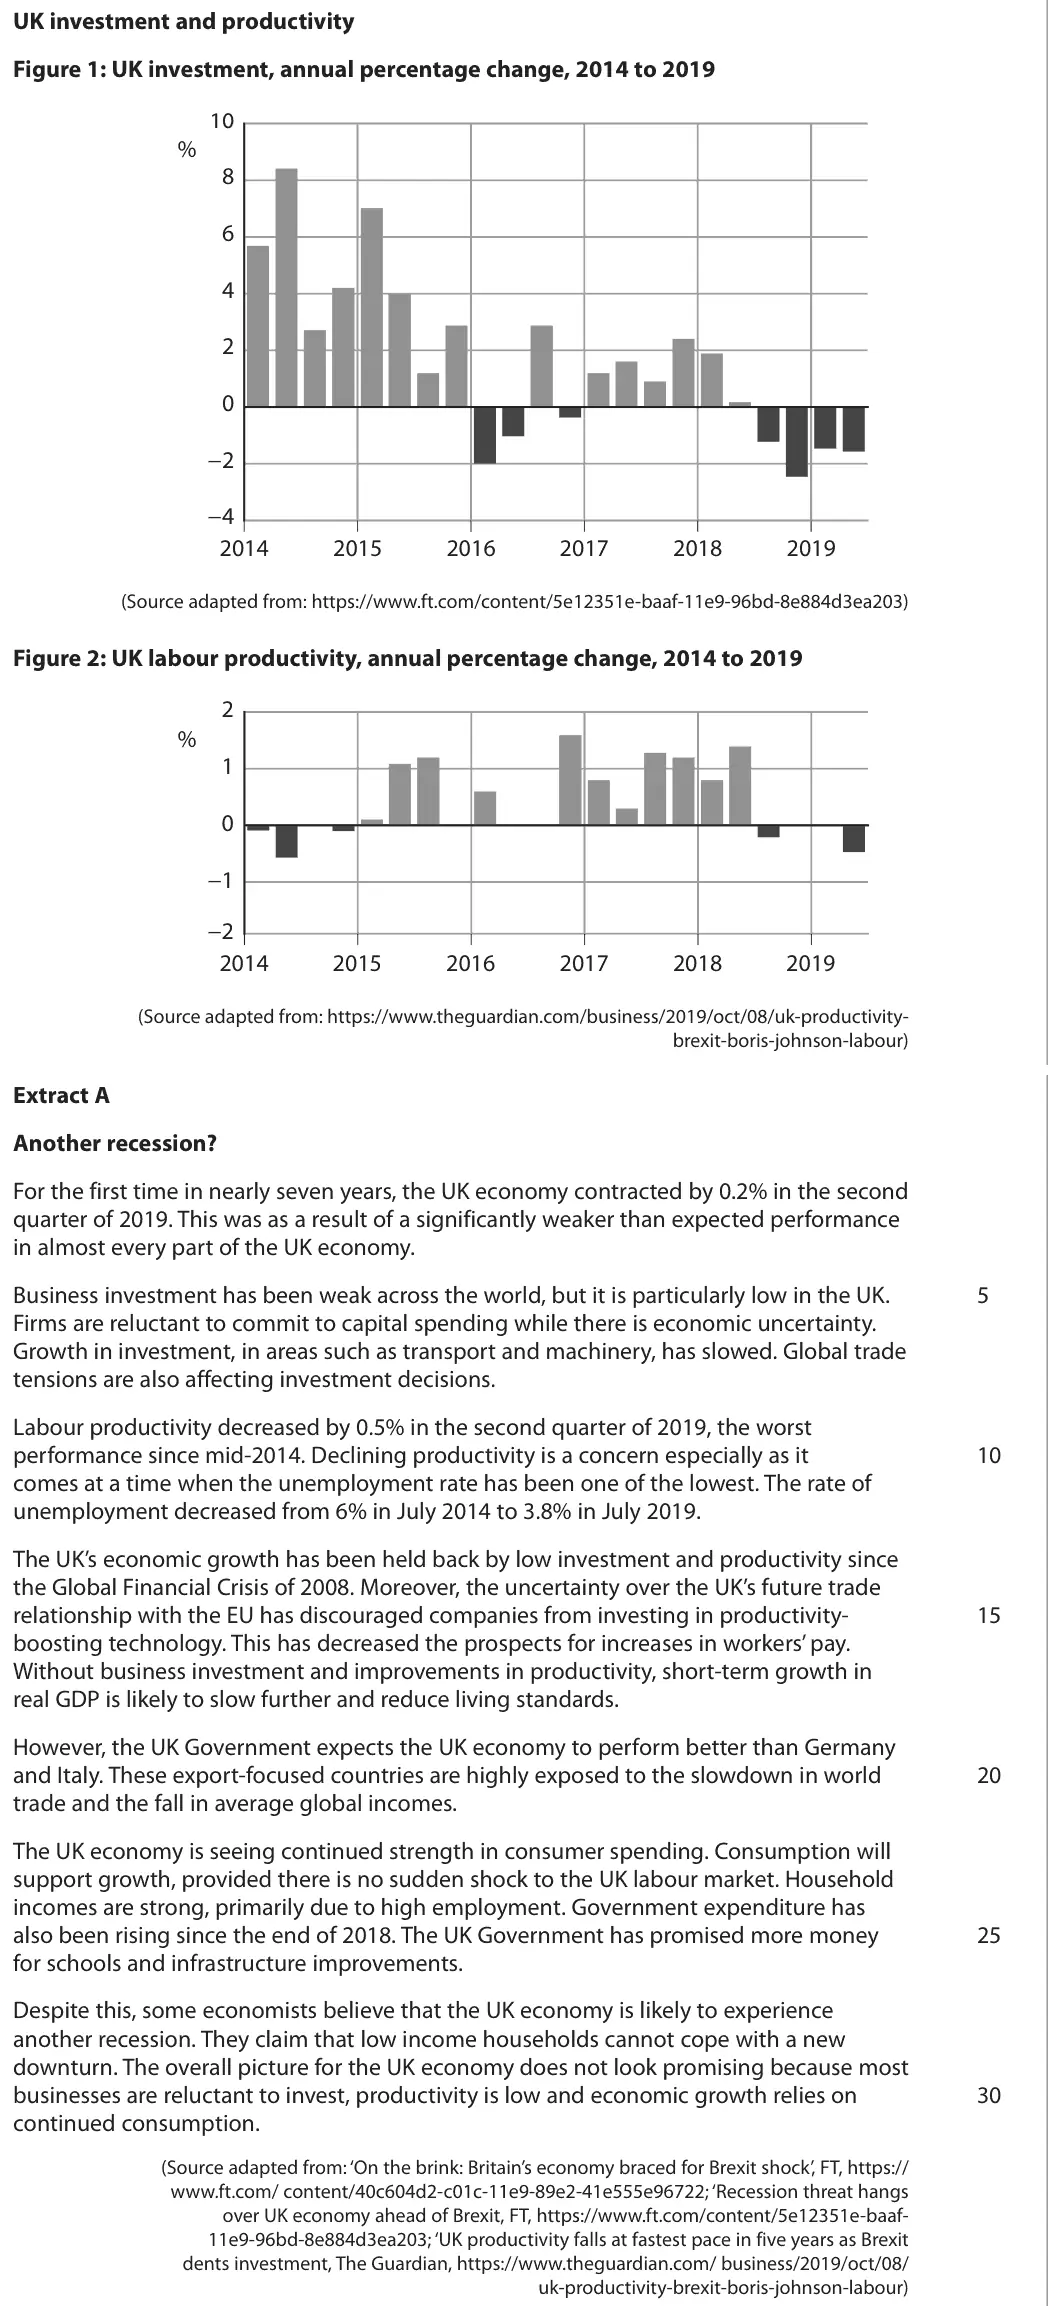
characteristics, not effects, of a recession: falling real GDP (Q2 2008 to Q3 2009), rising unemployment (8.5% in 2009), falling inflation, falling investment
one data reference each
Quantitative skills: QS 9 (interpret, apply and analyse information in written, graphical tabular and numerical forms)
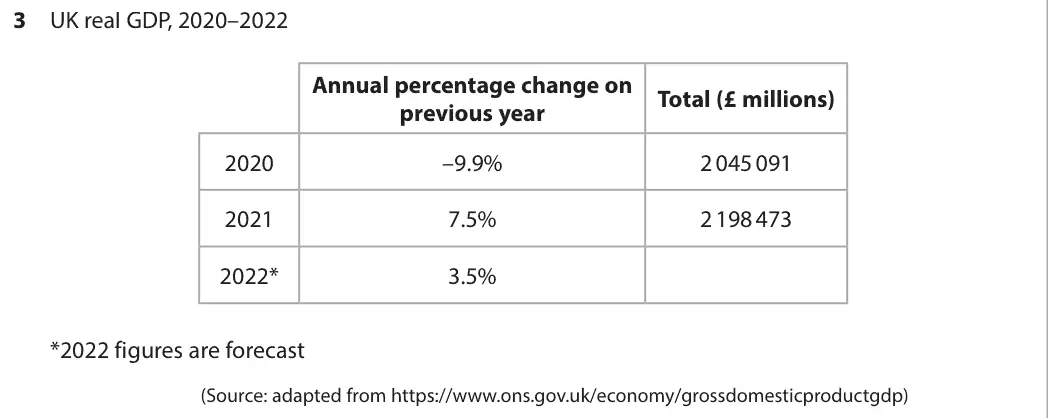
June 2023 · Paper 2 · Q3(b)2 marksAO1=1, AO3=1Short answer
Data and extracts for question 3
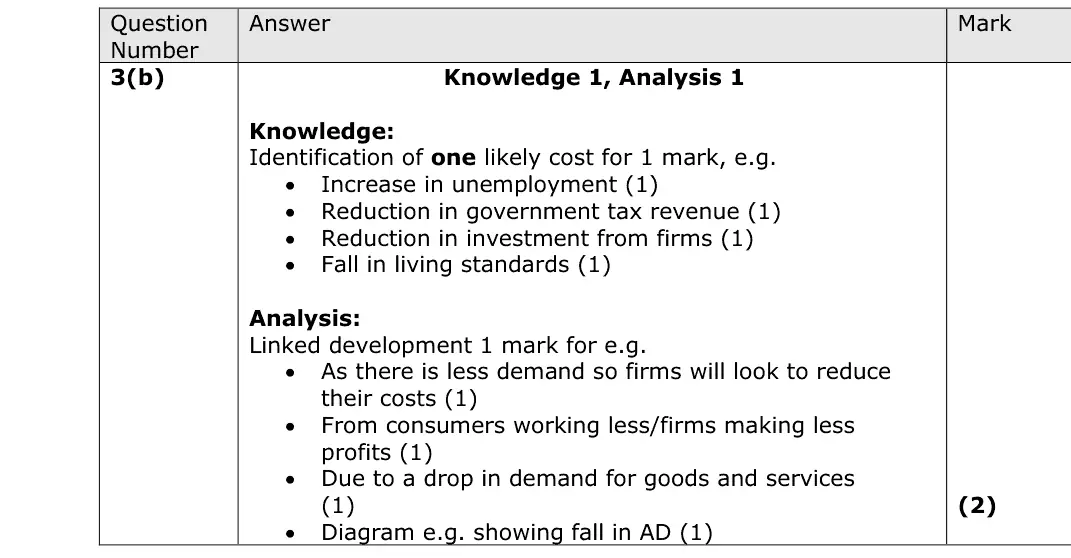
Mark scheme
Examiner's comment
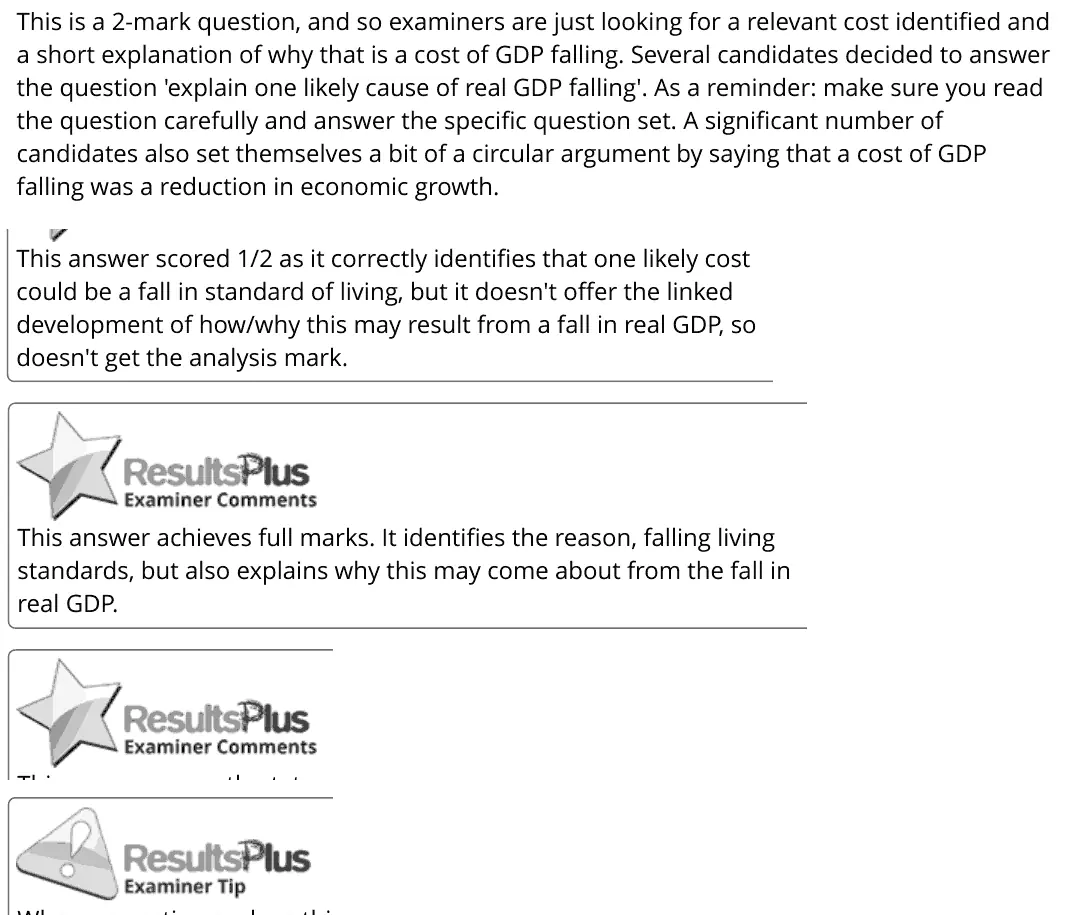
This is a 2-mark question, and so examiners are just looking for a relevant cost identified and a short explanation of why that is a cost of GDP falling. Several candidates decided to answer the question 'explain one likely cause of real GDP falling'. As a reminder: make sure you read the question carefully and answer the specific question set. A significant number of candidates also set themselves a bit of a circular argument by saying that a cost of GDP falling was a reduction in economic growth. This answer scored 1/2 as it correctly identifies that one likely cost could be a fall in standard of living, but it doesn't offer the linked development of how/why this may result from a fall in real GDP, so doesn't get the analysis mark. This answer achieves full marks. It identifies the reason, falling living standards, but also explains why this may come about from the fall in real GDP.
Notes from the mark scheme and report
a cost of falling real GDP (unemployment, lower tax revenue, lower living standards) with linked development
some explained causes instead
'lower economic growth' is circular
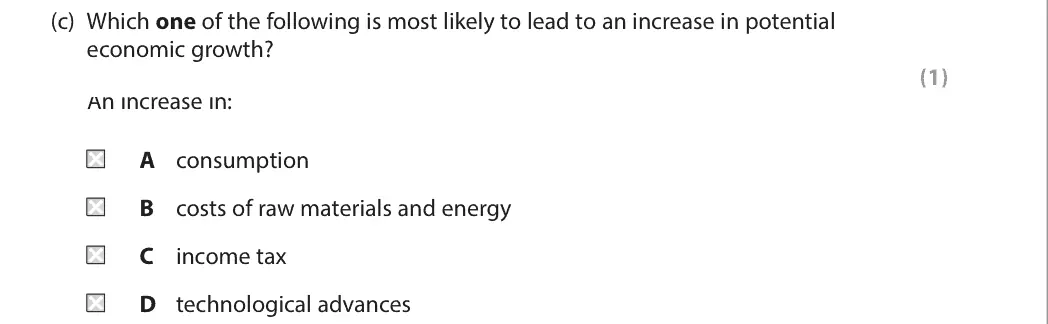
June 2023 · Paper 2 · Q3(c)1 markMultiple choice
Data and extracts for question 3
Answer
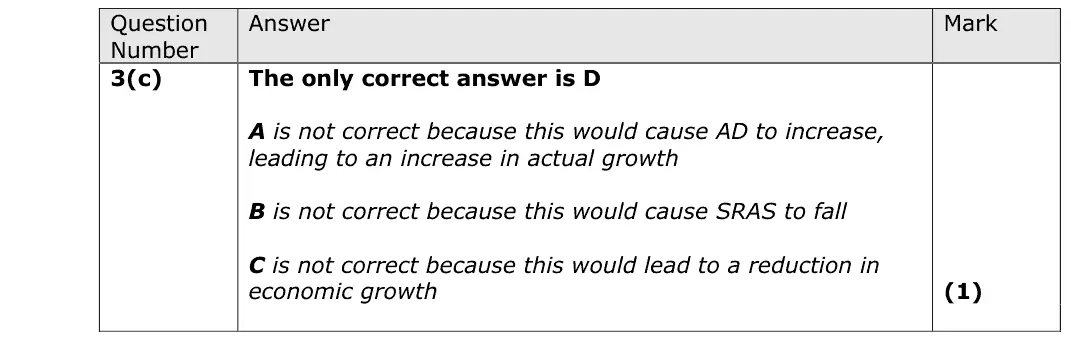
D
Mark scheme
Notes from the mark scheme and report
technological advances shift LRAS right = potential growth (D)
consumption raises actual growth via AD
higher raw material costs shift SRAS left
higher income tax reduces growth
June 2023 · AS Paper 2 · Q5(b)3 marksAO1=1, AO2=1, AO3=1Short answer
Data and extracts for question 5
Mark scheme
Examiner's comment
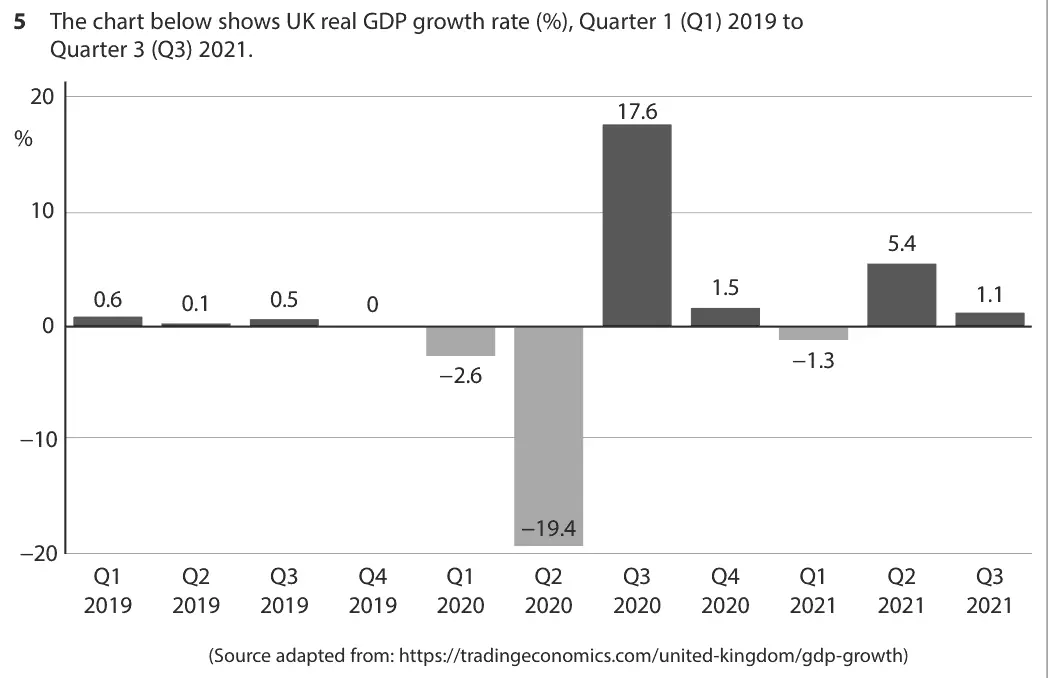
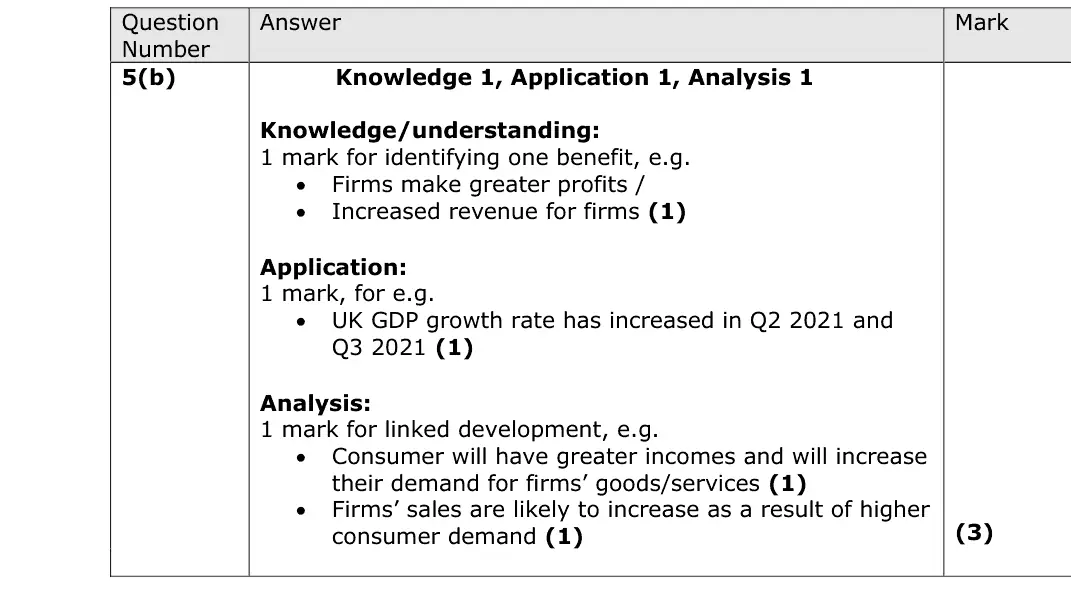
This question asked candidates to explain one benefit of economic growth to firms. Many candidates found this question a little challenging to answer. However, some candidates lost application marks because they did not use the data provided.
Notes from the mark scheme and report
benefit to firms: higher sales, revenue and profit, confidence to invest
quote growth in Q2 2021 (5.4%) or Q3 2021 (1.1%)
report: some lost the application mark by not using the chart
Quantitative skills: QS 9 (interpret, apply and analyse information in written, graphical tabular and numerical forms)
June 2023 · Paper 2 · Q6(c)12 marksAO1=2, AO2=2, AO3=4, AO4=412-mark response
Data and extracts for question 6
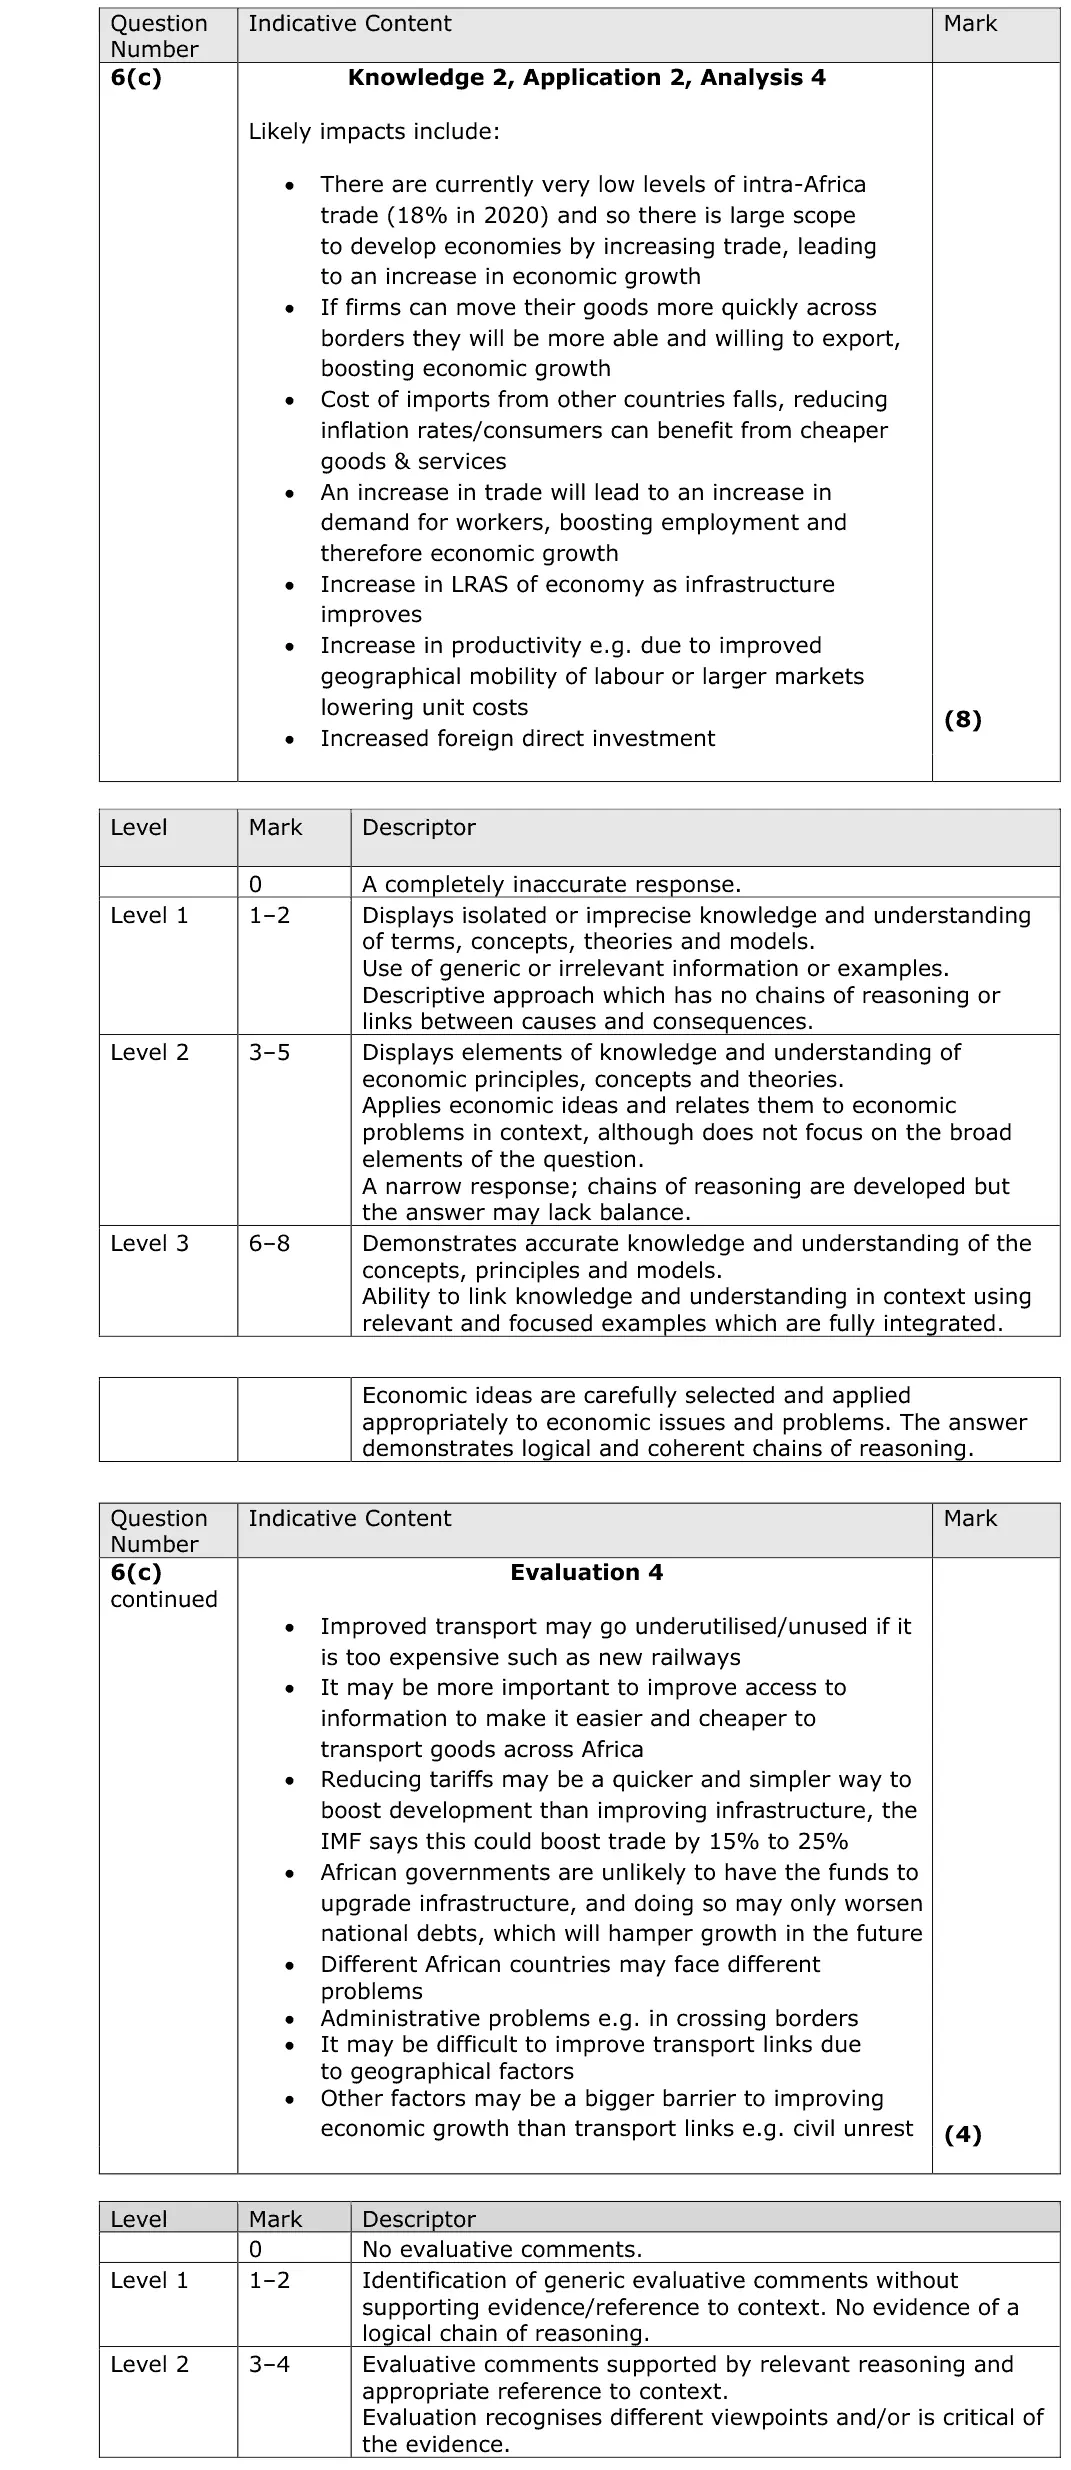
Mark scheme, including the levels grid and indicative content
Examiner's comment
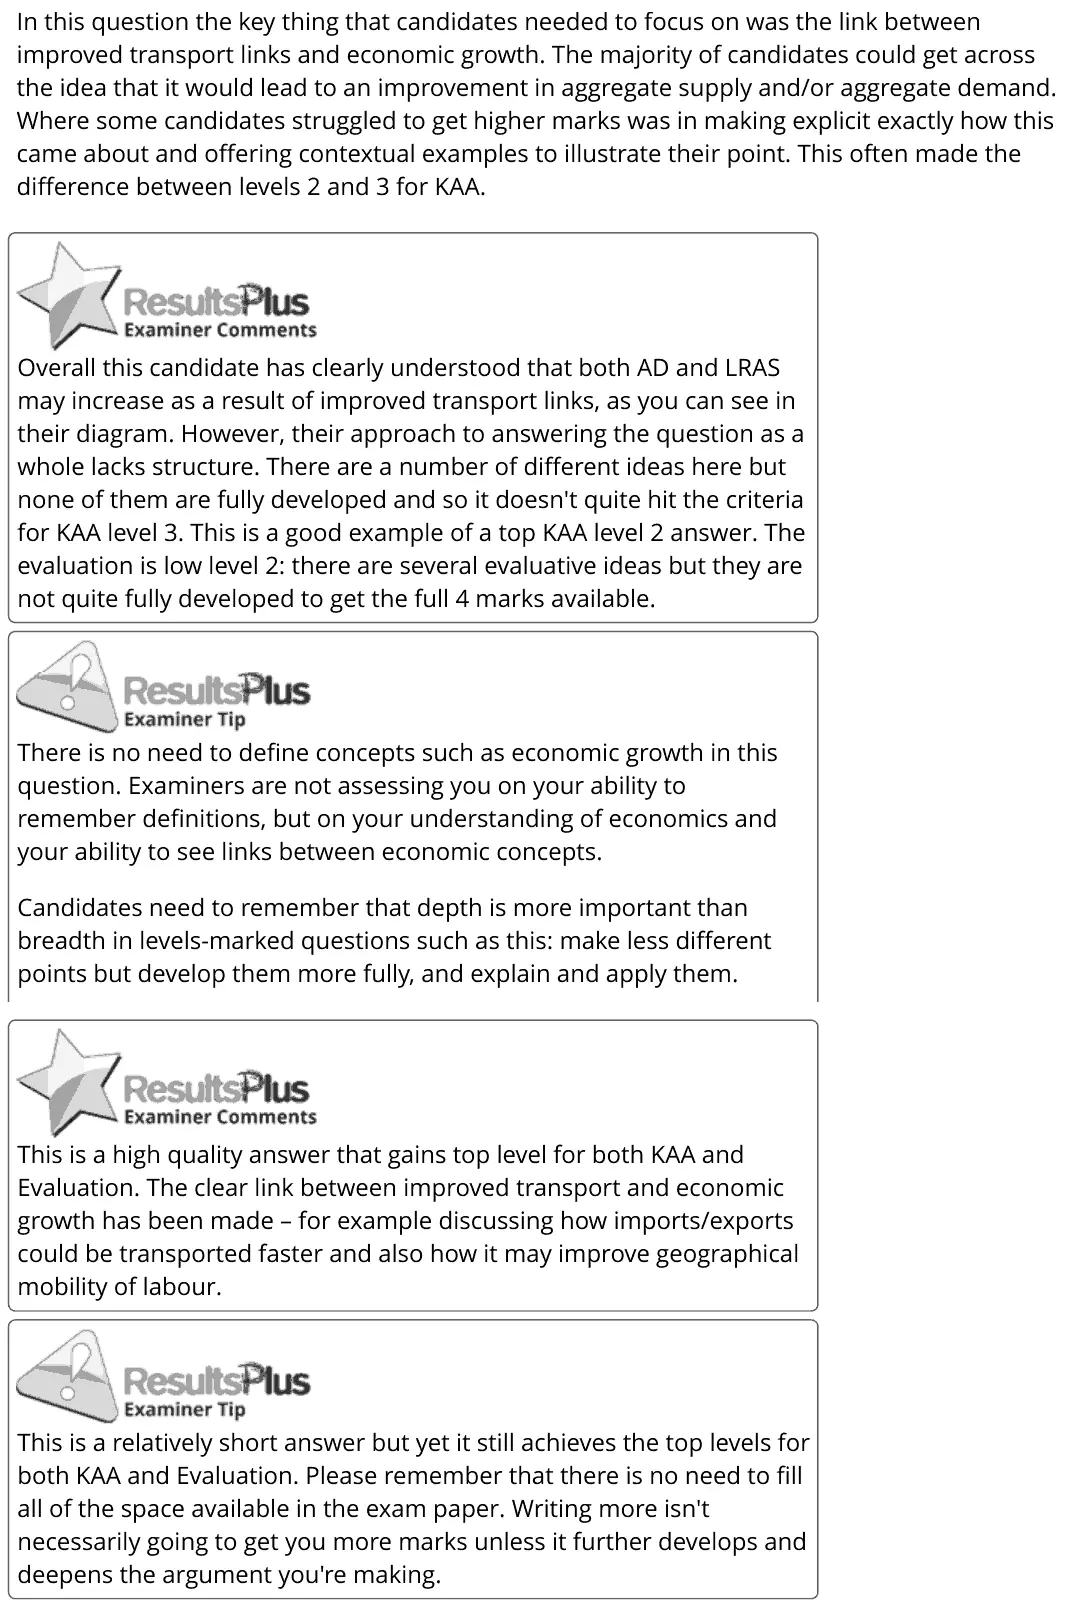
In this question the key thing that candidates needed to focus on was the link between improved transport links and economic growth. The majority of candidates could get across the idea that it would lead to an improvement in aggregate supply and/or aggregate demand. Where some candidates struggled to get higher marks was in making explicit exactly how this came about and offering contextual examples to illustrate their point. This often made the difference between levels 2 and 3 for KAA. Overall this candidate has clearly understood that both AD and LRAS may increase as a result of improved transport links, as you can see in their diagram. However, their approach to answering the question as a whole lacks structure. There are a number of different ideas here but none of them are fully developed and so it doesn't quite hit the criteria for KAA level 3. This is a good example of a top KAA level 2 answer. The evaluation is low level 2: there are several evaluative ideas but they are not quite fully developed to get the full 4 marks available. There is no need to define concepts such as economic growth in this question. Examiners are not assessing you on your ability to remember definitions, but on your understanding of economics and your ability to see links between economic concepts. Candidates need to remember that depth is more important than breadth in levels-marked questions such as this: make less different points but develop them more fully, and explain and apply them. This is a high quality answer that gains top level for both KAA and Evaluation. The clear link between improved transport and economic growth has been made – for example discussing how imports/exports could be transported faster and also how it may improve geographical mobility of labour. This is a relatively short answer but yet it still achieves the top levels for both KAA and Evaluation. Please remember that there is no need to fill all of the space available in the exam paper. Writing more isn't necessarily going to get you more marks unless it further develops and deepens the argument you're making.
Notes from the mark scheme and report
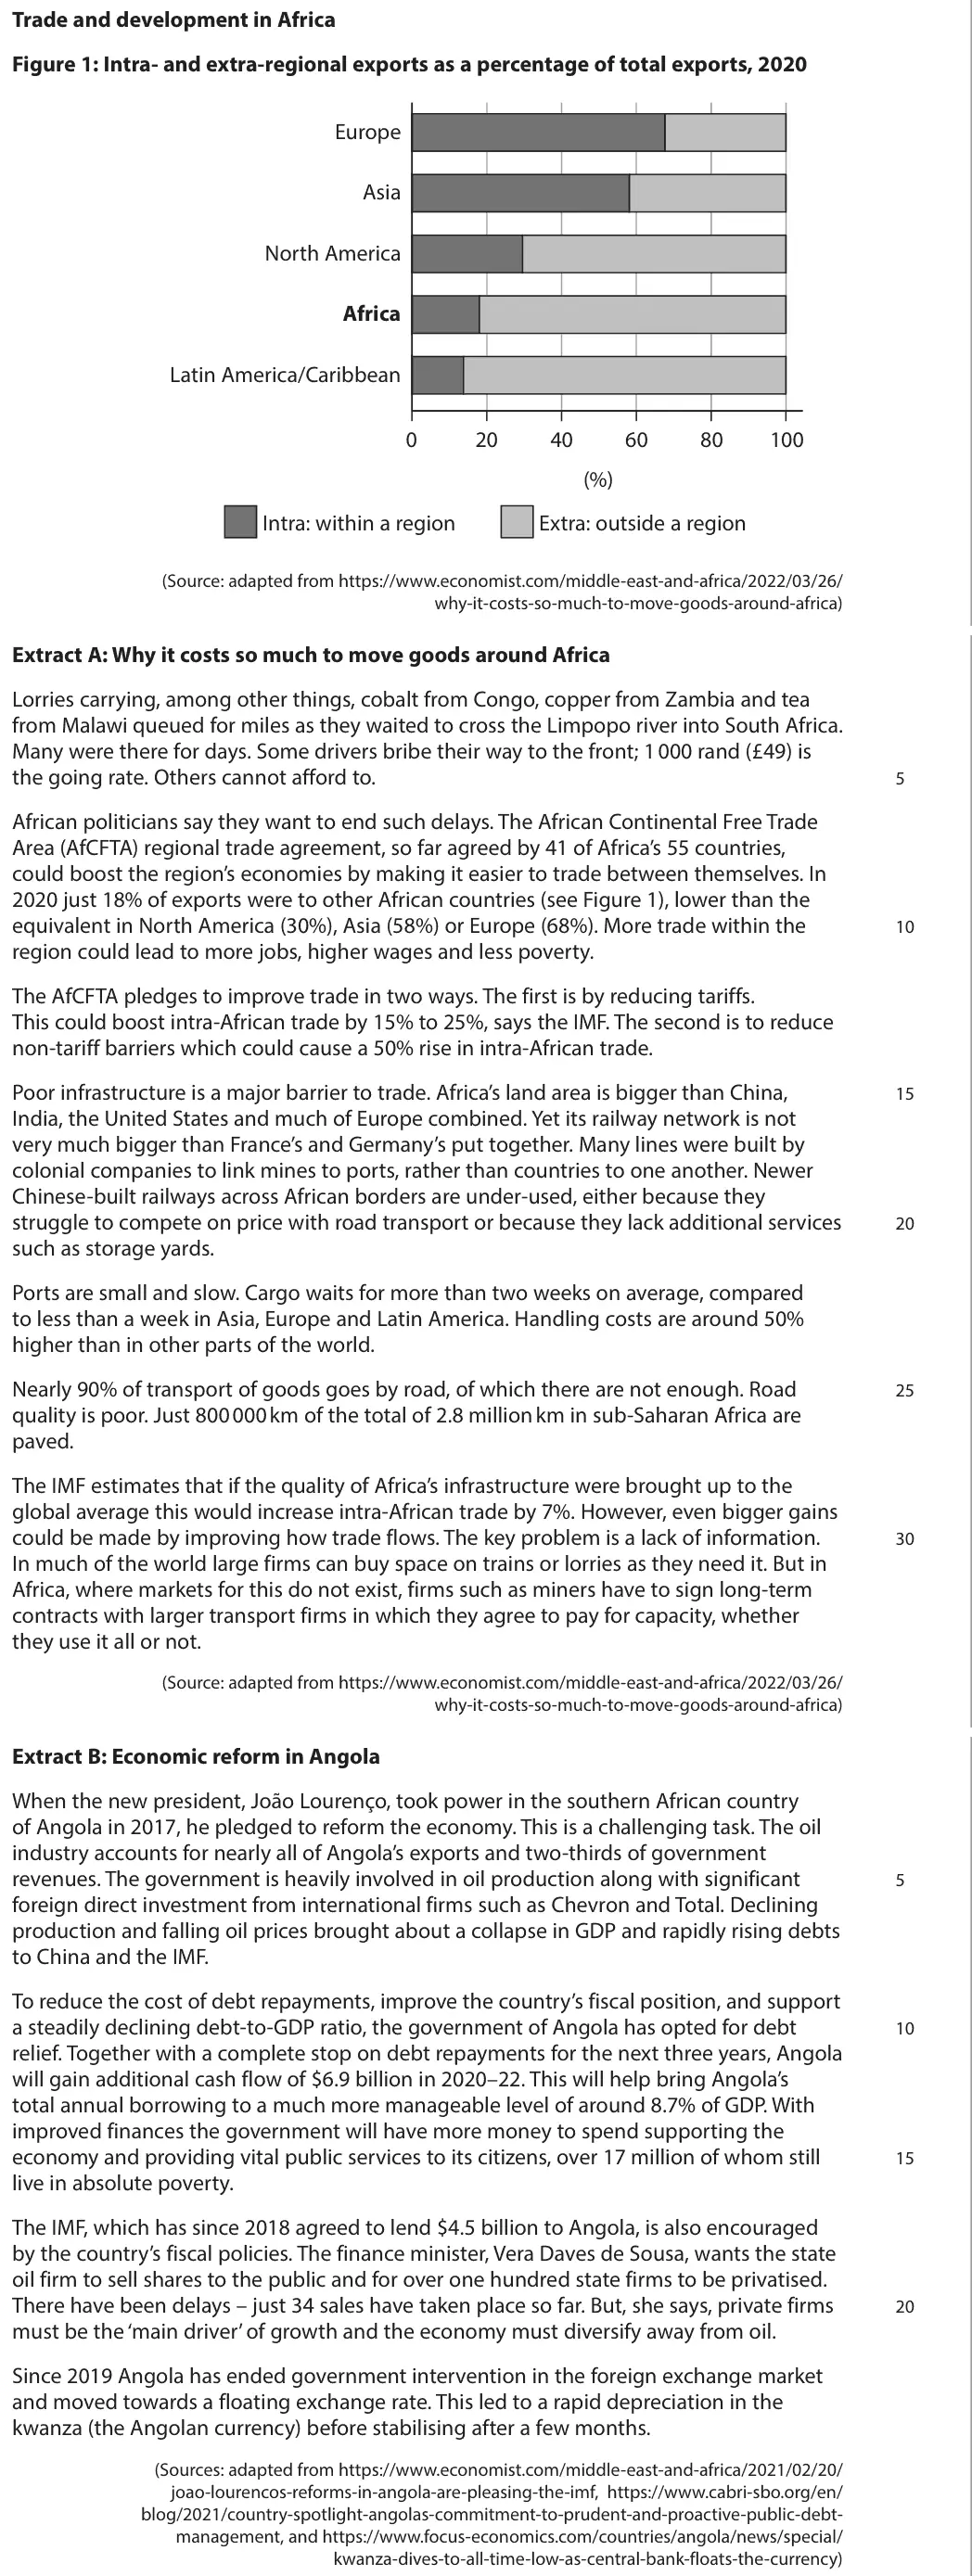
better transport raises LRAS (productivity, lower costs) and AD (exports, FDI) so growth increases
intra-Africa trade only 18%
Level 3 needs explicit links and context
evaluate with funding, under-used railways, other barriers
June 2022 · Paper 2 · Q4(a)1 markMultiple choice
Data and extracts for question 4
Answer
D
Mark scheme
Notes from the mark scheme and report
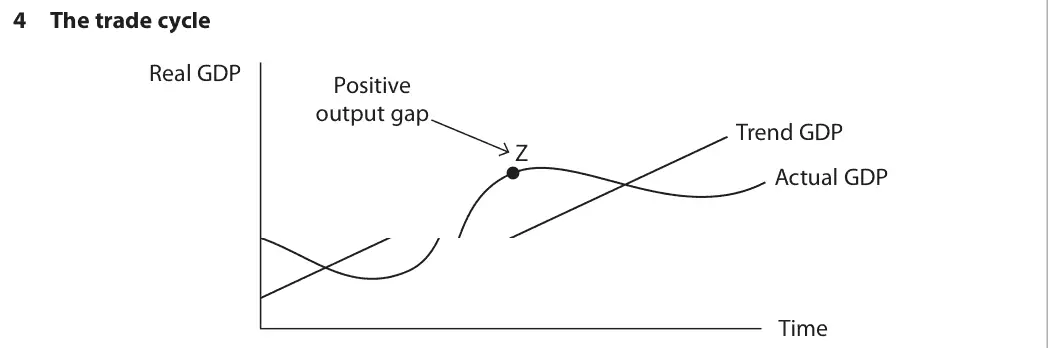
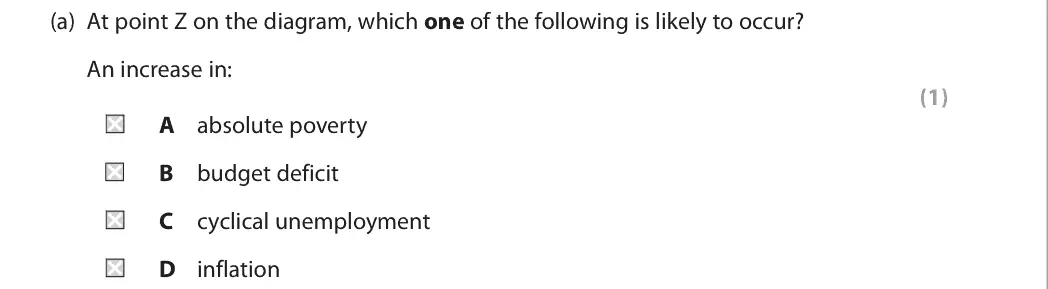
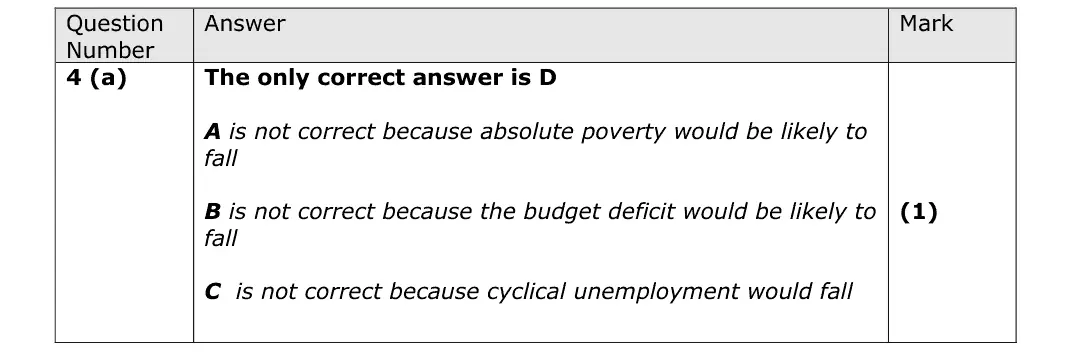
Z is a peak with a positive output gap, so demand-pull inflation rises (D)
absolute poverty, the budget deficit and cyclical unemployment would fall
Quantitative skills: QS 9 (interpret, apply and analyse information in written, graphical tabular and numerical forms)
June 2022 · AS Paper 2 · Q6(d)5 marksAO1=1, AO2=2, AO3=2Short answer
Data and extracts for question 6
Mark scheme
Examiner's comment
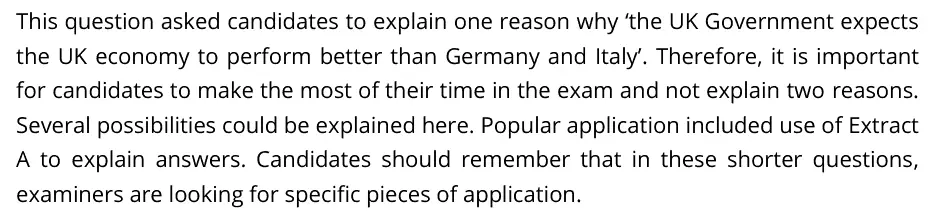
This question asked candidates to explain one reason why ‘the UK Government expects the UK economy to perform better than Germany and Italy’. Therefore, it is important for candidates to make the most of their time in the exam and not explain two reasons. Several possibilities could be explained here. Popular application included use of Extract A to explain answers. Candidates should remember that in these shorter questions, examiners are looking for specific pieces of application.
Notes from the mark scheme and report
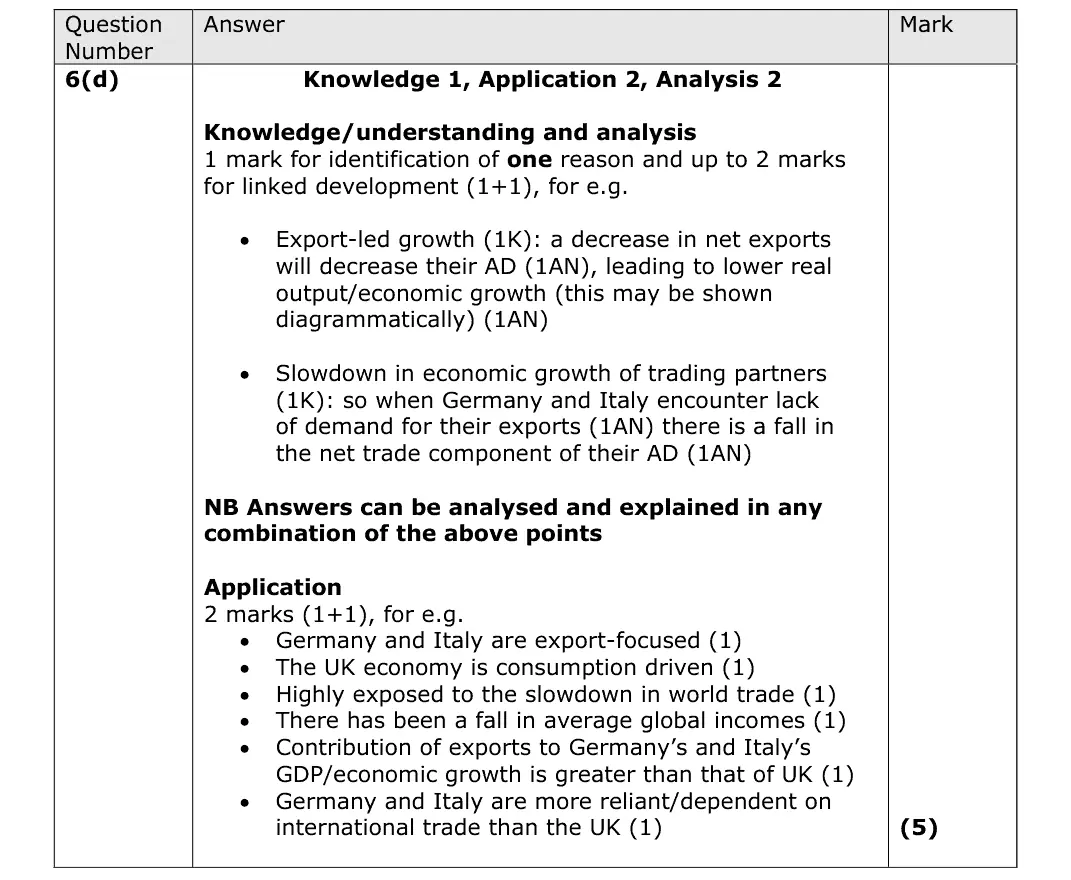
one reason: Germany and Italy are export-focused so the slowdown in world trade cuts their net exports and AD, while UK growth is consumption-driven
one reason only
June 2022 · AS Paper 2 · Q6(e)15 marksAO1=3, AO2=3, AO3=3, AO4=615-mark response
Data and extracts for question 6
Mark scheme, including the levels grid and indicative content
Examiner's comment
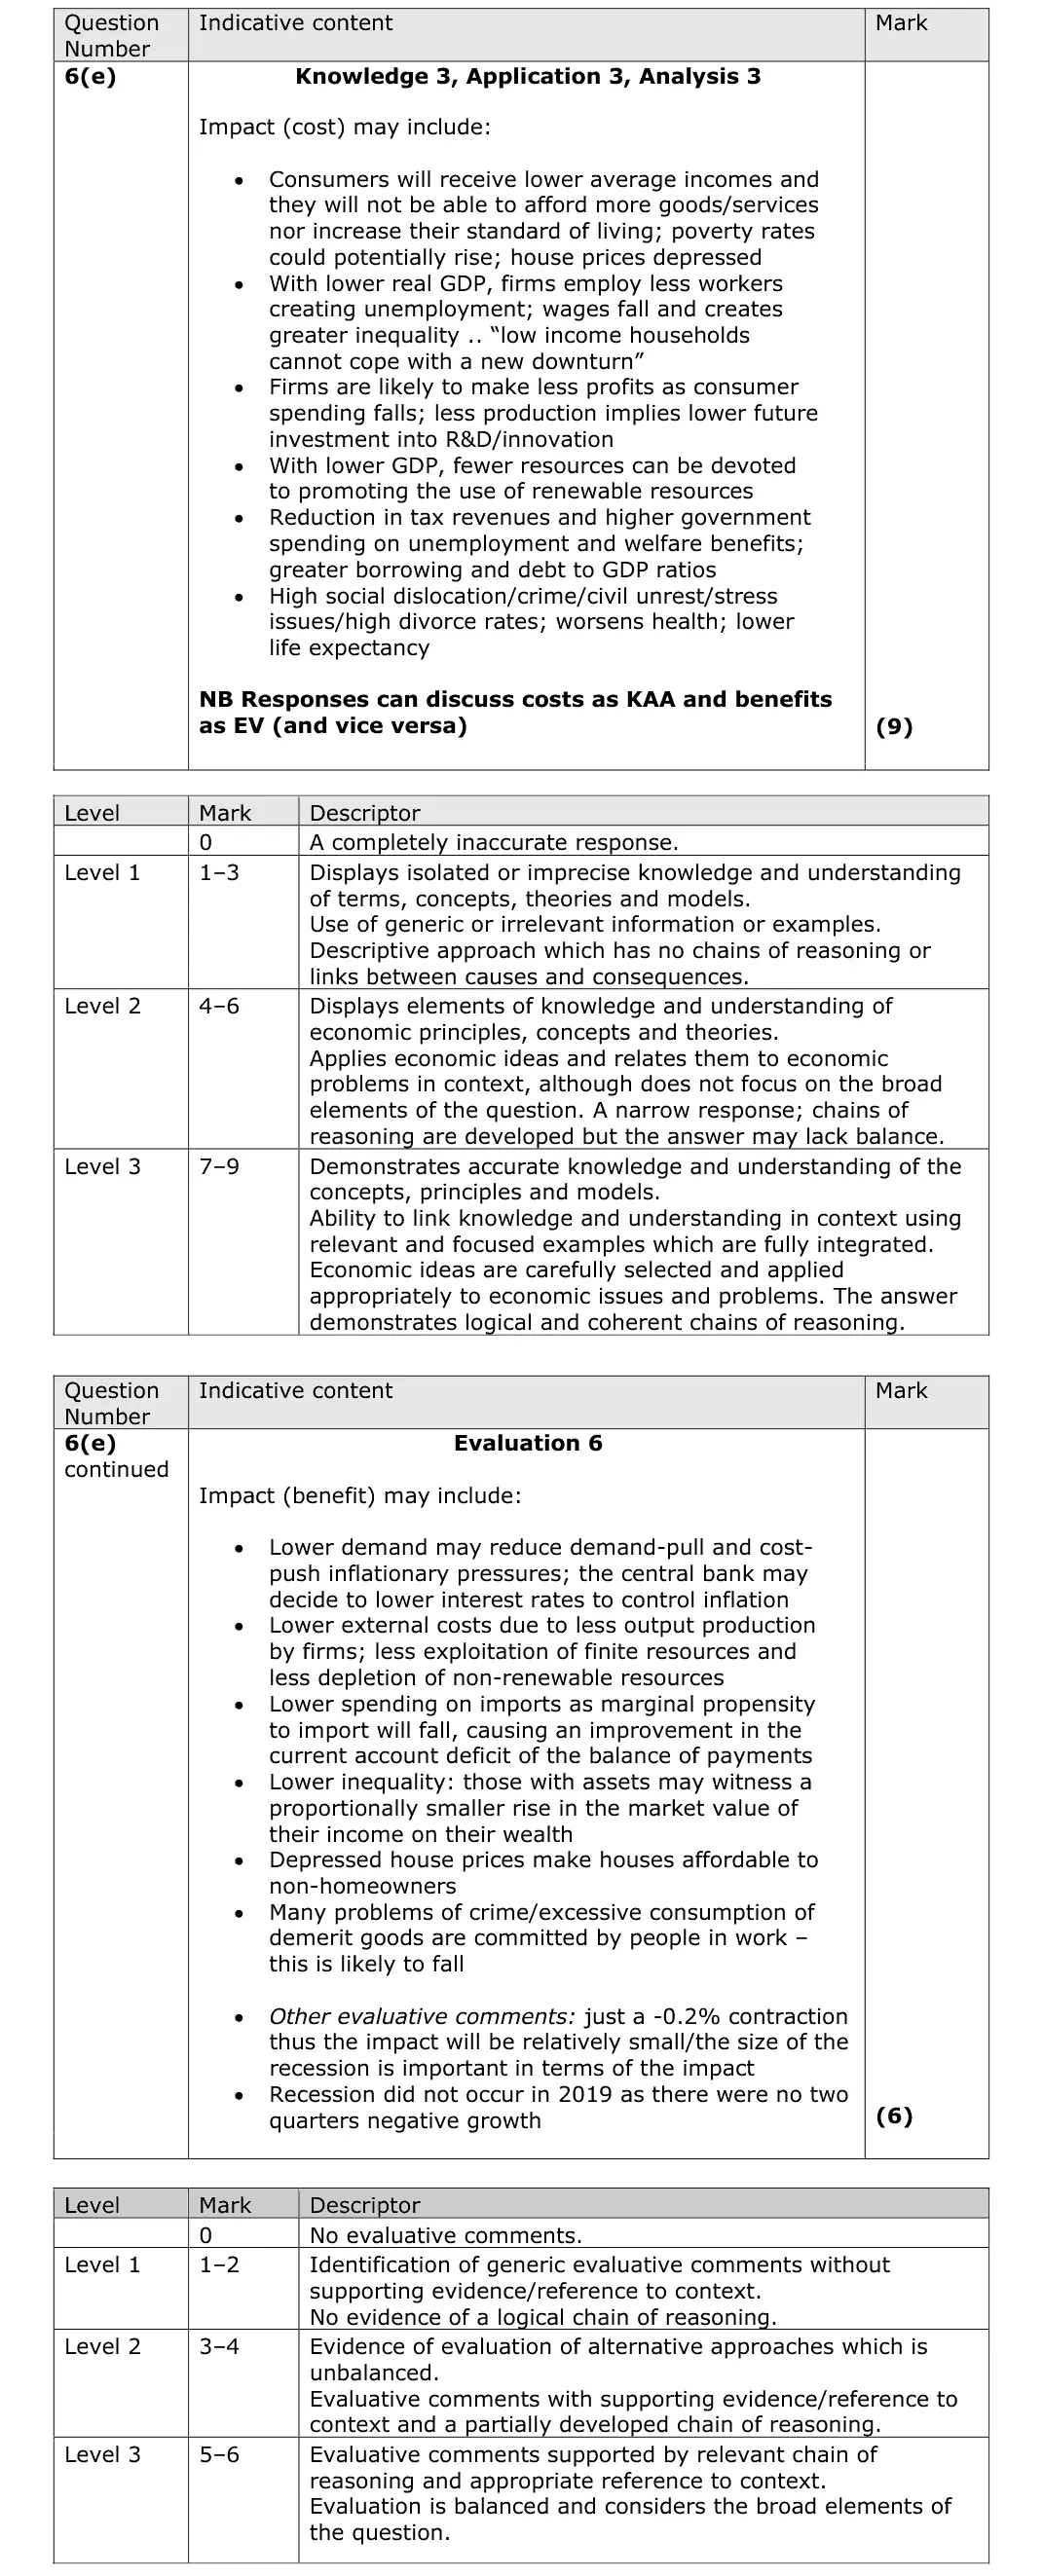
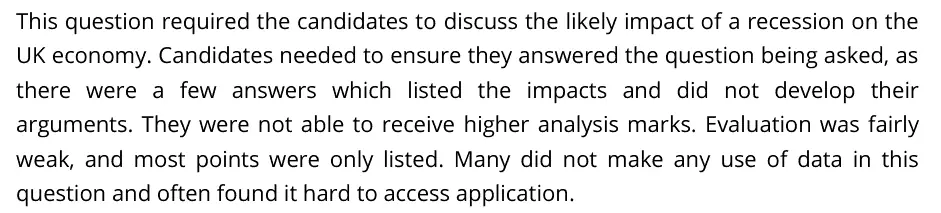
This question required the candidates to discuss the likely impact of a recession on the UK economy. Candidates needed to ensure they answered the question being asked, as there were a few answers which listed the impacts and did not develop their arguments. They were not able to receive higher analysis marks. Evaluation was fairly weak, and most points were only listed. Many did not make any use of data in this question and often found it hard to access application.
Notes from the mark scheme and report
impacts on consumers, firms, government and workers: unemployment, lower incomes, less investment, budget deficit, lower inflation, better current account
develop rather than list
evaluation and data use were often weak
Quantitative skills: QS 9 (interpret, apply and analyse information in written, graphical tabular and numerical forms)
November 2021 · Paper 3 · Q1(d)25 marksAO1=4, AO2=4, AO3=8, AO4=925-mark essayEither/or
Data and extracts for question 1
Mark scheme, including the levels grid and indicative content
Examiner's comment
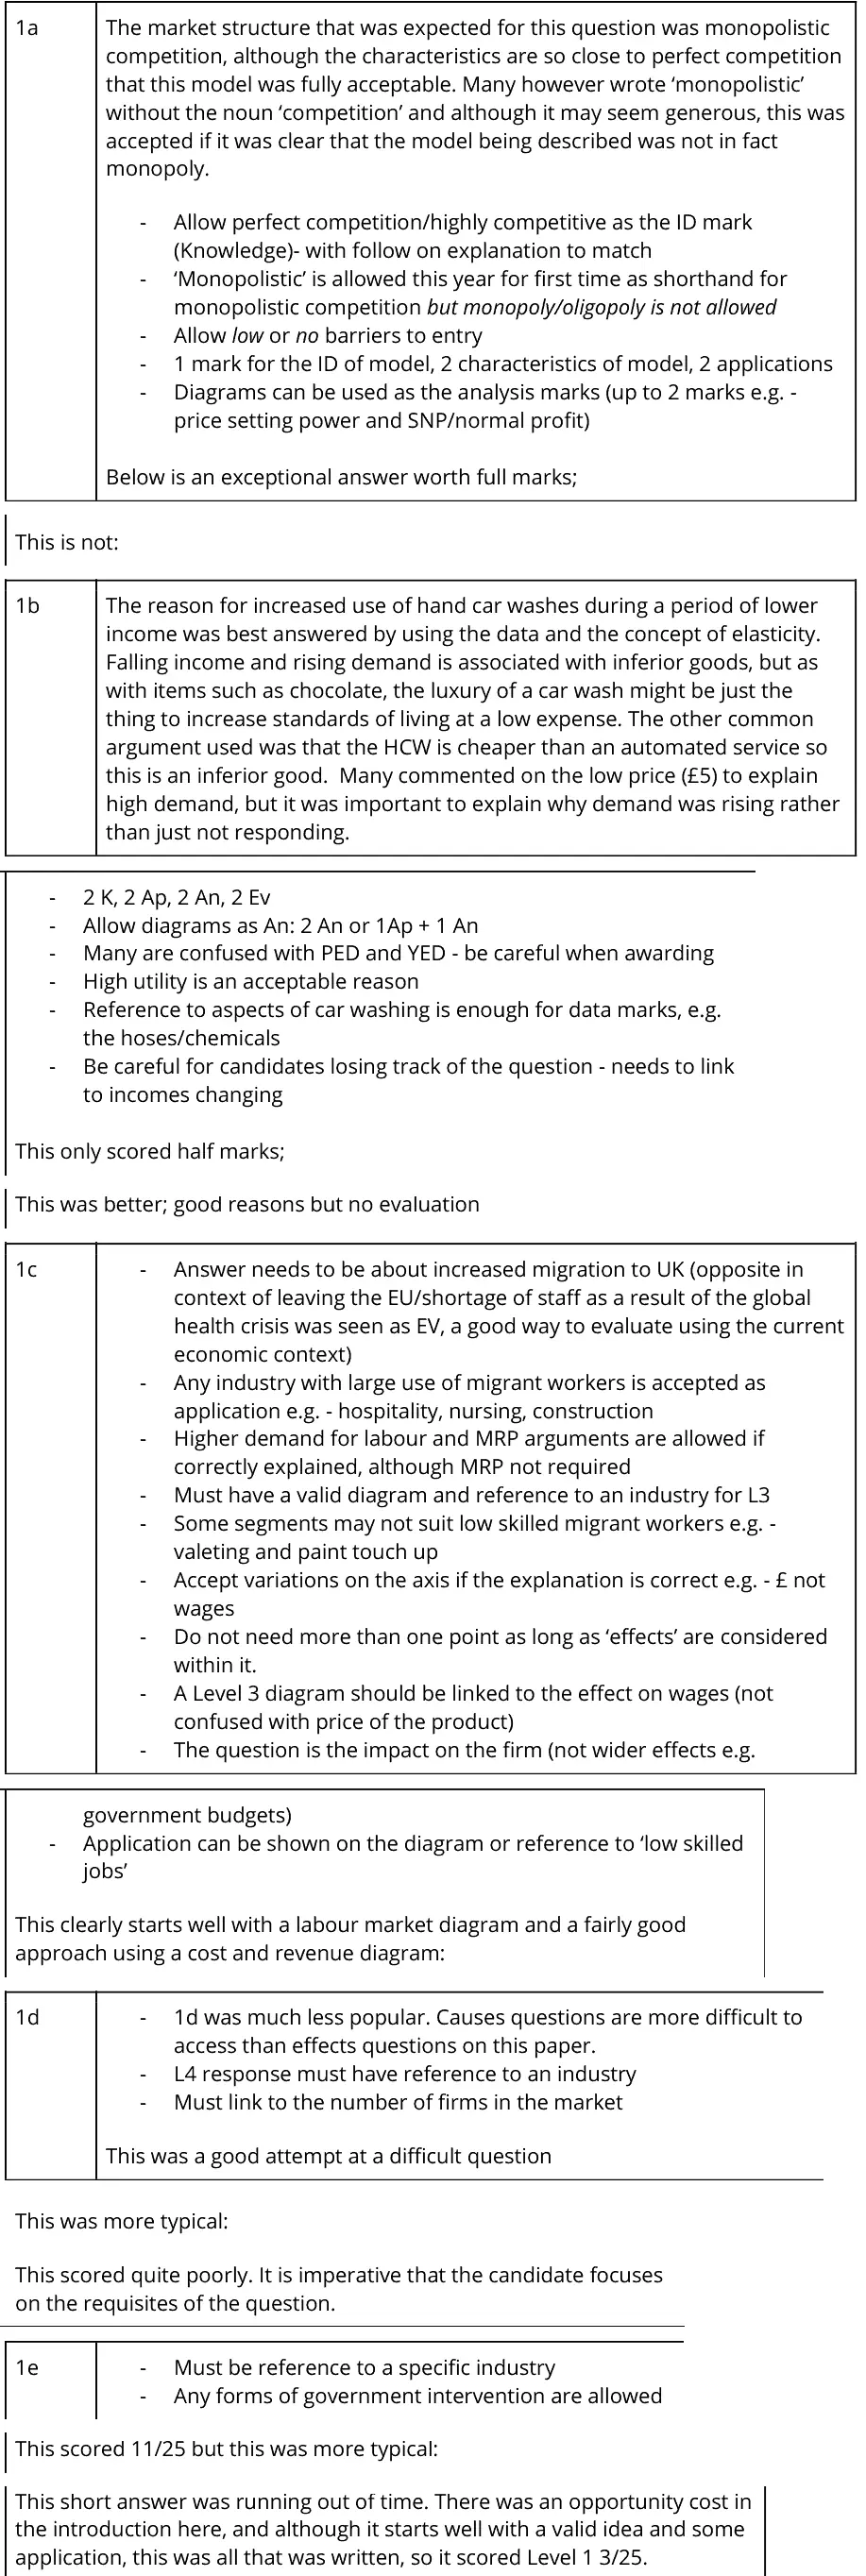
1a The market structure that was expected for this question was monopolistic competition, although the characteristics are so close to perfect competition that this model was fully acceptable. Many however wrote ‘monopolistic’ without the noun ‘competition’ and although it may seem generous, this was accepted if it was clear that the model being described was not in fact monopoly. - Allow perfect competition/highly competitive as the ID mark (Knowledge)- with follow on explanation to match - ‘Monopolistic’ is allowed this year for first time as shorthand for monopolistic competition but monopoly/oligopoly is not allowed - Allow low or no barriers to entry - 1 mark for the ID of model, 2 characteristics of model, 2 applications - Diagrams can be used as the analysis marks (up to 2 marks e.g. - price setting power and SNP/normal profit) Below is an exceptional answer worth full marks; This is not: 1b The reason for increased use of hand car washes during a period of lower income was best answered by using the data and the concept of elasticity. Falling income and rising demand is associated with inferior goods, but as with items such as chocolate, the luxury of a car wash might be just the thing to increase standards of living at a low expense. The other common argument used was that the HCW is cheaper than an automated service so this is an inferior good. Many commented on the low price (£5) to explain high demand, but it was important to explain why demand was rising rather than just not responding. - 2 K, 2 Ap, 2 An, 2 Ev - Allow diagrams as An: 2 An or 1Ap + 1 An - Many are confused with PED and YED - be careful when awarding - High utility is an acceptable reason - Reference to aspects of car washing is enough for data marks, e.g. the hoses/chemicals - Be careful for candidates losing track of the question - needs to link to incomes changing This only scored half marks; This was better; good reasons but no evaluation 1c - Answer needs to be about increased migration to UK (opposite in context of leaving the EU/shortage of staff as a result of the global health crisis was seen as EV, a good way to evaluate using the current economic context) - Any industry with large use of migrant workers is accepted as application e.g. - hospitality, nursing, construction - Higher demand for labour and MRP arguments are allowed if correctly explained, although MRP not required - Must have a valid diagram and reference to an industry for L3 - Some segments may not suit low skilled migrant workers e.g. - valeting and paint touch up - Accept variations on the axis if the explanation is correct e.g. - £ not wages - Do not need more than one point as long as ‘effects’ are considered within it. - A Level 3 diagram should be linked to the effect on wages (not confused with price of the product) - The question is the impact on the firm (not wider effects e.g. government budgets) - Application can be shown on the diagram or reference to ‘low skilled jobs’ This clearly starts well with a labour market diagram and a fairly good approach using a cost and revenue diagram: 1d - 1d was much less popular. Causes questions are more difficult to access than effects questions on this paper. - L4 response must have reference to an industry - Must link to the number of firms in the market This was a good attempt at a difficult question This was more typical: This scored quite poorly. It is imperative that the candidate focuses on the requisites of the question. 1e - Must be reference to a specific industry - Any forms of government intervention are allowed This scored 11/25 but this was more typical: This short answer was running out of time. There was an opportunity cost in the introduction here, and although it starts well with a valid idea and some application, this was all that was written, so it scored Level 1 3/25.
Notes from the mark scheme and report
causes of the number of firms: barriers to entry, contestability, economies of scale, regulation
Level 4 needs micro and macro and a named industry linked to the number of firms
report: "Causes questions are more difficult to access than effects questions"
November 2021 · Paper 3 · Q2(d)25 marksAO1=4, AO2=4, AO3=8, AO4=925-mark essayEither/or
Data and extracts for question 2
Mark scheme, including the levels grid and indicative content
Examiner's comment
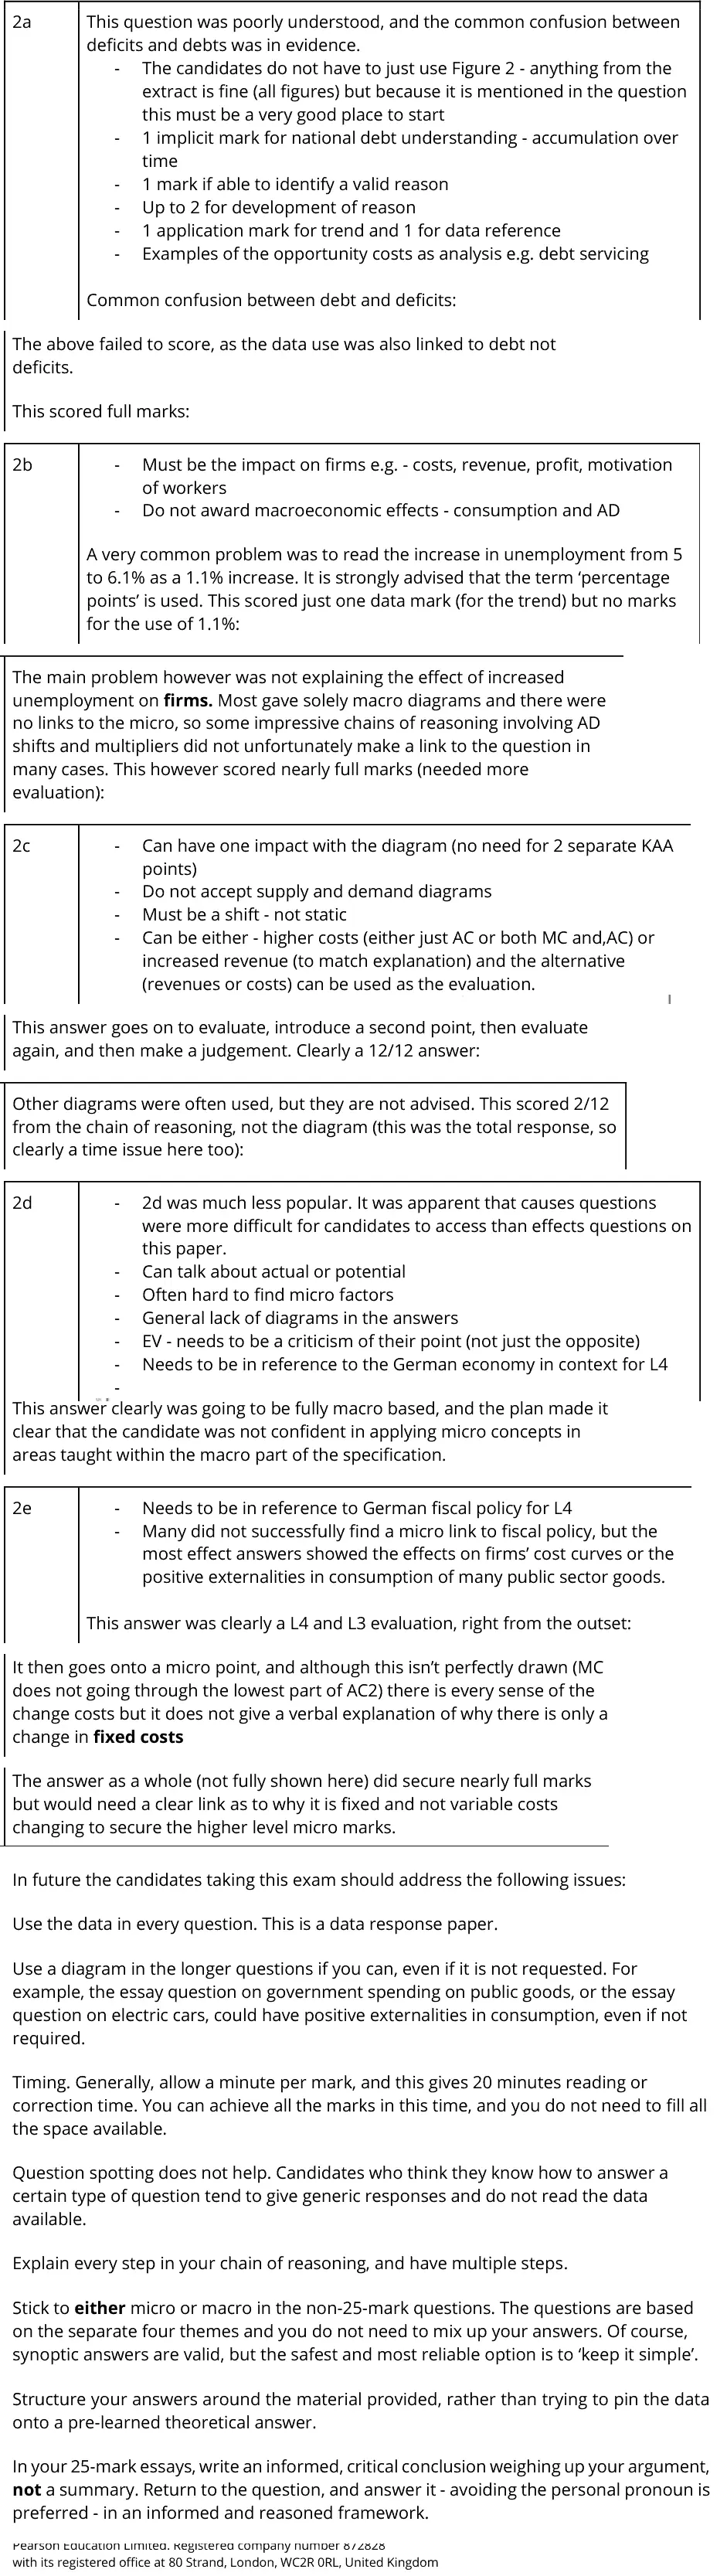
2a This question was poorly understood, and the common confusion between deficits and debts was in evidence. - The candidates do not have to just use Figure 2 - anything from the extract is fine (all figures) but because it is mentioned in the question this must be a very good place to start - 1 implicit mark for national debt understanding - accumulation over time - 1 mark if able to identify a valid reason - Up to 2 for development of reason - 1 application mark for trend and 1 for data reference - Examples of the opportunity costs as analysis e.g. debt servicing Common confusion between debt and deficits: The above failed to score, as the data use was also linked to debt not deficits. This scored full marks: 2b - Must be the impact on firms e.g. - costs, revenue, profit, motivation of workers - Do not award macroeconomic effects - consumption and AD A very common problem was to read the increase in unemployment from 5 to 6.1% as a 1.1% increase. It is strongly advised that the term ‘percentage points’ is used. This scored just one data mark (for the trend) but no marks for the use of 1.1%: The main problem however was not explaining the effect of increased unemployment on firms. Most gave solely macro diagrams and there were no links to the micro, so some impressive chains of reasoning involving AD shifts and multipliers did not unfortunately make a link to the question in many cases. This however scored nearly full marks (needed more evaluation): 2c - Can have one impact with the diagram (no need for 2 separate KAA points) - Do not accept supply and demand diagrams - Must be a shift - not static - Can be either - higher costs (either just AC or both MC and,AC) or increased revenue (to match explanation) and the alternative (revenues or costs) can be used as the evaluation. This answer goes on to evaluate, introduce a second point, then evaluate again, and then make a judgement. Clearly a 12/12 answer: Other diagrams were often used, but they are not advised. This scored 2/12 from the chain of reasoning, not the diagram (this was the total response, so clearly a time issue here too): 2d - 2d was much less popular. It was apparent that causes questions were more difficult for candidates to access than effects questions on this paper. - Can talk about actual or potential - Often hard to find micro factors - General lack of diagrams in the answers - EV - needs to be a criticism of their point (not just the opposite) - Needs to be in reference to the German economy in context for L4 - This answer clearly was going to be fully macro based, and the plan made it clear that the candidate was not confident in applying micro concepts in areas taught within the macro part of the specification. 2e - Needs to be in reference to German fiscal policy for L4 - Many did not successfully find a micro link to fiscal policy, but the most effect answers showed the effects on firms’ cost curves or the positive externalities in consumption of many public sector goods. This answer was clearly a L4 and L3 evaluation, right from the outset: It then goes onto a micro point, and although this isn’t perfectly drawn (MC does not going through the lowest part of AC2) there is every sense of the change costs but it does not give a verbal explanation of why there is only a change in fixed costs The answer as a whole (not fully shown here) did secure nearly full marks but would need a clear link as to why it is fixed and not variable costs changing to secure the higher level micro marks. In future the candidates taking this exam should address the following issues: Use the data in every question. This is a data response paper. Use a diagram in the longer questions if you can, even if it is not requested. For example, the essay question on government spending on public goods, or the essay question on electric cars, could have positive externalities in consumption, even if not required. Timing. Generally, allow a minute per mark, and this gives 20 minutes reading or correction time. You can achieve all the marks in this time, and you do not need to fill all the space available. Question spotting does not help. Candidates who think they know how to answer a certain type of question tend to give generic responses and do not read the data available. Explain every step in your chain of reasoning, and have multiple steps. Stick to either micro or macro in the non-25-mark questions. The questions are based on the separate four themes and you do not need to mix up your answers. Of course, synoptic answers are valid, but the safest and most reliable option is to ‘keep it simple’. Structure your answers around the material provided, rather than trying to pin the data onto a pre-learned theoretical answer. In your 25-mark essays, write an informed, critical conclusion weighing up your argument, not a summary. Return to the question, and answer it - avoiding the personal pronoun is preferred - in an informed and reasoned framework. with its registered office at 80 Strand, London, WC2R 0RL, United Kingdom
Notes from the mark scheme and report
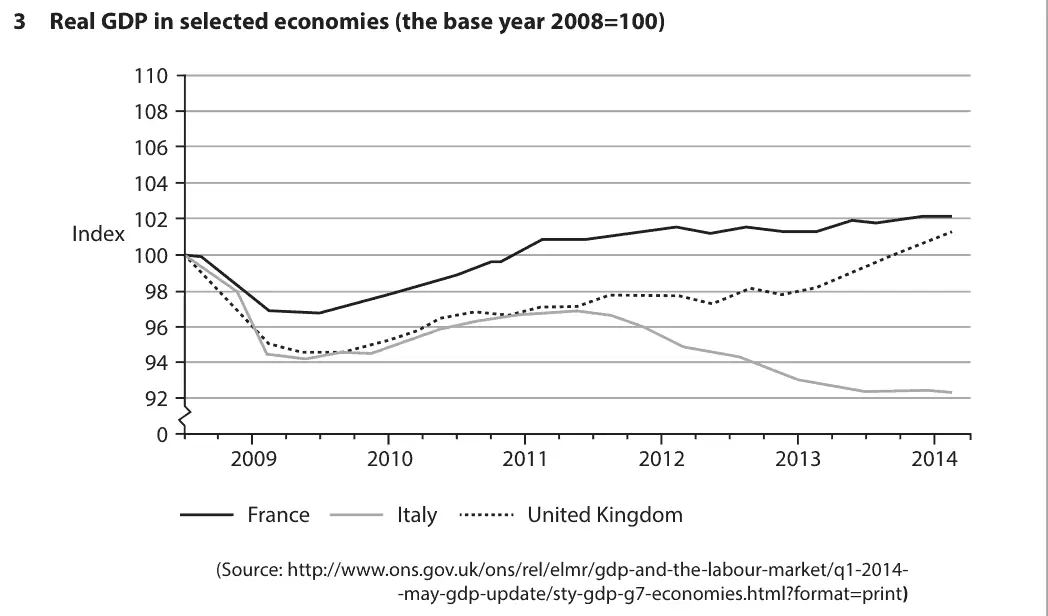
factors determining growth relative to other developed economies (Figure 3), actual or potential
micro factors (infrastructure, skills, technology, labour costs) were often missing
Level 4 needs Germany in context
evaluation must criticise the point, not just state the opposite
Quantitative skills: QS 9 (interpret, apply and analyse information in written, graphical tabular and numerical forms)
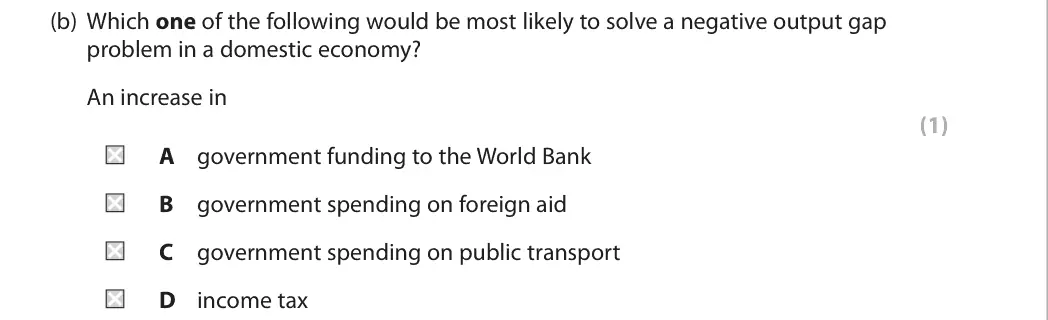
October 2020 · Paper 2 · Q5(b)1 markMultiple choice
Data and extracts for question 5
Answer
C
Mark scheme
Examiner's comment
Question 5 consists mainly of a draw question, and the vast majority of students demonstrated a very good understanding of what an AD/AS diagram should look like, and what should be happening on it in this case study- i.e. an increase in either aggregate supply and/or aggregate demand. Section B, the data response section, is based on information provided in the exam paper about trade and development issues in Africa. This includes 2 figures and 2 extracts on different issues.
Notes from the mark scheme and report
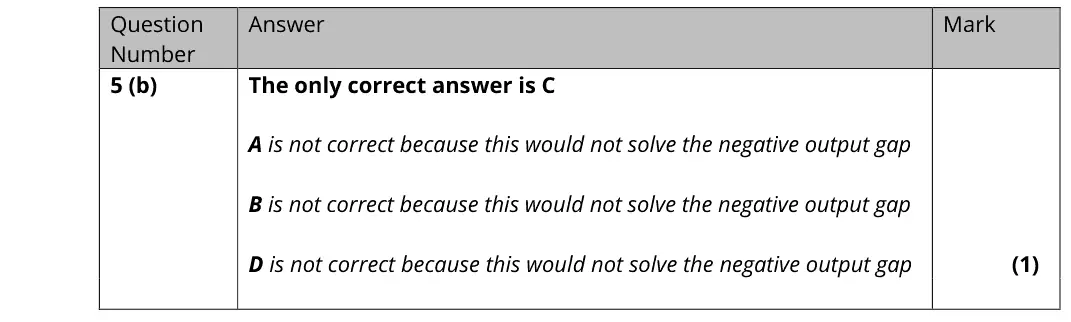
spending on public transport is a domestic injection that raises AD and closes a negative output gap (C)
World Bank funding and foreign aid leave the domestic circular flow
a higher income tax reduces AD
October 2020 · AS Paper 2 · Q6(e)15 marksAO1=3, AO2=3, AO3=3, AO4=615-mark responseHard
Data and extracts for question 6
Mark scheme, including the levels grid and indicative content
Examiner's comment
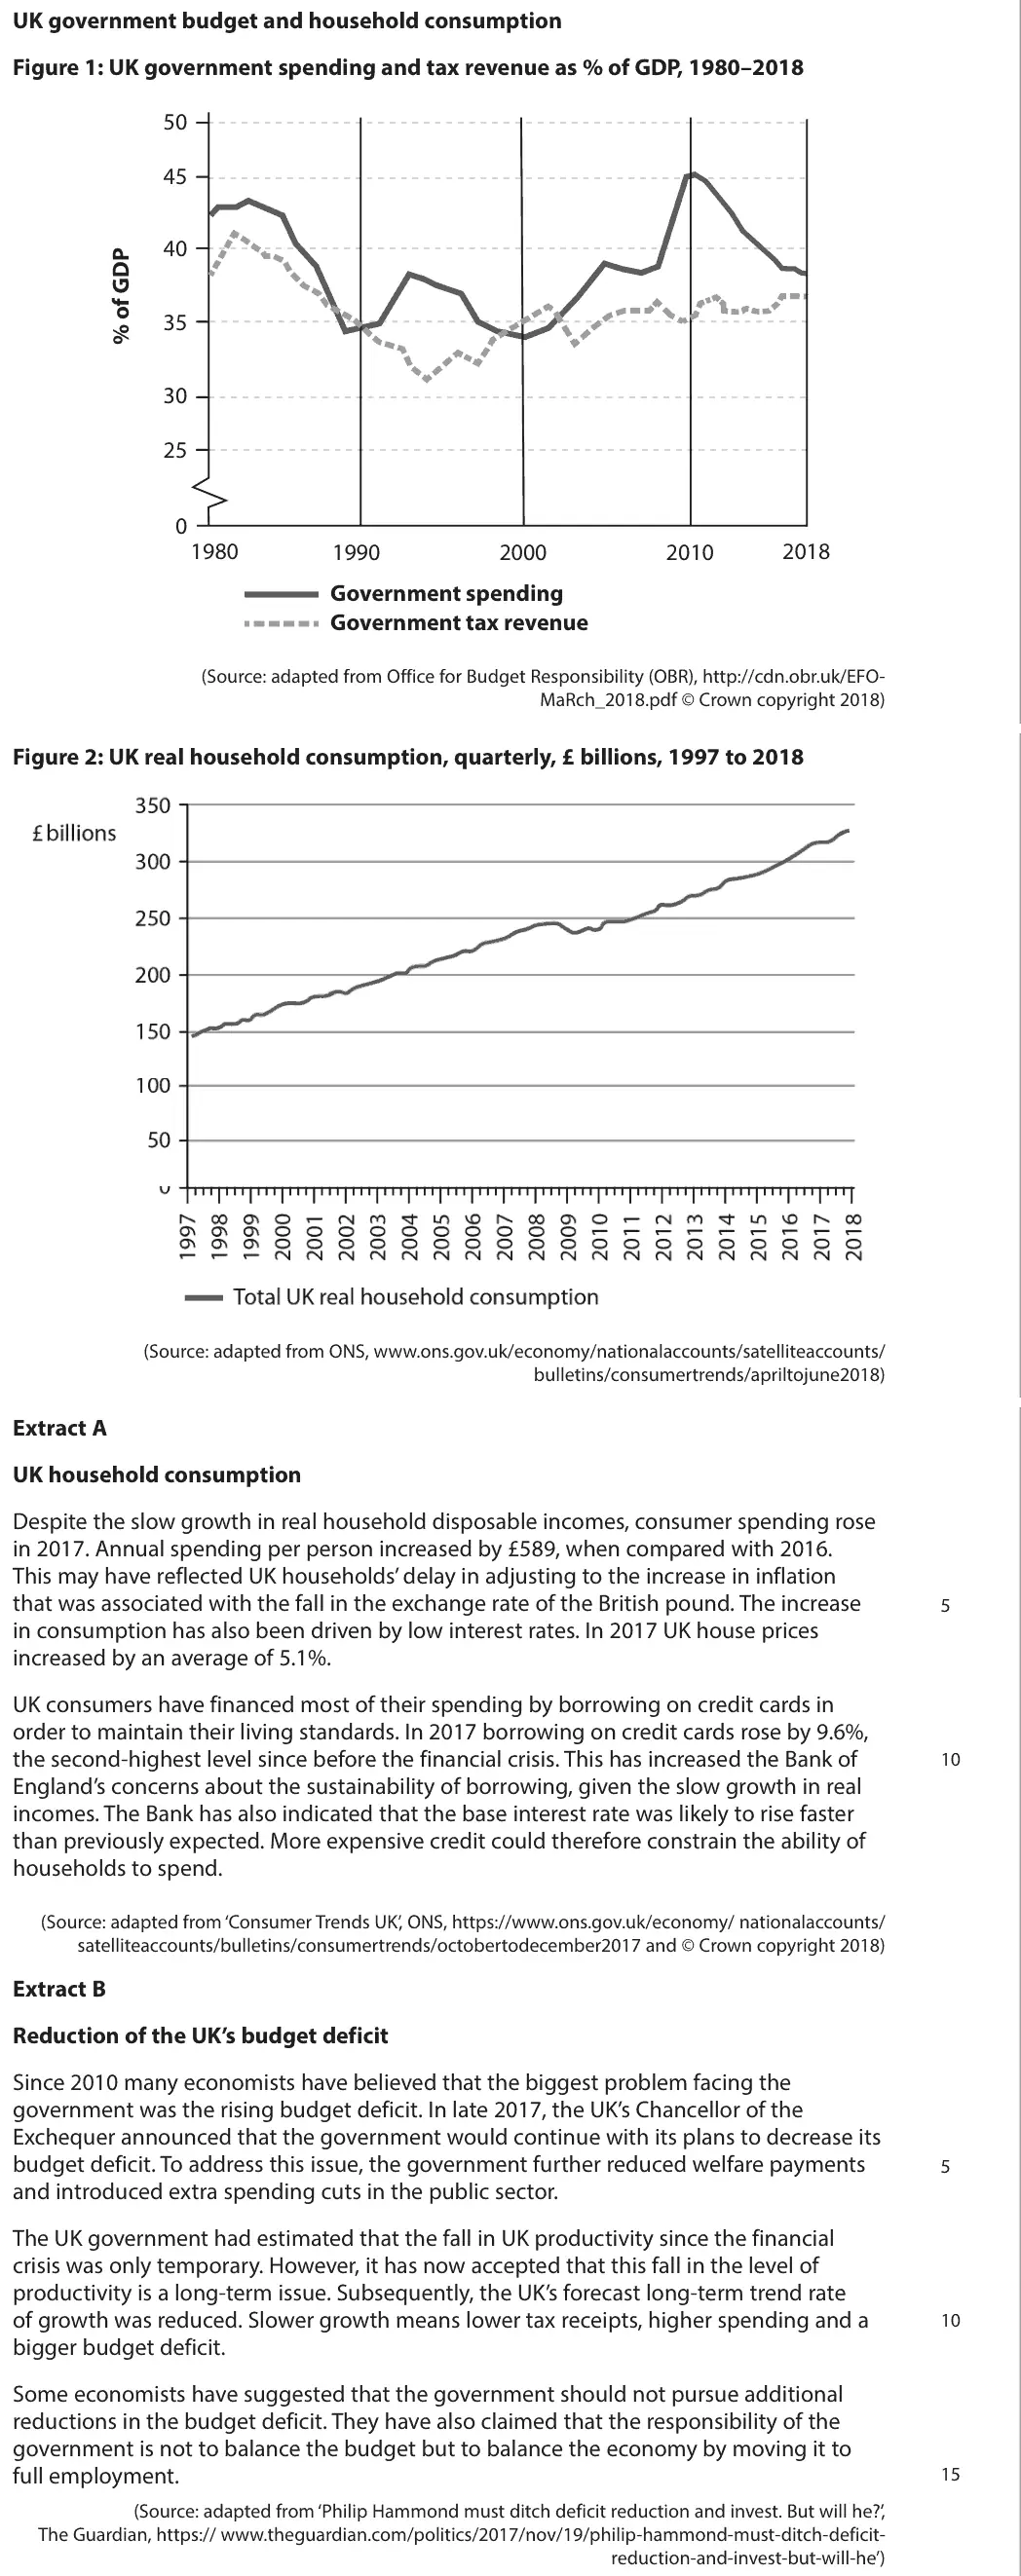
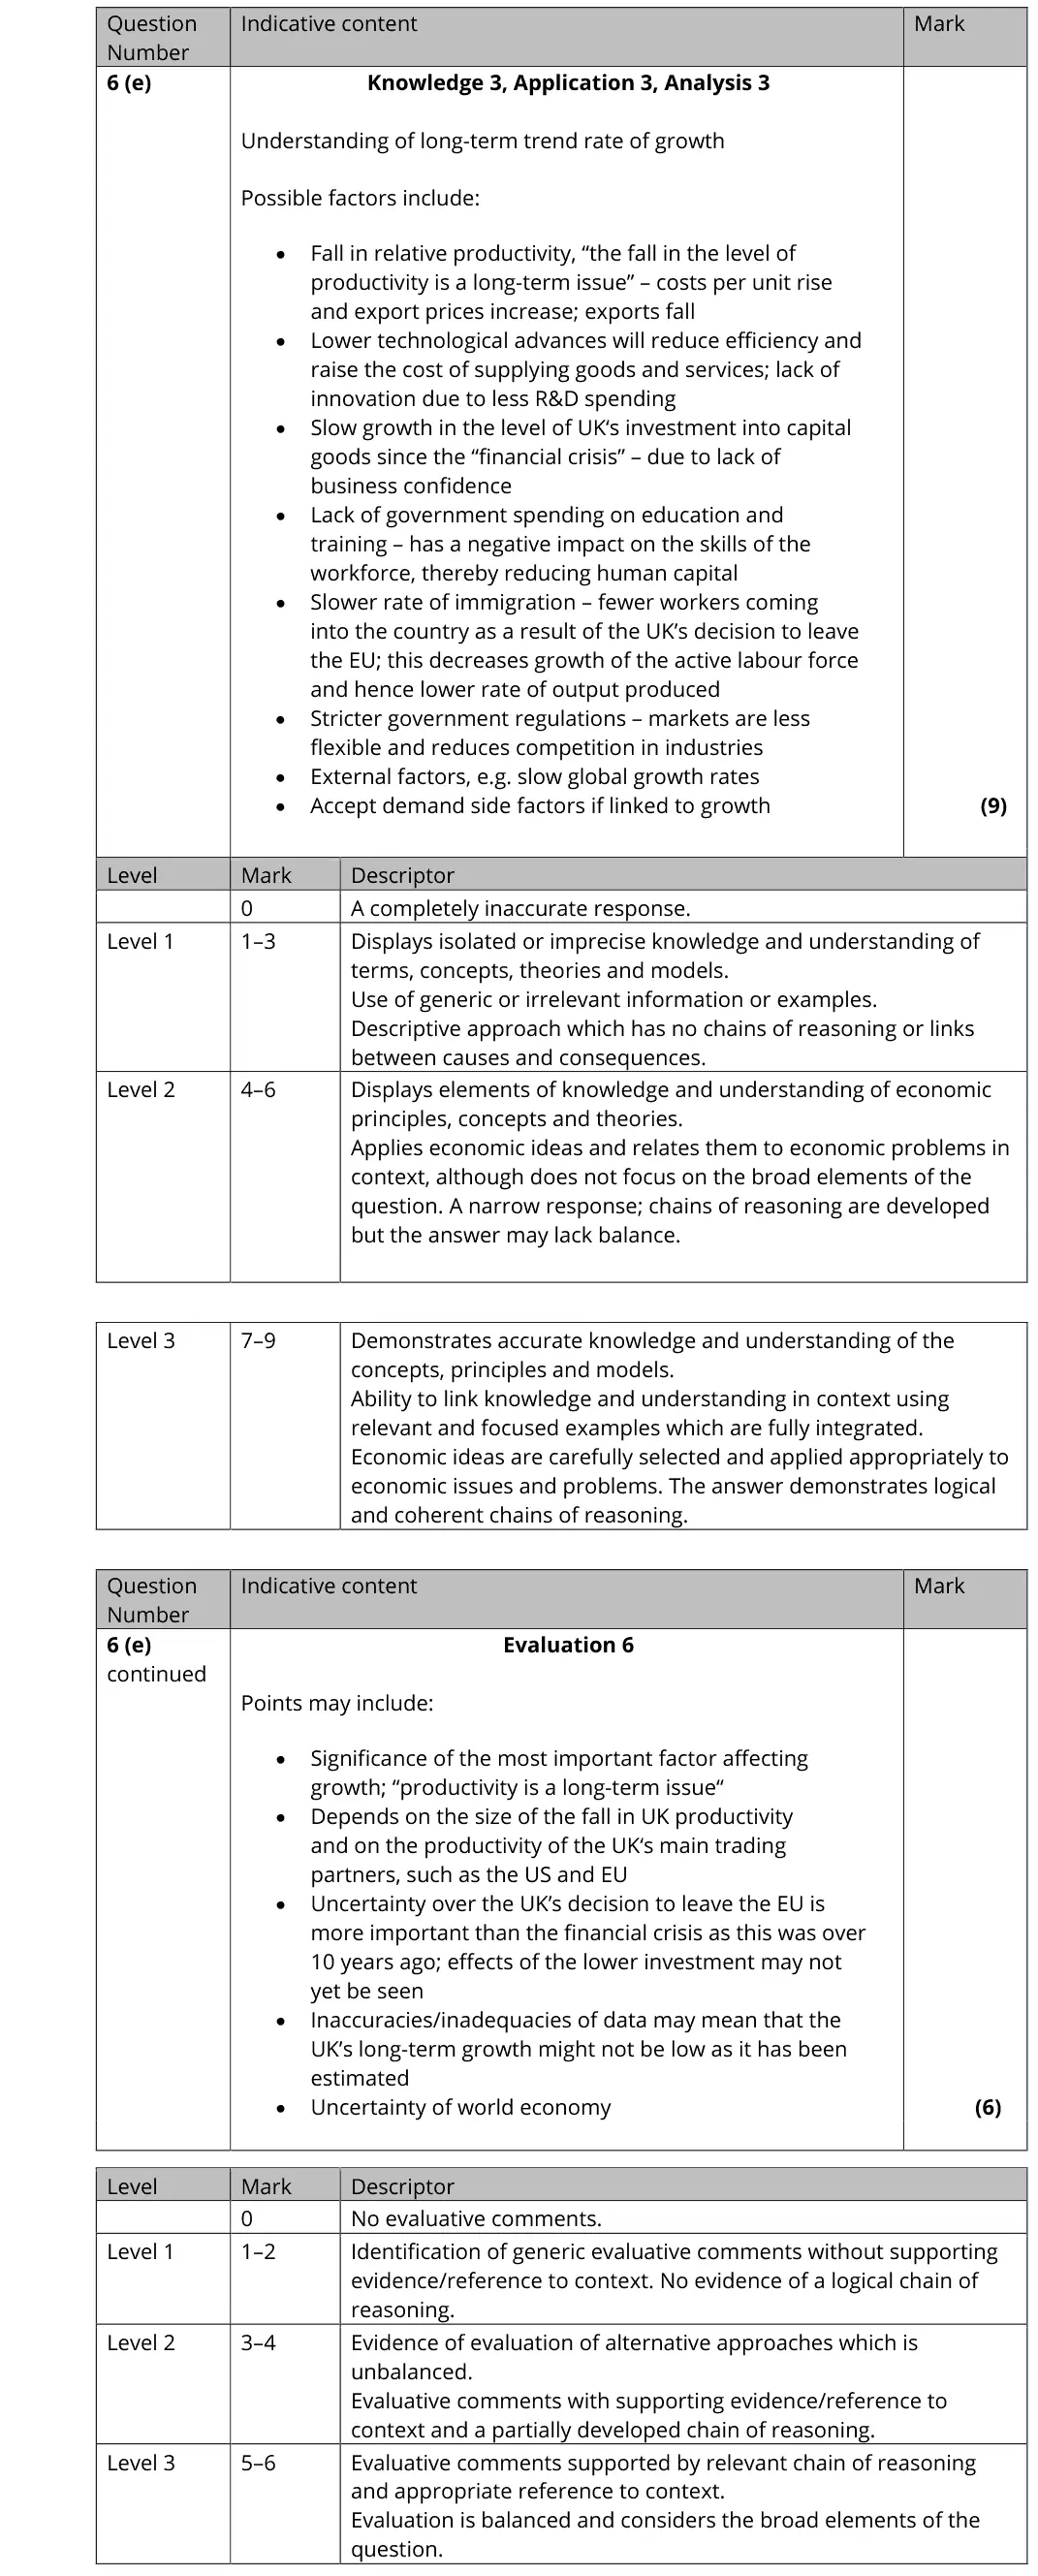
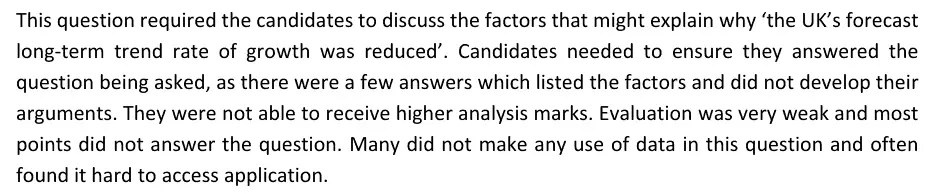
This question required the candidates to discuss the factors that might explain why ‘the UK’s forecast long-term trend rate of growth was reduced’. Candidates needed to ensure they answered the question being asked, as there were a few answers which listed the factors and did not develop their arguments. They were not able to receive higher analysis marks. Evaluation was very weak and most points did not answer the question. Many did not make any use of data in this question and often found it hard to access application.
Notes from the mark scheme and report
trend growth depends on LRAS: low productivity (Extract B), weak investment since the crisis, lower migration, skills
develop rather than list factors
report: "Evaluation was very weak and most points did not answer the question", many did not use data
June 2019 · AS Paper 2 · Q2(b)2 marksAO1=2Short answer
Mark scheme
Examiner's comment
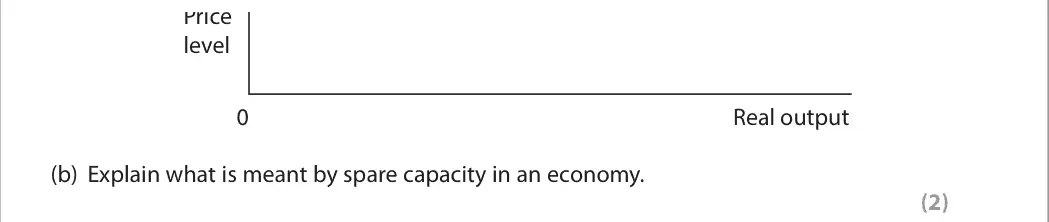
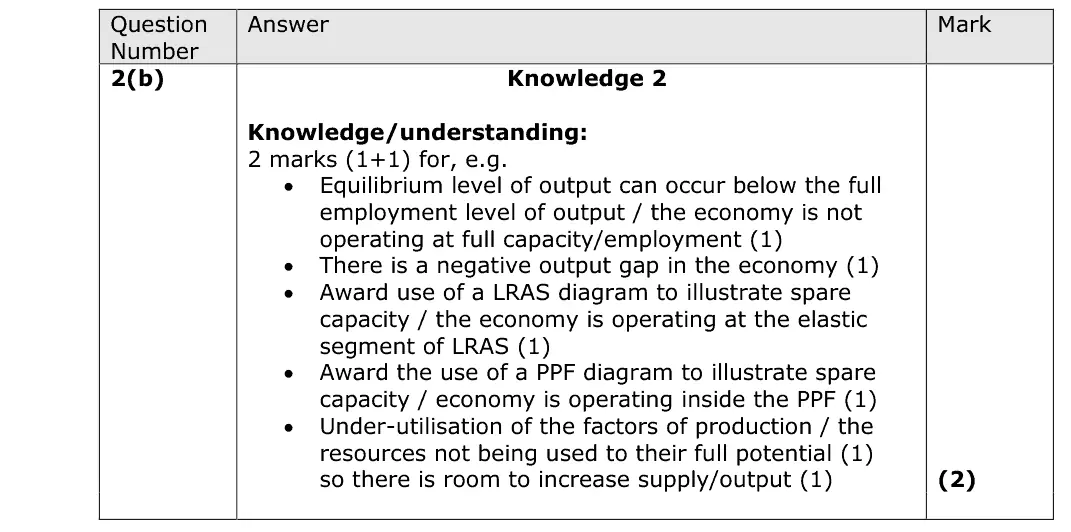
This question required candidates to explain the explanation of spare capacity. Many candidates were able to identify a point but often did not explain the point they had identified.
Notes from the mark scheme and report
output below the full-capacity (full employment) level, unemployed resources, a negative output gap
may use the elastic section of Keynesian LRAS
report: many identified a point but did not explain it
June 2018 · AS Paper 2 · Q2(a)1 markAO1=1Definition
Mark scheme
Examiner's comment
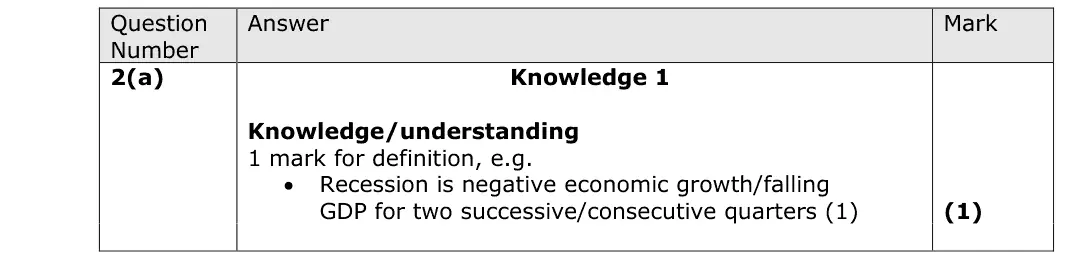
This question requires an accurate definition of a recession. Candidates were not asked to state the characteristics of a recession in this question. This candidate has an accurate definition of recession and as such achieves the 1 mark available. This candidate does not define recession accurately and hence does not attain the 1 mark available.
Notes from the mark scheme and report
negative economic growth (falling real GDP) for two consecutive quarters
do not list characteristics
June 2018 · AS Paper 2 · Q2(b)2 marksAO1=2Short answer
Mark scheme
Examiner's comment
This question required candidates to explain only one characteristic of a recession. Many candidates listed several characteristics and did not often explain the characteristic they had identified. This candidate gets 2/2 marks. They have identified and explained a characteristic of a recession. This candidate gets 1/2 marks. They have only identified a characteristic of a recession but have not given an explanation.
Notes from the mark scheme and report
one characteristic (rising unemployment, falling inflation, falling profits/investment, larger budget deficit) plus a reason
many listed several without explaining one
June 2018 · AS Paper 2 · Q2(c)1 markMultiple choice
Answer
B
Mark scheme
Notes from the mark scheme and report
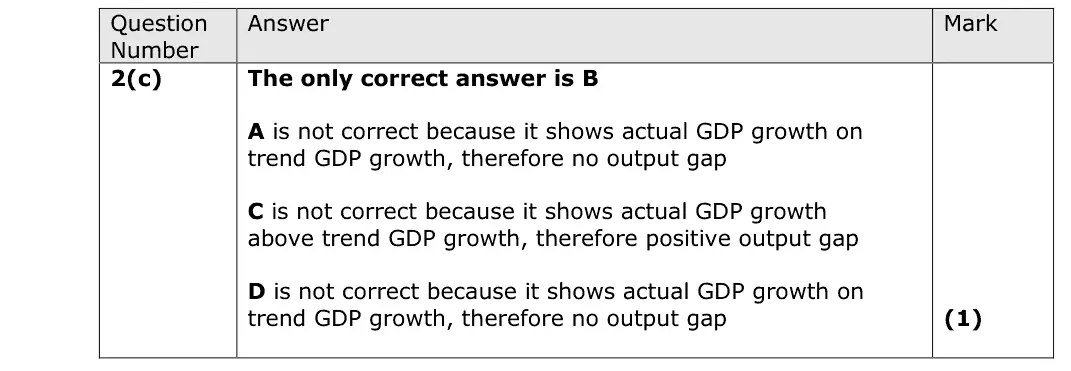
B is where actual GDP is below trend GDP = negative output gap
A and D are on trend (no gap), C is above trend (positive gap)
Quantitative skills: QS 4 (construct and interpret a range of standard graphical forms)
June 2017 · AS Paper 2 · Q3(c)1 markAO1=1Diagram
Data and extracts for question 3
Mark scheme
Examiner's comment
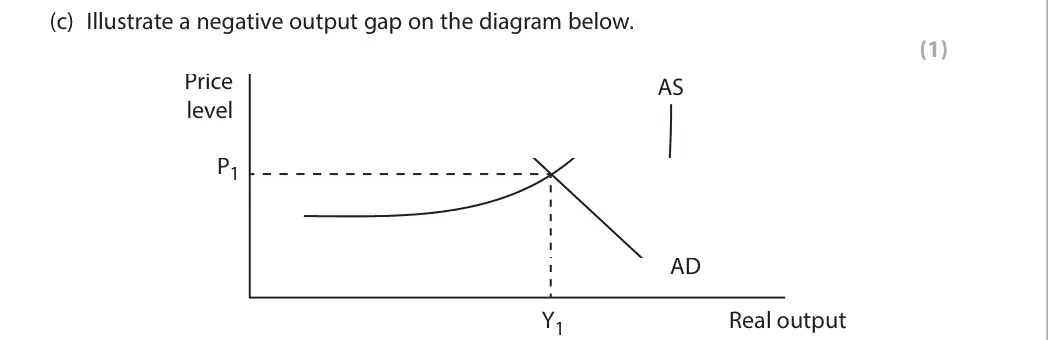
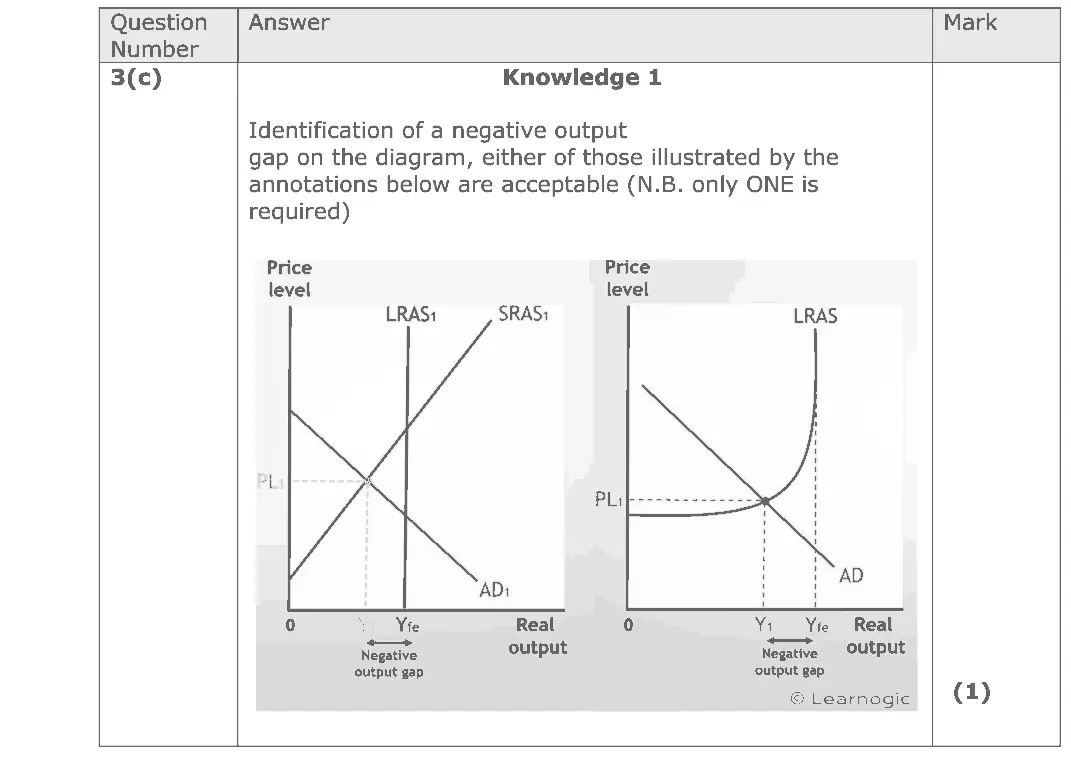
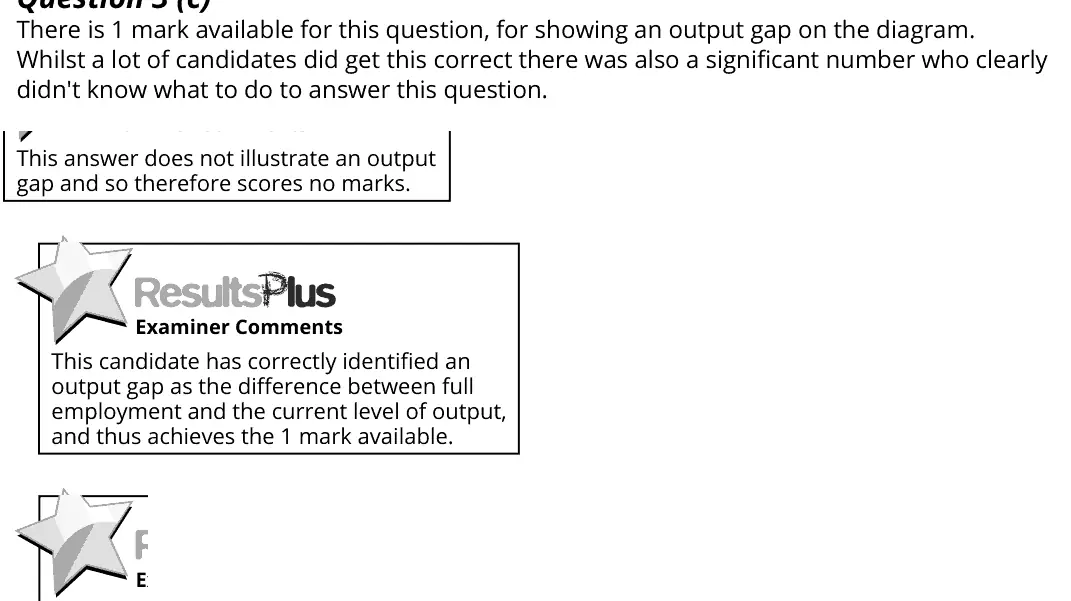
There is 1 mark available for this question, for showing an output gap on the diagram. Whilst a lot of candidates did get this correct there was also a significant number who clearly didn't know what to do to answer this question. This answer does not illustrate an output gap and so therefore scores no marks. This candidate has correctly identified an output gap as the difference between full employment and the current level of output, and thus achieves the 1 mark available.
Notes from the mark scheme and report
mark the gap between current real output Y1 and full-capacity output where AS becomes vertical
many did not know what to show
Quantitative skills: QS 4 (construct and interpret a range of standard graphical forms)
June 2017 · AS Paper 2 · Q6(f)20 marksAO1=4, AO2=4, AO3=6, AO4=620-mark essayEither/or
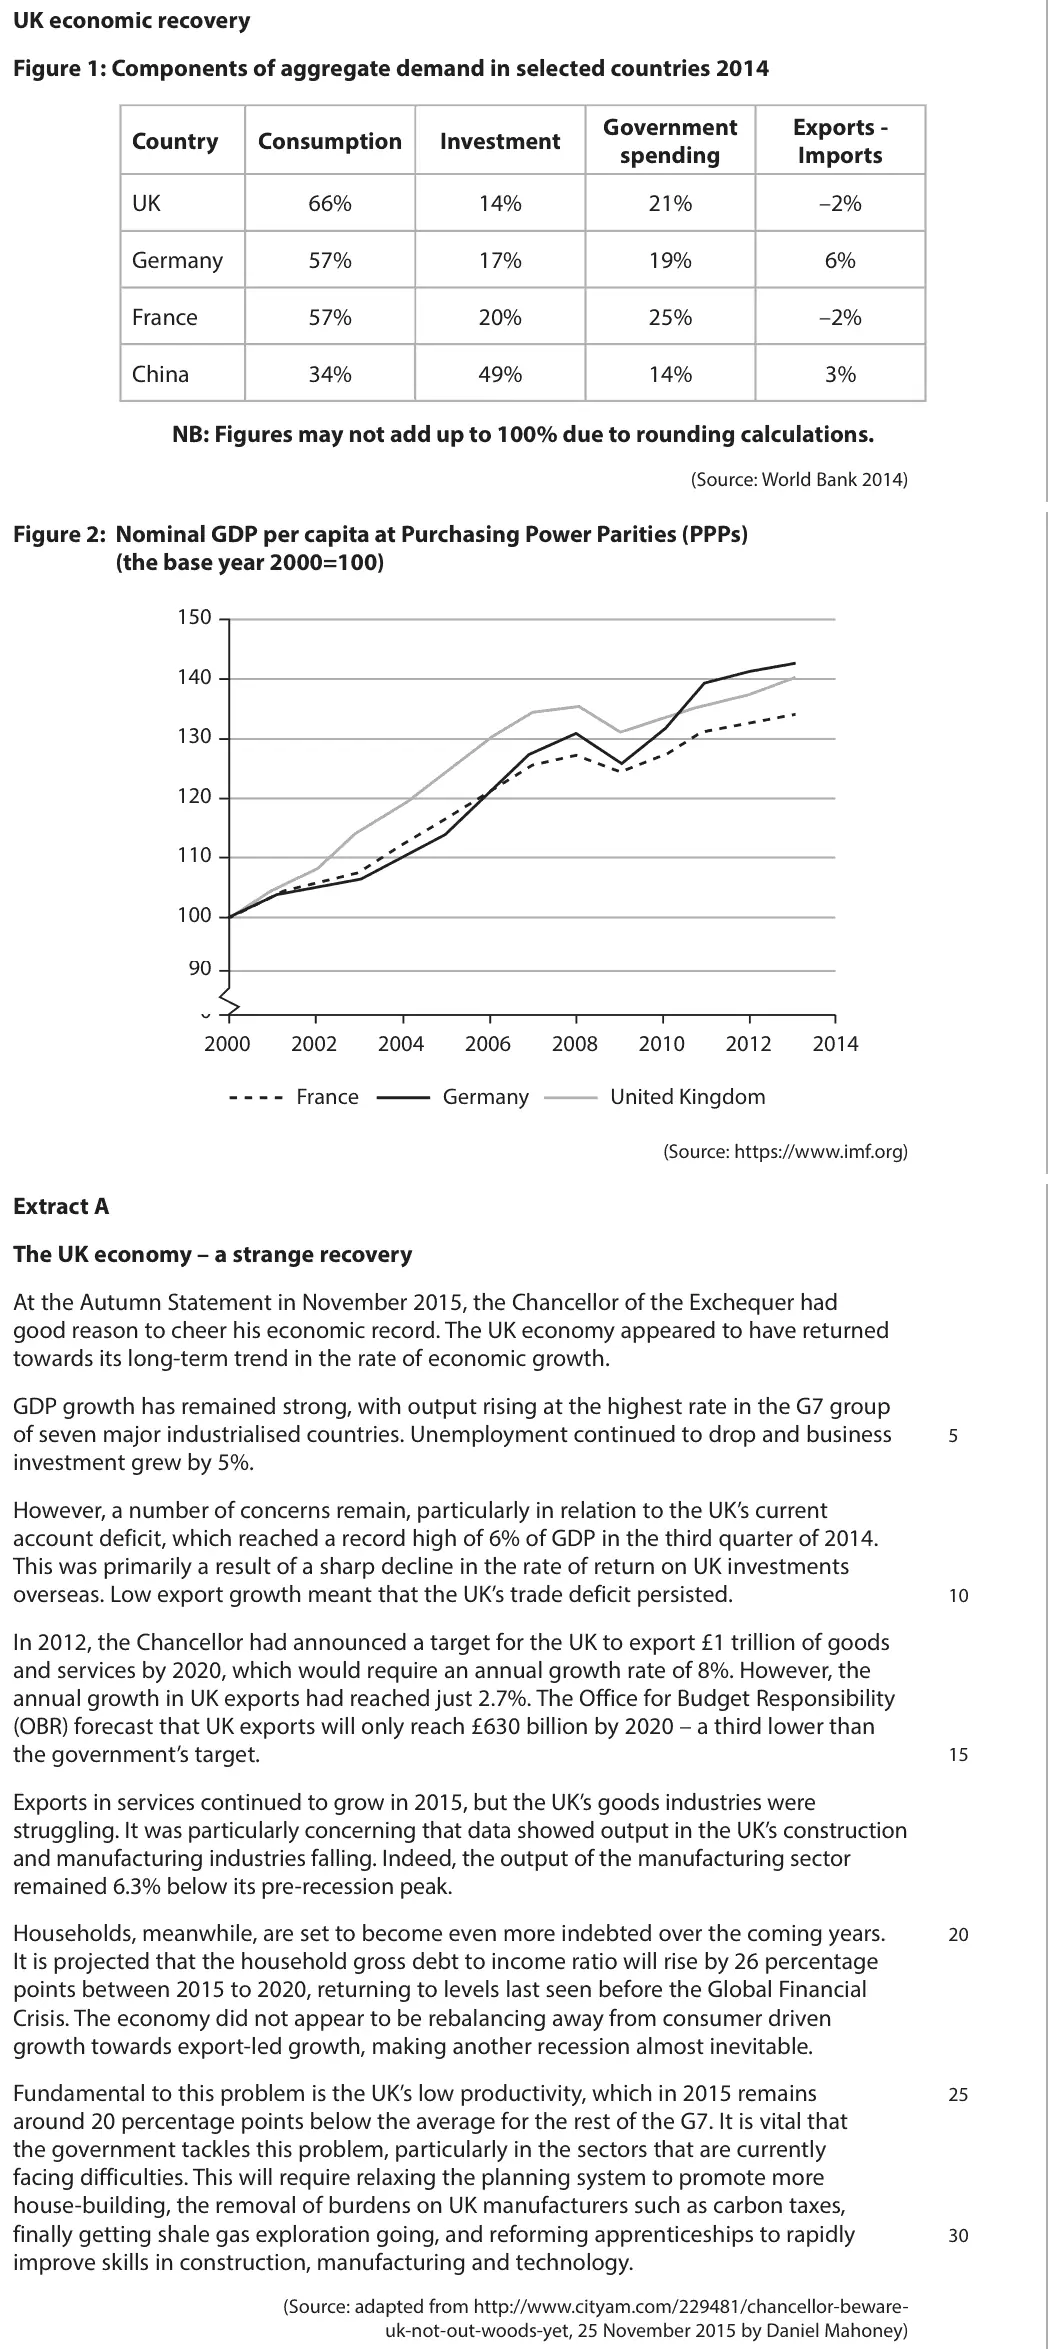
Data and extracts for question 6
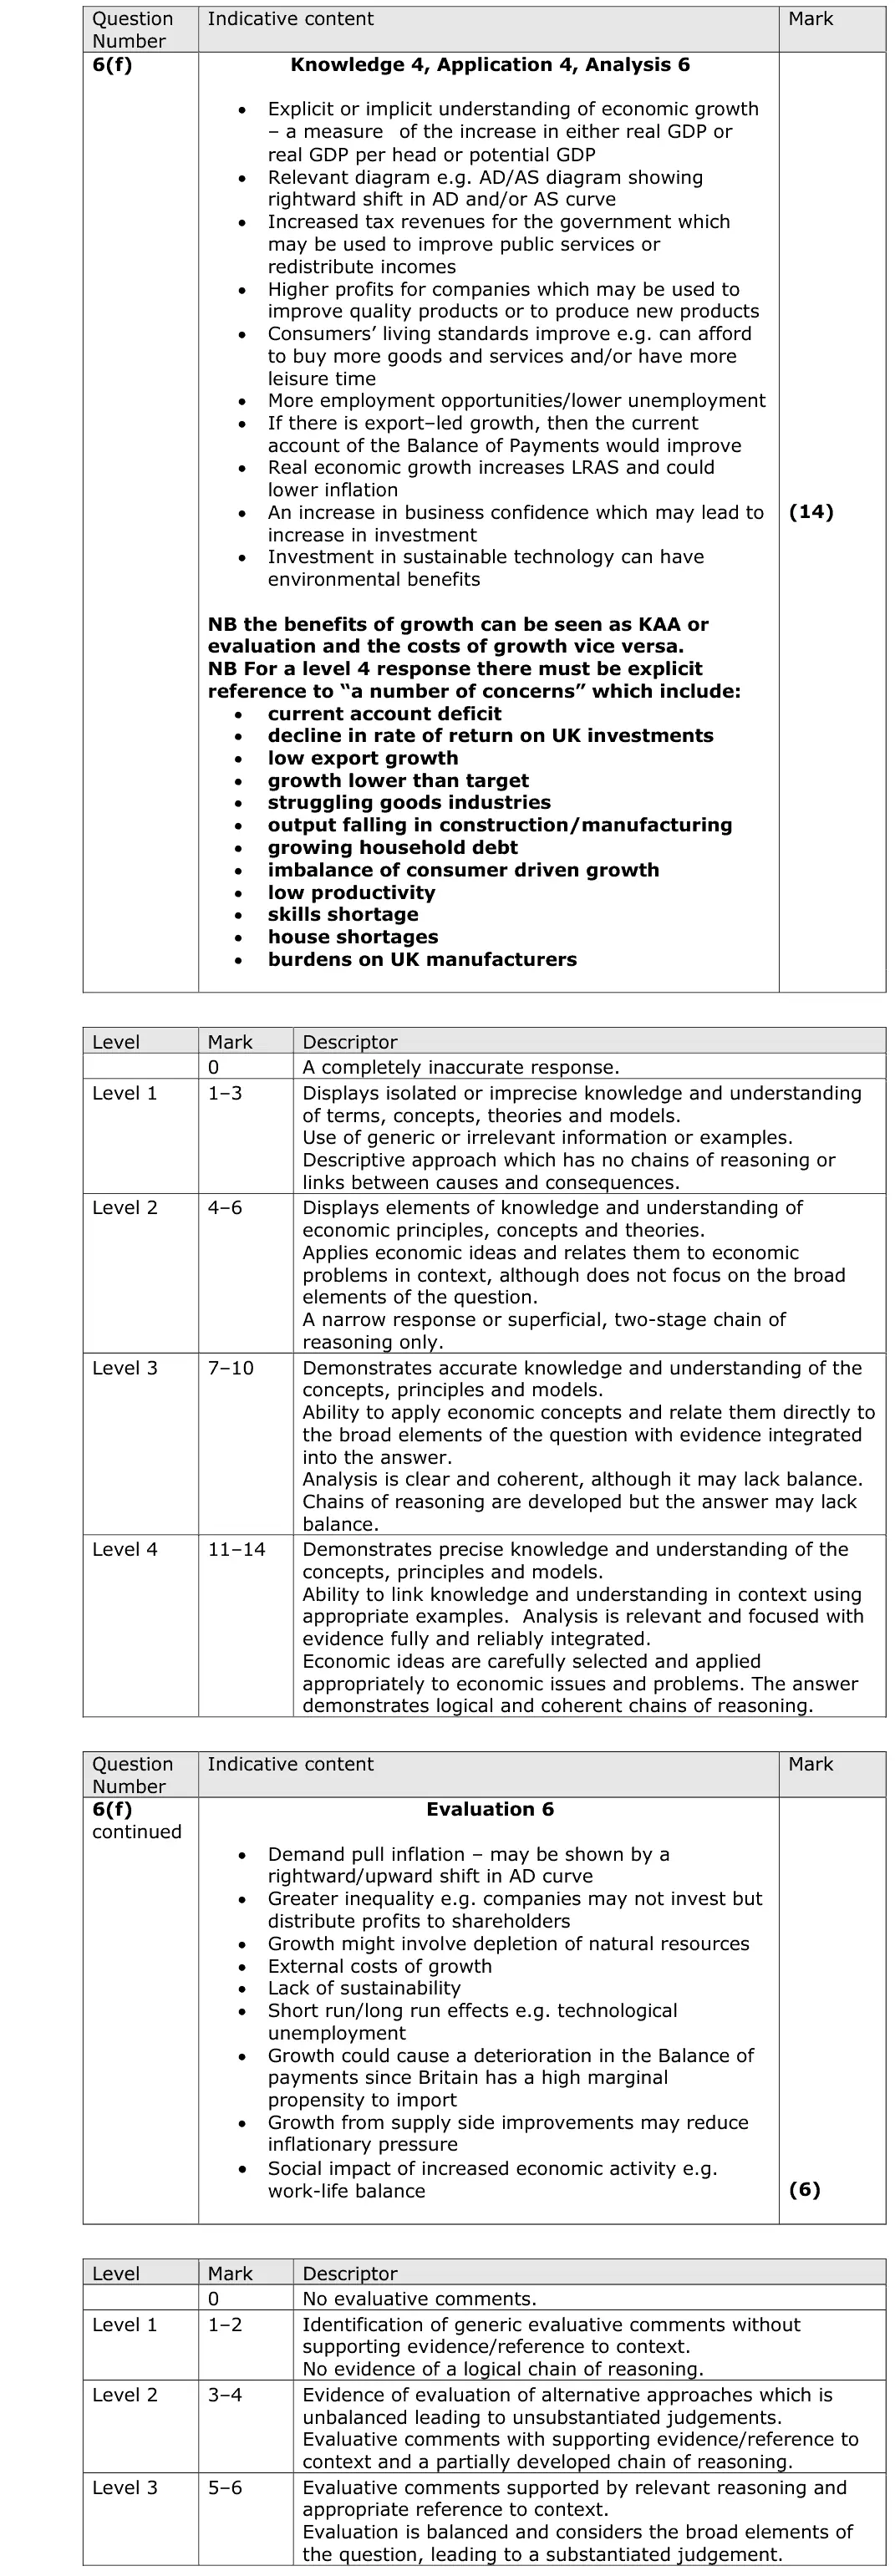
Mark scheme, including the levels grid and indicative content
Examiner's comment
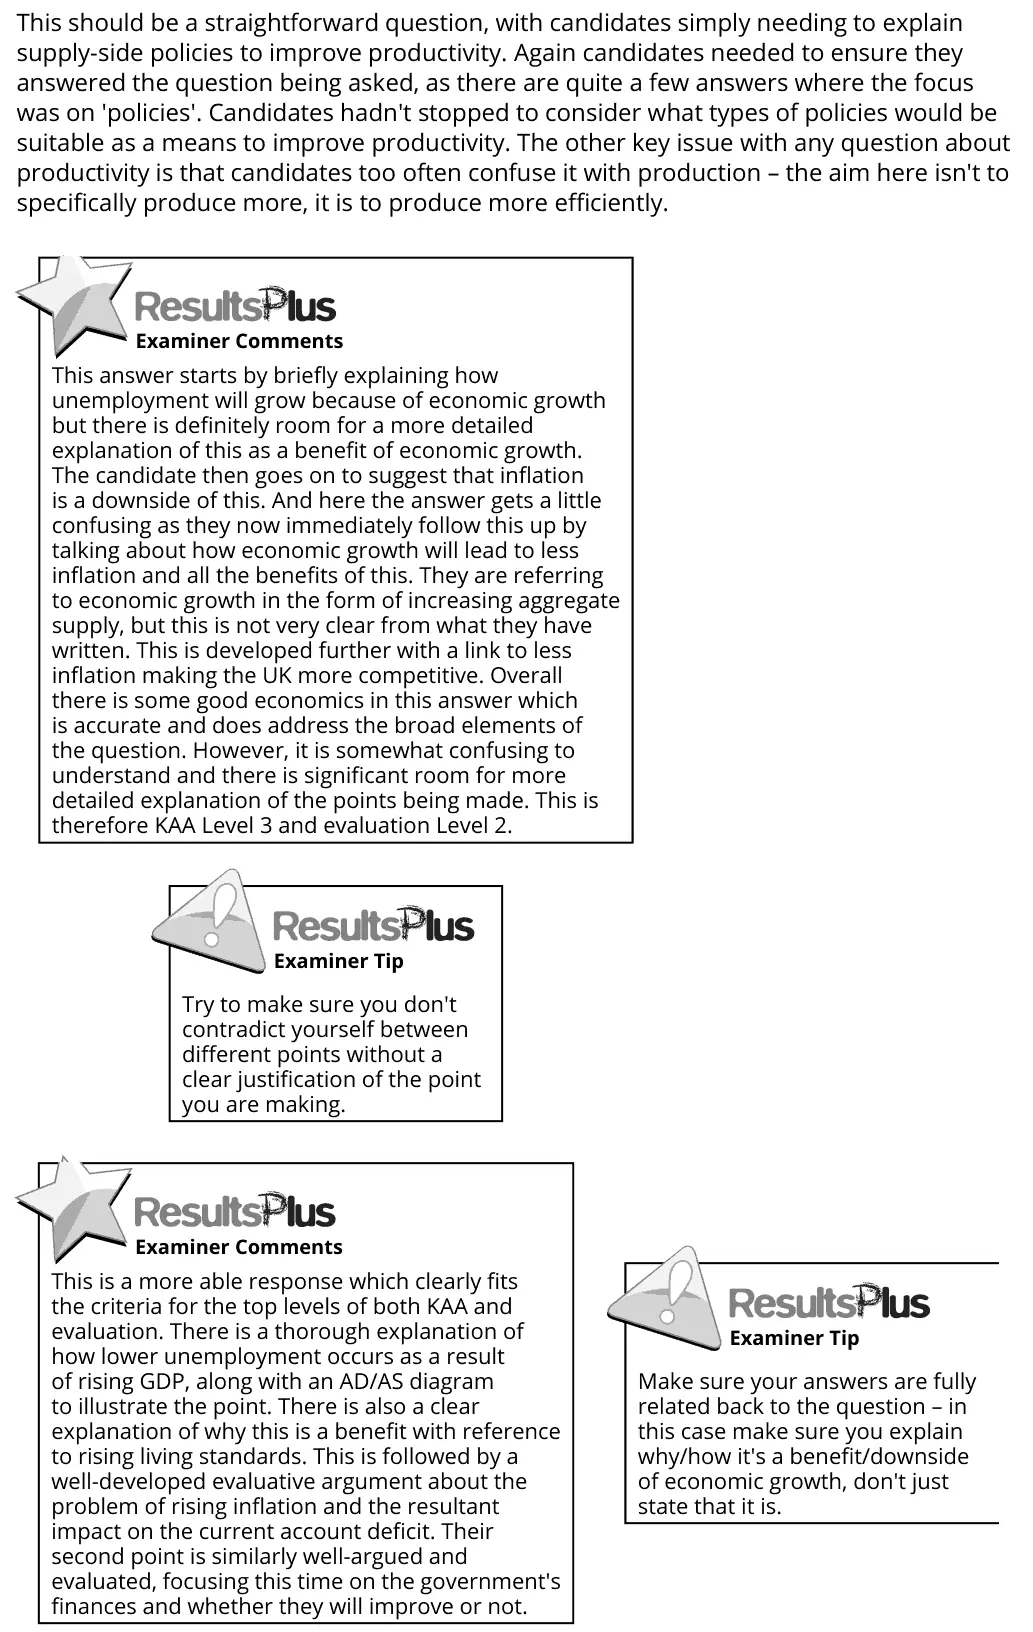
This should be a straightforward question, with candidates simply needing to explain supply-side policies to improve productivity. Again candidates needed to ensure they answered the question being asked, as there are quite a few answers where the focus was on 'policies'. Candidates hadn't stopped to consider what types of policies would be suitable as a means to improve productivity. The other key issue with any question about productivity is that candidates too often confuse it with production – the aim here isn't to specifically produce more, it is to produce more efficiently. This answer starts by briefly explaining how unemployment will grow because of economic growth but there is definitely room for a more detailed explanation of this as a benefit of economic growth. The candidate then goes on to suggest that inflation is a downside of this. And here the answer gets a little confusing as they now immediately follow this up by talking about how economic growth will lead to less inflation and all the benefits of this. They are referring to economic growth in the form of increasing aggregate supply, but this is not very clear from what they have written. This is developed further with a link to less inflation making the UK more competitive. Overall there is some good economics in this answer which is accurate and does address the broad elements of the question. However, it is somewhat confusing to understand and there is significant room for more detailed explanation of the points being made. This is therefore KAA Level 3 and evaluation Level 2. Try to make sure you don't contradict yourself between different points without a clear justification of the point you are making. This is a more able response which clearly fits the criteria for the top levels of both KAA and evaluation. There is a thorough explanation of how lower unemployment occurs as a result of rising GDP, along with an AD/AS diagram to illustrate the point. There is also a clear explanation of why this is a benefit with reference to rising living standards. This is followed by a well-developed evaluative argument about the problem of rising inflation and the resultant impact on the current account deficit. Their second point is similarly well-argued and evaluated, focusing this time on the government's finances and whether they will improve or not. Make sure your answers are fully related back to the question – in this case make sure you explain why/how it's a benefit/downside of economic growth, don't just state that it is.
Notes from the mark scheme and report
benefits: living standards, employment, tax revenue, profits and investment, LRAS growth lowering inflation
Level 4 needs explicit reference to the 'concerns' (current account deficit, low export growth, household debt)
evaluate with costs of growth
June 2017 · AS Paper 2 · Q6(g)20 marksAO1=4, AO2=4, AO3=6, AO4=620-mark essayEither/or
Data and extracts for question 6
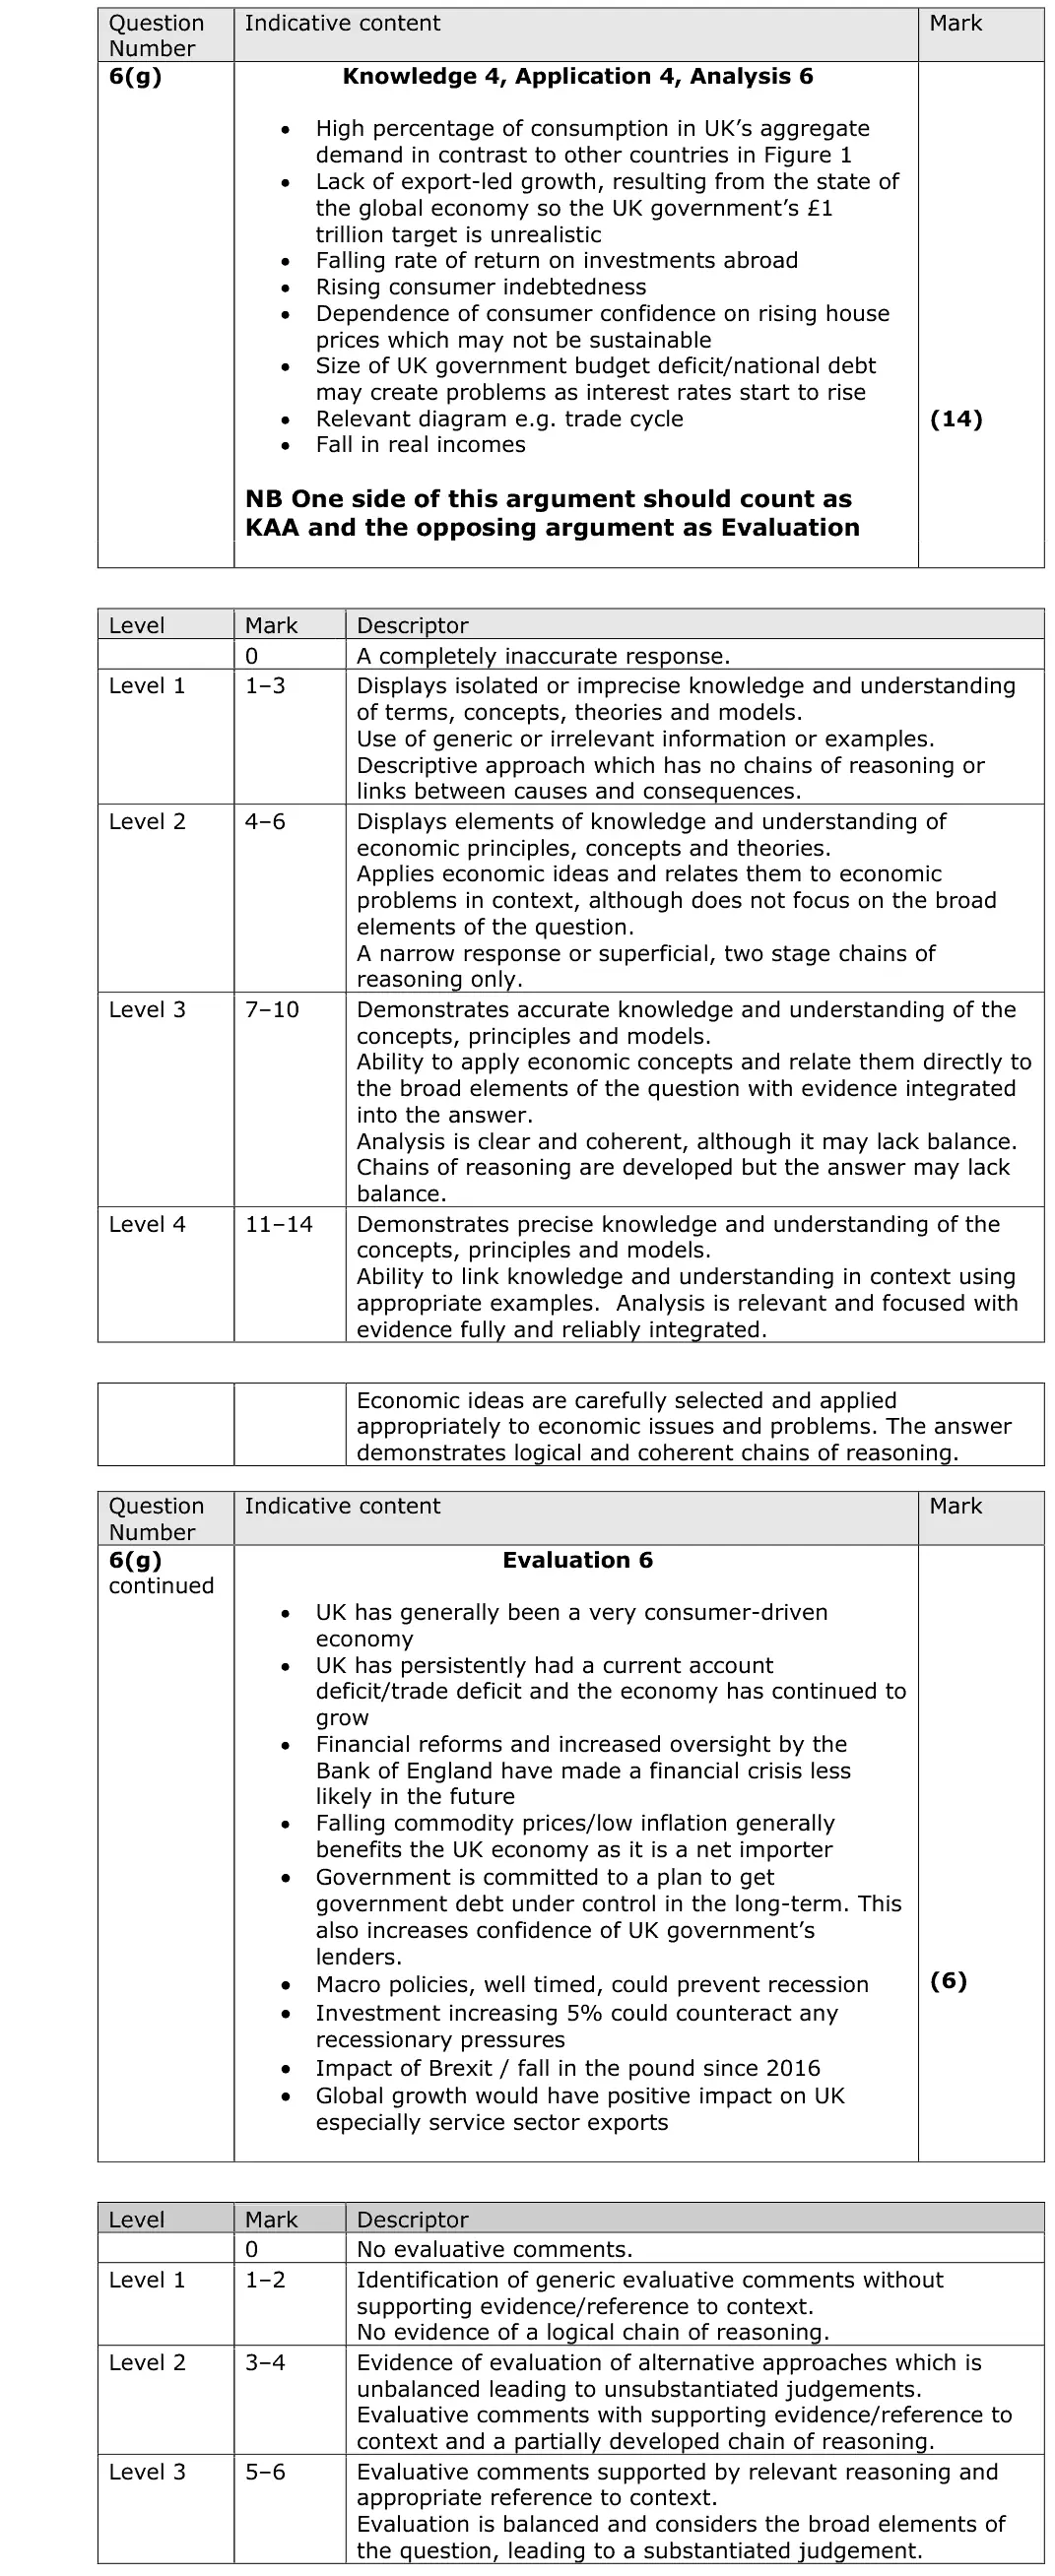
Mark scheme, including the levels grid and indicative content
Examiner's comment
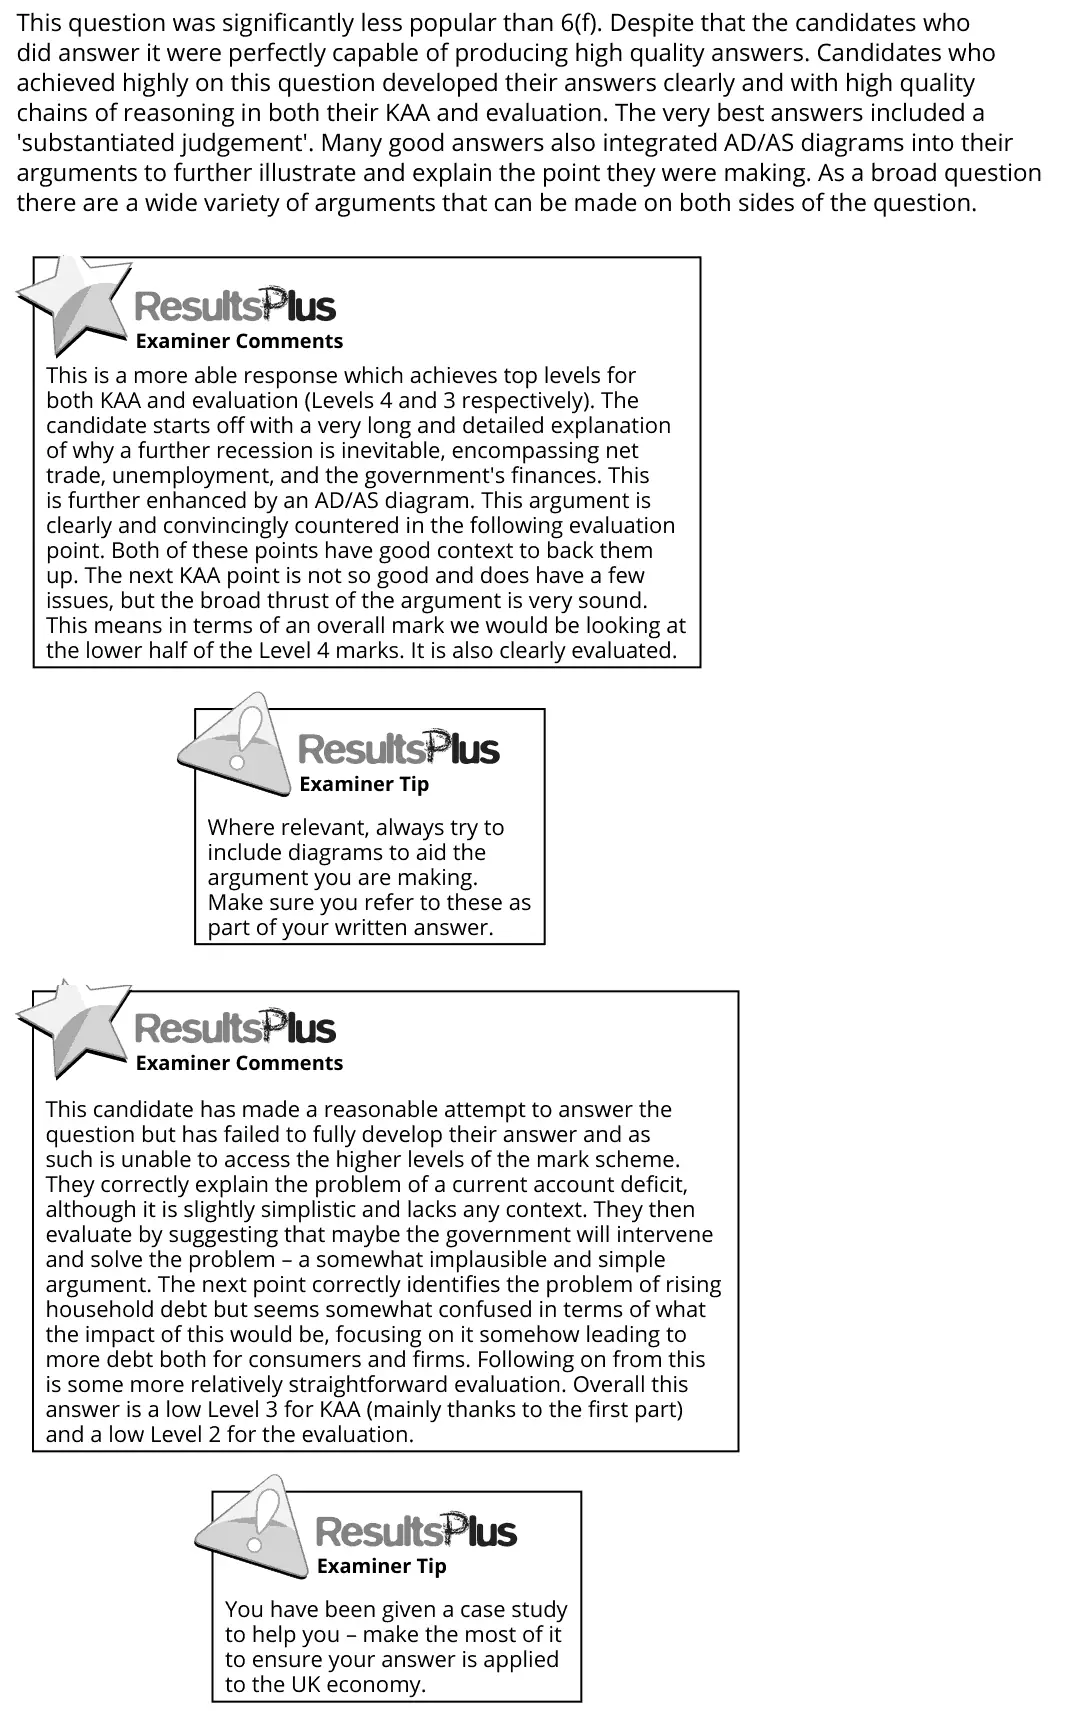
This question was significantly less popular than 6(f). Despite that the candidates who did answer it were perfectly capable of producing high quality answers. Candidates who achieved highly on this question developed their answers clearly and with high quality chains of reasoning in both their KAA and evaluation. The very best answers included a 'substantiated judgement'. Many good answers also integrated AD/AS diagrams into their arguments to further illustrate and explain the point they were making. As a broad question there are a wide variety of arguments that can be made on both sides of the question. This is a more able response which achieves top levels for both KAA and evaluation (Levels 4 and 3 respectively). The candidate starts off with a very long and detailed explanation of why a further recession is inevitable, encompassing net trade, unemployment, and the government's finances. This is further enhanced by an AD/AS diagram. This argument is clearly and convincingly countered in the following evaluation point. Both of these points have good context to back them up. The next KAA point is not so good and does have a few issues, but the broad thrust of the argument is very sound. This means in terms of an overall mark we would be looking at the lower half of the Level 4 marks. It is also clearly evaluated. Where relevant, always try to include diagrams to aid the argument you are making. Make sure you refer to these as part of your written answer. This candidate has made a reasonable attempt to answer the question but has failed to fully develop their answer and as such is unable to access the higher levels of the mark scheme. They correctly explain the problem of a current account deficit, although it is slightly simplistic and lacks any context. They then evaluate by suggesting that maybe the government will intervene and solve the problem – a somewhat implausible and simple argument. The next point correctly identifies the problem of rising household debt but seems somewhat confused in terms of what the impact of this would be, focusing on it somehow leading to more debt both for consumers and firms. Following on from this is some more relatively straightforward evaluation. Overall this answer is a low Level 3 for KAA (mainly thanks to the first part) and a low Level 2 for the evaluation. You have been given a case study to help you – make the most of it to ensure your answer is applied to the UK economy.
Notes from the mark scheme and report
for: consumption-led growth (66% of AD), rising household debt, weak exports and the missed £1 trillion target
June 2017 · Paper 3 · Q2(a)5 marksAO1=2, AO2=2, AO3=1Diagram
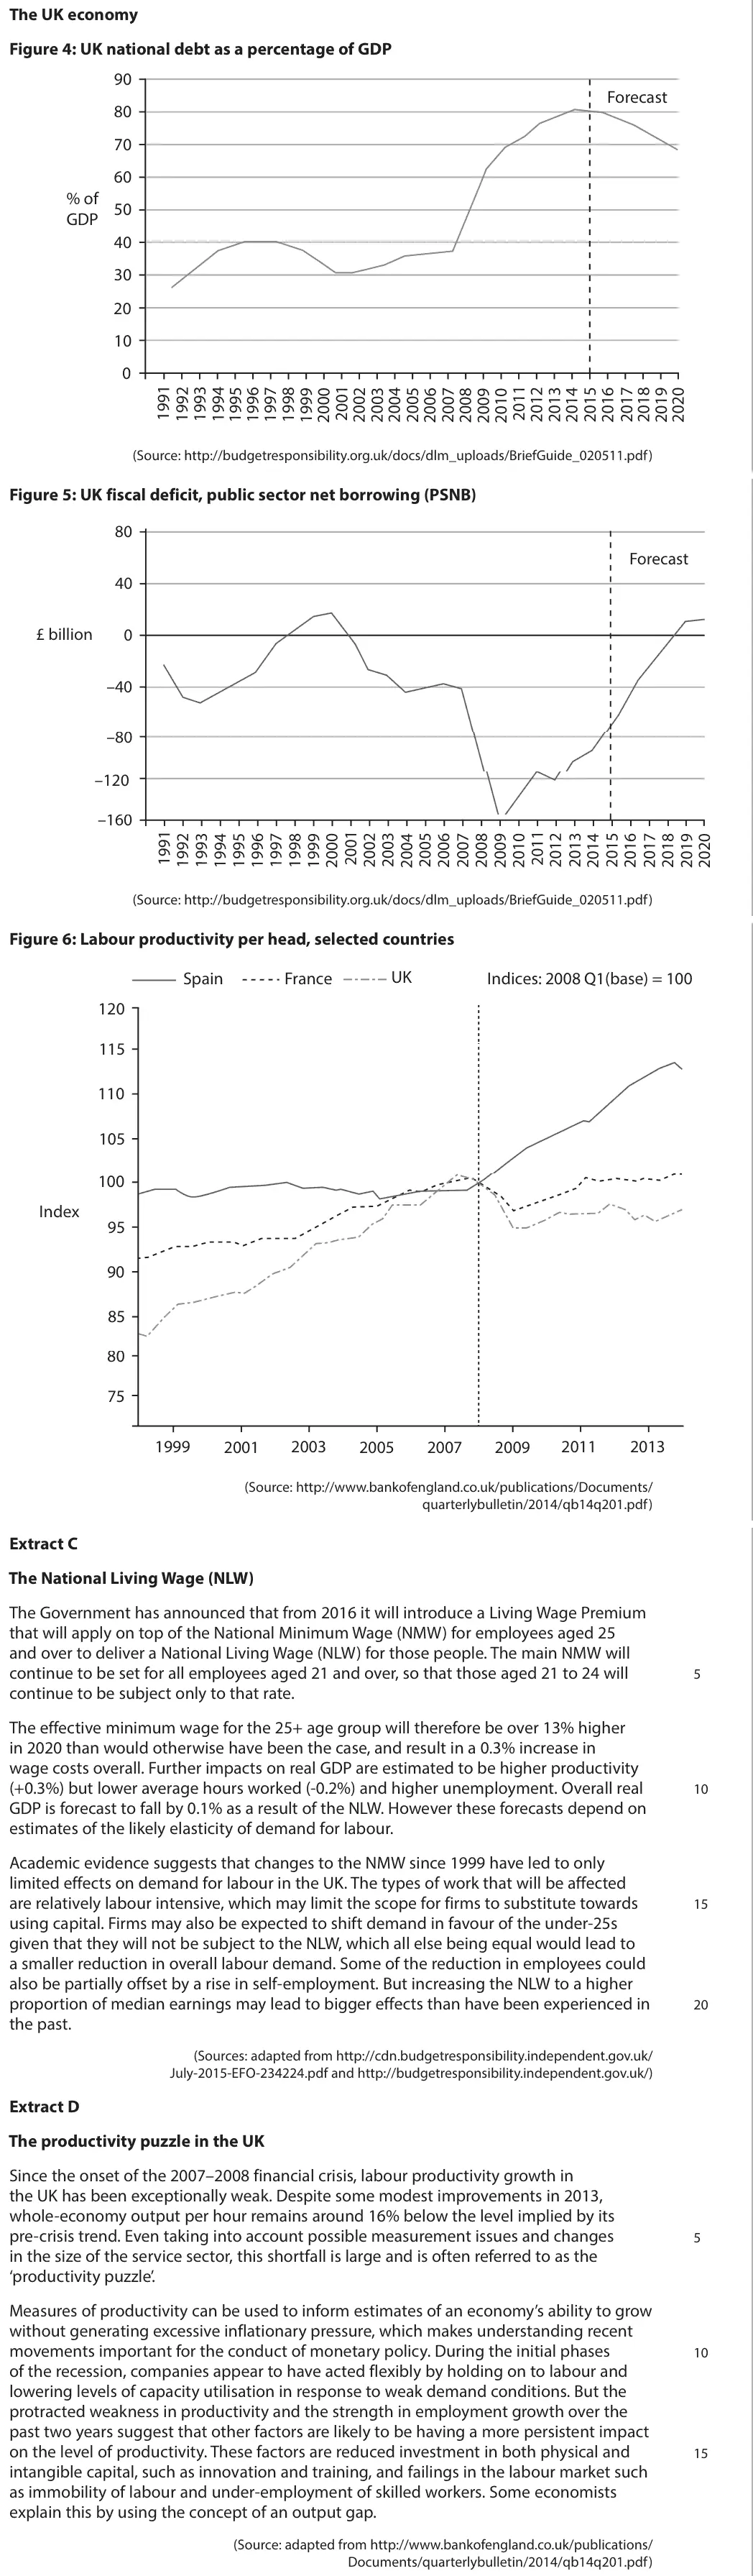
Data and extracts for question 2
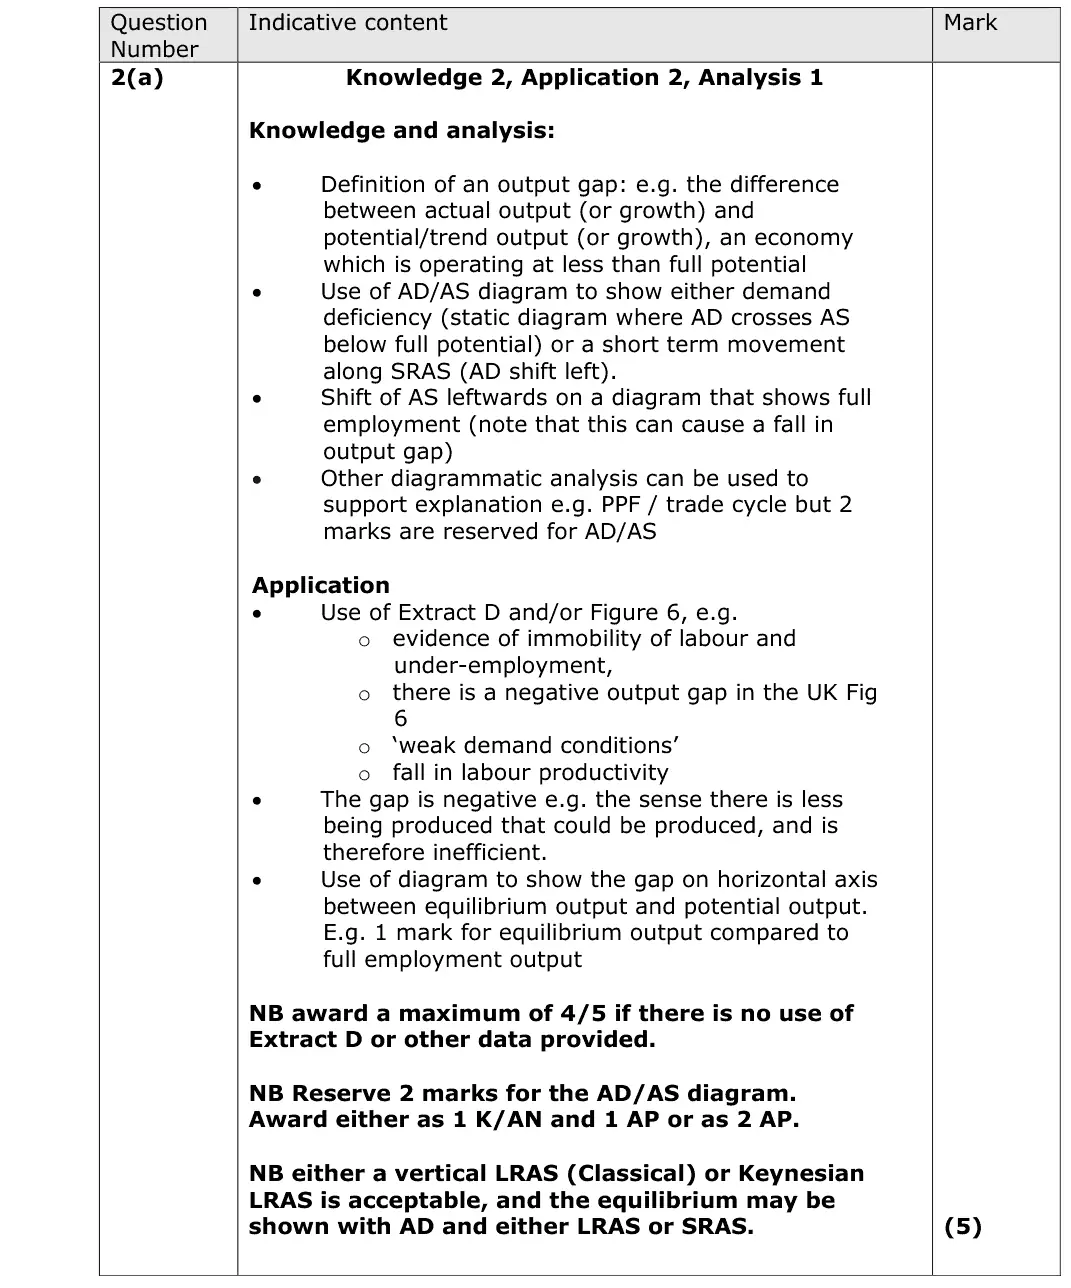
Mark scheme
Examiner's comment
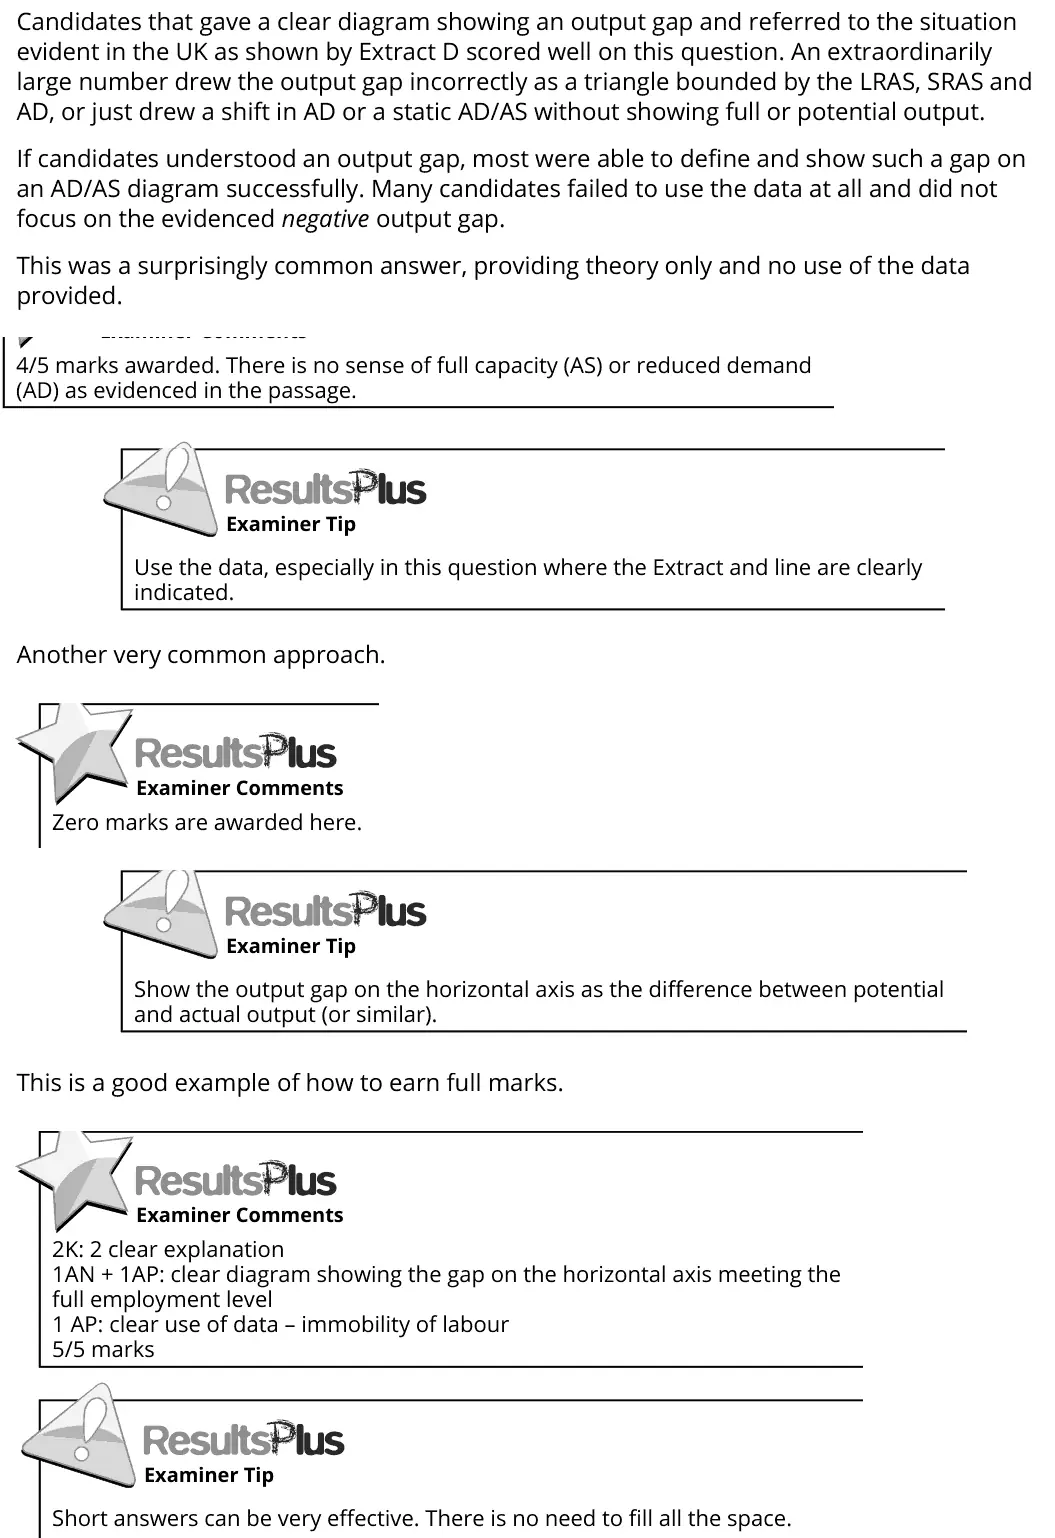
Candidates that gave a clear diagram showing an output gap and referred to the situation evident in the UK as shown by Extract D scored well on this question. An extraordinarily large number drew the output gap incorrectly as a triangle bounded by the LRAS, SRAS and AD, or just drew a shift in AD or a static AD/AS without showing full or potential output. If candidates understood an output gap, most were able to define and show such a gap on an AD/AS diagram successfully. Many candidates failed to use the data at all and did not focus on the evidenced negative output gap. This was a surprisingly common answer, providing theory only and no use of the data provided. 4/5 marks awarded. There is no sense of full capacity (AS) or reduced demand (AD) as evidenced in the passage. Another very common approach. Use the data, especially in this question where the Extract and line are clearly indicated. Zero marks are awarded here. This is a good example of how to earn full marks. Show the output gap on the horizontal axis as the difference between potential and actual output (or similar). 2K: 2 clear explanation 1AN + 1AP: clear diagram showing the gap on the horizontal axis meeting the full employment level 1 AP: clear use of data – immobility of labour 5/5 marks Short answers can be very effective. There is no need to fill all the space.
Notes from the mark scheme and report
show the gap on the horizontal axis between actual and full-capacity output, not a triangle between LRAS, SRAS and AD
2 marks reserved for the AD/AS diagram
max 4 of 5 without using Extract D (weak demand, immobility of labour)
Quantitative skills: QS 4 (construct and interpret a range of standard graphical forms); QS 9 (interpret, apply and analyse information in written, graphical tabular and numerical forms)
June 2016 · AS Paper 2 · Q2(c)1 markAO1=1Diagram
Data and extracts for question 2
Mark scheme
Examiner's comment
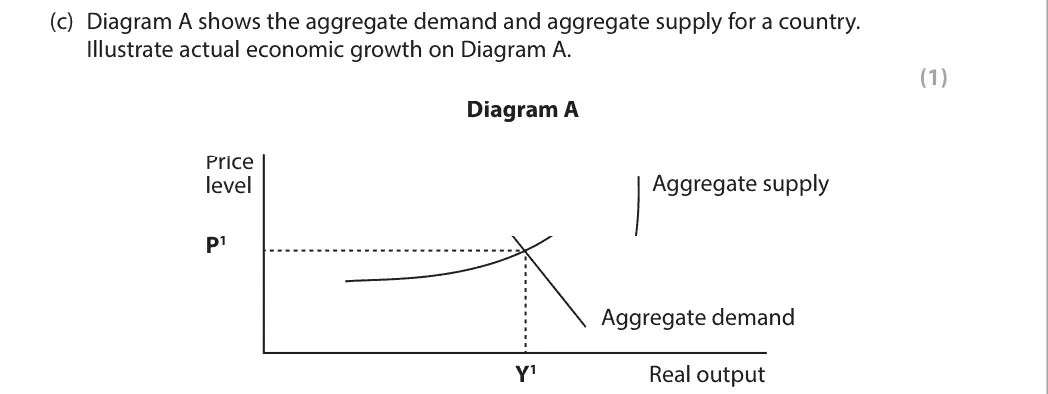
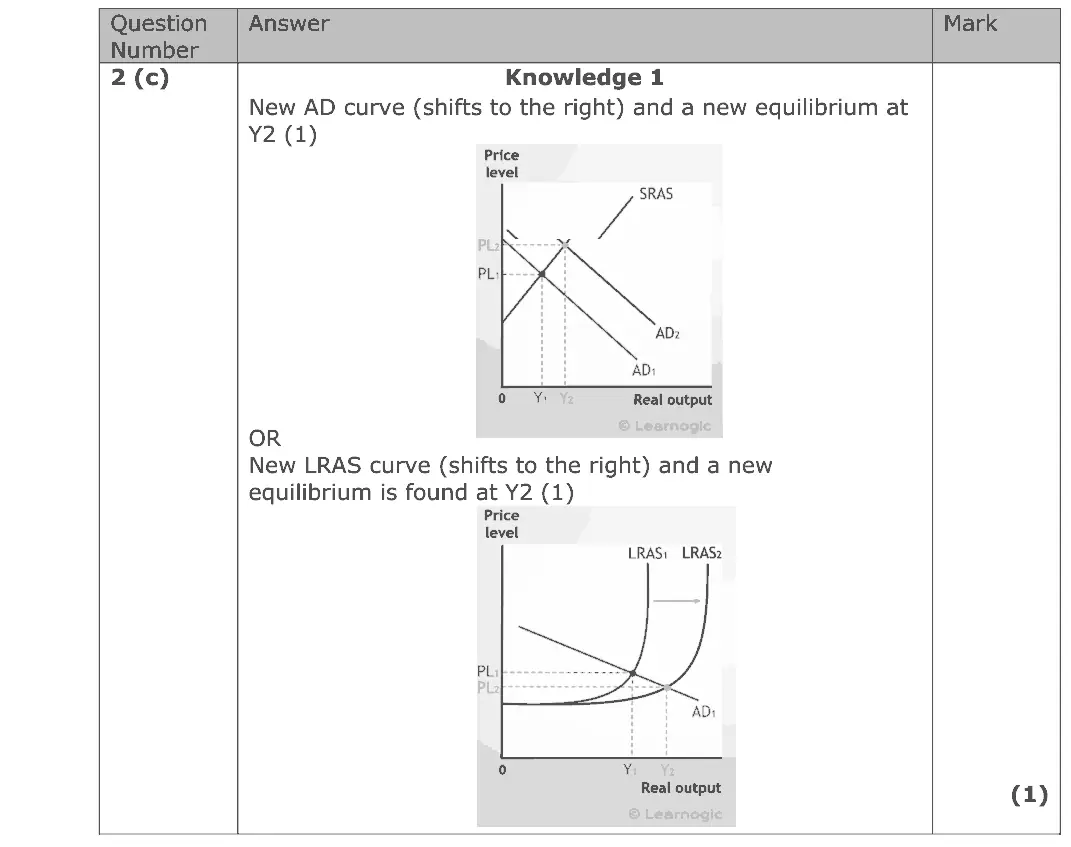
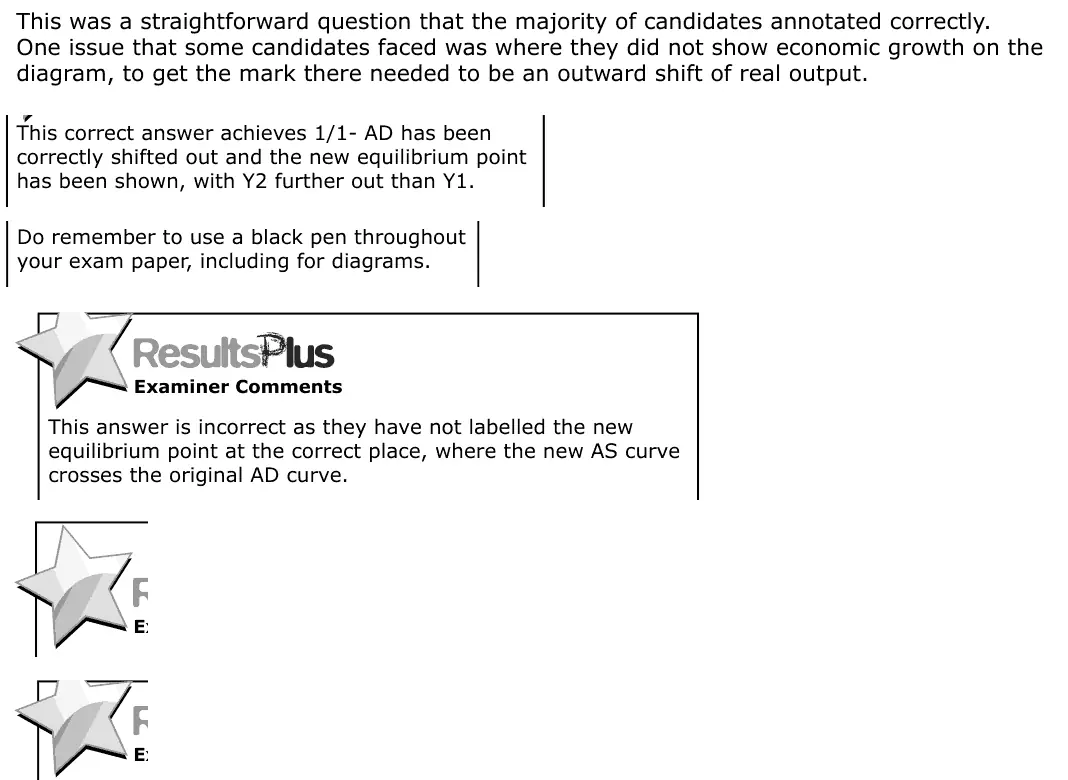
This was a straightforward question that the majority of candidates annotated correctly. One issue that some candidates faced was where they did not show economic growth on the diagram, to get the mark there needed to be an outward shift of real output. This correct answer achieves 1/1- AD has been correctly shifted out and the new equilibrium point has been shown, with Y2 further out than Y1. Do remember to use a black pen throughout your exam paper, including for diagrams. This answer is incorrect as they have not labelled the new equilibrium point at the correct place, where the new AS curve crosses the original AD curve.
Notes from the mark scheme and report
shift AD (or LRAS) right and mark the new equilibrium with real output Y2 beyond Y1
report: some placed the new equilibrium wrongly
Quantitative skills: QS 4 (construct and interpret a range of standard graphical forms)
Work with an Edexcel economics tutor
Essays stuck in Level 2, or losing the easy marks in Section A? Book a trial session with Lianne, a former Edexcel examiner.