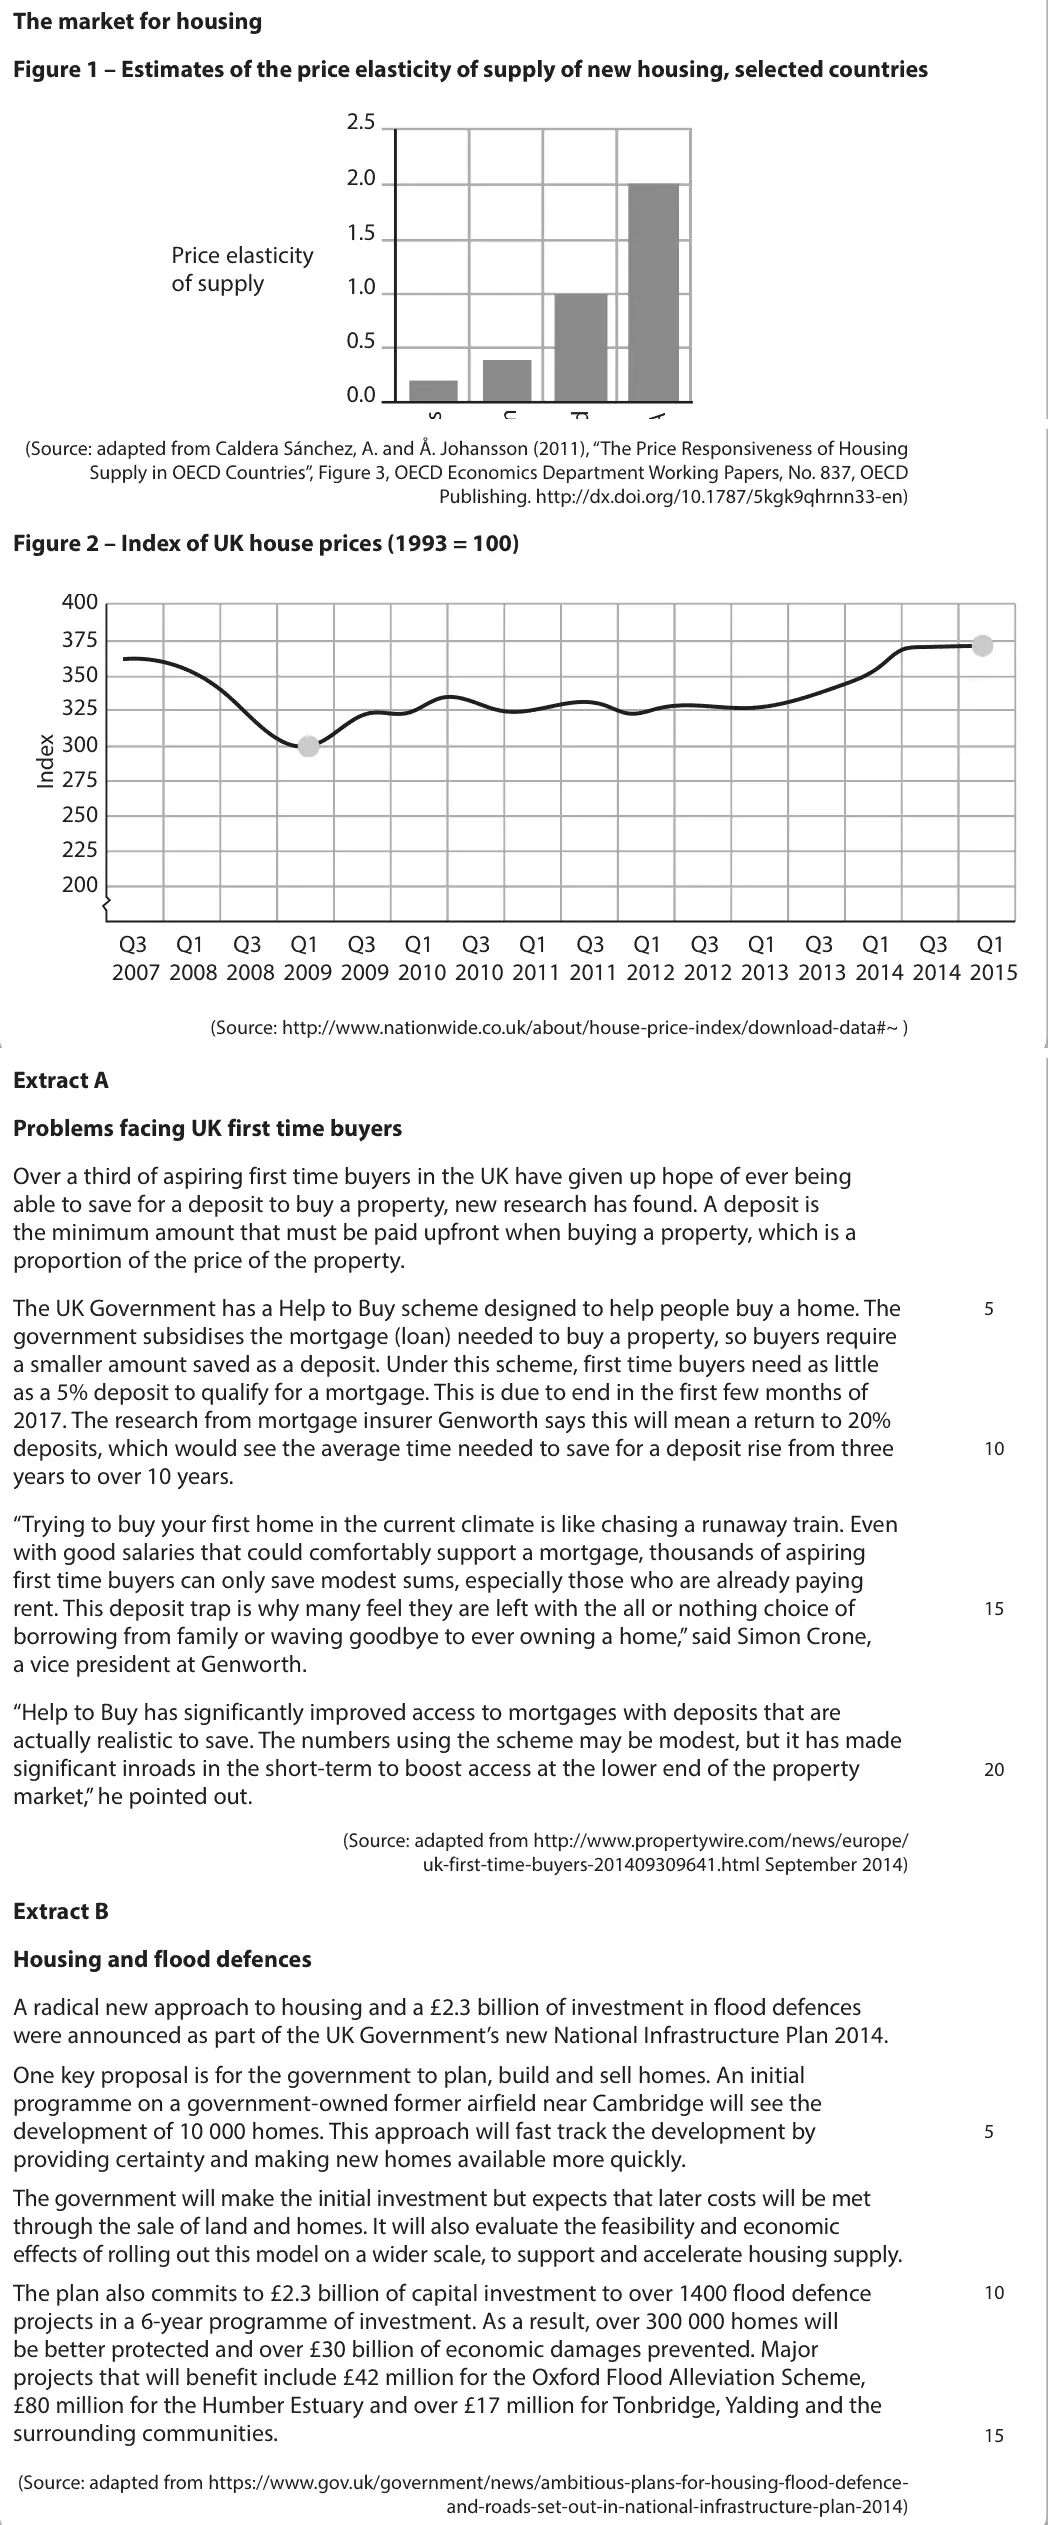
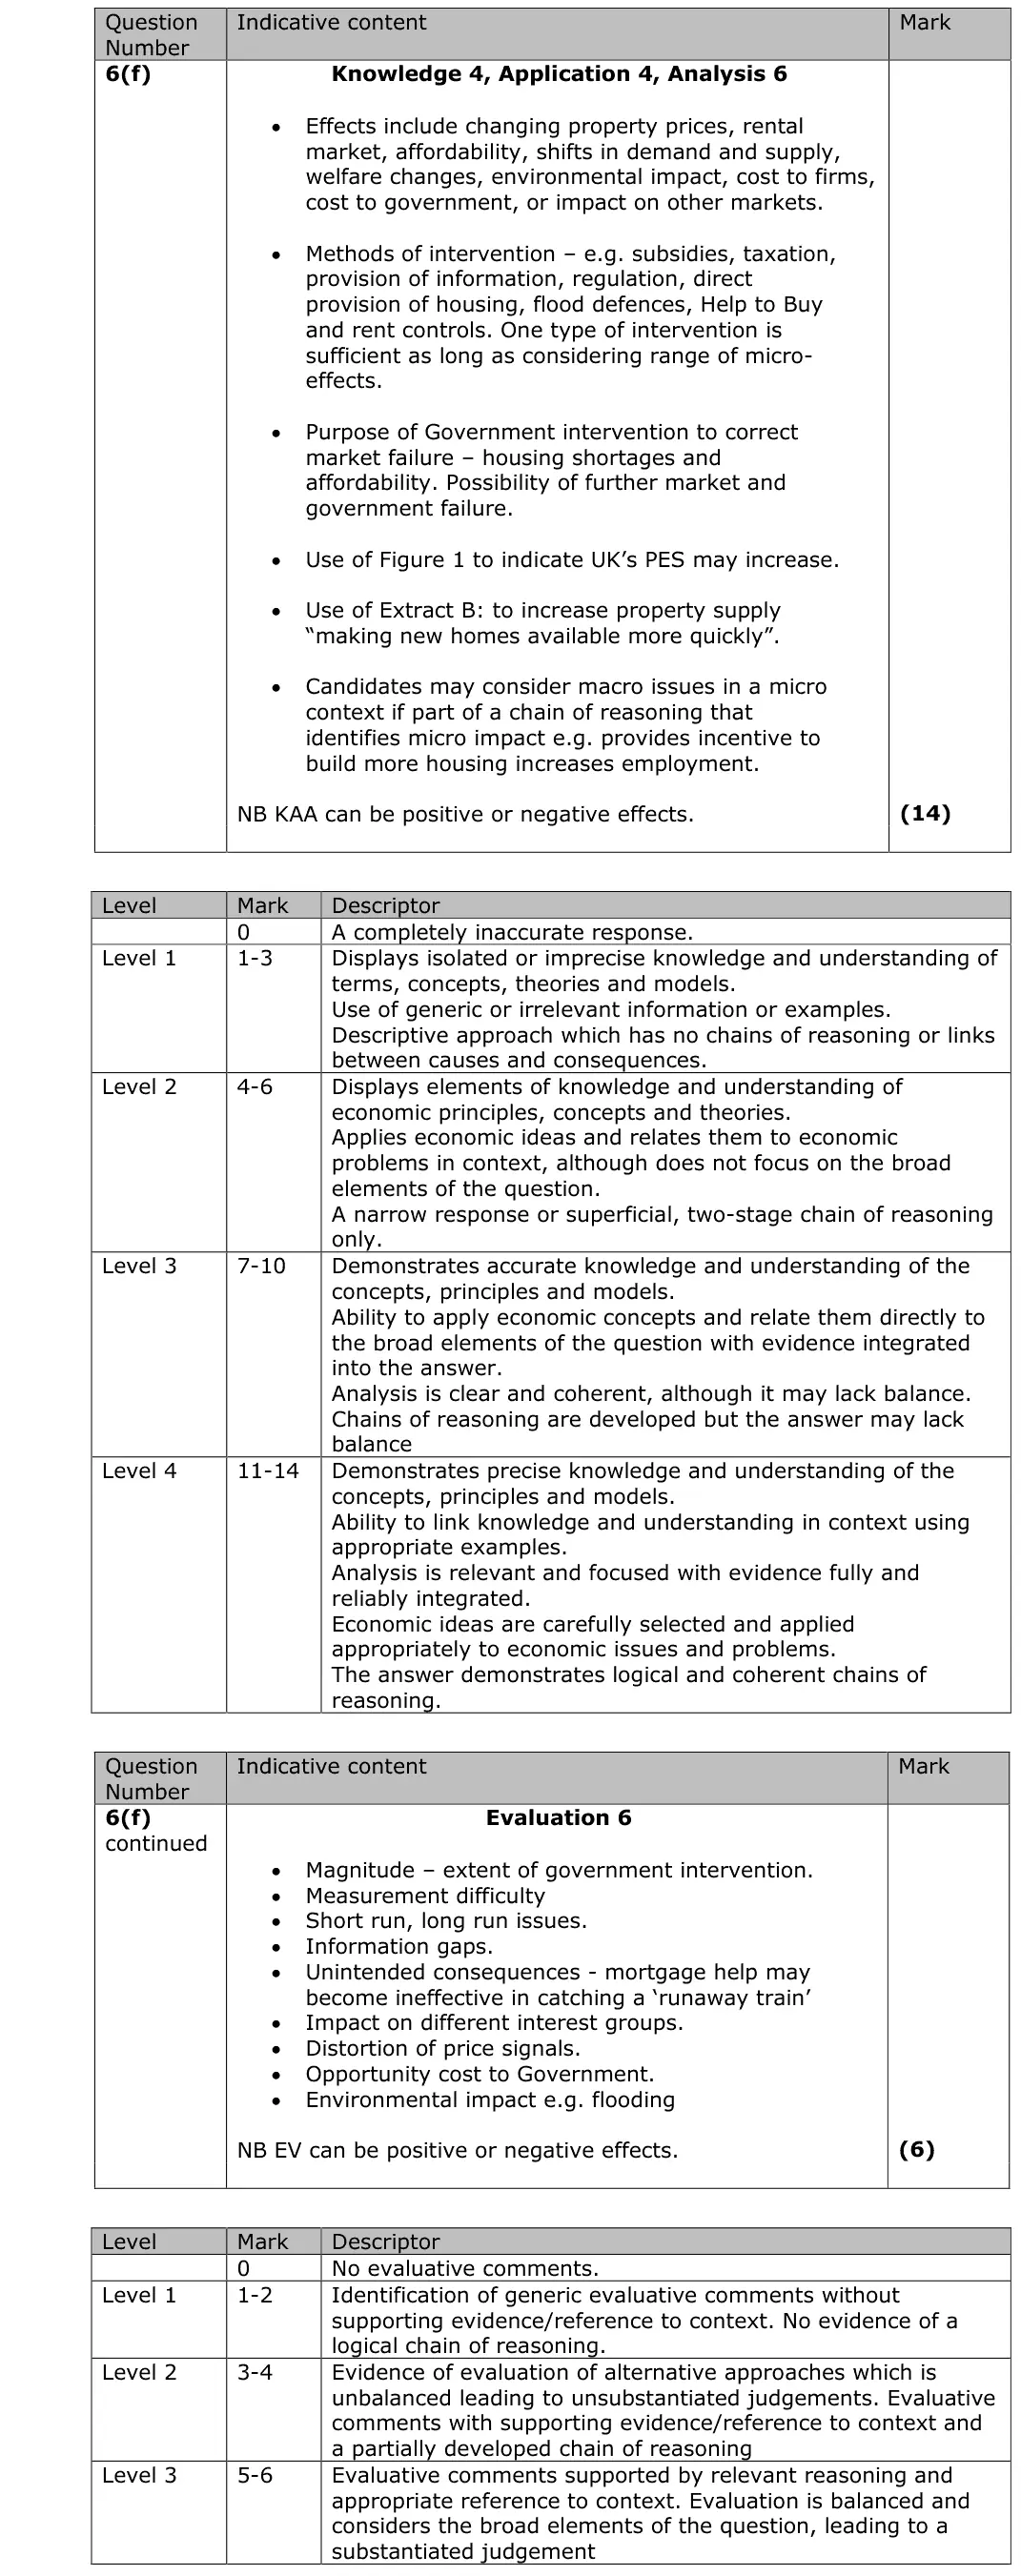
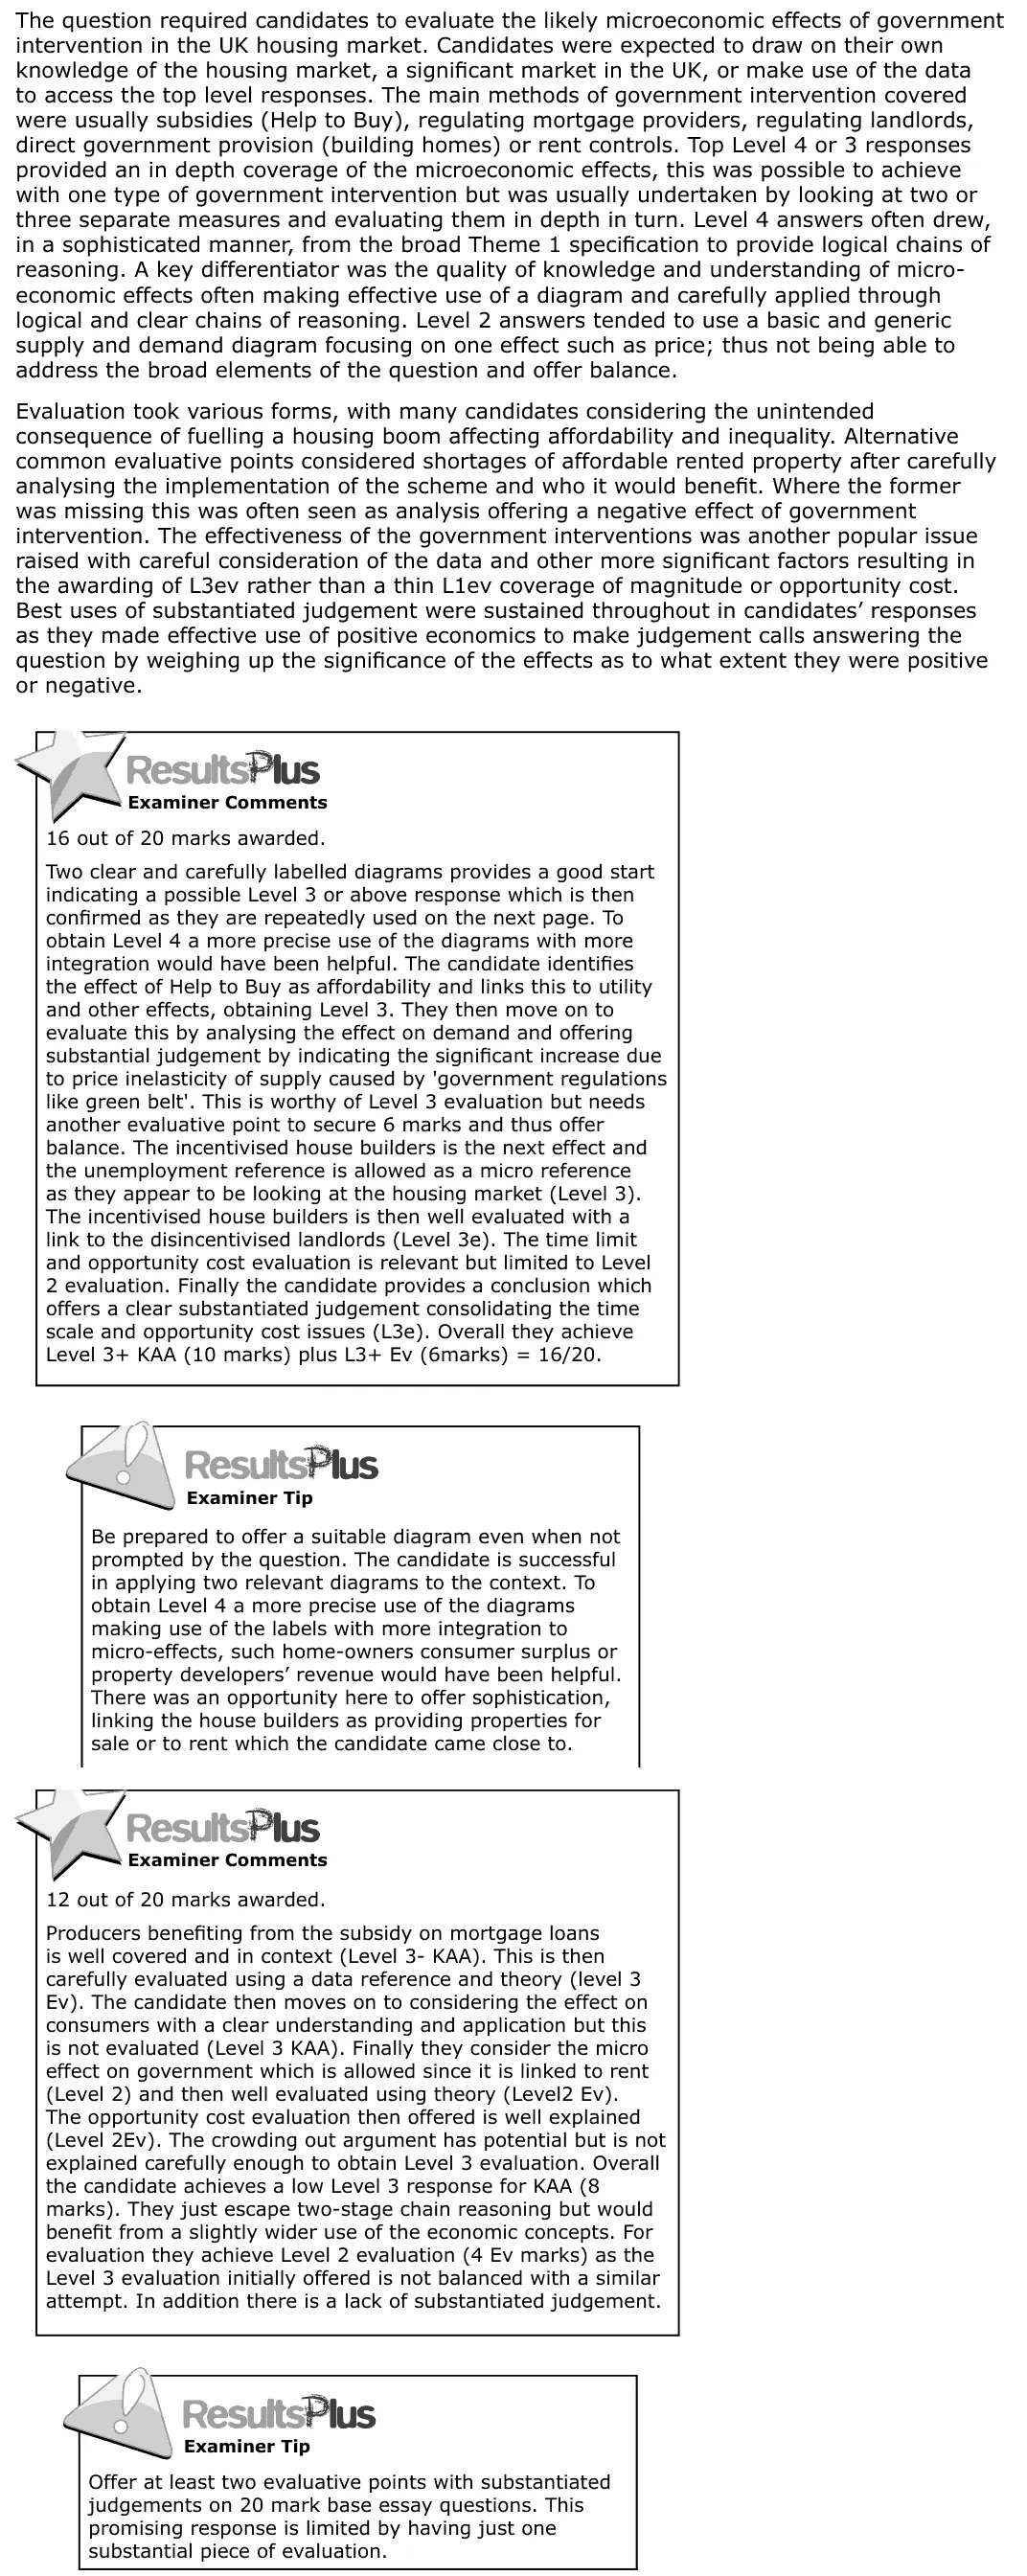
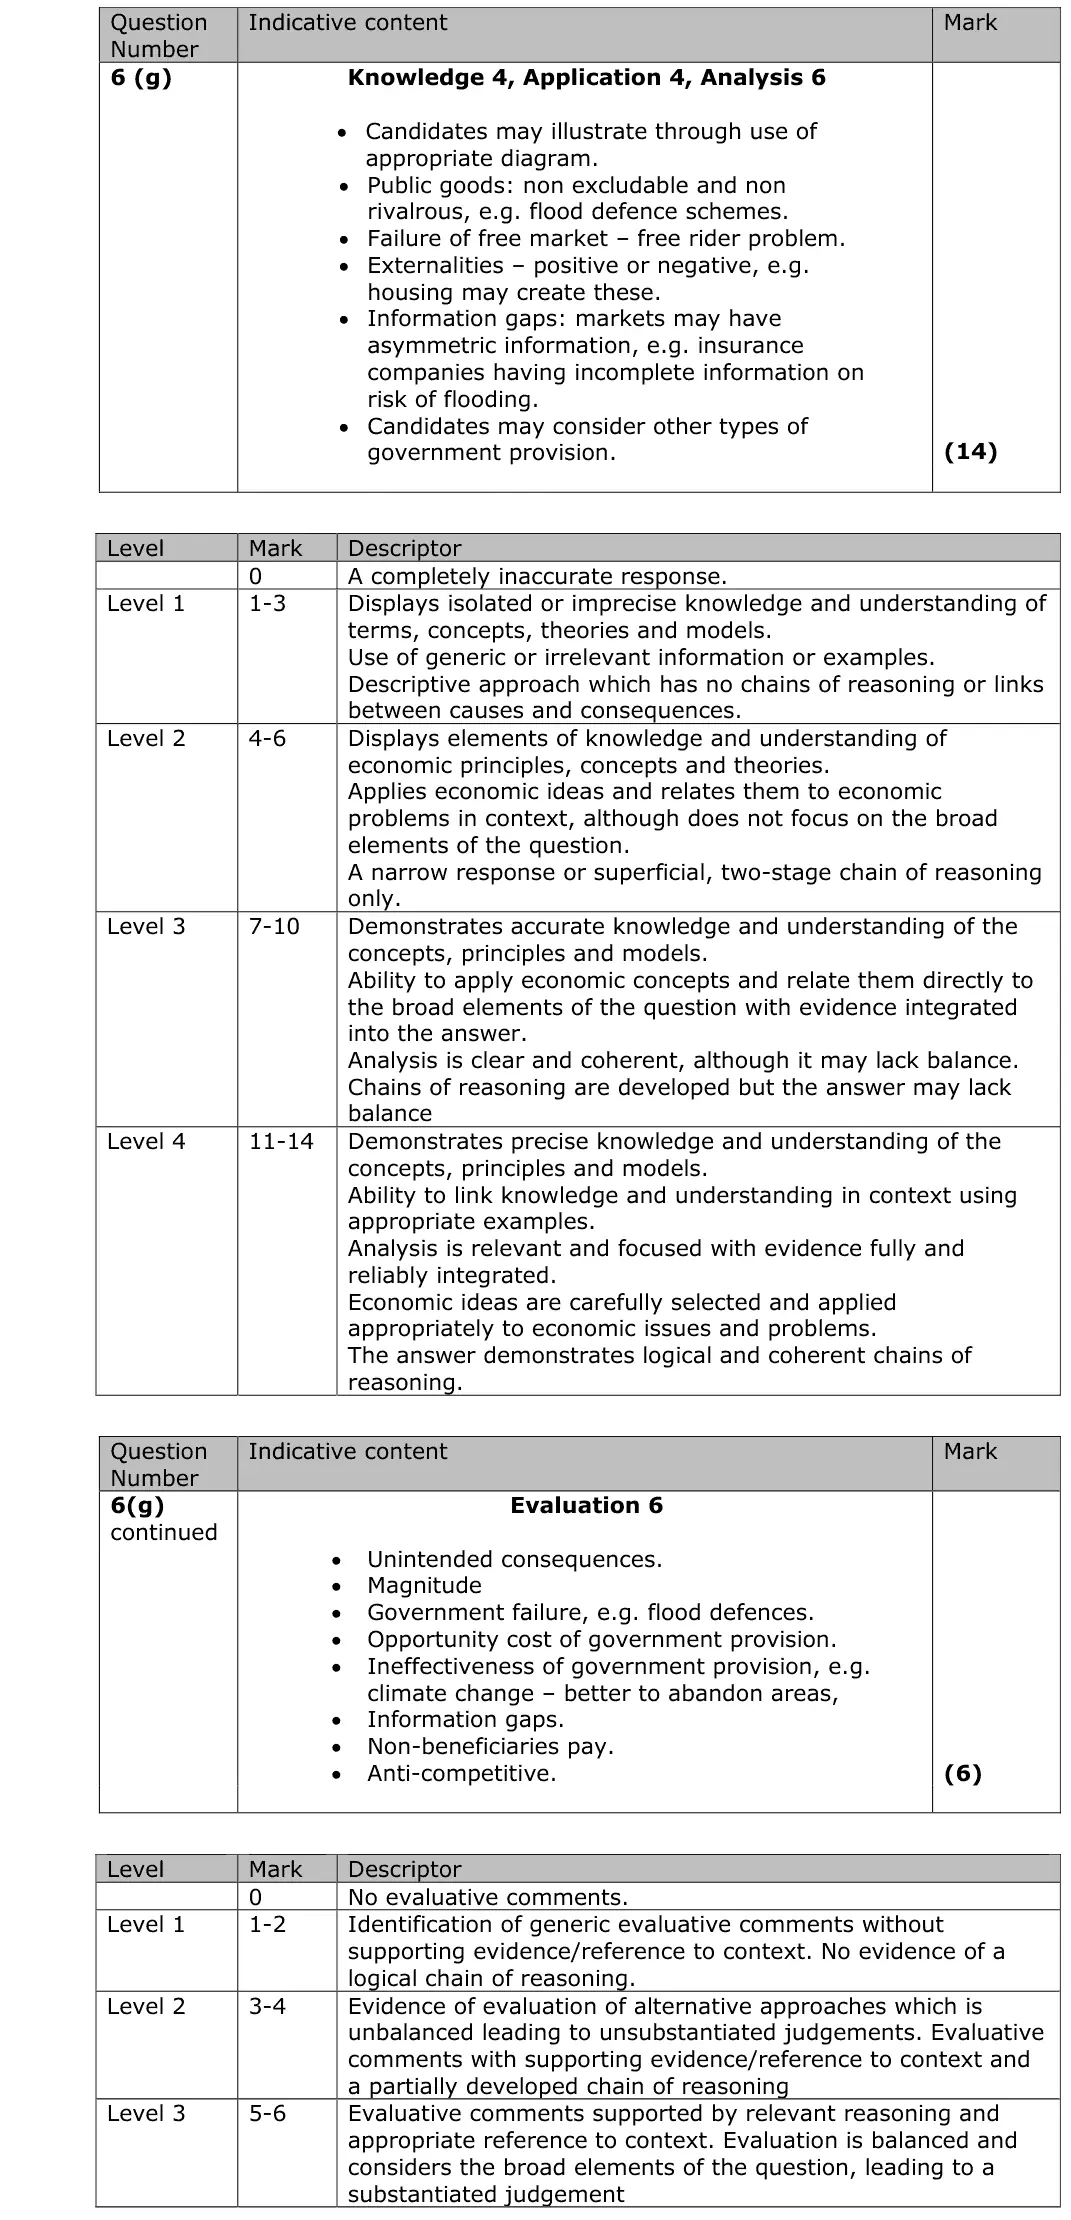
1.4.1Government intervention in markets: a) Purpose of intervention with reference to market failure and using diagrams in various contexts: • indirect taxation (ad valorem and specific) • subsidies • maximum and minimum prices b) Other methods of government intervention: • trade pollution permits • state provision of public goods • provision of information • regulationAS
Evaluate the likely microeconomic effects of a reduction in subsidies to farmers of animal products (Figure 1 and Extract B, line 14). Use a relevant diagram to support your answer.
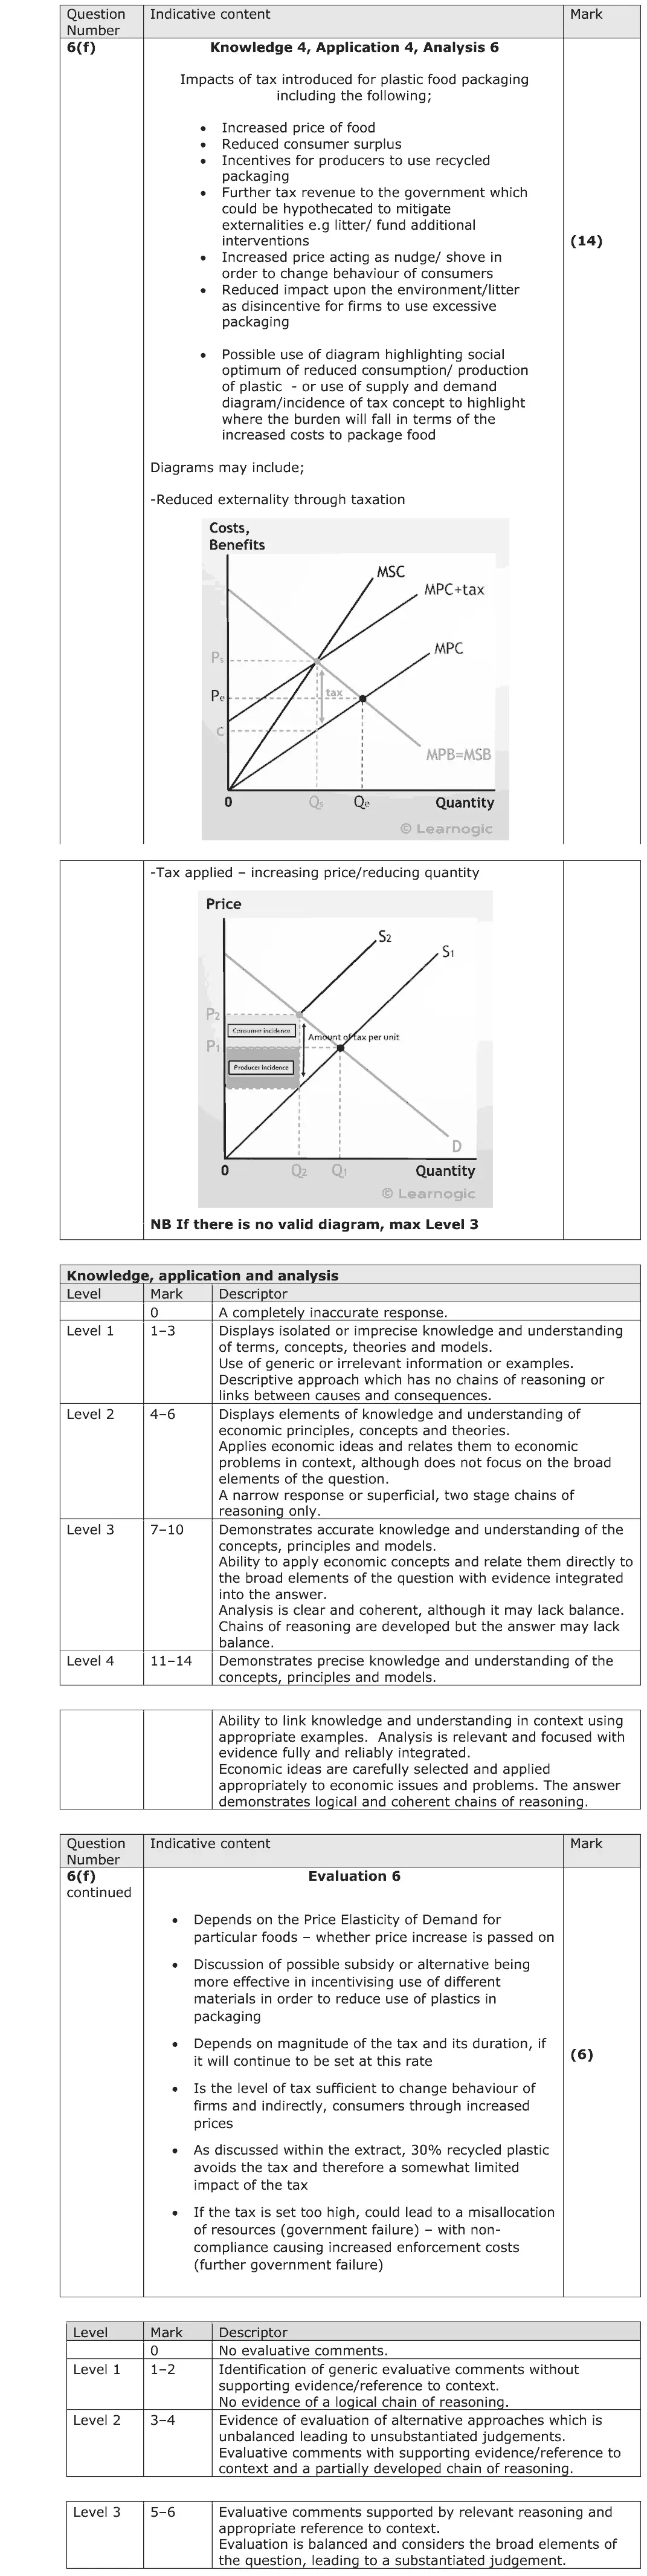
Evaluate the likely microeconomic effects of an increase in indirect tax on animal products (Figure 2 and Extract A, line 17). Use a relevant diagram to support your answer.
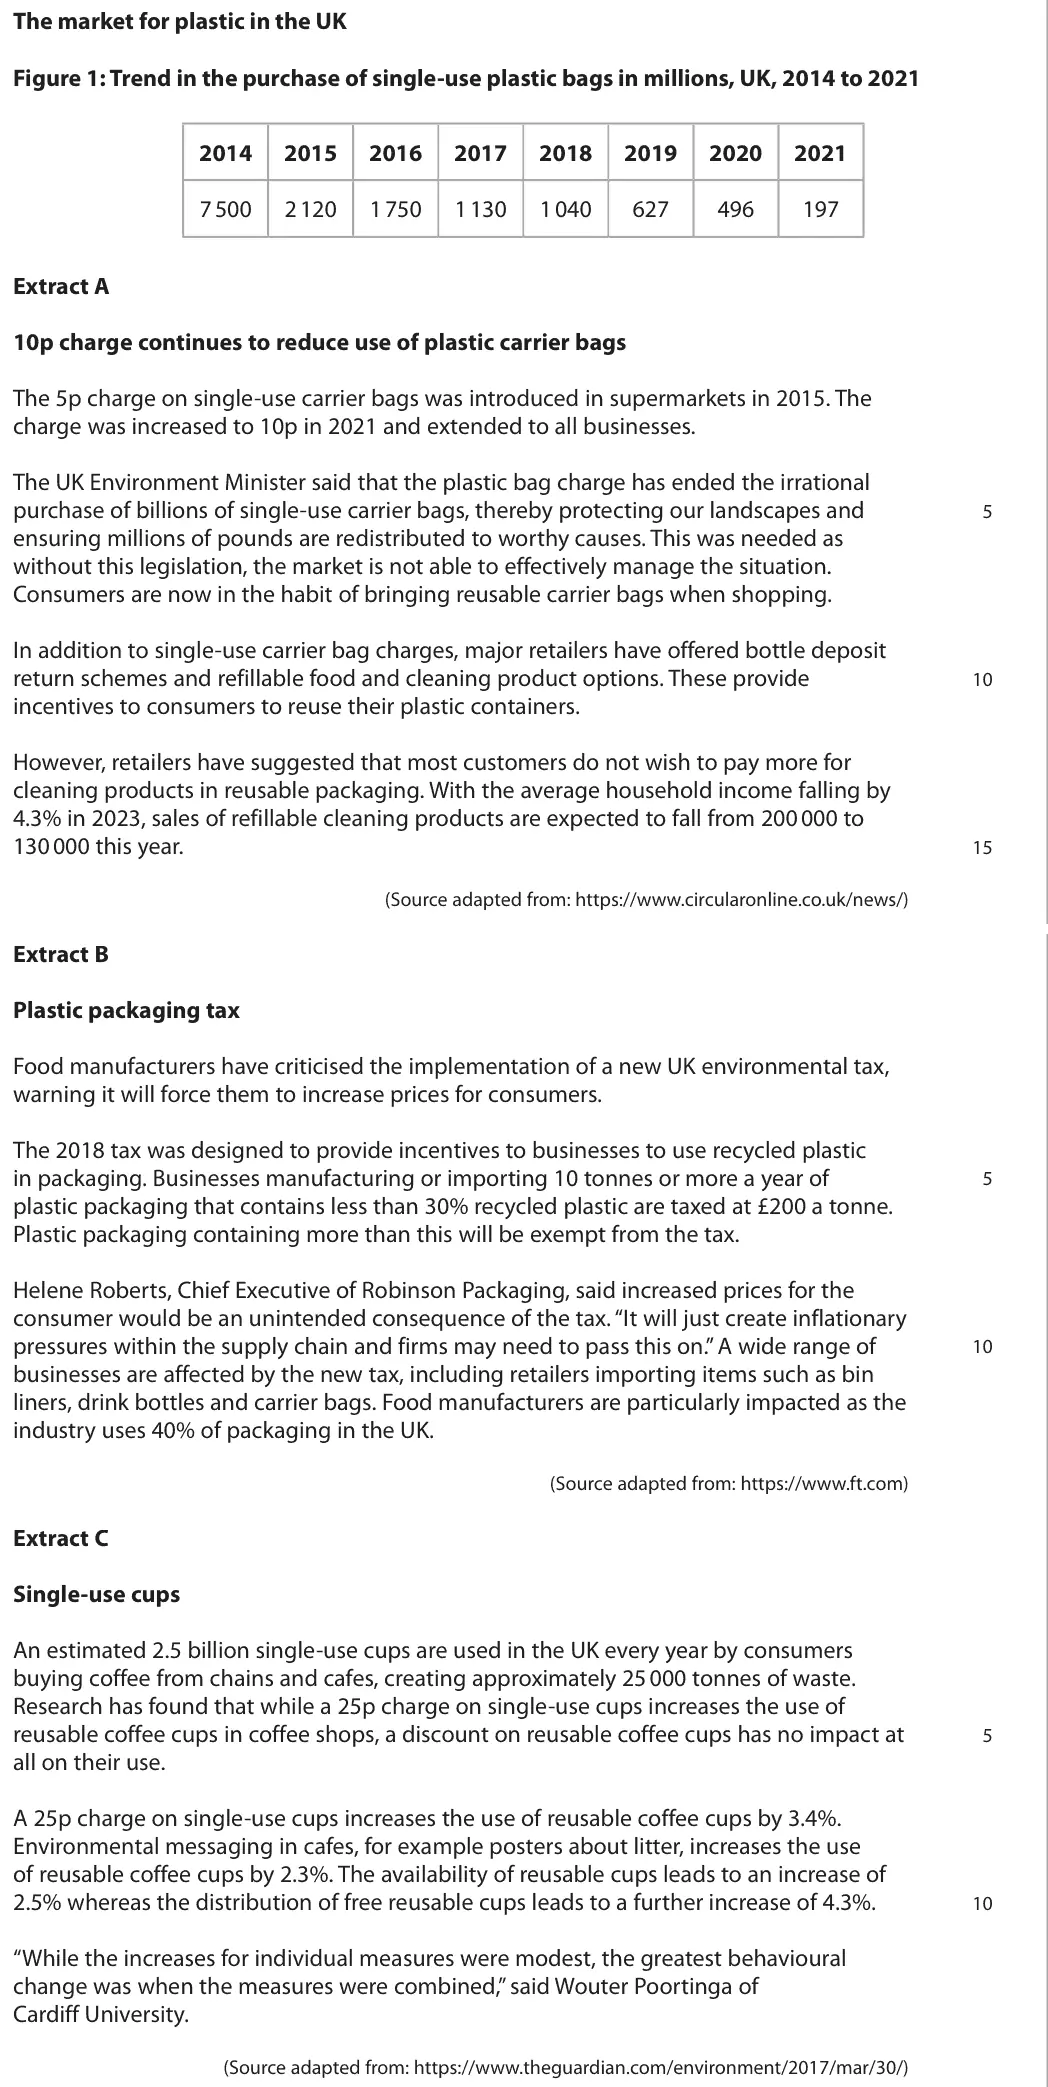
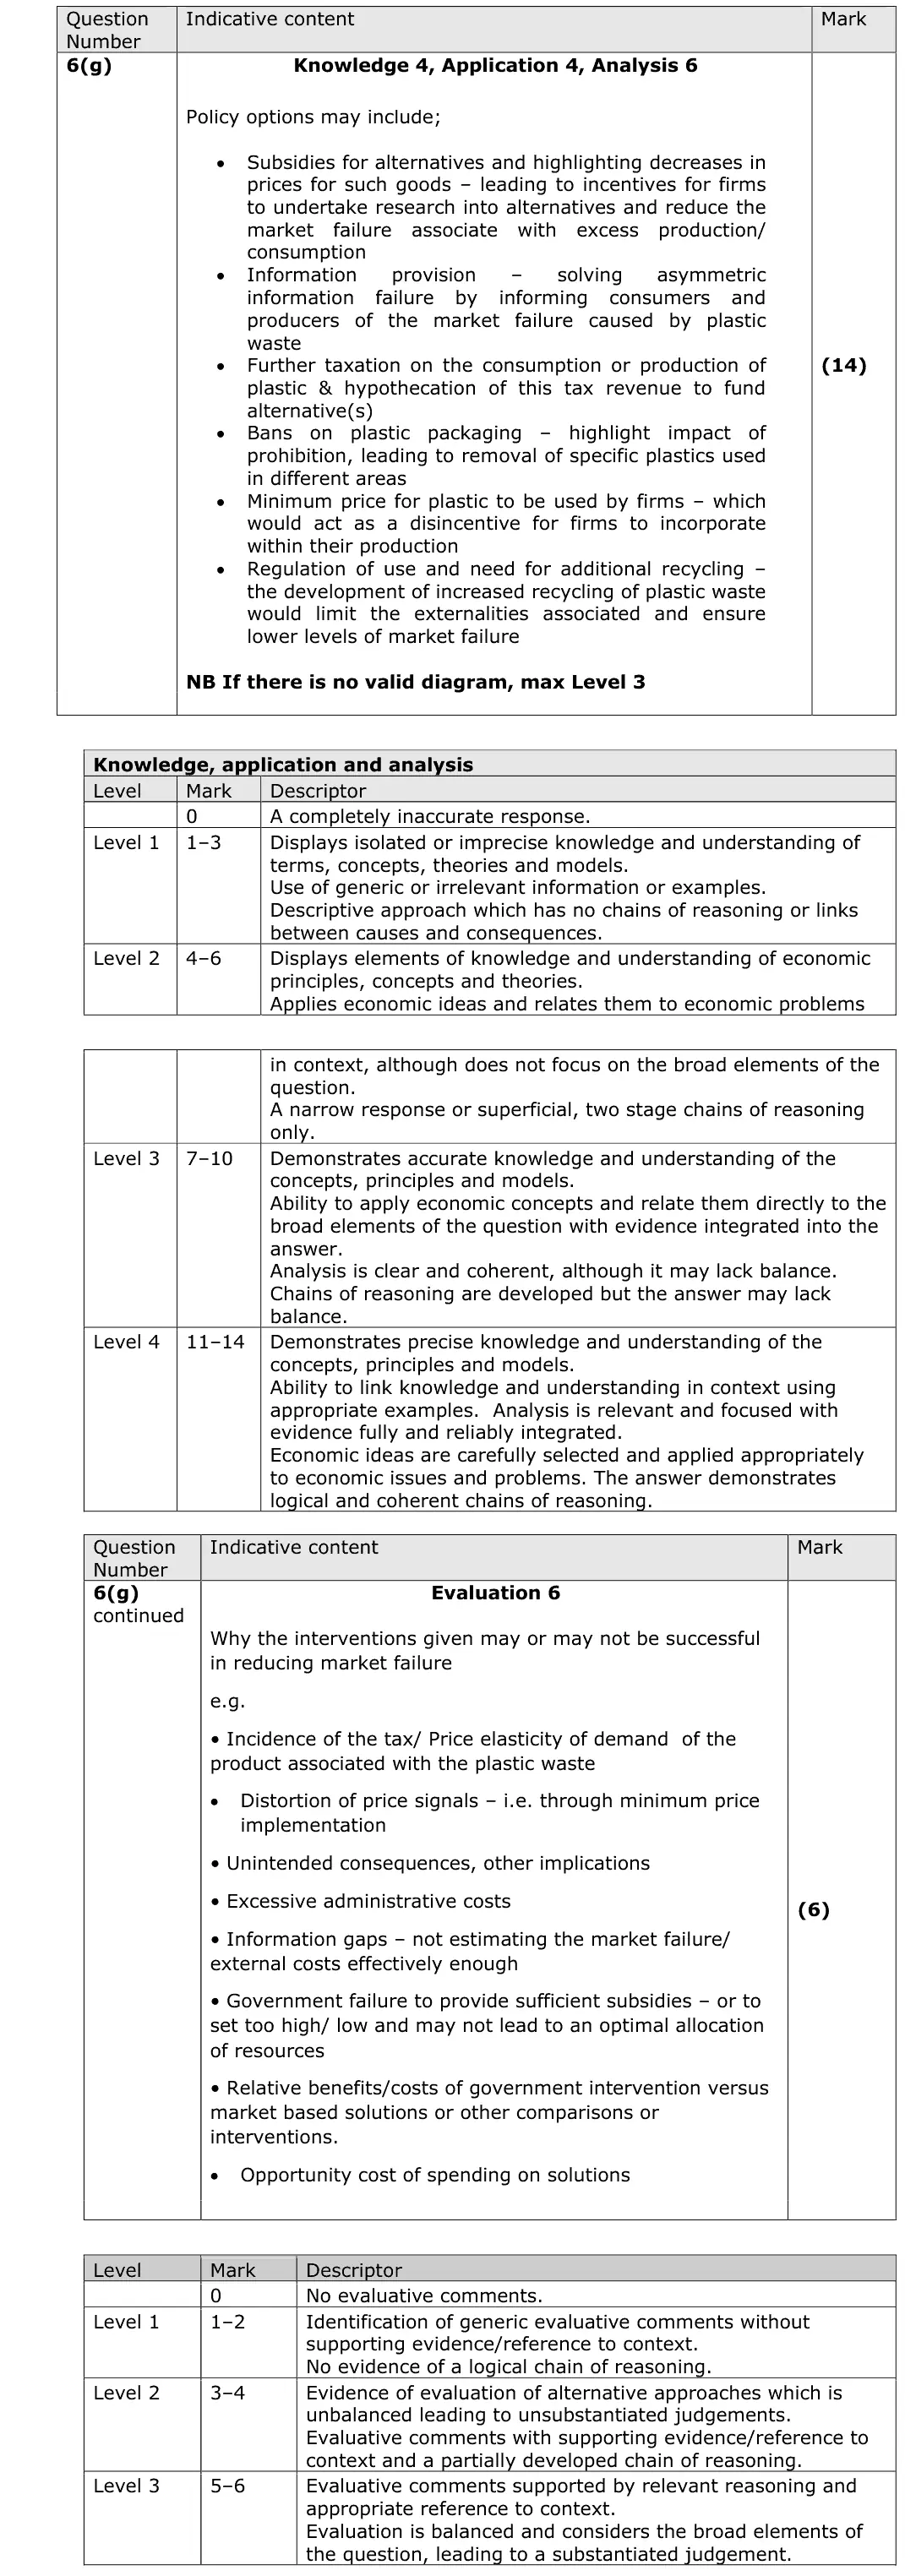
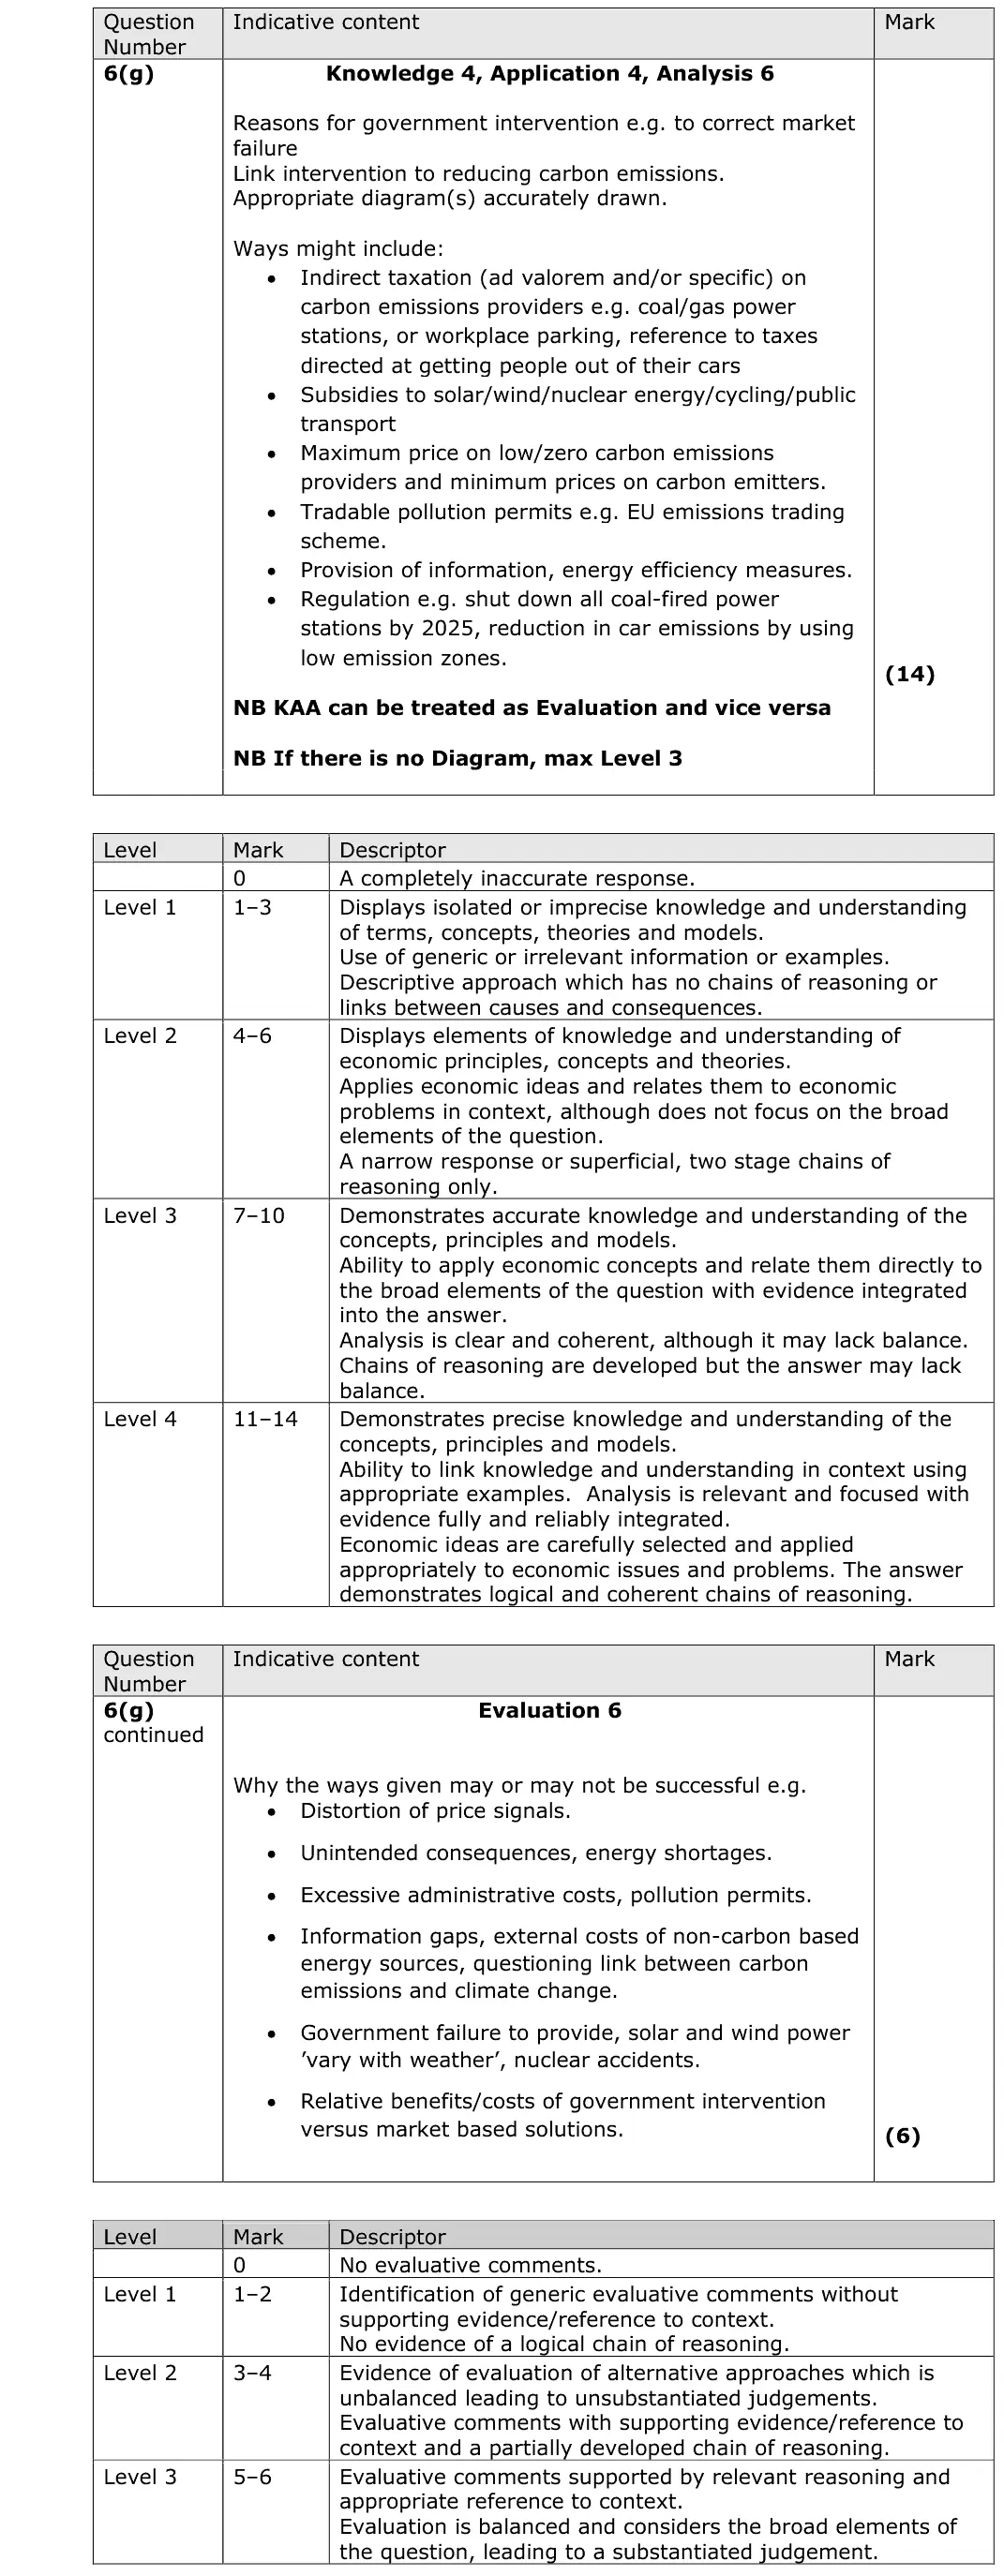
Evaluate methods of government intervention which could be used to reduce the market failure associated with plastic waste. Use a diagram to support your answer.
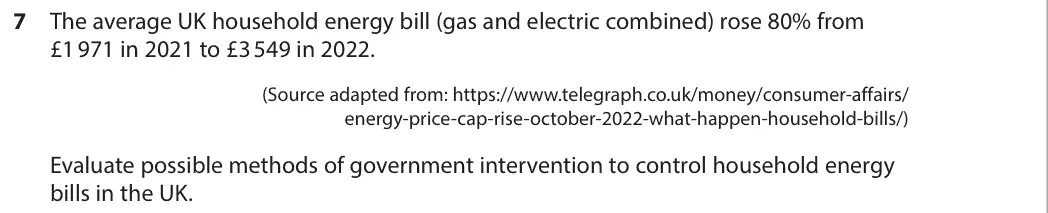
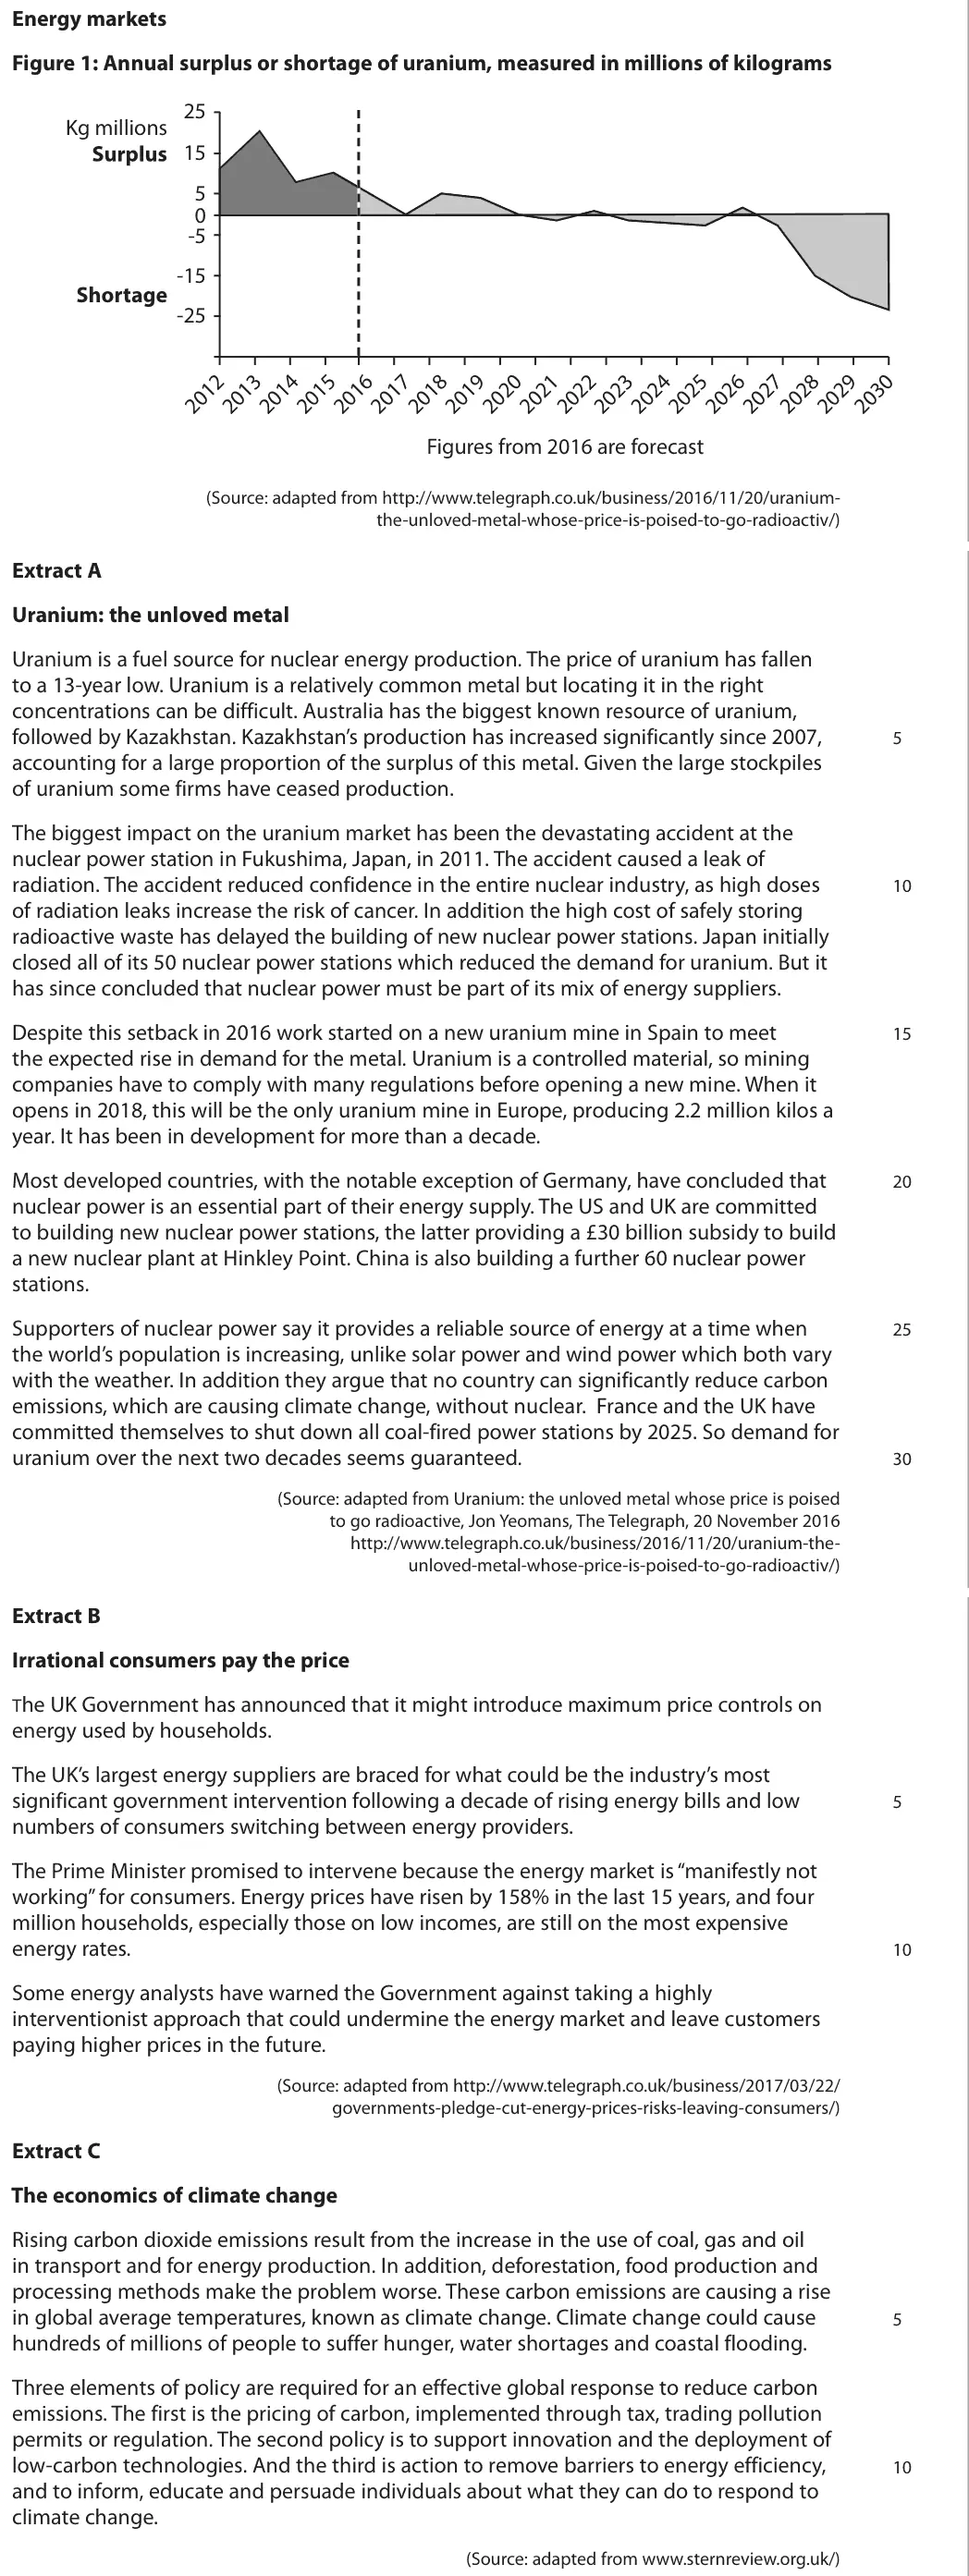
The average UK household energy bill (gas and electric combined) rose 80% from £1 971 in 2021 to £3 549 in 2022. (Source adapted from: https://www.telegraph.co.uk/money/consumer-affairs/ energy-price-cap-rise-october-2022-what-happen-household-bills/) Evaluate possible methods of government intervention to control household energy bills in the UK.
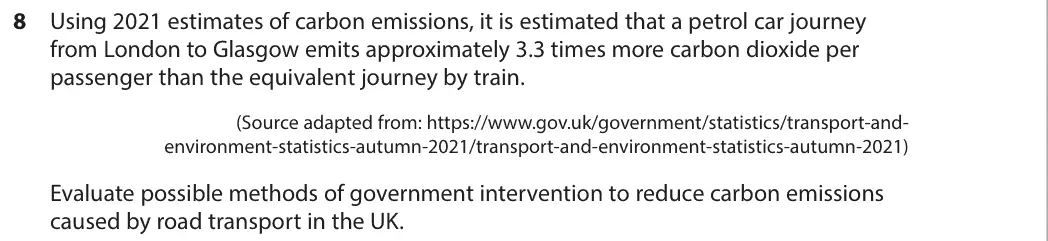
Using 2021 estimates of carbon emissions, it is estimated that a petrol car journey from London to Glasgow emits approximately 3.3 times more carbon dioxide per passenger than the equivalent journey by train. (Source adapted from: https://www.gov.uk/government/statistics/transport-and- environment-statistics-autumn-2021/transport-and-environment-statistics-autumn-2021) Evaluate possible methods of government intervention to reduce carbon emissions caused by road transport in the UK.
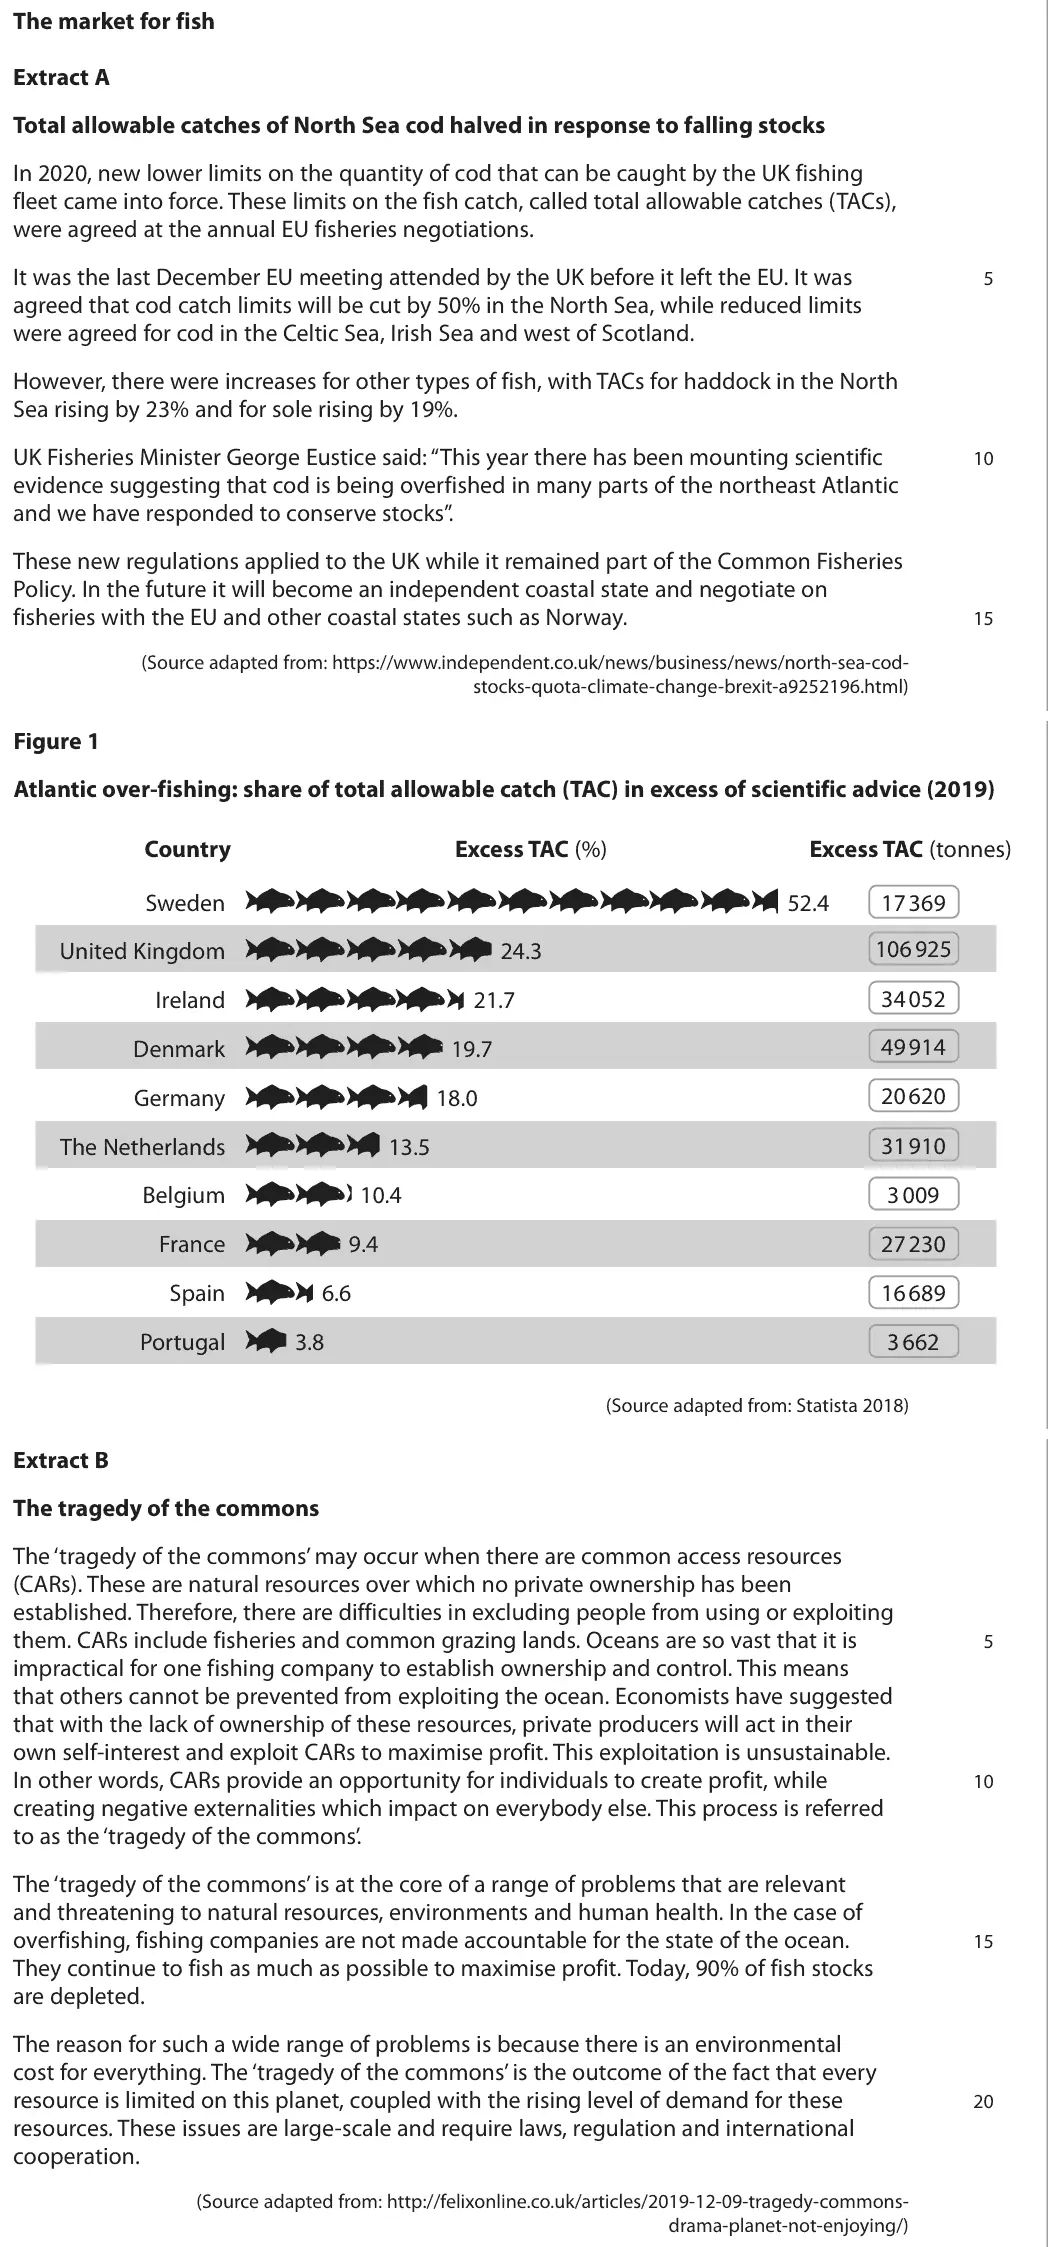
Other than using a TAC, evaluate the policy options which could be used to reduce market failure resulting from over-fishing. Use at least one appropriate diagram in your answer.
In 2015 a report by Public Health England recommended the imposition of a 20% tax on the sale of soft drinks that contain high levels of sugar. Evaluate the likely microeconomic effects of such a tax.
Tap a question to zoom it. The data and extracts fold out above each question; the mark scheme and examiner's comment open underneath.
June 2025 · AS Paper 1 · Q6(f)20 marksAO1=4, AO2=4, AO3=6, AO4=620-mark essayEither/orHard
Data and extracts for question 6
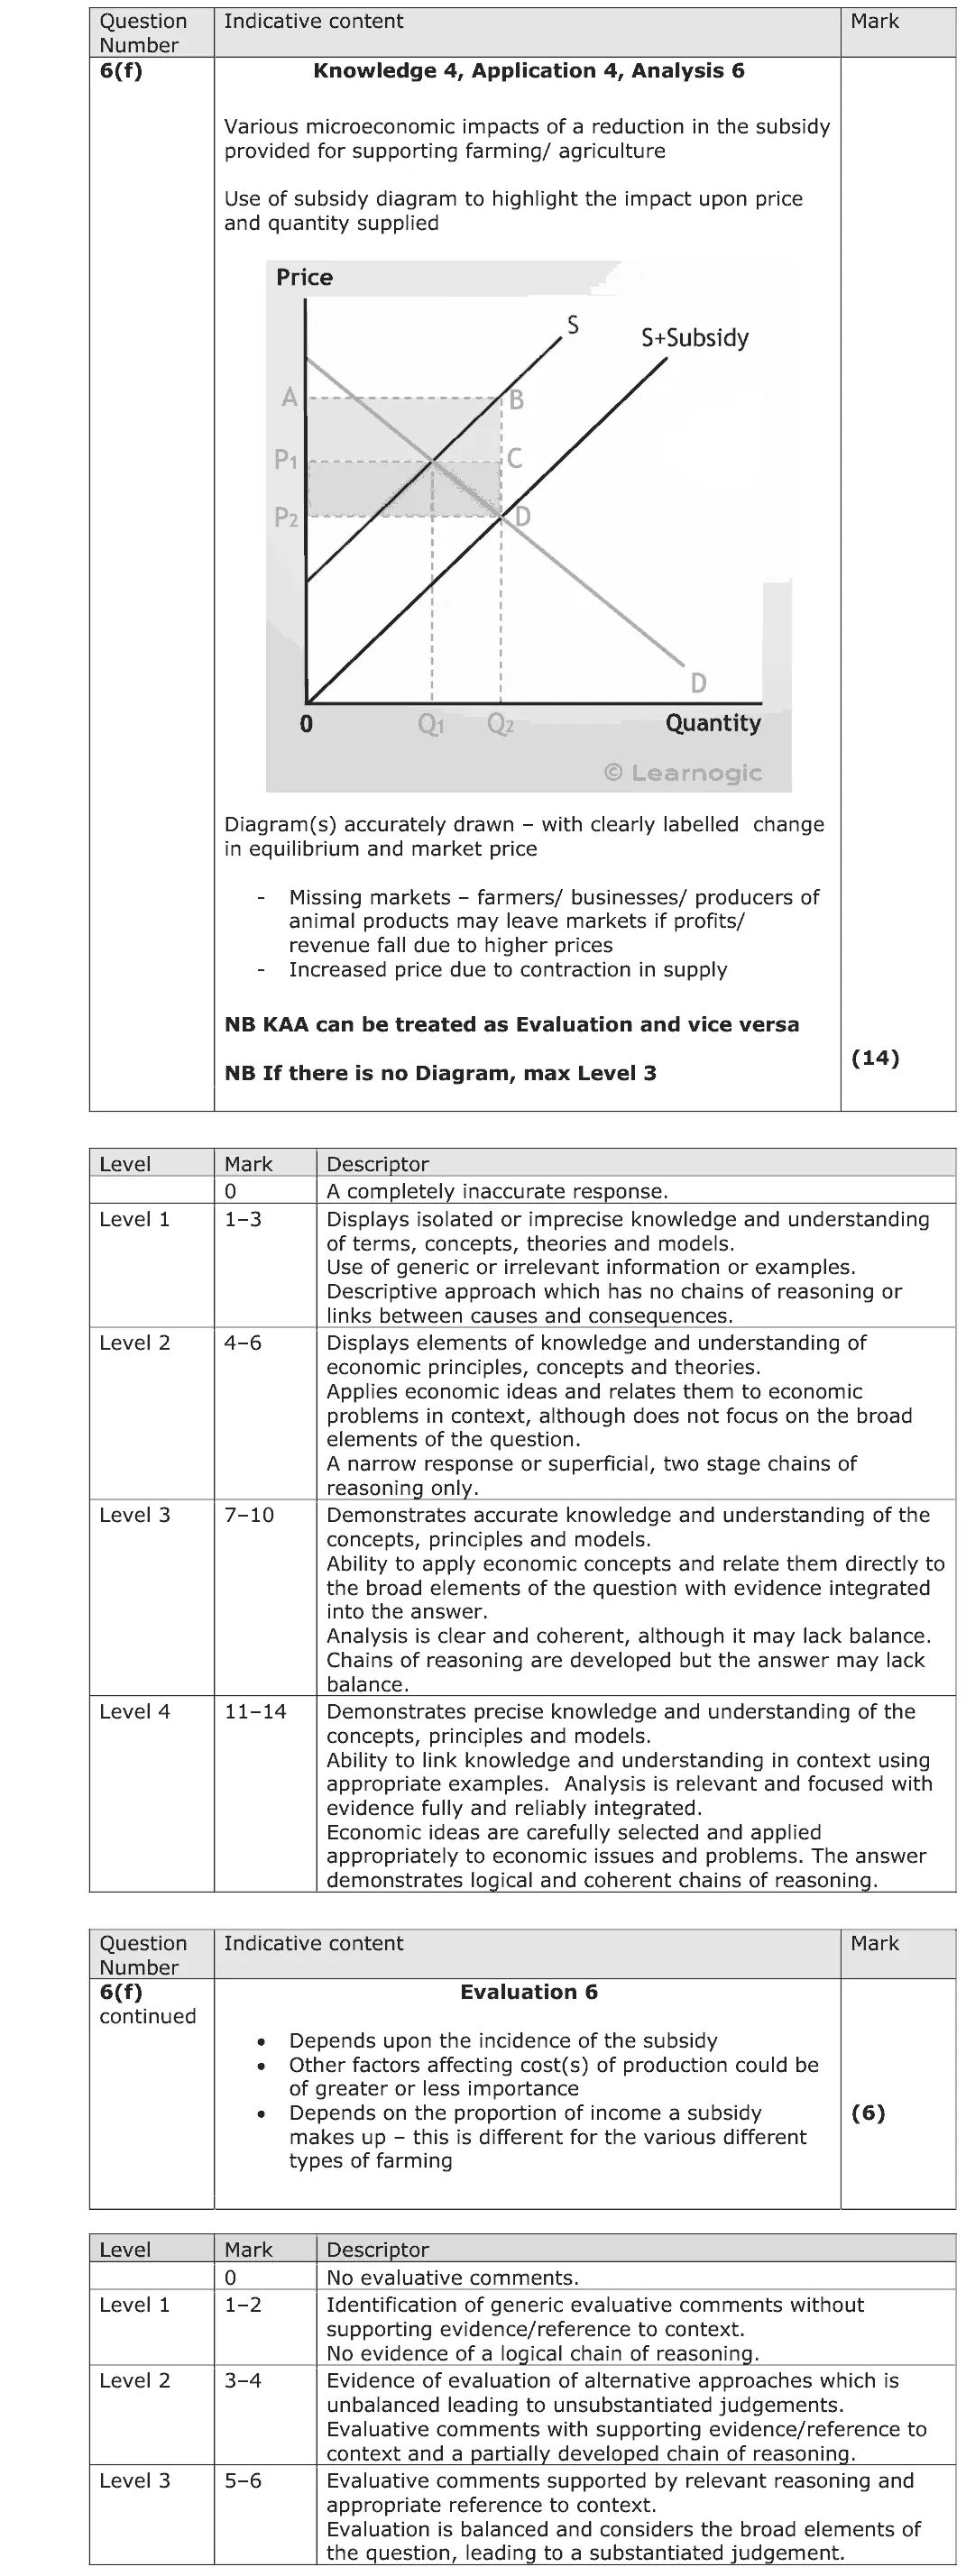
Mark scheme, including the levels grid and indicative content
Examiner's comment
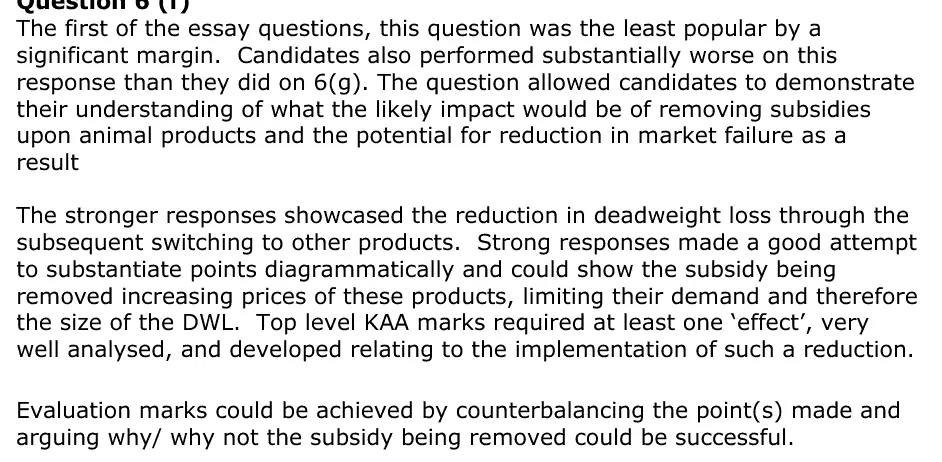
The first of the essay questions, this question was the least popular by a significant margin. Candidates also performed substantially worse on this response than they did on 6(g). The question allowed candidates to demonstrate their understanding of what the likely impact would be of removing subsidies upon animal products and the potential for reduction in market failure as a result The stronger responses showcased the reduction in deadweight loss through the subsequent switching to other products. Strong responses made a good attempt to substantiate points diagrammatically and could show the subsidy being removed increasing prices of these products, limiting their demand and therefore the size of the DWL. Top level KAA marks required at least one ‘effect’, very well analysed, and developed relating to the implementation of such a reduction. Evaluation marks could be achieved by counterbalancing the point(s) made and arguing why/ why not the subsidy being removed could be successful.
Notes from the mark scheme and report
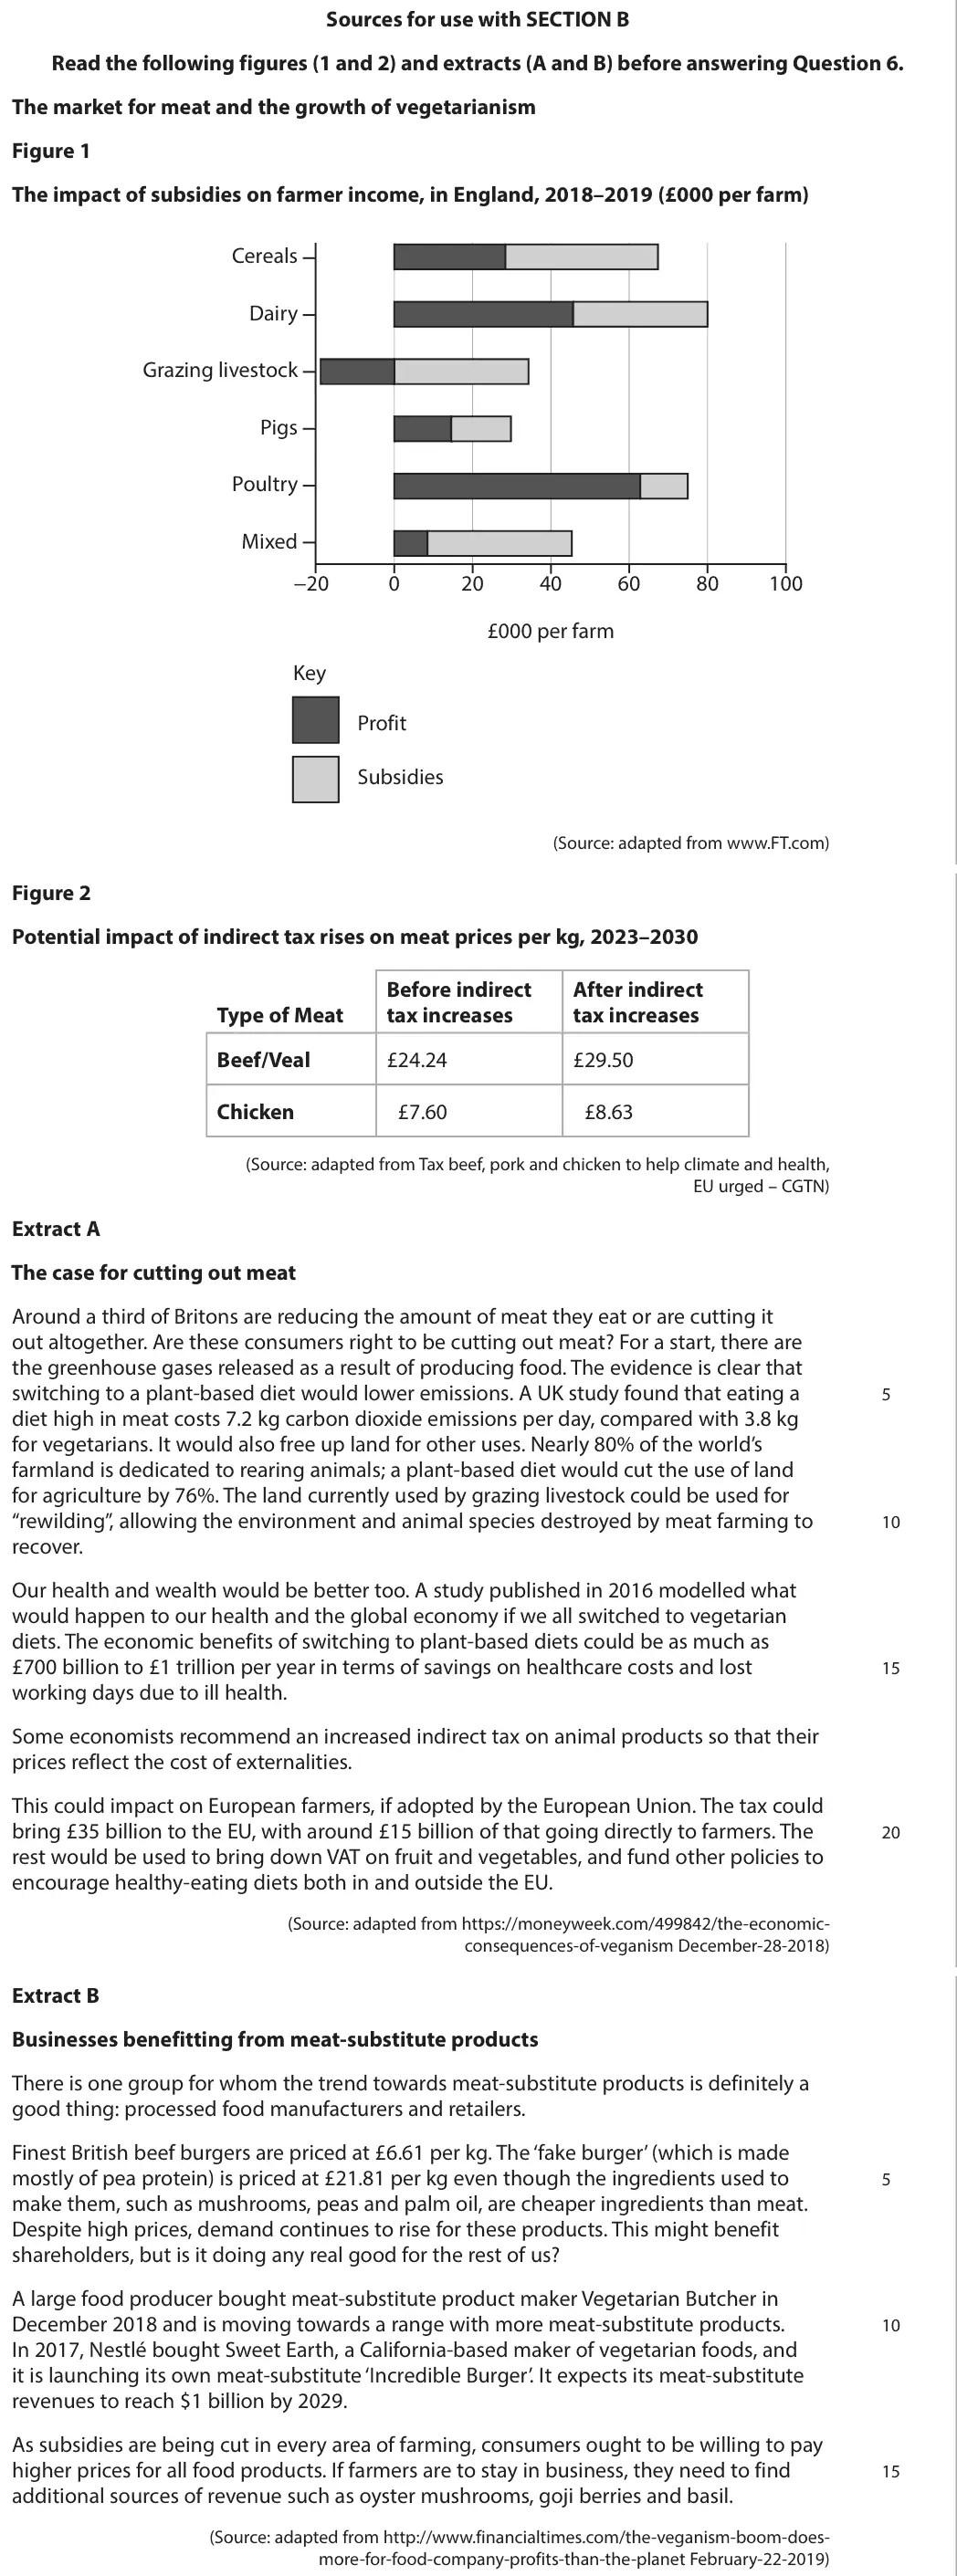
removing subsidies shifts supply left: higher prices, lower output, lower farm incomes (grazing livestock profit negative without subsidy, Figure 1), less overproduction and welfare loss
evaluate with PED, farm closures, food security
report: candidates "performed substantially worse on this response than they did on 6(g)"
Quantitative skills: QS 4 (construct and interpret a range of standard graphical forms)
June 2025 · AS Paper 1 · Q6(g)20 marksAO1=4, AO2=4, AO3=6, AO4=620-mark essayEither/or
Data and extracts for question 6
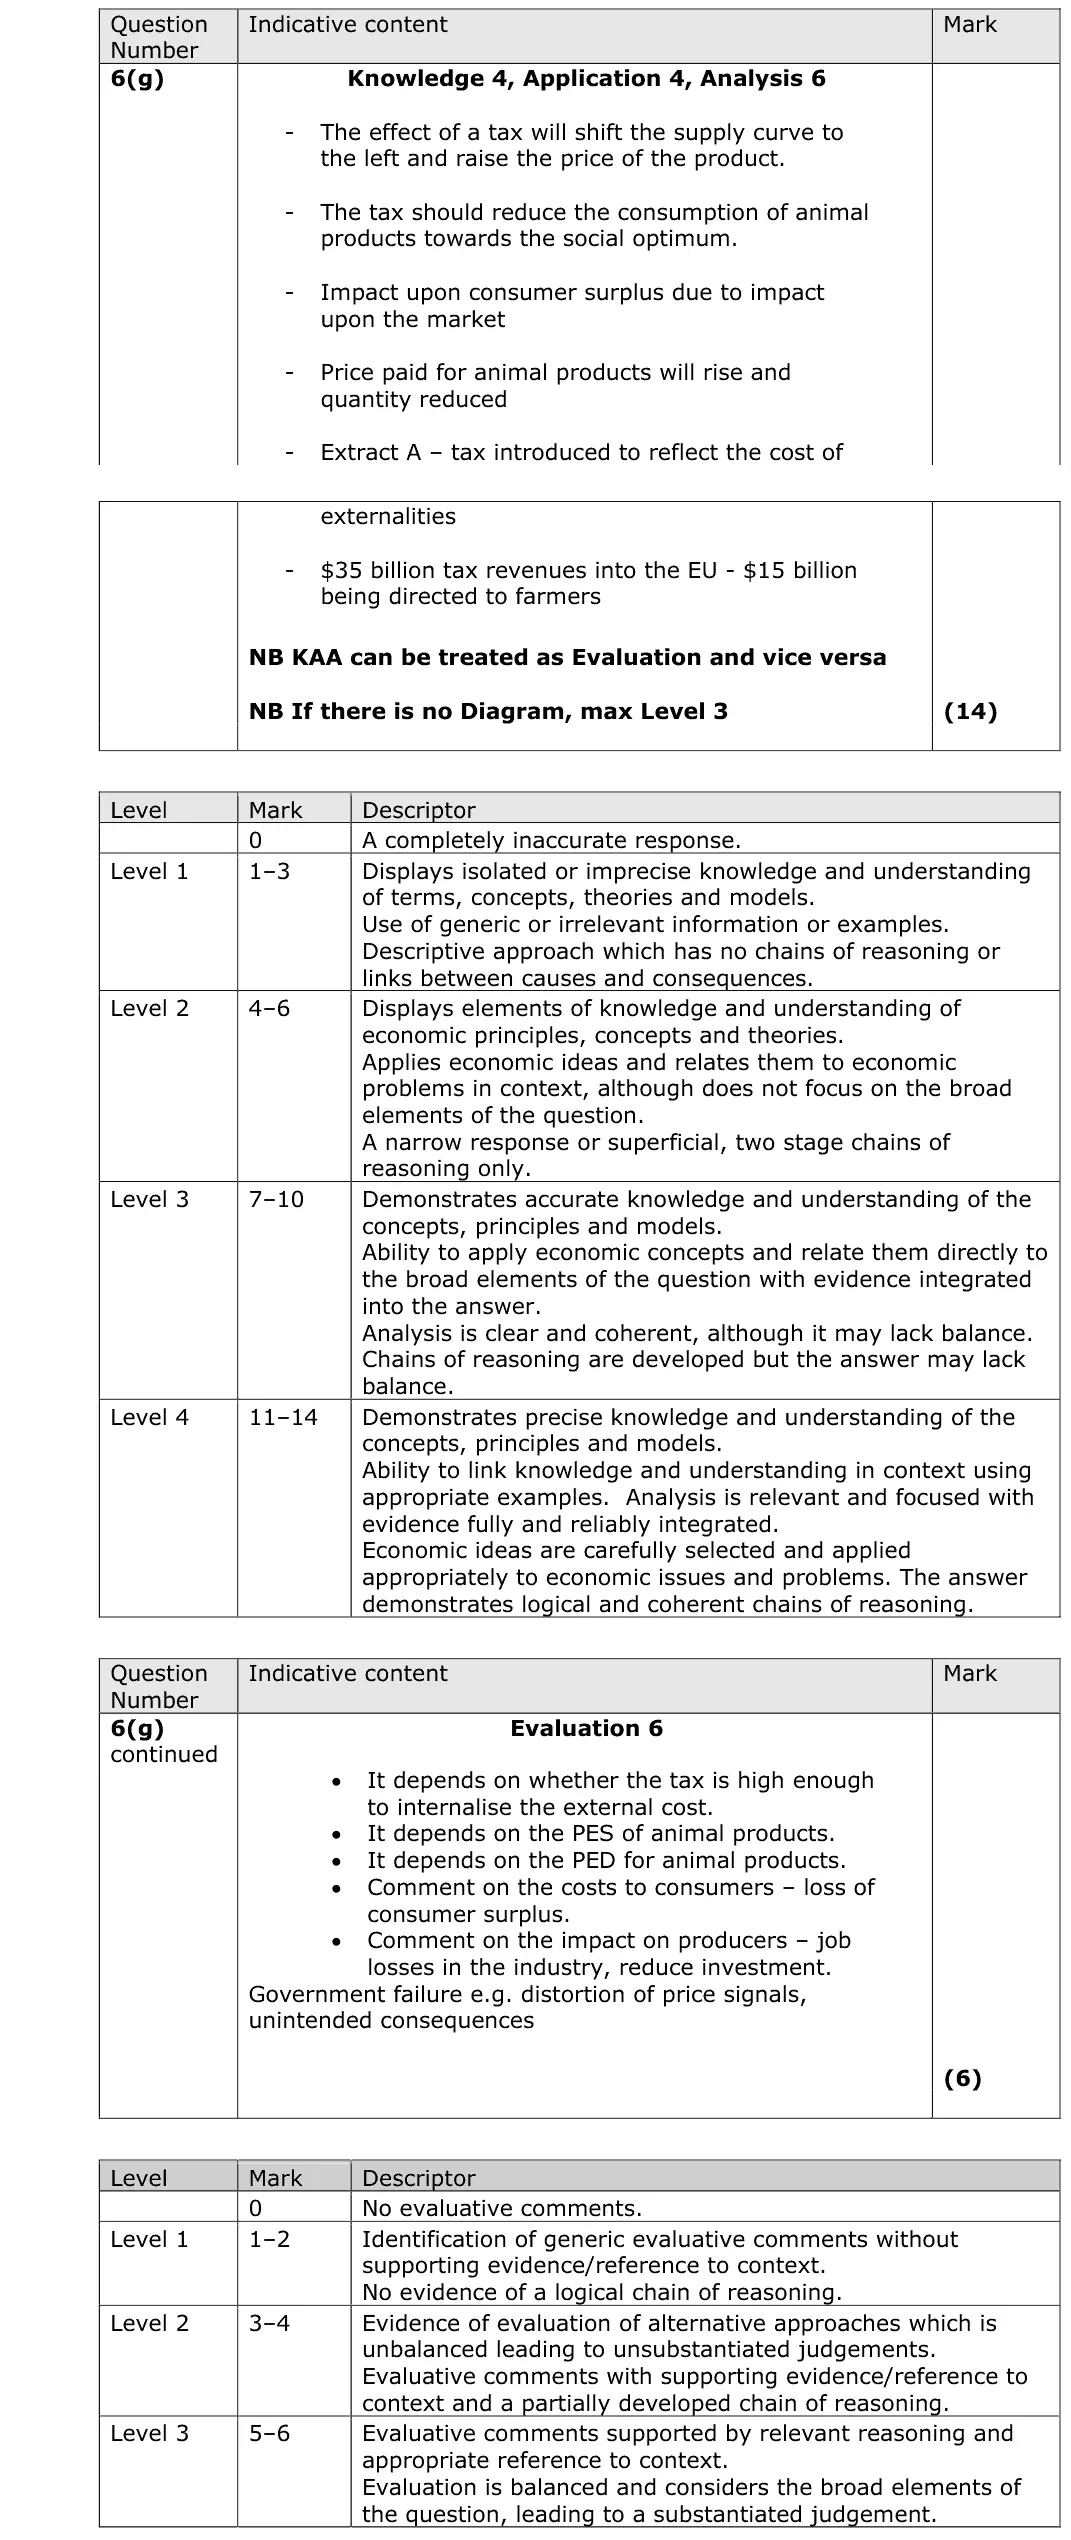
Mark scheme, including the levels grid and indicative content
Examiner's comment
This was a highly accessible question considering the use of taxation to reduce the market failure associated with meat farming. There are numerous possibilities that candidates could explore, and the vast majority talked about the increase in price and switching to other goods, using a simple taxation diagram. This essay required a clear exercise of critical analysis, and strong responses would be expected to have a developed a clear appreciation of the impact of taxation and its benefits and drawbacks as a method of government intervention to correct the market failure and introducing the concept of the incidence of the tax based on the elasticity of the goods. Sophisticated responses recognised that other forms of government intervention would be more effective than taxation. Good use of diagrams was showcased throughout the candidate’s responses, most commonly, an indirect tax diagram. To access evaluation marks, candidates could explore the various strengths and weaknesses of the proposed method and use the prompts in the extracts to consider how effective the policy might be. Another line of development considered how some combination of policies might be necessary to effectively tackle the problem of excessive consumption of production of these animal products. The best responses would work by proposing realistic solutions to the problem of excess demand and then evaluating the most effective in the context of the real- world situation, in this case limiting negative implications.
Notes from the mark scheme and report
indirect tax shifts supply left and raises meat prices (beef £24.24 to £29.50, Figure 2), reducing consumption towards the social optimum
incidence depends on PED and PES
revenue (£35bn) could fund cheaper fruit and veg
evaluate inelastic demand, regressive effect, valuing the externality
Quantitative skills: QS 4 (construct and interpret a range of standard graphical forms)
June 2024 · AS Paper 1 · Q3(b)3 marksAO1=1, AO2=1, AO3=1Short answer
Data and extracts for question 3
Mark scheme
Examiner's comment
This question on the benefits of education being provided by the government did allow stronger candidates to score higher. As indicated above, many answers centered incorrectly around education being non-rivalrous and non-excludable, and therefore explaining that education is a public good. The under provision of education within a free market due to the lack of awareness and consideration of its external benefits was the key missing element of many answers, leading to 3(b) scoring lower than many of the other questions in Section A.
Notes from the mark scheme and report
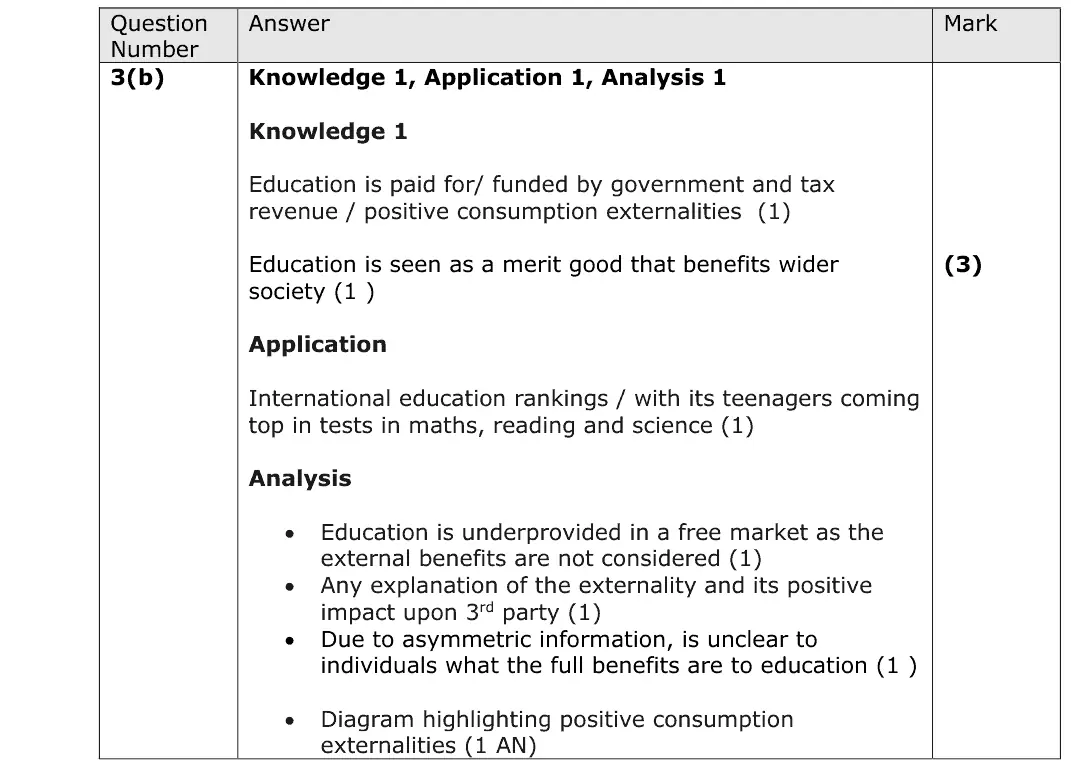
education has positive consumption externalities (and information gaps), so it is under-provided in a free market and funded by taxation
apply e.g. Singapore teenagers top international tests
many wrongly called education a public good (non-rival, non-excludable)
report: scored lower than many other Section A questions
June 2024 · Paper 1 · Q4(a)4 marksAO1=2, AO2=1, AO3=1Short answer
Data and extracts for question 4
Mark scheme
Examiner's comment
On this question, candidates had to explain one likely reason for the maximum price for an undergraduate university programme. The stem mentions the figure of £9250 per year for the next two years. Candidates referring to either the sum or the time period could access the application mark, with the rest of the marks being awarded for a legitimate reason and the explanation of it. Though there were no marks for a definition of a maximum price, a diagram or a definition of a maximum price was awarded as understanding. Concepts such as positive externalities in consumption could also be awarded. Note that the term 'merit good' is not on the specification. Candidates had to explain the difference between private and social benefits or give some indication that they knew what external benefits in consumption actually are. This response achieves all four marks. Although the term 'merit good' isn't on the specification, it is clear from the candidate's explanation that they know tertiary education has benefits to society which are greater than the private benefits alone. For this reason government intervenes to correct this underconsumption. The reference to a maximum price leading to increased consumption shows an implicit understanding of what a maximum price is, and there is specific reference to the cost of tuition being fixed at £9250 for the next two years. Be careful to explain any concept using the terminology of the specification. This second response scored 2 marks only. The first mark is awarded for the notion of education being made more affordable, and the second for a sense of education having external benefits in consumption, though the concept isn't developed. There is no application mark.
Notes from the mark scheme and report
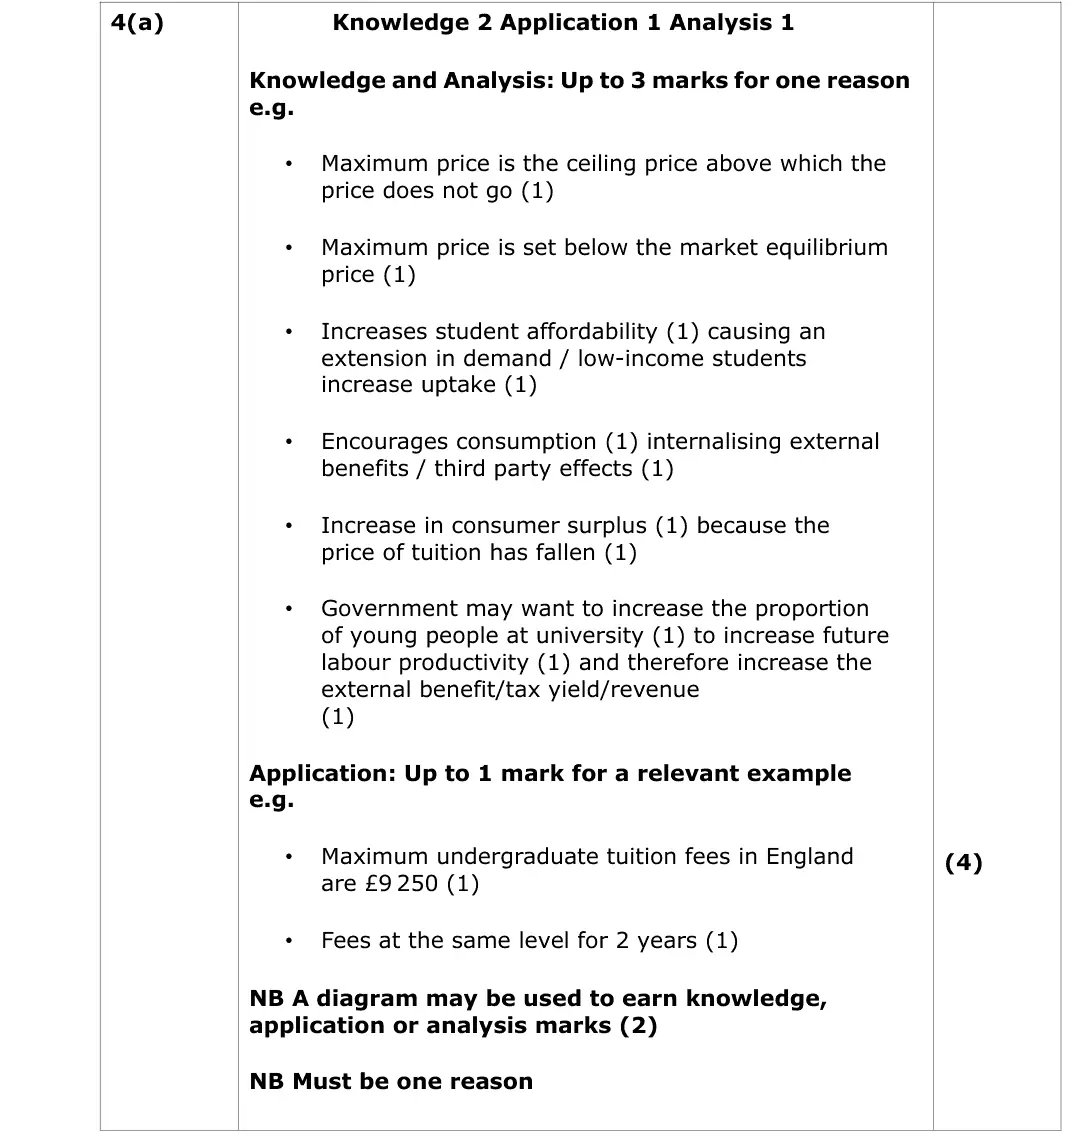
use the £9 250 fee or the two-year freeze for the application mark
no mark for just defining a maximum price
'merit good' is not on the spec, explain external benefits instead
Quantitative skills: QS 9 (interpret, apply and analyse information in written, graphical tabular and numerical forms)
June 2024 · Paper 1 · Q6(e)15 marksAO1=3, AO2=3, AO3=3, AO4=615-mark response
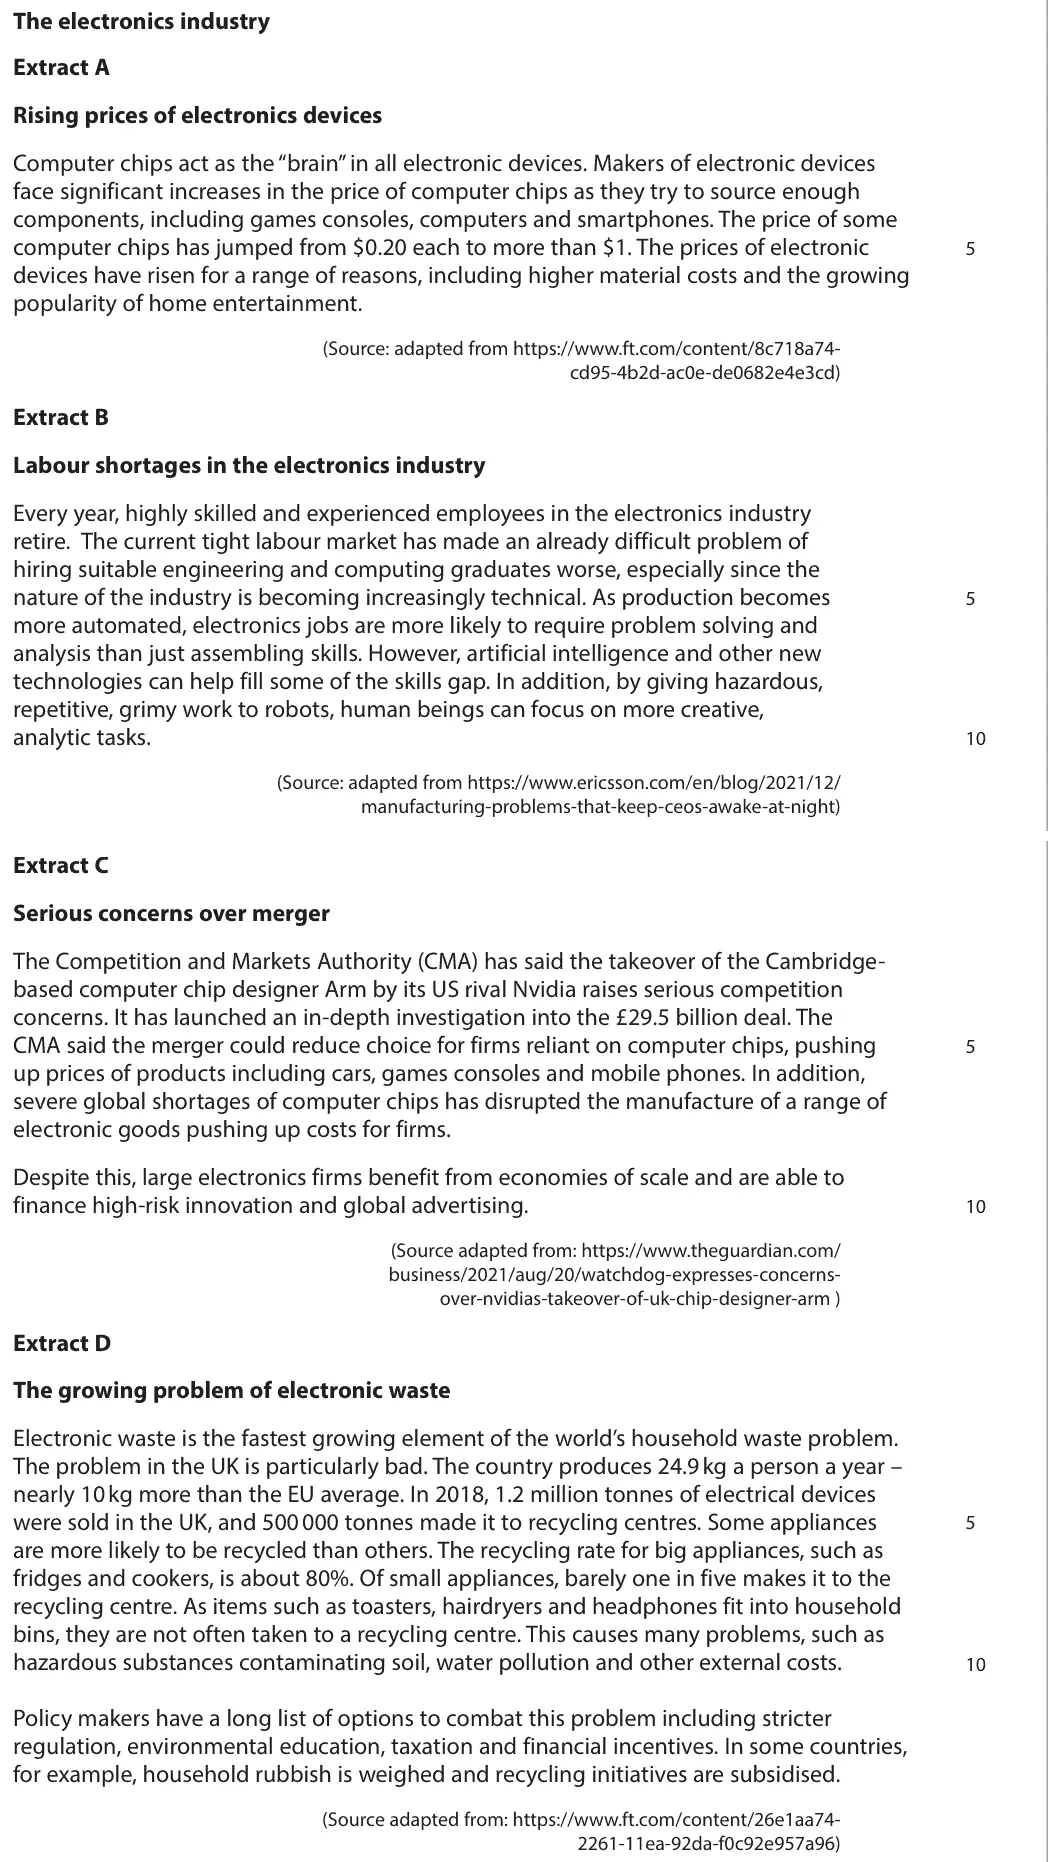
Data and extracts for question 6
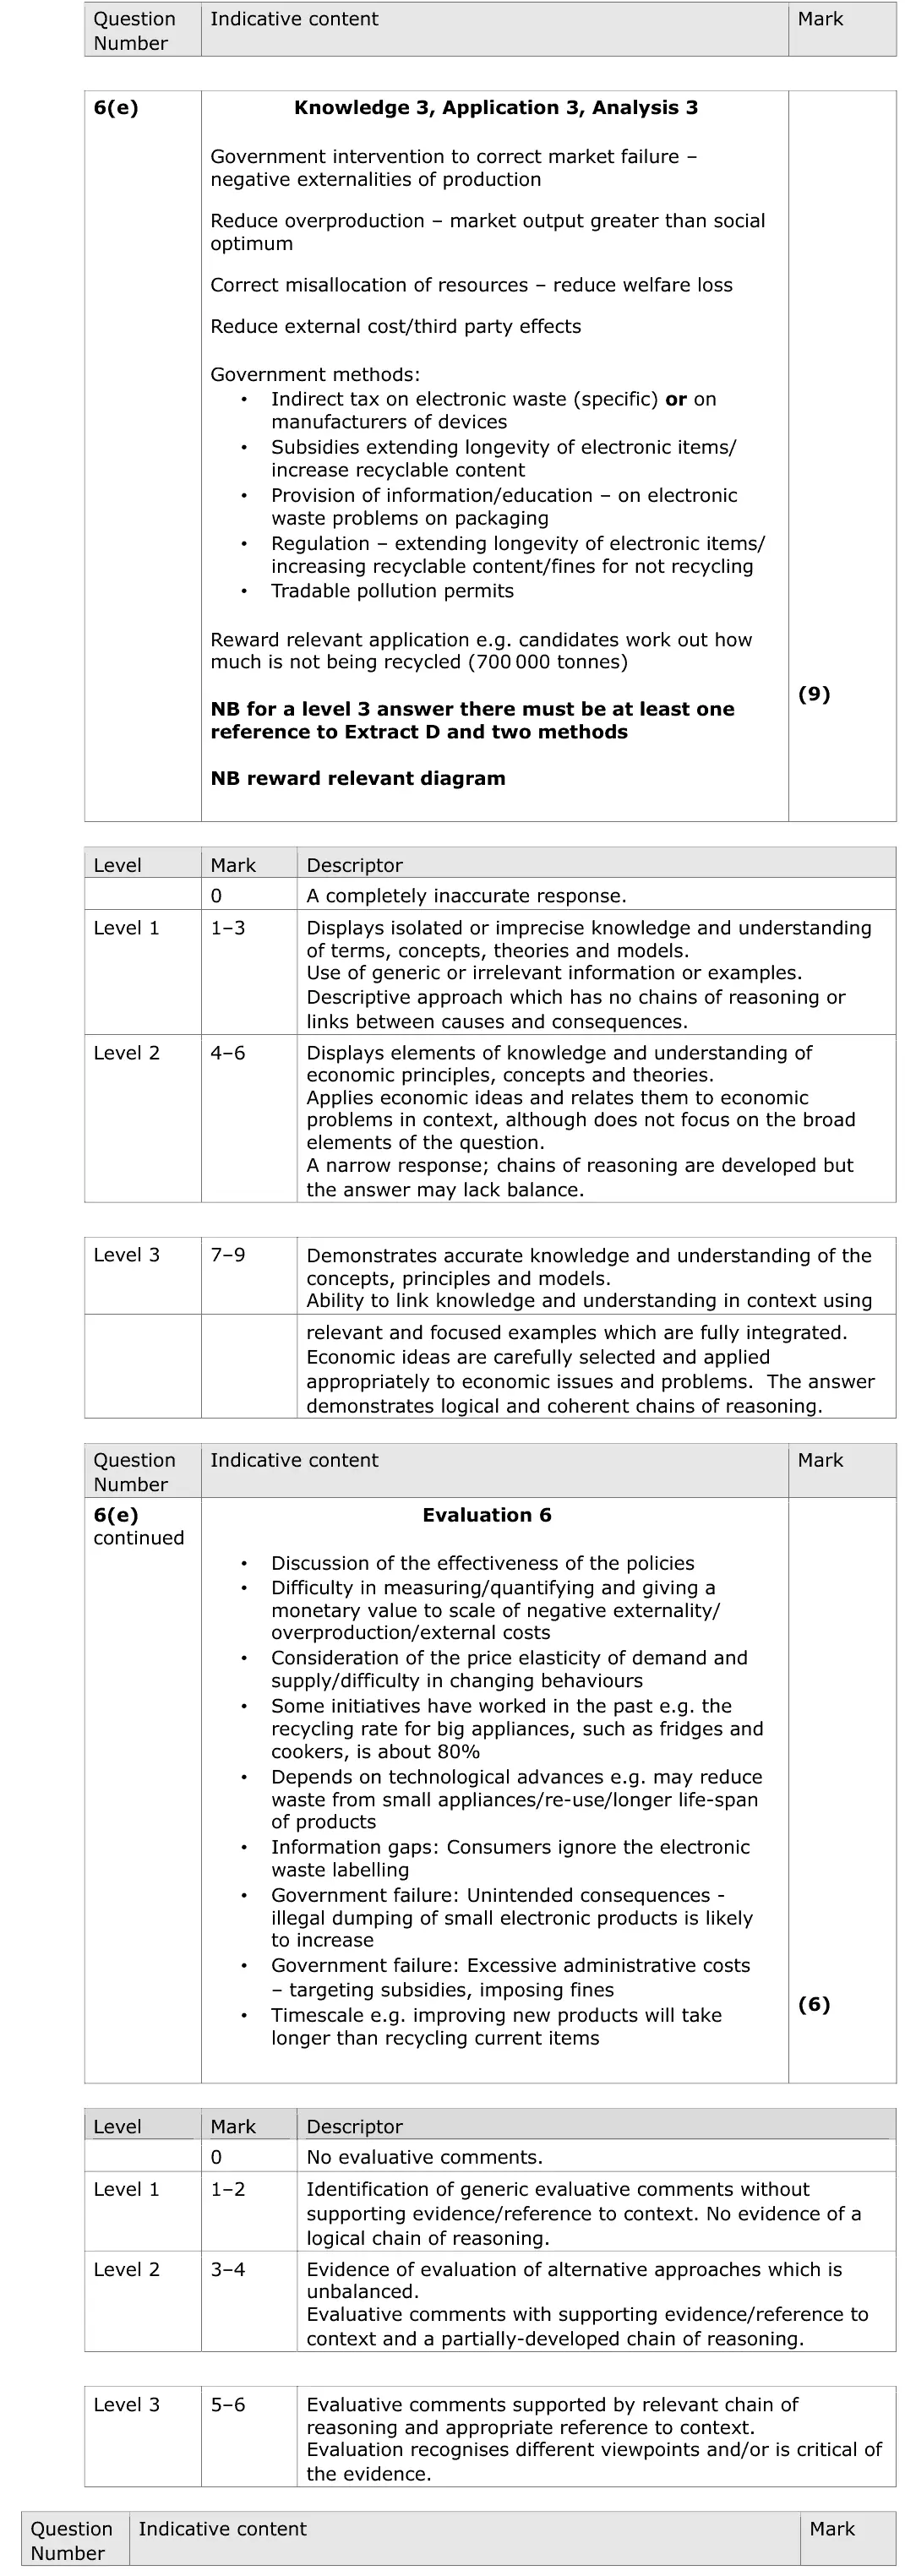
Mark scheme, including the levels grid and indicative content
Examiner's comment
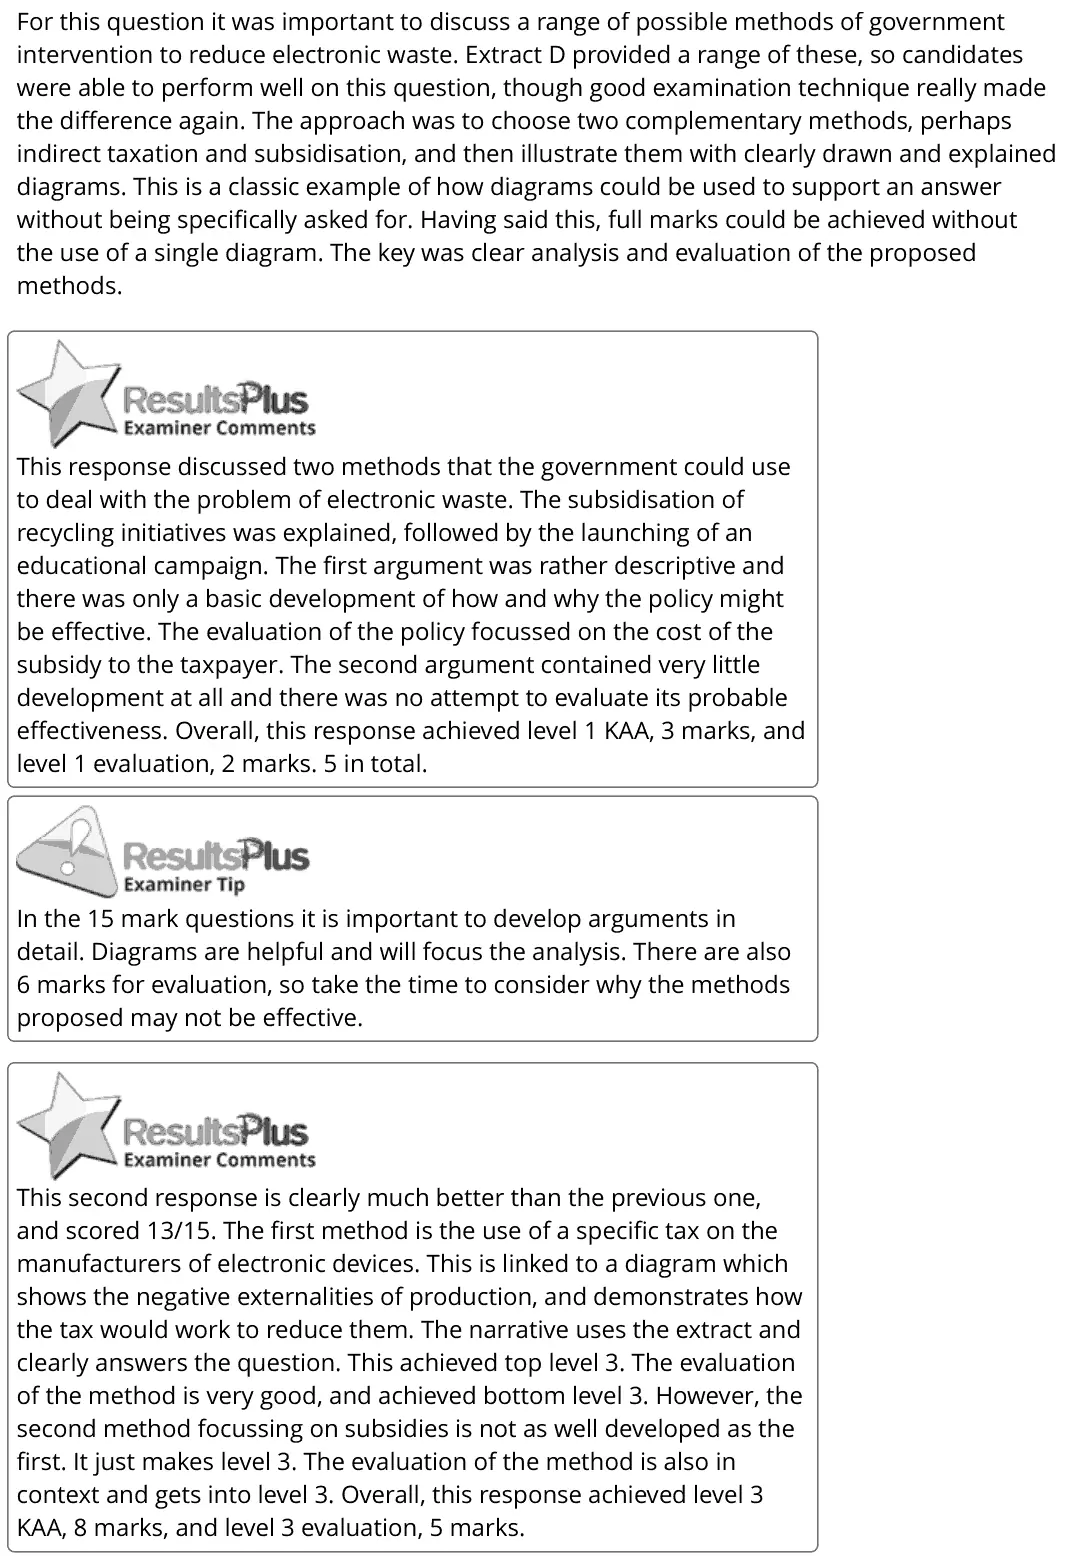
For this question it was important to discuss a range of possible methods of government intervention to reduce electronic waste. Extract D provided a range of these, so candidates were able to perform well on this question, though good examination technique really made the difference again. The approach was to choose two complementary methods, perhaps indirect taxation and subsidisation, and then illustrate them with clearly drawn and explained diagrams. This is a classic example of how diagrams could be used to support an answer without being specifically asked for. Having said this, full marks could be achieved without the use of a single diagram. The key was clear analysis and evaluation of the proposed methods. This response discussed two methods that the government could use to deal with the problem of electronic waste. The subsidisation of recycling initiatives was explained, followed by the launching of an educational campaign. The first argument was rather descriptive and there was only a basic development of how and why the policy might be effective. The evaluation of the policy focussed on the cost of the subsidy to the taxpayer. The second argument contained very little development at all and there was no attempt to evaluate its probable effectiveness. Overall, this response achieved level 1 KAA, 3 marks, and level 1 evaluation, 2 marks. 5 in total. In the 15 mark questions it is important to develop arguments in detail. Diagrams are helpful and will focus the analysis. There are also 6 marks for evaluation, so take the time to consider why the methods proposed may not be effective. This second response is clearly much better than the previous one, and scored 13/15. The first method is the use of a specific tax on the manufacturers of electronic devices. This is linked to a diagram which shows the negative externalities of production, and demonstrates how the tax would work to reduce them. The narrative uses the extract and clearly answers the question. This achieved top level 3. The evaluation of the method is very good, and achieved bottom level 3. However, the second method focussing on subsidies is not as well developed as the first. It just makes level 3. The evaluation of the method is also in context and gets into level 3. Overall, this response achieved level 3 KAA, 8 marks, and level 3 evaluation, 5 marks.
Notes from the mark scheme and report
Level 3 needs two methods and at least one reference to Extract D
indirect tax / subsidy with negative-externality diagrams
evaluate effectiveness, e.g. valuing the external cost
June 2024 · AS Paper 1 · Q6(f)20 marksAO1=4, AO2=4, AO3=6, AO4=620-mark essayEither/orHard
Data and extracts for question 6
Mark scheme, including the levels grid and indicative content
Examiner's comment
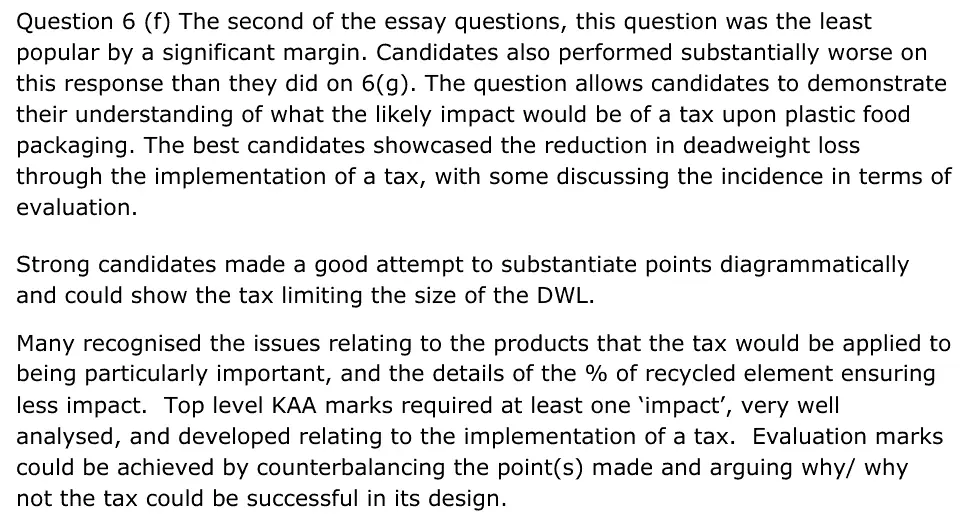
Question 6 (f) The second of the essay questions, this question was the least popular by a significant margin. Candidates also performed substantially worse on this response than they did on 6(g). The question allows candidates to demonstrate their understanding of what the likely impact would be of a tax upon plastic food packaging. The best candidates showcased the reduction in deadweight loss through the implementation of a tax, with some discussing the incidence in terms of evaluation. Strong candidates made a good attempt to substantiate points diagrammatically and could show the tax limiting the size of the DWL. Many recognised the issues relating to the products that the tax would be applied to being particularly important, and the details of the % of recycled element ensuring less impact. Top level KAA marks required at least one ‘impact’, very well analysed, and developed relating to the implementation of a tax. Evaluation marks could be achieved by counterbalancing the point(s) made and arguing why/ why not the tax could be successful in its design.
Notes from the mark scheme and report
maximum Level 3 without a valid diagram (MSC/MPC+tax externality diagram or tax incidence diagram)
higher food prices, less consumer surplus, incentive to use recycled packaging, revenue to hypothecate
evaluate with PED, size of the tax, the 30% recycled exemption
report: "Candidates also performed substantially worse on this response than they did on 6(g)"
Quantitative skills: QS 4 (construct and interpret a range of standard graphical forms)
June 2024 · AS Paper 1 · Q6(g)20 marksAO1=4, AO2=4, AO3=6, AO4=620-mark essayEither/or
Data and extracts for question 6
Mark scheme, including the levels grid and indicative content
Examiner's comment
Question 6 (g) This was a highly accessible question considering the methods that could be used to reduce the market failure associated with plastic waste. There are numerous possibilities that candidates could explore, and the vast majority talked about subsidies, taxation or minimum prices being introduced. This essay requires a clear exercise of critical analysis, and good candidates would be expected to have a developed a clear appreciation of the method of government intervention to correct the market failure. Sophisticated responses recognised that some forms of government intervention would be more effective than others. Good use of diagrams was showcased throughout the candidates’ responses, most commonly, an indirect tax diagram. To access evaluation marks candidates could explore the various strengths and weaknesses of each method proposed and use the prompts in the extracts to consider how effective the policy might be. Another line of development considered how some combination of policies might be necessary to effectively tackle the problem of environmental damage. The best responses would work by proposing realistic solutions to the problem of excess demand and then evaluating the most effective in the context of the real- world situation, in this case limiting the implications of too much consumption or production of plastic.
Notes from the mark scheme and report
maximum Level 3 without a valid diagram
subsidies for alternatives, information, taxation, bans, minimum prices, regulation
evaluate each with government failure (distortion of price signals, unintended consequences, administrative costs, information gaps), PED and opportunity cost
combinations of policies
Quantitative skills: QS 4 (construct and interpret a range of standard graphical forms)
June 2023 · AS Paper 1 · Q1(a)1 markMultiple choice
Data and extracts for question 1
Answer
C
Mark scheme
Notes from the mark scheme and report
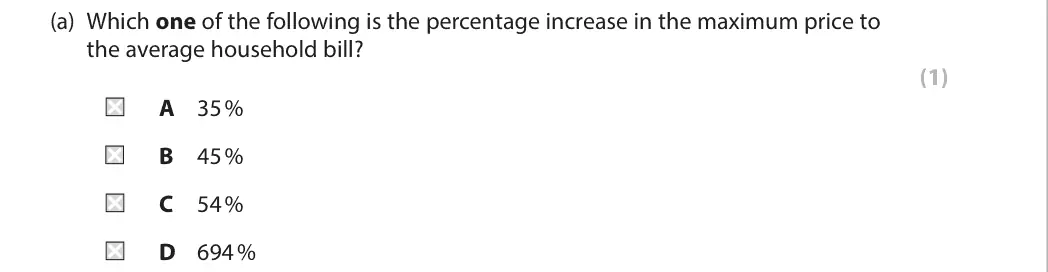
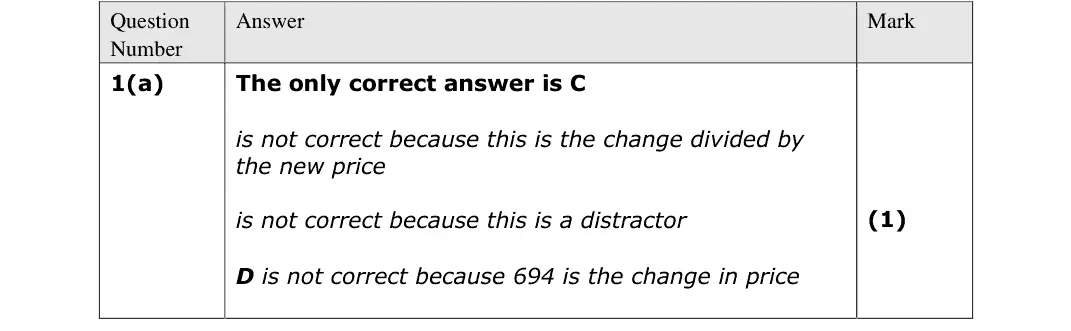
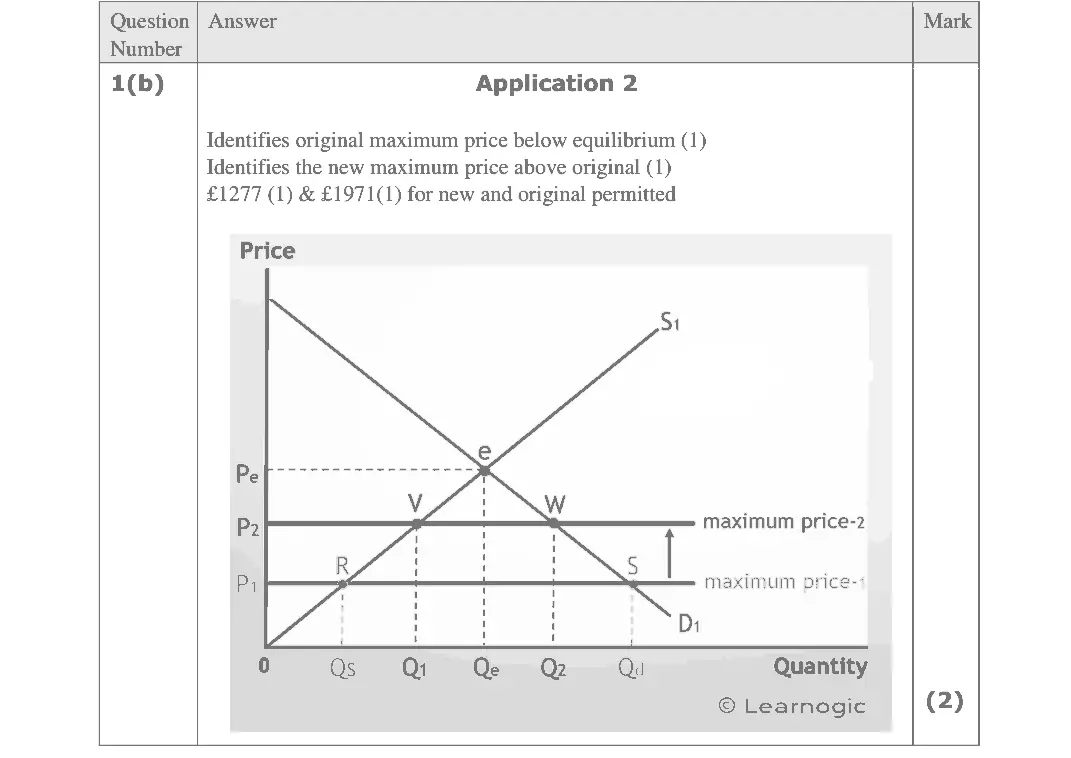
(1 971 - 1 277)/1 277 x 100 = 54% (C)
A divides the change by the new price
D is the change in pounds (694), not a percentage
Quantitative skills: QS 2 (calculate, use and understand percentages, percentage changes and percentage point changes)
June 2023 · AS Paper 1 · Q1(b)2 marksAO2=2Short answer
Data and extracts for question 1
Mark scheme
Examiner's comment
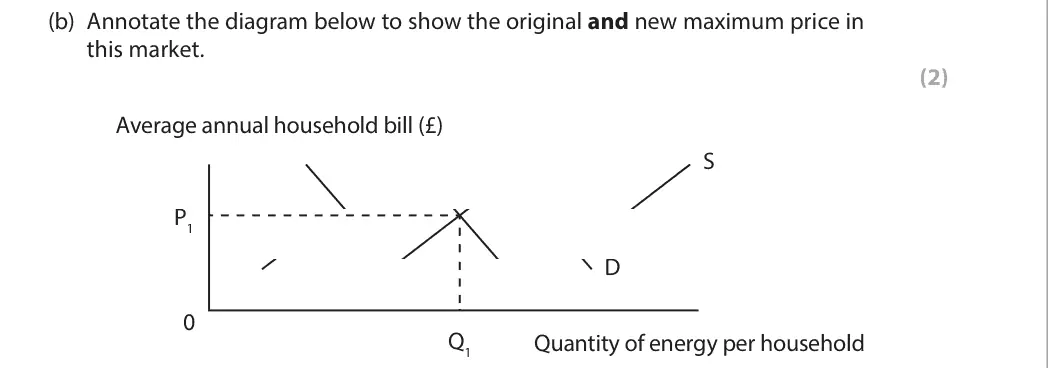
Candidates performed well on this question, with most able to distinguish where the original and maximum price would appear on the. A common misconception was to add the maximum price above equilibrium which a high number of students showcased.
Notes from the mark scheme and report
a maximum price is set below equilibrium: mark the original cap (£1 277) below P1 and the new cap (£1 971) higher but still a ceiling
many wrongly put the maximum price above equilibrium
Quantitative skills: QS 4 (construct and interpret a range of standard graphical forms)
June 2023 · AS Paper 1 · Q6(f)20 marksAO1=4, AO2=4, AO3=6, AO4=620-mark essayEither/or
Data and extracts for question 6
Mark scheme, including the levels grid and indicative content
Examiner's comment
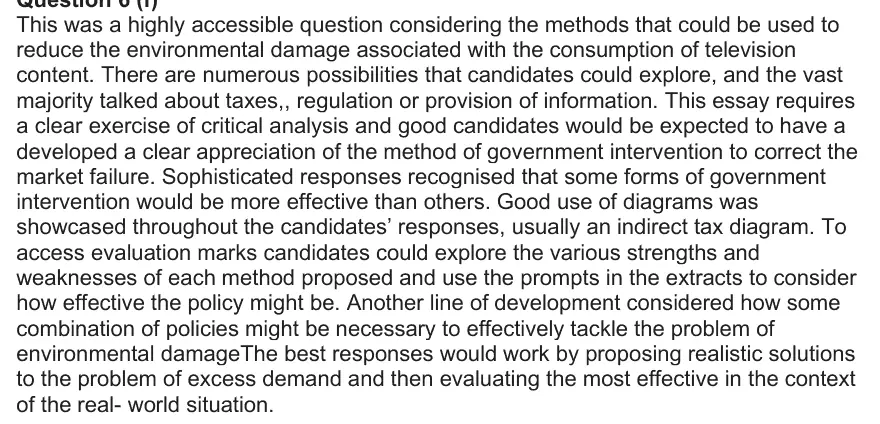
This was a highly accessible question considering the methods that could be used to reduce the environmental damage associated with the consumption of television content. There are numerous possibilities that candidates could explore, and the vast majority talked about taxes,, regulation or provision of information. This essay requires a clear exercise of critical analysis and good candidates would be expected to have a developed a clear appreciation of the method of government intervention to correct the market failure. Sophisticated responses recognised that some forms of government intervention would be more effective than others. Good use of diagrams was showcased throughout the candidates’ responses, usually an indirect tax diagram. To access evaluation marks candidates could explore the various strengths and weaknesses of each method proposed and use the prompts in the extracts to consider how effective the policy might be. Another line of development considered how some combination of policies might be necessary to effectively tackle the problem of environmental damageThe best responses would work by proposing realistic solutions to the problem of excess demand and then evaluating the most effective in the context of the real- world situation.
Notes from the mark scheme and report
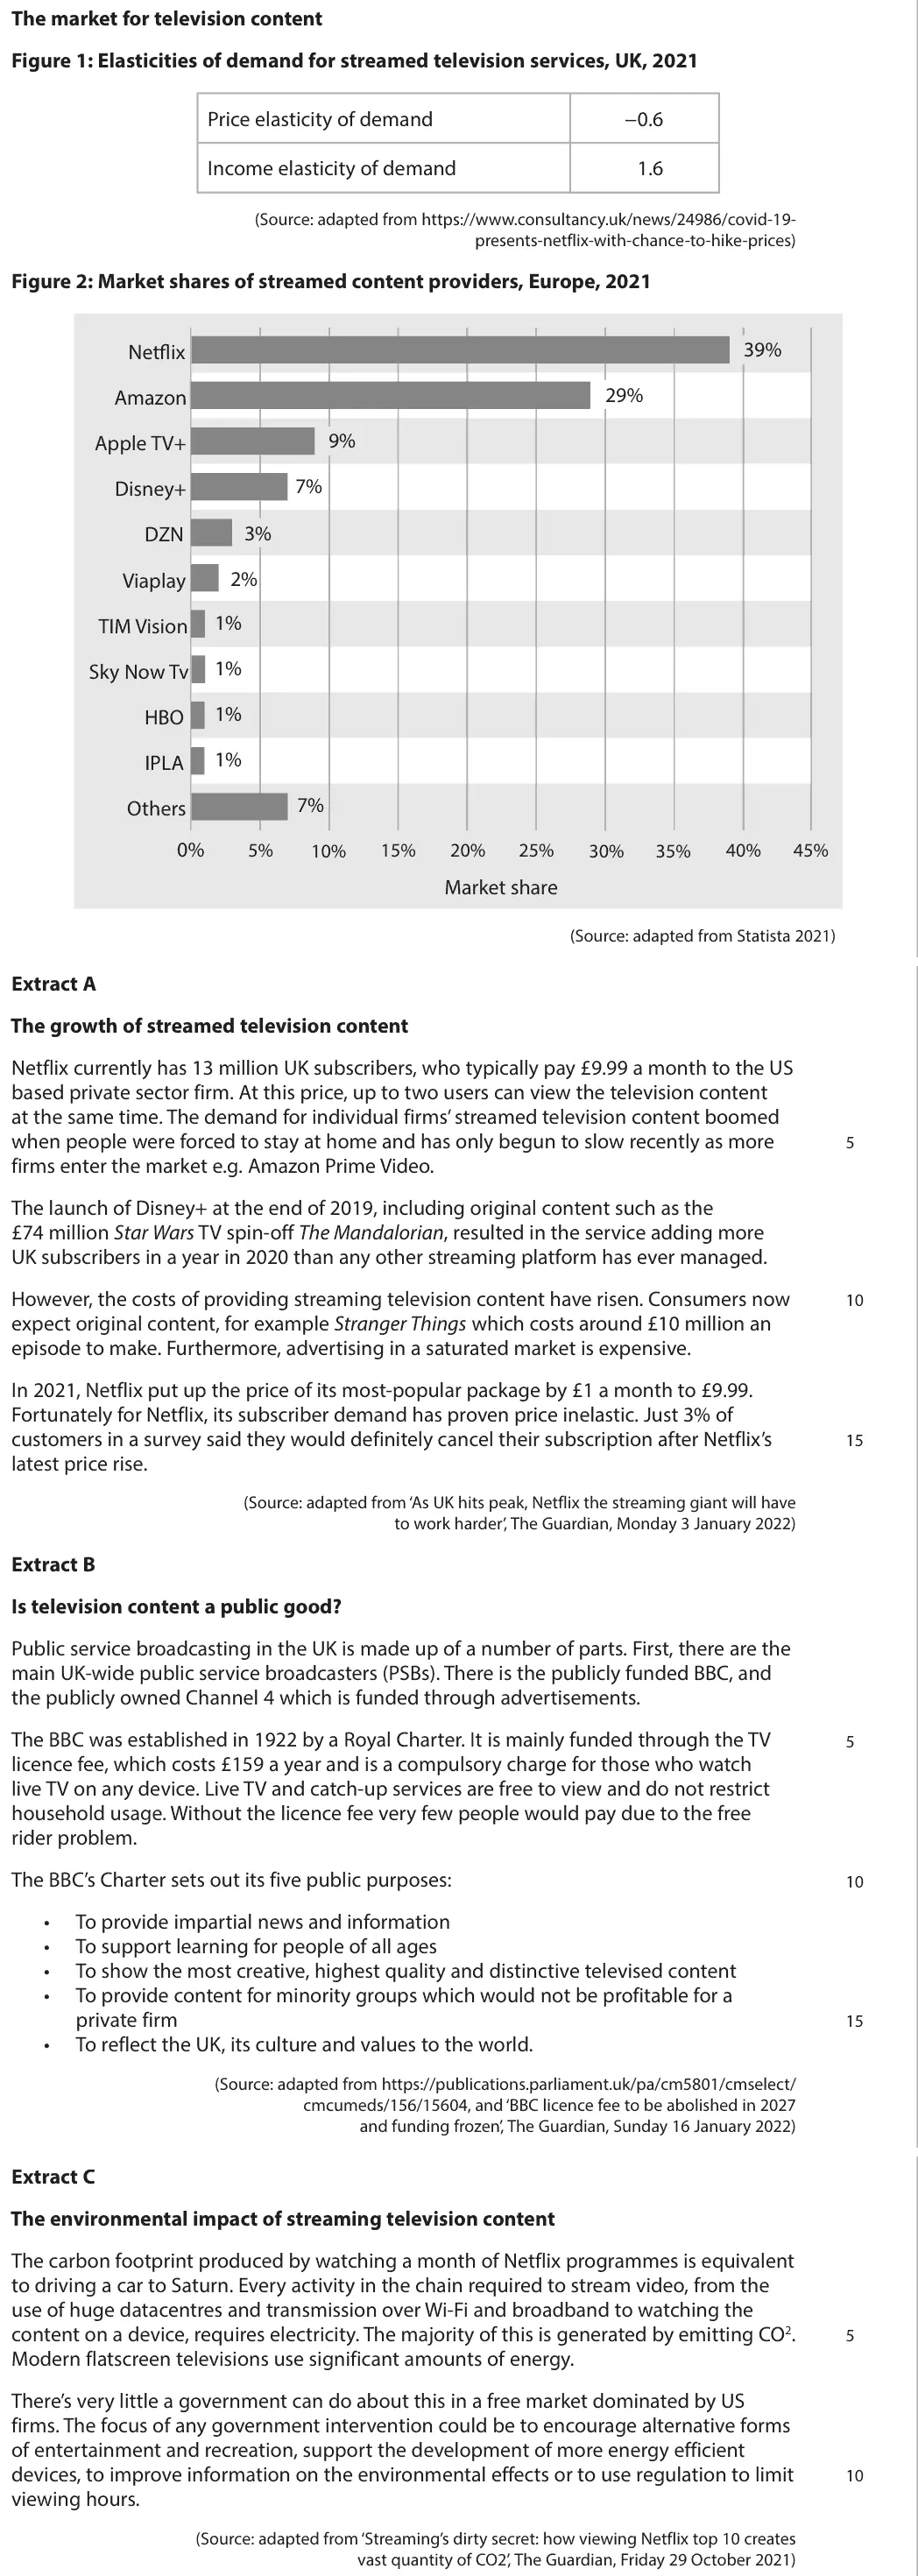
negative consumption externality from electricity use and CO2 (Extract C)
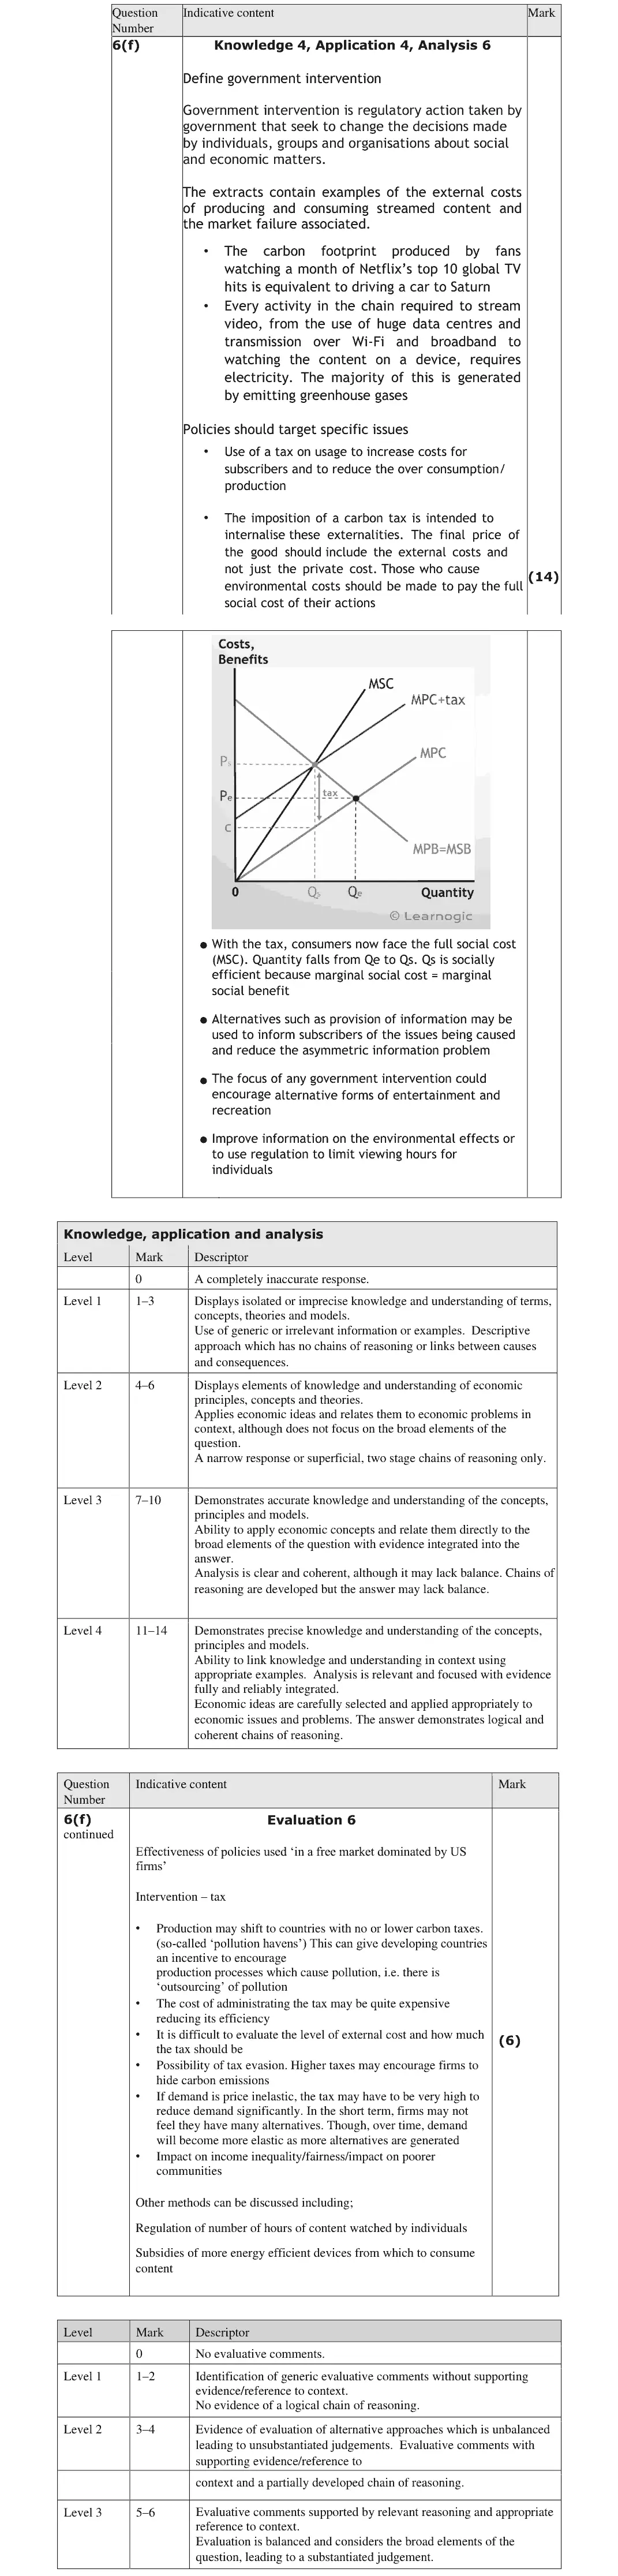
tax to internalise the external cost (MSC), information provision, regulation of viewing hours, subsidies for efficient devices
evaluate effectiveness, valuing the externality, US firms beyond UK reach
Quantitative skills: QS 4 (construct and interpret a range of standard graphical forms)
June 2023 · Paper 1 · Q725 marksAO1=4, AO2=4, AO3=8, AO4=925-mark essayEither/or
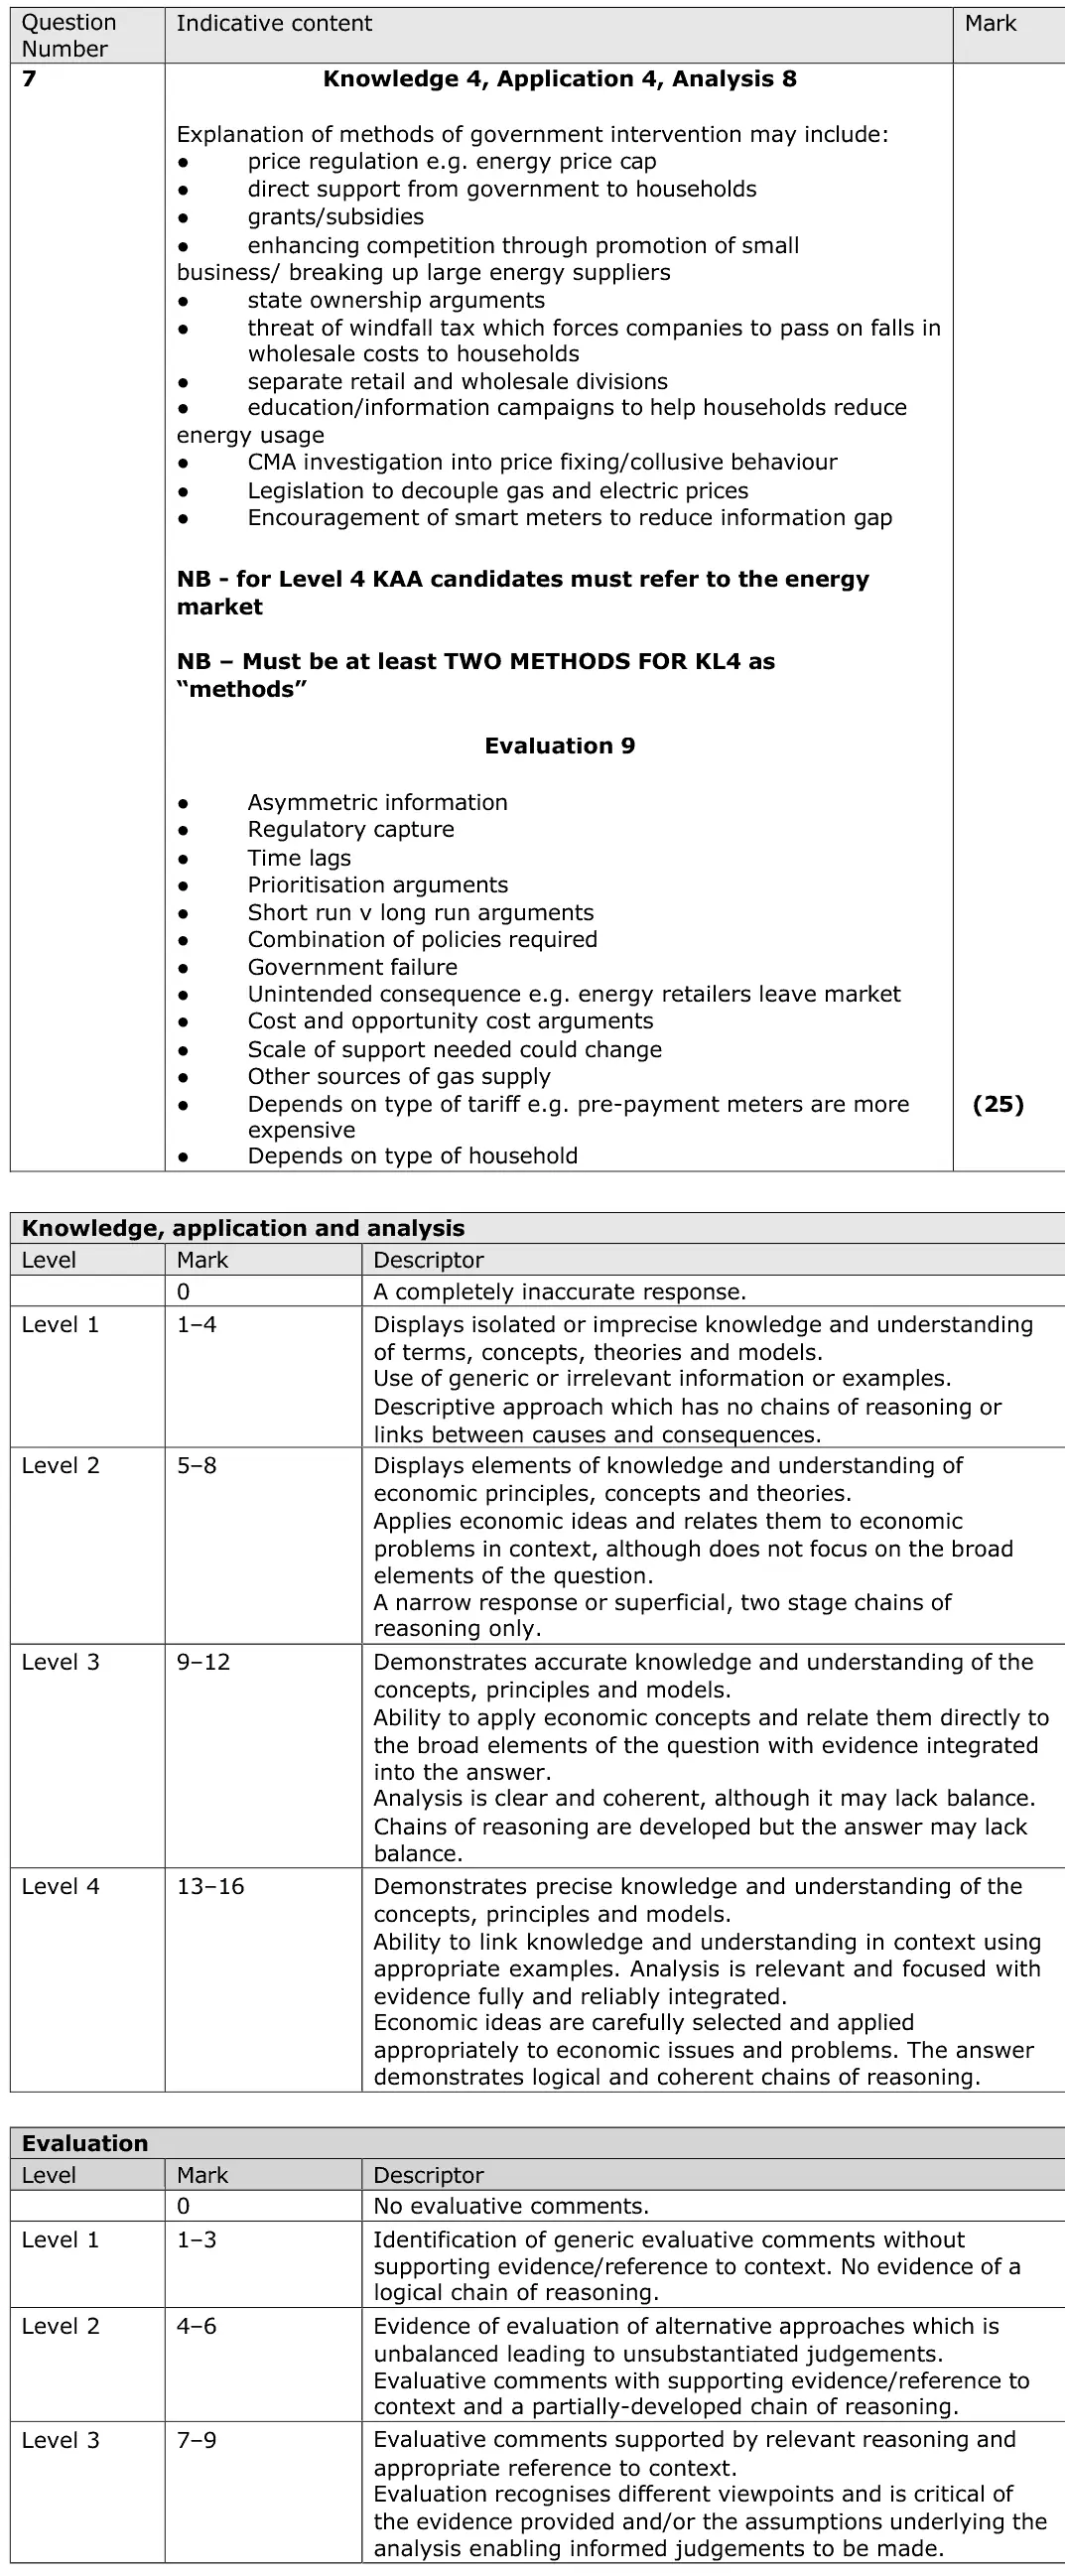
Mark scheme, including the levels grid and indicative content
Examiner's comment
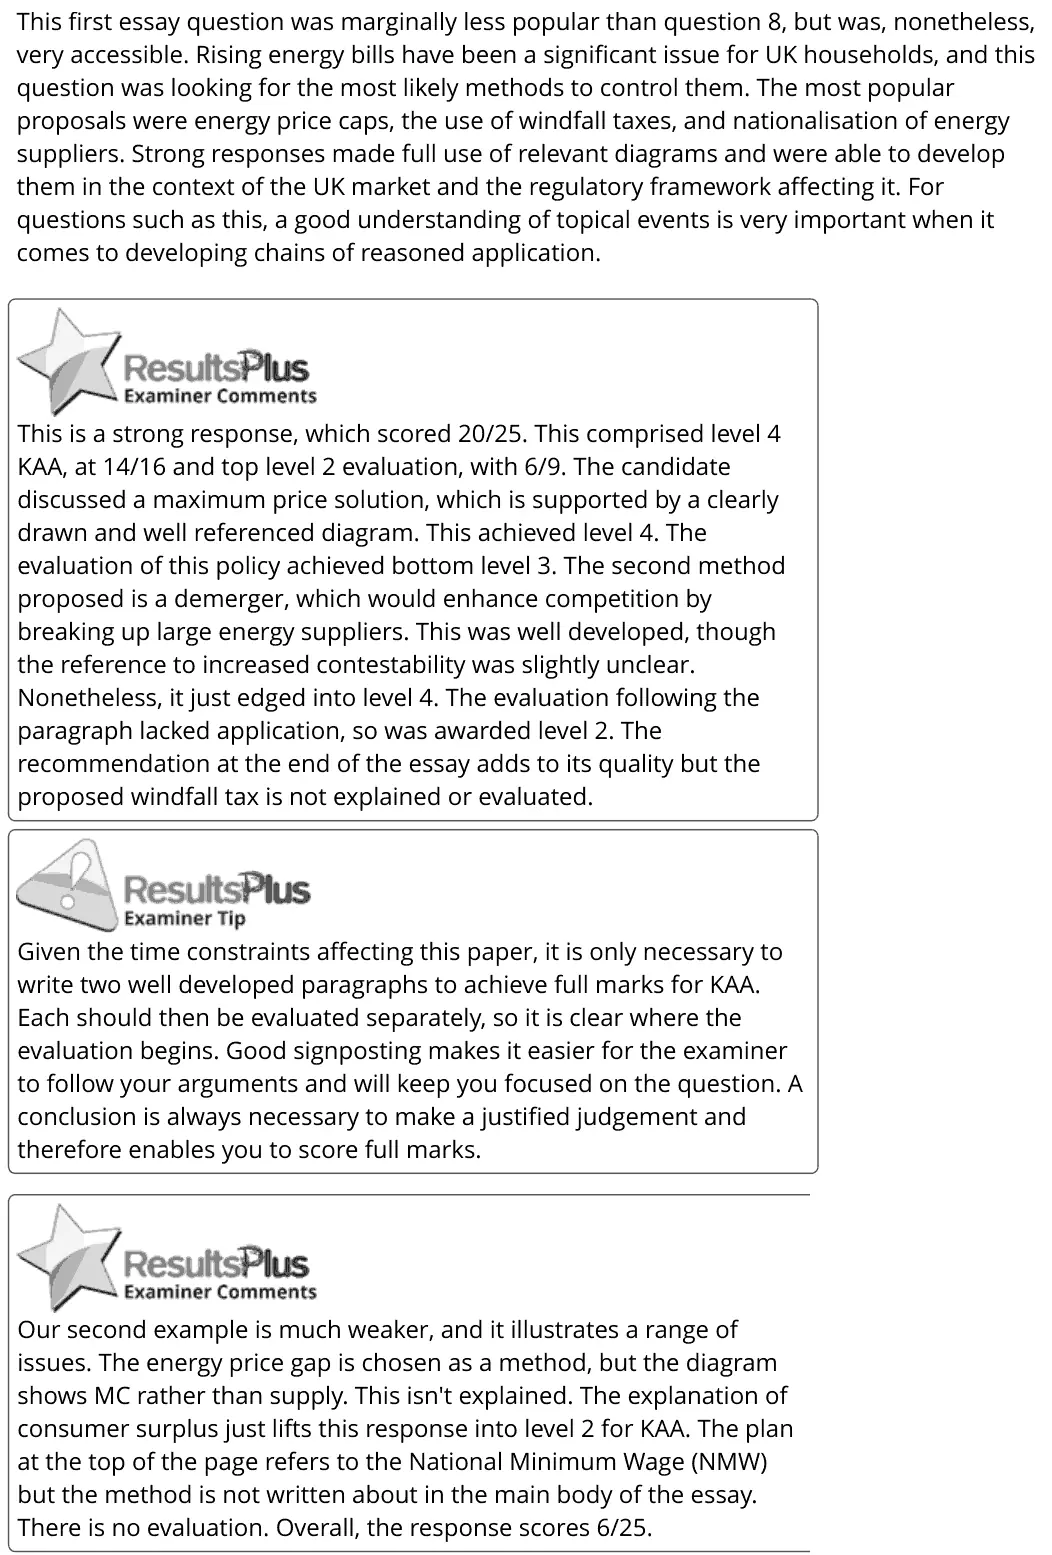
This first essay question was marginally less popular than question 8, but was, nonetheless, very accessible. Rising energy bills have been a significant issue for UK households, and this question was looking for the most likely methods to control them. The most popular proposals were energy price caps, the use of windfall taxes, and nationalisation of energy suppliers. Strong responses made full use of relevant diagrams and were able to develop them in the context of the UK market and the regulatory framework affecting it. For questions such as this, a good understanding of topical events is very important when it comes to developing chains of reasoned application. This is a strong response, which scored 20/25. This comprised level 4 KAA, at 14/16 and top level 2 evaluation, with 6/9. The candidate discussed a maximum price solution, which is supported by a clearly drawn and well referenced diagram. This achieved level 4. The evaluation of this policy achieved bottom level 3. The second method proposed is a demerger, which would enhance competition by breaking up large energy suppliers. This was well developed, though the reference to increased contestability was slightly unclear. Nonetheless, it just edged into level 4. The evaluation following the paragraph lacked application, so was awarded level 2. The recommendation at the end of the essay adds to its quality but the proposed windfall tax is not explained or evaluated. Given the time constraints affecting this paper, it is only necessary to write two well developed paragraphs to achieve full marks for KAA. Each should then be evaluated separately, so it is clear where the evaluation begins. Good signposting makes it easier for the examiner to follow your arguments and will keep you focused on the question. A conclusion is always necessary to make a justified judgement and therefore enables you to score full marks. Our second example is much weaker, and it illustrates a range of issues. The energy price gap is chosen as a method, but the diagram shows MC rather than supply. This isn't explained. The explanation of consumer surplus just lifts this response into level 2 for KAA. The plan at the top of the page refers to the National Minimum Wage (NMW) but the method is not written about in the main body of the essay. There is no evaluation. Overall, the response scores 6/25.
Notes from the mark scheme and report
energy price cap (maximum price) with diagram, windfall tax, subsidies or direct support to households, nationalisation, promoting competition
evaluate with shortages, firms exiting, cost to government and government failure
topical knowledge helps application
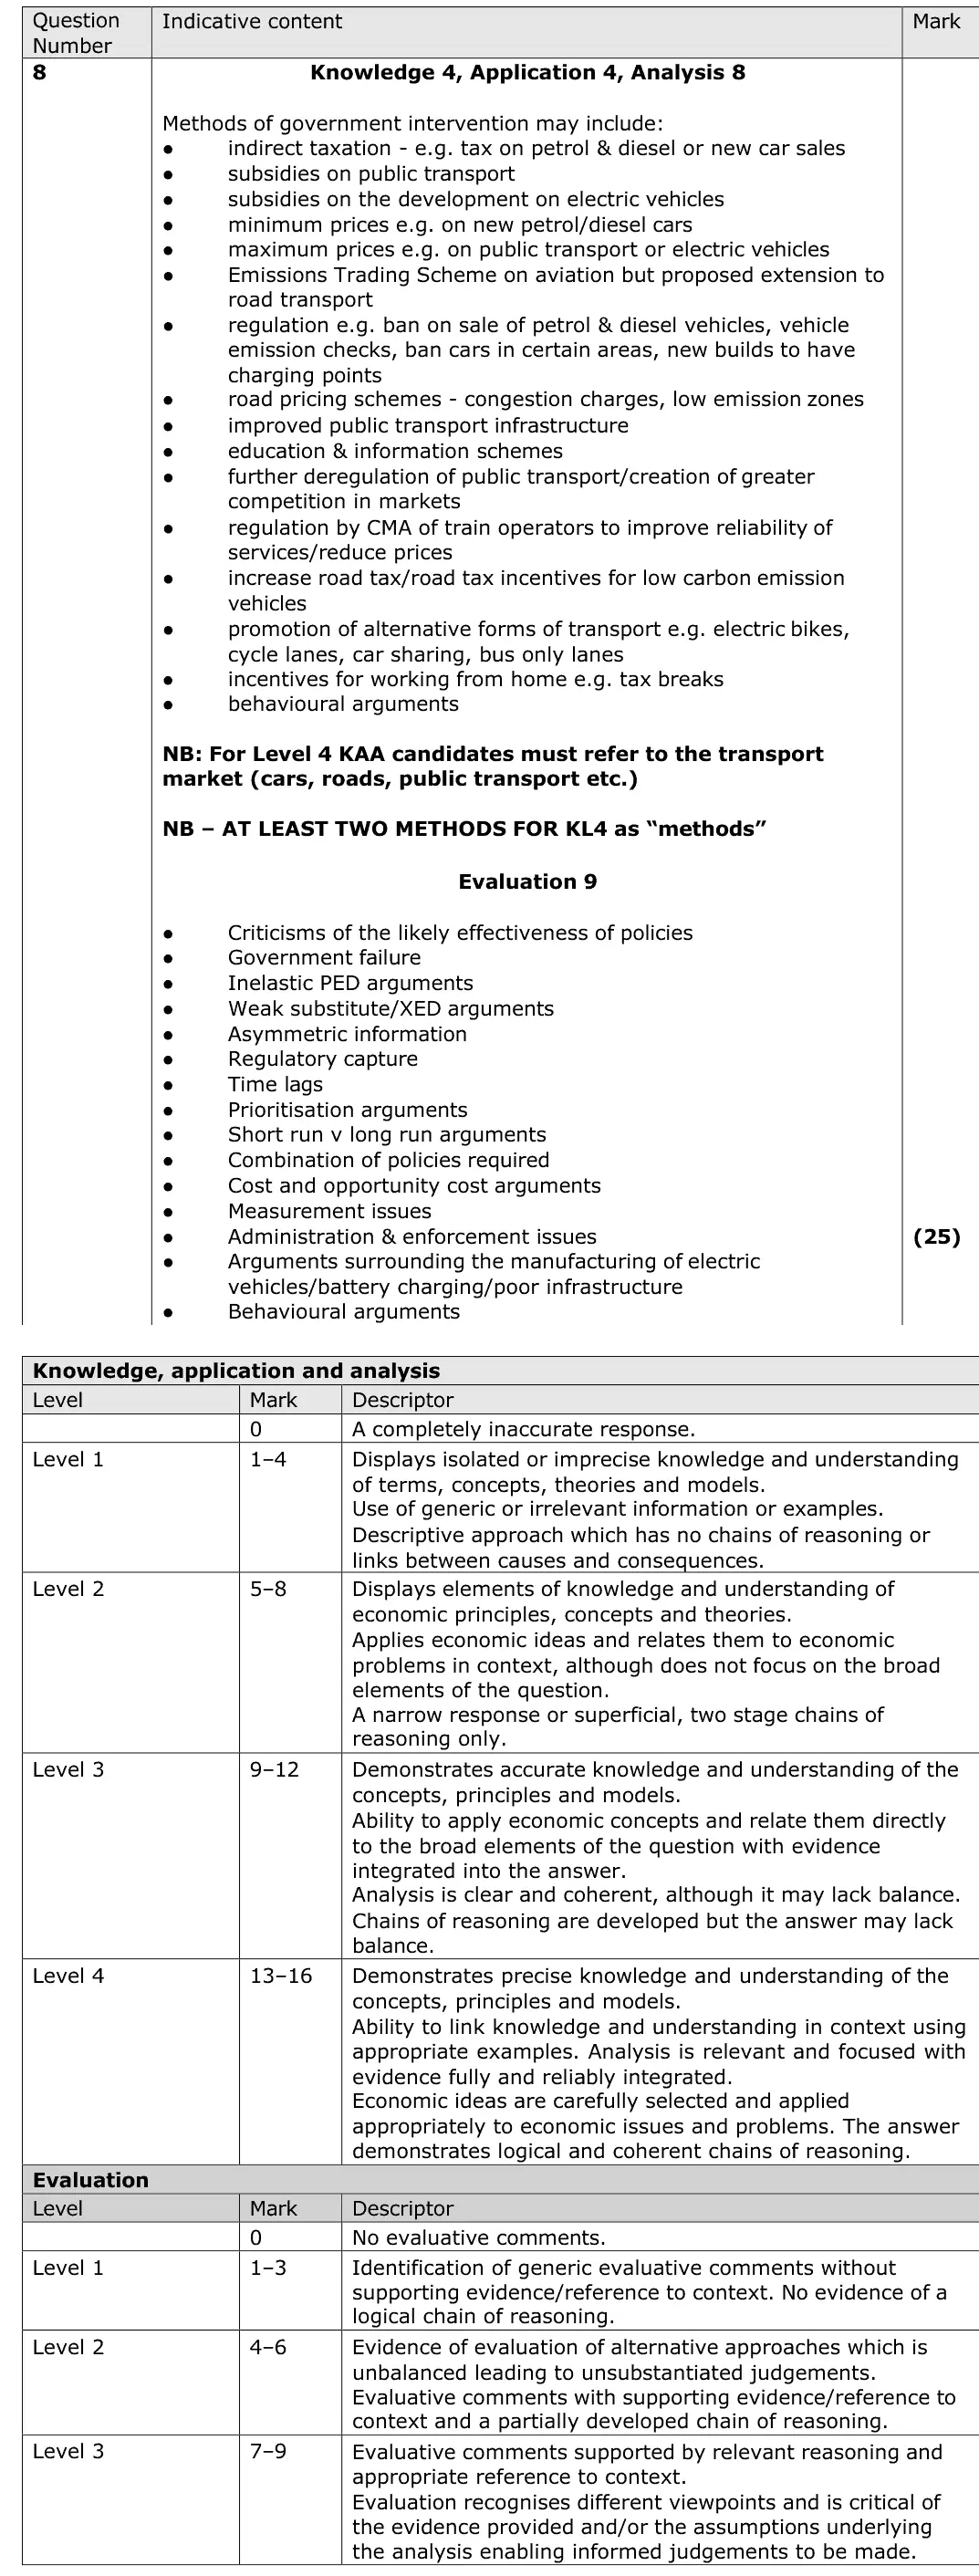
June 2023 · Paper 1 · Q825 marksAO1=4, AO2=4, AO3=8, AO4=925-mark essayEither/or
Mark scheme, including the levels grid and indicative content
Examiner's comment
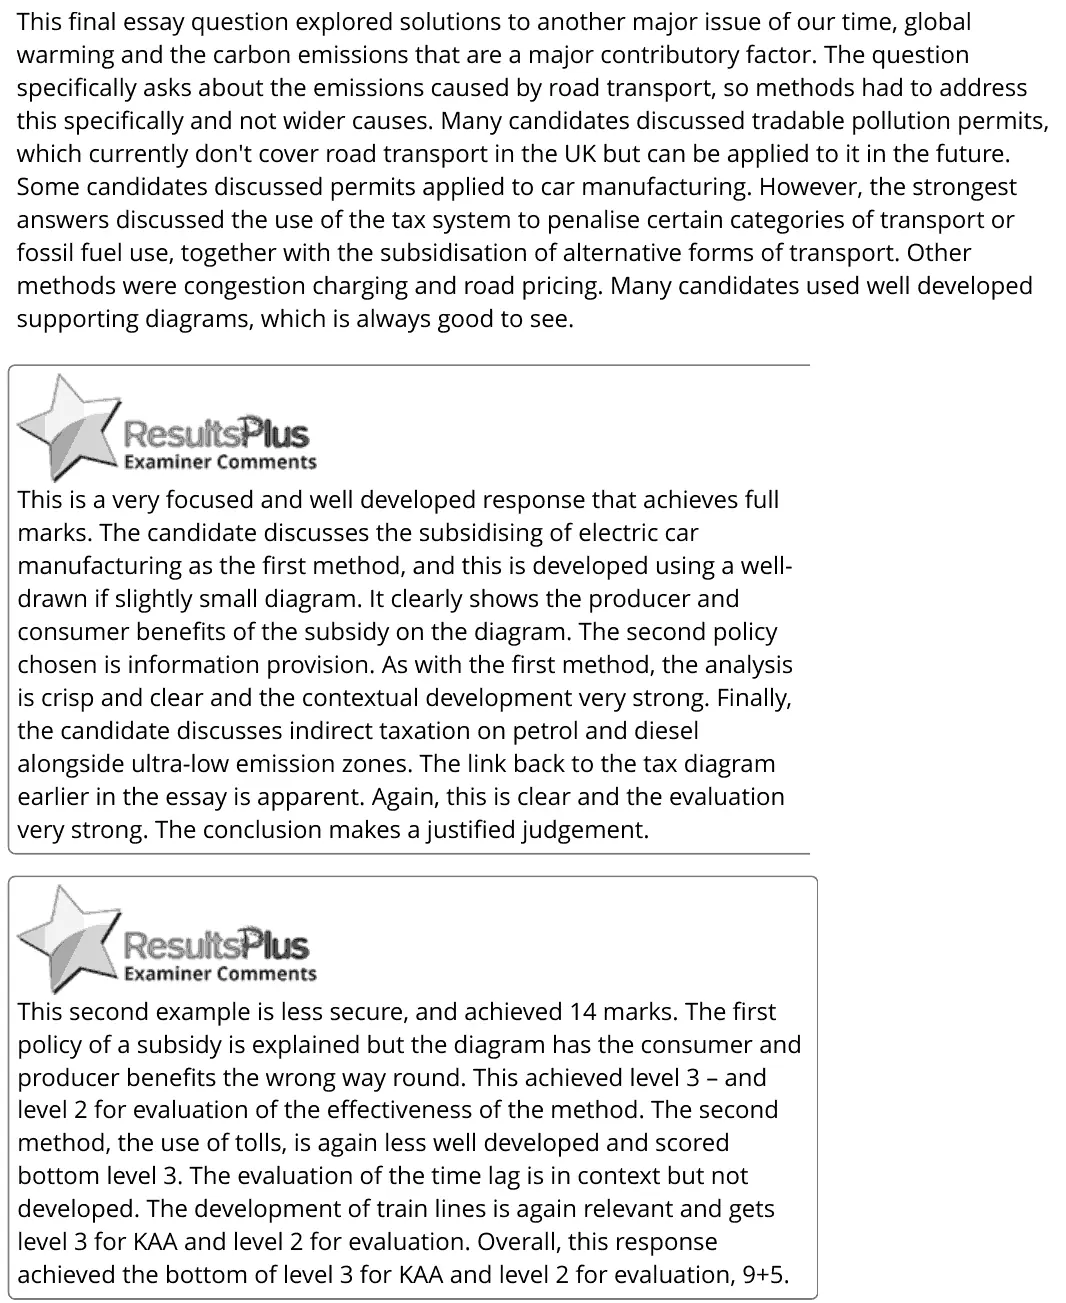
This final essay question explored solutions to another major issue of our time, global warming and the carbon emissions that are a major contributory factor. The question specifically asks about the emissions caused by road transport, so methods had to address this specifically and not wider causes. Many candidates discussed tradable pollution permits, which currently don't cover road transport in the UK but can be applied to it in the future. Some candidates discussed permits applied to car manufacturing. However, the strongest answers discussed the use of the tax system to penalise certain categories of transport or fossil fuel use, together with the subsidisation of alternative forms of transport. Other methods were congestion charging and road pricing. Many candidates used well developed supporting diagrams, which is always good to see. This is a very focused and well developed response that achieves full marks. The candidate discusses the subsidising of electric car manufacturing as the first method, and this is developed using a well- drawn if slightly small diagram. It clearly shows the producer and consumer benefits of the subsidy on the diagram. The second policy chosen is information provision. As with the first method, the analysis is crisp and clear and the contextual development very strong. Finally, the candidate discusses indirect taxation on petrol and diesel alongside ultra-low emission zones. The link back to the tax diagram earlier in the essay is apparent. Again, this is clear and the evaluation very strong. The conclusion makes a justified judgement. This second example is less secure, and achieved 14 marks. The first policy of a subsidy is explained but the diagram has the consumer and producer benefits the wrong way round. This achieved level 3 – and level 2 for evaluation of the effectiveness of the method. The second method, the use of tolls, is again less well developed and scored bottom level 3. The evaluation of the time lag is in context but not developed. The development of train lines is again relevant and gets level 3 for KAA and level 2 for evaluation. Overall, this response achieved the bottom of level 3 for KAA and level 2 for evaluation, 9+5.
Notes from the mark scheme and report
methods must target road transport: fuel or vehicle taxes, subsidies for public transport and electric vehicles, congestion charging, regulation, tradable permits (not yet covered for road transport)
negative externality diagrams
evaluate with PED, valuing the external cost and government failure
June 2022 · AS Paper 1 · Q1(b)3 marksAO1=1, AO2=1, AO3=1Short answer
Data and extracts for question 1
Mark scheme
Examiner's comment
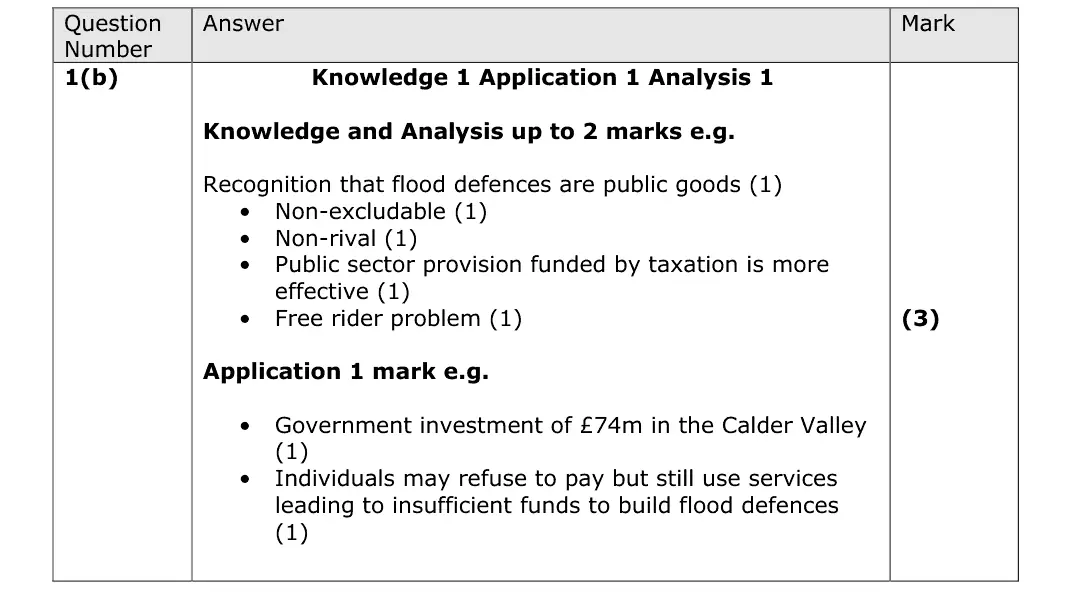
Candidates typically performed well on this question, with most able to explain why flood defences are provided by the public sector. Many candidates were able to put explanations in the context of the Calder Valley, which was necessary to gain the application mark.
Notes from the mark scheme and report
flood defences are non-excludable and non-rival so the free rider problem means the market would not provide them
state provision funded by taxation
apply the £74m Calder Valley scheme for the application mark
June 2022 · AS Paper 1 · Q2(a)1 markAO1=1Definition
Data and extracts for question 2
Mark scheme
Examiner's comment
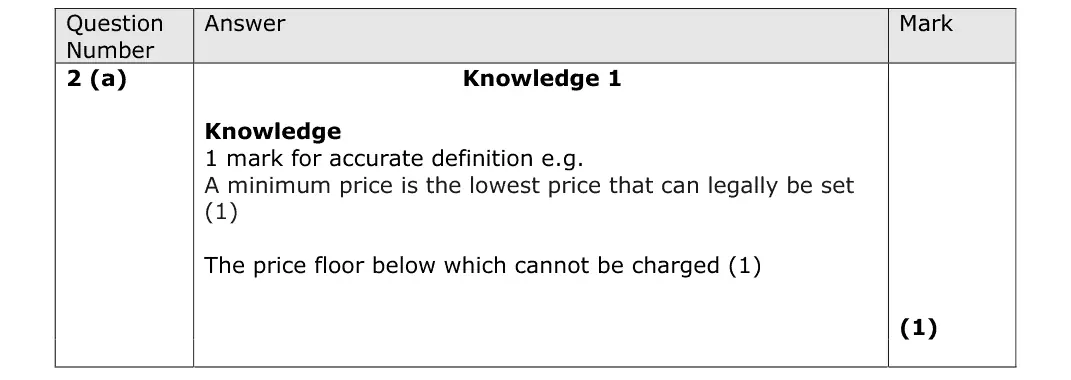
The majority of candidates were able to accurately define a minimum price, though some did inevitably confuse it with a maximum price.
Notes from the mark scheme and report
a legal price floor set above equilibrium, below which the price cannot fall
report: some confused it with a maximum price
June 2022 · AS Paper 1 · Q2(b)1 markMultiple choice
Data and extracts for question 2
Answer
B
Mark scheme
Notes from the mark scheme and report
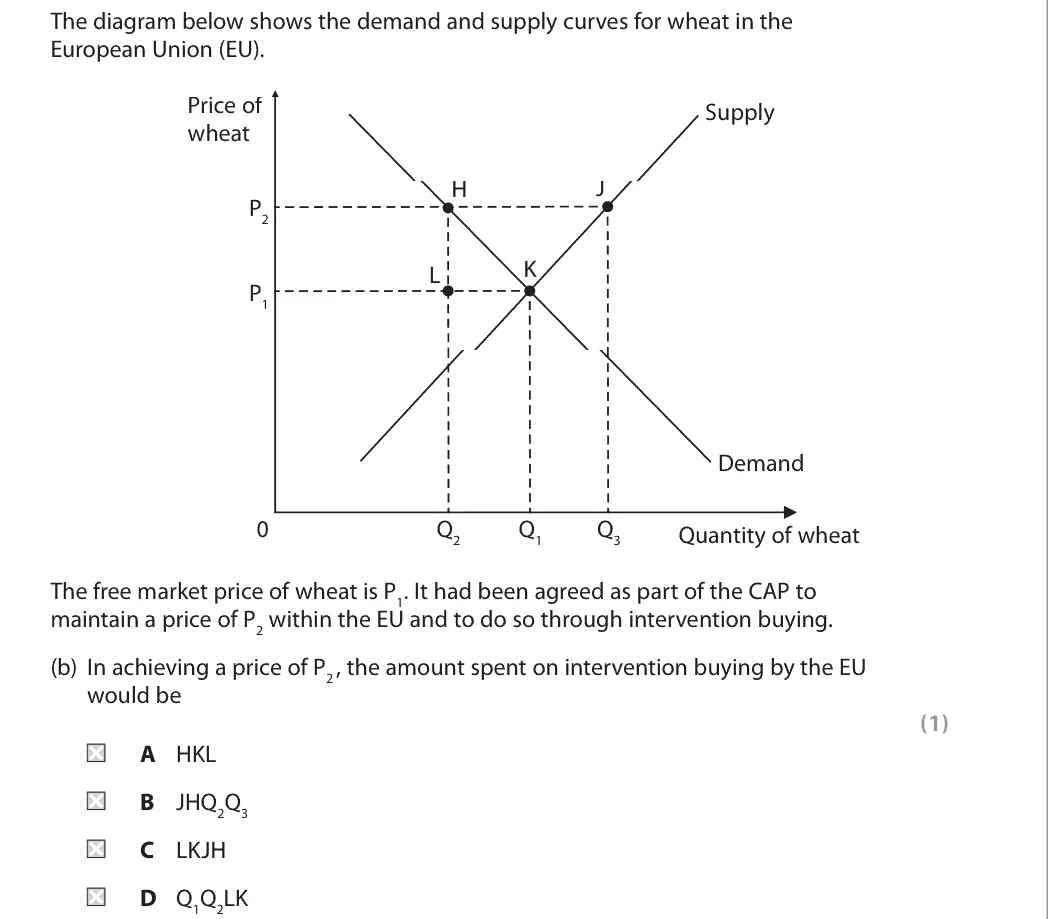
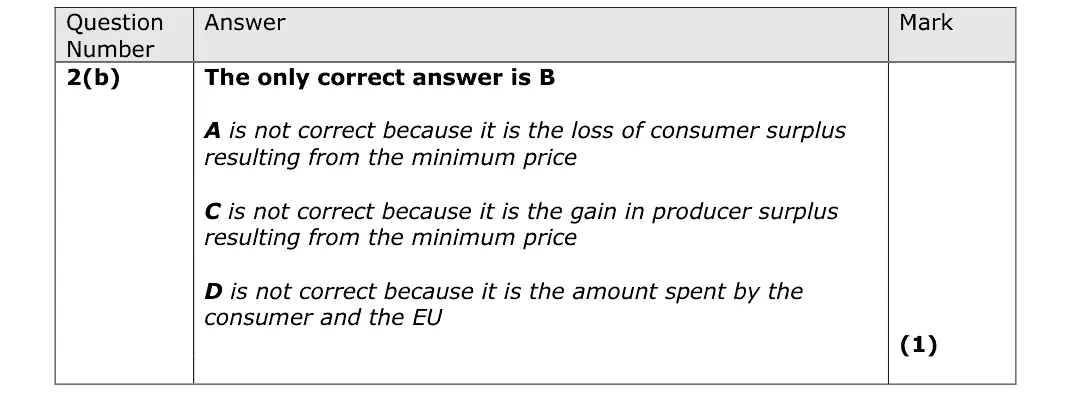
intervention buying spend = guaranteed price P2 x the surplus bought (Q2 to Q3), area JHQ2Q3 (B)
HKL is lost consumer surplus, LKJH the producer surplus gain, Q1Q2LK spending by consumers
Quantitative skills: QS 4 (construct and interpret a range of standard graphical forms)
June 2022 · Paper 1 · Q3(b)1 markAO3=1Multiple choice
Data and extracts for question 3
Answer
C
Mark scheme
Notes from the mark scheme and report
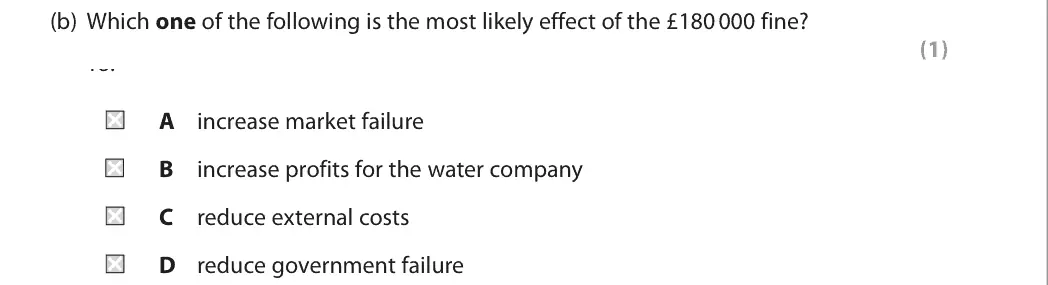
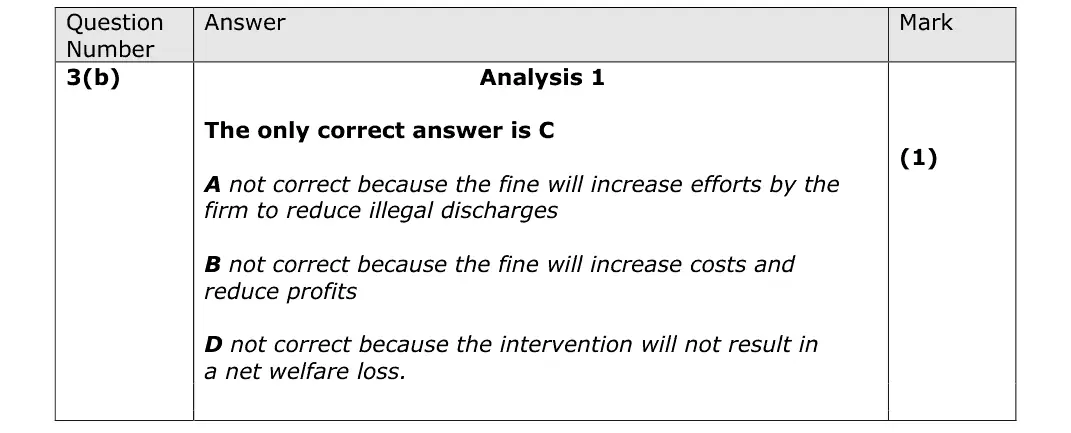
the fine raises the polluter's costs so it cuts illegal discharges, reducing external costs (C)
A market failure falls
B profits fall
D it does not cause a net welfare loss
June 2022 · AS Paper 1 · Q6(a)5 marksAO1=1, AO2=2, AO3=2Diagram
Data and extracts for question 6
Mark scheme
Examiner's comment
This question required candidates to consider the impact of the new Total Allowable Catches (TACs) on the market for fish. Most candidates were able to clearly draw a supply and demand diagram and used the extract fully to support their answers. Almost half of the candidates scored full marks on this question.
Notes from the mark scheme and report
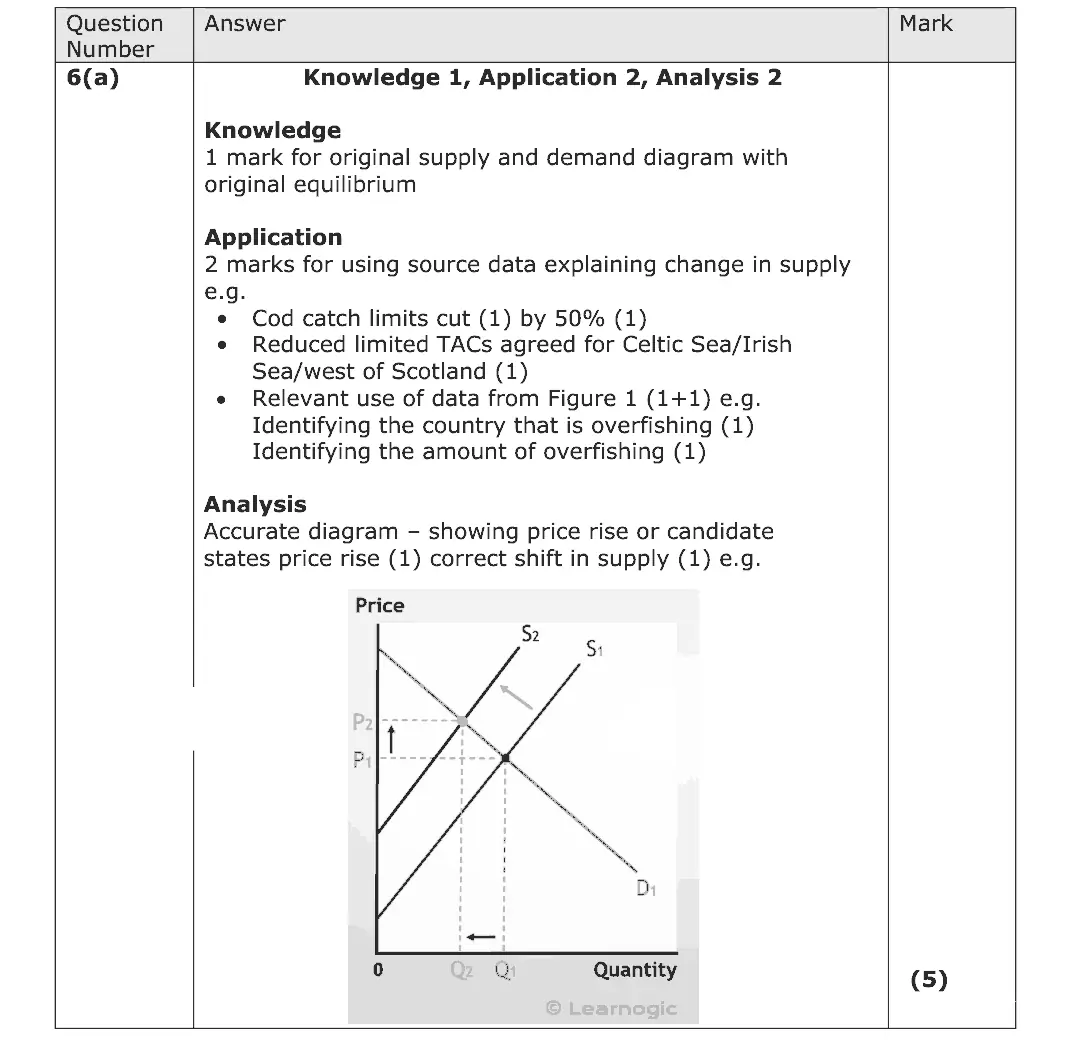
TACs cut the cod catch by 50%, so supply shifts left and price rises
diagram with original and new equilibrium
apply the 50% cut or Figure 1 data
almost half scored full marks
Quantitative skills: QS 4 (construct and interpret a range of standard graphical forms)
June 2022 · AS Paper 1 · Q6(g)20 marksAO1=4, AO2=4, AO3=6, AO4=620-mark essayEither/or
Data and extracts for question 6
Mark scheme, including the levels grid and indicative content
Examiner's comment
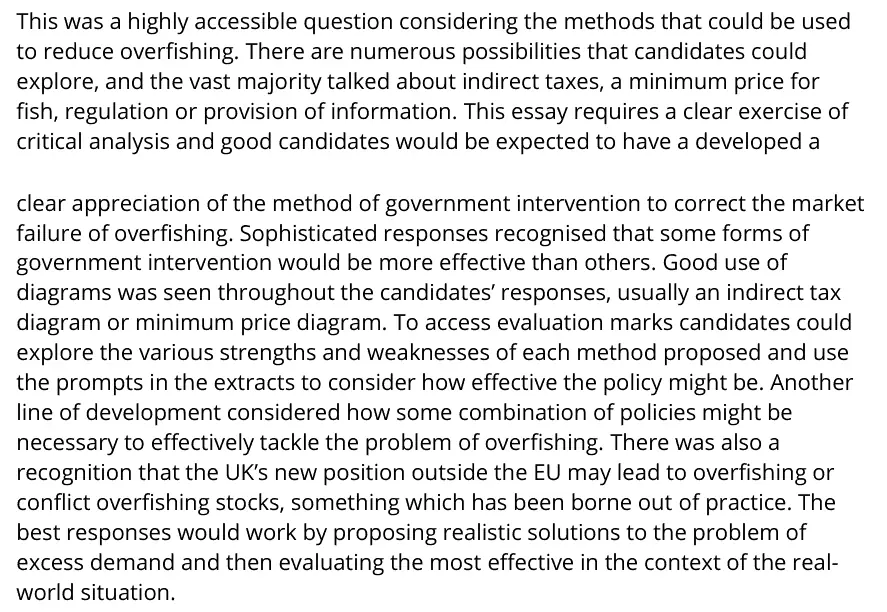
This was a highly accessible question considering the methods that could be used to reduce overfishing. There are numerous possibilities that candidates could explore, and the vast majority talked about indirect taxes, a minimum price for fish, regulation or provision of information. This essay requires a clear exercise of critical analysis and good candidates would be expected to have a developed a clear appreciation of the method of government intervention to correct the market failure of overfishing. Sophisticated responses recognised that some forms of government intervention would be more effective than others. Good use of diagrams was seen throughout the candidates’ responses, usually an indirect tax diagram or minimum price diagram. To access evaluation marks candidates could explore the various strengths and weaknesses of each method proposed and use the prompts in the extracts to consider how effective the policy might be. Another line of development considered how some combination of policies might be necessary to effectively tackle the problem of overfishing. There was also a recognition that the UK’s new position outside the EU may lead to overfishing or conflict overfishing stocks, something which has been borne out of practice. The best responses would work by proposing realistic solutions to the problem of excess demand and then evaluating the most effective in the context of the real- world situation.
Notes from the mark scheme and report
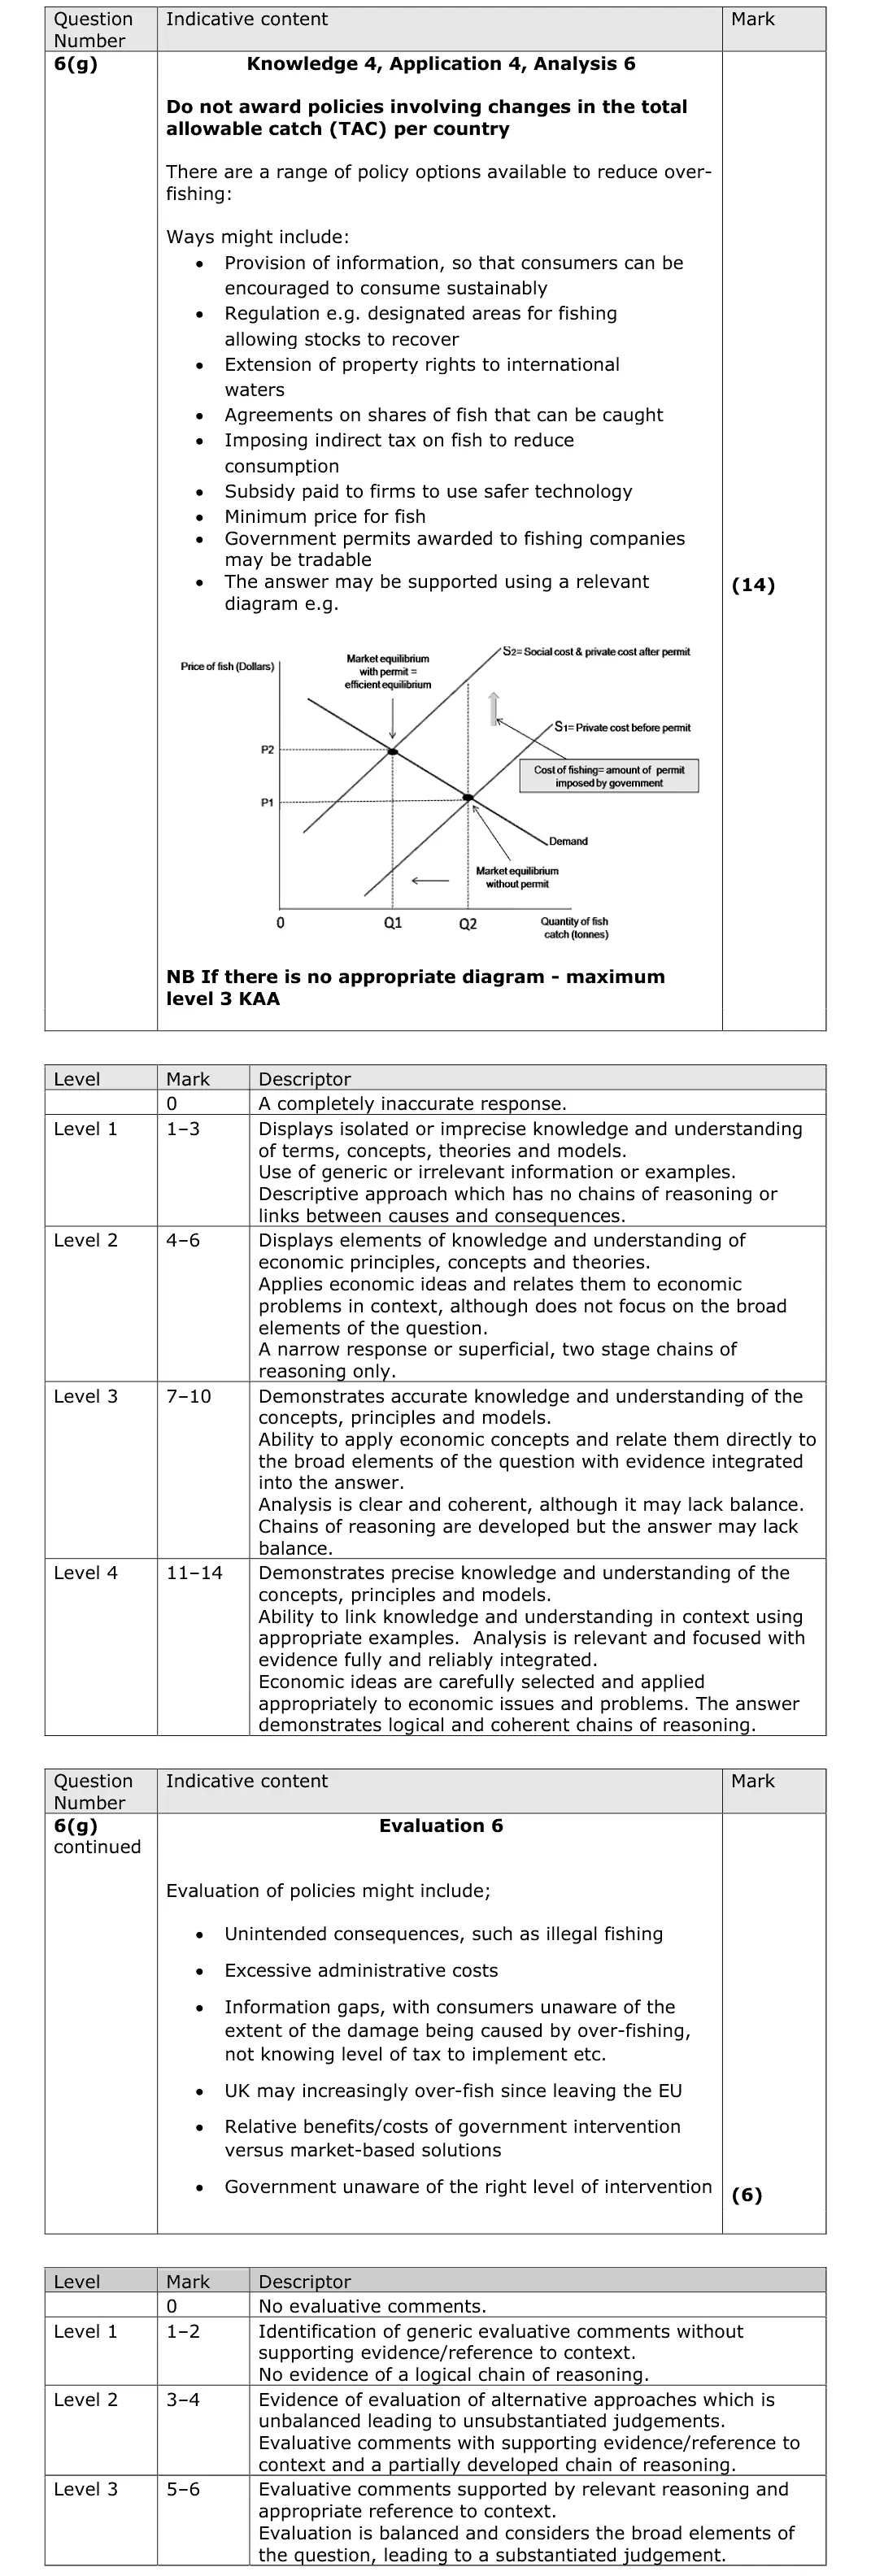
policies other than TACs: taxes on catches, minimum price for fish, regulation (no-fishing zones, net sizes), information, property rights
diagrams
evaluate effectiveness, enforcement and government failure
no credit for changing TACs
Quantitative skills: QS 4 (construct and interpret a range of standard graphical forms)
November 2021 · Paper 1 · Q6(d)12 marksAO1=2, AO2=2, AO3=4, AO4=412-mark response
Data and extracts for question 6
Mark scheme, including the levels grid and indicative content
Examiner's comment
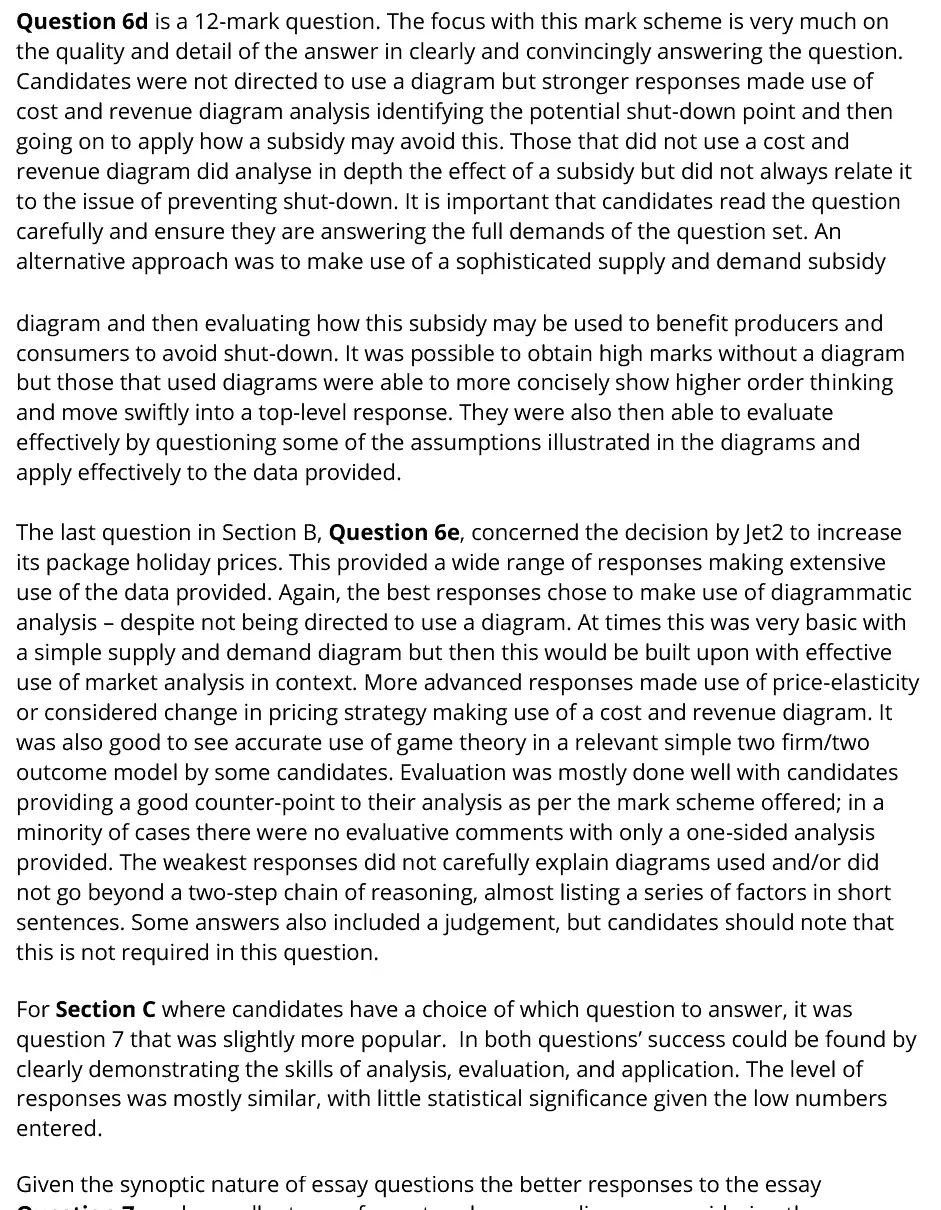
Question 6d is a 12-mark question. The focus with this mark scheme is very much on the quality and detail of the answer in clearly and convincingly answering the question. Candidates were not directed to use a diagram but stronger responses made use of cost and revenue diagram analysis identifying the potential shut-down point and then going on to apply how a subsidy may avoid this. Those that did not use a cost and revenue diagram did analyse in depth the effect of a subsidy but did not always relate it to the issue of preventing shut-down. It is important that candidates read the question carefully and ensure they are answering the full demands of the question set. An alternative approach was to make use of a sophisticated supply and demand subsidy diagram and then evaluating how this subsidy may be used to benefit producers and consumers to avoid shut-down. It was possible to obtain high marks without a diagram but those that used diagrams were able to more concisely show higher order thinking and move swiftly into a top-level response. They were also then able to evaluate effectively by questioning some of the assumptions illustrated in the diagrams and apply effectively to the data provided. The last question in Section B, Question 6e, concerned the decision by Jet2 to increase its package holiday prices. This provided a wide range of responses making extensive use of the data provided. Again, the best responses chose to make use of diagrammatic analysis – despite not being directed to use a diagram. At times this was very basic with a simple supply and demand diagram but then this would be built upon with effective use of market analysis in context. More advanced responses made use of price-elasticity or considered change in pricing strategy making use of a cost and revenue diagram. It was also good to see accurate use of game theory in a relevant simple two firm/two outcome model by some candidates. Evaluation was mostly done well with candidates providing a good counter-point to their analysis as per the mark scheme offered; in a minority of cases there were no evaluative comments with only a one-sided analysis provided. The weakest responses did not carefully explain diagrams used and/or did not go beyond a two-step chain of reasoning, almost listing a series of factors in short sentences. Some answers also included a judgement, but candidates should note that this is not required in this question. For Section C where candidates have a choice of which question to answer, it was question 7 that was slightly more popular. In both questions’ success could be found by clearly demonstrating the skills of analysis, evaluation, and application. The level of responses was mostly similar, with little statistical significance given the low numbers entered. Given the synoptic nature of essay questions the better responses to the essay
Notes from the mark scheme and report
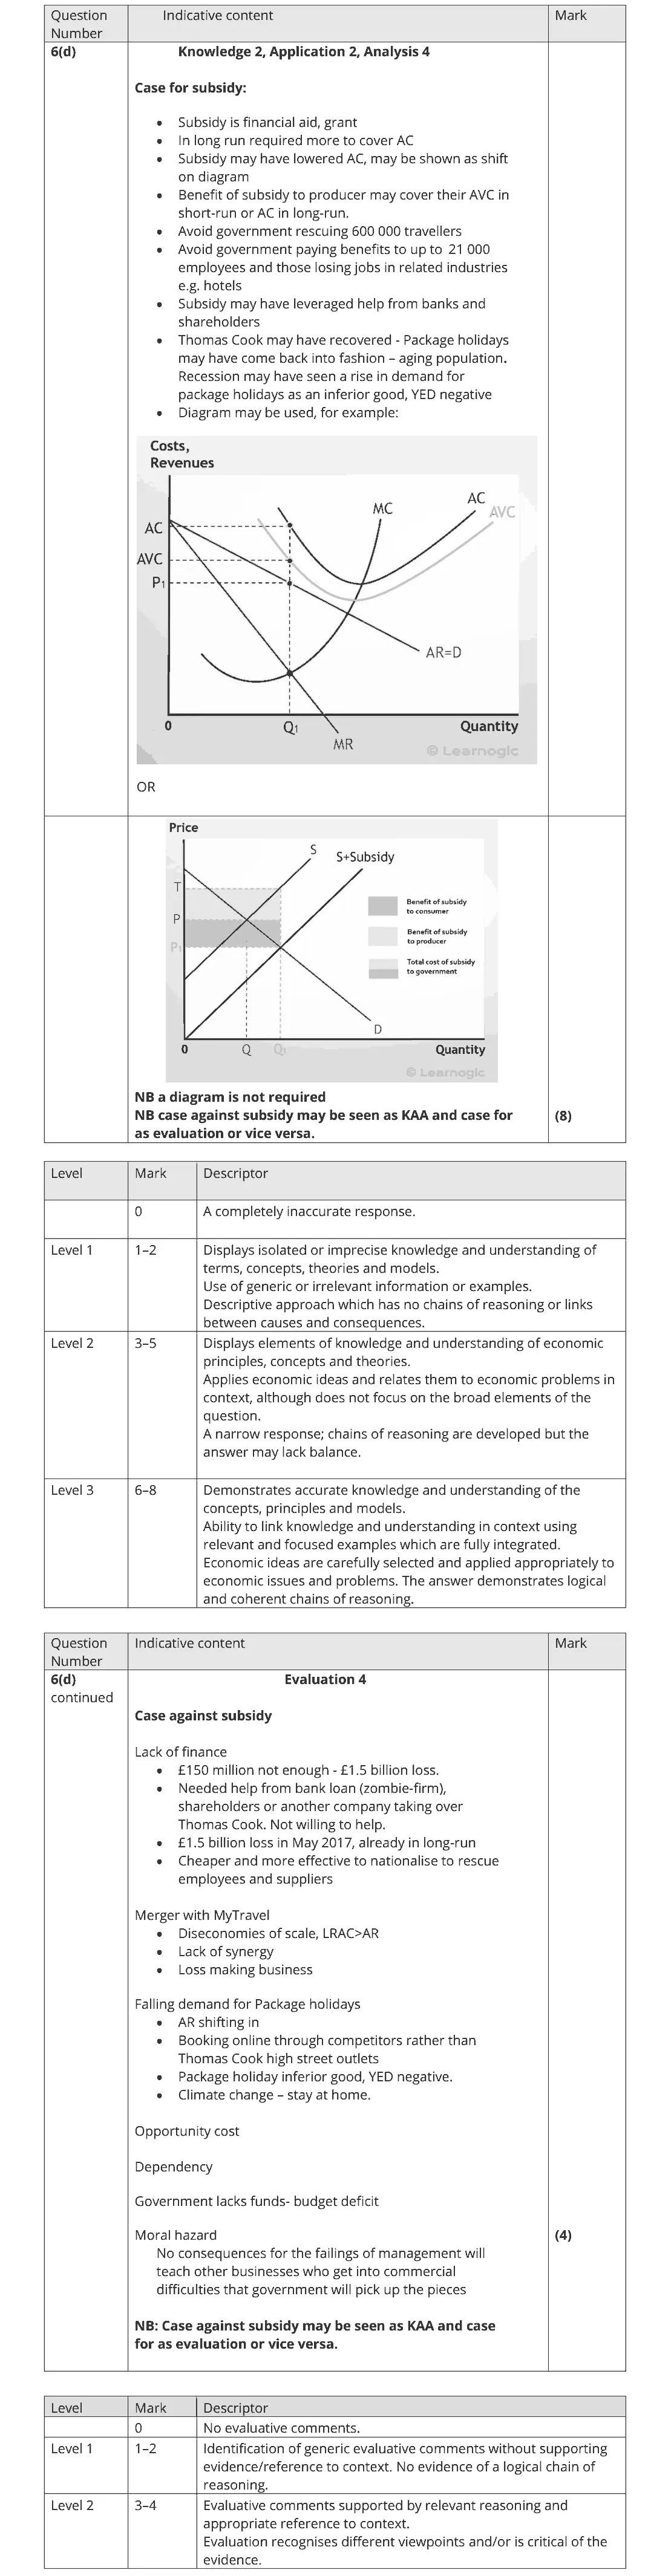
link the subsidy to the shut-down point: short run the firm must cover AVC, long run AC
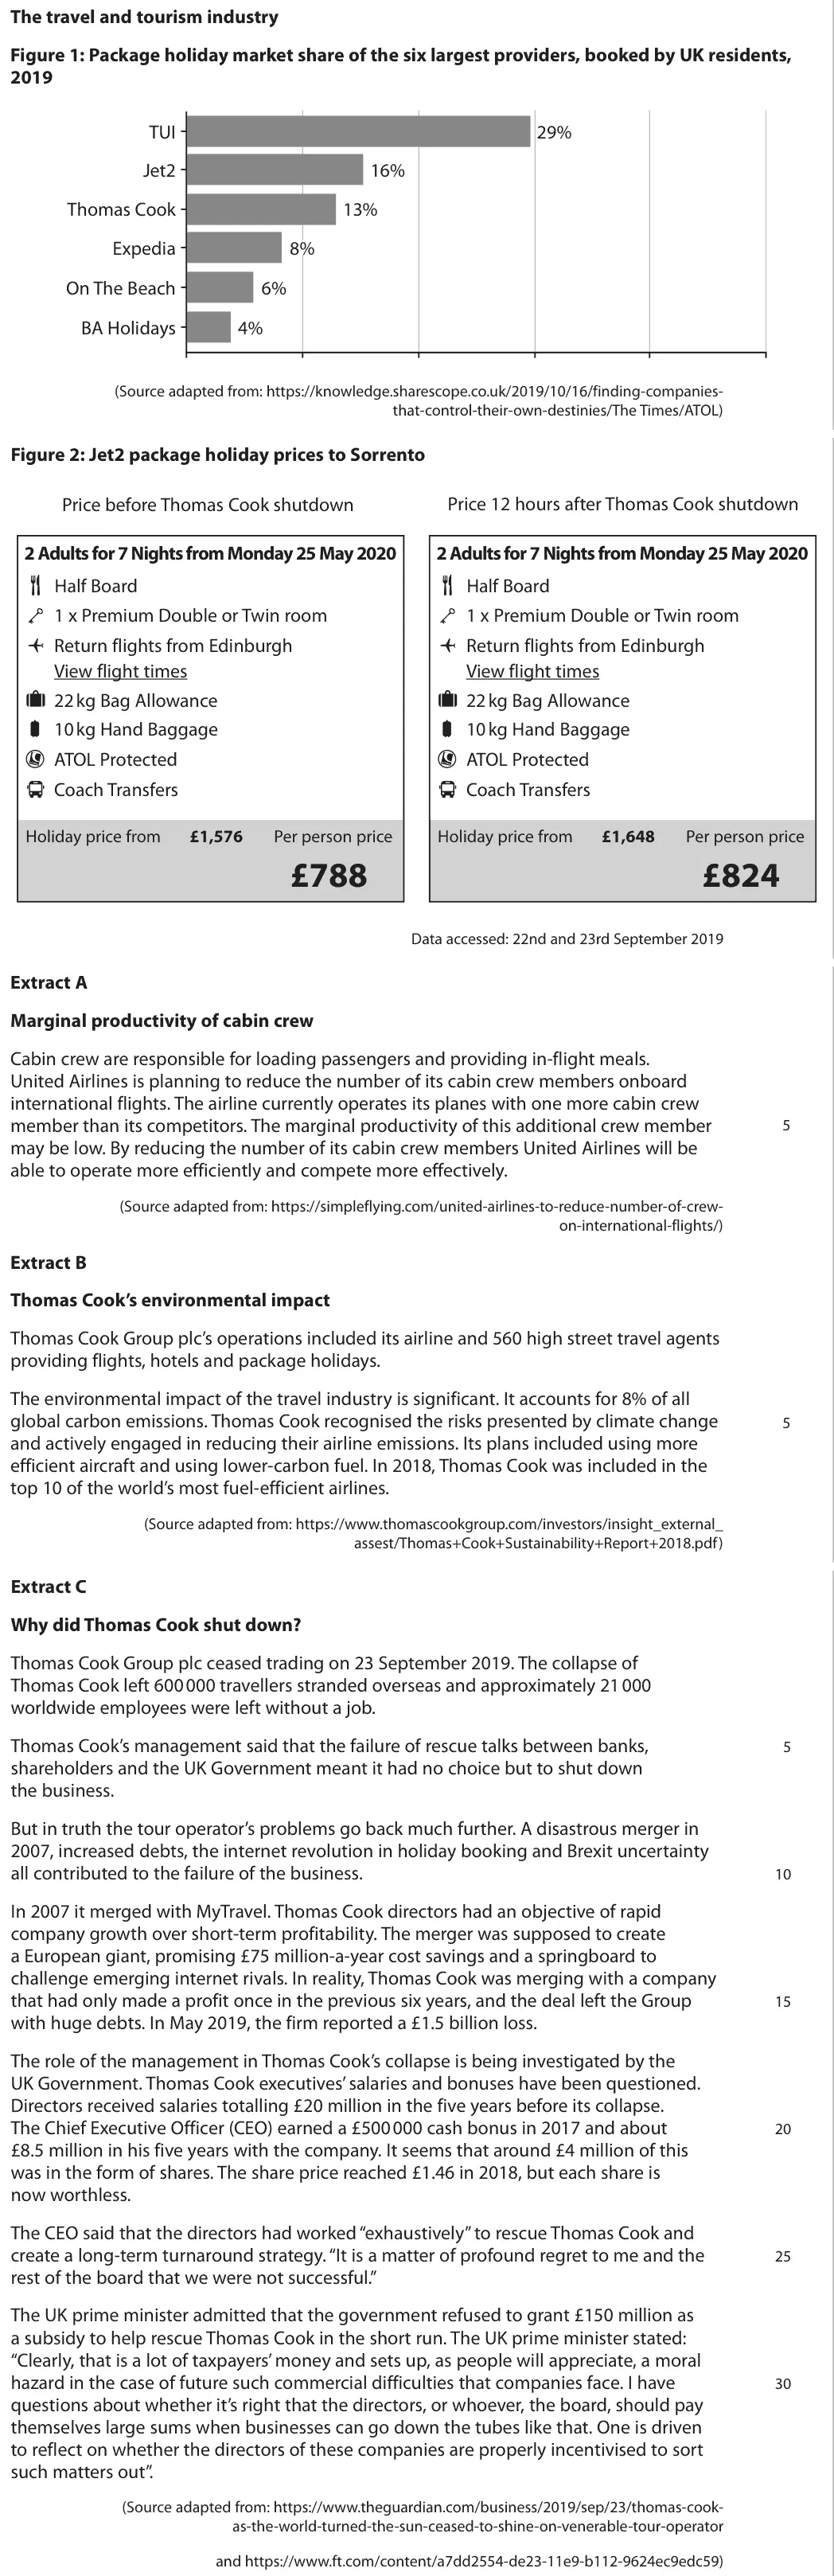
£150m could save jobs and 600 000 stranded travellers
evaluate moral hazard (prime minister's quote), opportunity cost and government failure
report: answers that ignored shut-down did not answer the question
October 2020 · Paper 1 · Q3(a)4 marksAO1=2, AO2=1, AO3=1Short answer
Data and extracts for question 3
Mark scheme
Examiner's comment
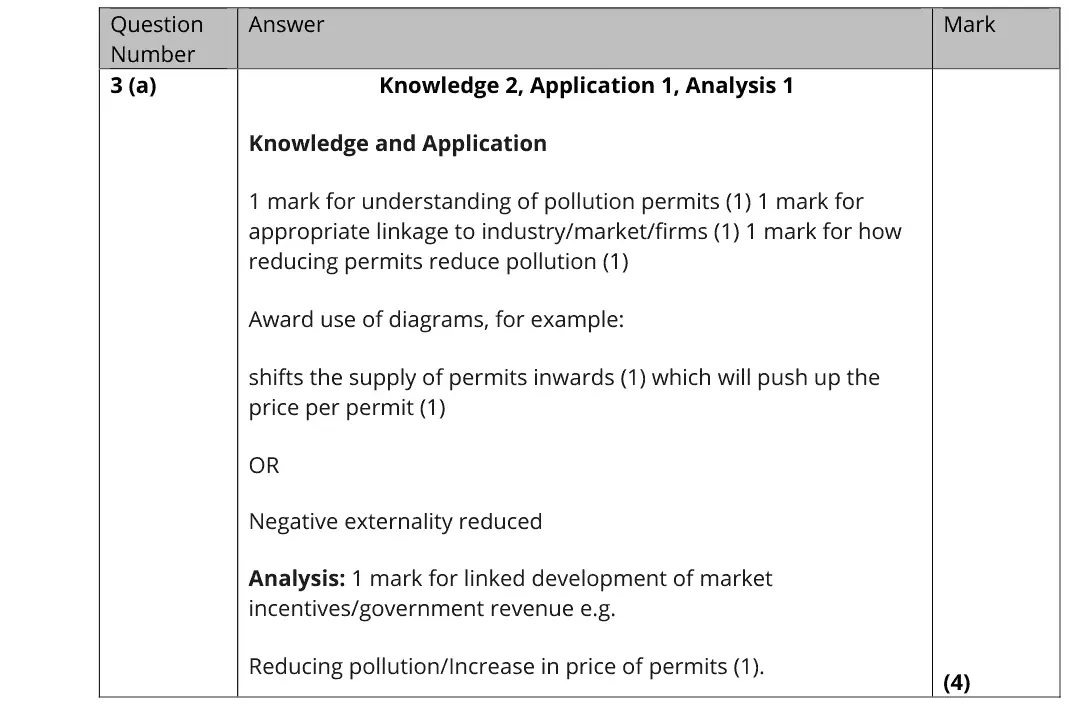
Most responses secured high marks with many explaining and illustrating a secure knowledge or tradable pollution permits using a supply and demand diagram. This was undertaken in a concise manner linking the rise in the price of permits to a fall in pollution levels, with students thus going beyond the four marks for this question. This answer achieves zero marks. Several effects are provided without a valid explanation. This answer achieves 4/4 marks. There is an awareness of how limiting the supply of permits will increase their price in the tradable pollution permits market. This is then further developed and applied in the context of reducing pollution in the long run.
Notes from the mark scheme and report
fewer permits shift supply of permits left, raising the permit price, so firms pollute less or invest in cleaner technology
one effect developed in context
listing several effects without explanation scored 0
Quantitative skills: QS 4 (construct and interpret a range of standard graphical forms)
October 2020 · AS Paper 1 · Q4(b)3 marksAO1=1, AO2=1, AO3=1Short answer
Data and extracts for question 4
Mark scheme
Examiner's comment
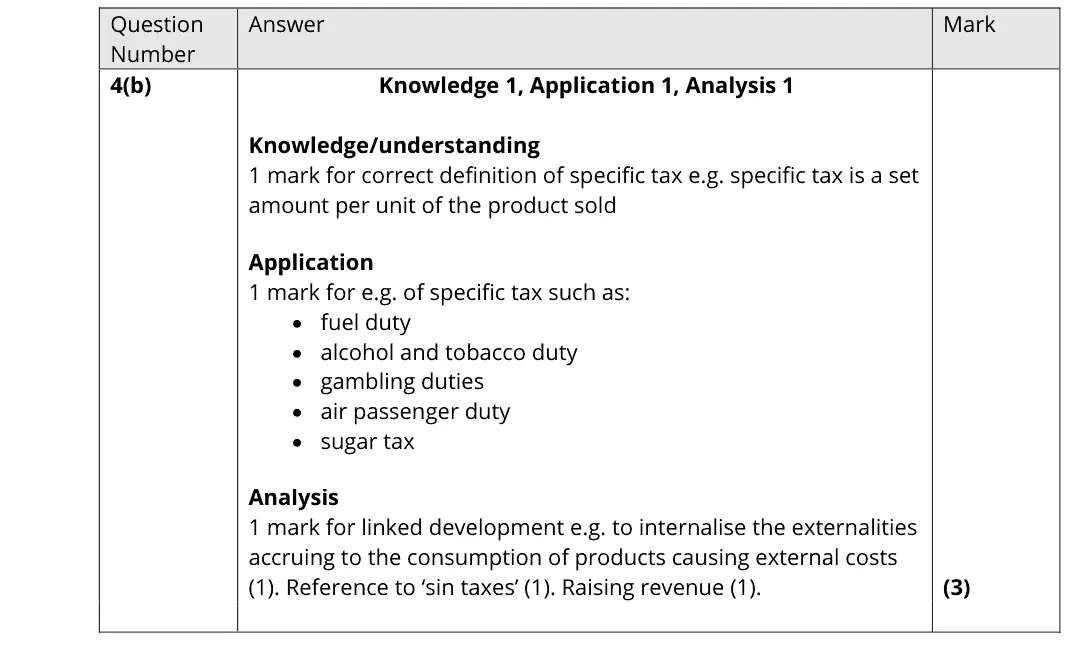
It was important that candidates were able to identify why specific taxes as per unit rather than ad valorem, are used in a market. Often products have both VAT and a specific tax levied on them, and it is important to explore why this is the case. As usual, a relevant example is crucial for application.
Notes from the mark scheme and report
define a specific tax as a fixed amount per unit (not ad valorem)
give an example (fuel, alcohol, tobacco, air passenger duty, sugar tax)
develop it: internalise external costs, sin taxes, raise revenue
October 2020 · AS Paper 1 · Q6(d)4 marksAO1=2, AO2=2Calculation
Data and extracts for question 6
Mark scheme
Examiner's comment
This question was a four-mark calculation based on the manipulation of student loans data. A large majority of candidates were able to complete this successfully, which is a pleasing indicator of the improving numeracy of the cohort each year. There were still errors, nonetheless, where percentage changes were clearly confused.
Notes from the mark scheme and report
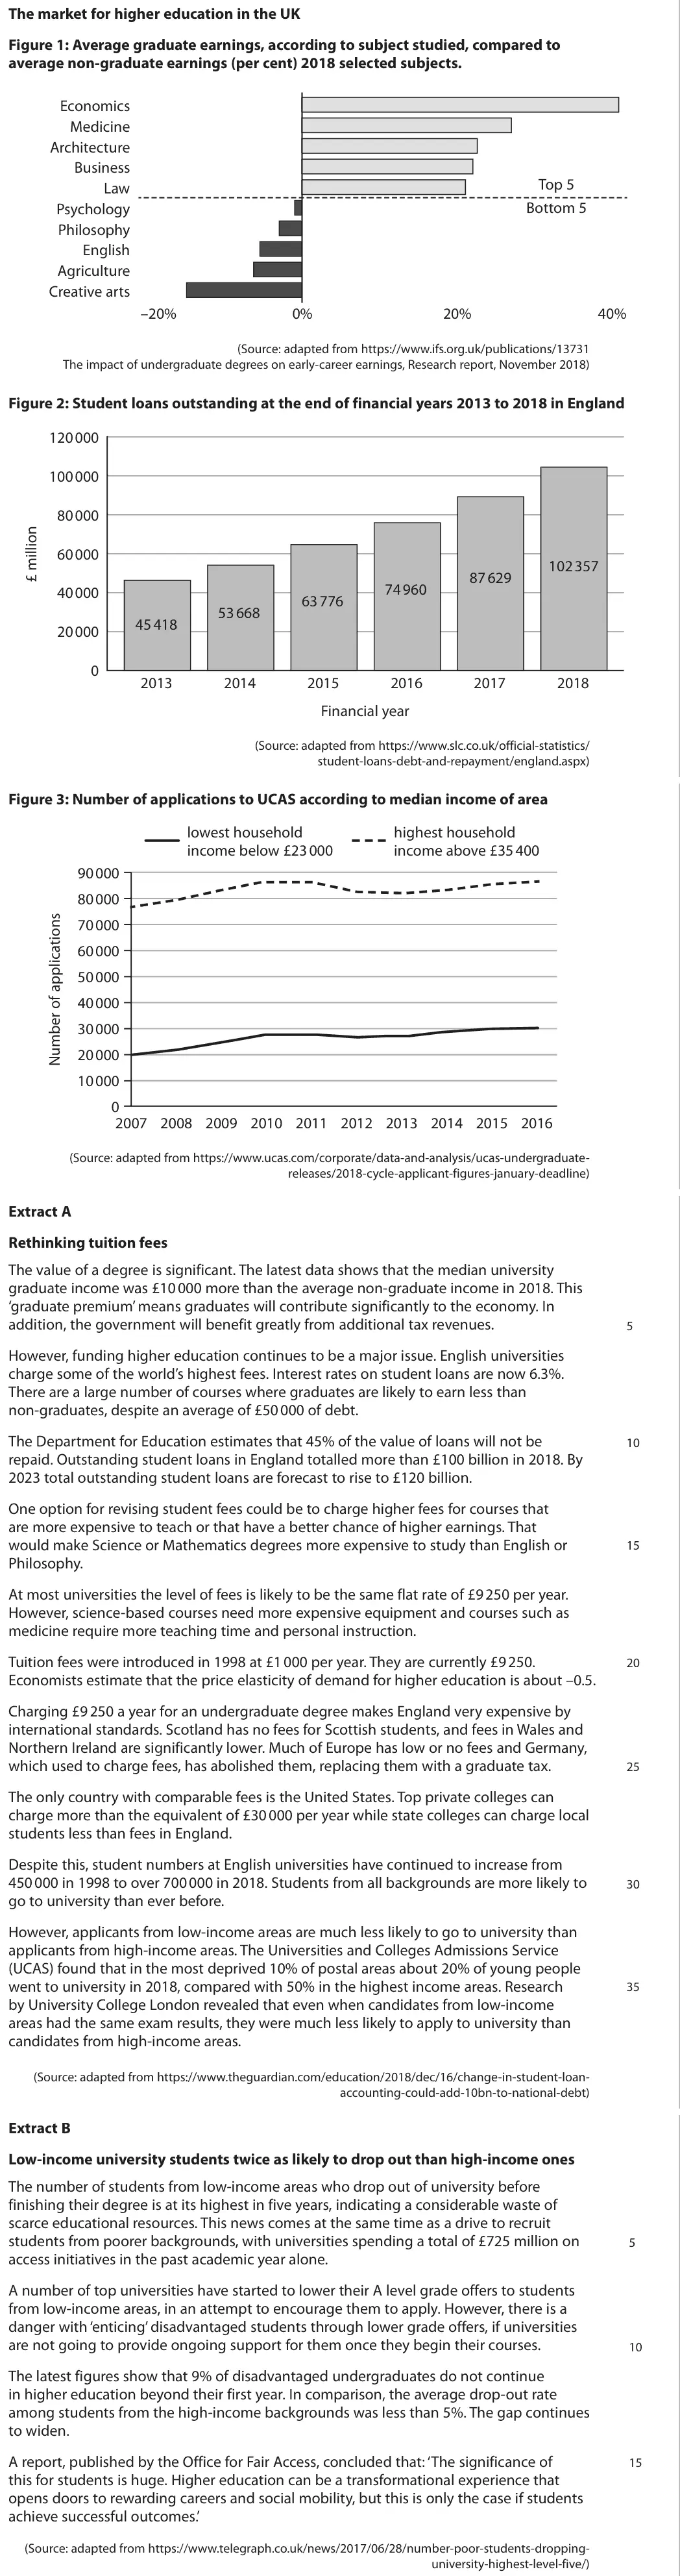
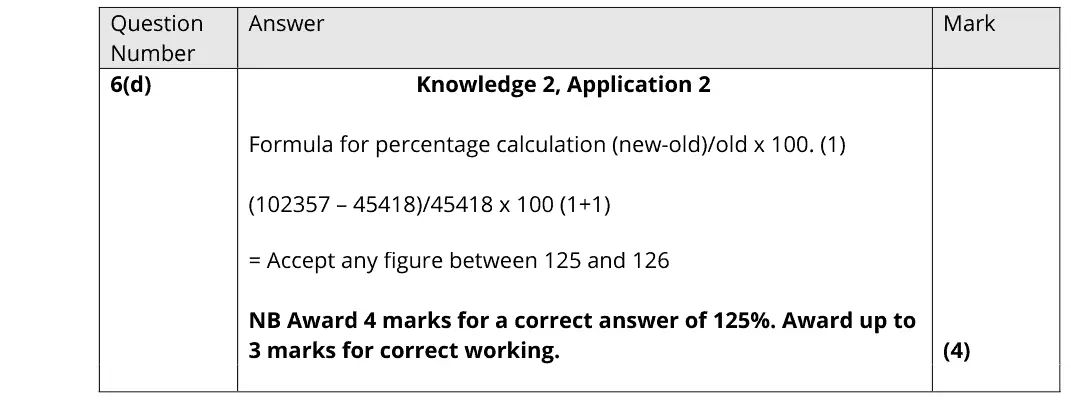
(102 357 - 45 418) / 45 418 x 100 = 125% (accept 125 to 126)
up to 3 marks for correct working
some confused the percentage change formula
Quantitative skills: QS 2 (calculate, use and understand percentages, percentage changes and percentage point changes); QS 9 (interpret, apply and analyse information in written, graphical tabular and numerical forms)
October 2020 · AS Paper 1 · Q6(g)20 marksAO1=4, AO2=4, AO3=6, AO4=620-mark essayEither/or
Data and extracts for question 6
Mark scheme, including the levels grid and indicative content
Examiner's comment
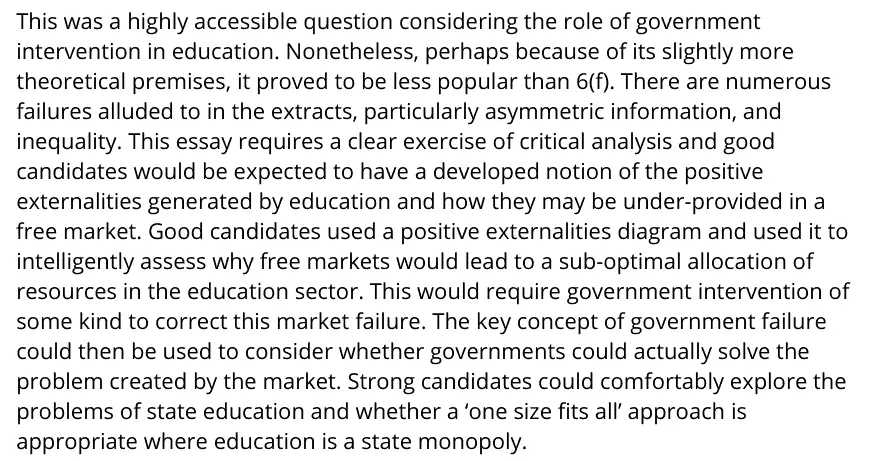
This was a highly accessible question considering the role of government intervention in education. Nonetheless, perhaps because of its slightly more theoretical premises, it proved to be less popular than 6(f). There are numerous failures alluded to in the extracts, particularly asymmetric information, and inequality. This essay requires a clear exercise of critical analysis and good candidates would be expected to have a developed notion of the positive externalities generated by education and how they may be under-provided in a free market. Good candidates used a positive externalities diagram and used it to intelligently assess why free markets would lead to a sub-optimal allocation of resources in the education sector. This would require government intervention of some kind to correct this market failure. The key concept of government failure could then be used to consider whether governments could actually solve the problem created by the market. Strong candidates could comfortably explore the problems of state education and whether a ‘one size fits all’ approach is appropriate where education is a state monopoly.
Notes from the mark scheme and report
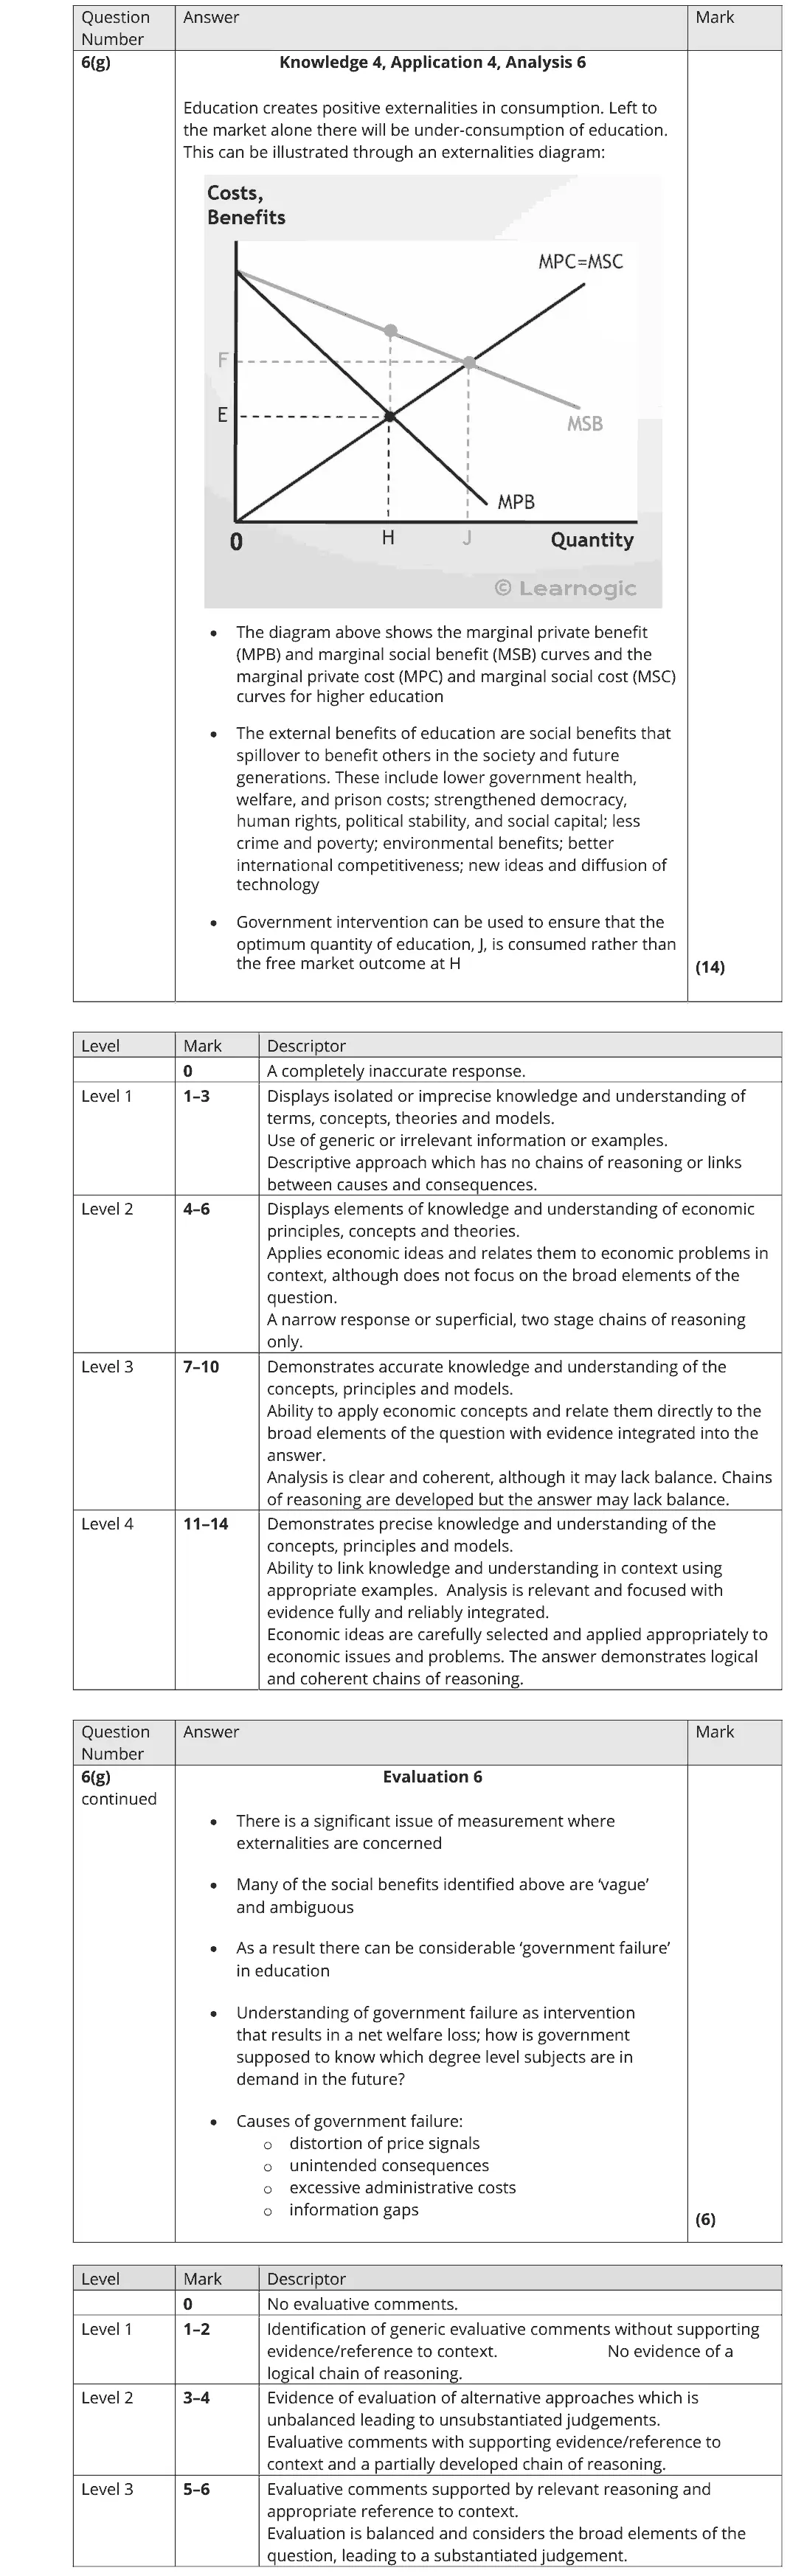
positive externalities diagram (MSB above MPB, under-consumption at H rather than optimum J)
state provision, subsidies, information
evaluate with difficulty of valuing external benefits and government failure (information gaps, unintended consequences, one size fits all)
October 2020 · Paper 3 · Q1(c)12 marksAO1=2, AO2=2, AO3=4, AO4=412-mark response
Data and extracts for question 1
Mark scheme, including the levels grid and indicative content
Examiner's comment
Level 3 diagram – although it does not show social optimum it is implicit Correct use of externalities description Application to the UK is strong L2e cannot pass on the tax Ban – well applied, unintended consequences – well applied but not as good as point 1 and only Level 2 on black bags – good point but needed some development, Level 3 Level 1 – just identifies increases tax. Very odd diagram. 1 + 1e for sense that it perverse effects of increasing output.
Notes from the mark scheme and report
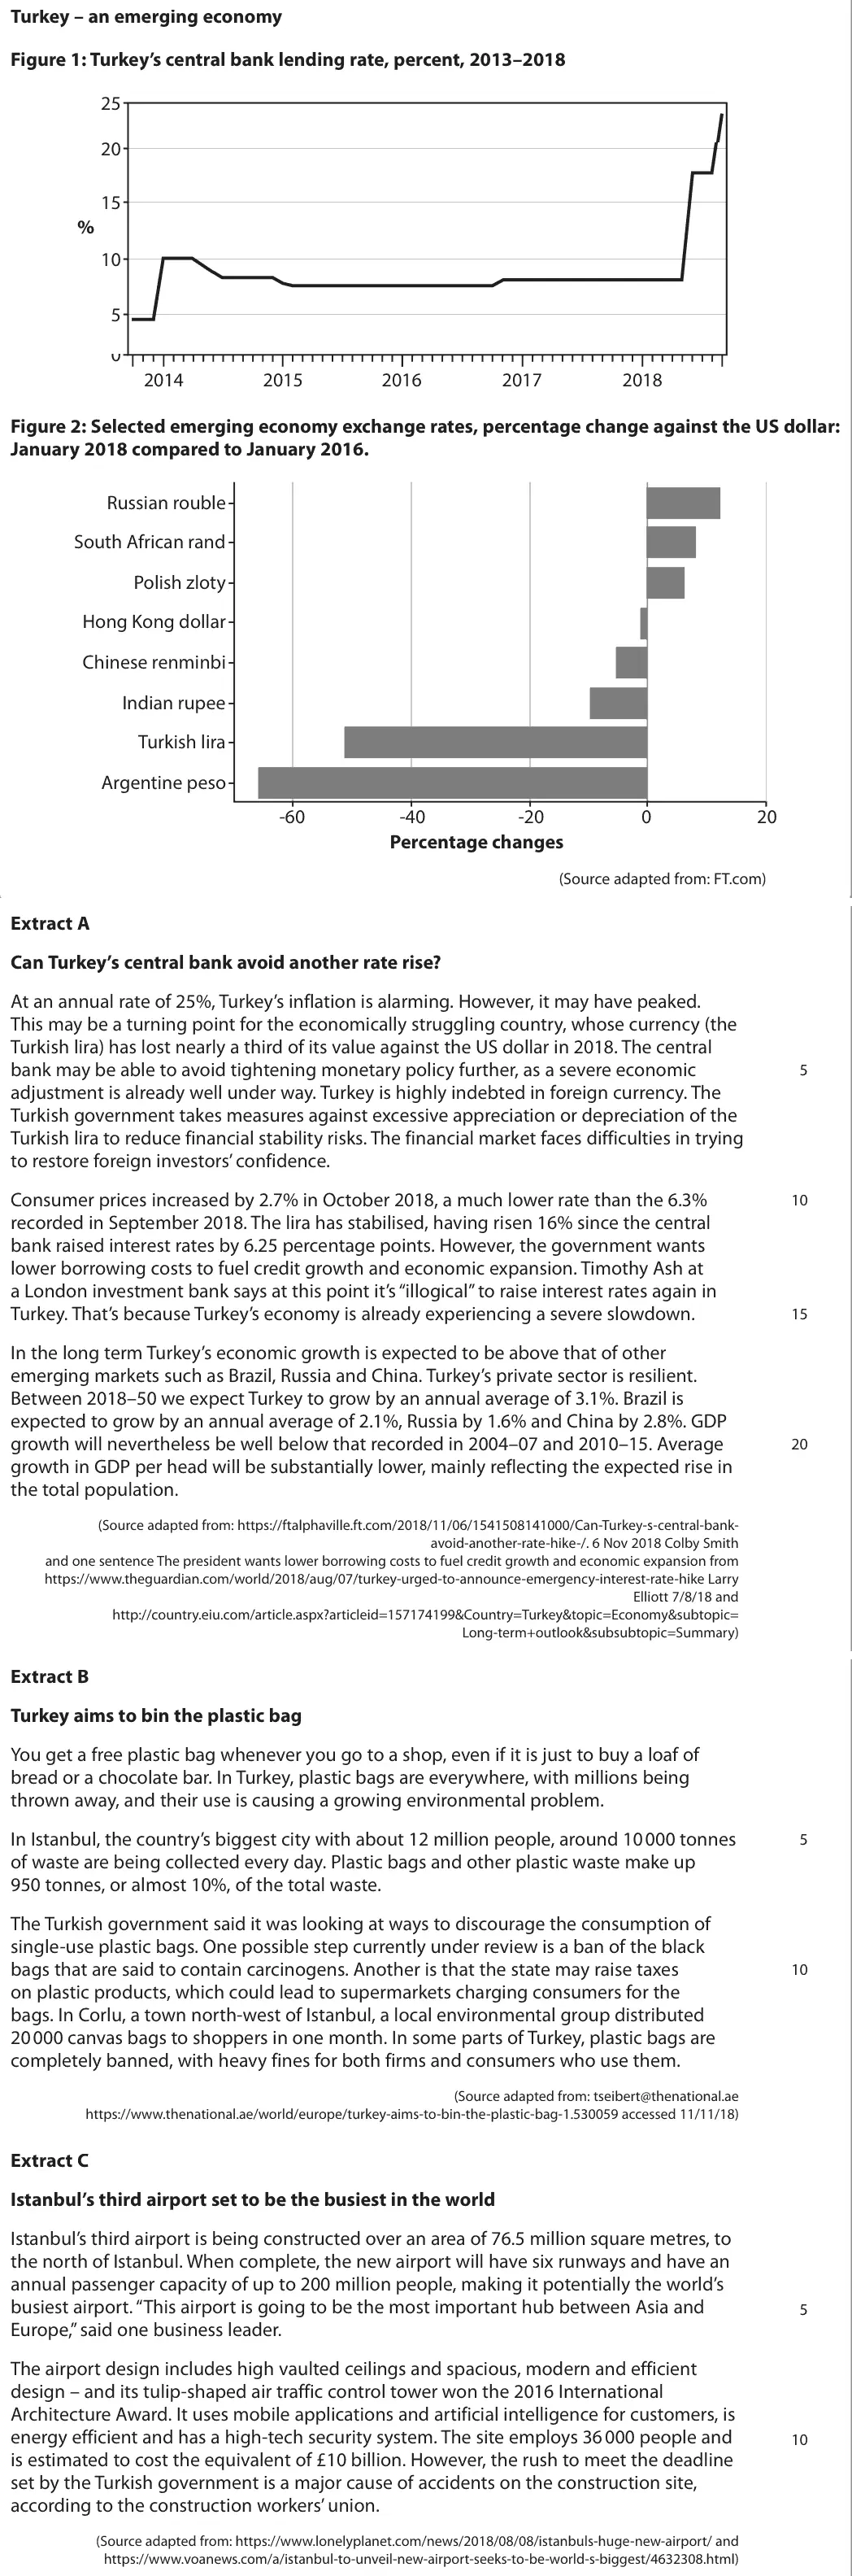
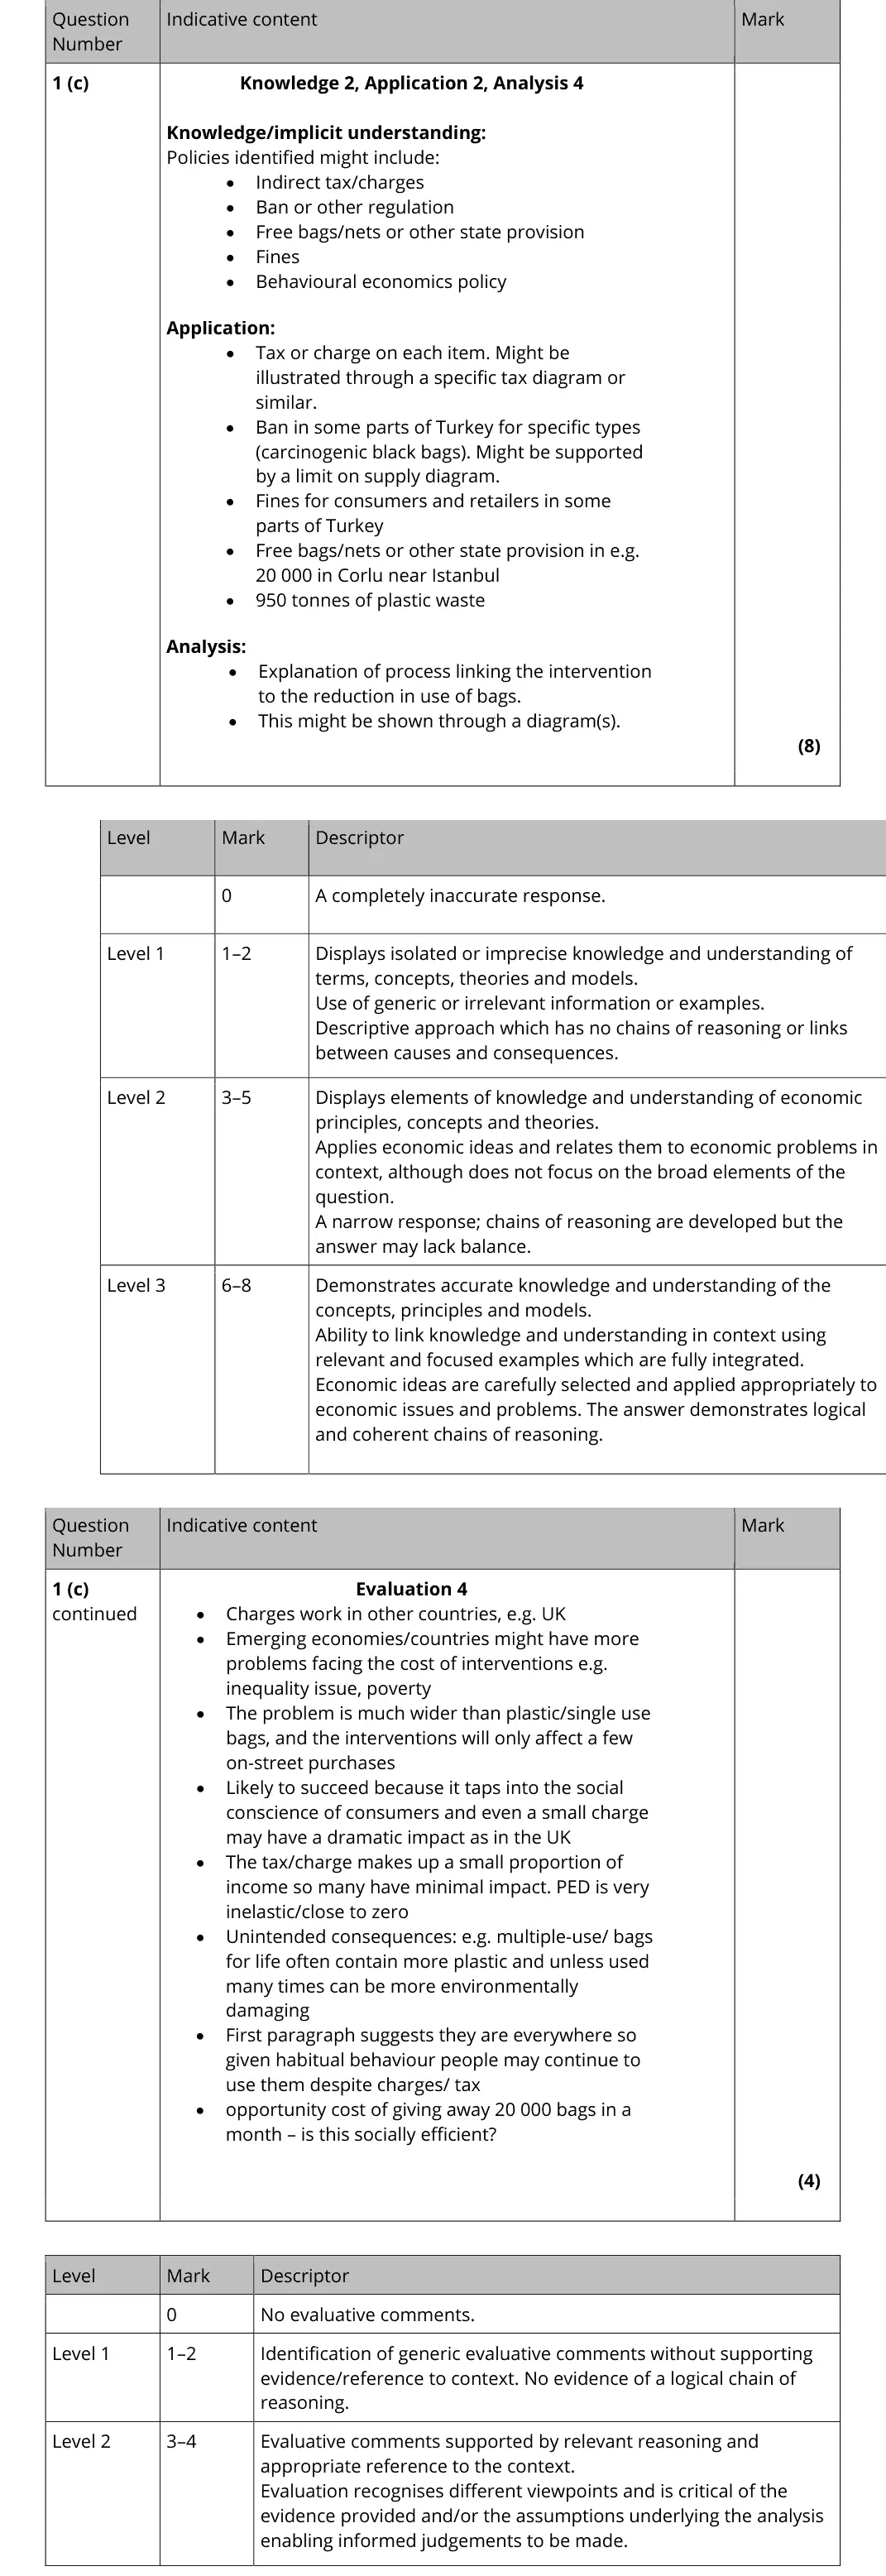
compare policies in Extract B: tax/charge (specific tax diagram), ban on black bags, fines, free canvas bags (20 000 in Corlu)
explain the process that cuts bag use
evaluate with inelastic demand, retailers not passing on the charge, unintended consequences of bans
June 2019 · AS Paper 1 · Q6(d)4 marksAO1=2, AO2=2Calculation
Data and extracts for question 6
Mark scheme
Examiner's comment
This question was a four-mark calculation based on the idea of charging patients when they visit a GP. A large majority of candidates were able to complete this successfully, which is a pleasing indicator of the improving numeracy of the cohort each year.
Notes from the mark scheme and report
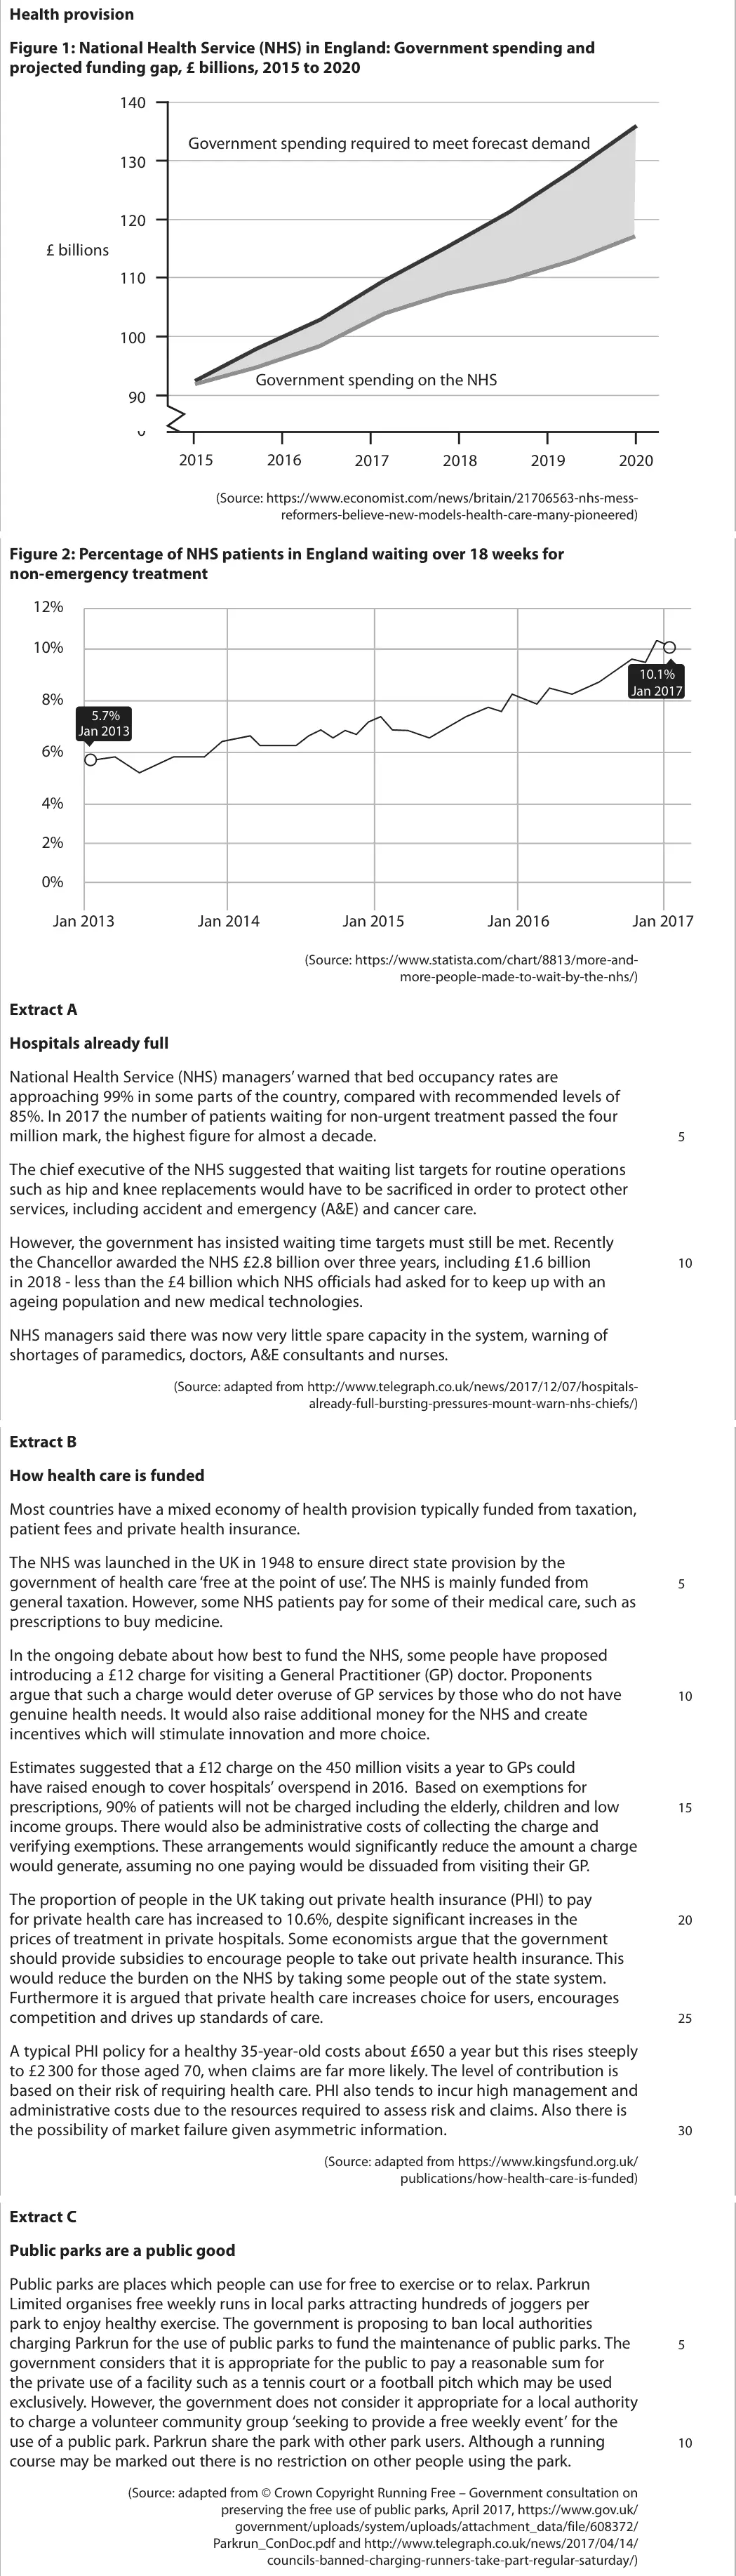
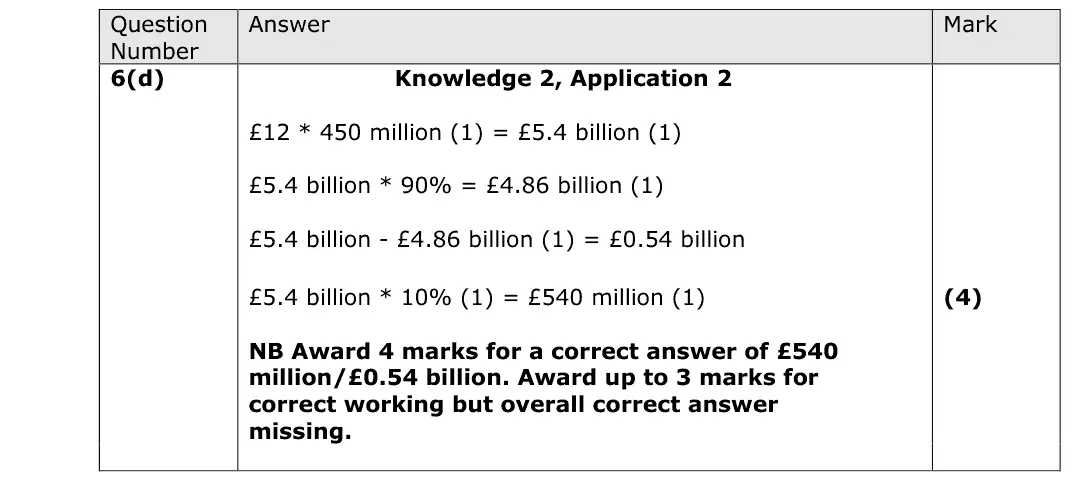
450m visits x £12 = £5.4 billion
only 10% are charged, so £5.4bn x 10% = £540 million (£0.54bn)
4 marks for the correct answer
most candidates got this right
Quantitative skills: QS 2 (calculate, use and understand percentages, percentage changes and percentage point changes)
June 2019 · AS Paper 1 · Q6(f)20 marksAO1=4, AO2=4, AO3=6, AO4=620-mark essayEither/or
Data and extracts for question 6
Mark scheme, including the levels grid and indicative content
Examiner's comment
The first of the essay questions, this question was the most popular by a significant margin. Candidates also performed marginally better on this response than they did on 6(g). The question allows candidates to demonstrate their understanding of a range of possible ways the government could intervene to reduce excess demand. These ways are in the extract, and strong candidates made a good attempt to substantiate points diagrammatically and in context. There was usually a clear recognition that some methods will be more effective than others and this could involve clear evaluation using concepts developed during the teaching of the course, such as subsidies to the private sector which reduce demand on the NHS; the introduction of charges for visits to GPs which could reduce unnecessary appointments; and an increase in frontline funding involving greater levels of public spending. Top level KAA marks required at least two ways and the better responses would draw accurate supply and demand diagrams, whereas weaker candidates would reproduce textbook versions with little though to the elasticity of supply and demand in health care provision. Evaluation marks could be achieved equally well by considering the disadvantages of each method per se, or in more sophisticated cases, in relation to the other methods proposed. The best responses would work by proposing realistic solutions to the problem of excess demand and then evaluating the most effective in the context of the real-world situation.
Notes from the mark scheme and report
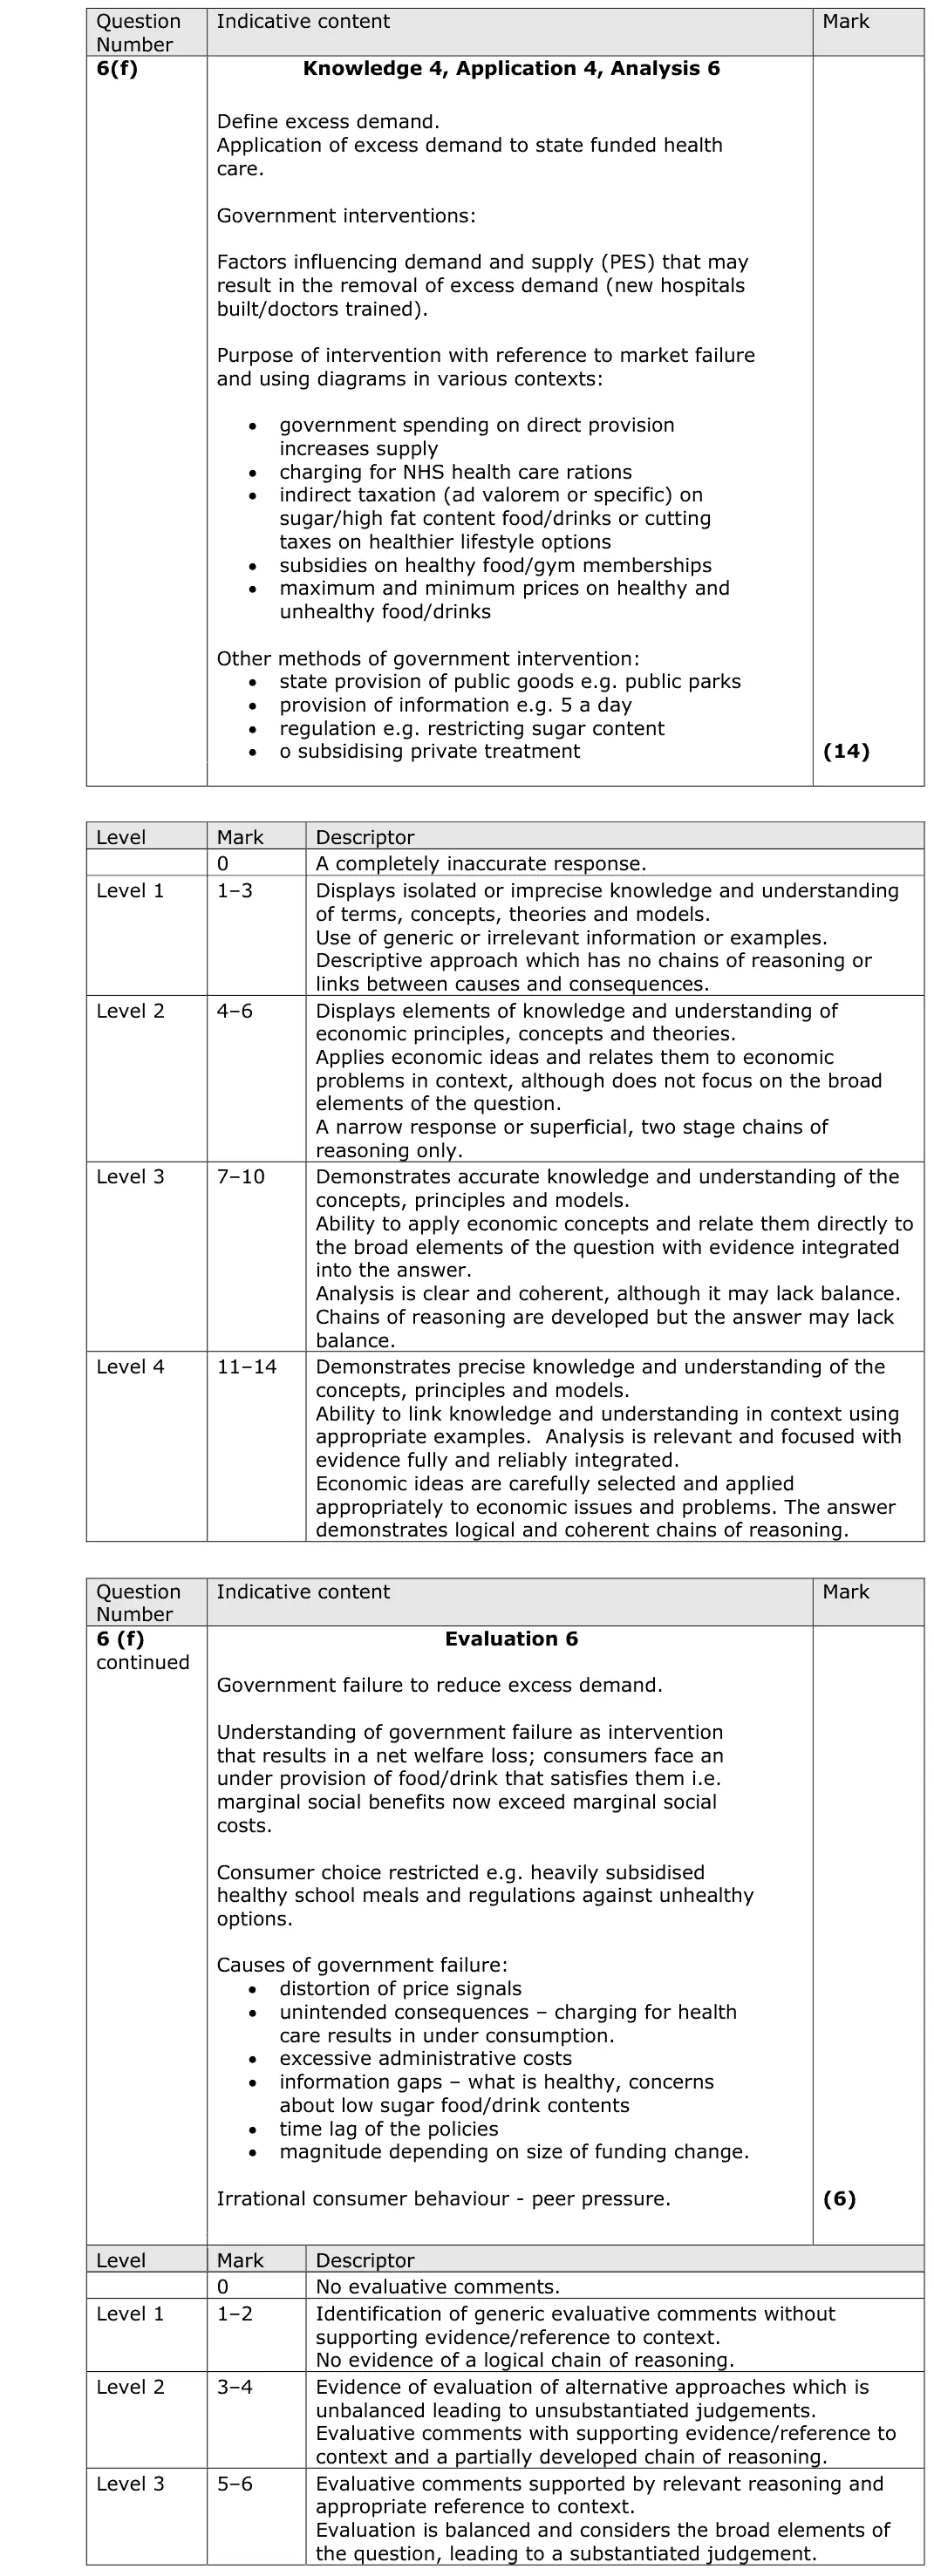
define excess demand and apply to NHS waiting lists
Level 4 needs at least two ways: more state provision (supply right), GP charges to ration, subsidies for private insurance, information and taxes on unhealthy goods
evaluate with government failure, PES of doctors, time lags
Quantitative skills: QS 4 (construct and interpret a range of standard graphical forms)
June 2019 · Paper 3 · Q1(d)25 marksAO1=4, AO2=4, AO3=8, AO4=925-mark essayEither/or
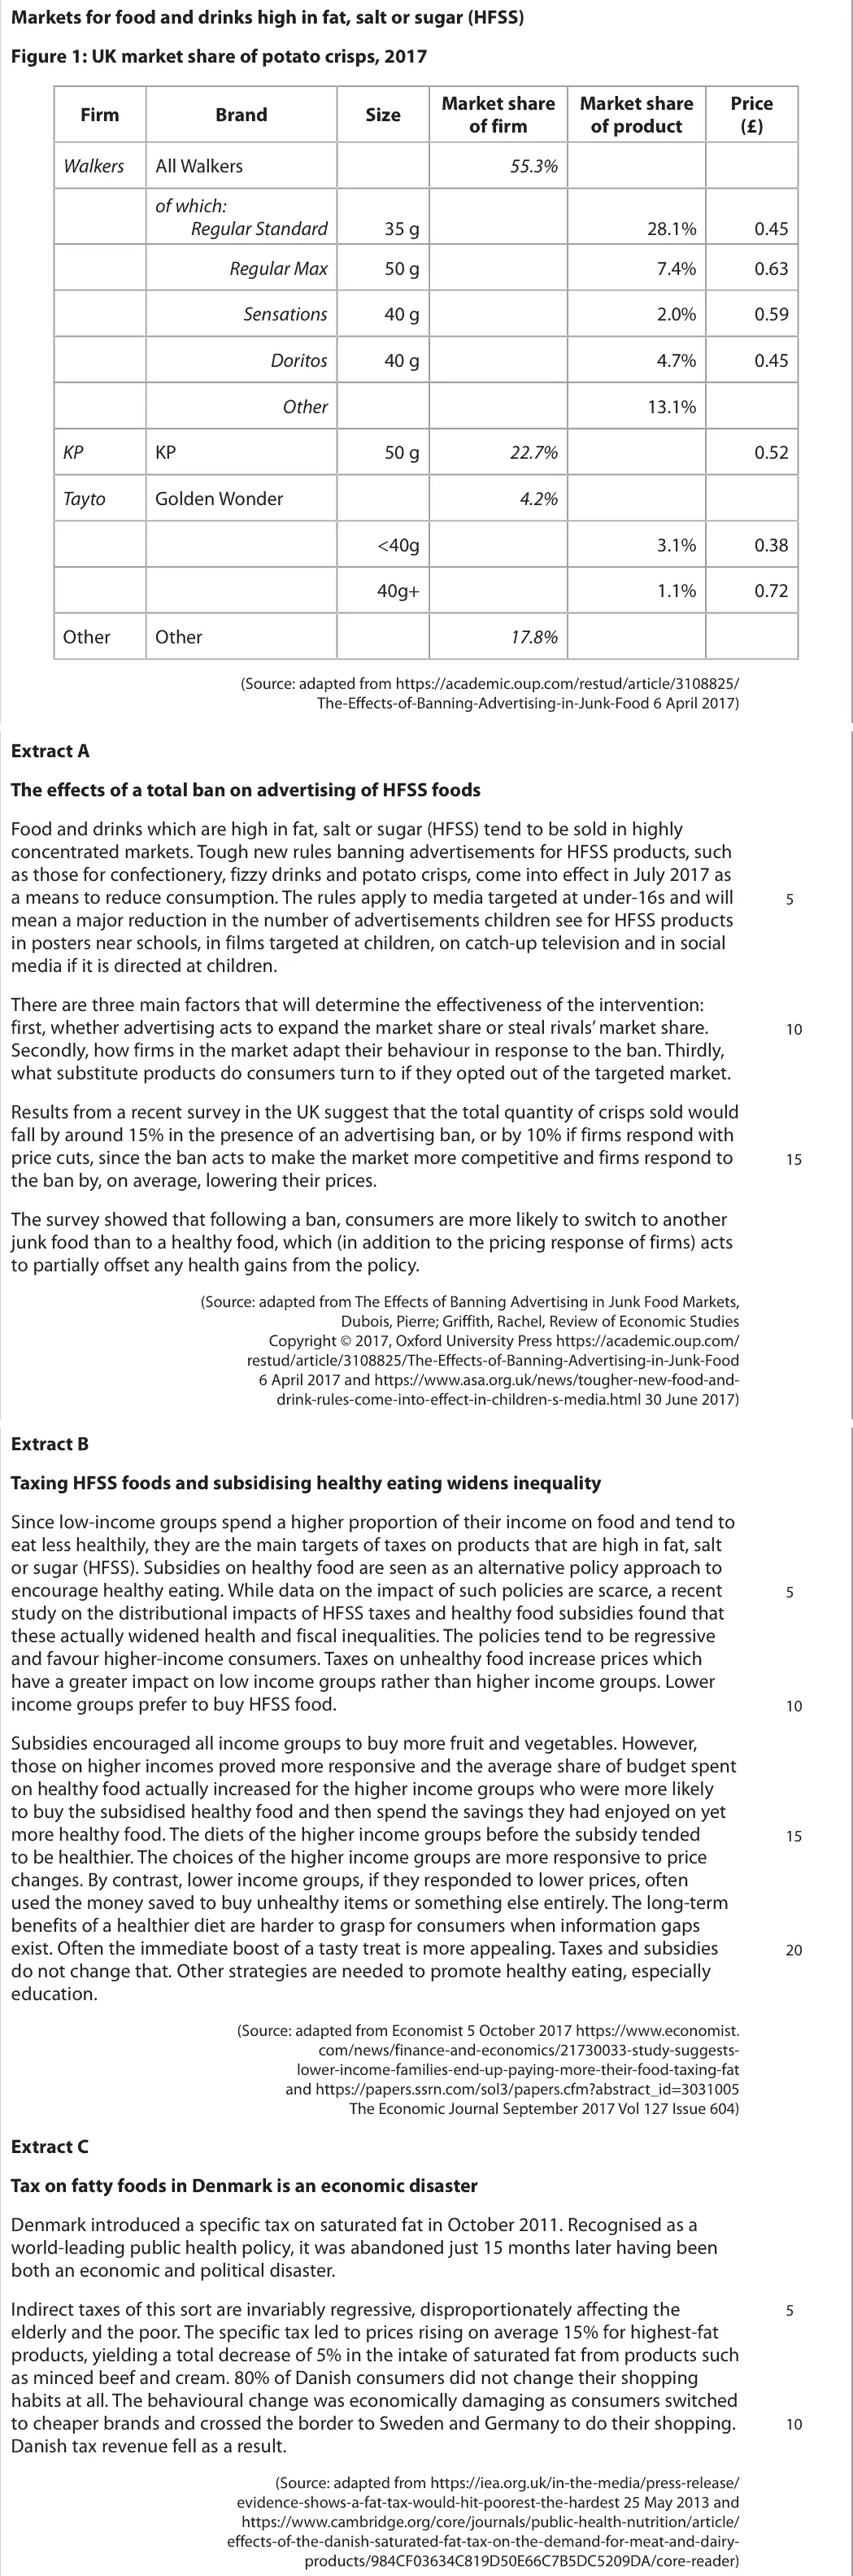
Data and extracts for question 1
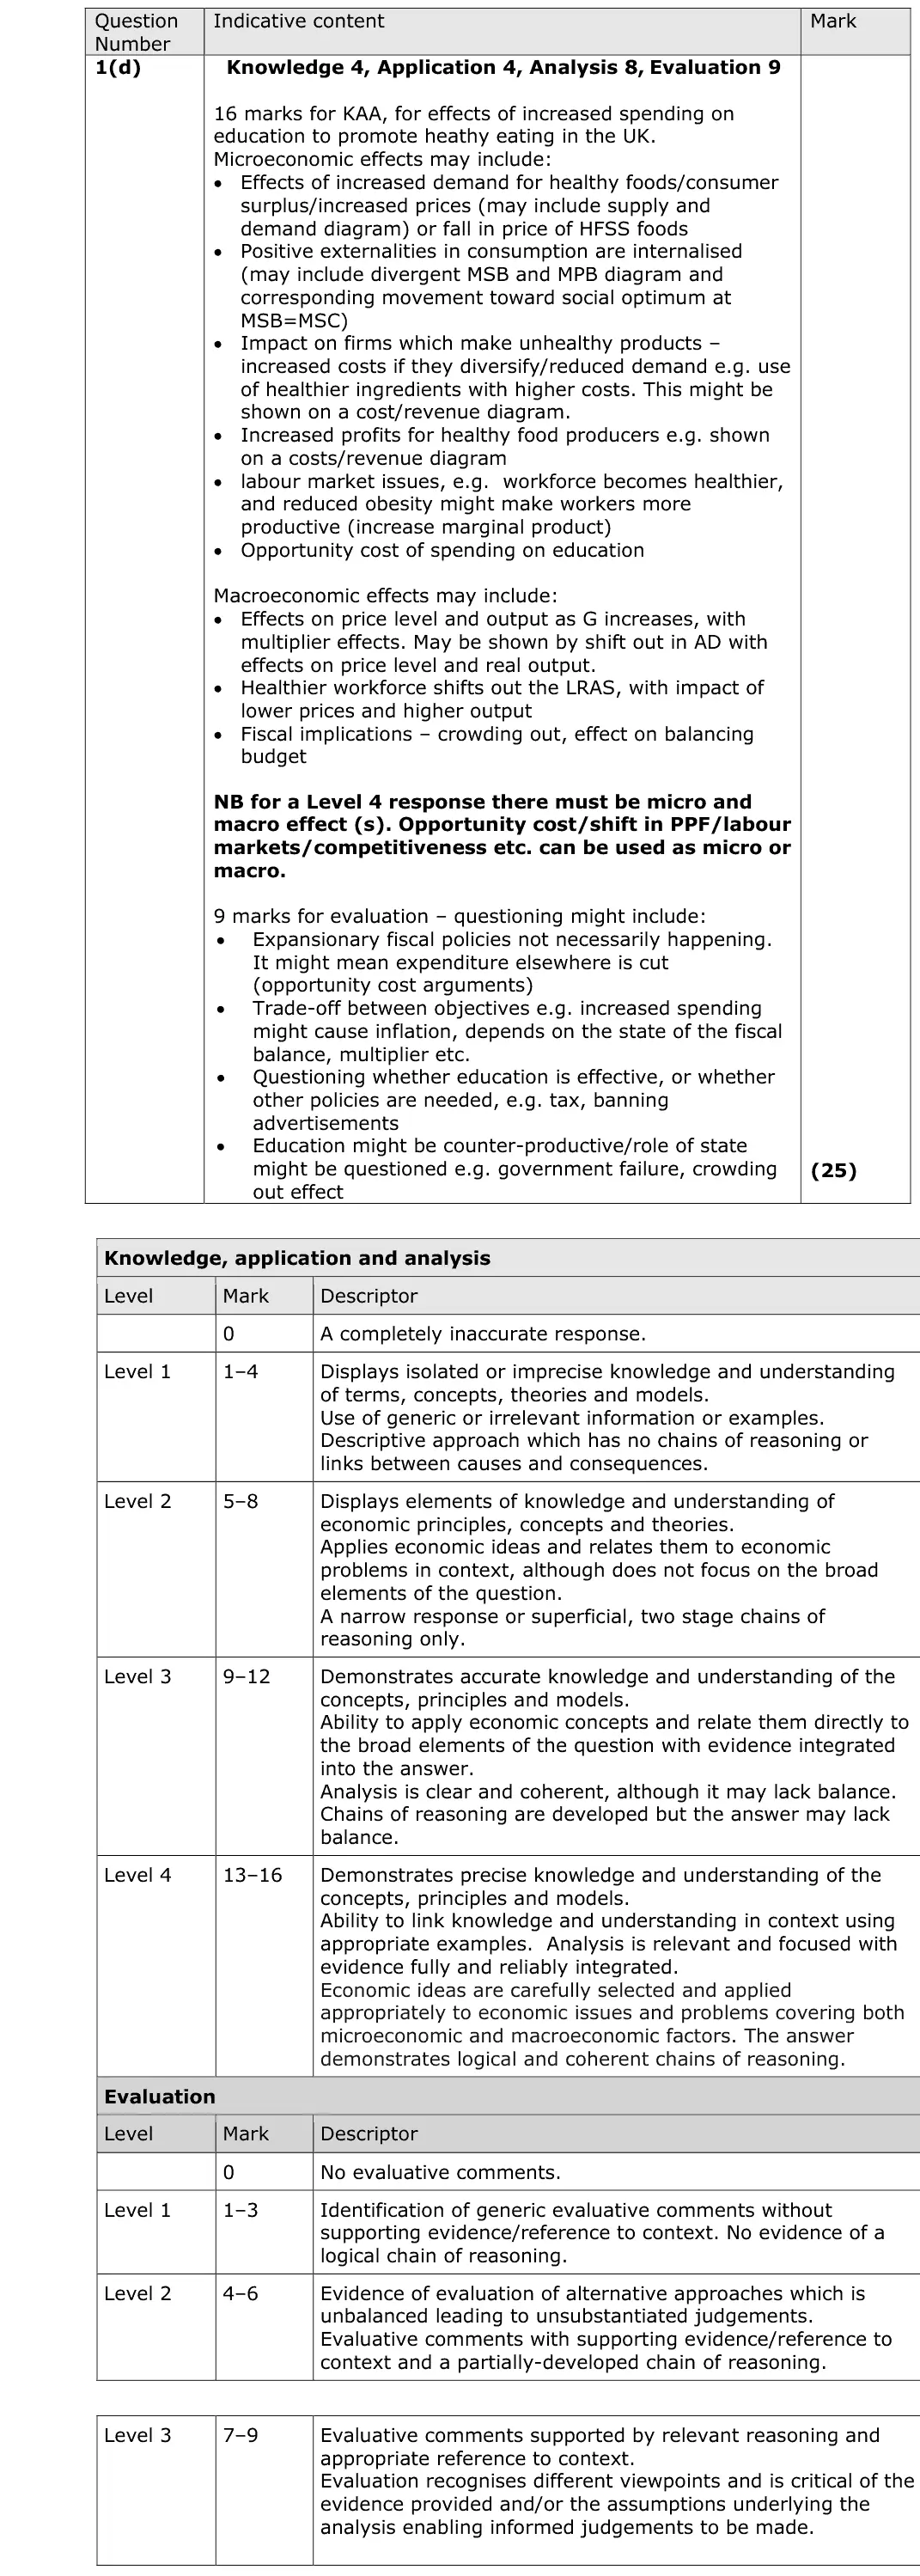
Mark scheme, including the levels grid and indicative content
Examiner's comment
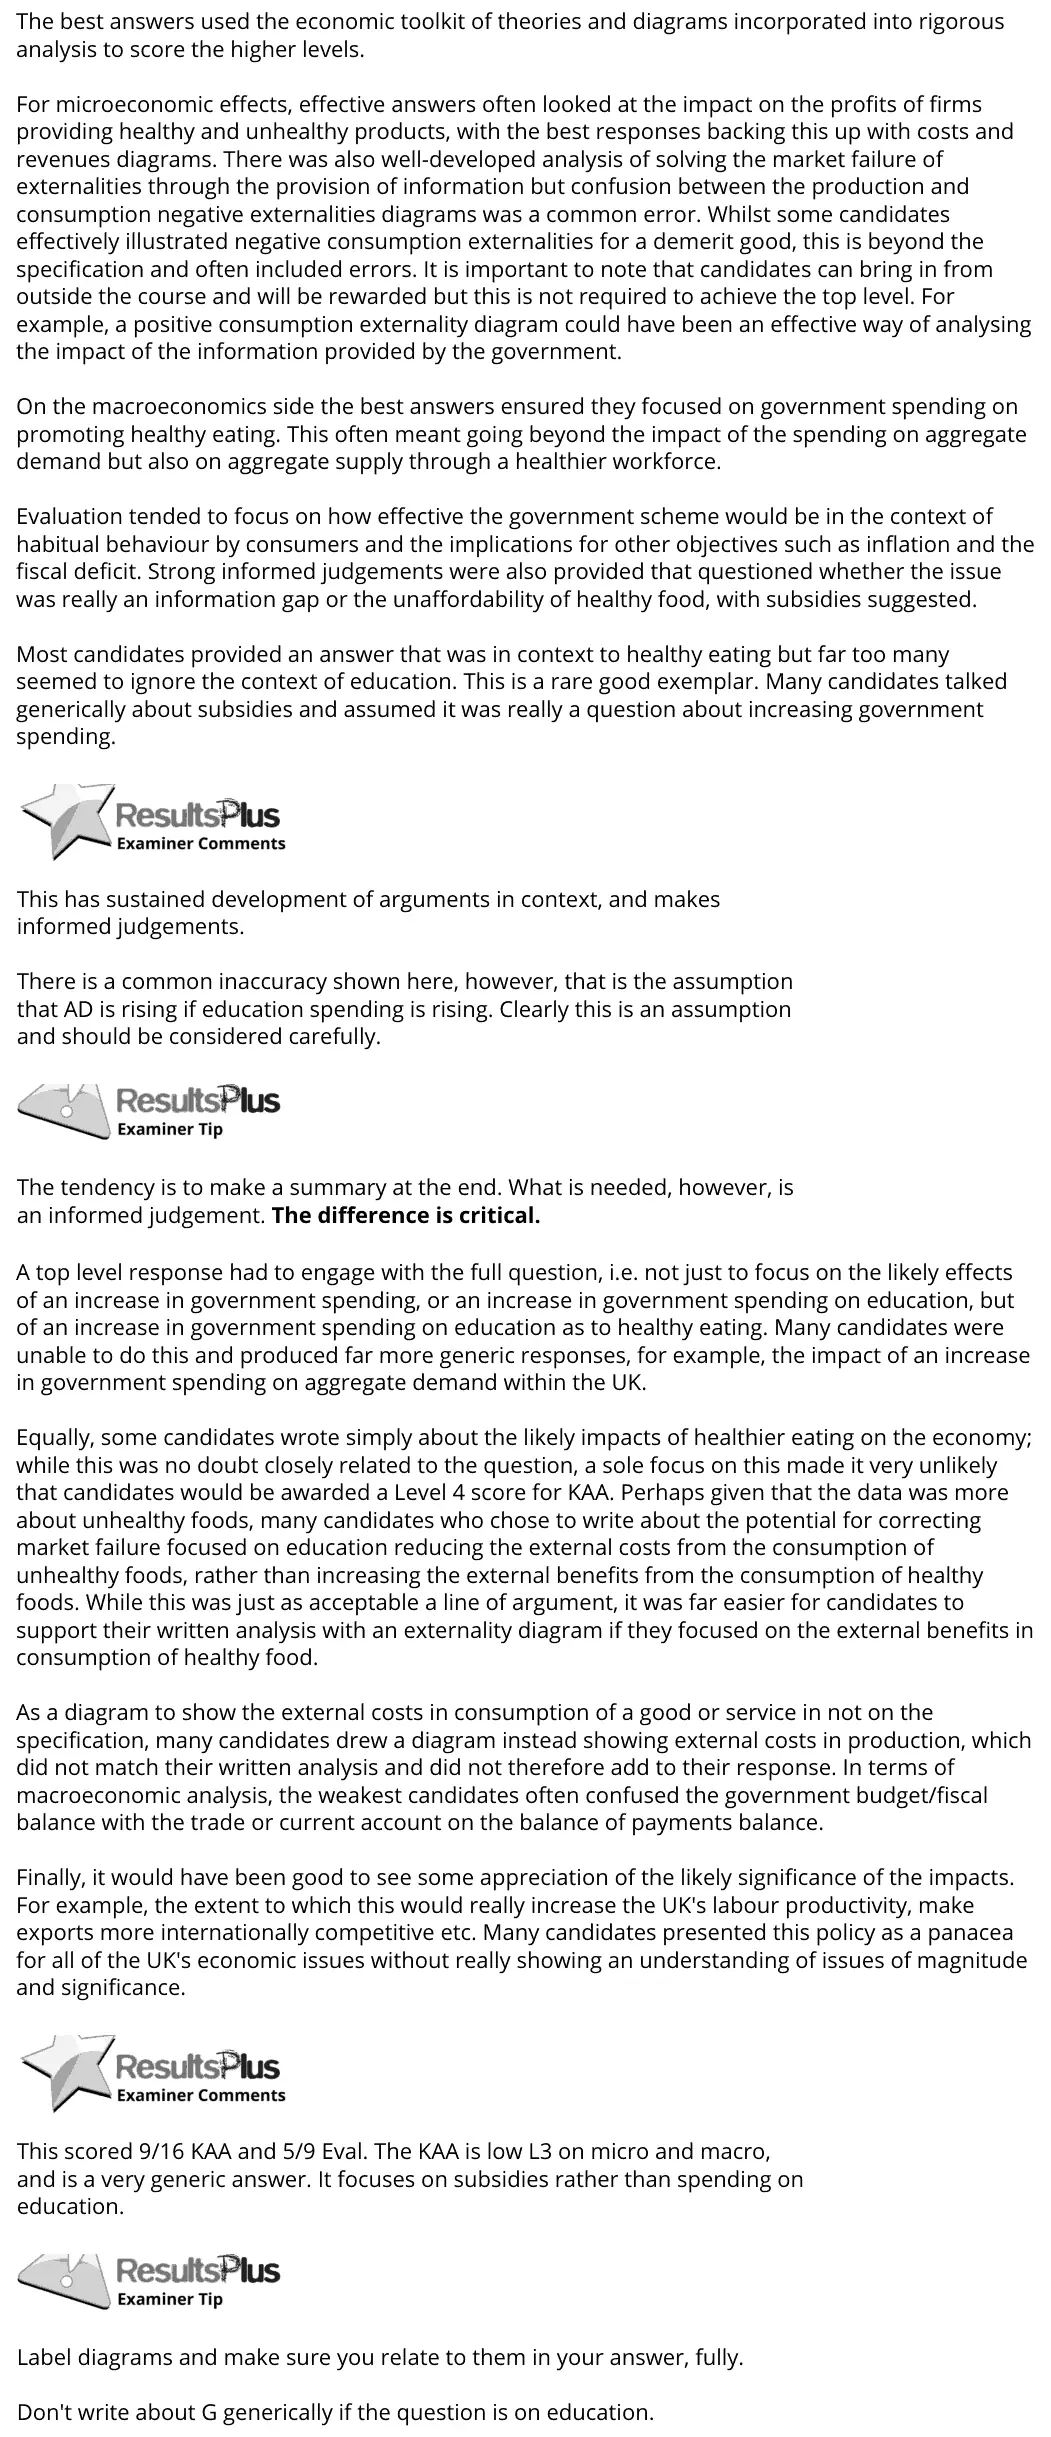
The best answers used the economic toolkit of theories and diagrams incorporated into rigorous analysis to score the higher levels. For microeconomic effects, effective answers often looked at the impact on the profits of firms providing healthy and unhealthy products, with the best responses backing this up with costs and revenues diagrams. There was also well-developed analysis of solving the market failure of externalities through the provision of information but confusion between the production and consumption negative externalities diagrams was a common error. Whilst some candidates effectively illustrated negative consumption externalities for a demerit good, this is beyond the specification and often included errors. It is important to note that candidates can bring in from outside the course and will be rewarded but this is not required to achieve the top level. For example, a positive consumption externality diagram could have been an effective way of analysing the impact of the information provided by the government. On the macroeconomics side the best answers ensured they focused on government spending on promoting healthy eating. This often meant going beyond the impact of the spending on aggregate demand but also on aggregate supply through a healthier workforce. Evaluation tended to focus on how effective the government scheme would be in the context of habitual behaviour by consumers and the implications for other objectives such as inflation and the fiscal deficit. Strong informed judgements were also provided that questioned whether the issue was really an information gap or the unaffordability of healthy food, with subsidies suggested. Most candidates provided an answer that was in context to healthy eating but far too many seemed to ignore the context of education. This is a rare good exemplar. Many candidates talked generically about subsidies and assumed it was really a question about increasing government spending. This has sustained development of arguments in context, and makes informed judgements. There is a common inaccuracy shown here, however, that is the assumption that AD is rising if education spending is rising. Clearly this is an assumption and should be considered carefully. The tendency is to make a summary at the end. What is needed, however, is an informed judgement. The difference is critical. A top level response had to engage with the full question, i.e. not just to focus on the likely effects of an increase in government spending, or an increase in government spending on education, but of an increase in government spending on education as to healthy eating. Many candidates were unable to do this and produced far more generic responses, for example, the impact of an increase in government spending on aggregate demand within the UK. Equally, some candidates wrote simply about the likely impacts of healthier eating on the economy; while this was no doubt closely related to the question, a sole focus on this made it very unlikely that candidates would be awarded a Level 4 score for KAA. Perhaps given that the data was more about unhealthy foods, many candidates who chose to write about the potential for correcting market failure focused on education reducing the external costs from the consumption of unhealthy foods, rather than increasing the external benefits from the consumption of healthy foods. While this was just as acceptable a line of argument, it was far easier for candidates to support their written analysis with an externality diagram if they focused on the external benefits in consumption of healthy food. As a diagram to show the external costs in consumption of a good or service in not on the specification, many candidates drew a diagram instead showing external costs in production, which did not match their written analysis and did not therefore add to their response. In terms of macroeconomic analysis, the weakest candidates often confused the government budget/fiscal balance with the trade or current account on the balance of payments balance. Finally, it would have been good to see some appreciation of the likely significance of the impacts. For example, the extent to which this would really increase the UK's labour productivity, make exports more internationally competitive etc. Many candidates presented this policy as a panacea for all of the UK's economic issues without really showing an understanding of issues of magnitude and significance. This scored 9/16 KAA and 5/9 Eval. The KAA is low L3 on micro and macro, and is a very generic answer. It focuses on subsidies rather than spending on education. Label diagrams and make sure you relate to them in your answer, fully. Don't write about G generically if the question is on education.
Notes from the mark scheme and report
provision of information as intervention: positive consumption externality diagram (MSB above MPB), effects on healthy and HFSS food firms
macro: G with multiplier shifts AD, healthier workforce shifts LRAS
Level 4 needs micro and macro
do not confuse the fiscal balance with the current account
production externality diagrams were a common error
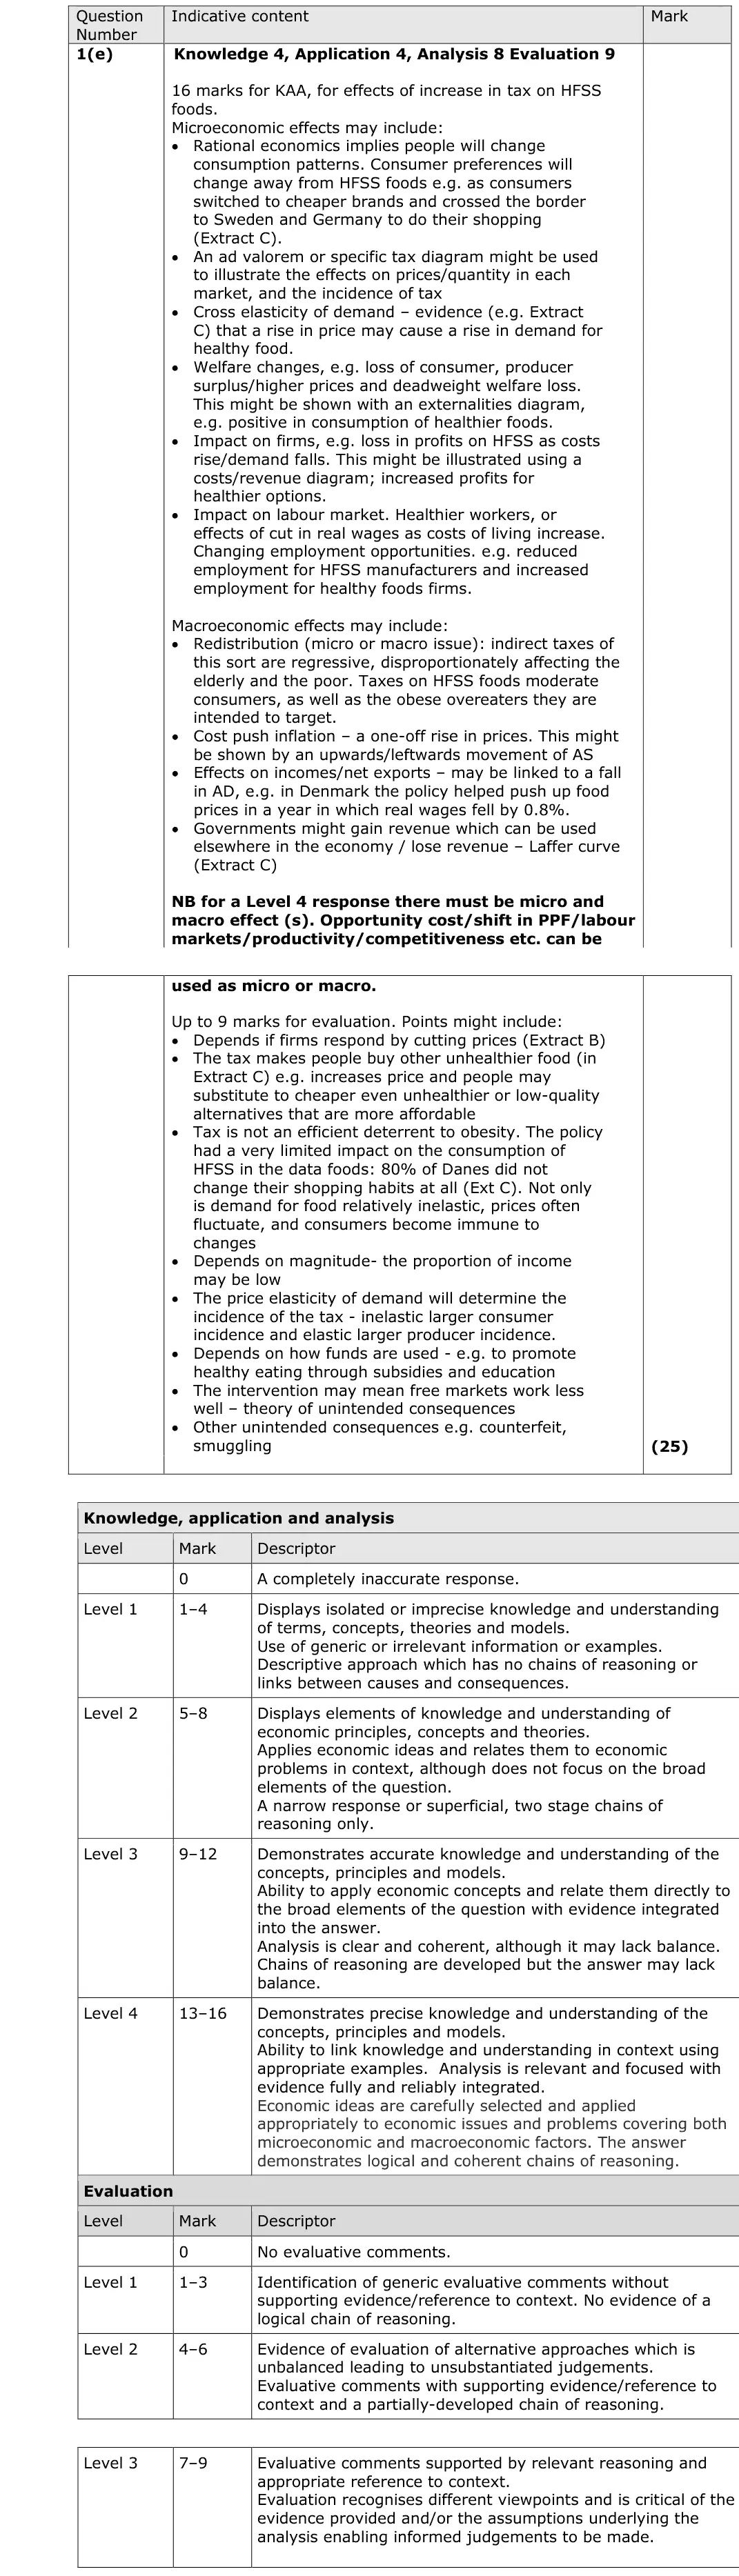
June 2019 · Paper 3 · Q1(e)25 marksAO1=4, AO2=4, AO3=8, AO4=925-mark essayEither/or
Data and extracts for question 1
Mark scheme, including the levels grid and indicative content
Examiner's comment
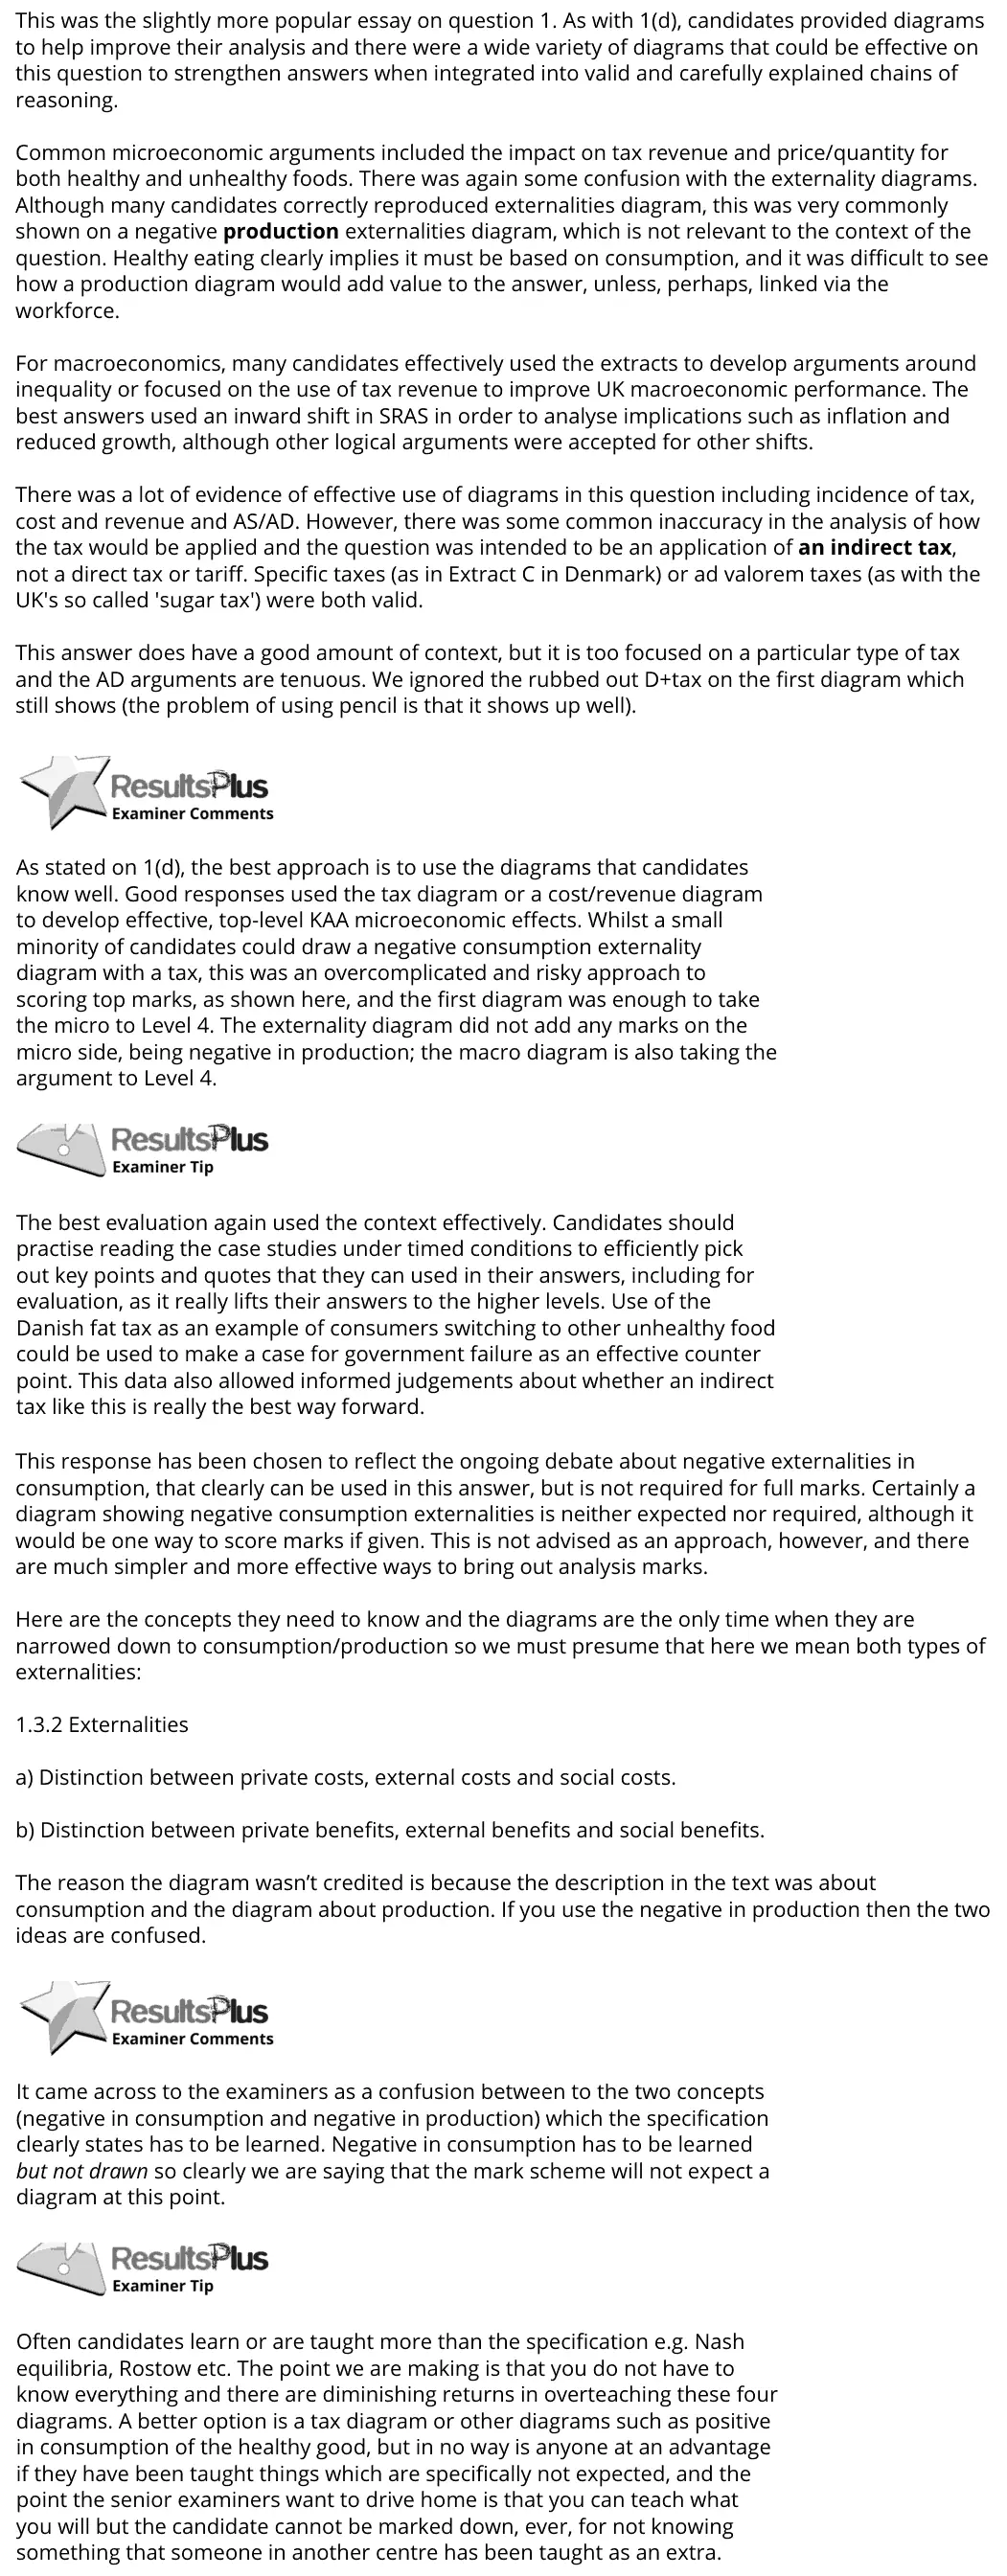
This was the slightly more popular essay on question 1. As with 1(d), candidates provided diagrams to help improve their analysis and there were a wide variety of diagrams that could be effective on this question to strengthen answers when integrated into valid and carefully explained chains of reasoning. Common microeconomic arguments included the impact on tax revenue and price/quantity for both healthy and unhealthy foods. There was again some confusion with the externality diagrams. Although many candidates correctly reproduced externalities diagram, this was very commonly shown on a negative production externalities diagram, which is not relevant to the context of the question. Healthy eating clearly implies it must be based on consumption, and it was difficult to see how a production diagram would add value to the answer, unless, perhaps, linked via the workforce. For macroeconomics, many candidates effectively used the extracts to develop arguments around inequality or focused on the use of tax revenue to improve UK macroeconomic performance. The best answers used an inward shift in SRAS in order to analyse implications such as inflation and reduced growth, although other logical arguments were accepted for other shifts. There was a lot of evidence of effective use of diagrams in this question including incidence of tax, cost and revenue and AS/AD. However, there was some common inaccuracy in the analysis of how the tax would be applied and the question was intended to be an application of an indirect tax, not a direct tax or tariff. Specific taxes (as in Extract C in Denmark) or ad valorem taxes (as with the UK's so called 'sugar tax') were both valid. This answer does have a good amount of context, but it is too focused on a particular type of tax and the AD arguments are tenuous. We ignored the rubbed out D+tax on the first diagram which still shows (the problem of using pencil is that it shows up well). As stated on 1(d), the best approach is to use the diagrams that candidates know well. Good responses used the tax diagram or a cost/revenue diagram to develop effective, top-level KAA microeconomic effects. Whilst a small minority of candidates could draw a negative consumption externality diagram with a tax, this was an overcomplicated and risky approach to scoring top marks, as shown here, and the first diagram was enough to take the micro to Level 4. The externality diagram did not add any marks on the micro side, being negative in production; the macro diagram is also taking the argument to Level 4. The best evaluation again used the context effectively. Candidates should practise reading the case studies under timed conditions to efficiently pick out key points and quotes that they can used in their answers, including for evaluation, as it really lifts their answers to the higher levels. Use of the Danish fat tax as an example of consumers switching to other unhealthy food could be used to make a case for government failure as an effective counter point. This data also allowed informed judgements about whether an indirect tax like this is really the best way forward. This response has been chosen to reflect the ongoing debate about negative externalities in consumption, that clearly can be used in this answer, but is not required for full marks. Certainly a diagram showing negative consumption externalities is neither expected nor required, although it would be one way to score marks if given. This is not advised as an approach, however, and there are much simpler and more effective ways to bring out analysis marks. Here are the concepts they need to know and the diagrams are the only time when they are narrowed down to consumption/production so we must presume that here we mean both types of externalities: 1.3.2 Externalities a) Distinction between private costs, external costs and social costs. b) Distinction between private benefits, external benefits and social benefits. The reason the diagram wasn’t credited is because the description in the text was about consumption and the diagram about production. If you use the negative in production then the two ideas are confused. It came across to the examiners as a confusion between to the two concepts (negative in consumption and negative in production) which the specification clearly states has to be learned. Negative in consumption has to be learned but not drawn so clearly we are saying that the mark scheme will not expect a diagram at this point. Often candidates learn or are taught more than the specification e.g. Nash equilibria, Rostow etc. The point we are making is that you do not have to know everything and there are diminishing returns in overteaching these four diagrams. A better option is a tax diagram or other diagrams such as positive in consumption of the healthy good, but in no way is anyone at an advantage if they have been taught things which are specifically not expected, and the point the senior examiners want to drive home is that you can teach what you will but the candidate cannot be marked down, ever, for not knowing something that someone in another centre has been taught as an extra.
Notes from the mark scheme and report
incidence depends on PED (inelastic demand, consumer bears most)
regressive (Extract B), Denmark tax abandoned after 15 months with cross-border shopping (Extract C)
use a consumption, not production, externality diagram
macro: inflation, SRAS, inequality, tax revenue
Level 4 needs micro and macro
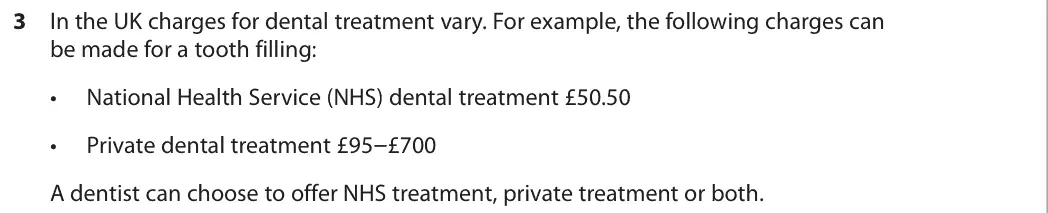
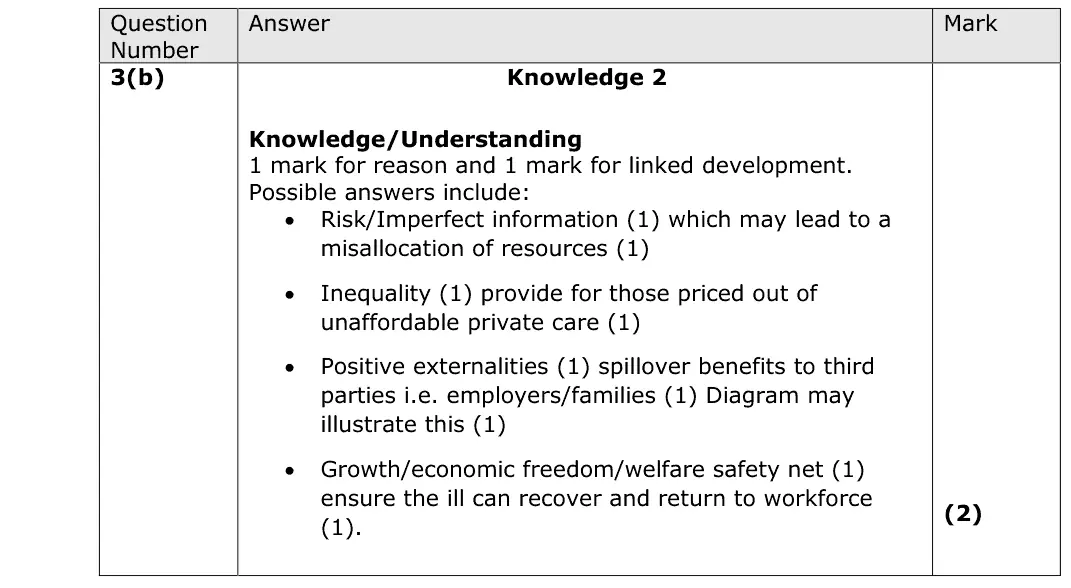
June 2018 · AS Paper 1 · Q3(b)2 marksAO1=2Short answer
Data and extracts for question 3
Mark scheme
Examiner's comment
This question did cause some difficulties for candidates, though most were still able to score highly. Many answers developed inequality as a reason, with NHS treatment going some way towards helping those priced out of unaffordable private dental care. Another popular approach was to consider the positive externalities of state provision for employers or family members. Candidates often misidentified dental care as a public good and developed arguments along this approach. Some candidates argued that NHS treatment is free, though the data does indicate that it isn't. An excellent answer which scores 2 marks. The candidate clearly identifies that those on low incomes may not be able to afford private sector dental treatment. This is because private sector dentists aim to maximise profit, meaning that prices are higher than in the NHS. Two marks are gained by the statement of a clear reason, followed by some development. This answer is typical of a number that developed the idea of NHS treatment being a public good. The candidate shows a textbook understanding of public goods but has misidentified dental treatment as a public good. In the last two lines of the answer the candidate says that 'people cannot be forced to pay for it', even though the data gives the cost of a tooth filling on the NHS. This scored 0 marks. Make sure you read the question carefully and use the data. NHS dental treatment has a cost at the point of use. People can be charged for it.
Notes from the mark scheme and report
reason plus linked development: inequality (those priced out of private care), positive externalities, information gaps
report: dental care was often wrongly called a public good, and NHS treatment is not free (£50.50)
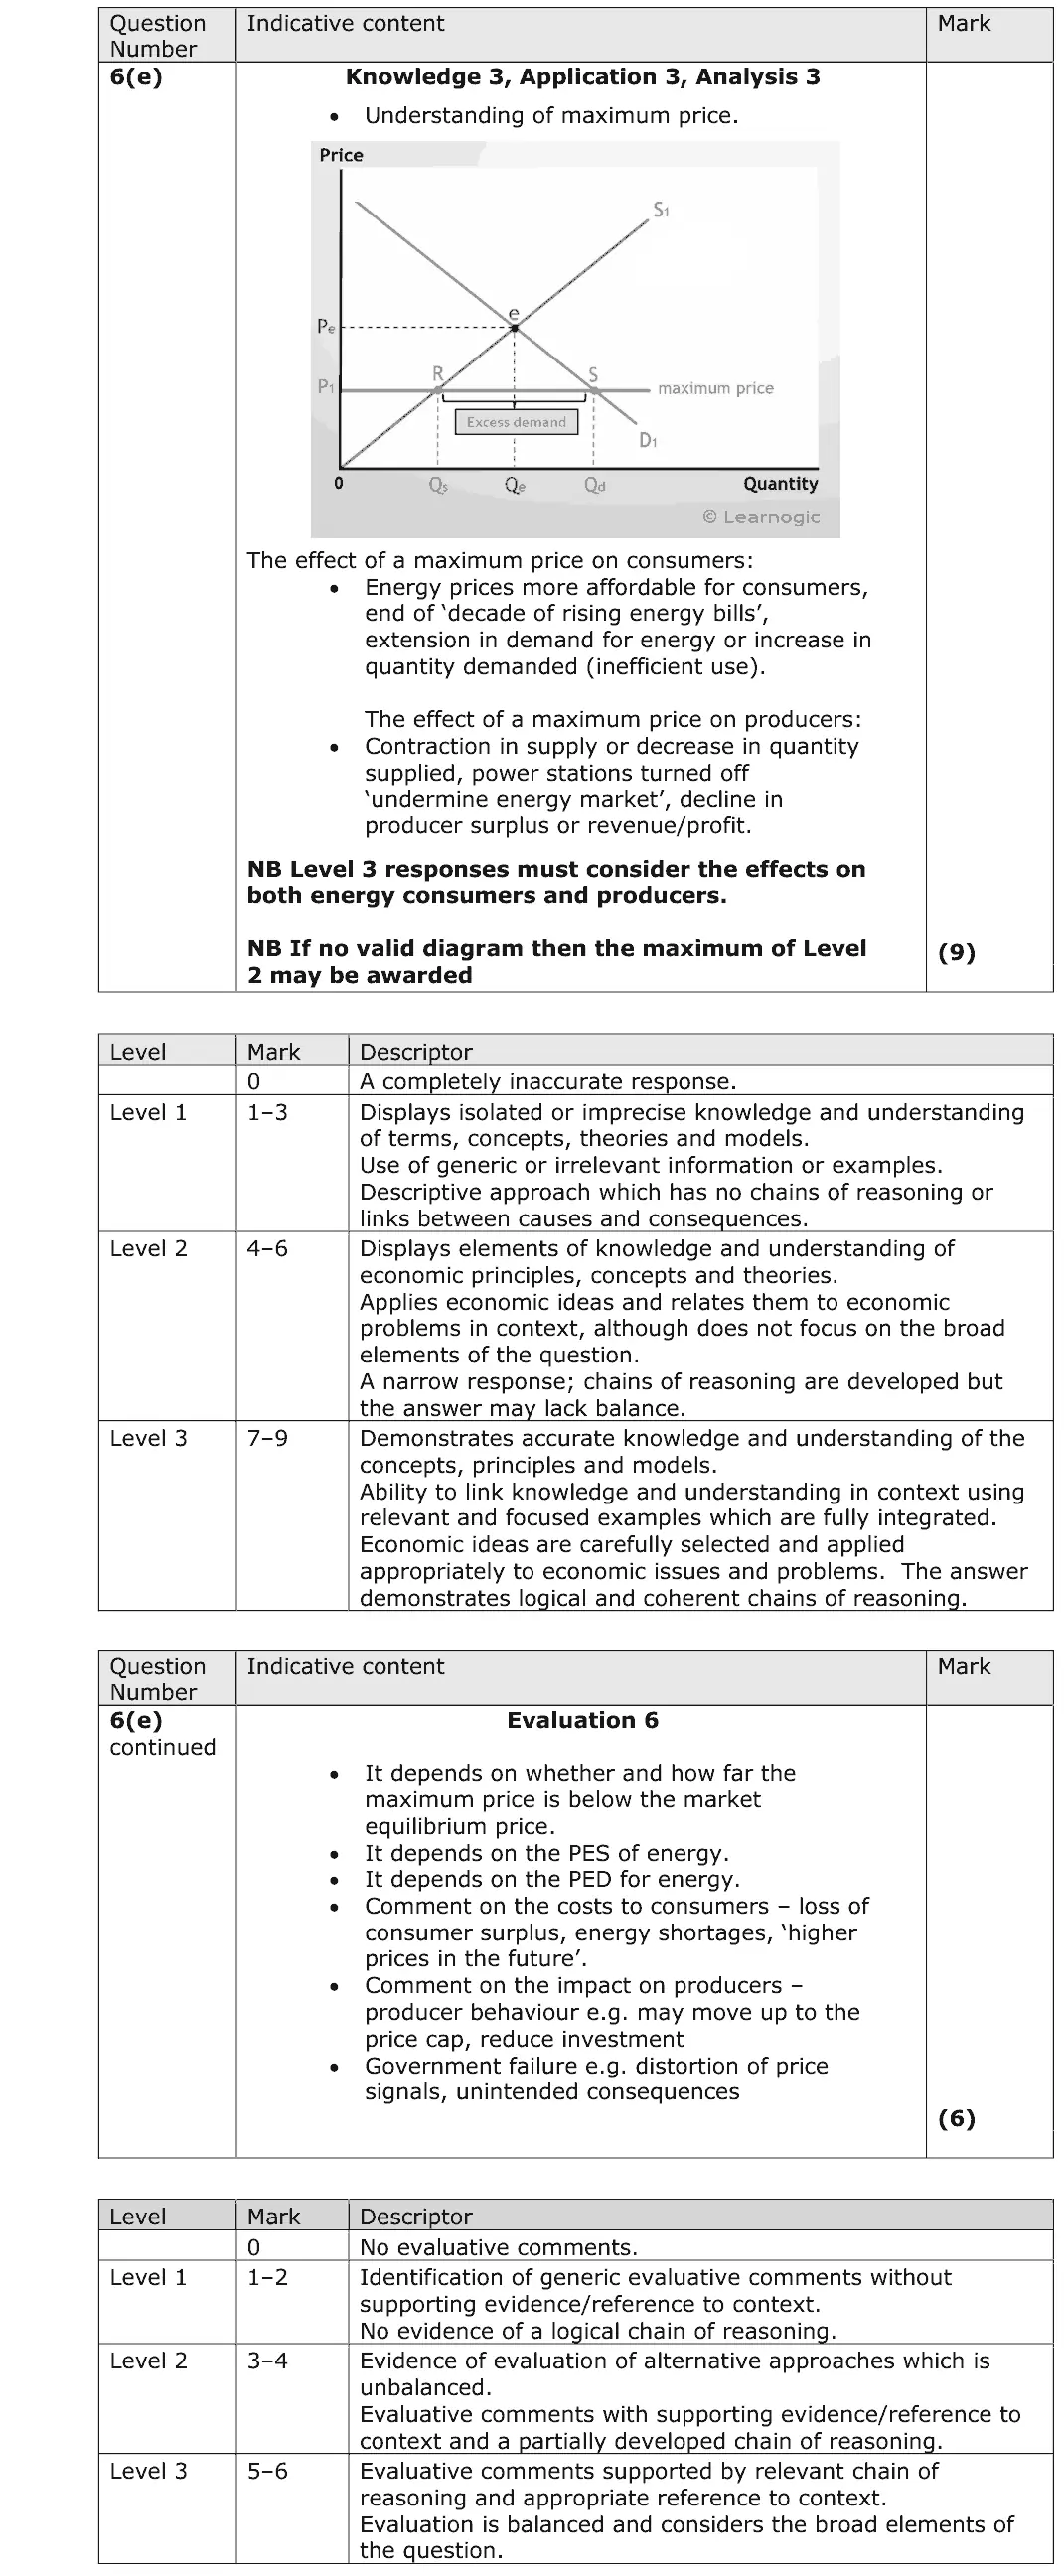
June 2018 · AS Paper 1 · Q6(e)15 marksAO1=3, AO2=3, AO3=3, AO4=615-mark response
Data and extracts for question 6
Mark scheme, including the levels grid and indicative content
Examiner's comment
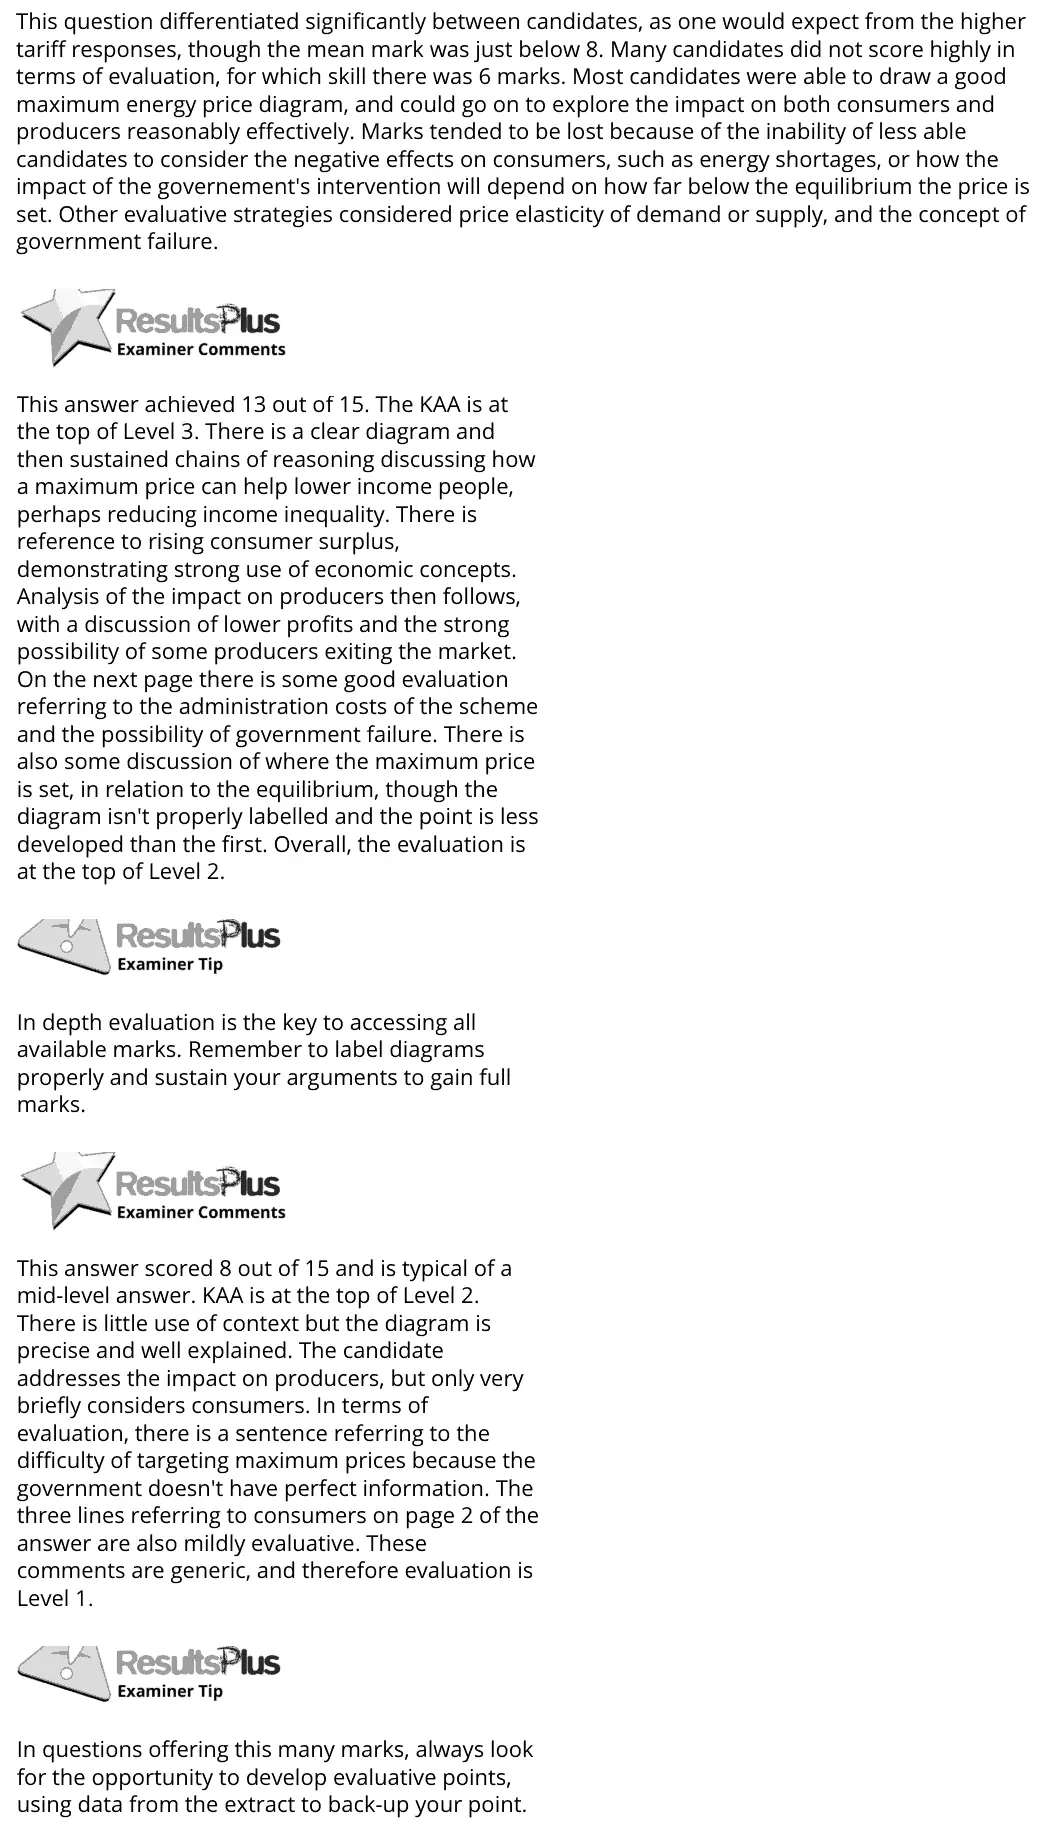
This question differentiated significantly between candidates, as one would expect from the higher tariff responses, though the mean mark was just below 8. Many candidates did not score highly in terms of evaluation, for which skill there was 6 marks. Most candidates were able to draw a good maximum energy price diagram, and could go on to explore the impact on both consumers and producers reasonably effectively. Marks tended to be lost because of the inability of less able candidates to consider the negative effects on consumers, such as energy shortages, or how the impact of the governement's intervention will depend on how far below the equilibrium the price is set. Other evaluative strategies considered price elasticity of demand or supply, and the concept of government failure. This answer achieved 13 out of 15. The KAA is at the top of Level 3. There is a clear diagram and then sustained chains of reasoning discussing how a maximum price can help lower income people, perhaps reducing income inequality. There is reference to rising consumer surplus, demonstrating strong use of economic concepts. Analysis of the impact on producers then follows, with a discussion of lower profits and the strong possibility of some producers exiting the market. On the next page there is some good evaluation referring to the administration costs of the scheme and the possibility of government failure. There is also some discussion of where the maximum price is set, in relation to the equilibrium, though the diagram isn't properly labelled and the point is less developed than the first. Overall, the evaluation is at the top of Level 2. In depth evaluation is the key to accessing all available marks. Remember to label diagrams properly and sustain your arguments to gain full marks. This answer scored 8 out of 15 and is typical of a mid-level answer. KAA is at the top of Level 2. There is little use of context but the diagram is precise and well explained. The candidate addresses the impact on producers, but only very briefly considers consumers. In terms of evaluation, there is a sentence referring to the difficulty of targeting maximum prices because the government doesn't have perfect information. The three lines referring to consumers on page 2 of the answer are also mildly evaluative. These comments are generic, and therefore evaluation is Level 1. In questions offering this many marks, always look for the opportunity to develop evaluative points, using data from the extract to back-up your point.
Notes from the mark scheme and report
maximum price below equilibrium: lower bills and more affordable energy for consumers but excess demand (shortages)
lower revenue and profit for producers, less investment
evaluate with how far below equilibrium, PED and PES, government failure
report: many lacked evaluation and ignored negative effects on consumers
Quantitative skills: QS 4 (construct and interpret a range of standard graphical forms)
June 2018 · AS Paper 1 · Q6(g)20 marksAO1=4, AO2=4, AO3=6, AO4=620-mark essayEither/or
Data and extracts for question 6
Mark scheme, including the levels grid and indicative content
Examiner's comment
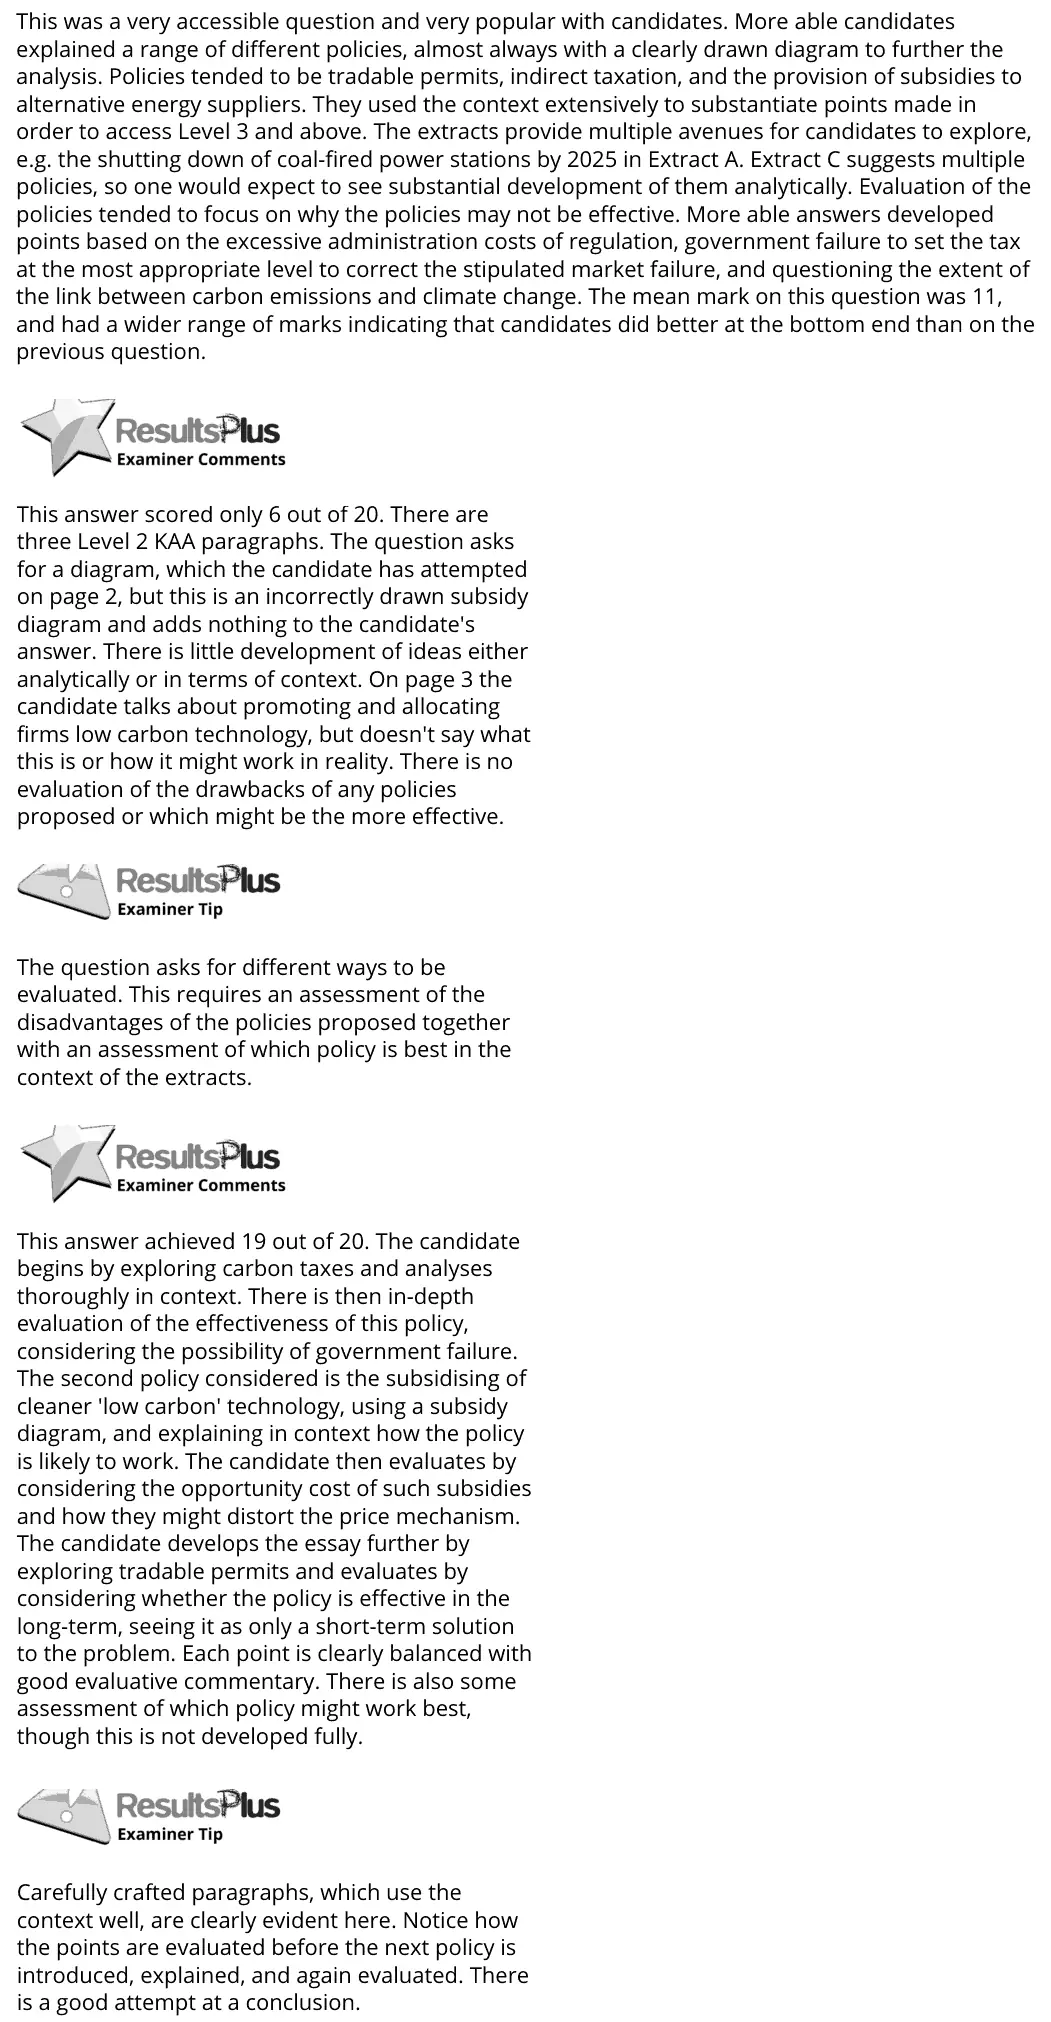
This was a very accessible question and very popular with candidates. More able candidates explained a range of different policies, almost always with a clearly drawn diagram to further the analysis. Policies tended to be tradable permits, indirect taxation, and the provision of subsidies to alternative energy suppliers. They used the context extensively to substantiate points made in order to access Level 3 and above. The extracts provide multiple avenues for candidates to explore, e.g. the shutting down of coal-fired power stations by 2025 in Extract A. Extract C suggests multiple policies, so one would expect to see substantial development of them analytically. Evaluation of the policies tended to focus on why the policies may not be effective. More able answers developed points based on the excessive administration costs of regulation, government failure to set the tax at the most appropriate level to correct the stipulated market failure, and questioning the extent of the link between carbon emissions and climate change. The mean mark on this question was 11, and had a wider range of marks indicating that candidates did better at the bottom end than on the previous question. This answer scored only 6 out of 20. There are three Level 2 KAA paragraphs. The question asks for a diagram, which the candidate has attempted on page 2, but this is an incorrectly drawn subsidy diagram and adds nothing to the candidate's answer. There is little development of ideas either analytically or in terms of context. On page 3 the candidate talks about promoting and allocating firms low carbon technology, but doesn't say what this is or how it might work in reality. There is no evaluation of the drawbacks of any policies proposed or which might be the more effective. The question asks for different ways to be evaluated. This requires an assessment of the disadvantages of the policies proposed together with an assessment of which policy is best in the context of the extracts. This answer achieved 19 out of 20. The candidate begins by exploring carbon taxes and analyses thoroughly in context. There is then in-depth evaluation of the effectiveness of this policy, considering the possibility of government failure. The second policy considered is the subsidising of cleaner 'low carbon' technology, using a subsidy diagram, and explaining in context how the policy is likely to work. The candidate then evaluates by considering the opportunity cost of such subsidies and how they might distort the price mechanism. The candidate develops the essay further by exploring tradable permits and evaluates by considering whether the policy is effective in the long-term, seeing it as only a short-term solution to the problem. Each point is clearly balanced with good evaluative commentary. There is also some assessment of which policy might work best, though this is not developed fully. Carefully crafted paragraphs, which use the context well, are clearly evident here. Notice how the points are evaluated before the next policy is introduced, explained, and again evaluated. There is a good attempt at a conclusion.
Notes from the mark scheme and report
taxes on carbon (shift MPC to MSC), tradable pollution permits, subsidies to renewables, regulation (closing coal plants by 2025), information
diagram required
evaluate effectiveness, valuing external costs, government failure, global free-rider problem
Quantitative skills: QS 4 (construct and interpret a range of standard graphical forms)
June 2018 · Paper 3 · Q1(c)8 marksAO1=2, AO2=2, AO3=2, AO4=28-mark response
Data and extracts for question 1
Mark scheme, including the levels grid and indicative content
Examiner's comment
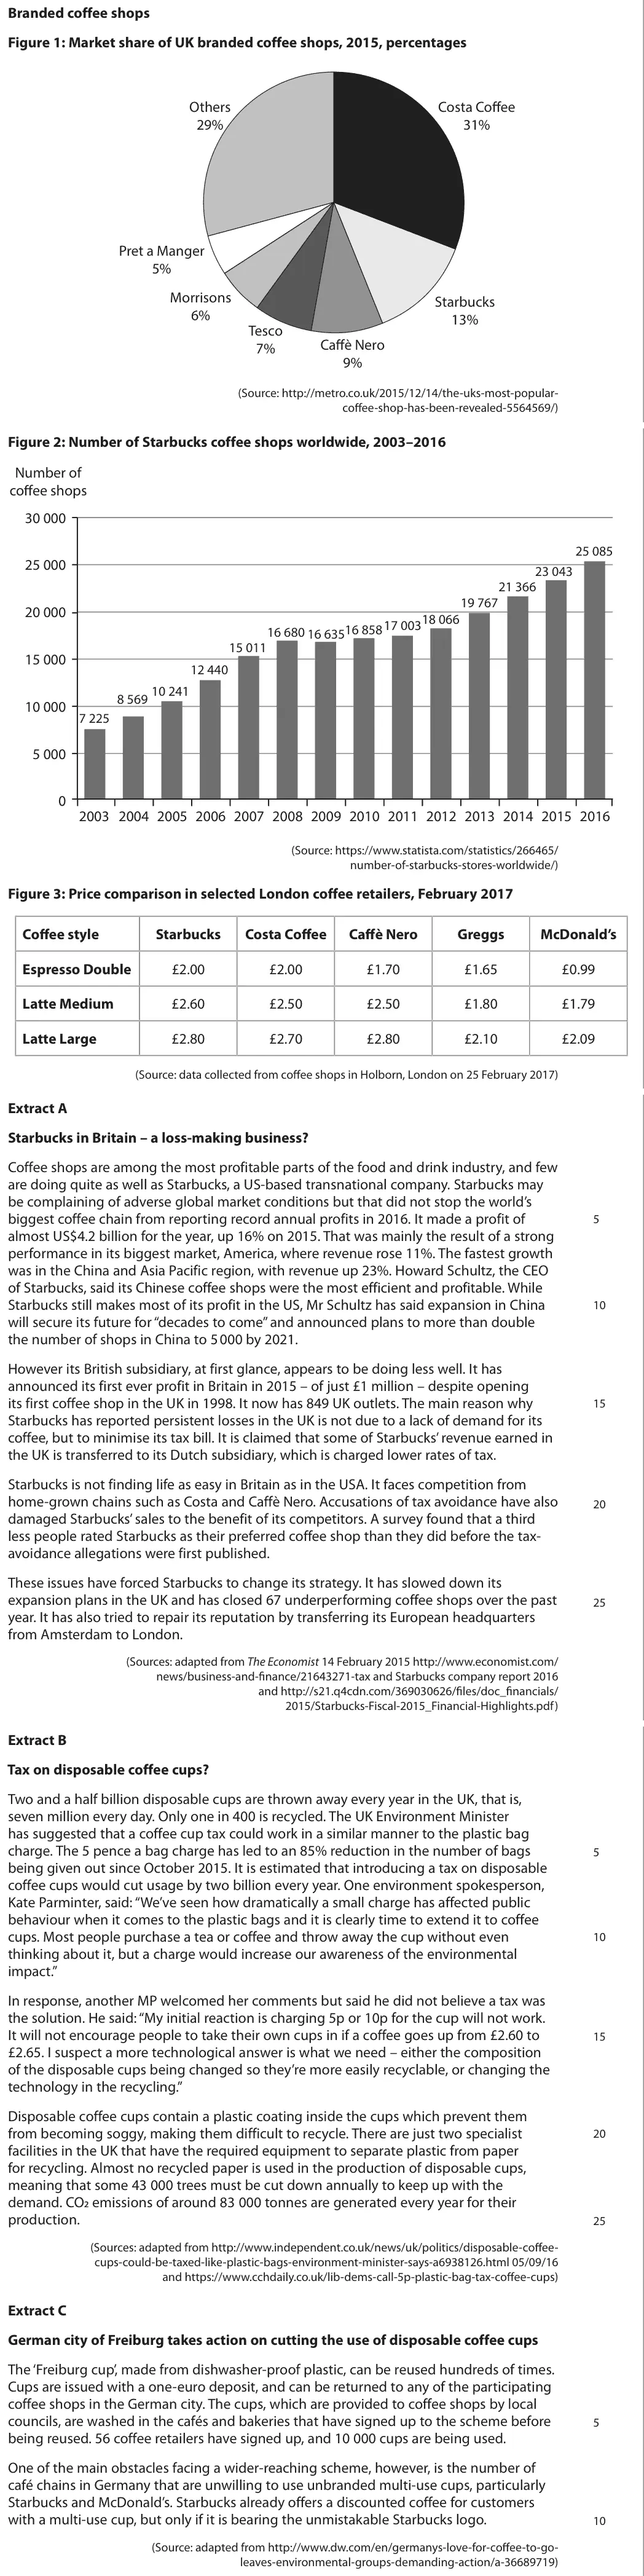
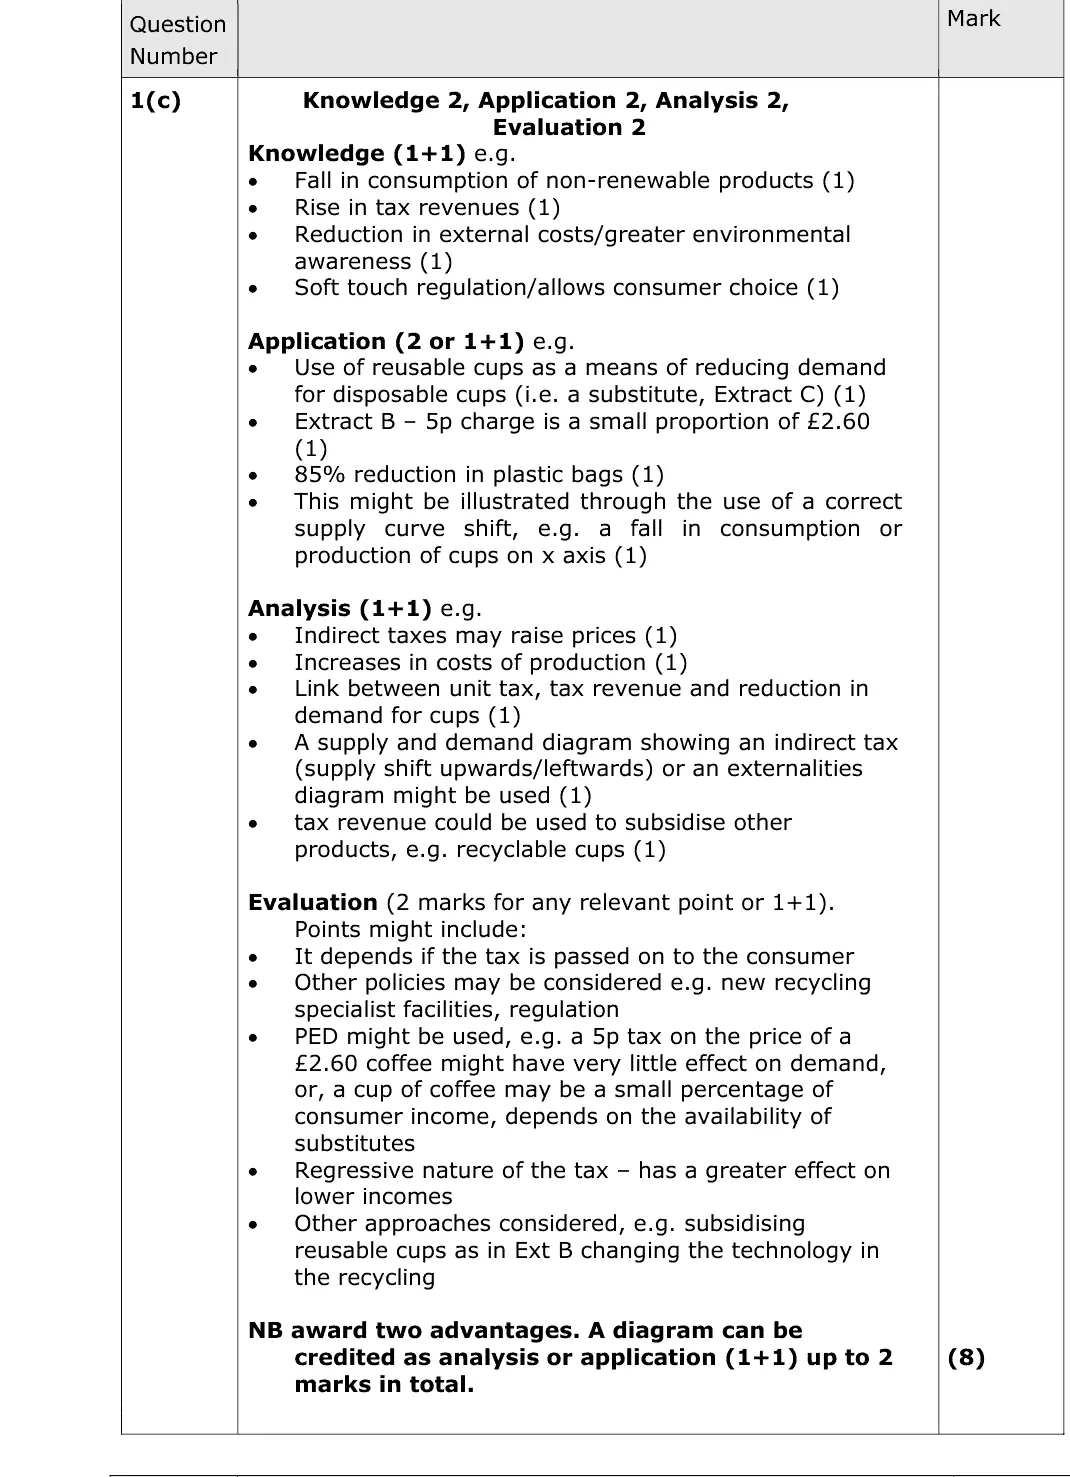
Good answers used the case study effectively to ensure they picked up two clear benefits or advantages, and two application marks (these could be awarded as 1+1 or 2), as well as drawing on the issues of the tax to score two evaluation marks (e.g. use of inelastic PED issue). However, there were many answers that gave far more evaluation than required for the two marks available, some devoting a whole side to alternatives to taxation or the disadvantages that might ensue because of the indirect tax. Many answers used diagrammatical analysis to aid their explanation, this was rewarded but not required to get full marks. Diagrams were often very useful and could earn up to two marks (as application or analysis, depending on which would score the highest mark for the answer overall) but many candidates showed an ad valorem tax despite it being a 5p or 10p charge as the point of discussion in Extract B. Showing a parallel shift in supply was the most effective approach in a tax diagram. It is important that answers relate to the question carefully and do not rely on stock answers about indirect taxation. Many candidates discussed the effects of the tax and not the advantages of using a tax, and some were more focused therefore on the price change or changes in welfare (producer/consumer surplus) losing sight of the request for advantages. Several candidates said there would be a fall in demand – often even so far as to draw an inward shift in demand – which could not in itself be seen as an advantage nor even in this latter case, valid economics. Answers need to focus on the question asked, many answers did not clearly identify two advantages of using tax to reduce disposable cup usage, as in this example – beyond repeating the point in the question in that the tax will reduce the use of disposable cups. Here there is good application and the analysis is clear, but the benefits are not identified. The evaluation based on elasticities is not a secure 2/2 (it is not referring to the price element of PED) but does gain this mark. 4/6 KAA. 2/2 eval. = 6/8 marks. Focus on the key word in the question – advantages. Many candidates tried to use externalities diagrams but faced issues with the fact that negative externalities in consumption is not required for this specification in diagrammatic form. Such an approach tended to lead to confusion and was rarely fruitful, and it is advised that candidates try not to learn diagrams that are specifically not required for this exam. There are many points to raise in this answer: definitions are not required (indirect tax) but they can help the candidate focus on the question. reducing the use of cups is in the question and is not therefore a benefit, but the answer is awarded for 'internalising the externality' – a clear benefit in this context. the diagram does not show the effect of the tax, and a shift would be an effective way to pick up a second diagram mark. However it does illustrate the social optimum issue and is therefore awarded (deadweight welfare loss area). The diagram shows production externalities but the discussion is not explicitly about production. However there is an oblique reference to contraction of demand so credit is given here. There is enough here to score full marks. There were several other diagrammatic approaches that were valid, such as negative externalities in production as shown here, and indeed a diagram was not needed at all to gain full marks although it can be an efficient way to score two marks.
Notes from the mark scheme and report
give two advantages of the tax (internalising the externality, tax revenue, consumer choice), not its effects or 'it reduces cup use' (in the question)
a 5p charge is a specific tax so shift supply parallel, not ad valorem
evaluate with inelastic PED (5p on a £2.60 coffee)
June 2017 · AS Paper 1 · Q4(b)1 markMultiple choice
Data and extracts for question 4
Answer
D
Mark scheme
Notes from the mark scheme and report
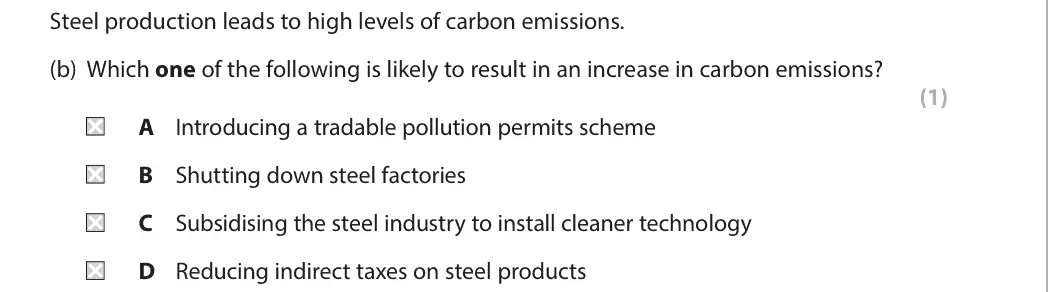
lower indirect taxes cut the price of steel products, raising consumption and output and so carbon emissions (D)
permits, closing steel plants and subsidies for clean technology all reduce emissions
June 2017 · AS Paper 1 · Q5(a)3 marksAO1=1, AO2=1, AO3=1Short answer
Data and extracts for question 5
Mark scheme
Examiner's comment
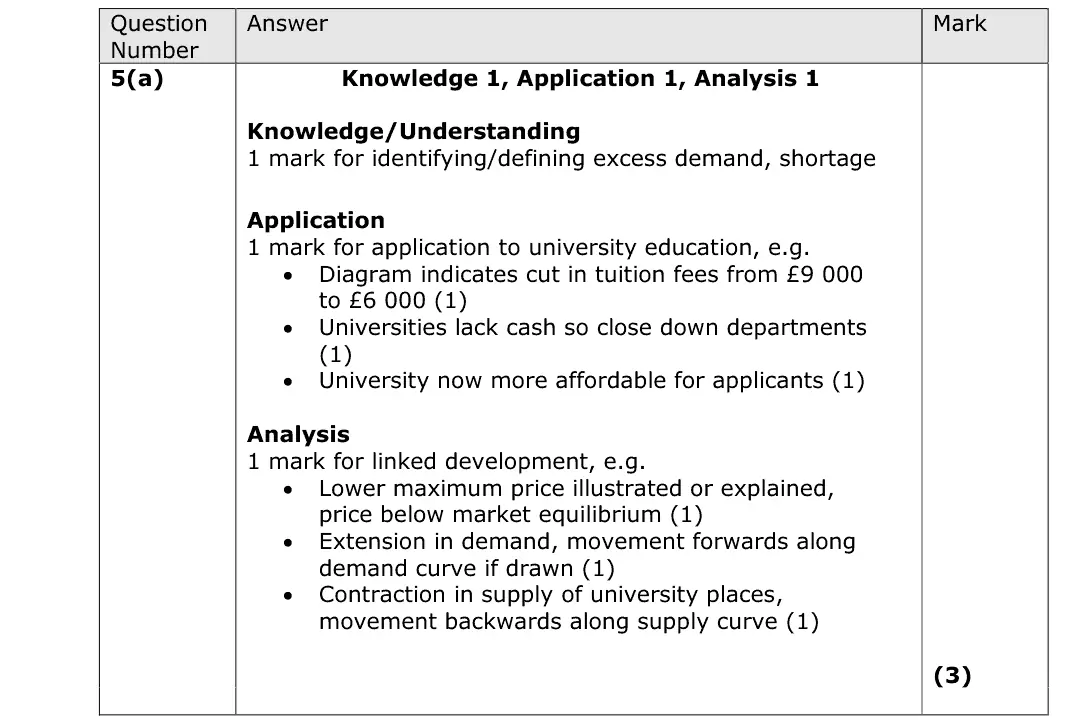
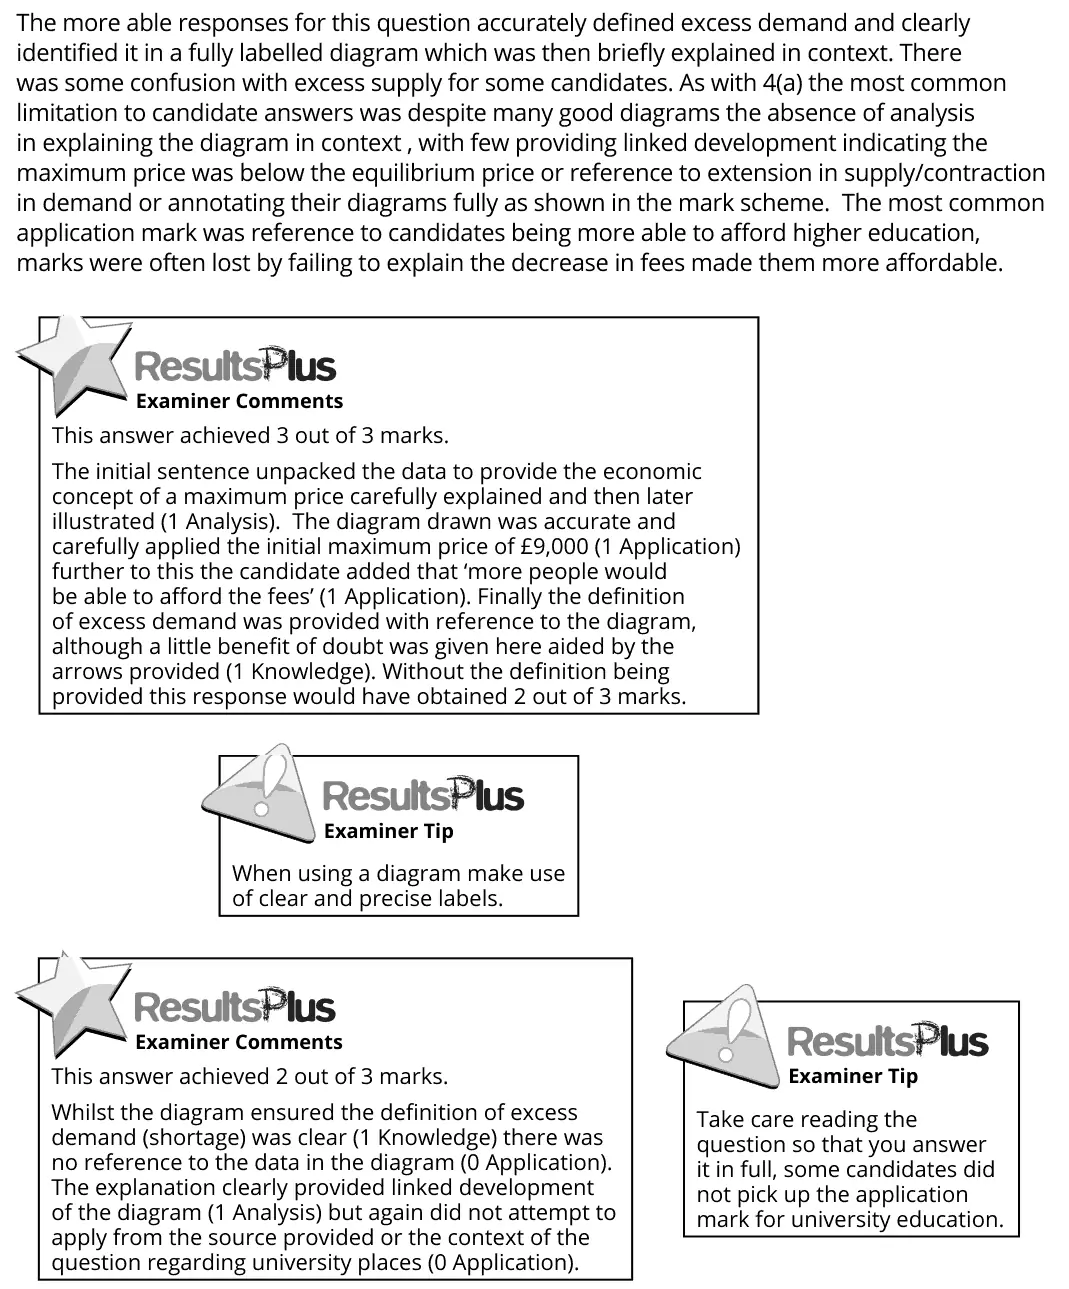
The more able responses for this question accurately defined excess demand and clearly identified it in a fully labelled diagram which was then briefly explained in context. There was some confusion with excess supply for some candidates. As with 4(a) the most common limitation to candidate answers was despite many good diagrams the absence of analysis in explaining the diagram in context , with few providing linked development indicating the maximum price was below the equilibrium price or reference to extension in supply/contraction in demand or annotating their diagrams fully as shown in the mark scheme. The most common application mark was reference to candidates being more able to afford higher education, marks were often lost by failing to explain the decrease in fees made them more affordable. This answer achieved 3 out of 3 marks. The initial sentence unpacked the data to provide the economic concept of a maximum price carefully explained and then later illustrated (1 Analysis). The diagram drawn was accurate and carefully applied the initial maximum price of £9,000 (1 Application) further to this the candidate added that ‘more people would be able to afford the fees’ (1 Application). Finally the definition of excess demand was provided with reference to the diagram, although a little benefit of doubt was given here aided by the arrows provided (1 Knowledge). Without the definition being provided this response would have obtained 2 out of 3 marks. When using a diagram make use of clear and precise labels. This answer achieved 2 out of 3 marks. Whilst the diagram ensured the definition of excess demand (shortage) was clear (1 Knowledge) there was no reference to the data in the diagram (0 Application). The explanation clearly provided linked development of the diagram (1 Analysis) but again did not attempt to apply from the source provided or the context of the question regarding university places (0 Application). Take care reading the question so that you answer it in full, some candidates did not pick up the application mark for university education.
Notes from the mark scheme and report
the fee cap is a maximum price set below equilibrium: demand extends (more affordable at £6 000) while supply of places contracts, giving a shortage
define excess demand
most common loss was the analysis mark
June 2017 · AS Paper 1 · Q6(g)20 marksAO1=4, AO2=4, AO3=6, AO4=620-mark essayEither/or
Data and extracts for question 6
Mark scheme, including the levels grid and indicative content
Examiner's comment
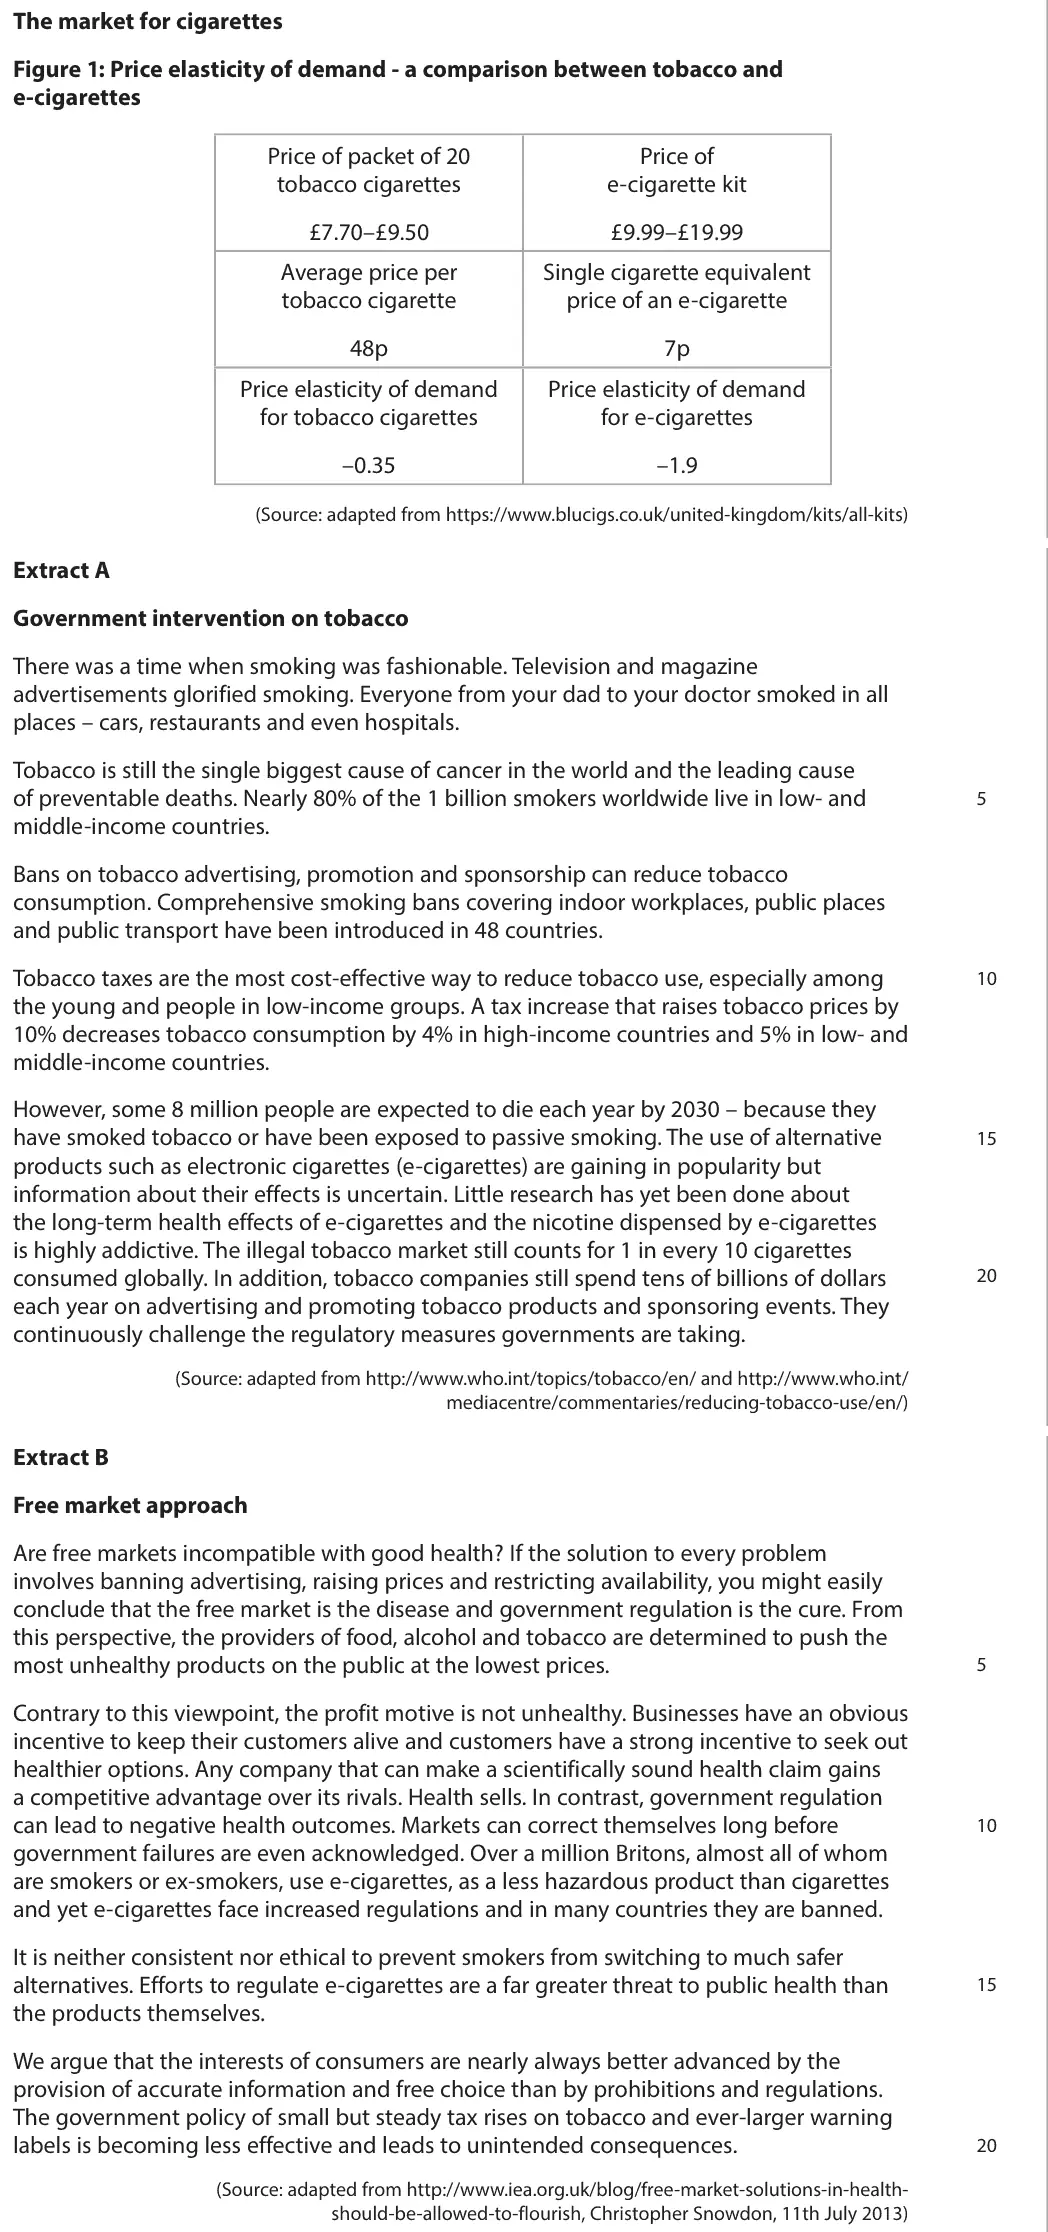
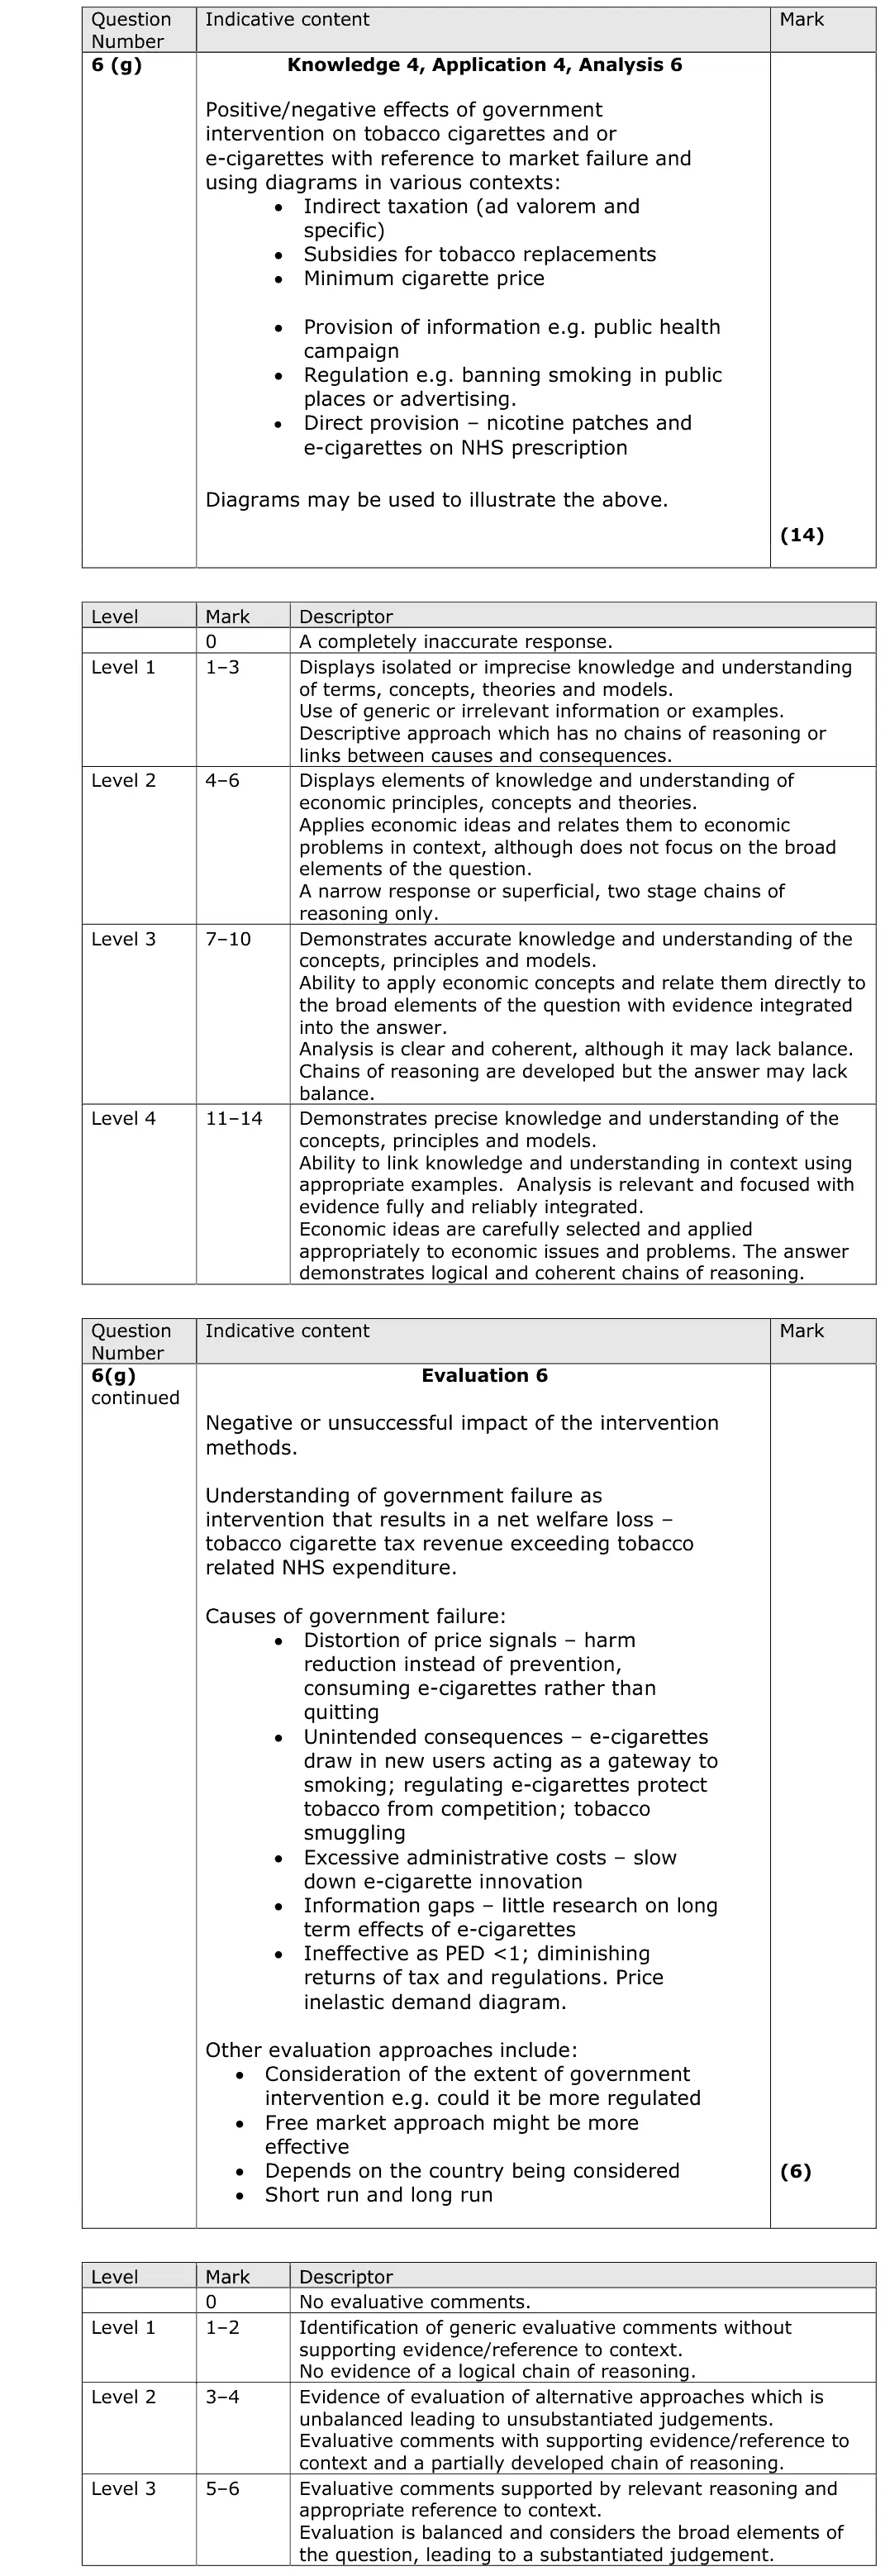
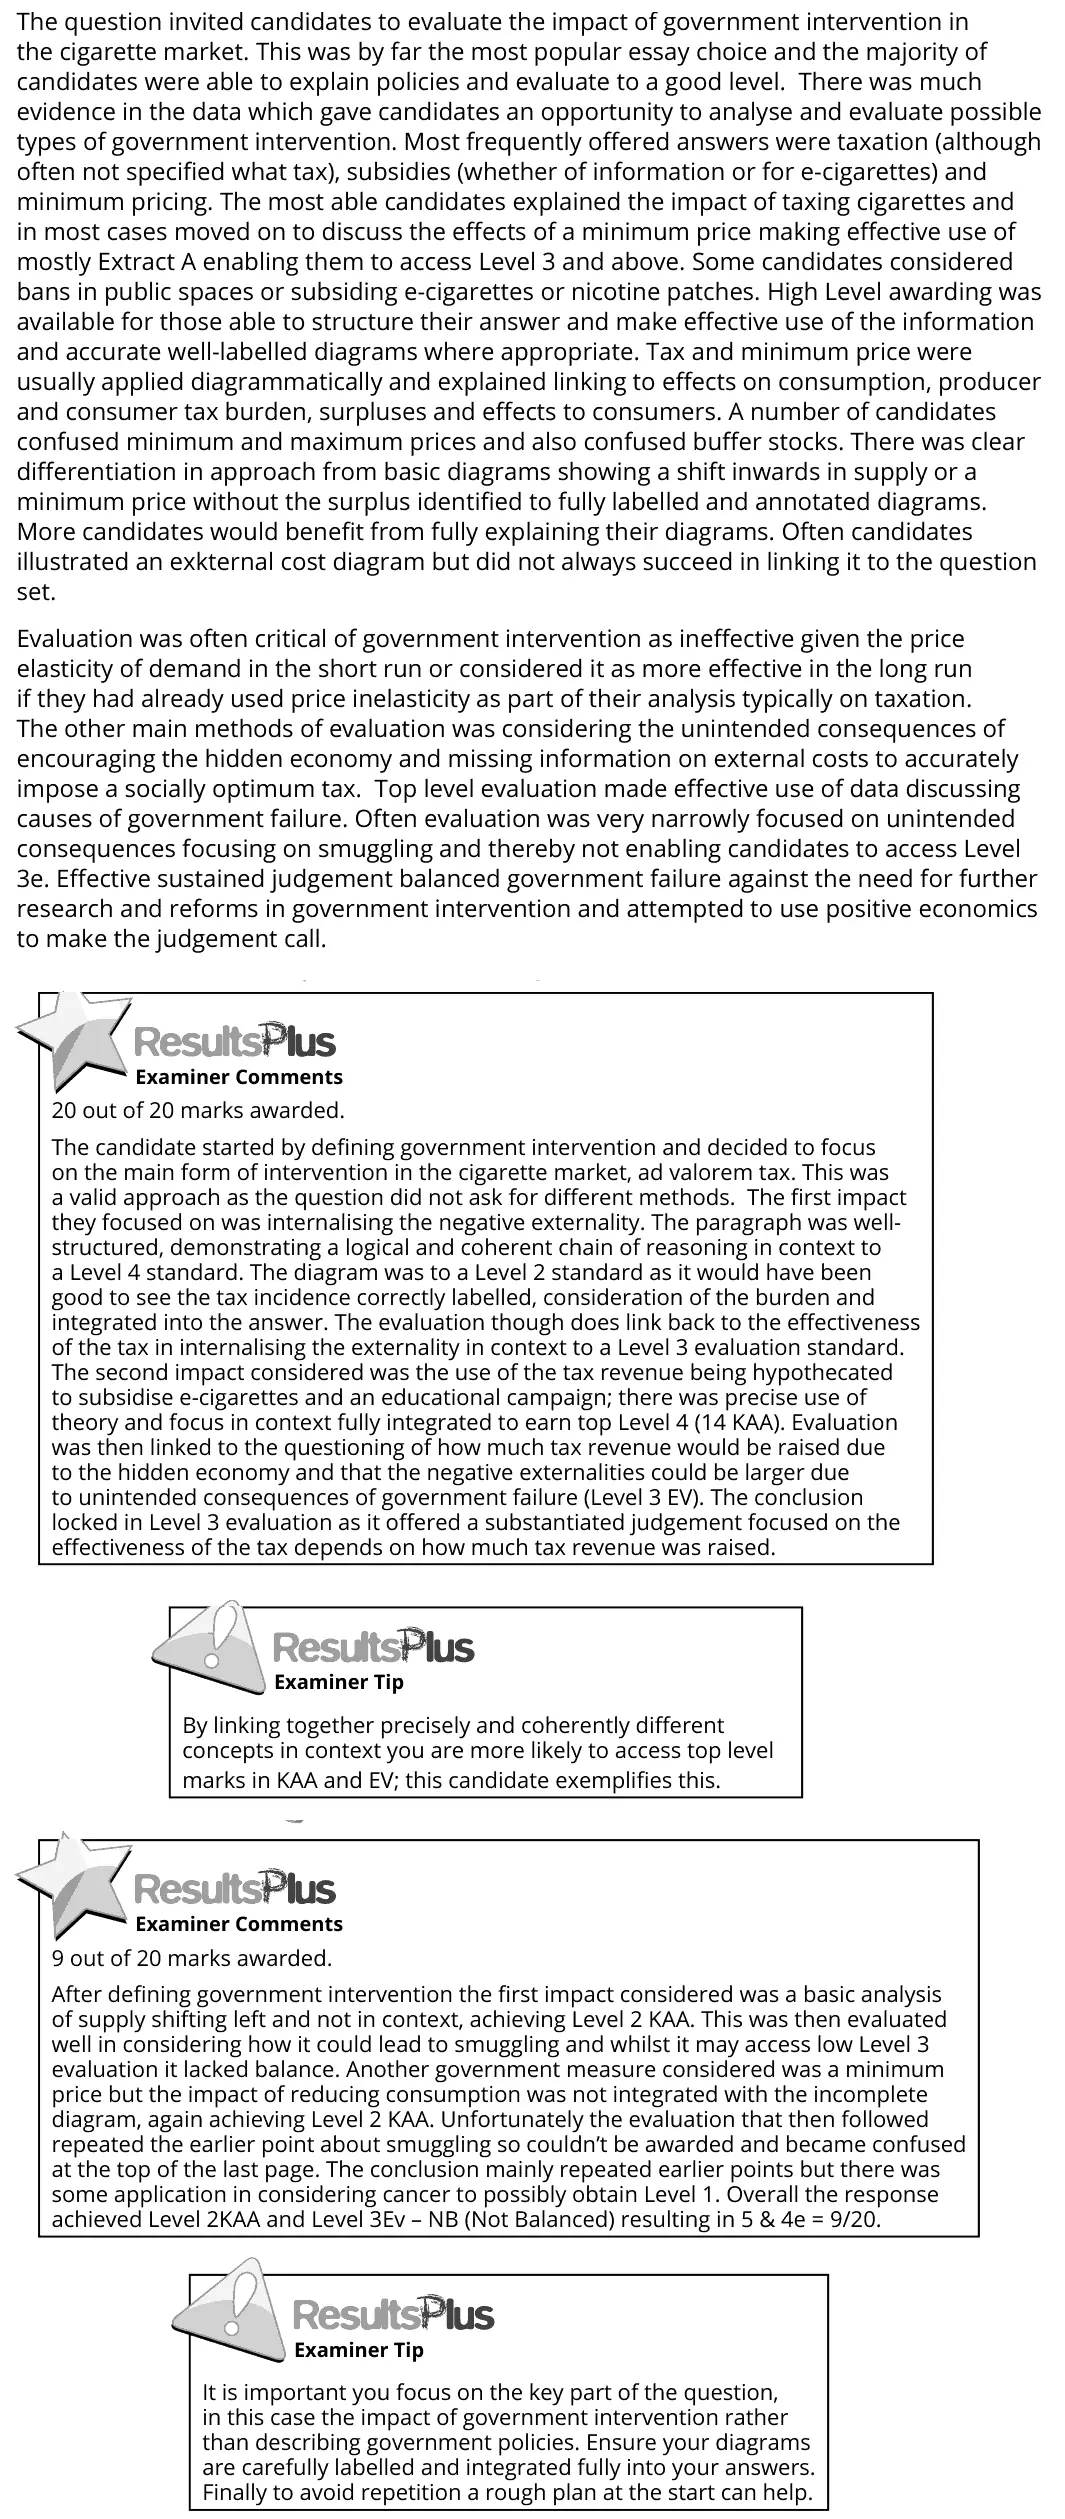
The question invited candidates to evaluate the impact of government intervention in the cigarette market. This was by far the most popular essay choice and the majority of candidates were able to explain policies and evaluate to a good level. There was much evidence in the data which gave candidates an opportunity to analyse and evaluate possible types of government intervention. Most frequently offered answers were taxation (although often not specified what tax), subsidies (whether of information or for e-cigarettes) and minimum pricing. The most able candidates explained the impact of taxing cigarettes and in most cases moved on to discuss the effects of a minimum price making effective use of mostly Extract A enabling them to access Level 3 and above. Some candidates considered bans in public spaces or subsiding e-cigarettes or nicotine patches. High Level awarding was available for those able to structure their answer and make effective use of the information and accurate well-labelled diagrams where appropriate. Tax and minimum price were usually applied diagrammatically and explained linking to effects on consumption, producer and consumer tax burden, surpluses and effects to consumers. A number of candidates confused minimum and maximum prices and also confused buffer stocks. There was clear differentiation in approach from basic diagrams showing a shift inwards in supply or a minimum price without the surplus identified to fully labelled and annotated diagrams. More candidates would benefit from fully explaining their diagrams. Often candidates illustrated an exkternal cost diagram but did not always succeed in linking it to the question set. Evaluation was often critical of government intervention as ineffective given the price elasticity of demand in the short run or considered it as more effective in the long run if they had already used price inelasticity as part of their analysis typically on taxation. The other main methods of evaluation was considering the unintended consequences of encouraging the hidden economy and missing information on external costs to accurately impose a socially optimum tax. Top level evaluation made effective use of data discussing causes of government failure. Often evaluation was very narrowly focused on unintended consequences focusing on smuggling and thereby not enabling candidates to access Level 3e. Effective sustained judgement balanced government failure against the need for further research and reforms in government intervention and attempted to use positive economics to make the judgement call. 20 out of 20 marks awarded. The candidate started by defining government intervention and decided to focus on the main form of intervention in the cigarette market, ad valorem tax. This was a valid approach as the question did not ask for different methods. The first impact they focused on was internalising the negative externality. The paragraph was well- structured, demonstrating a logical and coherent chain of reasoning in context to a Level 4 standard. The diagram was to a Level 2 standard as it would have been good to see the tax incidence correctly labelled, consideration of the burden and integrated into the answer. The evaluation though does link back to the effectiveness of the tax in internalising the externality in context to a Level 3 evaluation standard. The second impact considered was the use of the tax revenue being hypothecated to subsidise e-cigarettes and an educational campaign; there was precise use of theory and focus in context fully integrated to earn top Level 4 (14 KAA). Evaluation was then linked to the questioning of how much tax revenue would be raised due to the hidden economy and that the negative externalities could be larger due to unintended consequences of government failure (Level 3 EV). The conclusion locked in Level 3 evaluation as it offered a substantiated judgement focused on the effectiveness of the tax depends on how much tax revenue was raised. By linking together precisely and coherently different concepts in context you are more likely to access top level marks in KAA and EV; this candidate exemplifies this. 9 out of 20 marks awarded. After defining government intervention the first impact considered was a basic analysis of supply shifting left and not in context, achieving Level 2 KAA. This was then evaluated well in considering how it could lead to smuggling and whilst it may access low Level 3 evaluation it lacked balance. Another government measure considered was a minimum price but the impact of reducing consumption was not integrated with the incomplete diagram, again achieving Level 2 KAA. Unfortunately the evaluation that then followed repeated the earlier point about smuggling so couldn’t be awarded and became confused at the top of the last page. The conclusion mainly repeated earlier points but there was some application in considering cancer to possibly obtain Level 1. Overall the response achieved Level 2KAA and Level 3Ev – NB (Not Balanced) resulting in 5 & 4e = 9/20. It is important you focus on the key part of the question, in this case the impact of government intervention rather than describing government policies. Ensure your diagrams are carefully labelled and integrated fully into your answers. Finally to avoid repetition a rough plan at the start can help.
Notes from the mark scheme and report
indirect tax, minimum price, subsidised substitutes, information, regulation and bans with diagrams linked to the negative externality
evaluate with inelastic demand (PED below 1), smuggling, information gaps on e-cigarettes, government failure
some confused minimum and maximum prices
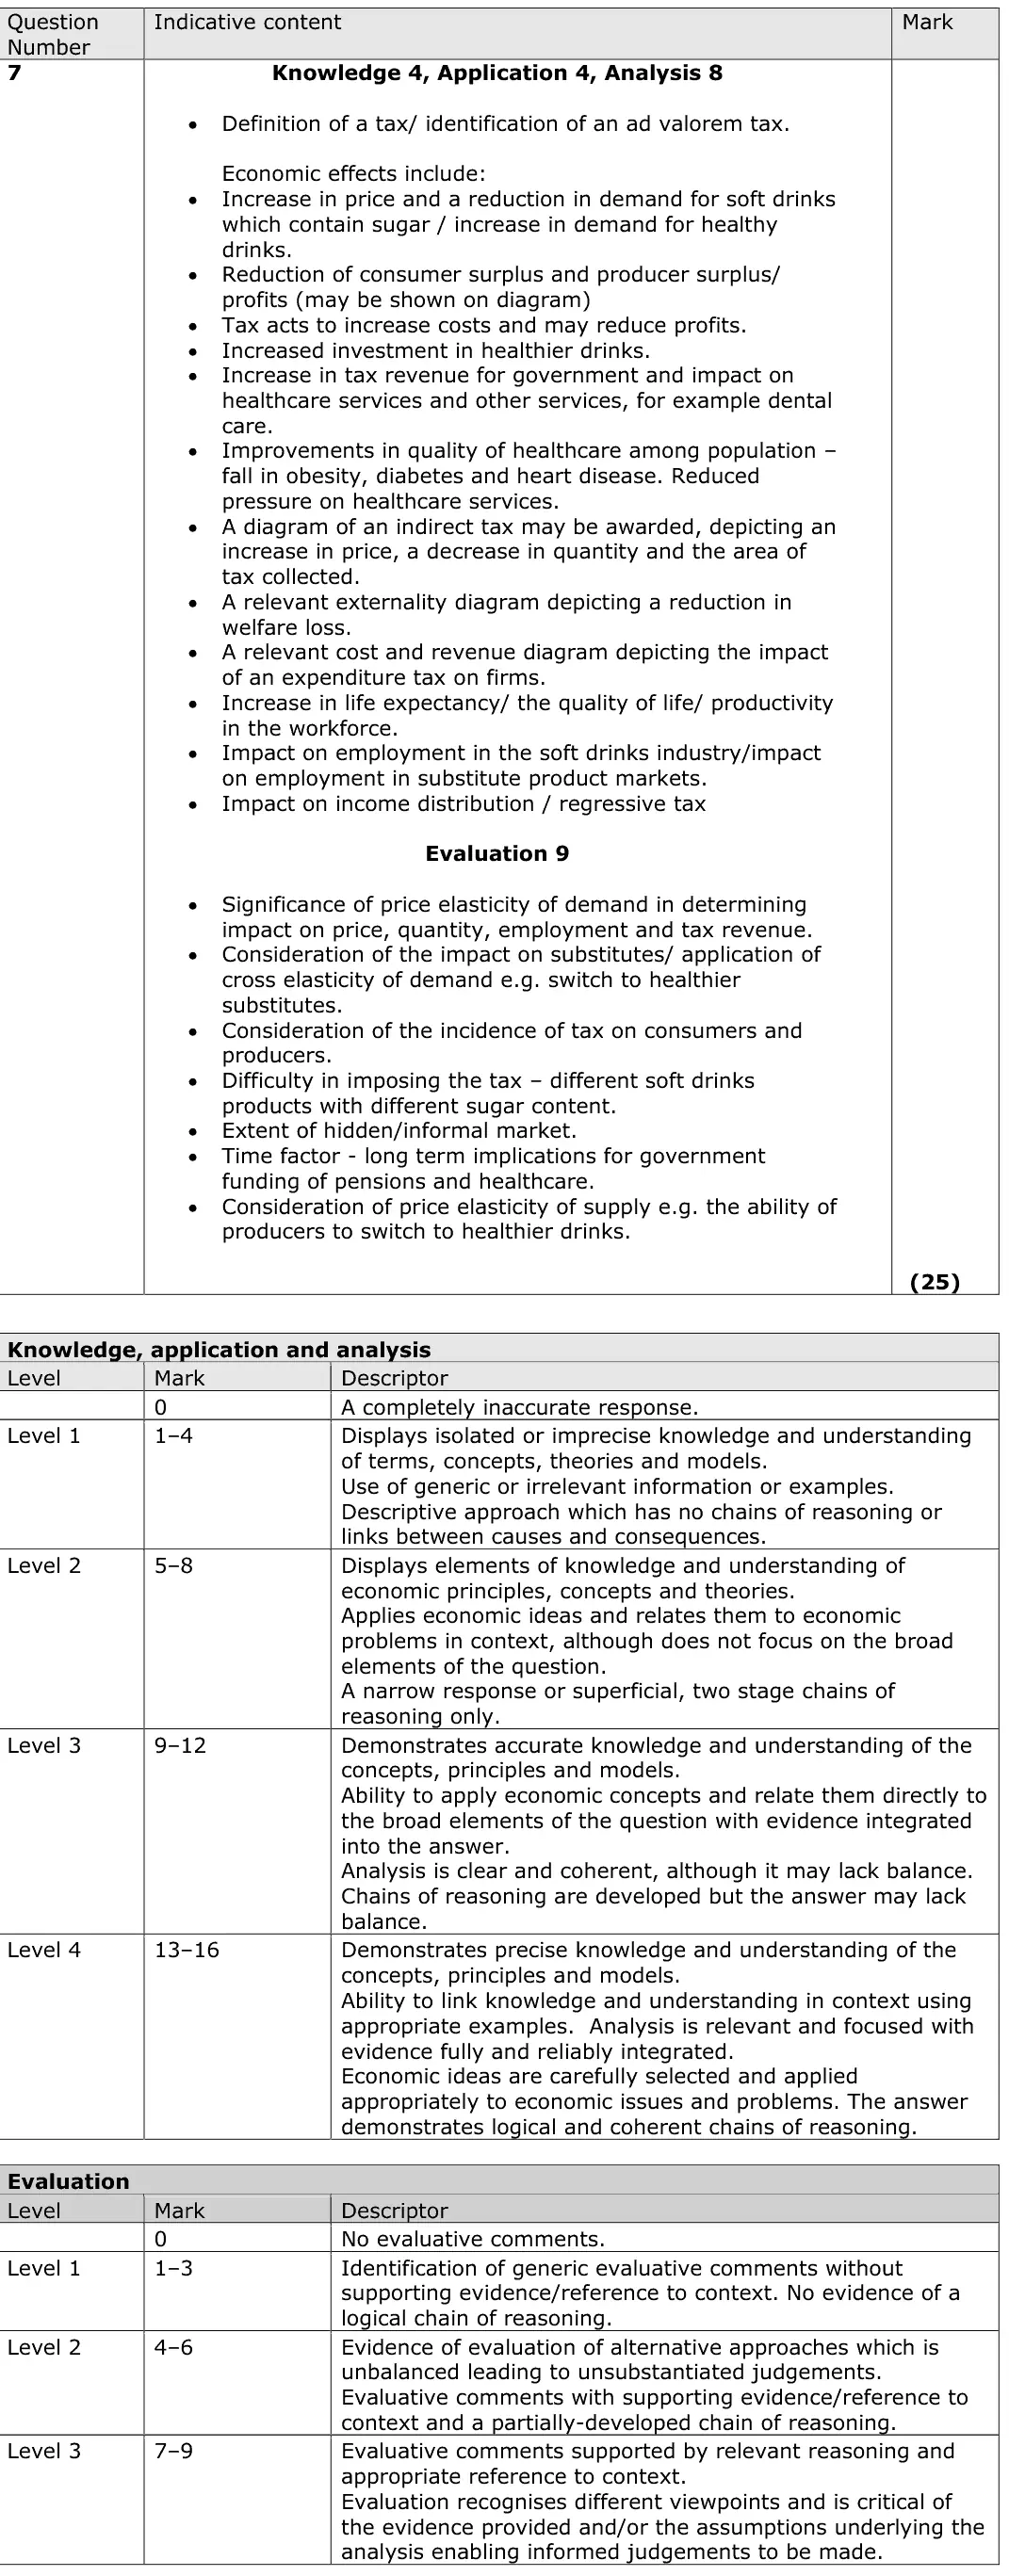
June 2017 · Paper 1 · Q725 marksAO1=4, AO2=4, AO3=8, AO4=925-mark essayEither/or
Mark scheme, including the levels grid and indicative content
Examiner's comment
Responses generally focused on a number of relevant microeconomic issues effectively and broke down the various impacts on different agents to provide effective analysis of a range of microeconomic effects. High scoring responses were well structured and at times provided clear evidence of planning. They made effective use of Theme 1 and Theme 3 theory, going beyond the mostly Theme 1 theory of lower scoring candidates. Diagrammatic analysis is not required but when done well was accurate, well labelled and well explained with a solid chain of reasoning. Candidates at the top end used supply and demand diagrams to consider the tax burden or welfare effects and many candidates used theory of the firm diagrams eloquently to explore the cost and revenue implications. In addition candidates who recognised a negative consumption externality and were able to provide a correct diagram provided well developed responses. This answer achieves a mark of 22/25. Whilst still marked as a level based response the analysis marks are much more heavily weighted in the essays compared to other questions. The candidates diagram is to a Level 3+ standard with the shift in tax being ‘ad valorem’ and careful labelling which is then integrated in context to achieve Level 4. The welfare analysis of the tax revenue raised is also impressive. They have also included a number of good evaluative points, including unintended consequences, for example. Overall this answer secures Level 4 KAA (15 marks) and Level 3 evaluation (7 marks). To achieve Level 4 analysis candidates need to offer a depth of thinking which is best secured with two, or three, major points rather than attempting to do so through a wide range of points. This answer achieves a mark of 14/25. In this answer the candidate has used a diagram but it has basic analysis to a Level 2 standard in the written explanation and the evaluation is limited to considering the rice elasticity of demand (Level 2e). The effect of the tax on internalising the external cost, with a benefit of doubt given on deforestation, just secures Level 3 but the evaluation here referring to unintended consequences lacks balance (Level 1e). Overall therefore this answer is a low level 2 for KAA (9 marks) and a mid level 2 for evaluation (5e). Remember if you are going to use a diagram try to ensure it is fully labelled and used in context. Evaluation also needs to be well balanced to offer an alternative viewpoint to the one already made.
Notes from the mark scheme and report
ad valorem tax shifts supply by a widening gap
incidence depends on PED
loss of consumer and producer surplus
internalises the external cost of sugary drinks
effects on firms' costs and profits (Theme 3 diagrams)
evaluate with inelastic demand, regressive effect, substitutes and unintended consequences
two or three developed points beat a wide list
June 2016 · AS Paper 1 · Q2(b)1 markMultiple choice
Answer
B
Mark scheme
Notes from the mark scheme and report
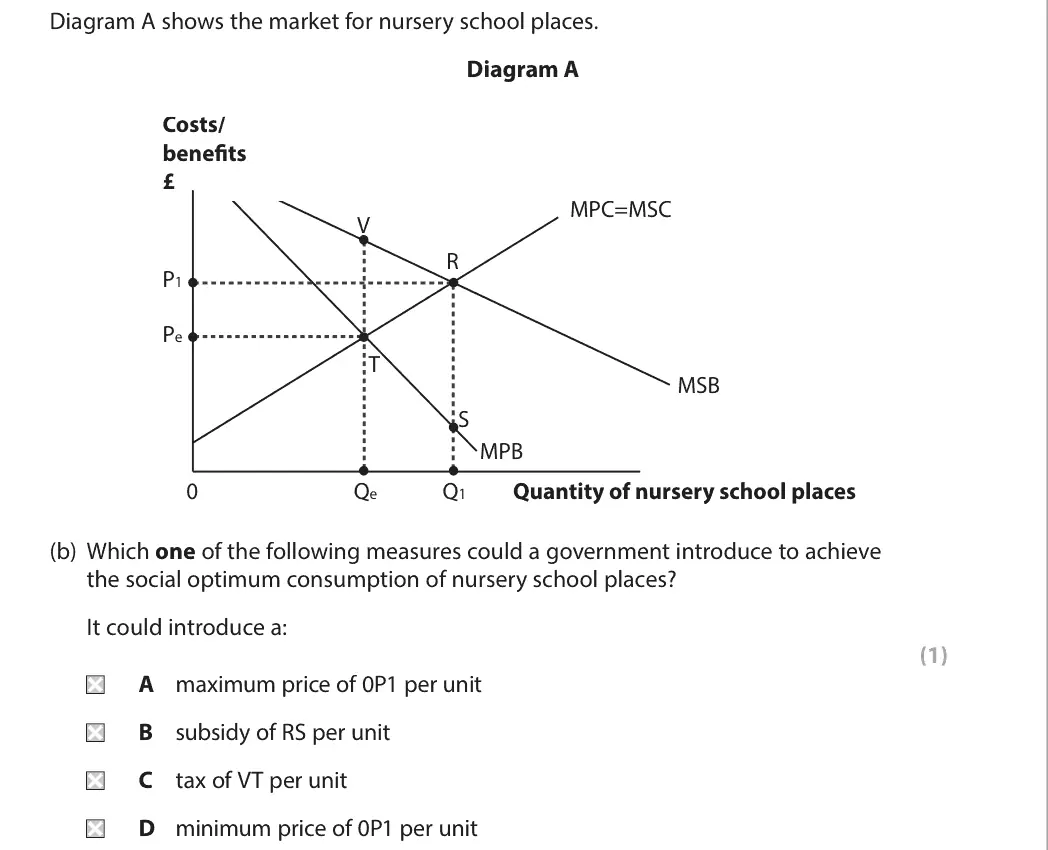
a subsidy of RS per unit (the vertical gap between MSB and MPB at the optimum) shifts MPC down to reach Q1 (B)
a tax of VT would reduce consumption
maximum and minimum prices at 0P1 do not reach the optimum
Quantitative skills: QS 4 (construct and interpret a range of standard graphical forms)
June 2016 · AS Paper 1 · Q3(b)3 marksAO1=1, AO2=2Short answer
Data and extracts for question 3
Mark scheme
Examiner's comment
The most common measures identified were a tax on water or water consumers with candidates explaining or making use of a diagram to indicate the reduction in water extraction. Answers that used as a measure a tax on the flower industry sometimes struggled to pick up the second application mark identifying resulting reduction in water extraction. Alternative measures were well applied including: regulation, subsiding alternative provision or efficiency measures and use of pollution permits (sometimes identified a tradable). Many answers were a little on the long side, candidates do not have to use all the lined space available; rather than it being there for guidance it is more to avoid the need for additional paper or to enable the ability to make use of a suitable diagram. This answer achieved 3 out of 3 marks. A clear, concise and well-structured answer is provided. The candidate immediately identifies the measure (1 mark for knowledge) then applies their theoretical understanding in context, carefully identifying how the measure reduces water consumption and thereby answering the question (1+1 marks for application). Note a maximum of two marks for application is available. Take care reading the question so that you answer it in full, some candidates did not pick up the last application mark for identifying the reduction in water consumption or reduced quantity of water consumed. This answer also achieved 3 out of 3 marks. The answer provides a valid measure, permits, developing the response with a logical chain of reasoning suitable for the essay based questions; applying theory in context to a high standard. Some candidates will easily be able to write substantial responses inside the time constraints but there was some evidence of too much time being spent on 3 mark responses despite the guidance provided. A minority used a suitable diagram which along with a clear identification of the measure, tax on water consumption, and fall in quantity of water consumed would have quickly achieved full marks.
Notes from the mark scheme and report
one measure (tax on water extraction, regulation, tradable permits, subsidy for water efficiency) then explain how it reduces water extraction from the lake
a tax on the flower industry must still be linked to less water taken
keep it concise
June 2016 · AS Paper 1 · Q6(f)20 marksAO1=4, AO2=4, AO3=6, AO4=620-mark essayEither/or
Data and extracts for question 6
Mark scheme, including the levels grid and indicative content
Examiner's comment
The question required candidates to evaluate the likely microeconomic effects of government intervention in the UK housing market. Candidates were expected to draw on their own knowledge of the housing market, a significant market in the UK, or make use of the data to access the top level responses. The main methods of government intervention covered were usually subsidies (Help to Buy), regulating mortgage providers, regulating landlords, direct government provision (building homes) or rent controls. Top Level 4 or 3 responses provided an in depth coverage of the microeconomic effects, this was possible to achieve with one type of government intervention but was usually undertaken by looking at two or three separate measures and evaluating them in depth in turn. Level 4 answers often drew, in a sophisticated manner, from the broad Theme 1 specification to provide logical chains of reasoning. A key differentiator was the quality of knowledge and understanding of micro- economic effects often making effective use of a diagram and carefully applied through logical and clear chains of reasoning. Level 2 answers tended to use a basic and generic supply and demand diagram focusing on one effect such as price; thus not being able to address the broad elements of the question and offer balance. Evaluation took various forms, with many candidates considering the unintended consequence of fuelling a housing boom affecting affordability and inequality. Alternative common evaluative points considered shortages of affordable rented property after carefully analysing the implementation of the scheme and who it would benefit. Where the former was missing this was often seen as analysis offering a negative effect of government intervention. The effectiveness of the government interventions was another popular issue raised with careful consideration of the data and other more significant factors resulting in the awarding of L3ev rather than a thin L1ev coverage of magnitude or opportunity cost. Best uses of substantiated judgement were sustained throughout in candidates’ responses as they made effective use of positive economics to make judgement calls answering the question by weighing up the significance of the effects as to what extent they were positive or negative. 16 out of 20 marks awarded. Two clear and carefully labelled diagrams provides a good start indicating a possible Level 3 or above response which is then confirmed as they are repeatedly used on the next page. To obtain Level 4 a more precise use of the diagrams with more integration would have been helpful. The candidate identifies the effect of Help to Buy as affordability and links this to utility and other effects, obtaining Level 3. They then move on to evaluate this by analysing the effect on demand and offering substantial judgement by indicating the significant increase due to price inelasticity of supply caused by 'government regulations like green belt'. This is worthy of Level 3 evaluation but needs another evaluative point to secure 6 marks and thus offer balance. The incentivised house builders is the next effect and the unemployment reference is allowed as a micro reference as they appear to be looking at the housing market (Level 3). The incentivised house builders is then well evaluated with a link to the disincentivised landlords (Level 3e). The time limit and opportunity cost evaluation is relevant but limited to Level 2 evaluation. Finally the candidate provides a conclusion which offers a clear substantiated judgement consolidating the time scale and opportunity cost issues (L3e). Overall they achieve Level 3+ KAA (10 marks) plus L3+ Ev (6marks) = 16/20. Be prepared to offer a suitable diagram even when not prompted by the question. The candidate is successful in applying two relevant diagrams to the context. To obtain Level 4 a more precise use of the diagrams making use of the labels with more integration to micro-effects, such home-owners consumer surplus or property developers’ revenue would have been helpful. There was an opportunity here to offer sophistication, linking the house builders as providing properties for sale or to rent which the candidate came close to. 12 out of 20 marks awarded. Producers benefiting from the subsidy on mortgage loans is well covered and in context (Level 3- KAA). This is then carefully evaluated using a data reference and theory (level 3 Ev). The candidate then moves on to considering the effect on consumers with a clear understanding and application but this is not evaluated (Level 3 KAA). Finally they consider the micro effect on government which is allowed since it is linked to rent (Level 2) and then well evaluated using theory (Level2 Ev). The opportunity cost evaluation then offered is well explained (Level 2Ev). The crowding out argument has potential but is not explained carefully enough to obtain Level 3 evaluation. Overall the candidate achieves a low Level 3 response for KAA (8 marks). They just escape two-stage chain reasoning but would benefit from a slightly wider use of the economic concepts. For evaluation they achieve Level 2 evaluation (4 Ev marks) as the Level 3 evaluation initially offered is not balanced with a similar attempt. In addition there is a lack of substantiated judgement. Offer at least two evaluative points with substantiated judgements on 20 mark base essay questions. This promising response is limited by having just one substantial piece of evaluation.
Notes from the mark scheme and report
micro effects of subsidies (Help to Buy), regulation, rent controls (maximum price) or direct provision on prices, rents, supply and welfare
one measure can suffice if effects are wide
evaluate with government failure, unintended consequences such as higher prices, opportunity cost
June 2016 · AS Paper 1 · Q6(g)20 marksAO1=4, AO2=4, AO3=6, AO4=620-mark essayEither/or
Data and extracts for question 6
Mark scheme, including the levels grid and indicative content
Examiner's comment
The question invited candidates to discuss the case for government provision of goods and services such as flood defence schemes or housing. In suggesting flood defence scheme or housing candidates could draw on the data available and their own knowledge but were also free to discuss the provision of other goods or services by government and a minority did so. There was much evidence in the data which gave candidates an opportunity to analyse and evaluate possible cases. As with 6(f) it proved to be another question which differentiated well between the quality of responses with the mean score being 10.70 from a total of 20 marks. . High Level awarding was available for those able to structure their answer and make effective use of the information. The most popular case was missing market associated with public goods and the associated free rider problem. Affordability and wider economic cases were made for intervening in the housing market. The most able responses evaluated effectively, in particular, by questioning the effectiveness of government intervention or the law of unintended consequences. Effective sustained judgement balanced government failure against market failure and attempted to use positive economics to make the judgement call. 18 out of 20 marks awarded. The candidate develops their first case on the under-provision and non-provision of goods and services if left to market forces. They use an accurate positive externality diagram, albeit missing a divergent MPB and MSB, to make the case for under provision and link it to the data provided. For public goods they again place in context and link to the wider benefits of government provision in this case. The second case is certainty for builders, as derived demand, encouraging them to invest. The third linked case is employment in the housing market linking back to the initial diagram. It would have been good to see more use of the diagram but there is precise use of theory and focus on context fully integrated here to earn top Level 4 (14 KAA). Evaluation was then separately addressed coming in the form of: the opportunity cost carefully explained (L2e); difficulty in measuring negative externalities (L2e+) which if they had linked back to the diagram may have obtained L3e and time lags (L2e). Since all evaluative comments are at Level 2 the candidate is awarded 4 evaluative marks not 6. Overall they achieved L4 KAA (14) and L2e (4) = 18/20. Some candidates do say they find it easier to complete their knowledge, analysis and application first and then move on to the evaluation. The risk with this is that the evaluation may lack the sufficient depth, application and sustained judgement that can be offered against each case made. For sustained judgement by immediately evaluating the evaluative comments they are able to weigh their arguments using positive economics. This is a sophisticated approach to developing a coherent argument. 6 out of 20 marks awarded. The candidate considers public goods by defining the concept on the first page and using the data but does not clearly make the case for government provision thus achieving a low Level 2 for knowledge, analysis and application (L2-KAA = 4). They then go onto identify a problem with public goods and seem to link it to the government provision but the response could do with further development (Level 1 evaluation = 2e). Overall they achieve L2-Kaa (4 marks) pus Level 1 evaluation (2 ev) = 6/20. It is essential in using theory and data to ensure you are directly answering the question and inking evaluation back to the question.
Notes from the mark scheme and report
flood defences are public goods (non-rival, non-excludable, free rider)
housing case via externalities and information gaps
evaluate with government failure, opportunity cost, non-beneficiaries pay
report mean 10.70 out of 20
Work with an Edexcel economics tutor
Essays stuck in Level 2, or losing the easy marks in Section A? Book a trial session with Lianne, a former Edexcel examiner.