Notes and key-term cards for this topic are being written by our tutors. The past-paper questions below are ready now.
Specification statements
1.2.9Indirect taxes and subsidies: a) Supply and demand analysis, elasticities, and: • the impact of indirect taxes on consumers, producers and government • the incidence of indirect taxes on consumers and producers • the impact of subsidies on consumers, producers and government • the area that represents the producer subsidy and consumer subsidyAS
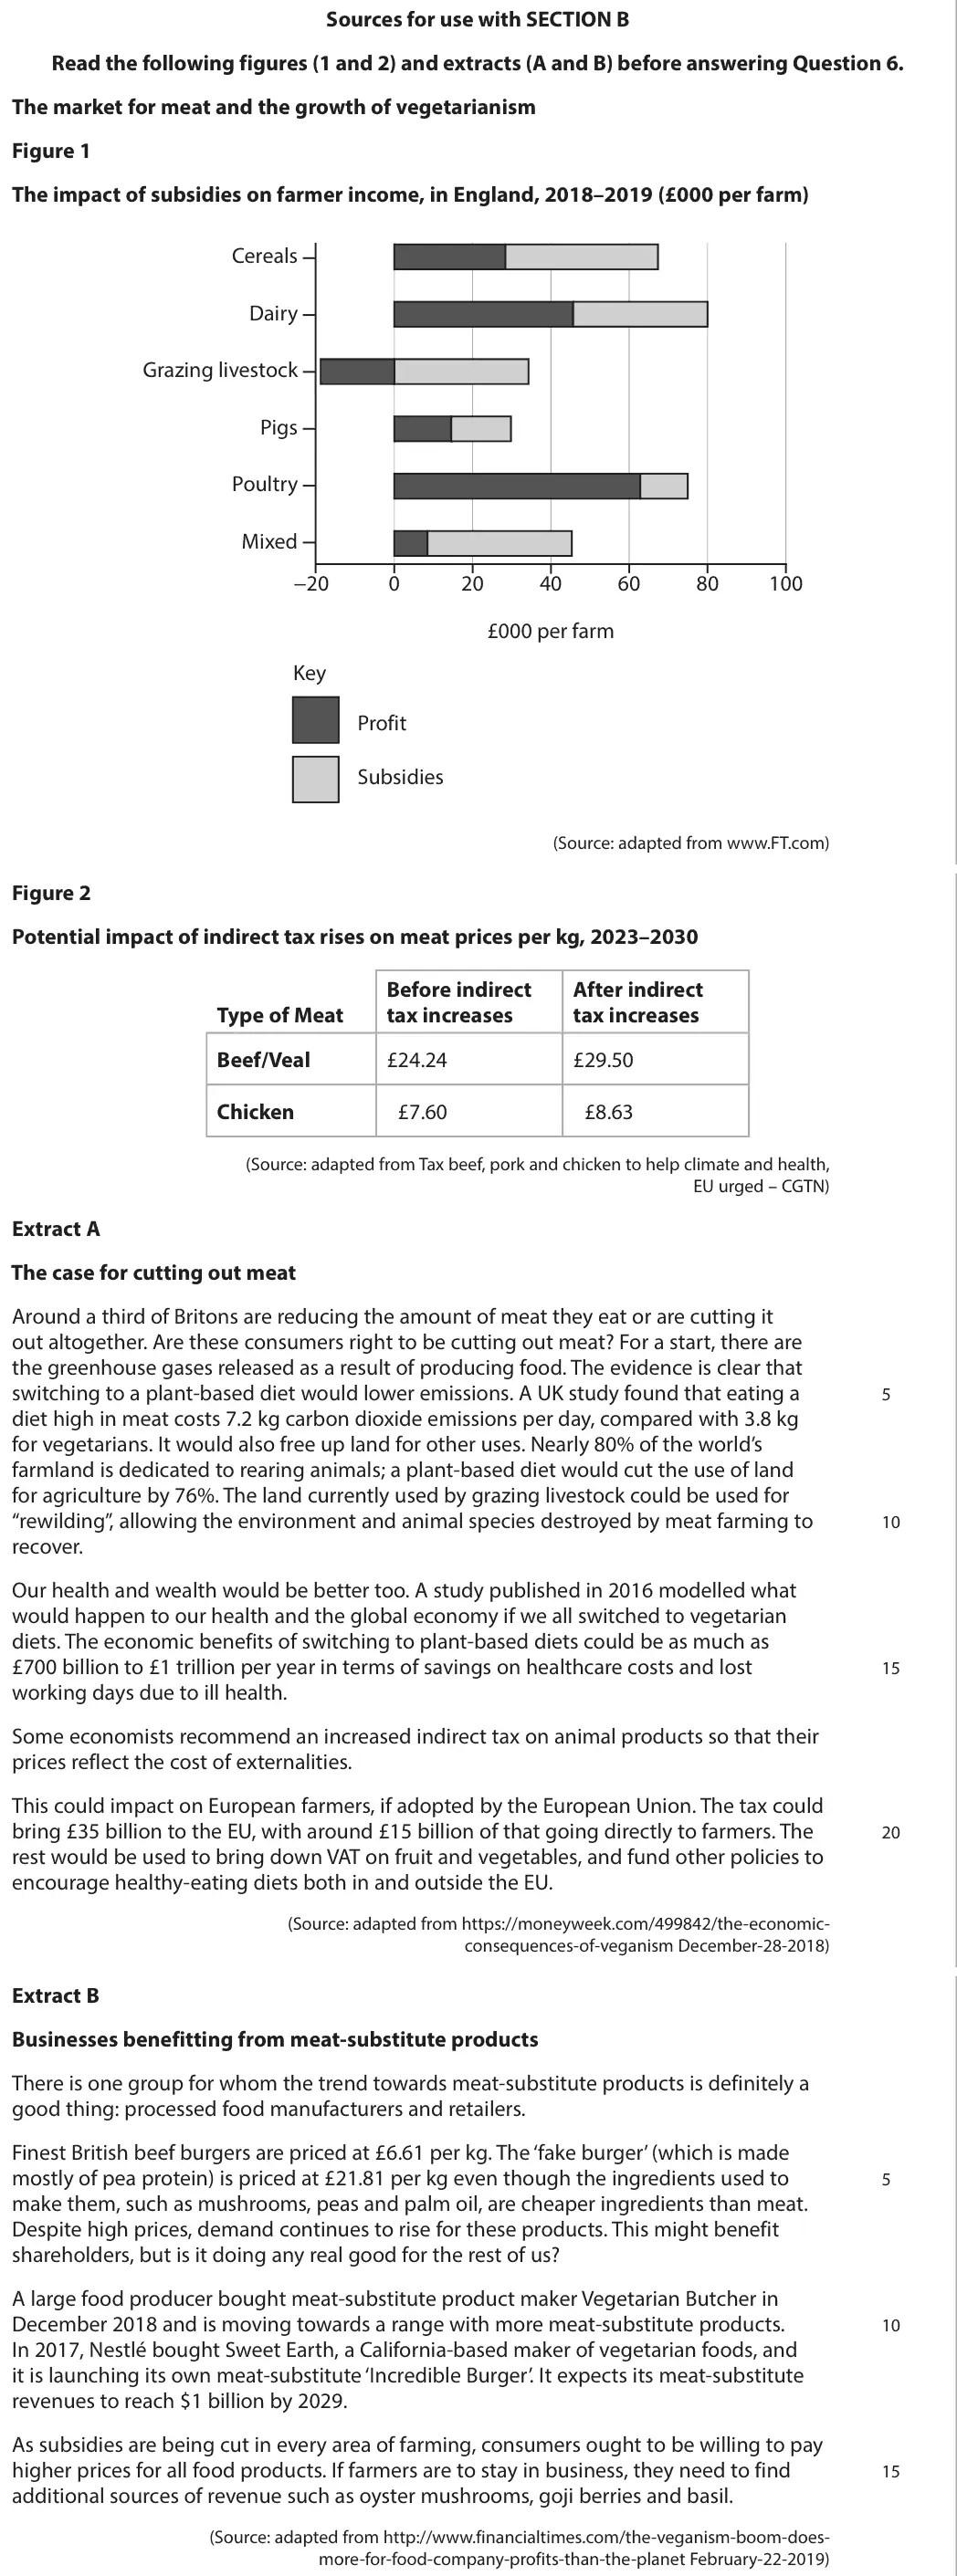
Evaluate the likely microeconomic effects of a reduction in subsidies to farmers of animal products (Figure 1 and Extract B, line 14). Use a relevant diagram to support your answer.
Evaluate the likely microeconomic effects of an increase in indirect tax on animal products (Figure 2 and Extract A, line 17). Use a relevant diagram to support your answer.
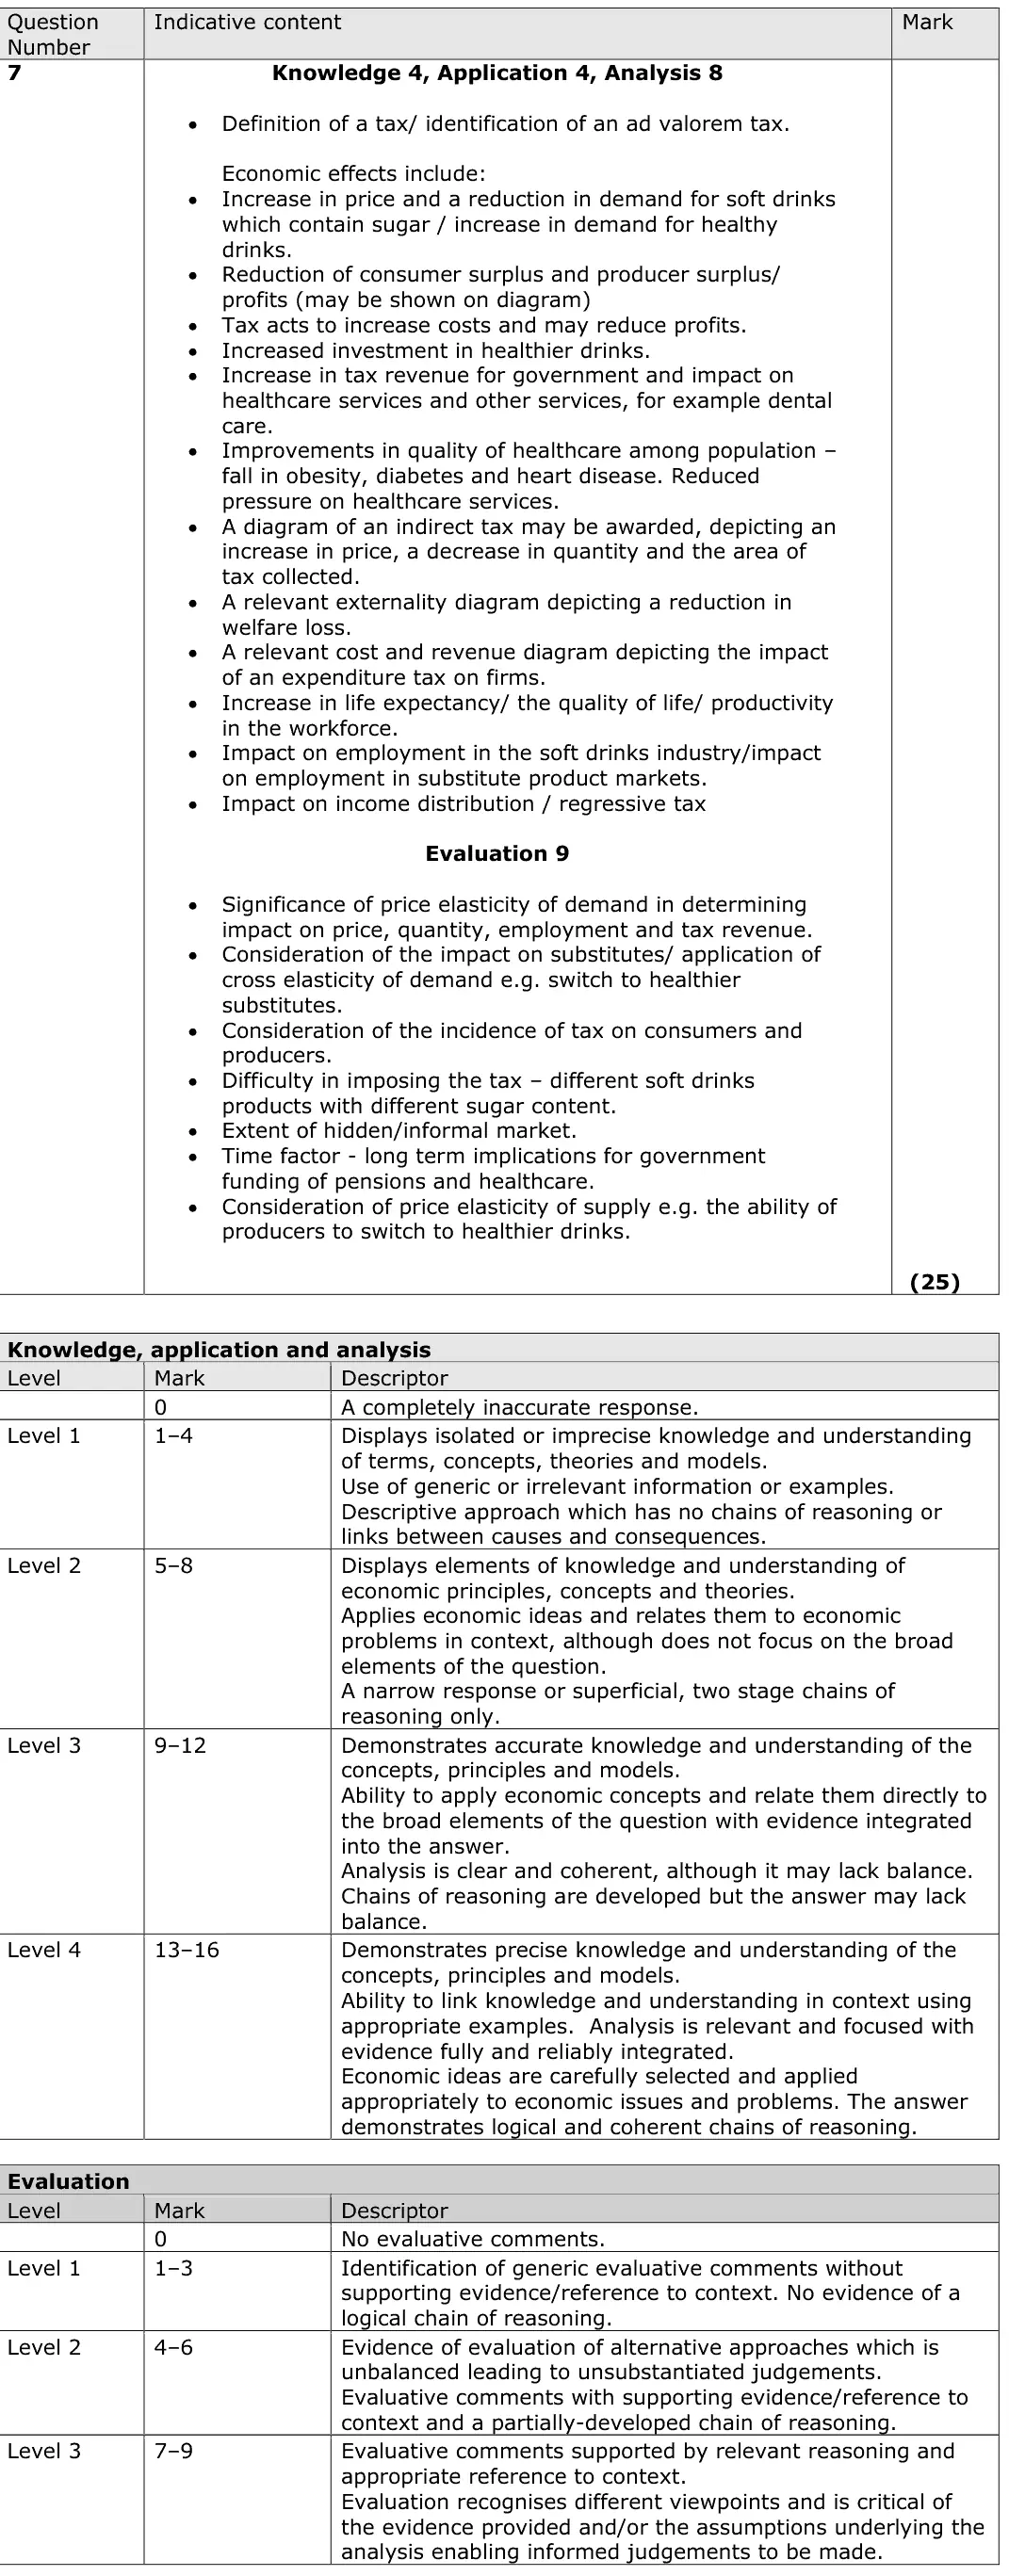
In 2015 a report by Public Health England recommended the imposition of a 20% tax on the sale of soft drinks that contain high levels of sugar. Evaluate the likely microeconomic effects of such a tax.
Tap a question to zoom it. The data and extracts fold out above each question; the mark scheme and examiner's comment open underneath.
June 2025 · AS Paper 1 · Q6(f)20 marksAO1=4, AO2=4, AO3=6, AO4=620-mark essayEither/orHard
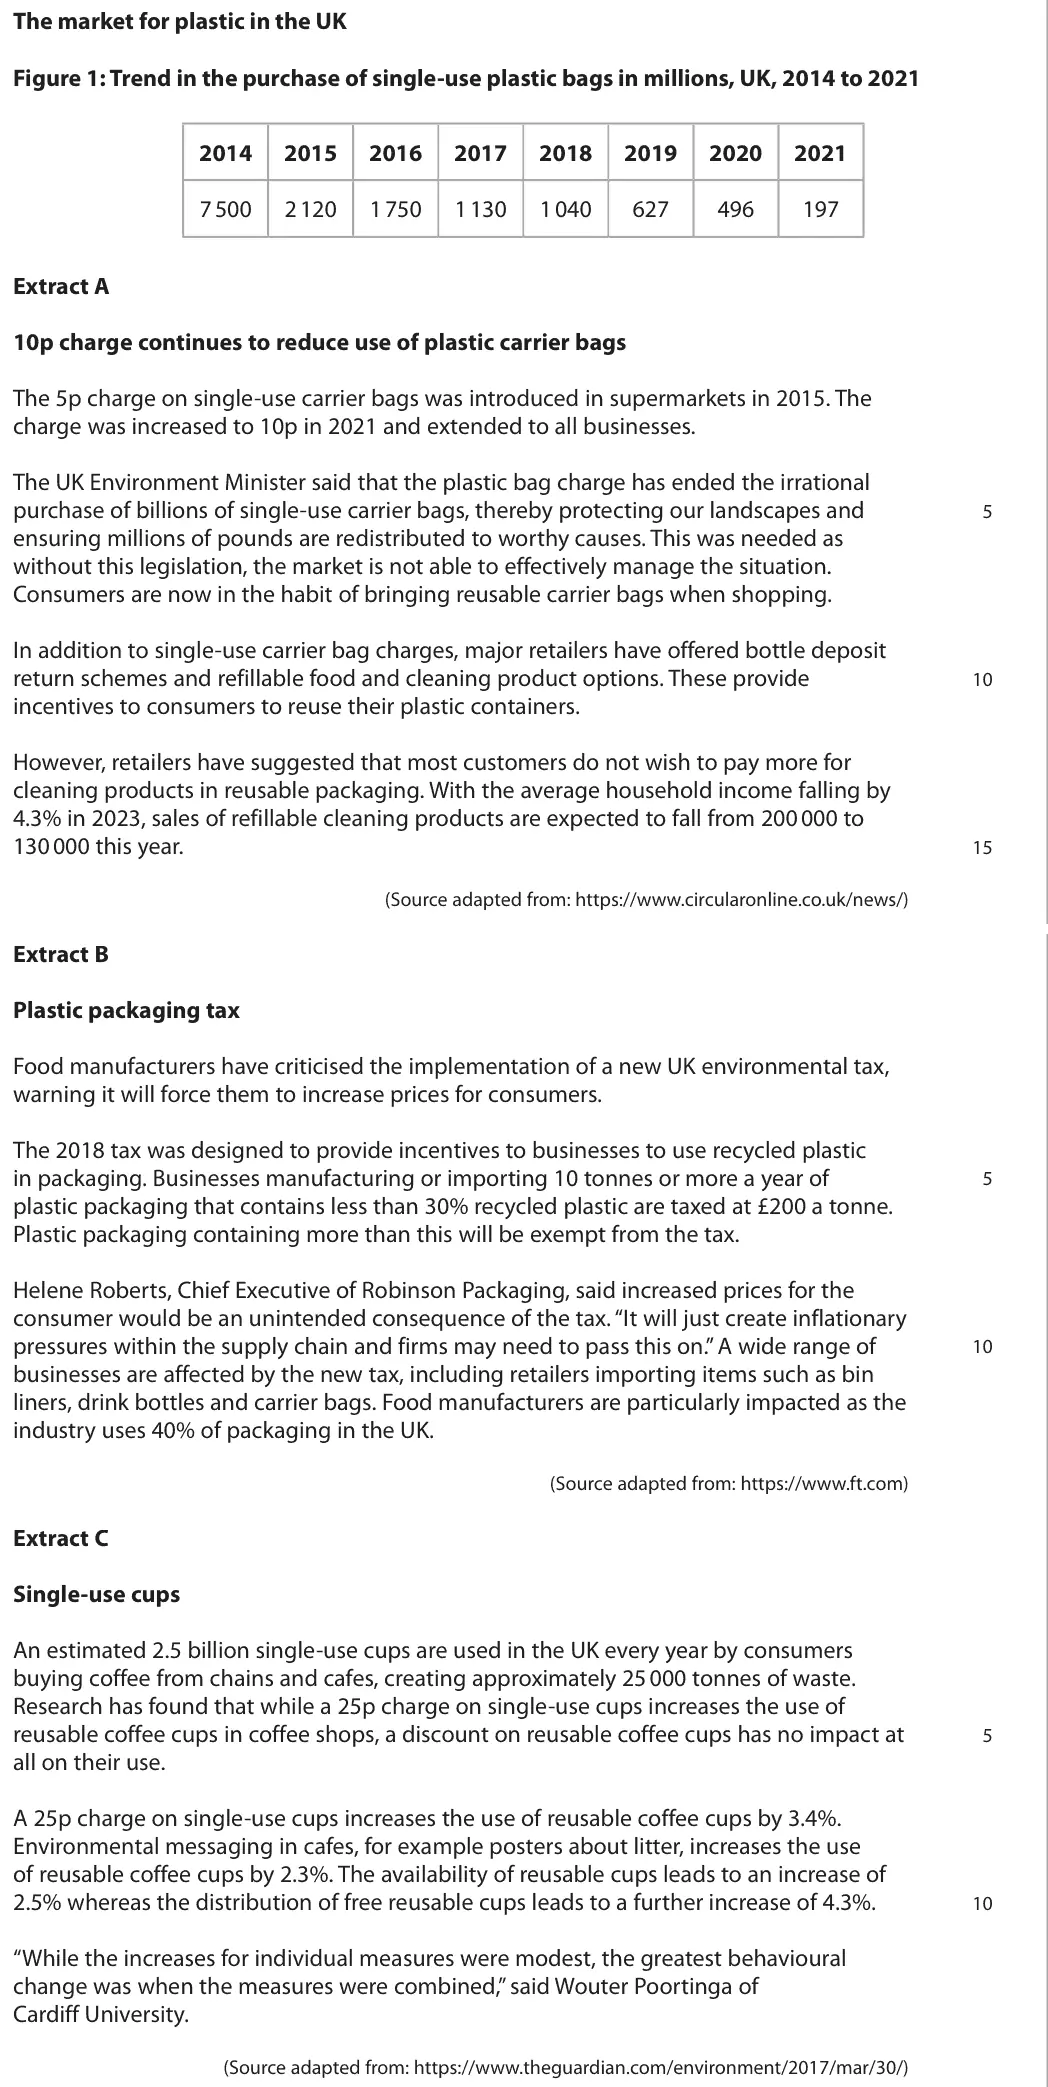
Data and extracts for question 6
Mark scheme, including the levels grid and indicative content
Examiner's comment
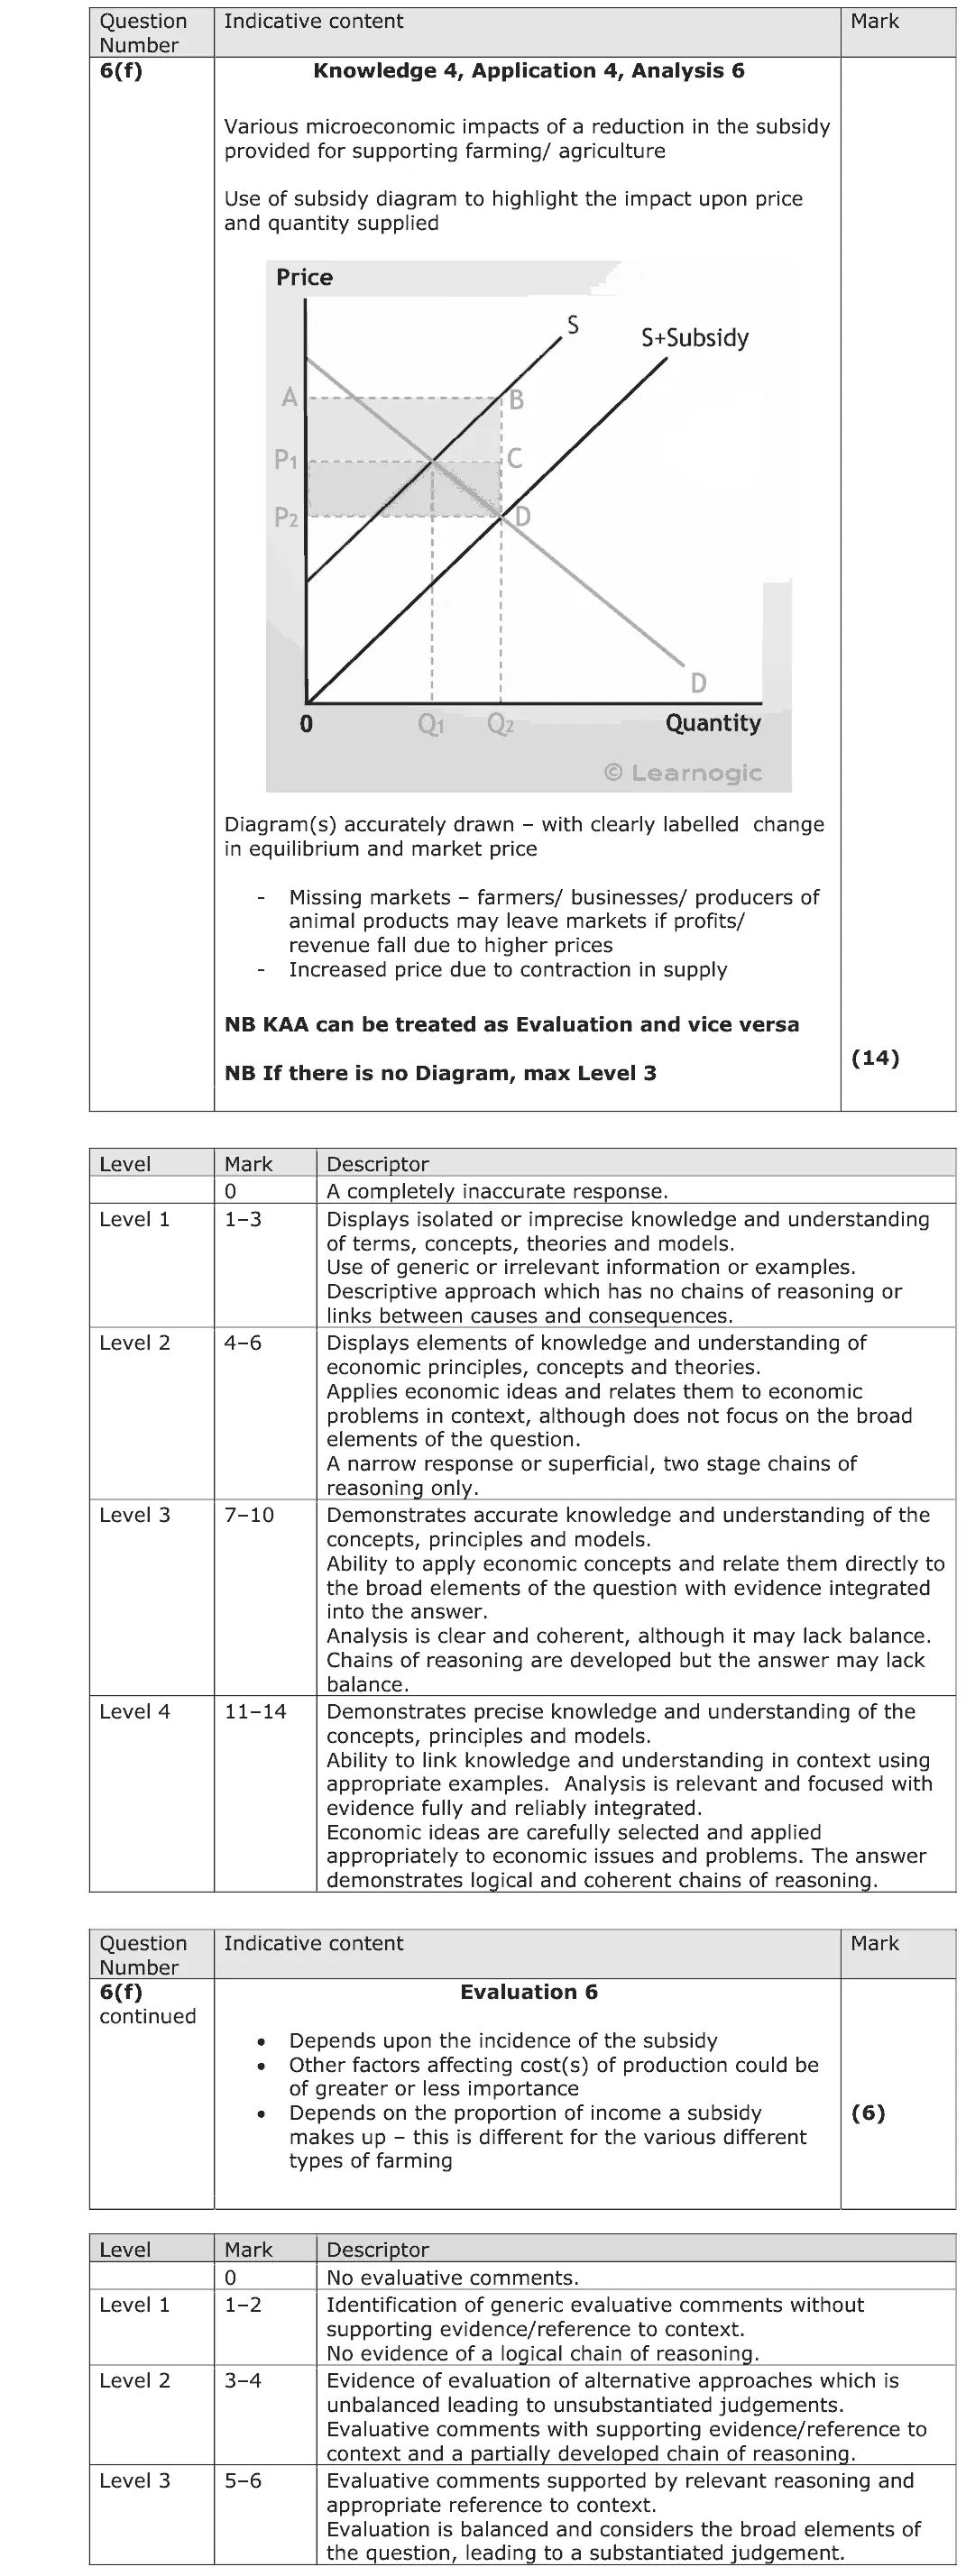
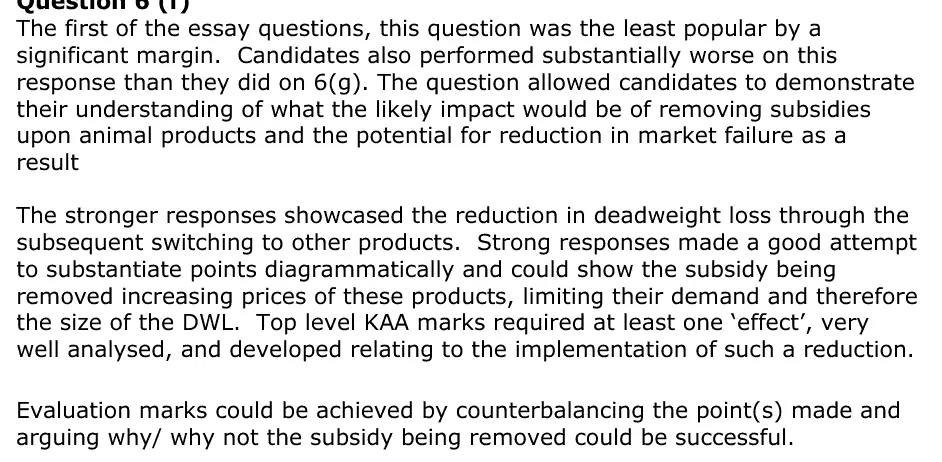
The first of the essay questions, this question was the least popular by a significant margin. Candidates also performed substantially worse on this response than they did on 6(g). The question allowed candidates to demonstrate their understanding of what the likely impact would be of removing subsidies upon animal products and the potential for reduction in market failure as a result The stronger responses showcased the reduction in deadweight loss through the subsequent switching to other products. Strong responses made a good attempt to substantiate points diagrammatically and could show the subsidy being removed increasing prices of these products, limiting their demand and therefore the size of the DWL. Top level KAA marks required at least one ‘effect’, very well analysed, and developed relating to the implementation of such a reduction. Evaluation marks could be achieved by counterbalancing the point(s) made and arguing why/ why not the subsidy being removed could be successful.
Notes from the mark scheme and report
removing subsidies shifts supply left: higher prices, lower output, lower farm incomes (grazing livestock profit negative without subsidy, Figure 1), less overproduction and welfare loss
evaluate with PED, farm closures, food security
report: candidates "performed substantially worse on this response than they did on 6(g)"
Quantitative skills: QS 4 (construct and interpret a range of standard graphical forms)
June 2025 · AS Paper 1 · Q6(g)20 marksAO1=4, AO2=4, AO3=6, AO4=620-mark essayEither/or
Data and extracts for question 6
Mark scheme, including the levels grid and indicative content
Examiner's comment
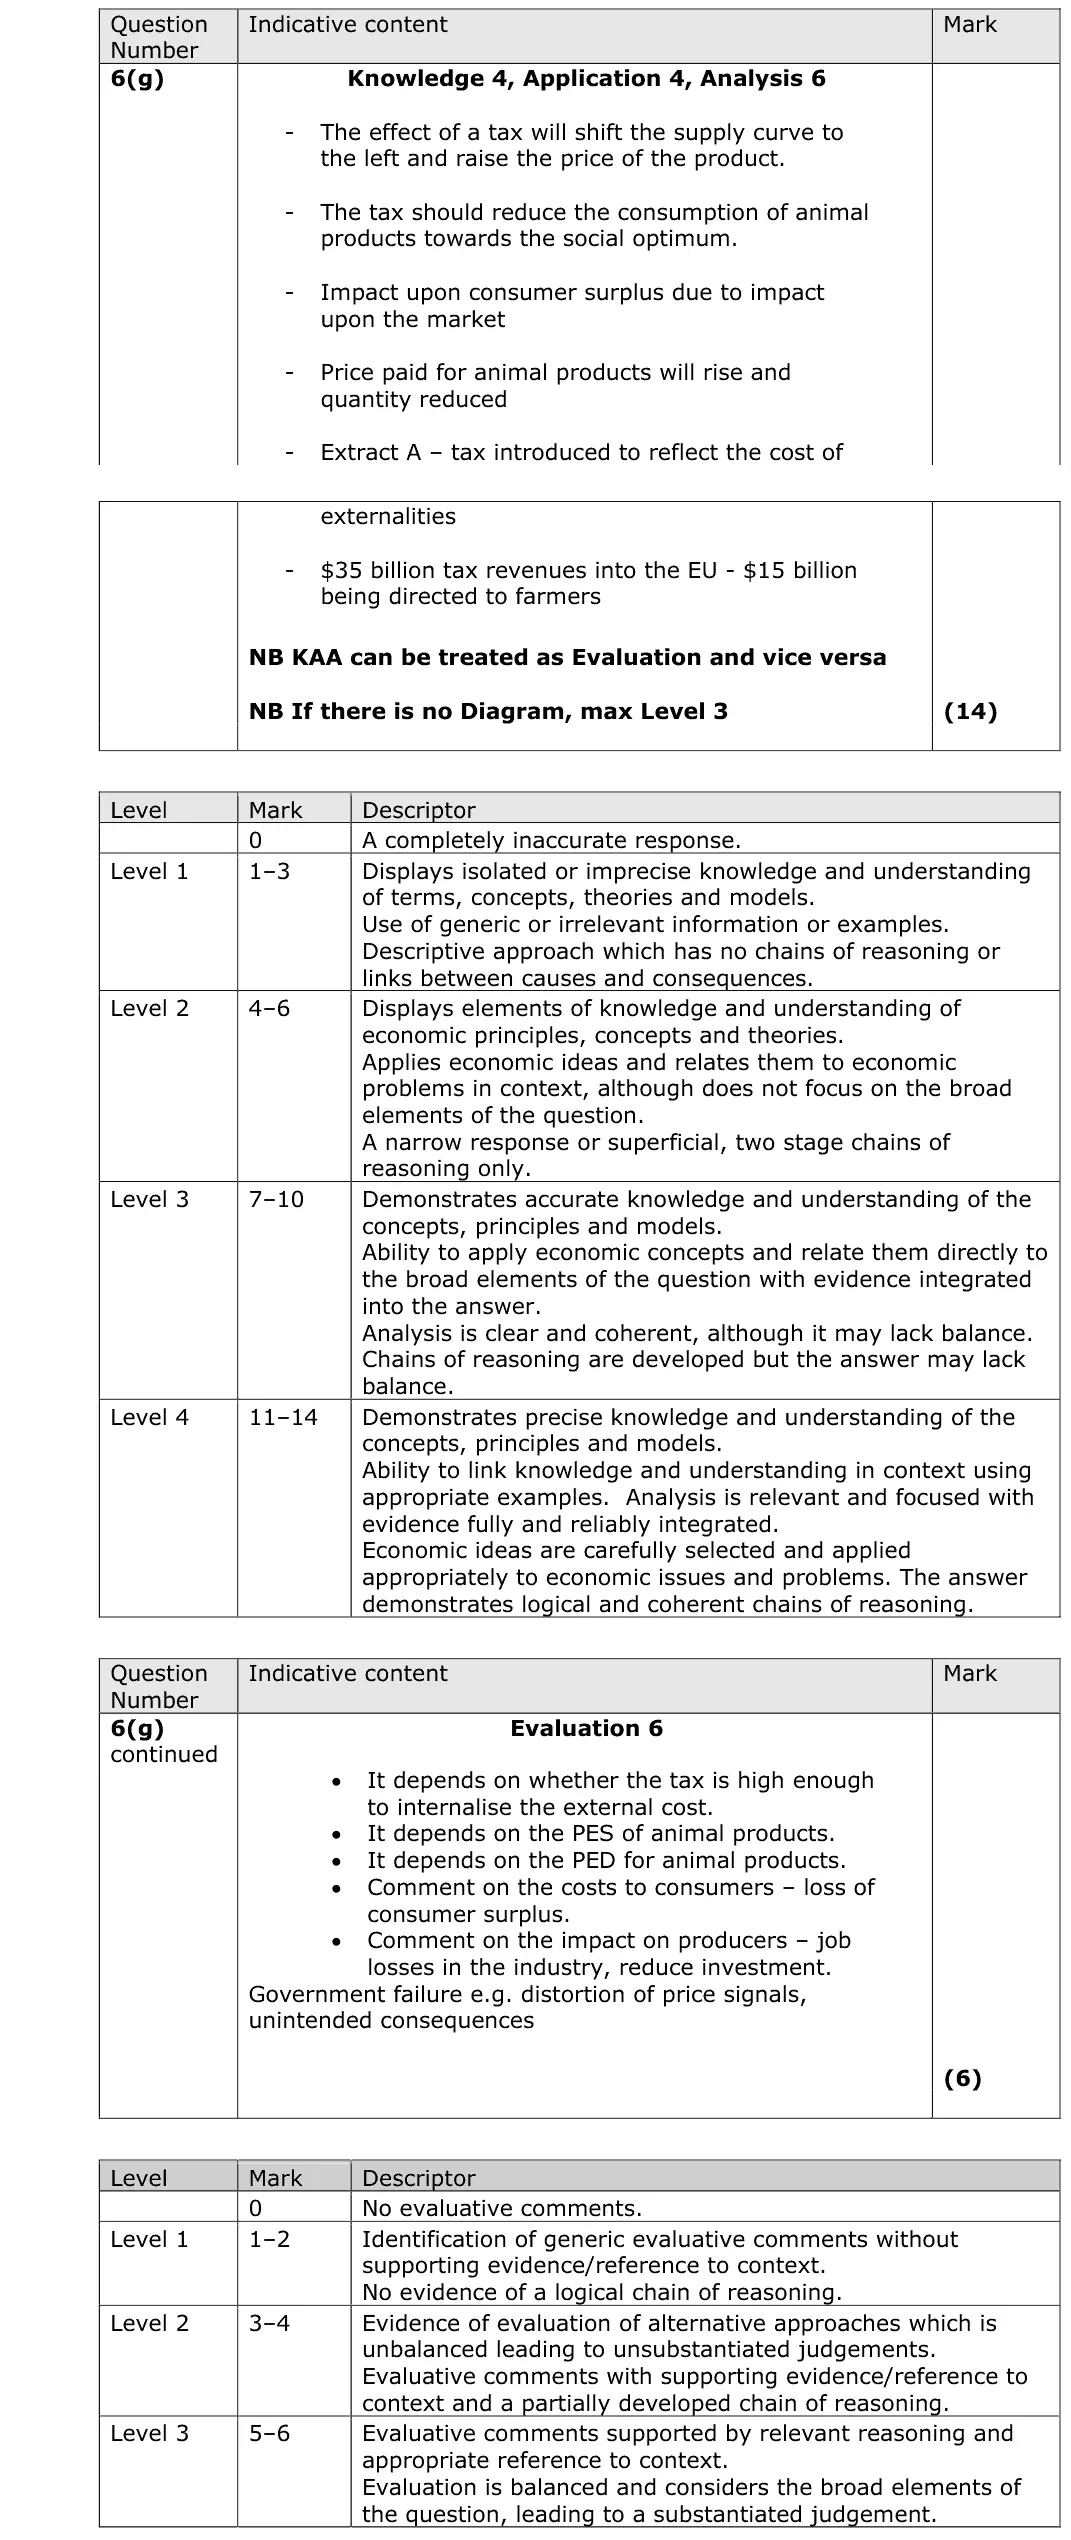
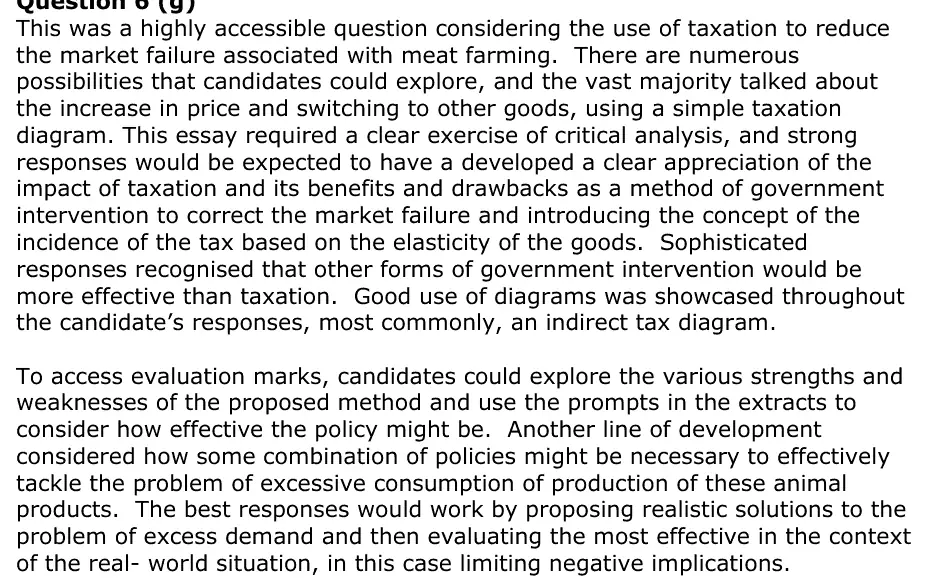
This was a highly accessible question considering the use of taxation to reduce the market failure associated with meat farming. There are numerous possibilities that candidates could explore, and the vast majority talked about the increase in price and switching to other goods, using a simple taxation diagram. This essay required a clear exercise of critical analysis, and strong responses would be expected to have a developed a clear appreciation of the impact of taxation and its benefits and drawbacks as a method of government intervention to correct the market failure and introducing the concept of the incidence of the tax based on the elasticity of the goods. Sophisticated responses recognised that other forms of government intervention would be more effective than taxation. Good use of diagrams was showcased throughout the candidate’s responses, most commonly, an indirect tax diagram. To access evaluation marks, candidates could explore the various strengths and weaknesses of the proposed method and use the prompts in the extracts to consider how effective the policy might be. Another line of development considered how some combination of policies might be necessary to effectively tackle the problem of excessive consumption of production of these animal products. The best responses would work by proposing realistic solutions to the problem of excess demand and then evaluating the most effective in the context of the real- world situation, in this case limiting negative implications.
Notes from the mark scheme and report
indirect tax shifts supply left and raises meat prices (beef £24.24 to £29.50, Figure 2), reducing consumption towards the social optimum
incidence depends on PED and PES
revenue (£35bn) could fund cheaper fruit and veg
evaluate inelastic demand, regressive effect, valuing the externality
Quantitative skills: QS 4 (construct and interpret a range of standard graphical forms)
June 2025 · Paper 3 · Q2(a)5 marksAO1=2, AO2=2, AO3=1DiagramHard
Data and extracts for question 2
Mark scheme
Examiner's comment
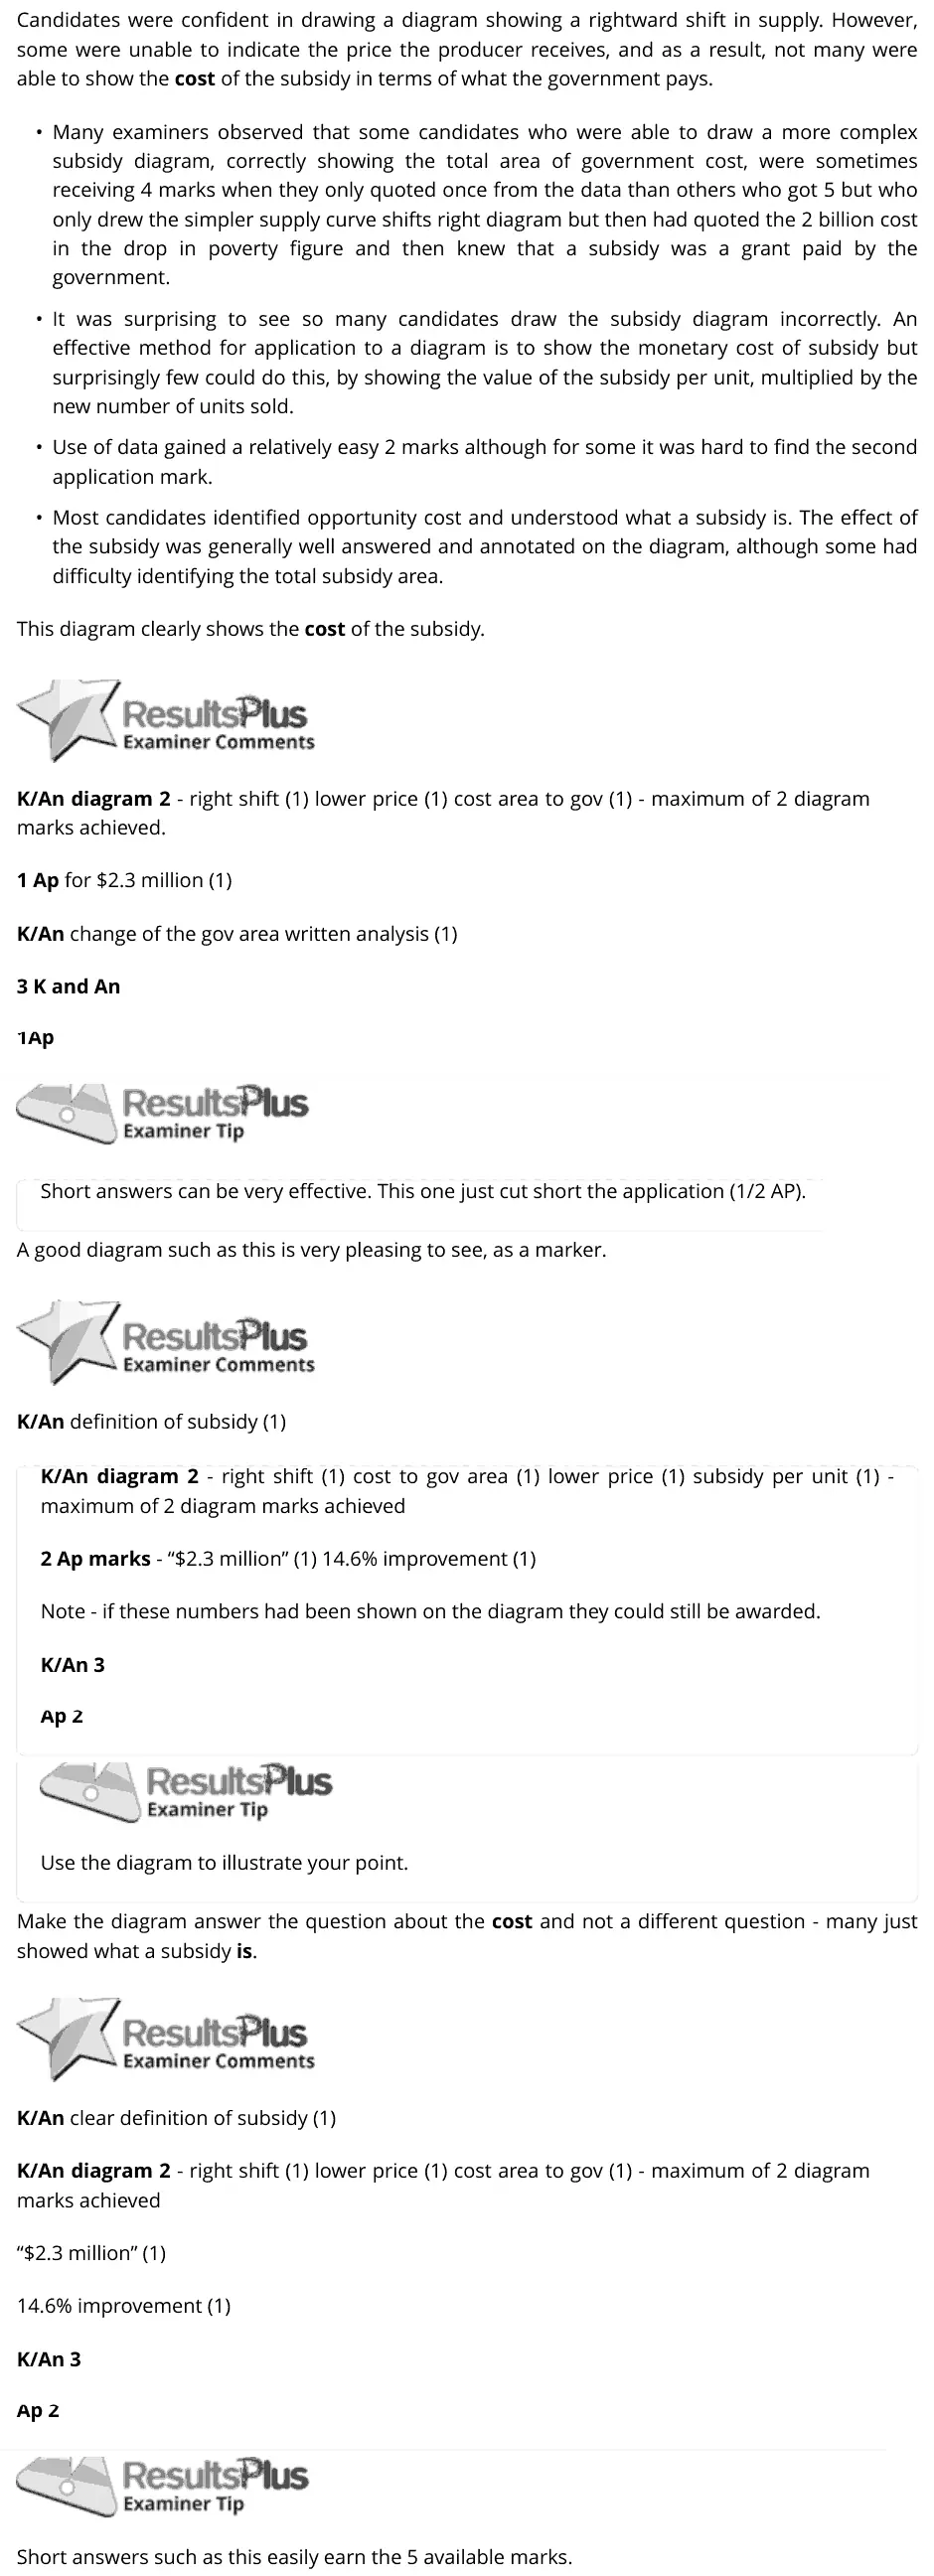
Candidates were confident in drawing a diagram showing a rightward shift in supply. However, some were unable to indicate the price the producer receives, and as a result, not many were able to show the cost of the subsidy in terms of what the government pays. • Many examiners observed that some candidates who were able to draw a more complex subsidy diagram, correctly showing the total area of government cost, were sometimes receiving 4 marks when they only quoted once from the data than others who got 5 but who only drew the simpler supply curve shifts right diagram but then had quoted the 2 billion cost in the drop in poverty figure and then knew that a subsidy was a grant paid by the government. • It was surprising to see so many candidates draw the subsidy diagram incorrectly. An effective method for application to a diagram is to show the monetary cost of subsidy but surprisingly few could do this, by showing the value of the subsidy per unit, multiplied by the new number of units sold. • Use of data gained a relatively easy 2 marks although for some it was hard to find the second application mark. • Most candidates identified opportunity cost and understood what a subsidy is. The effect of the subsidy was generally well answered and annotated on the diagram, although some had difficulty identifying the total subsidy area. This diagram clearly shows the cost of the subsidy. K/An diagram 2 - right shift (1) lower price (1) cost area to gov (1) - maximum of 2 diagram marks achieved. 1 Ap for $2.3 million (1) K/An change of the gov area written analysis (1) 3 K and An 1Ap Short answers can be very effective. This one just cut short the application (1/2 AP). A good diagram such as this is very pleasing to see, as a marker. K/An definition of subsidy (1) K/An diagram 2 - right shift (1) cost to gov area (1) lower price (1) subsidy per unit (1) - maximum of 2 diagram marks achieved 2 Ap marks - “$2.3 million” (1) 14.6% improvement (1) Note - if these numbers had been shown on the diagram they could still be awarded. K/An 3 Ap 2 Use the diagram to illustrate your point. Make the diagram answer the question about the cost and not a different question - many just showed what a subsidy is. K/An clear definition of subsidy (1) K/An diagram 2 - right shift (1) lower price (1) cost area to gov (1) - maximum of 2 diagram marks achieved “$2.3 million” (1) 14.6% improvement (1) K/An 3 Ap 2 Short answers such as this easily earn the 5 available marks.
Notes from the mark scheme and report
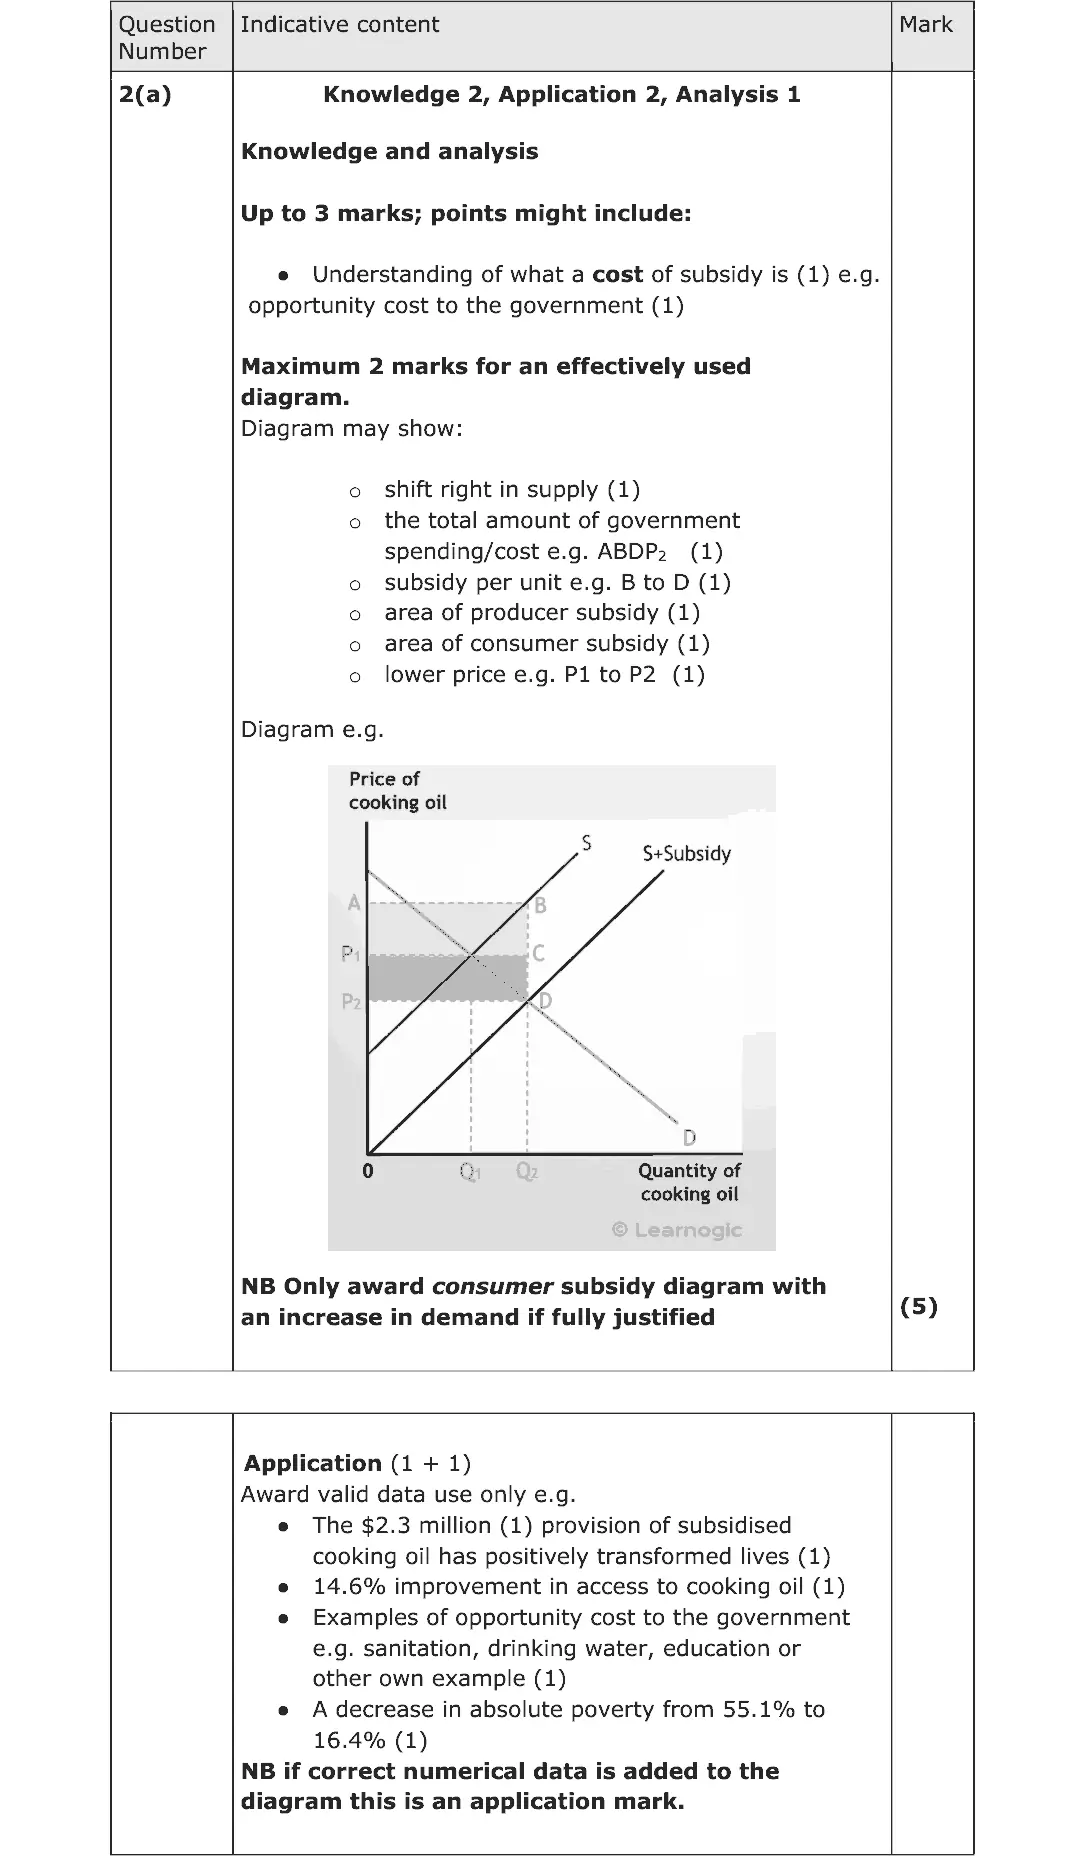
supply shifts right by the subsidy per unit
the cost to government = subsidy per unit x new quantity (area between the two supply curves)
opportunity cost
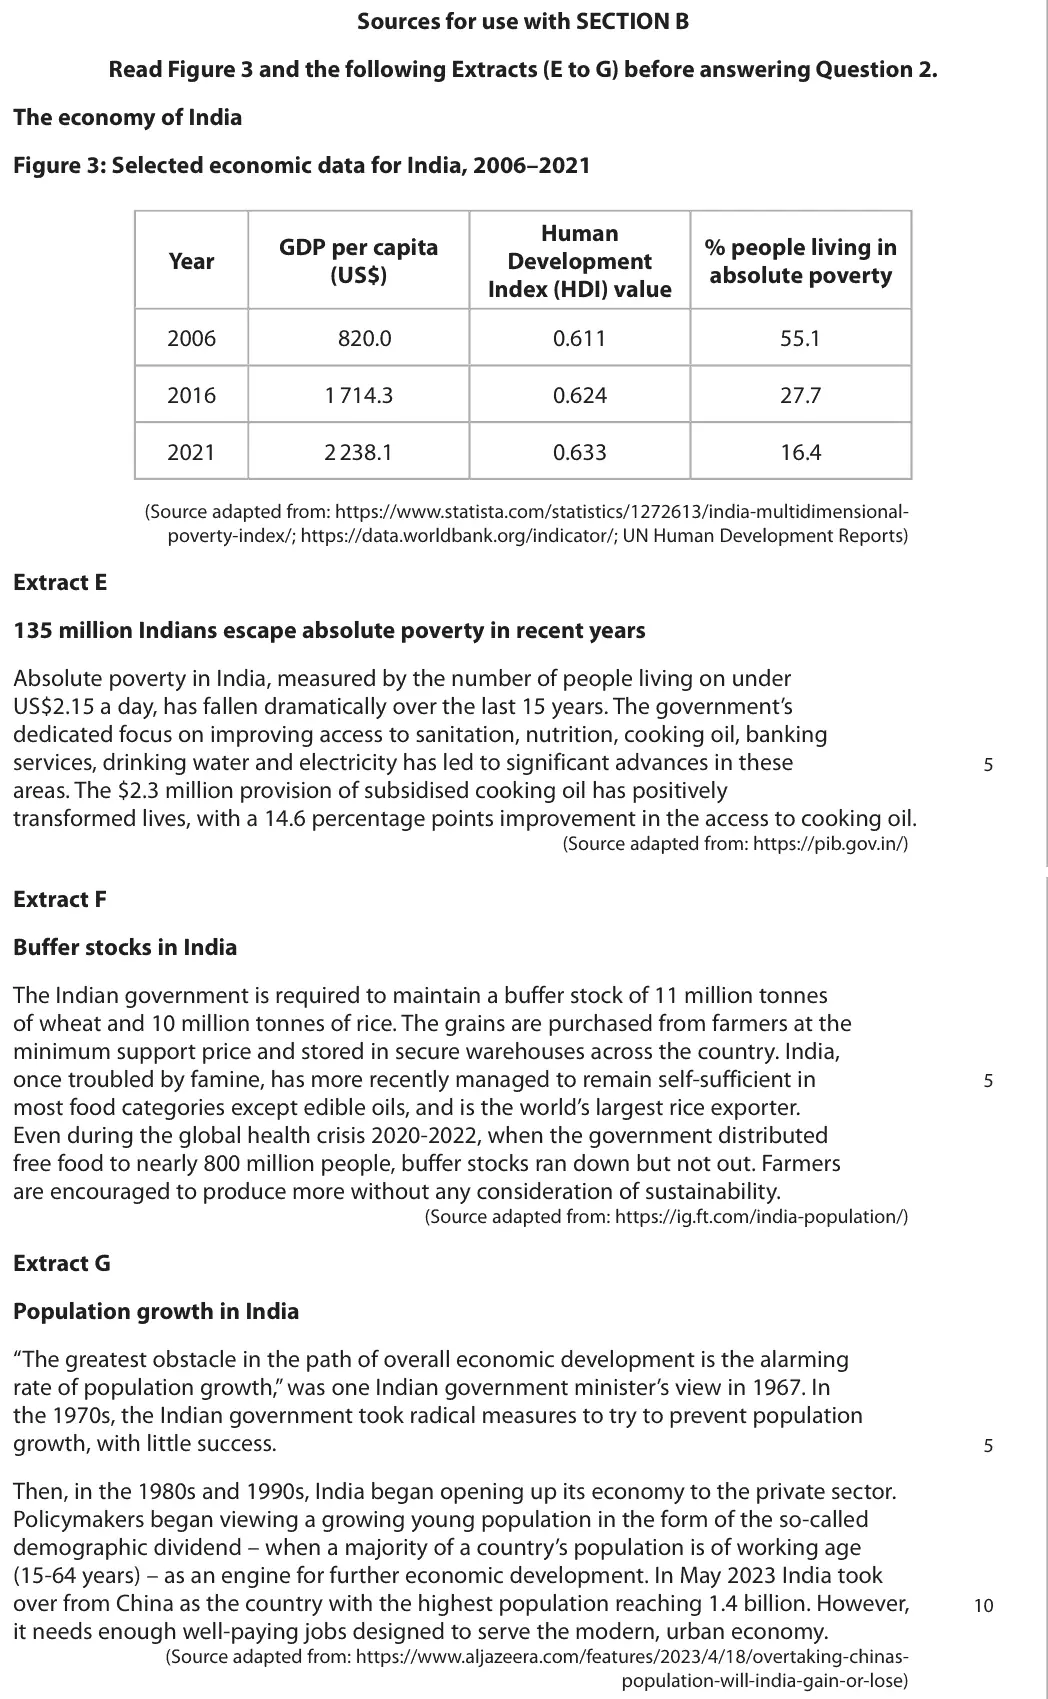
quote the $2.3 million subsidy
report: "not many were able to show the cost of the subsidy in terms of what the government pays" and "so many candidates draw the subsidy diagram incorrectly"
Quantitative skills: QS 4 (construct and interpret a range of standard graphical forms); QS 9 (interpret, apply and analyse information in written, graphical tabular and numerical forms)
June 2024 · AS Paper 1 · Q6(f)20 marksAO1=4, AO2=4, AO3=6, AO4=620-mark essayEither/orHard
Data and extracts for question 6
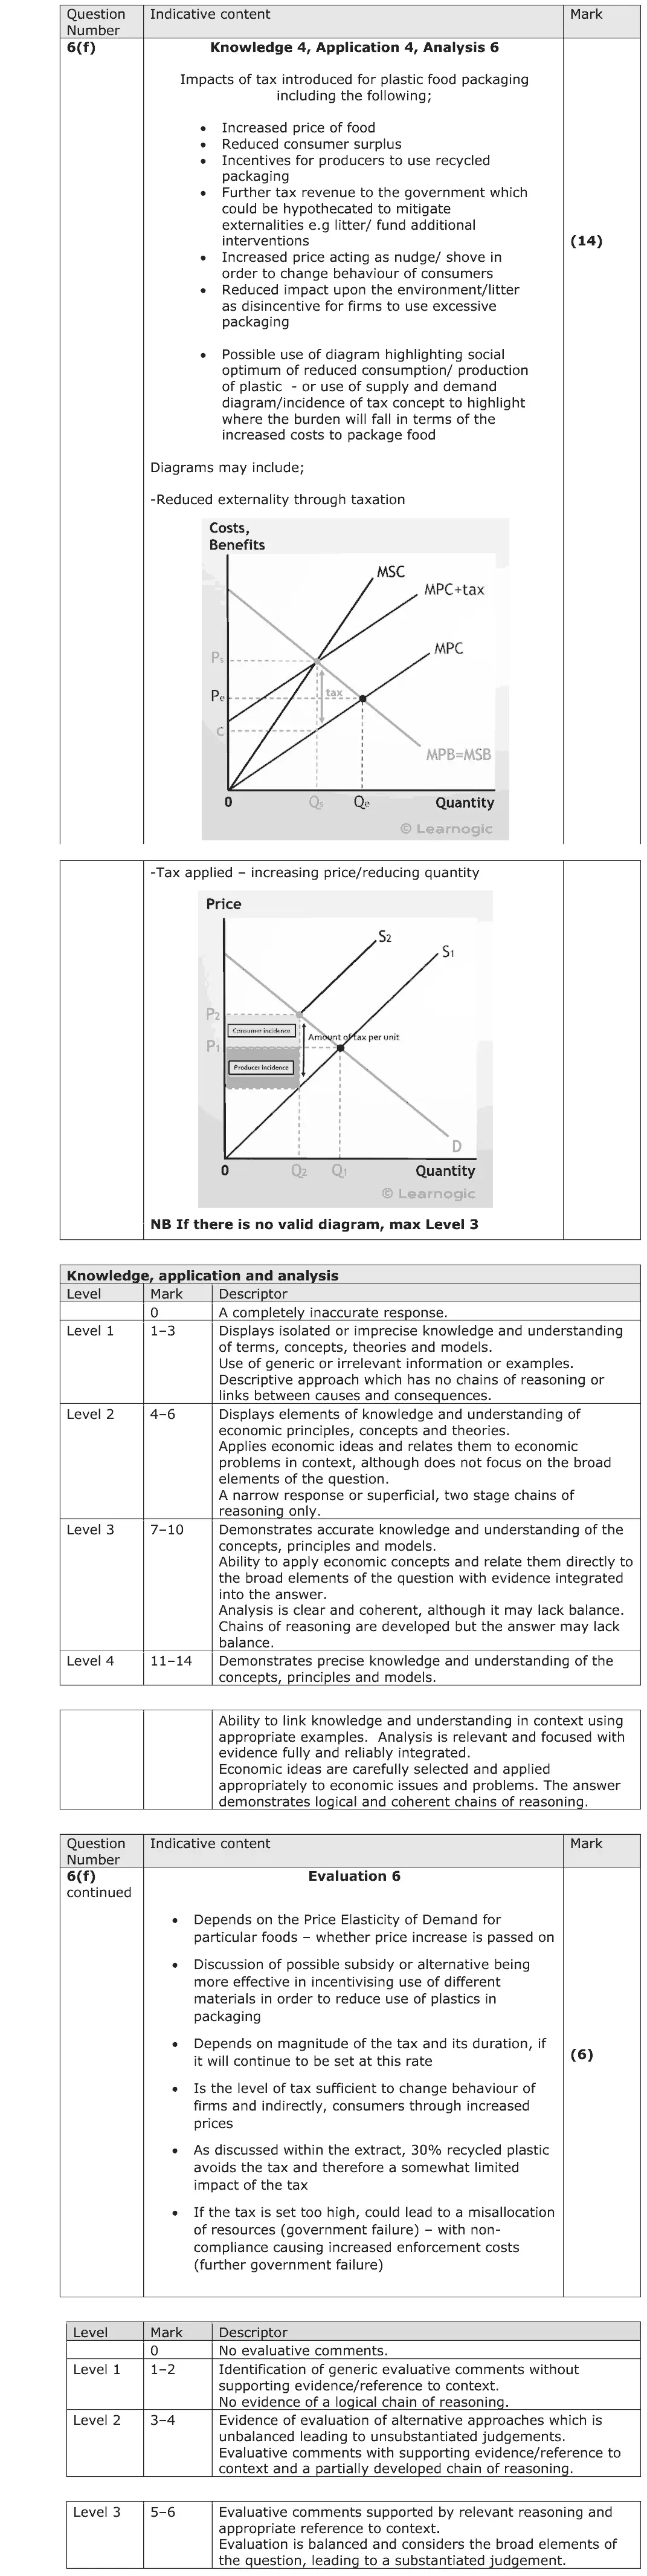
Mark scheme, including the levels grid and indicative content
Examiner's comment
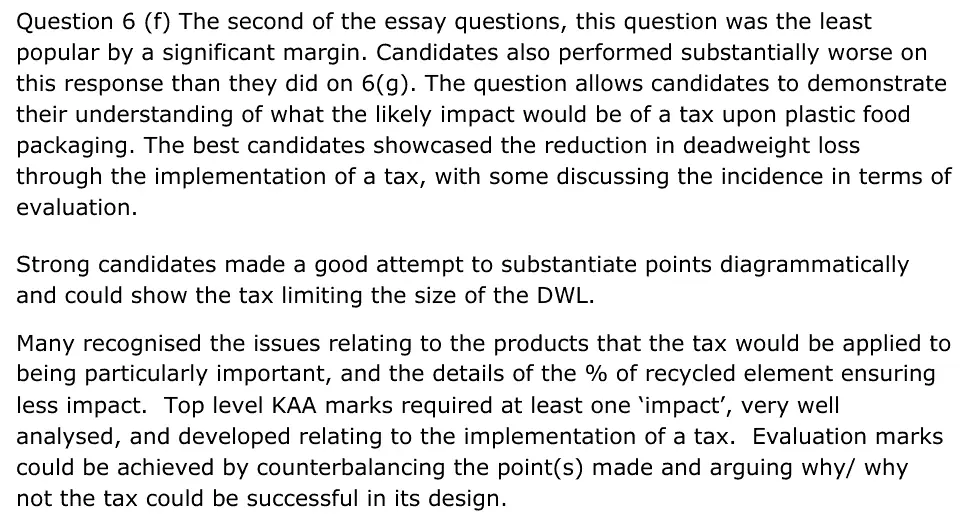
Question 6 (f) The second of the essay questions, this question was the least popular by a significant margin. Candidates also performed substantially worse on this response than they did on 6(g). The question allows candidates to demonstrate their understanding of what the likely impact would be of a tax upon plastic food packaging. The best candidates showcased the reduction in deadweight loss through the implementation of a tax, with some discussing the incidence in terms of evaluation. Strong candidates made a good attempt to substantiate points diagrammatically and could show the tax limiting the size of the DWL. Many recognised the issues relating to the products that the tax would be applied to being particularly important, and the details of the % of recycled element ensuring less impact. Top level KAA marks required at least one ‘impact’, very well analysed, and developed relating to the implementation of a tax. Evaluation marks could be achieved by counterbalancing the point(s) made and arguing why/ why not the tax could be successful in its design.
Notes from the mark scheme and report
maximum Level 3 without a valid diagram (MSC/MPC+tax externality diagram or tax incidence diagram)
higher food prices, less consumer surplus, incentive to use recycled packaging, revenue to hypothecate
evaluate with PED, size of the tax, the 30% recycled exemption
report: "Candidates also performed substantially worse on this response than they did on 6(g)"
Quantitative skills: QS 4 (construct and interpret a range of standard graphical forms)
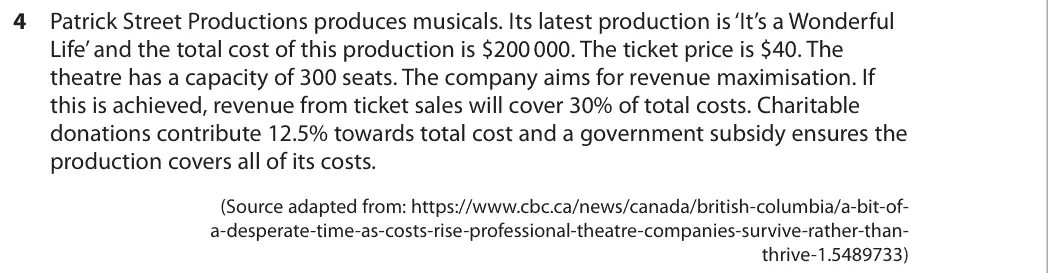
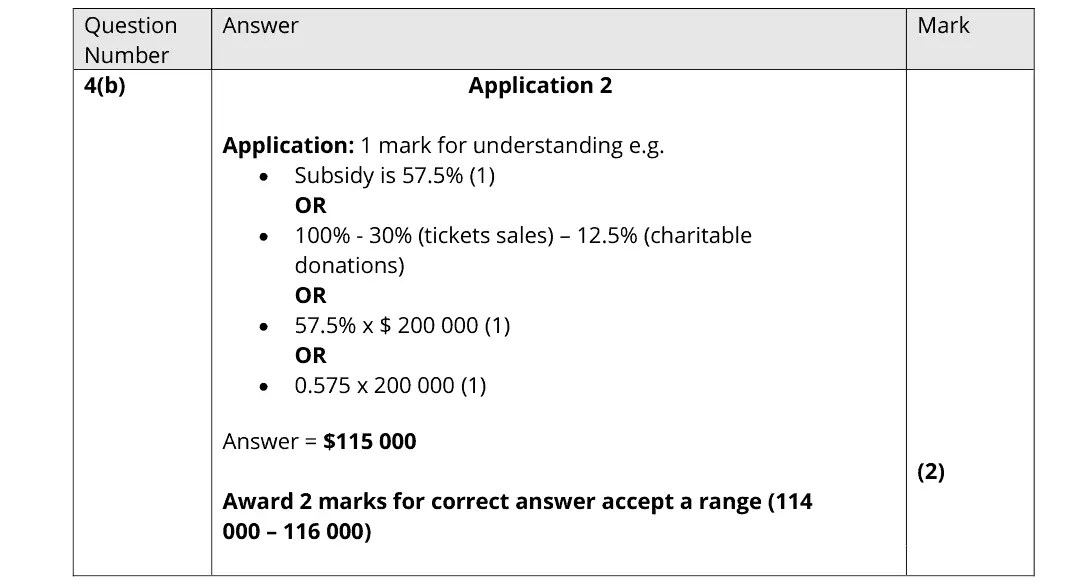
November 2021 · Paper 1 · Q4(b)2 marksAO2=2Calculation
Quantitative skills: QS 2 (calculate, use and understand percentages, percentage changes and percentage point changes); QS 6 (calculate cost, revenue and profit (marginal, average, totals))
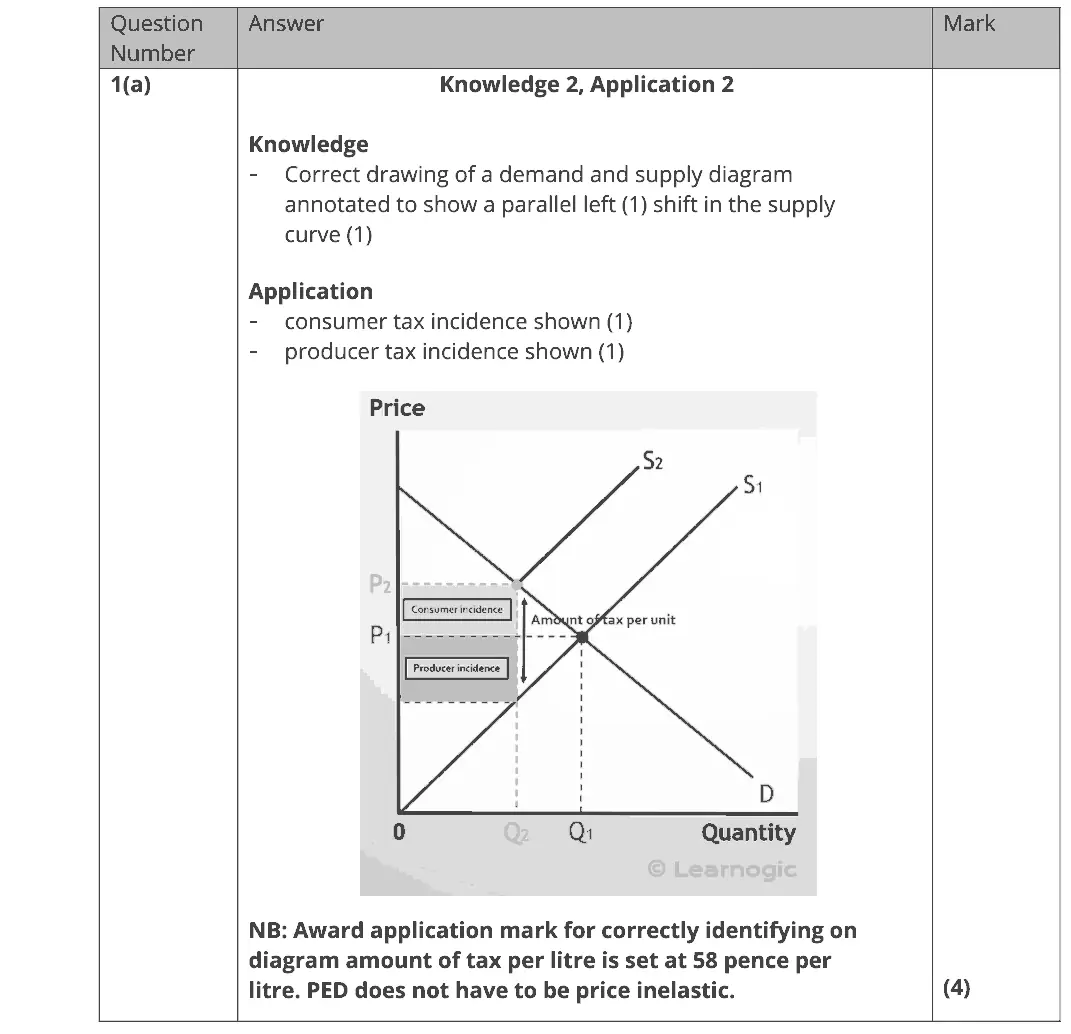
October 2020 · Paper 1 · Q1(a)4 marksAO1=2, AO2=2Diagram
Data and extracts for question 1
Mark scheme
Examiner's comment
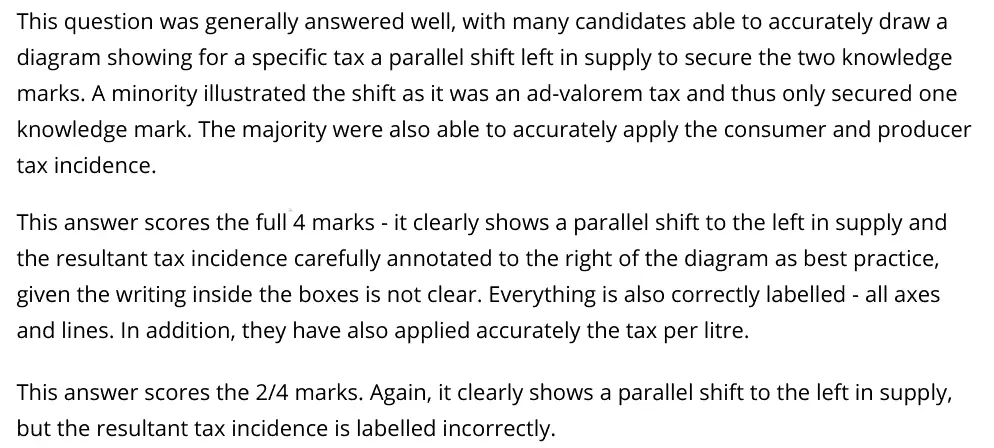
This question was generally answered well, with many candidates able to accurately draw a diagram showing for a specific tax a parallel shift left in supply to secure the two knowledge marks. A minority illustrated the shift as it was an ad-valorem tax and thus only secured one knowledge mark. The majority were also able to accurately apply the consumer and producer tax incidence. This answer scores the full 4 marks - it clearly shows a parallel shift to the left in supply and the resultant tax incidence carefully annotated to the right of the diagram as best practice, given the writing inside the boxes is not clear. Everything is also correctly labelled - all axes and lines. In addition, they have also applied accurately the tax per litre. This answer scores the 2/4 marks. Again, it clearly shows a parallel shift to the left in supply, but the resultant tax incidence is labelled incorrectly.
Notes from the mark scheme and report
specific tax is a parallel leftward shift of supply (a pivot is ad valorem and loses a knowledge mark)
label consumer and producer incidence
application mark for showing the 58p per litre tax
report: some labelled the incidence areas the wrong way round
Quantitative skills: QS 4 (construct and interpret a range of standard graphical forms)
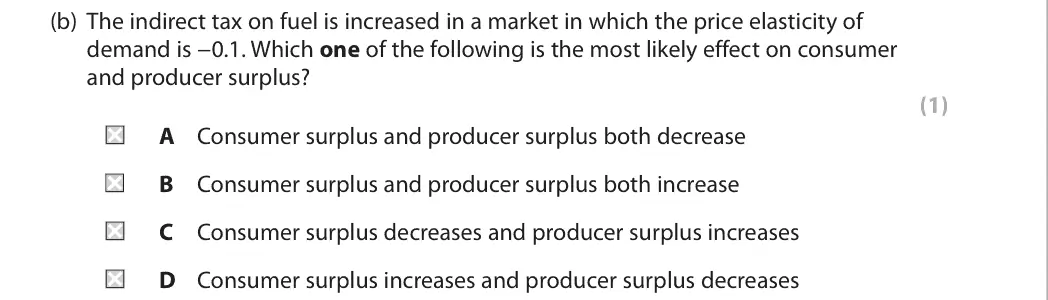
October 2020 · Paper 1 · Q1(b)1 markAO3=1Multiple choice
Data and extracts for question 1
Answer
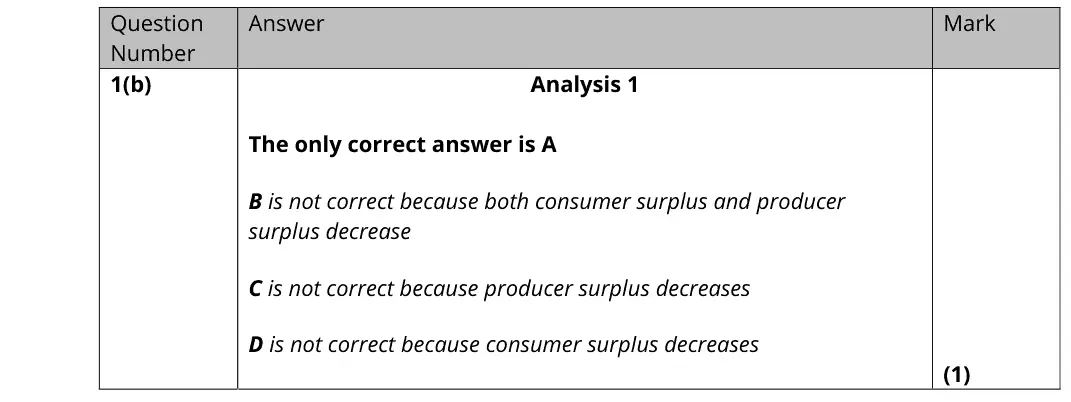
A
Mark scheme
Notes from the mark scheme and report
a higher indirect tax raises price and cuts quantity so both consumer and producer surplus fall (A), whatever the PED of -0.1
B, C and D each have one surplus rising
October 2020 · AS Paper 1 · Q3(a)1 markMultiple choice
Data and extracts for question 3
Answer
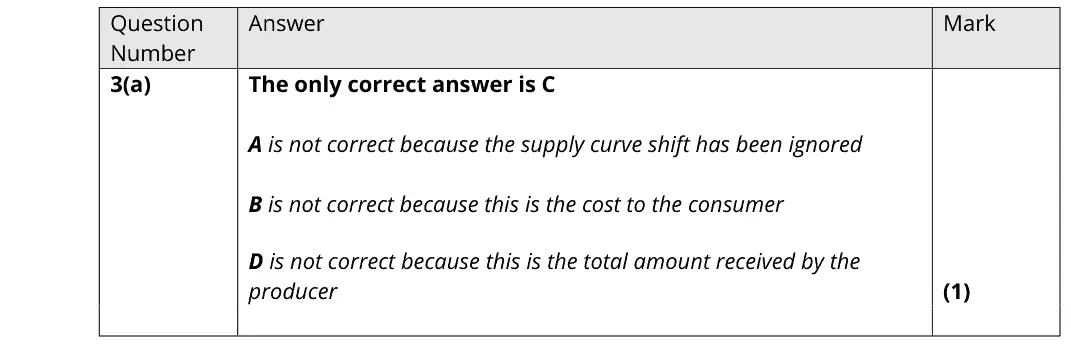
C
Mark scheme
Notes from the mark scheme and report
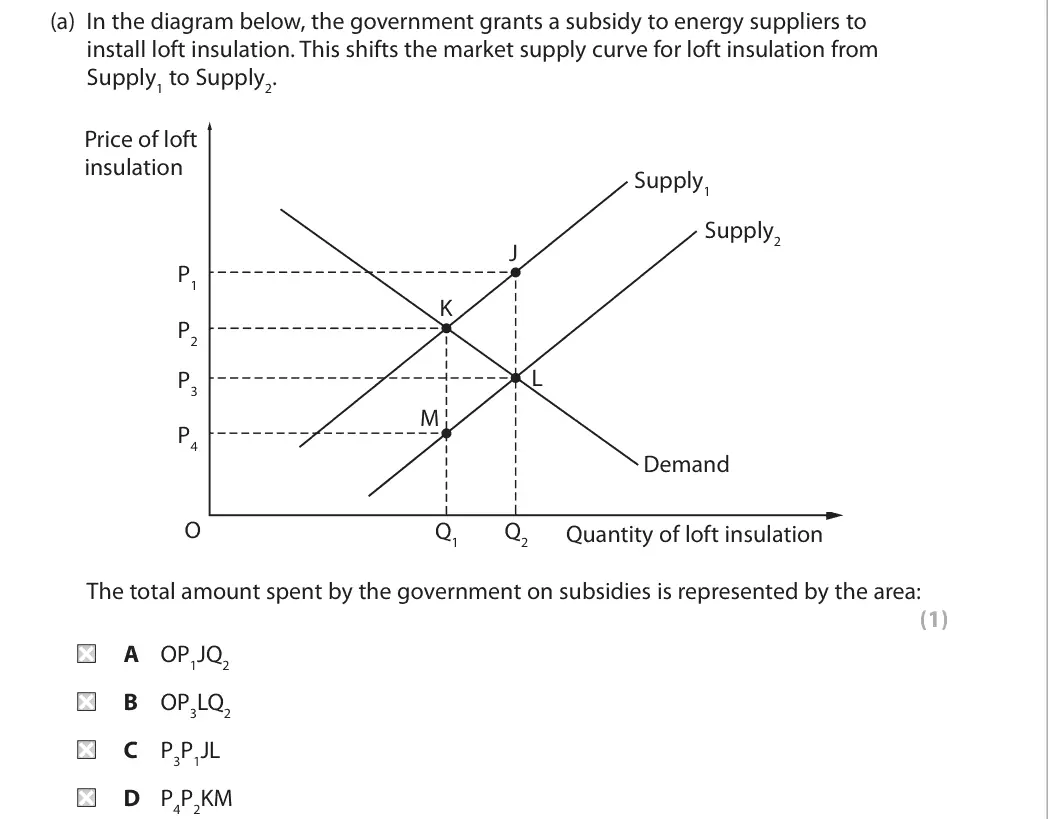
subsidy per unit (vertical distance J to L) x quantity Q2 = area P3P1JL (C)
OP3LQ2 is consumer spending
the other areas ignore the supply shift or the subsidised quantity
Quantitative skills: QS 4 (construct and interpret a range of standard graphical forms)
October 2020 · AS Paper 1 · Q4(a)1 markMultiple choice
Data and extracts for question 4
Answer
C
Mark scheme
Notes from the mark scheme and report
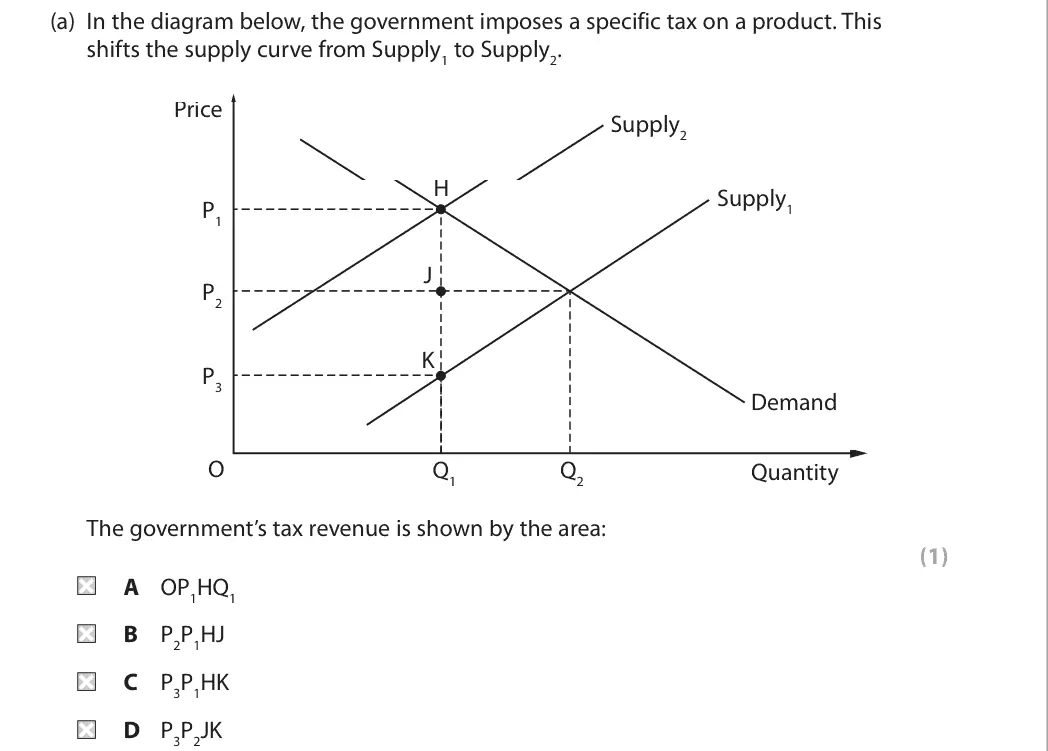
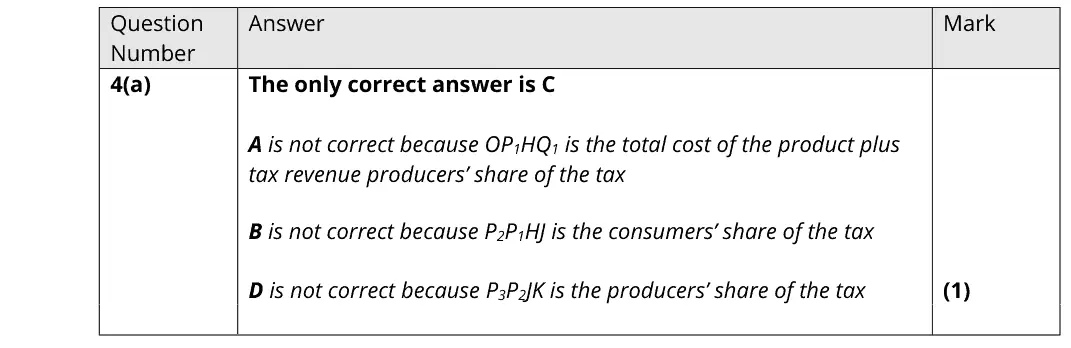
tax revenue = tax per unit (H to K) x Q1 = area P3P1HK (C)
P2P1HJ is the consumers' share and P3P2JK the producers' share of the tax
OP1HQ1 is total consumer spending
Quantitative skills: QS 4 (construct and interpret a range of standard graphical forms)
October 2020 · AS Paper 1 · Q4(b)3 marksAO1=1, AO2=1, AO3=1Short answer
Data and extracts for question 4
Mark scheme
Examiner's comment
It was important that candidates were able to identify why specific taxes as per unit rather than ad valorem, are used in a market. Often products have both VAT and a specific tax levied on them, and it is important to explore why this is the case. As usual, a relevant example is crucial for application.
Notes from the mark scheme and report
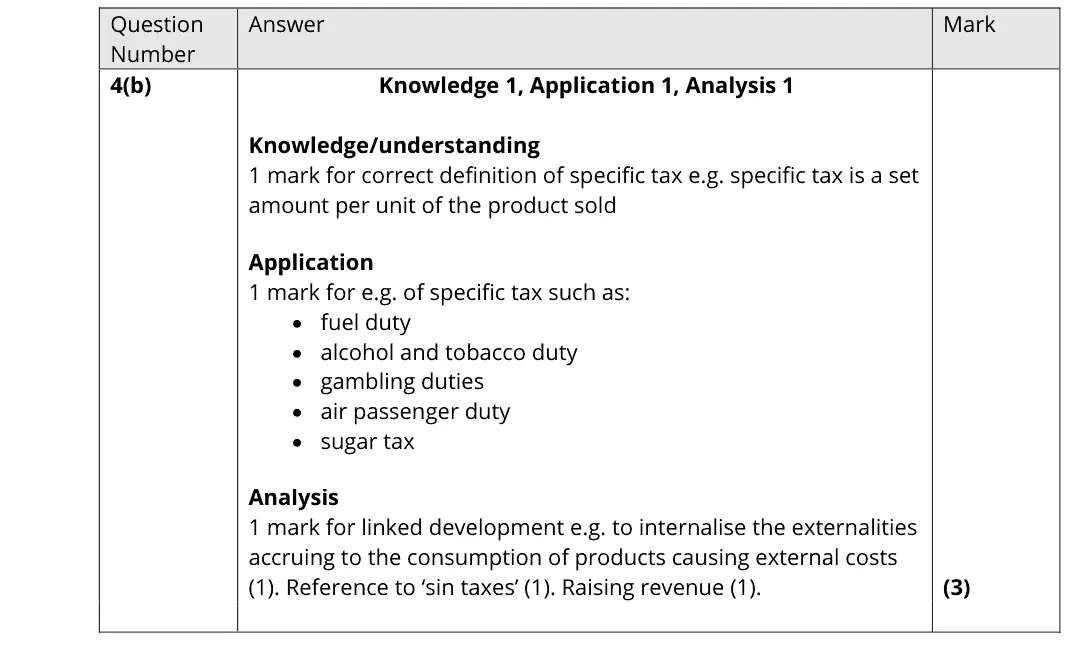
define a specific tax as a fixed amount per unit (not ad valorem)
give an example (fuel, alcohol, tobacco, air passenger duty, sugar tax)
develop it: internalise external costs, sin taxes, raise revenue
October 2020 · Paper 1 · Q6(a)5 marksAO1=1, AO2=1, AO3=3Diagram
Data and extracts for question 6
Mark scheme
Examiner's comment
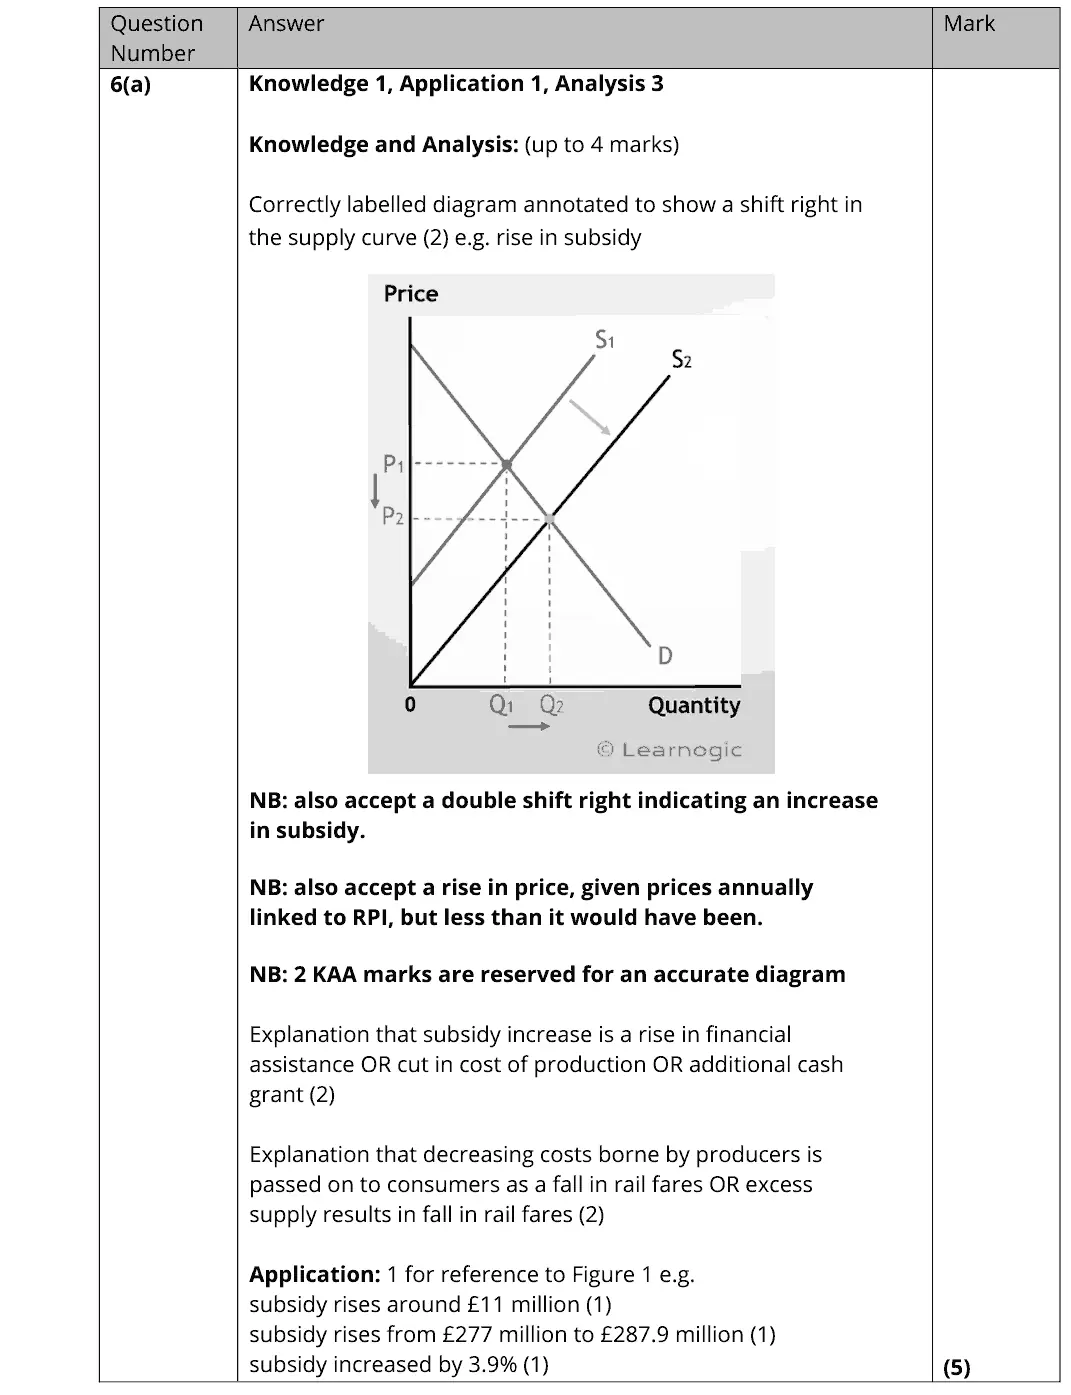
In this question most students were able to access close to full marks. There was, in most cases, an accurately labelled diagram accompanied by a relevant explanation. However, a significant number of responses ignored the requirement to refer to Figure 1. This answer secure 5/5. A correctly labelled diagram annotated to show a shift right in supply is explained with reference to the data in Figure 1. There is also some explanation of the effect being a rise in consumer surplus and in the diagram of the financial gains to the producer and consumers of the subsidy illustrated in the diagram. This is an excellent answer to this question scoring full marks. An accurate diagram is provided showing a double shift right indicating an increase in subsidy, as allowed in the mark scheme. Accurate reference to the data in Figure 1 is also provided within the careful explanation of the diagram.
Notes from the mark scheme and report
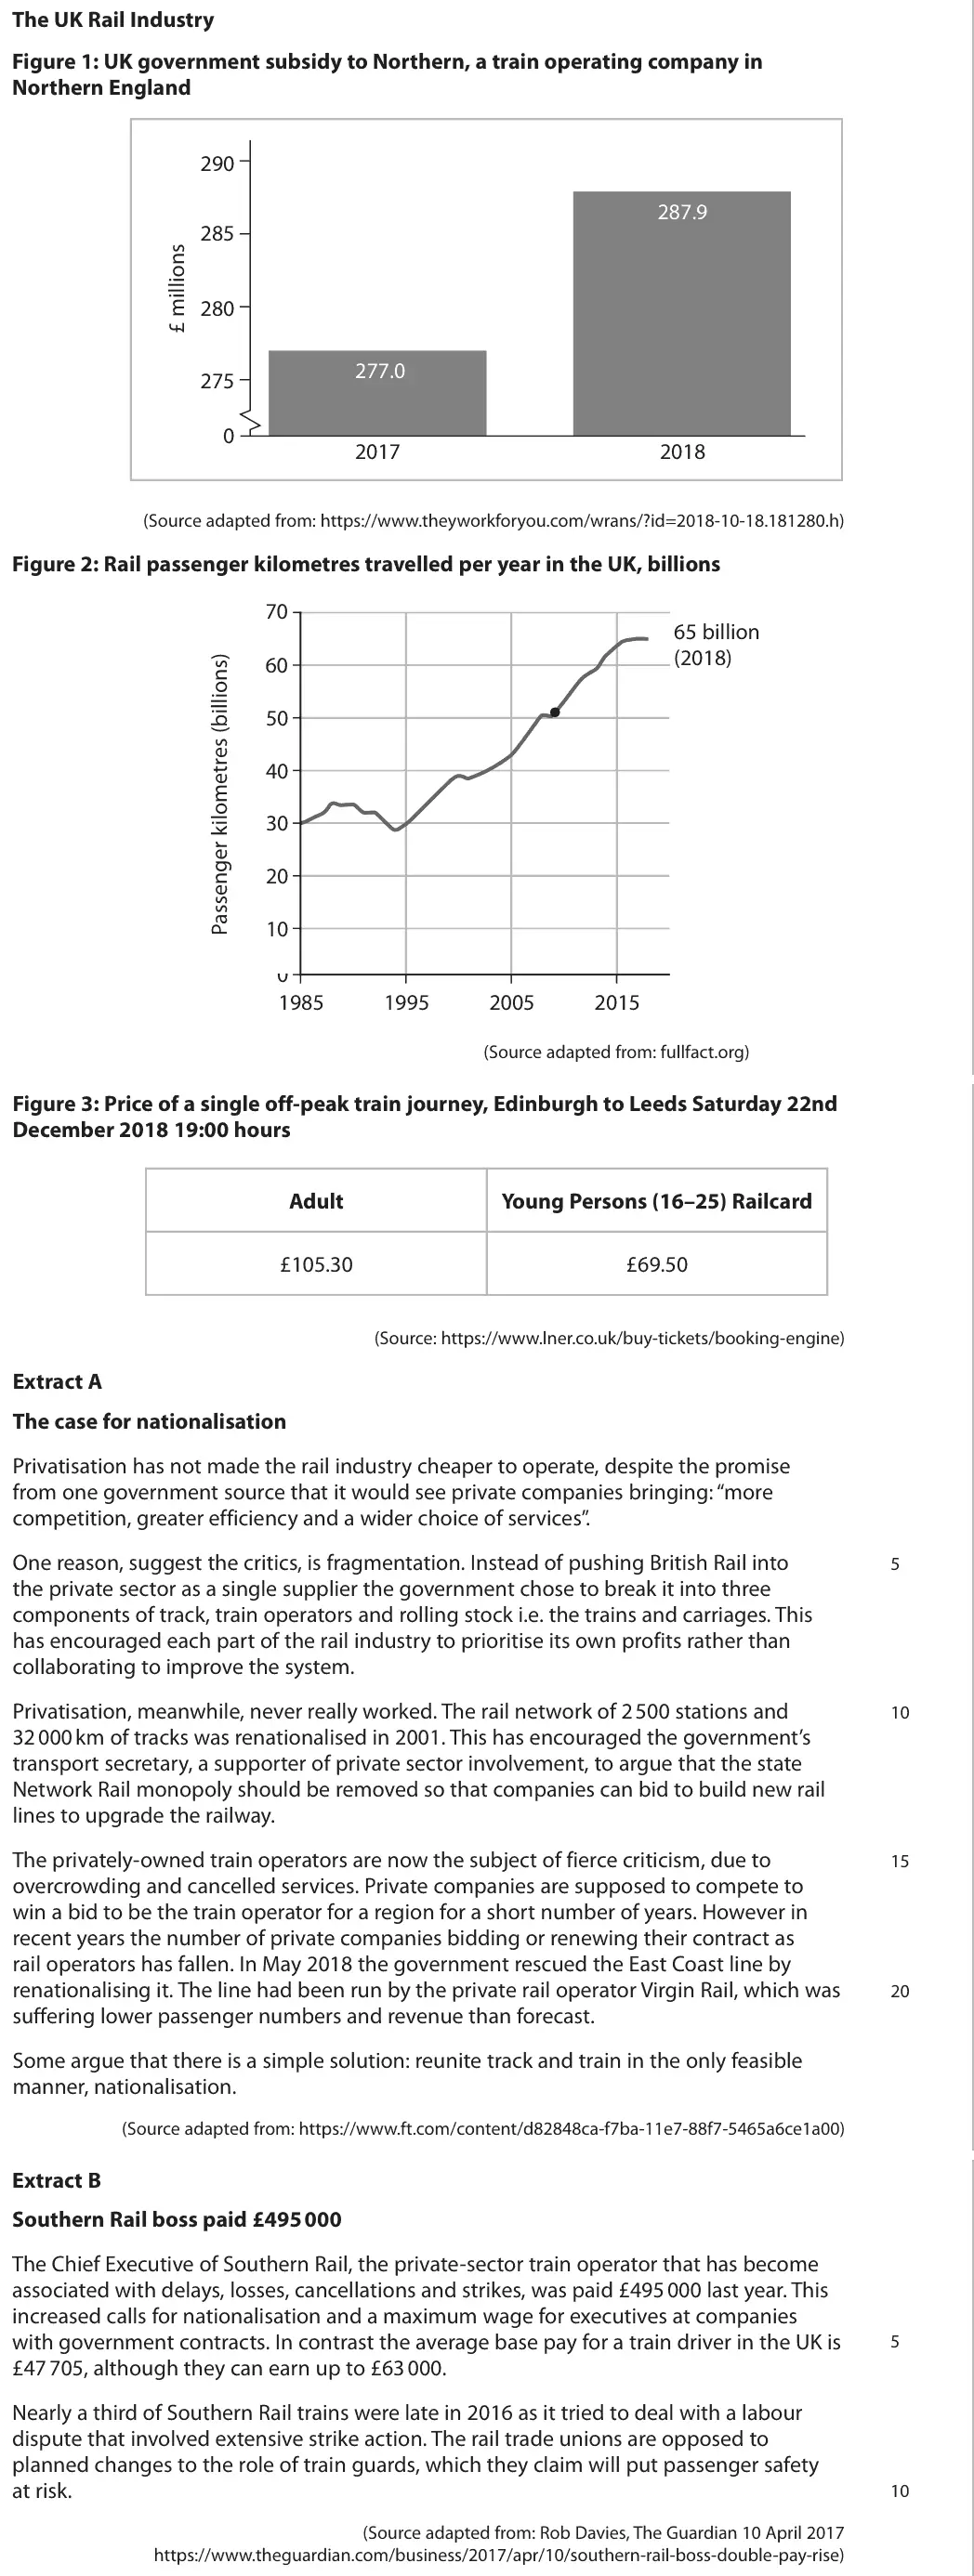
higher subsidy (£277m to £287.9m, about 3.9%) shifts supply right so fares fall (or rise less than they would with RPI-linked fares)
2 KAA marks reserved for an accurate diagram
report: a significant number ignored Figure 1
Quantitative skills: QS 2 (calculate, use and understand percentages, percentage changes and percentage point changes); QS 4 (construct and interpret a range of standard graphical forms); QS 9 (interpret, apply and analyse information in written, graphical tabular and numerical forms)
June 2019 · AS Paper 1 · Q4(a)1 markAO2=1Multiple choice
Data and extracts for question 4
Answer
A
Mark scheme
Notes from the mark scheme and report
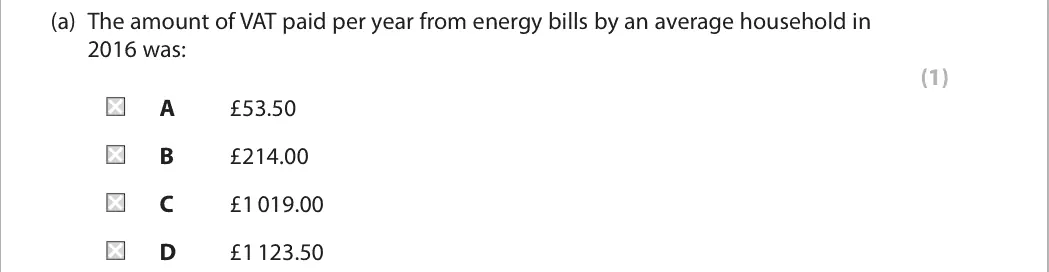
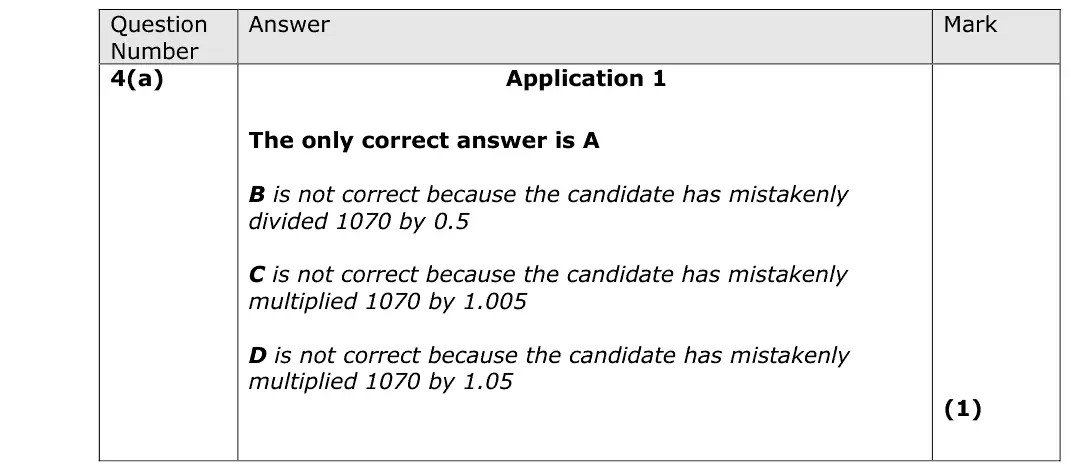
VAT = 5% x £1 070 = £53.50 (A)
B divides by 0.5, C multiplies by 1.005, D gives the bill including VAT (x 1.05)
Quantitative skills: QS 2 (calculate, use and understand percentages, percentage changes and percentage point changes)
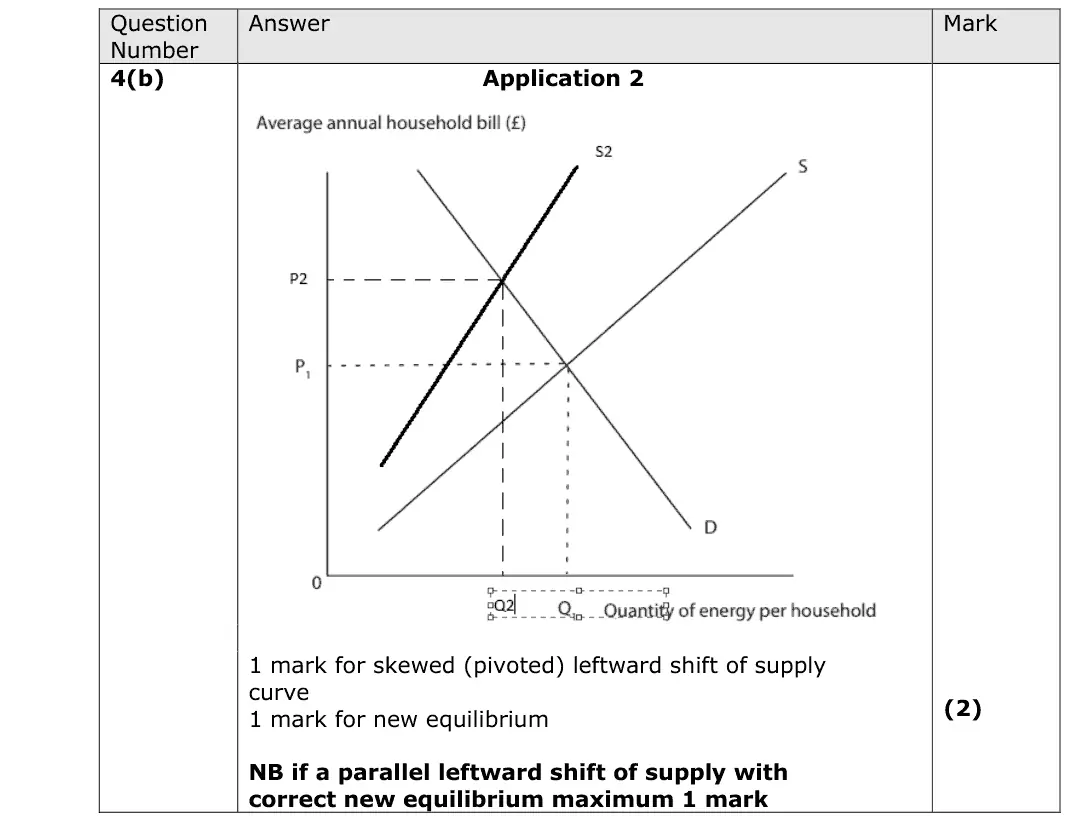
June 2019 · AS Paper 1 · Q4(b)2 marksAO2=2Short answer
Data and extracts for question 4
Mark scheme
Examiner's comment
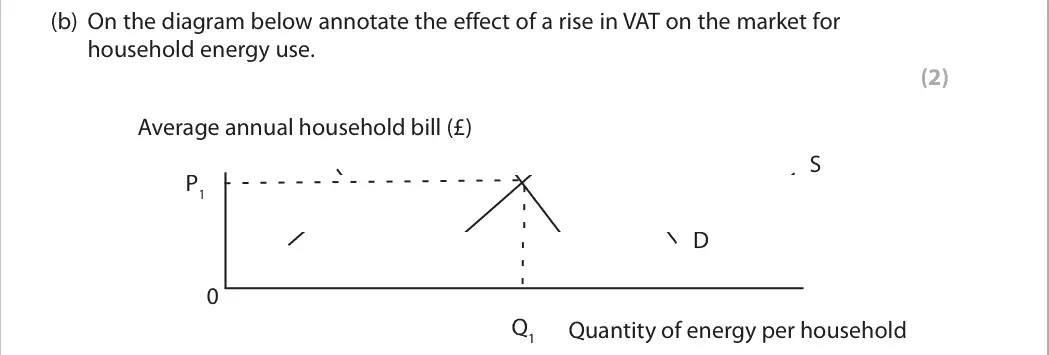
Most candidates were able to demonstrate a left shift of the supply curve in response to the rise in VAT on the market for energy use but the vast majority were unable to show a non-parallel or pivoted shift, tending to show only the impact of a specific rather than ad valorem tax.
Notes from the mark scheme and report
VAT is ad valorem so the supply curve pivots (non-parallel) left, plus the new equilibrium
a parallel shift (specific tax) scores max 1
most drew only a parallel shift
Quantitative skills: QS 4 (construct and interpret a range of standard graphical forms)
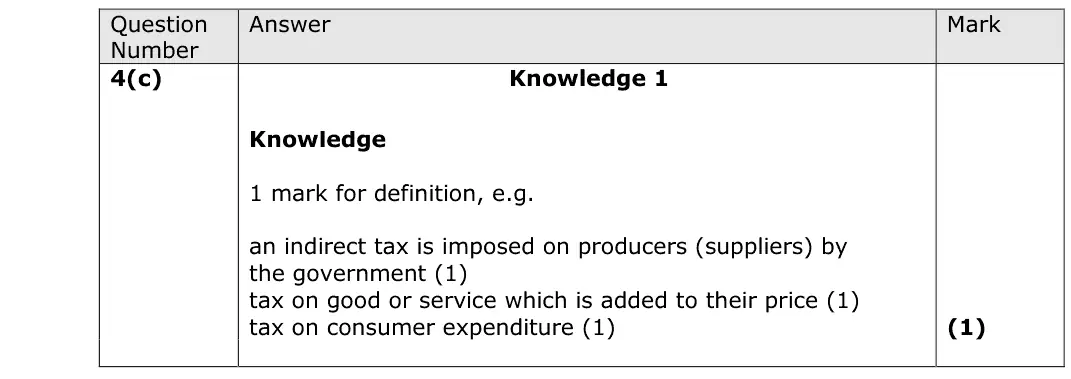
June 2019 · AS Paper 1 · Q4(c)1 markAO1=1Definition
Data and extracts for question 4
Mark scheme
Examiner's comment
This question required a definition of an indirect tax and the vast majority of candidates were able to perform this correctly, though over ten percent of the responses were either incorrect or too vague.
Notes from the mark scheme and report
a tax on spending on goods and services, imposed on producers and added to the price
over ten percent of answers were wrong or too vague
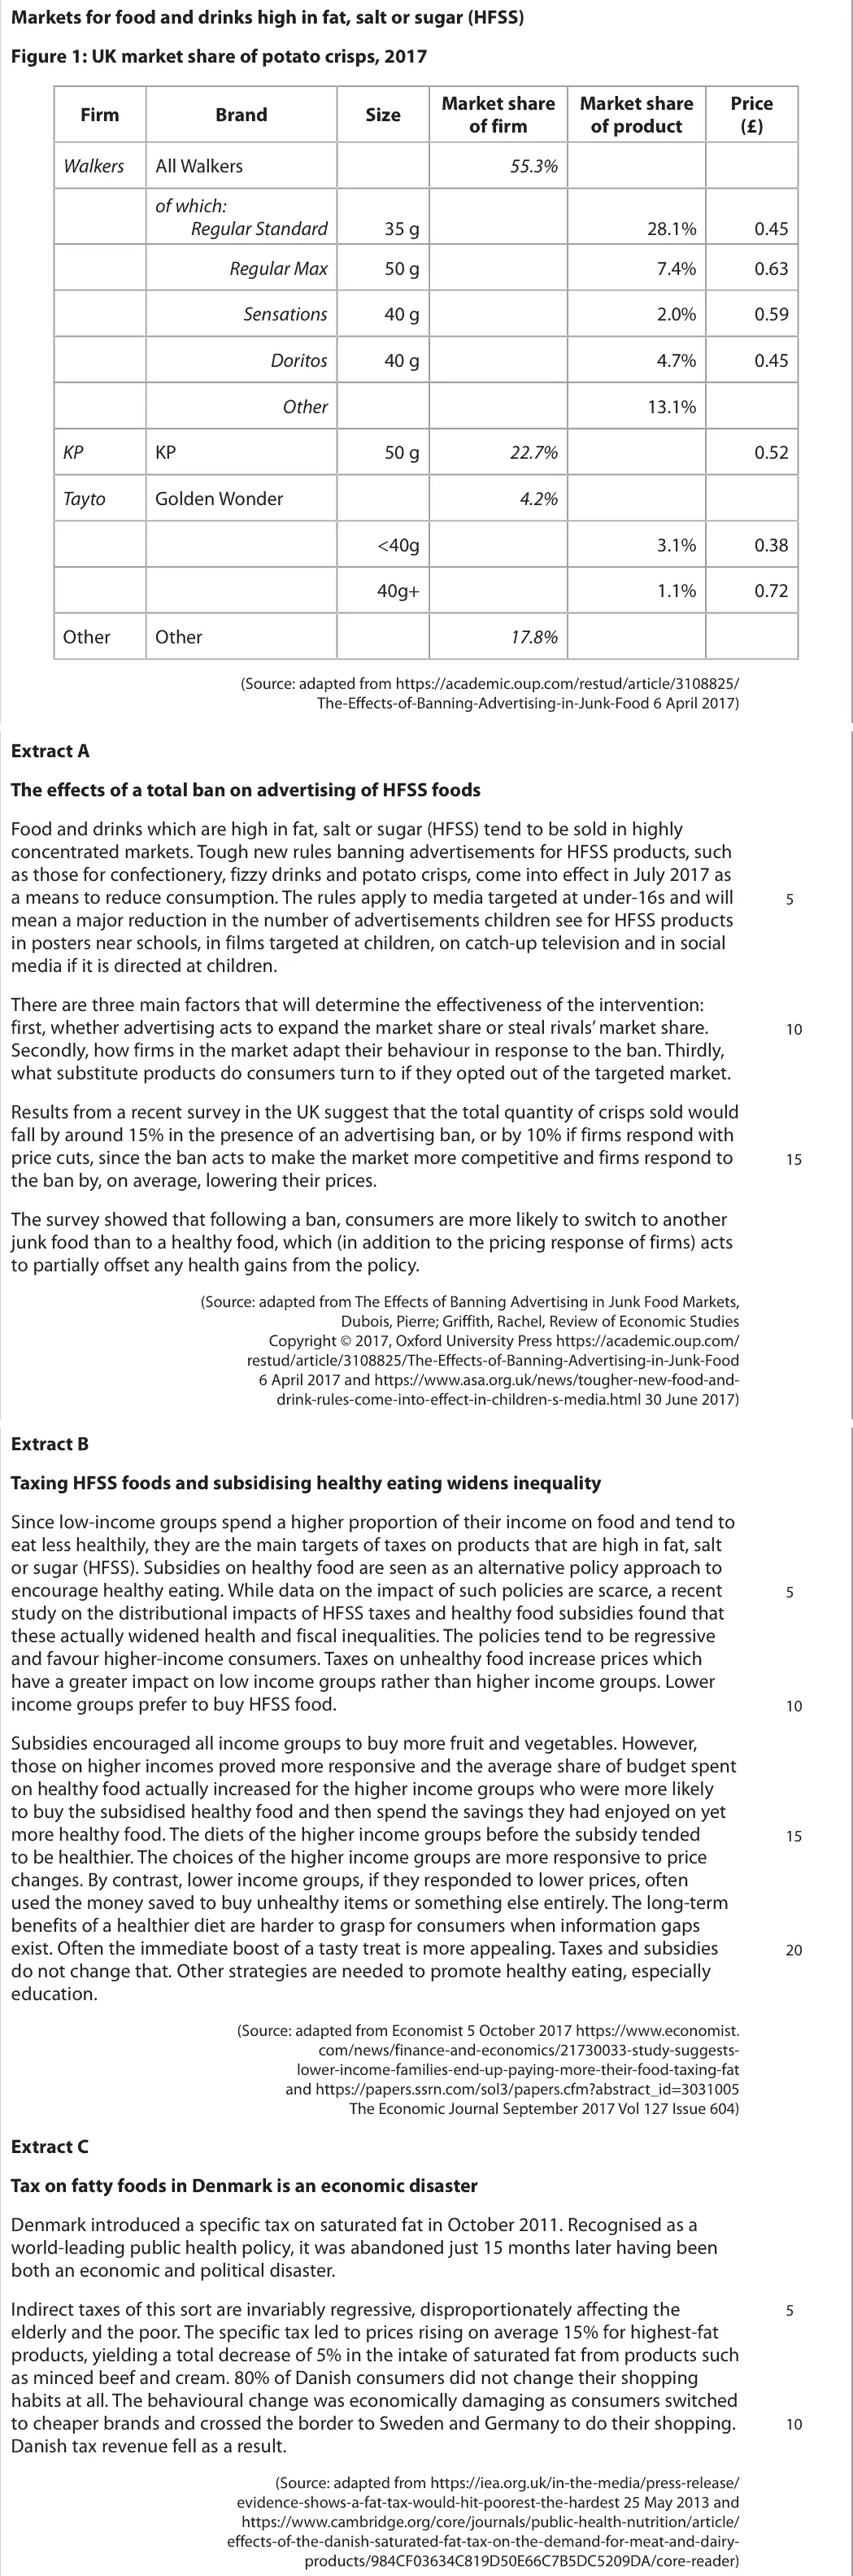
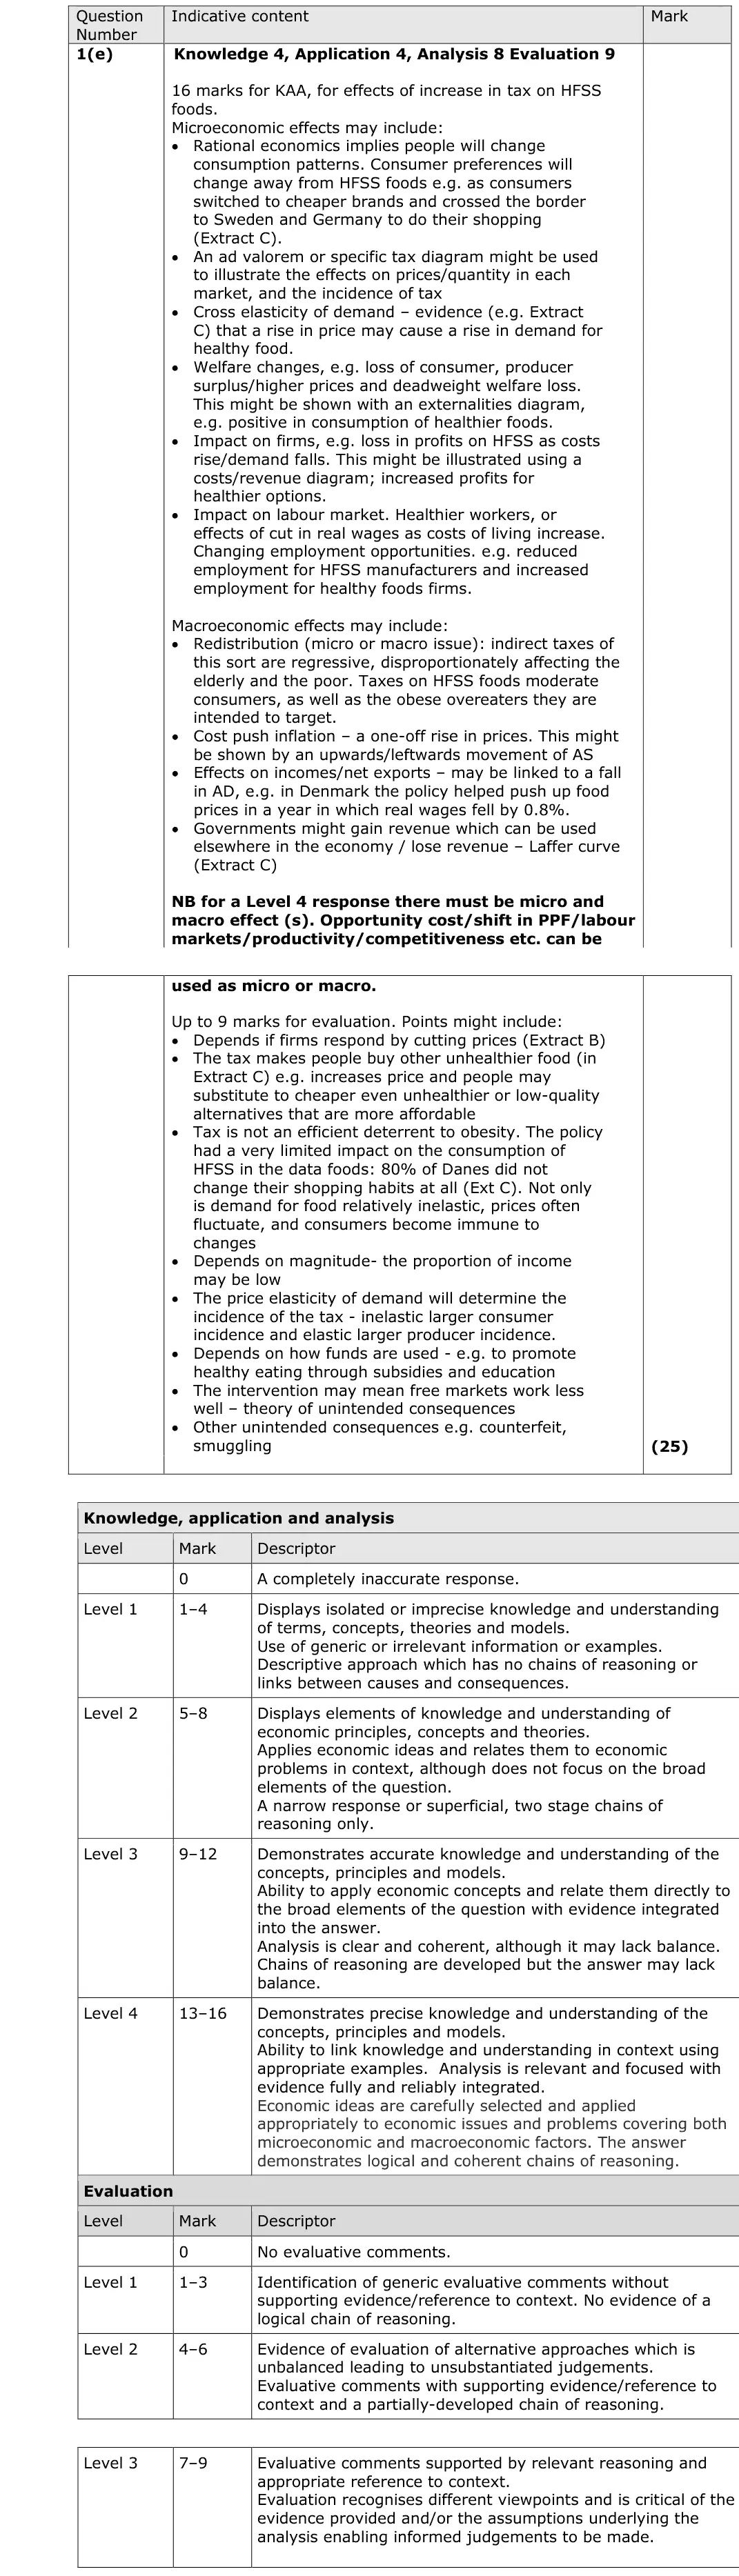
June 2019 · Paper 3 · Q1(e)25 marksAO1=4, AO2=4, AO3=8, AO4=925-mark essayEither/or
Data and extracts for question 1
Mark scheme, including the levels grid and indicative content
Examiner's comment
This was the slightly more popular essay on question 1. As with 1(d), candidates provided diagrams to help improve their analysis and there were a wide variety of diagrams that could be effective on this question to strengthen answers when integrated into valid and carefully explained chains of reasoning. Common microeconomic arguments included the impact on tax revenue and price/quantity for both healthy and unhealthy foods. There was again some confusion with the externality diagrams. Although many candidates correctly reproduced externalities diagram, this was very commonly shown on a negative production externalities diagram, which is not relevant to the context of the question. Healthy eating clearly implies it must be based on consumption, and it was difficult to see how a production diagram would add value to the answer, unless, perhaps, linked via the workforce. For macroeconomics, many candidates effectively used the extracts to develop arguments around inequality or focused on the use of tax revenue to improve UK macroeconomic performance. The best answers used an inward shift in SRAS in order to analyse implications such as inflation and reduced growth, although other logical arguments were accepted for other shifts. There was a lot of evidence of effective use of diagrams in this question including incidence of tax, cost and revenue and AS/AD. However, there was some common inaccuracy in the analysis of how the tax would be applied and the question was intended to be an application of an indirect tax, not a direct tax or tariff. Specific taxes (as in Extract C in Denmark) or ad valorem taxes (as with the UK's so called 'sugar tax') were both valid. This answer does have a good amount of context, but it is too focused on a particular type of tax and the AD arguments are tenuous. We ignored the rubbed out D+tax on the first diagram which still shows (the problem of using pencil is that it shows up well). As stated on 1(d), the best approach is to use the diagrams that candidates know well. Good responses used the tax diagram or a cost/revenue diagram to develop effective, top-level KAA microeconomic effects. Whilst a small minority of candidates could draw a negative consumption externality diagram with a tax, this was an overcomplicated and risky approach to scoring top marks, as shown here, and the first diagram was enough to take the micro to Level 4. The externality diagram did not add any marks on the micro side, being negative in production; the macro diagram is also taking the argument to Level 4. The best evaluation again used the context effectively. Candidates should practise reading the case studies under timed conditions to efficiently pick out key points and quotes that they can used in their answers, including for evaluation, as it really lifts their answers to the higher levels. Use of the Danish fat tax as an example of consumers switching to other unhealthy food could be used to make a case for government failure as an effective counter point. This data also allowed informed judgements about whether an indirect tax like this is really the best way forward. This response has been chosen to reflect the ongoing debate about negative externalities in consumption, that clearly can be used in this answer, but is not required for full marks. Certainly a diagram showing negative consumption externalities is neither expected nor required, although it would be one way to score marks if given. This is not advised as an approach, however, and there are much simpler and more effective ways to bring out analysis marks. Here are the concepts they need to know and the diagrams are the only time when they are narrowed down to consumption/production so we must presume that here we mean both types of externalities: 1.3.2 Externalities a) Distinction between private costs, external costs and social costs. b) Distinction between private benefits, external benefits and social benefits. The reason the diagram wasn’t credited is because the description in the text was about consumption and the diagram about production. If you use the negative in production then the two ideas are confused. It came across to the examiners as a confusion between to the two concepts (negative in consumption and negative in production) which the specification clearly states has to be learned. Negative in consumption has to be learned but not drawn so clearly we are saying that the mark scheme will not expect a diagram at this point. Often candidates learn or are taught more than the specification e.g. Nash equilibria, Rostow etc. The point we are making is that you do not have to know everything and there are diminishing returns in overteaching these four diagrams. A better option is a tax diagram or other diagrams such as positive in consumption of the healthy good, but in no way is anyone at an advantage if they have been taught things which are specifically not expected, and the point the senior examiners want to drive home is that you can teach what you will but the candidate cannot be marked down, ever, for not knowing something that someone in another centre has been taught as an extra.
Notes from the mark scheme and report
incidence depends on PED (inelastic demand, consumer bears most)
regressive (Extract B), Denmark tax abandoned after 15 months with cross-border shopping (Extract C)
use a consumption, not production, externality diagram
macro: inflation, SRAS, inequality, tax revenue
Level 4 needs micro and macro
June 2018 · Paper 1 · Q2(a)2 marksAO2=2Calculation
Data and extracts for question 2
Mark scheme
Examiner's comment
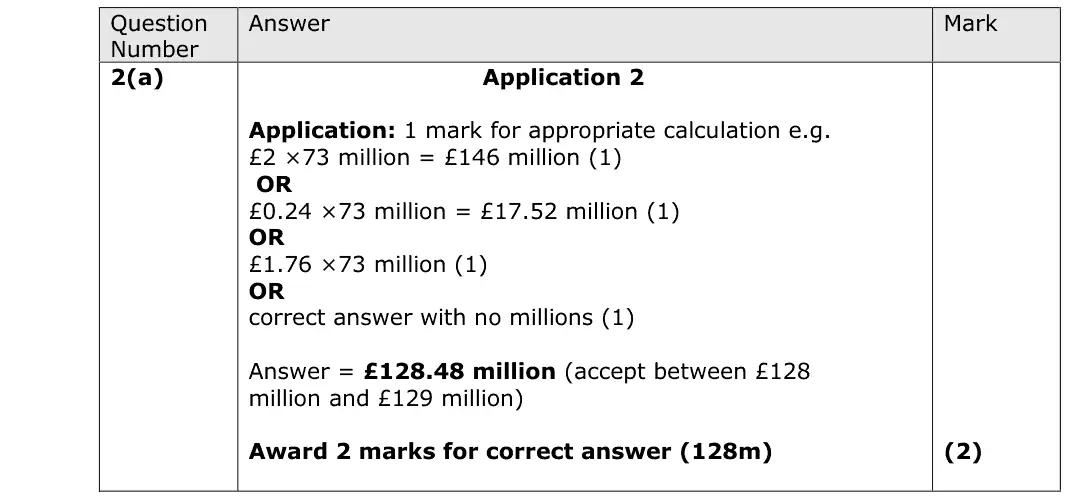
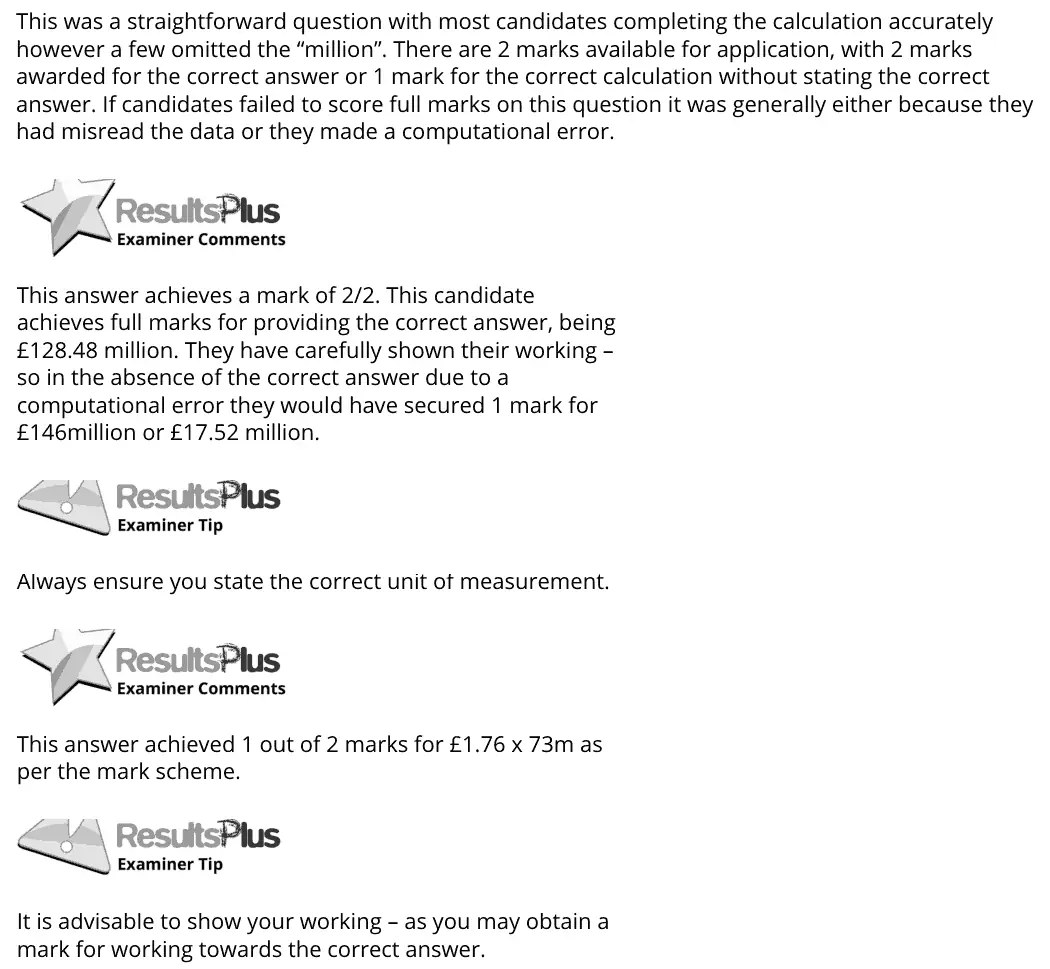
This was a straightforward question with most candidates completing the calculation accurately however a few omitted the “million”. There are 2 marks available for application, with 2 marks awarded for the correct answer or 1 mark for the correct calculation without stating the correct answer. If candidates failed to score full marks on this question it was generally either because they had misread the data or they made a computational error. This answer achieves a mark of 2/2. This candidate achieves full marks for providing the correct answer, being £128.48 million. They have carefully shown their working – so in the absence of the correct answer due to a computational error they would have secured 1 mark for £146million or £17.52 million. Always ensure you state the correct unit of measurement. This answer achieved 1 out of 2 marks for £1.76 x 73m as per the mark scheme. It is advisable to show your working – as you may obtain a mark for working towards the correct answer.
Notes from the mark scheme and report
(£2 - £0.24) x 73 million = £128.48 million, or £146m - £17.52m
omitting "million" or misreading the data lost marks
June 2017 · AS Paper 1 · Q3(a)1 markAO1=1Definition
Data and extracts for question 3
Mark scheme
Examiner's comment
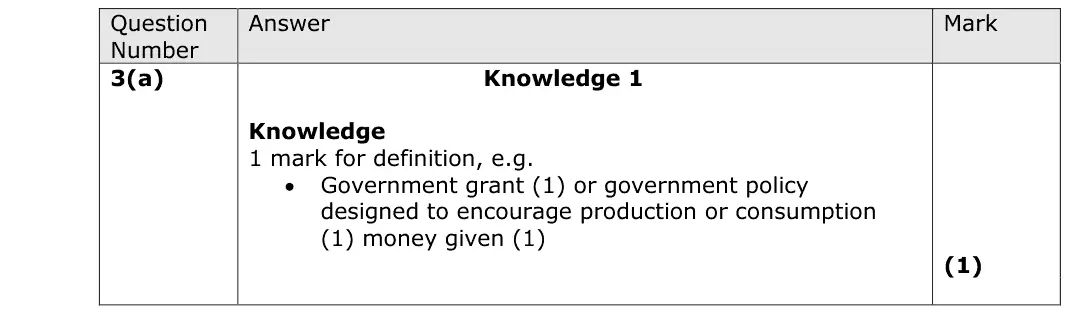
This was a high scoring answer. The most common answers referred to government grant or encouraging consumption or production usually in context. This answer achieved 1 out of 1 mark. Definition of ‘subsidy’ was accurately provided (1). The mark scheme accommodates a range of accurate economic definitions for ‘subsidy’. Concise accurate answers for 1 mark are the best approach. It is important you do not confuse definitions with causes or effects and thereby fail to answer the question. This answer achieved 1 out of 1 mark. The shift supply outwards if provided as the only response would not have been awarded but government intervention encouraging production was awarded.
Notes from the mark scheme and report
a government grant to producers to encourage production or consumption
do not give the effect (supply shifts out) as the definition
June 2017 · Paper 1 · Q3(a)2 marksAO2=2Calculation
Data and extracts for question 3
Mark scheme
Examiner's comment
In this question it was clear who knew how to calculate subsidy and who did not. A number of candidates lost a mark as 'million' was missing from their answer as the unit of measure. Candidates need to practice similar subsidy and tax diagrams from Theme 1. This answer achieves a mark of 2/2. This candidate achieves full marks for providing the correct answer, being 1,022,400,000. Best practice is always to state the currency. This answer achieves a mark of 1/2. The candidate can only be awarded 1 mark as million, the unit of measure, is missing. Always ensure you state the correct unit of measurement.
Notes from the mark scheme and report
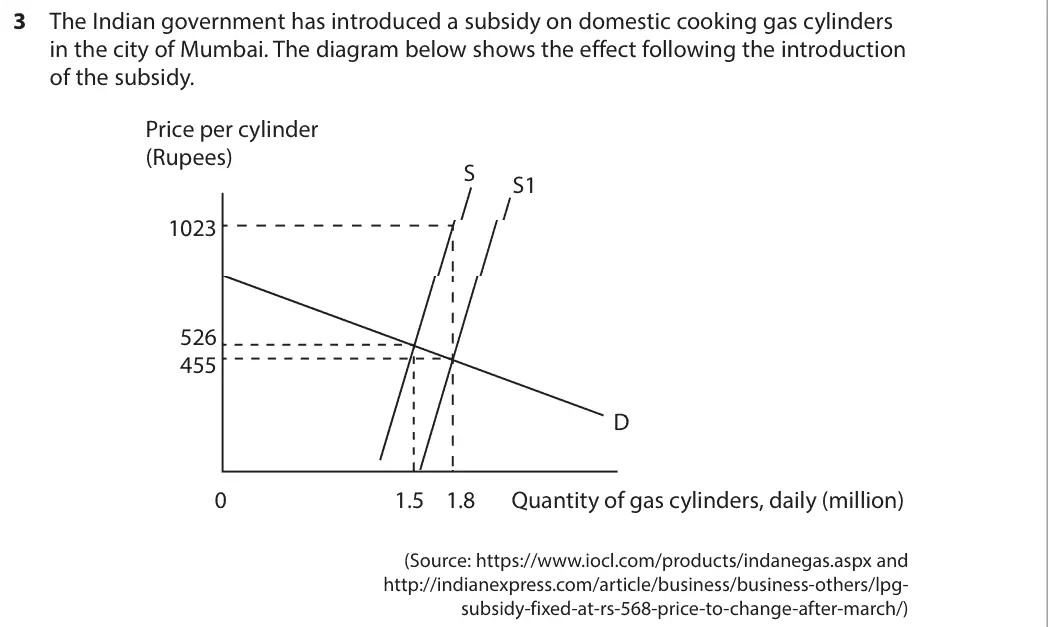
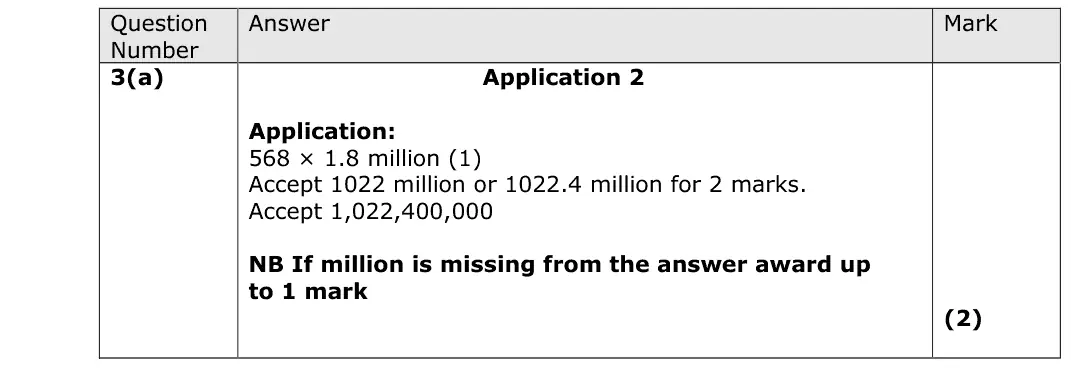
subsidy per unit = 1023 - 455 = 568 rupees x 1.8 million cylinders = 1 022.4 million rupees
leaving out "million" loses a mark
read the subsidy as the vertical gap between S and S1 at the new quantity
Quantitative skills: QS 4 (construct and interpret a range of standard graphical forms); QS 9 (interpret, apply and analyse information in written, graphical tabular and numerical forms)
June 2017 · AS Paper 1 · Q3(b)1 markAO1=1Multiple choice
Data and extracts for question 3
Answer
C
Mark scheme
Notes from the mark scheme and report
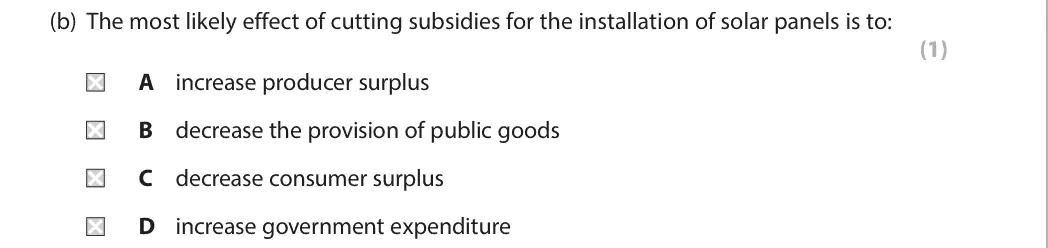
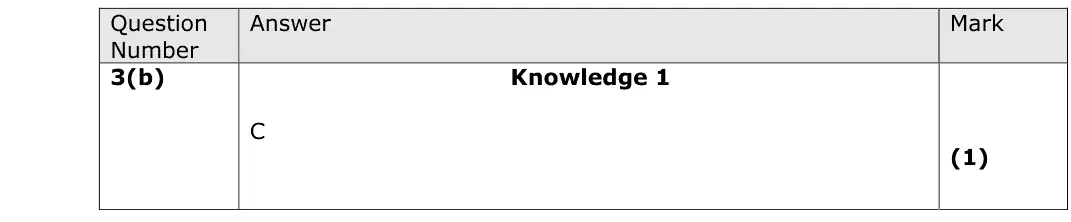
removing the subsidy shifts supply left, raising price and cutting quantity, so consumer surplus falls (C)
producer surplus falls and government spending falls
solar panels are not a public good
June 2017 · Paper 1 · Q3(b)(i)1 markCalculation
Data and extracts for question 3
Mark scheme
Examiner's comment
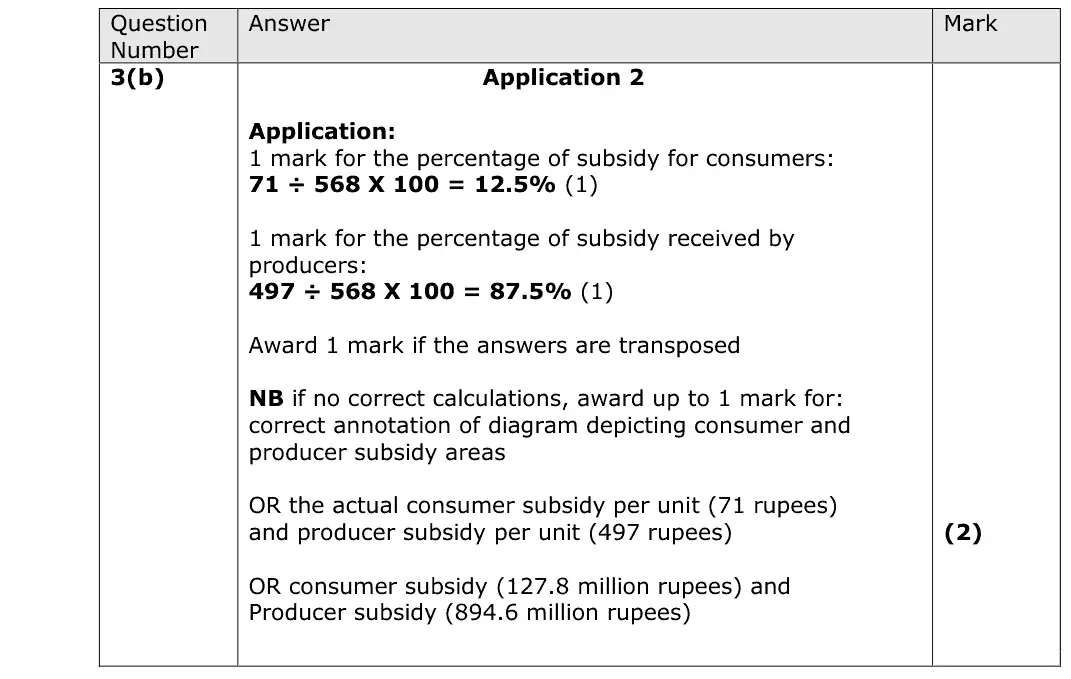
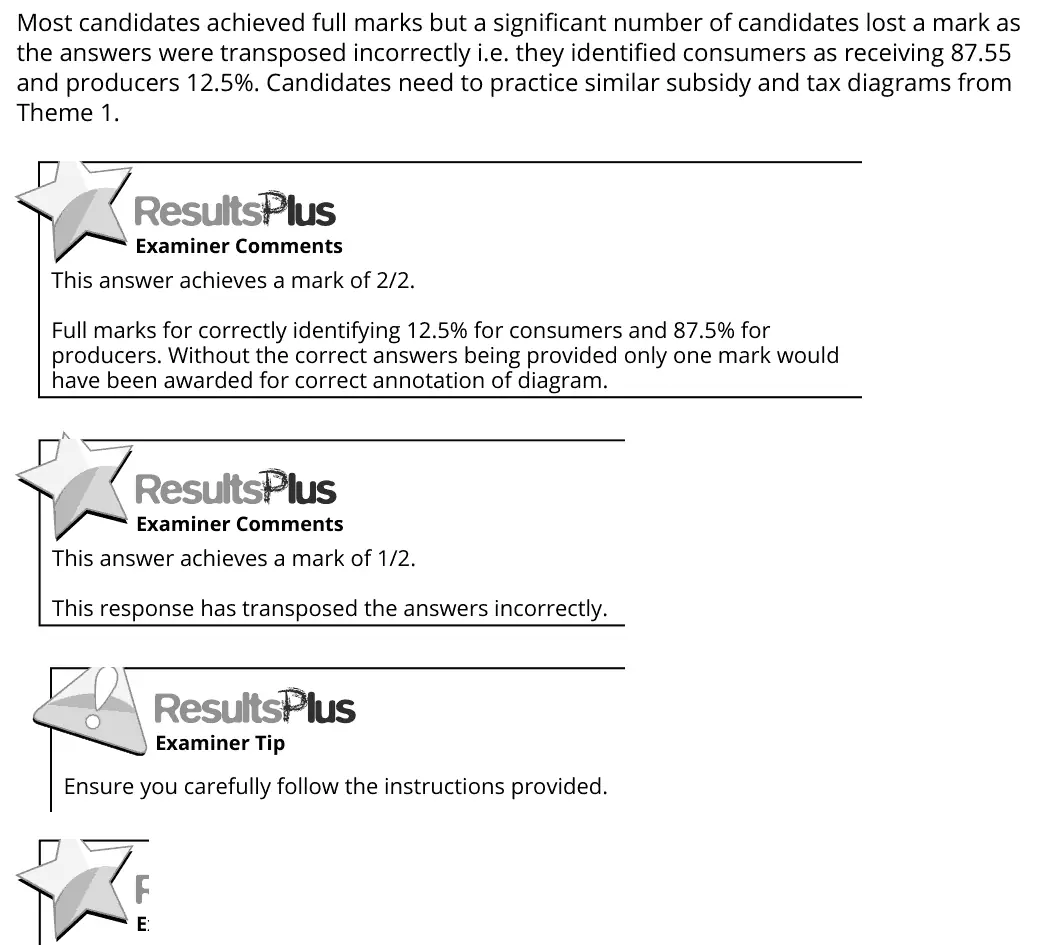
Most candidates achieved full marks but a significant number of candidates lost a mark as the answers were transposed incorrectly i.e. they identified consumers as receiving 87.55 and producers 12.5%. Candidates need to practice similar subsidy and tax diagrams from Theme 1. This answer achieves a mark of 2/2. Full marks for correctly identifying 12.5% for consumers and 87.5% for producers. Without the correct answers being provided only one mark would have been awarded for correct annotation of diagram. This answer achieves a mark of 1/2. This response has transposed the answers incorrectly. Ensure you carefully follow the instructions provided.
Notes from the mark scheme and report
consumers gain the fall in price 526 - 455 = 71 rupees: 71 / 568 x 100 = 12.5%
report: a significant number transposed the consumer and producer shares
Quantitative skills: QS 2 (calculate, use and understand percentages, percentage changes and percentage point changes); QS 4 (construct and interpret a range of standard graphical forms); QS 9 (interpret, apply and analyse information in written, graphical tabular and numerical forms)
June 2017 · Paper 1 · Q3(b)(ii)1 markCalculation
Data and extracts for question 3
Mark scheme
Examiner's comment
Most candidates achieved full marks but a significant number of candidates lost a mark as the answers were transposed incorrectly i.e. they identified consumers as receiving 87.55 and producers 12.5%. Candidates need to practice similar subsidy and tax diagrams from Theme 1. This answer achieves a mark of 2/2. Full marks for correctly identifying 12.5% for consumers and 87.5% for producers. Without the correct answers being provided only one mark would have been awarded for correct annotation of diagram. This answer achieves a mark of 1/2. This response has transposed the answers incorrectly. Ensure you carefully follow the instructions provided.
supply is inelastic so producers gain most of the subsidy
Quantitative skills: QS 2 (calculate, use and understand percentages, percentage changes and percentage point changes); QS 4 (construct and interpret a range of standard graphical forms); QS 9 (interpret, apply and analyse information in written, graphical tabular and numerical forms)
June 2017 · AS Paper 1 · Q3(c)2 marksAO2=2Diagram
Data and extracts for question 3
Mark scheme
Examiner's comment
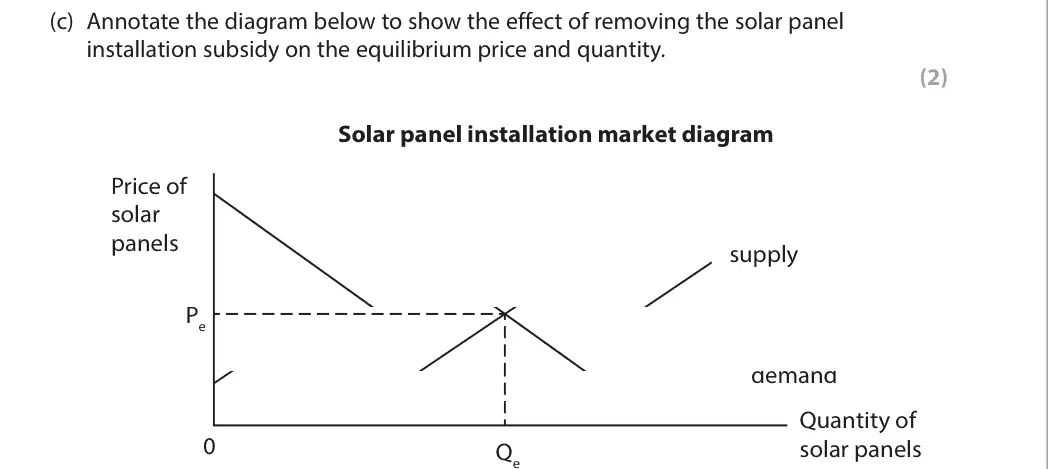
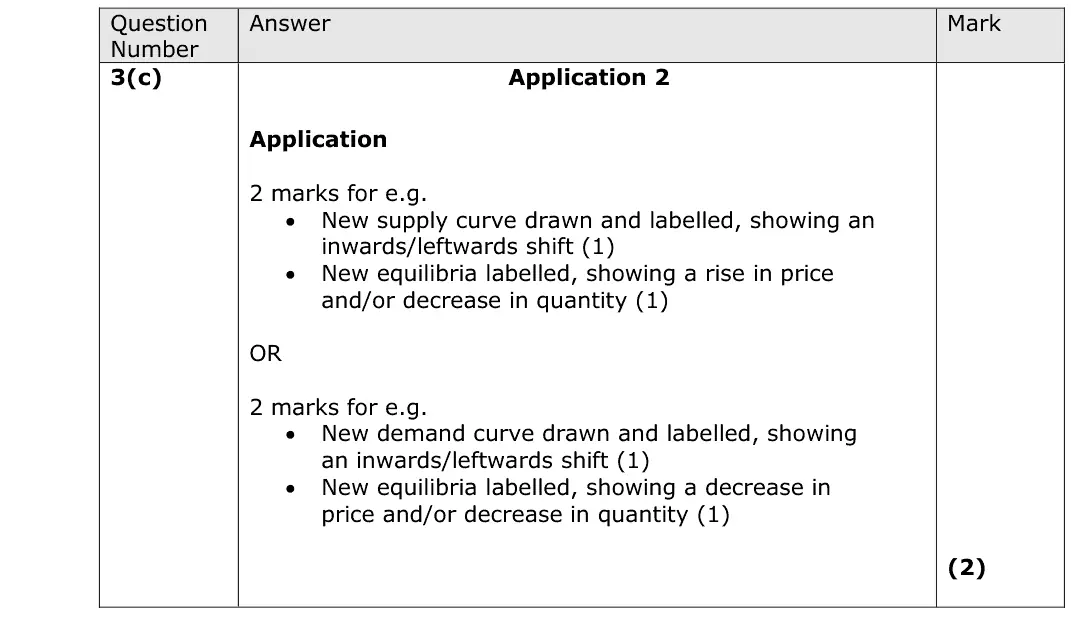
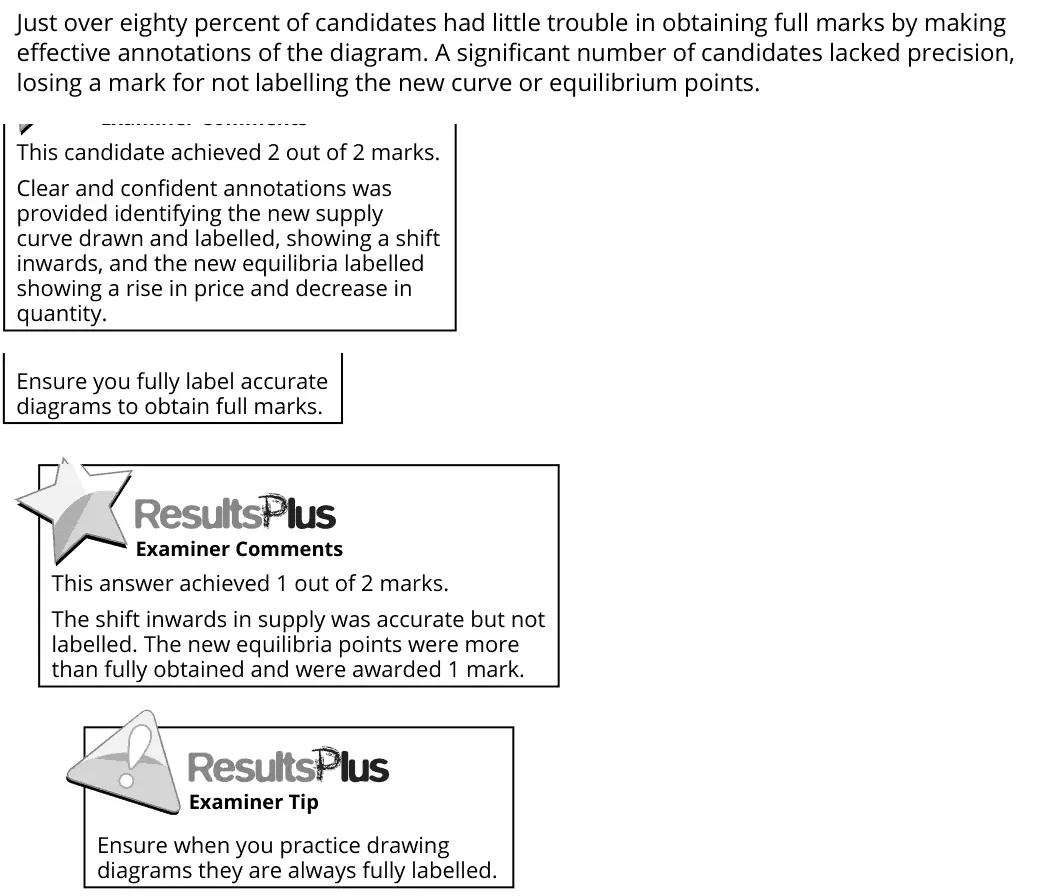
Just over eighty percent of candidates had little trouble in obtaining full marks by making effective annotations of the diagram. A significant number of candidates lacked precision, losing a mark for not labelling the new curve or equilibrium points. This candidate achieved 2 out of 2 marks. Clear and confident annotations was provided identifying the new supply curve drawn and labelled, showing a shift inwards, and the new equilibria labelled showing a rise in price and decrease in quantity. Ensure you fully label accurate diagrams to obtain full marks. This answer achieved 1 out of 2 marks. The shift inwards in supply was accurate but not labelled. The new equilibria points were more than fully obtained and were awarded 1 mark. Ensure when you practice drawing diagrams they are always fully labelled.
Notes from the mark scheme and report
draw and label the new supply curve shifted left and label the new equilibrium (higher price, lower quantity)
a significant number lost a mark for not labelling the new curve or equilibrium
command word is 'Annotate'
Quantitative skills: QS 4 (construct and interpret a range of standard graphical forms)
June 2017 · Paper 1 · Q725 marksAO1=4, AO2=4, AO3=8, AO4=925-mark essayEither/or
Mark scheme, including the levels grid and indicative content
Examiner's comment
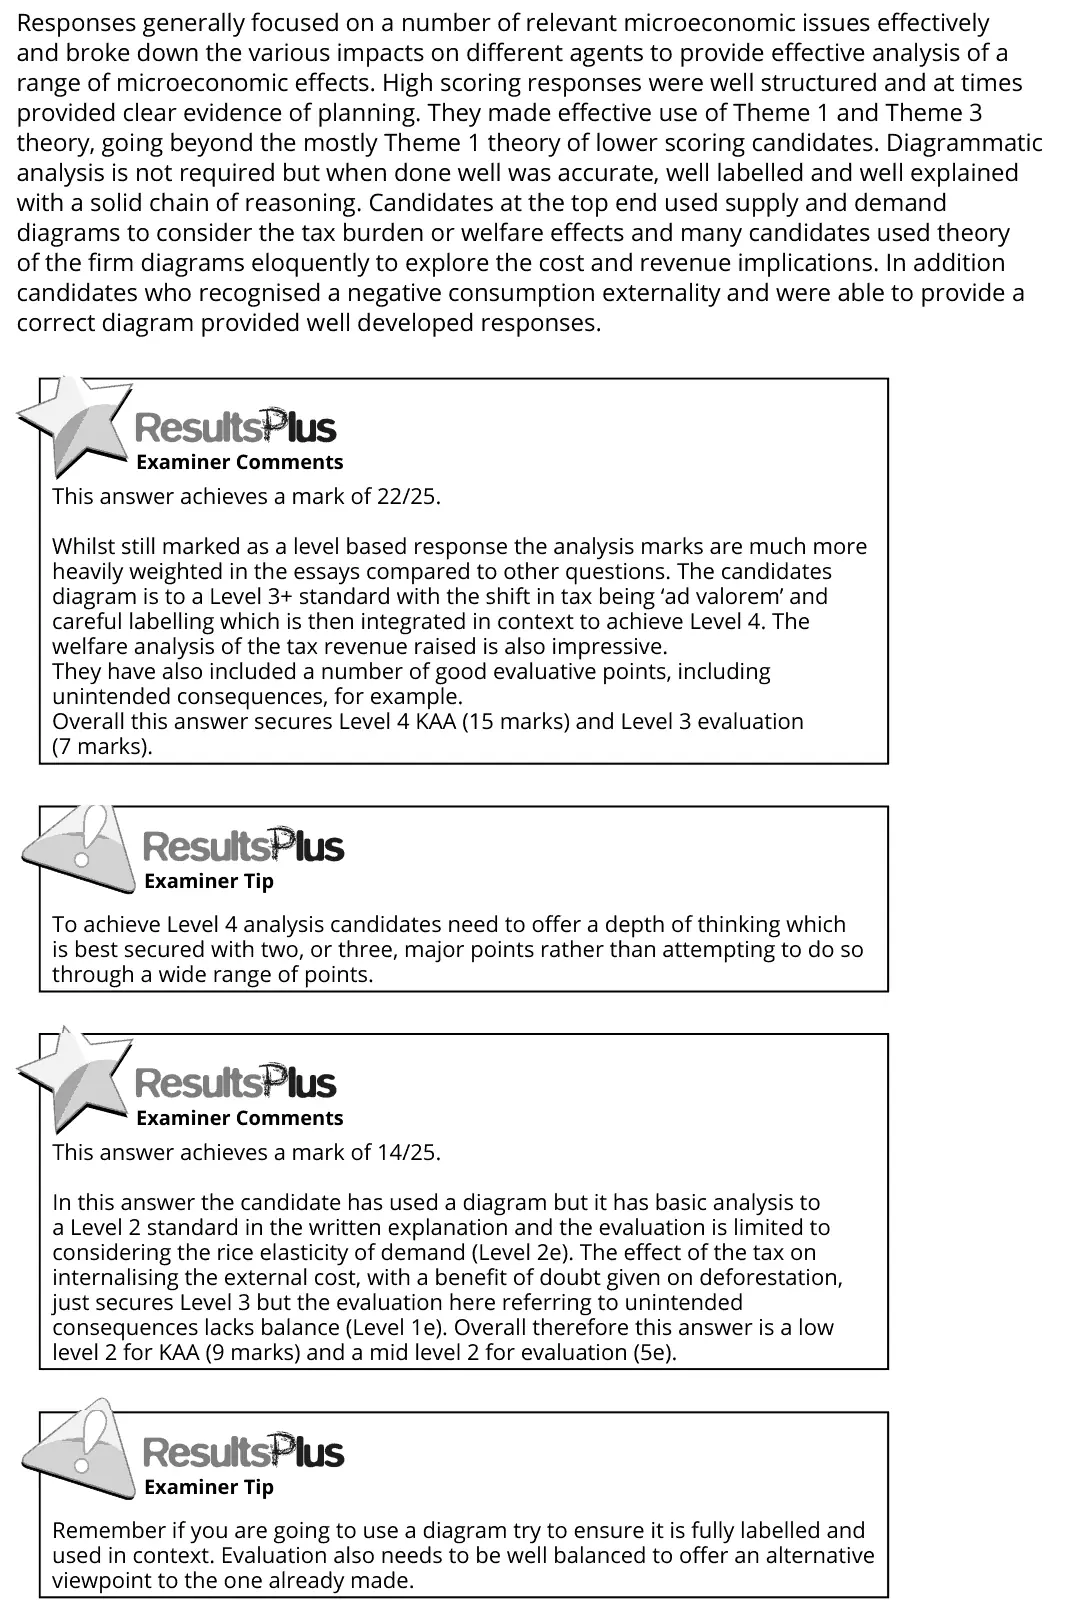
Responses generally focused on a number of relevant microeconomic issues effectively and broke down the various impacts on different agents to provide effective analysis of a range of microeconomic effects. High scoring responses were well structured and at times provided clear evidence of planning. They made effective use of Theme 1 and Theme 3 theory, going beyond the mostly Theme 1 theory of lower scoring candidates. Diagrammatic analysis is not required but when done well was accurate, well labelled and well explained with a solid chain of reasoning. Candidates at the top end used supply and demand diagrams to consider the tax burden or welfare effects and many candidates used theory of the firm diagrams eloquently to explore the cost and revenue implications. In addition candidates who recognised a negative consumption externality and were able to provide a correct diagram provided well developed responses. This answer achieves a mark of 22/25. Whilst still marked as a level based response the analysis marks are much more heavily weighted in the essays compared to other questions. The candidates diagram is to a Level 3+ standard with the shift in tax being ‘ad valorem’ and careful labelling which is then integrated in context to achieve Level 4. The welfare analysis of the tax revenue raised is also impressive. They have also included a number of good evaluative points, including unintended consequences, for example. Overall this answer secures Level 4 KAA (15 marks) and Level 3 evaluation (7 marks). To achieve Level 4 analysis candidates need to offer a depth of thinking which is best secured with two, or three, major points rather than attempting to do so through a wide range of points. This answer achieves a mark of 14/25. In this answer the candidate has used a diagram but it has basic analysis to a Level 2 standard in the written explanation and the evaluation is limited to considering the rice elasticity of demand (Level 2e). The effect of the tax on internalising the external cost, with a benefit of doubt given on deforestation, just secures Level 3 but the evaluation here referring to unintended consequences lacks balance (Level 1e). Overall therefore this answer is a low level 2 for KAA (9 marks) and a mid level 2 for evaluation (5e). Remember if you are going to use a diagram try to ensure it is fully labelled and used in context. Evaluation also needs to be well balanced to offer an alternative viewpoint to the one already made.
Notes from the mark scheme and report
ad valorem tax shifts supply by a widening gap
incidence depends on PED
loss of consumer and producer surplus
internalises the external cost of sugary drinks
effects on firms' costs and profits (Theme 3 diagrams)
evaluate with inelastic demand, regressive effect, substitutes and unintended consequences
two or three developed points beat a wide list
Work with an Edexcel economics tutor
Essays stuck in Level 2, or losing the easy marks in Section A? Book a trial session with Lianne, a former Edexcel examiner.