June 2017: Paper 2

100 marks · 18 question parts · Paper, mark scheme and report on Pearson's site

Question by question

QTopicMarksAOType
1(a) Employment and unemployment 1Multiple choice
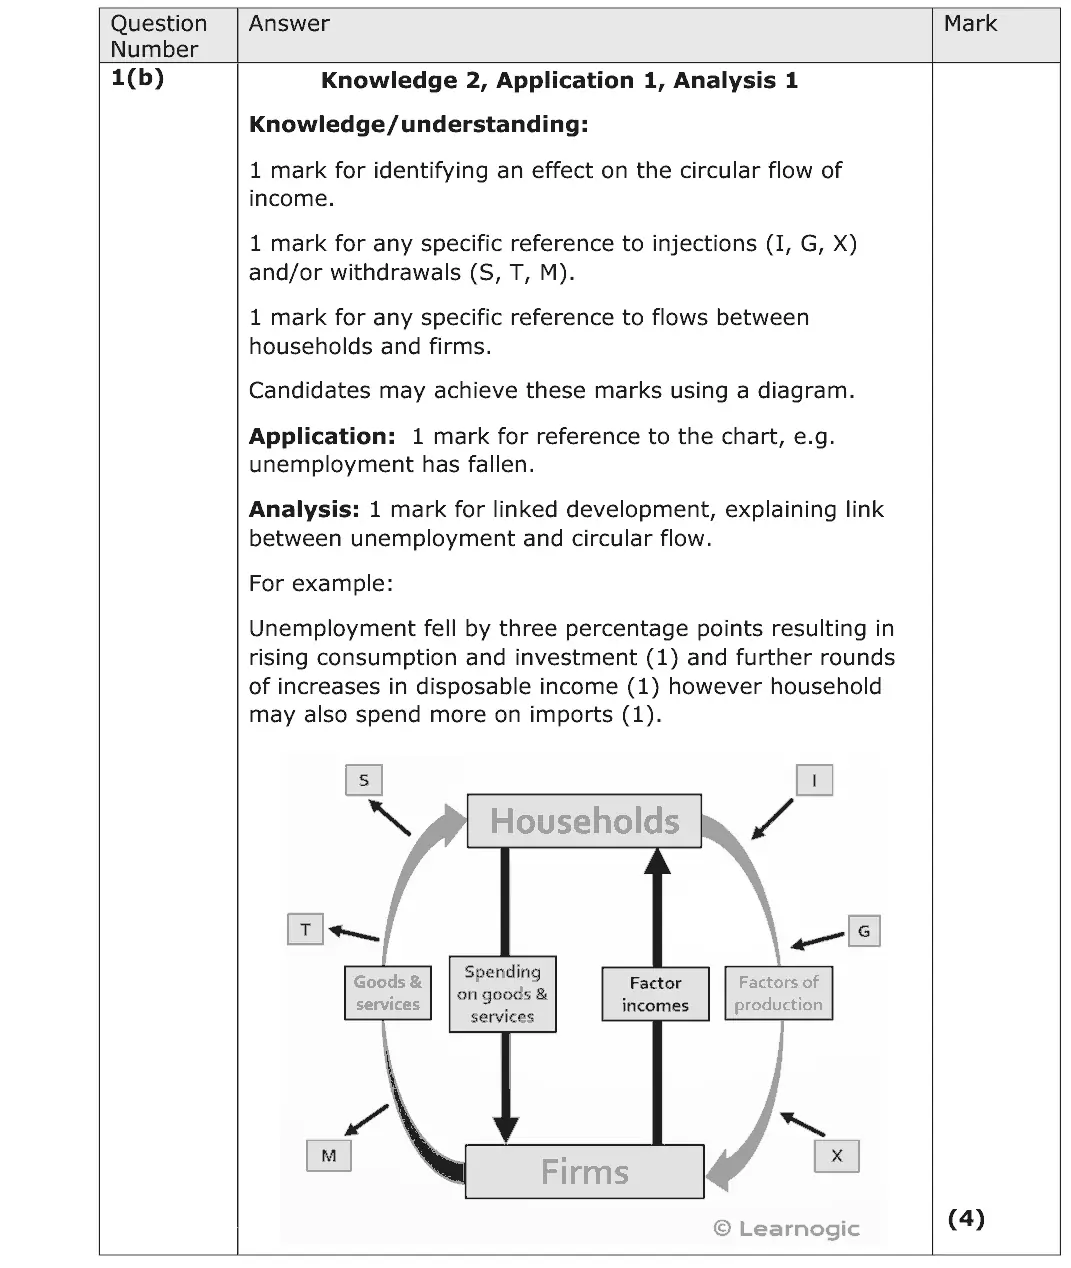
1(b) The circular flow, national income and the multiplier 4AO1=2,AO2=1,AO3=1Short answer
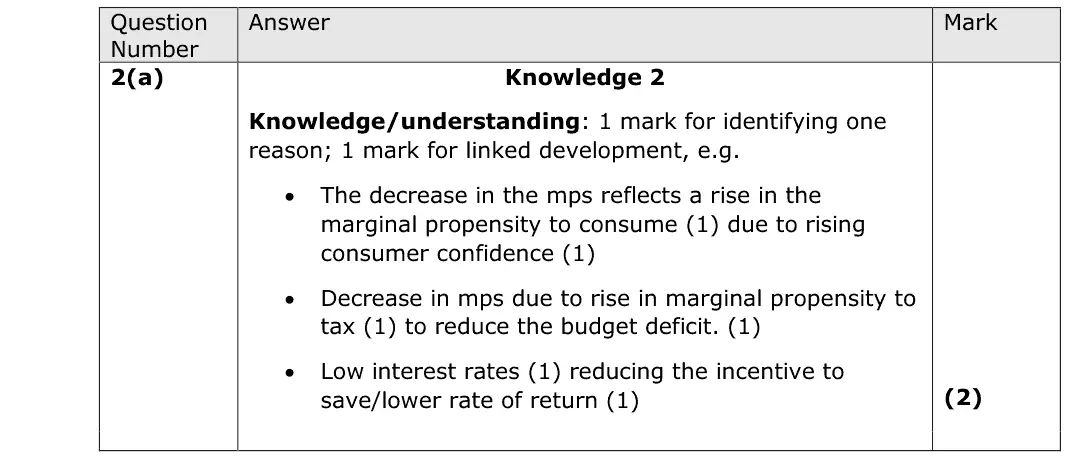
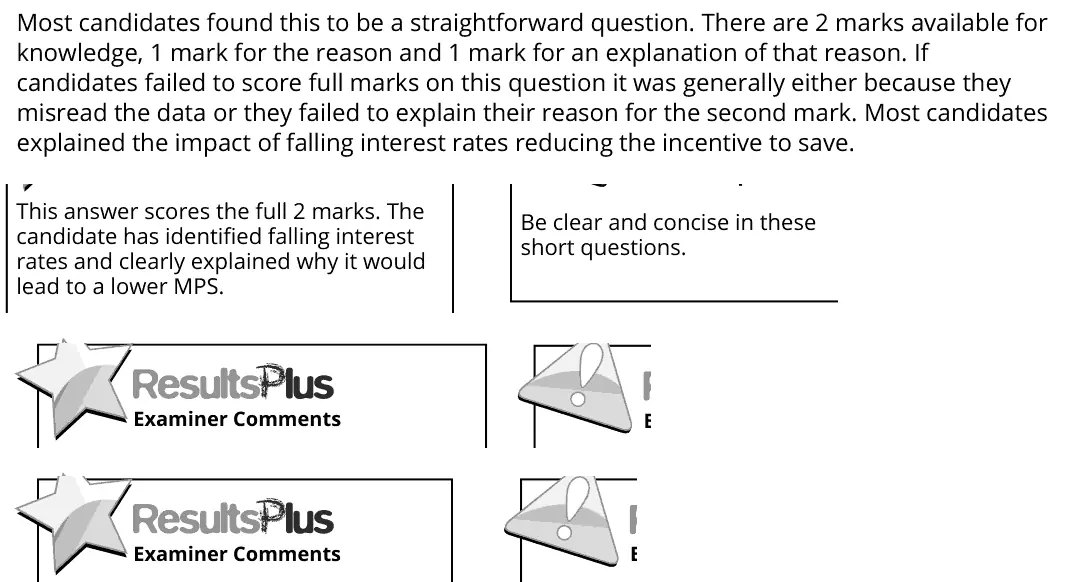
2(a) Aggregate demand 2AO1=2Short answer
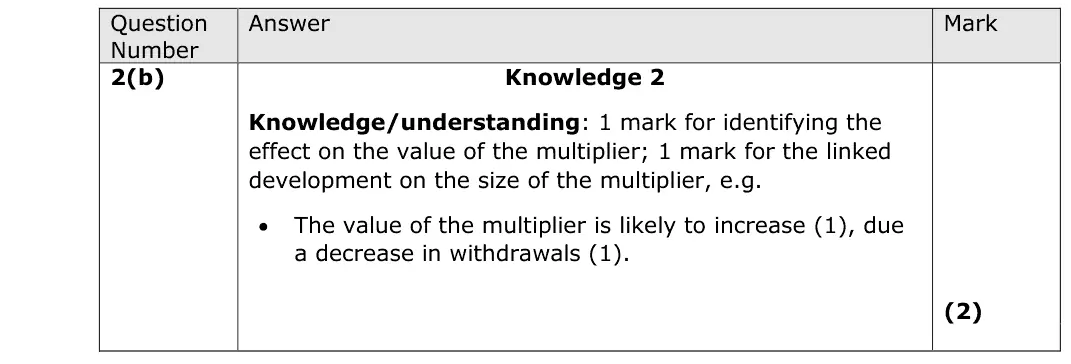
2(b) The circular flow, national income and the multiplier 2AO1=2Short answer
2(c) The circular flow, national income and the multiplier 1Multiple choice
3(a) Inflation 1Multiple choice
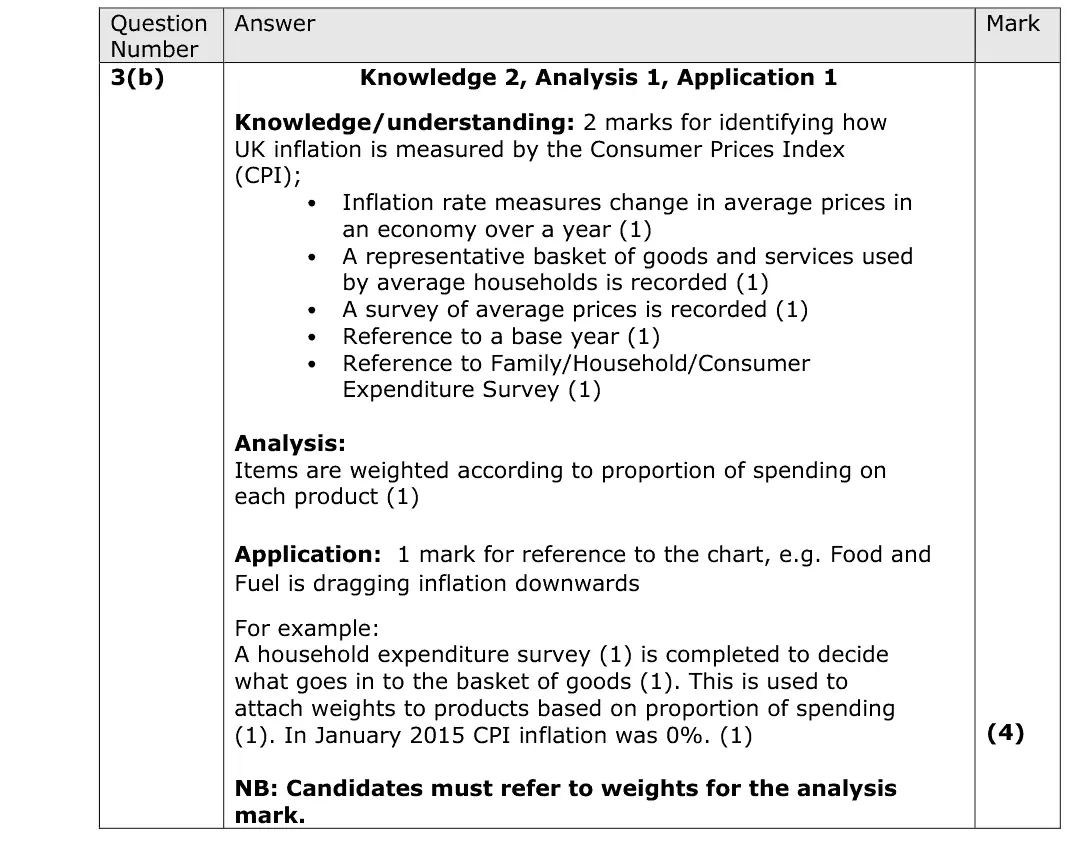
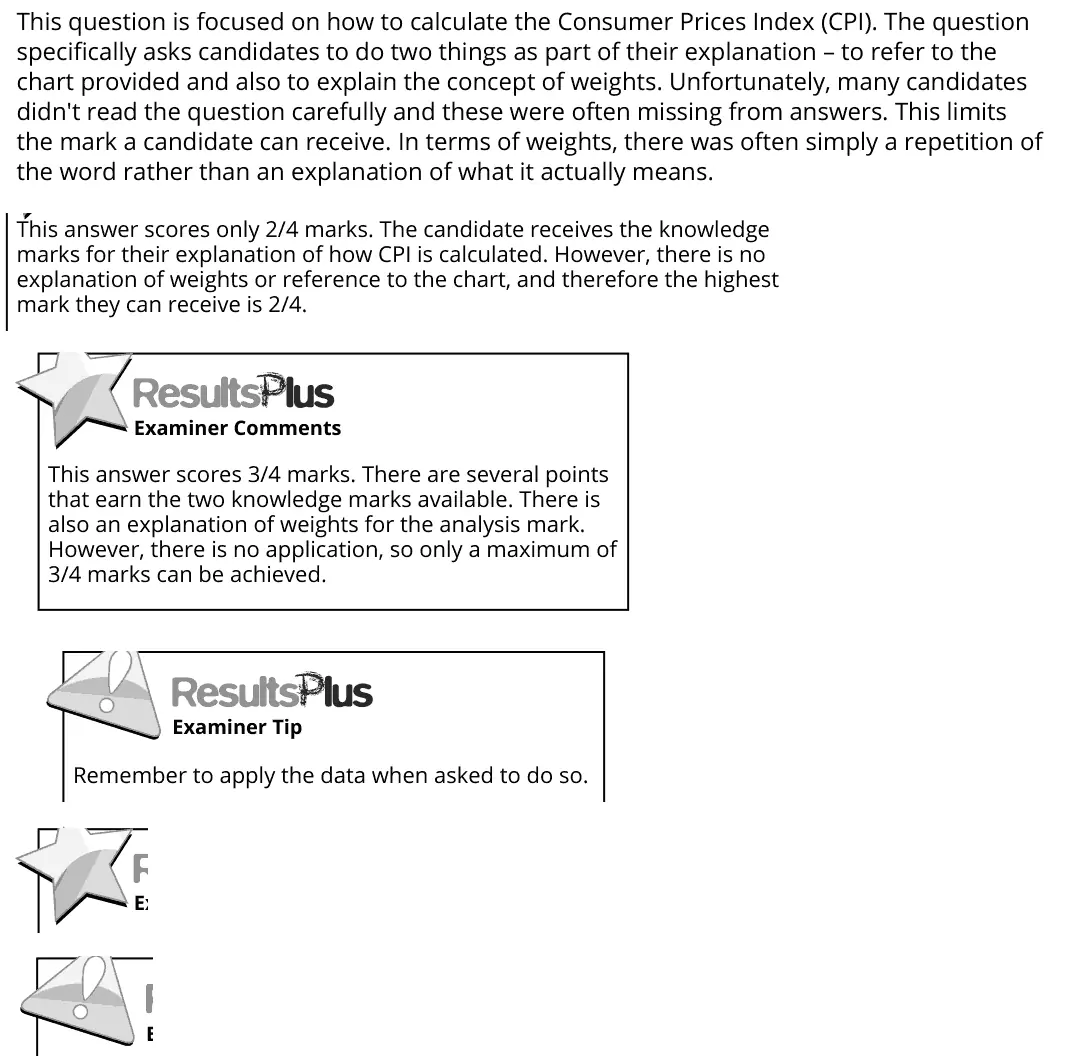
3(b) Inflation 4AO1=2,AO2=1,AO3=1Short answer
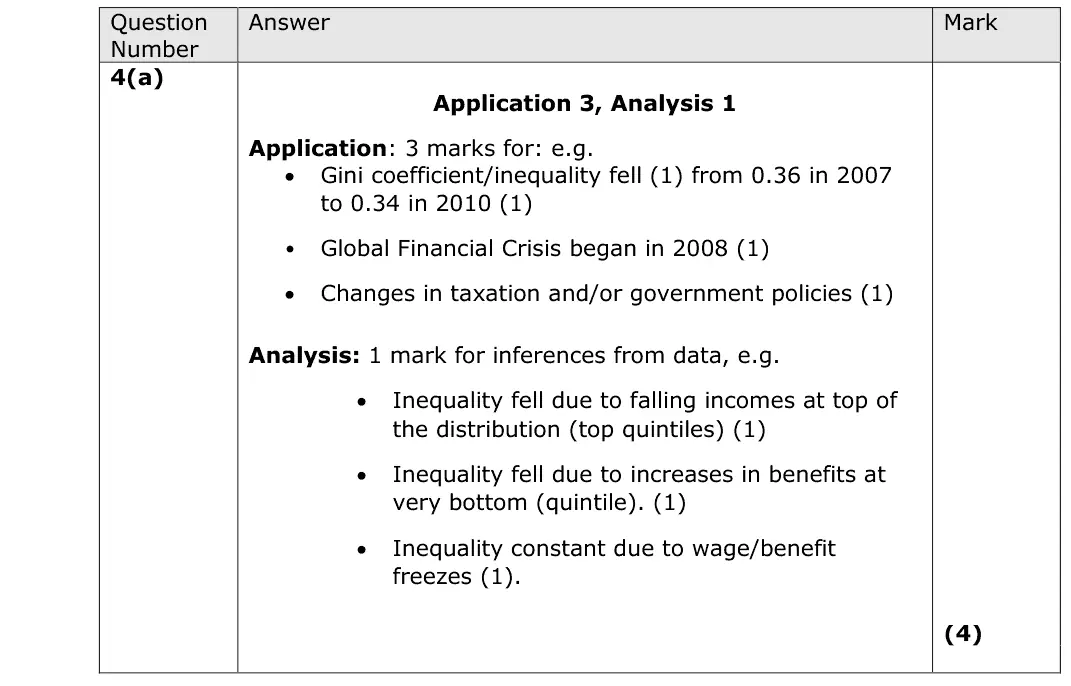
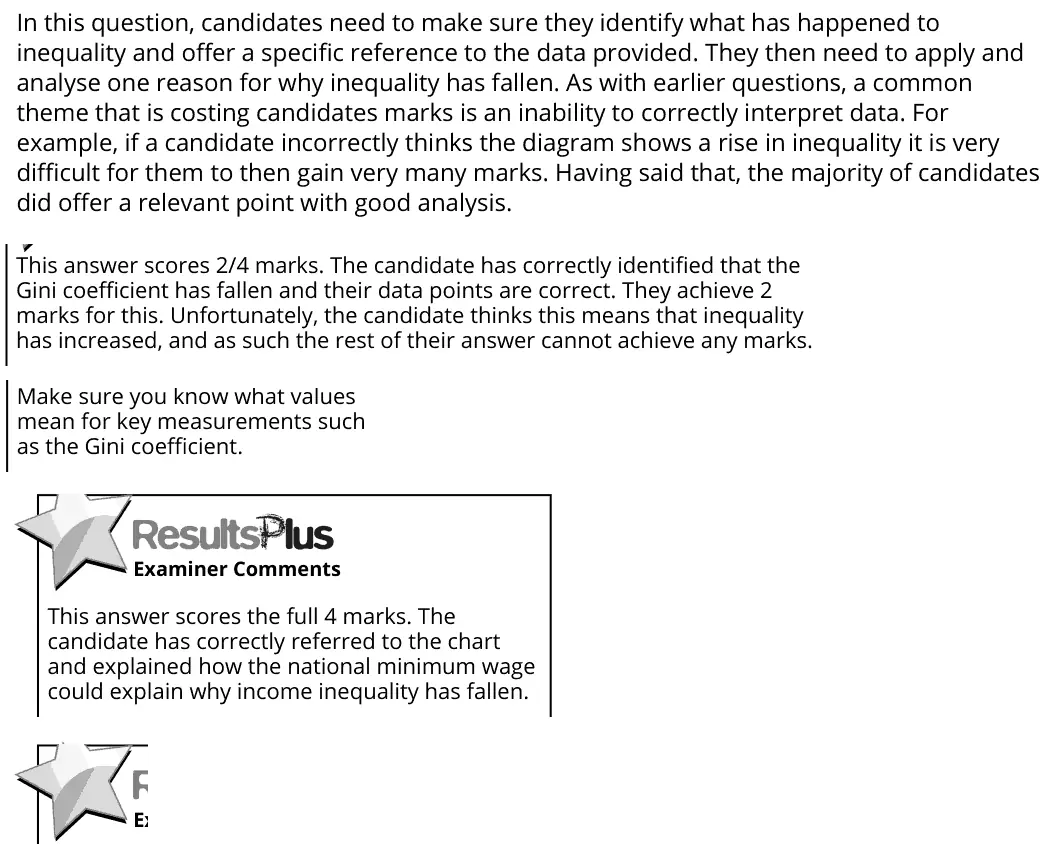
4(a) Poverty and inequality 4AO2=3,AO3=1Short answer
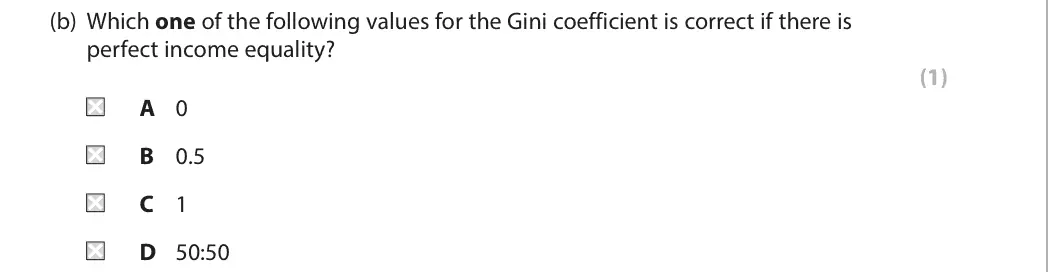
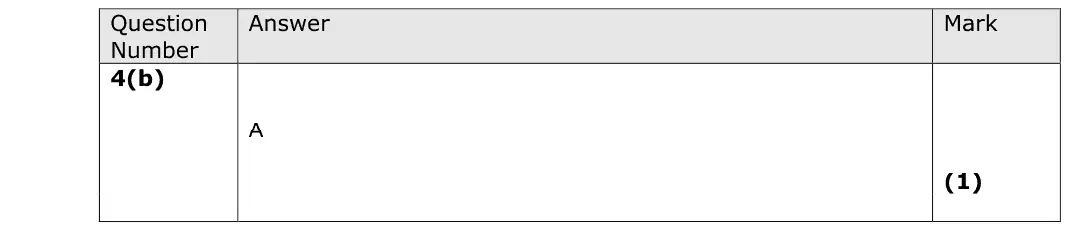
4(b) Poverty and inequality 1Multiple choice
5(a) Measuring economic growth: GDP, GNI and living standards 1Multiple choice
5(b) Emerging and developing economies 4AO1=2,AO2=1,AO3=1Short answer
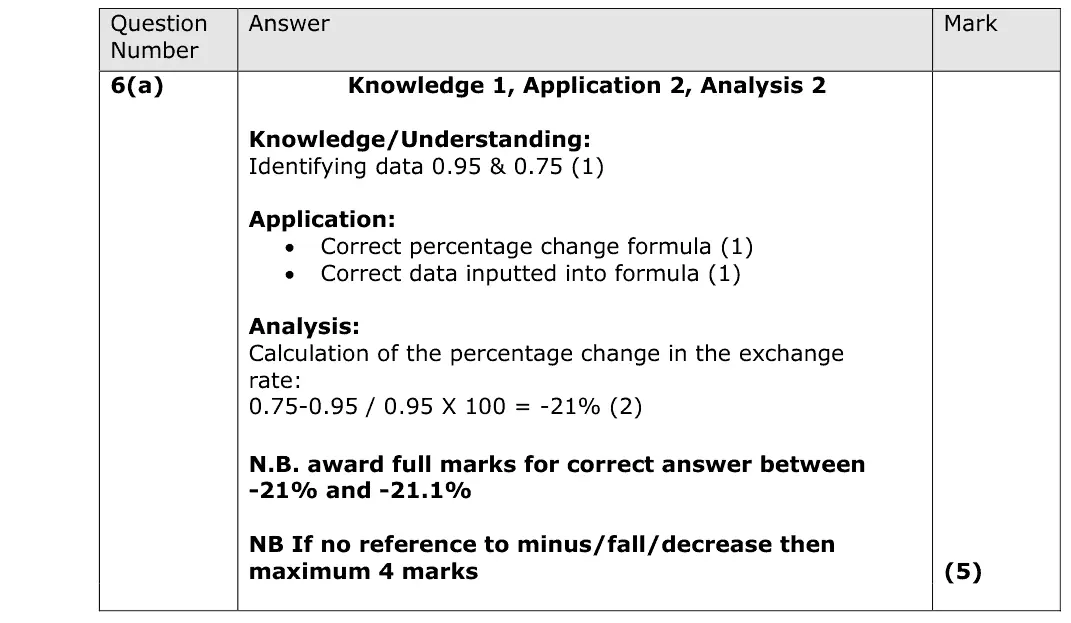
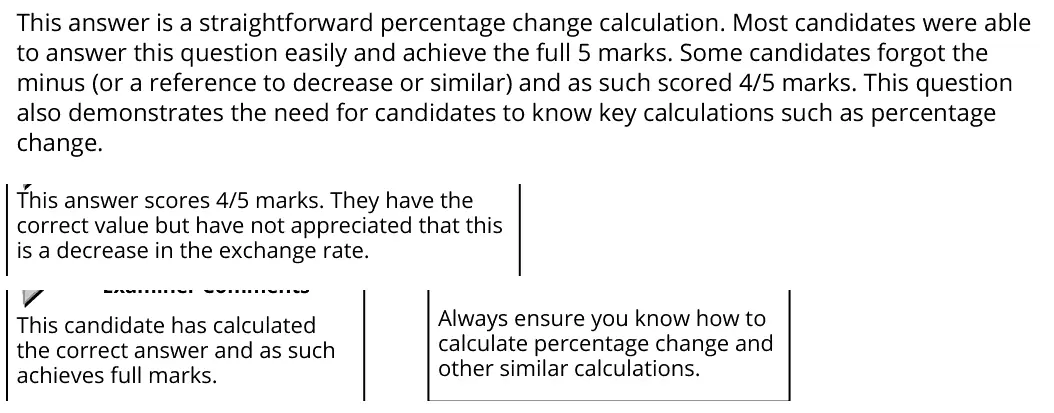
6(a) Exchange rates 5AO1=1,AO2=2,AO3=2Calculation
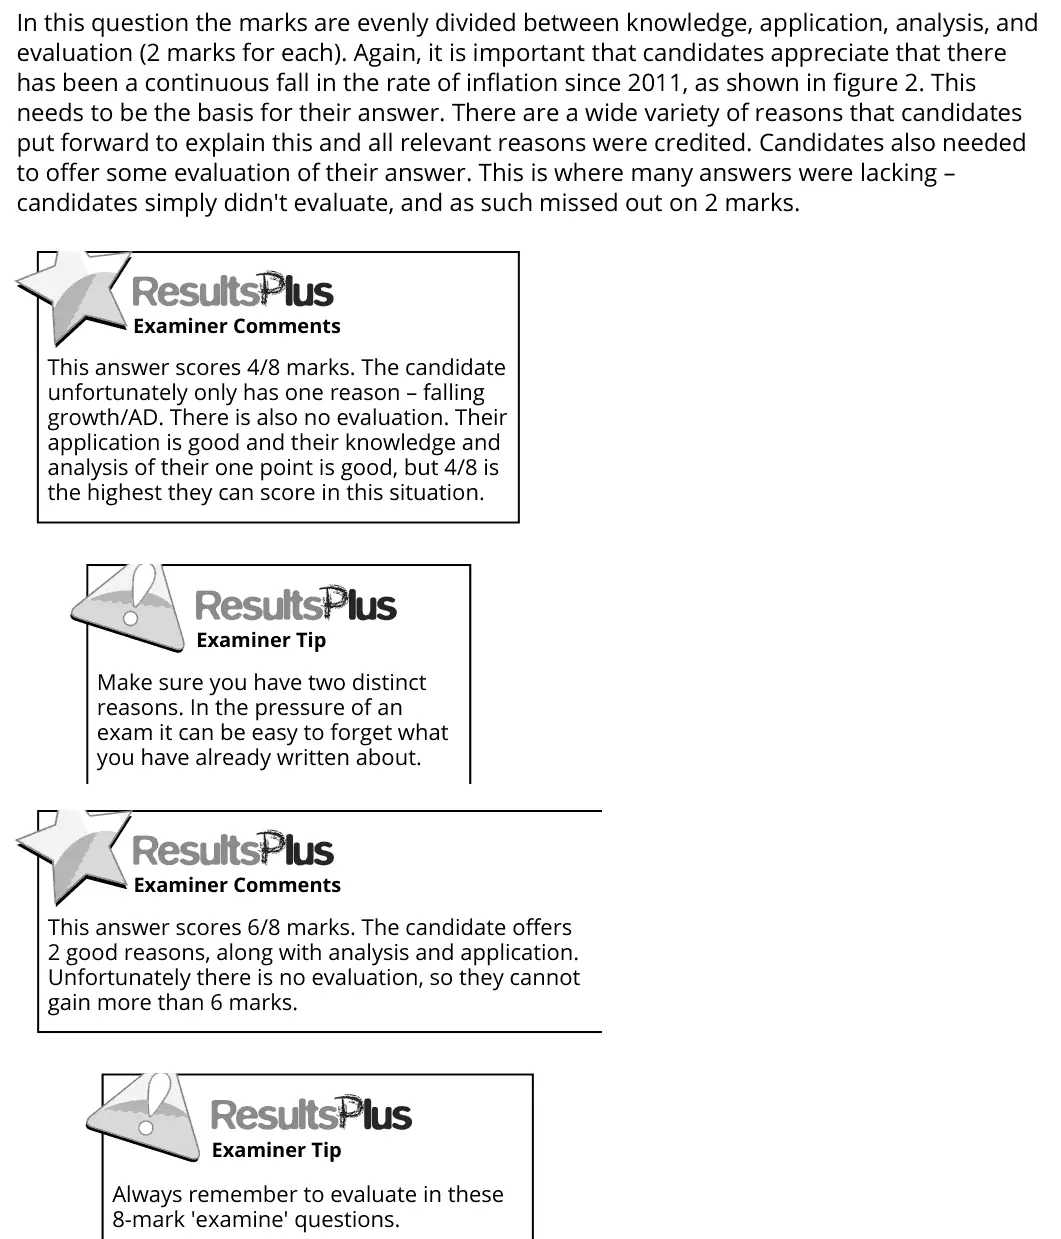
6(b) Inflation 8AO1=2,AO2=2,AO3=2,AO4=2Extended response
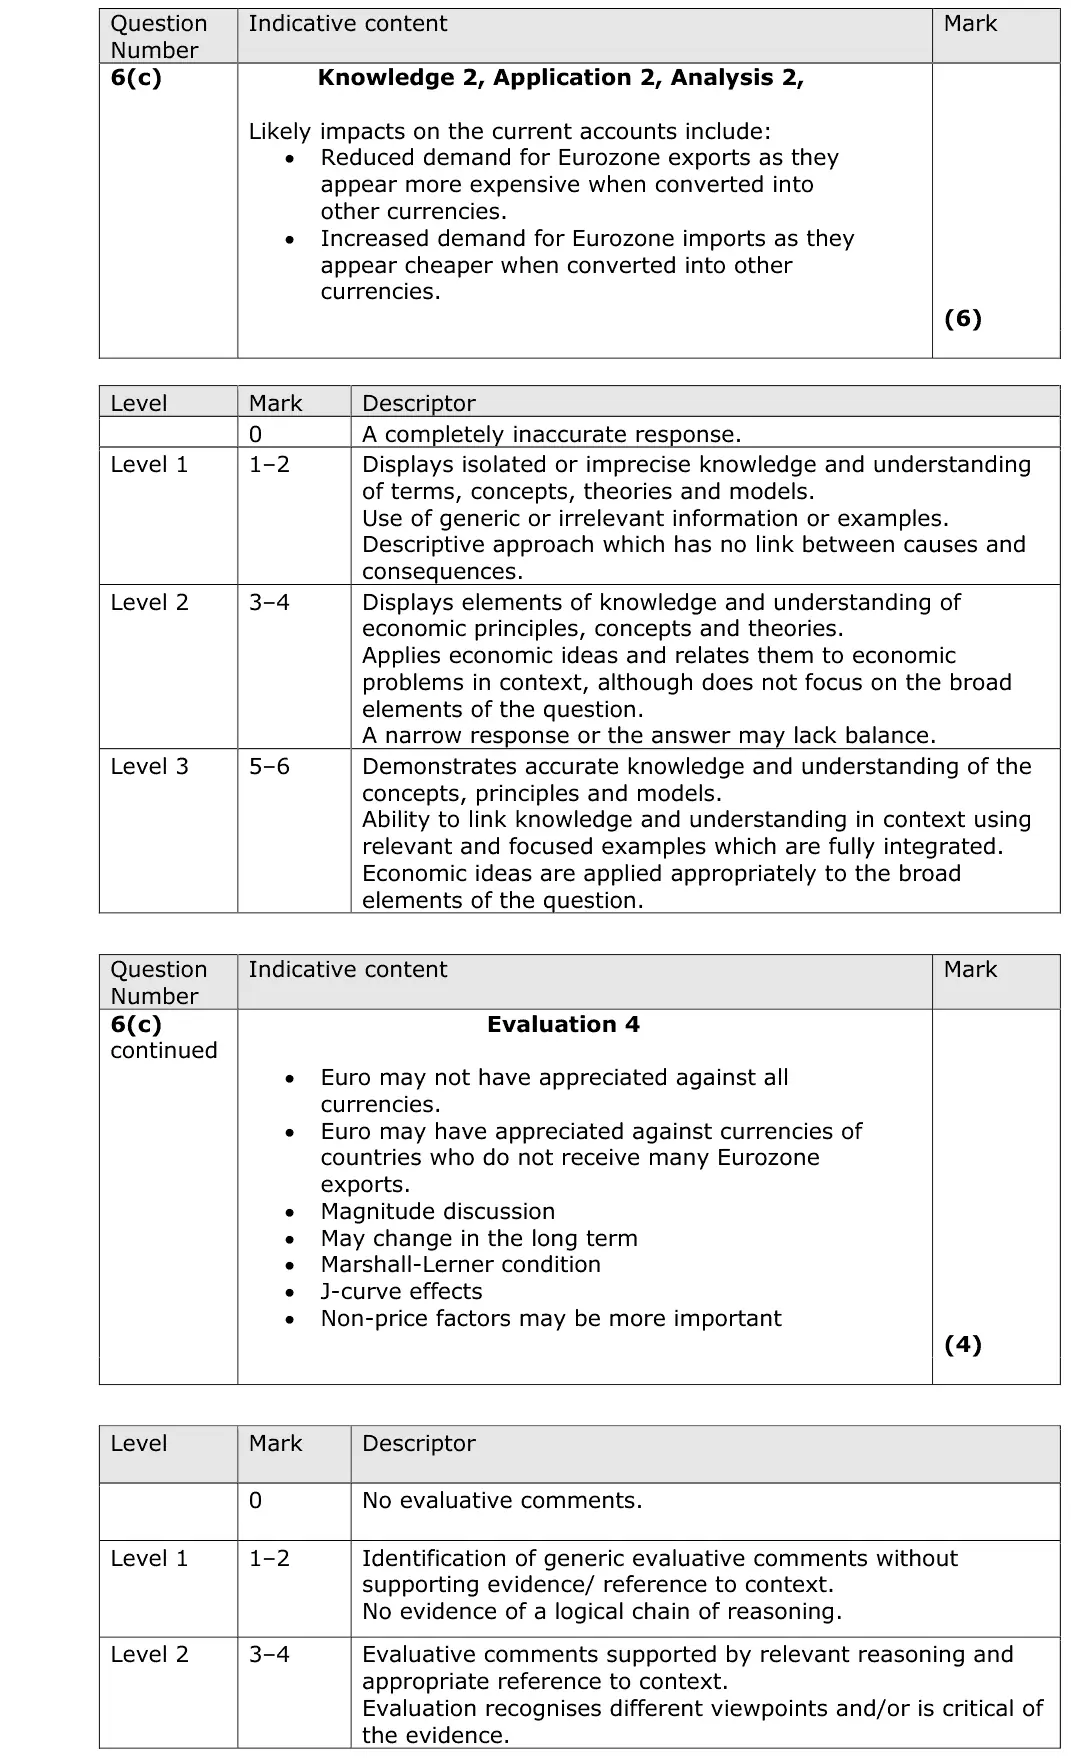
6(c) Exchange rates, The balance of payments 10AO1=2,AO2=2,AO3=2,AO4=4Extended response
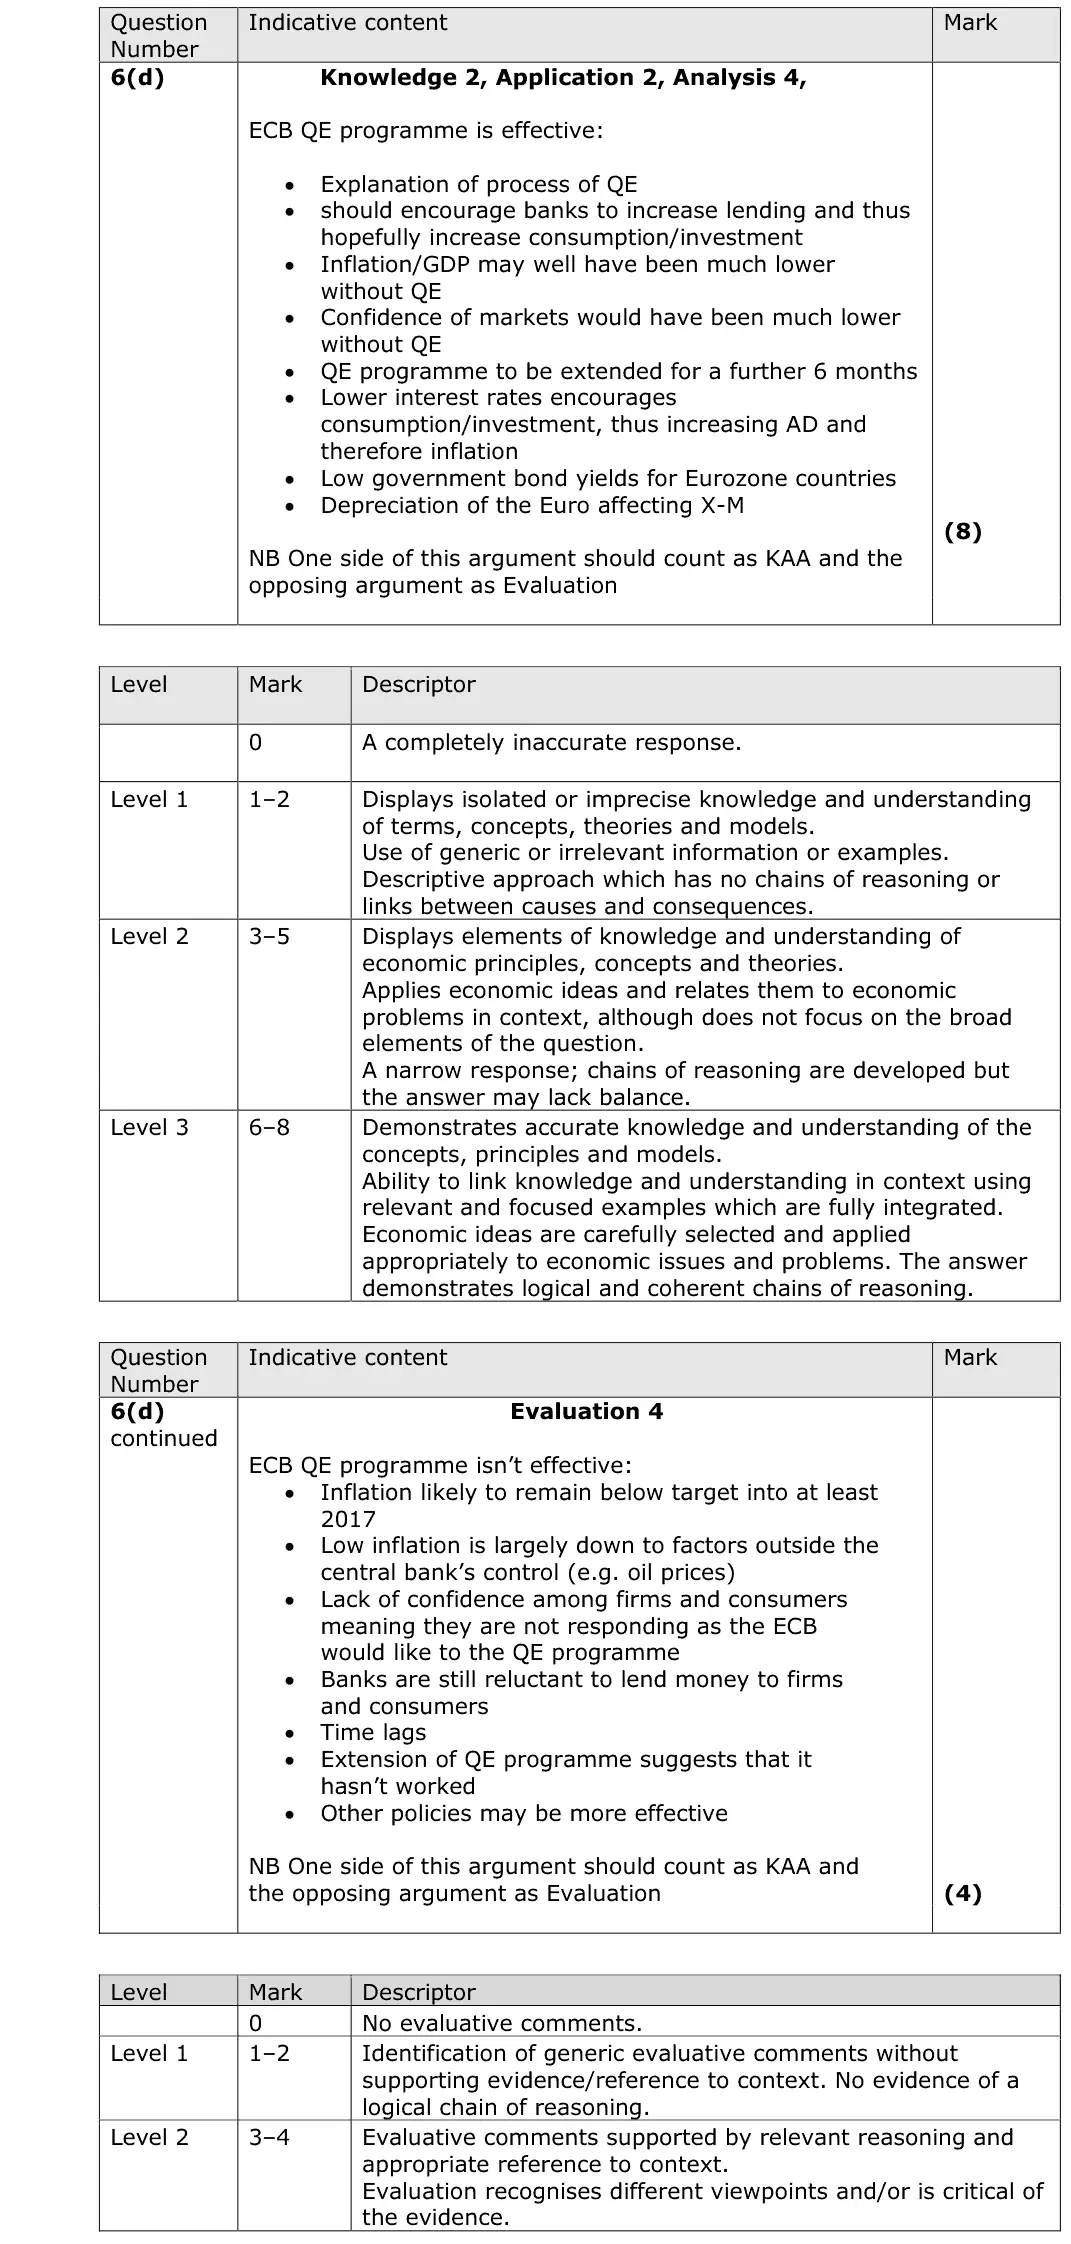
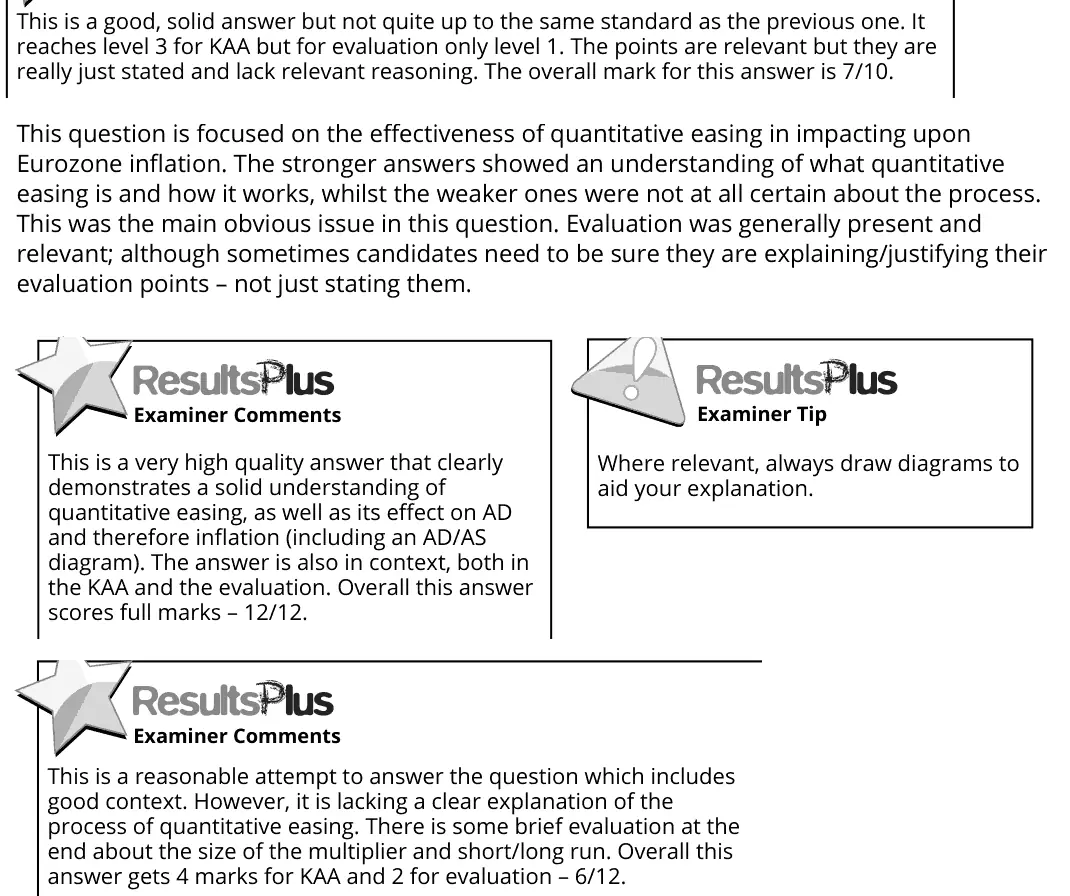
6(d) Demand-side policies: fiscal and monetary policy, Macroeconomic policies in a global context 12AO1=2,AO2=2,AO3=4,AO4=4Extended response
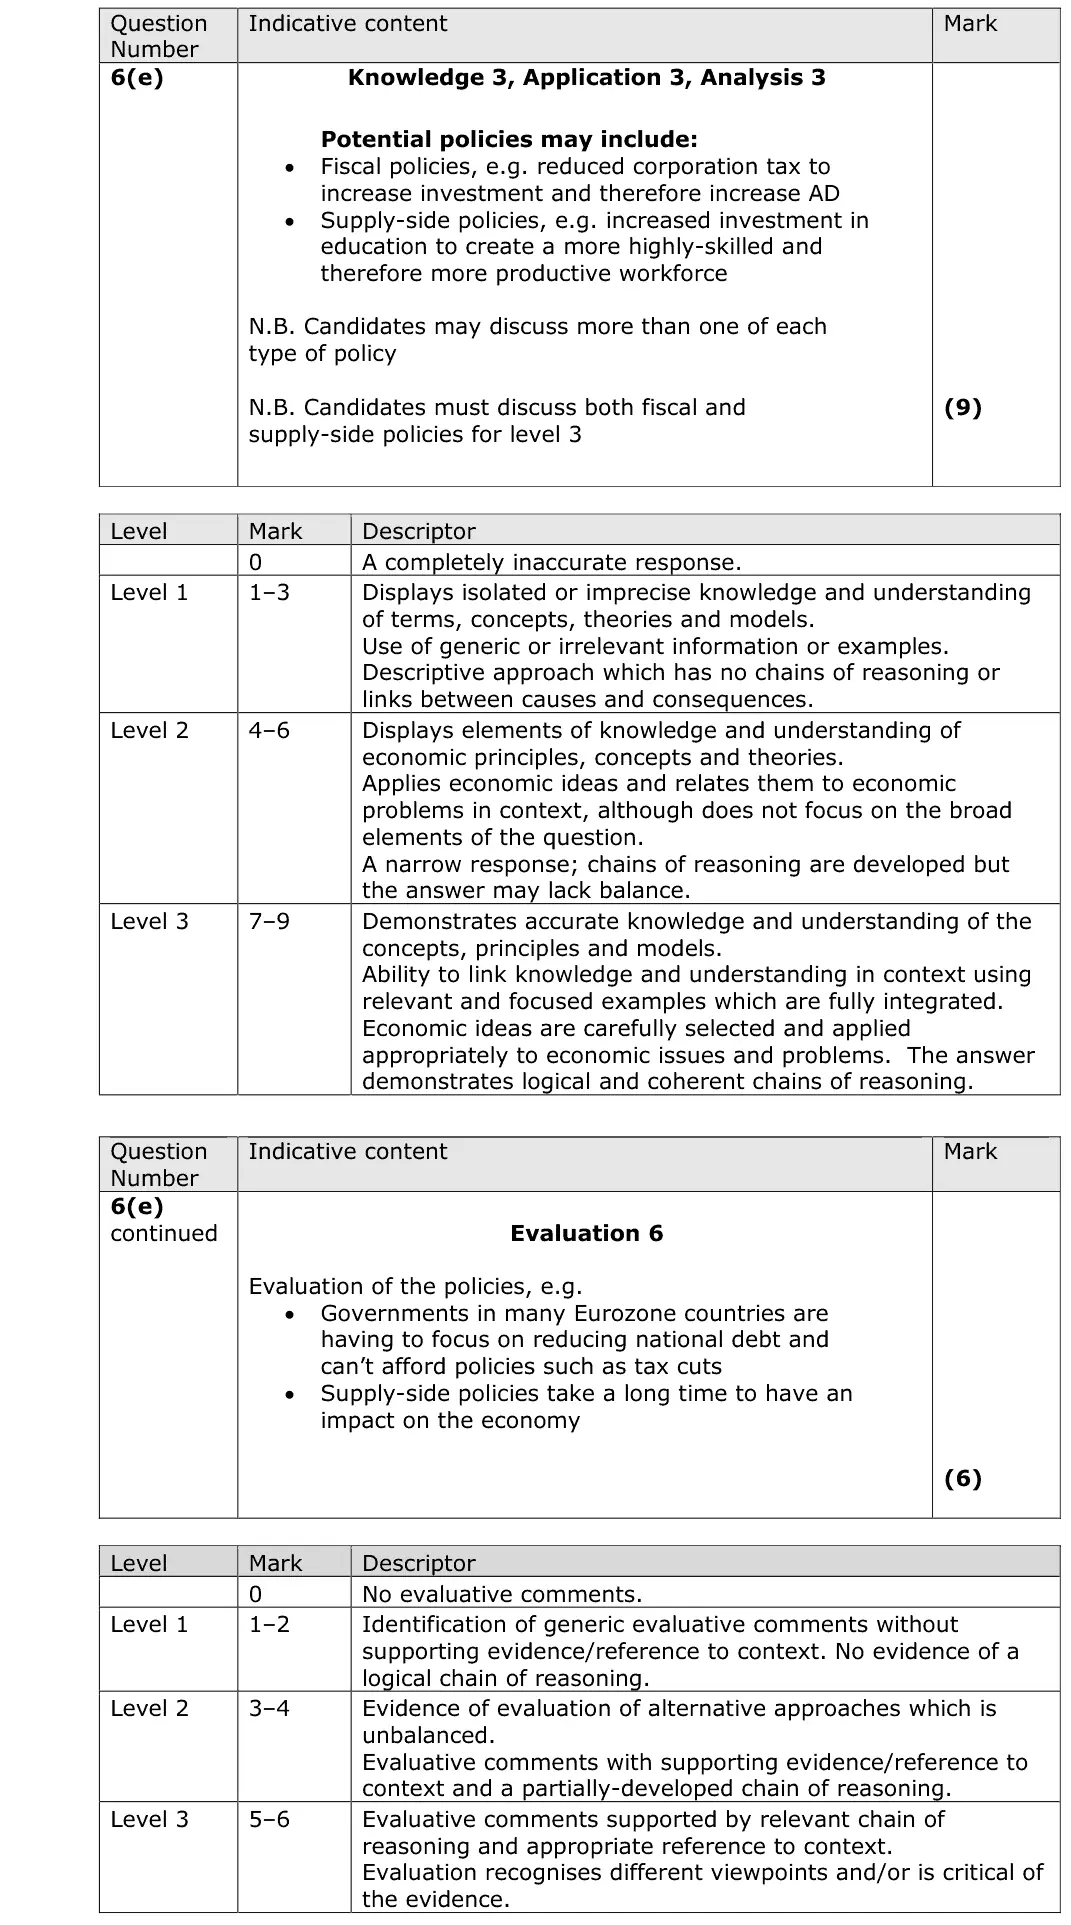
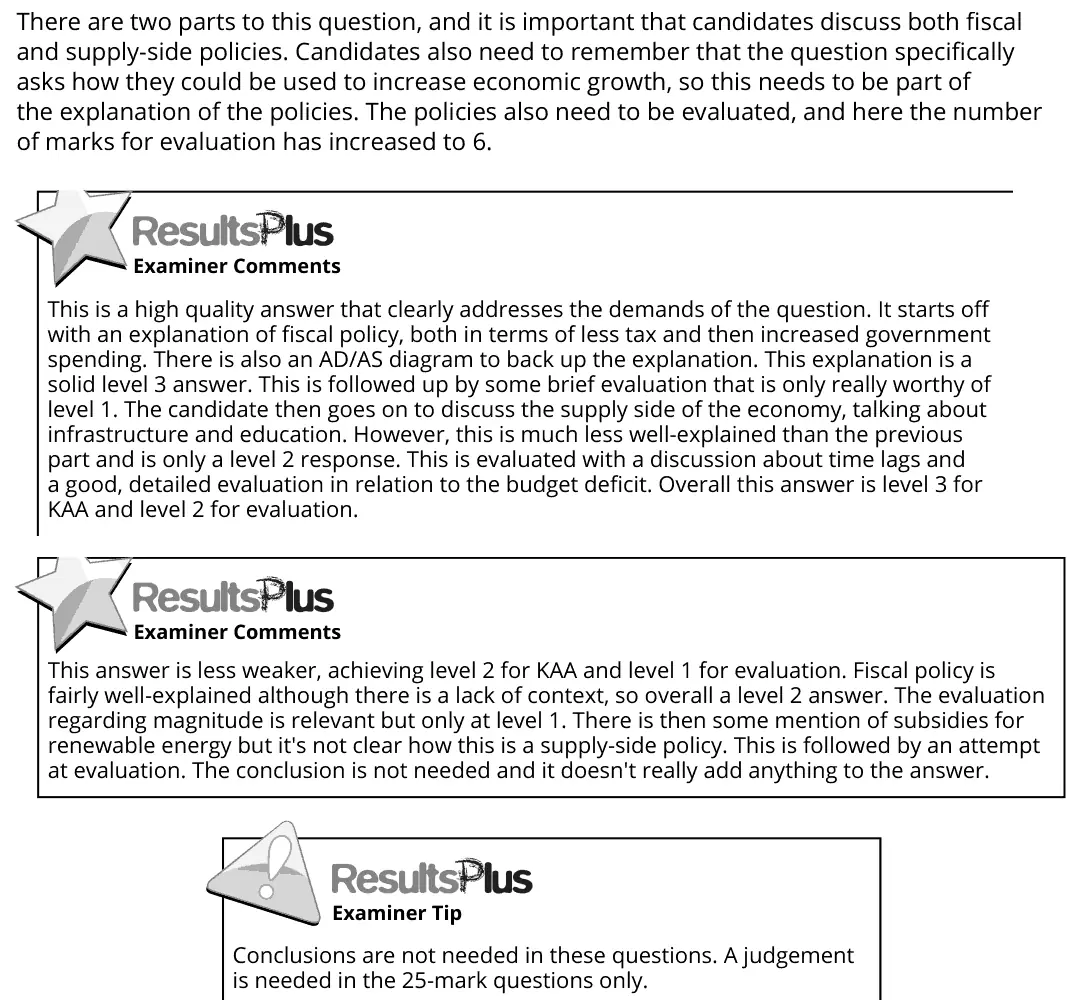
6(e) Demand-side policies: fiscal and monetary policy, Supply-side policies 15AO1=3,AO2=3,AO3=3,AO4=6Extended response
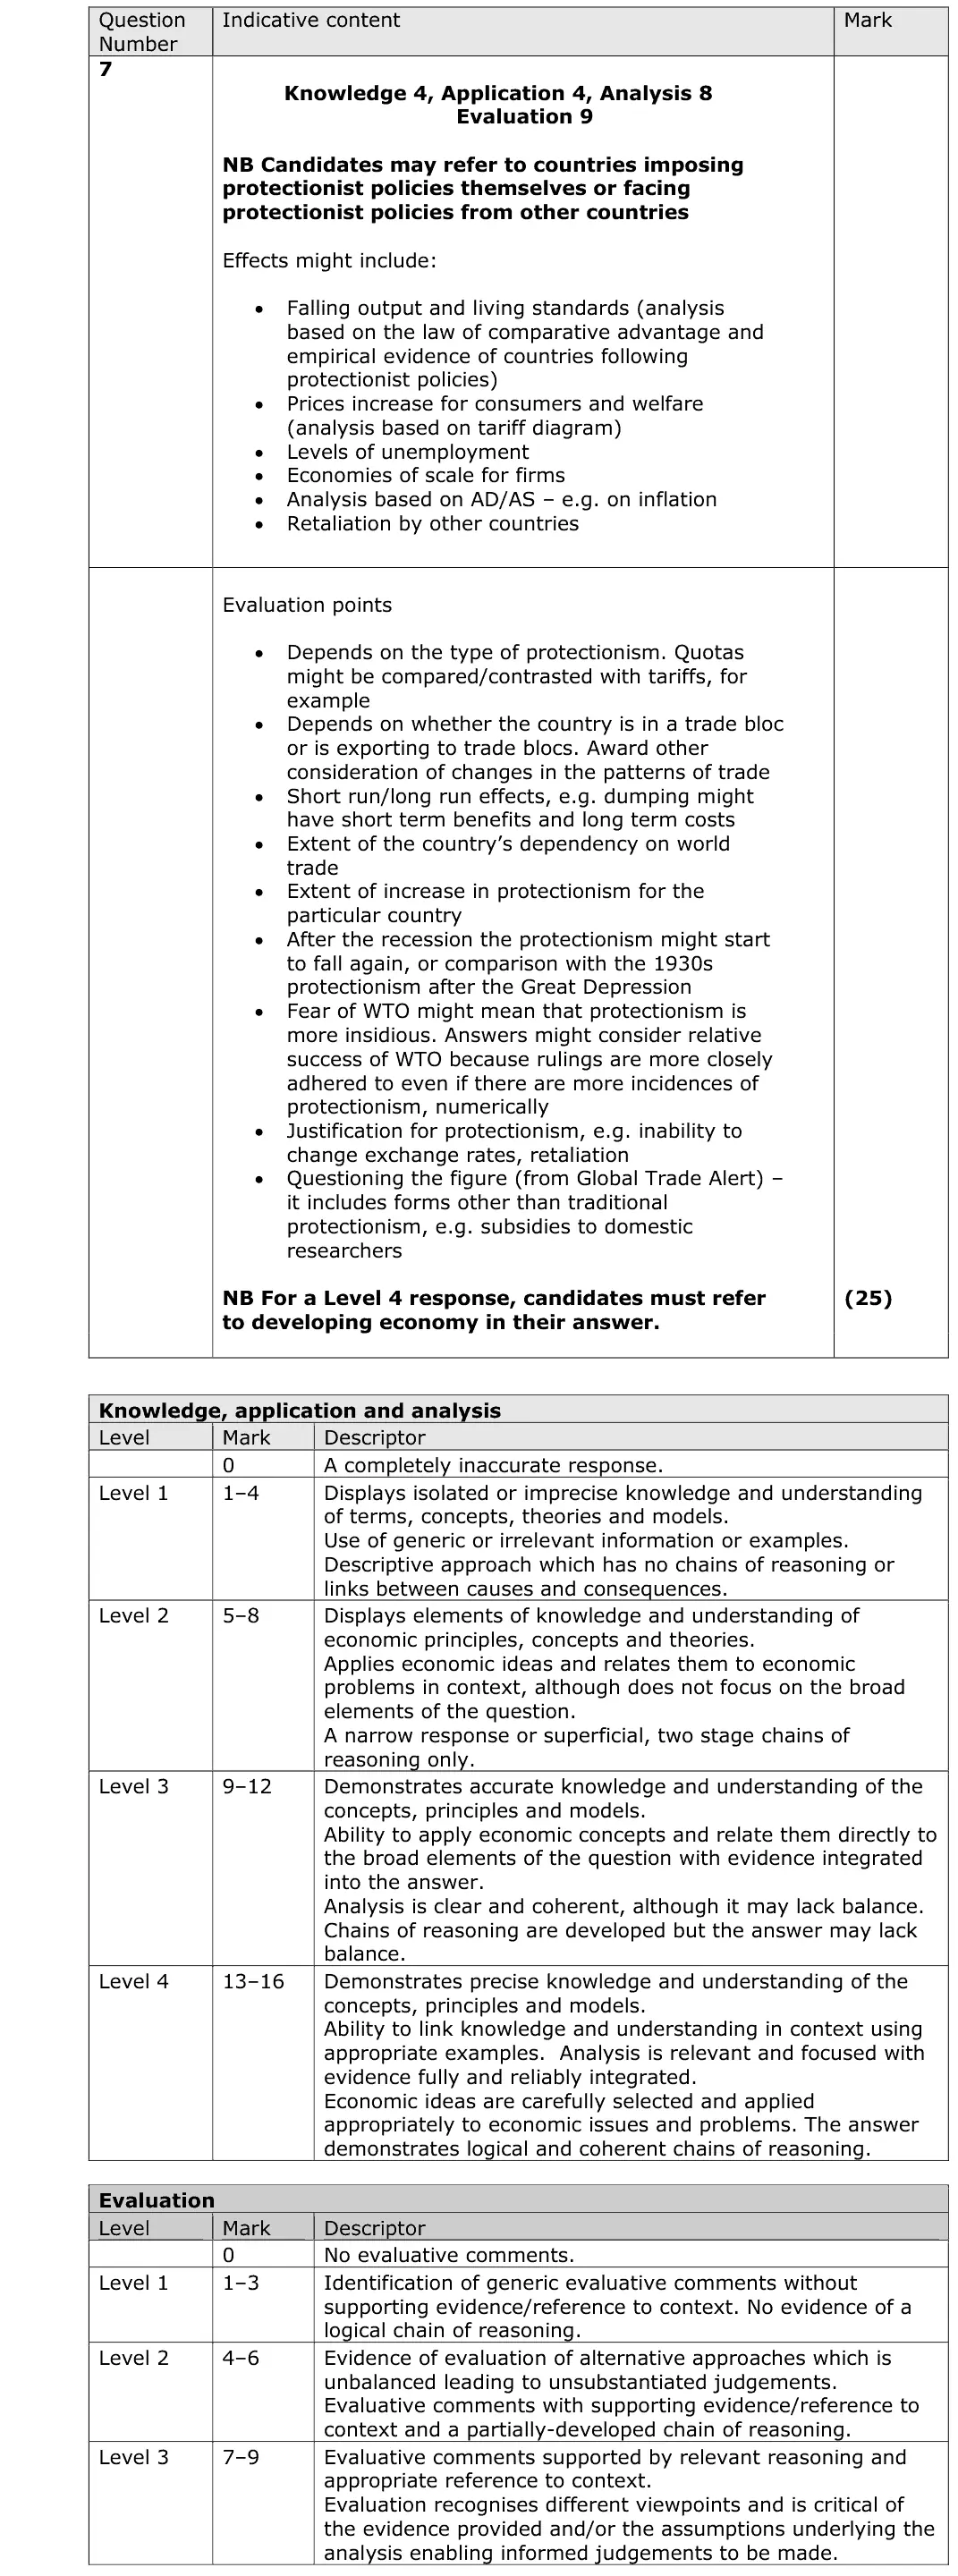
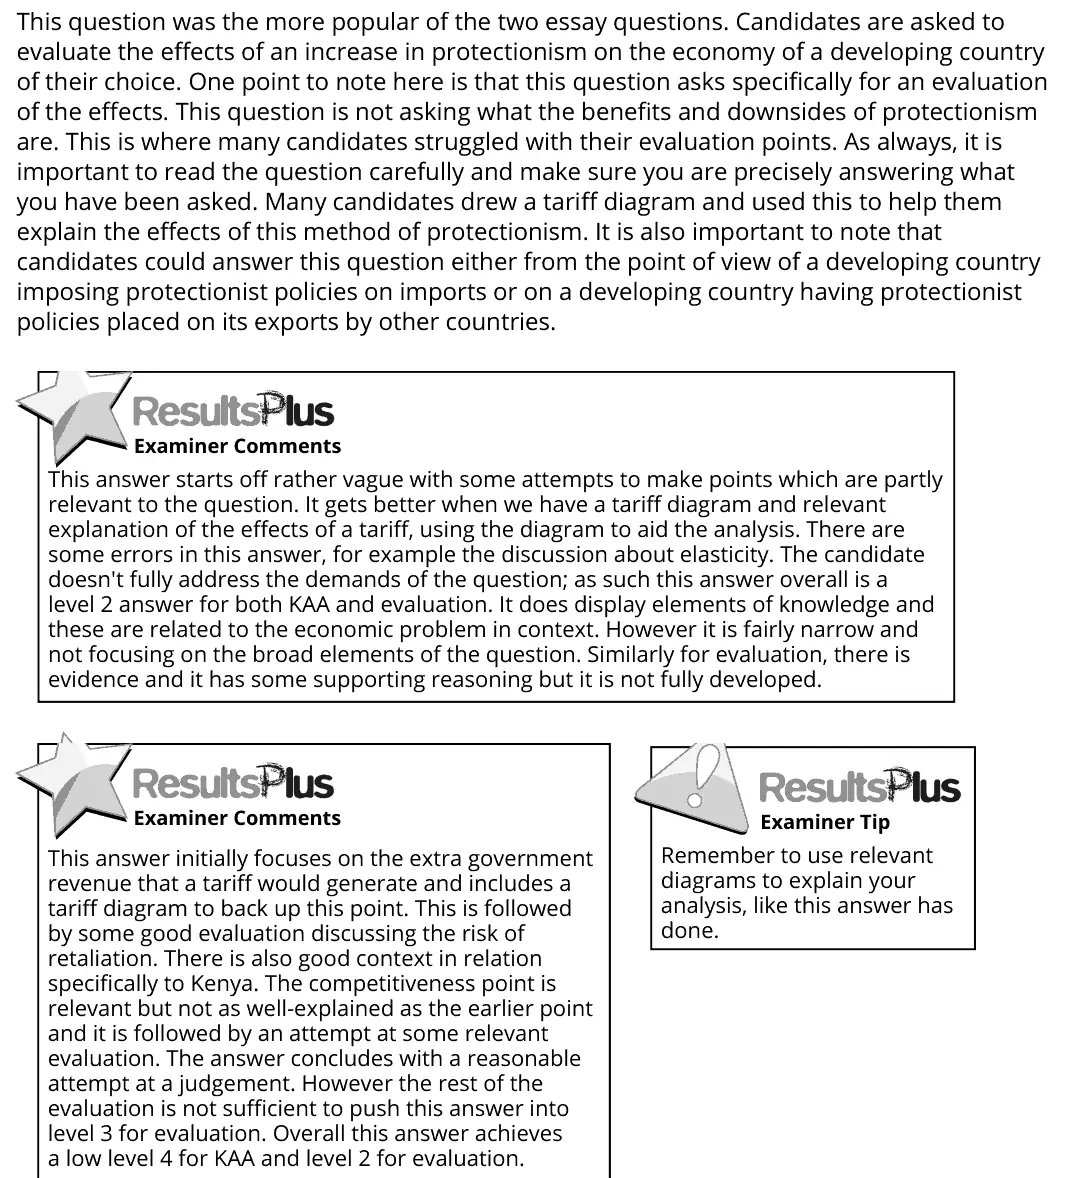
7 Trading blocs, the WTO and protectionism, Globalisation, specialisation and trade 25AO1=4,AO2=4,AO3=8,AO4=9Essay
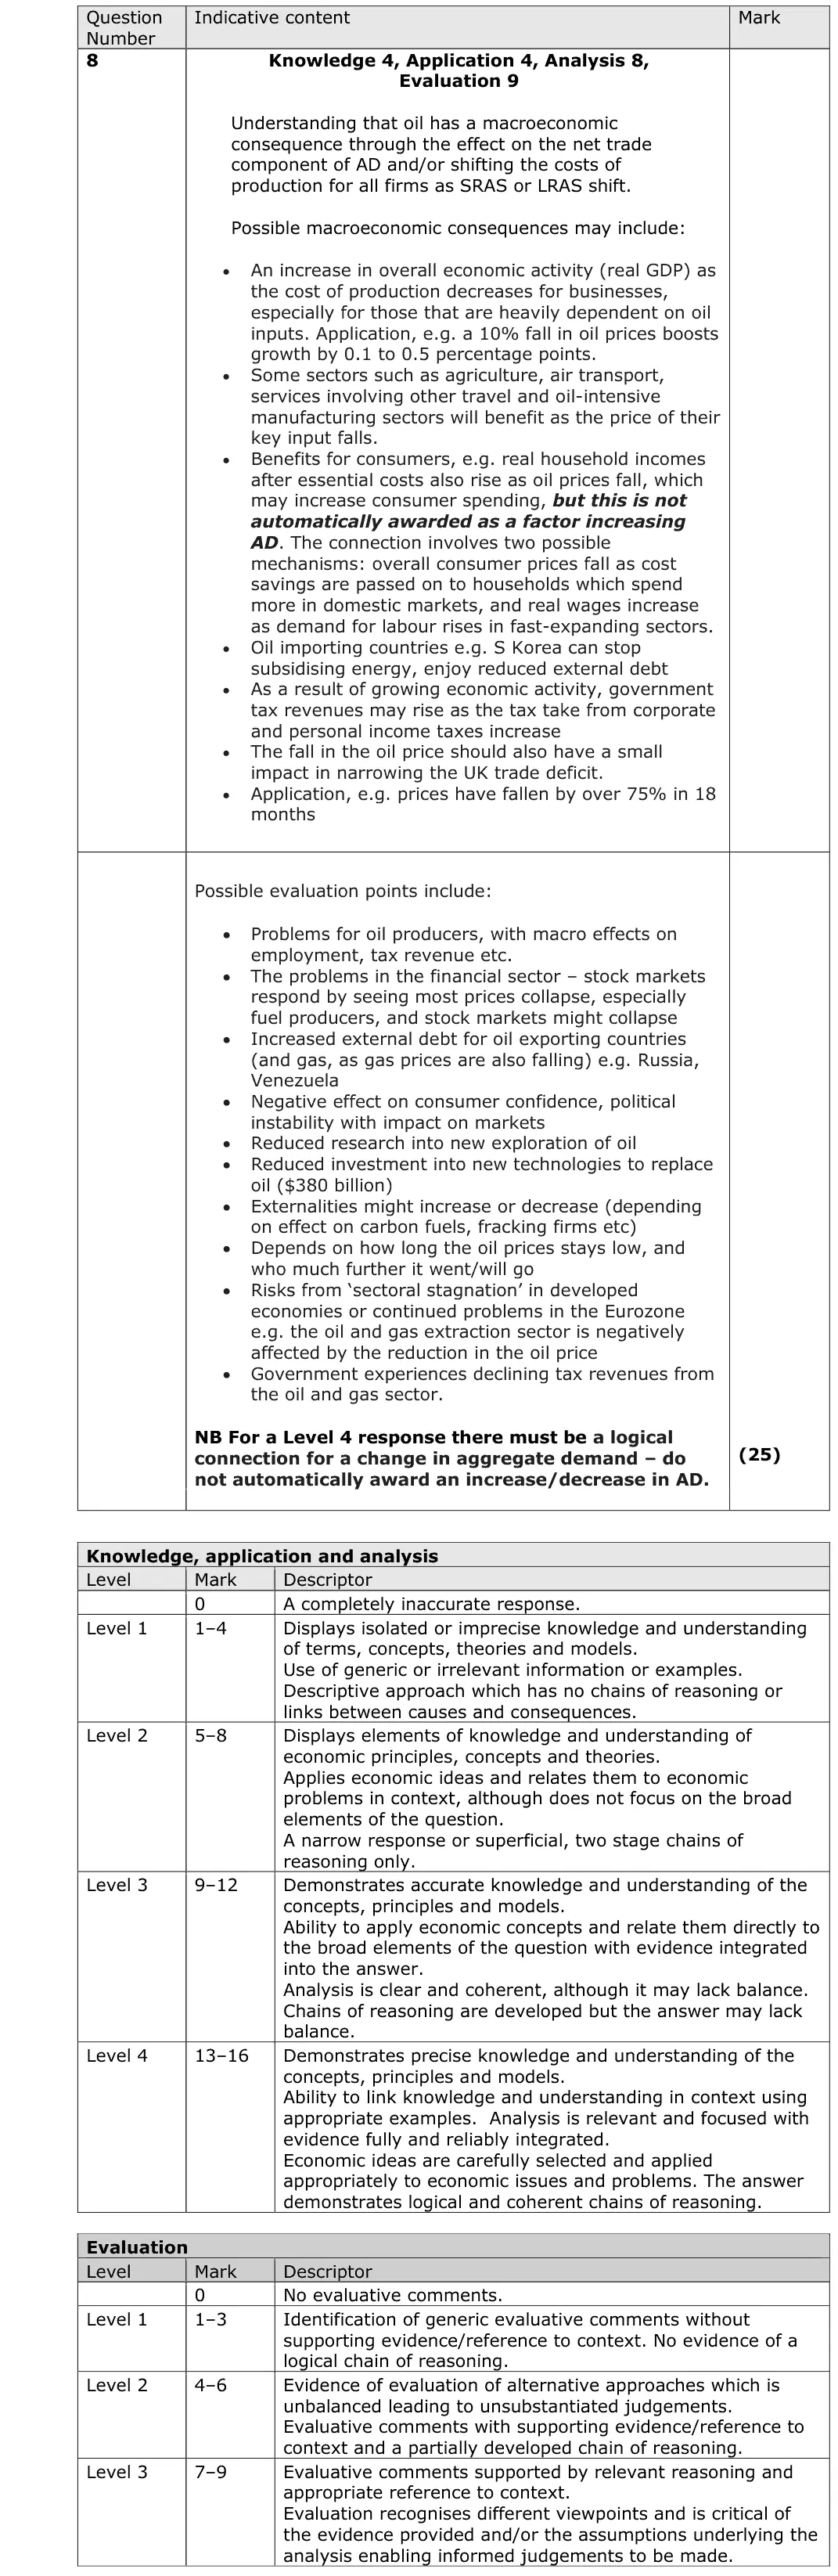
8 Aggregate supply, The circular flow, national income and the multiplier 25AO1=4,AO2=4,AO3=8,AO4=9Essay

The questions

1(a)1(b)2(a)2(b)2(c)3(a)3(b)4(a)4(b)5(a)5(b)6(a)6(b)6(c)6(d)6(e)78
June 2017 · Paper 2 · Q1(a) 1 mark Multiple choice unemployment
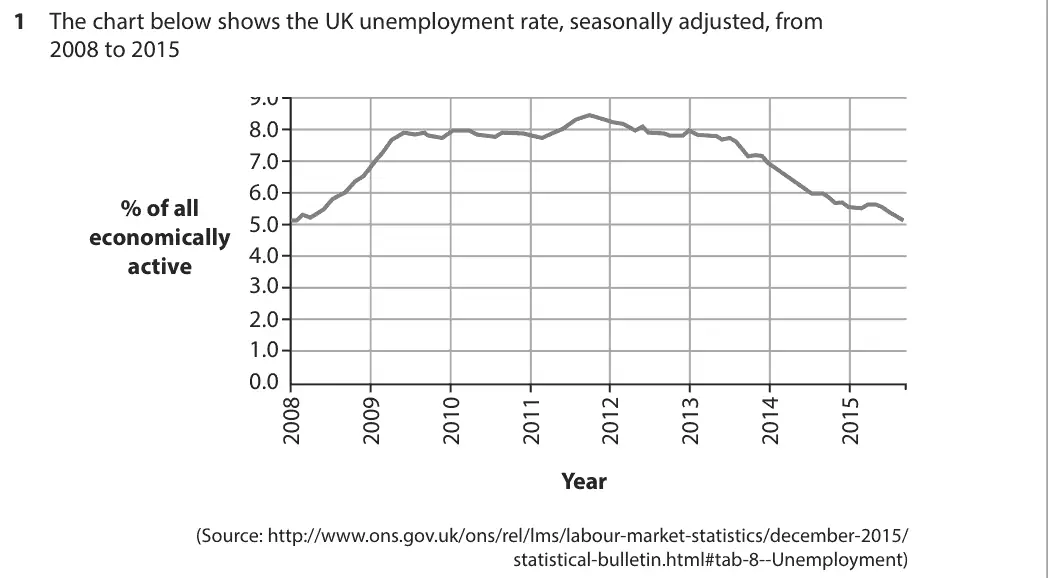
Data and extracts for question 11 The chart below shows the UK unemployment rate, seasonally adjusted, from 2008 to 2015 9.0 8.0 7.0 6.0 % of all 5.0 economically 4.0 active 3.0 2.0 1.0 0.0 Year (Source: http://www.ons.gov.uk/ons/rel/lms/labour-market-statistics/december-2015/ statistical-bulletin.html#tab-8--Unemployment)
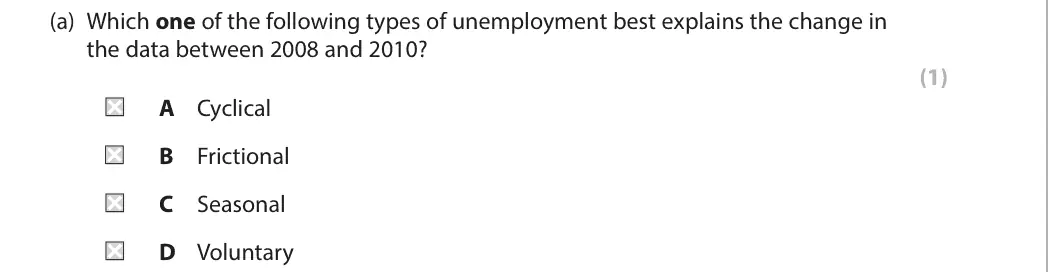
(a) Which one of the following types of unemployment best explains the change in the data between 2008 and 2010? (1) A Cyclical B Frictional C Seasonal D Voluntary
June 2017 · Paper 2 · Q1(b) 4 marks AO1=2, AO2=1, AO3=1 Short answer national income and the multiplier
Data and extracts for question 11 The chart below shows the UK unemployment rate, seasonally adjusted, from 2008 to 2015 9.0 8.0 7.0 6.0 % of all 5.0 economically 4.0 active 3.0 2.0 1.0 0.0 Year (Source: http://www.ons.gov.uk/ons/rel/lms/labour-market-statistics/december-2015/ statistical-bulletin.html#tab-8--Unemployment)
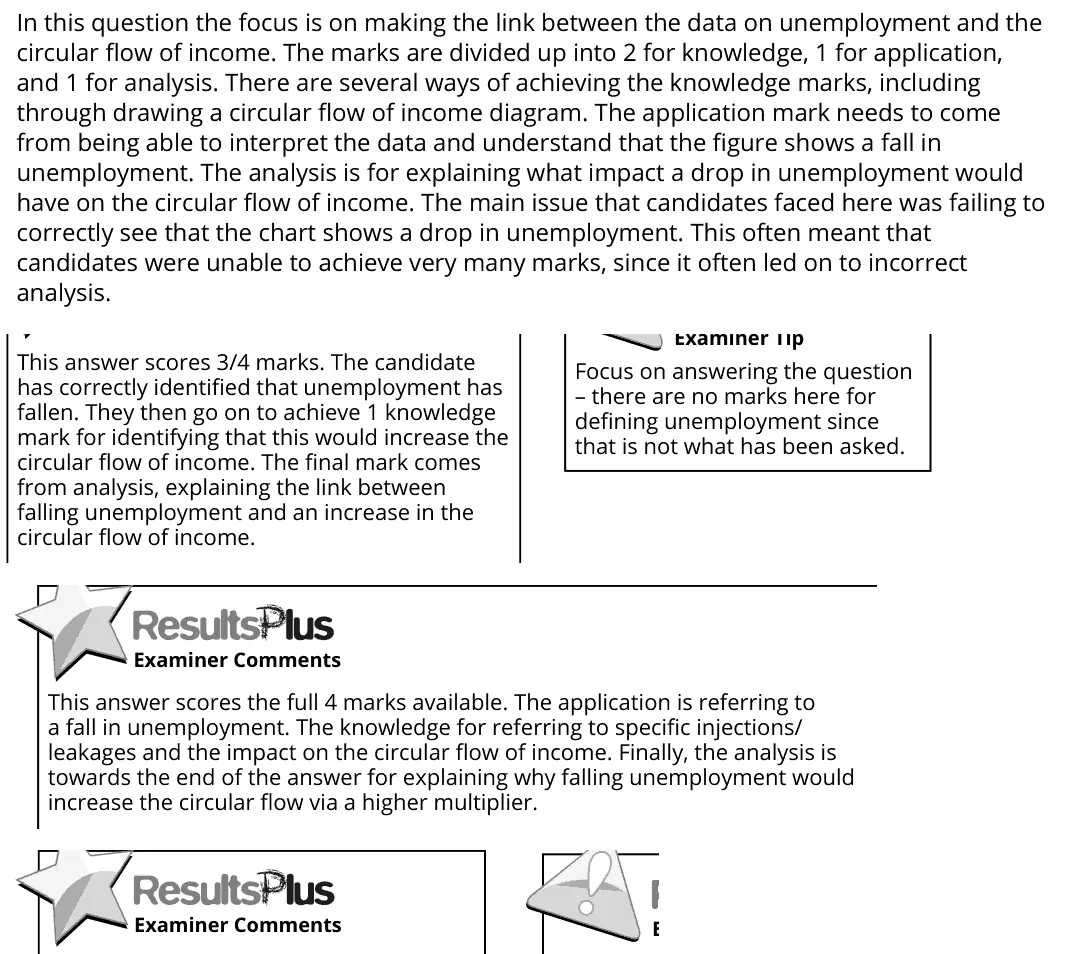
(b) Explain the likely effects on the circular flow of income of the change in unemployment between 2013 and 2015. (4)
June 2017 · Paper 2 · Q2(a) 2 marks AO1=2 Short answer aggregate demand
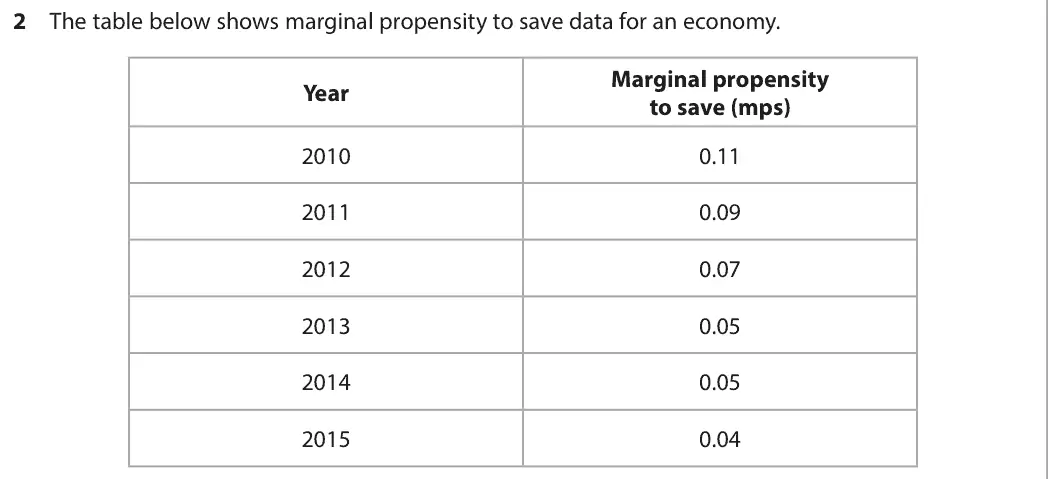
Data and extracts for question 22 The table below shows marginal propensity to save data for an economy. Marginal propensity Year to save (mps) 2010 0.11 2011 0.09 2012 0.07 2013 0.05 2014 0.05 2015 0.04

(a) Explain one possible reason for the changes in the marginal propensity to save as shown in the table. (2)
June 2017 · Paper 2 · Q2(b) 2 marks AO1=2 Short answer national income and the multiplier
Data and extracts for question 22 The table below shows marginal propensity to save data for an economy. Marginal propensity Year to save (mps) 2010 0.11 2011 0.09 2012 0.07 2013 0.05 2014 0.05 2015 0.04
(b) Explain the likely effect of a fall in the marginal propensity to save on the value of the multiplier if other things remain equal. (2)
June 2017 · Paper 2 · Q2(c) 1 mark Multiple choice national income and the multiplier
Data and extracts for question 22 The table below shows marginal propensity to save data for an economy. Marginal propensity Year to save (mps) 2010 0.11 2011 0.09 2012 0.07 2013 0.05 2014 0.05 2015 0.04
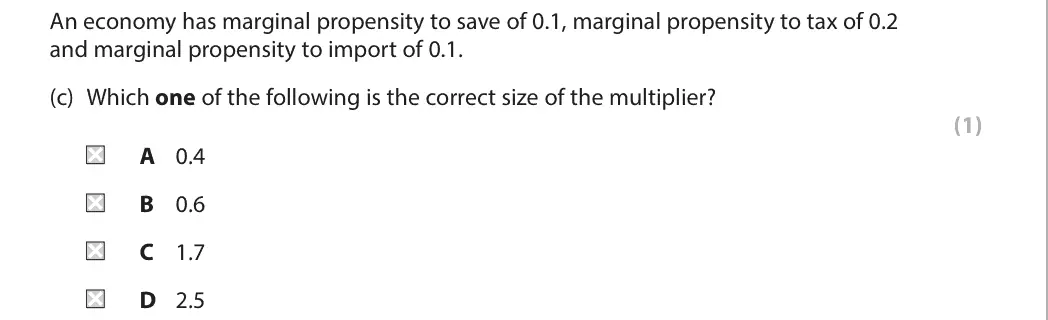
An economy has marginal propensity to save of 0.1, marginal propensity to tax of 0.2 and marginal propensity to import of 0.1. (c) Which one of the following is the correct size of the multiplier? (1) A 0.4 B 0.6 C 1.7 D 2.5
June 2017 · Paper 2 · Q3(a) 1 mark Multiple choice inflation
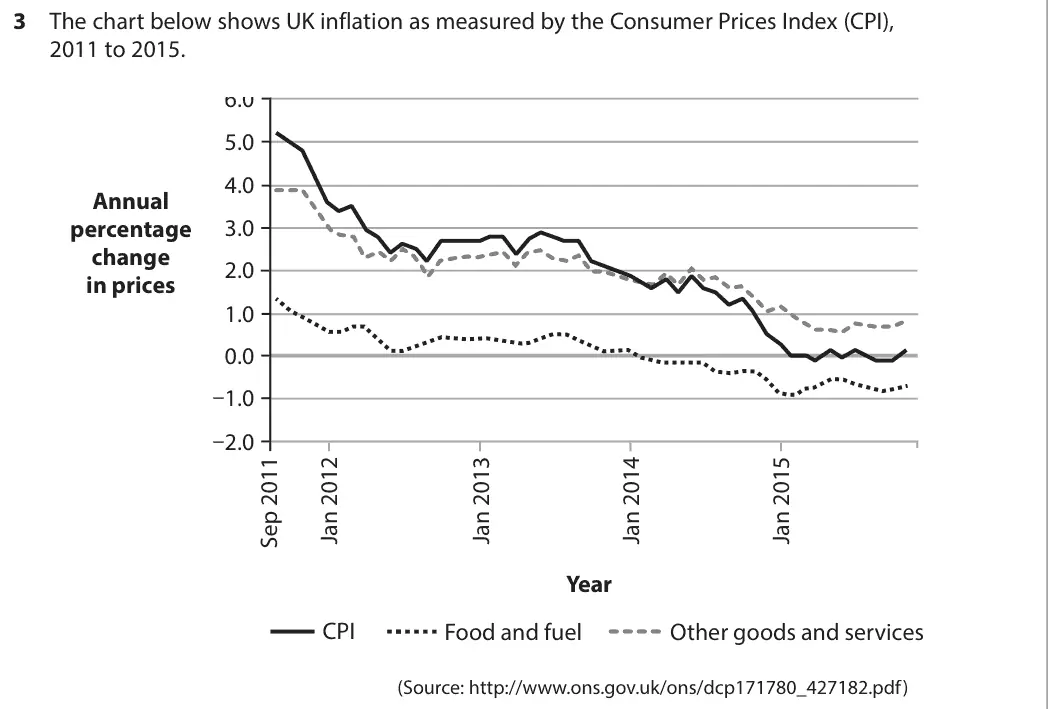
Data and extracts for question 33 The chart below shows UK inflation as measured by the Consumer Prices Index (CPI), 2011 to 2015. 6.0 5.0 4.0 Annual 3.0 percentage change 2.0 in prices 1.0 0.0 –1.0 –2.0 Year CPI Food and fuel Other goods and services (Source: http://www.ons.gov.uk/ons/dcp171780_427182.pdf)
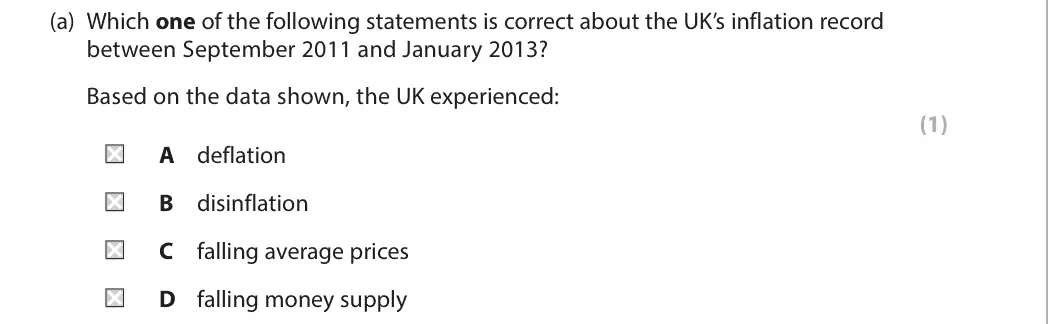
(a) Which one of the following statements is correct about the UK’s inflation record between September 2011 and January 2013? Based on the data shown, the UK experienced: (1) A deflation B disinflation C falling average prices D falling money supply
June 2017 · Paper 2 · Q3(b) 4 marks AO1=2, AO2=1, AO3=1 Short answer inflation
Data and extracts for question 33 The chart below shows UK inflation as measured by the Consumer Prices Index (CPI), 2011 to 2015. 6.0 5.0 4.0 Annual 3.0 percentage change 2.0 in prices 1.0 0.0 –1.0 –2.0 Year CPI Food and fuel Other goods and services (Source: http://www.ons.gov.uk/ons/dcp171780_427182.pdf)
(b) With reference to the data provided, explain the process of calculating the rate of inflation in the UK using the Consumer Prices Index. Refer to the concept of weights in your answer. (4)
June 2017 · Paper 2 · Q4(a) 4 marks AO2=3, AO3=1 Short answer poverty and inequality
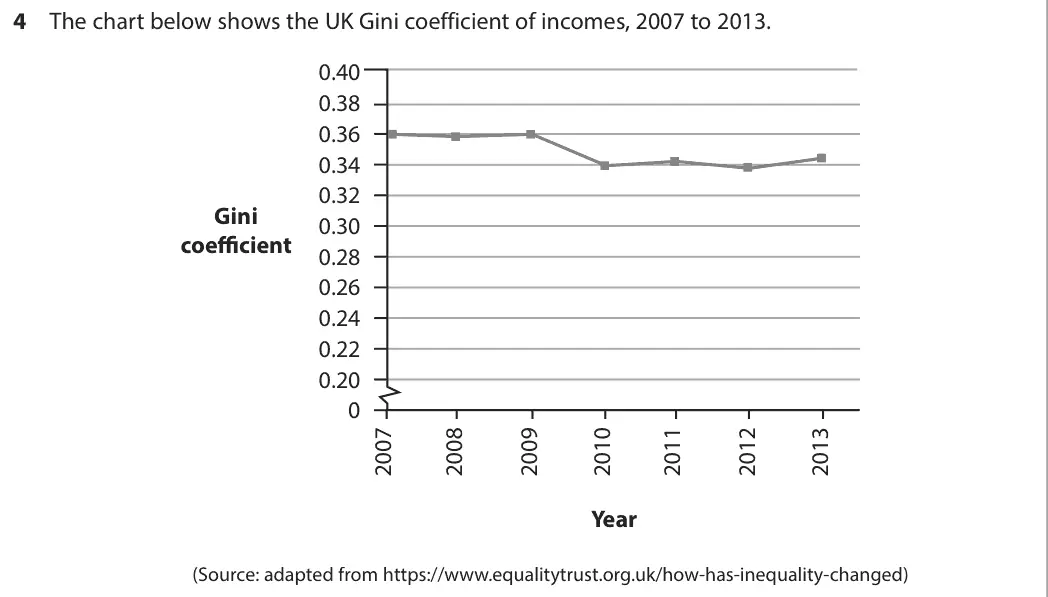
Data and extracts for question 44 The chart below shows the UK Gini coefficient of incomes, 2007 to 2013. 0.40 0.38 0.36 0.34 0.32 Gini 0.30 coefficient 0.28 0.26 0.24 0.22 0.20 0 Year (Source: adapted from https://www.equalitytrust.org.uk/how-has-inequality-changed)
(a) Explain one likely reason for the change in UK income inequality since 2007. (4)
June 2017 · Paper 2 · Q4(b) 1 mark Multiple choice poverty and inequality
Data and extracts for question 44 The chart below shows the UK Gini coefficient of incomes, 2007 to 2013. 0.40 0.38 0.36 0.34 0.32 Gini 0.30 coefficient 0.28 0.26 0.24 0.22 0.20 0 Year (Source: adapted from https://www.equalitytrust.org.uk/how-has-inequality-changed)
(b) Which one of the following values for the Gini coefficient is correct if there is perfect income equality? (1) A 0 B 0.5 C 1 D 50:50
June 2017 · Paper 2 · Q5(a) 1 mark Multiple choice measuring economic growth
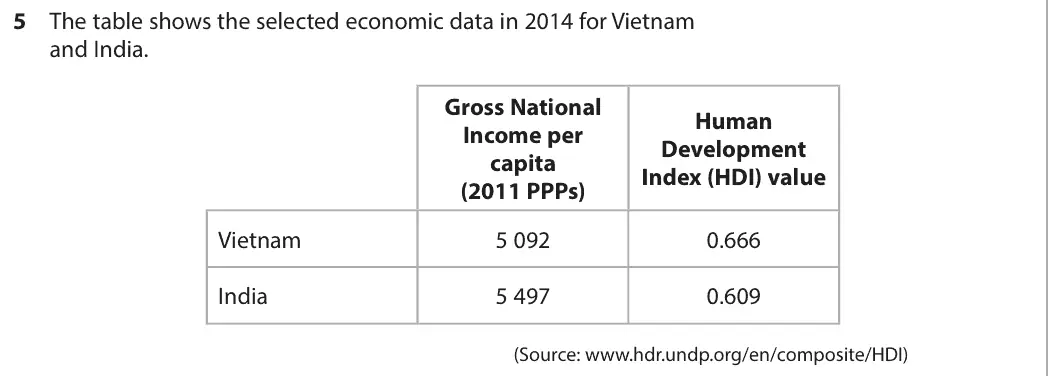
Data and extracts for question 55 The table shows the selected economic data in 2014 for Vietnam and India. Gross National Human Income per Development capita Index (HDI) value (2011 PPPs) Vietnam 5 092 0.666 India 5 497 0.609 (Source: www.hdr.undp.org/en/composite/HDI)
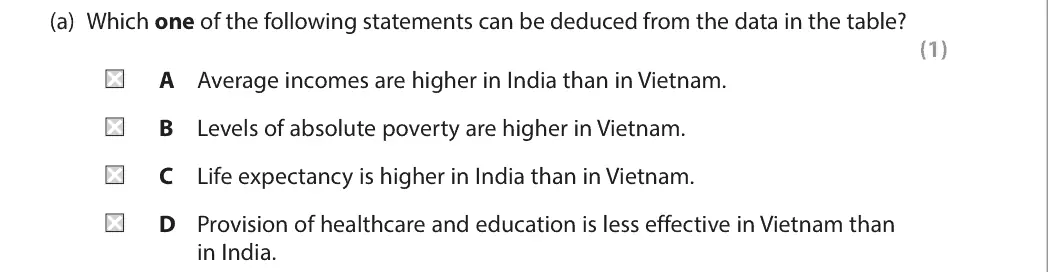
(a) Which one of the following statements can be deduced from the data in the table? (1) A Average incomes are higher in India than in Vietnam. B Levels of absolute poverty are higher in Vietnam. C Life expectancy is higher in India than in Vietnam. D Provision of healthcare and education is less effective in Vietnam than in India.
June 2017 · Paper 2 · Q5(b) 4 marks AO1=2, AO2=1, AO3=1 Short answer emerging and developing economies
Data and extracts for question 55 The table shows the selected economic data in 2014 for Vietnam and India. Gross National Human Income per Development capita Index (HDI) value (2011 PPPs) Vietnam 5 092 0.666 India 5 497 0.609 (Source: www.hdr.undp.org/en/composite/HDI)
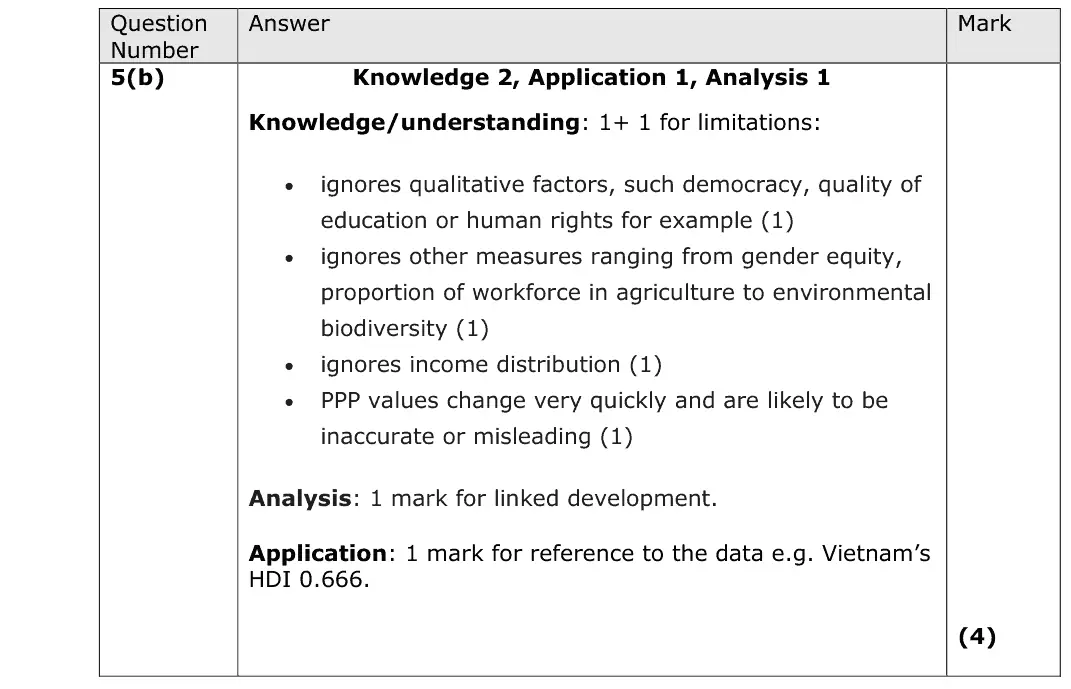
(b) With reference to the data provided, explain two limitations of using the HDI to compare levels of development between countries and over time. (4)
June 2017 · Paper 2 · Q6(a) 5 marks AO1=1, AO2=2, AO3=2 Calculation exchange rates
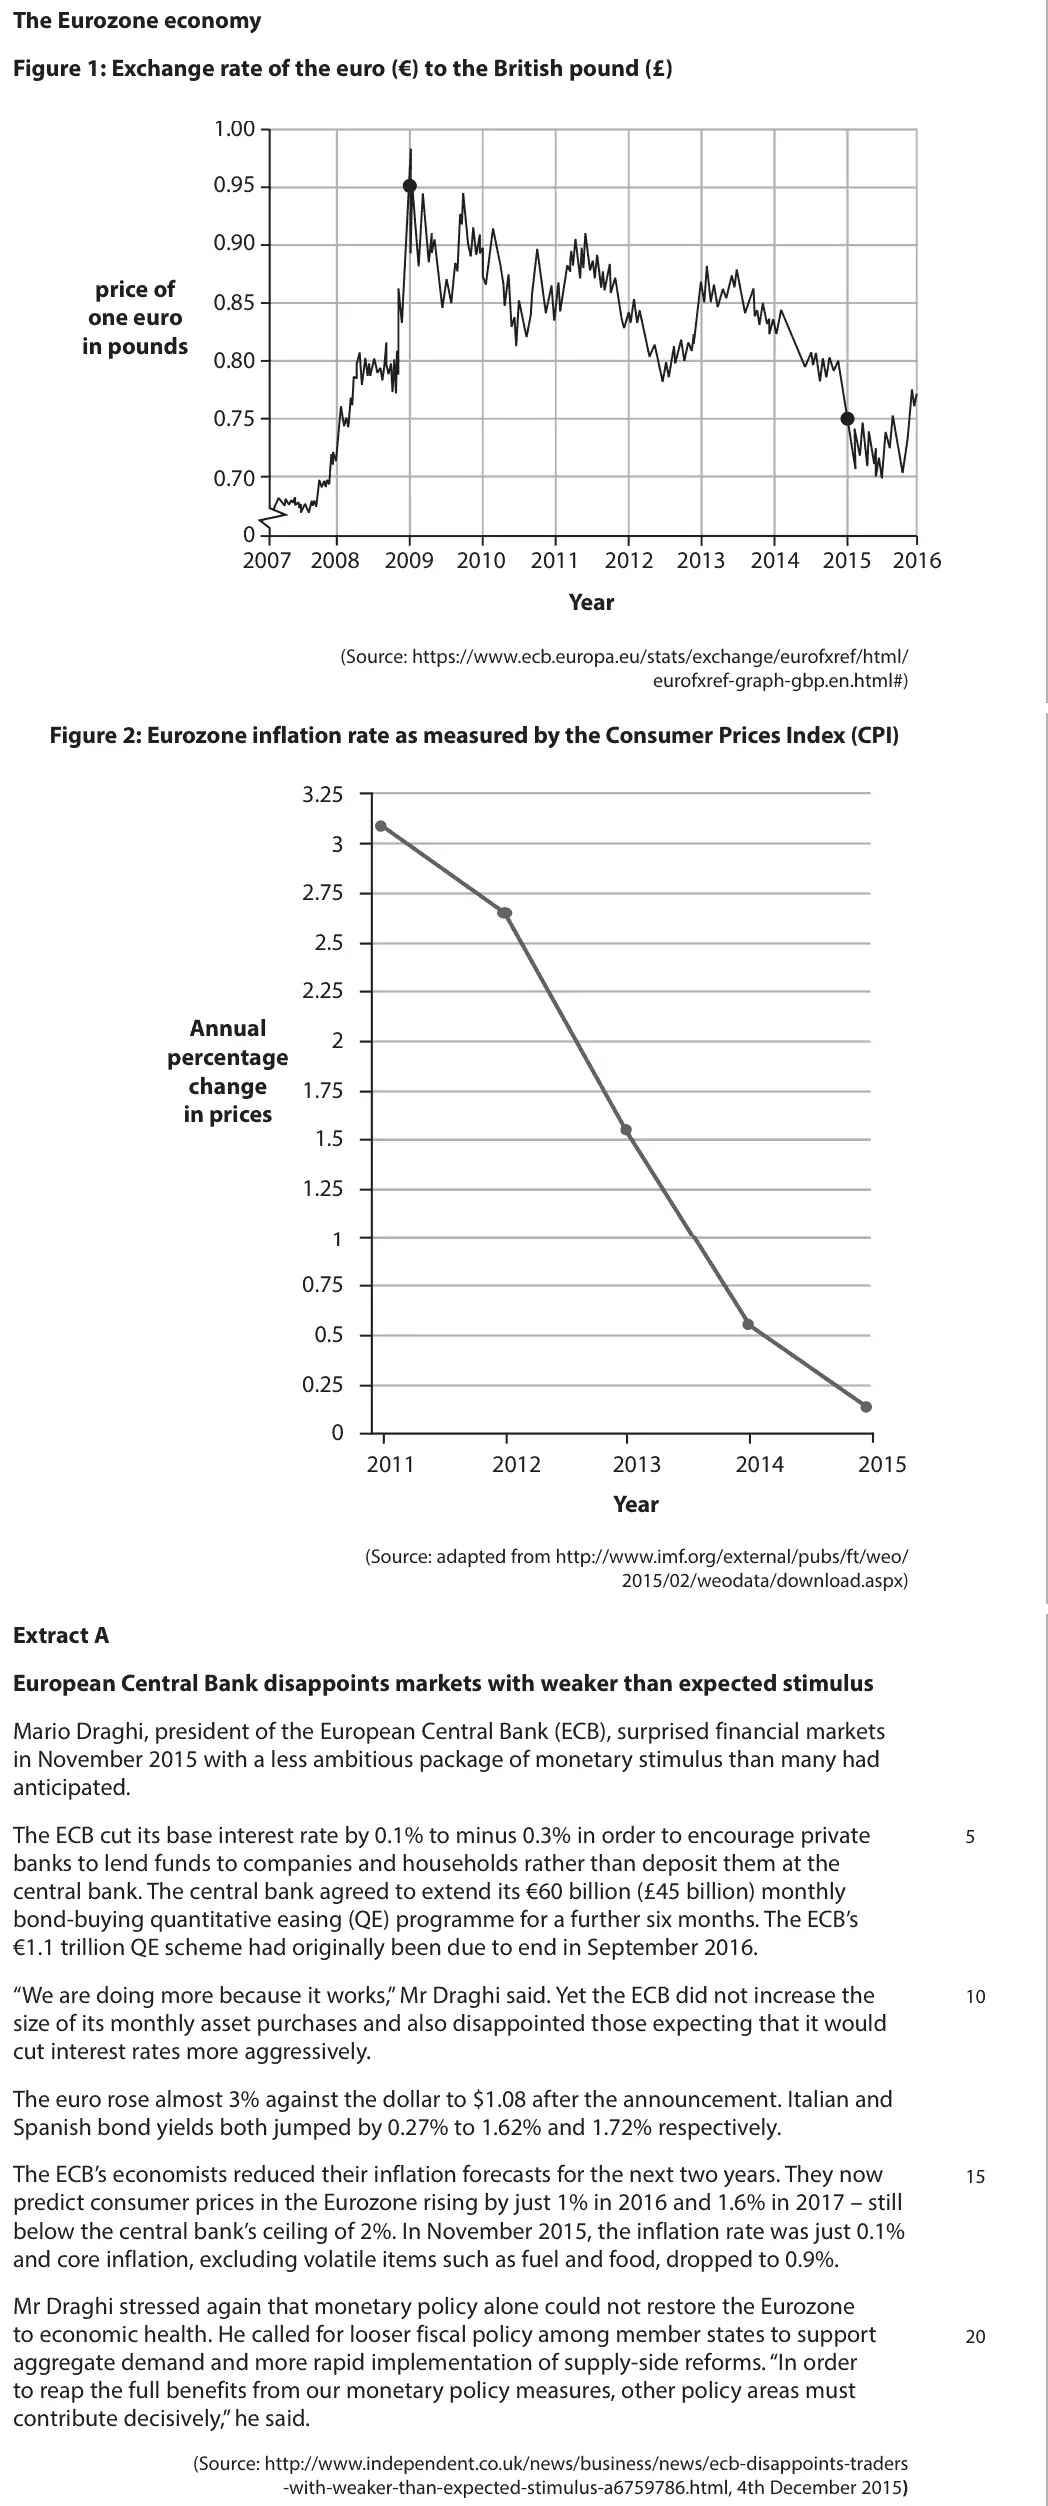
Data and extracts for question 6The Eurozone economy Figure 1: Exchange rate of the euro (€) to the British pound (£) 1.00 0.95 0.90 price of 0.85 one euro in pounds 0.80 0.75 0.70 0 2007 2008 2009 2010 2011 2012 2013 2014 2015 2016 Year (Source: https://www.ecb.europa.eu/stats/exchange/eurofxref/html/ eurofxref-graph-gbp.en.html#) Figure 2: Eurozone inflation rate as measured by the Consumer Prices Index (CPI) 3.25 3 2.75 2.5 2.25 Annual 2 percentage change 1.75 in prices 1.5 1.25 1 0.75 0.5 0.25 0 2011 2012 2013 2014 2015 Year (Source: adapted from http://www.imf.org/external/pubs/ft/weo/ 2015/02/weodata/download.aspx) Extract A European Central Bank disappoints markets with weaker than expected stimulus Mario Draghi, president of the European Central Bank (ECB), surprised financial markets in November 2015 with a less ambitious package of monetary stimulus than many had anticipated. The ECB cut its base interest rate by 0.1% to minus 0.3% in order to encourage private 5 banks to lend funds to companies and households rather than deposit them at the central bank. The central bank agreed to extend its €60 billion (£45 billion) monthly bond-buying quantitative easing (QE) programme for a further six months. The ECB’s €1.1 trillion QE scheme had originally been due to end in September 2016. “We are doing more because it works,” Mr Draghi said. Yet the ECB did not increase the 10 size of its monthly asset purchases and also disappointed those expecting that it would cut interest rates more aggressively. The euro rose almost 3% against the dollar to $1.08 after the announcement. Italian and Spanish bond yields both jumped by 0.27% to 1.62% and 1.72% respectively. The ECB’s economists reduced their inflation forecasts for the next two years. They now 15 predict consumer prices in the Eurozone rising by just 1% in 2016 and 1.6% in 2017 – still below the central bank’s ceiling of 2%. In November 2015, the inflation rate was just 0.1% and core inflation, excluding volatile items such as fuel and food, dropped to 0.9%. Mr Draghi stressed again that monetary policy alone could not restore the Eurozone to economic health. He called for looser fiscal policy among member states to support 20 aggregate demand and more rapid implementation of supply-side reforms. “In order to reap the full benefits from our monetary policy measures, other policy areas must contribute decisively,” he said. (Source: http://www.independent.co.uk/news/business/news/ecb-disappoints-traders -with-weaker-than-expected-stimulus-a6759786.html, 4th December 2015)
(a) With reference to Figure 1, calculate the percentage change in the value of the euro in pounds from the start of 2009 to the start of 2015. (5)
June 2017 · Paper 2 · Q6(b) 8 marks AO1=2, AO2=2, AO3=2, AO4=2 8-mark response inflation
Data and extracts for question 6The Eurozone economy Figure 1: Exchange rate of the euro (€) to the British pound (£) 1.00 0.95 0.90 price of 0.85 one euro in pounds 0.80 0.75 0.70 0 2007 2008 2009 2010 2011 2012 2013 2014 2015 2016 Year (Source: https://www.ecb.europa.eu/stats/exchange/eurofxref/html/ eurofxref-graph-gbp.en.html#) Figure 2: Eurozone inflation rate as measured by the Consumer Prices Index (CPI) 3.25 3 2.75 2.5 2.25 Annual 2 percentage change 1.75 in prices 1.5 1.25 1 0.75 0.5 0.25 0 2011 2012 2013 2014 2015 Year (Source: adapted from http://www.imf.org/external/pubs/ft/weo/ 2015/02/weodata/download.aspx) Extract A European Central Bank disappoints markets with weaker than expected stimulus Mario Draghi, president of the European Central Bank (ECB), surprised financial markets in November 2015 with a less ambitious package of monetary stimulus than many had anticipated. The ECB cut its base interest rate by 0.1% to minus 0.3% in order to encourage private 5 banks to lend funds to companies and households rather than deposit them at the central bank. The central bank agreed to extend its €60 billion (£45 billion) monthly bond-buying quantitative easing (QE) programme for a further six months. The ECB’s €1.1 trillion QE scheme had originally been due to end in September 2016. “We are doing more because it works,” Mr Draghi said. Yet the ECB did not increase the 10 size of its monthly asset purchases and also disappointed those expecting that it would cut interest rates more aggressively. The euro rose almost 3% against the dollar to $1.08 after the announcement. Italian and Spanish bond yields both jumped by 0.27% to 1.62% and 1.72% respectively. The ECB’s economists reduced their inflation forecasts for the next two years. They now 15 predict consumer prices in the Eurozone rising by just 1% in 2016 and 1.6% in 2017 – still below the central bank’s ceiling of 2%. In November 2015, the inflation rate was just 0.1% and core inflation, excluding volatile items such as fuel and food, dropped to 0.9%. Mr Draghi stressed again that monetary policy alone could not restore the Eurozone to economic health. He called for looser fiscal policy among member states to support 20 aggregate demand and more rapid implementation of supply-side reforms. “In order to reap the full benefits from our monetary policy measures, other policy areas must contribute decisively,” he said. (Source: http://www.independent.co.uk/news/business/news/ecb-disappoints-traders -with-weaker-than-expected-stimulus-a6759786.html, 4th December 2015)
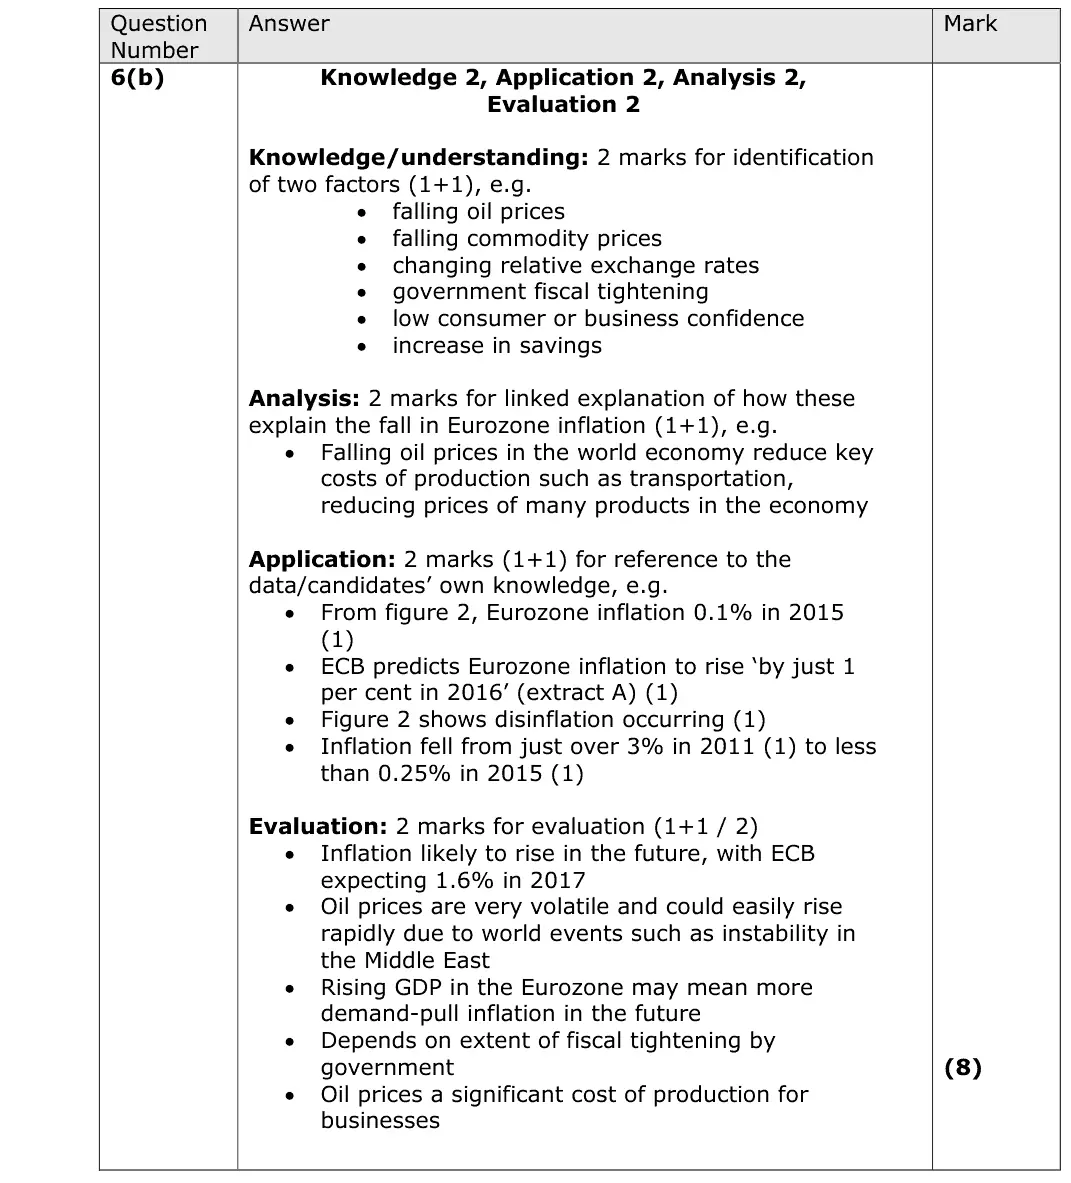
(b) With reference to the information provided and your own knowledge, examine two factors which might explain the change in the rate of Eurozone inflation as shown in Figure 2. (8)
June 2017 · Paper 2 · Q6(c) 10 marks AO1=2, AO2=2, AO3=2, AO4=4 10-mark response exchange ratesbalance of payments
Data and extracts for question 6The Eurozone economy Figure 1: Exchange rate of the euro (€) to the British pound (£) 1.00 0.95 0.90 price of 0.85 one euro in pounds 0.80 0.75 0.70 0 2007 2008 2009 2010 2011 2012 2013 2014 2015 2016 Year (Source: https://www.ecb.europa.eu/stats/exchange/eurofxref/html/ eurofxref-graph-gbp.en.html#) Figure 2: Eurozone inflation rate as measured by the Consumer Prices Index (CPI) 3.25 3 2.75 2.5 2.25 Annual 2 percentage change 1.75 in prices 1.5 1.25 1 0.75 0.5 0.25 0 2011 2012 2013 2014 2015 Year (Source: adapted from http://www.imf.org/external/pubs/ft/weo/ 2015/02/weodata/download.aspx) Extract A European Central Bank disappoints markets with weaker than expected stimulus Mario Draghi, president of the European Central Bank (ECB), surprised financial markets in November 2015 with a less ambitious package of monetary stimulus than many had anticipated. The ECB cut its base interest rate by 0.1% to minus 0.3% in order to encourage private 5 banks to lend funds to companies and households rather than deposit them at the central bank. The central bank agreed to extend its €60 billion (£45 billion) monthly bond-buying quantitative easing (QE) programme for a further six months. The ECB’s €1.1 trillion QE scheme had originally been due to end in September 2016. “We are doing more because it works,” Mr Draghi said. Yet the ECB did not increase the 10 size of its monthly asset purchases and also disappointed those expecting that it would cut interest rates more aggressively. The euro rose almost 3% against the dollar to $1.08 after the announcement. Italian and Spanish bond yields both jumped by 0.27% to 1.62% and 1.72% respectively. The ECB’s economists reduced their inflation forecasts for the next two years. They now 15 predict consumer prices in the Eurozone rising by just 1% in 2016 and 1.6% in 2017 – still below the central bank’s ceiling of 2%. In November 2015, the inflation rate was just 0.1% and core inflation, excluding volatile items such as fuel and food, dropped to 0.9%. Mr Draghi stressed again that monetary policy alone could not restore the Eurozone to economic health. He called for looser fiscal policy among member states to support 20 aggregate demand and more rapid implementation of supply-side reforms. “In order to reap the full benefits from our monetary policy measures, other policy areas must contribute decisively,” he said. (Source: http://www.independent.co.uk/news/business/news/ecb-disappoints-traders -with-weaker-than-expected-stimulus-a6759786.html, 4th December 2015)
(c) Since mid-2015 the euro has appreciated. Assess the likely impact of an appreciation of the euro on the current account of the balance of payments for Eurozone countries. (10)
June 2017 · Paper 2 · Q6(d) 12 marks AO1=2, AO2=2, AO3=4, AO4=4 12-mark response fiscal and monetary policymacroeconomic policy in a global context
Data and extracts for question 6The Eurozone economy Figure 1: Exchange rate of the euro (€) to the British pound (£) 1.00 0.95 0.90 price of 0.85 one euro in pounds 0.80 0.75 0.70 0 2007 2008 2009 2010 2011 2012 2013 2014 2015 2016 Year (Source: https://www.ecb.europa.eu/stats/exchange/eurofxref/html/ eurofxref-graph-gbp.en.html#) Figure 2: Eurozone inflation rate as measured by the Consumer Prices Index (CPI) 3.25 3 2.75 2.5 2.25 Annual 2 percentage change 1.75 in prices 1.5 1.25 1 0.75 0.5 0.25 0 2011 2012 2013 2014 2015 Year (Source: adapted from http://www.imf.org/external/pubs/ft/weo/ 2015/02/weodata/download.aspx) Extract A European Central Bank disappoints markets with weaker than expected stimulus Mario Draghi, president of the European Central Bank (ECB), surprised financial markets in November 2015 with a less ambitious package of monetary stimulus than many had anticipated. The ECB cut its base interest rate by 0.1% to minus 0.3% in order to encourage private 5 banks to lend funds to companies and households rather than deposit them at the central bank. The central bank agreed to extend its €60 billion (£45 billion) monthly bond-buying quantitative easing (QE) programme for a further six months. The ECB’s €1.1 trillion QE scheme had originally been due to end in September 2016. “We are doing more because it works,” Mr Draghi said. Yet the ECB did not increase the 10 size of its monthly asset purchases and also disappointed those expecting that it would cut interest rates more aggressively. The euro rose almost 3% against the dollar to $1.08 after the announcement. Italian and Spanish bond yields both jumped by 0.27% to 1.62% and 1.72% respectively. The ECB’s economists reduced their inflation forecasts for the next two years. They now 15 predict consumer prices in the Eurozone rising by just 1% in 2016 and 1.6% in 2017 – still below the central bank’s ceiling of 2%. In November 2015, the inflation rate was just 0.1% and core inflation, excluding volatile items such as fuel and food, dropped to 0.9%. Mr Draghi stressed again that monetary policy alone could not restore the Eurozone to economic health. He called for looser fiscal policy among member states to support 20 aggregate demand and more rapid implementation of supply-side reforms. “In order to reap the full benefits from our monetary policy measures, other policy areas must contribute decisively,” he said. (Source: http://www.independent.co.uk/news/business/news/ecb-disappoints-traders -with-weaker-than-expected-stimulus-a6759786.html, 4th December 2015)
(d) Discuss the likely success of the ECB’s quantitative easing programme in moving Eurozone inflation closer to ‘the central bank’s ceiling of 2%’ (Extract A, line 17). (12)
June 2017 · Paper 2 · Q6(e) 15 marks AO1=3, AO2=3, AO3=3, AO4=6 15-mark response fiscal and monetary policysupply side policies
Data and extracts for question 6The Eurozone economy Figure 1: Exchange rate of the euro (€) to the British pound (£) 1.00 0.95 0.90 price of 0.85 one euro in pounds 0.80 0.75 0.70 0 2007 2008 2009 2010 2011 2012 2013 2014 2015 2016 Year (Source: https://www.ecb.europa.eu/stats/exchange/eurofxref/html/ eurofxref-graph-gbp.en.html#) Figure 2: Eurozone inflation rate as measured by the Consumer Prices Index (CPI) 3.25 3 2.75 2.5 2.25 Annual 2 percentage change 1.75 in prices 1.5 1.25 1 0.75 0.5 0.25 0 2011 2012 2013 2014 2015 Year (Source: adapted from http://www.imf.org/external/pubs/ft/weo/ 2015/02/weodata/download.aspx) Extract A European Central Bank disappoints markets with weaker than expected stimulus Mario Draghi, president of the European Central Bank (ECB), surprised financial markets in November 2015 with a less ambitious package of monetary stimulus than many had anticipated. The ECB cut its base interest rate by 0.1% to minus 0.3% in order to encourage private 5 banks to lend funds to companies and households rather than deposit them at the central bank. The central bank agreed to extend its €60 billion (£45 billion) monthly bond-buying quantitative easing (QE) programme for a further six months. The ECB’s €1.1 trillion QE scheme had originally been due to end in September 2016. “We are doing more because it works,” Mr Draghi said. Yet the ECB did not increase the 10 size of its monthly asset purchases and also disappointed those expecting that it would cut interest rates more aggressively. The euro rose almost 3% against the dollar to $1.08 after the announcement. Italian and Spanish bond yields both jumped by 0.27% to 1.62% and 1.72% respectively. The ECB’s economists reduced their inflation forecasts for the next two years. They now 15 predict consumer prices in the Eurozone rising by just 1% in 2016 and 1.6% in 2017 – still below the central bank’s ceiling of 2%. In November 2015, the inflation rate was just 0.1% and core inflation, excluding volatile items such as fuel and food, dropped to 0.9%. Mr Draghi stressed again that monetary policy alone could not restore the Eurozone to economic health. He called for looser fiscal policy among member states to support 20 aggregate demand and more rapid implementation of supply-side reforms. “In order to reap the full benefits from our monetary policy measures, other policy areas must contribute decisively,” he said. (Source: http://www.independent.co.uk/news/business/news/ecb-disappoints-traders -with-weaker-than-expected-stimulus-a6759786.html, 4th December 2015)
(e) Discuss ‘looser fiscal policy’ and ‘supply-side reforms’ (Extract A, lines 20 and 21) that may be used by governments of Eurozone countries to increase economic growth. (15)
June 2017 · Paper 2 · Q7 25 marks AO1=4, AO2=4, AO3=8, AO4=9 25-mark essay Either/or trading blocs and protectionismglobalisation and trade
7 Since the global financial crisis of 2008 there have been over 5 700 increases in tariffs, quotas and administrative controls on international trade. Evaluate the likely effects of an increase in protectionism on the economy of a developing country of your choice.
June 2017 · Paper 2 · Q8 25 marks AO1=4, AO2=4, AO3=8, AO4=9 25-mark essay Either/or aggregate supplynational income and the multiplier
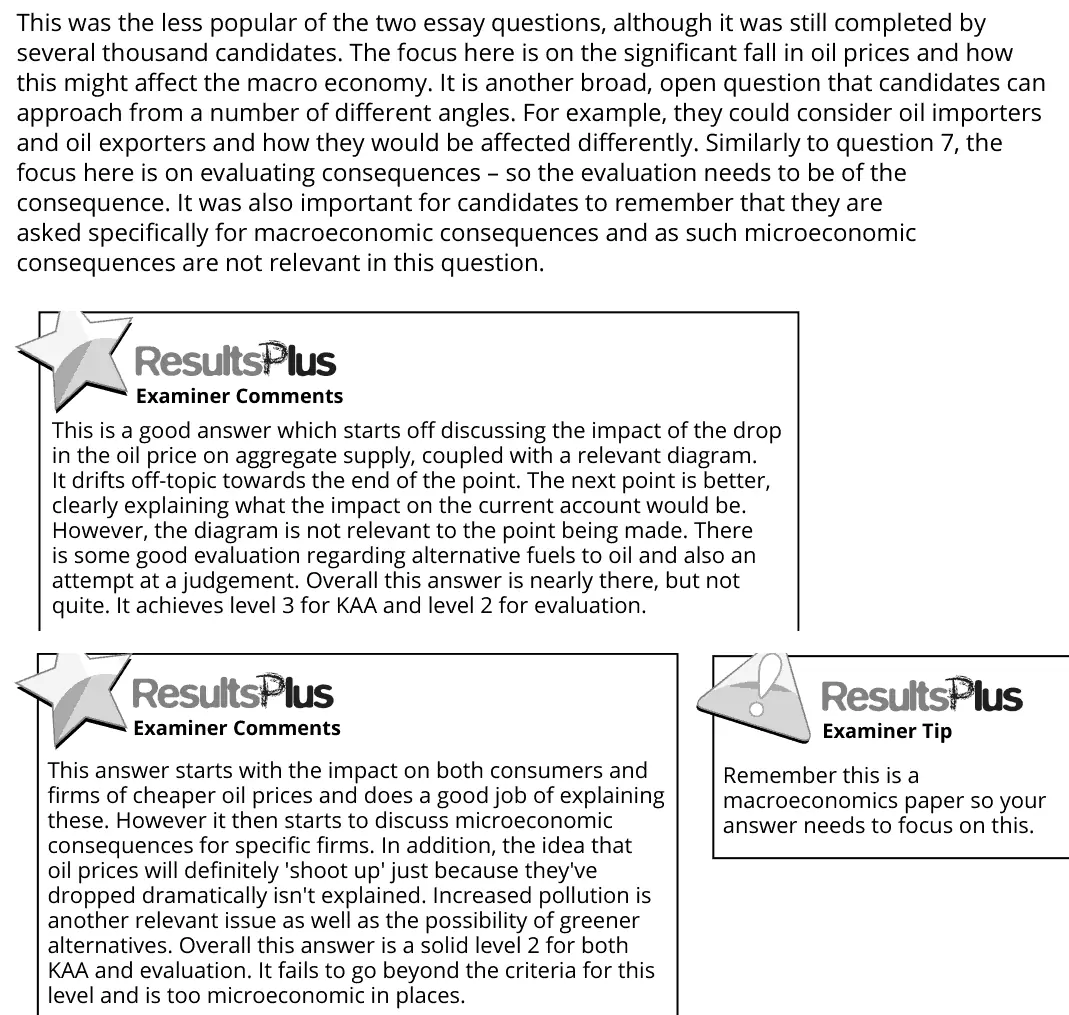
8 Global oil prices fell from a 2008 peak of $147 a barrel to $27 in 2016. Evaluate the likely macroeconomic consequences of a significant fall in global oil prices.

Work with an Edexcel economics tutor

Want a paper marked and gone through with you? Message us.

Prefer email? Send an enquiry

If you are under 18, please include a parent's contact details. Enquiries go to enquiries@economicsaleveltutor.com and are deleted once handled. All tutoring is online.