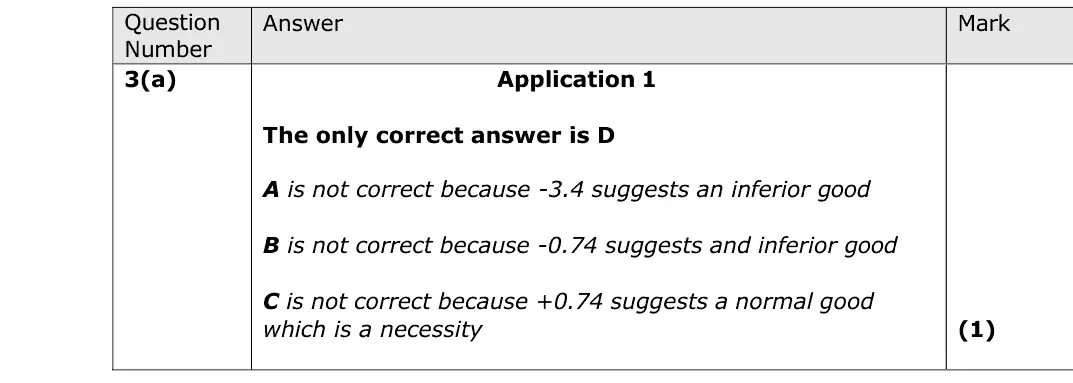
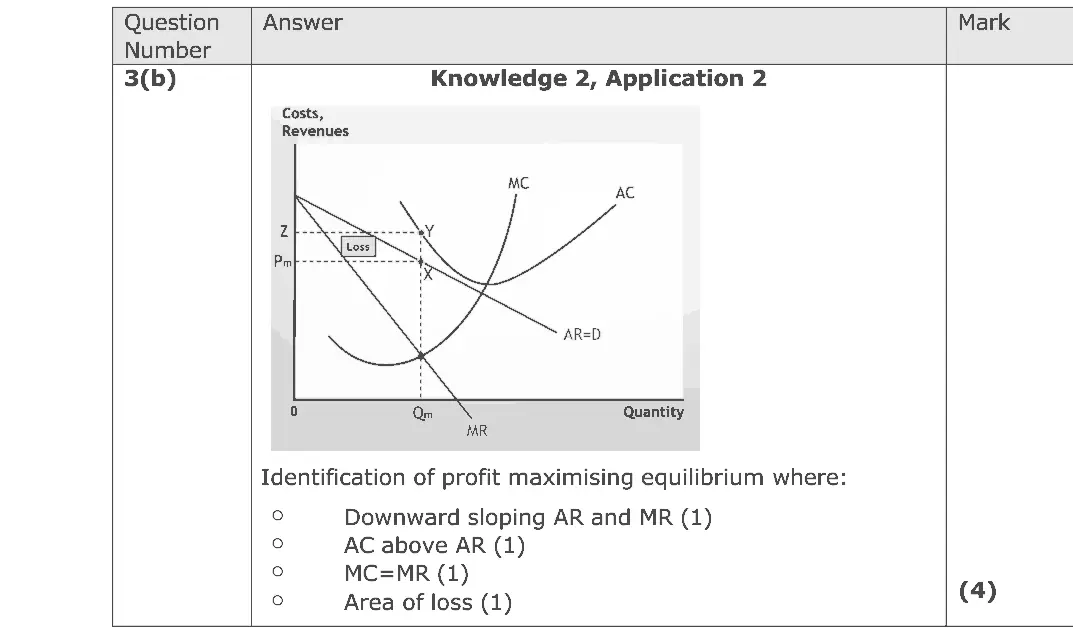
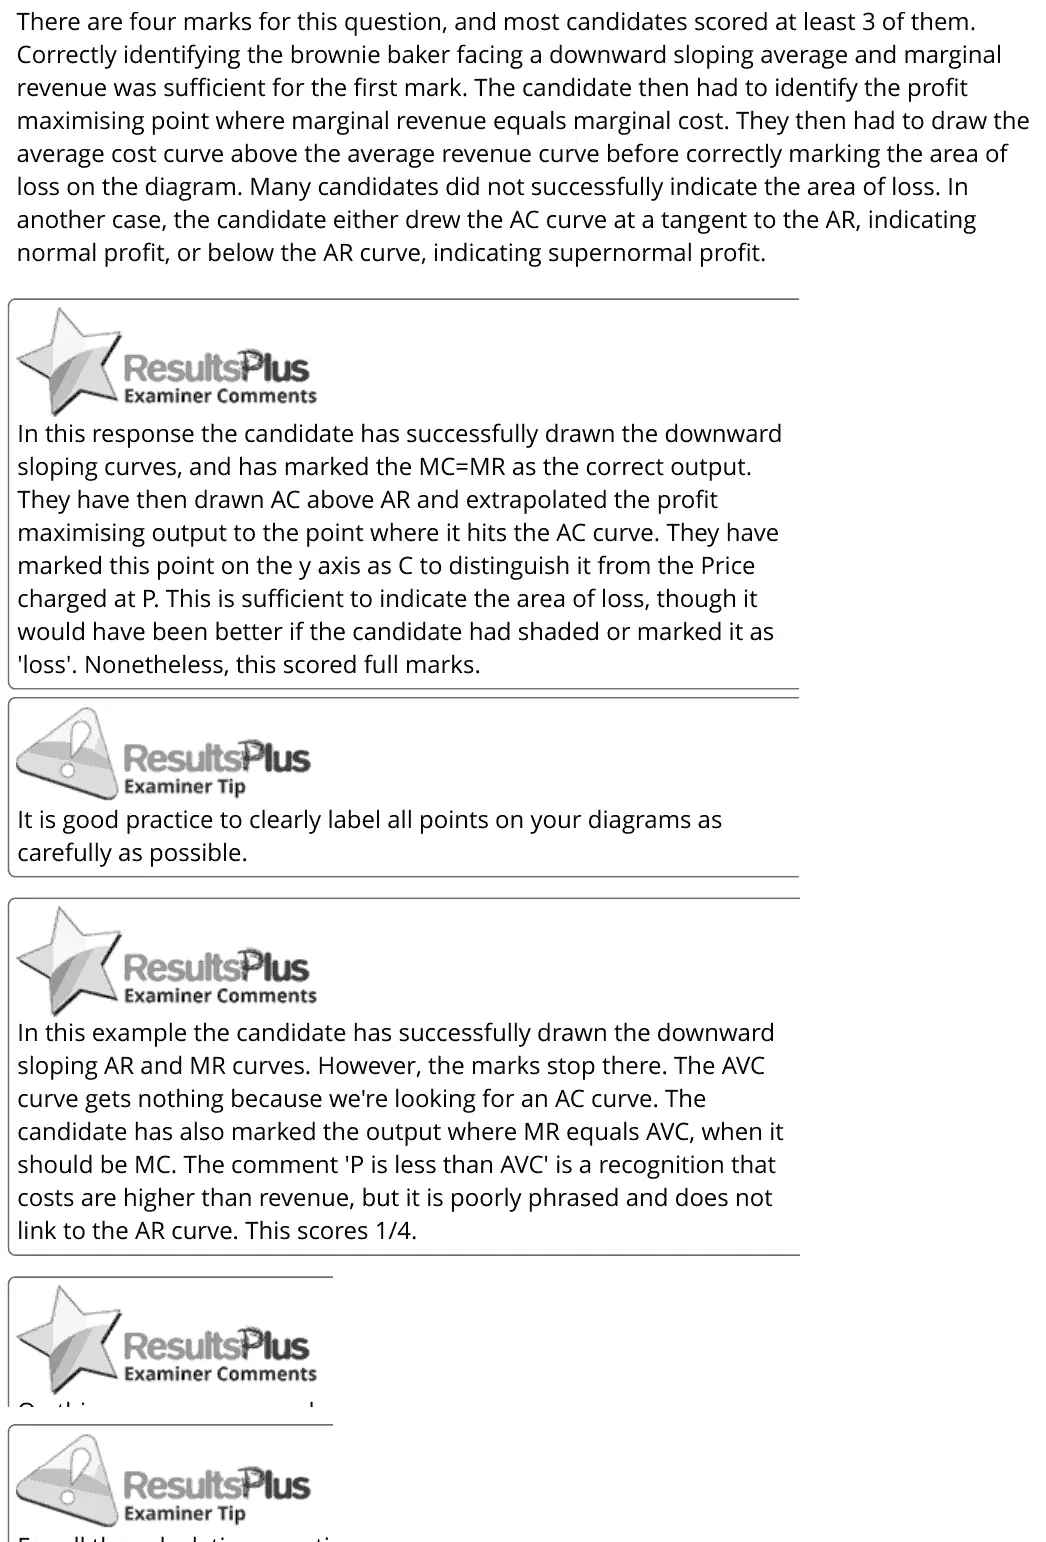
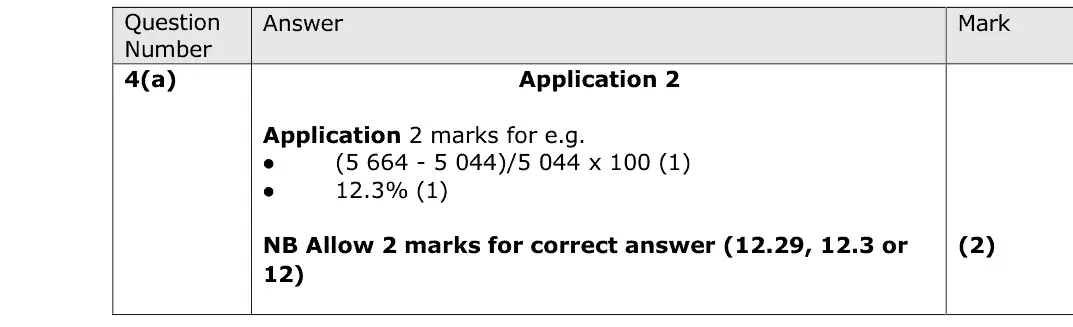
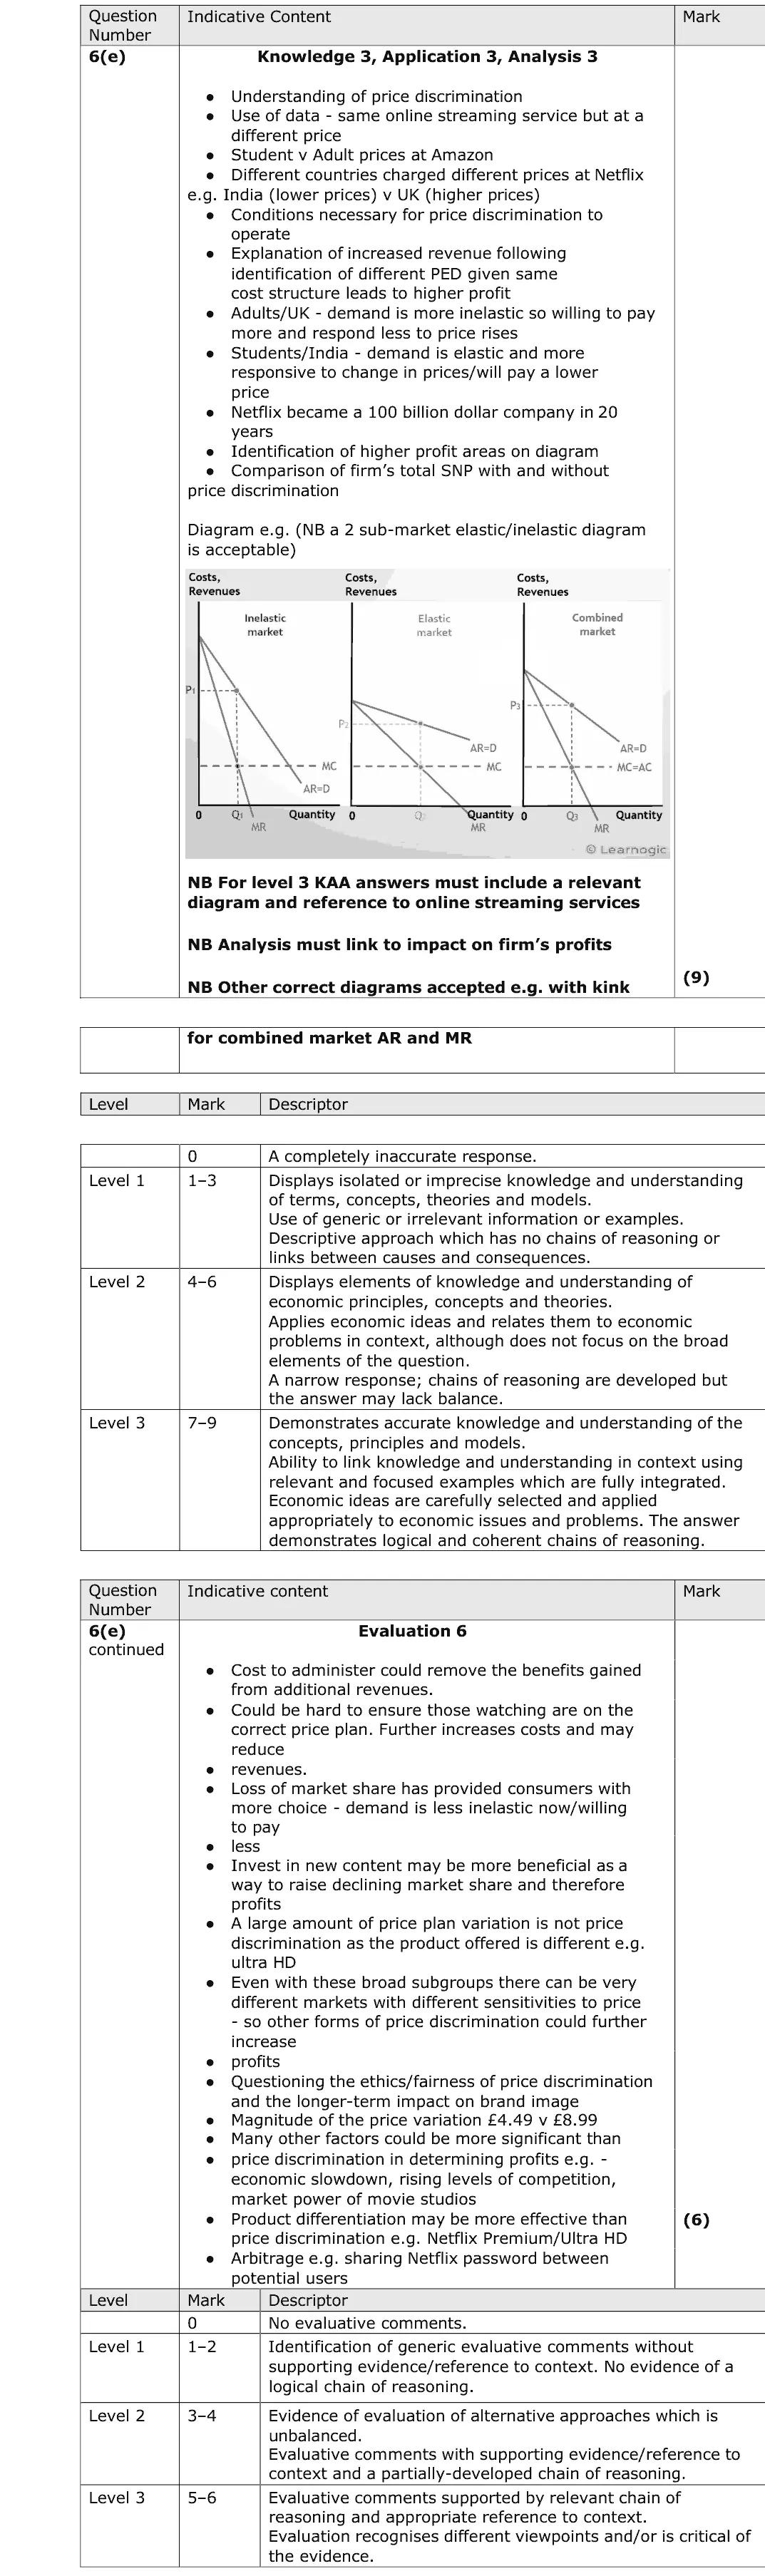
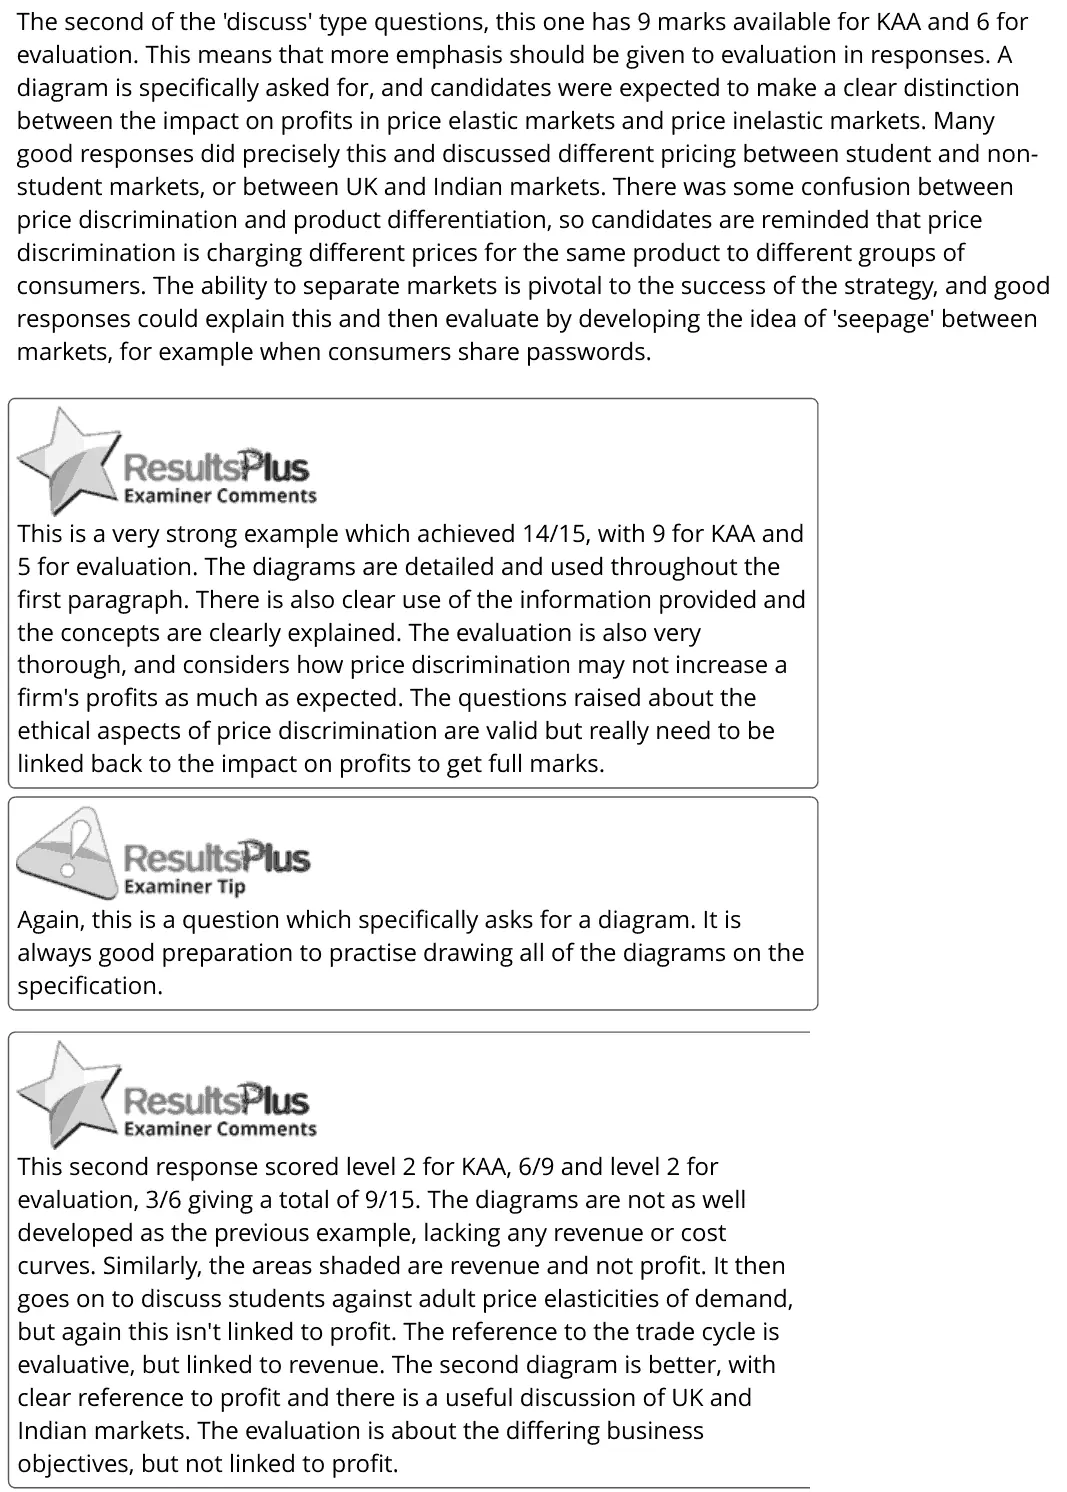
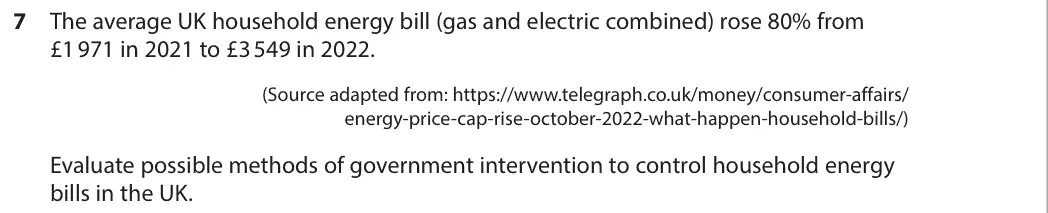
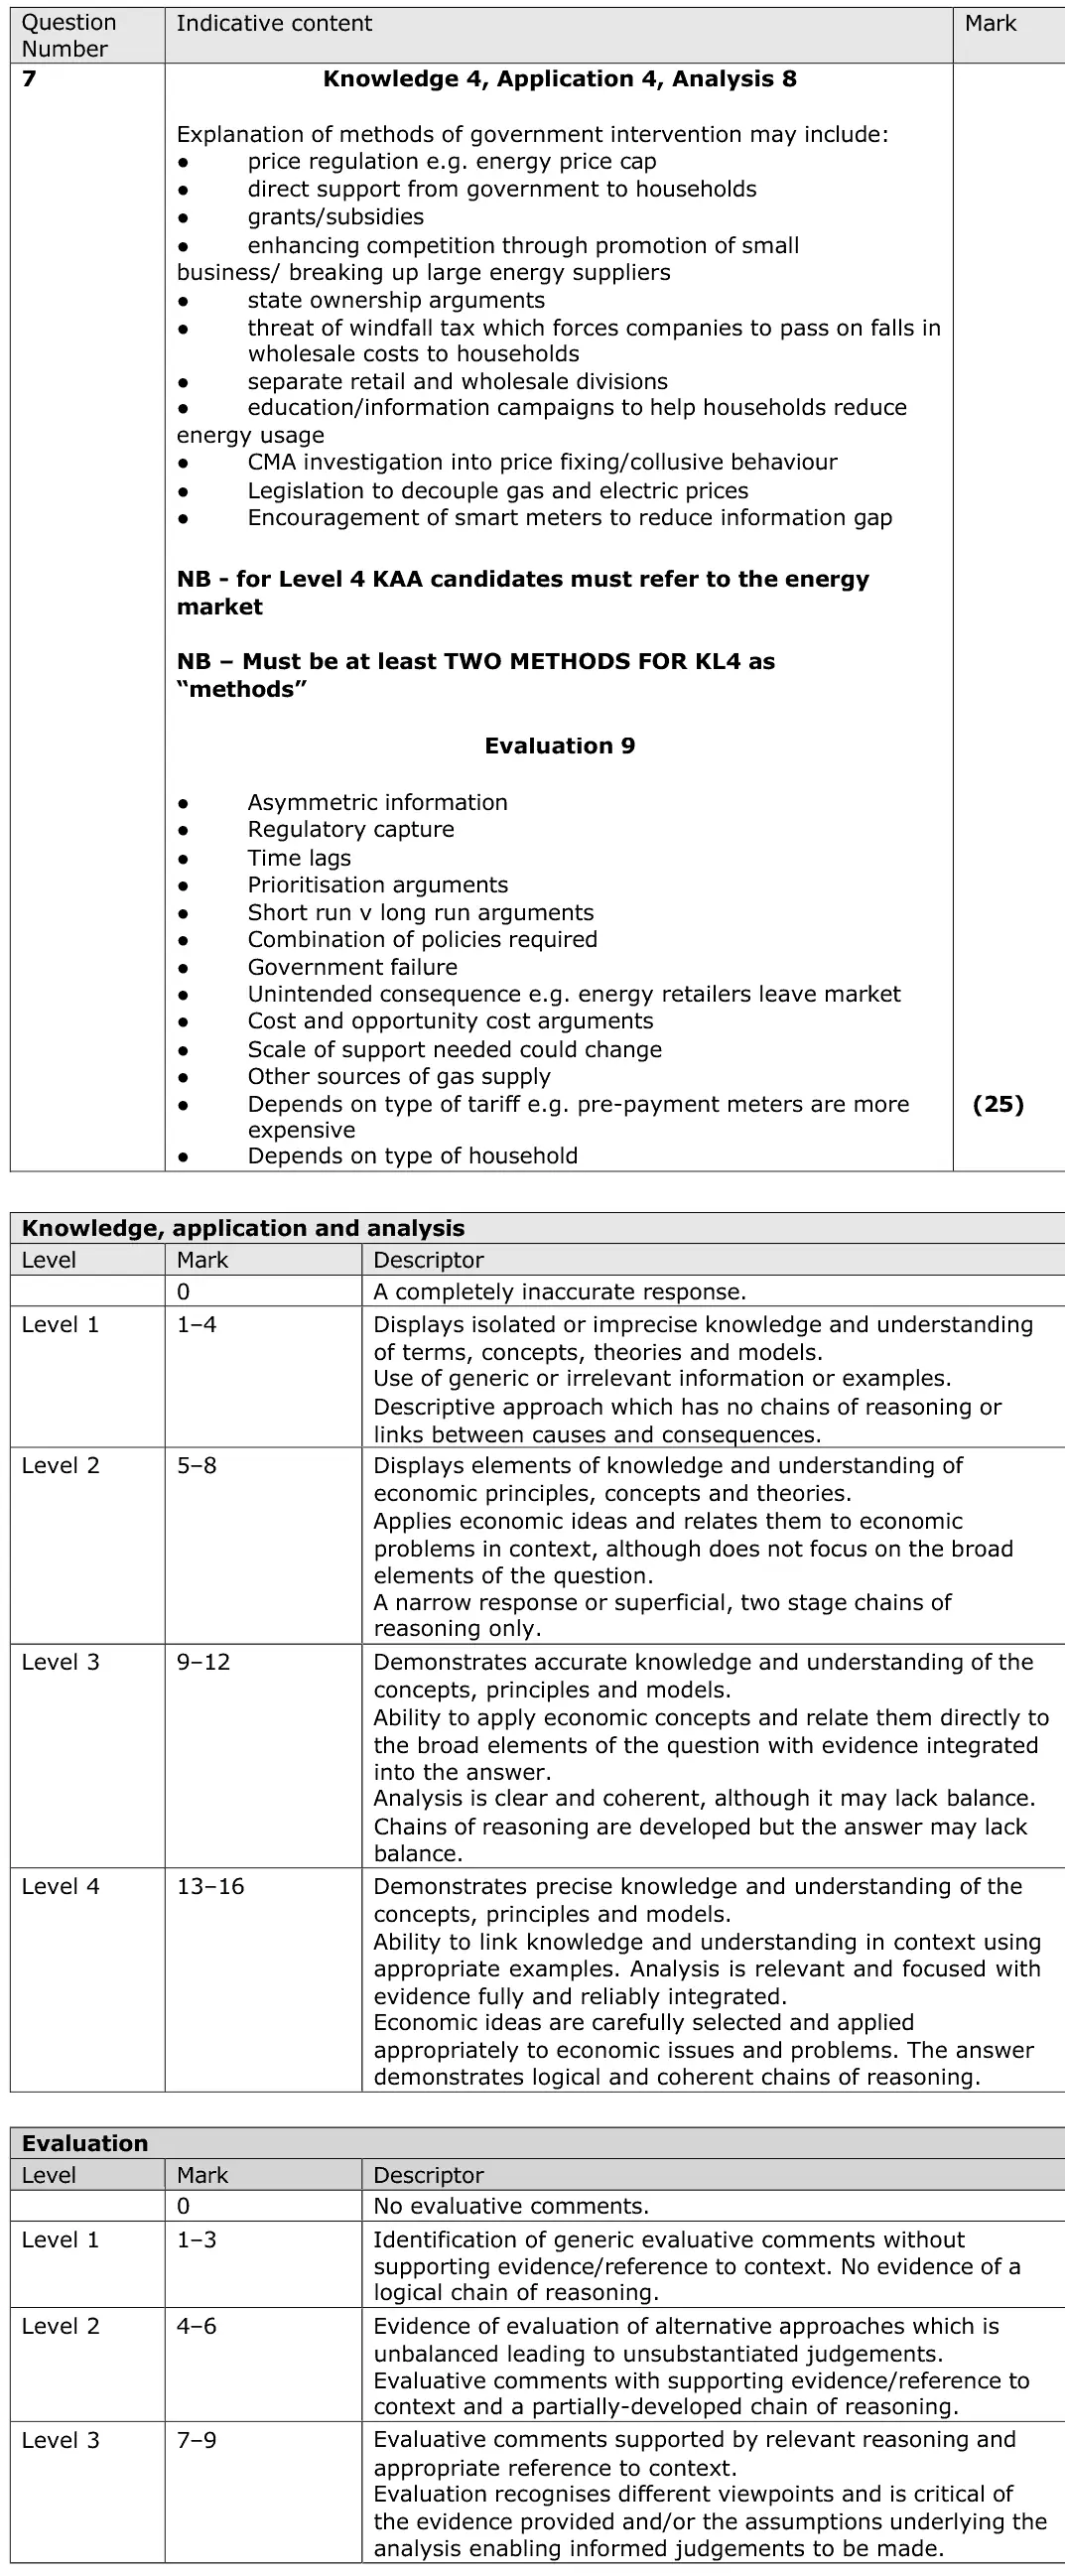
Examiner's comment
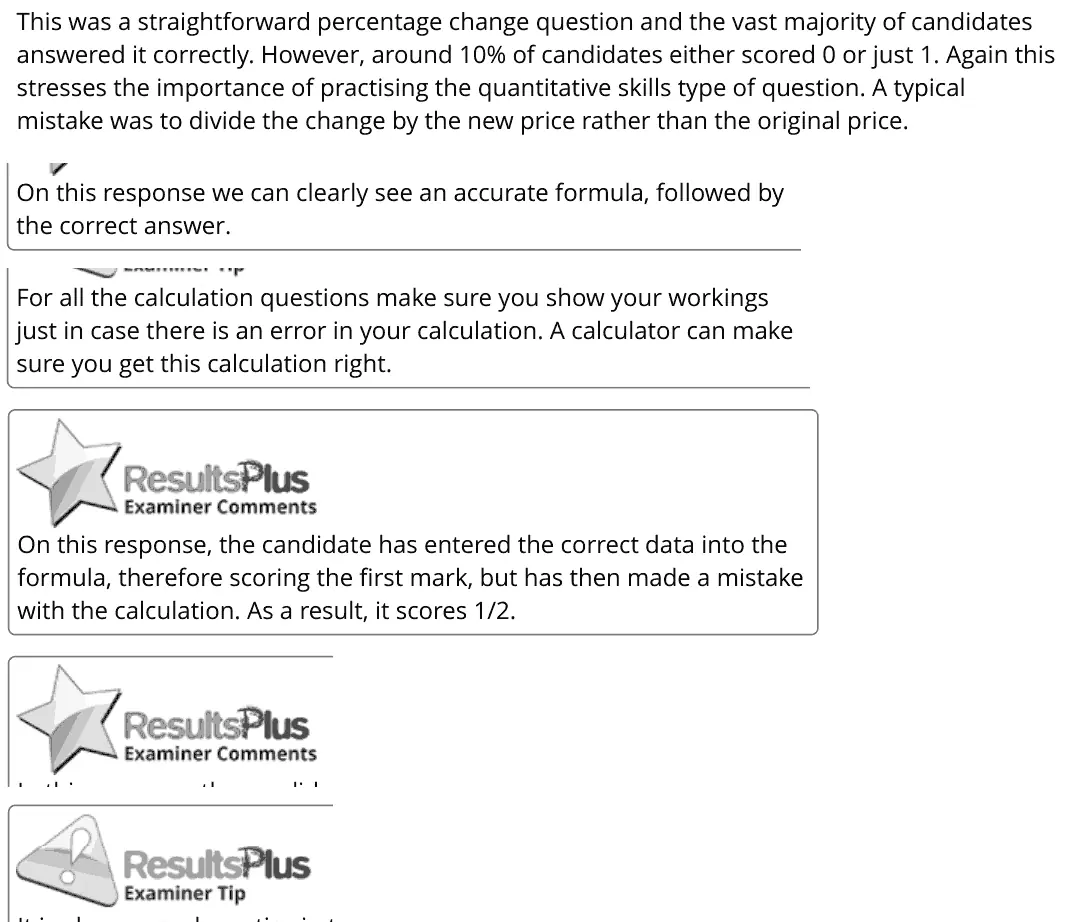
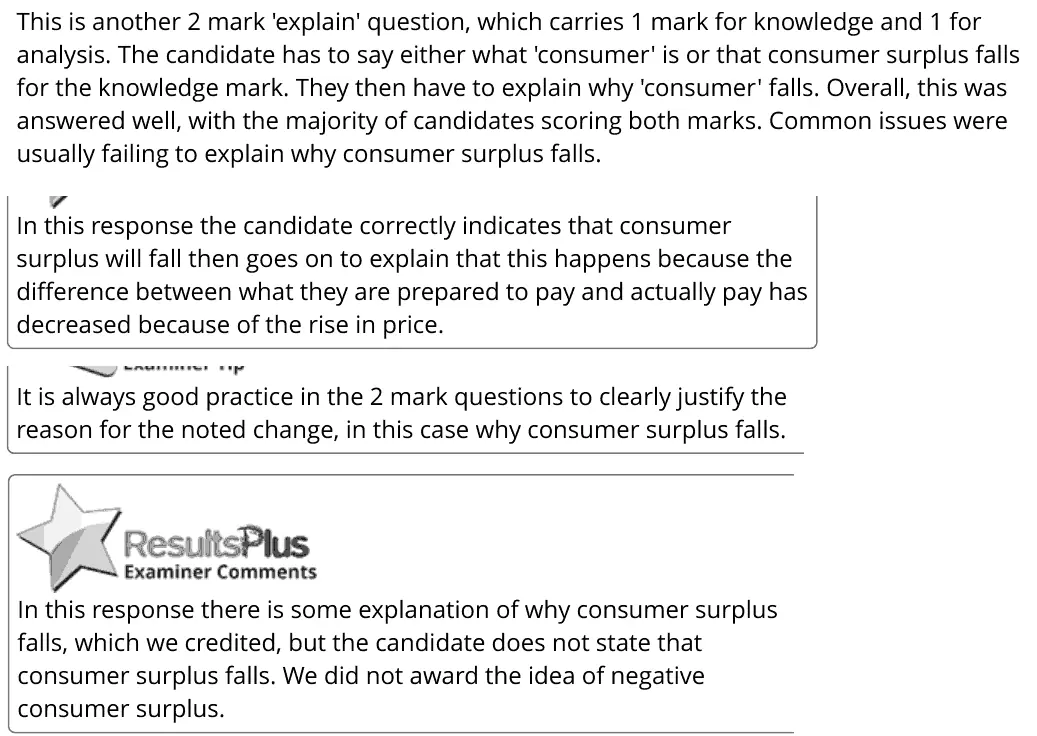
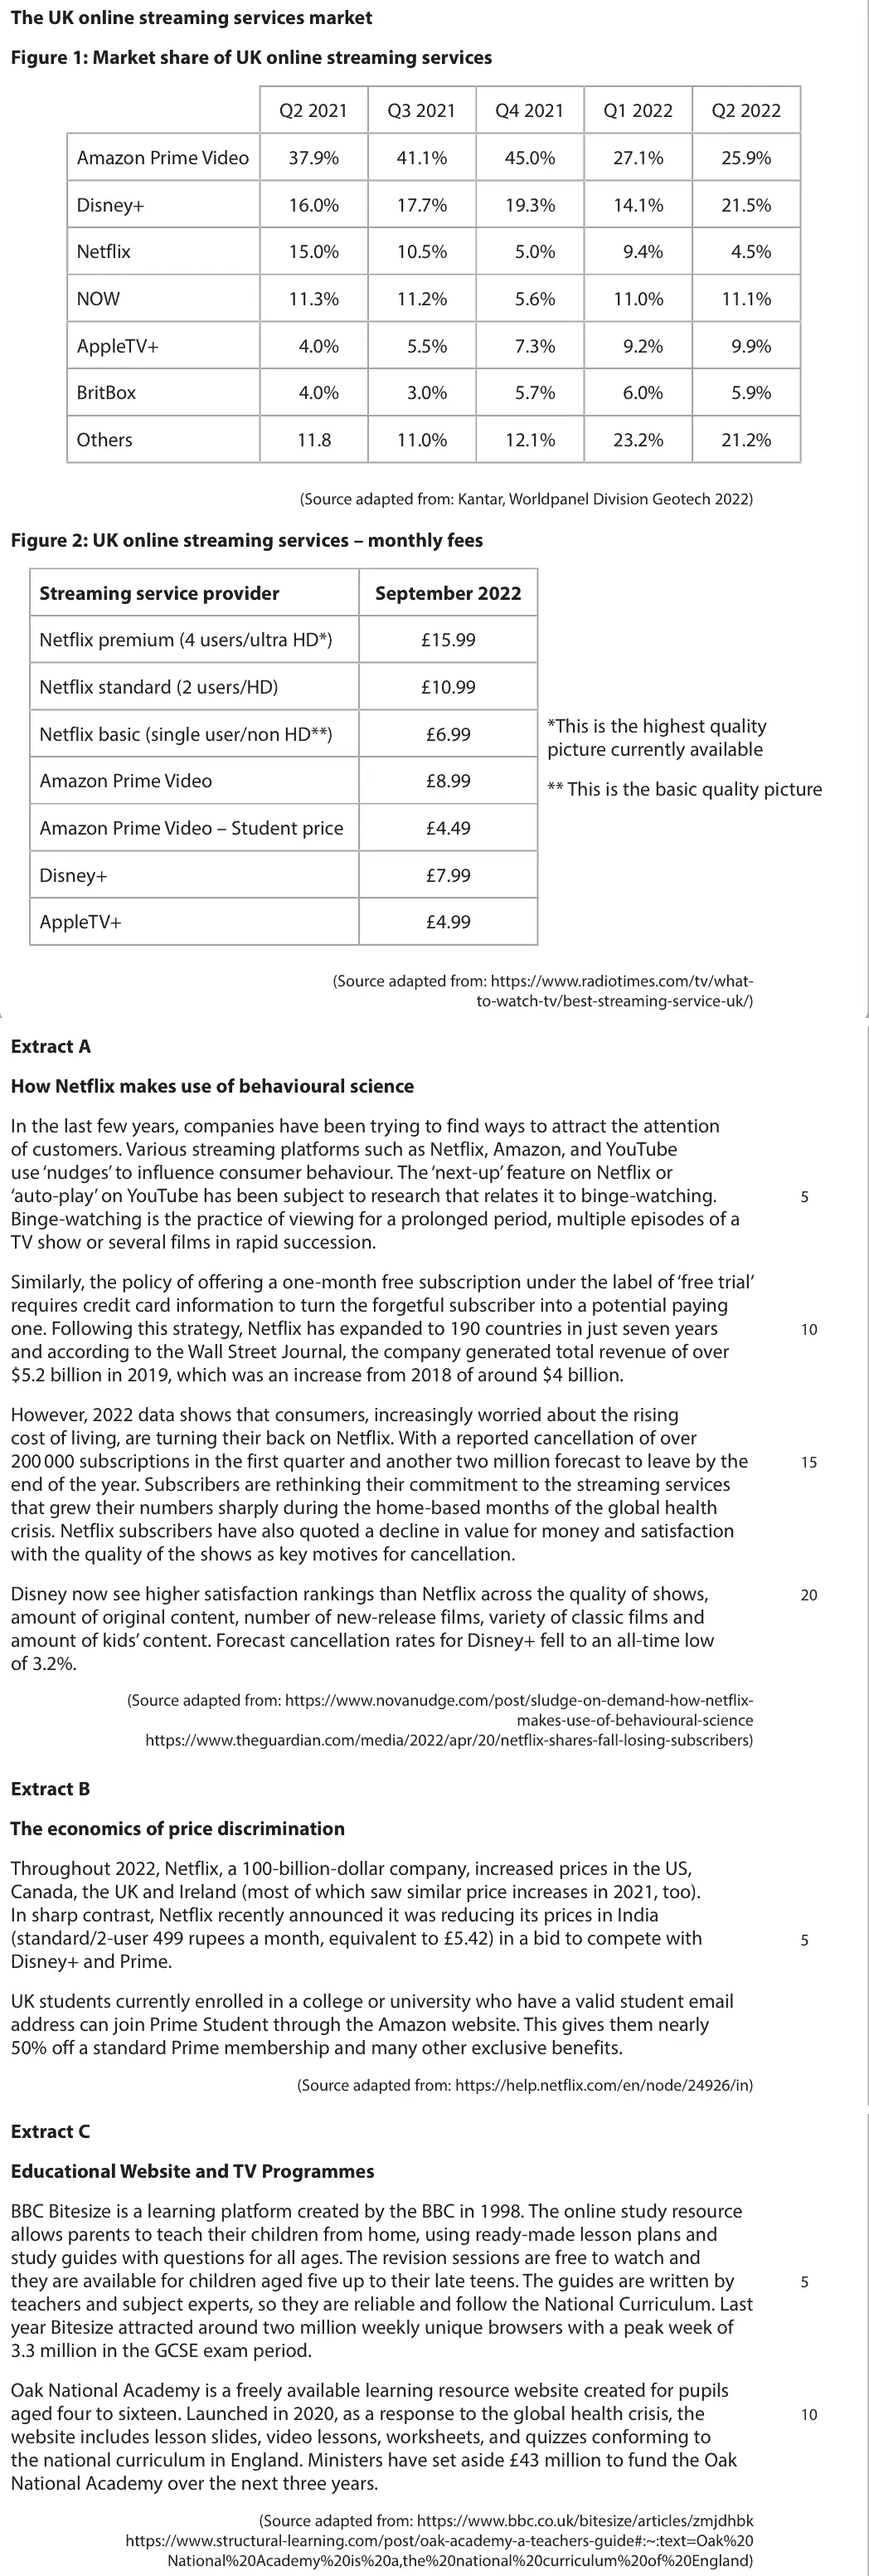
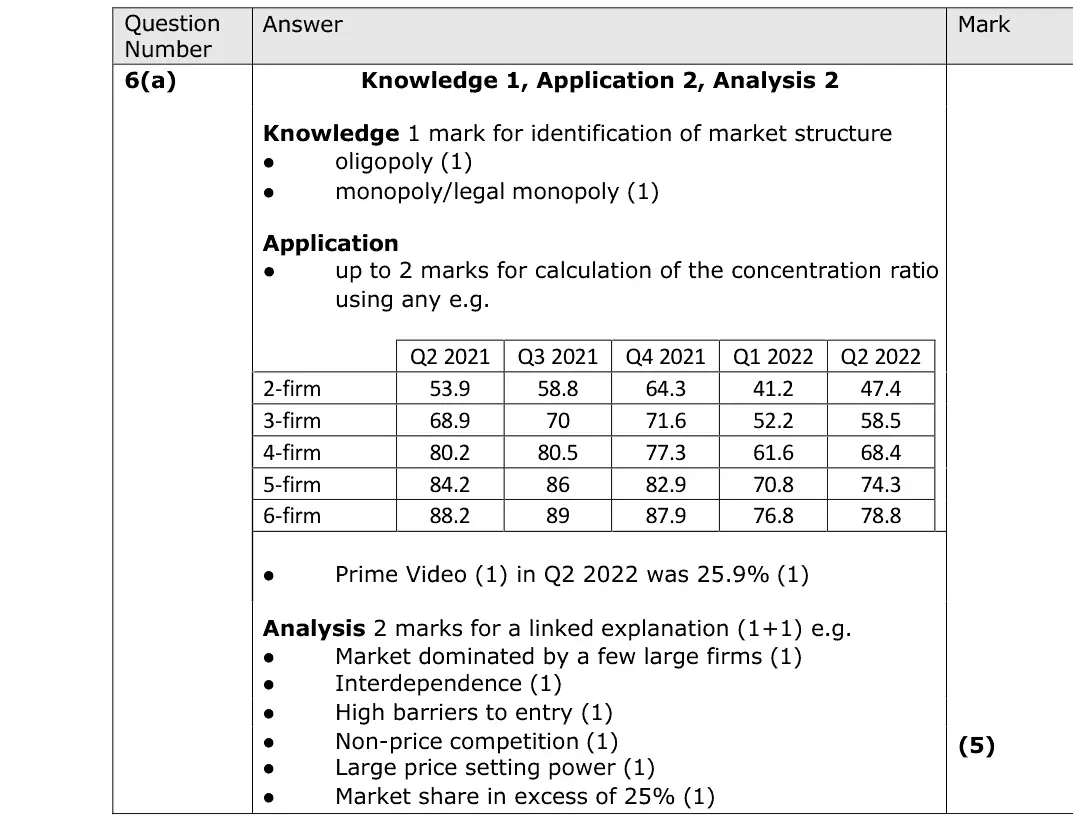
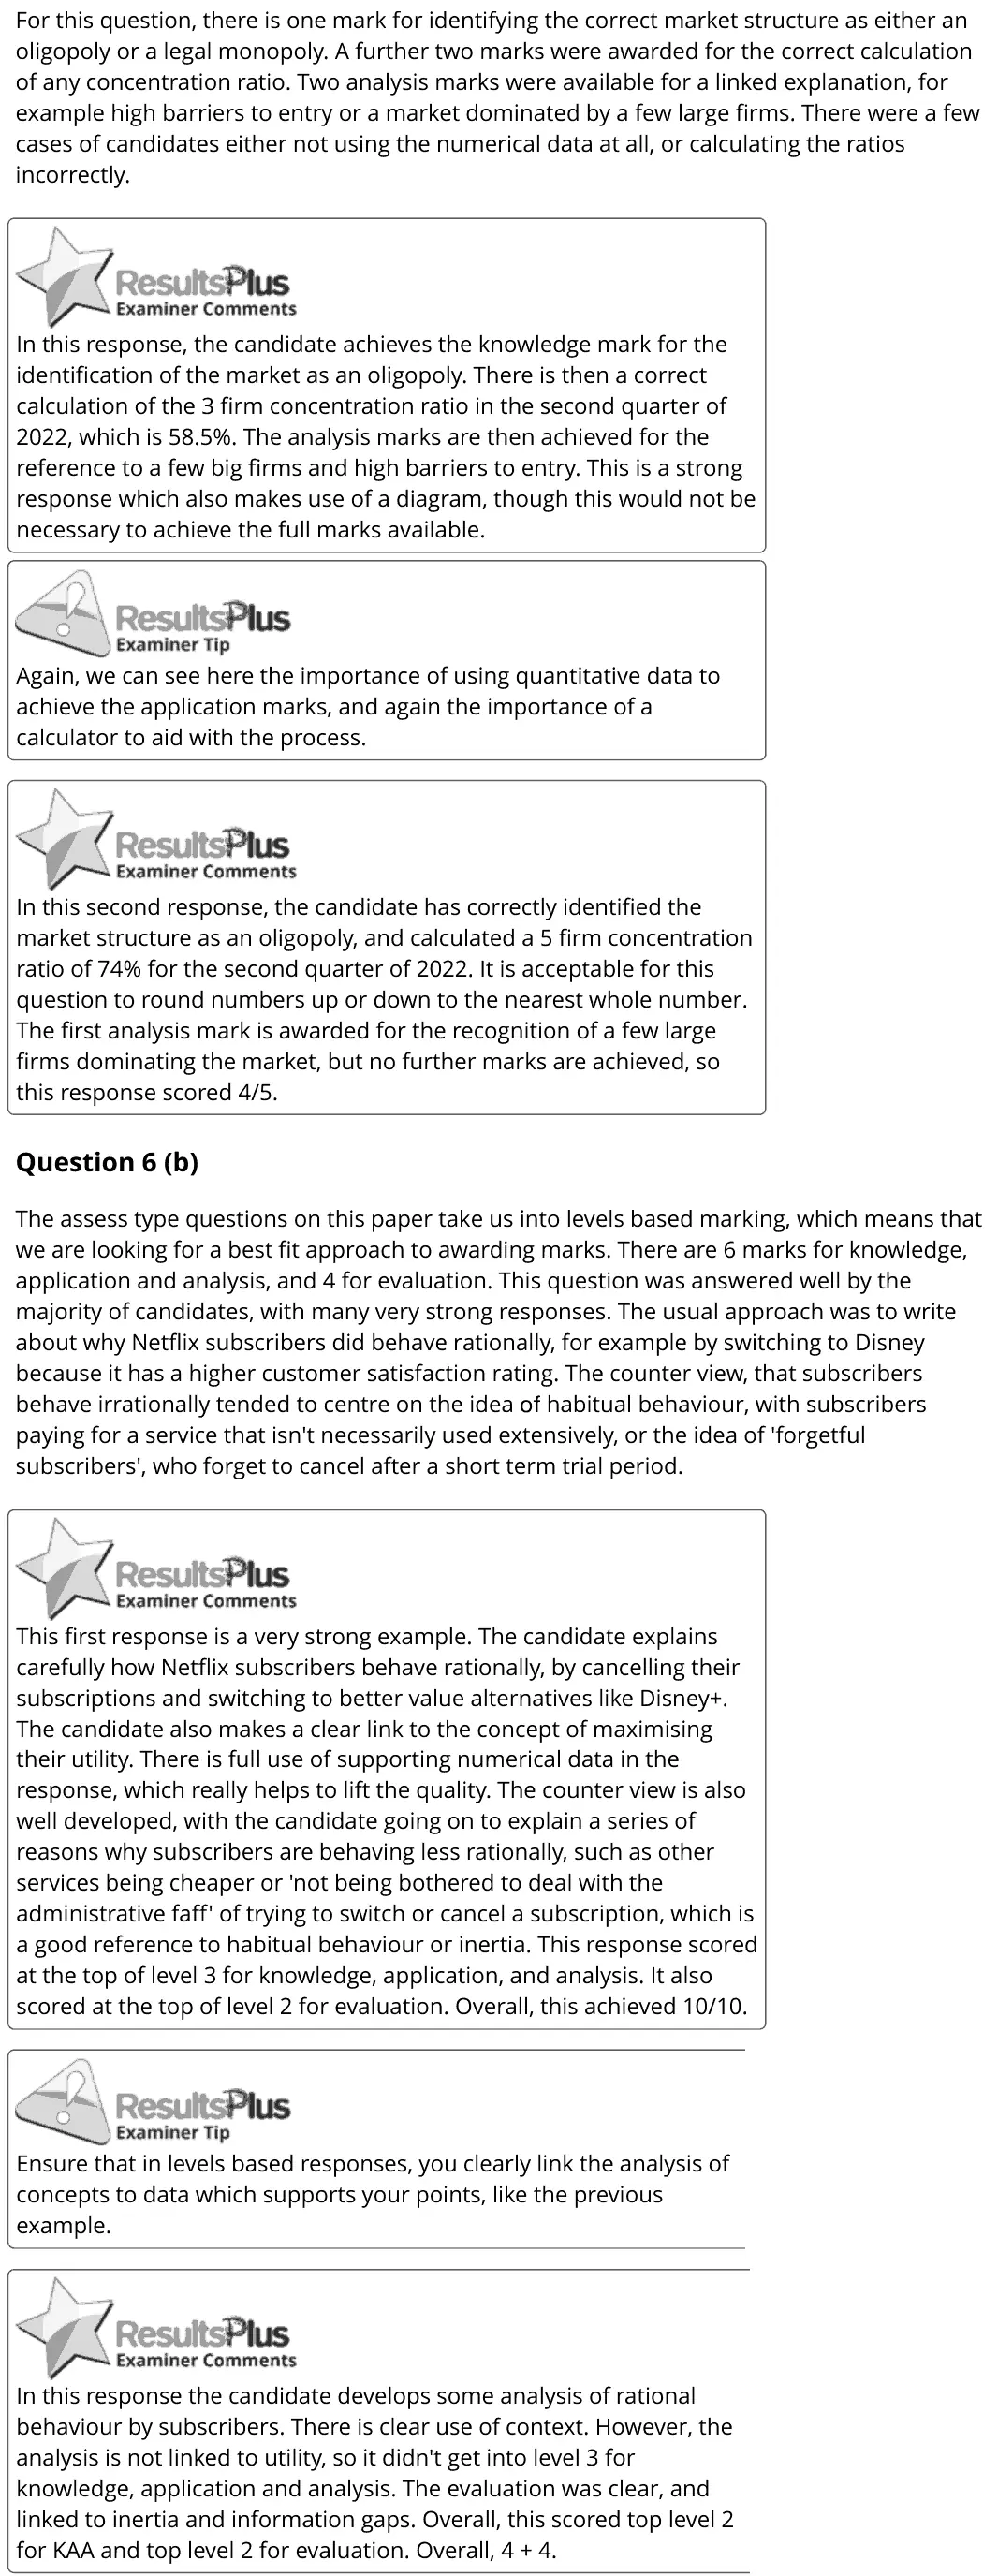
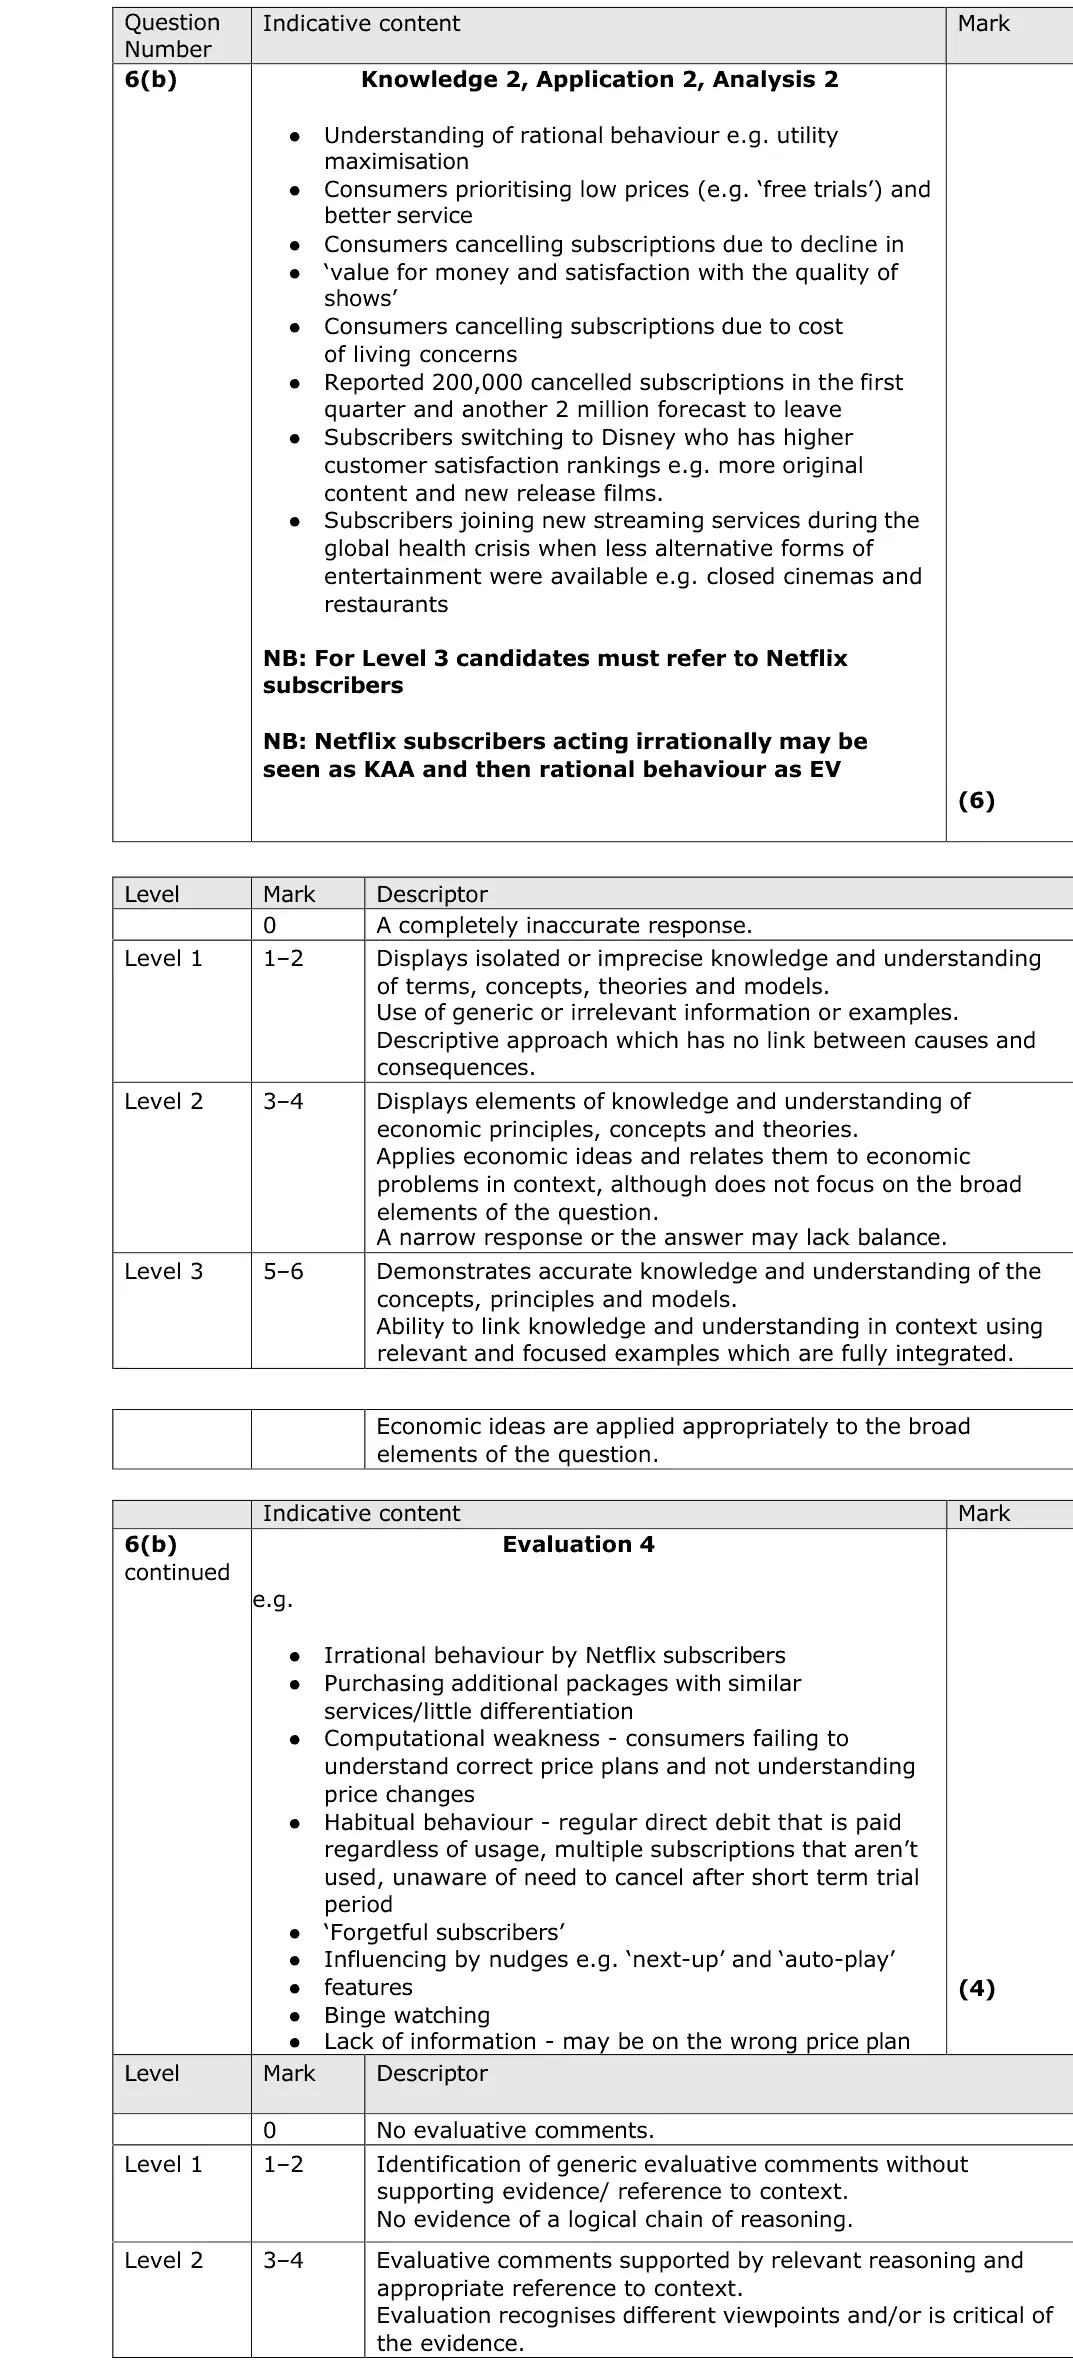
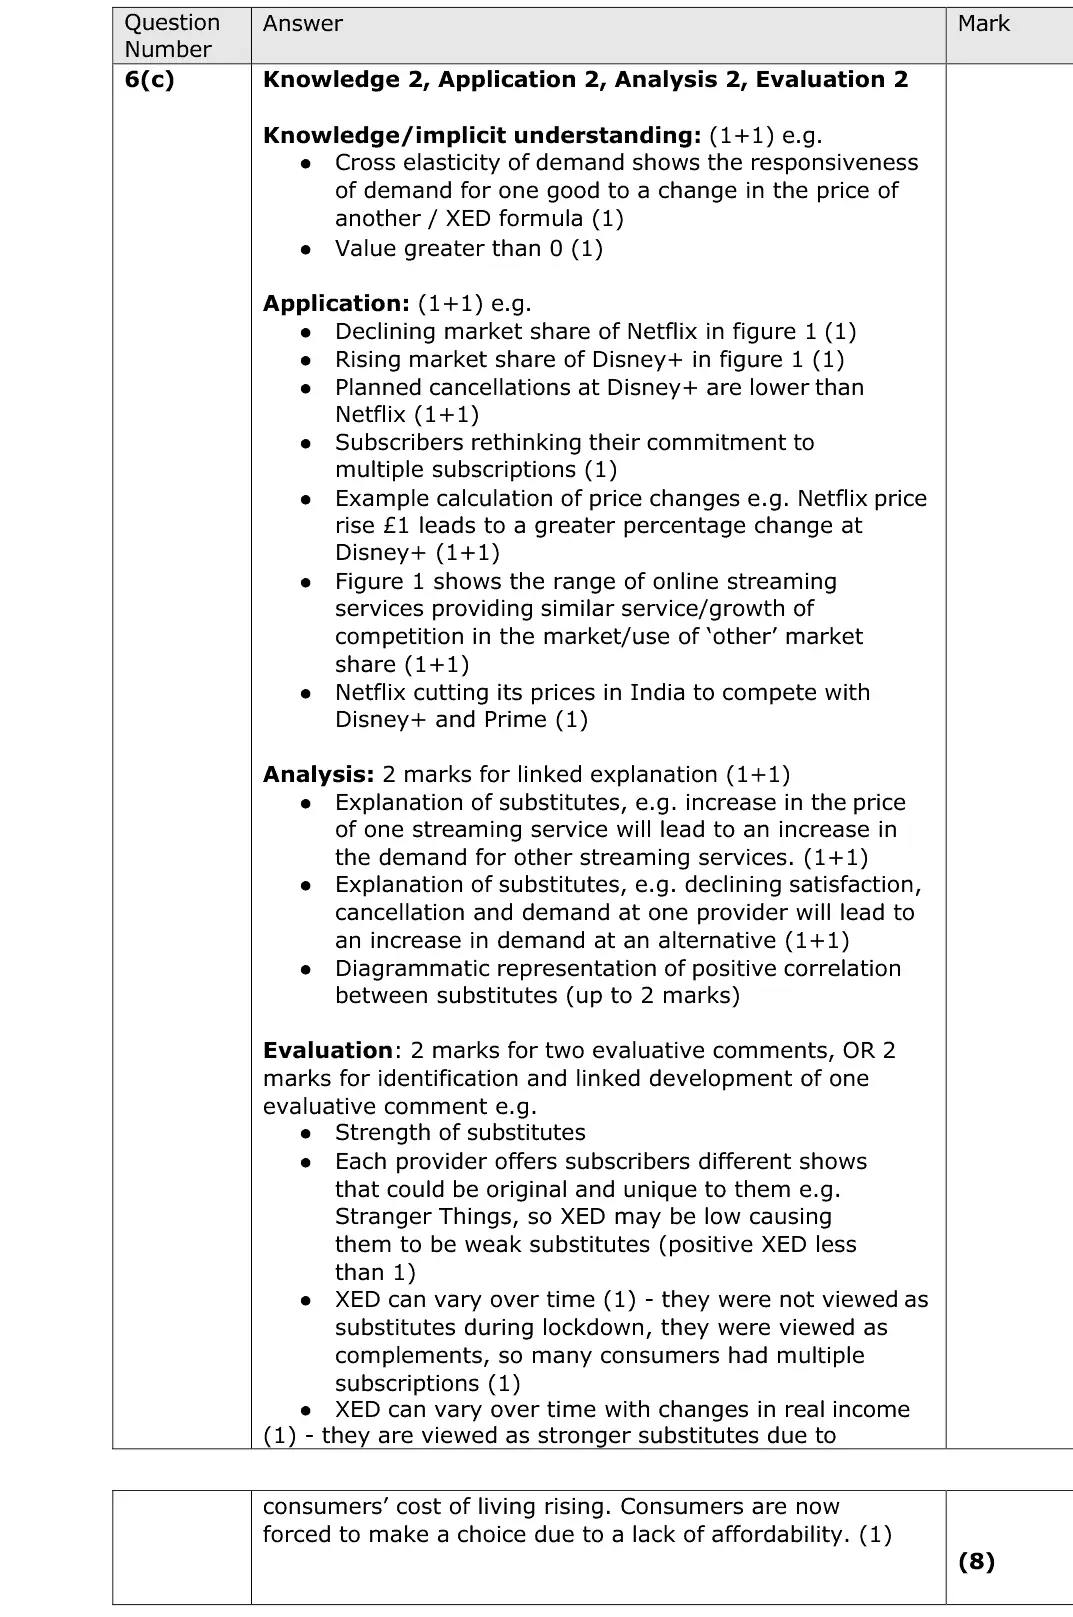
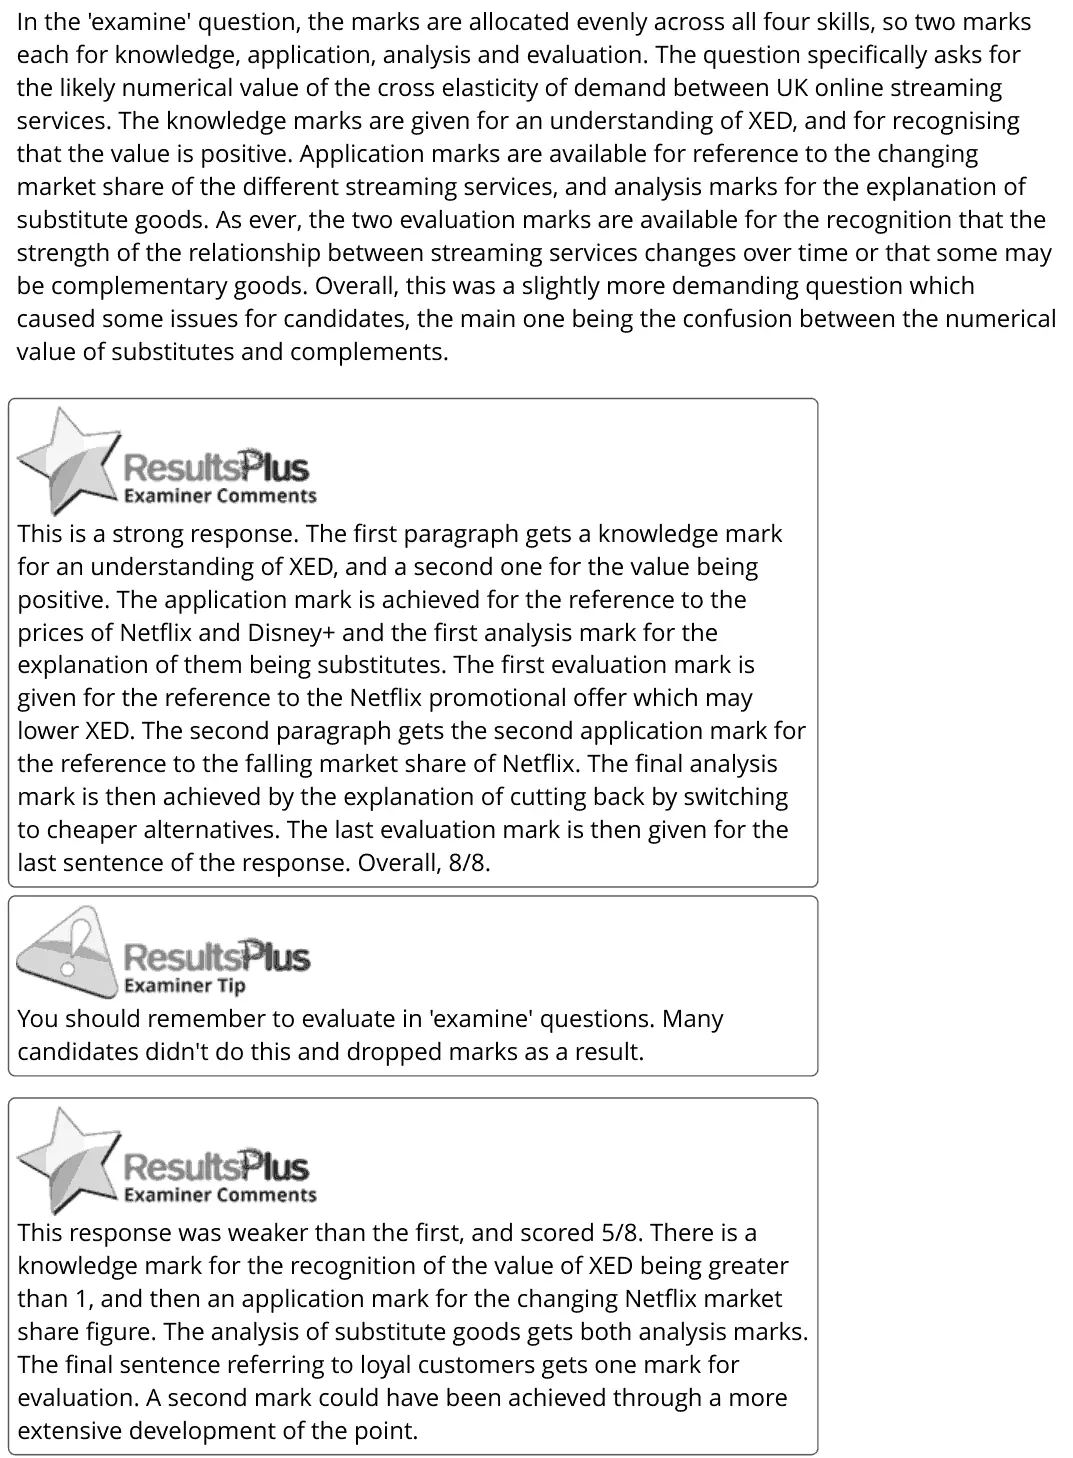
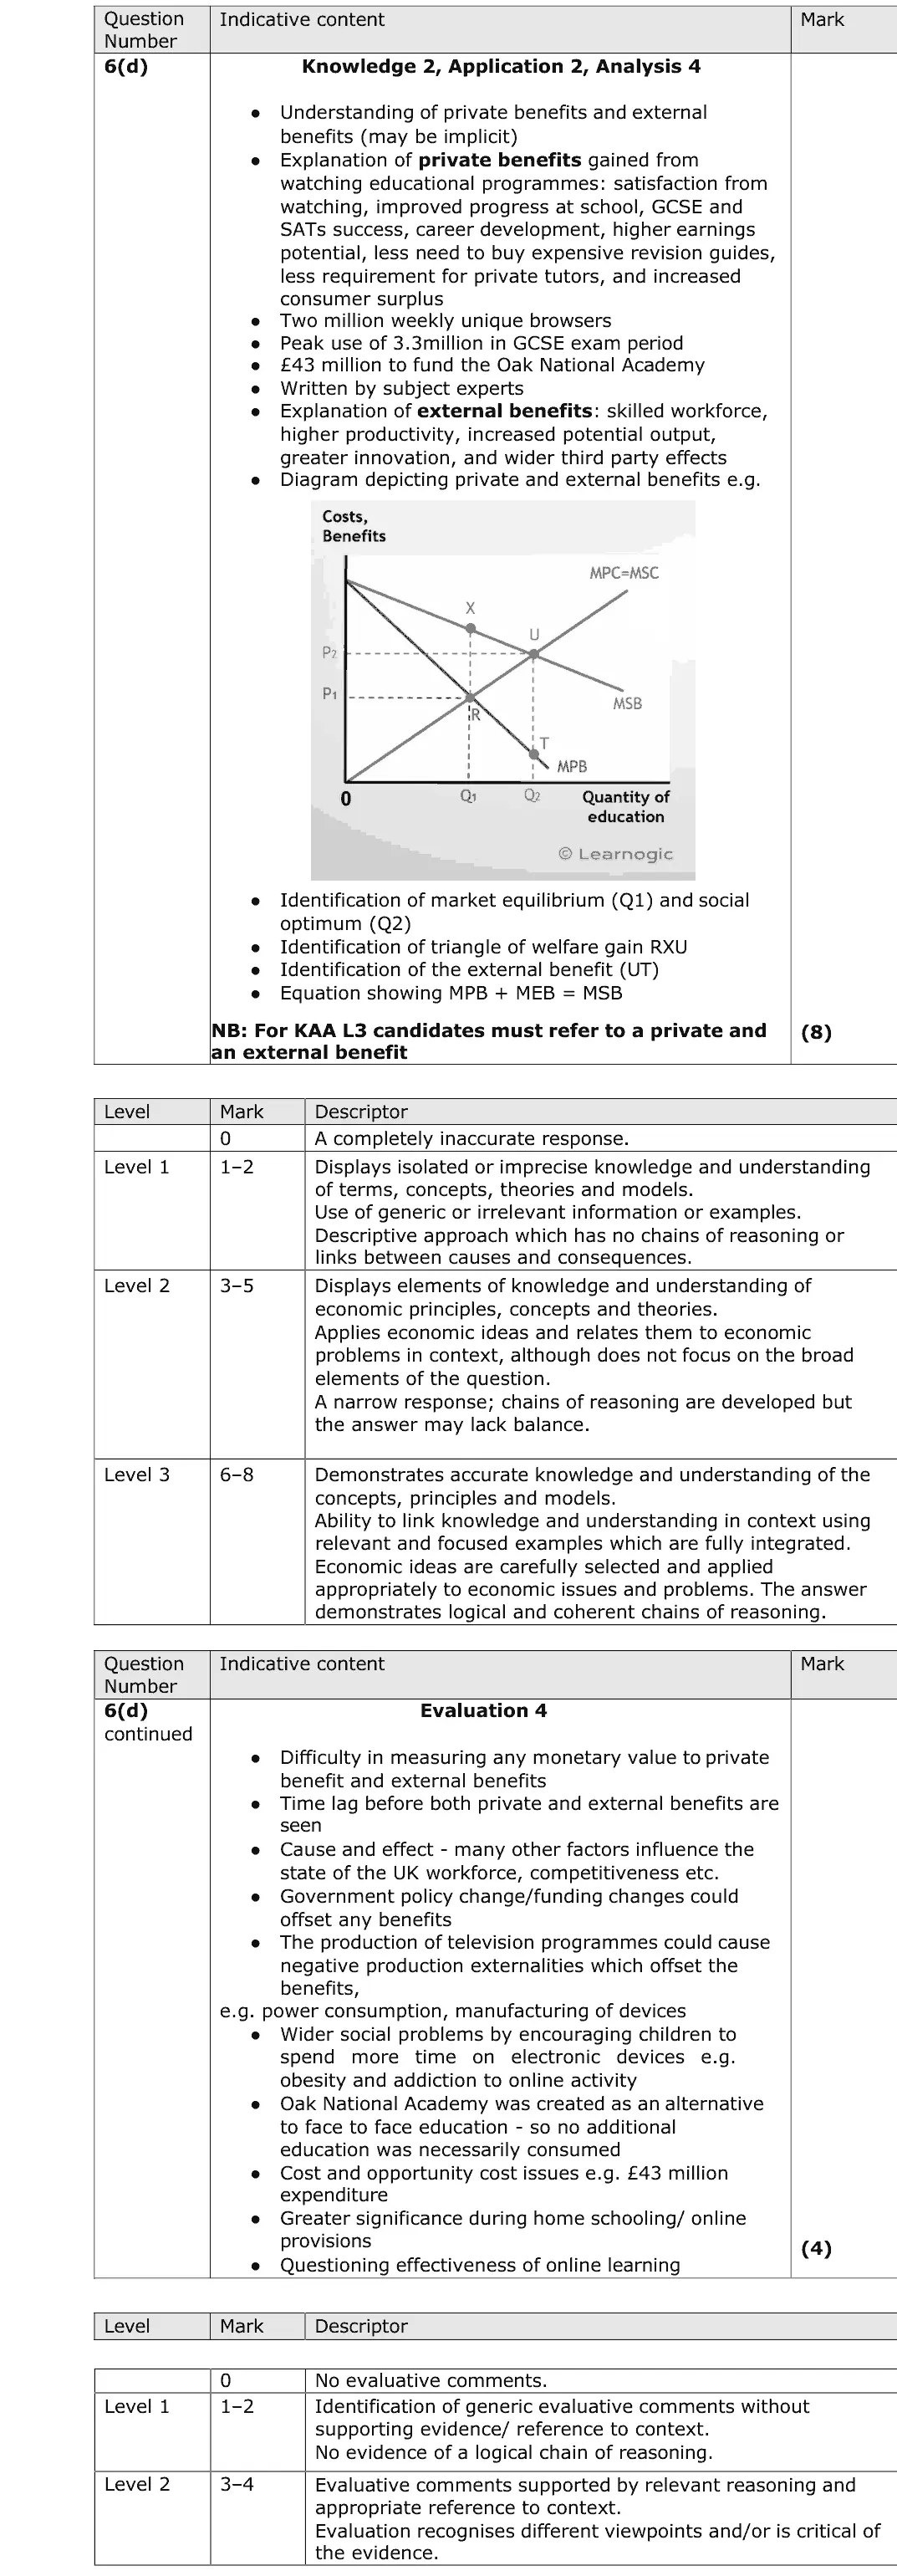
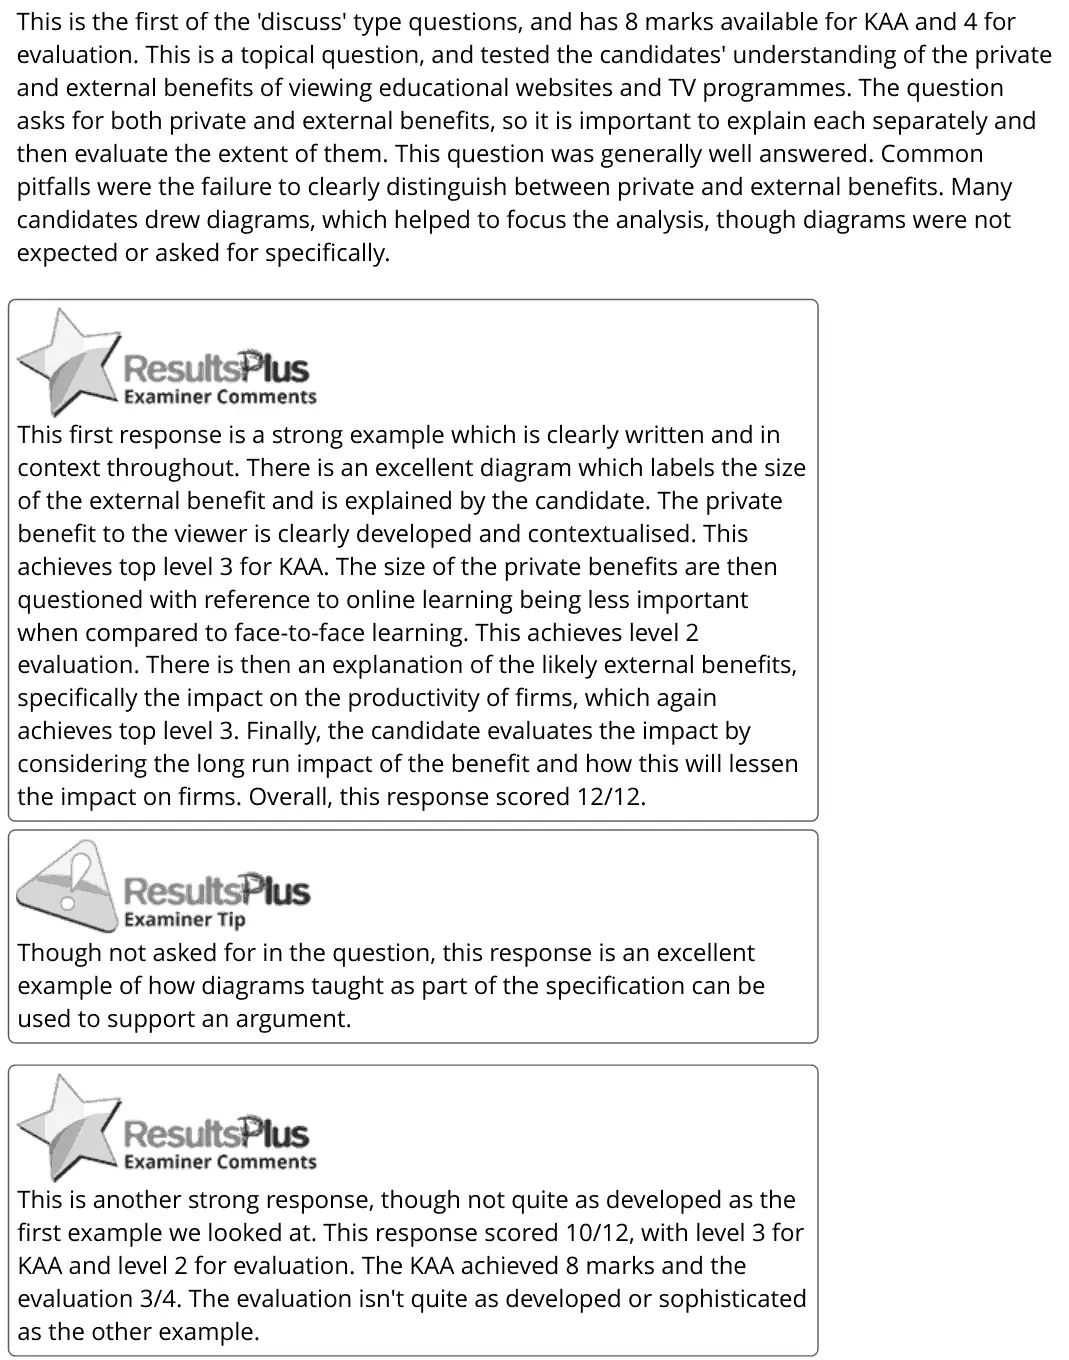
For this question, there is one mark for identifying the correct market structure as either an oligopoly or a legal monopoly. A further two marks were awarded for the correct calculation of any concentration ratio. Two analysis marks were available for a linked explanation, for example high barriers to entry or a market dominated by a few large firms. There were a few cases of candidates either not using the numerical data at all, or calculating the ratios incorrectly. In this response, the candidate achieves the knowledge mark for the identification of the market as an oligopoly. There is then a correct calculation of the 3 firm concentration ratio in the second quarter of 2022, which is 58.5%. The analysis marks are then achieved for the reference to a few big firms and high barriers to entry. This is a strong response which also makes use of a diagram, though this would not be necessary to achieve the full marks available. Again, we can see here the importance of using quantitative data to achieve the application marks, and again the importance of a calculator to aid with the process. In this second response, the candidate has correctly identified the market structure as an oligopoly, and calculated a 5 firm concentration ratio of 74% for the second quarter of 2022. It is acceptable for this question to round numbers up or down to the nearest whole number. The first analysis mark is awarded for the recognition of a few large firms dominating the market, but no further marks are achieved, so this response scored 4/5. Question (b) The assess type questions on this paper take us into levels based marking, which means that we are looking for a best fit approach to awarding marks. There are 6 marks for knowledge, application and analysis, and 4 for evaluation. This question was answered well by the majority of candidates, with many very strong responses. The usual approach was to write about why Netflix subscribers did behave rationally, for example by switching to Disney because it has a higher customer satisfaction rating. The counter view, that subscribers behave irrationally tended to centre on the idea of habitual behaviour, with subscribers paying for a service that isn't necessarily used extensively, or the idea of 'forgetful subscribers', who forget to cancel after a short term trial period. This first response is a very strong example. The candidate explains carefully how Netflix subscribers behave rationally, by cancelling their subscriptions and switching to better value alternatives like Disney+. The candidate also makes a clear link to the concept of maximising their utility. There is full use of supporting numerical data in the response, which really helps to lift the quality. The counter view is also well developed, with the candidate going on to explain a series of reasons why subscribers are behaving less rationally, such as other services being cheaper or 'not being bothered to deal with the administrative faff' of trying to switch or cancel a subscription, which is a good reference to habitual behaviour or inertia. This response scored at the top of level 3 for knowledge, application, and analysis. It also scored at the top of level 2 for evaluation. Overall, this achieved 10/10. Ensure that in levels based responses, you clearly link the analysis of concepts to data which supports your points, like the previous example. In this response the candidate develops some analysis of rational behaviour by subscribers. There is clear use of context. However, the analysis is not linked to utility, so it didn't get into level 3 for knowledge, application and analysis. The evaluation was clear, and linked to inertia and information gaps. Overall, this scored top level 2 for KAA and top level 2 for evaluation. Overall, 4 + 4.
![Examiner's report extract for June 2023 Paper 1 question 6(a)]()
Notes from the mark scheme and report
- oligopoly (or legal monopoly for Amazon over 25%): calculate a concentration ratio (e.g. 3-firm Q2 2022 = 58.5%) for 2 marks
- explain few large firms and barriers to entry
- report: a few did not use the data or miscalculated
Quantitative skills: QS 2 (calculate, use and understand percentages, percentage changes and percentage point changes); QS 9 (interpret, apply and analyse information in written, graphical tabular and numerical forms)