November 2021: Paper 2

100 marks · 20 question parts · Paper, mark scheme and report on Pearson's site

Question by question

QTopicMarksAOType
1(a) The circular flow, national income and the multiplier 1Multiple choice
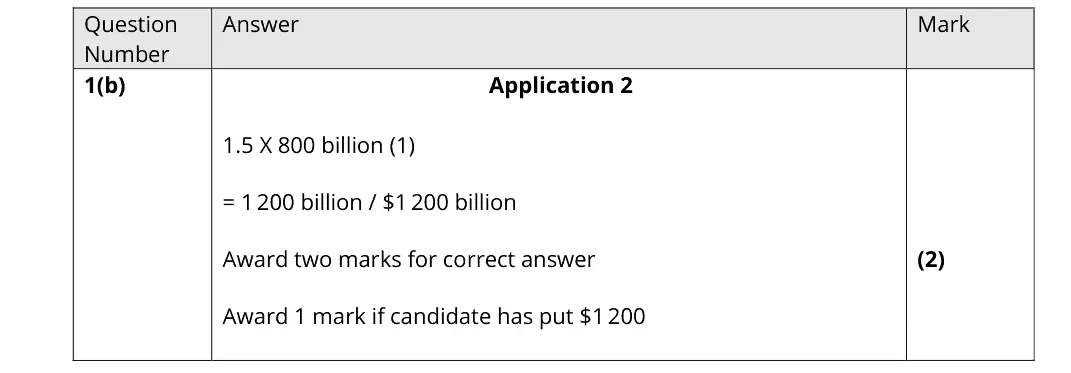
1(b) The circular flow, national income and the multiplier 2AO2=2Calculation
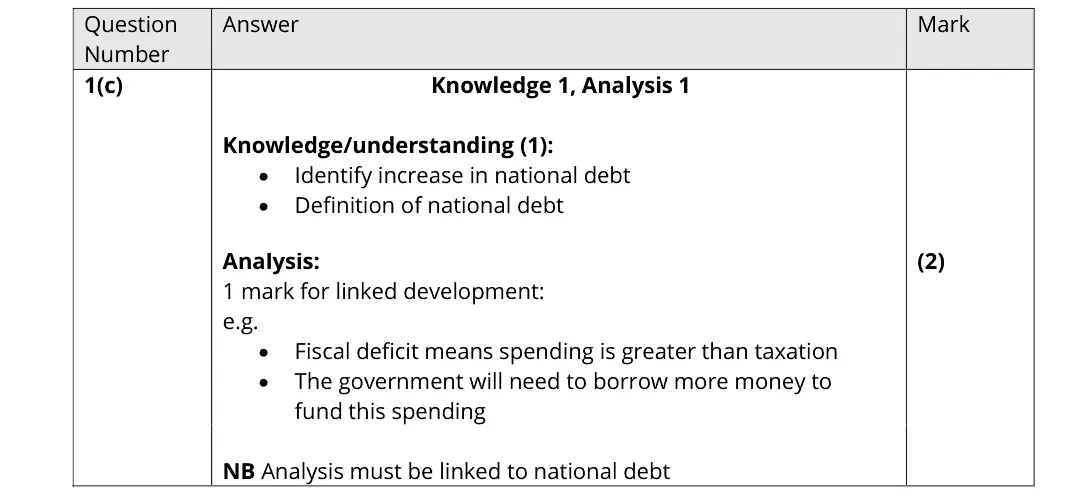
1(c) Public expenditure, taxation and public sector finances 2AO1=1,AO3=1Short answer
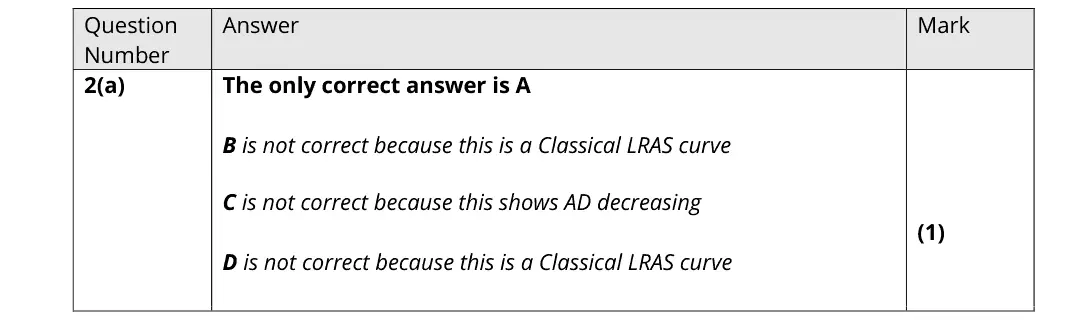
2(a) Aggregate supply, The circular flow, national income and the multiplier 1Multiple choice
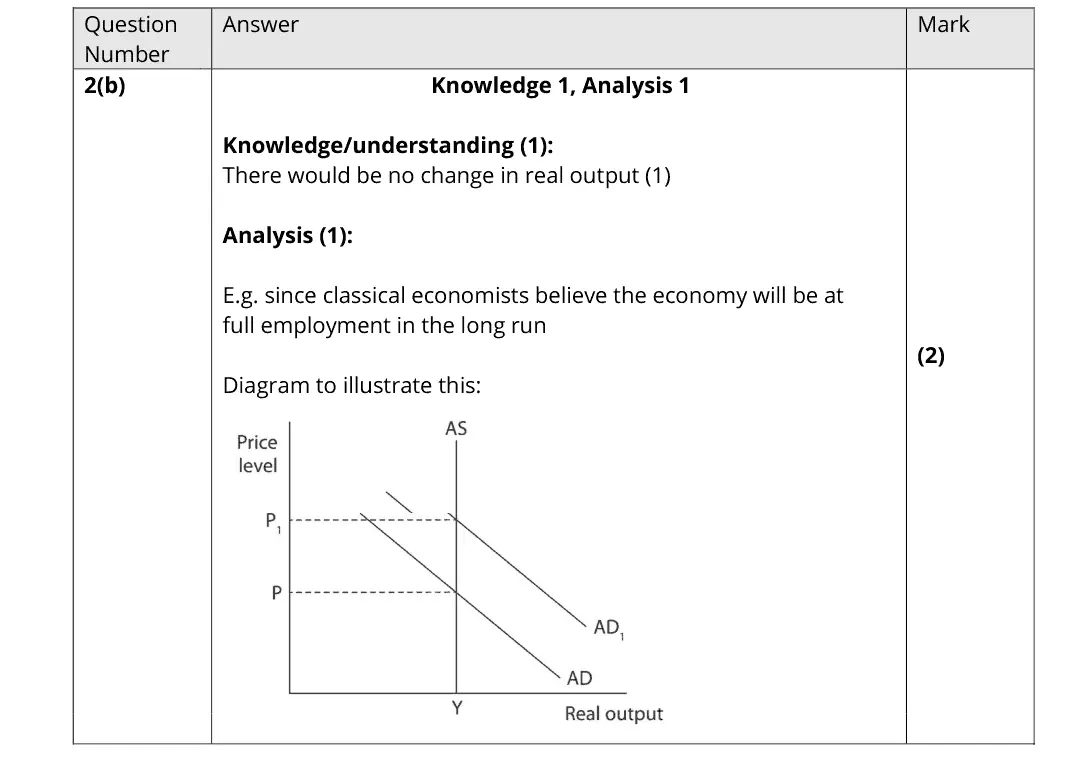
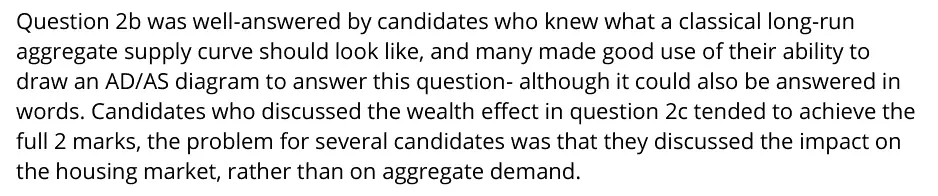
2(b) Aggregate supply 2AO1=1,AO3=1Short answer
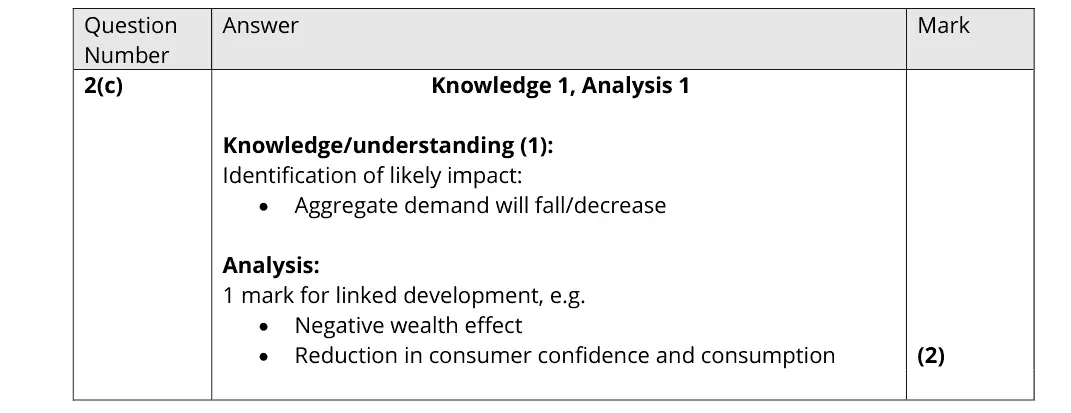
2(c) Aggregate demand 2AO1=1,AO3=1Short answer
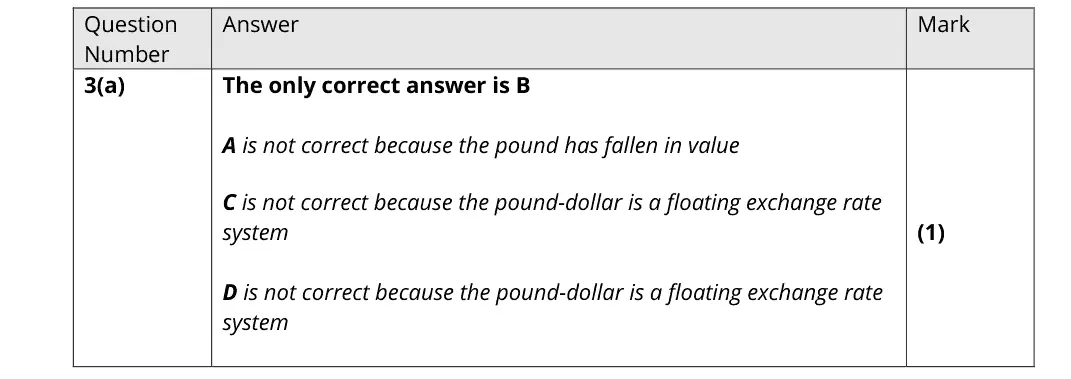
3(a) Exchange rates 1Multiple choice
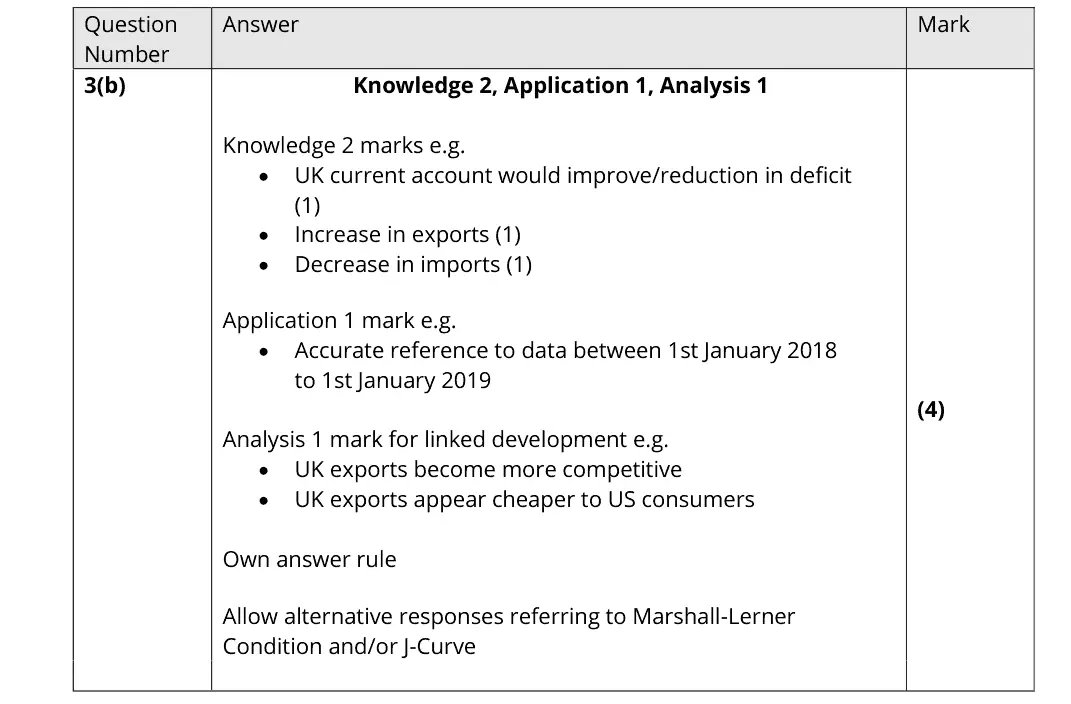
3(b) Exchange rates, The balance of payments 4AO1=2,AO2=1,AO3=1Short answer
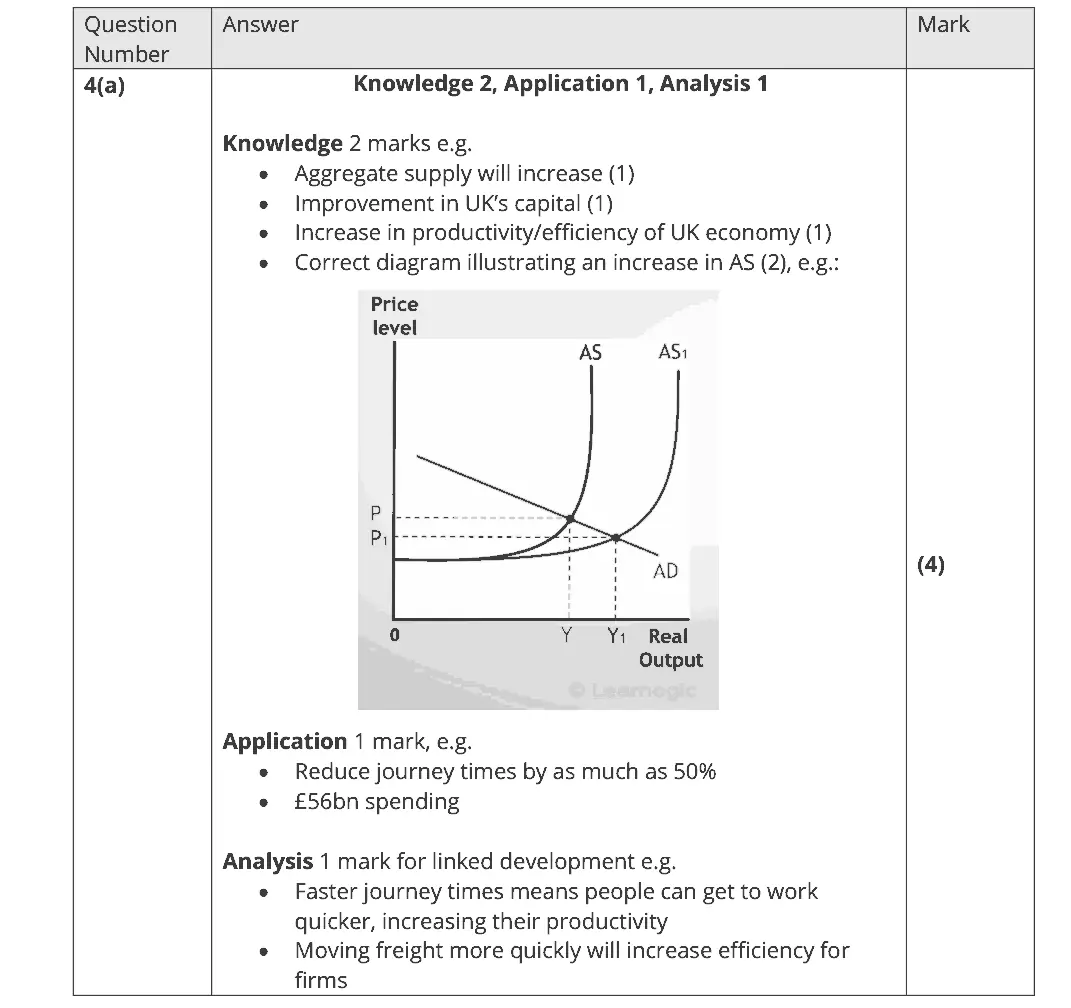
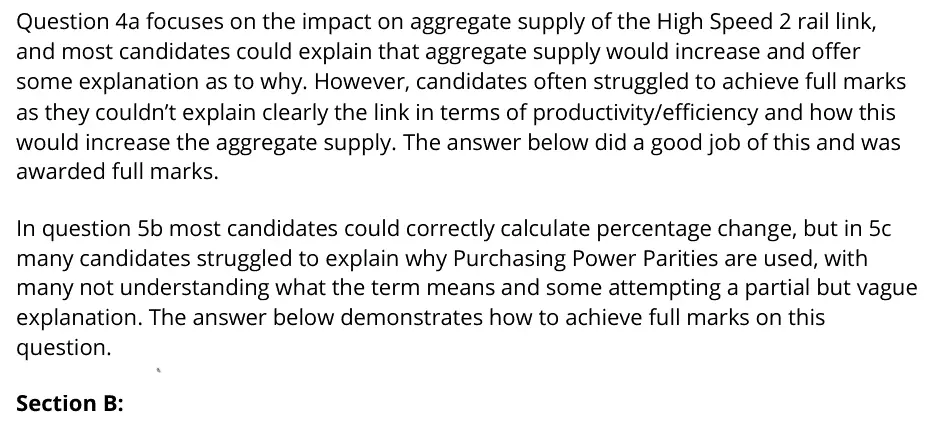
4(a) Aggregate supply 4AO1=2,AO2=1,AO3=1Short answer
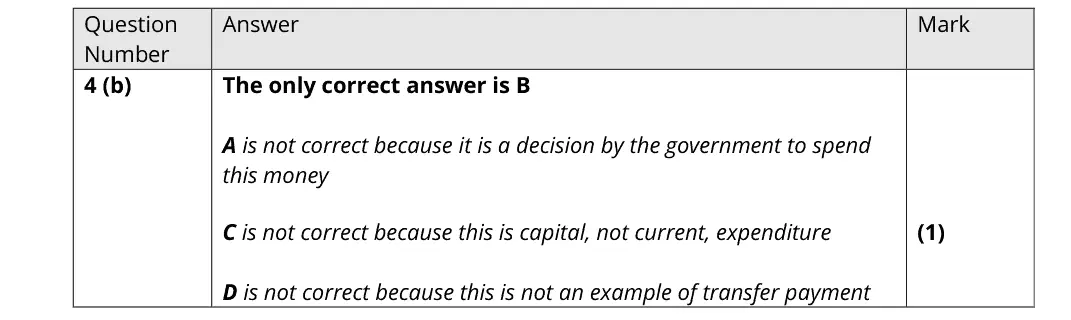
4(b) Public expenditure, taxation and public sector finances 1Multiple choice
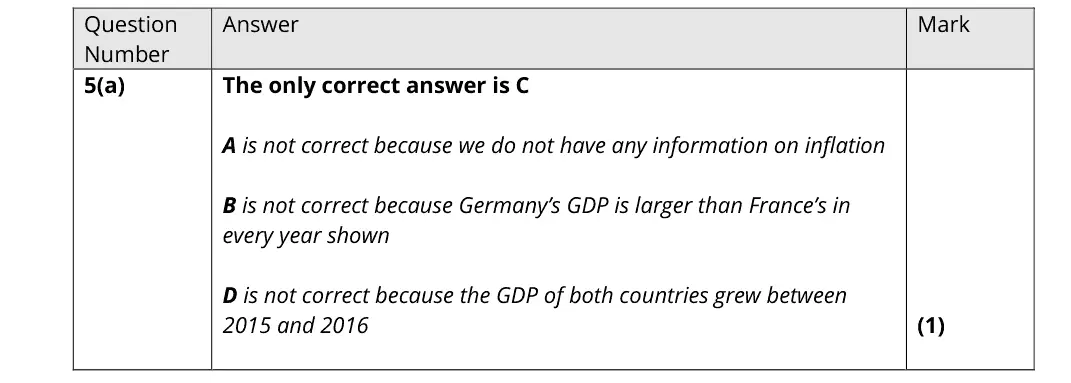
5(a) Measuring economic growth: GDP, GNI and living standards 1Multiple choice
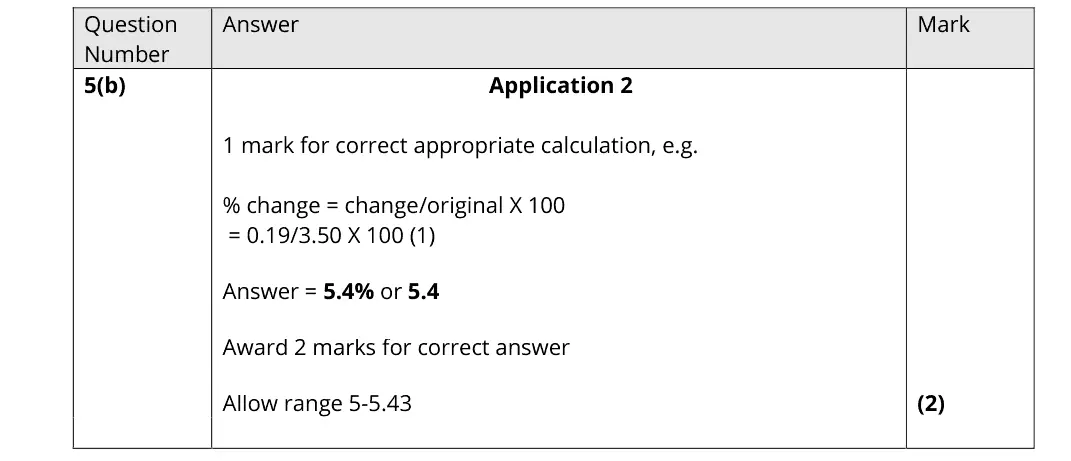
5(b) Measuring economic growth: GDP, GNI and living standards 2AO2=2Calculation
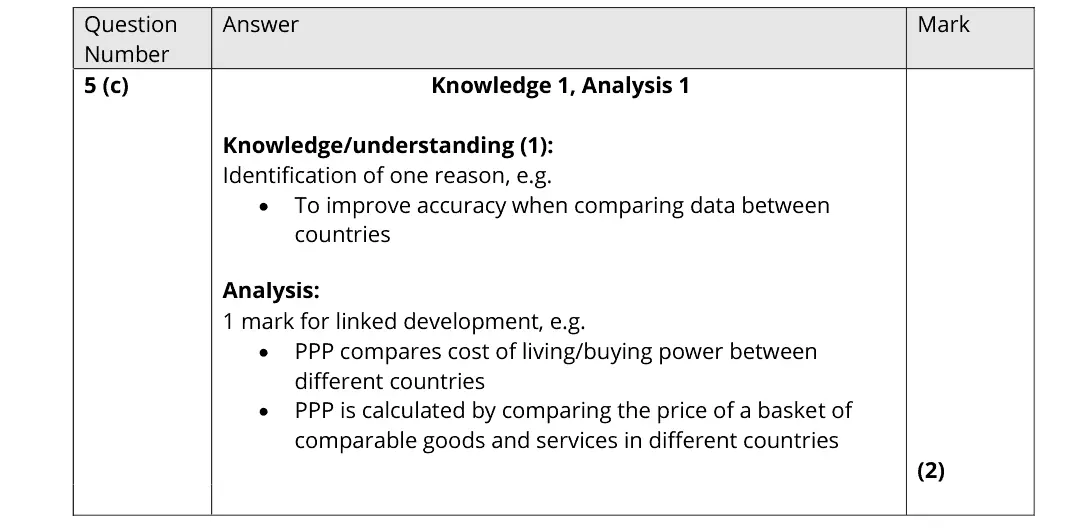
5(c) Measuring economic growth: GDP, GNI and living standards 2AO1=1,AO3=1Short answer
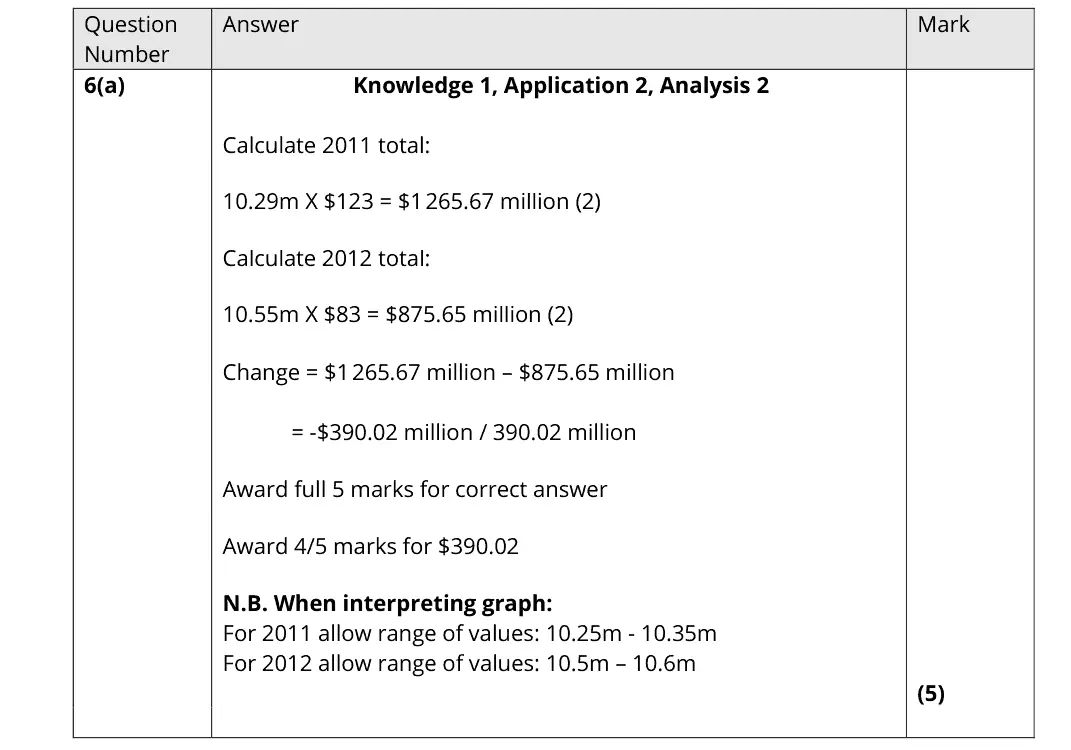
6(a) Emerging and developing economies 5AO1=1,AO2=2,AO3=2Calculation
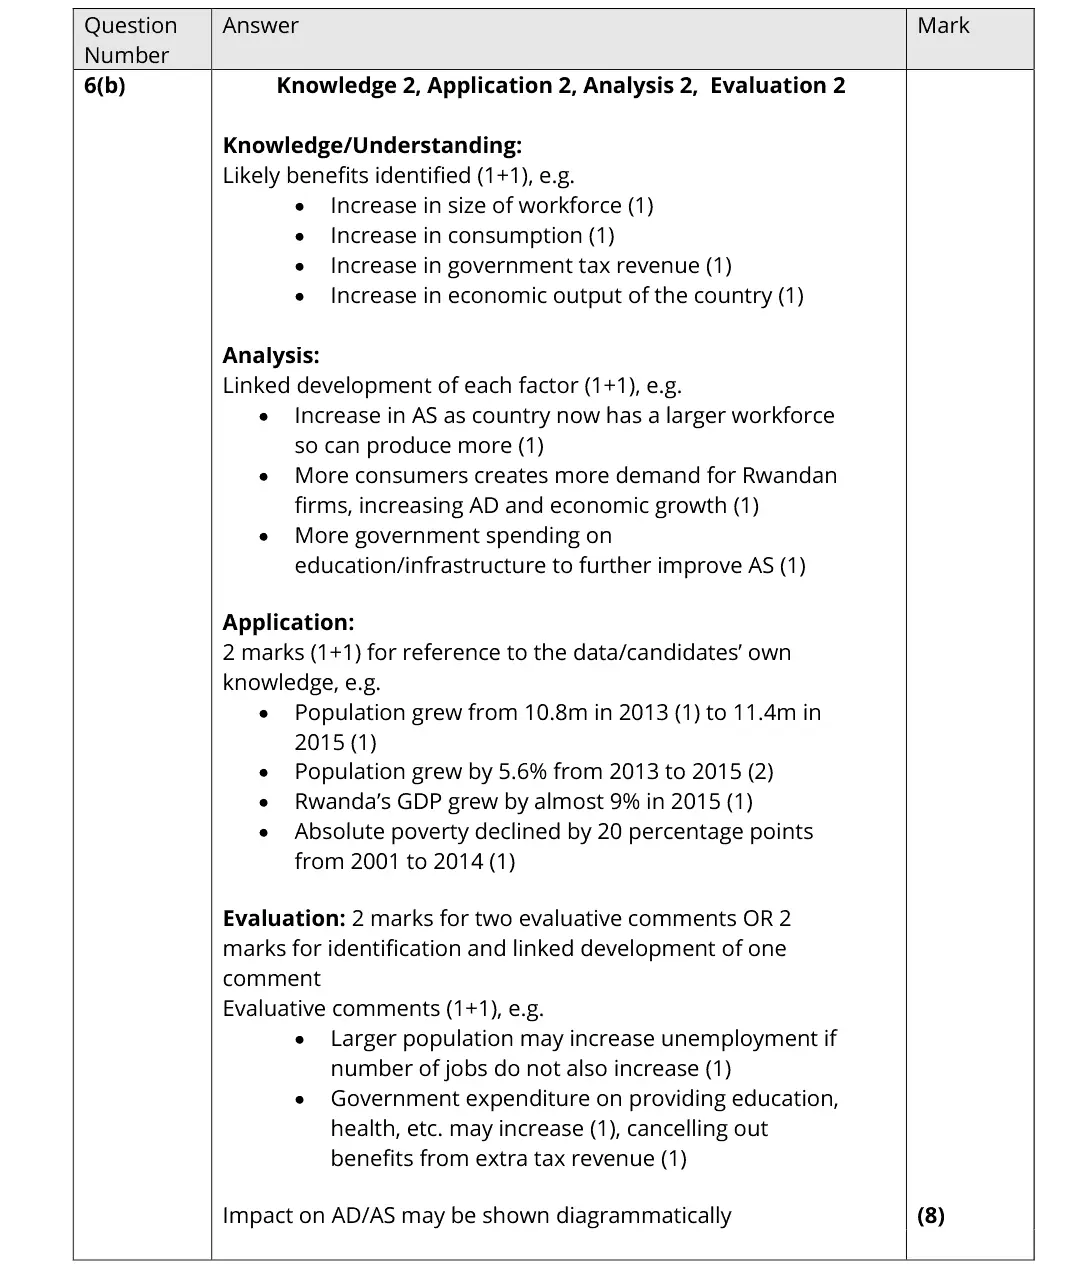
6(b) Emerging and developing economies 8AO1=2,AO2=2,AO3=2,AO4=2Extended response
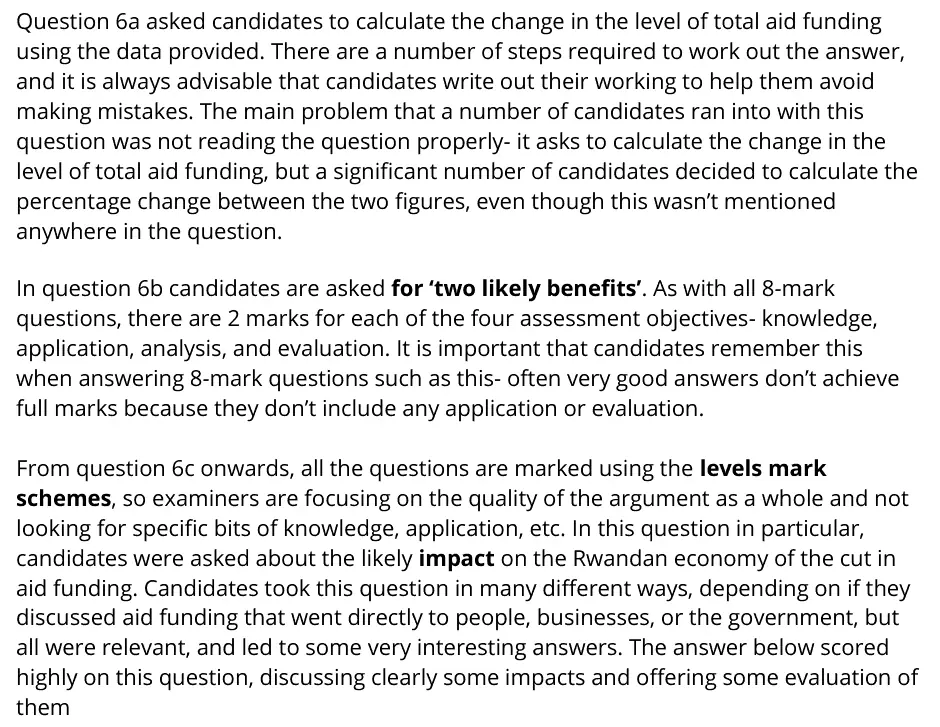
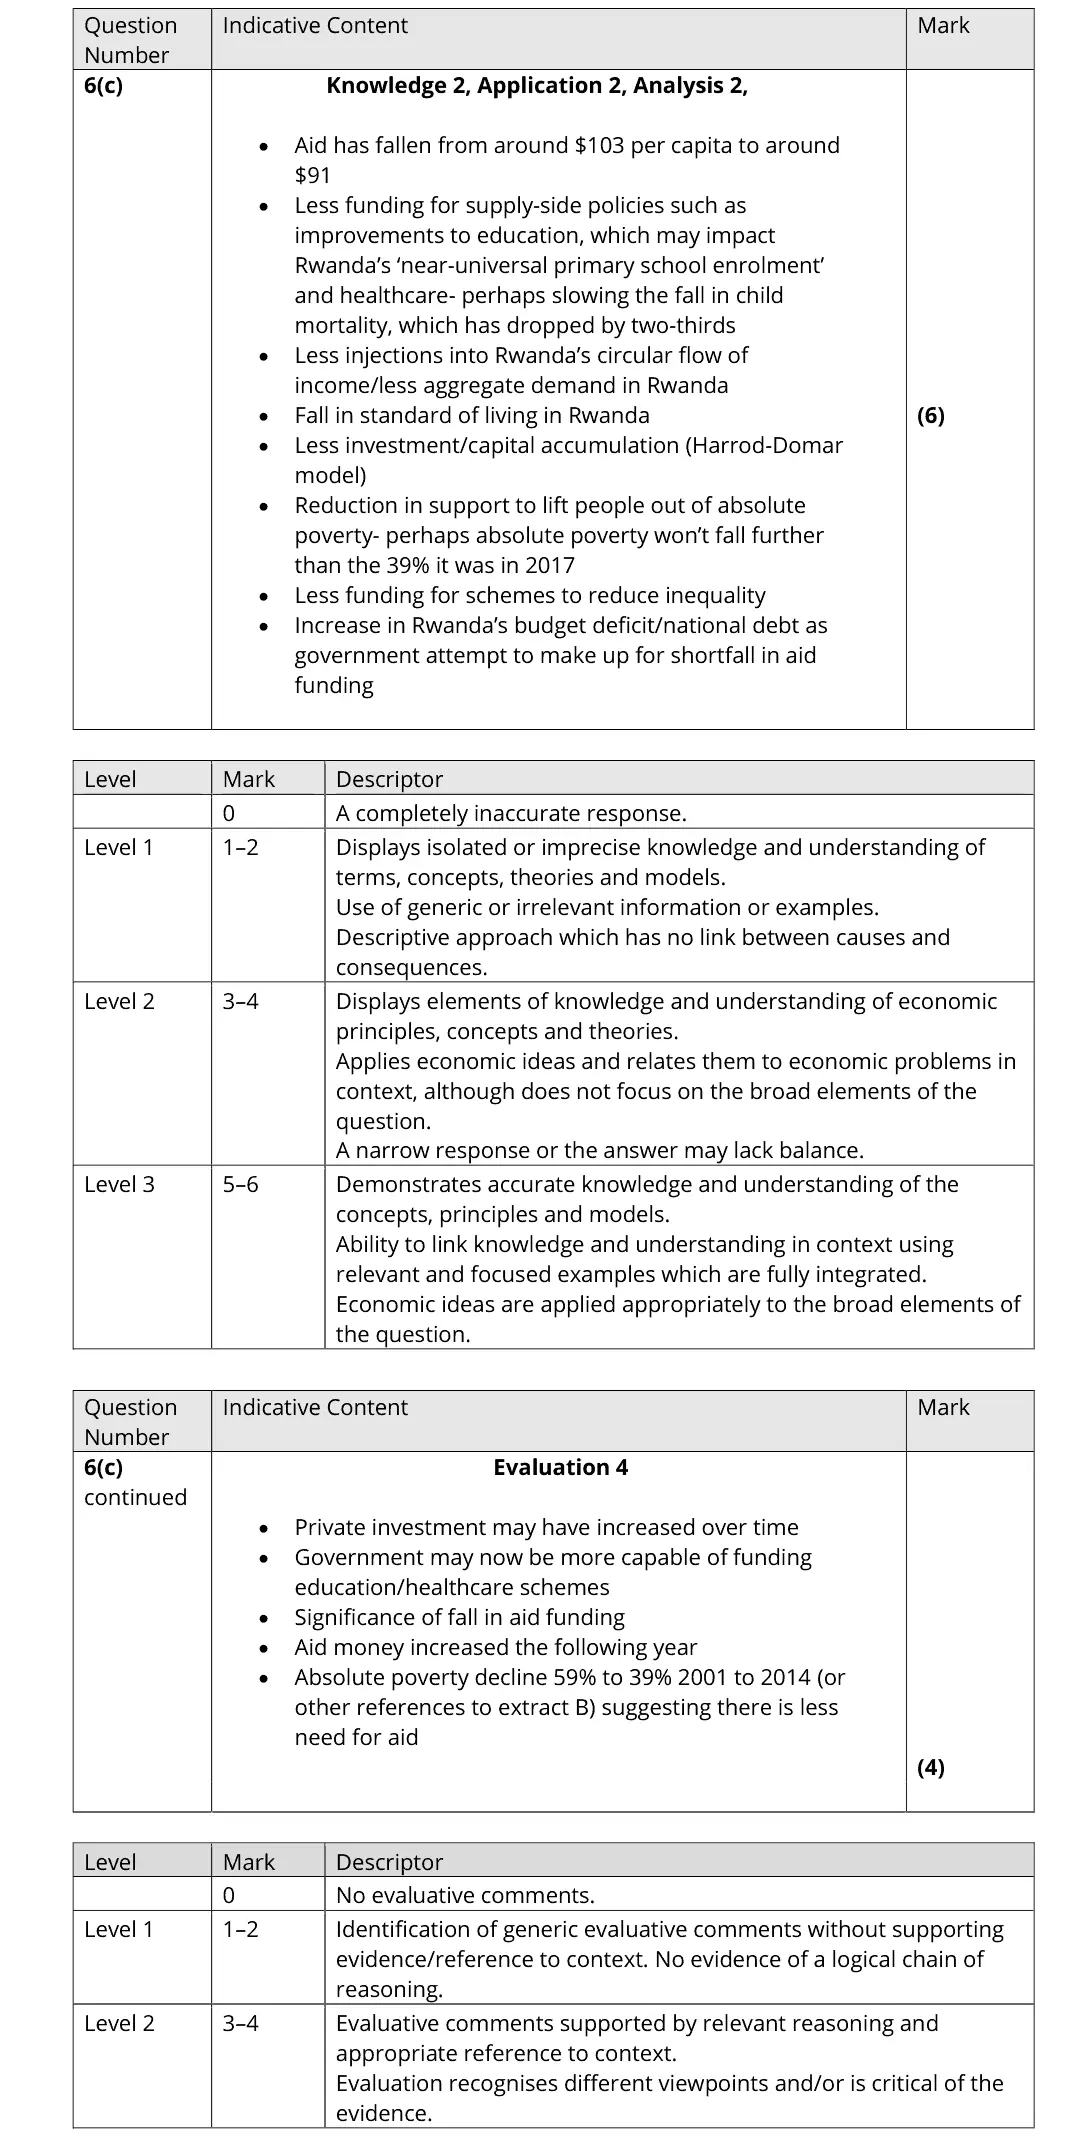
6(c) Emerging and developing economies 10AO1=2,AO2=2,AO3=2,AO4=4Extended response
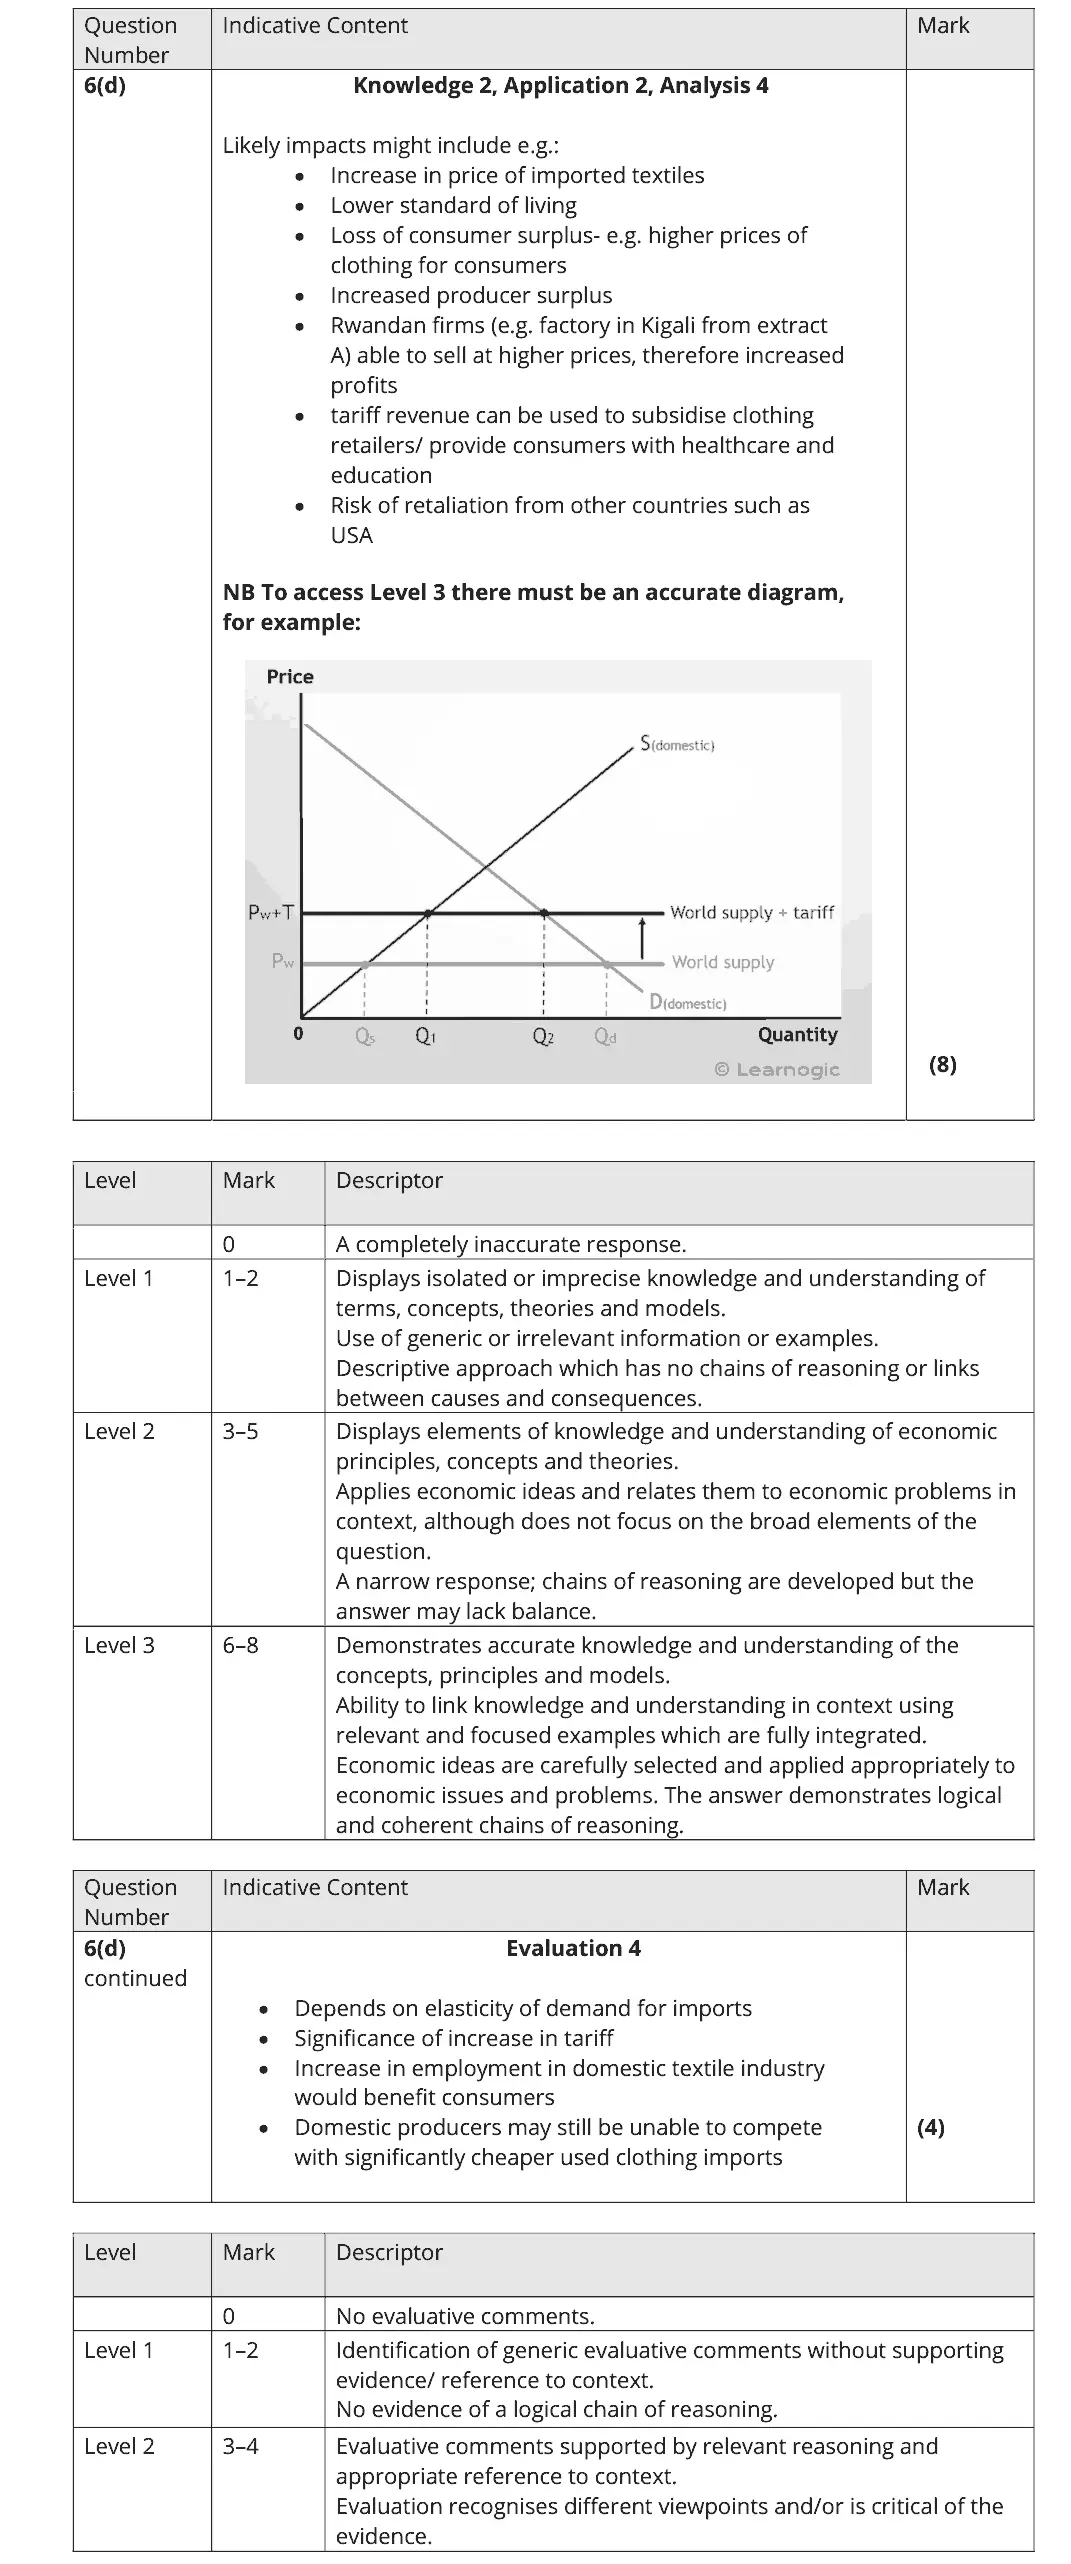
6(d) Trading blocs, the WTO and protectionism 12AO1=2,AO2=2,AO3=4,AO4=4Extended response
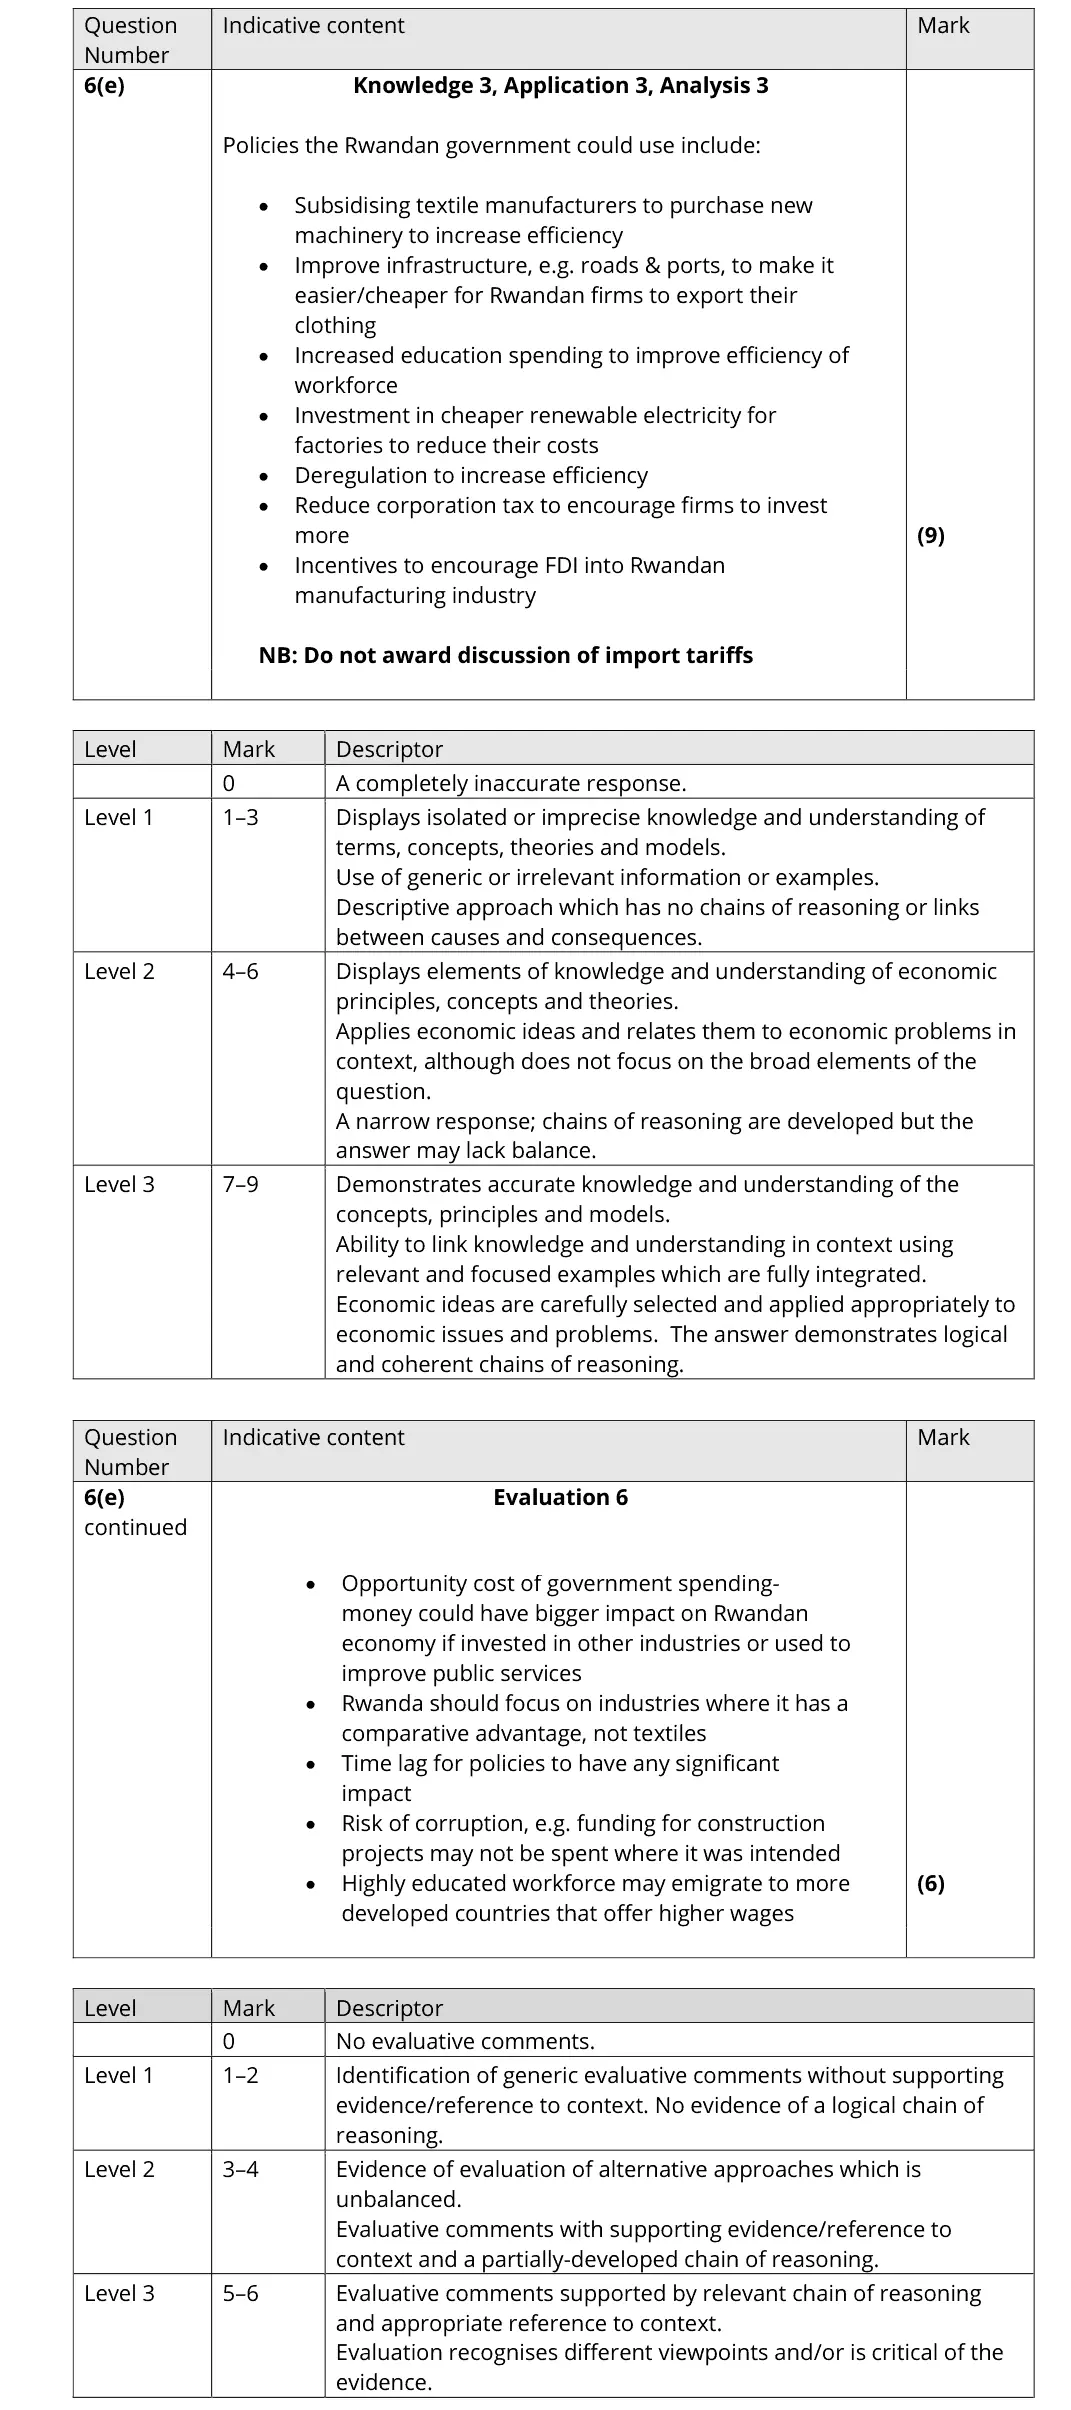
6(e) Emerging and developing economies 15AO1=3,AO2=3,AO3=3,AO4=6Extended response
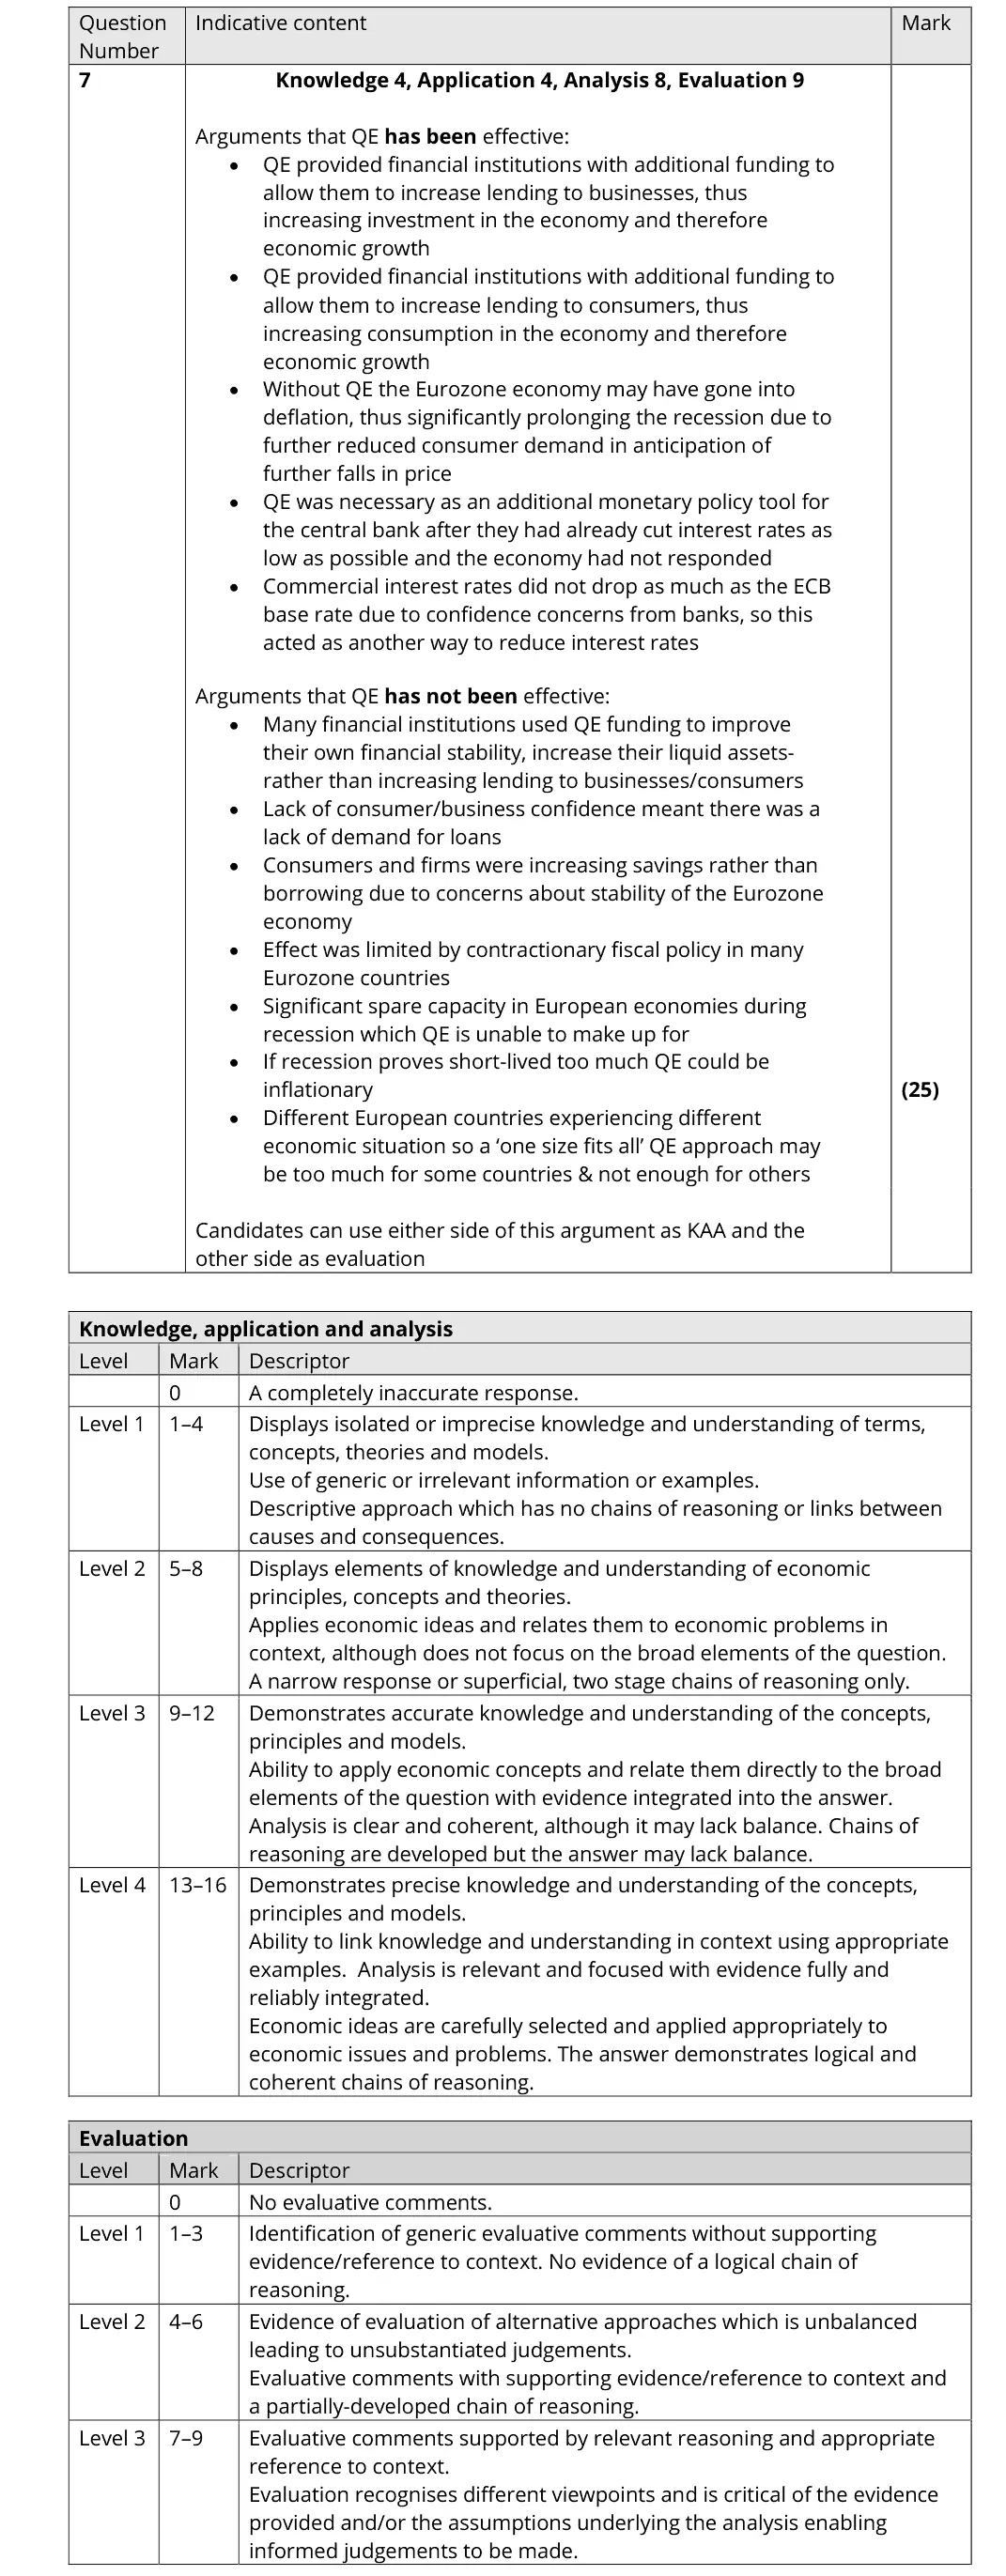
7 Demand-side policies: fiscal and monetary policy, Macroeconomic policies in a global context 25AO1=4,AO2=4,AO3=8,AO4=9Essay
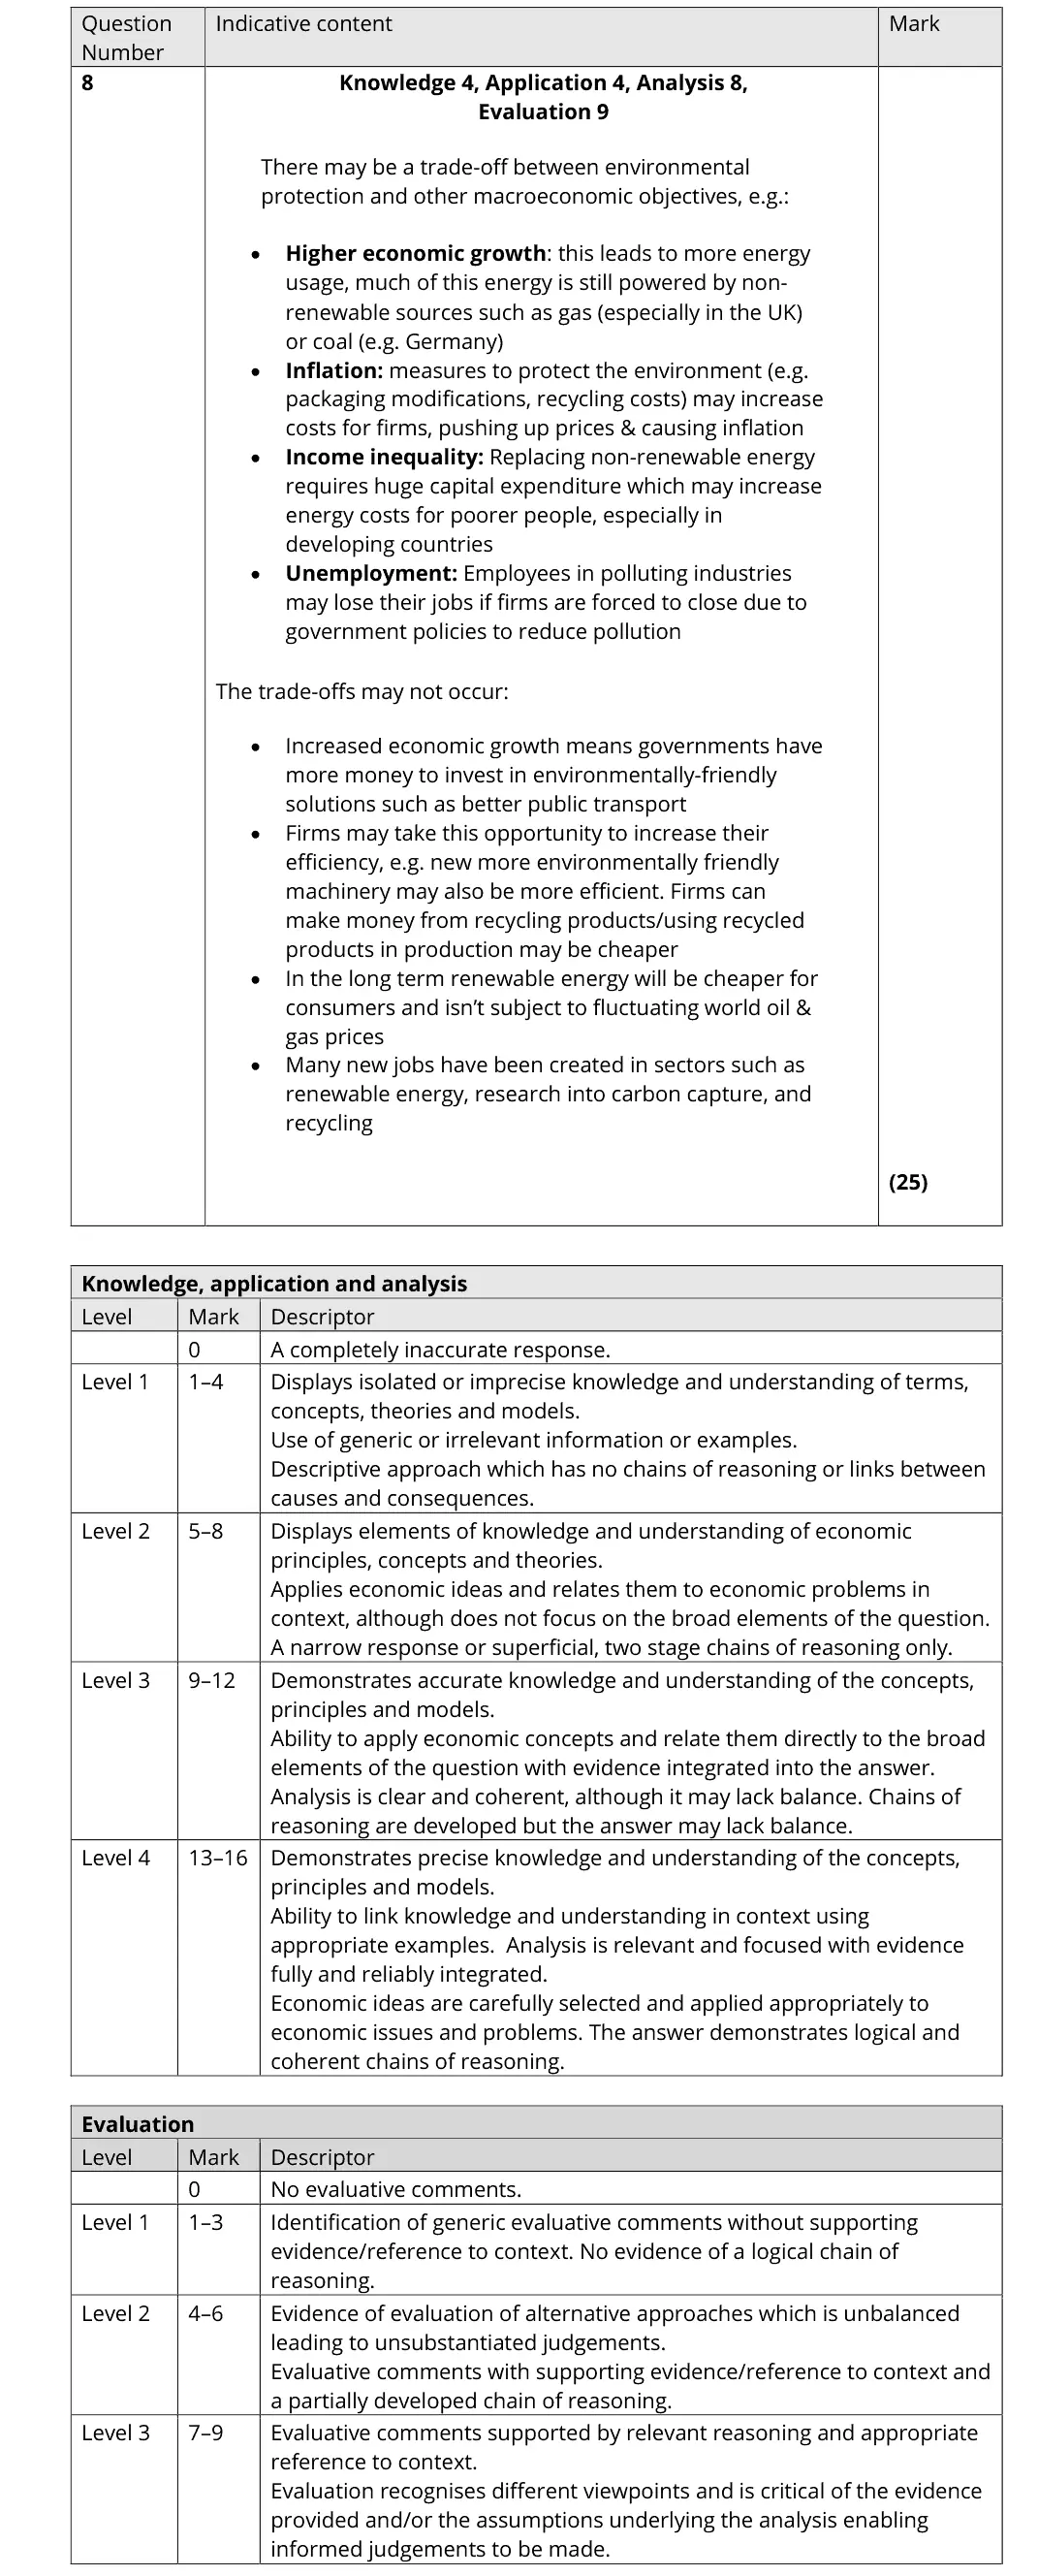
8 Macroeconomic objectives, conflicts and trade-offs 25AO1=4,AO2=4,AO3=8,AO4=9Essay

The questions

1(a)1(b)1(c)2(a)2(b)2(c)3(a)3(b)4(a)4(b)5(a)5(b)5(c)6(a)6(b)6(c)6(d)6(e)78
November 2021 · Paper 2 · Q1(a) 1 mark Multiple choice national income and the multiplier
Data and extracts for question 11 After the Global Financial Crisis of 2008, the US President introduced expansionary fiscal policies of $800 billion. The International Monetary Fund estimated that the multiplier at the time was approximately 1.5. (Source adapted from: https://www.economist.com/the-economist-explains/2016/09/07/ what-is-the-keynesian-multiplier)
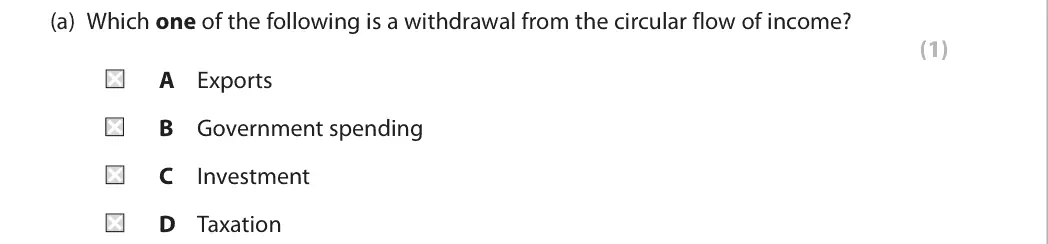
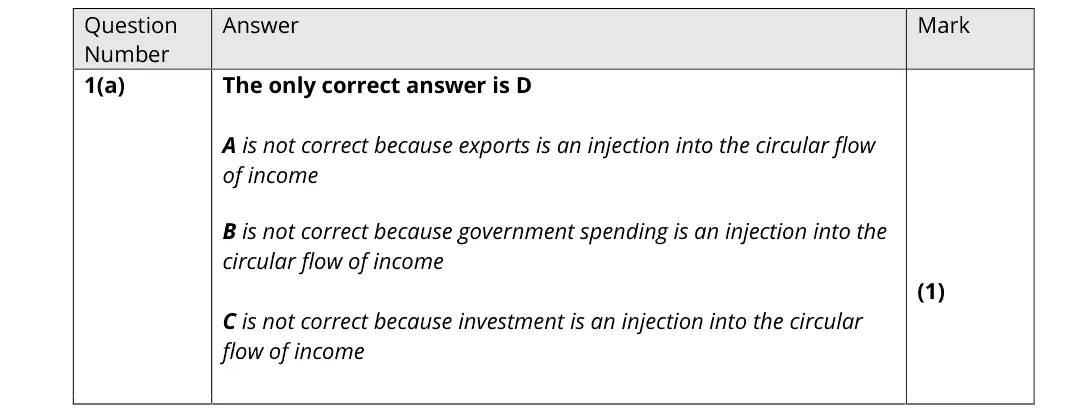
(a) Which one of the following is a withdrawal from the circular flow of income? (1) A Exports B Government spending C Investment D Taxation
November 2021 · Paper 2 · Q1(b) 2 marks AO2=2 Calculation national income and the multiplier
Data and extracts for question 11 After the Global Financial Crisis of 2008, the US President introduced expansionary fiscal policies of $800 billion. The International Monetary Fund estimated that the multiplier at the time was approximately 1.5. (Source adapted from: https://www.economist.com/the-economist-explains/2016/09/07/ what-is-the-keynesian-multiplier)
(b) Calculate the total final increase in US aggregate demand as a result of the President’s ‘expansionary fiscal policies’, assuming no other changes. (2)
November 2021 · Paper 2 · Q1(c) 2 marks AO1=1, AO3=1 Short answer public finances and taxation
Data and extracts for question 11 After the Global Financial Crisis of 2008, the US President introduced expansionary fiscal policies of $800 billion. The International Monetary Fund estimated that the multiplier at the time was approximately 1.5. (Source adapted from: https://www.economist.com/the-economist-explains/2016/09/07/ what-is-the-keynesian-multiplier)
(c) Explain the impact of annual fiscal deficits on the US national debt. (2)
November 2021 · Paper 2 · Q2(a) 1 mark Multiple choice aggregate supplynational income and the multiplier
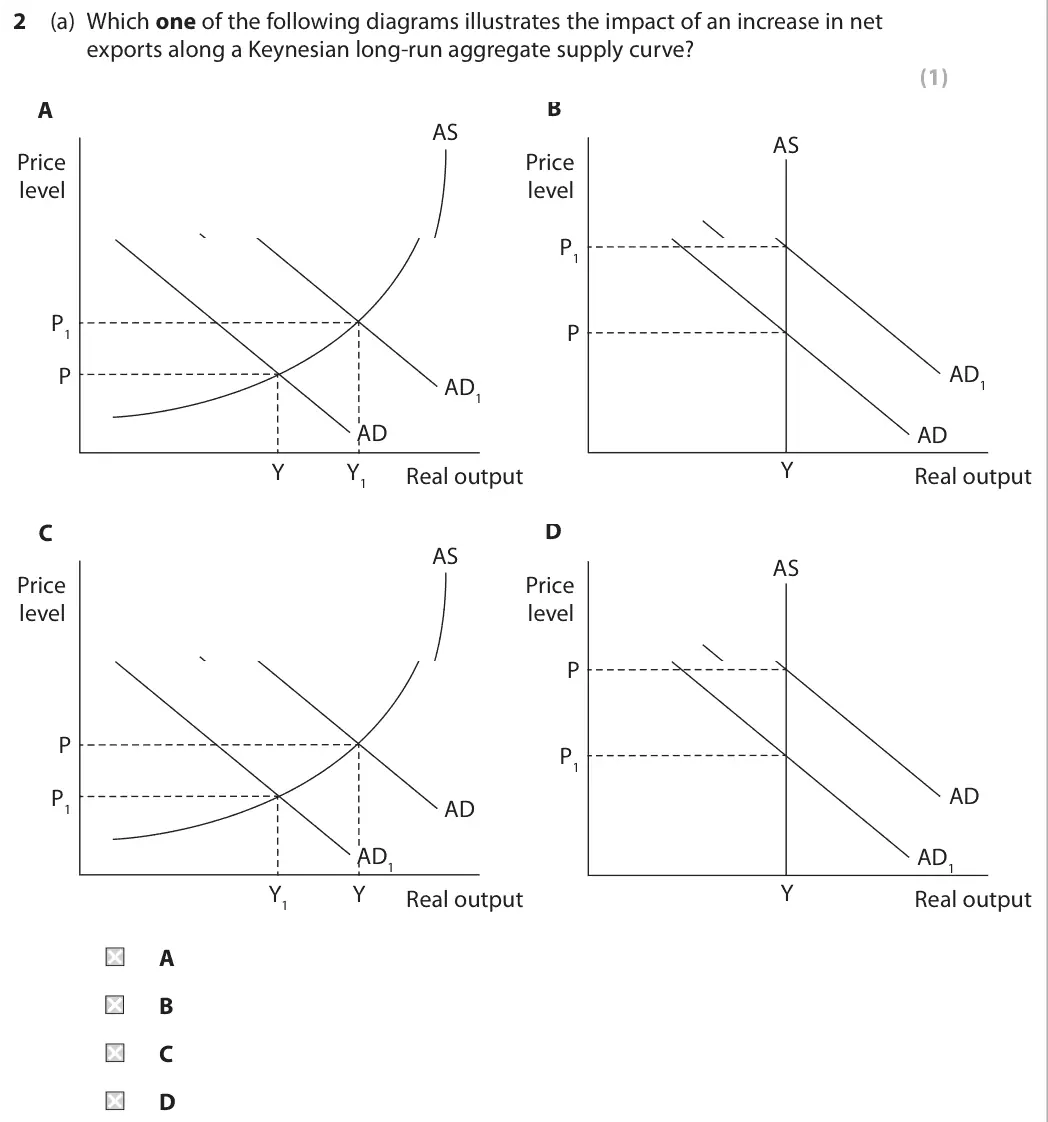
(a) Which one of the following diagrams illustrates the impact of an increase in net exports along a Keynesian long-run aggregate supply curve? (1) B A AS AS Price Price level level P1 P1 P AD1 P AD1 AD AD Y Y Y1 Real output Real output D C AS AS Price Price level level P P P1 AD P1 AD AD1 AD1 Y Y1 Y Real output Real output A B C D
November 2021 · Paper 2 · Q2(b) 2 marks AO1=1, AO3=1 Short answer aggregate supply
(b) Using the classical long-run aggregate supply curve, explain what will happen in the long run to real output if aggregate demand increases. (2)
November 2021 · Paper 2 · Q2(c) 2 marks AO1=1, AO3=1 Short answer aggregate demand
(c) Explain the likely impact on aggregate demand of a fall in average house prices. (2)
November 2021 · Paper 2 · Q3(a) 1 mark Multiple choice exchange rates
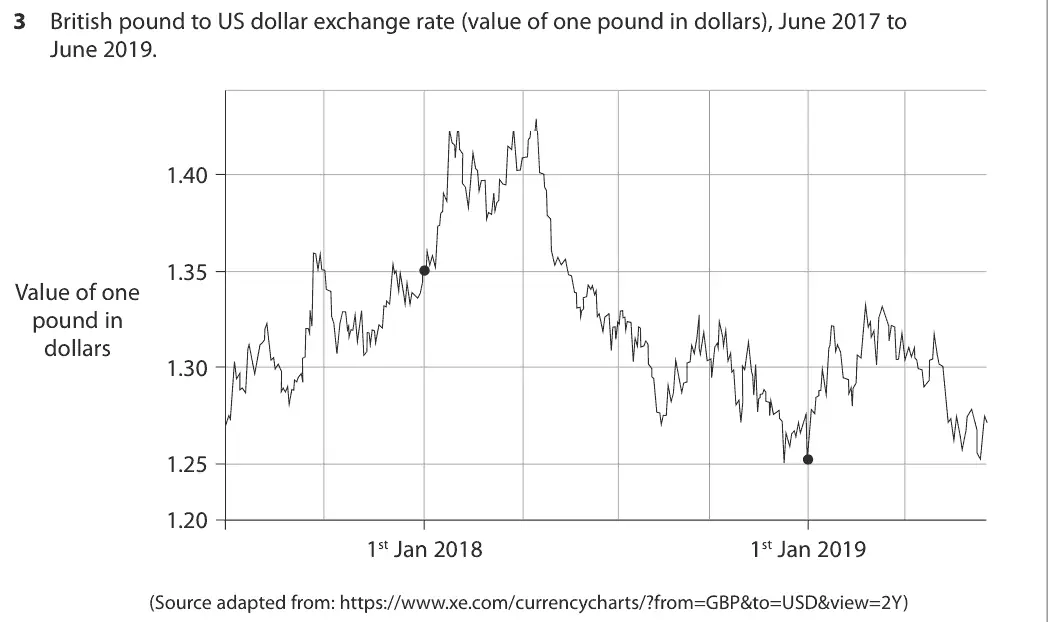
Data and extracts for question 33 British pound to US dollar exchange rate (value of one pound in dollars), June 2017 to June 2019. 1.40 1.35 Value of one pound in dollars 1.30 1.25 1.20 1st Jan 2018 1st Jan 2019 (Source adapted from: https://www.xe.com/currencycharts/?from=GBP&to=USD&view=2Y)
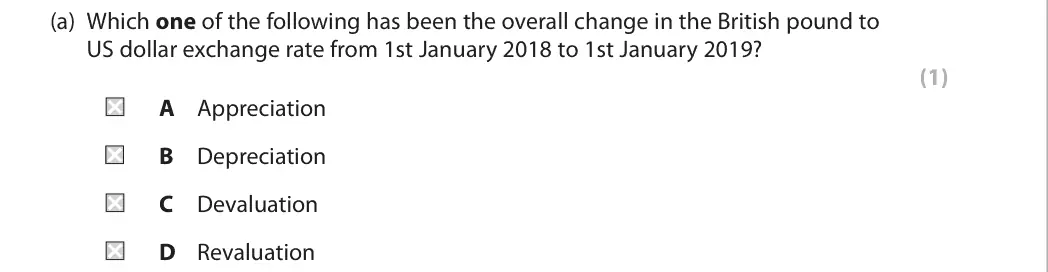
(a) Which one of the following has been the overall change in the British pound to US dollar exchange rate from 1st January 2018 to 1st January 2019? (1) A Appreciation B Depreciation C Devaluation D Revaluation
November 2021 · Paper 2 · Q3(b) 4 marks AO1=2, AO2=1, AO3=1 Short answer exchange ratesbalance of payments
Data and extracts for question 33 British pound to US dollar exchange rate (value of one pound in dollars), June 2017 to June 2019. 1.40 1.35 Value of one pound in dollars 1.30 1.25 1.20 1st Jan 2018 1st Jan 2019 (Source adapted from: https://www.xe.com/currencycharts/?from=GBP&to=USD&view=2Y)
(b) Explain the likely impact of the change in the exchange rate of the pound shown in the graph from 1st January 2018 to 1st January 2019 on the UK current account of the balance of payments. (4)
November 2021 · Paper 2 · Q4(a) 4 marks AO1=2, AO2=1, AO3=1 Short answer aggregate supply
Data and extracts for question 44 A number of business groups have signed an open letter to the UK Government asking it to commit to delivering the full High Speed 2 rail link. This will connect London to the northern cities of Manchester and Leeds at a cost of £56 billion and reduce journey times by as much as 50%. (Source adapted from: https://www.theguardian.com/uk-news/2019/jun/22/business-heads- urge-next-pm-to-commit-to-finishing-hs2)
(a) Explain one likely impact of this project on aggregate supply in the UK. (4)
November 2021 · Paper 2 · Q4(b) 1 mark Multiple choice public finances and taxation
Data and extracts for question 44 A number of business groups have signed an open letter to the UK Government asking it to commit to delivering the full High Speed 2 rail link. This will connect London to the northern cities of Manchester and Leeds at a cost of £56 billion and reduce journey times by as much as 50%. (Source adapted from: https://www.theguardian.com/uk-news/2019/jun/22/business-heads- urge-next-pm-to-commit-to-finishing-hs2)
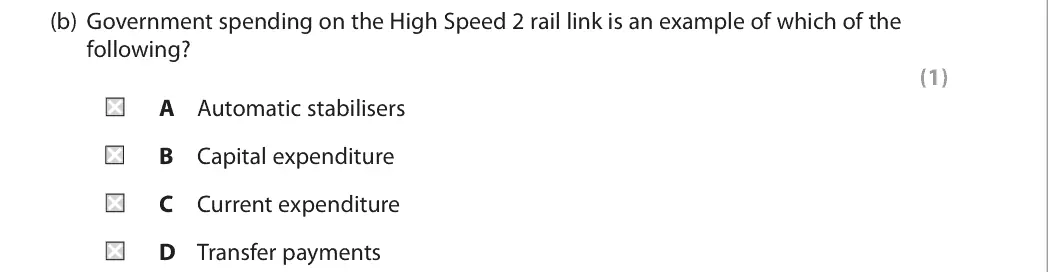
(b) Government spending on the High Speed 2 rail link is an example of which of the following? (1) A Automatic stabilisers B Capital expenditure C Current expenditure D Transfer payments
November 2021 · Paper 2 · Q5(a) 1 mark Multiple choice measuring economic growth
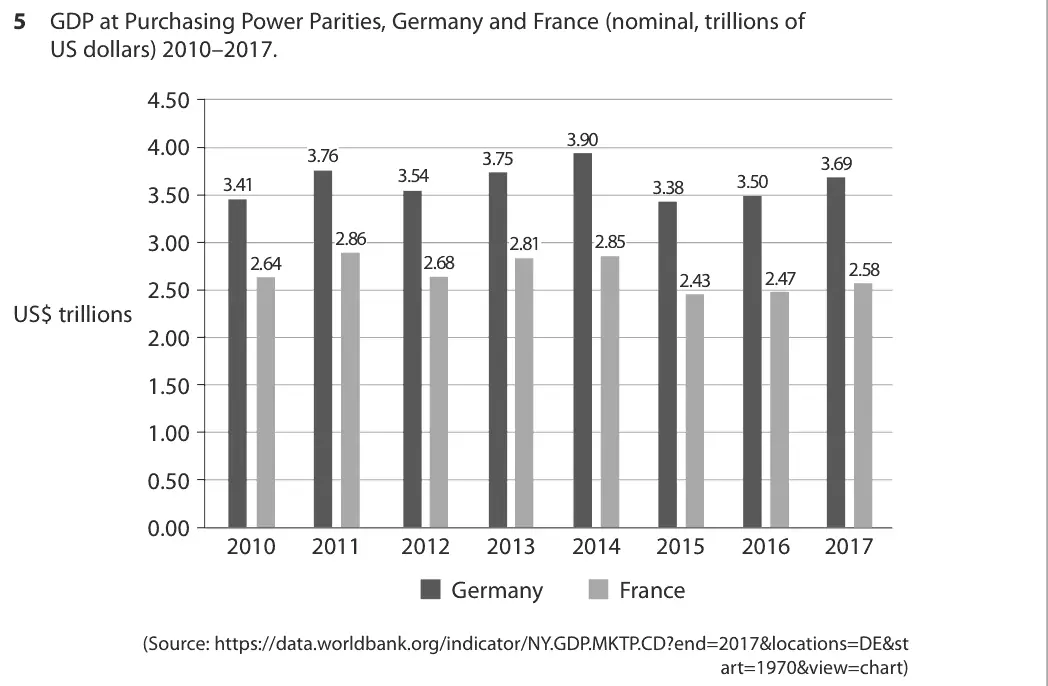
Data and extracts for question 55 GDP at Purchasing Power Parities, Germany and France (nominal, trillions of US dollars) 2010–2017. 4.50 3 . 90 4.00 3 . 76 3 . 75 3 . 69 3 . 54 3 . 50 3 . 41 3 . 38 3.50 2 . 86 3.00 2 . 85 2 . 81 2. 64 2 . 68 2 . 58 2 . 47 2 . 43 2.50 US$ trillions 2.00 1.50 1.00 0.50 0.00 2010 2011 2012 2013 2014 2015 2016 2017 Germany France (Source: https://data.worldbank.org/indicator/NY.GDP.MKTP.CD?end=2017&locations=DE&st art=1970&view=chart)
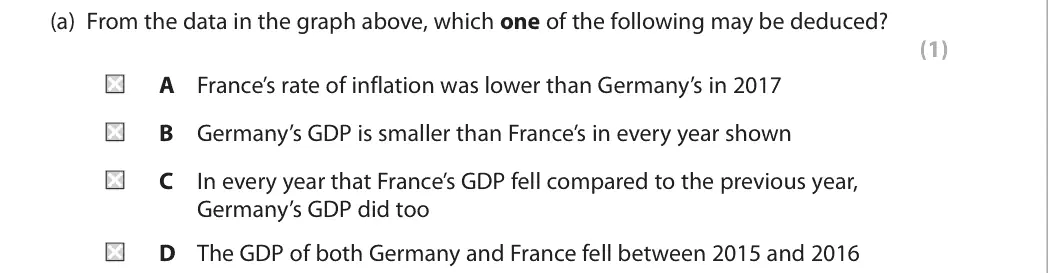
(a) From the data in the graph above, which one of the following may be deduced? (1) A France’s rate of inflation was lower than Germany’s in 2017 B Germany’s GDP is smaller than France’s in every year shown C In every year that France’s GDP fell compared to the previous year, Germany’s GDP did too D The GDP of both Germany and France fell between 2015 and 2016
November 2021 · Paper 2 · Q5(b) 2 marks AO2=2 Calculation measuring economic growth
Data and extracts for question 55 GDP at Purchasing Power Parities, Germany and France (nominal, trillions of US dollars) 2010–2017. 4.50 3 . 90 4.00 3 . 76 3 . 75 3 . 69 3 . 54 3 . 50 3 . 41 3 . 38 3.50 2 . 86 3.00 2 . 85 2 . 81 2. 64 2 . 68 2 . 58 2 . 47 2 . 43 2.50 US$ trillions 2.00 1.50 1.00 0.50 0.00 2010 2011 2012 2013 2014 2015 2016 2017 Germany France (Source: https://data.worldbank.org/indicator/NY.GDP.MKTP.CD?end=2017&locations=DE&st art=1970&view=chart)
(b) Calculate the percentage change in Germany’s nominal GDP from 2016 to 2017. (2)
November 2021 · Paper 2 · Q5(c) 2 marks AO1=1, AO3=1 Short answer Hard measuring economic growth
Data and extracts for question 55 GDP at Purchasing Power Parities, Germany and France (nominal, trillions of US dollars) 2010–2017. 4.50 3 . 90 4.00 3 . 76 3 . 75 3 . 69 3 . 54 3 . 50 3 . 41 3 . 38 3.50 2 . 86 3.00 2 . 85 2 . 81 2. 64 2 . 68 2 . 58 2 . 47 2 . 43 2.50 US$ trillions 2.00 1.50 1.00 0.50 0.00 2010 2011 2012 2013 2014 2015 2016 2017 Germany France (Source: https://data.worldbank.org/indicator/NY.GDP.MKTP.CD?end=2017&locations=DE&st art=1970&view=chart)
(c) Explain one reason why Purchasing Power Parities are used. (2)
November 2021 · Paper 2 · Q6(a) 5 marks AO1=1, AO2=2, AO3=2 Calculation emerging and developing economies
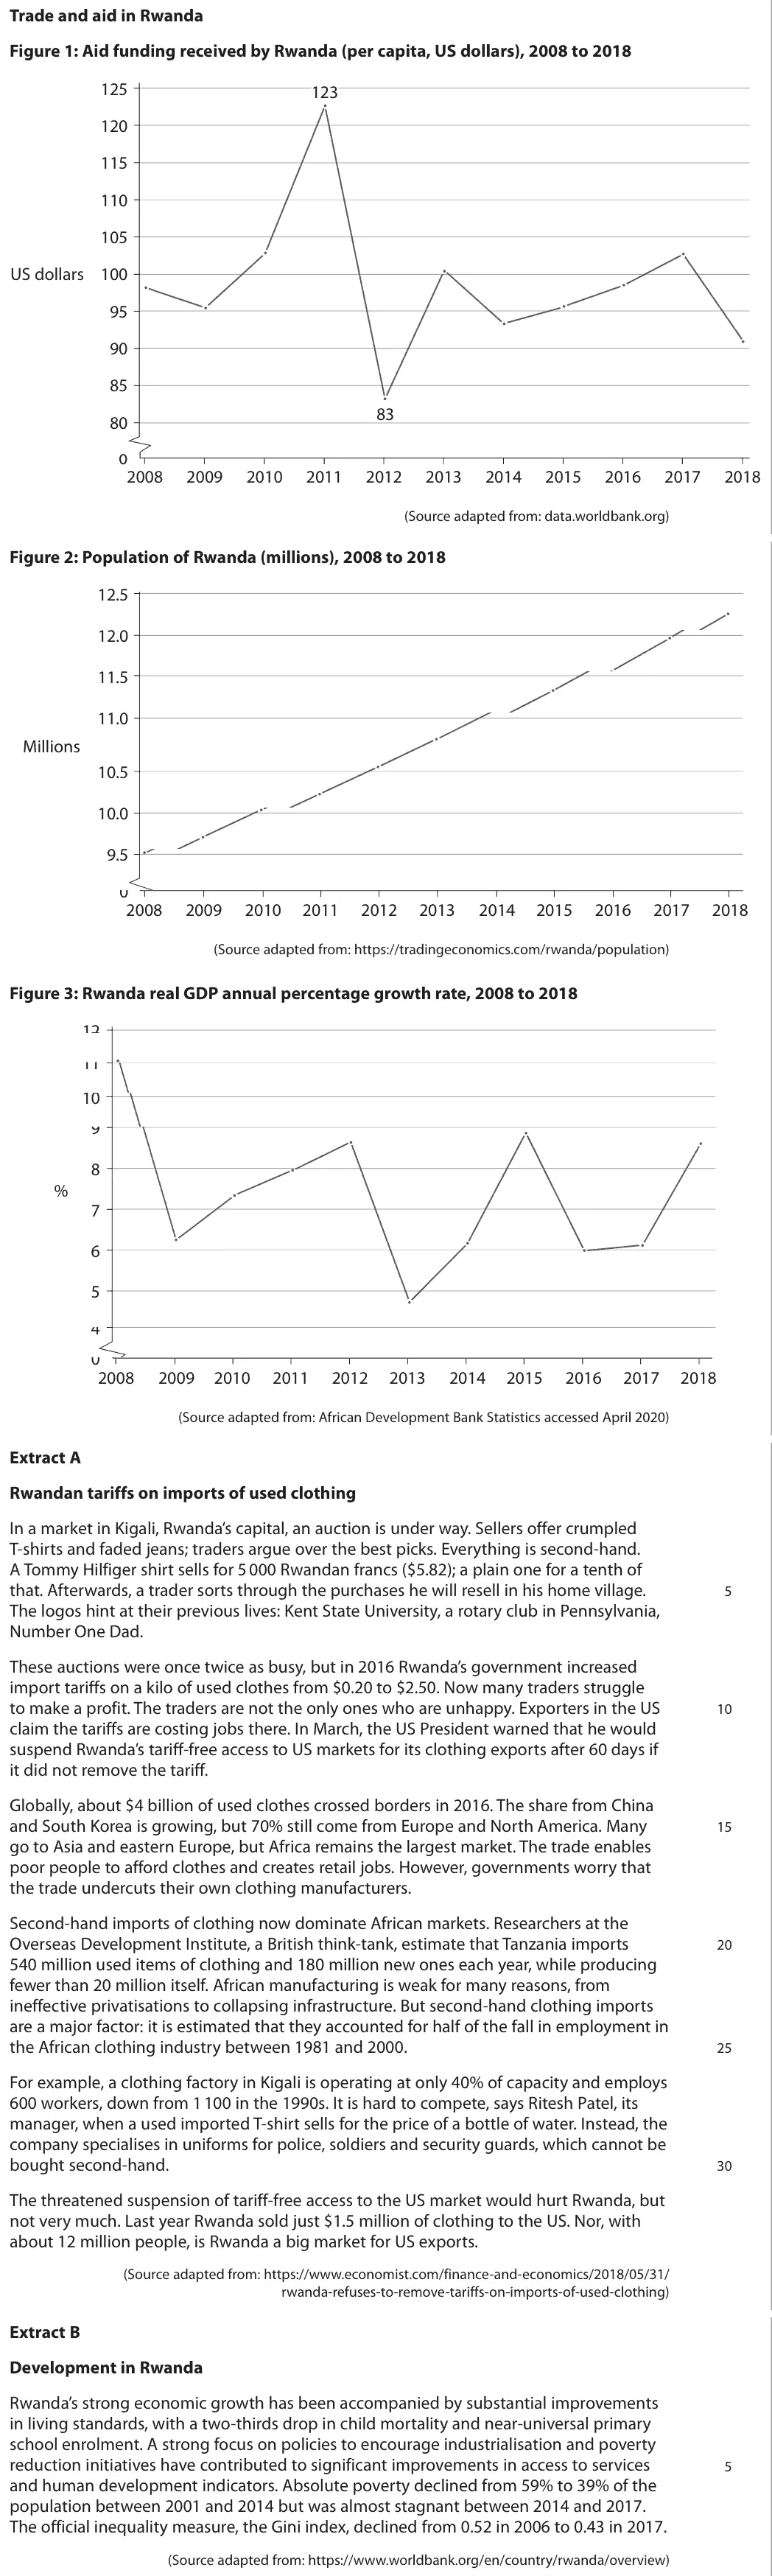
Data and extracts for question 6Trade and aid in Rwanda Figure 1: Aid funding received by Rwanda (per capita, US dollars), 2008 to 2018 125 123 120 115 110 105 US dollars 100 95 90 85 83 80 0 2008 2009 2010 2011 2012 2013 2014 2015 2016 2017 2018 (Source adapted from: data.worldbank.org) Figure 2: Population of Rwanda (millions), 2008 to 2018 12.5 12.0 11.5 11.0 Millions 10.5 10.0 9.5 0 2008 2009 2010 2011 2012 2013 2014 2015 2016 2017 2018 (Source adapted from: https://tradingeconomics.com/rwanda/population) Figure 3: Rwanda real GDP annual percentage growth rate, 2008 to 2018 12 11 10 9 8 % 7 6 5 4 0 2008 2009 2010 2011 2012 2013 2014 2015 2016 2017 2018 (Source adapted from: African Development Bank Statistics accessed April 2020) Extract A Rwandan tariffs on imports of used clothing In a market in Kigali, Rwanda’s capital, an auction is under way. Sellers offer crumpled T-shirts and faded jeans; traders argue over the best picks. Everything is second-hand. A Tommy Hilfiger shirt sells for 5 000 Rwandan francs ($5.82); a plain one for a tenth of that. Afterwards, a trader sorts through the purchases he will resell in his home village. 5 The logos hint at their previous lives: Kent State University, a rotary club in Pennsylvania, Number One Dad. These auctions were once twice as busy, but in 2016 Rwanda’s government increased import tariffs on a kilo of used clothes from $0.20 to $2.50. Now many traders struggle to make a profit. The traders are not the only ones who are unhappy. Exporters in the US 10 claim the tariffs are costing jobs there. In March, the US President warned that he would suspend Rwanda’s tariff-free access to US markets for its clothing exports after 60 days if it did not remove the tariff. Globally, about $4 billion of used clothes crossed borders in 2016. The share from China and South Korea is growing, but 70% still come from Europe and North America. Many 15 go to Asia and eastern Europe, but Africa remains the largest market. The trade enables poor people to afford clothes and creates retail jobs. However, governments worry that the trade undercuts their own clothing manufacturers. Second-hand imports of clothing now dominate African markets. Researchers at the Overseas Development Institute, a British think-tank, estimate that Tanzania imports 20 540 million used items of clothing and 180 million new ones each year, while producing fewer than 20 million itself. African manufacturing is weak for many reasons, from ineffective privatisations to collapsing infrastructure. But second-hand clothing imports are a major factor: it is estimated that they accounted for half of the fall in employment in the African clothing industry between 1981 and 2000. 25 For example, a clothing factory in Kigali is operating at only 40% of capacity and employs 600 workers, down from 1 100 in the 1990s. It is hard to compete, says Ritesh Patel, its manager, when a used imported T-shirt sells for the price of a bottle of water. Instead, the company specialises in uniforms for police, soldiers and security guards, which cannot be bought second-hand. 30 The threatened suspension of tariff-free access to the US market would hurt Rwanda, but not very much. Last year Rwanda sold just $1.5 million of clothing to the US. Nor, with about 12 million people, is Rwanda a big market for US exports. (Source adapted from: https://www.economist.com/finance-and-economics/2018/05/31/ rwanda-refuses-to-remove-tariffs-on-imports-of-used-clothing) Extract B Development in Rwanda Rwanda’s strong economic growth has been accompanied by substantial improvements in living standards, with a two-thirds drop in child mortality and near-universal primary school enrolment. A strong focus on policies to encourage industrialisation and poverty reduction initiatives have contributed to significant improvements in access to services 5 and human development indicators. Absolute poverty declined from 59% to 39% of the population between 2001 and 2014 but was almost stagnant between 2014 and 2017. The official inequality measure, the Gini index, declined from 0.52 in 2006 to 0.43 in 2017. (Source adapted from: https://www.worldbank.org/en/country/rwanda/overview)
(a) Using the data in Figures 1 and 2, calculate the change in the level of total aid funding to Rwanda between 2011 and 2012. (5)
November 2021 · Paper 2 · Q6(b) 8 marks AO1=2, AO2=2, AO3=2, AO4=2 8-mark response emerging and developing economies
Data and extracts for question 6Trade and aid in Rwanda Figure 1: Aid funding received by Rwanda (per capita, US dollars), 2008 to 2018 125 123 120 115 110 105 US dollars 100 95 90 85 83 80 0 2008 2009 2010 2011 2012 2013 2014 2015 2016 2017 2018 (Source adapted from: data.worldbank.org) Figure 2: Population of Rwanda (millions), 2008 to 2018 12.5 12.0 11.5 11.0 Millions 10.5 10.0 9.5 0 2008 2009 2010 2011 2012 2013 2014 2015 2016 2017 2018 (Source adapted from: https://tradingeconomics.com/rwanda/population) Figure 3: Rwanda real GDP annual percentage growth rate, 2008 to 2018 12 11 10 9 8 % 7 6 5 4 0 2008 2009 2010 2011 2012 2013 2014 2015 2016 2017 2018 (Source adapted from: African Development Bank Statistics accessed April 2020) Extract A Rwandan tariffs on imports of used clothing In a market in Kigali, Rwanda’s capital, an auction is under way. Sellers offer crumpled T-shirts and faded jeans; traders argue over the best picks. Everything is second-hand. A Tommy Hilfiger shirt sells for 5 000 Rwandan francs ($5.82); a plain one for a tenth of that. Afterwards, a trader sorts through the purchases he will resell in his home village. 5 The logos hint at their previous lives: Kent State University, a rotary club in Pennsylvania, Number One Dad. These auctions were once twice as busy, but in 2016 Rwanda’s government increased import tariffs on a kilo of used clothes from $0.20 to $2.50. Now many traders struggle to make a profit. The traders are not the only ones who are unhappy. Exporters in the US 10 claim the tariffs are costing jobs there. In March, the US President warned that he would suspend Rwanda’s tariff-free access to US markets for its clothing exports after 60 days if it did not remove the tariff. Globally, about $4 billion of used clothes crossed borders in 2016. The share from China and South Korea is growing, but 70% still come from Europe and North America. Many 15 go to Asia and eastern Europe, but Africa remains the largest market. The trade enables poor people to afford clothes and creates retail jobs. However, governments worry that the trade undercuts their own clothing manufacturers. Second-hand imports of clothing now dominate African markets. Researchers at the Overseas Development Institute, a British think-tank, estimate that Tanzania imports 20 540 million used items of clothing and 180 million new ones each year, while producing fewer than 20 million itself. African manufacturing is weak for many reasons, from ineffective privatisations to collapsing infrastructure. But second-hand clothing imports are a major factor: it is estimated that they accounted for half of the fall in employment in the African clothing industry between 1981 and 2000. 25 For example, a clothing factory in Kigali is operating at only 40% of capacity and employs 600 workers, down from 1 100 in the 1990s. It is hard to compete, says Ritesh Patel, its manager, when a used imported T-shirt sells for the price of a bottle of water. Instead, the company specialises in uniforms for police, soldiers and security guards, which cannot be bought second-hand. 30 The threatened suspension of tariff-free access to the US market would hurt Rwanda, but not very much. Last year Rwanda sold just $1.5 million of clothing to the US. Nor, with about 12 million people, is Rwanda a big market for US exports. (Source adapted from: https://www.economist.com/finance-and-economics/2018/05/31/ rwanda-refuses-to-remove-tariffs-on-imports-of-used-clothing) Extract B Development in Rwanda Rwanda’s strong economic growth has been accompanied by substantial improvements in living standards, with a two-thirds drop in child mortality and near-universal primary school enrolment. A strong focus on policies to encourage industrialisation and poverty reduction initiatives have contributed to significant improvements in access to services 5 and human development indicators. Absolute poverty declined from 59% to 39% of the population between 2001 and 2014 but was almost stagnant between 2014 and 2017. The official inequality measure, the Gini index, declined from 0.52 in 2006 to 0.43 in 2017. (Source adapted from: https://www.worldbank.org/en/country/rwanda/overview)
(b) With reference to the information provided, examine two likely benefits for the Rwandan economy of the growth in the country’s population. (8)
November 2021 · Paper 2 · Q6(c) 10 marks AO1=2, AO2=2, AO3=2, AO4=4 10-mark response emerging and developing economies
Data and extracts for question 6Trade and aid in Rwanda Figure 1: Aid funding received by Rwanda (per capita, US dollars), 2008 to 2018 125 123 120 115 110 105 US dollars 100 95 90 85 83 80 0 2008 2009 2010 2011 2012 2013 2014 2015 2016 2017 2018 (Source adapted from: data.worldbank.org) Figure 2: Population of Rwanda (millions), 2008 to 2018 12.5 12.0 11.5 11.0 Millions 10.5 10.0 9.5 0 2008 2009 2010 2011 2012 2013 2014 2015 2016 2017 2018 (Source adapted from: https://tradingeconomics.com/rwanda/population) Figure 3: Rwanda real GDP annual percentage growth rate, 2008 to 2018 12 11 10 9 8 % 7 6 5 4 0 2008 2009 2010 2011 2012 2013 2014 2015 2016 2017 2018 (Source adapted from: African Development Bank Statistics accessed April 2020) Extract A Rwandan tariffs on imports of used clothing In a market in Kigali, Rwanda’s capital, an auction is under way. Sellers offer crumpled T-shirts and faded jeans; traders argue over the best picks. Everything is second-hand. A Tommy Hilfiger shirt sells for 5 000 Rwandan francs ($5.82); a plain one for a tenth of that. Afterwards, a trader sorts through the purchases he will resell in his home village. 5 The logos hint at their previous lives: Kent State University, a rotary club in Pennsylvania, Number One Dad. These auctions were once twice as busy, but in 2016 Rwanda’s government increased import tariffs on a kilo of used clothes from $0.20 to $2.50. Now many traders struggle to make a profit. The traders are not the only ones who are unhappy. Exporters in the US 10 claim the tariffs are costing jobs there. In March, the US President warned that he would suspend Rwanda’s tariff-free access to US markets for its clothing exports after 60 days if it did not remove the tariff. Globally, about $4 billion of used clothes crossed borders in 2016. The share from China and South Korea is growing, but 70% still come from Europe and North America. Many 15 go to Asia and eastern Europe, but Africa remains the largest market. The trade enables poor people to afford clothes and creates retail jobs. However, governments worry that the trade undercuts their own clothing manufacturers. Second-hand imports of clothing now dominate African markets. Researchers at the Overseas Development Institute, a British think-tank, estimate that Tanzania imports 20 540 million used items of clothing and 180 million new ones each year, while producing fewer than 20 million itself. African manufacturing is weak for many reasons, from ineffective privatisations to collapsing infrastructure. But second-hand clothing imports are a major factor: it is estimated that they accounted for half of the fall in employment in the African clothing industry between 1981 and 2000. 25 For example, a clothing factory in Kigali is operating at only 40% of capacity and employs 600 workers, down from 1 100 in the 1990s. It is hard to compete, says Ritesh Patel, its manager, when a used imported T-shirt sells for the price of a bottle of water. Instead, the company specialises in uniforms for police, soldiers and security guards, which cannot be bought second-hand. 30 The threatened suspension of tariff-free access to the US market would hurt Rwanda, but not very much. Last year Rwanda sold just $1.5 million of clothing to the US. Nor, with about 12 million people, is Rwanda a big market for US exports. (Source adapted from: https://www.economist.com/finance-and-economics/2018/05/31/ rwanda-refuses-to-remove-tariffs-on-imports-of-used-clothing) Extract B Development in Rwanda Rwanda’s strong economic growth has been accompanied by substantial improvements in living standards, with a two-thirds drop in child mortality and near-universal primary school enrolment. A strong focus on policies to encourage industrialisation and poverty reduction initiatives have contributed to significant improvements in access to services 5 and human development indicators. Absolute poverty declined from 59% to 39% of the population between 2001 and 2014 but was almost stagnant between 2014 and 2017. The official inequality measure, the Gini index, declined from 0.52 in 2006 to 0.43 in 2017. (Source adapted from: https://www.worldbank.org/en/country/rwanda/overview)
(c) With reference to the information provided, assess the likely impact on the Rwandan economy of the change in aid received between 2017 and 2018. (10)
November 2021 · Paper 2 · Q6(d) 12 marks AO1=2, AO2=2, AO3=4, AO4=4 12-mark response trading blocs and protectionism
Data and extracts for question 6Trade and aid in Rwanda Figure 1: Aid funding received by Rwanda (per capita, US dollars), 2008 to 2018 125 123 120 115 110 105 US dollars 100 95 90 85 83 80 0 2008 2009 2010 2011 2012 2013 2014 2015 2016 2017 2018 (Source adapted from: data.worldbank.org) Figure 2: Population of Rwanda (millions), 2008 to 2018 12.5 12.0 11.5 11.0 Millions 10.5 10.0 9.5 0 2008 2009 2010 2011 2012 2013 2014 2015 2016 2017 2018 (Source adapted from: https://tradingeconomics.com/rwanda/population) Figure 3: Rwanda real GDP annual percentage growth rate, 2008 to 2018 12 11 10 9 8 % 7 6 5 4 0 2008 2009 2010 2011 2012 2013 2014 2015 2016 2017 2018 (Source adapted from: African Development Bank Statistics accessed April 2020) Extract A Rwandan tariffs on imports of used clothing In a market in Kigali, Rwanda’s capital, an auction is under way. Sellers offer crumpled T-shirts and faded jeans; traders argue over the best picks. Everything is second-hand. A Tommy Hilfiger shirt sells for 5 000 Rwandan francs ($5.82); a plain one for a tenth of that. Afterwards, a trader sorts through the purchases he will resell in his home village. 5 The logos hint at their previous lives: Kent State University, a rotary club in Pennsylvania, Number One Dad. These auctions were once twice as busy, but in 2016 Rwanda’s government increased import tariffs on a kilo of used clothes from $0.20 to $2.50. Now many traders struggle to make a profit. The traders are not the only ones who are unhappy. Exporters in the US 10 claim the tariffs are costing jobs there. In March, the US President warned that he would suspend Rwanda’s tariff-free access to US markets for its clothing exports after 60 days if it did not remove the tariff. Globally, about $4 billion of used clothes crossed borders in 2016. The share from China and South Korea is growing, but 70% still come from Europe and North America. Many 15 go to Asia and eastern Europe, but Africa remains the largest market. The trade enables poor people to afford clothes and creates retail jobs. However, governments worry that the trade undercuts their own clothing manufacturers. Second-hand imports of clothing now dominate African markets. Researchers at the Overseas Development Institute, a British think-tank, estimate that Tanzania imports 20 540 million used items of clothing and 180 million new ones each year, while producing fewer than 20 million itself. African manufacturing is weak for many reasons, from ineffective privatisations to collapsing infrastructure. But second-hand clothing imports are a major factor: it is estimated that they accounted for half of the fall in employment in the African clothing industry between 1981 and 2000. 25 For example, a clothing factory in Kigali is operating at only 40% of capacity and employs 600 workers, down from 1 100 in the 1990s. It is hard to compete, says Ritesh Patel, its manager, when a used imported T-shirt sells for the price of a bottle of water. Instead, the company specialises in uniforms for police, soldiers and security guards, which cannot be bought second-hand. 30 The threatened suspension of tariff-free access to the US market would hurt Rwanda, but not very much. Last year Rwanda sold just $1.5 million of clothing to the US. Nor, with about 12 million people, is Rwanda a big market for US exports. (Source adapted from: https://www.economist.com/finance-and-economics/2018/05/31/ rwanda-refuses-to-remove-tariffs-on-imports-of-used-clothing) Extract B Development in Rwanda Rwanda’s strong economic growth has been accompanied by substantial improvements in living standards, with a two-thirds drop in child mortality and near-universal primary school enrolment. A strong focus on policies to encourage industrialisation and poverty reduction initiatives have contributed to significant improvements in access to services 5 and human development indicators. Absolute poverty declined from 59% to 39% of the population between 2001 and 2014 but was almost stagnant between 2014 and 2017. The official inequality measure, the Gini index, declined from 0.52 in 2006 to 0.43 in 2017. (Source adapted from: https://www.worldbank.org/en/country/rwanda/overview)
(d) Discuss the likely impact on Rwandan consumers and clothing manufacturers of the increase in the tariff on imports of second-hand clothes. Use an appropriate diagram to support your answer. (12)
November 2021 · Paper 2 · Q6(e) 15 marks AO1=3, AO2=3, AO3=3, AO4=6 15-mark response emerging and developing economies
Data and extracts for question 6Trade and aid in Rwanda Figure 1: Aid funding received by Rwanda (per capita, US dollars), 2008 to 2018 125 123 120 115 110 105 US dollars 100 95 90 85 83 80 0 2008 2009 2010 2011 2012 2013 2014 2015 2016 2017 2018 (Source adapted from: data.worldbank.org) Figure 2: Population of Rwanda (millions), 2008 to 2018 12.5 12.0 11.5 11.0 Millions 10.5 10.0 9.5 0 2008 2009 2010 2011 2012 2013 2014 2015 2016 2017 2018 (Source adapted from: https://tradingeconomics.com/rwanda/population) Figure 3: Rwanda real GDP annual percentage growth rate, 2008 to 2018 12 11 10 9 8 % 7 6 5 4 0 2008 2009 2010 2011 2012 2013 2014 2015 2016 2017 2018 (Source adapted from: African Development Bank Statistics accessed April 2020) Extract A Rwandan tariffs on imports of used clothing In a market in Kigali, Rwanda’s capital, an auction is under way. Sellers offer crumpled T-shirts and faded jeans; traders argue over the best picks. Everything is second-hand. A Tommy Hilfiger shirt sells for 5 000 Rwandan francs ($5.82); a plain one for a tenth of that. Afterwards, a trader sorts through the purchases he will resell in his home village. 5 The logos hint at their previous lives: Kent State University, a rotary club in Pennsylvania, Number One Dad. These auctions were once twice as busy, but in 2016 Rwanda’s government increased import tariffs on a kilo of used clothes from $0.20 to $2.50. Now many traders struggle to make a profit. The traders are not the only ones who are unhappy. Exporters in the US 10 claim the tariffs are costing jobs there. In March, the US President warned that he would suspend Rwanda’s tariff-free access to US markets for its clothing exports after 60 days if it did not remove the tariff. Globally, about $4 billion of used clothes crossed borders in 2016. The share from China and South Korea is growing, but 70% still come from Europe and North America. Many 15 go to Asia and eastern Europe, but Africa remains the largest market. The trade enables poor people to afford clothes and creates retail jobs. However, governments worry that the trade undercuts their own clothing manufacturers. Second-hand imports of clothing now dominate African markets. Researchers at the Overseas Development Institute, a British think-tank, estimate that Tanzania imports 20 540 million used items of clothing and 180 million new ones each year, while producing fewer than 20 million itself. African manufacturing is weak for many reasons, from ineffective privatisations to collapsing infrastructure. But second-hand clothing imports are a major factor: it is estimated that they accounted for half of the fall in employment in the African clothing industry between 1981 and 2000. 25 For example, a clothing factory in Kigali is operating at only 40% of capacity and employs 600 workers, down from 1 100 in the 1990s. It is hard to compete, says Ritesh Patel, its manager, when a used imported T-shirt sells for the price of a bottle of water. Instead, the company specialises in uniforms for police, soldiers and security guards, which cannot be bought second-hand. 30 The threatened suspension of tariff-free access to the US market would hurt Rwanda, but not very much. Last year Rwanda sold just $1.5 million of clothing to the US. Nor, with about 12 million people, is Rwanda a big market for US exports. (Source adapted from: https://www.economist.com/finance-and-economics/2018/05/31/ rwanda-refuses-to-remove-tariffs-on-imports-of-used-clothing) Extract B Development in Rwanda Rwanda’s strong economic growth has been accompanied by substantial improvements in living standards, with a two-thirds drop in child mortality and near-universal primary school enrolment. A strong focus on policies to encourage industrialisation and poverty reduction initiatives have contributed to significant improvements in access to services 5 and human development indicators. Absolute poverty declined from 59% to 39% of the population between 2001 and 2014 but was almost stagnant between 2014 and 2017. The official inequality measure, the Gini index, declined from 0.52 in 2006 to 0.43 in 2017. (Source adapted from: https://www.worldbank.org/en/country/rwanda/overview)
(e) Discuss policies, other than import tariffs, that the Rwandan government could use to develop its manufacturing industries. (15)
November 2021 · Paper 2 · Q7 25 marks AO1=4, AO2=4, AO3=8, AO4=9 25-mark essay Either/or fiscal and monetary policymacroeconomic policy in a global context
7 The European Central Bank introduced a new round of quantitative easing (QE) in March 2020, purchasing up to €750 billion of assets. The objective of this QE was to reduce the serious risks to the effectiveness of monetary policy resulting from a significant recession. The European Central Bank’s target for inflation remains at ‘below but close to 2%’. (Source adapted from: https://www.ecb.europa.eu/press/pr/date/2020/html/ecb. pr200318_1~3949d6f266.en.html) Evaluate the effectiveness of quantitative easing during ‘a significant recession’.
November 2021 · Paper 2 · Q8 25 marks AO1=4, AO2=4, AO3=8, AO4=9 25-mark essay Either/or macroeconomic objectives
8 It has been estimated that if climate change led to the world’s temperature rising 2.5 °C compared to the temperature in 2010, then global GDP per capita would be 15% lower by 2100. If temperatures rise by 4 °C compared to the temperature in 2010, then by 2100 global GDP per capita would decline by more than 30%. (Source adapted from: https://www.nature.com/articles/s41586-018-0071-9) Evaluate the potential trade-offs between environmental protection and other macroeconomic objectives.

Work with an Edexcel economics tutor

Want a paper marked and gone through with you? Message us.
Prefer email? Send an enquiry

If you are under 18, please include a parent's contact details. Enquiries go to enquiries@economicsaleveltutor.com and are deleted once handled. All tutoring is online.