June 2018: Paper 1

100 marks · 21 question parts · Paper, mark scheme and report on Pearson's site

Question by question

QTopicMarksAOType
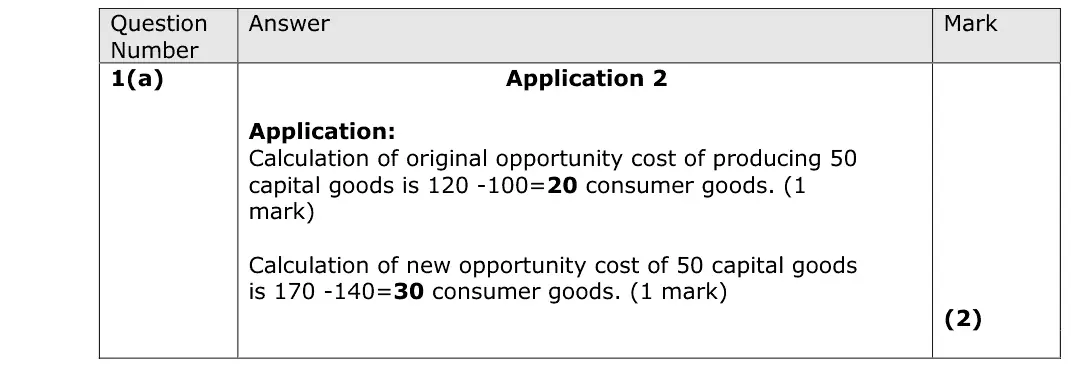
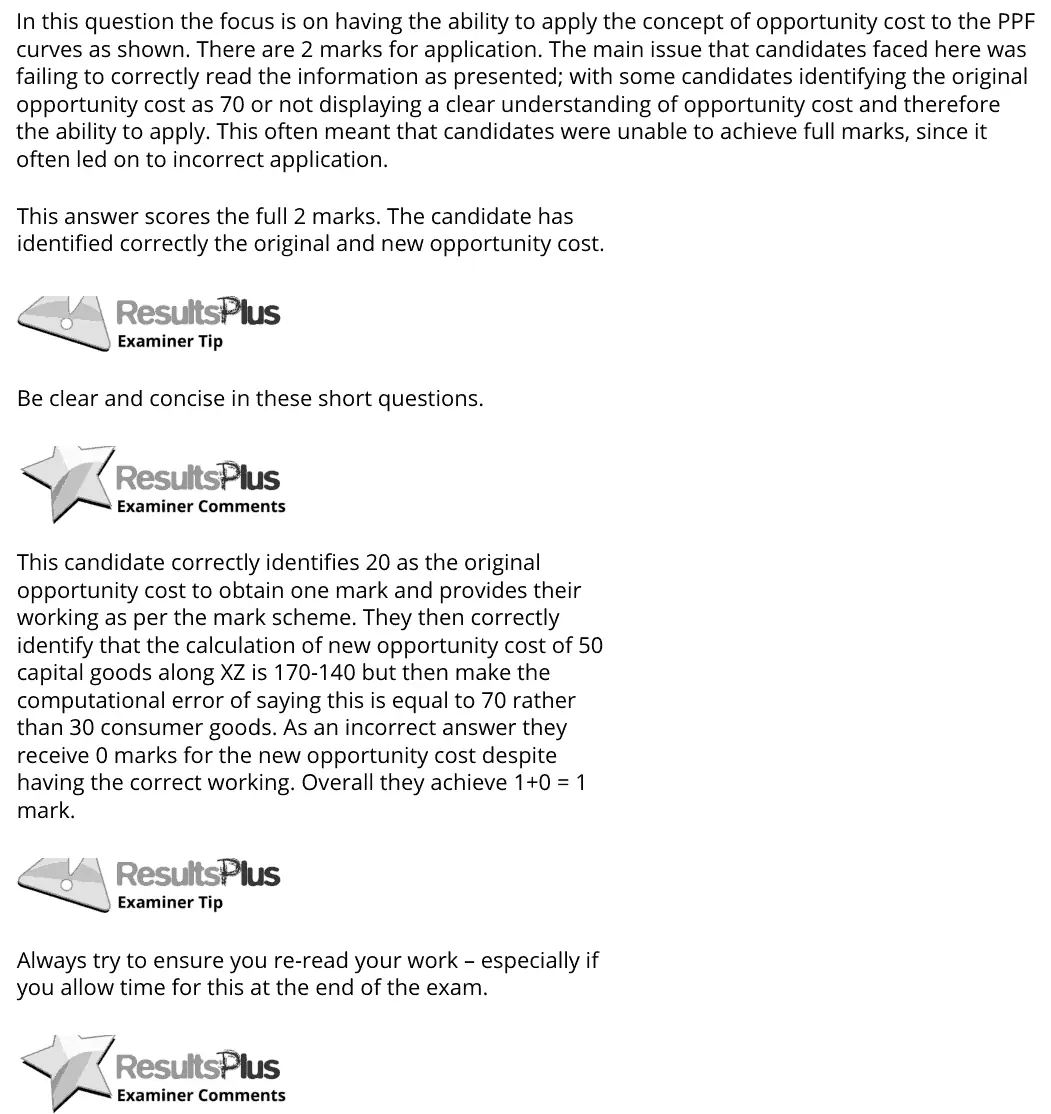
1(a) Production possibility frontiers 2AO2=2Calculation
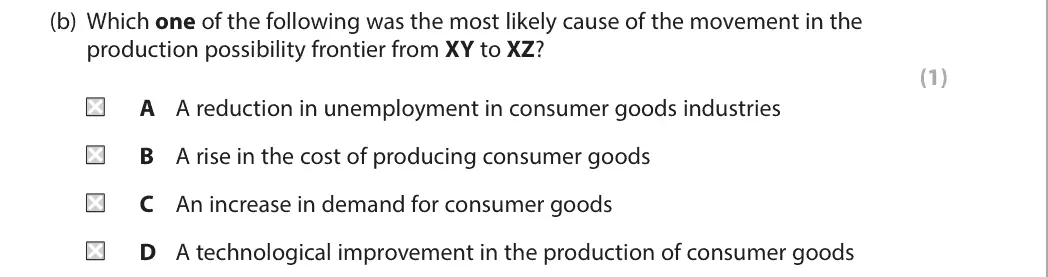
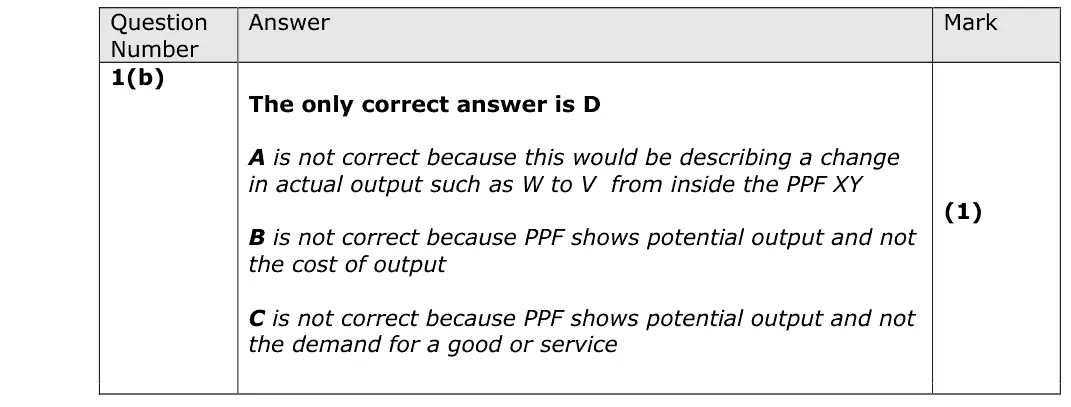
1(b) Production possibility frontiers 1Multiple choice
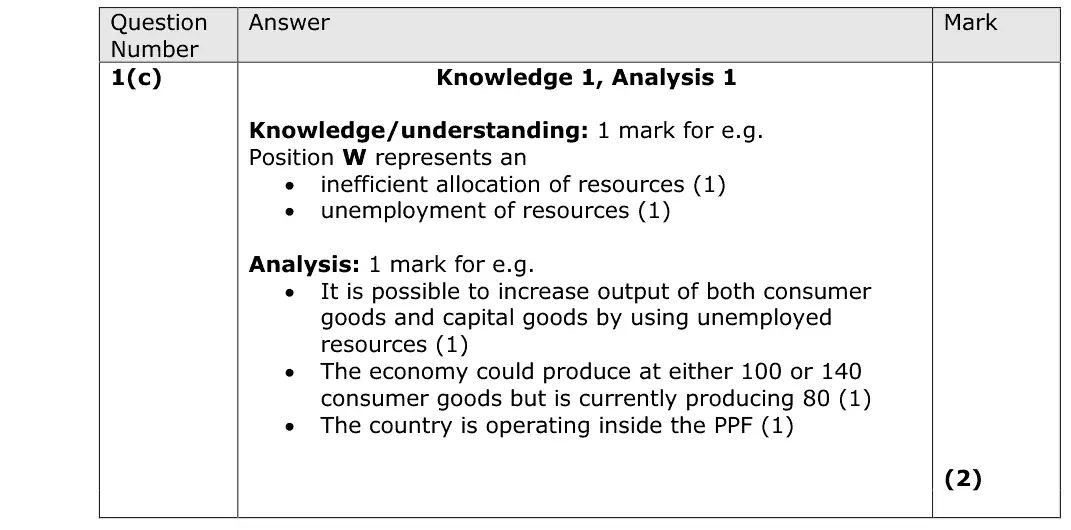
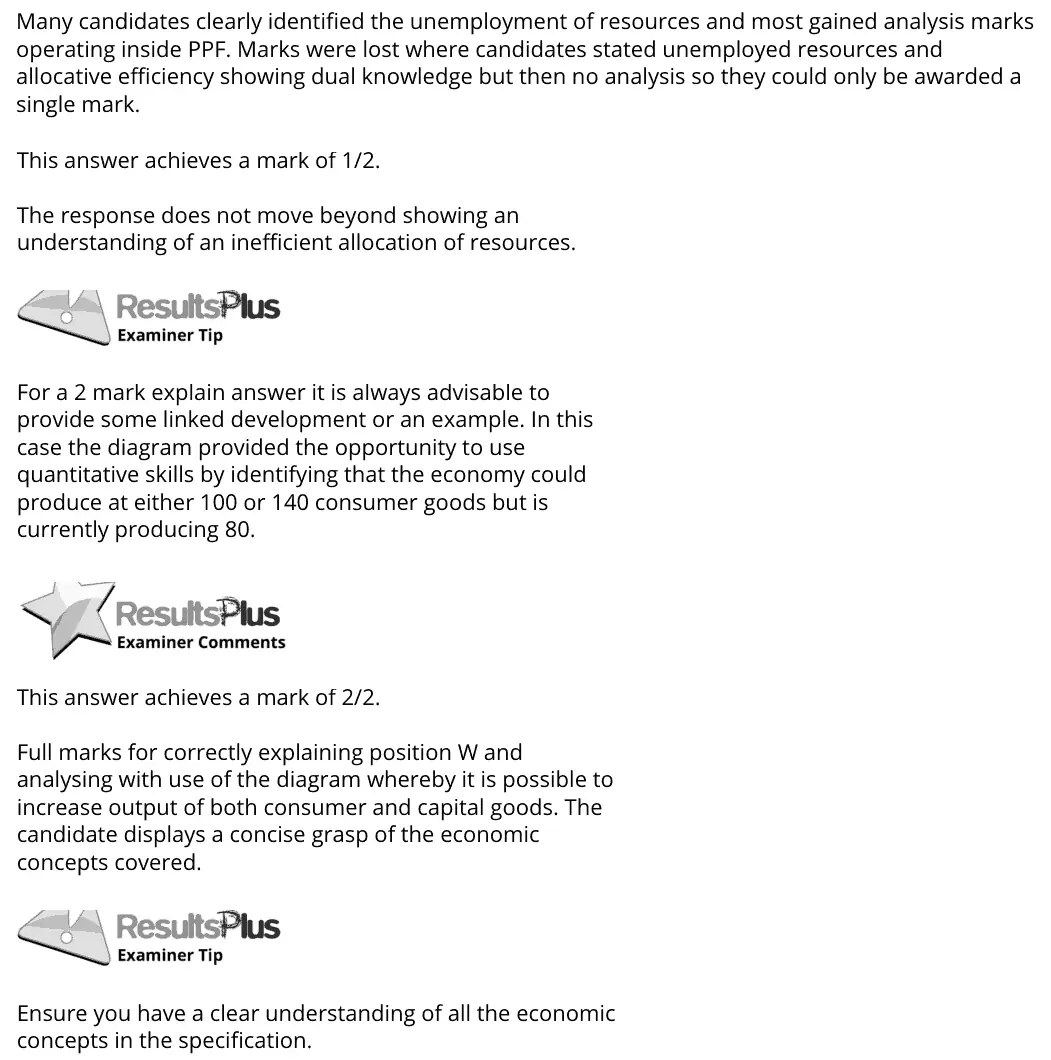
1(c) Production possibility frontiers 2AO1=1,AO3=1Short answer
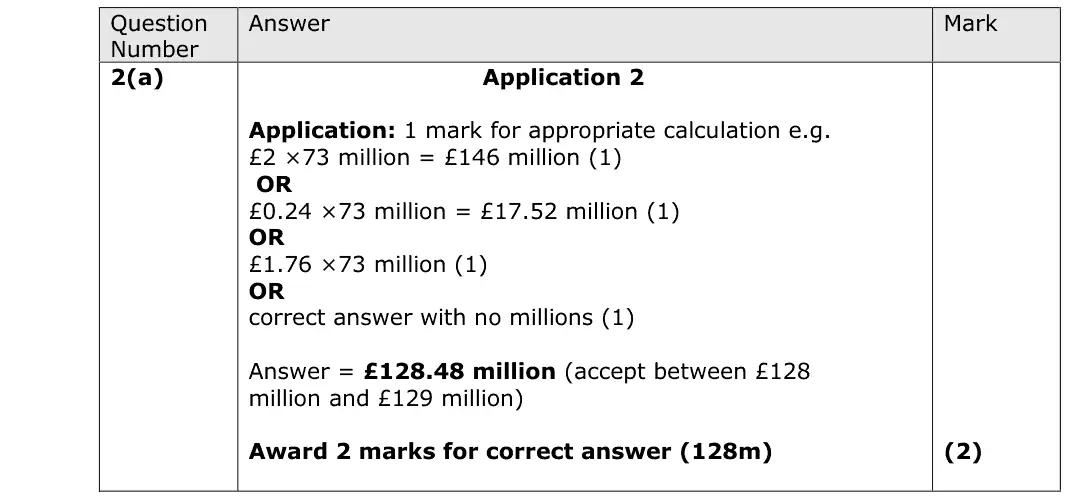
2(a) Indirect taxes and subsidies 2AO2=2Calculation
2(b) Price, income and cross elasticities of demand 2AO1=1,AO3=1Short answer
2(c) Public goods and information gaps 1Multiple choice
3(a) Revenues, costs and profits 2AO2=2Calculation
3(b) Supply, demand and price determination 1Multiple choice
3(c) Supply, demand and price determination 2AO1=1,AO3=1Short answer
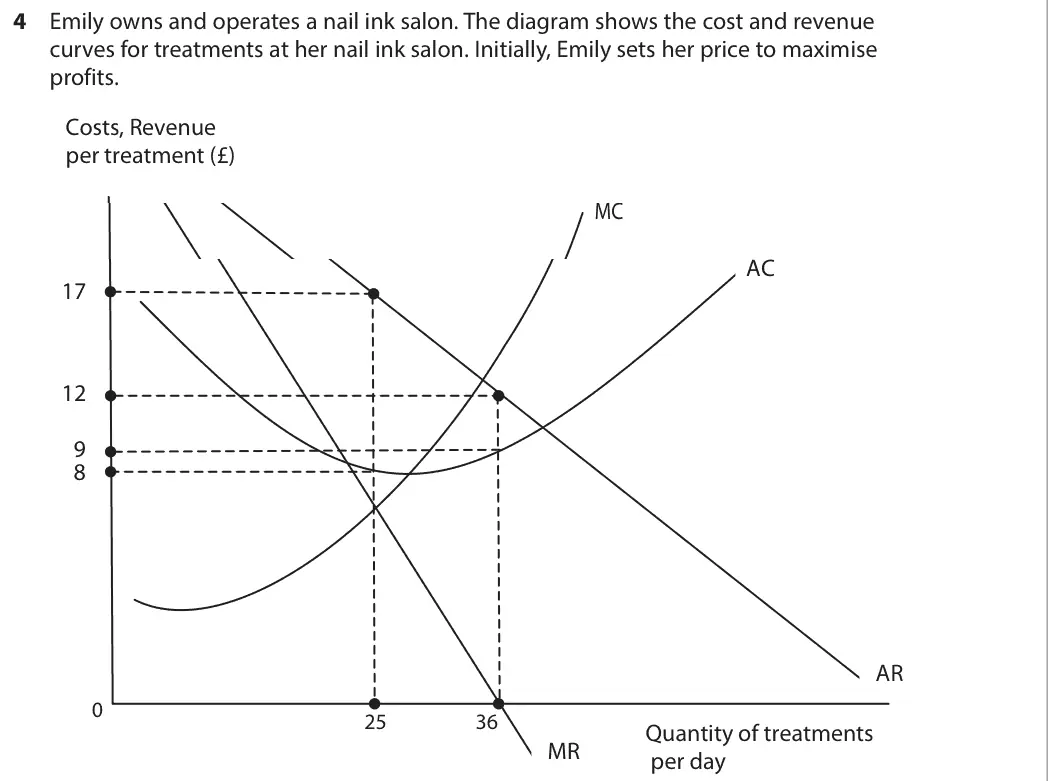
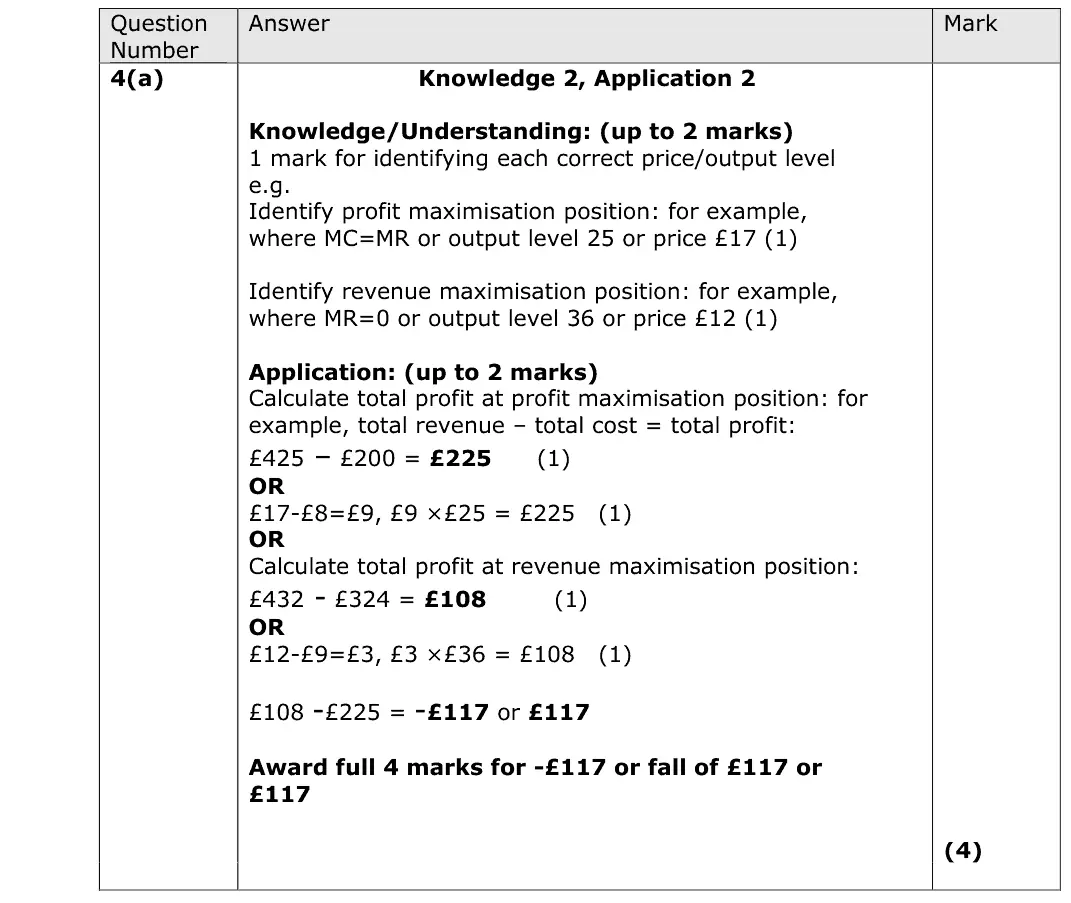
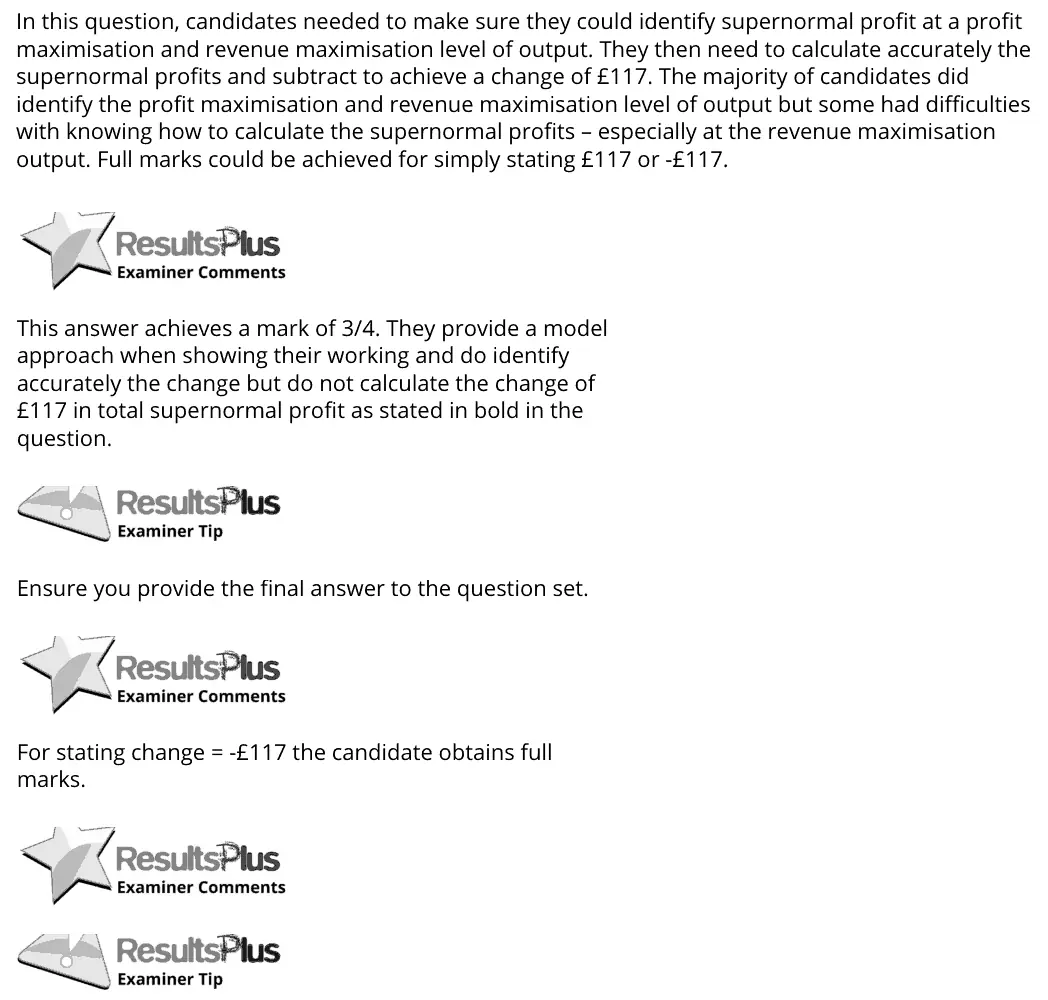
4(a) Business growth and business objectives, Revenues, costs and profits 4AO1=2,AO2=2Calculation
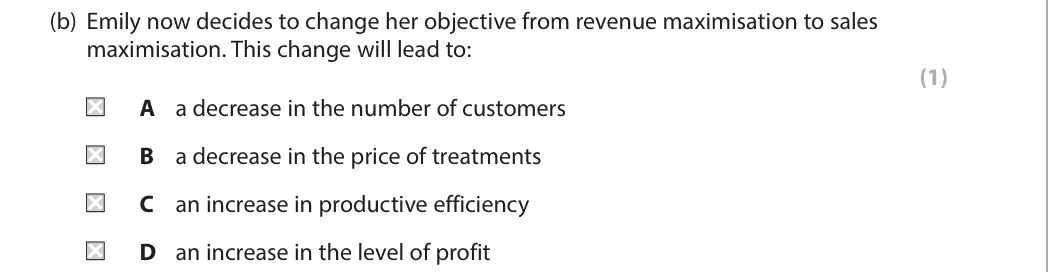
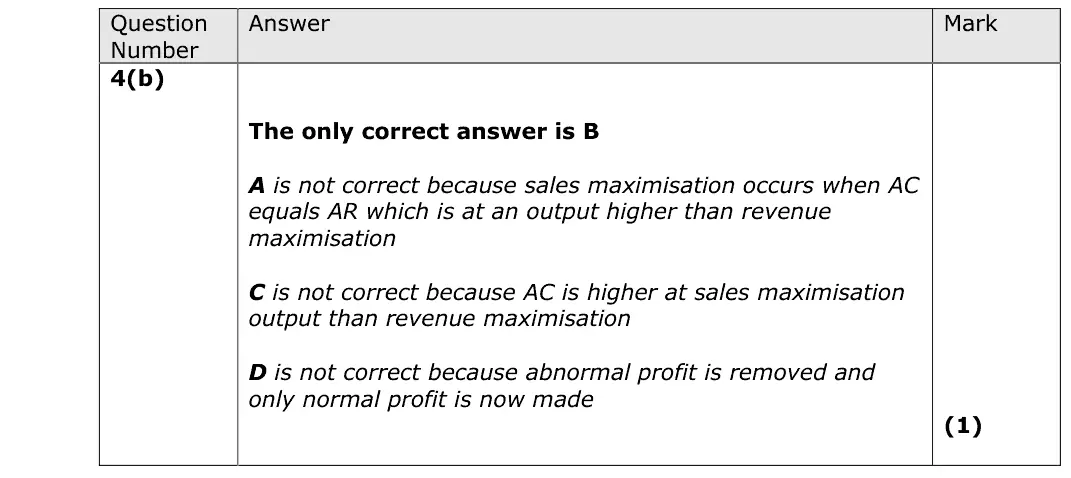
4(b) Business growth and business objectives 1Multiple choice
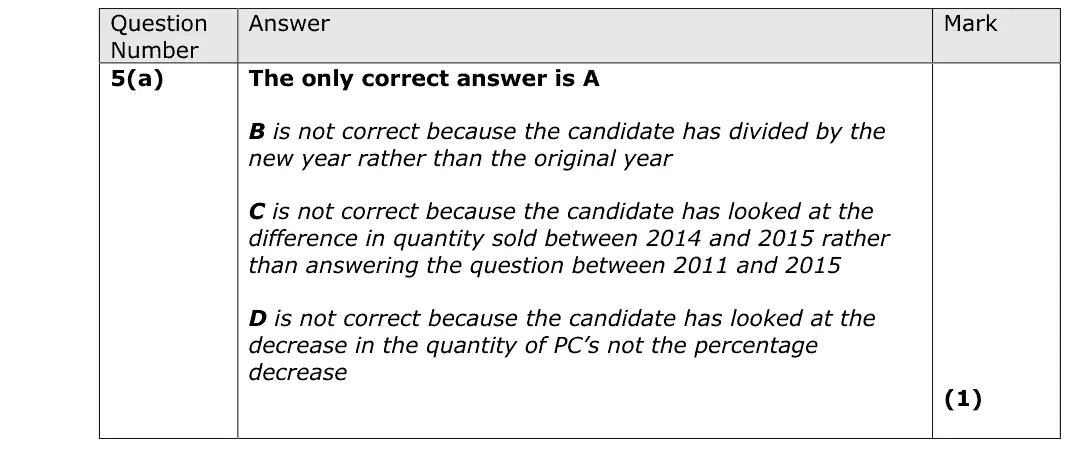
5(a) Supply, demand and price determination 1Multiple choice
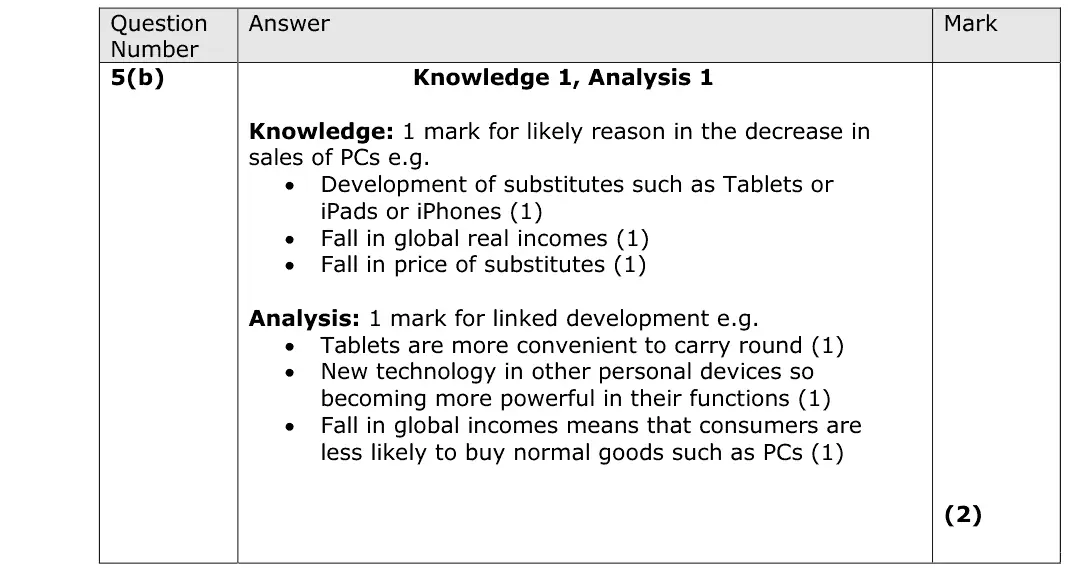
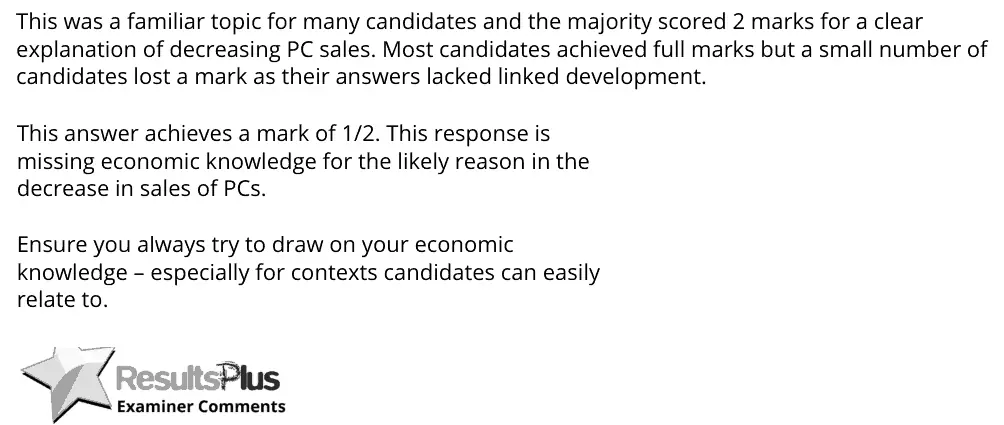
5(b) Supply, demand and price determination 2AO1=1,AO3=1Short answer
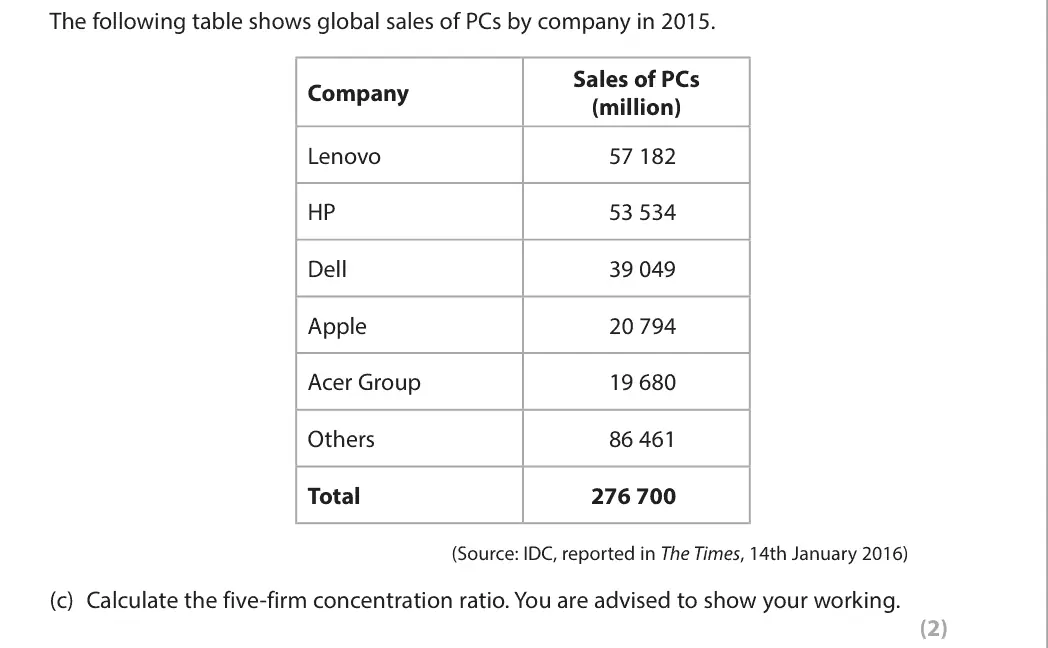
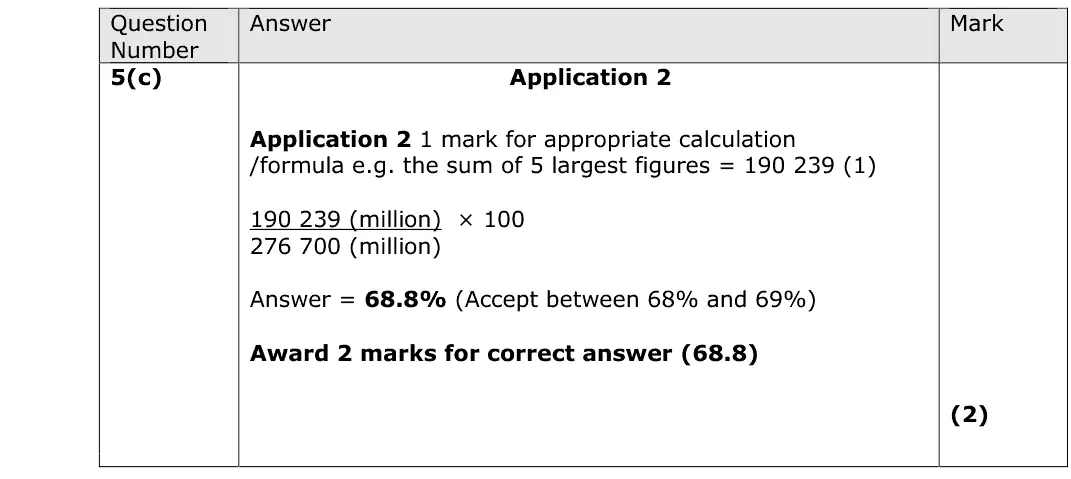
5(c) Oligopoly 2AO2=2Calculation
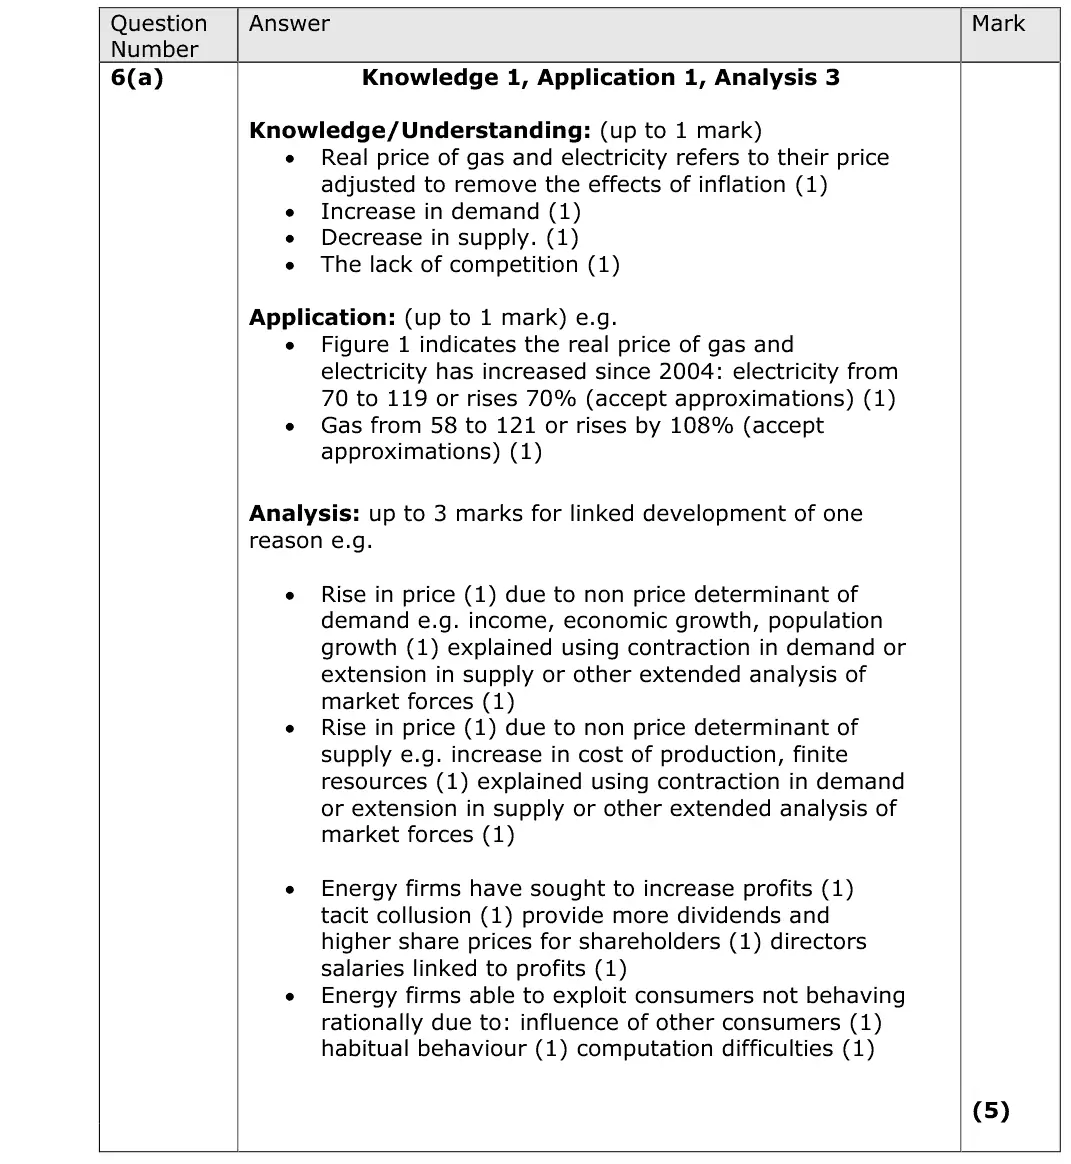
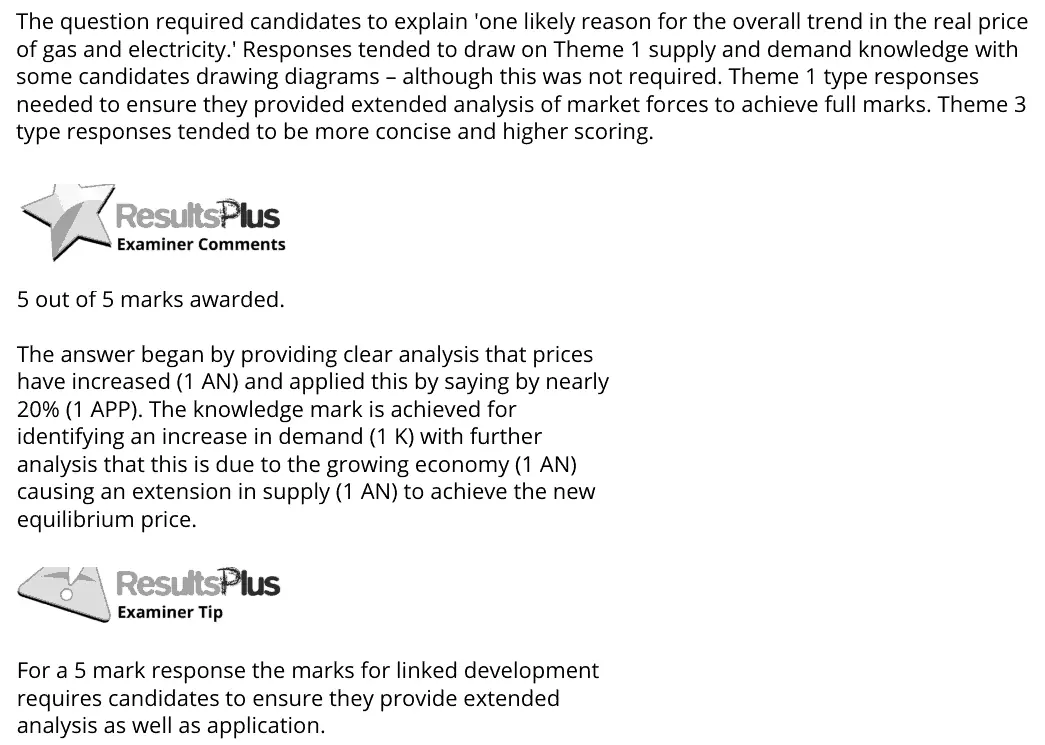
6(a) Supply, demand and price determination 5AO1=1,AO2=1,AO3=3Short answer
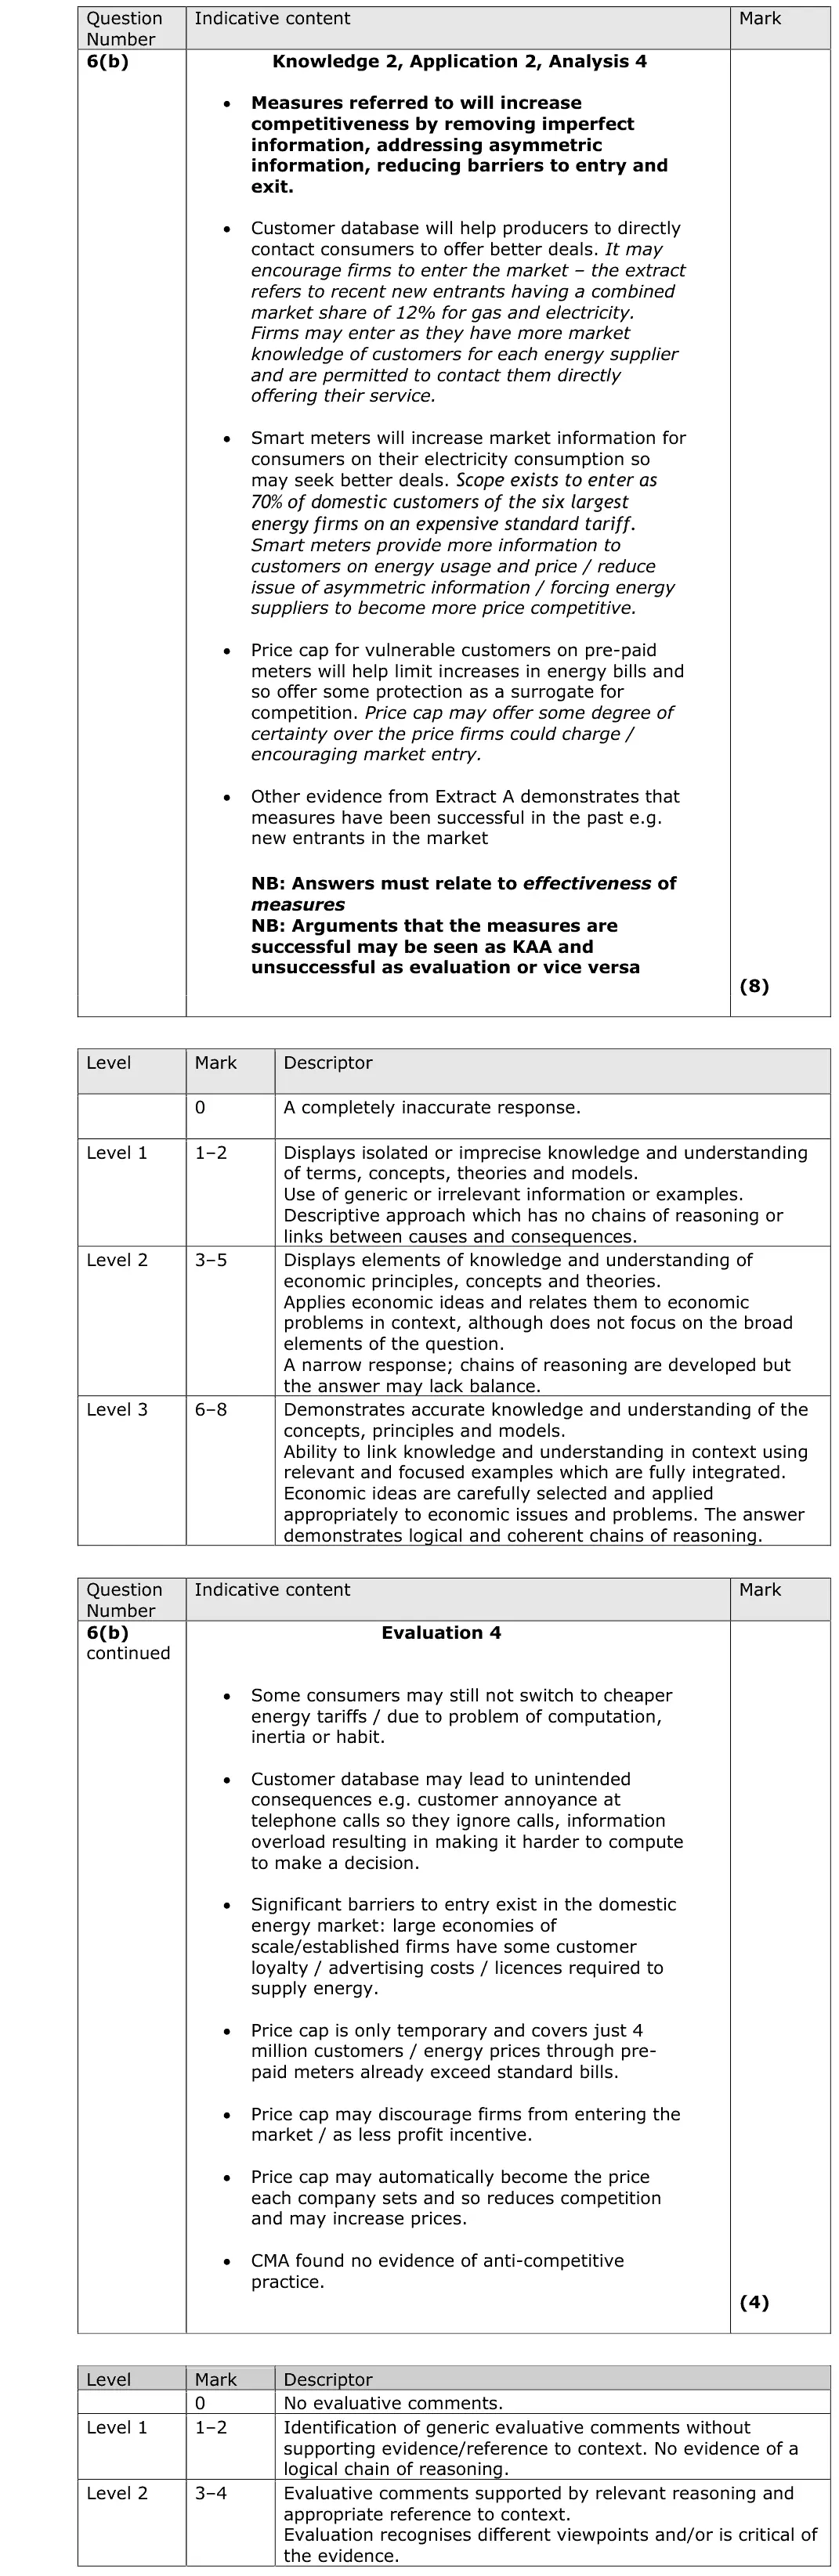
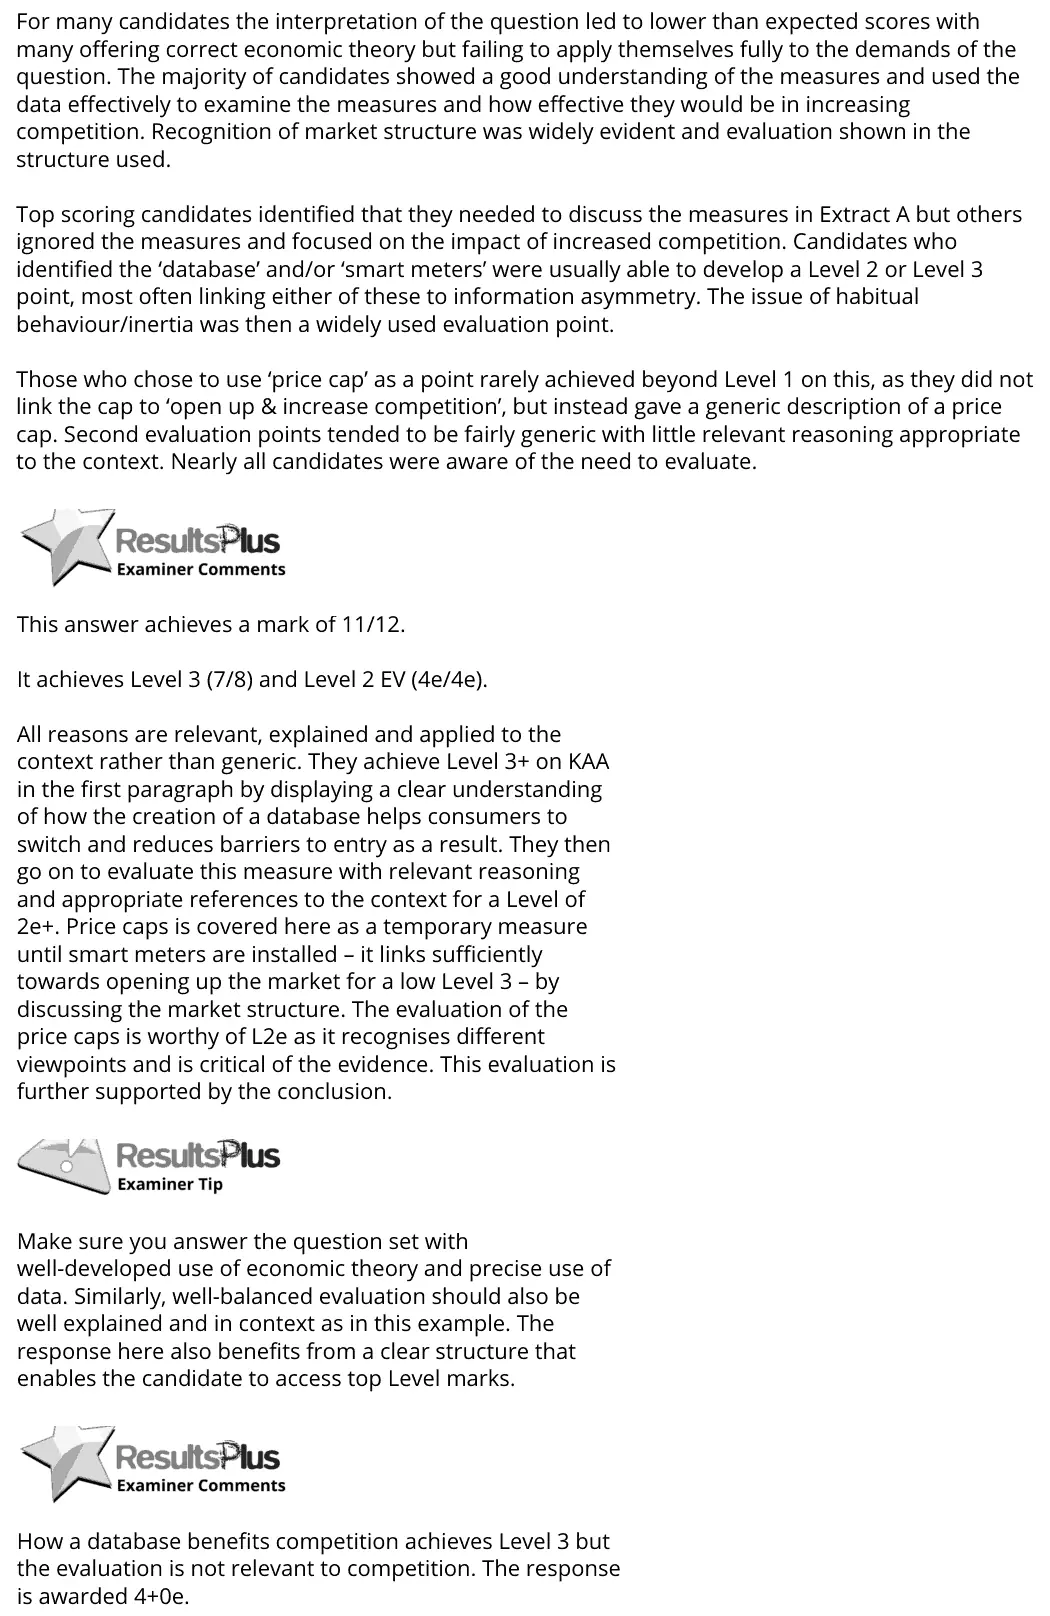
6(b) Government intervention: competition policy and regulation, Public goods and information gaps 12AO1=2,AO2=2,AO3=4,AO4=4Extended response
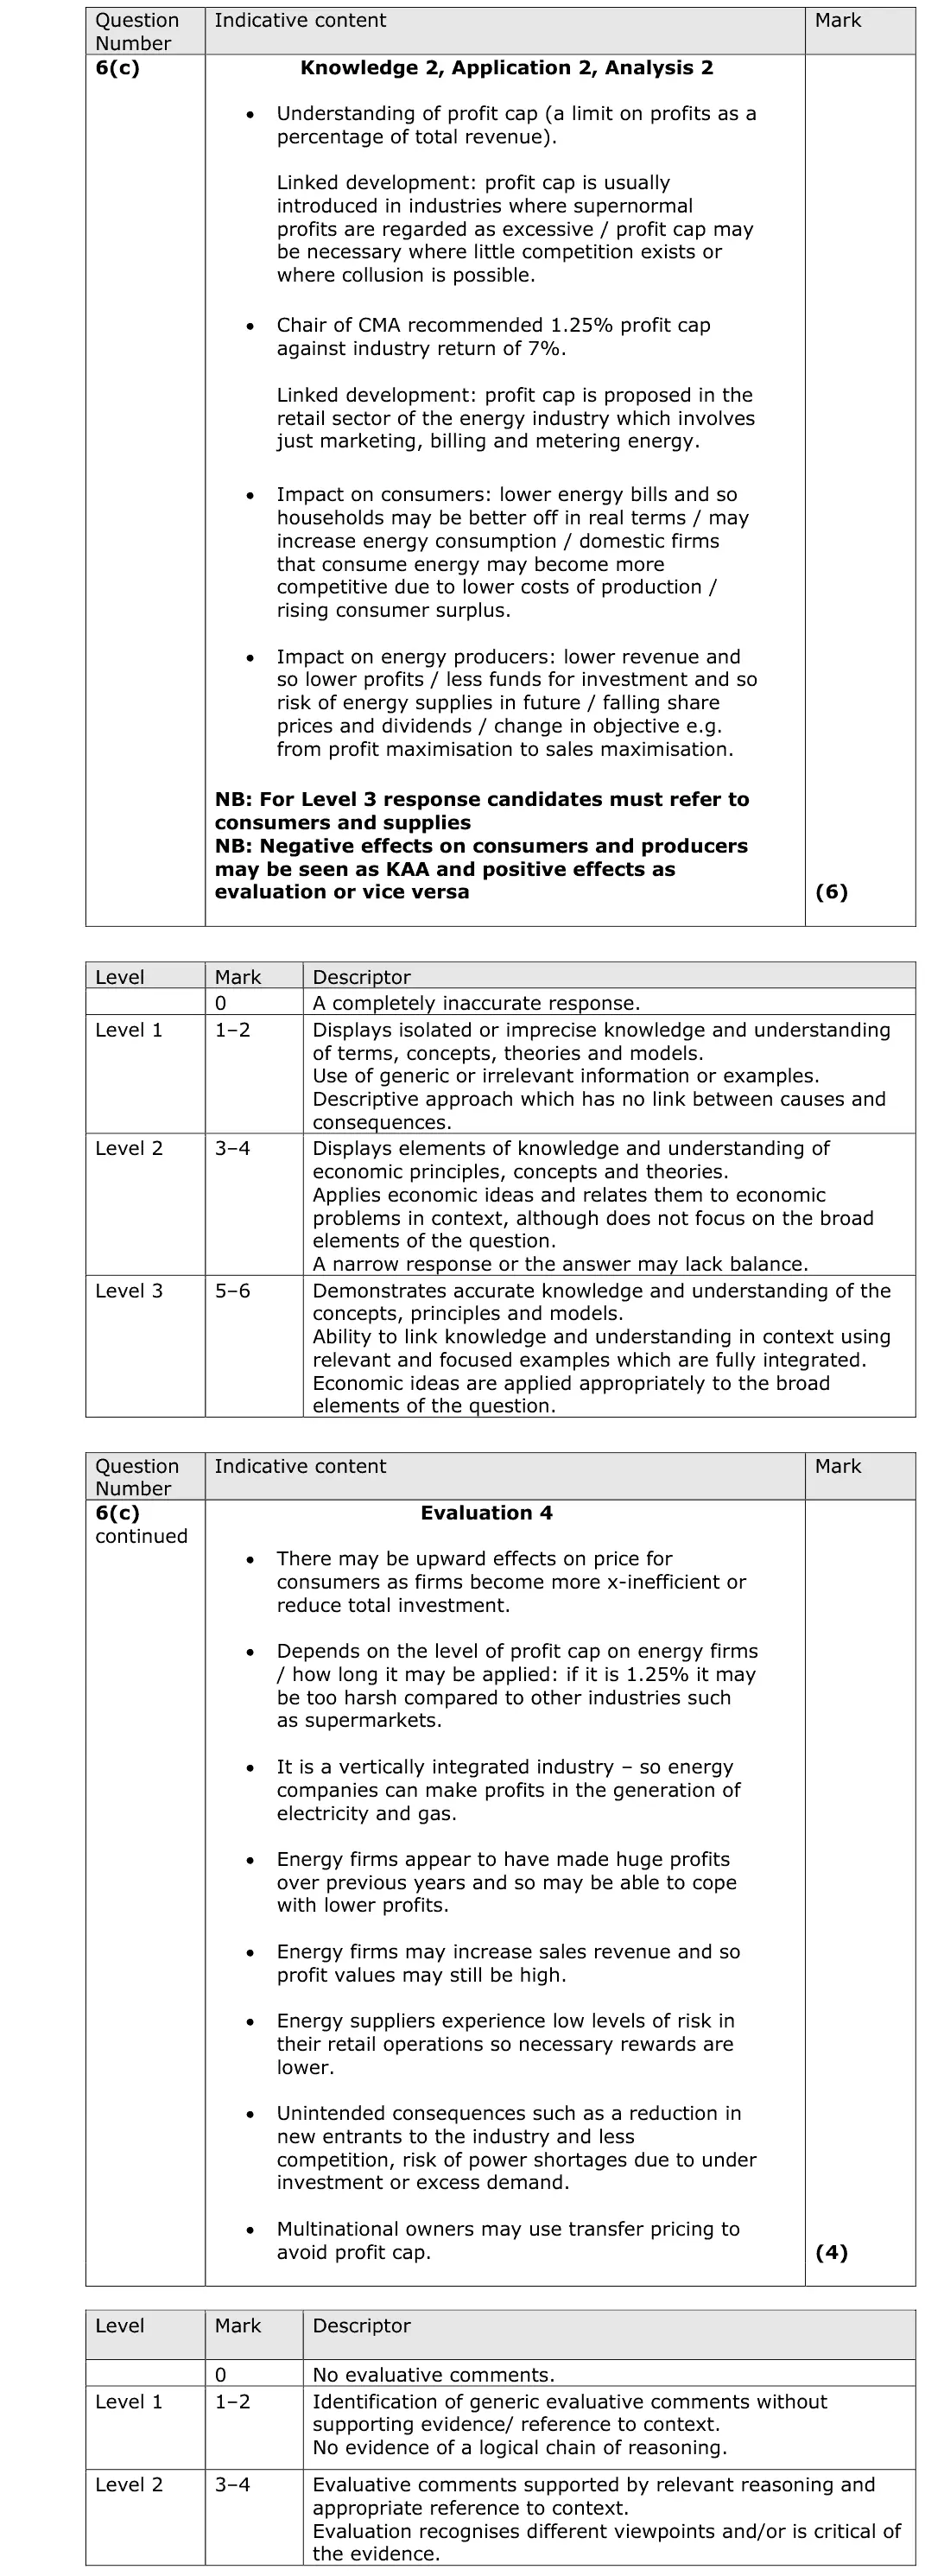
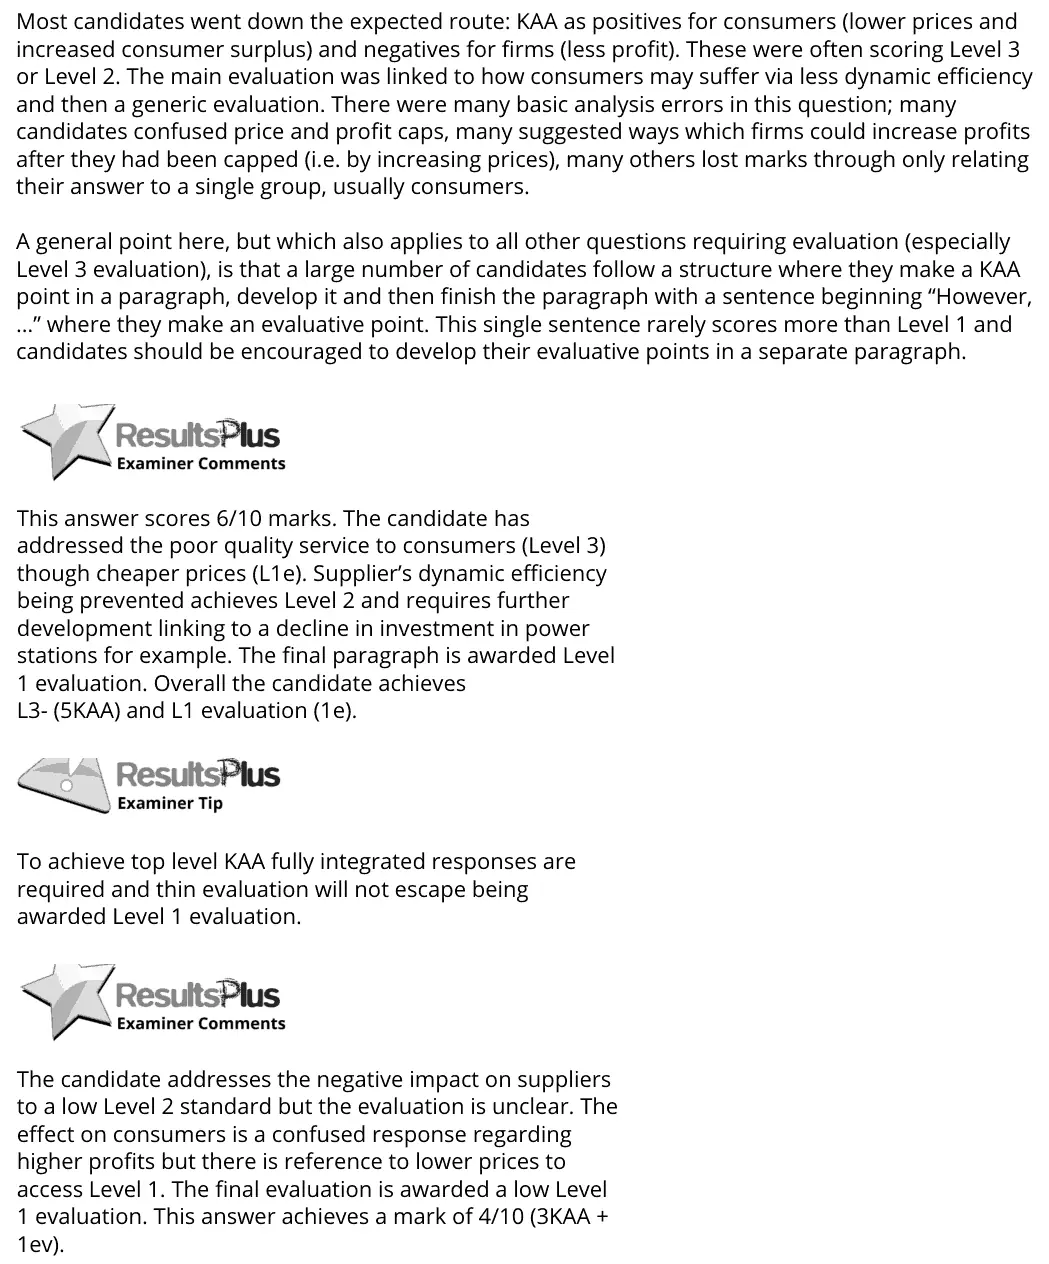
6(c) Government intervention: competition policy and regulation 10AO1=2,AO2=2,AO3=2,AO4=4Extended response
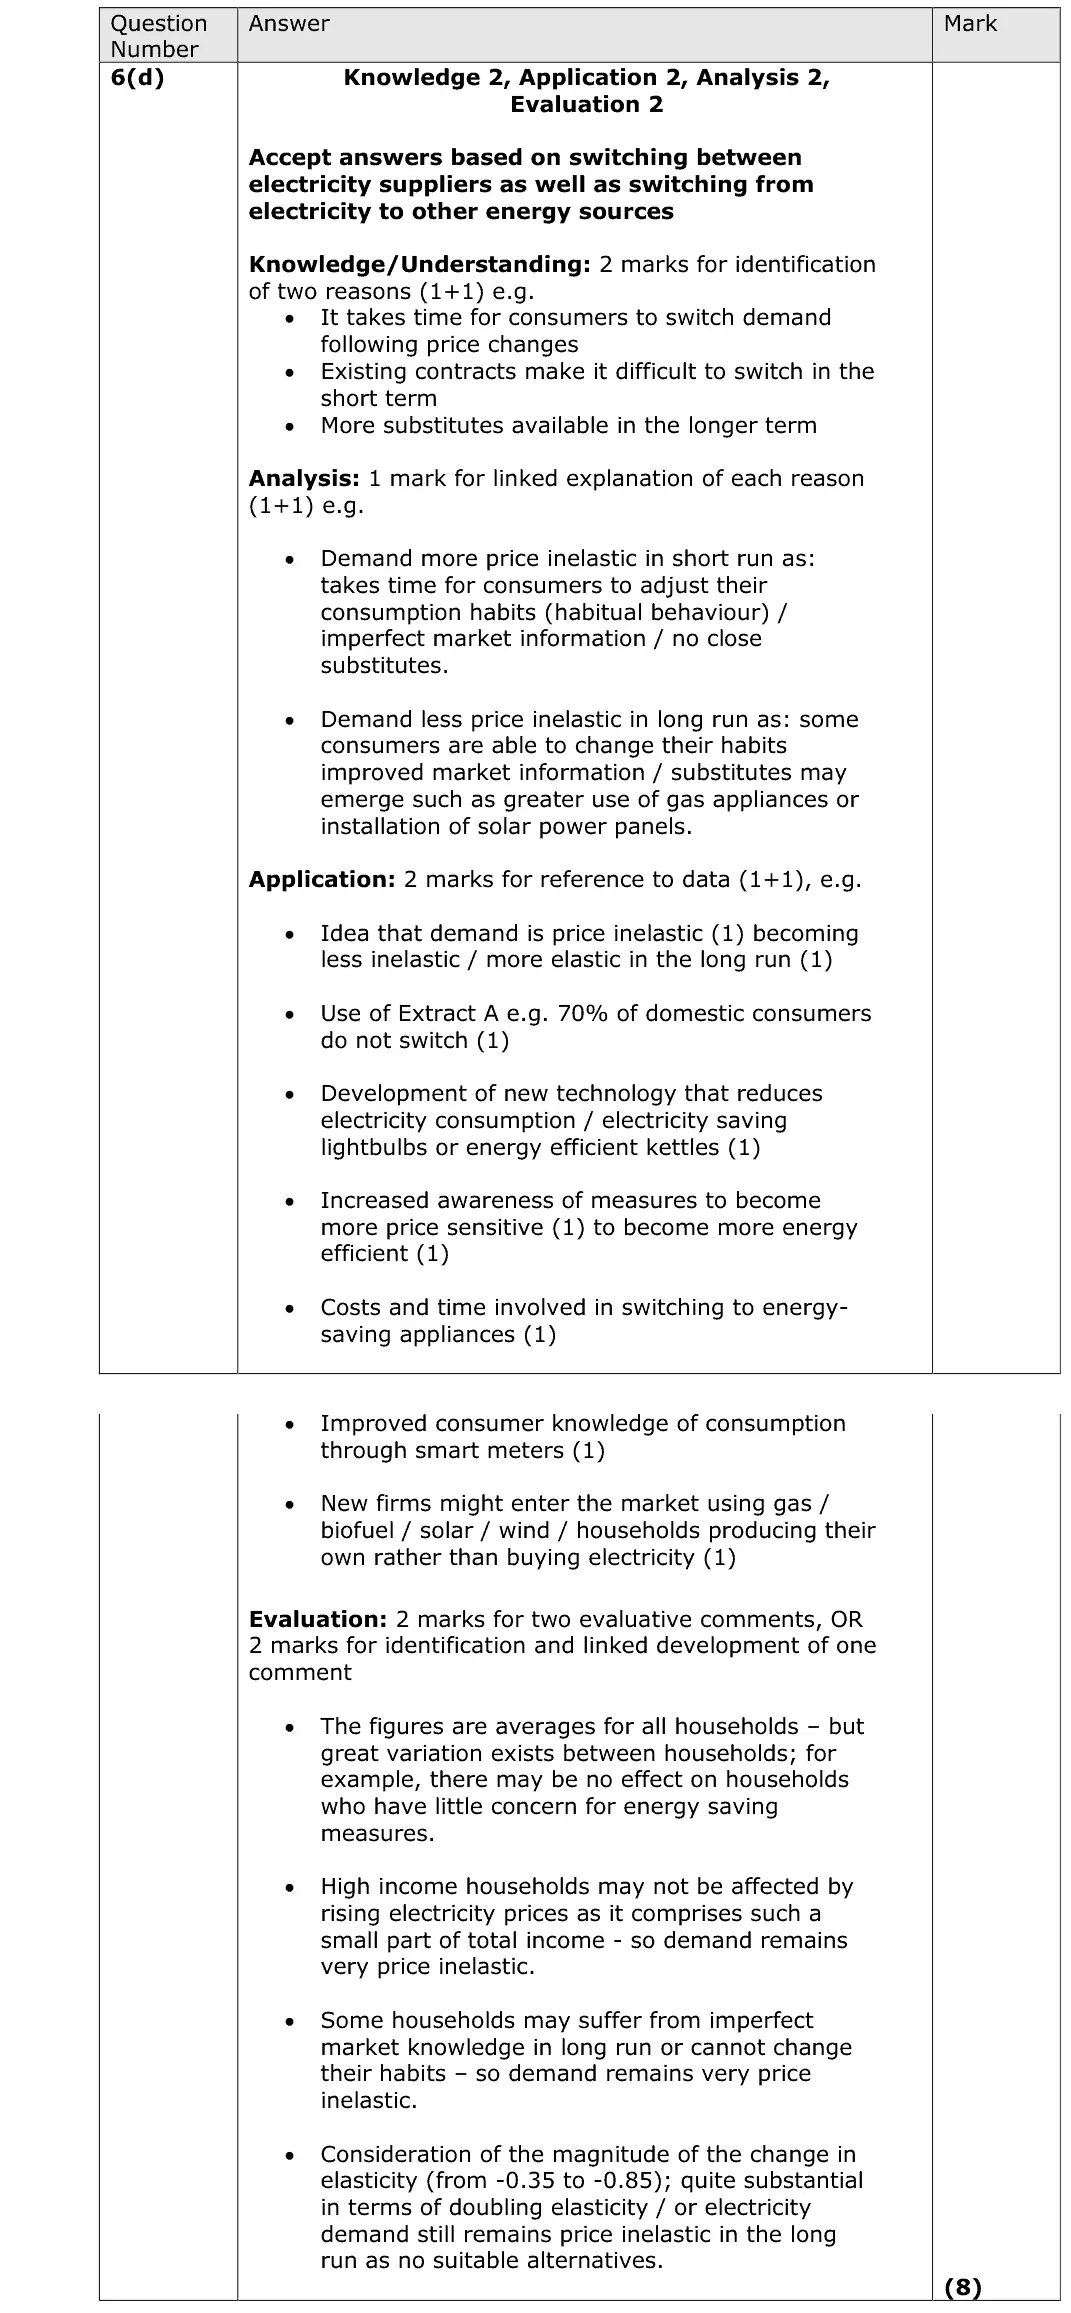
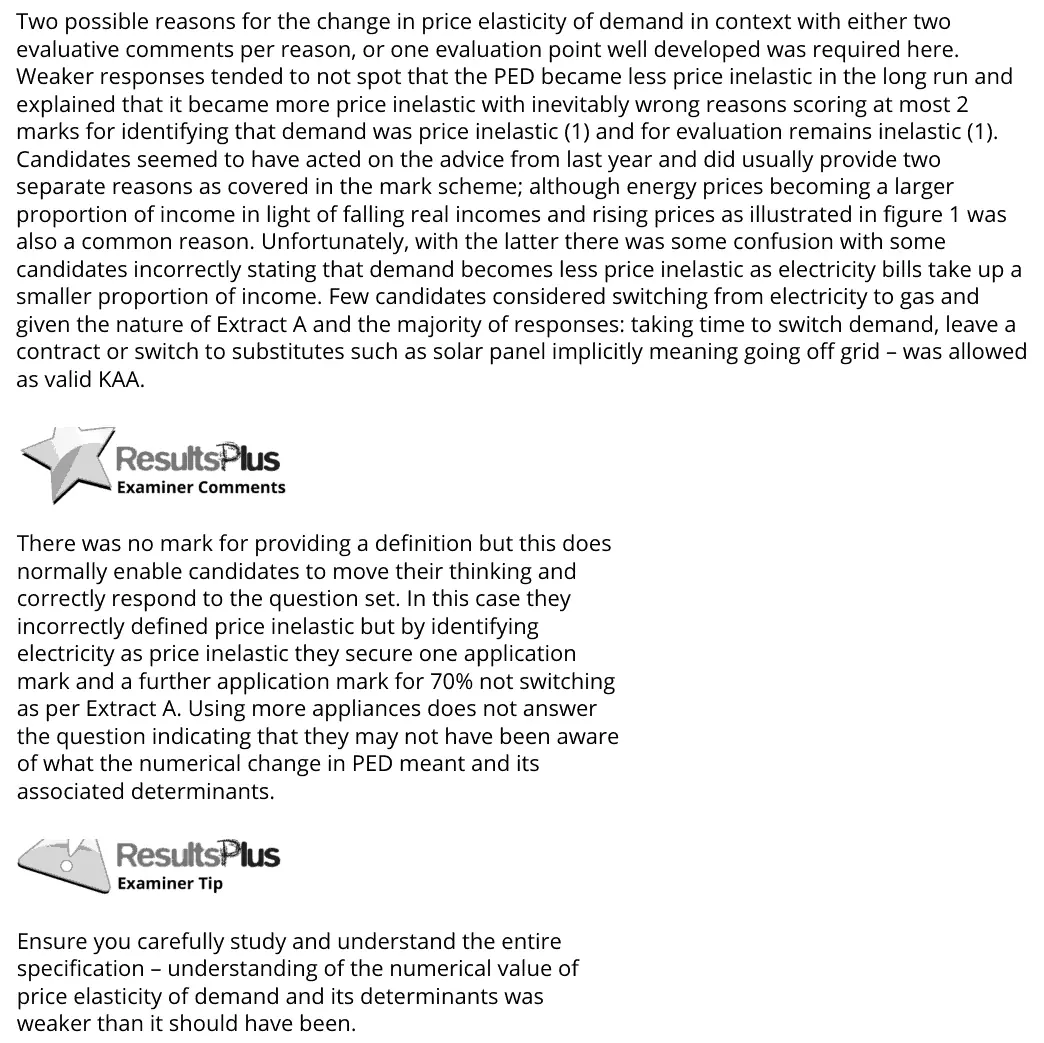
6(d) Price, income and cross elasticities of demand 8AO1=2,AO2=2,AO3=2,AO4=2Extended response
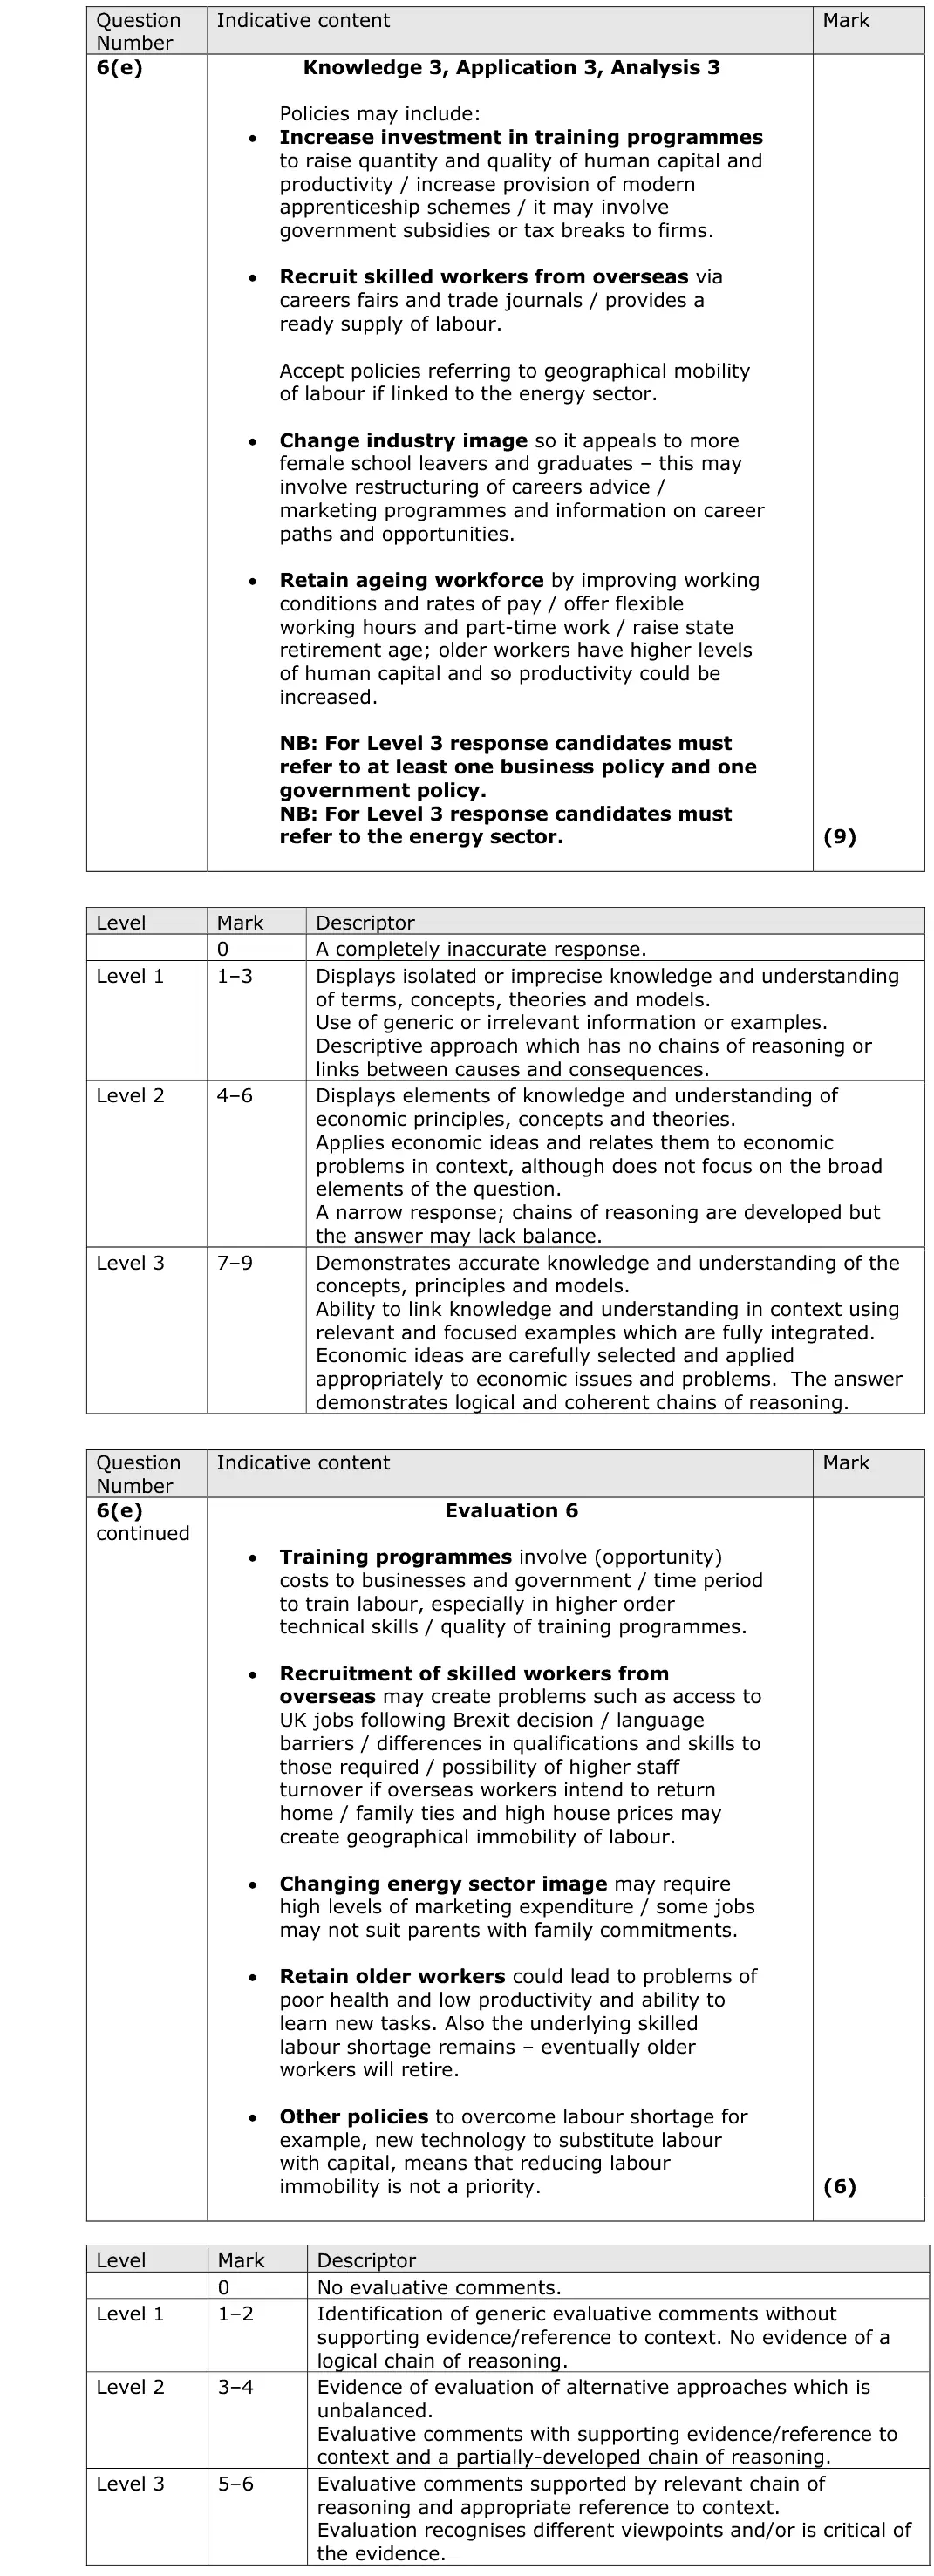
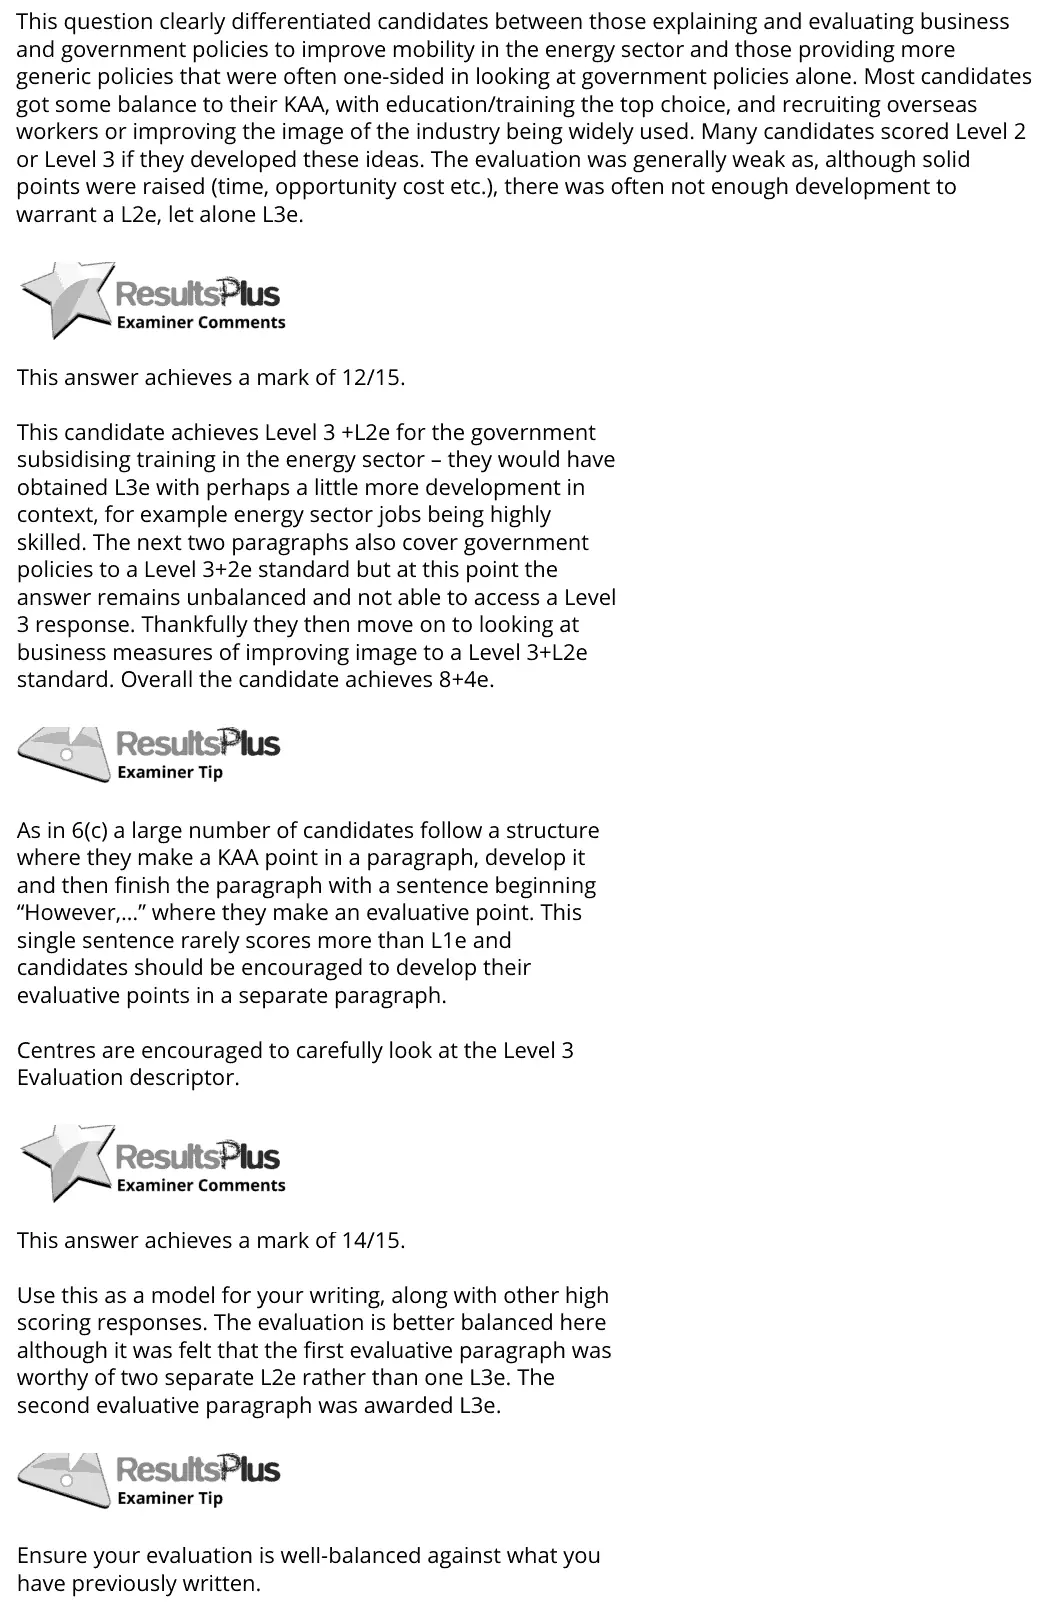
6(e) The labour market 15AO1=3,AO2=3,AO3=3,AO4=6Extended response
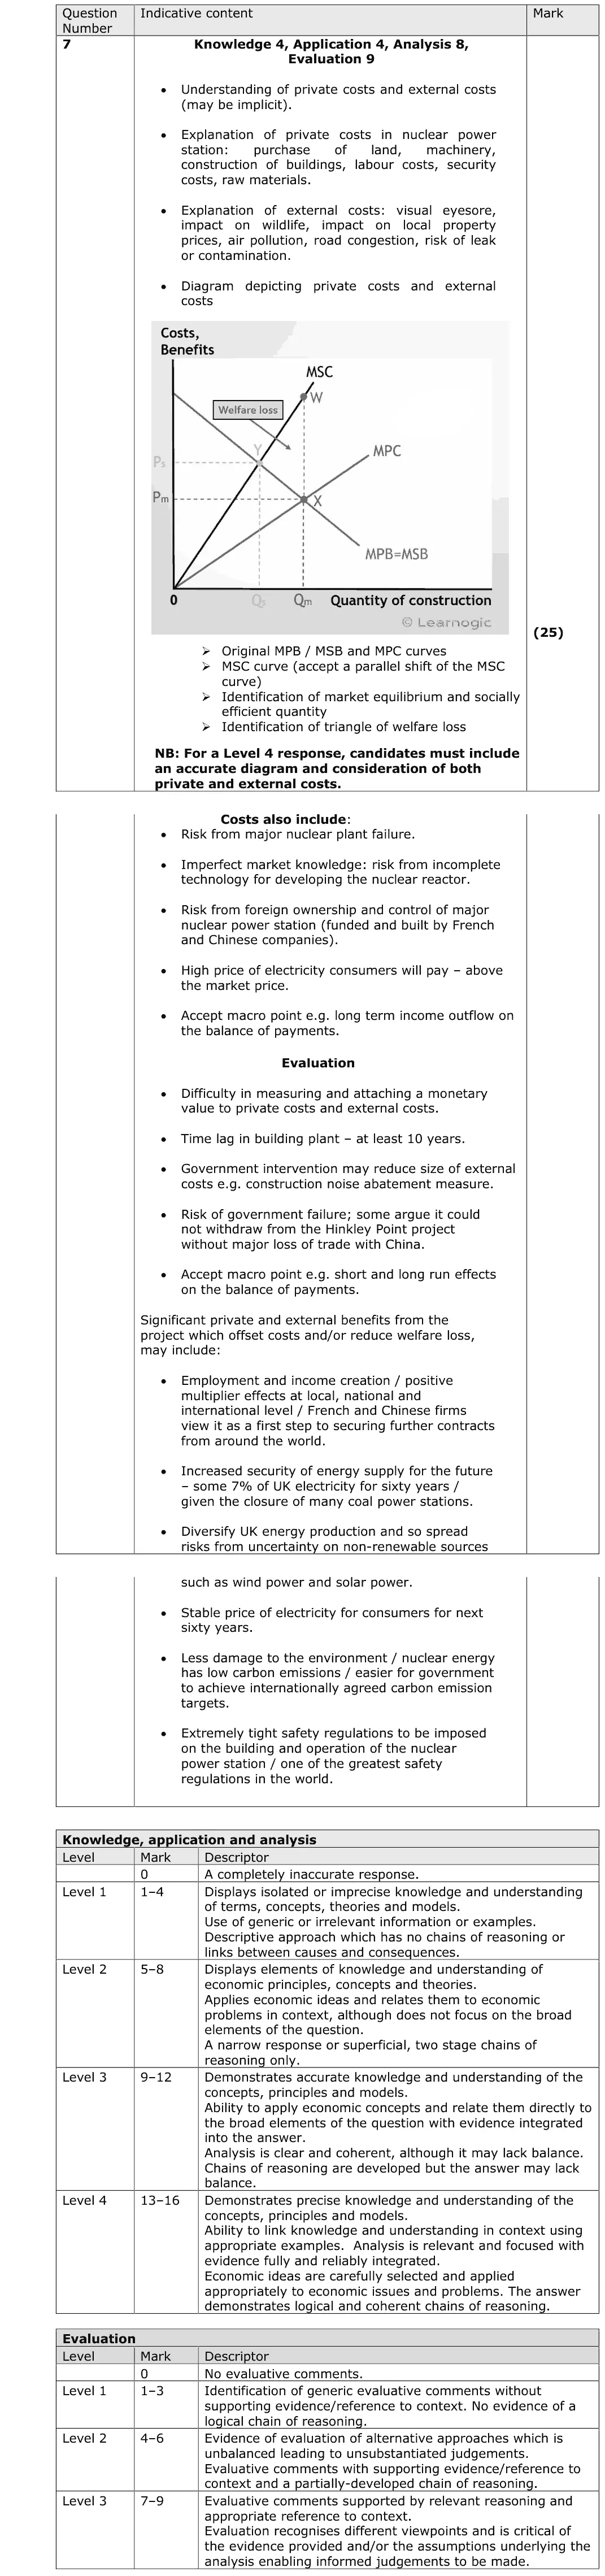
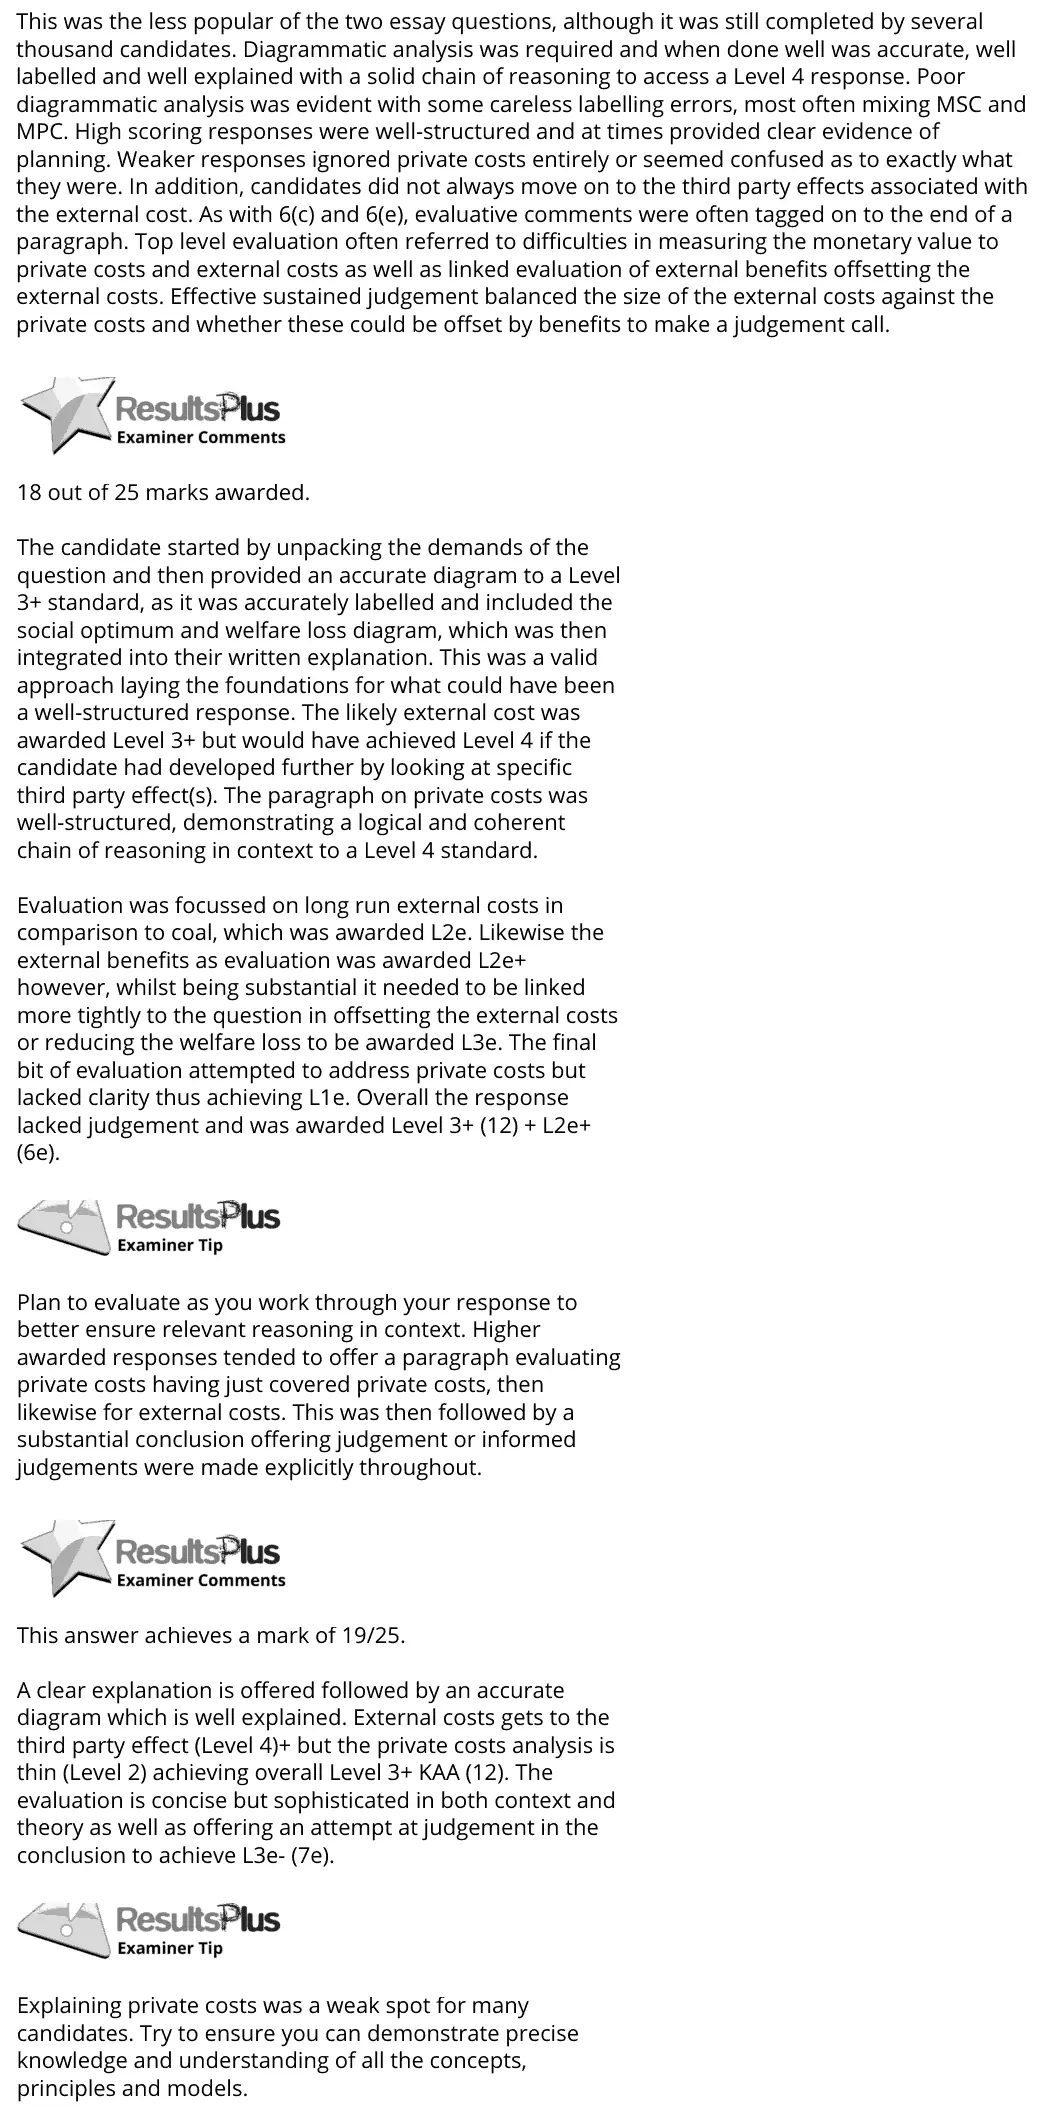
7 Market failure and externalities 25AO1=4,AO2=4,AO3=8,AO4=9Essay
8 Monopoly 25AO1=4,AO2=4,AO3=8,AO4=9Essay

The questions

1(a)1(b)1(c)2(a)2(b)2(c)3(a)3(b)3(c)4(a)4(b)5(a)5(b)5(c)6(a)6(b)6(c)6(d)6(e)78
June 2018 · Paper 1 · Q1(a) 2 marks AO2=2 Calculation production possibility frontiers
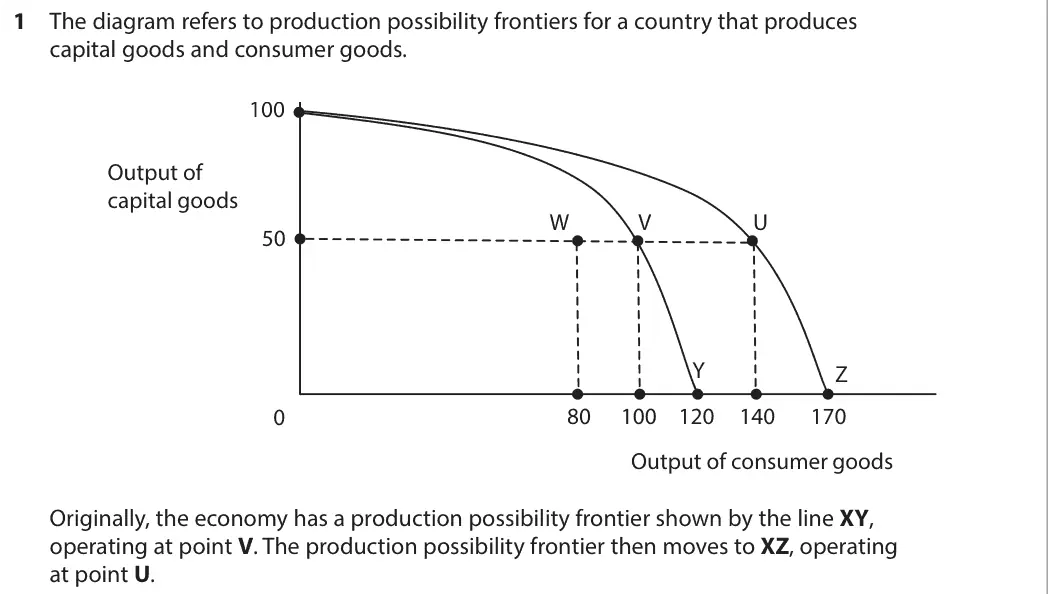
Data and extracts for question 11 The diagram refers to production possibility frontiers for a country that produces capital goods and consumer goods. X 100 Output of capital goods W V U 50 Y Z 0 80 100 120 140 170 Output of consumer goods Originally, the economy has a production possibility frontier shown by the line XY, operating at point V. The production possibility frontier then moves to XZ, operating at point U.
(a) Calculate the original and the new opportunity cost of producing 50 capital goods. You are advised to show your working. (2)
June 2018 · Paper 1 · Q1(b) 1 mark Multiple choice production possibility frontiers
Data and extracts for question 11 The diagram refers to production possibility frontiers for a country that produces capital goods and consumer goods. X 100 Output of capital goods W V U 50 Y Z 0 80 100 120 140 170 Output of consumer goods Originally, the economy has a production possibility frontier shown by the line XY, operating at point V. The production possibility frontier then moves to XZ, operating at point U.
(b) Which one of the following was the most likely cause of the movement in the production possibility frontier from XY to XZ? (1) A A reduction in unemployment in consumer goods industries B A rise in the cost of producing consumer goods C An increase in demand for consumer goods D A technological improvement in the production of consumer goods
June 2018 · Paper 1 · Q1(c) 2 marks AO1=1, AO3=1 Short answer production possibility frontiers
Data and extracts for question 11 The diagram refers to production possibility frontiers for a country that produces capital goods and consumer goods. X 100 Output of capital goods W V U 50 Y Z 0 80 100 120 140 170 Output of consumer goods Originally, the economy has a production possibility frontier shown by the line XY, operating at point V. The production possibility frontier then moves to XZ, operating at point U.
(c) Explain one characteristic of the economy at position W. (2)
June 2018 · Paper 1 · Q2(a) 2 marks AO2=2 Calculation indirect taxes and subsidies
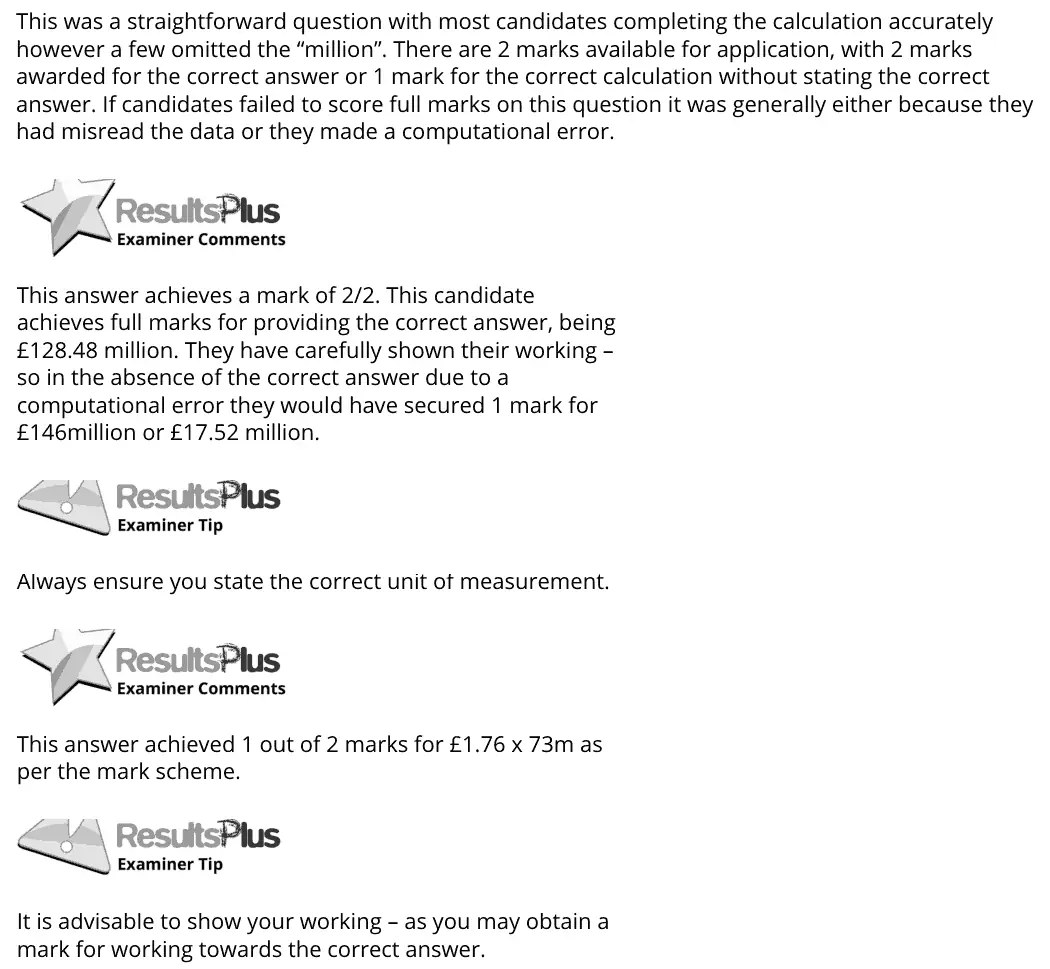
Data and extracts for question 22 The number of individual weekly ticket sales from UK National Lottery games operated by Camelot was 73 million in the financial year 2015–2016. The sale price of each lottery ticket was £2. This figure included 24 pence of tax revenue on each ticket sold.
(a) Calculate the weekly revenue received by Camelot after paying the tax to the government. You are advised to show your working. (2)
June 2018 · Paper 1 · Q2(b) 2 marks AO1=1, AO3=1 Short answer price elasticity of demand
Data and extracts for question 22 The number of individual weekly ticket sales from UK National Lottery games operated by Camelot was 73 million in the financial year 2015–2016. The sale price of each lottery ticket was £2. This figure included 24 pence of tax revenue on each ticket sold.
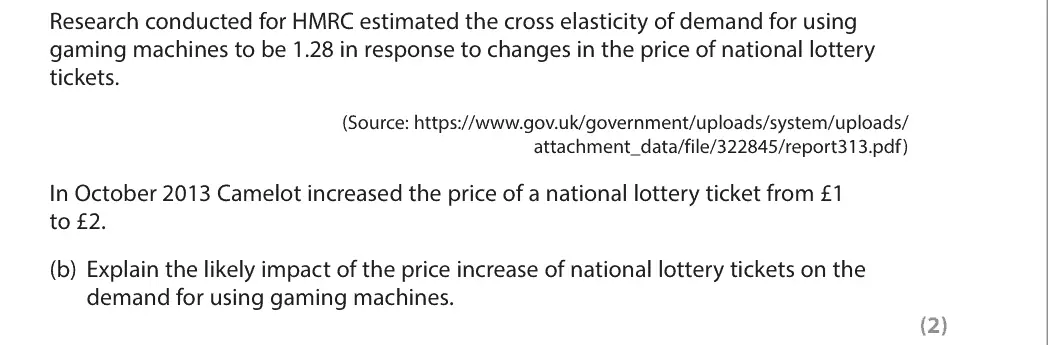
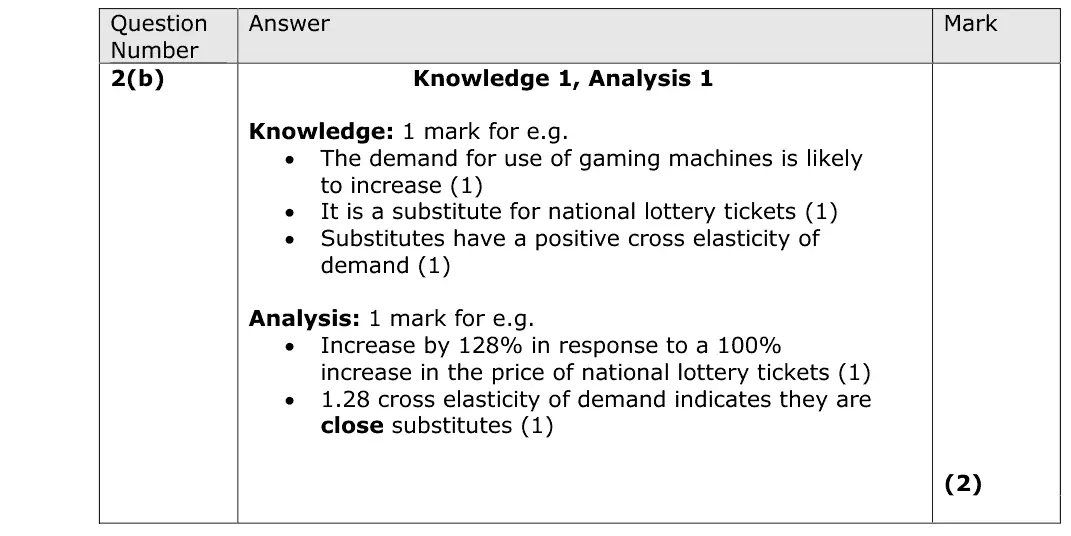
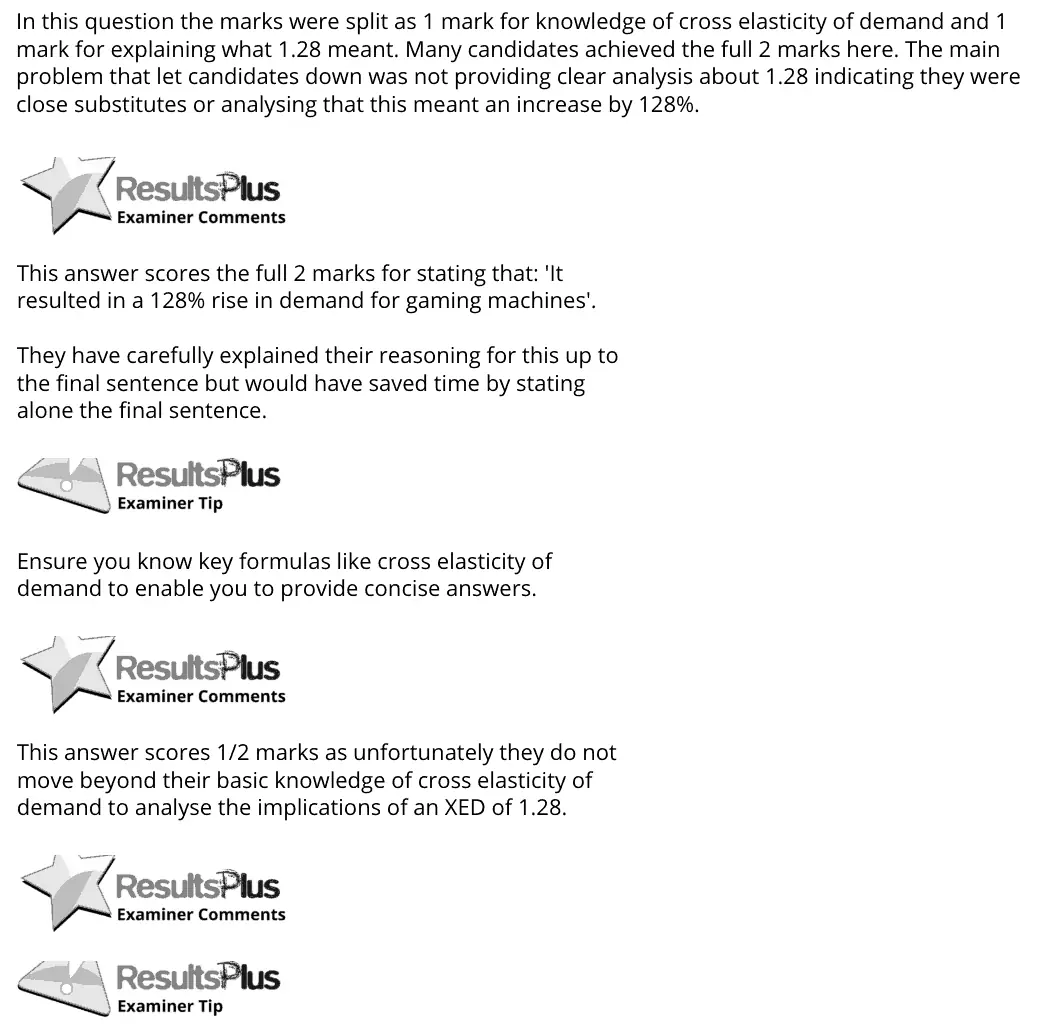
Research conducted for HMRC estimated the cross elasticity of demand for using gaming machines to be 1.28 in response to changes in the price of national lottery tickets. (Source: https://www.gov.uk/government/uploads/system/uploads/ attachment_data/file/322845/report313.pdf) In October 2013 Camelot increased the price of a national lottery ticket from £1 to £2. (b) Explain the likely impact of the price increase of national lottery tickets on the demand for using gaming machines. (2)
June 2018 · Paper 1 · Q2(c) 1 mark Multiple choice public goods and information gaps
Data and extracts for question 22 The number of individual weekly ticket sales from UK National Lottery games operated by Camelot was 73 million in the financial year 2015–2016. The sale price of each lottery ticket was £2. This figure included 24 pence of tax revenue on each ticket sold.
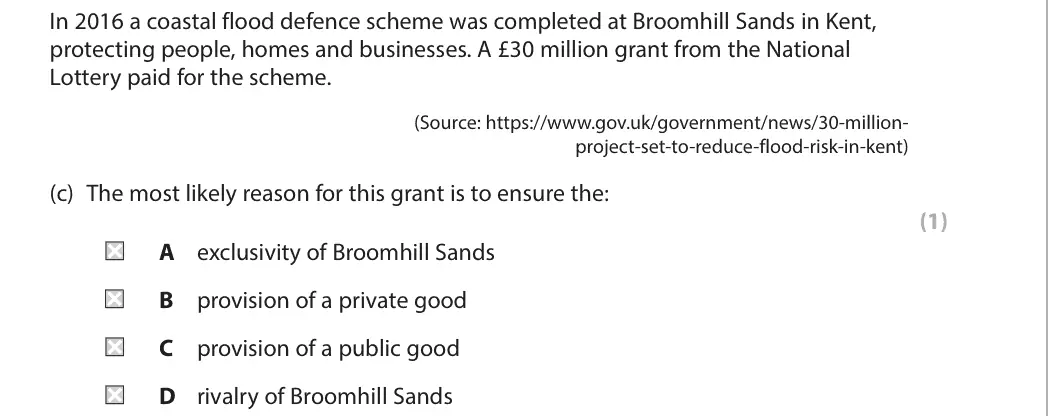
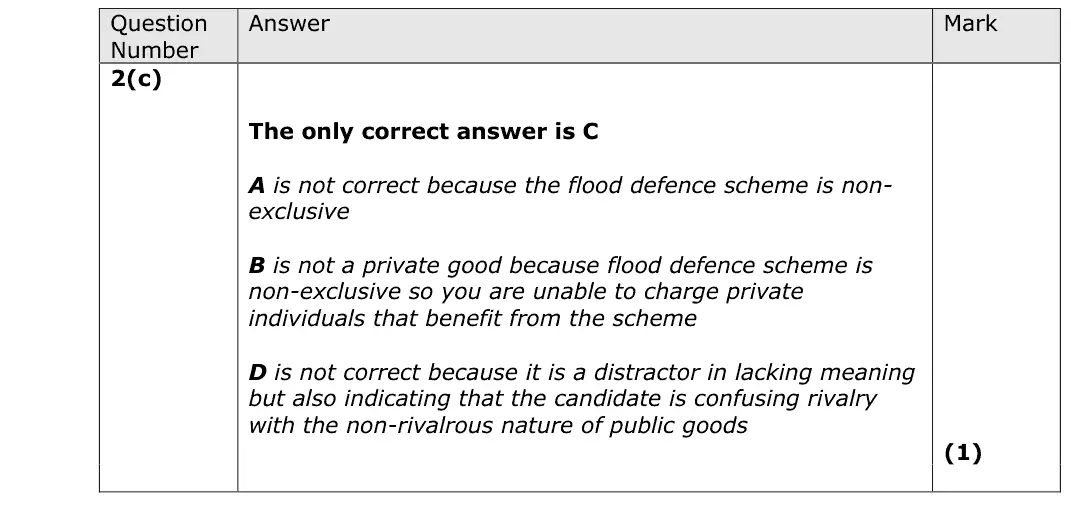
In 2016 a coastal flood defence scheme was completed at Broomhill Sands in Kent, protecting people, homes and businesses. A £30 million grant from the National Lottery paid for the scheme. (Source: https://www.gov.uk/government/news/30-million- project-set-to-reduce-flood-risk-in-kent) (c) The most likely reason for this grant is to ensure the: (1) A exclusivity of Broomhill Sands B provision of a private good C provision of a public good D rivalry of Broomhill Sands
June 2018 · Paper 1 · Q3(a) 2 marks AO2=2 Calculation revenues costs and profits
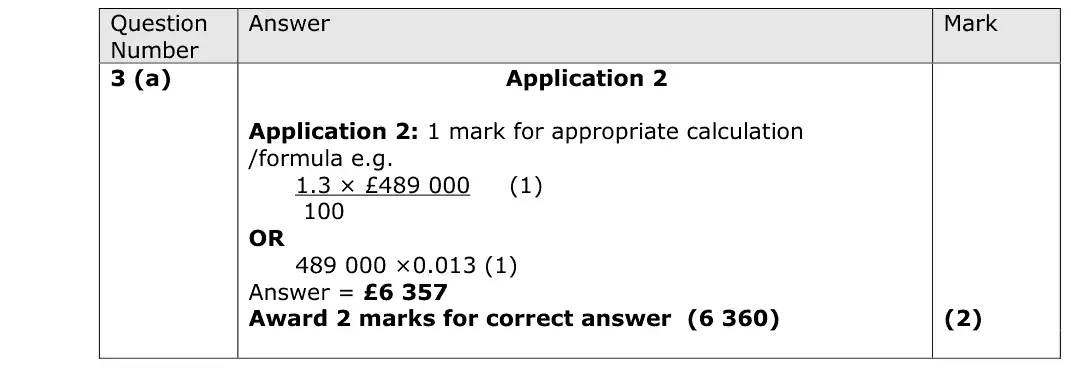
Data and extracts for question 33 The average fee charged by high-street estate agents to homeowners for selling property is 1.3% of the final sale price. (Source: http://www.which.co.uk/money/mortgages-and-property/home- movers/guides/selling-a-house/estate-agent-fees-and-contracts)
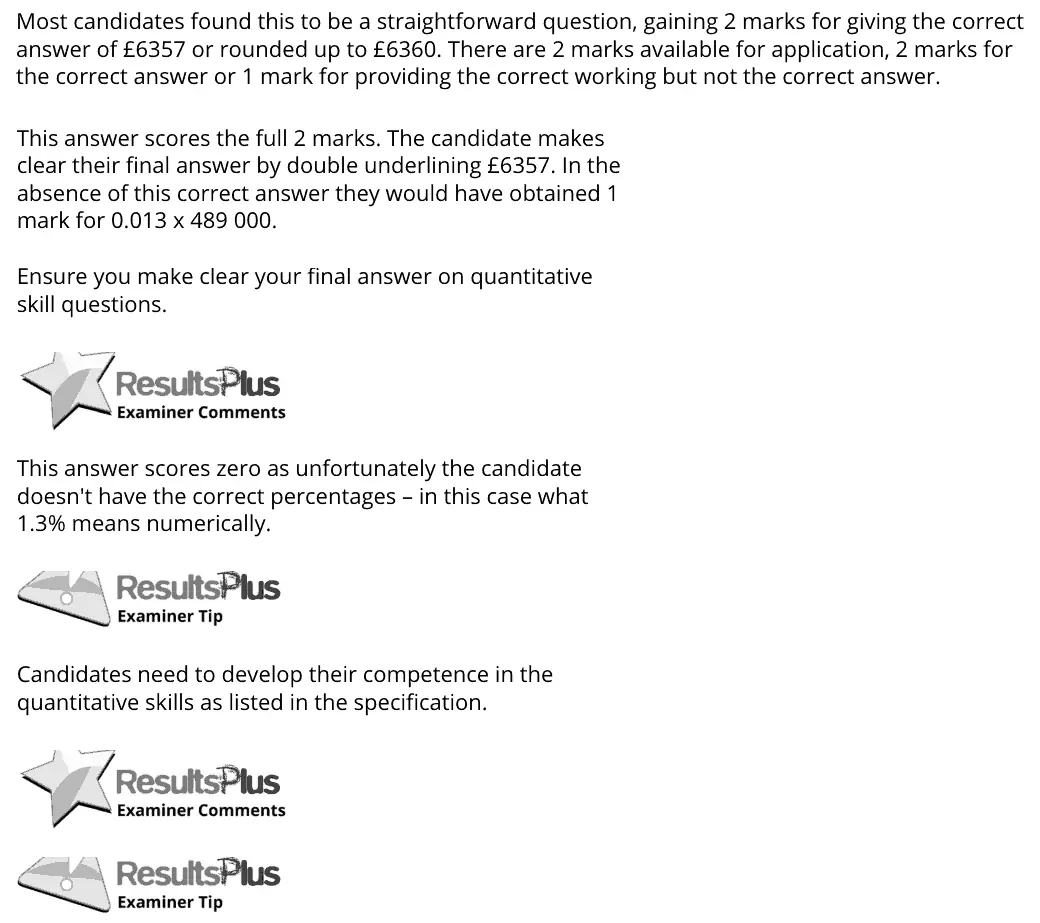
(a) Assume the selling fee is 1.3%. Calculate the payment received by an estate agent on a property sold for £489 000. You are advised to show your working. (2)
June 2018 · Paper 1 · Q3(b) 1 mark Multiple choice supply and demand
Data and extracts for question 33 The average fee charged by high-street estate agents to homeowners for selling property is 1.3% of the final sale price. (Source: http://www.which.co.uk/money/mortgages-and-property/home- movers/guides/selling-a-house/estate-agent-fees-and-contracts)
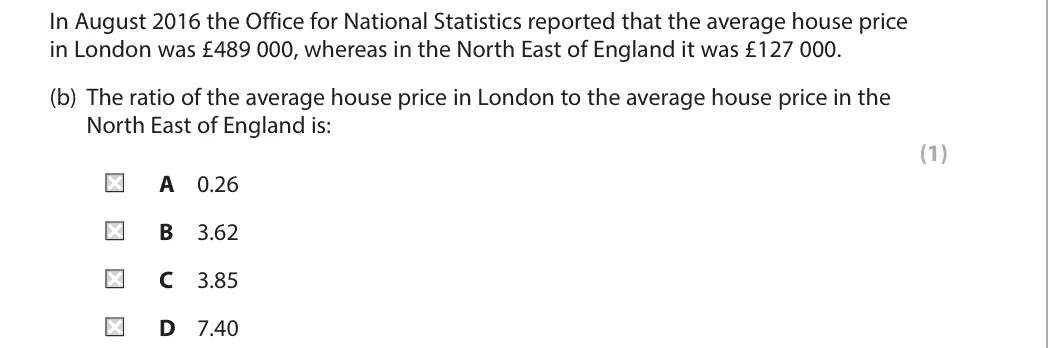
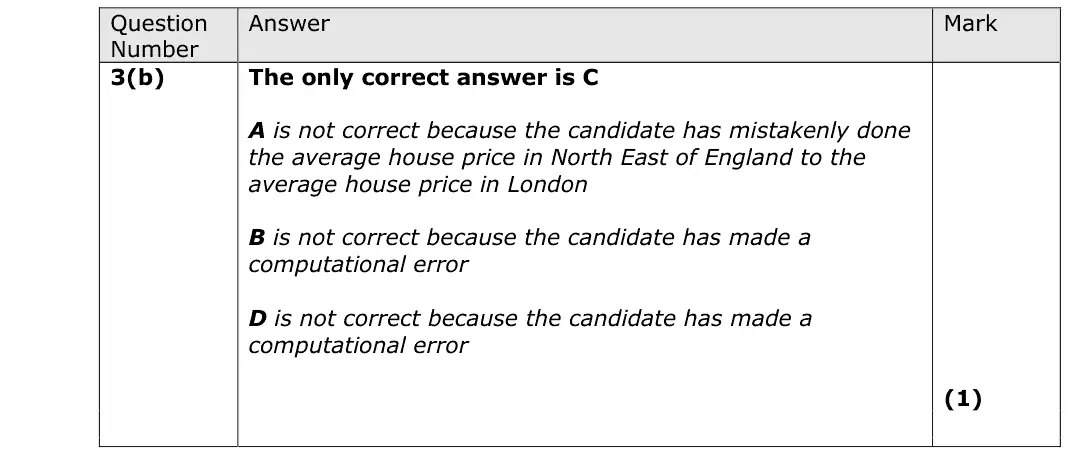
In August 2016 the Office for National Statistics reported that the average house price in London was £489 000, whereas in the North East of England it was £127 000. (b) The ratio of the average house price in London to the average house price in the North East of England is: (1) A 0.26 B 3.62 C 3.85 D 7.40
June 2018 · Paper 1 · Q3(c) 2 marks AO1=1, AO3=1 Short answer supply and demand
Data and extracts for question 33 The average fee charged by high-street estate agents to homeowners for selling property is 1.3% of the final sale price. (Source: http://www.which.co.uk/money/mortgages-and-property/home- movers/guides/selling-a-house/estate-agent-fees-and-contracts)
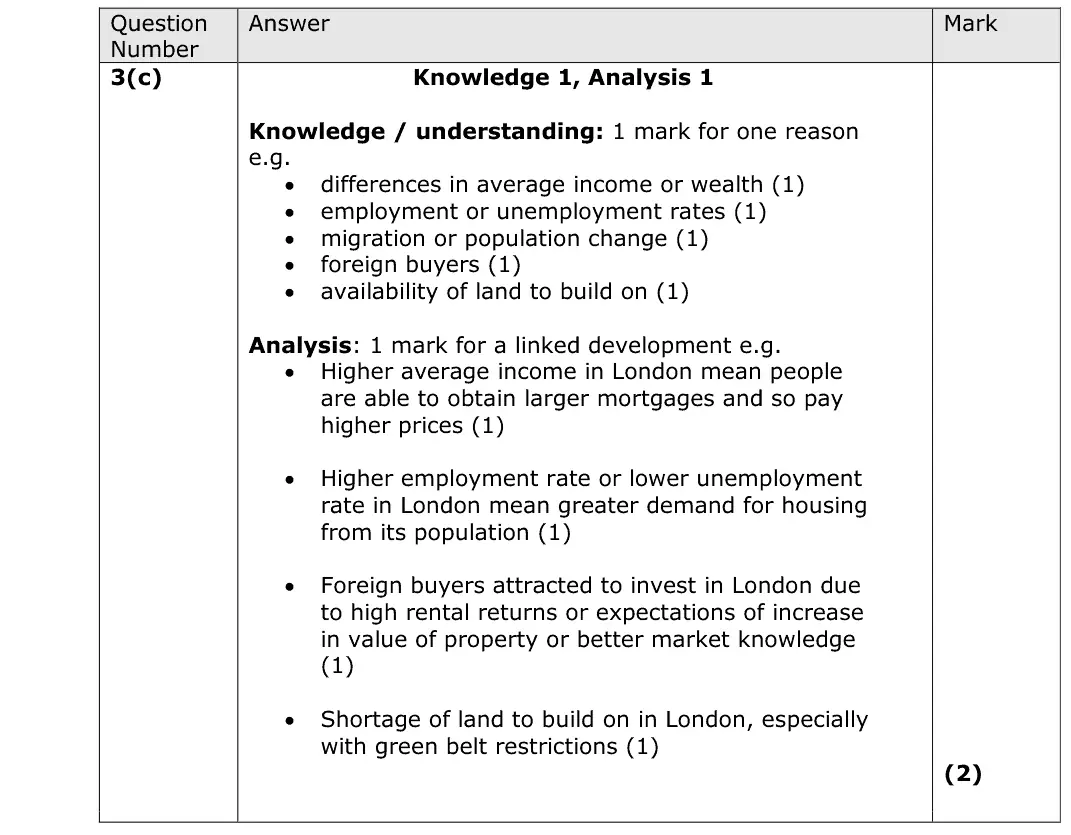
(c) Explain one likely reason for the difference in average house prices between London and the North East of England. (2)
June 2018 · Paper 1 · Q4(a) 4 marks AO1=2, AO2=2 Calculation business growth and objectivesrevenues costs and profits
Data and extracts for question 44 Emily owns and operates a nail ink salon. The diagram shows the cost and revenue curves for treatments at her nail ink salon. Initially, Emily sets her price to maximise profits. Costs, Revenue per treatment (£) MC AC 17 12 9 8 AR 0 25 36 Quantity of treatments MR per day
(a) Calculate the change in total supernormal profit if Emily changes her objective from profit maximisation to revenue maximisation. You are advised to show your working. (4)
June 2018 · Paper 1 · Q4(b) 1 mark Multiple choice business growth and objectives
Data and extracts for question 44 Emily owns and operates a nail ink salon. The diagram shows the cost and revenue curves for treatments at her nail ink salon. Initially, Emily sets her price to maximise profits. Costs, Revenue per treatment (£) MC AC 17 12 9 8 AR 0 25 36 Quantity of treatments MR per day
(b) Emily now decides to change her objective from revenue maximisation to sales maximisation. This change will lead to: (1) A a decrease in the number of customers B a decrease in the price of treatments C an increase in productive efficiency D an increase in the level of profit
June 2018 · Paper 1 · Q5(a) 1 mark Multiple choice supply and demand
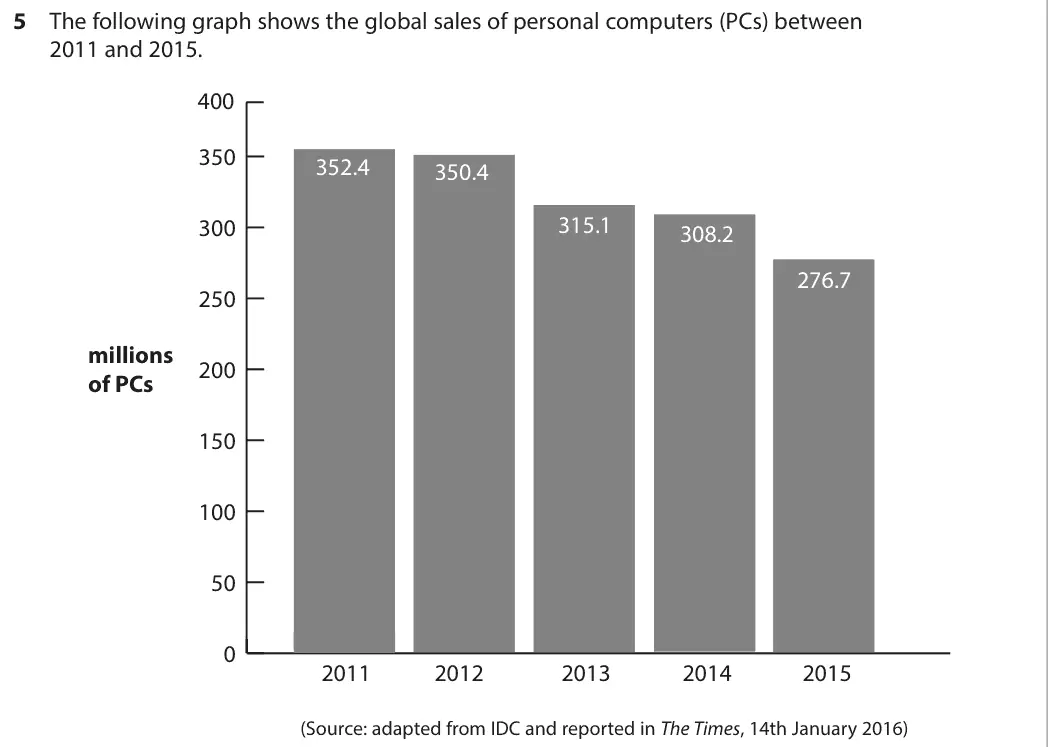
Data and extracts for question 55 The following graph shows the global sales of personal computers (PCs) between 2011 and 2015. 400 350 352.4 350.4 315.1 300 308.2 276.7 250 millions 200 of PCs 150 100 50 0 2011 2012 2013 2014 2015 (Source: adapted from IDC and reported in The Times, 14th January 2016)
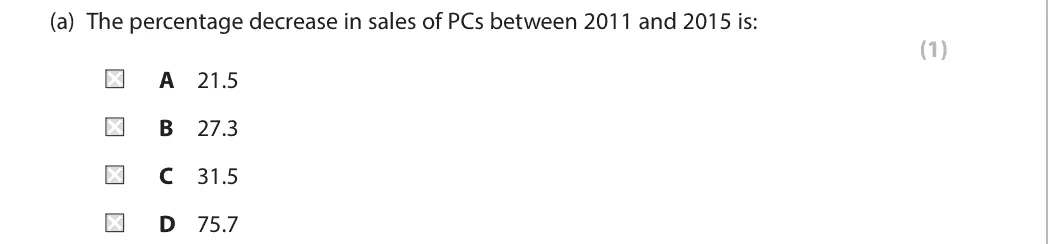
(a) The percentage decrease in sales of PCs between 2011 and 2015 is: (1) A 21.5 B 27.3 C 31.5 D 75.7
June 2018 · Paper 1 · Q5(b) 2 marks AO1=1, AO3=1 Short answer supply and demand
Data and extracts for question 55 The following graph shows the global sales of personal computers (PCs) between 2011 and 2015. 400 350 352.4 350.4 315.1 300 308.2 276.7 250 millions 200 of PCs 150 100 50 0 2011 2012 2013 2014 2015 (Source: adapted from IDC and reported in The Times, 14th January 2016)
(b) Explain one likely reason for the decrease in sales of PCs. (2)
June 2018 · Paper 1 · Q5(c) 2 marks AO2=2 Calculation oligopoly
Data and extracts for question 55 The following graph shows the global sales of personal computers (PCs) between 2011 and 2015. 400 350 352.4 350.4 315.1 300 308.2 276.7 250 millions 200 of PCs 150 100 50 0 2011 2012 2013 2014 2015 (Source: adapted from IDC and reported in The Times, 14th January 2016)
The following table shows global sales of PCs by company in 2015. Sales of PCs Company (million) Lenovo 57 182 HP 53 534 Dell 39 049 Apple 20 794 Acer Group 19 680 Others 86 461 Total 276 700 (Source: IDC, reported in The Times, 14th January 2016) (c) Calculate the five-firm concentration ratio. You are advised to show your working. (2)
June 2018 · Paper 1 · Q6(a) 5 marks AO1=1, AO2=1, AO3=3 Short answer supply and demand
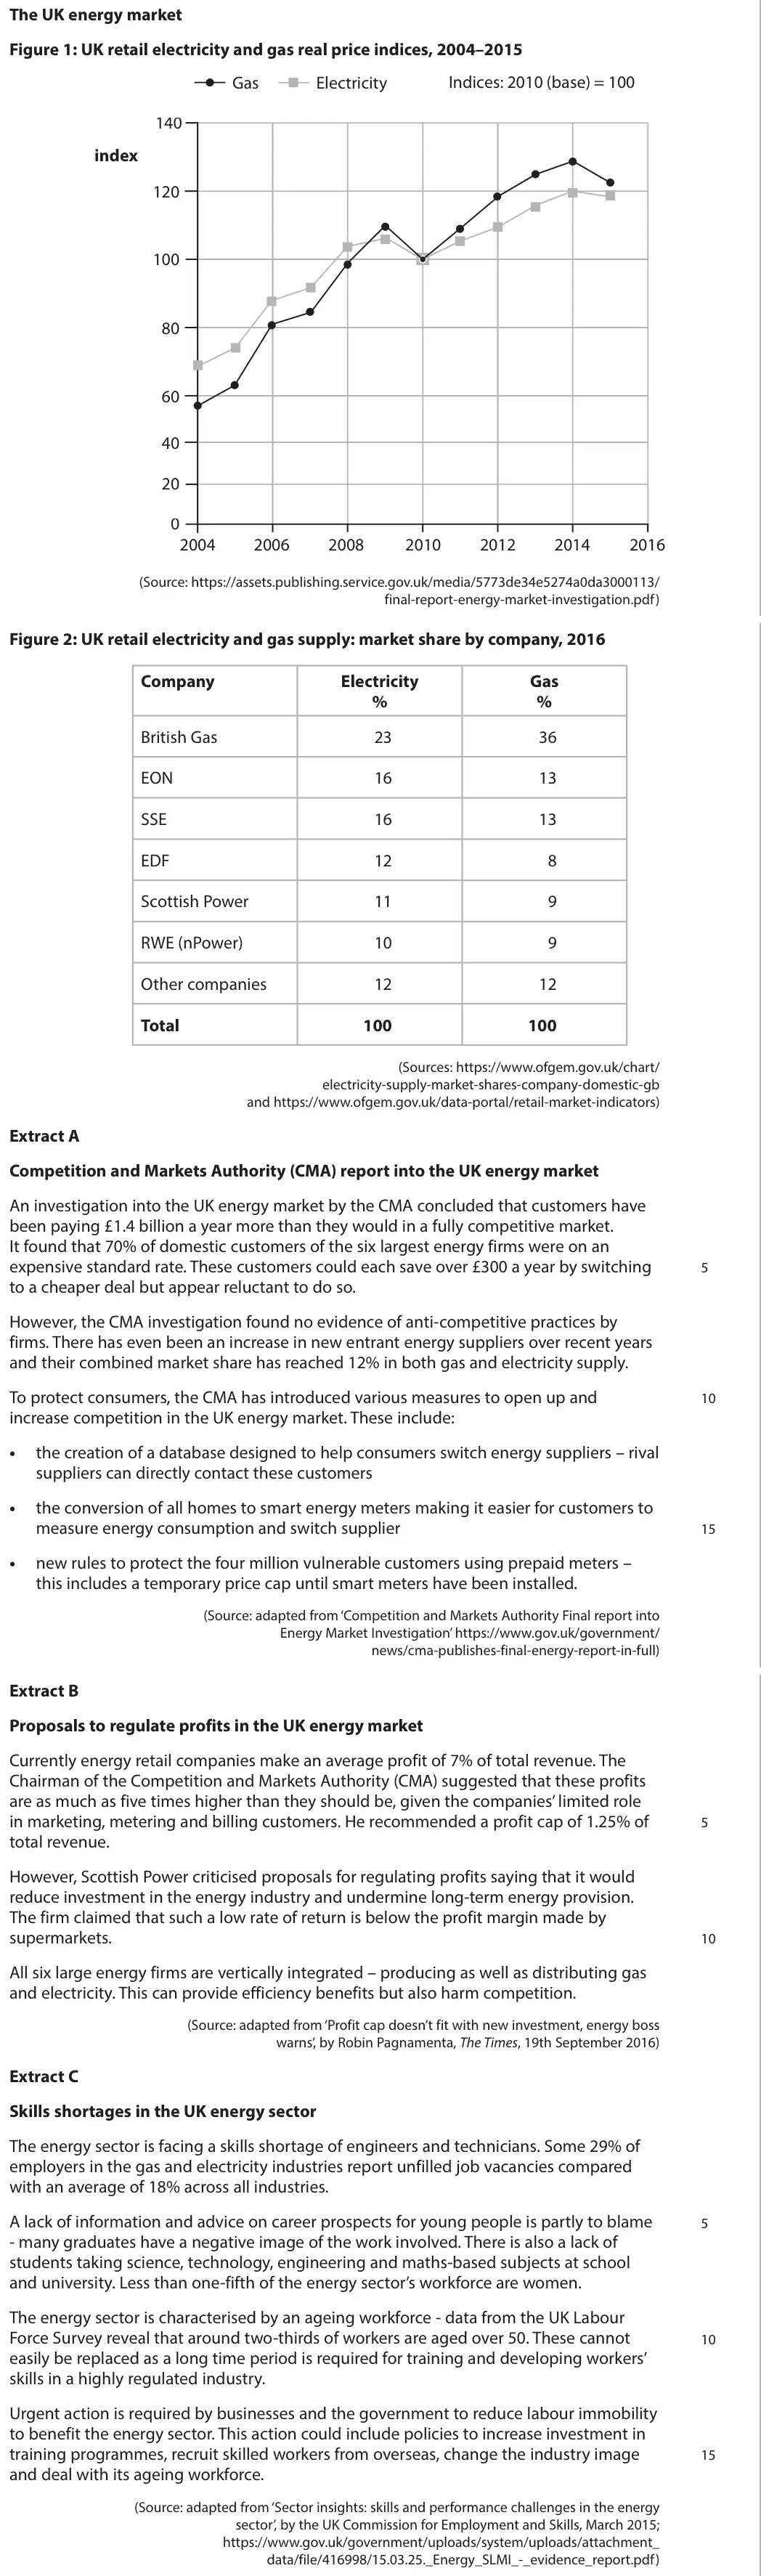
Data and extracts for question 6The UK energy market Figure 1: UK retail electricity and gas real price indices, 2004–2015 Gas Electricity Indices: 2010 (base) = 100 140 index 120 100 80 60 40 20 0 2004 2006 2008 2010 2012 2014 2016 (Source: https://assets.publishing.service.gov.uk/media/5773de34e5274a0da3000113/ final-report-energy-market-investigation.pdf) Figure 2: UK retail electricity and gas supply: market share by company, 2016 Company Electricity Gas % % British Gas 23 36 EON 16 13 SSE 16 13 EDF 12 8 Scottish Power 11 9 RWE (nPower) 10 9 Other companies 12 12 Total 100 100 (Sources: https://www.ofgem.gov.uk/chart/ electricity-supply-market-shares-company-domestic-gb and https://www.ofgem.gov.uk/data-portal/retail-market-indicators) Extract A Competition and Markets Authority (CMA) report into the UK energy market An investigation into the UK energy market by the CMA concluded that customers have been paying £1.4 billion a year more than they would in a fully competitive market. It found that 70% of domestic customers of the six largest energy firms were on an expensive standard rate. These customers could each save over £300 a year by switching 5 to a cheaper deal but appear reluctant to do so. However, the CMA investigation found no evidence of anti-competitive practices by firms. There has even been an increase in new entrant energy suppliers over recent years and their combined market share has reached 12% in both gas and electricity supply. To protect consumers, the CMA has introduced various measures to open up and 10 increase competition in the UK energy market. These include: • the creation of a database designed to help consumers switch energy suppliers – rival suppliers can directly contact these customers • the conversion of all homes to smart energy meters making it easier for customers to measure energy consumption and switch supplier 15 • new rules to protect the four million vulnerable customers using prepaid meters – this includes a temporary price cap until smart meters have been installed. (Source: adapted from ‘Competition and Markets Authority Final report into Energy Market Investigation’ https://www.gov.uk/government/ news/cma-publishes-final-energy-report-in-full) Extract B Proposals to regulate profits in the UK energy market Currently energy retail companies make an average profit of 7% of total revenue. The Chairman of the Competition and Markets Authority (CMA) suggested that these profits are as much as five times higher than they should be, given the companies’ limited role in marketing, metering and billing customers. He recommended a profit cap of 1.25% of 5 total revenue. However, Scottish Power criticised proposals for regulating profits saying that it would reduce investment in the energy industry and undermine long-term energy provision. The firm claimed that such a low rate of return is below the profit margin made by supermarkets. 10 All six large energy firms are vertically integrated – producing as well as distributing gas and electricity. This can provide efficiency benefits but also harm competition. (Source: adapted from ‘Profit cap doesn’t fit with new investment, energy boss warns’, by Robin Pagnamenta, The Times, 19th September 2016) Extract C Skills shortages in the UK energy sector The energy sector is facing a skills shortage of engineers and technicians. Some 29% of employers in the gas and electricity industries report unfilled job vacancies compared with an average of 18% across all industries. A lack of information and advice on career prospects for young people is partly to blame 5 - many graduates have a negative image of the work involved. There is also a lack of students taking science, technology, engineering and maths-based subjects at school and university. Less than one-fifth of the energy sector’s workforce are women. The energy sector is characterised by an ageing workforce - data from the UK Labour Force Survey reveal that around two-thirds of workers are aged over 50. These cannot 10 easily be replaced as a long time period is required for training and developing workers’ skills in a highly regulated industry. Urgent action is required by businesses and the government to reduce labour immobility to benefit the energy sector. This action could include policies to increase investment in training programmes, recruit skilled workers from overseas, change the industry image 15 and deal with its ageing workforce. (Source: adapted from ‘Sector insights: skills and performance challenges in the energy sector’, by the UK Commission for Employment and Skills, March 2015; https://www.gov.uk/government/uploads/system/uploads/attachment_ data/file/416998/15.03.25._Energy_SLMI_-_evidence_report.pdf)
(a) With reference to Figure 1, explain one likely reason for the overall trend in the real price of gas and electricity. (5)
June 2018 · Paper 1 · Q6(b) 12 marks AO1=2, AO2=2, AO3=4, AO4=4 12-mark response competition policy and regulationpublic goods and information gaps
Data and extracts for question 6The UK energy market Figure 1: UK retail electricity and gas real price indices, 2004–2015 Gas Electricity Indices: 2010 (base) = 100 140 index 120 100 80 60 40 20 0 2004 2006 2008 2010 2012 2014 2016 (Source: https://assets.publishing.service.gov.uk/media/5773de34e5274a0da3000113/ final-report-energy-market-investigation.pdf) Figure 2: UK retail electricity and gas supply: market share by company, 2016 Company Electricity Gas % % British Gas 23 36 EON 16 13 SSE 16 13 EDF 12 8 Scottish Power 11 9 RWE (nPower) 10 9 Other companies 12 12 Total 100 100 (Sources: https://www.ofgem.gov.uk/chart/ electricity-supply-market-shares-company-domestic-gb and https://www.ofgem.gov.uk/data-portal/retail-market-indicators) Extract A Competition and Markets Authority (CMA) report into the UK energy market An investigation into the UK energy market by the CMA concluded that customers have been paying £1.4 billion a year more than they would in a fully competitive market. It found that 70% of domestic customers of the six largest energy firms were on an expensive standard rate. These customers could each save over £300 a year by switching 5 to a cheaper deal but appear reluctant to do so. However, the CMA investigation found no evidence of anti-competitive practices by firms. There has even been an increase in new entrant energy suppliers over recent years and their combined market share has reached 12% in both gas and electricity supply. To protect consumers, the CMA has introduced various measures to open up and 10 increase competition in the UK energy market. These include: • the creation of a database designed to help consumers switch energy suppliers – rival suppliers can directly contact these customers • the conversion of all homes to smart energy meters making it easier for customers to measure energy consumption and switch supplier 15 • new rules to protect the four million vulnerable customers using prepaid meters – this includes a temporary price cap until smart meters have been installed. (Source: adapted from ‘Competition and Markets Authority Final report into Energy Market Investigation’ https://www.gov.uk/government/ news/cma-publishes-final-energy-report-in-full) Extract B Proposals to regulate profits in the UK energy market Currently energy retail companies make an average profit of 7% of total revenue. The Chairman of the Competition and Markets Authority (CMA) suggested that these profits are as much as five times higher than they should be, given the companies’ limited role in marketing, metering and billing customers. He recommended a profit cap of 1.25% of 5 total revenue. However, Scottish Power criticised proposals for regulating profits saying that it would reduce investment in the energy industry and undermine long-term energy provision. The firm claimed that such a low rate of return is below the profit margin made by supermarkets. 10 All six large energy firms are vertically integrated – producing as well as distributing gas and electricity. This can provide efficiency benefits but also harm competition. (Source: adapted from ‘Profit cap doesn’t fit with new investment, energy boss warns’, by Robin Pagnamenta, The Times, 19th September 2016) Extract C Skills shortages in the UK energy sector The energy sector is facing a skills shortage of engineers and technicians. Some 29% of employers in the gas and electricity industries report unfilled job vacancies compared with an average of 18% across all industries. A lack of information and advice on career prospects for young people is partly to blame 5 - many graduates have a negative image of the work involved. There is also a lack of students taking science, technology, engineering and maths-based subjects at school and university. Less than one-fifth of the energy sector’s workforce are women. The energy sector is characterised by an ageing workforce - data from the UK Labour Force Survey reveal that around two-thirds of workers are aged over 50. These cannot 10 easily be replaced as a long time period is required for training and developing workers’ skills in a highly regulated industry. Urgent action is required by businesses and the government to reduce labour immobility to benefit the energy sector. This action could include policies to increase investment in training programmes, recruit skilled workers from overseas, change the industry image 15 and deal with its ageing workforce. (Source: adapted from ‘Sector insights: skills and performance challenges in the energy sector’, by the UK Commission for Employment and Skills, March 2015; https://www.gov.uk/government/uploads/system/uploads/attachment_ data/file/416998/15.03.25._Energy_SLMI_-_evidence_report.pdf)
(b) With reference to Extract A, discuss the likely effectiveness of ‘measures to open up and increase competition’ in the UK energy market. (12)
June 2018 · Paper 1 · Q6(c) 10 marks AO1=2, AO2=2, AO3=2, AO4=4 10-mark response competition policy and regulation
Data and extracts for question 6The UK energy market Figure 1: UK retail electricity and gas real price indices, 2004–2015 Gas Electricity Indices: 2010 (base) = 100 140 index 120 100 80 60 40 20 0 2004 2006 2008 2010 2012 2014 2016 (Source: https://assets.publishing.service.gov.uk/media/5773de34e5274a0da3000113/ final-report-energy-market-investigation.pdf) Figure 2: UK retail electricity and gas supply: market share by company, 2016 Company Electricity Gas % % British Gas 23 36 EON 16 13 SSE 16 13 EDF 12 8 Scottish Power 11 9 RWE (nPower) 10 9 Other companies 12 12 Total 100 100 (Sources: https://www.ofgem.gov.uk/chart/ electricity-supply-market-shares-company-domestic-gb and https://www.ofgem.gov.uk/data-portal/retail-market-indicators) Extract A Competition and Markets Authority (CMA) report into the UK energy market An investigation into the UK energy market by the CMA concluded that customers have been paying £1.4 billion a year more than they would in a fully competitive market. It found that 70% of domestic customers of the six largest energy firms were on an expensive standard rate. These customers could each save over £300 a year by switching 5 to a cheaper deal but appear reluctant to do so. However, the CMA investigation found no evidence of anti-competitive practices by firms. There has even been an increase in new entrant energy suppliers over recent years and their combined market share has reached 12% in both gas and electricity supply. To protect consumers, the CMA has introduced various measures to open up and 10 increase competition in the UK energy market. These include: • the creation of a database designed to help consumers switch energy suppliers – rival suppliers can directly contact these customers • the conversion of all homes to smart energy meters making it easier for customers to measure energy consumption and switch supplier 15 • new rules to protect the four million vulnerable customers using prepaid meters – this includes a temporary price cap until smart meters have been installed. (Source: adapted from ‘Competition and Markets Authority Final report into Energy Market Investigation’ https://www.gov.uk/government/ news/cma-publishes-final-energy-report-in-full) Extract B Proposals to regulate profits in the UK energy market Currently energy retail companies make an average profit of 7% of total revenue. The Chairman of the Competition and Markets Authority (CMA) suggested that these profits are as much as five times higher than they should be, given the companies’ limited role in marketing, metering and billing customers. He recommended a profit cap of 1.25% of 5 total revenue. However, Scottish Power criticised proposals for regulating profits saying that it would reduce investment in the energy industry and undermine long-term energy provision. The firm claimed that such a low rate of return is below the profit margin made by supermarkets. 10 All six large energy firms are vertically integrated – producing as well as distributing gas and electricity. This can provide efficiency benefits but also harm competition. (Source: adapted from ‘Profit cap doesn’t fit with new investment, energy boss warns’, by Robin Pagnamenta, The Times, 19th September 2016) Extract C Skills shortages in the UK energy sector The energy sector is facing a skills shortage of engineers and technicians. Some 29% of employers in the gas and electricity industries report unfilled job vacancies compared with an average of 18% across all industries. A lack of information and advice on career prospects for young people is partly to blame 5 - many graduates have a negative image of the work involved. There is also a lack of students taking science, technology, engineering and maths-based subjects at school and university. Less than one-fifth of the energy sector’s workforce are women. The energy sector is characterised by an ageing workforce - data from the UK Labour Force Survey reveal that around two-thirds of workers are aged over 50. These cannot 10 easily be replaced as a long time period is required for training and developing workers’ skills in a highly regulated industry. Urgent action is required by businesses and the government to reduce labour immobility to benefit the energy sector. This action could include policies to increase investment in training programmes, recruit skilled workers from overseas, change the industry image 15 and deal with its ageing workforce. (Source: adapted from ‘Sector insights: skills and performance challenges in the energy sector’, by the UK Commission for Employment and Skills, March 2015; https://www.gov.uk/government/uploads/system/uploads/attachment_ data/file/416998/15.03.25._Energy_SLMI_-_evidence_report.pdf)
(c) With reference to Extract B, assess how the regulation of energy suppliers’ profits is likely to affect consumers and suppliers in the energy market. (10)
June 2018 · Paper 1 · Q6(d) 8 marks AO1=2, AO2=2, AO3=2, AO4=2 8-mark response price elasticity of demand
Data and extracts for question 6The UK energy market Figure 1: UK retail electricity and gas real price indices, 2004–2015 Gas Electricity Indices: 2010 (base) = 100 140 index 120 100 80 60 40 20 0 2004 2006 2008 2010 2012 2014 2016 (Source: https://assets.publishing.service.gov.uk/media/5773de34e5274a0da3000113/ final-report-energy-market-investigation.pdf) Figure 2: UK retail electricity and gas supply: market share by company, 2016 Company Electricity Gas % % British Gas 23 36 EON 16 13 SSE 16 13 EDF 12 8 Scottish Power 11 9 RWE (nPower) 10 9 Other companies 12 12 Total 100 100 (Sources: https://www.ofgem.gov.uk/chart/ electricity-supply-market-shares-company-domestic-gb and https://www.ofgem.gov.uk/data-portal/retail-market-indicators) Extract A Competition and Markets Authority (CMA) report into the UK energy market An investigation into the UK energy market by the CMA concluded that customers have been paying £1.4 billion a year more than they would in a fully competitive market. It found that 70% of domestic customers of the six largest energy firms were on an expensive standard rate. These customers could each save over £300 a year by switching 5 to a cheaper deal but appear reluctant to do so. However, the CMA investigation found no evidence of anti-competitive practices by firms. There has even been an increase in new entrant energy suppliers over recent years and their combined market share has reached 12% in both gas and electricity supply. To protect consumers, the CMA has introduced various measures to open up and 10 increase competition in the UK energy market. These include: • the creation of a database designed to help consumers switch energy suppliers – rival suppliers can directly contact these customers • the conversion of all homes to smart energy meters making it easier for customers to measure energy consumption and switch supplier 15 • new rules to protect the four million vulnerable customers using prepaid meters – this includes a temporary price cap until smart meters have been installed. (Source: adapted from ‘Competition and Markets Authority Final report into Energy Market Investigation’ https://www.gov.uk/government/ news/cma-publishes-final-energy-report-in-full) Extract B Proposals to regulate profits in the UK energy market Currently energy retail companies make an average profit of 7% of total revenue. The Chairman of the Competition and Markets Authority (CMA) suggested that these profits are as much as five times higher than they should be, given the companies’ limited role in marketing, metering and billing customers. He recommended a profit cap of 1.25% of 5 total revenue. However, Scottish Power criticised proposals for regulating profits saying that it would reduce investment in the energy industry and undermine long-term energy provision. The firm claimed that such a low rate of return is below the profit margin made by supermarkets. 10 All six large energy firms are vertically integrated – producing as well as distributing gas and electricity. This can provide efficiency benefits but also harm competition. (Source: adapted from ‘Profit cap doesn’t fit with new investment, energy boss warns’, by Robin Pagnamenta, The Times, 19th September 2016) Extract C Skills shortages in the UK energy sector The energy sector is facing a skills shortage of engineers and technicians. Some 29% of employers in the gas and electricity industries report unfilled job vacancies compared with an average of 18% across all industries. A lack of information and advice on career prospects for young people is partly to blame 5 - many graduates have a negative image of the work involved. There is also a lack of students taking science, technology, engineering and maths-based subjects at school and university. Less than one-fifth of the energy sector’s workforce are women. The energy sector is characterised by an ageing workforce - data from the UK Labour Force Survey reveal that around two-thirds of workers are aged over 50. These cannot 10 easily be replaced as a long time period is required for training and developing workers’ skills in a highly regulated industry. Urgent action is required by businesses and the government to reduce labour immobility to benefit the energy sector. This action could include policies to increase investment in training programmes, recruit skilled workers from overseas, change the industry image 15 and deal with its ageing workforce. (Source: adapted from ‘Sector insights: skills and performance challenges in the energy sector’, by the UK Commission for Employment and Skills, March 2015; https://www.gov.uk/government/uploads/system/uploads/attachment_ data/file/416998/15.03.25._Energy_SLMI_-_evidence_report.pdf)
The price elasticity of demand for electricity in the UK is estimated to be –0.35 in the short run and –0.85 in the long run. (d) With reference to Extract A and your own knowledge, examine two possible reasons for the change in price elasticity of demand for electricity over time. (8)
June 2018 · Paper 1 · Q6(e) 15 marks AO1=3, AO2=3, AO3=3, AO4=6 15-mark response labour market
Data and extracts for question 6The UK energy market Figure 1: UK retail electricity and gas real price indices, 2004–2015 Gas Electricity Indices: 2010 (base) = 100 140 index 120 100 80 60 40 20 0 2004 2006 2008 2010 2012 2014 2016 (Source: https://assets.publishing.service.gov.uk/media/5773de34e5274a0da3000113/ final-report-energy-market-investigation.pdf) Figure 2: UK retail electricity and gas supply: market share by company, 2016 Company Electricity Gas % % British Gas 23 36 EON 16 13 SSE 16 13 EDF 12 8 Scottish Power 11 9 RWE (nPower) 10 9 Other companies 12 12 Total 100 100 (Sources: https://www.ofgem.gov.uk/chart/ electricity-supply-market-shares-company-domestic-gb and https://www.ofgem.gov.uk/data-portal/retail-market-indicators) Extract A Competition and Markets Authority (CMA) report into the UK energy market An investigation into the UK energy market by the CMA concluded that customers have been paying £1.4 billion a year more than they would in a fully competitive market. It found that 70% of domestic customers of the six largest energy firms were on an expensive standard rate. These customers could each save over £300 a year by switching 5 to a cheaper deal but appear reluctant to do so. However, the CMA investigation found no evidence of anti-competitive practices by firms. There has even been an increase in new entrant energy suppliers over recent years and their combined market share has reached 12% in both gas and electricity supply. To protect consumers, the CMA has introduced various measures to open up and 10 increase competition in the UK energy market. These include: • the creation of a database designed to help consumers switch energy suppliers – rival suppliers can directly contact these customers • the conversion of all homes to smart energy meters making it easier for customers to measure energy consumption and switch supplier 15 • new rules to protect the four million vulnerable customers using prepaid meters – this includes a temporary price cap until smart meters have been installed. (Source: adapted from ‘Competition and Markets Authority Final report into Energy Market Investigation’ https://www.gov.uk/government/ news/cma-publishes-final-energy-report-in-full) Extract B Proposals to regulate profits in the UK energy market Currently energy retail companies make an average profit of 7% of total revenue. The Chairman of the Competition and Markets Authority (CMA) suggested that these profits are as much as five times higher than they should be, given the companies’ limited role in marketing, metering and billing customers. He recommended a profit cap of 1.25% of 5 total revenue. However, Scottish Power criticised proposals for regulating profits saying that it would reduce investment in the energy industry and undermine long-term energy provision. The firm claimed that such a low rate of return is below the profit margin made by supermarkets. 10 All six large energy firms are vertically integrated – producing as well as distributing gas and electricity. This can provide efficiency benefits but also harm competition. (Source: adapted from ‘Profit cap doesn’t fit with new investment, energy boss warns’, by Robin Pagnamenta, The Times, 19th September 2016) Extract C Skills shortages in the UK energy sector The energy sector is facing a skills shortage of engineers and technicians. Some 29% of employers in the gas and electricity industries report unfilled job vacancies compared with an average of 18% across all industries. A lack of information and advice on career prospects for young people is partly to blame 5 - many graduates have a negative image of the work involved. There is also a lack of students taking science, technology, engineering and maths-based subjects at school and university. Less than one-fifth of the energy sector’s workforce are women. The energy sector is characterised by an ageing workforce - data from the UK Labour Force Survey reveal that around two-thirds of workers are aged over 50. These cannot 10 easily be replaced as a long time period is required for training and developing workers’ skills in a highly regulated industry. Urgent action is required by businesses and the government to reduce labour immobility to benefit the energy sector. This action could include policies to increase investment in training programmes, recruit skilled workers from overseas, change the industry image 15 and deal with its ageing workforce. (Source: adapted from ‘Sector insights: skills and performance challenges in the energy sector’, by the UK Commission for Employment and Skills, March 2015; https://www.gov.uk/government/uploads/system/uploads/attachment_ data/file/416998/15.03.25._Energy_SLMI_-_evidence_report.pdf)
(e) With reference to Extract C and your own knowledge, discuss policies businesses and government might implement to reduce labour immobility to benefit the energy sector. (15)
June 2018 · Paper 1 · Q7 25 marks AO1=4, AO2=4, AO3=8, AO4=9 25-mark essay Either/or externalities
7 In September 2016 the government approved the building of an £18 billion nuclear power station, Hinkley Point C, which will supply 7% of UK electricity for up to 60 years. The power station is funded by Chinese and French investment. Evaluate the likely private costs and external costs involved in such major power station construction projects. Use an appropriate externalities diagram in your answer.
June 2018 · Paper 1 · Q8 25 marks AO1=4, AO2=4, AO3=8, AO4=9 25-mark essay Either/or monopoly
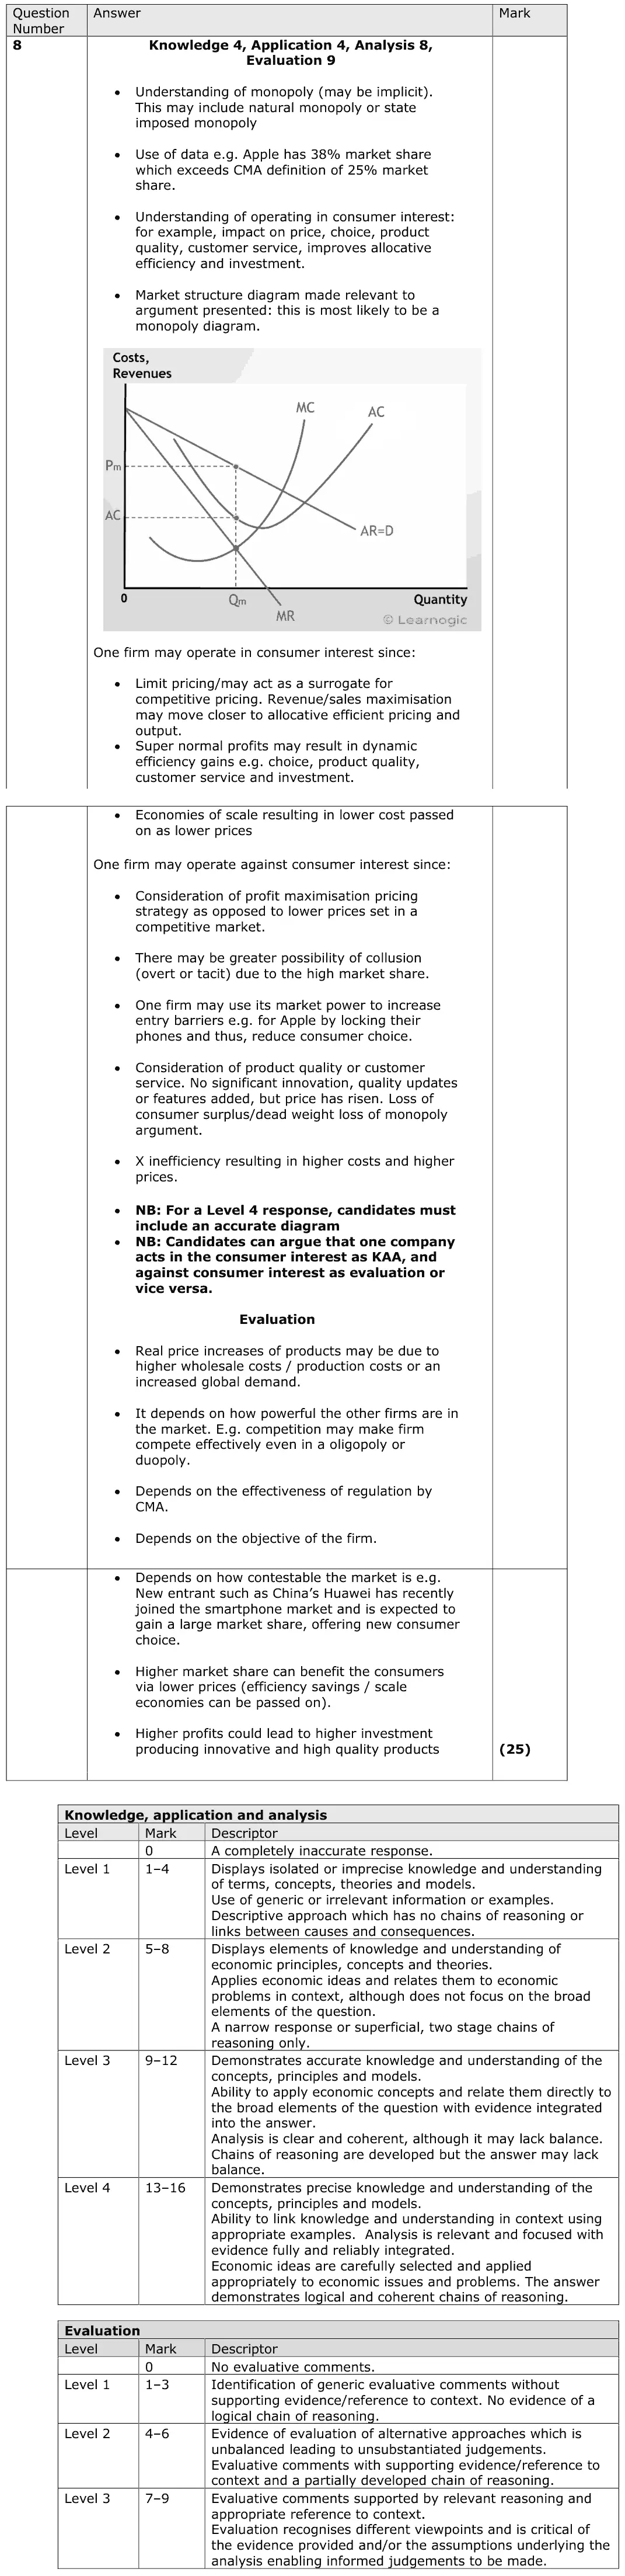
8 In July 2016 Apple’s share of the UK market for smartphones was 38%. Evaluate whether such a high market share for one company is in the consumer interest. Use appropriate diagrammatic analysis in your answer.

Work with an Edexcel economics tutor

Want a paper marked and gone through with you? Message us.

Prefer email? Send an enquiry

If you are under 18, please include a parent's contact details. Enquiries go to enquiries@economicsaleveltutor.com and are deleted once handled. All tutoring is online.