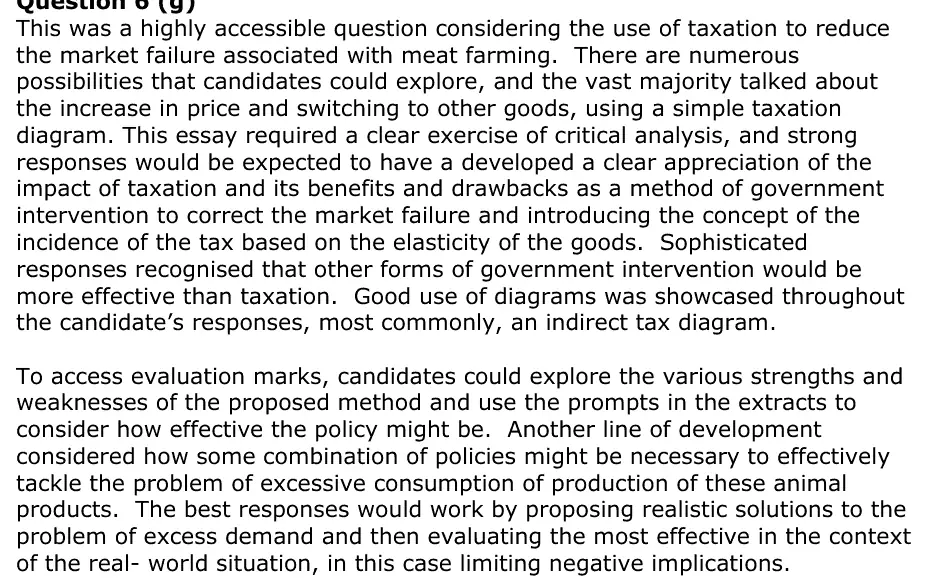
Answer
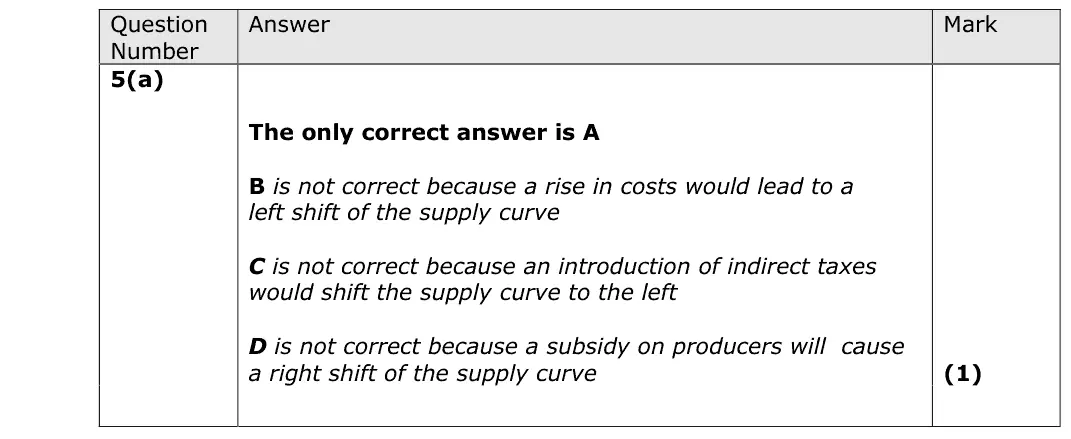
A
Mark scheme
Notes from the mark scheme and report
- a computer is a capital good used to produce other goods (A)
- savings and shares are financial assets, not capital goods
- underground oil reserves are natural resources (land)
80 marks · 18 question parts · Paper, mark scheme and report on Pearson's site
A

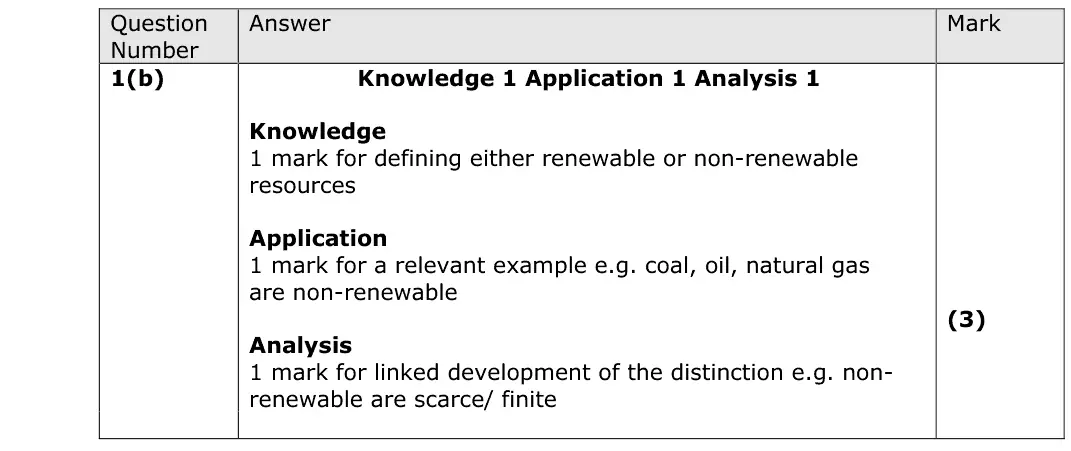
This question focused on the distinction between renewable and non-renewable resources and was answered generally very well, although not all candidates were able to include specific distinctions in the structure of their answers

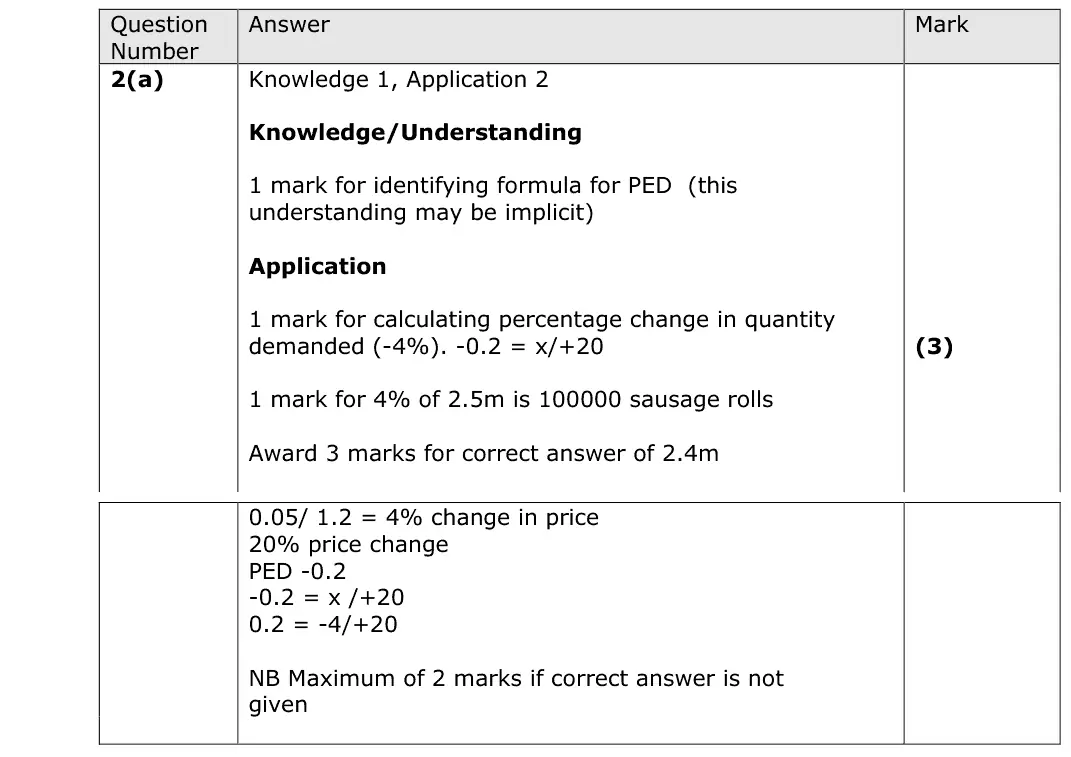
This question was designed to test quantitative ability and was focused on price elasticity. Candidates who lost marks did not manage to understand how to use the PED figure within the equation to complete the new quantity demanded, however on the whole was very well answered by the vast majority of candidates.
Quantitative skills: QS 2 (calculate, use and understand percentages, percentage changes and percentage point changes); QS 8 (make calculations of elasticity and interpret the result)
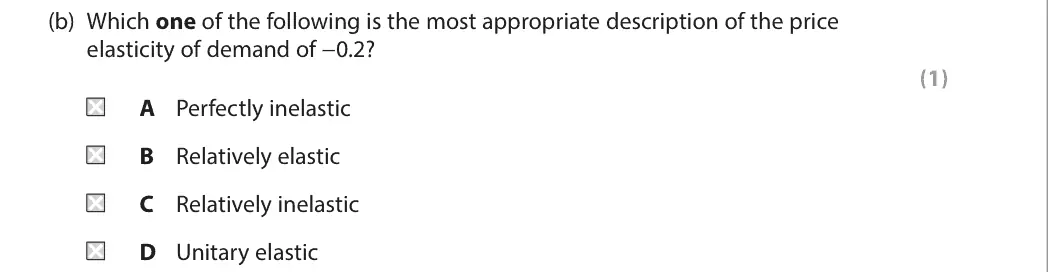
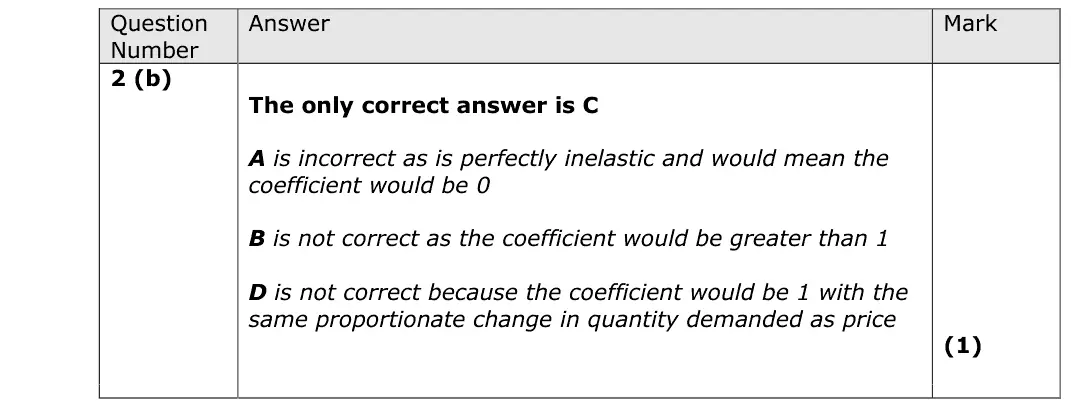
C
Quantitative skills: QS 8 (make calculations of elasticity and interpret the result)


C

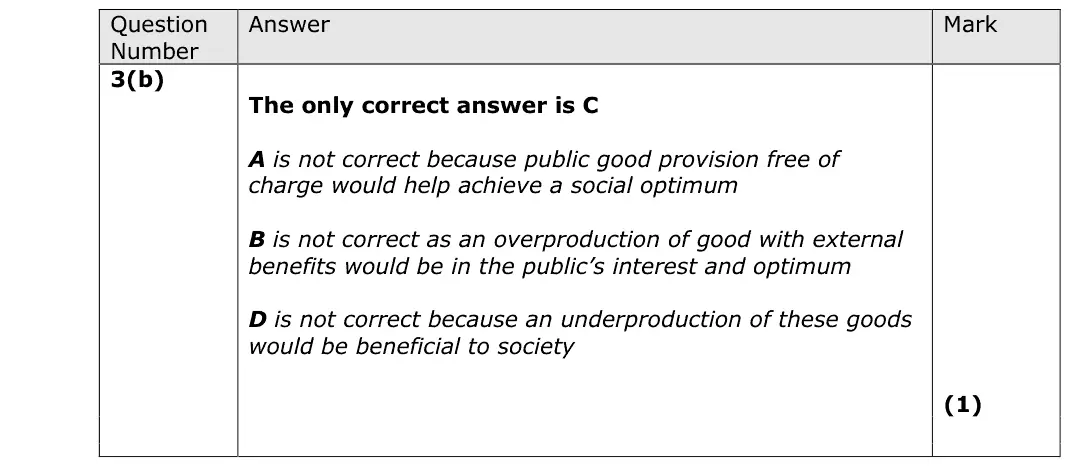
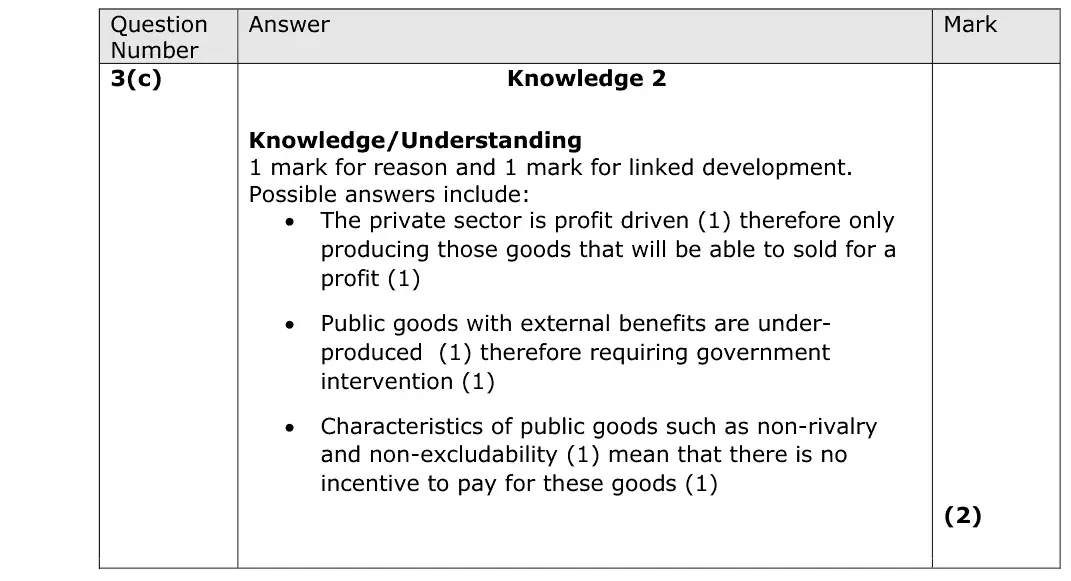
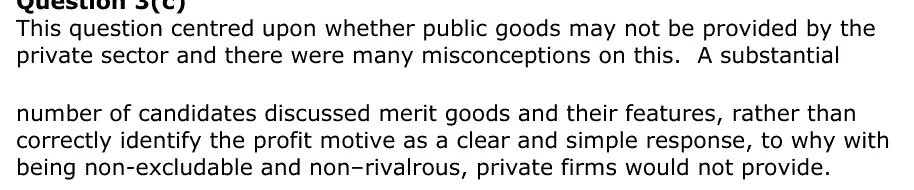
This question centred upon whether public goods may not be provided by the private sector and there were many misconceptions on this. A substantial number of candidates discussed merit goods and their features, rather than correctly identify the profit motive as a clear and simple response, to why with being non-excludable and non–rivalrous, private firms would not provide.

B

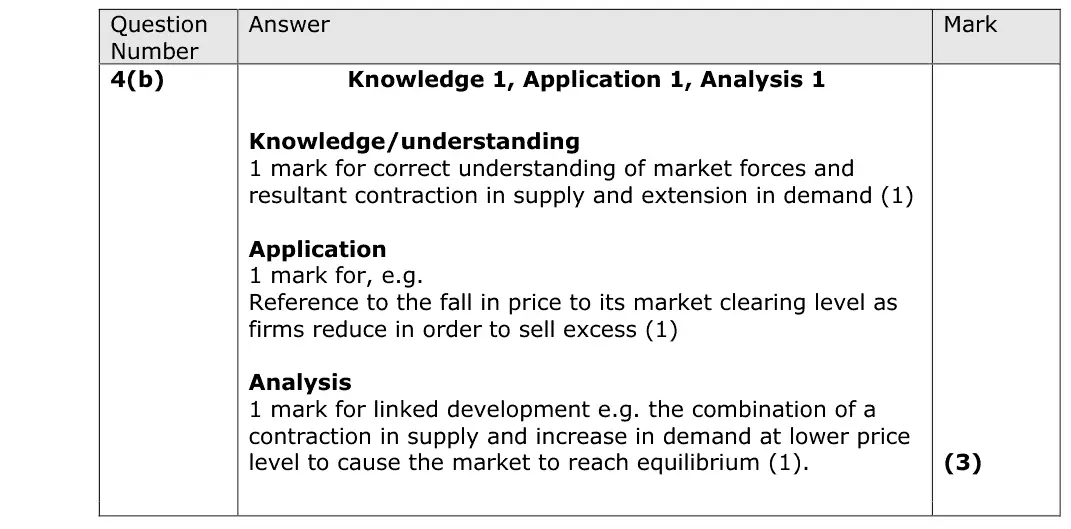
This question was well answered broadly, with many candidates understanding the functions of the price mechanism, and could clearly articulate why this would reduce the excess supply of coffee as mentioned in the question. Referring to coffee, and the price falling due to the high supply were essential to score well on this question.
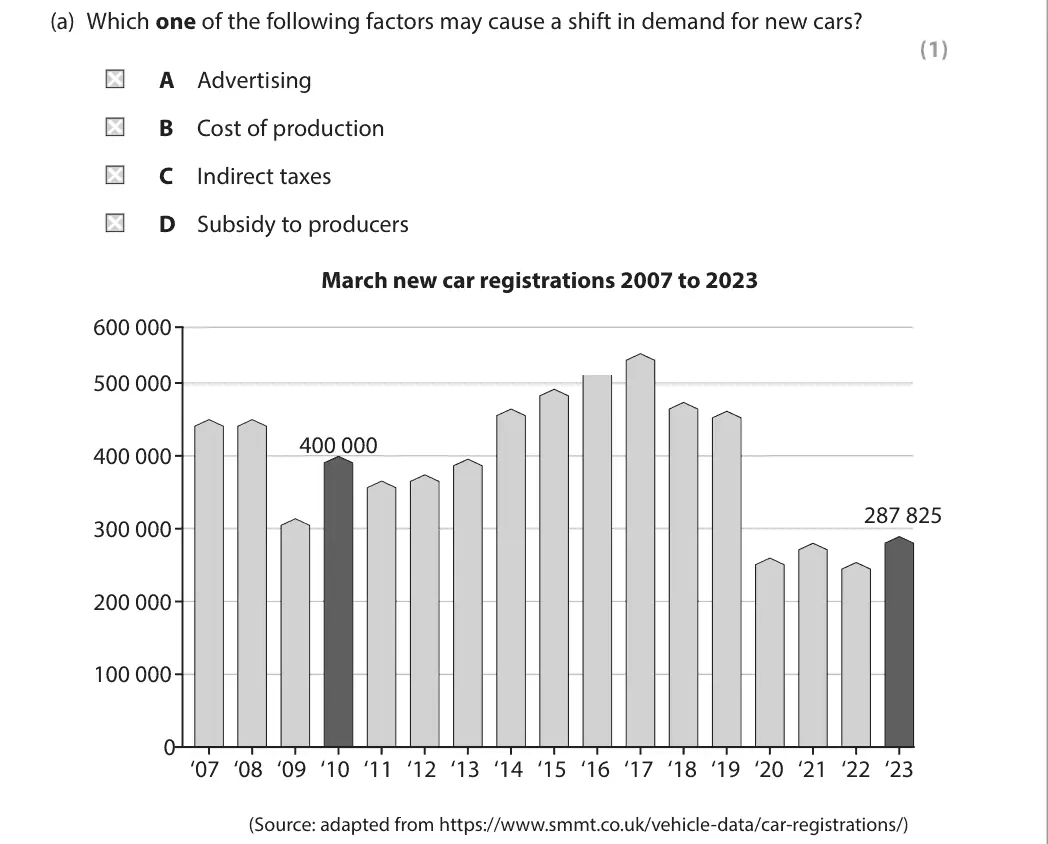
A

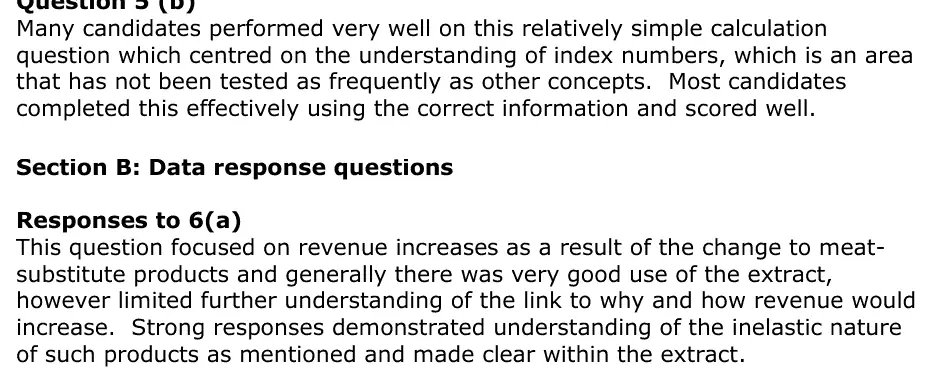
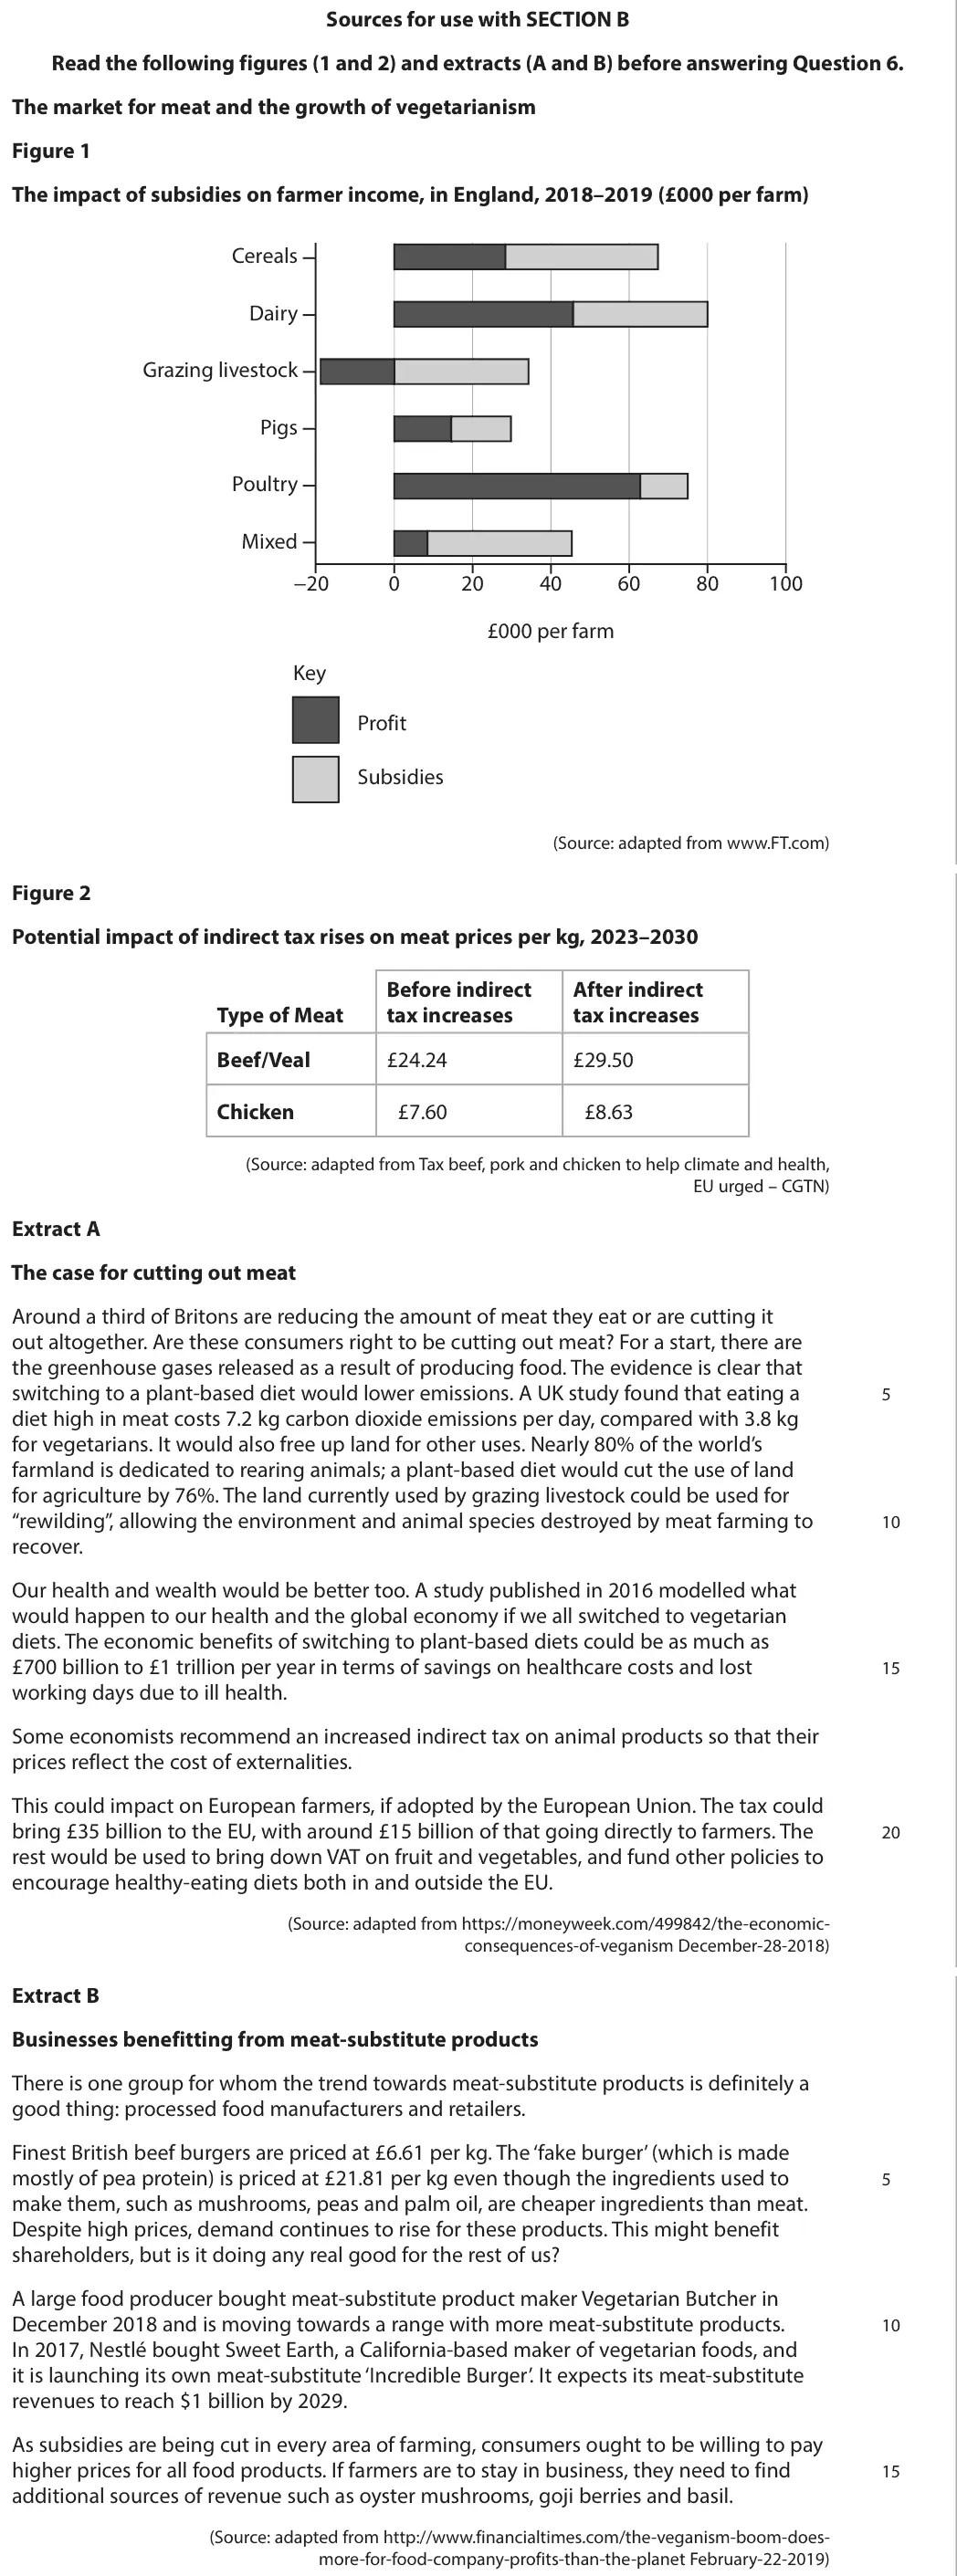
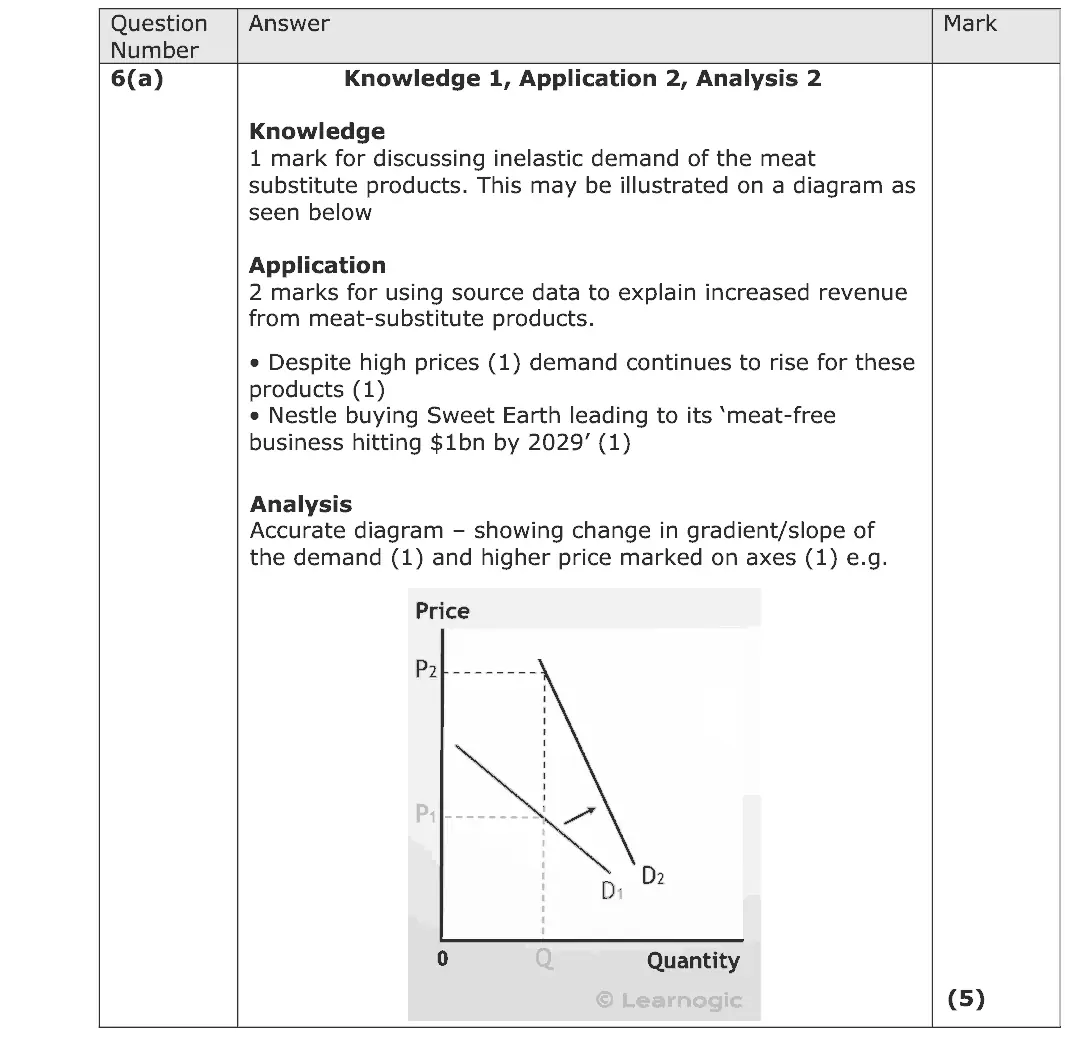
Many candidates performed very well on this relatively simple calculation question which centred on the understanding of index numbers, which is an area that has not been tested as frequently as other concepts. Most candidates completed this effectively using the correct information and scored well. Section B: Data response questions Responses to 6(a) This question focused on revenue increases as a result of the change to meat- substitute products and generally there was very good use of the extract, however limited further understanding of the link to why and how revenue would increase. Strong responses demonstrated understanding of the inelastic nature of such products as mentioned and made clear within the extract.
Quantitative skills: QS 5 (calculate and interpret index numbers); QS 9 (interpret, apply and analyse information in written, graphical tabular and numerical forms)

Quantitative skills: QS 4 (construct and interpret a range of standard graphical forms)

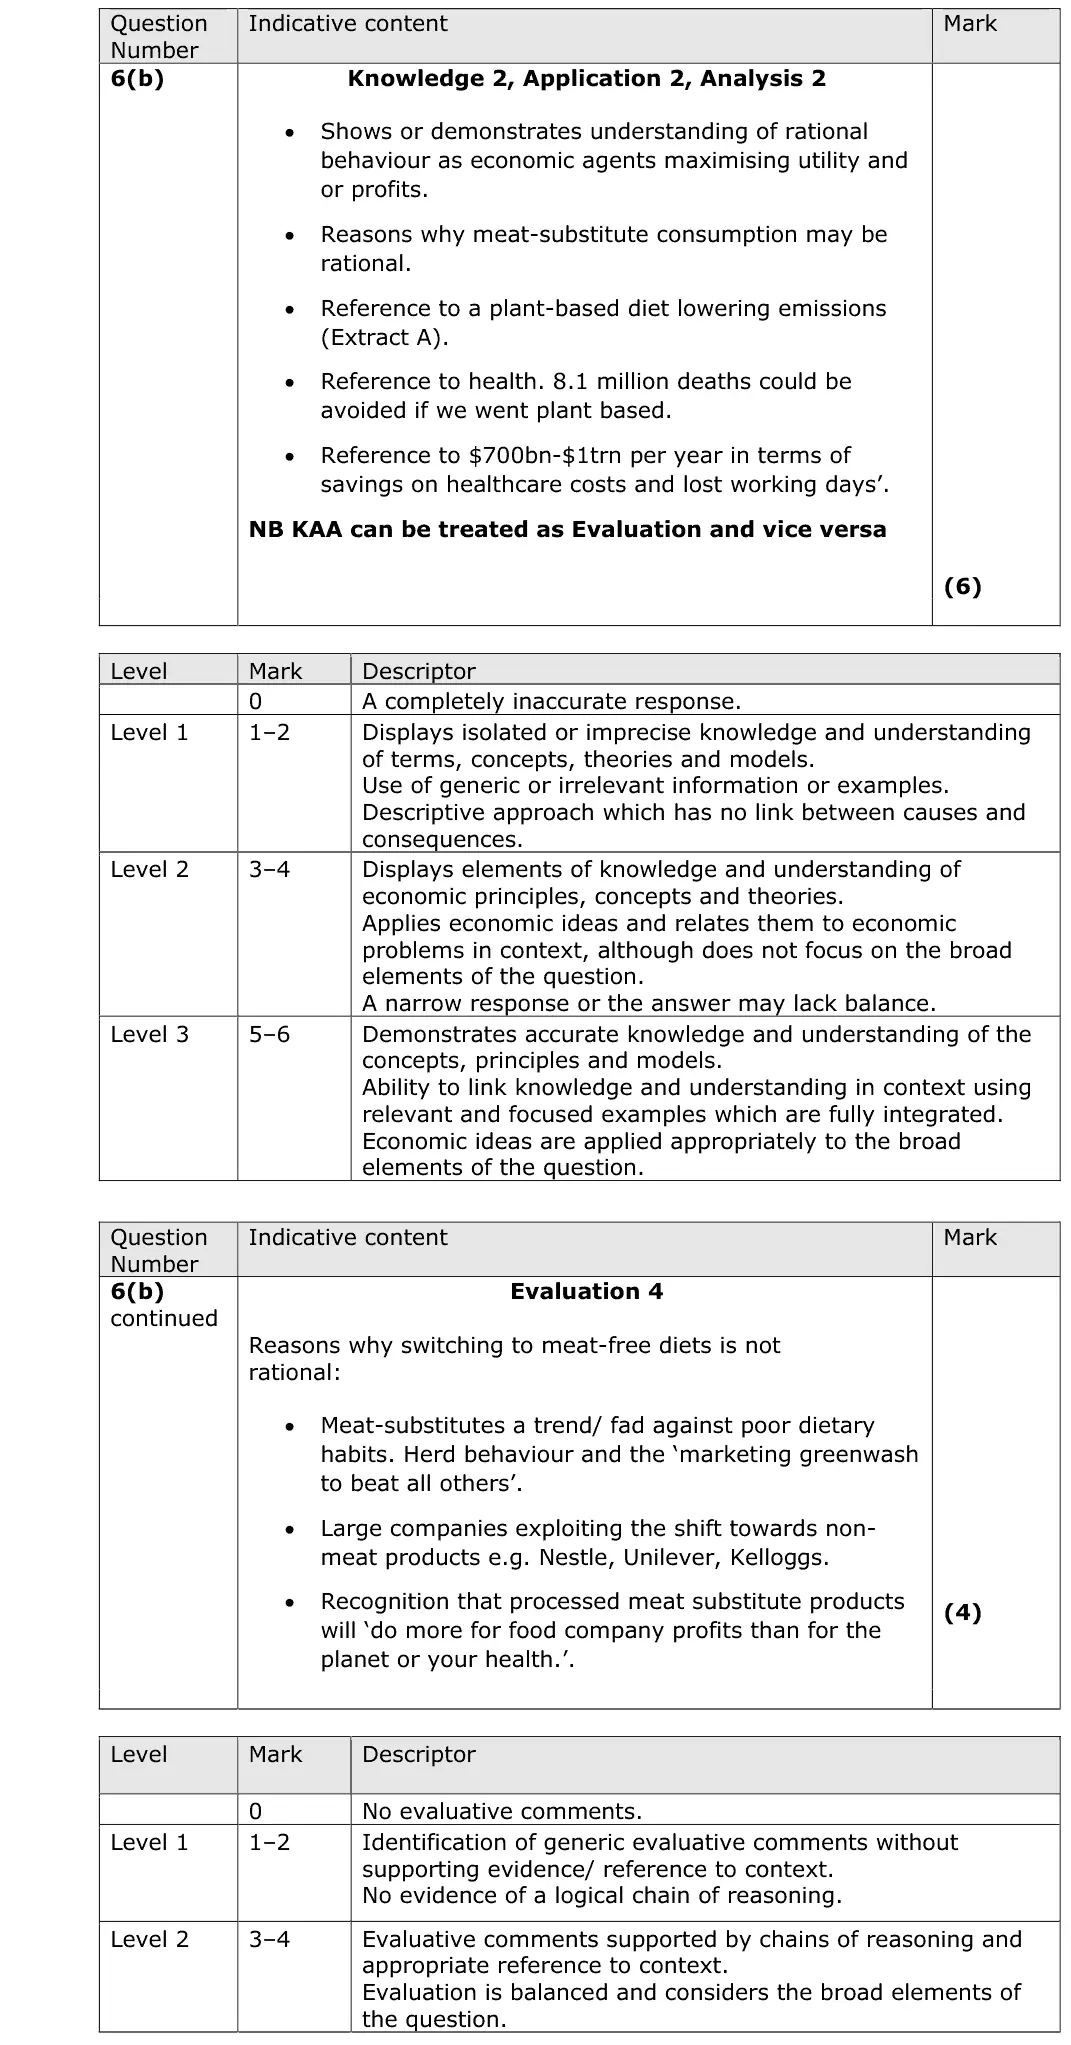
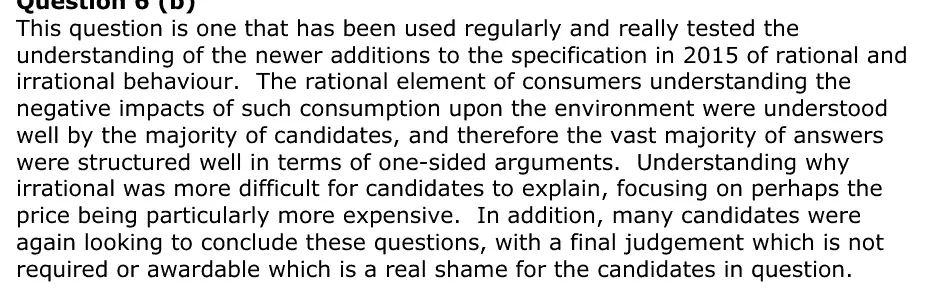
This question is one that has been used regularly and really tested the understanding of the newer additions to the specification in 2015 of rational and irrational behaviour. The rational element of consumers understanding the negative impacts of such consumption upon the environment were understood well by the majority of candidates, and therefore the vast majority of answers were structured well in terms of one-sided arguments. Understanding why irrational was more difficult for candidates to explain, focusing on perhaps the price being particularly more expensive. In addition, many candidates were again looking to conclude these questions, with a final judgement which is not required or awardable which is a real shame for the candidates in question.

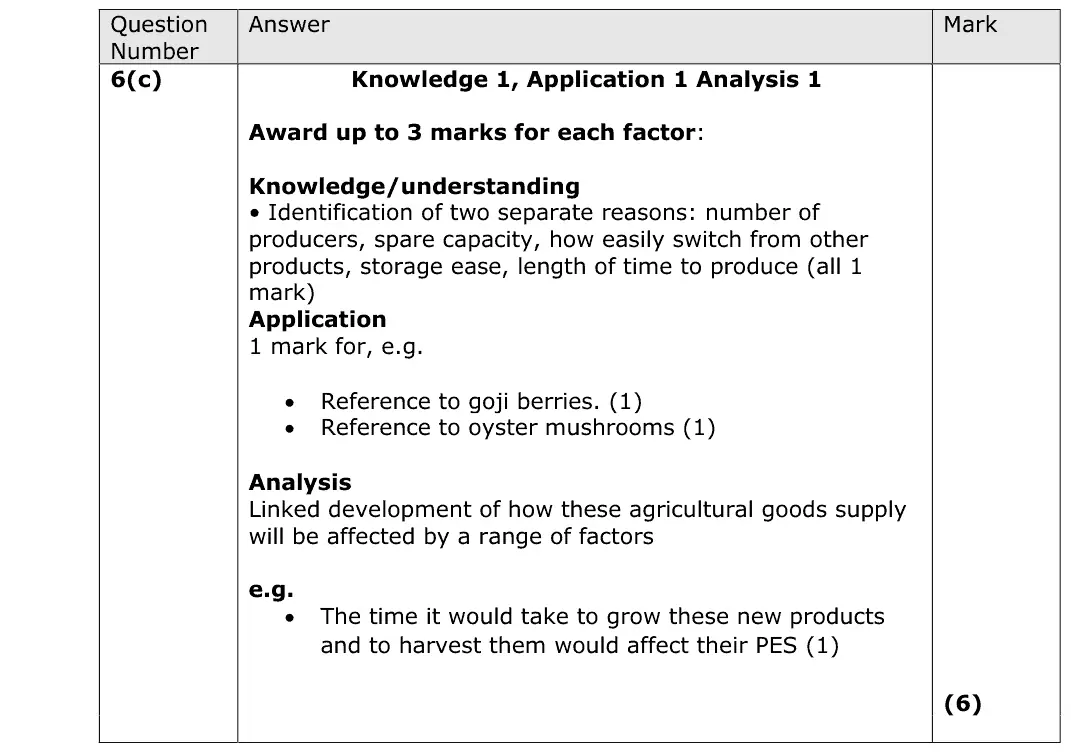
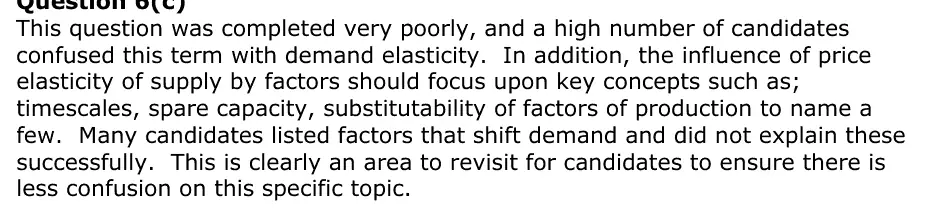
This question was completed very poorly, and a high number of candidates confused this term with demand elasticity. In addition, the influence of price elasticity of supply by factors should focus upon key concepts such as; timescales, spare capacity, substitutability of factors of production to name a few. Many candidates listed factors that shift demand and did not explain these successfully. This is clearly an area to revisit for candidates to ensure there is less confusion on this specific topic.

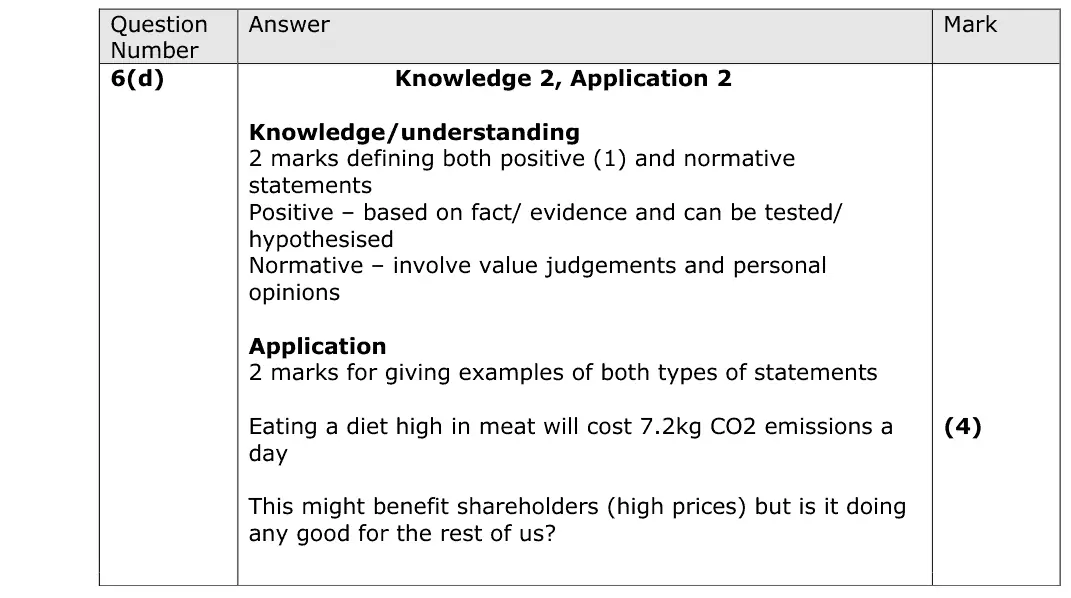
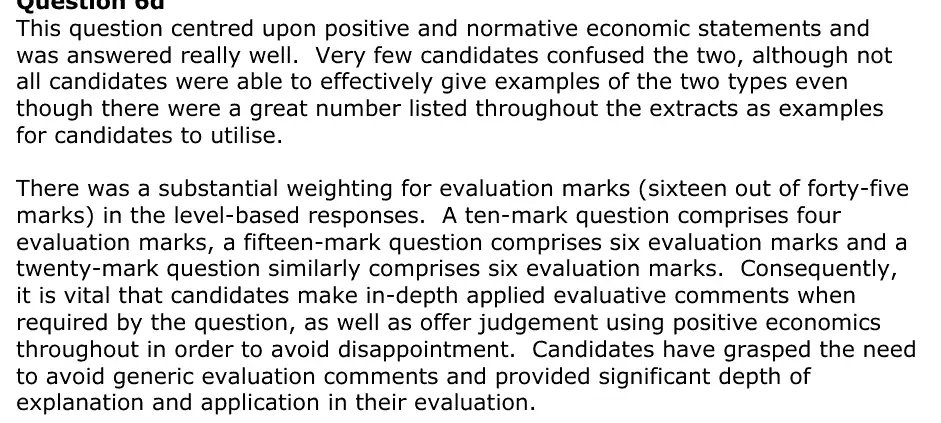
This question centred upon positive and normative economic statements and was answered really well. Very few candidates confused the two, although not all candidates were able to effectively give examples of the two types even though there were a great number listed throughout the extracts as examples for candidates to utilise. There was a substantial weighting for evaluation marks (sixteen out of forty-five marks) in the level-based responses. A ten-mark question comprises four evaluation marks, a fifteen-mark question comprises six evaluation marks and a twenty-mark question similarly comprises six evaluation marks. Consequently, it is vital that candidates make in-depth applied evaluative comments when required by the question, as well as offer judgement using positive economics throughout in order to avoid disappointment. Candidates have grasped the need to avoid generic evaluation comments and provided significant depth of explanation and application in their evaluation.

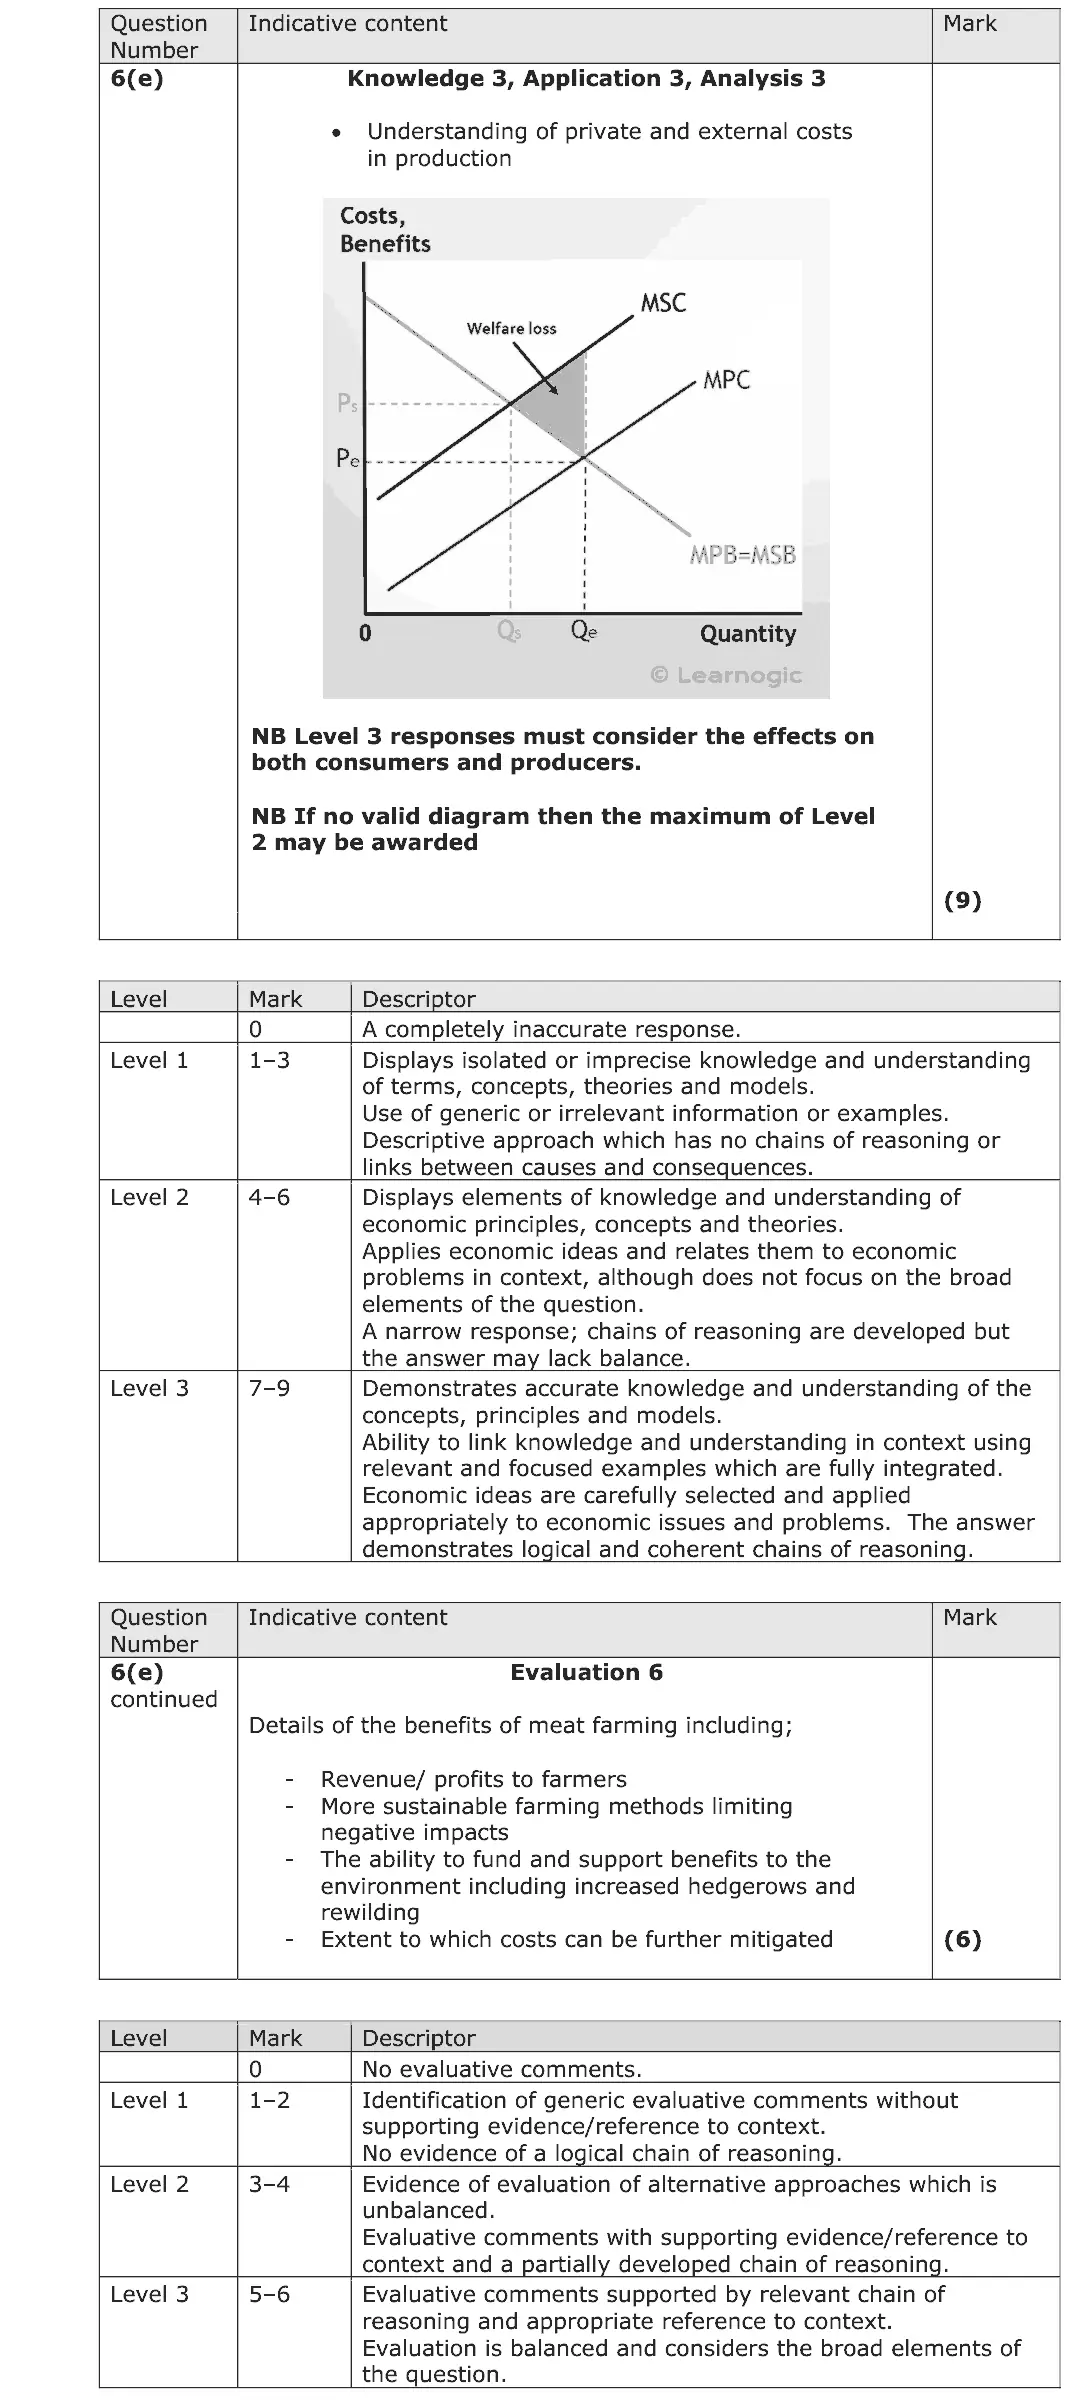
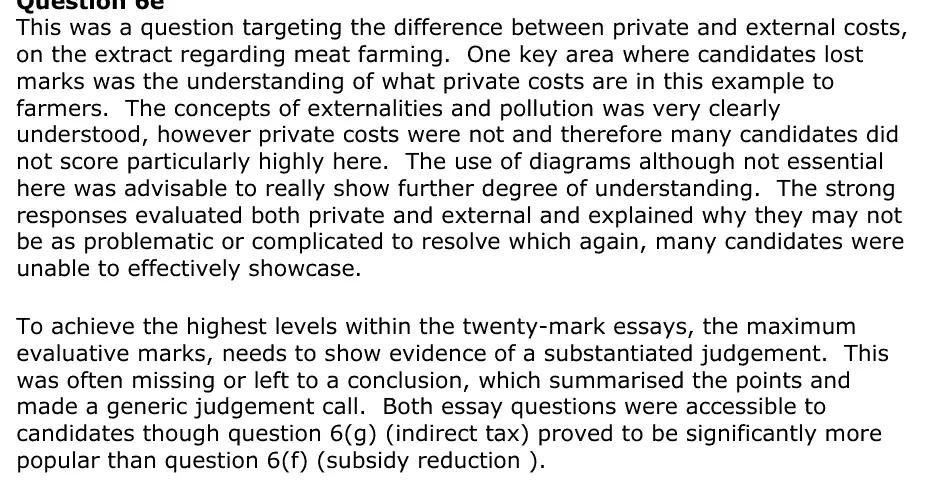
This was a question targeting the difference between private and external costs, on the extract regarding meat farming. One key area where candidates lost marks was the understanding of what private costs are in this example to farmers. The concepts of externalities and pollution was very clearly understood, however private costs were not and therefore many candidates did not score particularly highly here. The use of diagrams although not essential here was advisable to really show further degree of understanding. The strong responses evaluated both private and external and explained why they may not be as problematic or complicated to resolve which again, many candidates were unable to effectively showcase. To achieve the highest levels within the twenty-mark essays, the maximum evaluative marks, needs to show evidence of a substantiated judgement. This was often missing or left to a conclusion, which summarised the points and made a generic judgement call. Both essay questions were accessible to candidates though question 6(g) (indirect tax) proved to be significantly more popular than question 6(f) (subsidy reduction ).
Quantitative skills: QS 4 (construct and interpret a range of standard graphical forms)

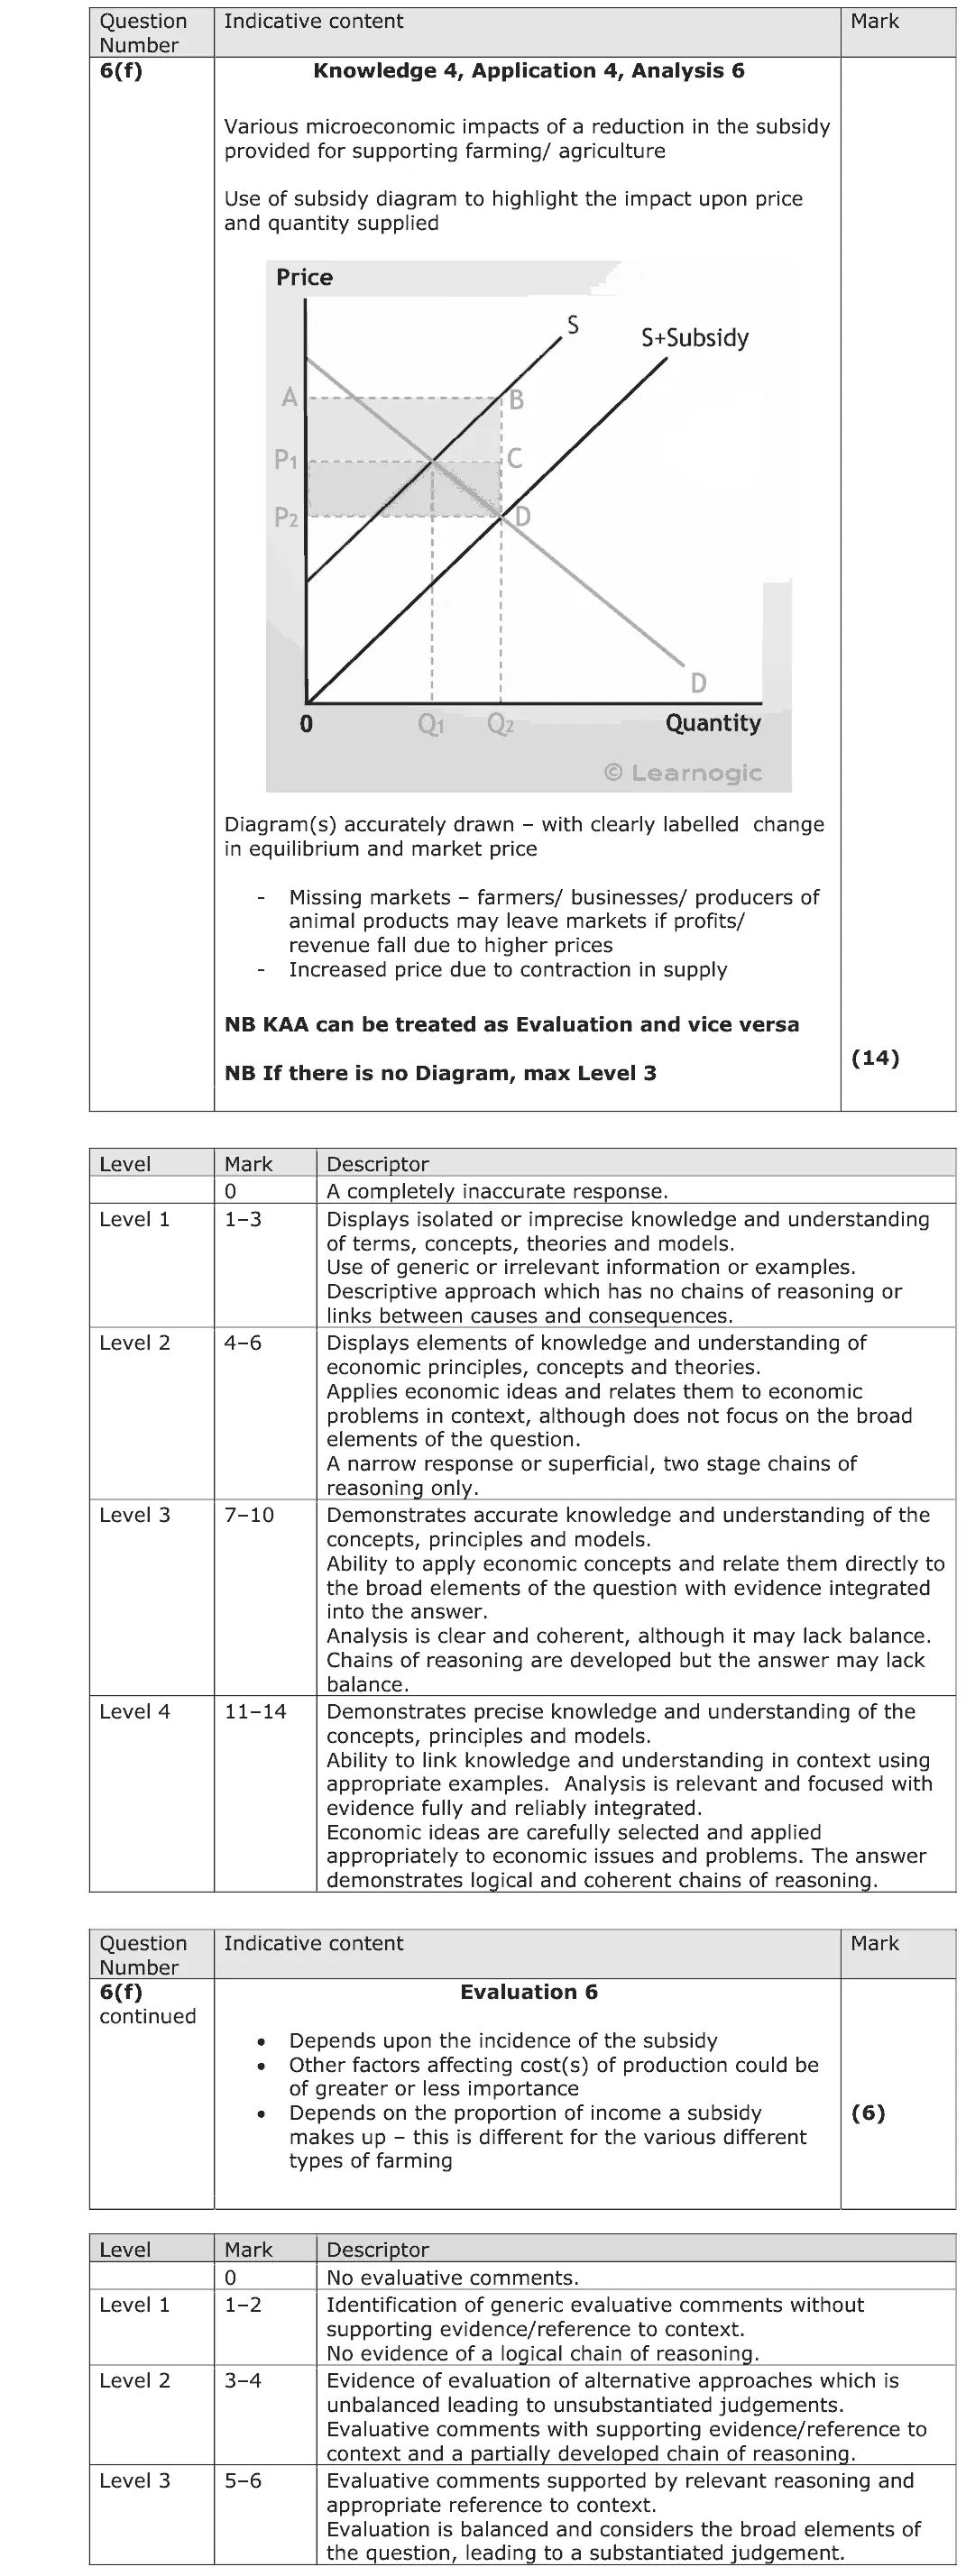
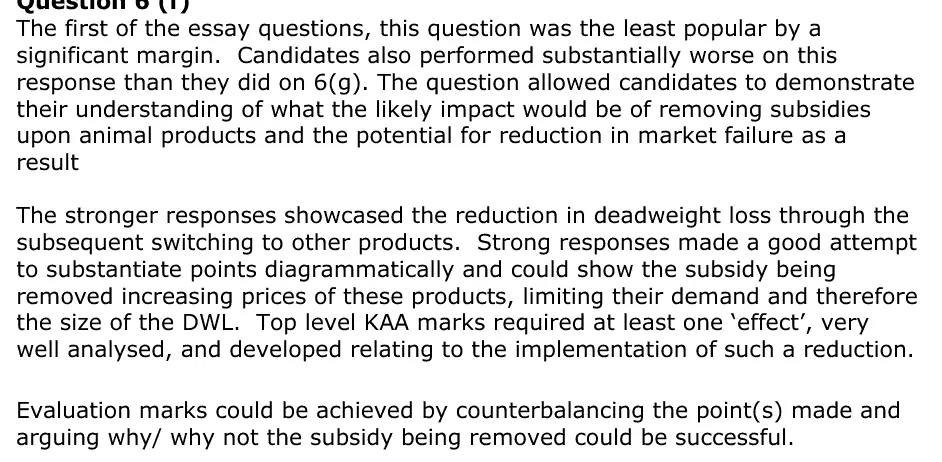
The first of the essay questions, this question was the least popular by a significant margin. Candidates also performed substantially worse on this response than they did on 6(g). The question allowed candidates to demonstrate their understanding of what the likely impact would be of removing subsidies upon animal products and the potential for reduction in market failure as a result The stronger responses showcased the reduction in deadweight loss through the subsequent switching to other products. Strong responses made a good attempt to substantiate points diagrammatically and could show the subsidy being removed increasing prices of these products, limiting their demand and therefore the size of the DWL. Top level KAA marks required at least one ‘effect’, very well analysed, and developed relating to the implementation of such a reduction. Evaluation marks could be achieved by counterbalancing the point(s) made and arguing why/ why not the subsidy being removed could be successful.
Quantitative skills: QS 4 (construct and interpret a range of standard graphical forms)

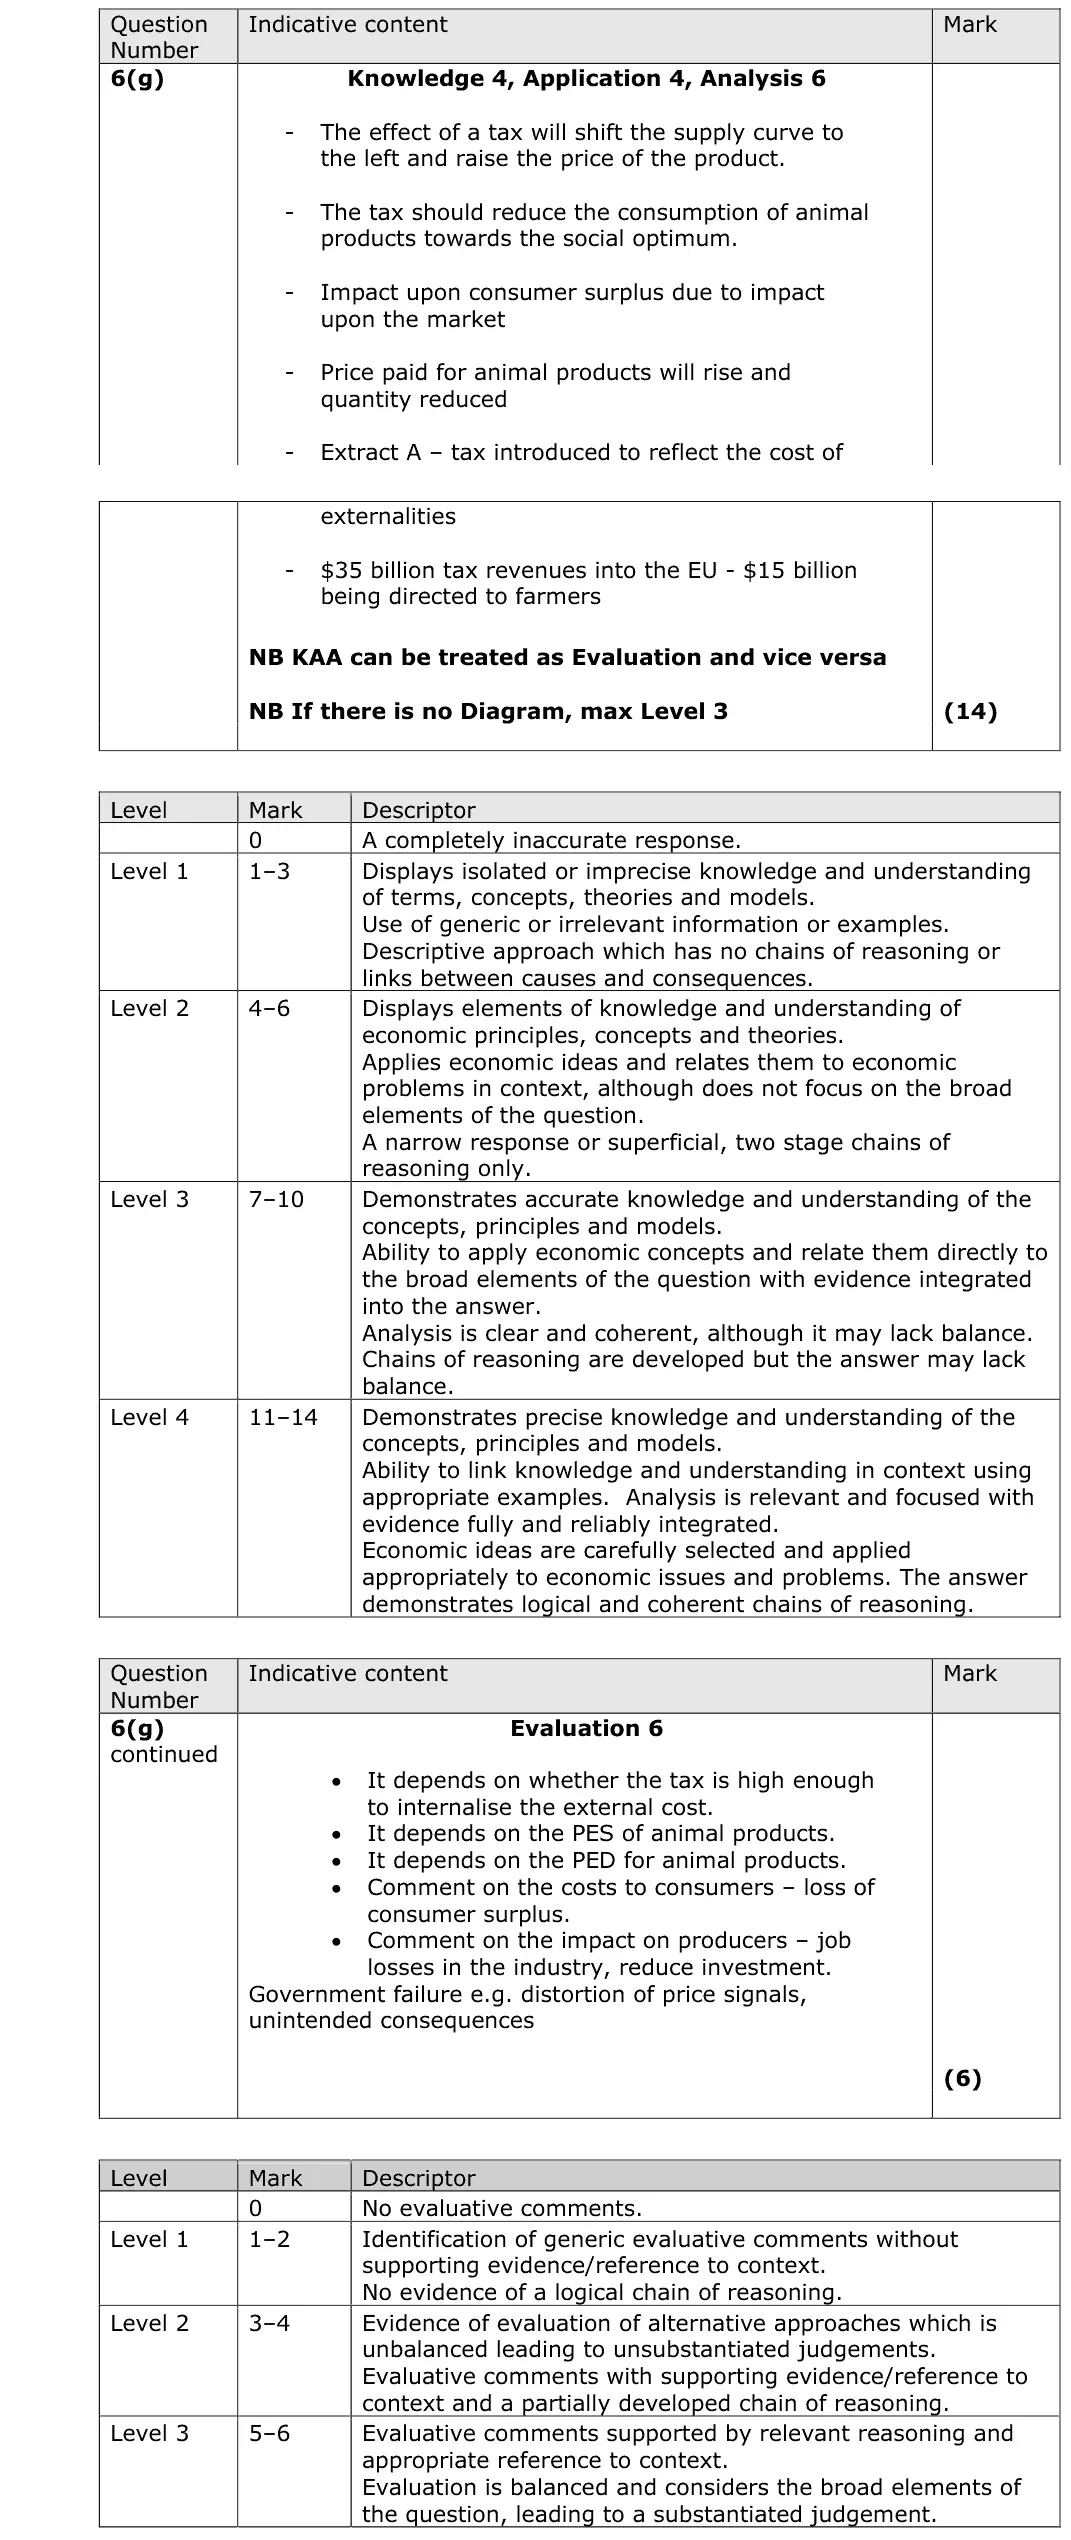
This was a highly accessible question considering the use of taxation to reduce the market failure associated with meat farming. There are numerous possibilities that candidates could explore, and the vast majority talked about the increase in price and switching to other goods, using a simple taxation diagram. This essay required a clear exercise of critical analysis, and strong responses would be expected to have a developed a clear appreciation of the impact of taxation and its benefits and drawbacks as a method of government intervention to correct the market failure and introducing the concept of the incidence of the tax based on the elasticity of the goods. Sophisticated responses recognised that other forms of government intervention would be more effective than taxation. Good use of diagrams was showcased throughout the candidate’s responses, most commonly, an indirect tax diagram. To access evaluation marks, candidates could explore the various strengths and weaknesses of the proposed method and use the prompts in the extracts to consider how effective the policy might be. Another line of development considered how some combination of policies might be necessary to effectively tackle the problem of excessive consumption of production of these animal products. The best responses would work by proposing realistic solutions to the problem of excess demand and then evaluating the most effective in the context of the real- world situation, in this case limiting negative implications.
Quantitative skills: QS 4 (construct and interpret a range of standard graphical forms)
Want a paper marked and gone through with you? Message us.