June 2023: Paper 2

100 marks · 19 question parts · Paper, mark scheme and report on Pearson's site

Question by question

QTopicMarksAOType
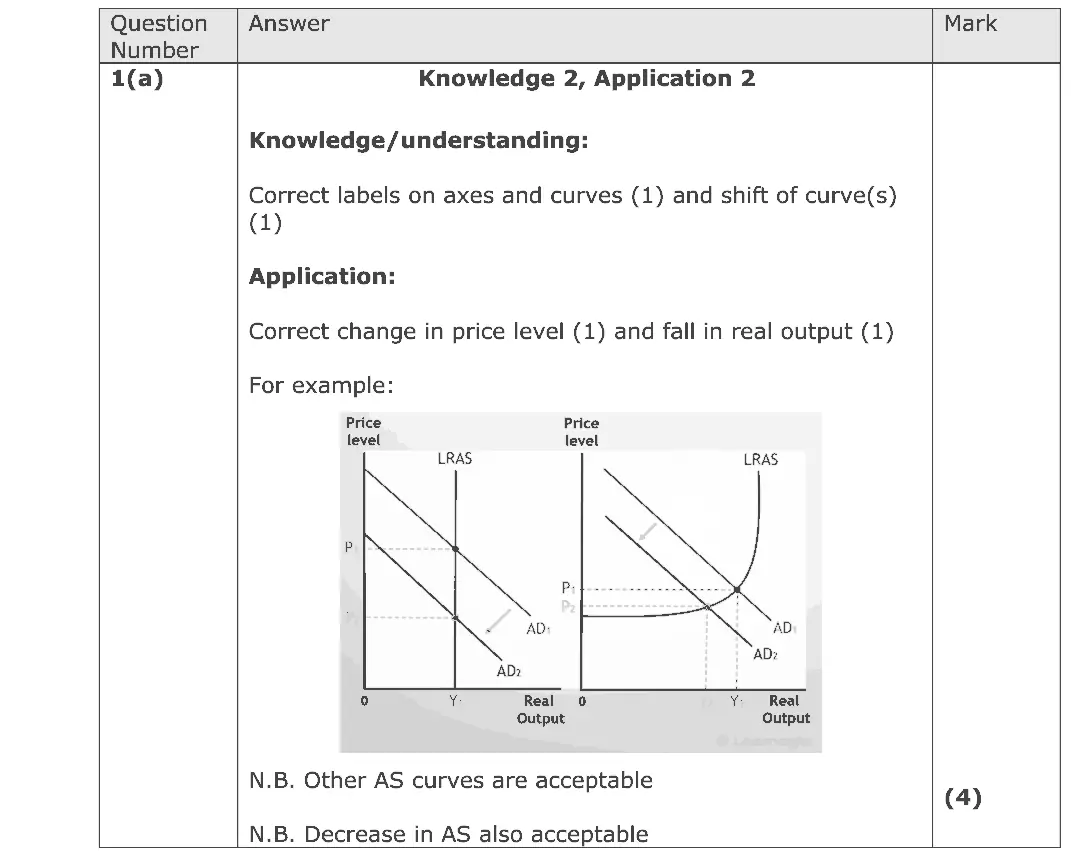
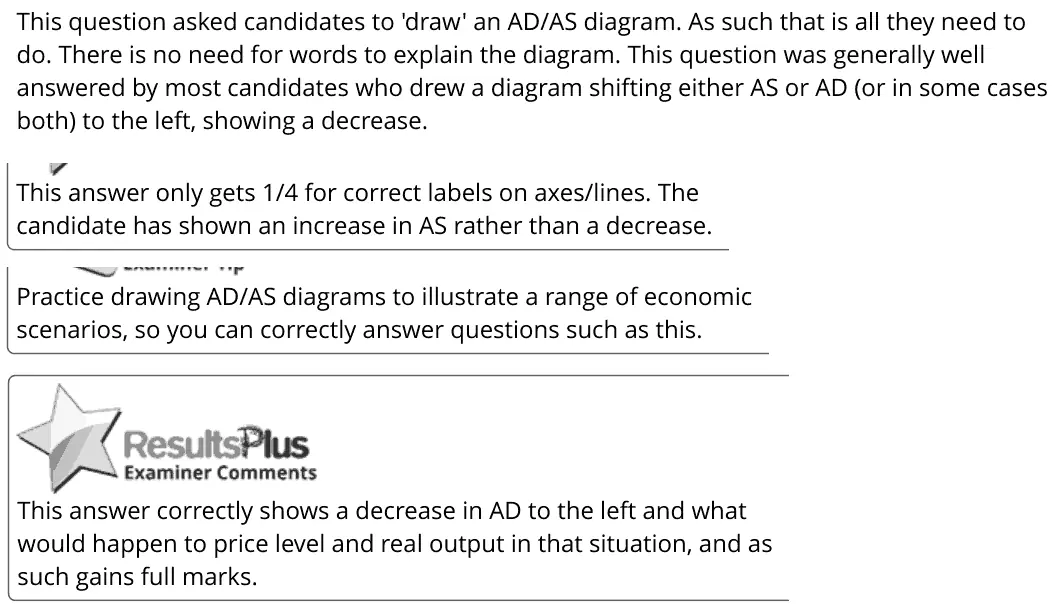
1(a) Demand-side policies: fiscal and monetary policy, The circular flow, national income and the multiplier 4AO1=2,AO2=2Diagram
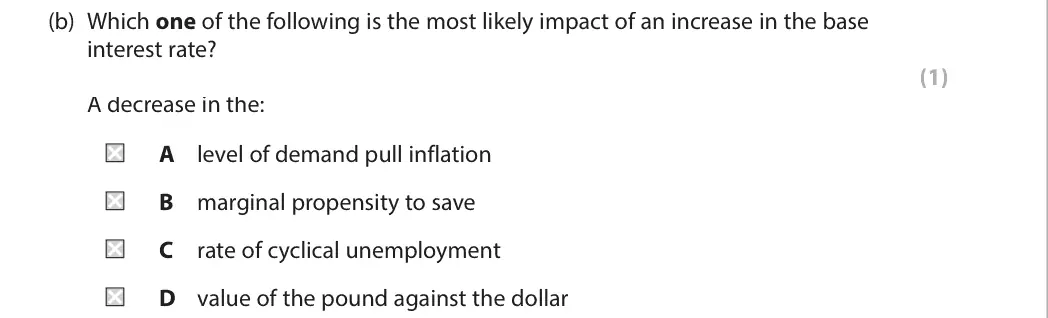
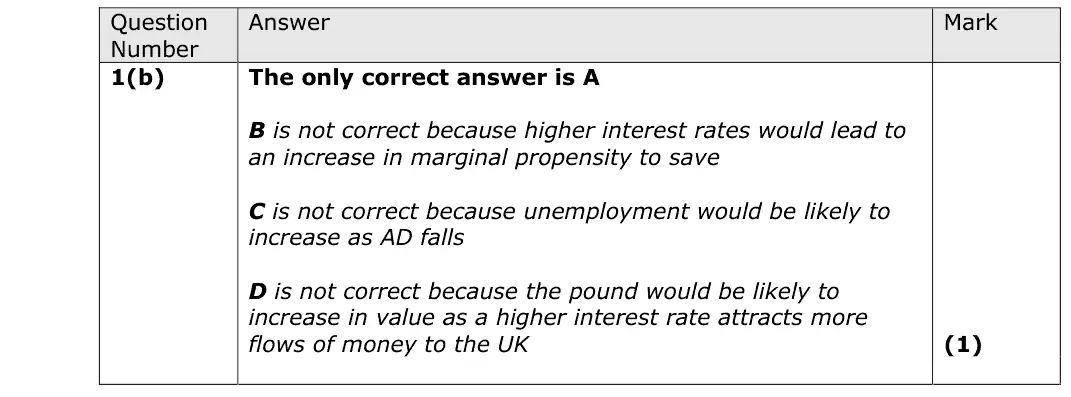
1(b) Demand-side policies: fiscal and monetary policy 1Multiple choice
2(a) Employment and unemployment 1Multiple choice
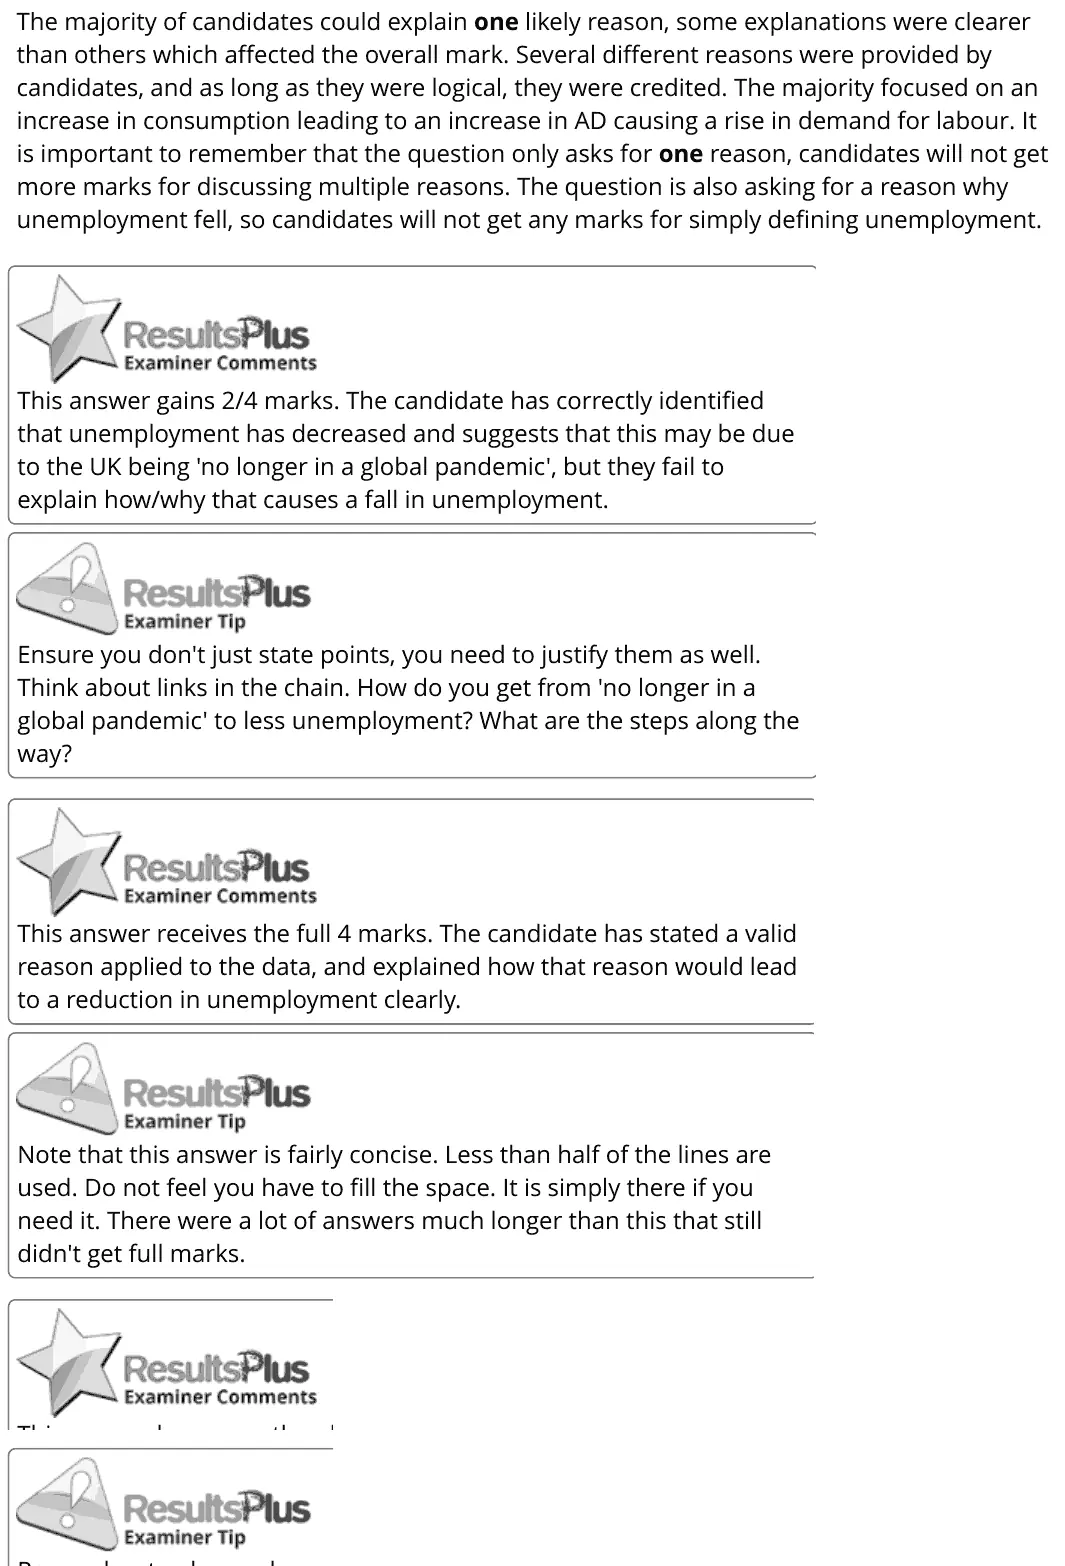
2(b) Employment and unemployment 4AO1=2,AO2=1,AO3=1Short answer
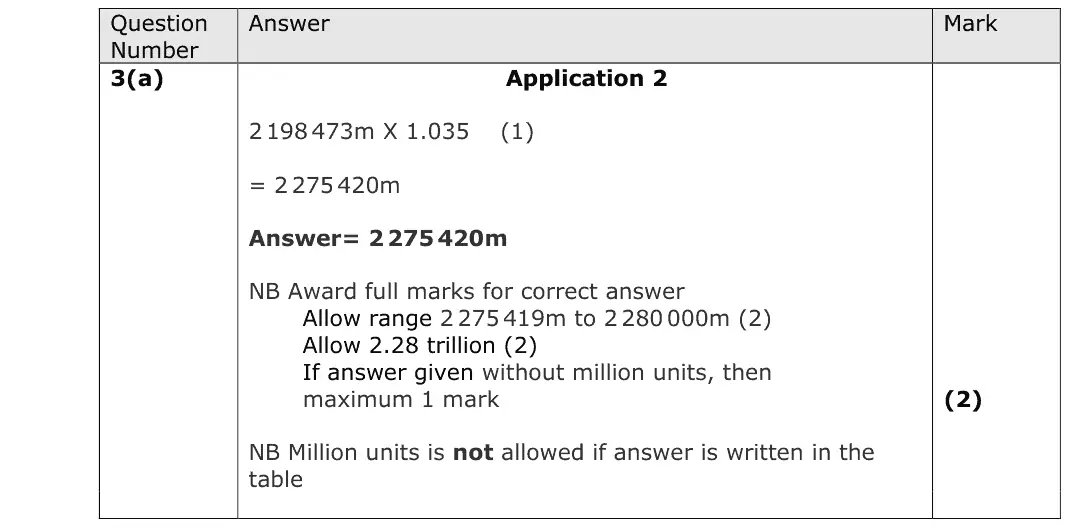
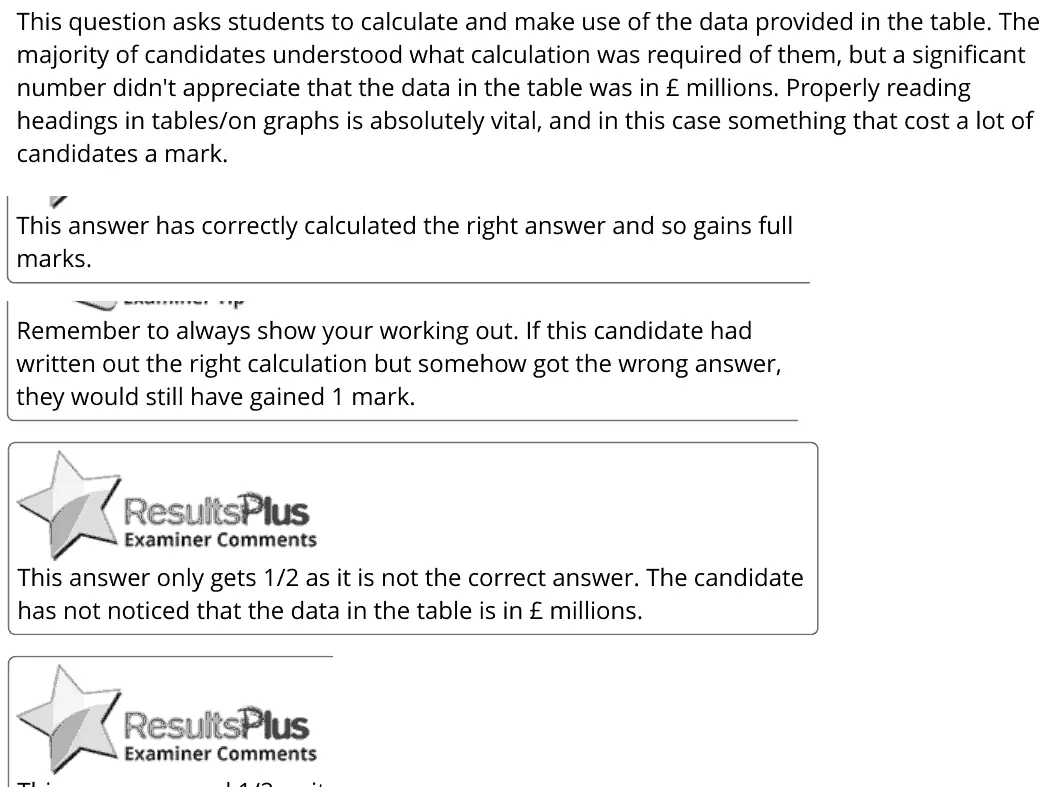
3(a) Measuring economic growth: GDP, GNI and living standards 2AO2=2Calculation
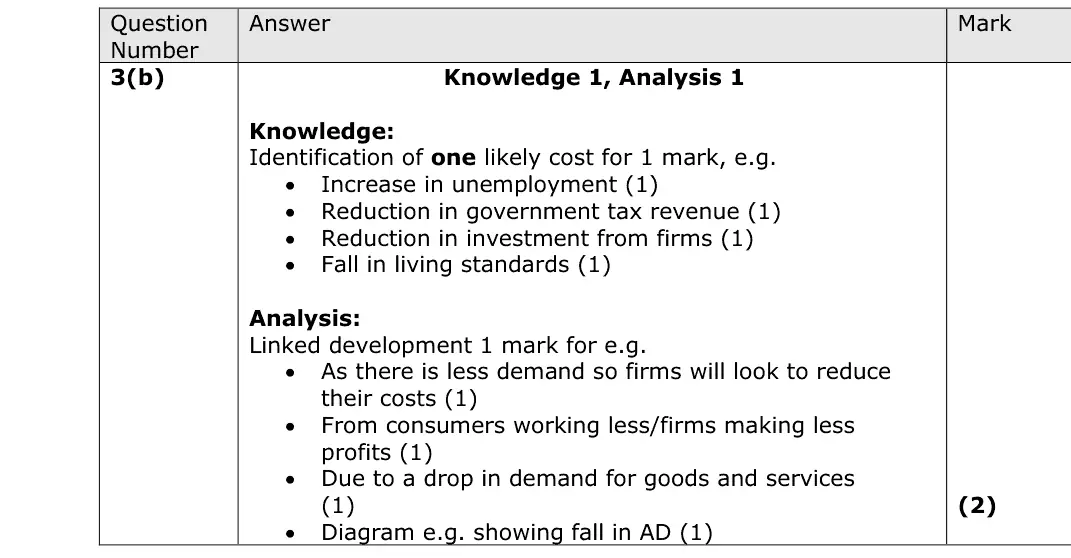
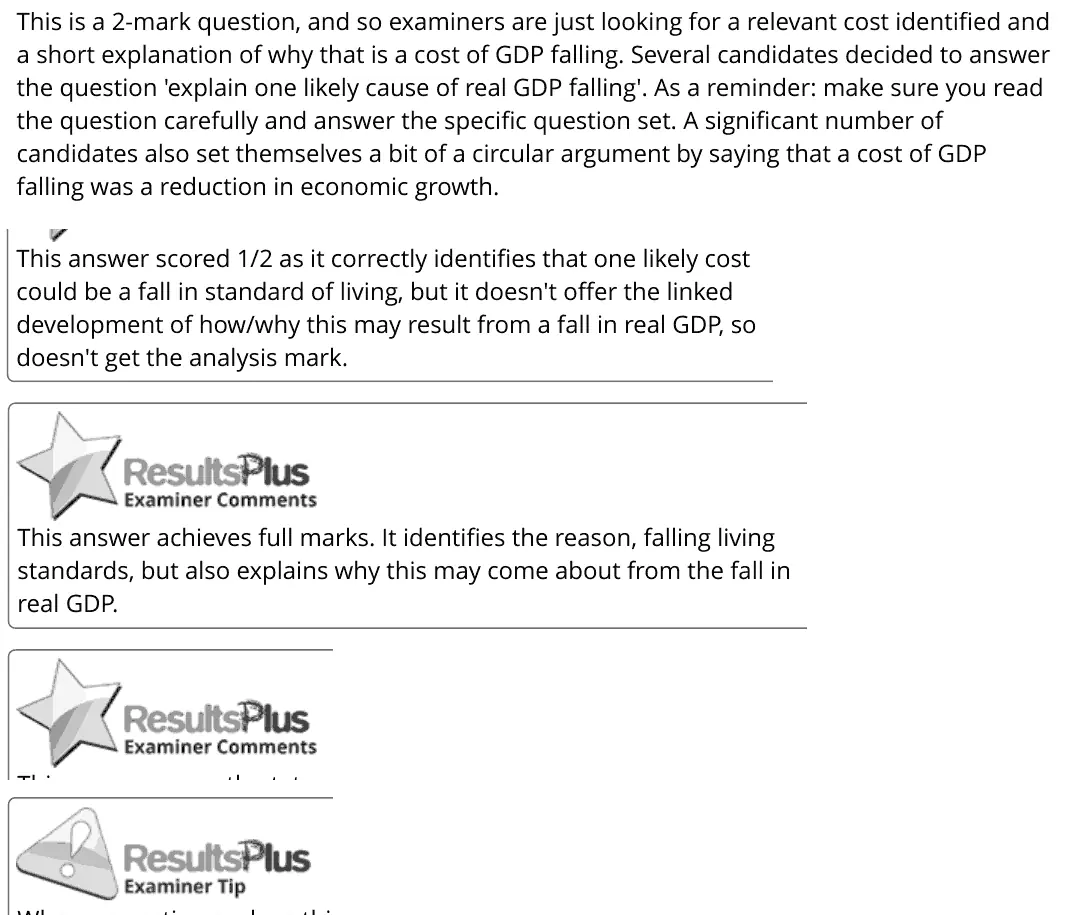
3(b) Economic growth, output gaps and the trade cycle 2AO1=1,AO3=1Short answer
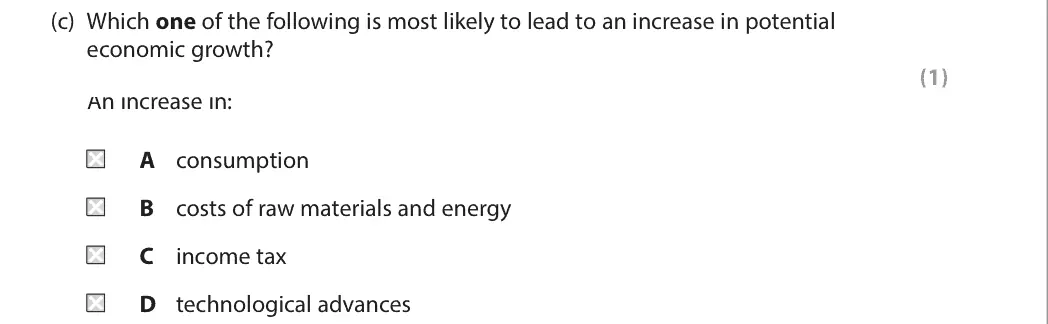
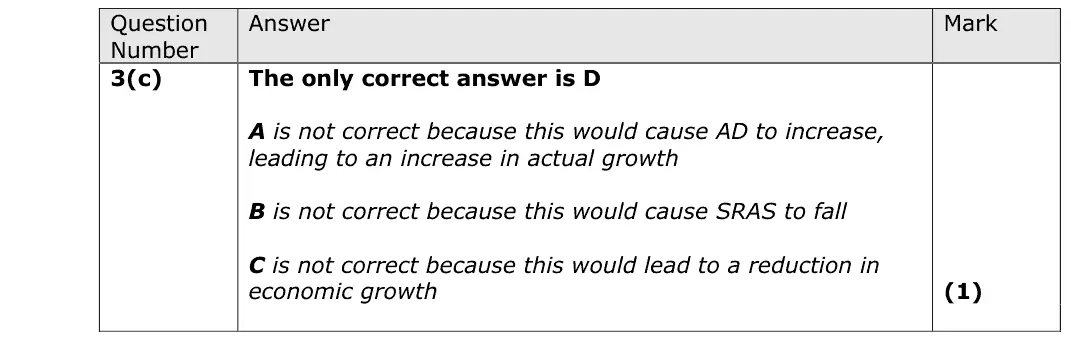
3(c) Economic growth, output gaps and the trade cycle 1Multiple choice
4(a) Aggregate demand 1Multiple choice
4(b) The circular flow, national income and the multiplier 4AO2=3,AO3=1Short answer
5(a) Public expenditure, taxation and public sector finances 2AO2=2Calculation
5(b) Public expenditure, taxation and public sector finances 2AO1=2Short answer
5(c) Public expenditure, taxation and public sector finances 1Multiple choice
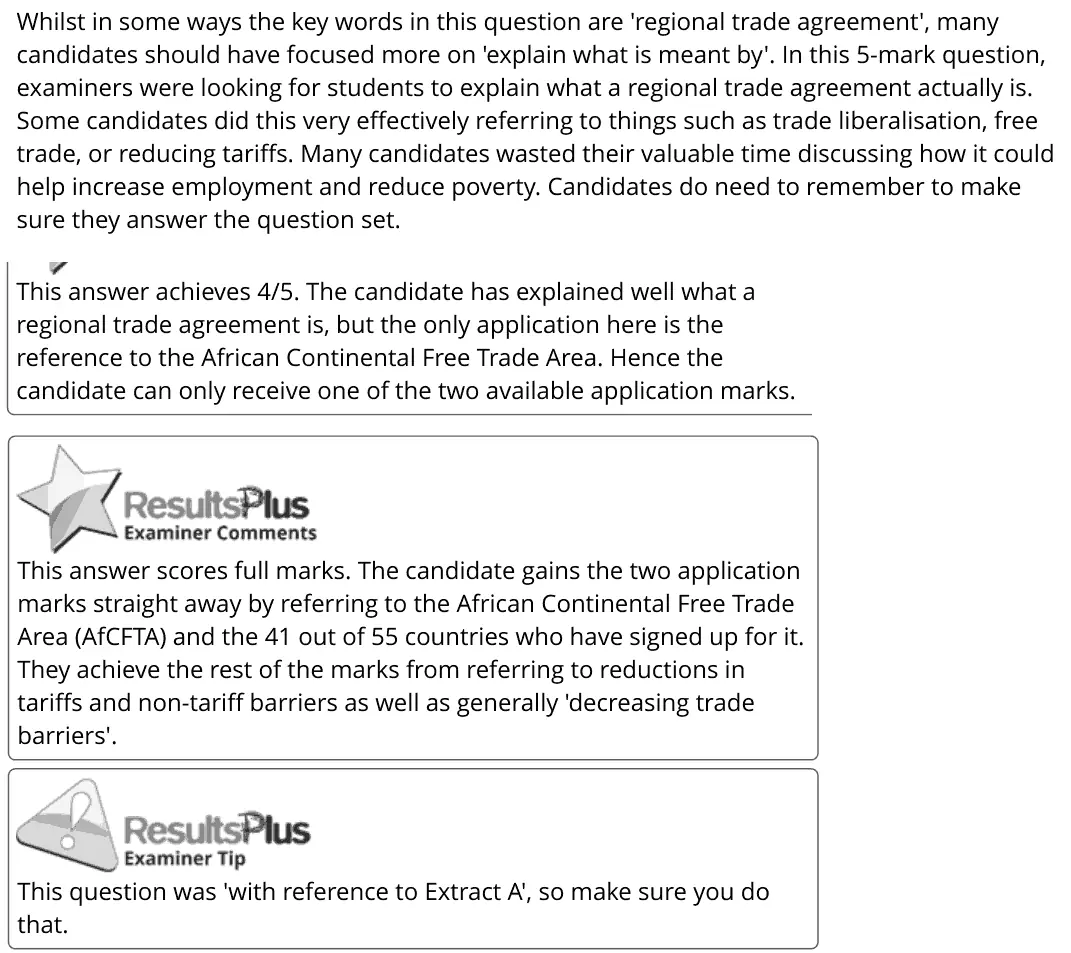
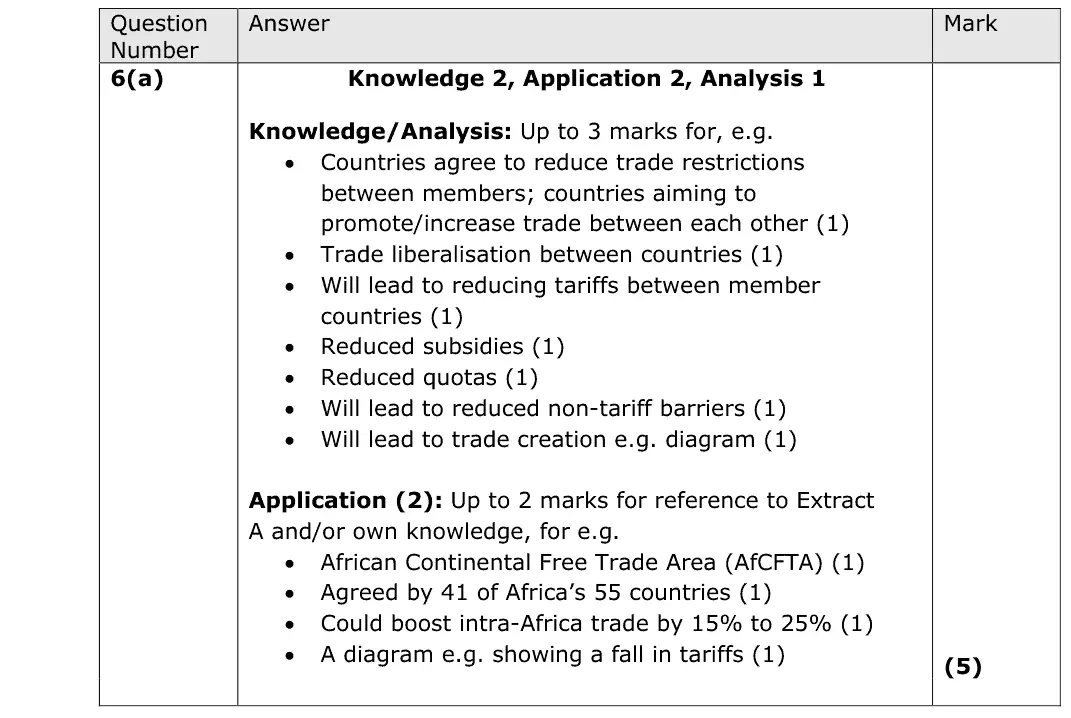
6(a) Trading blocs, the WTO and protectionism 5AO1=2,AO2=2,AO3=1Short answer
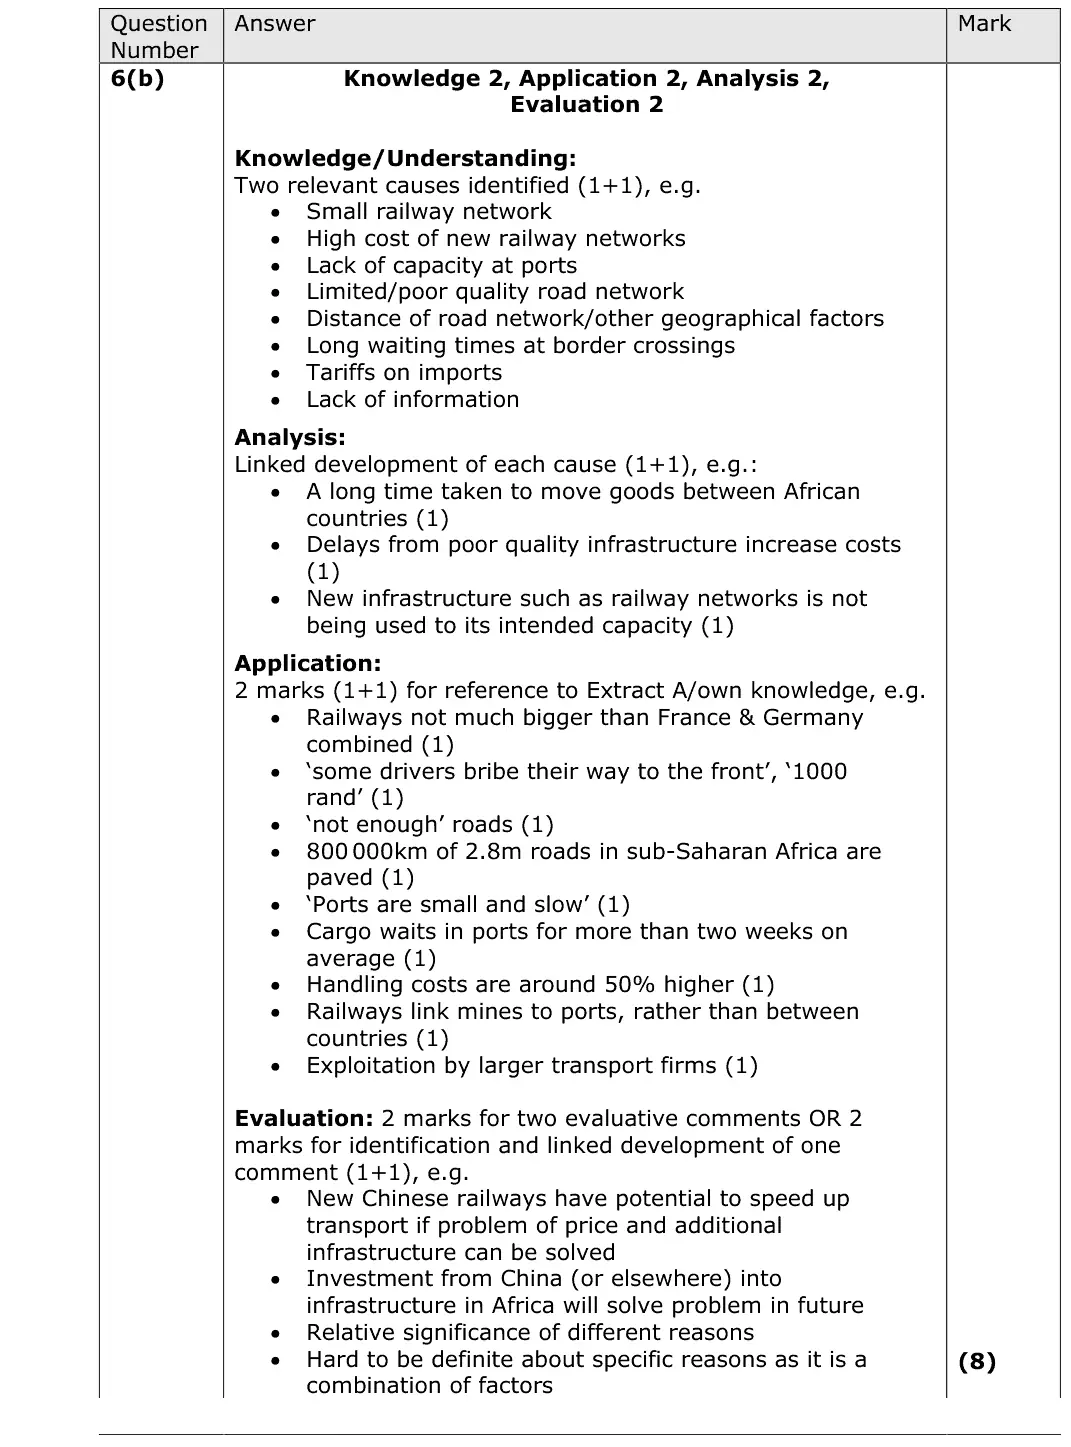
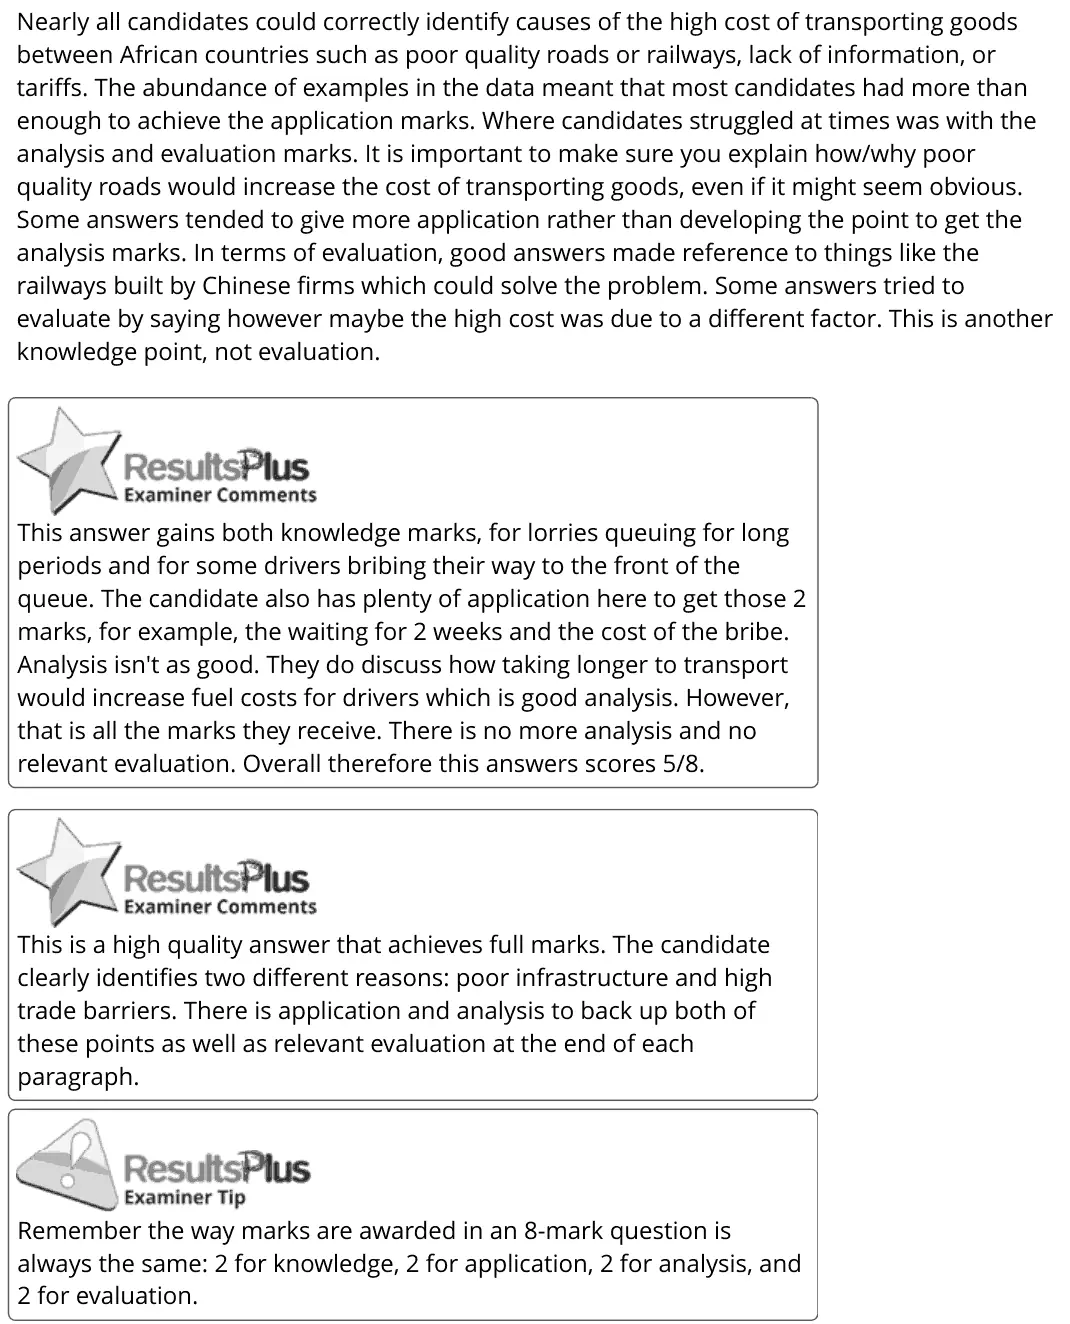
6(b) Emerging and developing economies 8AO1=2,AO2=2,AO3=2,AO4=2Extended response
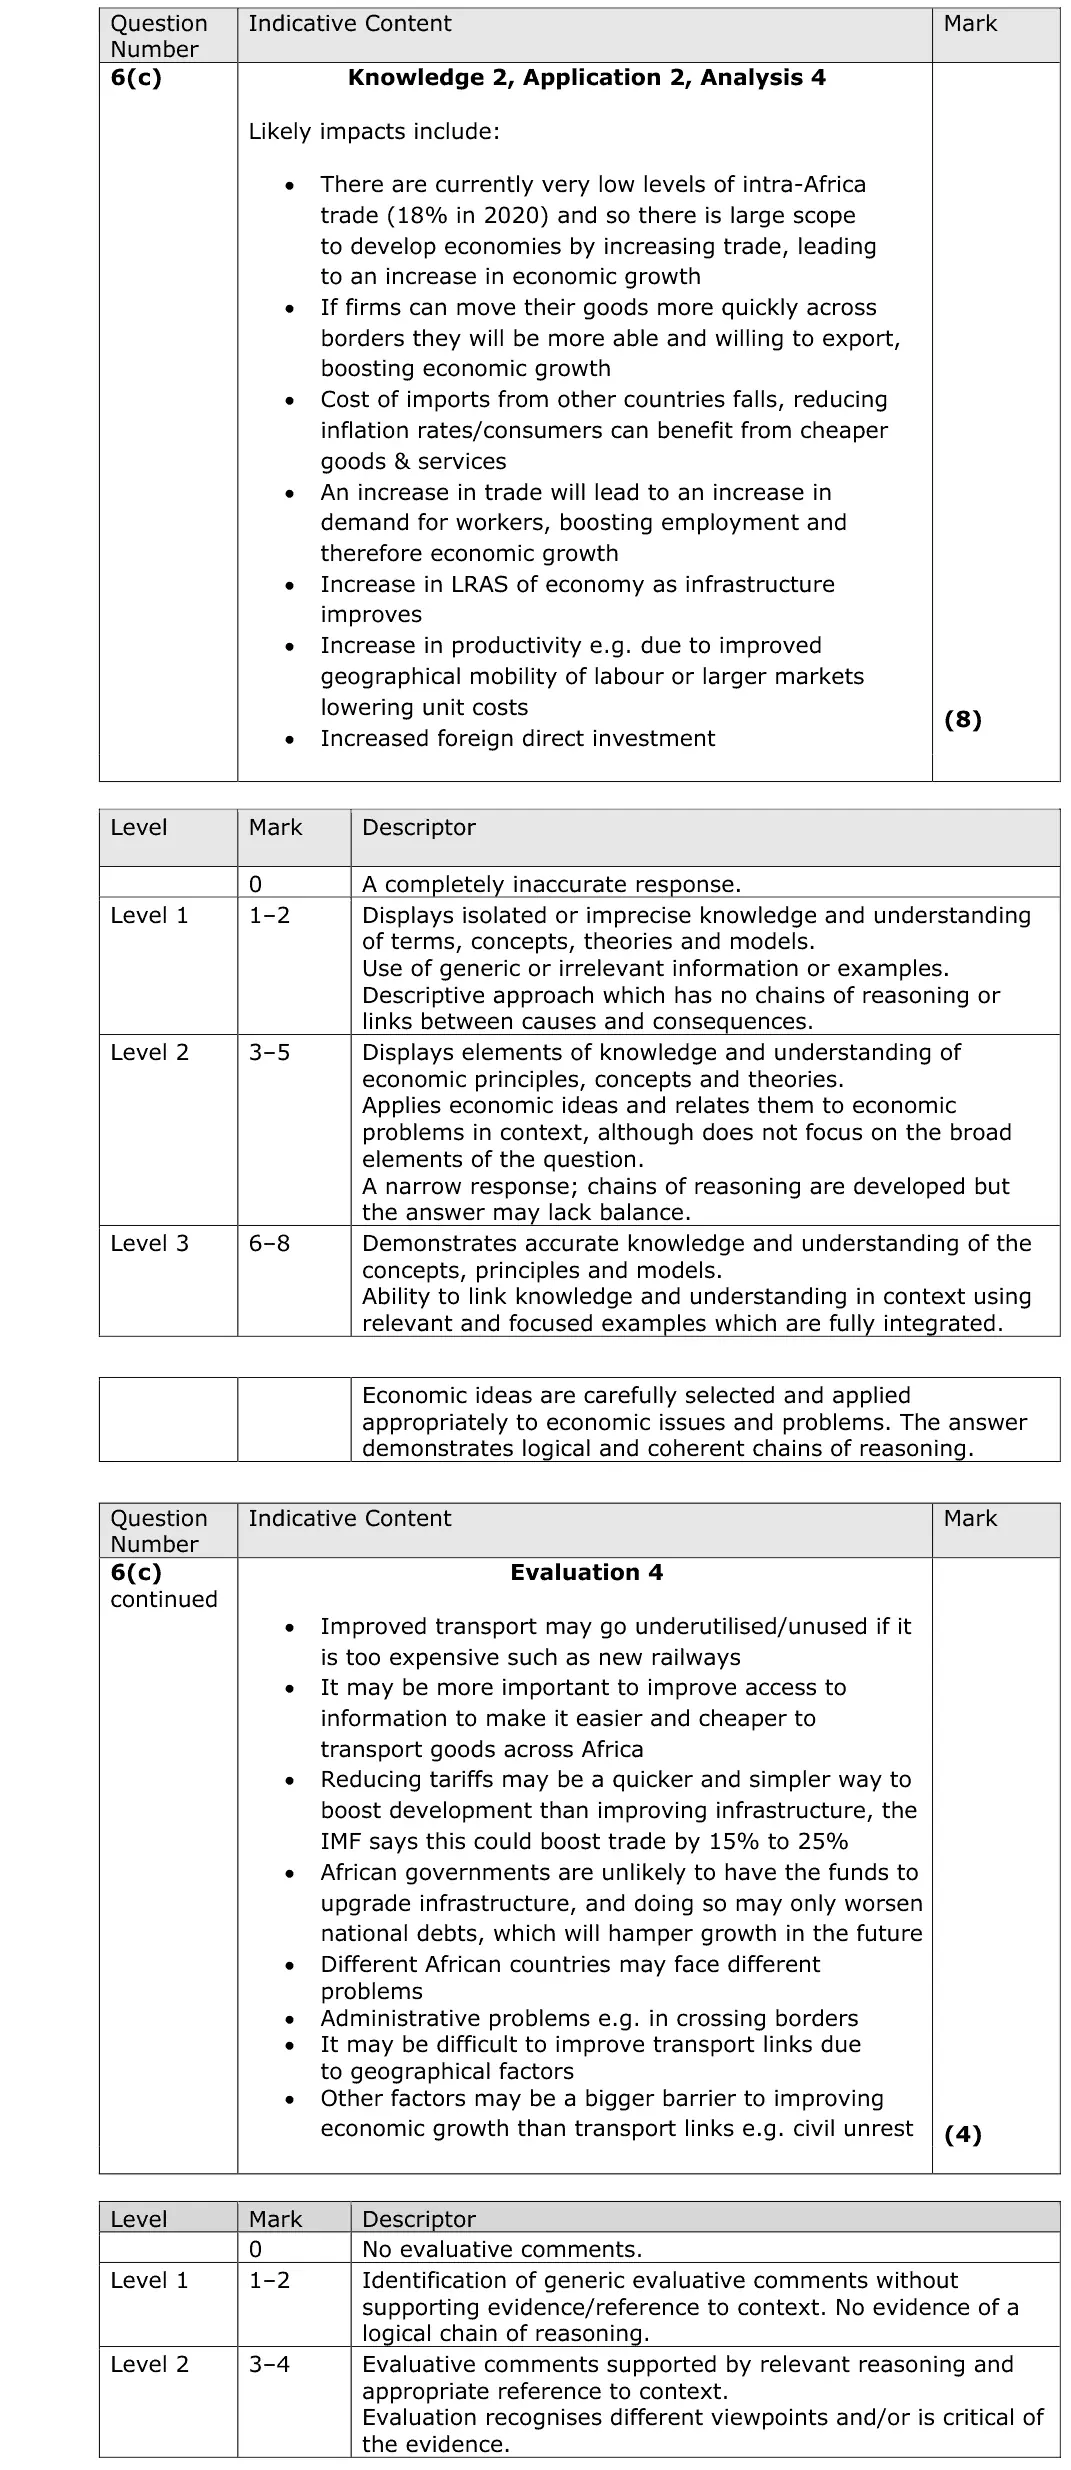
6(c) Emerging and developing economies, Economic growth, output gaps and the trade cycle 12AO1=2,AO2=2,AO3=4,AO4=4Extended response
6(d) Emerging and developing economies 10AO1=2,AO2=2,AO3=2,AO4=4Extended response
6(e) Emerging and developing economies 15AO1=3,AO2=3,AO3=3,AO4=6Extended response
7 International competitiveness 25AO1=4,AO2=4,AO3=8,AO4=9Essay
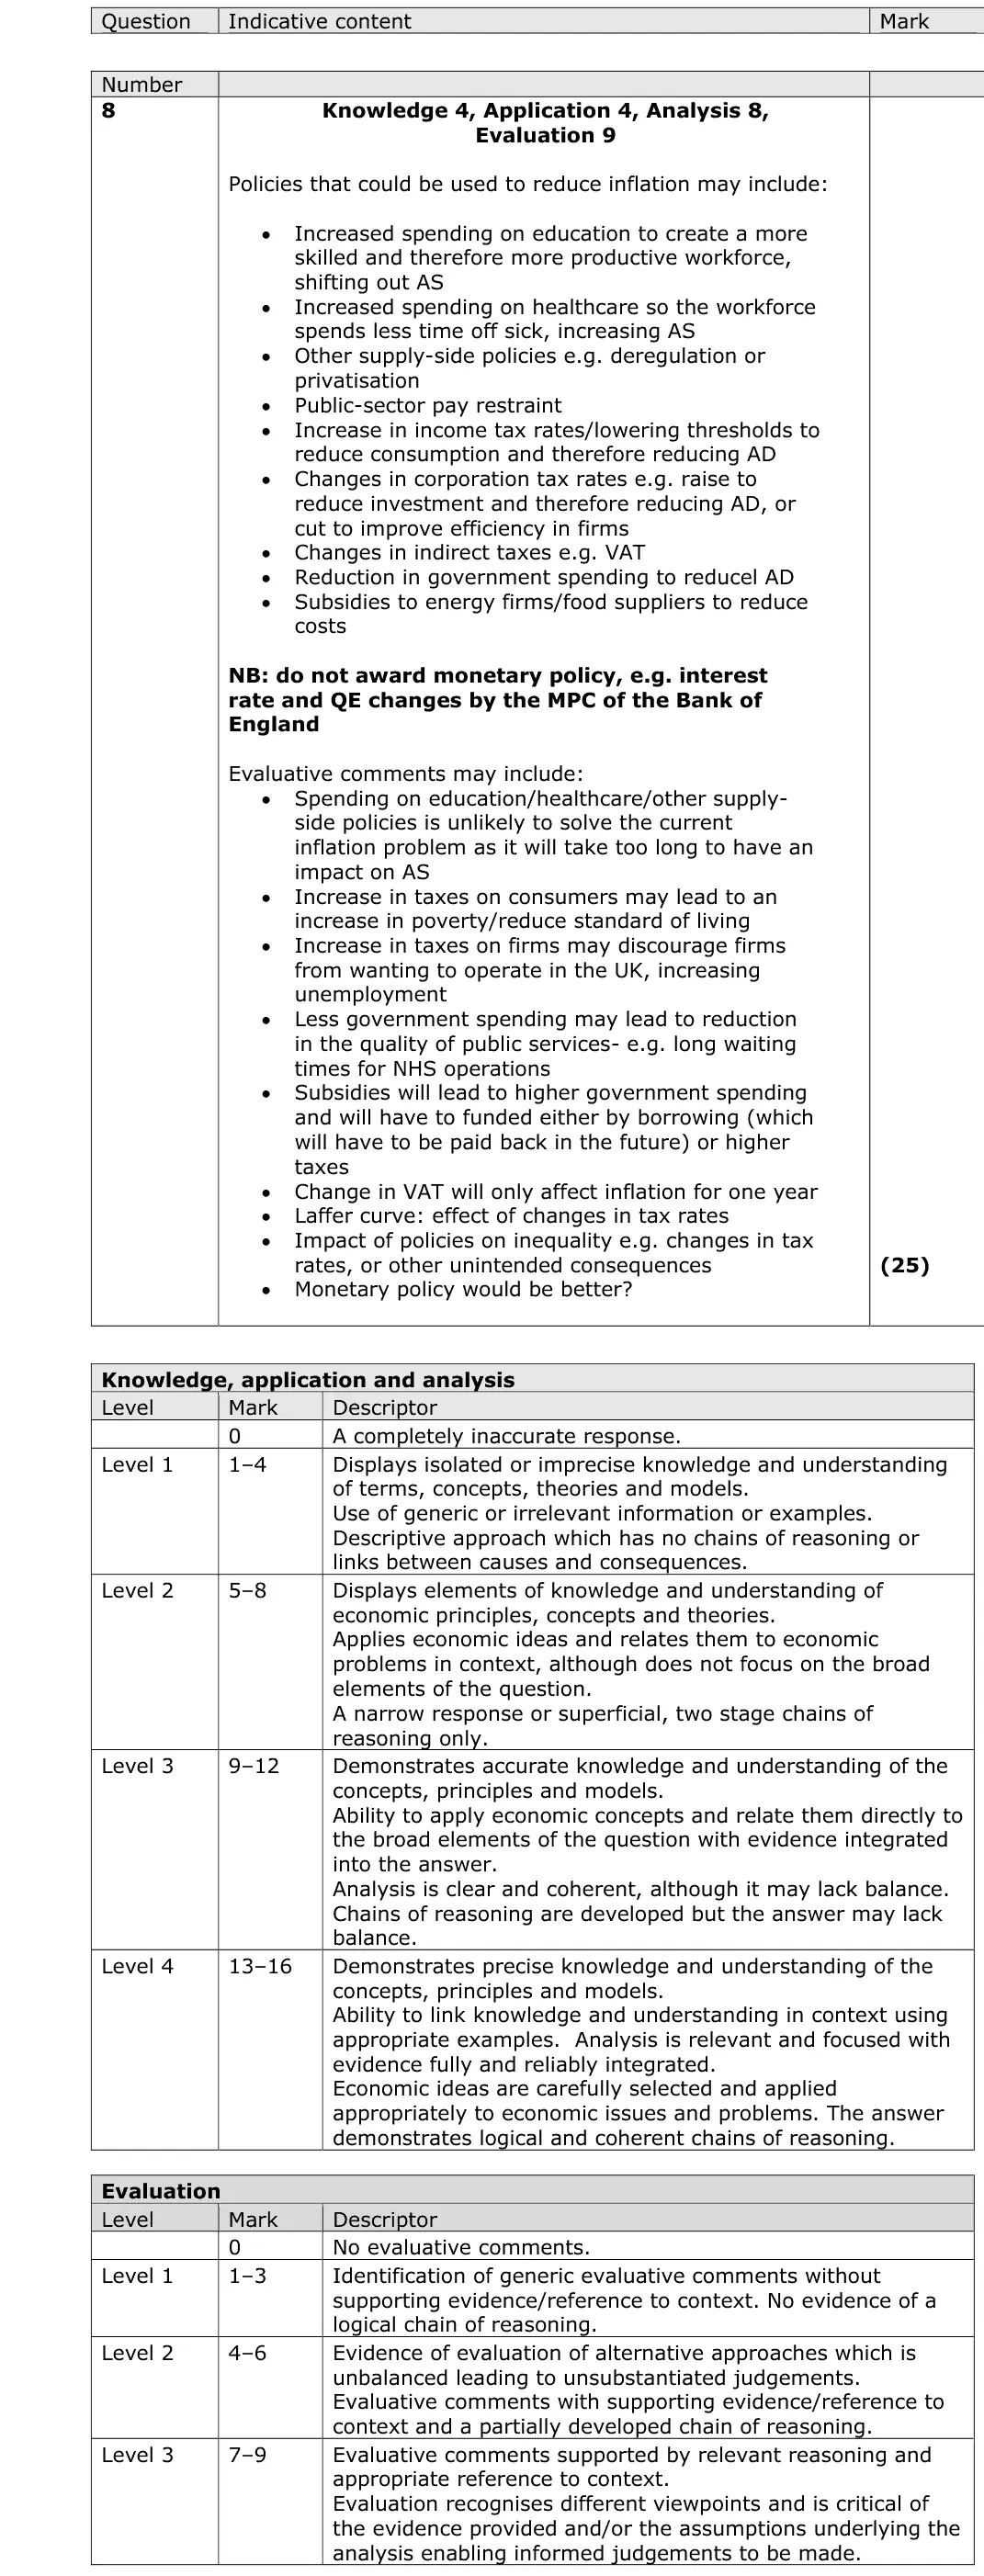
8 Supply-side policies, Demand-side policies: fiscal and monetary policy 25AO1=4,AO2=4,AO3=8,AO4=9Essay

The questions

1(a)1(b)2(a)2(b)3(a)3(b)3(c)4(a)4(b)5(a)5(b)5(c)6(a)6(b)6(c)6(d)6(e)78
June 2023 · Paper 2 · Q1(a) 4 marks AO1=2, AO2=2 Diagram fiscal and monetary policynational income and the multiplier
Data and extracts for question 11 In September 2022 the Bank of England increased the base interest rate from 1.75% to 2.25%. (Source: adapted from https://www.bankofengland.co.uk/boeapps/database/Bank-Rate.asp)
(a) Draw an aggregate demand and aggregate supply diagram to illustrate the likely impact of an increase in the UK base interest rate on the average price level and real output. (4)
June 2023 · Paper 2 · Q1(b) 1 mark Multiple choice fiscal and monetary policy
Data and extracts for question 11 In September 2022 the Bank of England increased the base interest rate from 1.75% to 2.25%. (Source: adapted from https://www.bankofengland.co.uk/boeapps/database/Bank-Rate.asp)
(b) Which one of the following is the most likely impact of an increase in the base interest rate? (1) A decrease in the: A level of demand pull inflation B marginal propensity to save C rate of cyclical unemployment D value of the pound against the dollar
June 2023 · Paper 2 · Q2(a) 1 mark Multiple choice unemployment
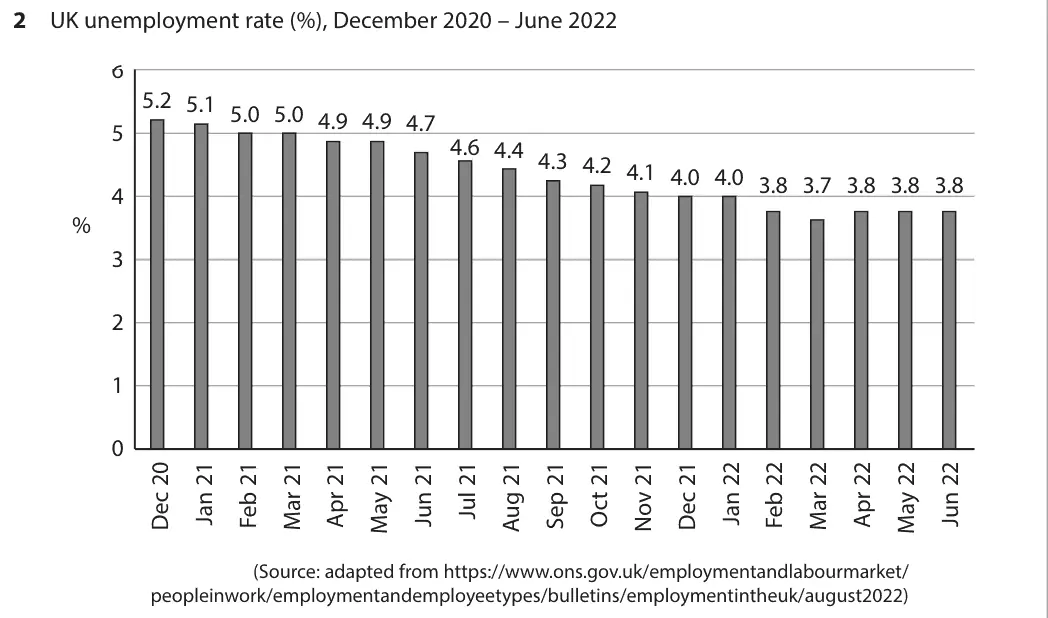
Data and extracts for question 22 UK unemployment rate (%), December 2020 – June 2022 6 5.2 5.1 5.0 5.0 4.9 4.9 4.7 5 4.6 4.4 4.3 4.2 4.1 4.0 4.0 3.8 3.7 3.8 3.8 3.8 4 % 3 2 1 0 (Source: adapted from https://www.ons.gov.uk/employmentandlabourmarket/ peopleinwork/employmentandemployeetypes/bulletins/employmentintheuk/august2022)
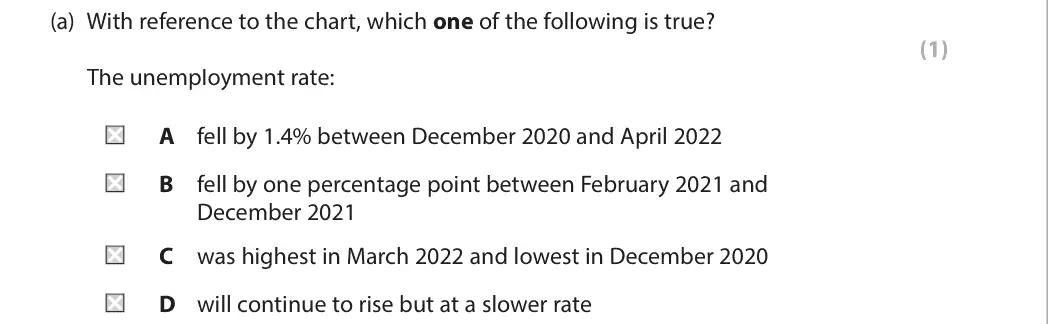
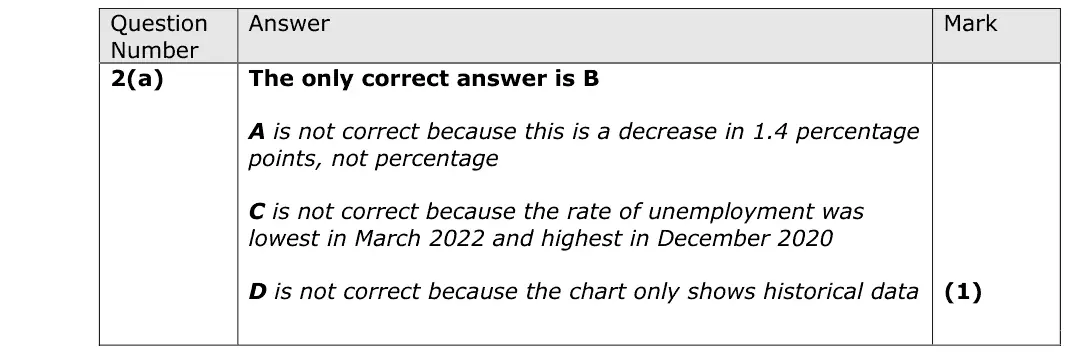
(a) With reference to the chart, which one of the following is true? (1) The unemployment rate: A fell by 1.4% between December 2020 and April 2022 B fell by one percentage point between February 2021 and December 2021 C was highest in March 2022 and lowest in December 2020 D will continue to rise but at a slower rate
June 2023 · Paper 2 · Q2(b) 4 marks AO1=2, AO2=1, AO3=1 Short answer unemployment
Data and extracts for question 22 UK unemployment rate (%), December 2020 – June 2022 6 5.2 5.1 5.0 5.0 4.9 4.9 4.7 5 4.6 4.4 4.3 4.2 4.1 4.0 4.0 3.8 3.7 3.8 3.8 3.8 4 % 3 2 1 0 (Source: adapted from https://www.ons.gov.uk/employmentandlabourmarket/ peopleinwork/employmentandemployeetypes/bulletins/employmentintheuk/august2022)
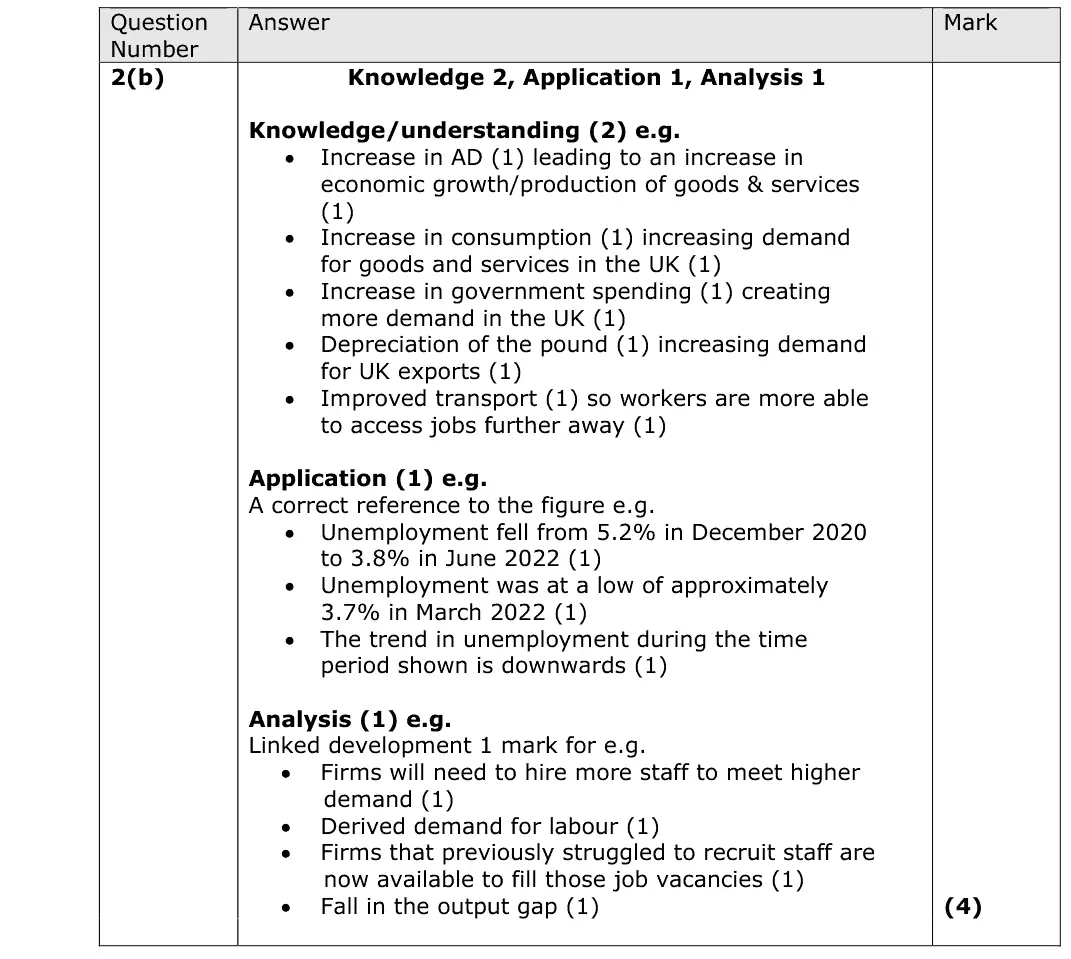
(b) With reference to the chart on the previous page, explain one likely reason for the change in the UK’s rate of unemployment. (4)
June 2023 · Paper 2 · Q3(a) 2 marks AO2=2 Calculation measuring economic growth
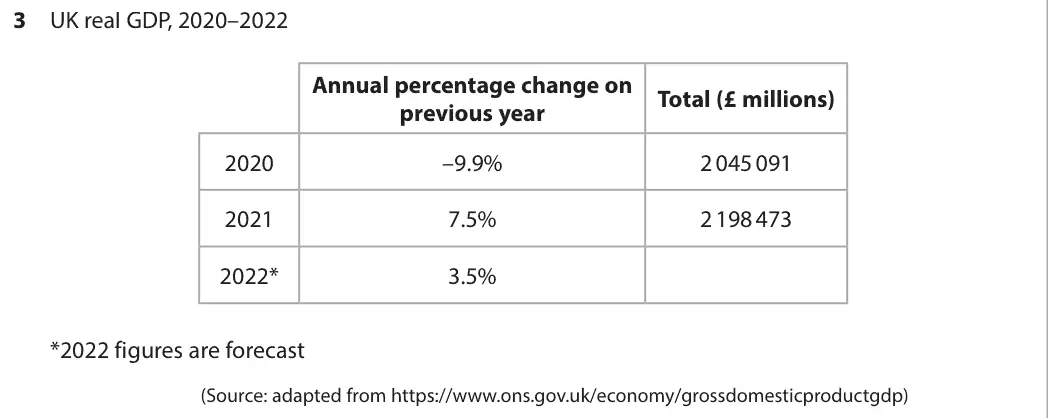
Data and extracts for question 33 UK real GDP, 2020–2022 Annual percentage change on Total (£ millions) previous year 2020 –9.9% 2 045 091 2021 7.5% 2 198 473 2022* 3.5% *2022 figures are forecast (Source: adapted from https://www.ons.gov.uk/economy/grossdomesticproductgdp)
(a) Calculate the value of the total forecast GDP in 2022. (2)
June 2023 · Paper 2 · Q3(b) 2 marks AO1=1, AO3=1 Short answer economic growth and the trade cycle
Data and extracts for question 33 UK real GDP, 2020–2022 Annual percentage change on Total (£ millions) previous year 2020 –9.9% 2 045 091 2021 7.5% 2 198 473 2022* 3.5% *2022 figures are forecast (Source: adapted from https://www.ons.gov.uk/economy/grossdomesticproductgdp)
(b) Explain one likely cost of UK real GDP falling by 9.9% in 2020. (2)
June 2023 · Paper 2 · Q3(c) 1 mark Multiple choice economic growth and the trade cycle
Data and extracts for question 33 UK real GDP, 2020–2022 Annual percentage change on Total (£ millions) previous year 2020 –9.9% 2 045 091 2021 7.5% 2 198 473 2022* 3.5% *2022 figures are forecast (Source: adapted from https://www.ons.gov.uk/economy/grossdomesticproductgdp)
(c) Which one of the following is most likely to lead to an increase in potential economic growth? (1) An increase in: A consumption B costs of raw materials and energy C income tax D technological advances
June 2023 · Paper 2 · Q4(a) 1 mark Multiple choice aggregate demand
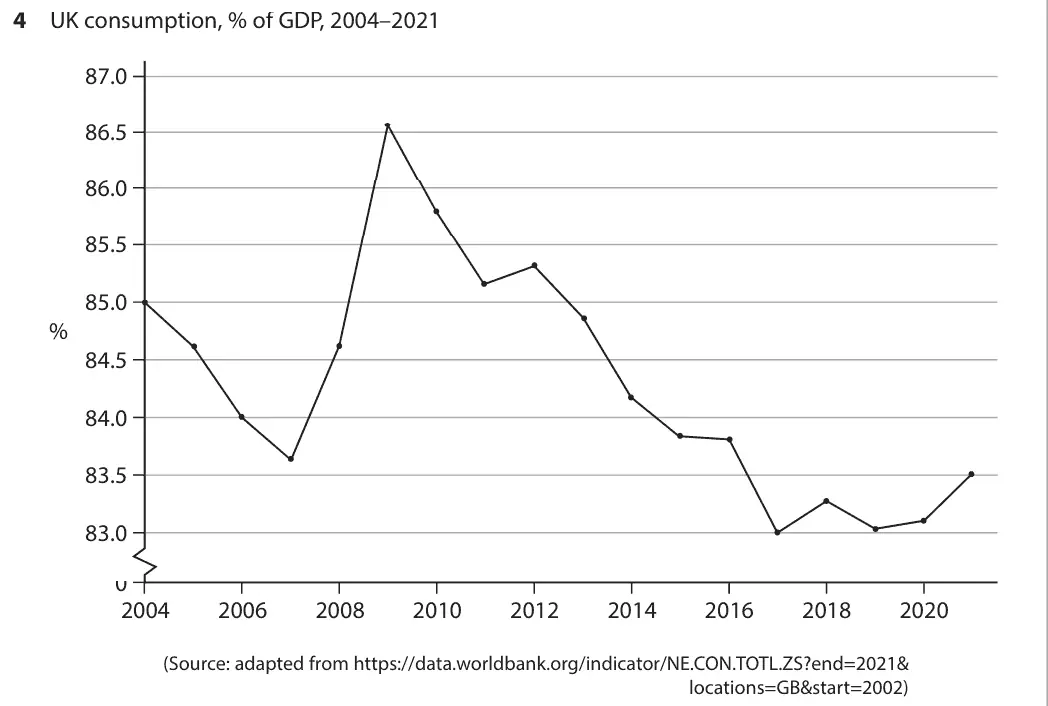
Data and extracts for question 44 UK consumption, % of GDP, 2004–2021 87.0 86.5 86.0 85.5 85.0 % 84.5 84.0 83.5 83.0 0 2004 2006 2008 2010 2012 2014 2016 2018 2020 (Source: adapted from https://data.worldbank.org/indicator/NE.CON.TOTL.ZS?end=2021& locations=GB&start=2002)
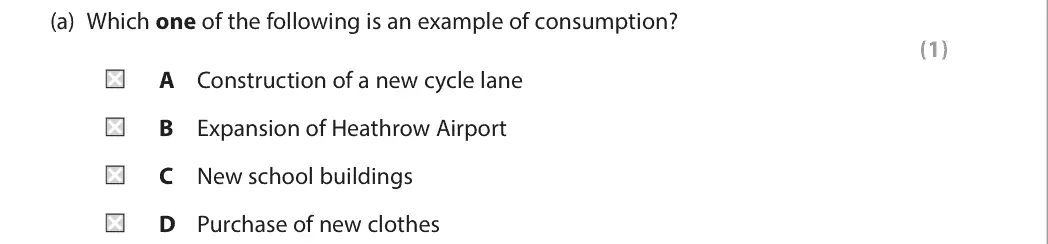
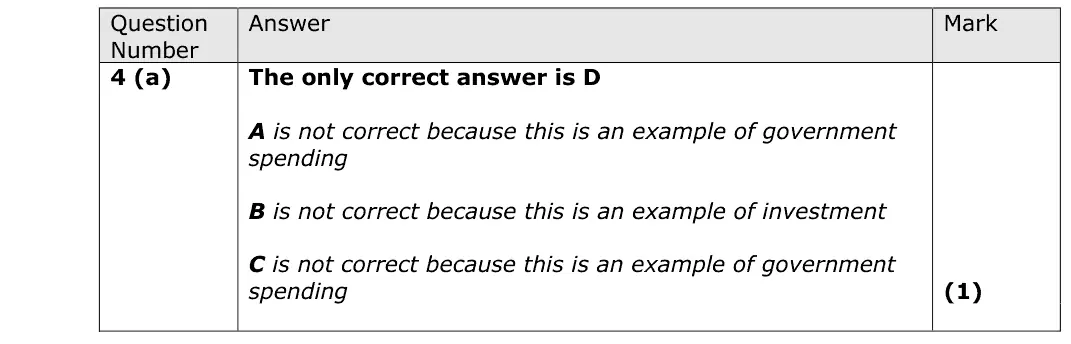
(a) Which one of the following is an example of consumption? (1) A Construction of a new cycle lane B Expansion of Heathrow Airport C New school buildings D Purchase of new clothes
June 2023 · Paper 2 · Q4(b) 4 marks AO2=3, AO3=1 Short answer national income and the multiplier
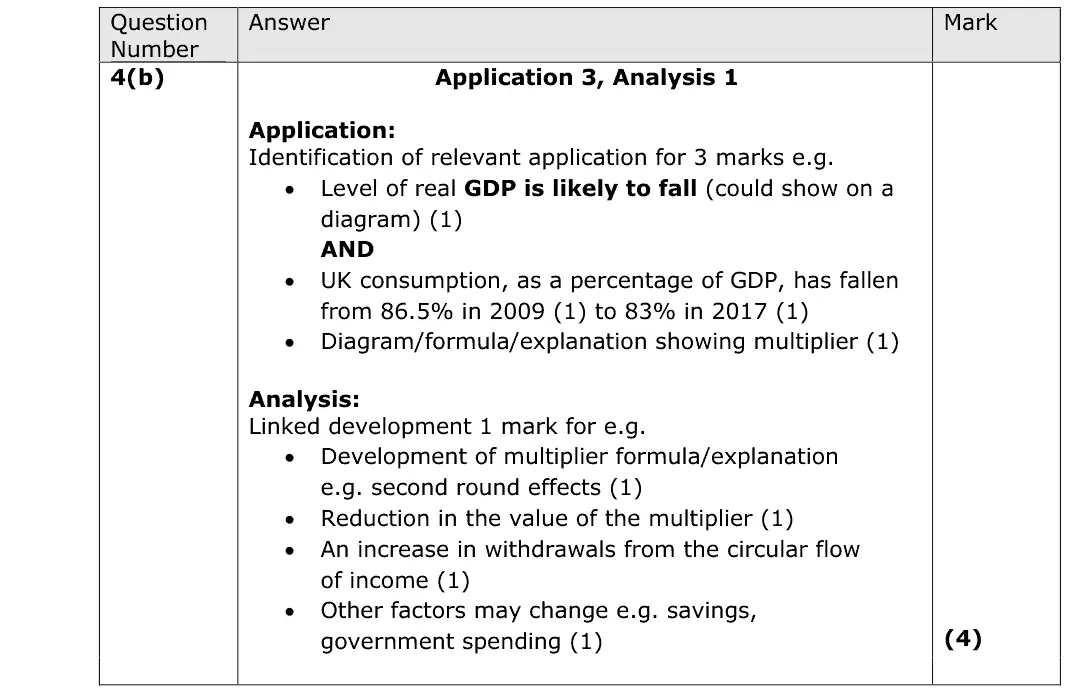
Data and extracts for question 44 UK consumption, % of GDP, 2004–2021 87.0 86.5 86.0 85.5 85.0 % 84.5 84.0 83.5 83.0 0 2004 2006 2008 2010 2012 2014 2016 2018 2020 (Source: adapted from https://data.worldbank.org/indicator/NE.CON.TOTL.ZS?end=2021& locations=GB&start=2002)
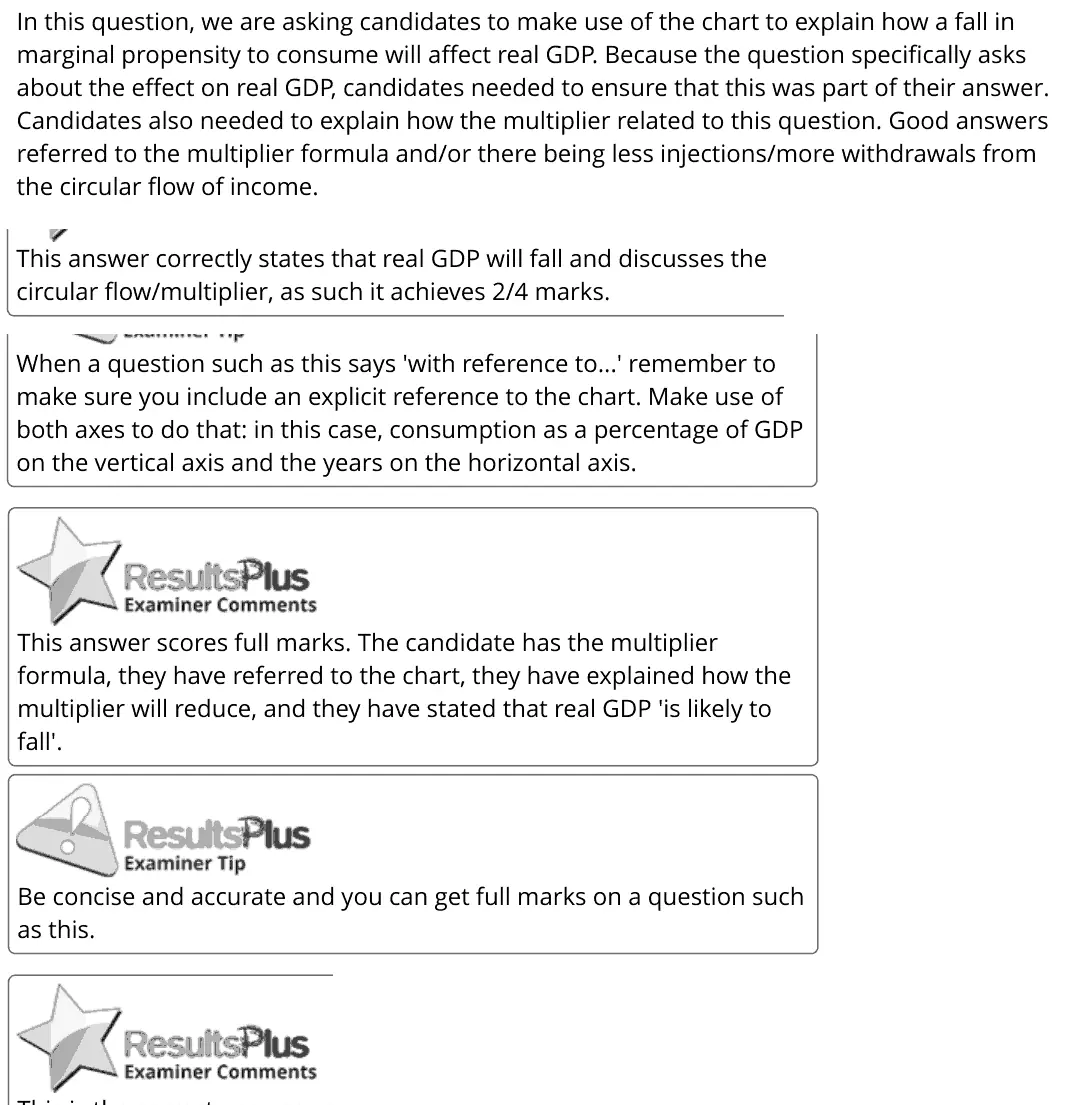
(b) With reference to the chart on the previous page, explain the likely effect of a fall in the marginal propensity to consume on the level of real GDP. Refer to the multiplier in your answer. (4)
June 2023 · Paper 2 · Q5(a) 2 marks AO2=2 Calculation public finances and taxation
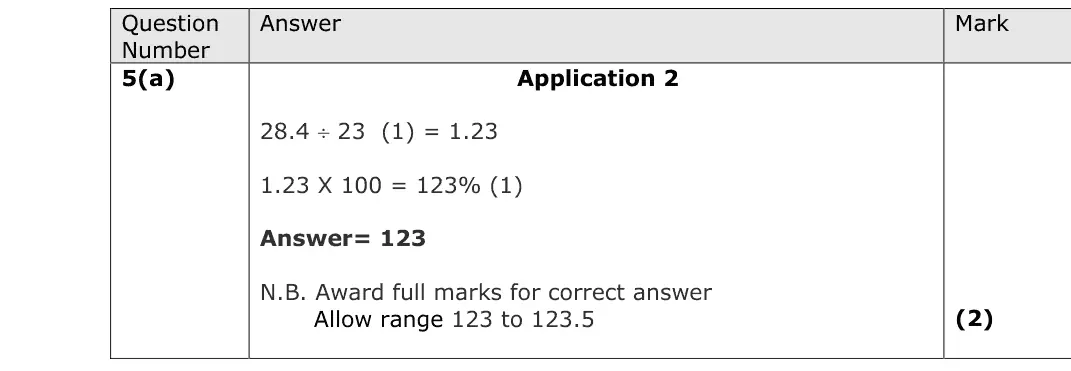
Data and extracts for question 55 In 2021, the US total GDP was $23 trillion and national debt was $28.4 trillion. (Source: adapted from https://data.worldbank.org/indicator/NY.GDP.MKTP.CD?locations=US and https://fiscaldata.treasury.gov/national-debt/)
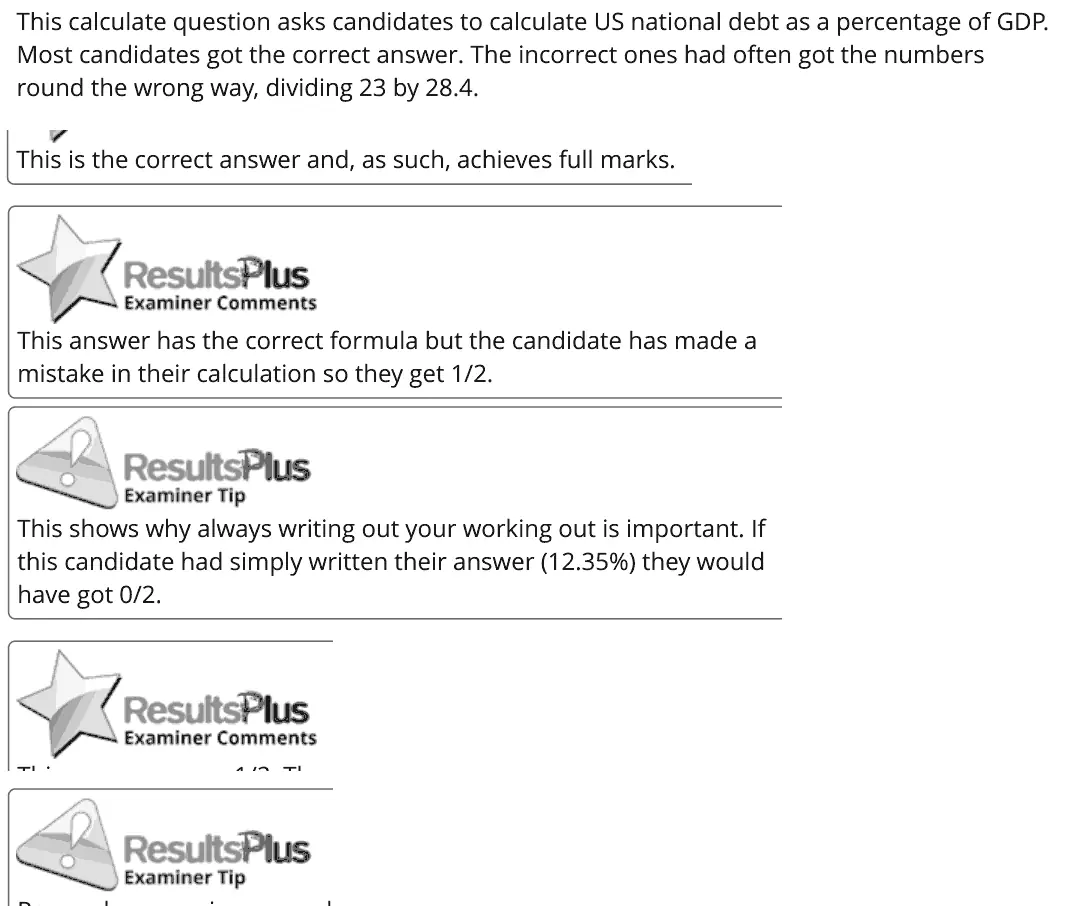
(a) Calculate the US national debt in 2021 as a percentage of GDP. (2)
June 2023 · Paper 2 · Q5(b) 2 marks AO1=2 Short answer public finances and taxation
Data and extracts for question 55 In 2021, the US total GDP was $23 trillion and national debt was $28.4 trillion. (Source: adapted from https://data.worldbank.org/indicator/NY.GDP.MKTP.CD?locations=US and https://fiscaldata.treasury.gov/national-debt/)
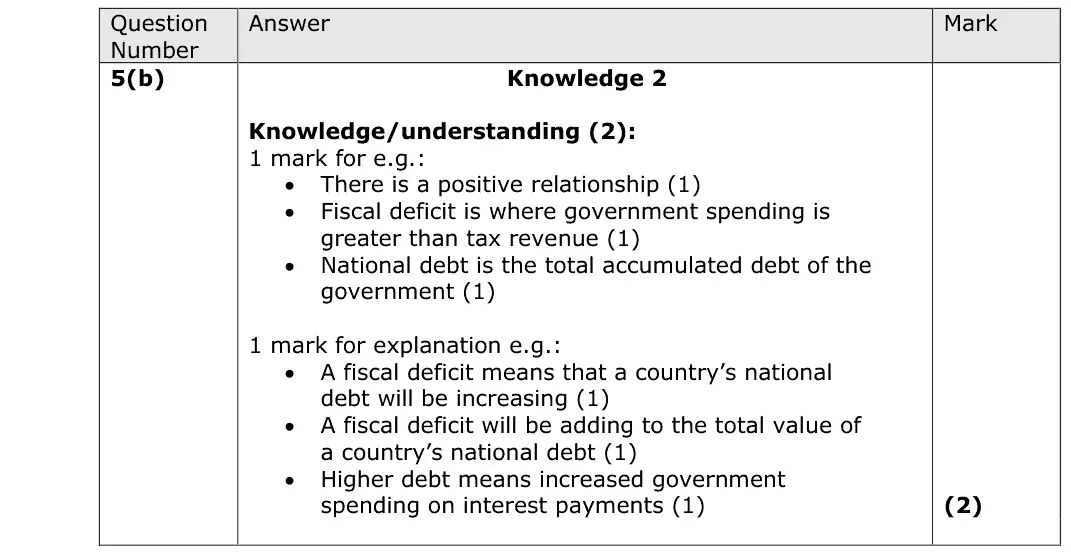
(b) Explain the relationship between a fiscal deficit and the national debt. (2)
June 2023 · Paper 2 · Q5(c) 1 mark Multiple choice public finances and taxation
Data and extracts for question 55 In 2021, the US total GDP was $23 trillion and national debt was $28.4 trillion. (Source: adapted from https://data.worldbank.org/indicator/NY.GDP.MKTP.CD?locations=US and https://fiscaldata.treasury.gov/national-debt/)
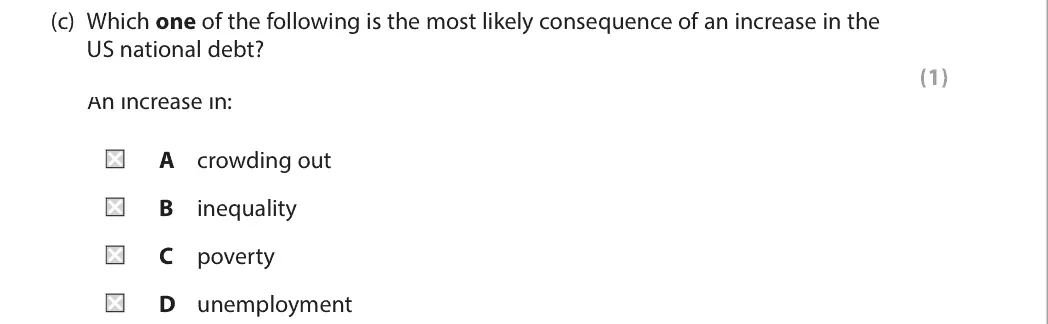
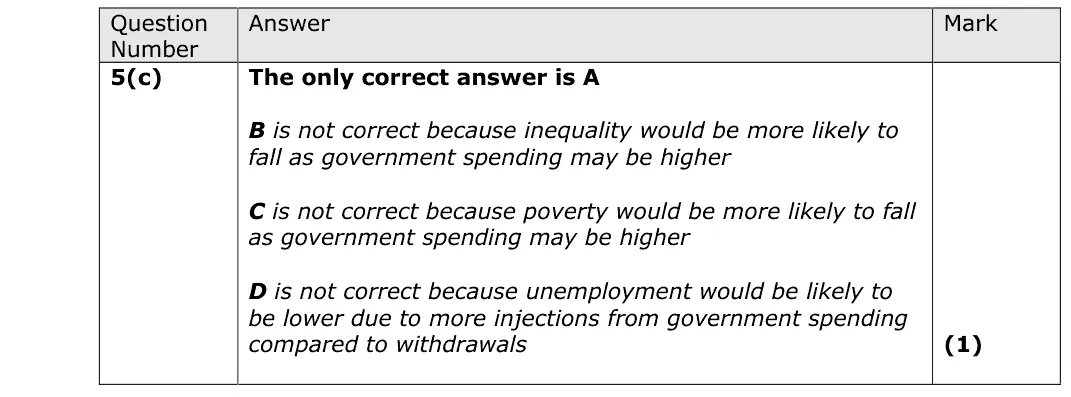
(c) Which one of the following is the most likely consequence of an increase in the US national debt? (1) An increase in: A crowding out B inequality C poverty D unemployment
June 2023 · Paper 2 · Q6(a) 5 marks AO1=2, AO2=2, AO3=1 Short answer trading blocs and protectionism
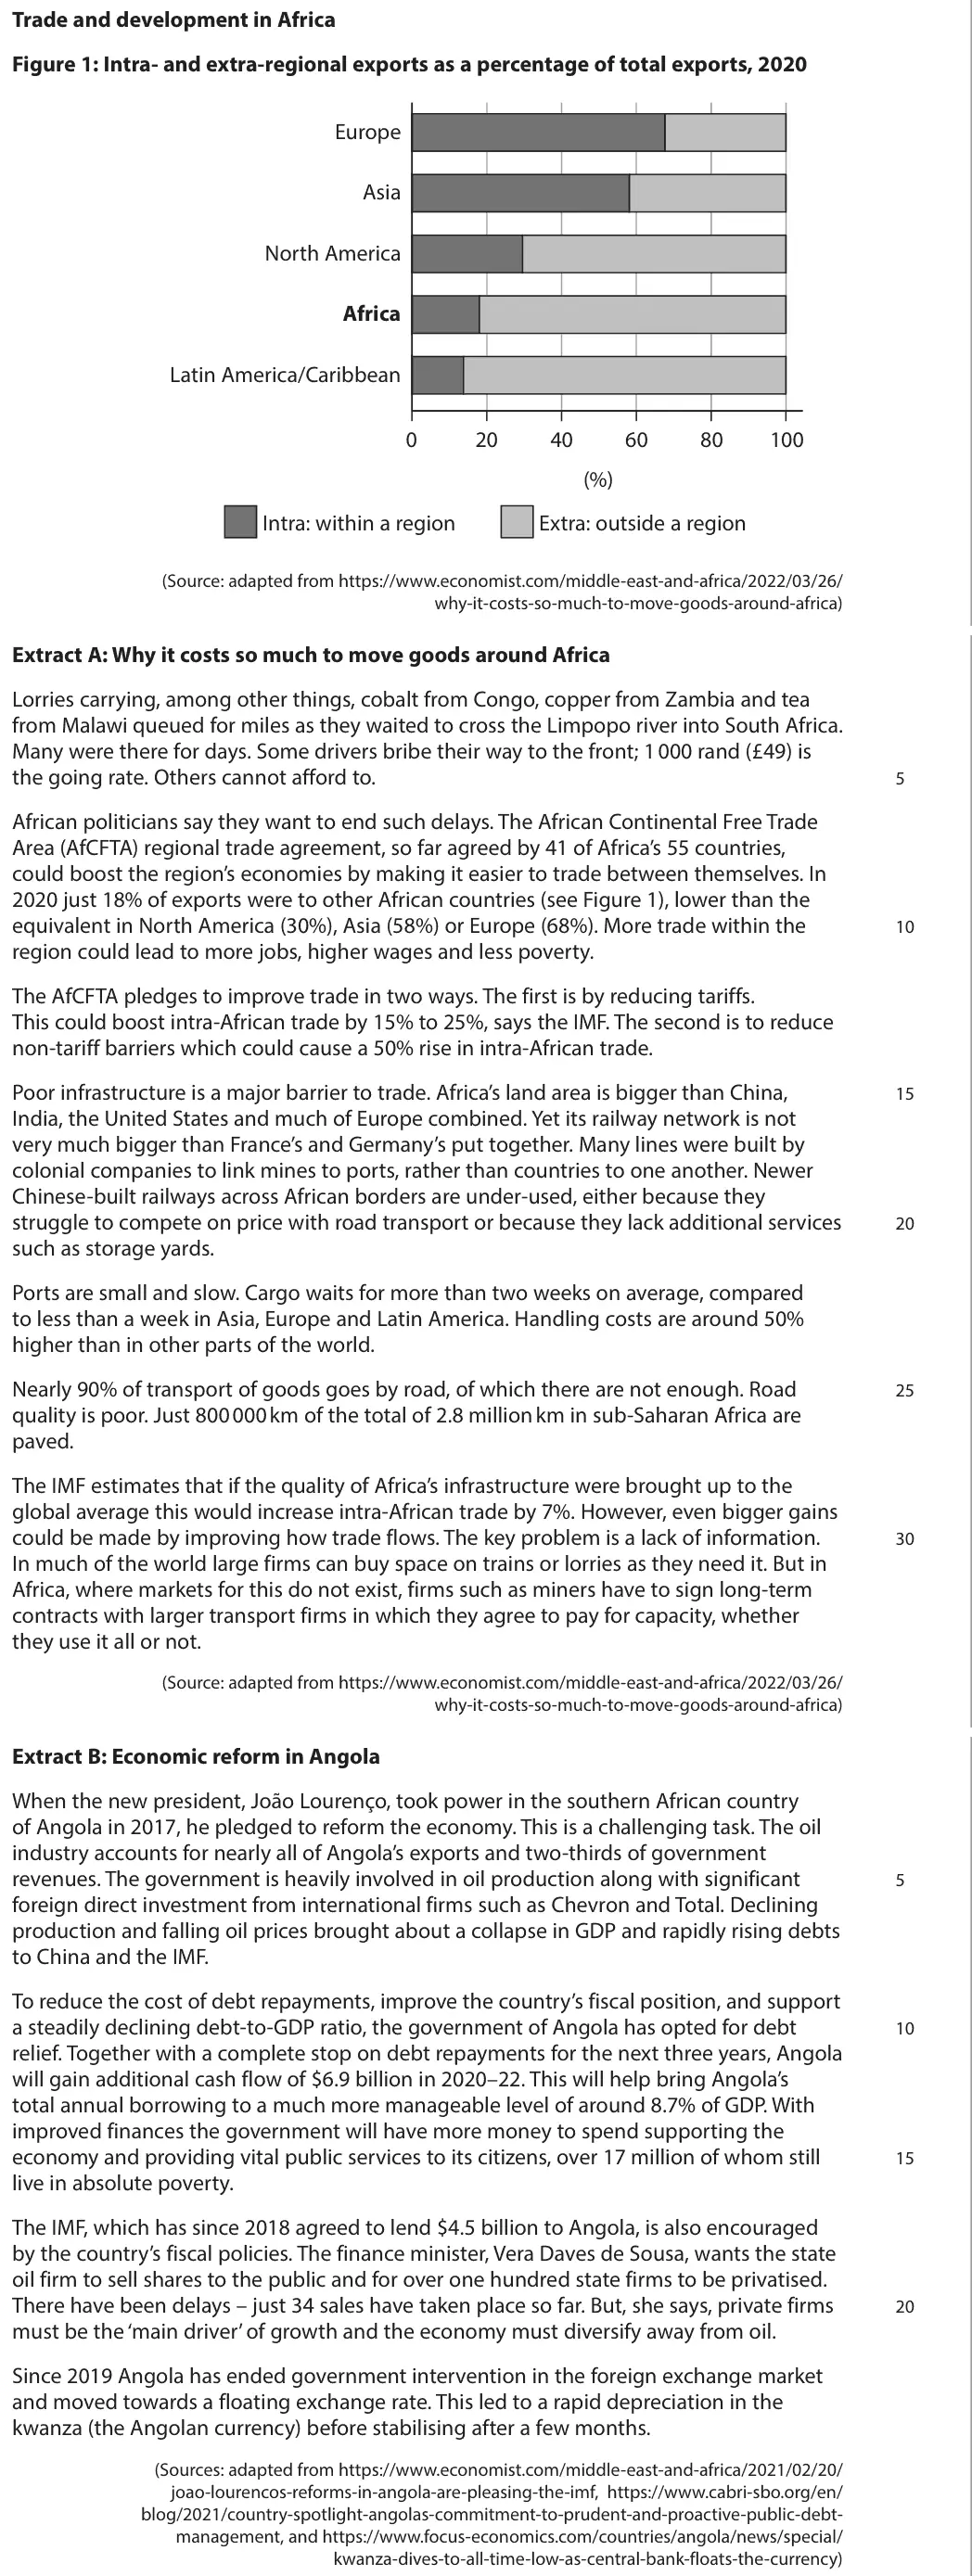
Data and extracts for question 6Trade and development in Africa Figure 1: Intra- and extra-regional exports as a percentage of total exports, 2020 Europe Asia North America Africa Latin America/Caribbean 0 20 40 60 80 100 (%) Intra: within a region Extra: outside a region (Source: adapted from https://www.economist.com/middle-east-and-africa/2022/03/26/ why-it-costs-so-much-to-move-goods-around-africa) Extract A: Why it costs so much to move goods around Africa Lorries carrying, among other things, cobalt from Congo, copper from Zambia and tea from Malawi queued for miles as they waited to cross the Limpopo river into South Africa. Many were there for days. Some drivers bribe their way to the front; 1 000 rand (£49) is the going rate. Others cannot afford to. 5 African politicians say they want to end such delays. The African Continental Free Trade Area (AfCFTA) regional trade agreement, so far agreed by 41 of Africa’s 55 countries, could boost the region’s economies by making it easier to trade between themselves. In 2020 just 18% of exports were to other African countries (see Figure 1), lower than the equivalent in North America (30%), Asia (58%) or Europe (68%). More trade within the 10 region could lead to more jobs, higher wages and less poverty. The AfCFTA pledges to improve trade in two ways. The first is by reducing tariffs. This could boost intra‑African trade by 15% to 25%, says the IMF. The second is to reduce non‑tariff barriers which could cause a 50% rise in intra‑African trade. Poor infrastructure is a major barrier to trade. Africa’s land area is bigger than China, 15 India, the United States and much of Europe combined. Yet its railway network is not very much bigger than France’s and Germany’s put together. Many lines were built by colonial companies to link mines to ports, rather than countries to one another. Newer Chinese‑built railways across African borders are under‑used, either because they struggle to compete on price with road transport or because they lack additional services 20 such as storage yards. Ports are small and slow. Cargo waits for more than two weeks on average, compared to less than a week in Asia, Europe and Latin America. Handling costs are around 50% higher than in other parts of the world. Nearly 90% of transport of goods goes by road, of which there are not enough. Road 25 quality is poor. Just 800 000 km of the total of 2.8 million km in sub‑Saharan Africa are paved. The IMF estimates that if the quality of Africa’s infrastructure were brought up to the global average this would increase intra‑African trade by 7%. However, even bigger gains could be made by improving how trade flows. The key problem is a lack of information. 30 In much of the world large firms can buy space on trains or lorries as they need it. But in Africa, where markets for this do not exist, firms such as miners have to sign long‑term contracts with larger transport firms in which they agree to pay for capacity, whether they use it all or not. (Source: adapted from https://www.economist.com/middle-east-and-africa/2022/03/26/ why-it-costs-so-much-to-move-goods-around-africa) Extract B: Economic reform in Angola When the new president, João Lourenço, took power in the southern African country of Angola in 2017, he pledged to reform the economy. This is a challenging task. The oil industry accounts for nearly all of Angola’s exports and two‑thirds of government revenues. The government is heavily involved in oil production along with significant 5 foreign direct investment from international firms such as Chevron and Total. Declining production and falling oil prices brought about a collapse in GDP and rapidly rising debts to China and the IMF. To reduce the cost of debt repayments, improve the country’s fiscal position, and support a steadily declining debt‑to‑GDP ratio, the government of Angola has opted for debt 10 relief. Together with a complete stop on debt repayments for the next three years, Angola will gain additional cash flow of $6.9 billion in 2020–22. This will help bring Angola’s total annual borrowing to a much more manageable level of around 8.7% of GDP. With improved finances the government will have more money to spend supporting the economy and providing vital public services to its citizens, over 17 million of whom still 15 live in absolute poverty. The IMF, which has since 2018 agreed to lend $4.5 billion to Angola, is also encouraged by the country’s fiscal policies. The finance minister, Vera Daves de Sousa, wants the state oil firm to sell shares to the public and for over one hundred state firms to be privatised. There have been delays – just 34 sales have taken place so far. But, she says, private firms 20 must be the ‘main driver’ of growth and the economy must diversify away from oil. Since 2019 Angola has ended government intervention in the foreign exchange market and moved towards a floating exchange rate. This led to a rapid depreciation in the kwanza (the Angolan currency) before stabilising after a few months. (Sources: adapted from https://www.economist.com/middle-east-and-africa/2021/02/20/ joao-lourencos-reforms-in-angola-are-pleasing-the-imf, https://www.cabri-sbo.org/en/ blog/2021/country-spotlight-angolas-commitment-to-prudent-and-proactive-public-debt- management, and https://www.focus-economics.com/countries/angola/news/special/ kwanza-dives-to-all-time-low-as-central-bank-floats-the-currency)
(a) With reference to Extract A, explain what is meant by a ‘regional trade agreement’ (Extract A, line 7). (5)
June 2023 · Paper 2 · Q6(b) 8 marks AO1=2, AO2=2, AO3=2, AO4=2 8-mark response emerging and developing economies
Data and extracts for question 6Trade and development in Africa Figure 1: Intra- and extra-regional exports as a percentage of total exports, 2020 Europe Asia North America Africa Latin America/Caribbean 0 20 40 60 80 100 (%) Intra: within a region Extra: outside a region (Source: adapted from https://www.economist.com/middle-east-and-africa/2022/03/26/ why-it-costs-so-much-to-move-goods-around-africa) Extract A: Why it costs so much to move goods around Africa Lorries carrying, among other things, cobalt from Congo, copper from Zambia and tea from Malawi queued for miles as they waited to cross the Limpopo river into South Africa. Many were there for days. Some drivers bribe their way to the front; 1 000 rand (£49) is the going rate. Others cannot afford to. 5 African politicians say they want to end such delays. The African Continental Free Trade Area (AfCFTA) regional trade agreement, so far agreed by 41 of Africa’s 55 countries, could boost the region’s economies by making it easier to trade between themselves. In 2020 just 18% of exports were to other African countries (see Figure 1), lower than the equivalent in North America (30%), Asia (58%) or Europe (68%). More trade within the 10 region could lead to more jobs, higher wages and less poverty. The AfCFTA pledges to improve trade in two ways. The first is by reducing tariffs. This could boost intra‑African trade by 15% to 25%, says the IMF. The second is to reduce non‑tariff barriers which could cause a 50% rise in intra‑African trade. Poor infrastructure is a major barrier to trade. Africa’s land area is bigger than China, 15 India, the United States and much of Europe combined. Yet its railway network is not very much bigger than France’s and Germany’s put together. Many lines were built by colonial companies to link mines to ports, rather than countries to one another. Newer Chinese‑built railways across African borders are under‑used, either because they struggle to compete on price with road transport or because they lack additional services 20 such as storage yards. Ports are small and slow. Cargo waits for more than two weeks on average, compared to less than a week in Asia, Europe and Latin America. Handling costs are around 50% higher than in other parts of the world. Nearly 90% of transport of goods goes by road, of which there are not enough. Road 25 quality is poor. Just 800 000 km of the total of 2.8 million km in sub‑Saharan Africa are paved. The IMF estimates that if the quality of Africa’s infrastructure were brought up to the global average this would increase intra‑African trade by 7%. However, even bigger gains could be made by improving how trade flows. The key problem is a lack of information. 30 In much of the world large firms can buy space on trains or lorries as they need it. But in Africa, where markets for this do not exist, firms such as miners have to sign long‑term contracts with larger transport firms in which they agree to pay for capacity, whether they use it all or not. (Source: adapted from https://www.economist.com/middle-east-and-africa/2022/03/26/ why-it-costs-so-much-to-move-goods-around-africa) Extract B: Economic reform in Angola When the new president, João Lourenço, took power in the southern African country of Angola in 2017, he pledged to reform the economy. This is a challenging task. The oil industry accounts for nearly all of Angola’s exports and two‑thirds of government revenues. The government is heavily involved in oil production along with significant 5 foreign direct investment from international firms such as Chevron and Total. Declining production and falling oil prices brought about a collapse in GDP and rapidly rising debts to China and the IMF. To reduce the cost of debt repayments, improve the country’s fiscal position, and support a steadily declining debt‑to‑GDP ratio, the government of Angola has opted for debt 10 relief. Together with a complete stop on debt repayments for the next three years, Angola will gain additional cash flow of $6.9 billion in 2020–22. This will help bring Angola’s total annual borrowing to a much more manageable level of around 8.7% of GDP. With improved finances the government will have more money to spend supporting the economy and providing vital public services to its citizens, over 17 million of whom still 15 live in absolute poverty. The IMF, which has since 2018 agreed to lend $4.5 billion to Angola, is also encouraged by the country’s fiscal policies. The finance minister, Vera Daves de Sousa, wants the state oil firm to sell shares to the public and for over one hundred state firms to be privatised. There have been delays – just 34 sales have taken place so far. But, she says, private firms 20 must be the ‘main driver’ of growth and the economy must diversify away from oil. Since 2019 Angola has ended government intervention in the foreign exchange market and moved towards a floating exchange rate. This led to a rapid depreciation in the kwanza (the Angolan currency) before stabilising after a few months. (Sources: adapted from https://www.economist.com/middle-east-and-africa/2021/02/20/ joao-lourencos-reforms-in-angola-are-pleasing-the-imf, https://www.cabri-sbo.org/en/ blog/2021/country-spotlight-angolas-commitment-to-prudent-and-proactive-public-debt- management, and https://www.focus-economics.com/countries/angola/news/special/ kwanza-dives-to-all-time-low-as-central-bank-floats-the-currency)
(b) With reference to Extract A, examine two causes of the high cost of transporting goods between African countries. (8)
June 2023 · Paper 2 · Q6(c) 12 marks AO1=2, AO2=2, AO3=4, AO4=4 12-mark response emerging and developing economieseconomic growth and the trade cycle
Data and extracts for question 6Trade and development in Africa Figure 1: Intra- and extra-regional exports as a percentage of total exports, 2020 Europe Asia North America Africa Latin America/Caribbean 0 20 40 60 80 100 (%) Intra: within a region Extra: outside a region (Source: adapted from https://www.economist.com/middle-east-and-africa/2022/03/26/ why-it-costs-so-much-to-move-goods-around-africa) Extract A: Why it costs so much to move goods around Africa Lorries carrying, among other things, cobalt from Congo, copper from Zambia and tea from Malawi queued for miles as they waited to cross the Limpopo river into South Africa. Many were there for days. Some drivers bribe their way to the front; 1 000 rand (£49) is the going rate. Others cannot afford to. 5 African politicians say they want to end such delays. The African Continental Free Trade Area (AfCFTA) regional trade agreement, so far agreed by 41 of Africa’s 55 countries, could boost the region’s economies by making it easier to trade between themselves. In 2020 just 18% of exports were to other African countries (see Figure 1), lower than the equivalent in North America (30%), Asia (58%) or Europe (68%). More trade within the 10 region could lead to more jobs, higher wages and less poverty. The AfCFTA pledges to improve trade in two ways. The first is by reducing tariffs. This could boost intra‑African trade by 15% to 25%, says the IMF. The second is to reduce non‑tariff barriers which could cause a 50% rise in intra‑African trade. Poor infrastructure is a major barrier to trade. Africa’s land area is bigger than China, 15 India, the United States and much of Europe combined. Yet its railway network is not very much bigger than France’s and Germany’s put together. Many lines were built by colonial companies to link mines to ports, rather than countries to one another. Newer Chinese‑built railways across African borders are under‑used, either because they struggle to compete on price with road transport or because they lack additional services 20 such as storage yards. Ports are small and slow. Cargo waits for more than two weeks on average, compared to less than a week in Asia, Europe and Latin America. Handling costs are around 50% higher than in other parts of the world. Nearly 90% of transport of goods goes by road, of which there are not enough. Road 25 quality is poor. Just 800 000 km of the total of 2.8 million km in sub‑Saharan Africa are paved. The IMF estimates that if the quality of Africa’s infrastructure were brought up to the global average this would increase intra‑African trade by 7%. However, even bigger gains could be made by improving how trade flows. The key problem is a lack of information. 30 In much of the world large firms can buy space on trains or lorries as they need it. But in Africa, where markets for this do not exist, firms such as miners have to sign long‑term contracts with larger transport firms in which they agree to pay for capacity, whether they use it all or not. (Source: adapted from https://www.economist.com/middle-east-and-africa/2022/03/26/ why-it-costs-so-much-to-move-goods-around-africa) Extract B: Economic reform in Angola When the new president, João Lourenço, took power in the southern African country of Angola in 2017, he pledged to reform the economy. This is a challenging task. The oil industry accounts for nearly all of Angola’s exports and two‑thirds of government revenues. The government is heavily involved in oil production along with significant 5 foreign direct investment from international firms such as Chevron and Total. Declining production and falling oil prices brought about a collapse in GDP and rapidly rising debts to China and the IMF. To reduce the cost of debt repayments, improve the country’s fiscal position, and support a steadily declining debt‑to‑GDP ratio, the government of Angola has opted for debt 10 relief. Together with a complete stop on debt repayments for the next three years, Angola will gain additional cash flow of $6.9 billion in 2020–22. This will help bring Angola’s total annual borrowing to a much more manageable level of around 8.7% of GDP. With improved finances the government will have more money to spend supporting the economy and providing vital public services to its citizens, over 17 million of whom still 15 live in absolute poverty. The IMF, which has since 2018 agreed to lend $4.5 billion to Angola, is also encouraged by the country’s fiscal policies. The finance minister, Vera Daves de Sousa, wants the state oil firm to sell shares to the public and for over one hundred state firms to be privatised. There have been delays – just 34 sales have taken place so far. But, she says, private firms 20 must be the ‘main driver’ of growth and the economy must diversify away from oil. Since 2019 Angola has ended government intervention in the foreign exchange market and moved towards a floating exchange rate. This led to a rapid depreciation in the kwanza (the Angolan currency) before stabilising after a few months. (Sources: adapted from https://www.economist.com/middle-east-and-africa/2021/02/20/ joao-lourencos-reforms-in-angola-are-pleasing-the-imf, https://www.cabri-sbo.org/en/ blog/2021/country-spotlight-angolas-commitment-to-prudent-and-proactive-public-debt- management, and https://www.focus-economics.com/countries/angola/news/special/ kwanza-dives-to-all-time-low-as-central-bank-floats-the-currency)
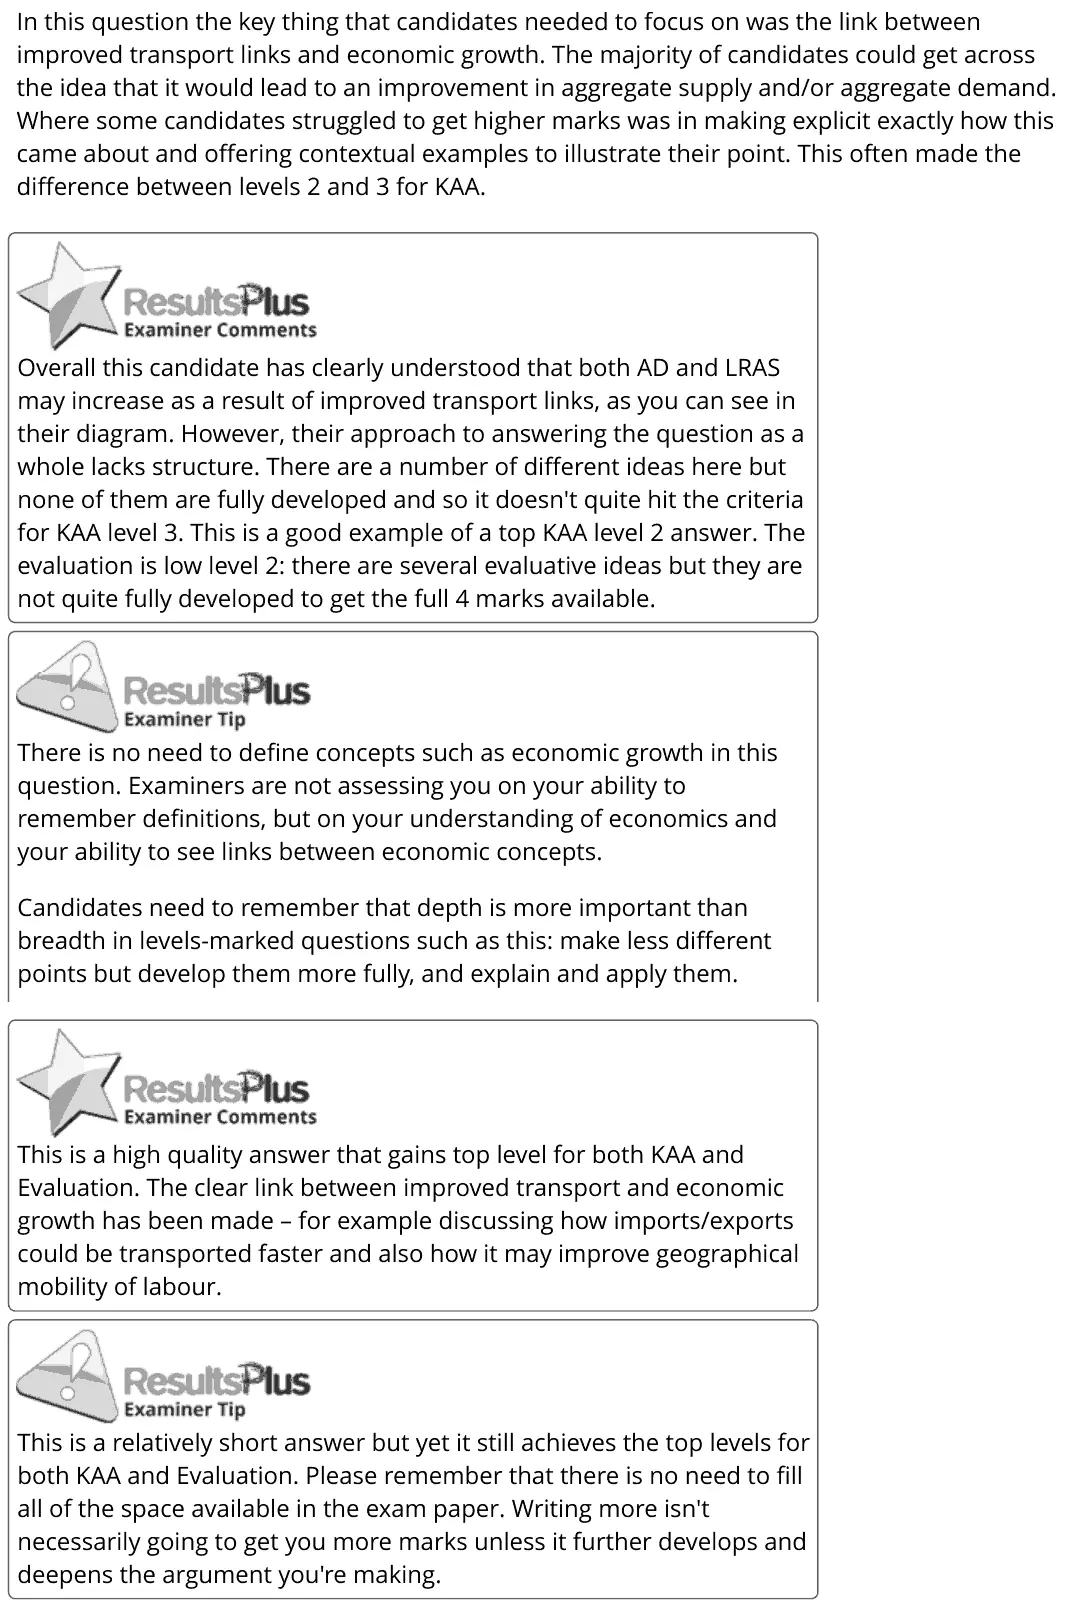
(c) Discuss the impact of improved transport links between African countries on economic growth rates. (12)
June 2023 · Paper 2 · Q6(d) 10 marks AO1=2, AO2=2, AO3=2, AO4=4 10-mark response emerging and developing economies
Data and extracts for question 6Trade and development in Africa Figure 1: Intra- and extra-regional exports as a percentage of total exports, 2020 Europe Asia North America Africa Latin America/Caribbean 0 20 40 60 80 100 (%) Intra: within a region Extra: outside a region (Source: adapted from https://www.economist.com/middle-east-and-africa/2022/03/26/ why-it-costs-so-much-to-move-goods-around-africa) Extract A: Why it costs so much to move goods around Africa Lorries carrying, among other things, cobalt from Congo, copper from Zambia and tea from Malawi queued for miles as they waited to cross the Limpopo river into South Africa. Many were there for days. Some drivers bribe their way to the front; 1 000 rand (£49) is the going rate. Others cannot afford to. 5 African politicians say they want to end such delays. The African Continental Free Trade Area (AfCFTA) regional trade agreement, so far agreed by 41 of Africa’s 55 countries, could boost the region’s economies by making it easier to trade between themselves. In 2020 just 18% of exports were to other African countries (see Figure 1), lower than the equivalent in North America (30%), Asia (58%) or Europe (68%). More trade within the 10 region could lead to more jobs, higher wages and less poverty. The AfCFTA pledges to improve trade in two ways. The first is by reducing tariffs. This could boost intra‑African trade by 15% to 25%, says the IMF. The second is to reduce non‑tariff barriers which could cause a 50% rise in intra‑African trade. Poor infrastructure is a major barrier to trade. Africa’s land area is bigger than China, 15 India, the United States and much of Europe combined. Yet its railway network is not very much bigger than France’s and Germany’s put together. Many lines were built by colonial companies to link mines to ports, rather than countries to one another. Newer Chinese‑built railways across African borders are under‑used, either because they struggle to compete on price with road transport or because they lack additional services 20 such as storage yards. Ports are small and slow. Cargo waits for more than two weeks on average, compared to less than a week in Asia, Europe and Latin America. Handling costs are around 50% higher than in other parts of the world. Nearly 90% of transport of goods goes by road, of which there are not enough. Road 25 quality is poor. Just 800 000 km of the total of 2.8 million km in sub‑Saharan Africa are paved. The IMF estimates that if the quality of Africa’s infrastructure were brought up to the global average this would increase intra‑African trade by 7%. However, even bigger gains could be made by improving how trade flows. The key problem is a lack of information. 30 In much of the world large firms can buy space on trains or lorries as they need it. But in Africa, where markets for this do not exist, firms such as miners have to sign long‑term contracts with larger transport firms in which they agree to pay for capacity, whether they use it all or not. (Source: adapted from https://www.economist.com/middle-east-and-africa/2022/03/26/ why-it-costs-so-much-to-move-goods-around-africa) Extract B: Economic reform in Angola When the new president, João Lourenço, took power in the southern African country of Angola in 2017, he pledged to reform the economy. This is a challenging task. The oil industry accounts for nearly all of Angola’s exports and two‑thirds of government revenues. The government is heavily involved in oil production along with significant 5 foreign direct investment from international firms such as Chevron and Total. Declining production and falling oil prices brought about a collapse in GDP and rapidly rising debts to China and the IMF. To reduce the cost of debt repayments, improve the country’s fiscal position, and support a steadily declining debt‑to‑GDP ratio, the government of Angola has opted for debt 10 relief. Together with a complete stop on debt repayments for the next three years, Angola will gain additional cash flow of $6.9 billion in 2020–22. This will help bring Angola’s total annual borrowing to a much more manageable level of around 8.7% of GDP. With improved finances the government will have more money to spend supporting the economy and providing vital public services to its citizens, over 17 million of whom still 15 live in absolute poverty. The IMF, which has since 2018 agreed to lend $4.5 billion to Angola, is also encouraged by the country’s fiscal policies. The finance minister, Vera Daves de Sousa, wants the state oil firm to sell shares to the public and for over one hundred state firms to be privatised. There have been delays – just 34 sales have taken place so far. But, she says, private firms 20 must be the ‘main driver’ of growth and the economy must diversify away from oil. Since 2019 Angola has ended government intervention in the foreign exchange market and moved towards a floating exchange rate. This led to a rapid depreciation in the kwanza (the Angolan currency) before stabilising after a few months. (Sources: adapted from https://www.economist.com/middle-east-and-africa/2021/02/20/ joao-lourencos-reforms-in-angola-are-pleasing-the-imf, https://www.cabri-sbo.org/en/ blog/2021/country-spotlight-angolas-commitment-to-prudent-and-proactive-public-debt- management, and https://www.focus-economics.com/countries/angola/news/special/ kwanza-dives-to-all-time-low-as-central-bank-floats-the-currency)
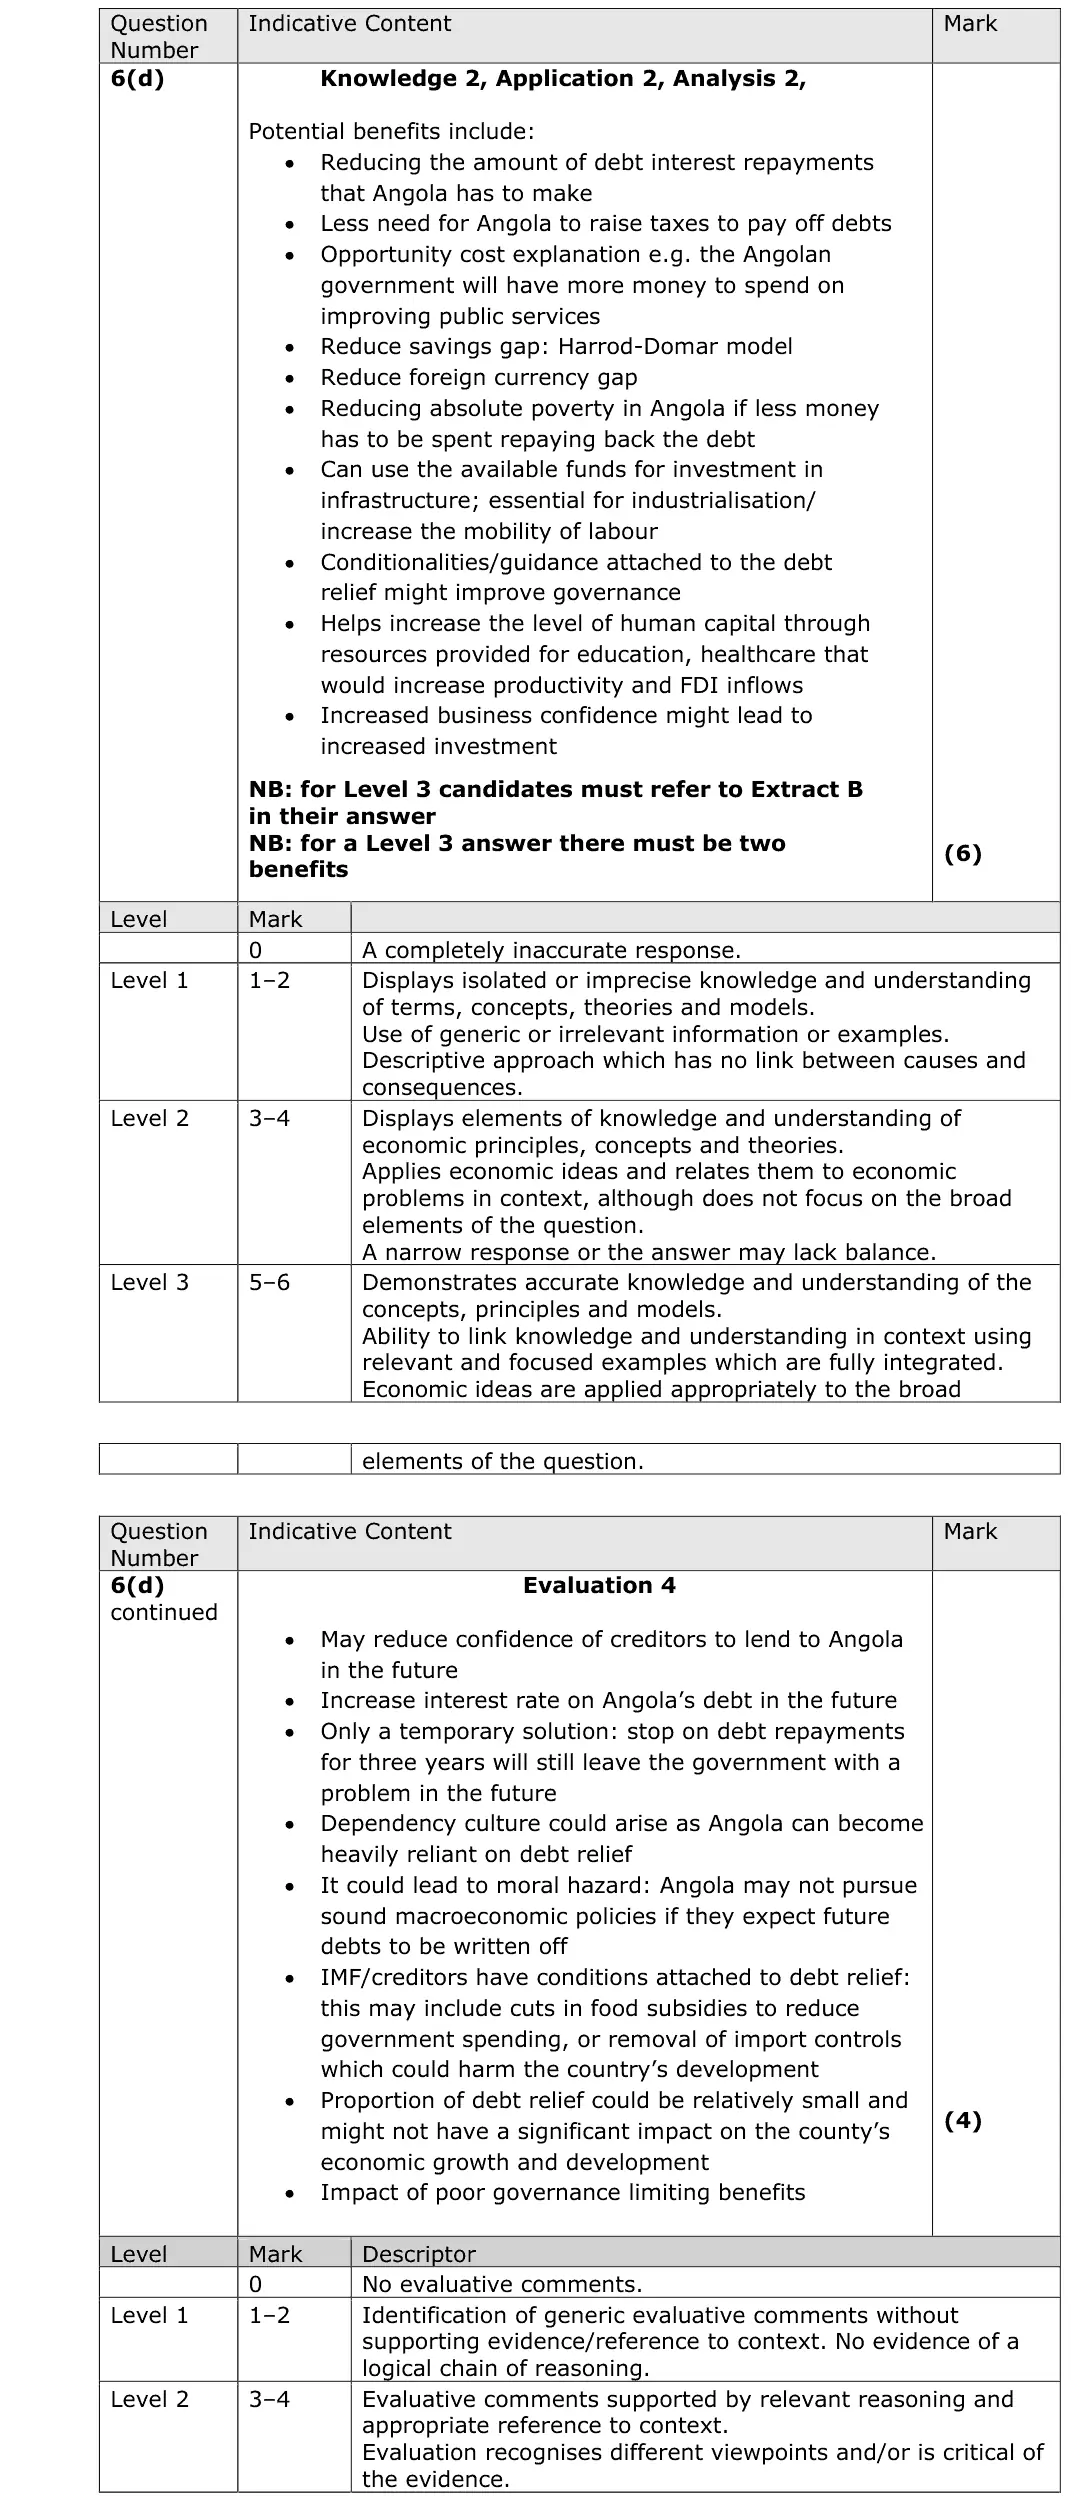
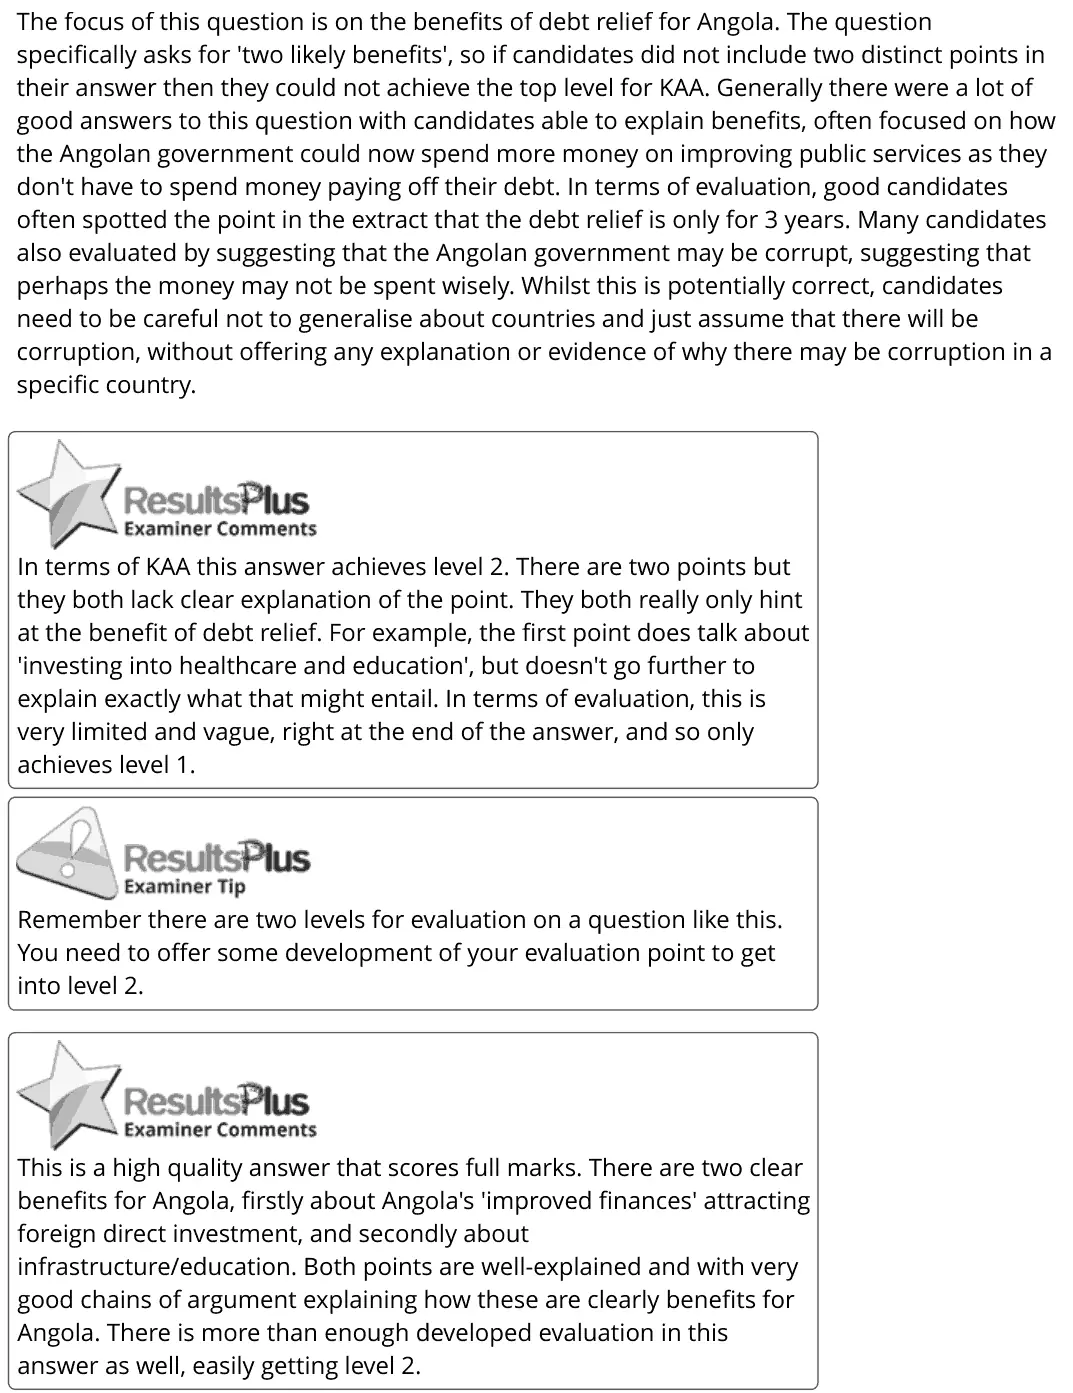
(d) Assess two likely benefits of debt relief to Angola. Refer to Extract B in your answer. (10)
June 2023 · Paper 2 · Q6(e) 15 marks AO1=3, AO2=3, AO3=3, AO4=6 15-mark response emerging and developing economies
Data and extracts for question 6Trade and development in Africa Figure 1: Intra- and extra-regional exports as a percentage of total exports, 2020 Europe Asia North America Africa Latin America/Caribbean 0 20 40 60 80 100 (%) Intra: within a region Extra: outside a region (Source: adapted from https://www.economist.com/middle-east-and-africa/2022/03/26/ why-it-costs-so-much-to-move-goods-around-africa) Extract A: Why it costs so much to move goods around Africa Lorries carrying, among other things, cobalt from Congo, copper from Zambia and tea from Malawi queued for miles as they waited to cross the Limpopo river into South Africa. Many were there for days. Some drivers bribe their way to the front; 1 000 rand (£49) is the going rate. Others cannot afford to. 5 African politicians say they want to end such delays. The African Continental Free Trade Area (AfCFTA) regional trade agreement, so far agreed by 41 of Africa’s 55 countries, could boost the region’s economies by making it easier to trade between themselves. In 2020 just 18% of exports were to other African countries (see Figure 1), lower than the equivalent in North America (30%), Asia (58%) or Europe (68%). More trade within the 10 region could lead to more jobs, higher wages and less poverty. The AfCFTA pledges to improve trade in two ways. The first is by reducing tariffs. This could boost intra‑African trade by 15% to 25%, says the IMF. The second is to reduce non‑tariff barriers which could cause a 50% rise in intra‑African trade. Poor infrastructure is a major barrier to trade. Africa’s land area is bigger than China, 15 India, the United States and much of Europe combined. Yet its railway network is not very much bigger than France’s and Germany’s put together. Many lines were built by colonial companies to link mines to ports, rather than countries to one another. Newer Chinese‑built railways across African borders are under‑used, either because they struggle to compete on price with road transport or because they lack additional services 20 such as storage yards. Ports are small and slow. Cargo waits for more than two weeks on average, compared to less than a week in Asia, Europe and Latin America. Handling costs are around 50% higher than in other parts of the world. Nearly 90% of transport of goods goes by road, of which there are not enough. Road 25 quality is poor. Just 800 000 km of the total of 2.8 million km in sub‑Saharan Africa are paved. The IMF estimates that if the quality of Africa’s infrastructure were brought up to the global average this would increase intra‑African trade by 7%. However, even bigger gains could be made by improving how trade flows. The key problem is a lack of information. 30 In much of the world large firms can buy space on trains or lorries as they need it. But in Africa, where markets for this do not exist, firms such as miners have to sign long‑term contracts with larger transport firms in which they agree to pay for capacity, whether they use it all or not. (Source: adapted from https://www.economist.com/middle-east-and-africa/2022/03/26/ why-it-costs-so-much-to-move-goods-around-africa) Extract B: Economic reform in Angola When the new president, João Lourenço, took power in the southern African country of Angola in 2017, he pledged to reform the economy. This is a challenging task. The oil industry accounts for nearly all of Angola’s exports and two‑thirds of government revenues. The government is heavily involved in oil production along with significant 5 foreign direct investment from international firms such as Chevron and Total. Declining production and falling oil prices brought about a collapse in GDP and rapidly rising debts to China and the IMF. To reduce the cost of debt repayments, improve the country’s fiscal position, and support a steadily declining debt‑to‑GDP ratio, the government of Angola has opted for debt 10 relief. Together with a complete stop on debt repayments for the next three years, Angola will gain additional cash flow of $6.9 billion in 2020–22. This will help bring Angola’s total annual borrowing to a much more manageable level of around 8.7% of GDP. With improved finances the government will have more money to spend supporting the economy and providing vital public services to its citizens, over 17 million of whom still 15 live in absolute poverty. The IMF, which has since 2018 agreed to lend $4.5 billion to Angola, is also encouraged by the country’s fiscal policies. The finance minister, Vera Daves de Sousa, wants the state oil firm to sell shares to the public and for over one hundred state firms to be privatised. There have been delays – just 34 sales have taken place so far. But, she says, private firms 20 must be the ‘main driver’ of growth and the economy must diversify away from oil. Since 2019 Angola has ended government intervention in the foreign exchange market and moved towards a floating exchange rate. This led to a rapid depreciation in the kwanza (the Angolan currency) before stabilising after a few months. (Sources: adapted from https://www.economist.com/middle-east-and-africa/2021/02/20/ joao-lourencos-reforms-in-angola-are-pleasing-the-imf, https://www.cabri-sbo.org/en/ blog/2021/country-spotlight-angolas-commitment-to-prudent-and-proactive-public-debt- management, and https://www.focus-economics.com/countries/angola/news/special/ kwanza-dives-to-all-time-low-as-central-bank-floats-the-currency)
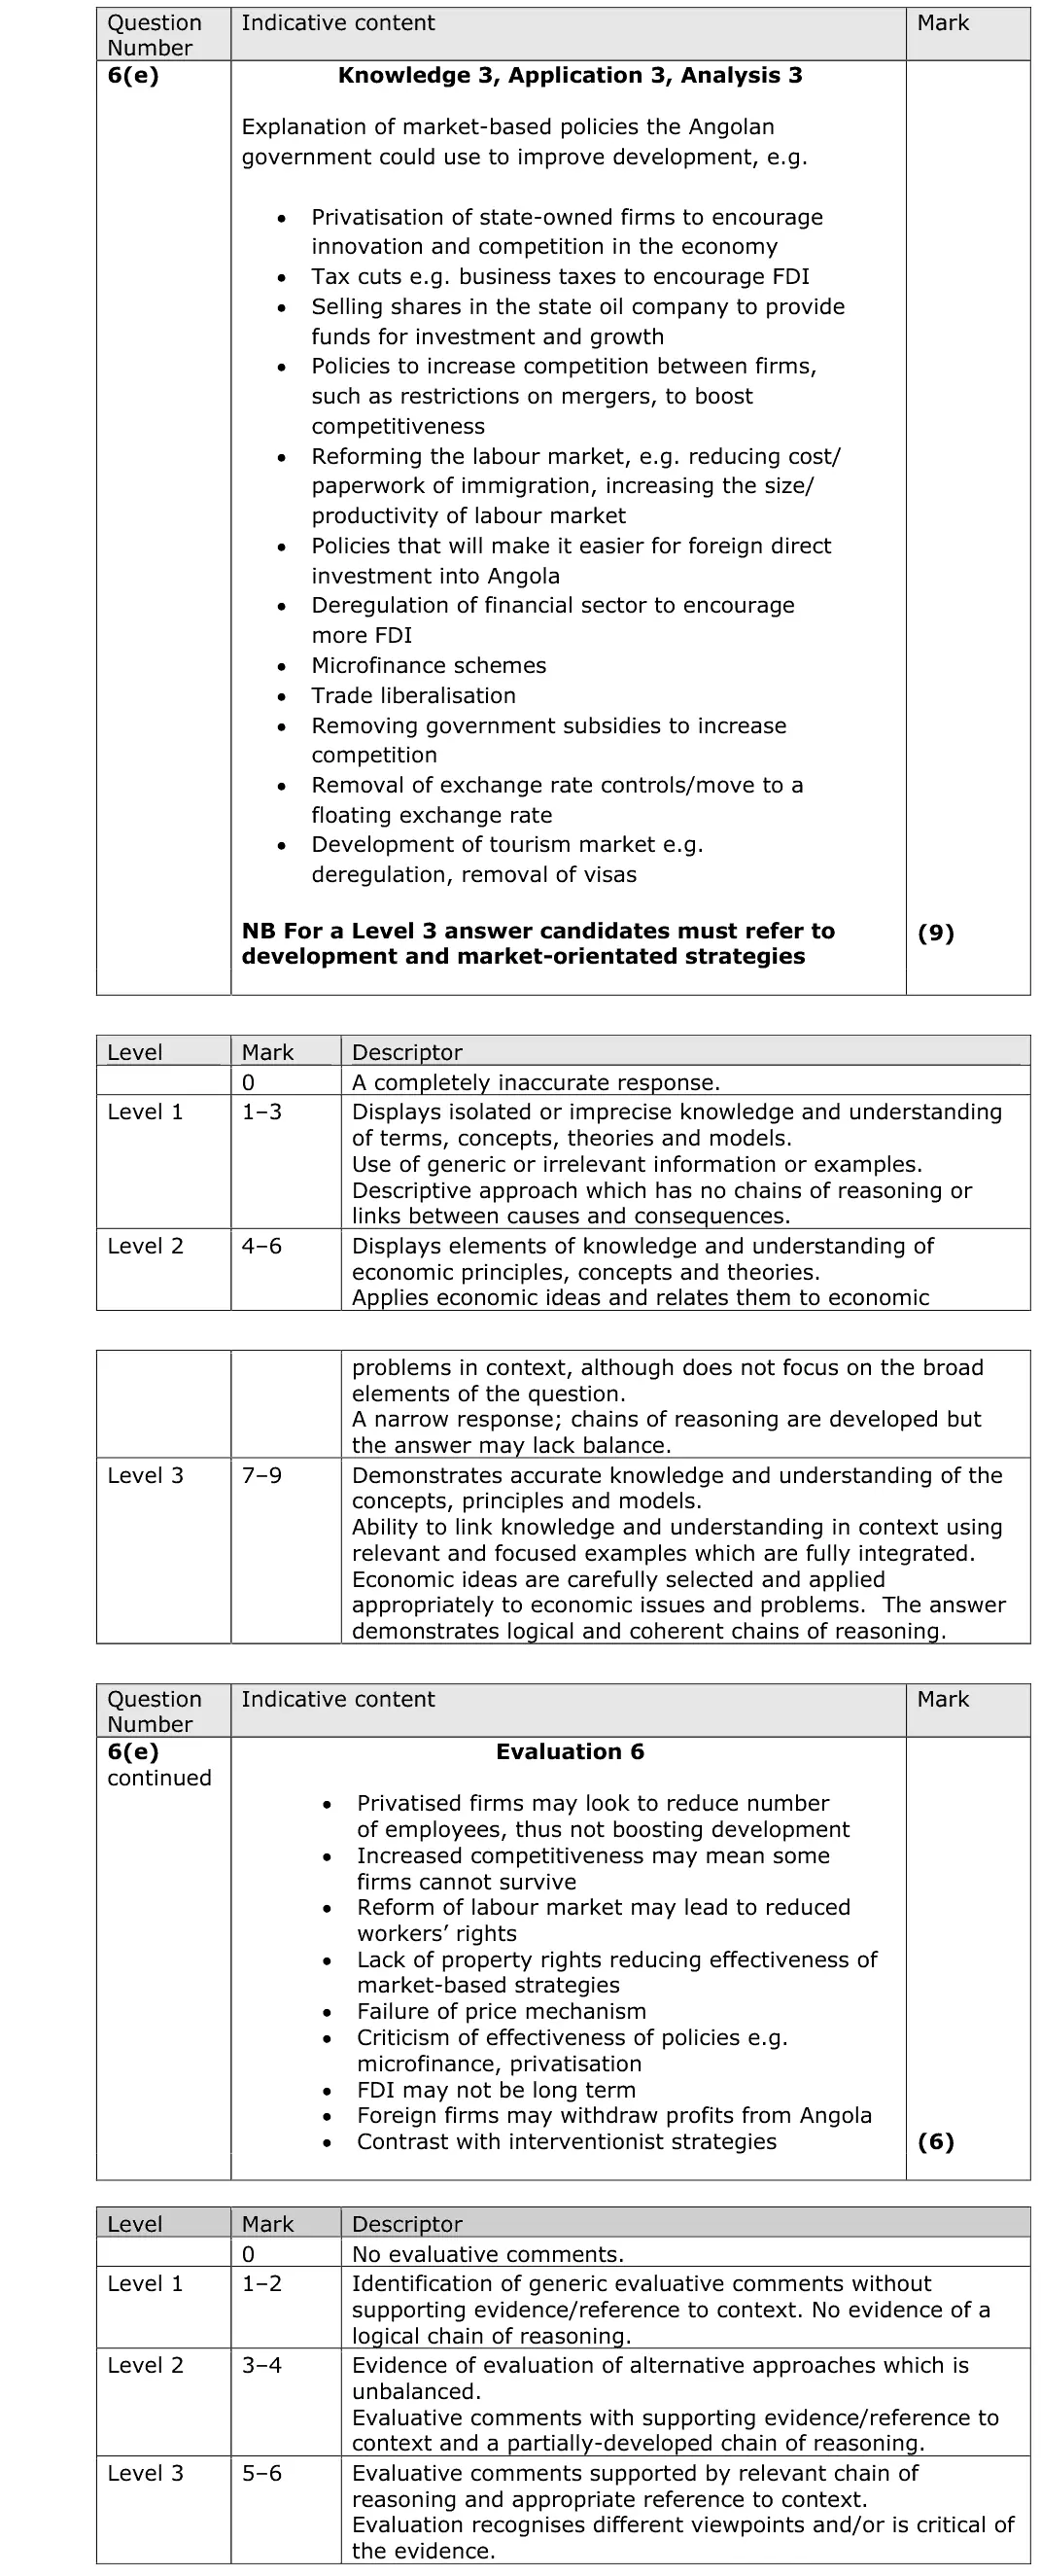
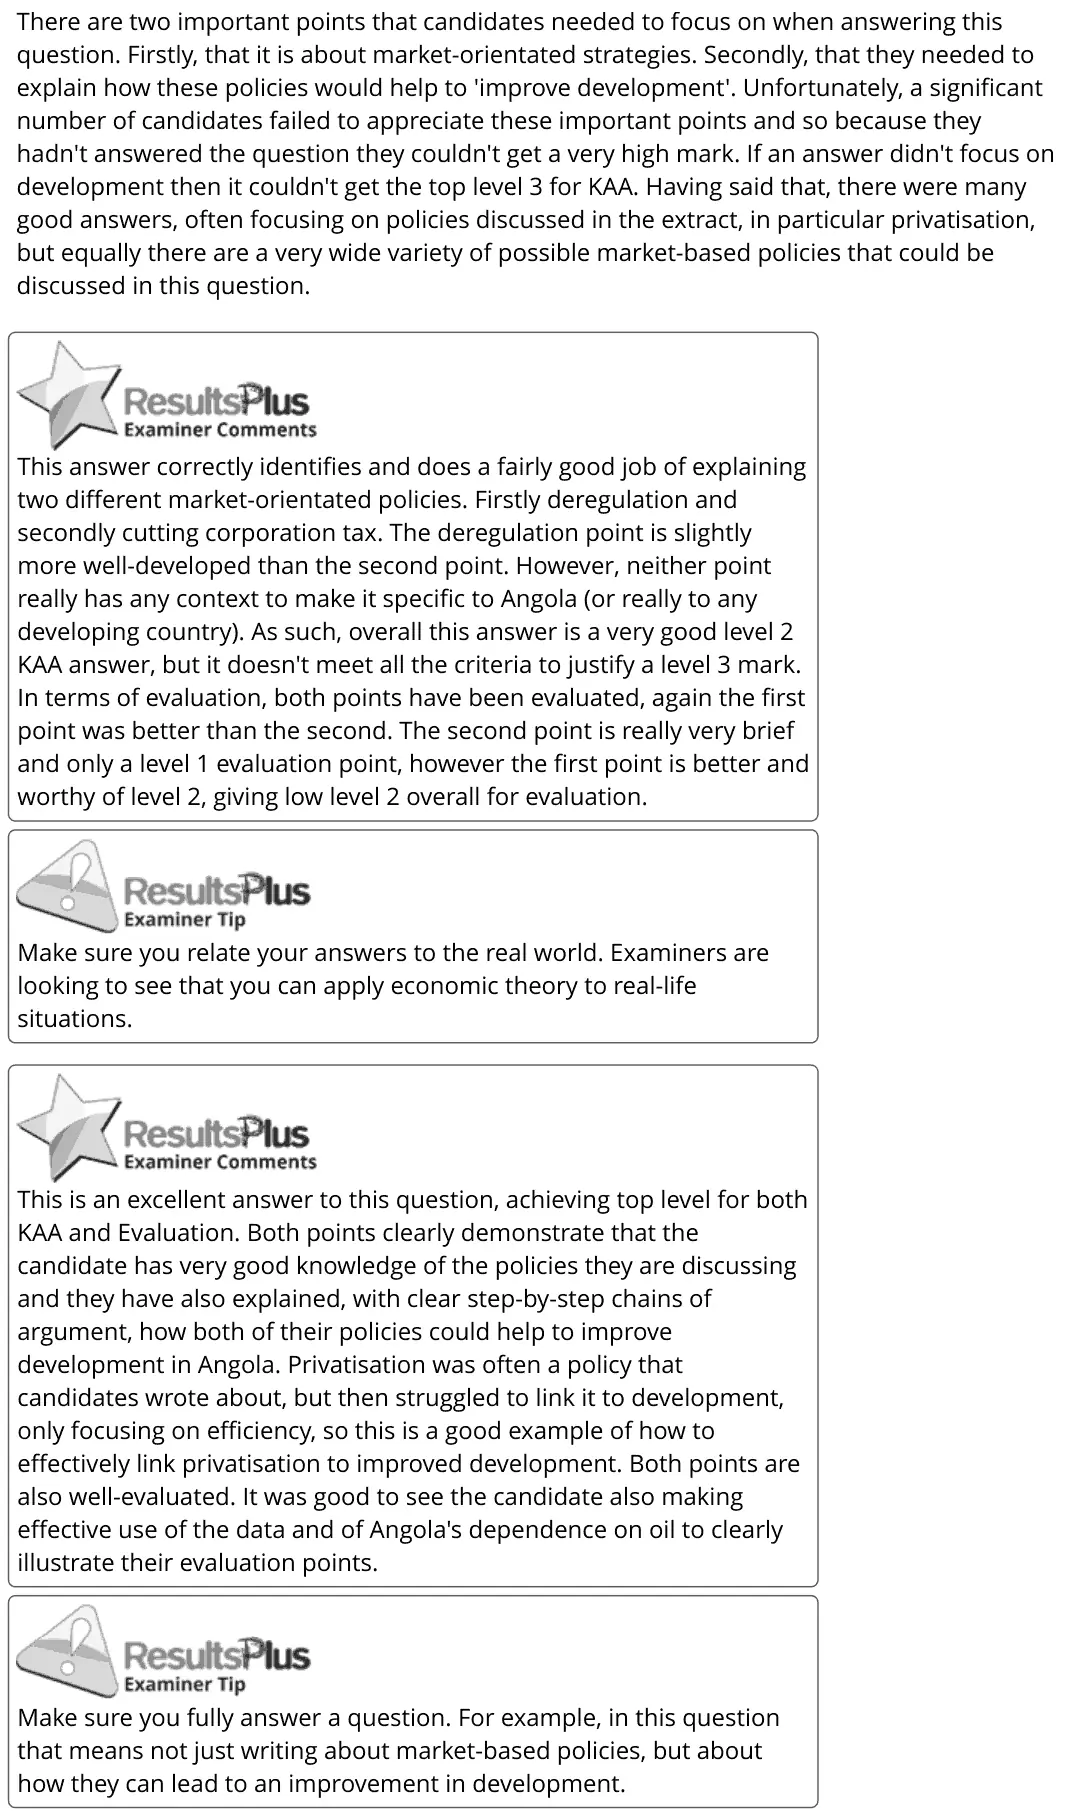
(e) Discuss market-orientated strategies the Angolan government could use to improve development. (15)
June 2023 · Paper 2 · Q7 25 marks AO1=4, AO2=4, AO3=8, AO4=9 25-mark essay Either/or international competitiveness
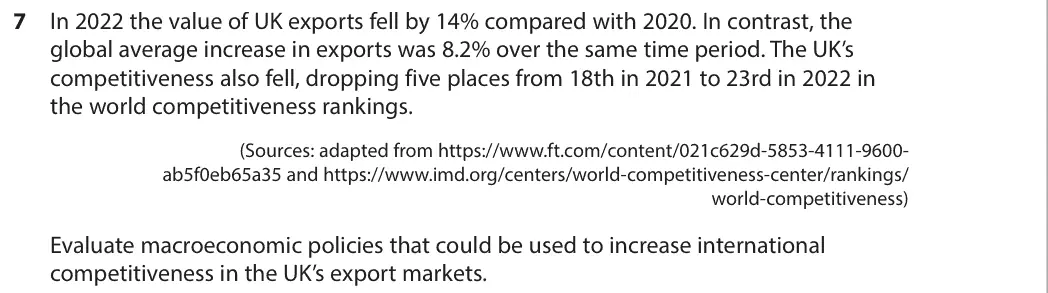
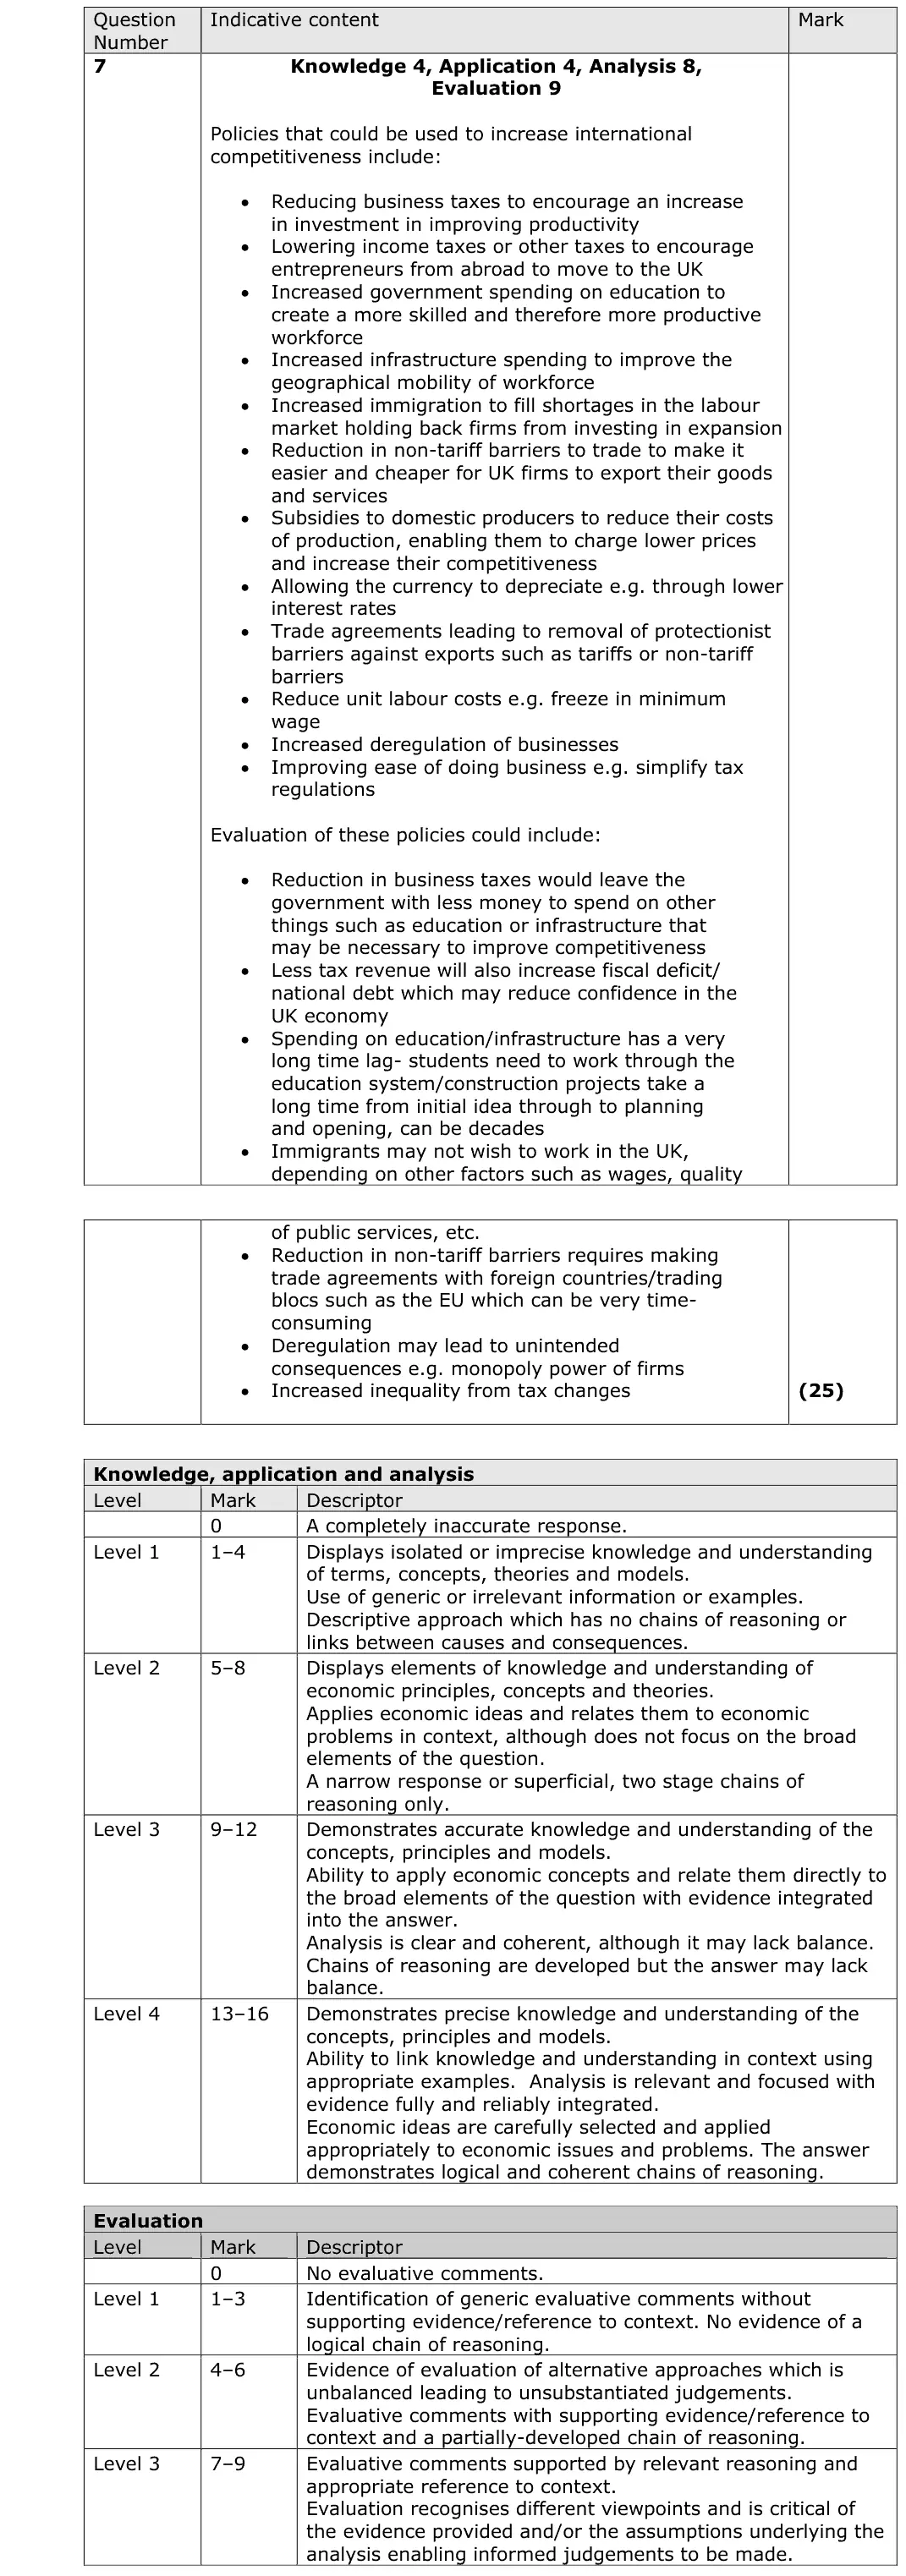
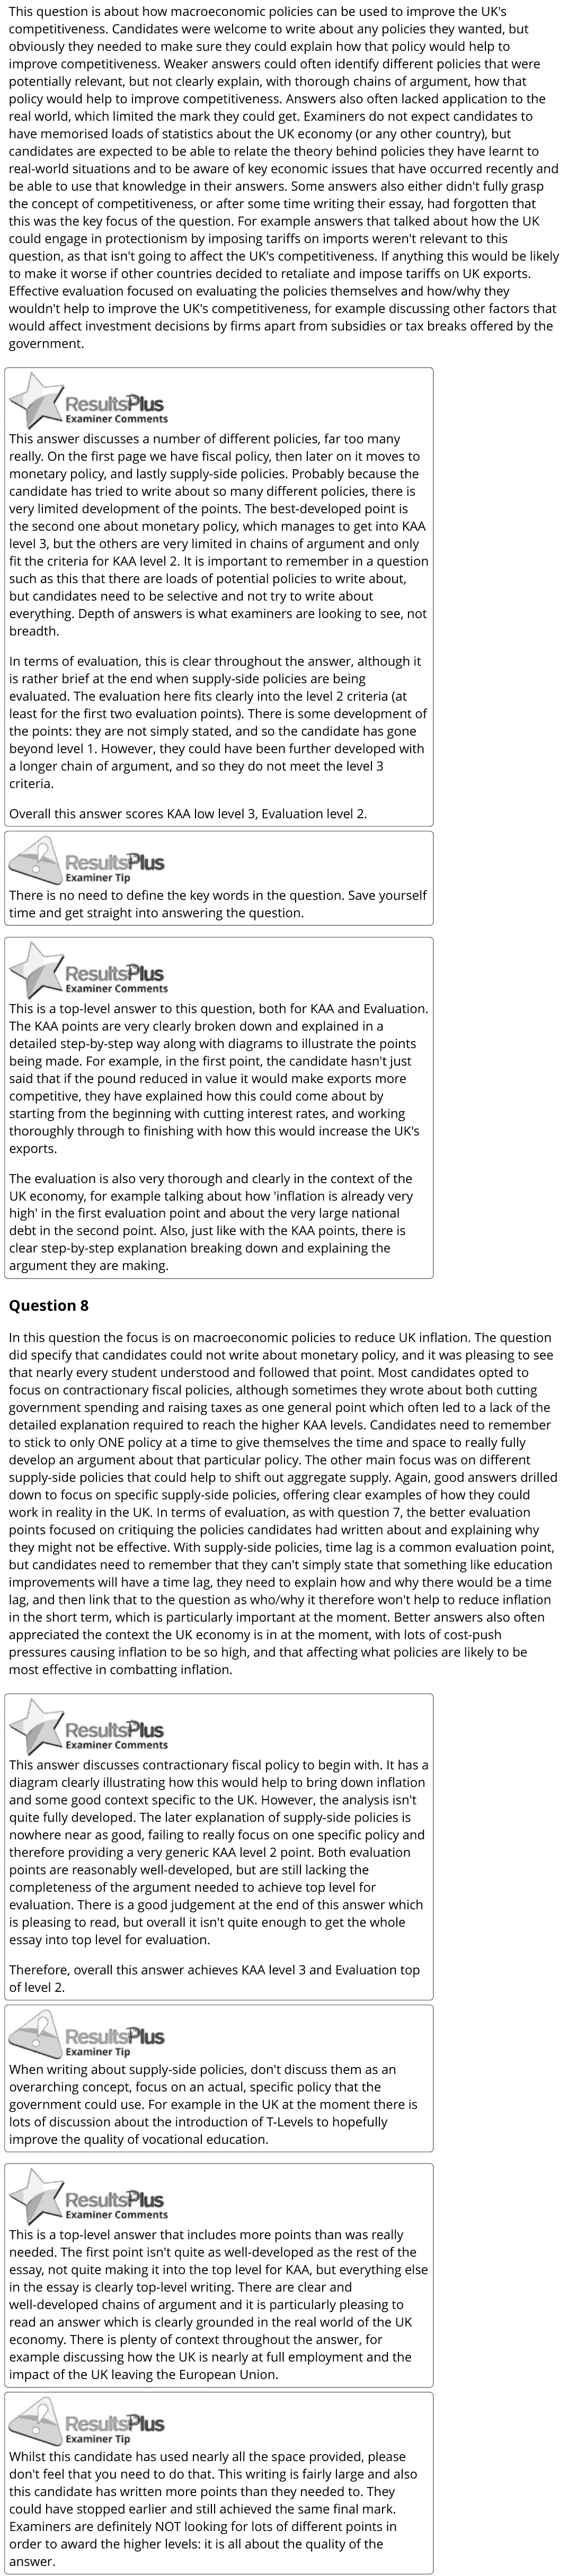
7 In 2022 the value of UK exports fell by 14% compared with 2020. In contrast, the global average increase in exports was 8.2% over the same time period. The UK’s competitiveness also fell, dropping five places from 18th in 2021 to 23rd in 2022 in the world competitiveness rankings. (Sources: adapted from https://www.ft.com/content/021c629d-5853-4111-9600- ab5f0eb65a35 and https://www.imd.org/centers/world-competitiveness-center/rankings/ world-competitiveness) Evaluate macroeconomic policies that could be used to increase international competitiveness in the UK’s export markets.
June 2023 · Paper 2 · Q8 25 marks AO1=4, AO2=4, AO3=8, AO4=9 25-mark essay Either/or supply side policiesfiscal and monetary policy
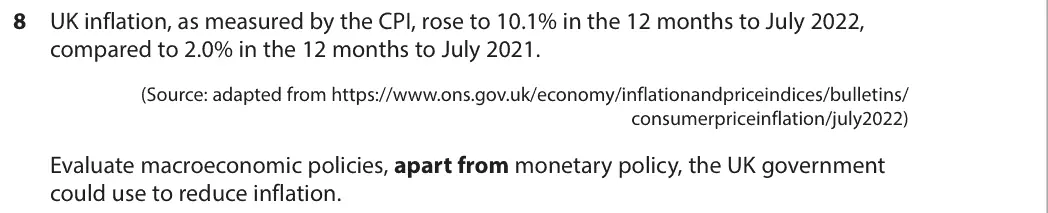
8 UK inflation, as measured by the CPI, rose to 10.1% in the 12 months to July 2022, compared to 2.0% in the 12 months to July 2021. (Source: adapted from https://www.ons.gov.uk/economy/inflationandpriceindices/bulletins/ consumerpriceinflation/july2022) Evaluate macroeconomic policies, apart from monetary policy, the UK government could use to reduce inflation.

Work with an Edexcel economics tutor

Want a paper marked and gone through with you? Message us.

Prefer email? Send an enquiry

If you are under 18, please include a parent's contact details. Enquiries go to enquiries@economicsaleveltutor.com and are deleted once handled. All tutoring is online.