June 2022: Paper 2

100 marks · 17 question parts · Paper, mark scheme and report on Pearson's site

Question by question

QTopicMarksAOType
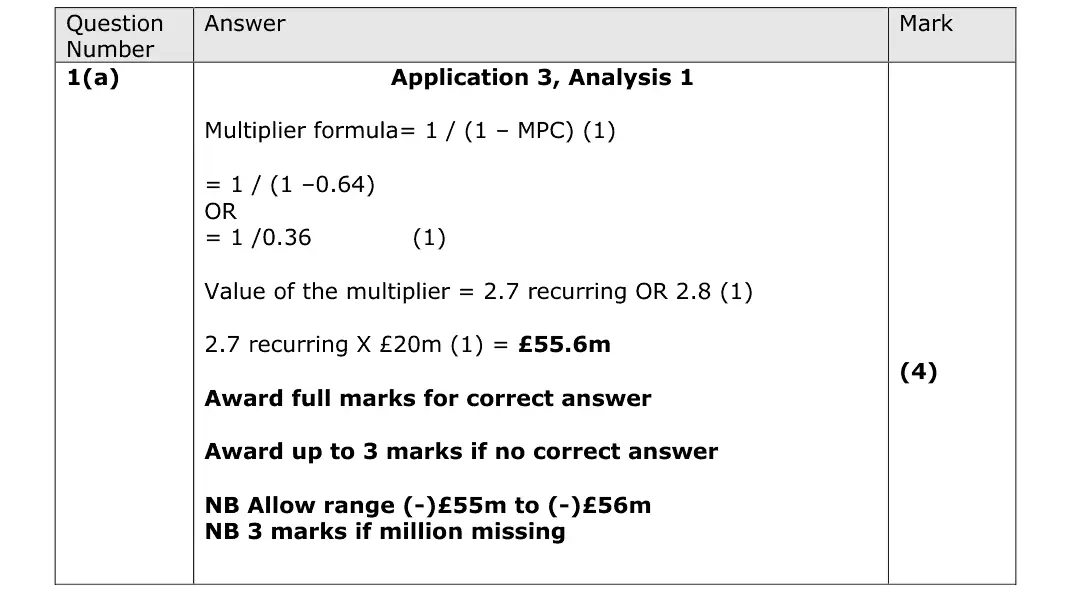
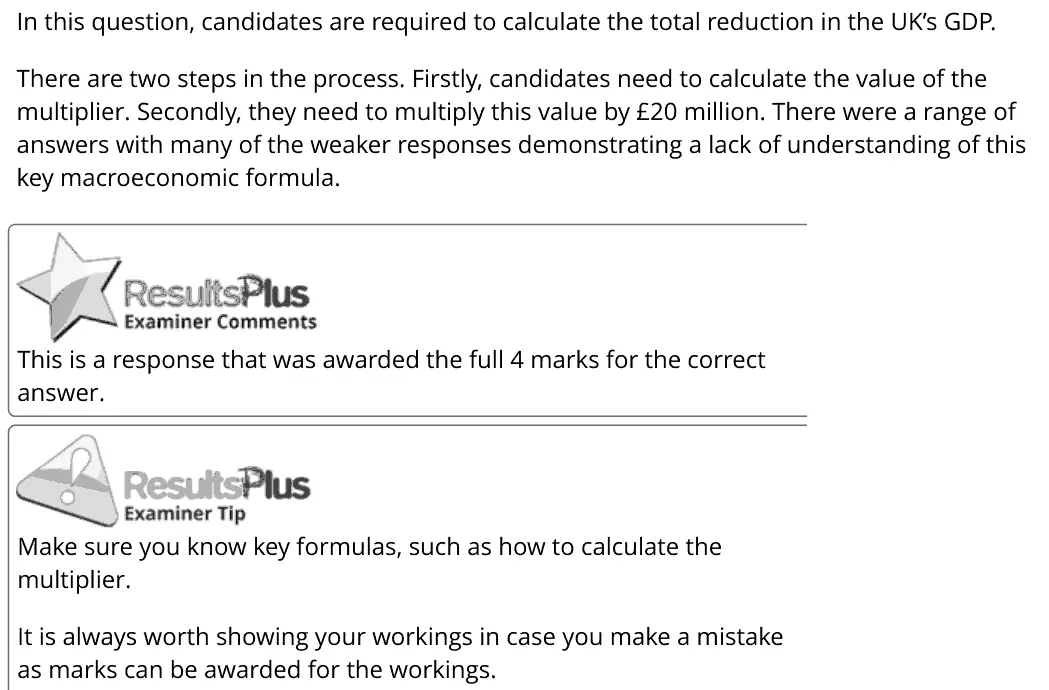
1(a) The circular flow, national income and the multiplier 4AO2=3,AO3=1Calculation
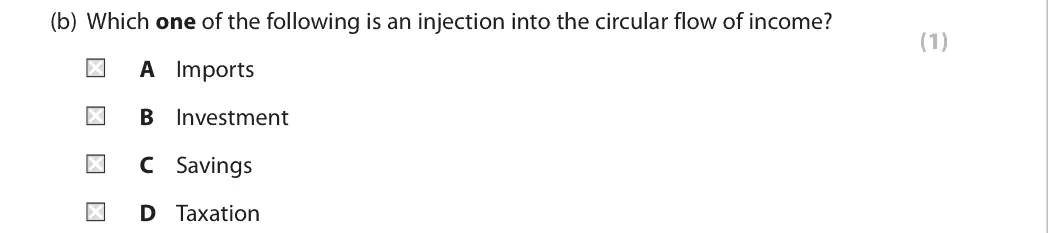
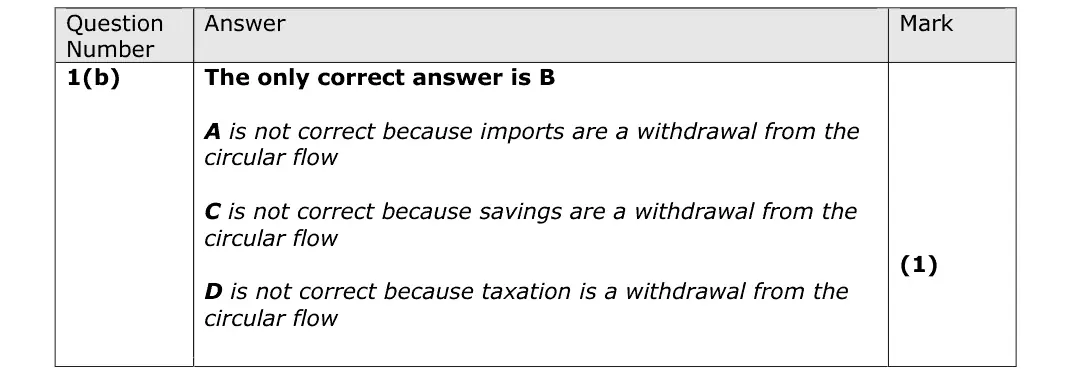
1(b) The circular flow, national income and the multiplier 1Multiple choice
2(a) Aggregate demand 1Multiple choice
2(b) Aggregate demand 4AO1=2,AO2=1,AO3=1Short answer
3(a) Aggregate demand 4AO1=2,AO2=1,AO3=1Short answer
3(b) Exchange rates 1Multiple choice
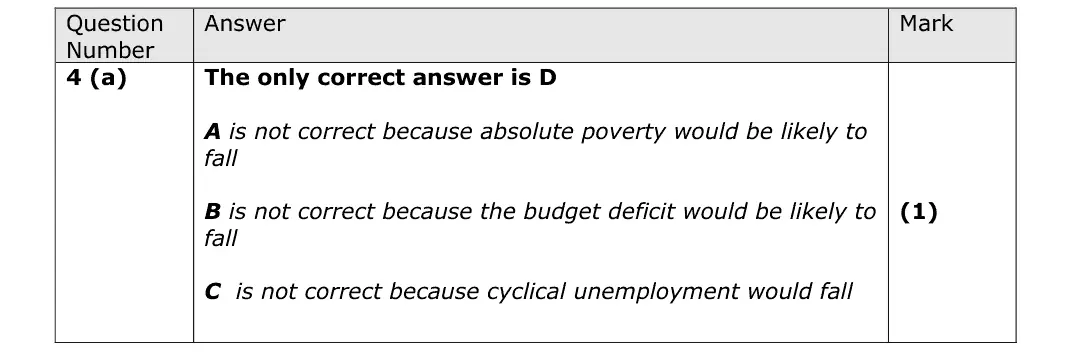
4(a) Economic growth, output gaps and the trade cycle 1Multiple choice
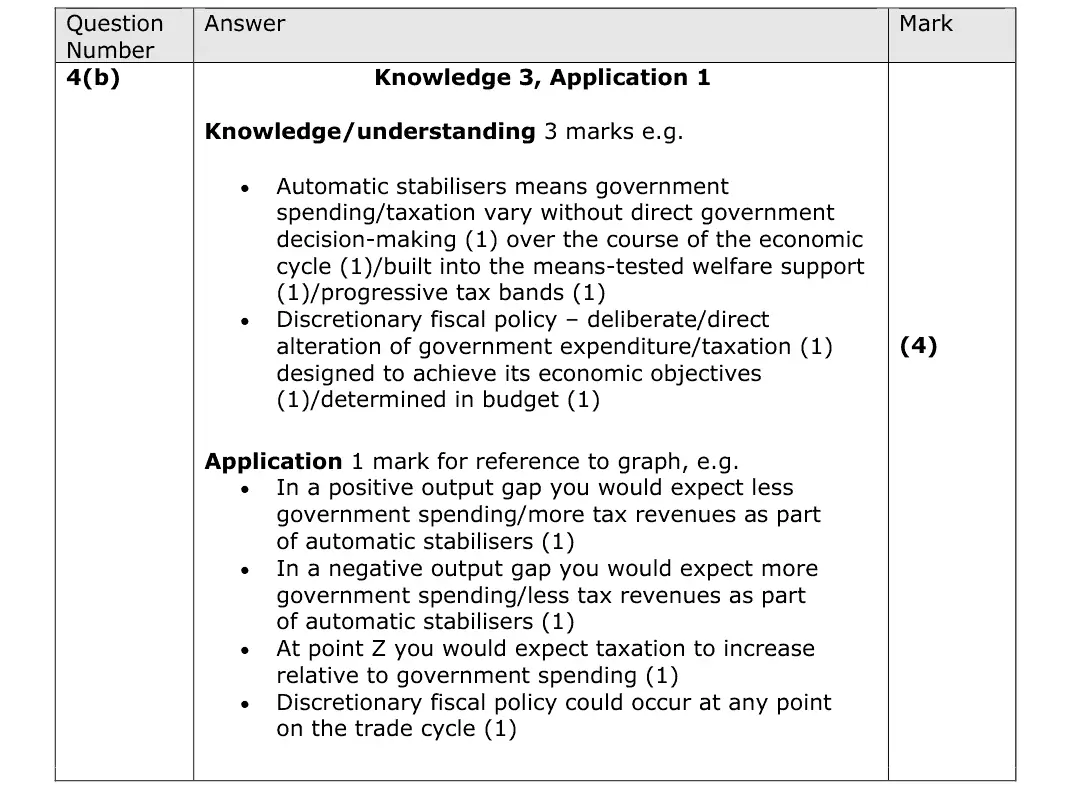
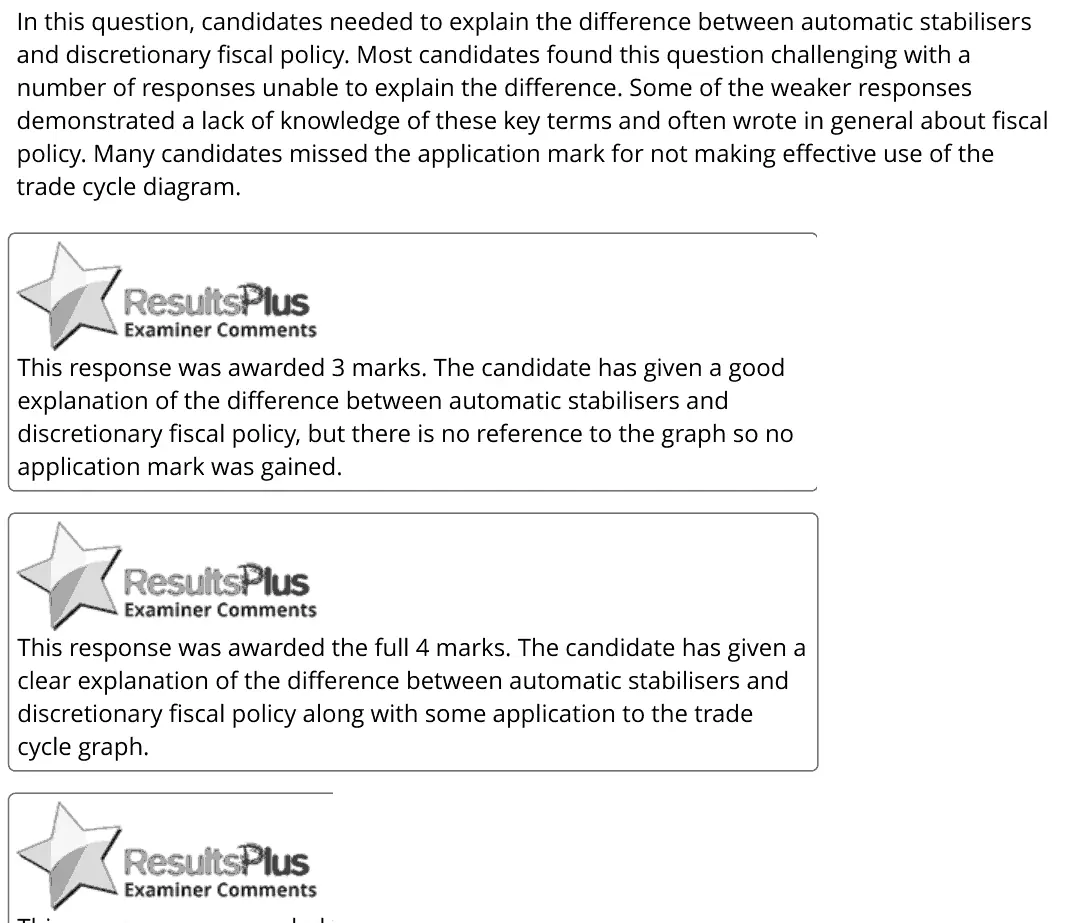
4(b) Public expenditure, taxation and public sector finances 4AO1=3,AO2=1Short answer
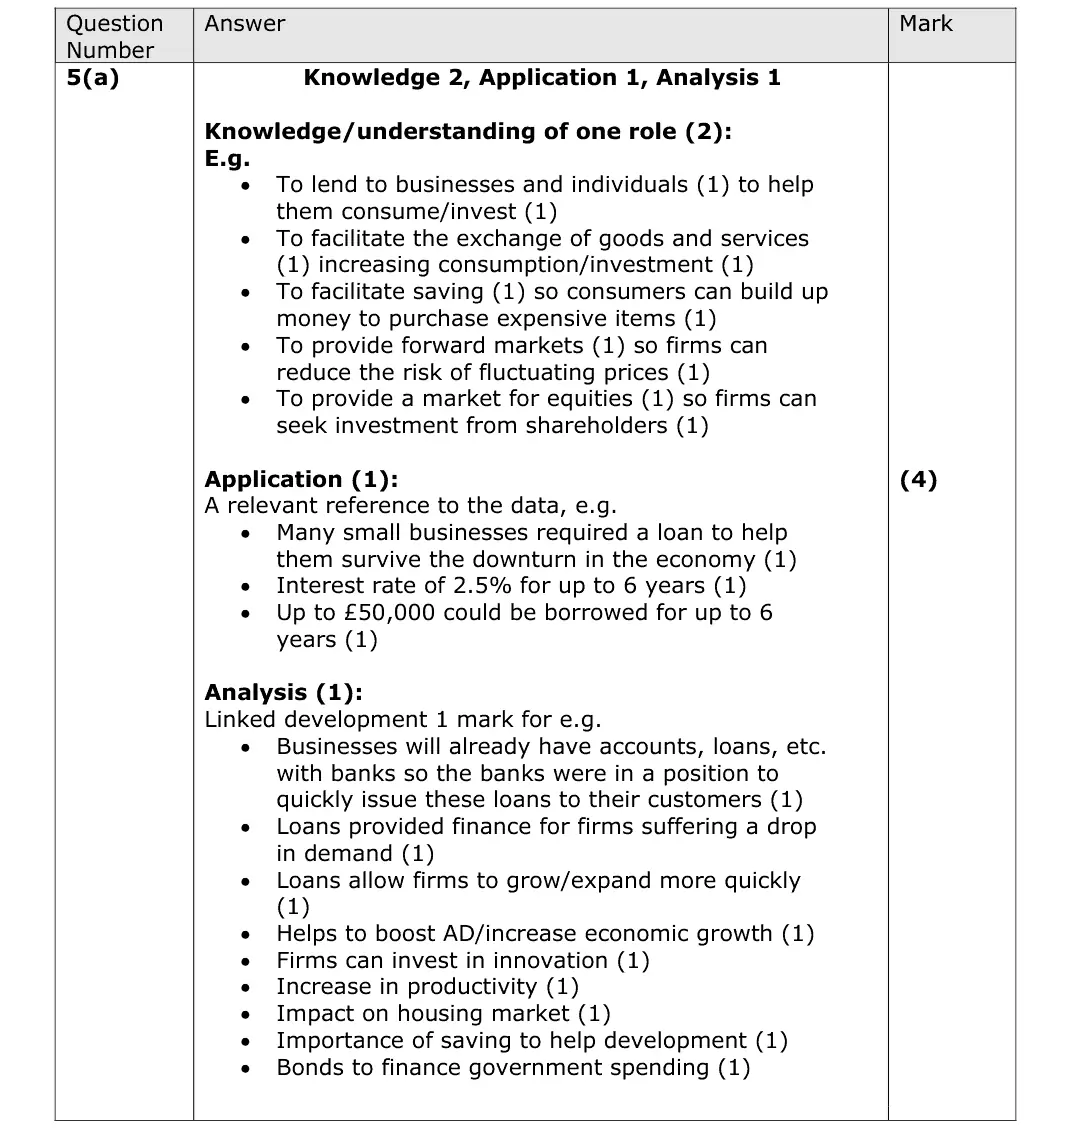
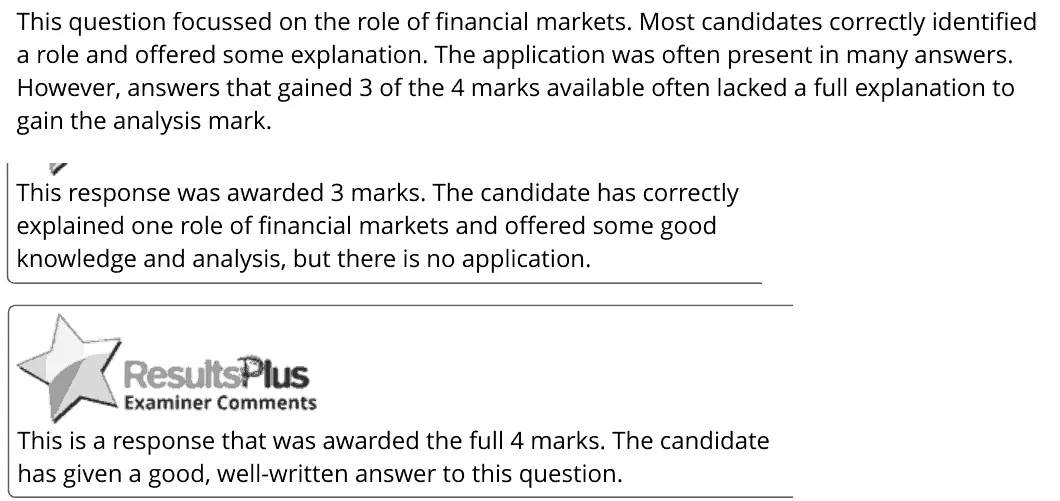
5(a) The financial sector and central banks 4AO1=2,AO2=1,AO3=1Short answer
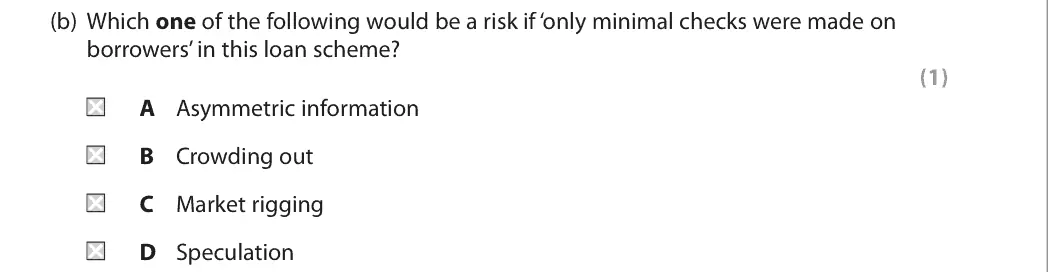
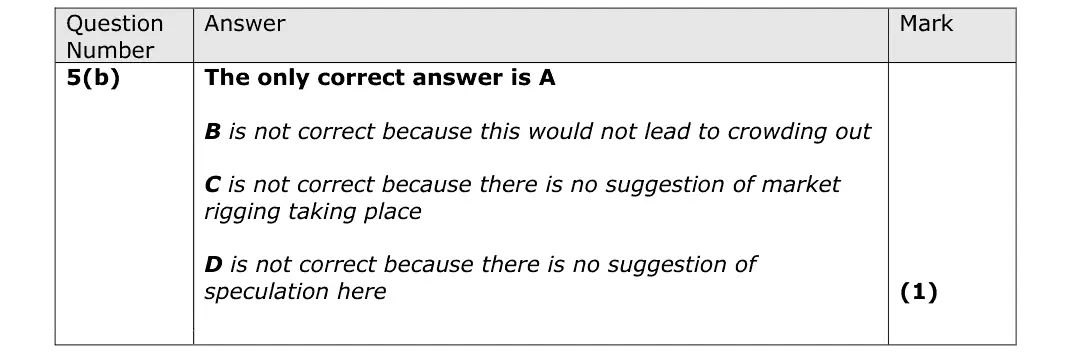
5(b) The financial sector and central banks 1Multiple choice
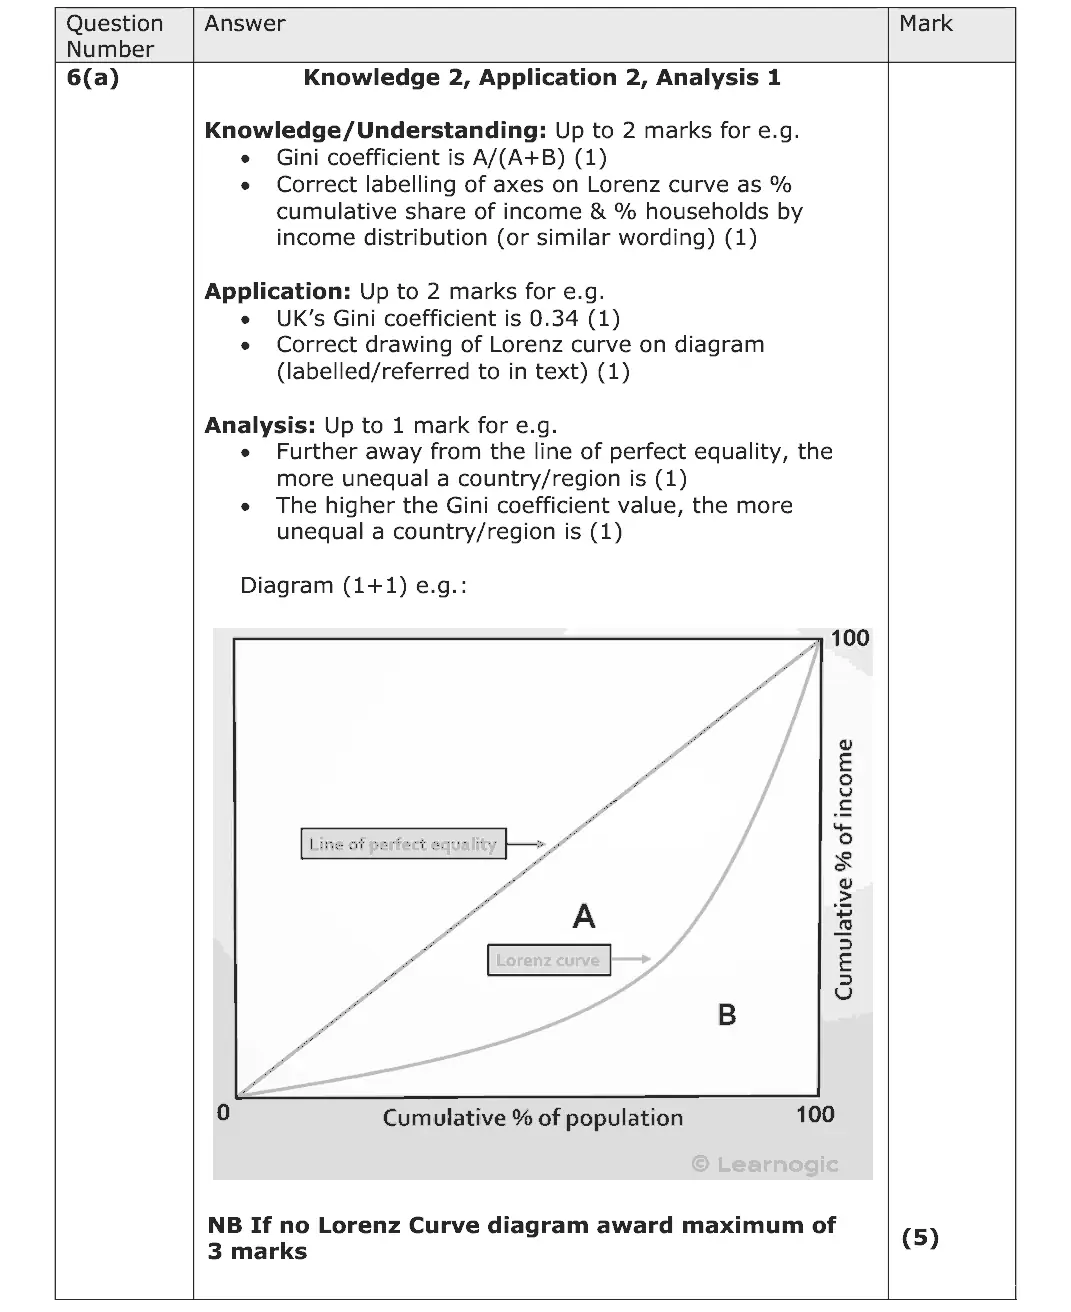
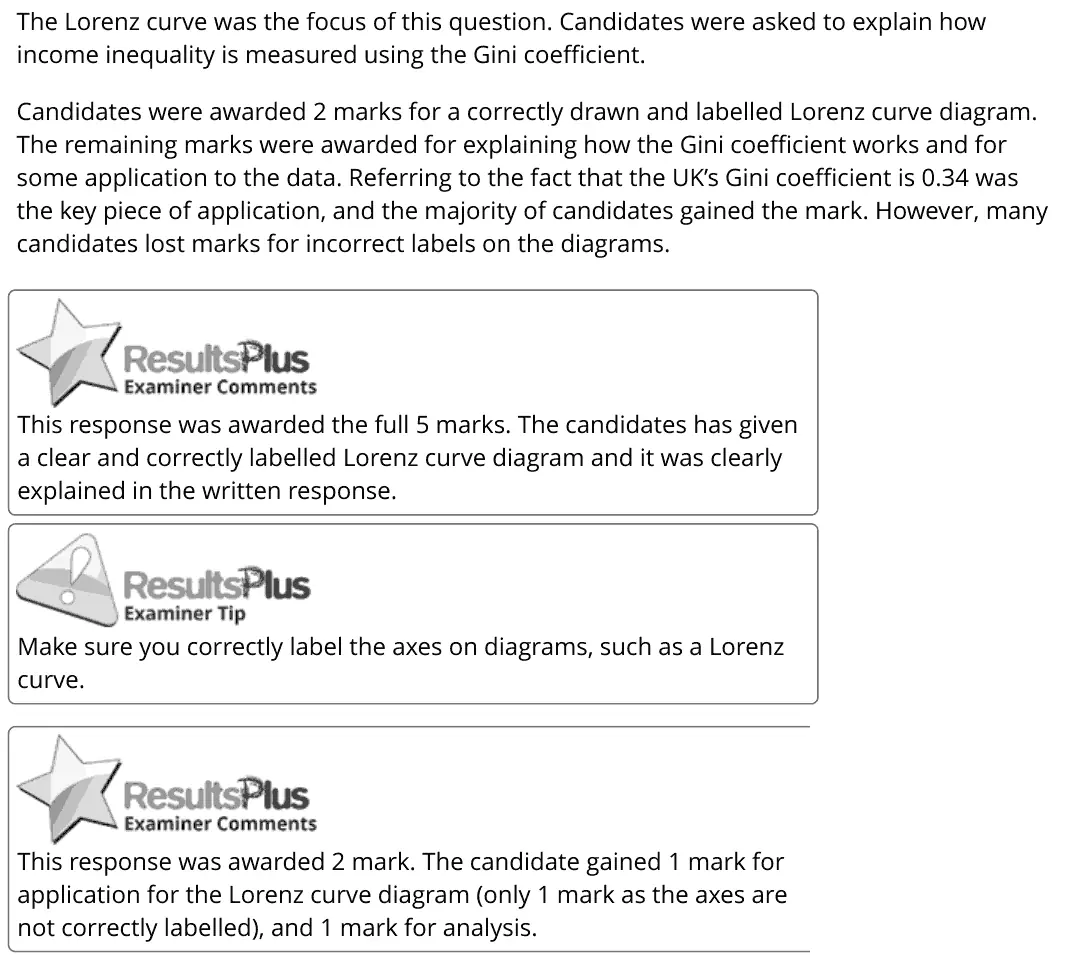
6(a) Poverty and inequality 5AO1=2,AO2=2,AO3=1Diagram
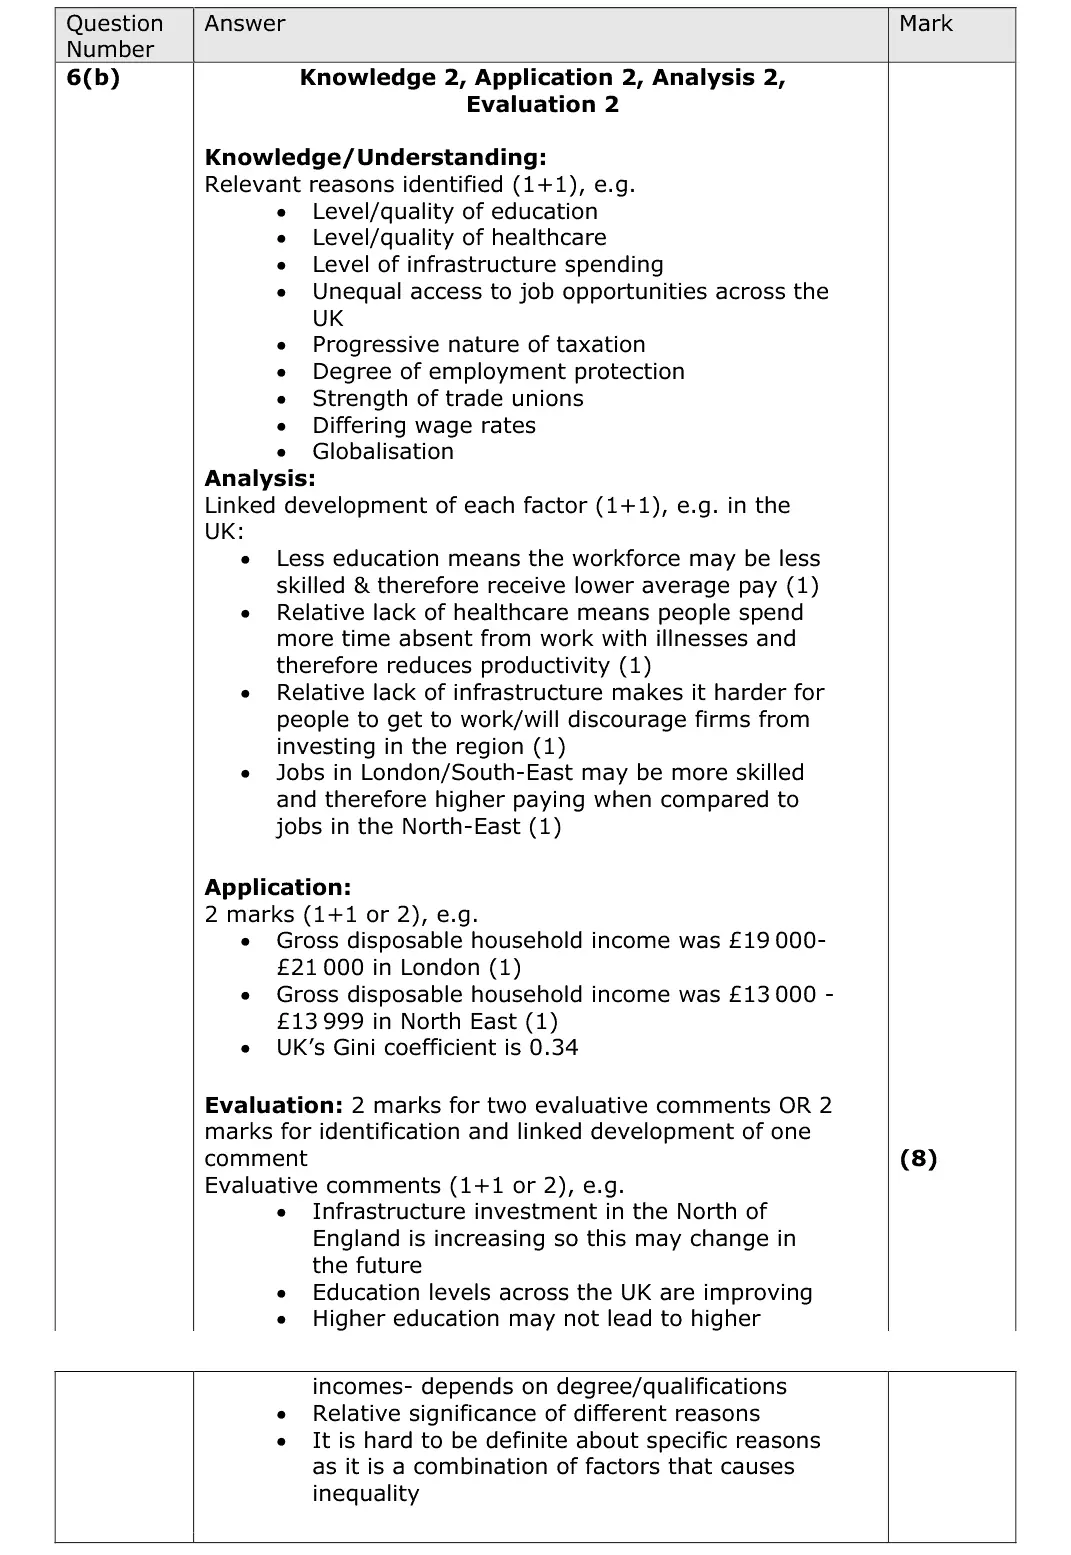
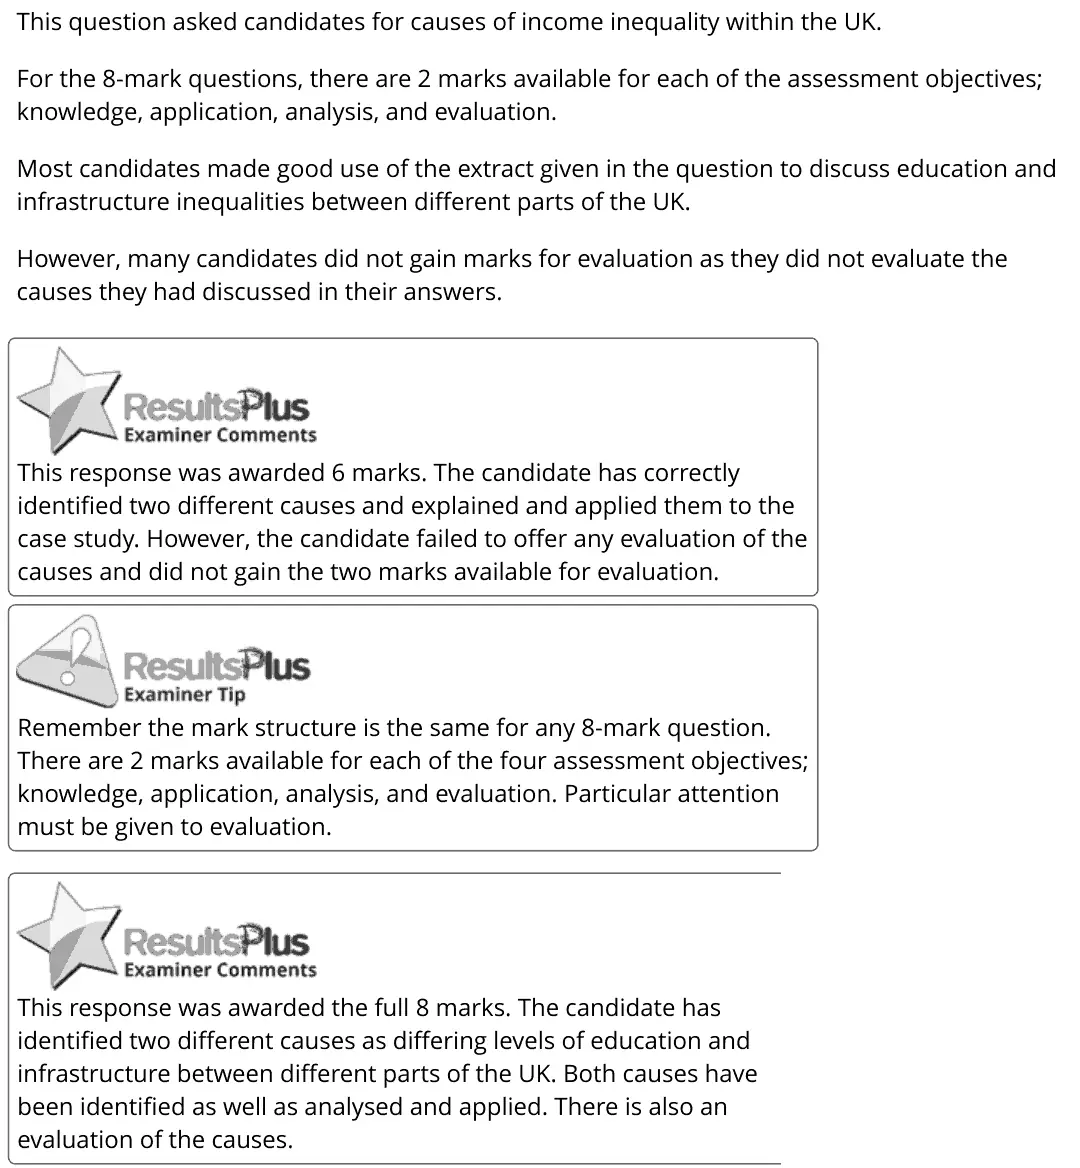
6(b) Poverty and inequality 8AO1=2,AO2=2,AO3=2,AO4=2Extended response
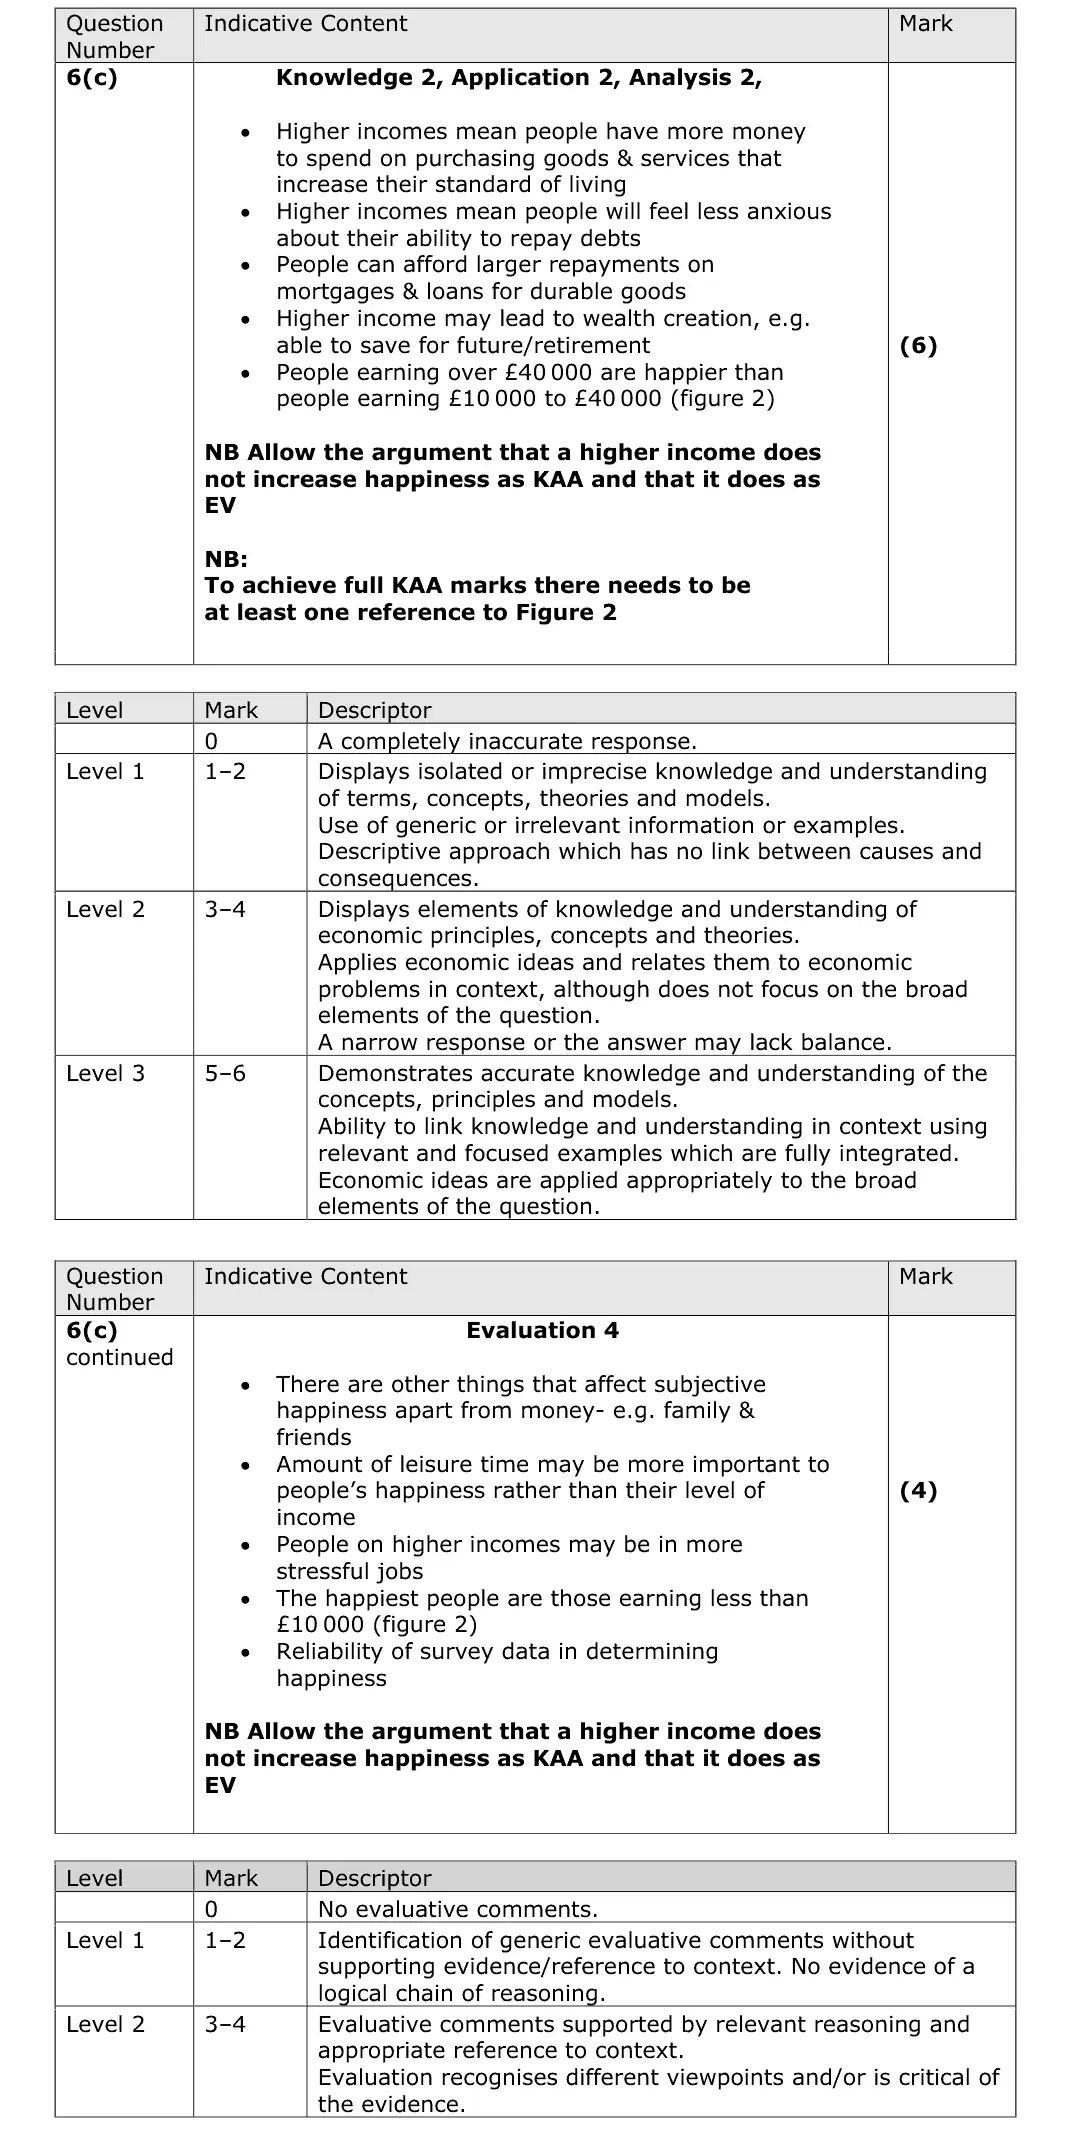
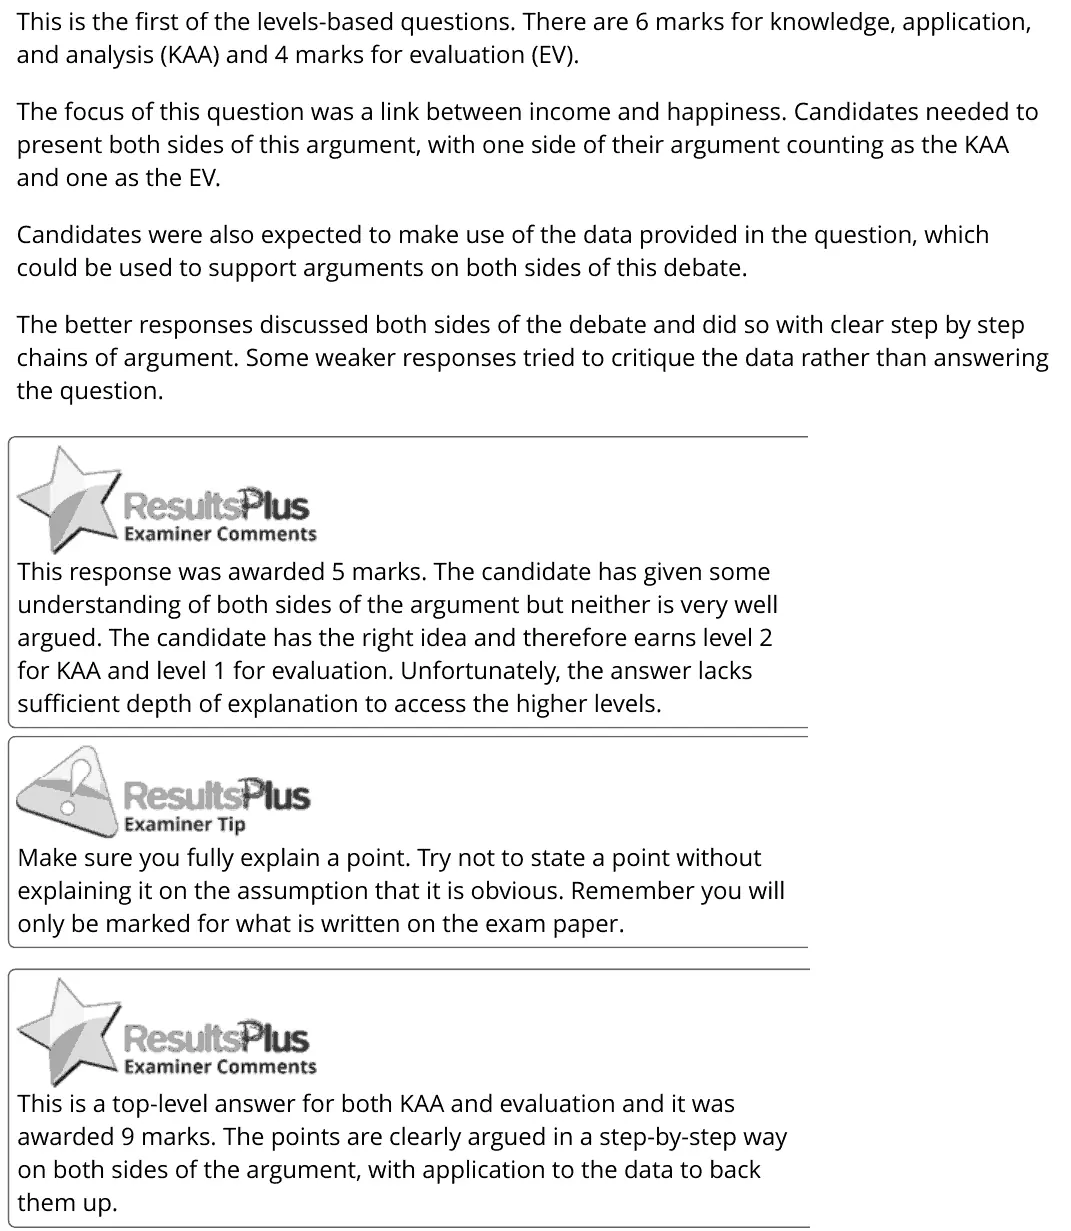
6(c) Measuring economic growth: GDP, GNI and living standards 10AO1=2,AO2=2,AO3=2,AO4=4Extended response
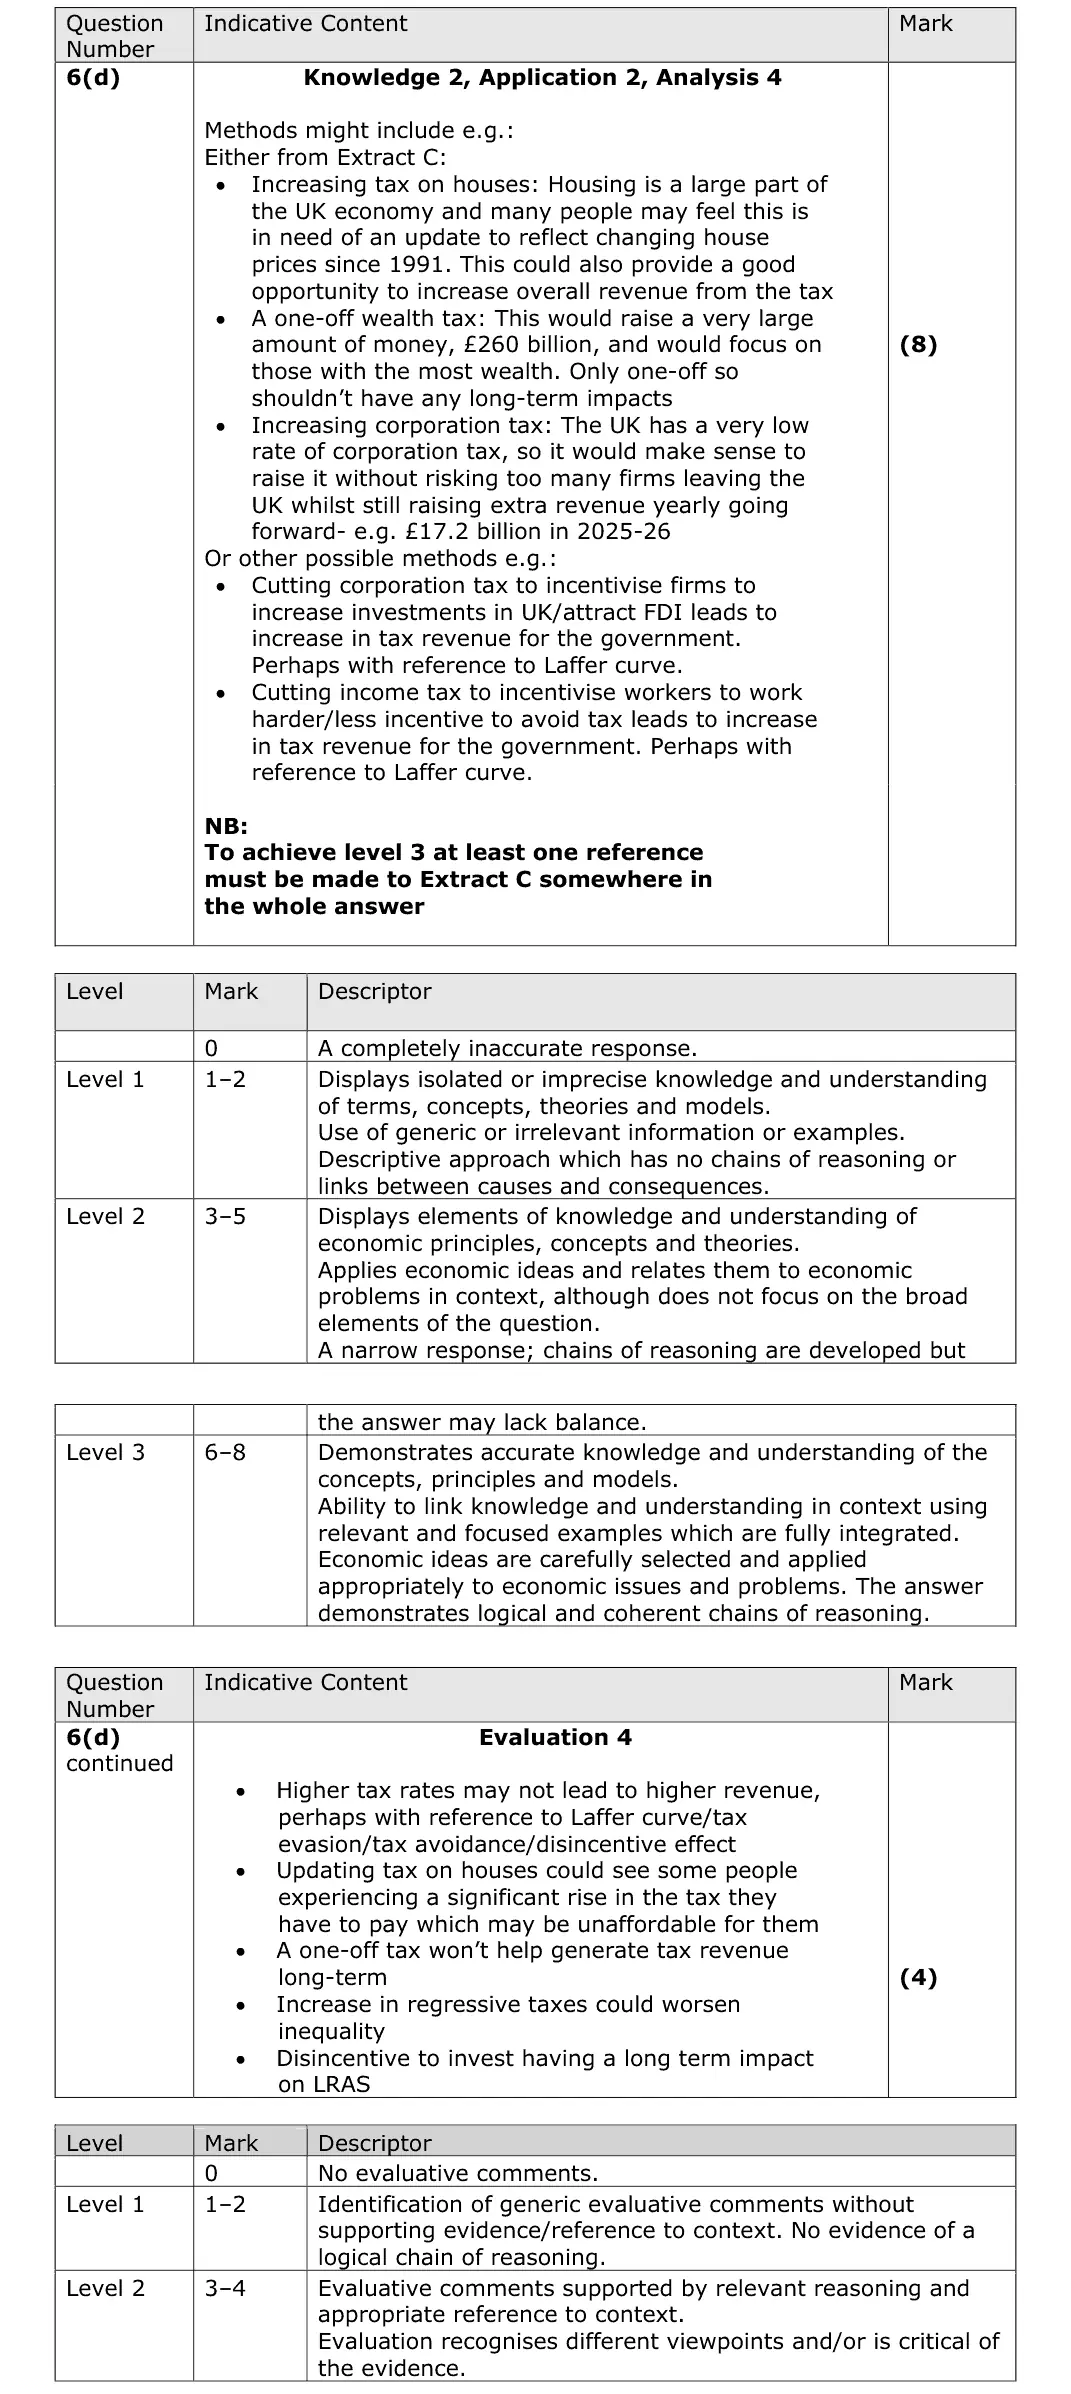
6(d) Public expenditure, taxation and public sector finances 12AO1=2,AO2=2,AO3=4,AO4=4Extended response
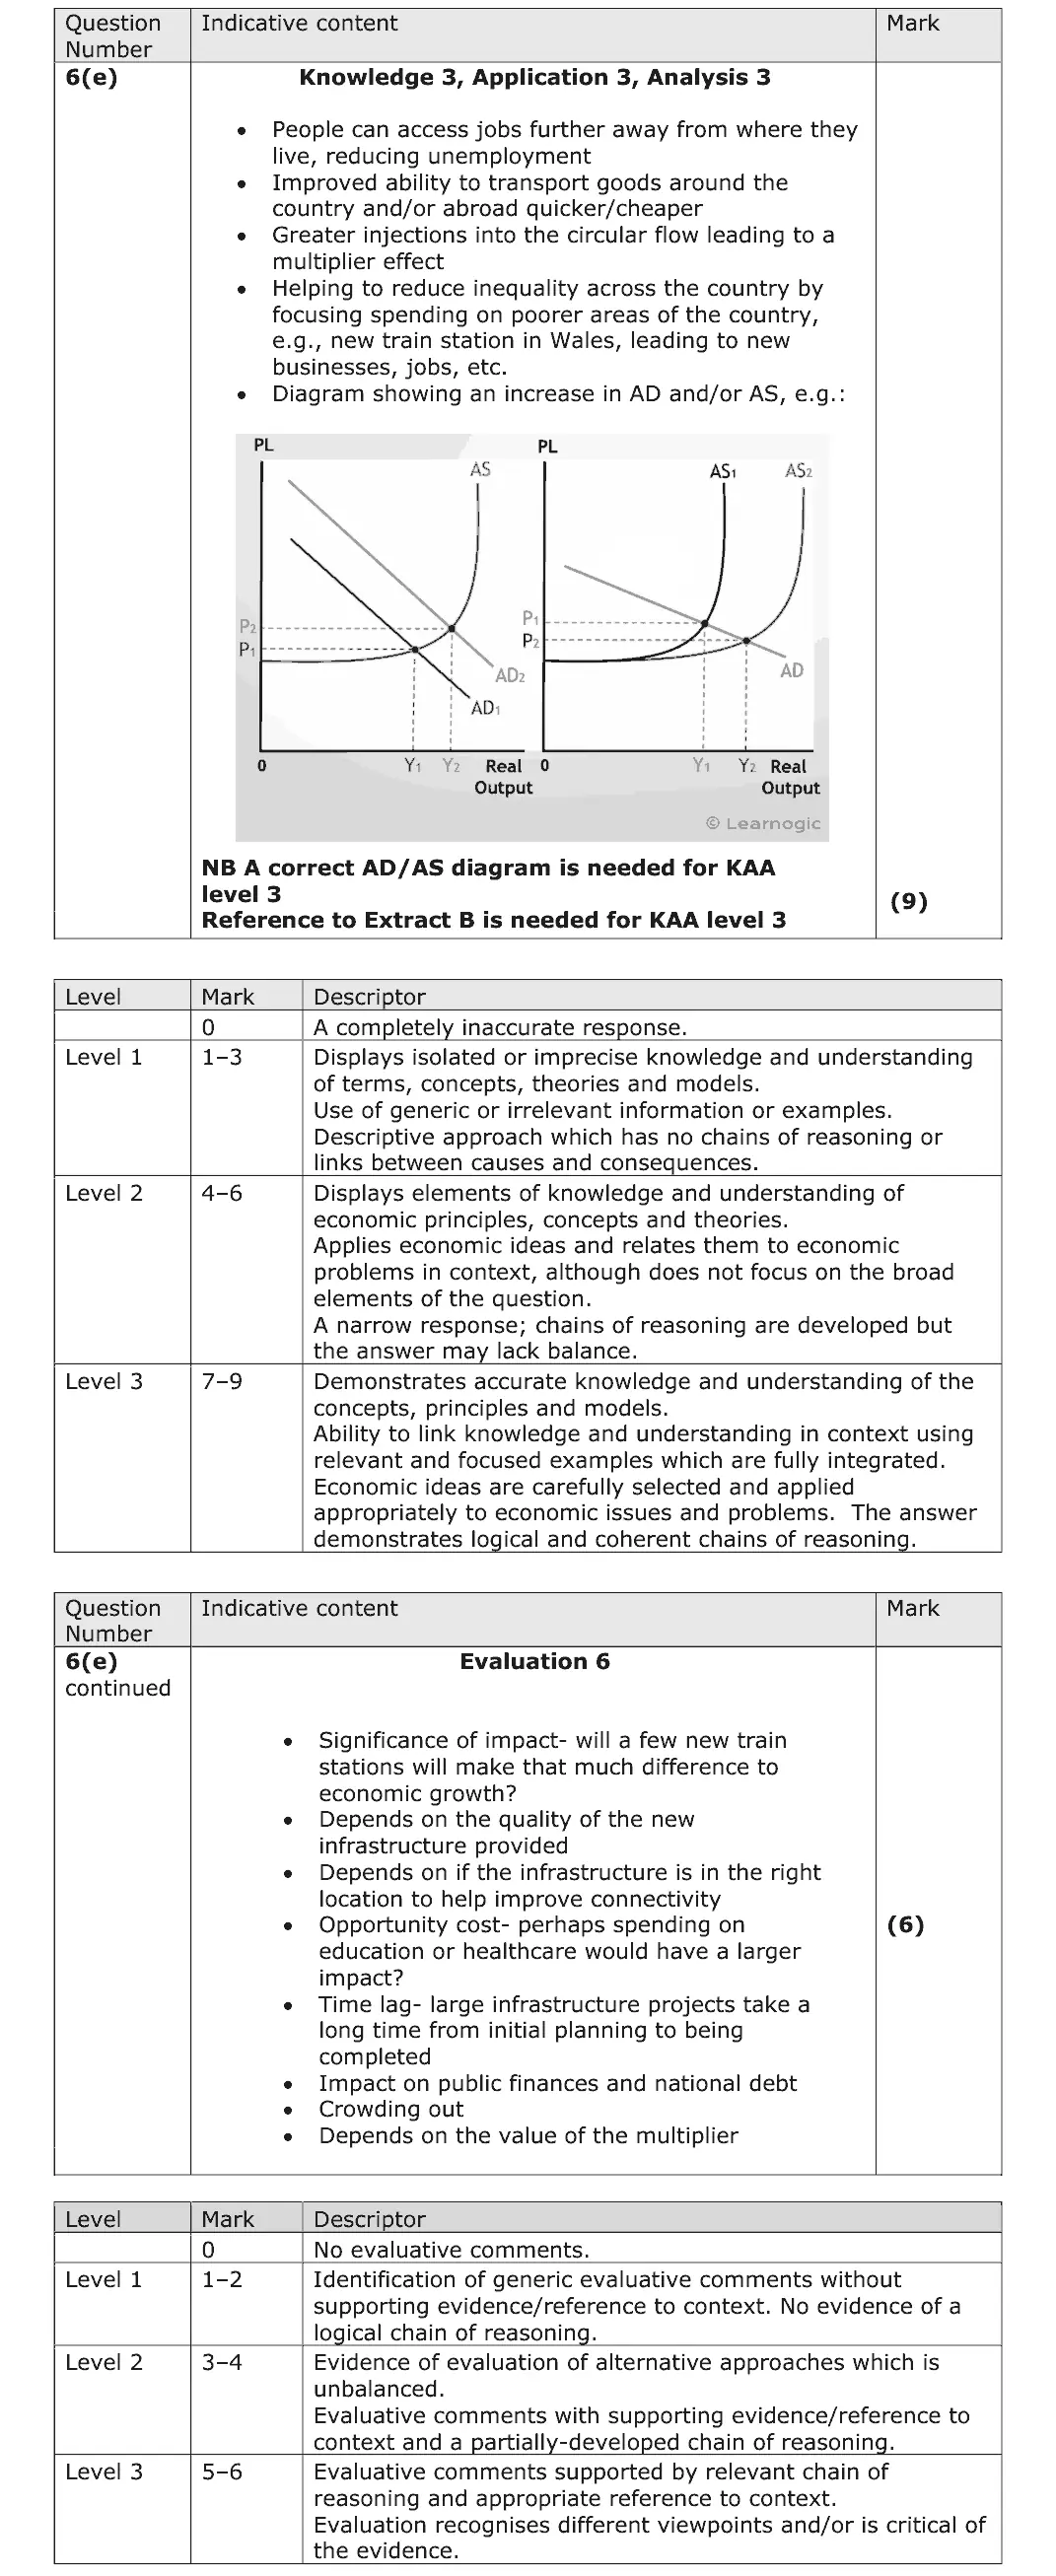
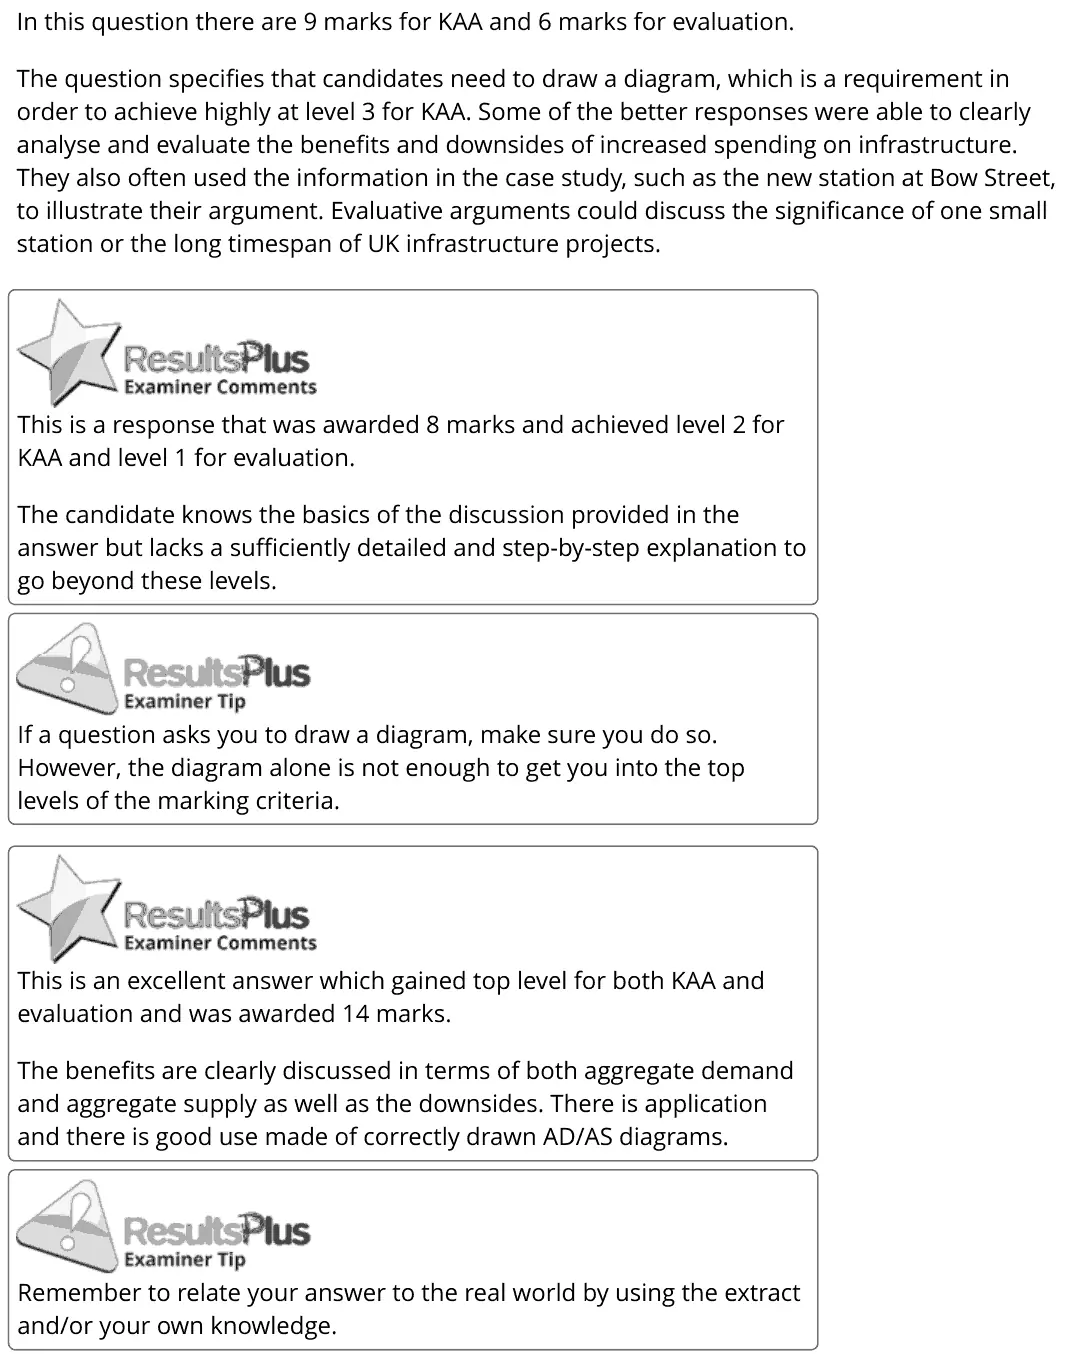
6(e) Supply-side policies, The circular flow, national income and the multiplier 15AO1=3,AO2=3,AO3=3,AO4=6Extended response
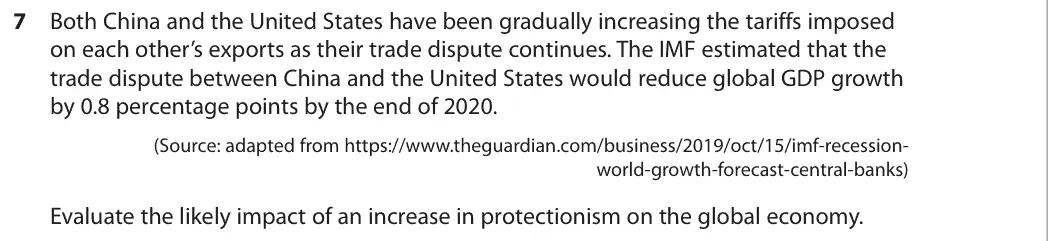
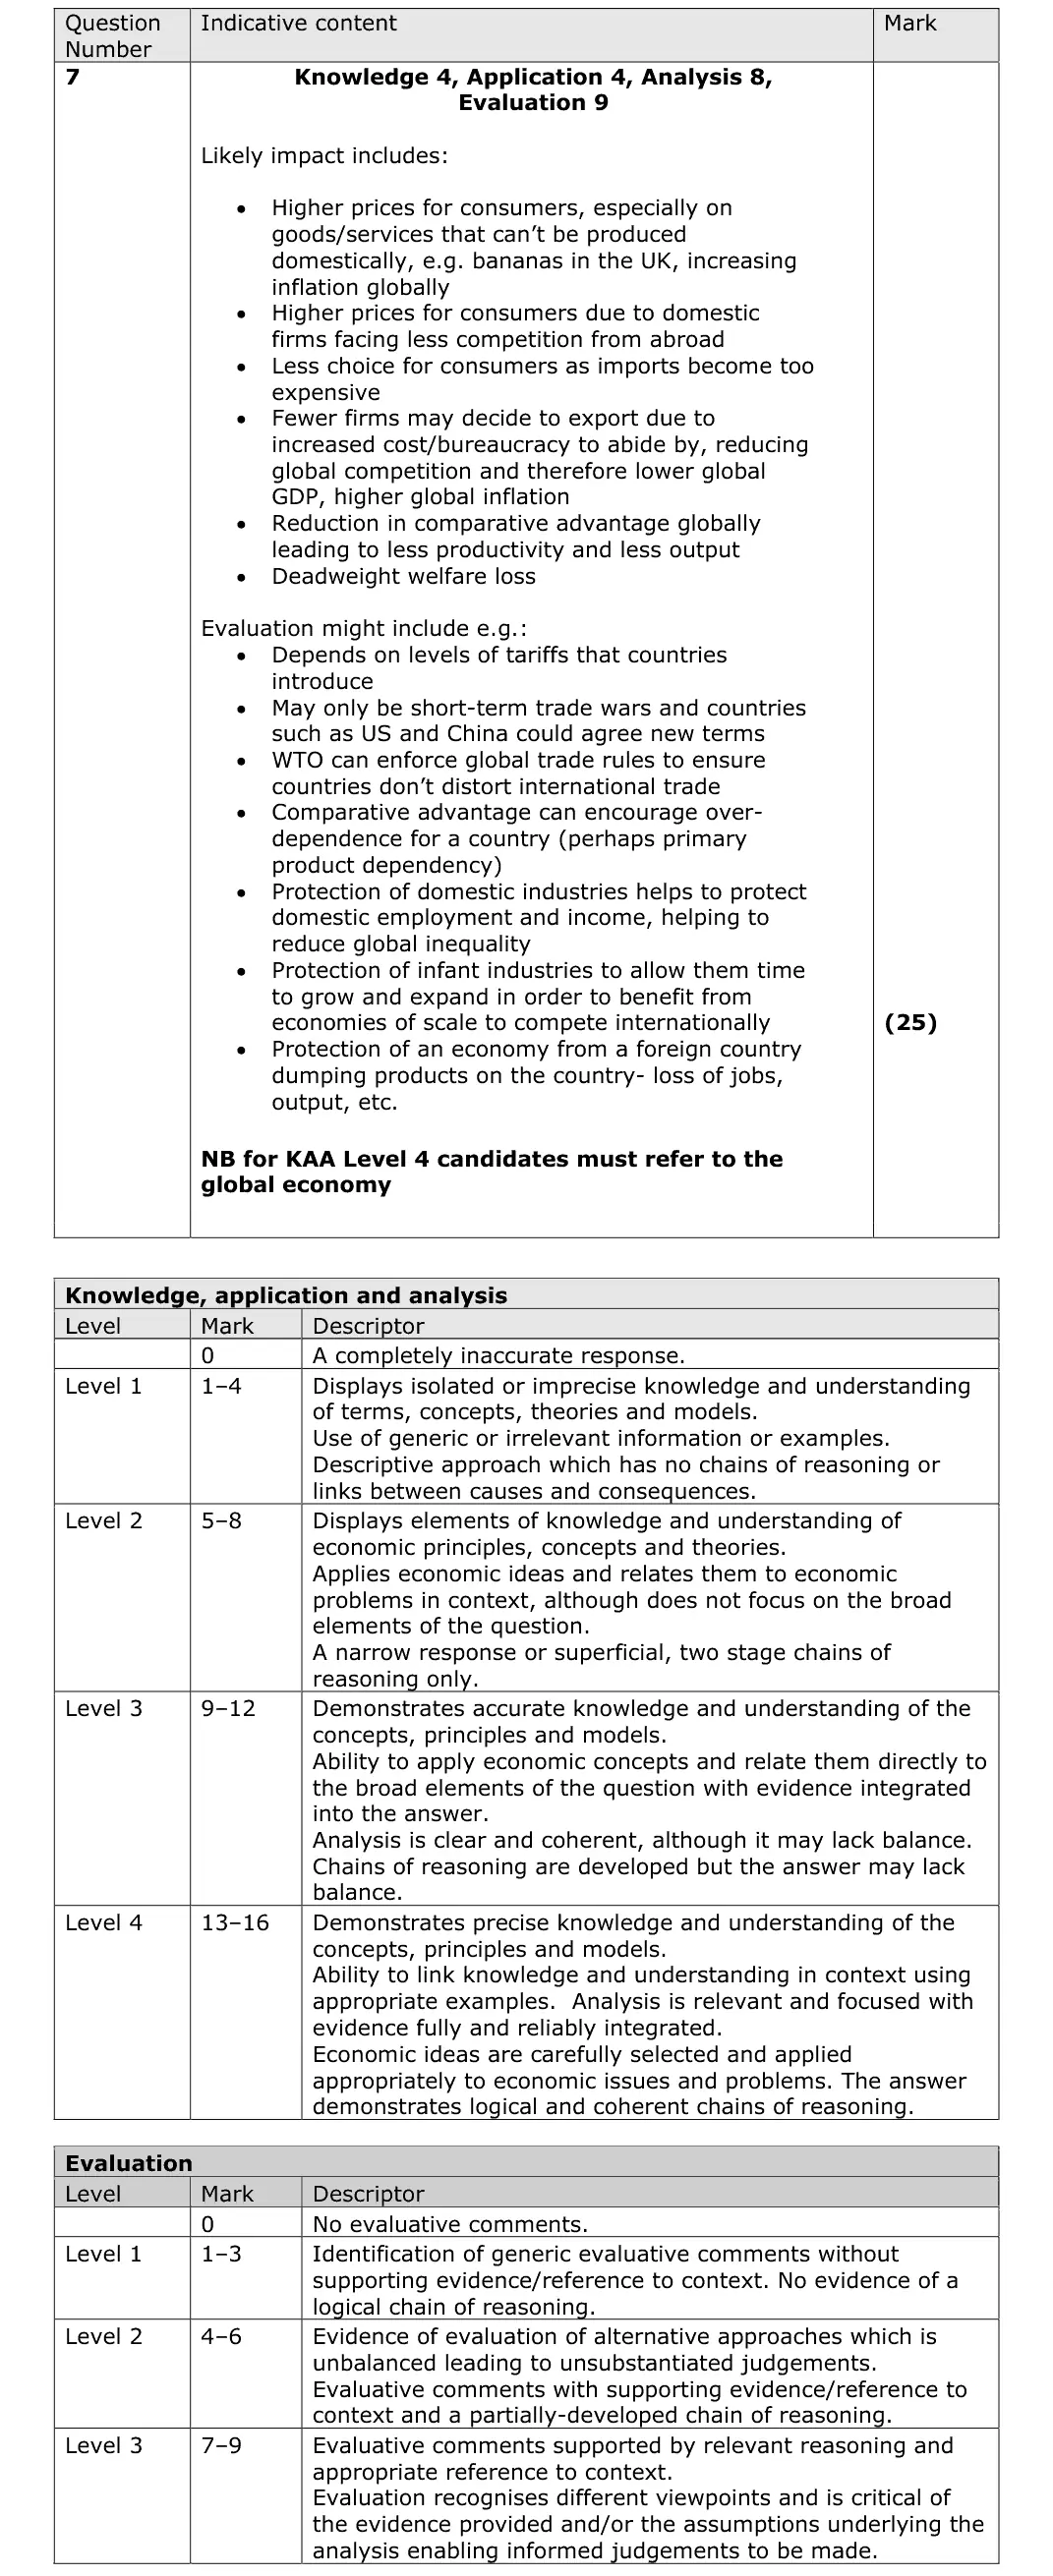
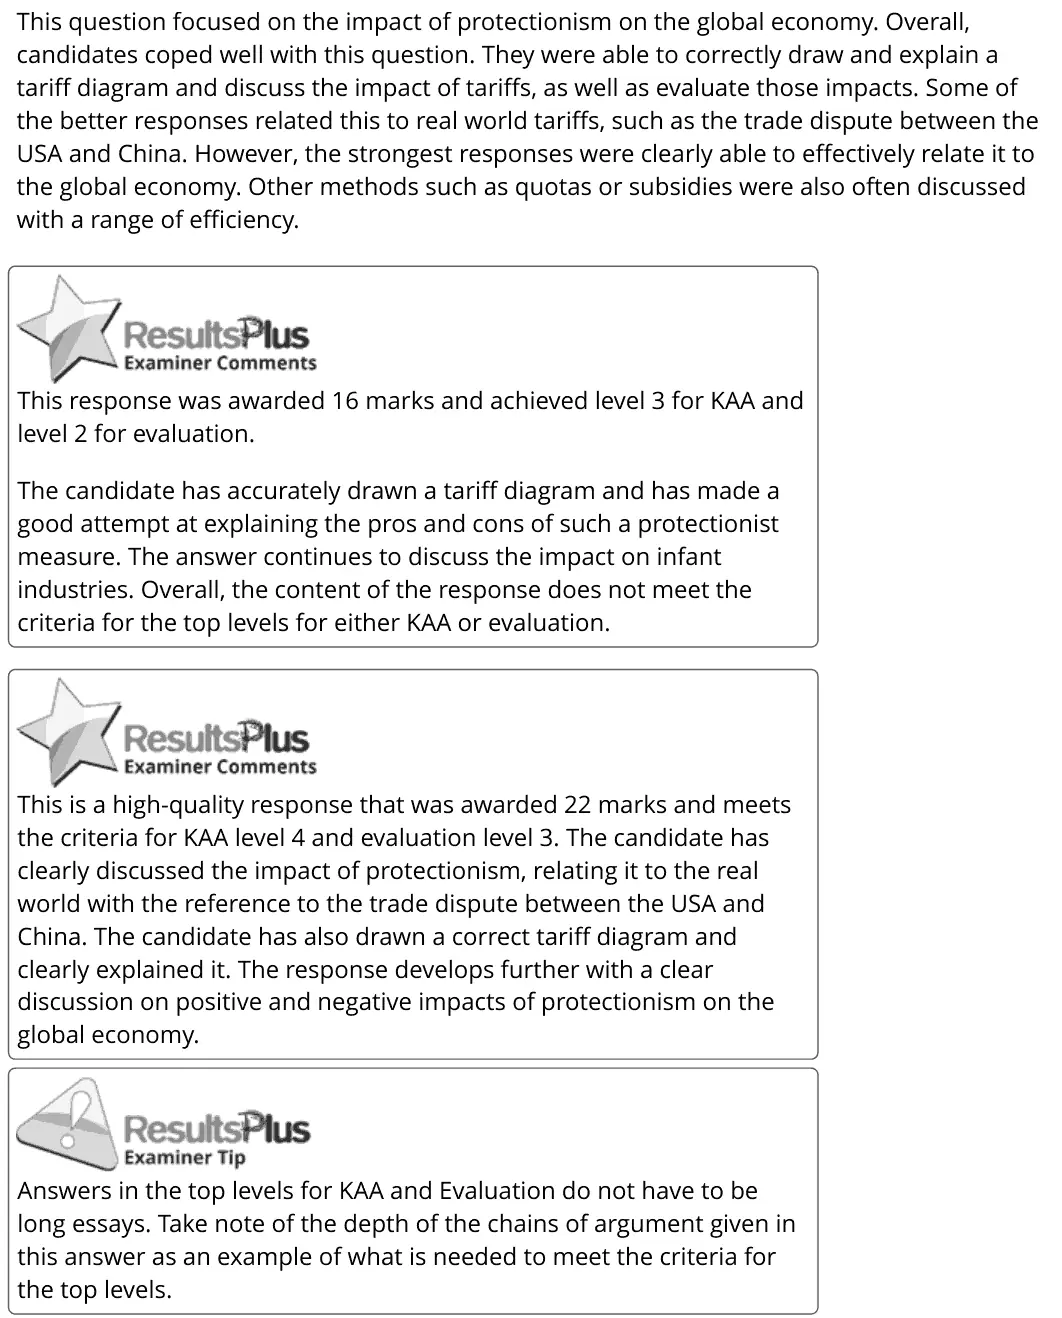
7 Trading blocs, the WTO and protectionism 25AO1=4,AO2=4,AO3=8,AO4=9Essay
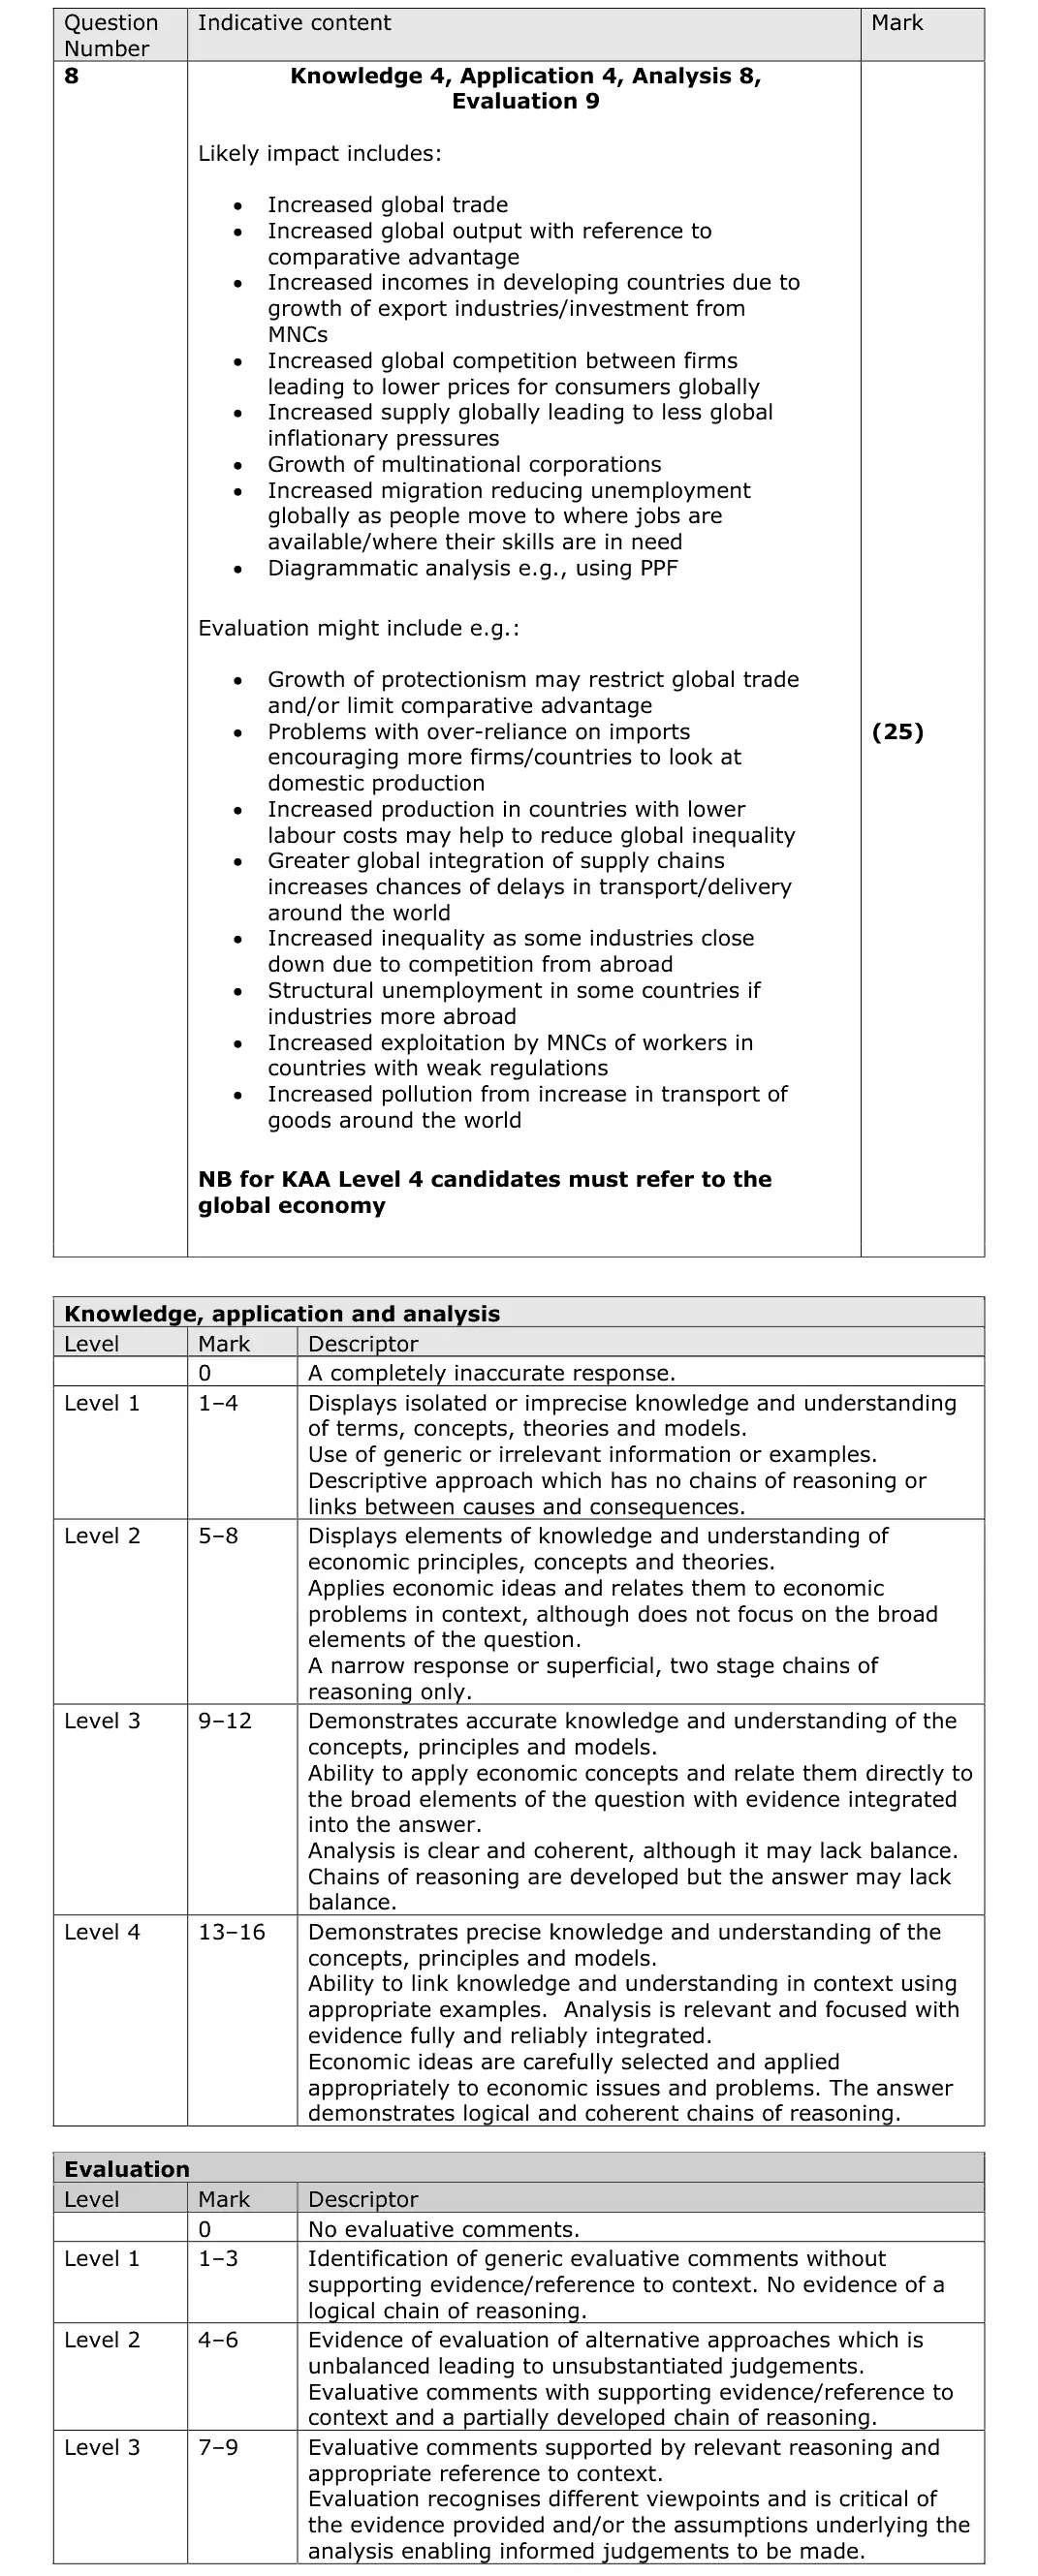
8 Globalisation, specialisation and trade 25AO1=4,AO2=4,AO3=8,AO4=9Essay

The questions

1(a)1(b)2(a)2(b)3(a)3(b)4(a)4(b)5(a)5(b)6(a)6(b)6(c)6(d)6(e)78
June 2022 · Paper 2 · Q1(a) 4 marks AO2=3, AO3=1 Calculation national income and the multiplier
Data and extracts for question 11 According to the Bank of England, the UK’s marginal propensity to consume is estimated to be 0.64. (Source: adapted from https://www.bankofengland.co.uk/-/media/boe/files/working- paper/2017/the-consumption-response-to-positive-and-negative-income-changes.pdf?)
(a) Using the information above, calculate the total reduction in the UK’s GDP from a fall in government spending of £20 million. (4)
June 2022 · Paper 2 · Q1(b) 1 mark Multiple choice national income and the multiplier
Data and extracts for question 11 According to the Bank of England, the UK’s marginal propensity to consume is estimated to be 0.64. (Source: adapted from https://www.bankofengland.co.uk/-/media/boe/files/working- paper/2017/the-consumption-response-to-positive-and-negative-income-changes.pdf?)
(b) Which one of the following is an injection into the circular flow of income? (1) A Imports B Investment C Savings D Taxation
June 2022 · Paper 2 · Q2(a) 1 mark Multiple choice aggregate demand
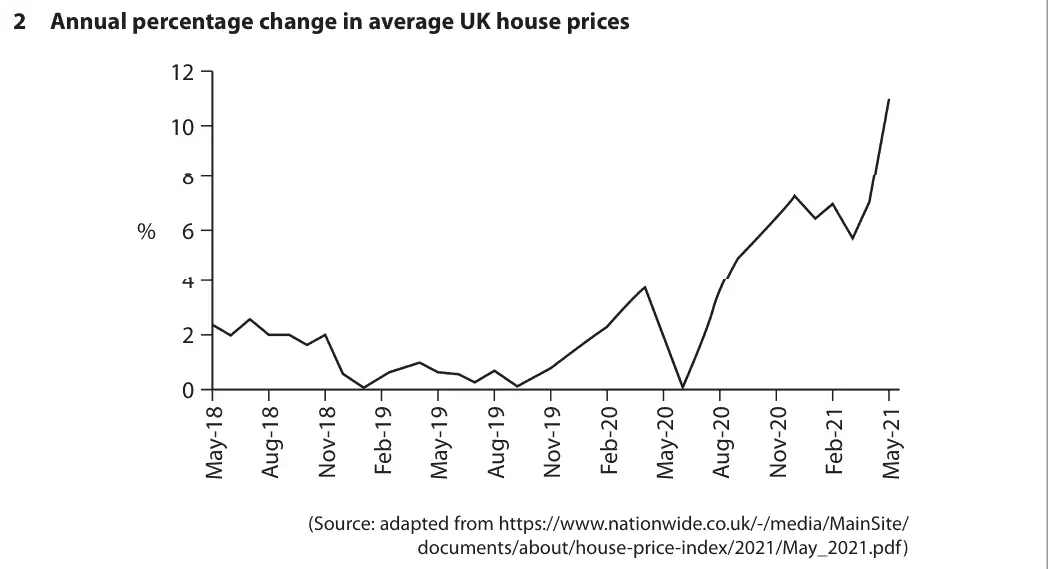
Data and extracts for question 22 Annual percentage change in average UK house prices 12 10 8 % 6 4 2 0 (Source: adapted from https://www.nationwide.co.uk/-/media/MainSite/ documents/about/house-price-index/2021/May_2021.pdf)
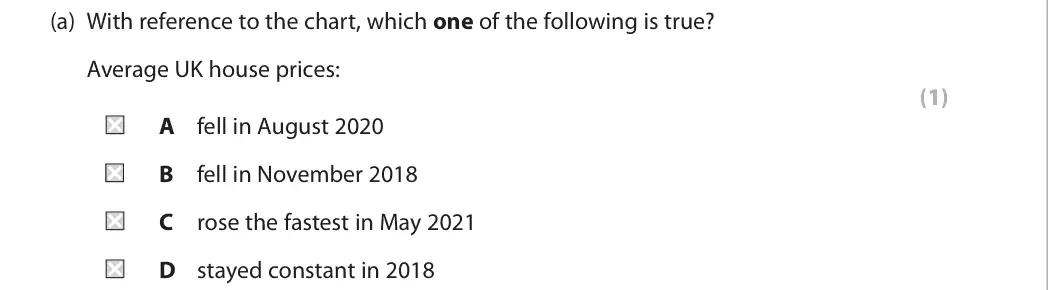
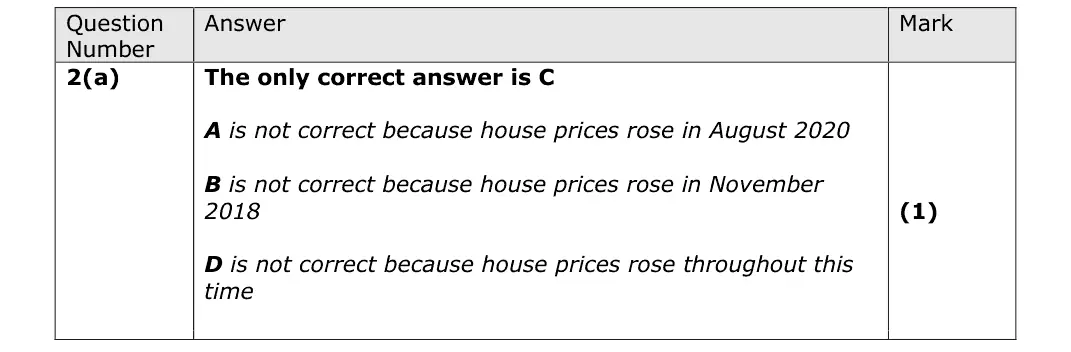
(a) With reference to the chart, which one of the following is true? Average UK house prices: (1) A fell in August 2020 B fell in November 2018 C rose the fastest in May 2021 D stayed constant in 2018
June 2022 · Paper 2 · Q2(b) 4 marks AO1=2, AO2=1, AO3=1 Short answer aggregate demand
Data and extracts for question 22 Annual percentage change in average UK house prices 12 10 8 % 6 4 2 0 (Source: adapted from https://www.nationwide.co.uk/-/media/MainSite/ documents/about/house-price-index/2021/May_2021.pdf)
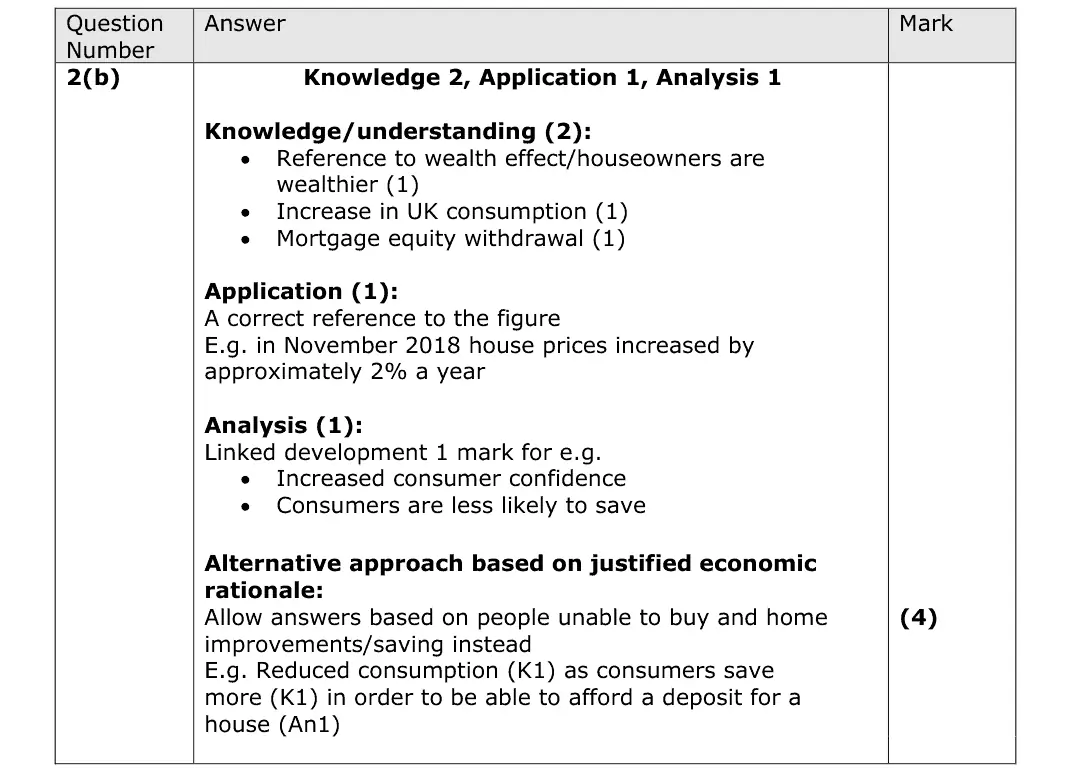
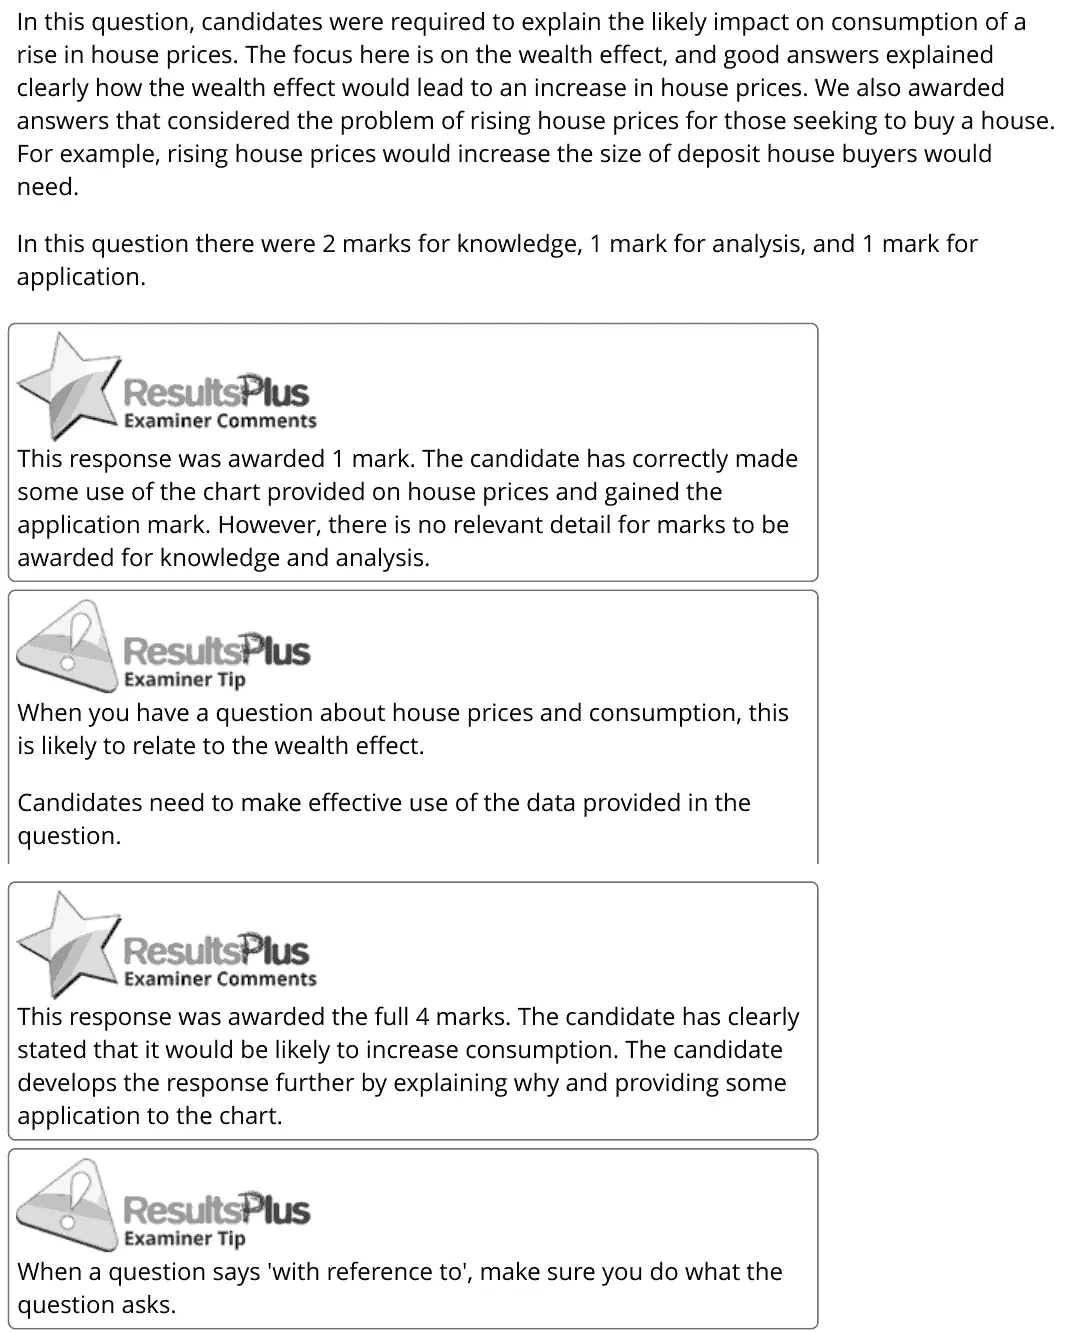
(b) With reference to the chart on the previous page, explain the likely impact of an increase in average house prices on UK consumption. (4)
June 2022 · Paper 2 · Q3(a) 4 marks AO1=2, AO2=1, AO3=1 Short answer aggregate demand
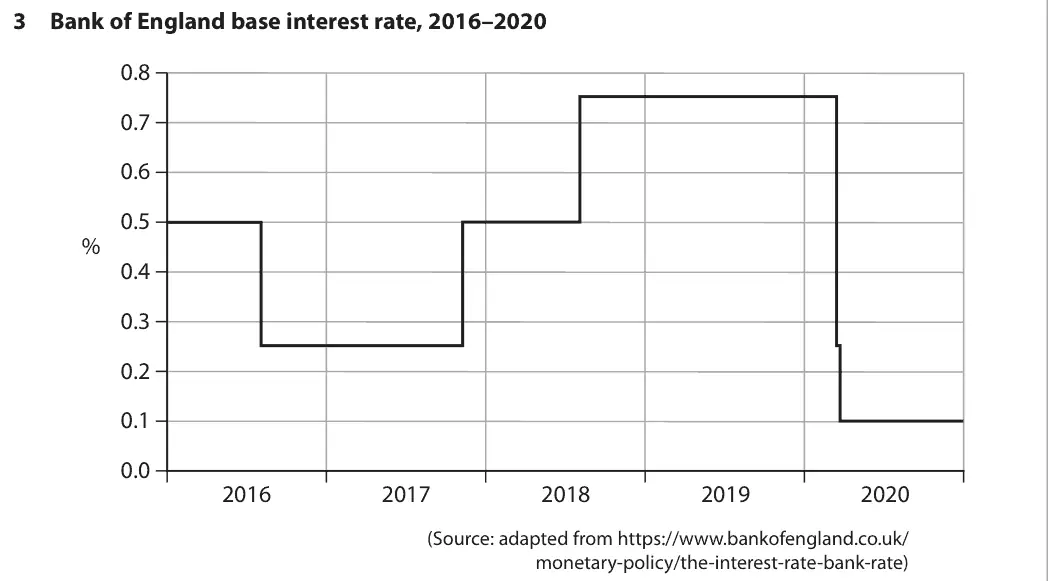
Data and extracts for question 33 Bank of England base interest rate, 2016–2020 0.8 0.7 0.6 0.5 % 0.4 0.3 0.2 0.1 0.0 2016 2017 2018 2019 2020 (Source: adapted from https://www.bankofengland.co.uk/ monetary-policy/the-interest-rate-bank-rate)
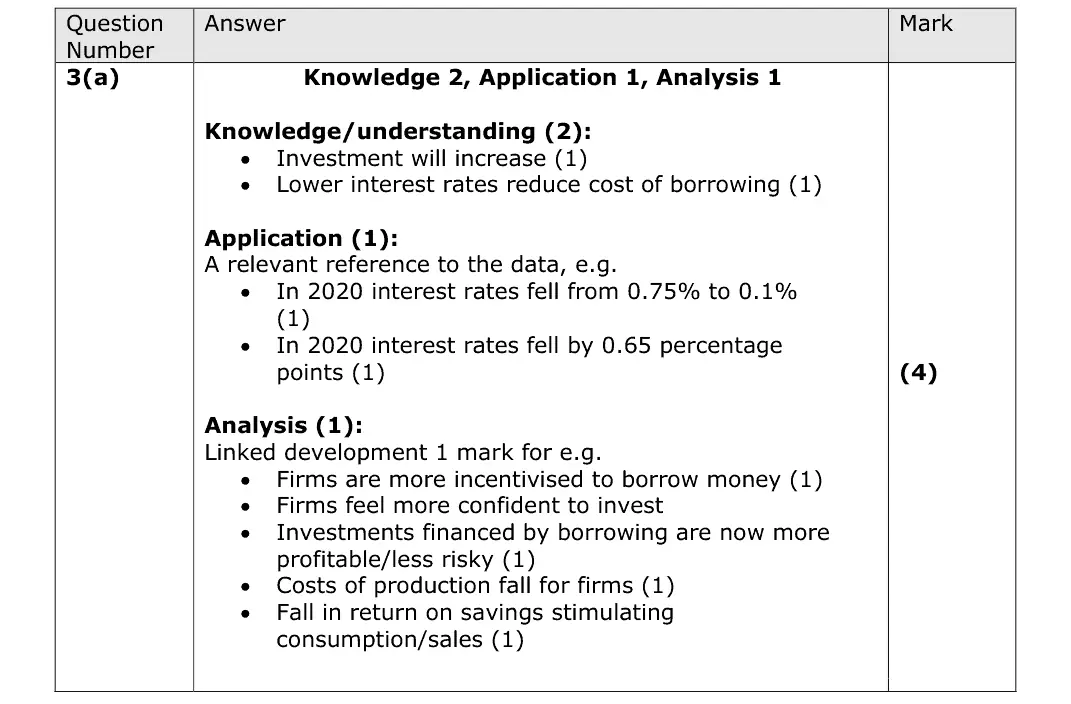
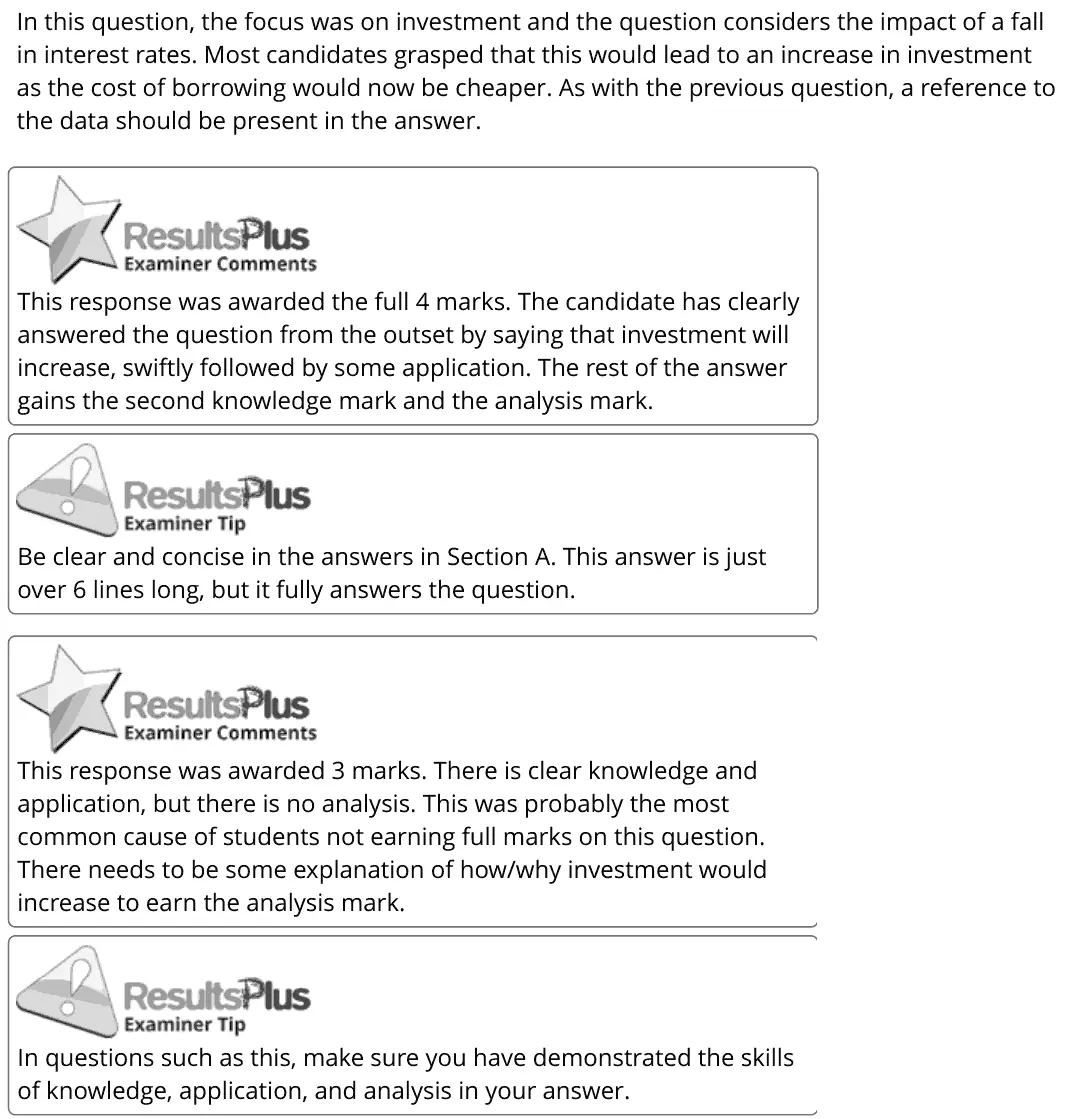
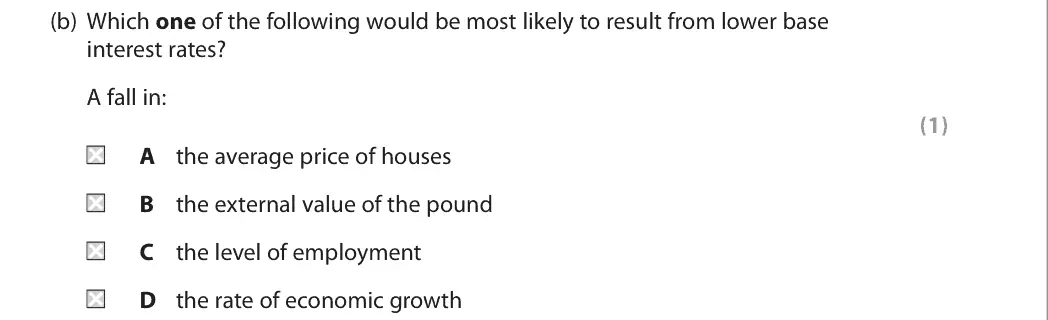
(a) With reference to the chart above, explain the likely impact of a reduction in the base interest rate on UK investment. (4)
June 2022 · Paper 2 · Q3(b) 1 mark Multiple choice exchange rates
Data and extracts for question 33 Bank of England base interest rate, 2016–2020 0.8 0.7 0.6 0.5 % 0.4 0.3 0.2 0.1 0.0 2016 2017 2018 2019 2020 (Source: adapted from https://www.bankofengland.co.uk/ monetary-policy/the-interest-rate-bank-rate)
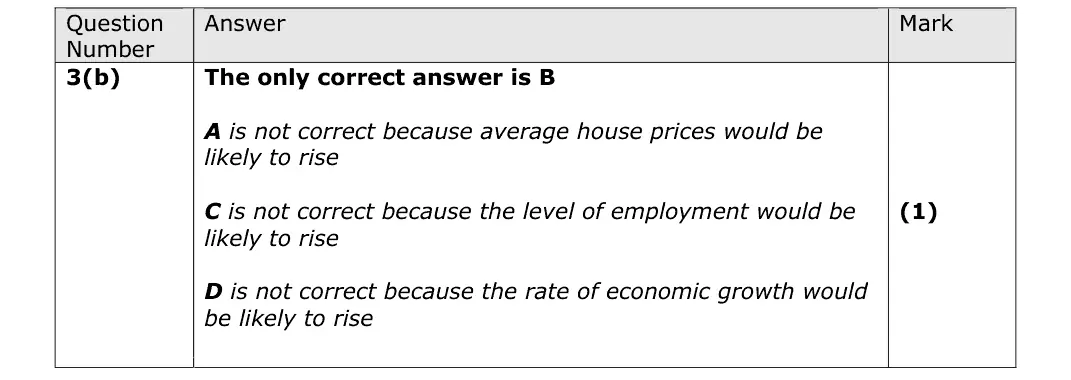
(b) Which one of the following would be most likely to result from lower base interest rates? A fall in: (1) A the average price of houses B the external value of the pound C the level of employment D the rate of economic growth
June 2022 · Paper 2 · Q4(a) 1 mark Multiple choice economic growth and the trade cycle
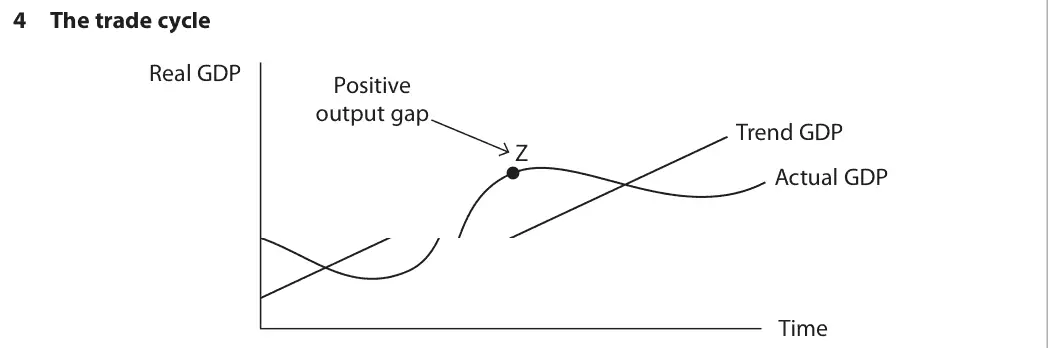
Data and extracts for question 44 The trade cycle Real GDP Positive output gap Trend GDP Z Actual GDP Time
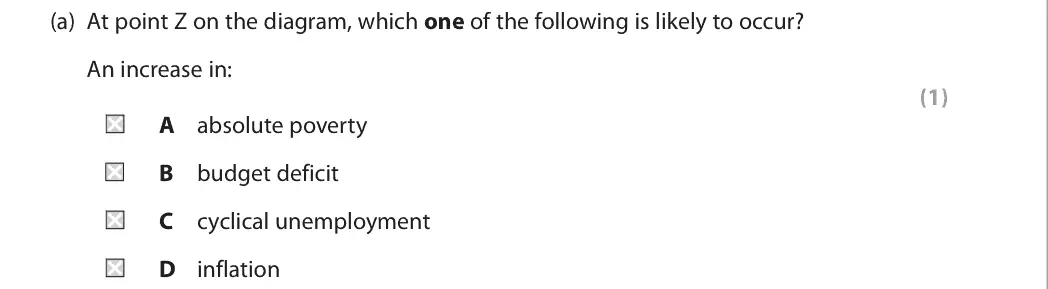
(a) At point Z on the diagram, which one of the following is likely to occur? An increase in: (1) A absolute poverty B budget deficit C cyclical unemployment D inflation
June 2022 · Paper 2 · Q4(b) 4 marks AO1=3, AO2=1 Short answer Hard public finances and taxation
Data and extracts for question 44 The trade cycle Real GDP Positive output gap Trend GDP Z Actual GDP Time
(b) With reference to the graph, explain the difference between automatic stabilisers and discretionary fiscal policy. (4)
June 2022 · Paper 2 · Q5(a) 4 marks AO1=2, AO2=1, AO3=1 Short answer financial sector
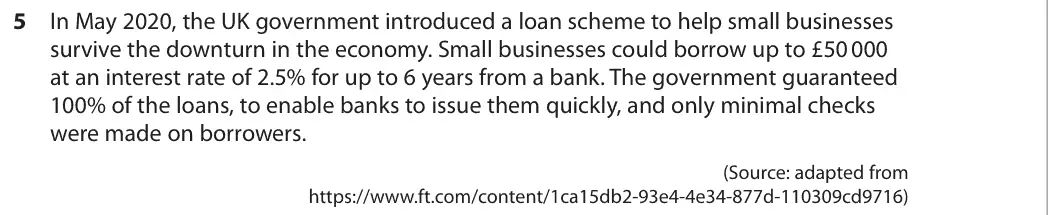
Data and extracts for question 55 In May 2020, the UK government introduced a loan scheme to help small businesses survive the downturn in the economy. Small businesses could borrow up to £50 000 at an interest rate of 2.5% for up to 6 years from a bank. The government guaranteed 100% of the loans, to enable banks to issue them quickly, and only minimal checks were made on borrowers. (Source: adapted from https://www.ft.com/content/1ca15db2-93e4-4e34-877d-110309cd9716)
(a) With reference to the information above, explain one role of financial markets. (4)
June 2022 · Paper 2 · Q5(b) 1 mark Multiple choice financial sector
Data and extracts for question 55 In May 2020, the UK government introduced a loan scheme to help small businesses survive the downturn in the economy. Small businesses could borrow up to £50 000 at an interest rate of 2.5% for up to 6 years from a bank. The government guaranteed 100% of the loans, to enable banks to issue them quickly, and only minimal checks were made on borrowers. (Source: adapted from https://www.ft.com/content/1ca15db2-93e4-4e34-877d-110309cd9716)
(b) Which one of the following would be a risk if ‘only minimal checks were made on borrowers’ in this loan scheme? (1) A Asymmetric information B Crowding out C Market rigging D Speculation
June 2022 · Paper 2 · Q6(a) 5 marks AO1=2, AO2=2, AO3=1 Diagram poverty and inequality
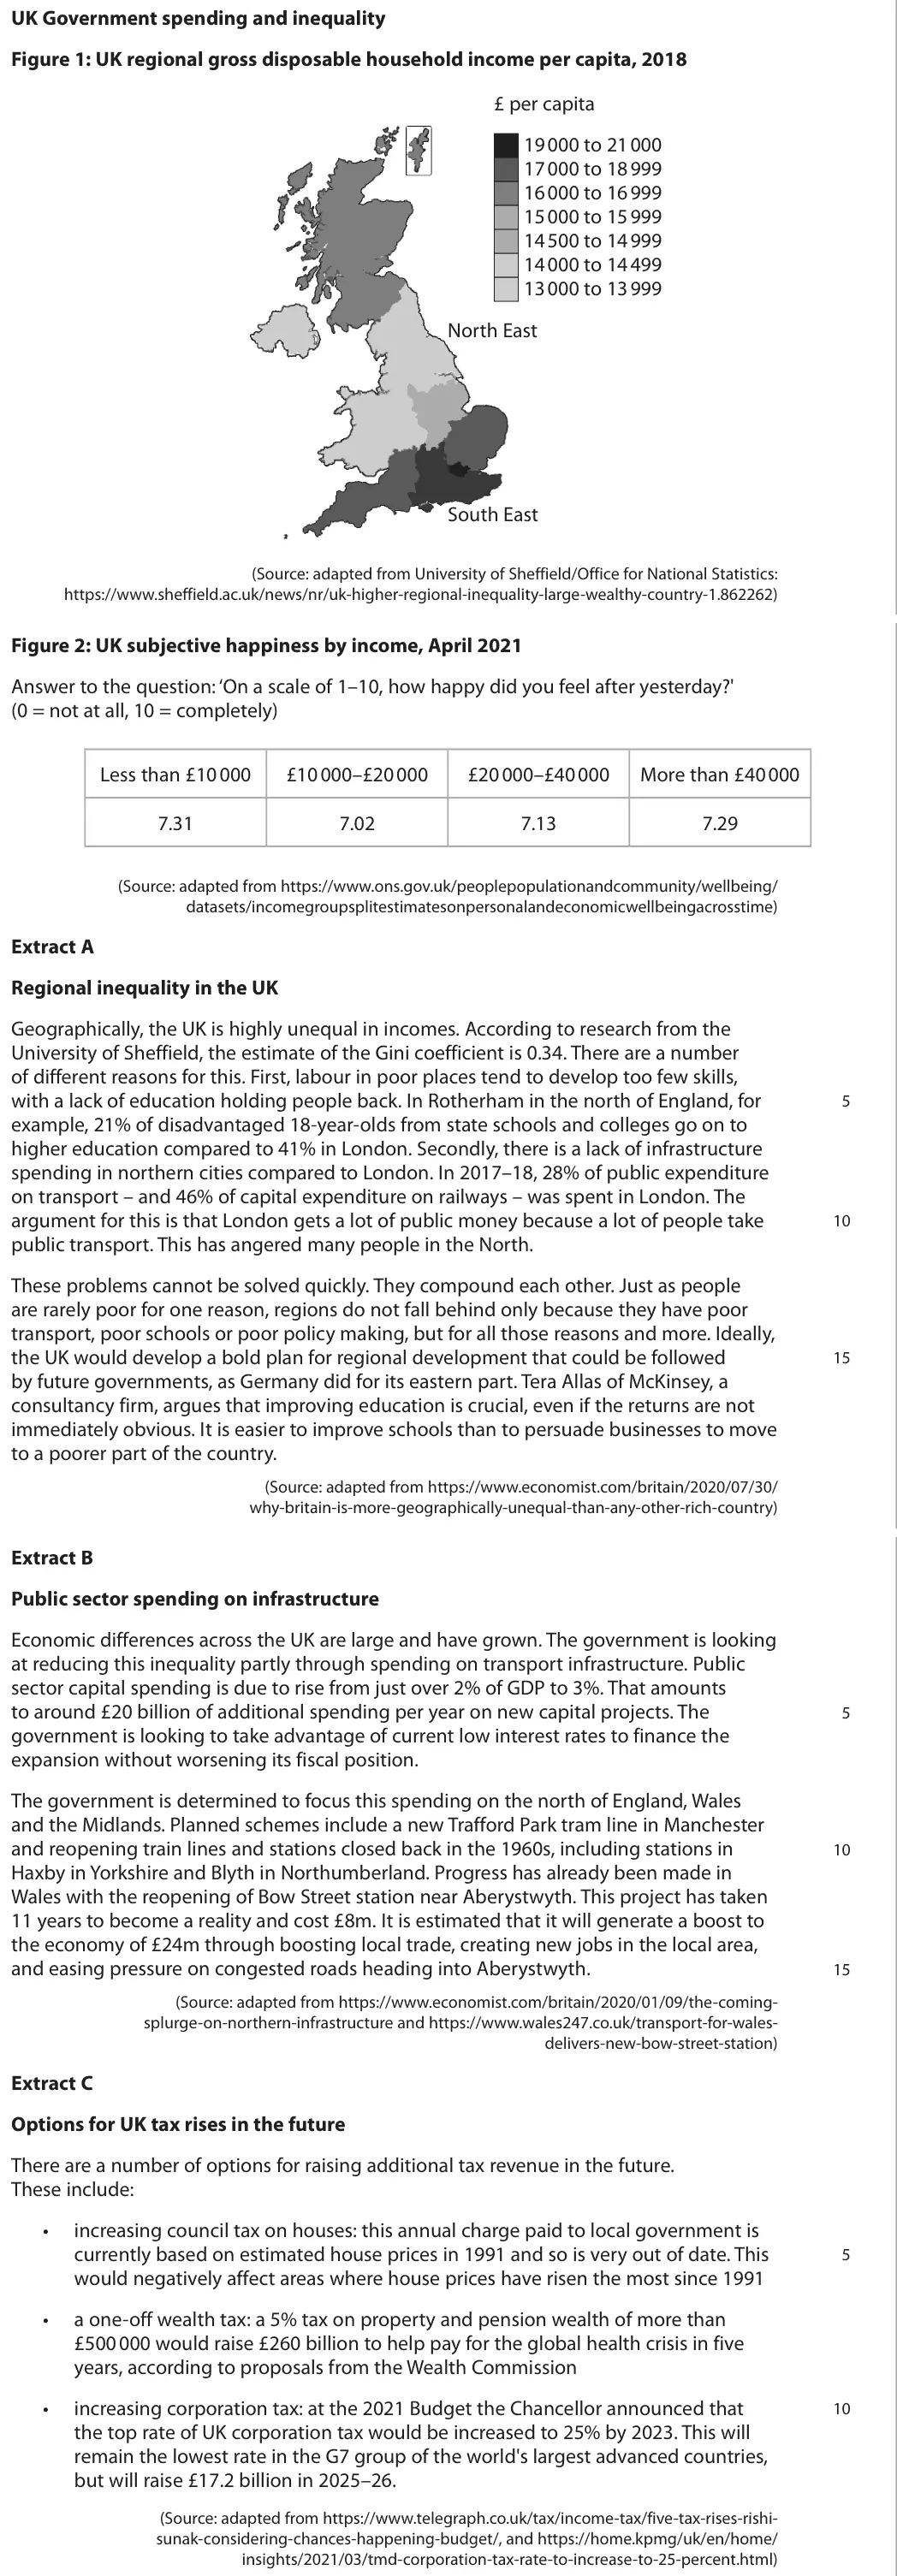
Data and extracts for question 6UK Government spending and inequality Figure 1: UK regional gross disposable household income per capita, 2018 £ per capita 19 000 to 21 000 17 000 to 18 999 16 000 to 16 999 15 000 to 15 999 14 500 to 14 999 14 000 to 14 499 13 000 to 13 999 North East South East (Source: adapted from University of Sheffield/Office for National Statistics: https://www.sheffield.ac.uk/news/nr/uk-higher-regional-inequality-large-wealthy-country-1.862262) Figure 2: UK subjective happiness by income, April 2021 Answer to the question: ‘On a scale of 1–10, how happy did you feel after yesterday?' (0 = not at all, 10 = completely) Less than £10 000 £10 000–£20 000 £20 000–£40 000 More than £40 000 7.31 7.02 7.13 7.29 (Source: adapted from https://www.ons.gov.uk/peoplepopulationandcommunity/wellbeing/ datasets/incomegroupsplitestimatesonpersonalandeconomicwellbeingacrosstime) Extract A Regional inequality in the UK Geographically, the UK is highly unequal in incomes. According to research from the University of Sheffield, the estimate of the Gini coefficient is 0.34. There are a number of different reasons for this. First, labour in poor places tend to develop too few skills, with a lack of education holding people back. In Rotherham in the north of England, for 5 example, 21% of disadvantaged 18-year-olds from state schools and colleges go on to higher education compared to 41% in London. Secondly, there is a lack of infrastructure spending in northern cities compared to London. In 2017–18, 28% of public expenditure on transport – and 46% of capital expenditure on railways – was spent in London. The argument for this is that London gets a lot of public money because a lot of people take 10 public transport. This has angered many people in the North. These problems cannot be solved quickly. They compound each other. Just as people are rarely poor for one reason, regions do not fall behind only because they have poor transport, poor schools or poor policy making, but for all those reasons and more. Ideally, the UK would develop a bold plan for regional development that could be followed 15 by future governments, as Germany did for its eastern part. Tera Allas of McKinsey, a consultancy firm, argues that improving education is crucial, even if the returns are not immediately obvious. It is easier to improve schools than to persuade businesses to move to a poorer part of the country. (Source: adapted from https://www.economist.com/britain/2020/07/30/ why-britain-is-more-geographically-unequal-than-any-other-rich-country) Extract B Public sector spending on infrastructure Economic differences across the UK are large and have grown. The government is looking at reducing this inequality partly through spending on transport infrastructure. Public sector capital spending is due to rise from just over 2% of GDP to 3%. That amounts to around £20 billion of additional spending per year on new capital projects. The 5 government is looking to take advantage of current low interest rates to finance the expansion without worsening its fiscal position. The government is determined to focus this spending on the north of England, Wales and the Midlands. Planned schemes include a new Trafford Park tram line in Manchester and reopening train lines and stations closed back in the 1960s, including stations in 10 Haxby in Yorkshire and Blyth in Northumberland. Progress has already been made in Wales with the reopening of Bow Street station near Aberystwyth. This project has taken 11 years to become a reality and cost £8m. It is estimated that it will generate a boost to the economy of £24m through boosting local trade, creating new jobs in the local area, and easing pressure on congested roads heading into Aberystwyth. 15 (Source: adapted from https://www.economist.com/britain/2020/01/09/the-coming- splurge-on-northern-infrastructure and https://www.wales247.co.uk/transport-for-wales- delivers-new-bow-street-station) Extract C Options for UK tax rises in the future There are a number of options for raising additional tax revenue in the future. These include: • increasing council tax on houses: this annual charge paid to local government is currently based on estimated house prices in 1991 and so is very out of date. This 5 would negatively affect areas where house prices have risen the most since 1991 • a one-off wealth tax: a 5% tax on property and pension wealth of more than £500 000 would raise £260 billion to help pay for the global health crisis in five years, according to proposals from the Wealth Commission • increasing corporation tax: at the 2021 Budget the Chancellor announced that 10 the top rate of UK corporation tax would be increased to 25% by 2023. This will remain the lowest rate in the G7 group of the world's largest advanced countries, but will raise £17.2 billion in 2025–26. (Source: adapted from https://www.telegraph.co.uk/tax/income-tax/five-tax-rises-rishi- sunak-considering-chances-happening-budget/, and https://home.kpmg/uk/en/home/ insights/2021/03/tmd-corporation-tax-rate-to-increase-to-25-percent.html)
(a) Using a Lorenz curve diagram, explain how income inequality is measured using the Gini coefficient. Refer to Extract A in your answer. (5)
June 2022 · Paper 2 · Q6(b) 8 marks AO1=2, AO2=2, AO3=2, AO4=2 8-mark response poverty and inequality
Data and extracts for question 6UK Government spending and inequality Figure 1: UK regional gross disposable household income per capita, 2018 £ per capita 19 000 to 21 000 17 000 to 18 999 16 000 to 16 999 15 000 to 15 999 14 500 to 14 999 14 000 to 14 499 13 000 to 13 999 North East South East (Source: adapted from University of Sheffield/Office for National Statistics: https://www.sheffield.ac.uk/news/nr/uk-higher-regional-inequality-large-wealthy-country-1.862262) Figure 2: UK subjective happiness by income, April 2021 Answer to the question: ‘On a scale of 1–10, how happy did you feel after yesterday?' (0 = not at all, 10 = completely) Less than £10 000 £10 000–£20 000 £20 000–£40 000 More than £40 000 7.31 7.02 7.13 7.29 (Source: adapted from https://www.ons.gov.uk/peoplepopulationandcommunity/wellbeing/ datasets/incomegroupsplitestimatesonpersonalandeconomicwellbeingacrosstime) Extract A Regional inequality in the UK Geographically, the UK is highly unequal in incomes. According to research from the University of Sheffield, the estimate of the Gini coefficient is 0.34. There are a number of different reasons for this. First, labour in poor places tend to develop too few skills, with a lack of education holding people back. In Rotherham in the north of England, for 5 example, 21% of disadvantaged 18-year-olds from state schools and colleges go on to higher education compared to 41% in London. Secondly, there is a lack of infrastructure spending in northern cities compared to London. In 2017–18, 28% of public expenditure on transport – and 46% of capital expenditure on railways – was spent in London. The argument for this is that London gets a lot of public money because a lot of people take 10 public transport. This has angered many people in the North. These problems cannot be solved quickly. They compound each other. Just as people are rarely poor for one reason, regions do not fall behind only because they have poor transport, poor schools or poor policy making, but for all those reasons and more. Ideally, the UK would develop a bold plan for regional development that could be followed 15 by future governments, as Germany did for its eastern part. Tera Allas of McKinsey, a consultancy firm, argues that improving education is crucial, even if the returns are not immediately obvious. It is easier to improve schools than to persuade businesses to move to a poorer part of the country. (Source: adapted from https://www.economist.com/britain/2020/07/30/ why-britain-is-more-geographically-unequal-than-any-other-rich-country) Extract B Public sector spending on infrastructure Economic differences across the UK are large and have grown. The government is looking at reducing this inequality partly through spending on transport infrastructure. Public sector capital spending is due to rise from just over 2% of GDP to 3%. That amounts to around £20 billion of additional spending per year on new capital projects. The 5 government is looking to take advantage of current low interest rates to finance the expansion without worsening its fiscal position. The government is determined to focus this spending on the north of England, Wales and the Midlands. Planned schemes include a new Trafford Park tram line in Manchester and reopening train lines and stations closed back in the 1960s, including stations in 10 Haxby in Yorkshire and Blyth in Northumberland. Progress has already been made in Wales with the reopening of Bow Street station near Aberystwyth. This project has taken 11 years to become a reality and cost £8m. It is estimated that it will generate a boost to the economy of £24m through boosting local trade, creating new jobs in the local area, and easing pressure on congested roads heading into Aberystwyth. 15 (Source: adapted from https://www.economist.com/britain/2020/01/09/the-coming- splurge-on-northern-infrastructure and https://www.wales247.co.uk/transport-for-wales- delivers-new-bow-street-station) Extract C Options for UK tax rises in the future There are a number of options for raising additional tax revenue in the future. These include: • increasing council tax on houses: this annual charge paid to local government is currently based on estimated house prices in 1991 and so is very out of date. This 5 would negatively affect areas where house prices have risen the most since 1991 • a one-off wealth tax: a 5% tax on property and pension wealth of more than £500 000 would raise £260 billion to help pay for the global health crisis in five years, according to proposals from the Wealth Commission • increasing corporation tax: at the 2021 Budget the Chancellor announced that 10 the top rate of UK corporation tax would be increased to 25% by 2023. This will remain the lowest rate in the G7 group of the world's largest advanced countries, but will raise £17.2 billion in 2025–26. (Source: adapted from https://www.telegraph.co.uk/tax/income-tax/five-tax-rises-rishi- sunak-considering-chances-happening-budget/, and https://home.kpmg/uk/en/home/ insights/2021/03/tmd-corporation-tax-rate-to-increase-to-25-percent.html)
(b) With reference to Figure 1 and Extract A, examine two likely causes of income inequality within the UK. (8)
June 2022 · Paper 2 · Q6(c) 10 marks AO1=2, AO2=2, AO3=2, AO4=4 10-mark response measuring economic growth
Data and extracts for question 6UK Government spending and inequality Figure 1: UK regional gross disposable household income per capita, 2018 £ per capita 19 000 to 21 000 17 000 to 18 999 16 000 to 16 999 15 000 to 15 999 14 500 to 14 999 14 000 to 14 499 13 000 to 13 999 North East South East (Source: adapted from University of Sheffield/Office for National Statistics: https://www.sheffield.ac.uk/news/nr/uk-higher-regional-inequality-large-wealthy-country-1.862262) Figure 2: UK subjective happiness by income, April 2021 Answer to the question: ‘On a scale of 1–10, how happy did you feel after yesterday?' (0 = not at all, 10 = completely) Less than £10 000 £10 000–£20 000 £20 000–£40 000 More than £40 000 7.31 7.02 7.13 7.29 (Source: adapted from https://www.ons.gov.uk/peoplepopulationandcommunity/wellbeing/ datasets/incomegroupsplitestimatesonpersonalandeconomicwellbeingacrosstime) Extract A Regional inequality in the UK Geographically, the UK is highly unequal in incomes. According to research from the University of Sheffield, the estimate of the Gini coefficient is 0.34. There are a number of different reasons for this. First, labour in poor places tend to develop too few skills, with a lack of education holding people back. In Rotherham in the north of England, for 5 example, 21% of disadvantaged 18-year-olds from state schools and colleges go on to higher education compared to 41% in London. Secondly, there is a lack of infrastructure spending in northern cities compared to London. In 2017–18, 28% of public expenditure on transport – and 46% of capital expenditure on railways – was spent in London. The argument for this is that London gets a lot of public money because a lot of people take 10 public transport. This has angered many people in the North. These problems cannot be solved quickly. They compound each other. Just as people are rarely poor for one reason, regions do not fall behind only because they have poor transport, poor schools or poor policy making, but for all those reasons and more. Ideally, the UK would develop a bold plan for regional development that could be followed 15 by future governments, as Germany did for its eastern part. Tera Allas of McKinsey, a consultancy firm, argues that improving education is crucial, even if the returns are not immediately obvious. It is easier to improve schools than to persuade businesses to move to a poorer part of the country. (Source: adapted from https://www.economist.com/britain/2020/07/30/ why-britain-is-more-geographically-unequal-than-any-other-rich-country) Extract B Public sector spending on infrastructure Economic differences across the UK are large and have grown. The government is looking at reducing this inequality partly through spending on transport infrastructure. Public sector capital spending is due to rise from just over 2% of GDP to 3%. That amounts to around £20 billion of additional spending per year on new capital projects. The 5 government is looking to take advantage of current low interest rates to finance the expansion without worsening its fiscal position. The government is determined to focus this spending on the north of England, Wales and the Midlands. Planned schemes include a new Trafford Park tram line in Manchester and reopening train lines and stations closed back in the 1960s, including stations in 10 Haxby in Yorkshire and Blyth in Northumberland. Progress has already been made in Wales with the reopening of Bow Street station near Aberystwyth. This project has taken 11 years to become a reality and cost £8m. It is estimated that it will generate a boost to the economy of £24m through boosting local trade, creating new jobs in the local area, and easing pressure on congested roads heading into Aberystwyth. 15 (Source: adapted from https://www.economist.com/britain/2020/01/09/the-coming- splurge-on-northern-infrastructure and https://www.wales247.co.uk/transport-for-wales- delivers-new-bow-street-station) Extract C Options for UK tax rises in the future There are a number of options for raising additional tax revenue in the future. These include: • increasing council tax on houses: this annual charge paid to local government is currently based on estimated house prices in 1991 and so is very out of date. This 5 would negatively affect areas where house prices have risen the most since 1991 • a one-off wealth tax: a 5% tax on property and pension wealth of more than £500 000 would raise £260 billion to help pay for the global health crisis in five years, according to proposals from the Wealth Commission • increasing corporation tax: at the 2021 Budget the Chancellor announced that 10 the top rate of UK corporation tax would be increased to 25% by 2023. This will remain the lowest rate in the G7 group of the world's largest advanced countries, but will raise £17.2 billion in 2025–26. (Source: adapted from https://www.telegraph.co.uk/tax/income-tax/five-tax-rises-rishi- sunak-considering-chances-happening-budget/, and https://home.kpmg/uk/en/home/ insights/2021/03/tmd-corporation-tax-rate-to-increase-to-25-percent.html)
(c) With reference to Figure 2, assess whether an increase in real income improves subjective happiness within the UK. (10)
June 2022 · Paper 2 · Q6(d) 12 marks AO1=2, AO2=2, AO3=4, AO4=4 12-mark response public finances and taxation
Data and extracts for question 6UK Government spending and inequality Figure 1: UK regional gross disposable household income per capita, 2018 £ per capita 19 000 to 21 000 17 000 to 18 999 16 000 to 16 999 15 000 to 15 999 14 500 to 14 999 14 000 to 14 499 13 000 to 13 999 North East South East (Source: adapted from University of Sheffield/Office for National Statistics: https://www.sheffield.ac.uk/news/nr/uk-higher-regional-inequality-large-wealthy-country-1.862262) Figure 2: UK subjective happiness by income, April 2021 Answer to the question: ‘On a scale of 1–10, how happy did you feel after yesterday?' (0 = not at all, 10 = completely) Less than £10 000 £10 000–£20 000 £20 000–£40 000 More than £40 000 7.31 7.02 7.13 7.29 (Source: adapted from https://www.ons.gov.uk/peoplepopulationandcommunity/wellbeing/ datasets/incomegroupsplitestimatesonpersonalandeconomicwellbeingacrosstime) Extract A Regional inequality in the UK Geographically, the UK is highly unequal in incomes. According to research from the University of Sheffield, the estimate of the Gini coefficient is 0.34. There are a number of different reasons for this. First, labour in poor places tend to develop too few skills, with a lack of education holding people back. In Rotherham in the north of England, for 5 example, 21% of disadvantaged 18-year-olds from state schools and colleges go on to higher education compared to 41% in London. Secondly, there is a lack of infrastructure spending in northern cities compared to London. In 2017–18, 28% of public expenditure on transport – and 46% of capital expenditure on railways – was spent in London. The argument for this is that London gets a lot of public money because a lot of people take 10 public transport. This has angered many people in the North. These problems cannot be solved quickly. They compound each other. Just as people are rarely poor for one reason, regions do not fall behind only because they have poor transport, poor schools or poor policy making, but for all those reasons and more. Ideally, the UK would develop a bold plan for regional development that could be followed 15 by future governments, as Germany did for its eastern part. Tera Allas of McKinsey, a consultancy firm, argues that improving education is crucial, even if the returns are not immediately obvious. It is easier to improve schools than to persuade businesses to move to a poorer part of the country. (Source: adapted from https://www.economist.com/britain/2020/07/30/ why-britain-is-more-geographically-unequal-than-any-other-rich-country) Extract B Public sector spending on infrastructure Economic differences across the UK are large and have grown. The government is looking at reducing this inequality partly through spending on transport infrastructure. Public sector capital spending is due to rise from just over 2% of GDP to 3%. That amounts to around £20 billion of additional spending per year on new capital projects. The 5 government is looking to take advantage of current low interest rates to finance the expansion without worsening its fiscal position. The government is determined to focus this spending on the north of England, Wales and the Midlands. Planned schemes include a new Trafford Park tram line in Manchester and reopening train lines and stations closed back in the 1960s, including stations in 10 Haxby in Yorkshire and Blyth in Northumberland. Progress has already been made in Wales with the reopening of Bow Street station near Aberystwyth. This project has taken 11 years to become a reality and cost £8m. It is estimated that it will generate a boost to the economy of £24m through boosting local trade, creating new jobs in the local area, and easing pressure on congested roads heading into Aberystwyth. 15 (Source: adapted from https://www.economist.com/britain/2020/01/09/the-coming- splurge-on-northern-infrastructure and https://www.wales247.co.uk/transport-for-wales- delivers-new-bow-street-station) Extract C Options for UK tax rises in the future There are a number of options for raising additional tax revenue in the future. These include: • increasing council tax on houses: this annual charge paid to local government is currently based on estimated house prices in 1991 and so is very out of date. This 5 would negatively affect areas where house prices have risen the most since 1991 • a one-off wealth tax: a 5% tax on property and pension wealth of more than £500 000 would raise £260 billion to help pay for the global health crisis in five years, according to proposals from the Wealth Commission • increasing corporation tax: at the 2021 Budget the Chancellor announced that 10 the top rate of UK corporation tax would be increased to 25% by 2023. This will remain the lowest rate in the G7 group of the world's largest advanced countries, but will raise £17.2 billion in 2025–26. (Source: adapted from https://www.telegraph.co.uk/tax/income-tax/five-tax-rises-rishi- sunak-considering-chances-happening-budget/, and https://home.kpmg/uk/en/home/ insights/2021/03/tmd-corporation-tax-rate-to-increase-to-25-percent.html)
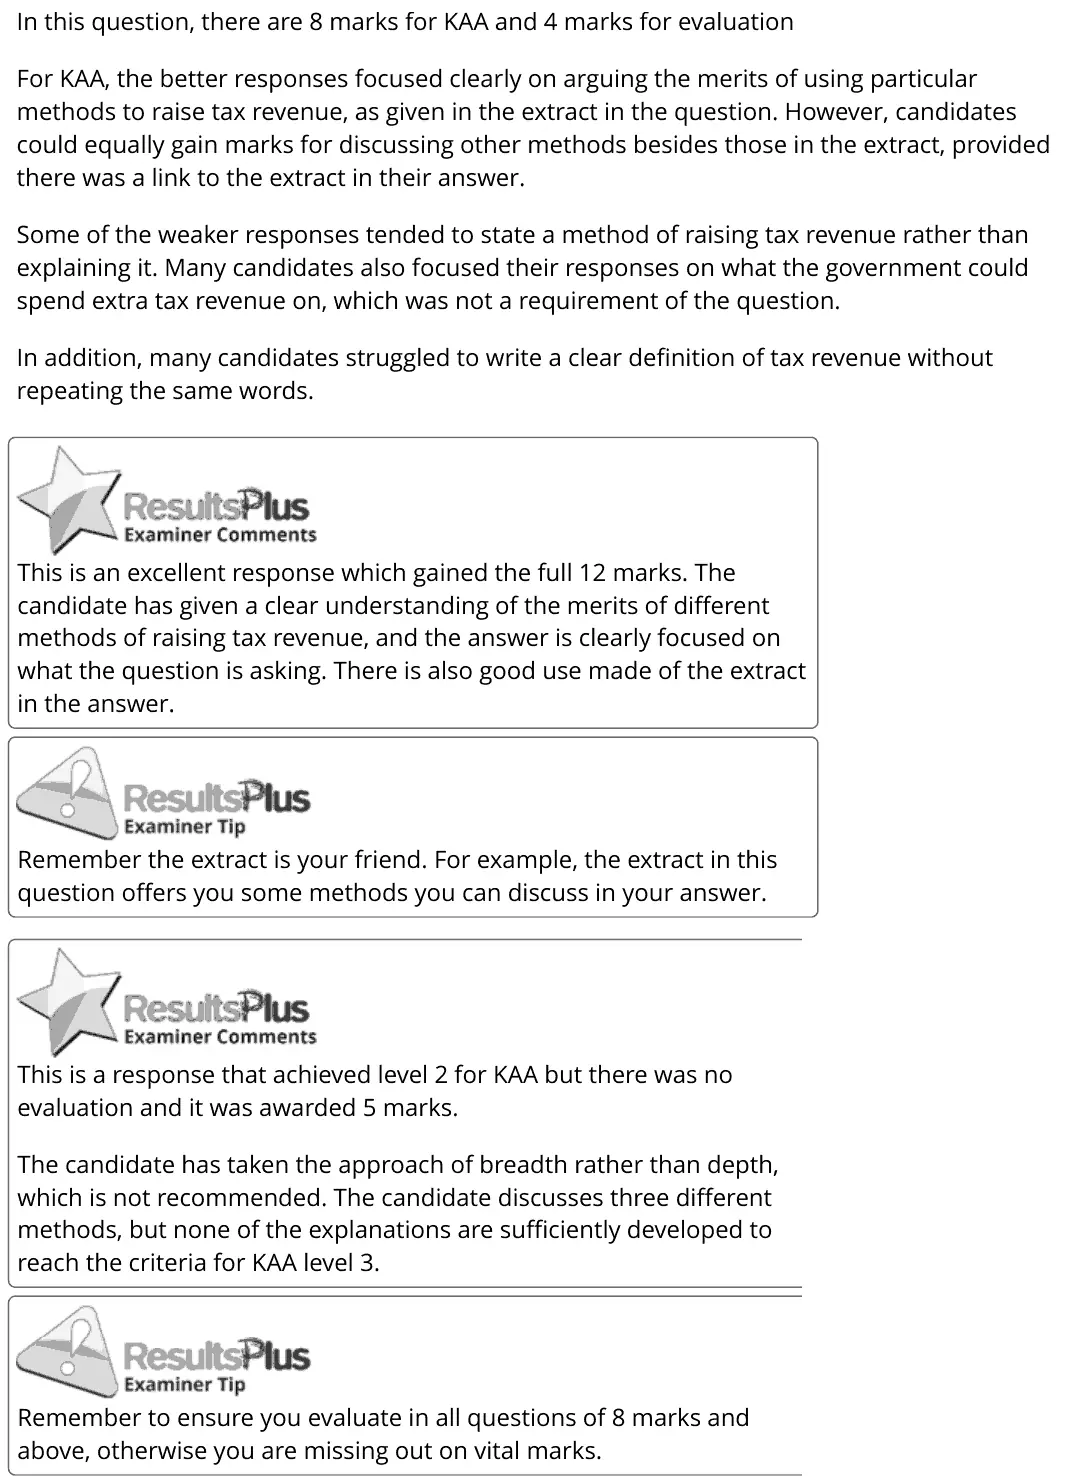
(d) With reference to Extract C and your own knowledge, discuss methods the UK government could use to increase tax revenue. (12)
June 2022 · Paper 2 · Q6(e) 15 marks AO1=3, AO2=3, AO3=3, AO4=6 15-mark response supply side policiesnational income and the multiplier
Data and extracts for question 6UK Government spending and inequality Figure 1: UK regional gross disposable household income per capita, 2018 £ per capita 19 000 to 21 000 17 000 to 18 999 16 000 to 16 999 15 000 to 15 999 14 500 to 14 999 14 000 to 14 499 13 000 to 13 999 North East South East (Source: adapted from University of Sheffield/Office for National Statistics: https://www.sheffield.ac.uk/news/nr/uk-higher-regional-inequality-large-wealthy-country-1.862262) Figure 2: UK subjective happiness by income, April 2021 Answer to the question: ‘On a scale of 1–10, how happy did you feel after yesterday?' (0 = not at all, 10 = completely) Less than £10 000 £10 000–£20 000 £20 000–£40 000 More than £40 000 7.31 7.02 7.13 7.29 (Source: adapted from https://www.ons.gov.uk/peoplepopulationandcommunity/wellbeing/ datasets/incomegroupsplitestimatesonpersonalandeconomicwellbeingacrosstime) Extract A Regional inequality in the UK Geographically, the UK is highly unequal in incomes. According to research from the University of Sheffield, the estimate of the Gini coefficient is 0.34. There are a number of different reasons for this. First, labour in poor places tend to develop too few skills, with a lack of education holding people back. In Rotherham in the north of England, for 5 example, 21% of disadvantaged 18-year-olds from state schools and colleges go on to higher education compared to 41% in London. Secondly, there is a lack of infrastructure spending in northern cities compared to London. In 2017–18, 28% of public expenditure on transport – and 46% of capital expenditure on railways – was spent in London. The argument for this is that London gets a lot of public money because a lot of people take 10 public transport. This has angered many people in the North. These problems cannot be solved quickly. They compound each other. Just as people are rarely poor for one reason, regions do not fall behind only because they have poor transport, poor schools or poor policy making, but for all those reasons and more. Ideally, the UK would develop a bold plan for regional development that could be followed 15 by future governments, as Germany did for its eastern part. Tera Allas of McKinsey, a consultancy firm, argues that improving education is crucial, even if the returns are not immediately obvious. It is easier to improve schools than to persuade businesses to move to a poorer part of the country. (Source: adapted from https://www.economist.com/britain/2020/07/30/ why-britain-is-more-geographically-unequal-than-any-other-rich-country) Extract B Public sector spending on infrastructure Economic differences across the UK are large and have grown. The government is looking at reducing this inequality partly through spending on transport infrastructure. Public sector capital spending is due to rise from just over 2% of GDP to 3%. That amounts to around £20 billion of additional spending per year on new capital projects. The 5 government is looking to take advantage of current low interest rates to finance the expansion without worsening its fiscal position. The government is determined to focus this spending on the north of England, Wales and the Midlands. Planned schemes include a new Trafford Park tram line in Manchester and reopening train lines and stations closed back in the 1960s, including stations in 10 Haxby in Yorkshire and Blyth in Northumberland. Progress has already been made in Wales with the reopening of Bow Street station near Aberystwyth. This project has taken 11 years to become a reality and cost £8m. It is estimated that it will generate a boost to the economy of £24m through boosting local trade, creating new jobs in the local area, and easing pressure on congested roads heading into Aberystwyth. 15 (Source: adapted from https://www.economist.com/britain/2020/01/09/the-coming- splurge-on-northern-infrastructure and https://www.wales247.co.uk/transport-for-wales- delivers-new-bow-street-station) Extract C Options for UK tax rises in the future There are a number of options for raising additional tax revenue in the future. These include: • increasing council tax on houses: this annual charge paid to local government is currently based on estimated house prices in 1991 and so is very out of date. This 5 would negatively affect areas where house prices have risen the most since 1991 • a one-off wealth tax: a 5% tax on property and pension wealth of more than £500 000 would raise £260 billion to help pay for the global health crisis in five years, according to proposals from the Wealth Commission • increasing corporation tax: at the 2021 Budget the Chancellor announced that 10 the top rate of UK corporation tax would be increased to 25% by 2023. This will remain the lowest rate in the G7 group of the world's largest advanced countries, but will raise £17.2 billion in 2025–26. (Source: adapted from https://www.telegraph.co.uk/tax/income-tax/five-tax-rises-rishi- sunak-considering-chances-happening-budget/, and https://home.kpmg/uk/en/home/ insights/2021/03/tmd-corporation-tax-rate-to-increase-to-25-percent.html)
(e) With reference to Extract B, discuss the benefits of an increase in infrastructure spending on the UK economy. Use an aggregate demand and aggregate supply diagram to support your answer. (15)
June 2022 · Paper 2 · Q7 25 marks AO1=4, AO2=4, AO3=8, AO4=9 25-mark essay Either/or trading blocs and protectionism
7 Both China and the United States have been gradually increasing the tariffs imposed on each other’s exports as their trade dispute continues. The IMF estimated that the trade dispute between China and the United States would reduce global GDP growth by 0.8 percentage points by the end of 2020. (Source: adapted from https://www.theguardian.com/business/2019/oct/15/imf-recession- world-growth-forecast-central-banks) Evaluate the likely impact of an increase in protectionism on the global economy.
June 2022 · Paper 2 · Q8 25 marks AO1=4, AO2=4, AO3=8, AO4=9 25-mark essay Either/or globalisation and trade
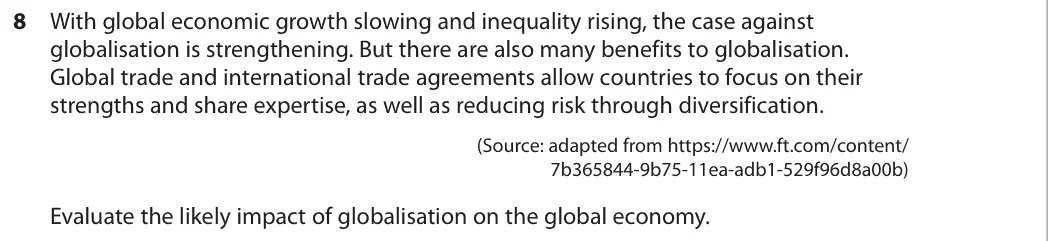
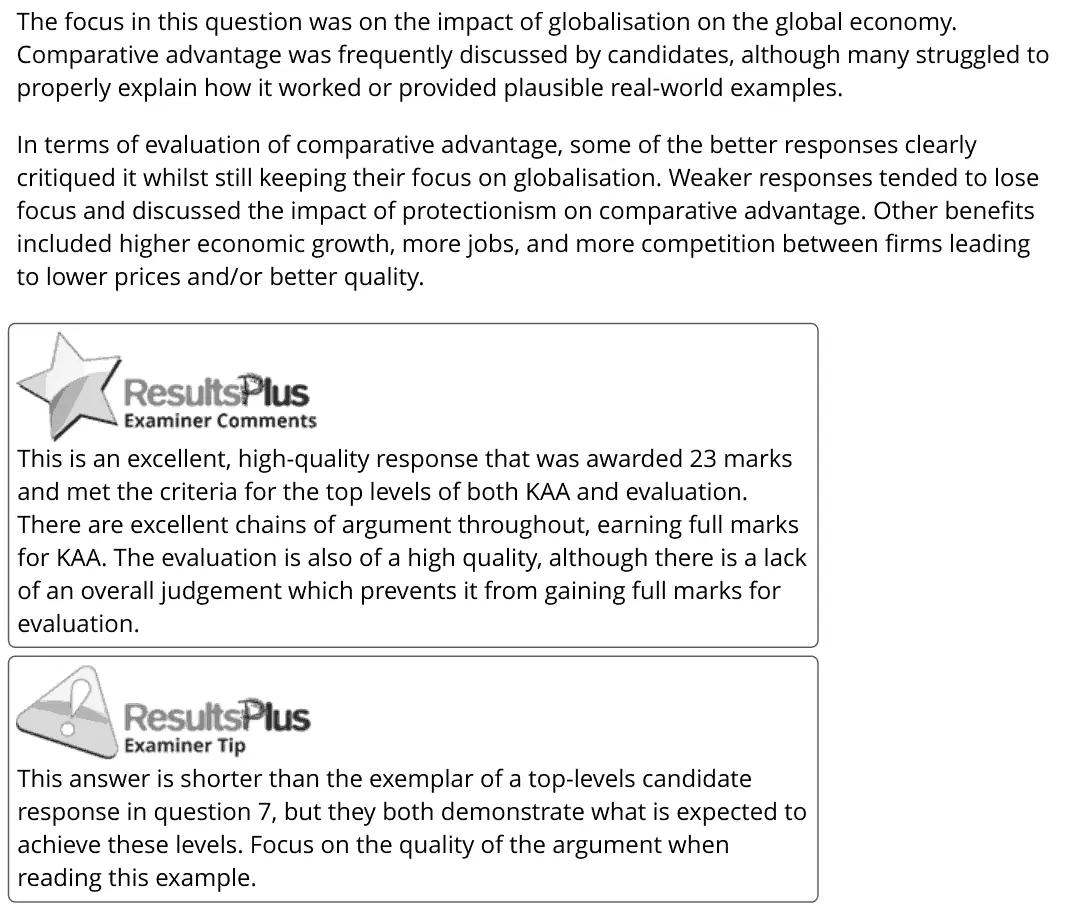
8 With global economic growth slowing and inequality rising, the case against globalisation is strengthening. But there are also many benefits to globalisation. Global trade and international trade agreements allow countries to focus on their strengths and share expertise, as well as reducing risk through diversification. (Source: adapted from https://www.ft.com/content/ 7b365844-9b75-11ea-adb1-529f96d8a00b) Evaluate the likely impact of globalisation on the global economy.
Work with an Edexcel economics tutor

Want a paper marked and gone through with you? Message us.

Prefer email? Send an enquiry

If you are under 18, please include a parent's contact details. Enquiries go to enquiries@economicsaleveltutor.com and are deleted once handled. All tutoring is online.