October 2020: AS Paper 2

80 marks · 21 question parts · Paper, mark scheme and report on Pearson's site · The October 2020 papers are the papers printed for the cancelled summer 2020 exams

Question by question

QTopicMarksAOType
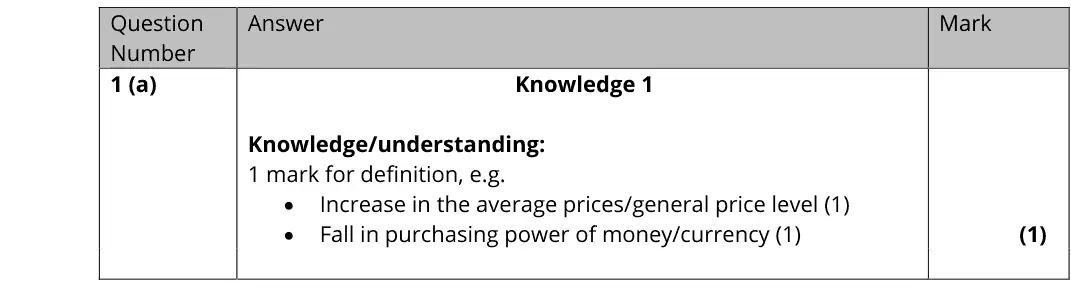
1(a) Inflation 1AO1=1Definition
1(b) Inflation 2AO1=2Short answer
1(c) Inflation 1Multiple choice
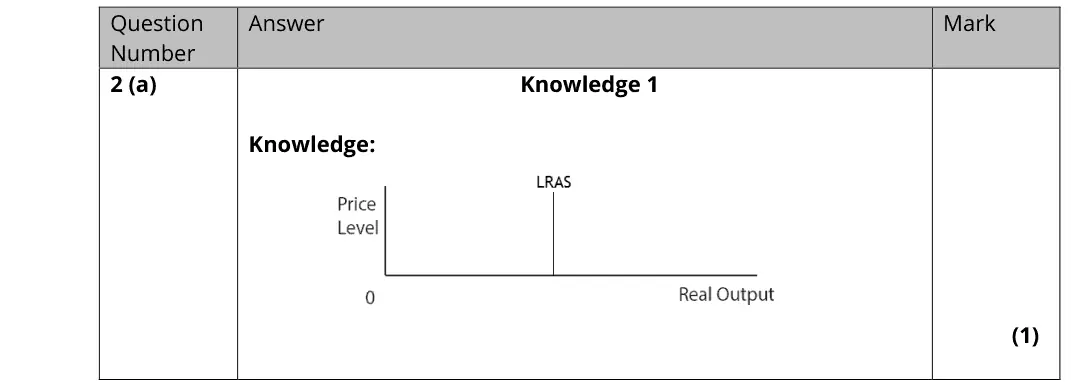
2(a) Aggregate supply 1AO1=1Diagram
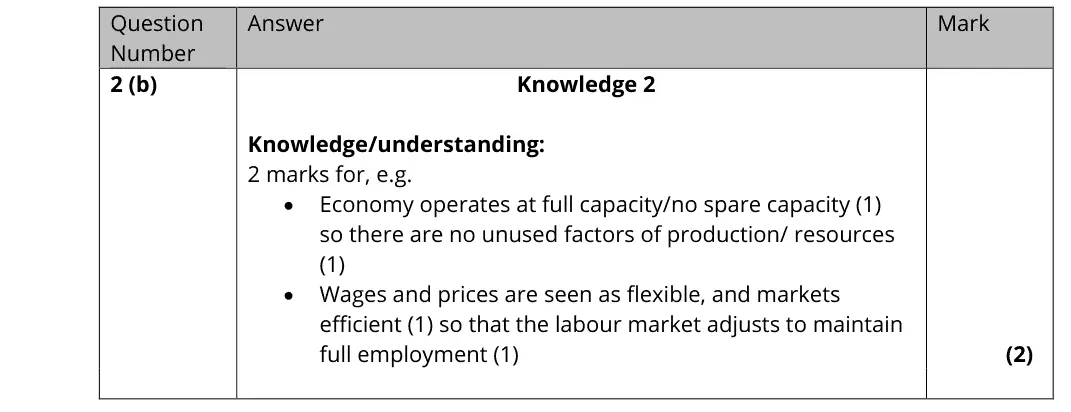
2(b) Aggregate supply 2AO1=2Short answer
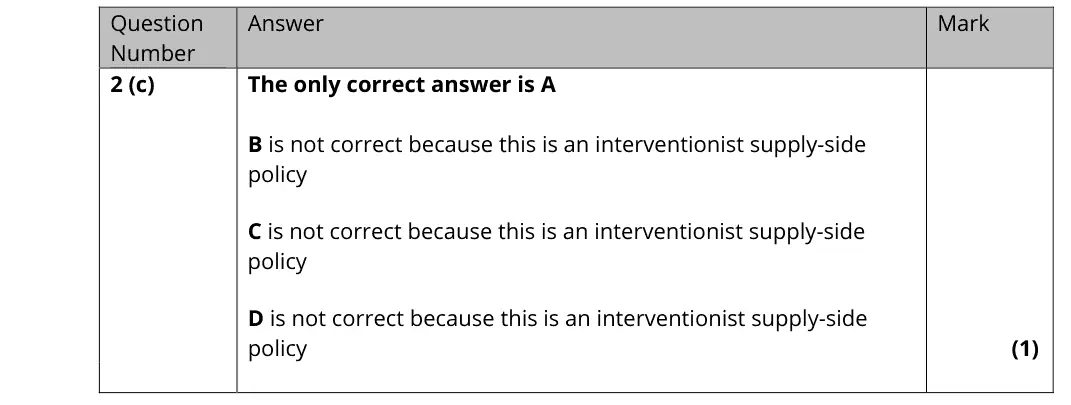
2(c) Supply-side policies 1Multiple choice
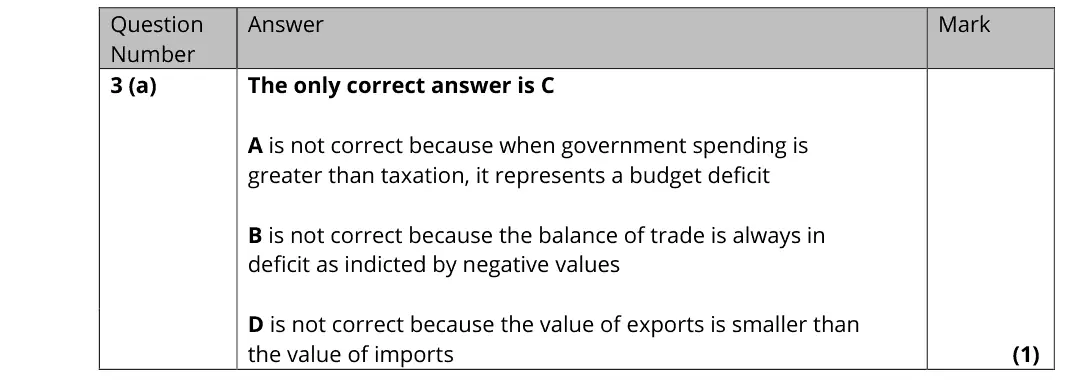
3(a) The balance of payments 1Multiple choice
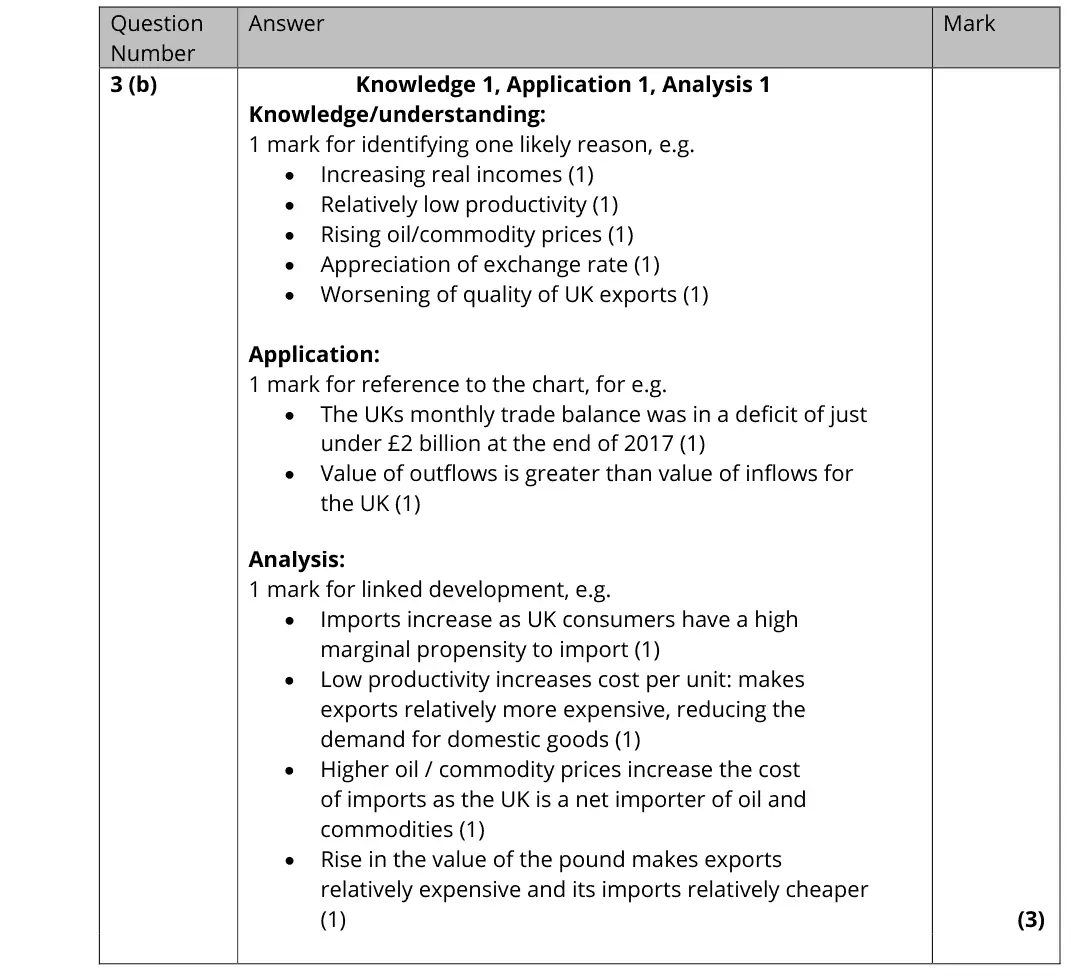
3(b) The balance of payments, Aggregate demand 3AO1=1,AO2=1,AO3=1Short answer
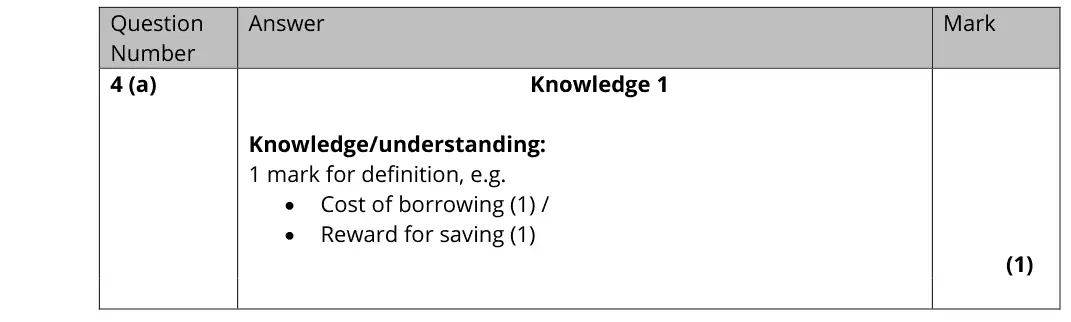
4(a) Demand-side policies: fiscal and monetary policy 1AO1=1Definition
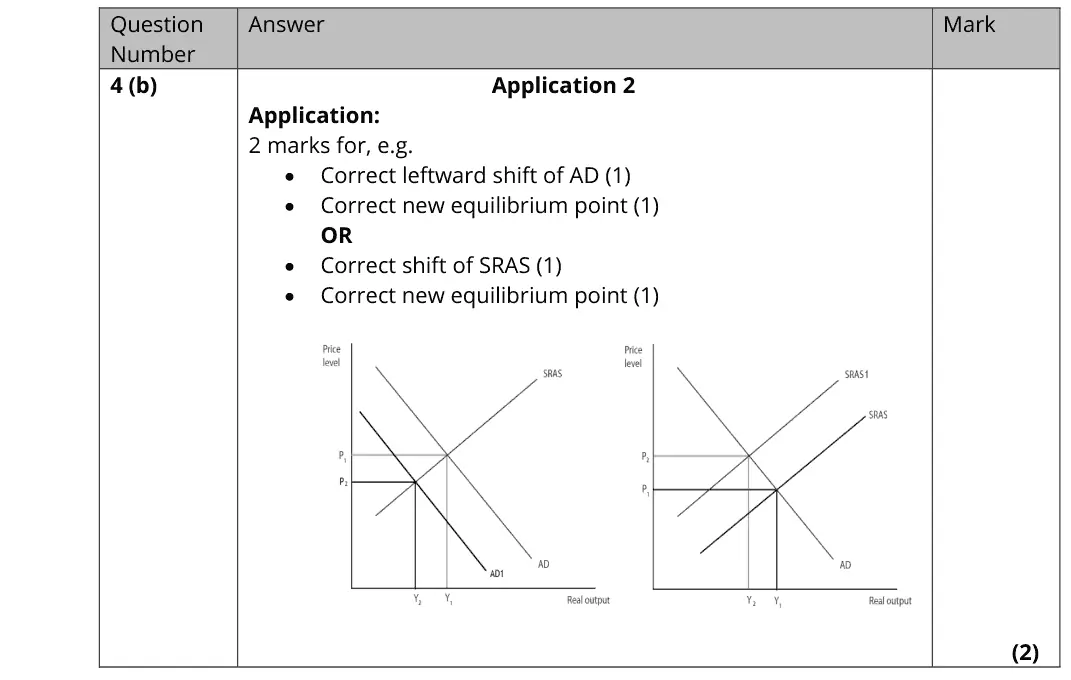
4(b) Demand-side policies: fiscal and monetary policy, The circular flow, national income and the multiplier 2AO2=2Diagram
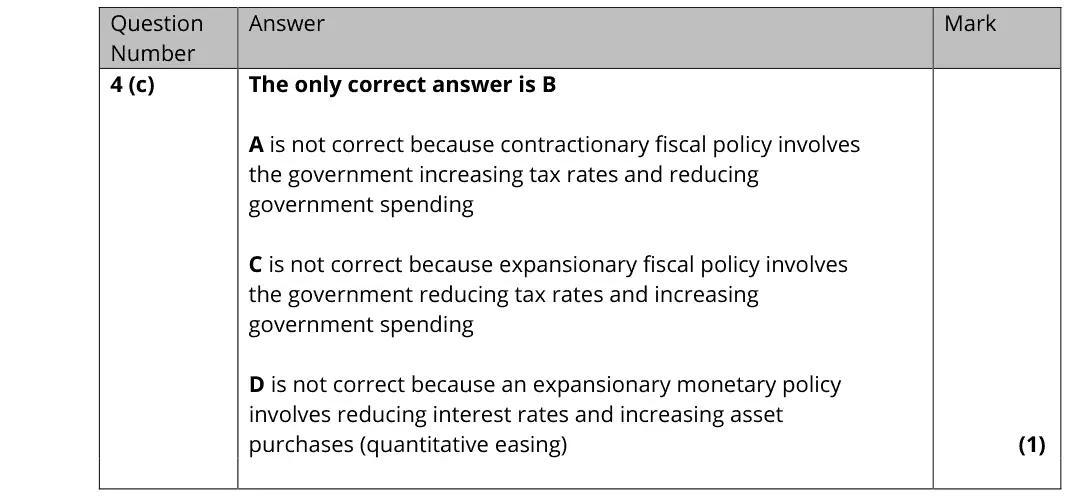
4(c) Demand-side policies: fiscal and monetary policy 1Multiple choice
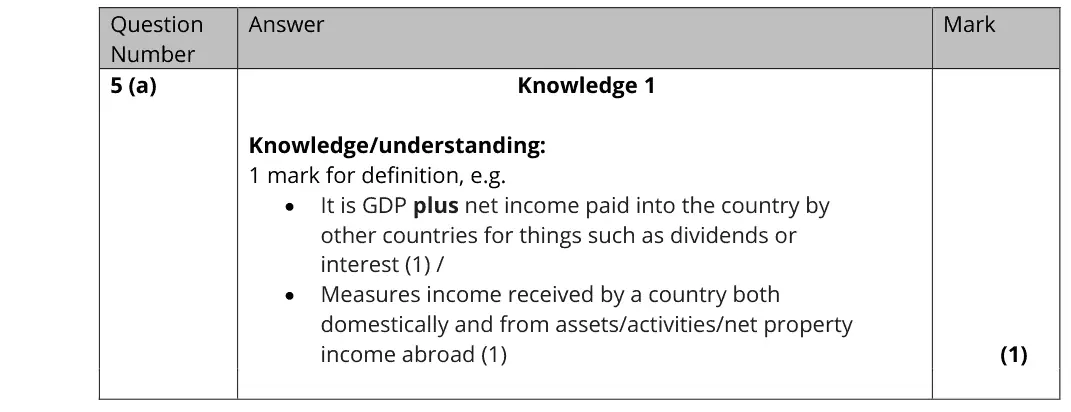
5(a) Measuring economic growth: GDP, GNI and living standards 1AO1=1Definition
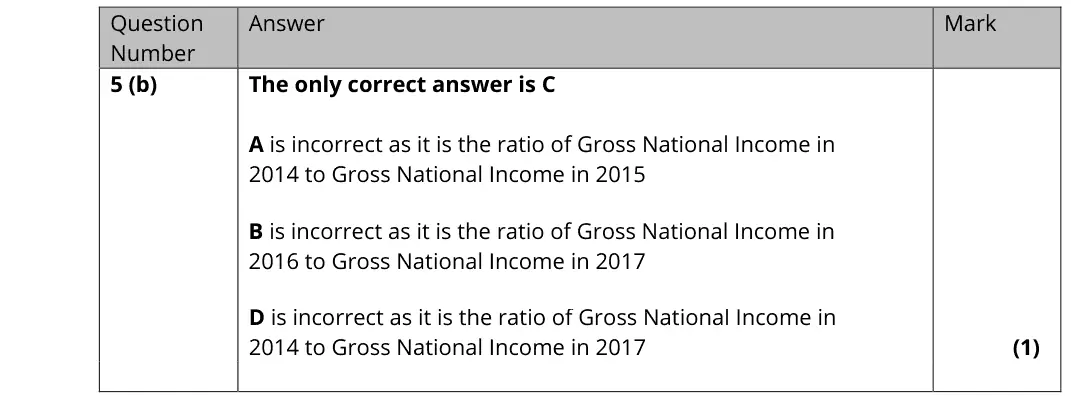
5(b) Measuring economic growth: GDP, GNI and living standards 1Multiple choice
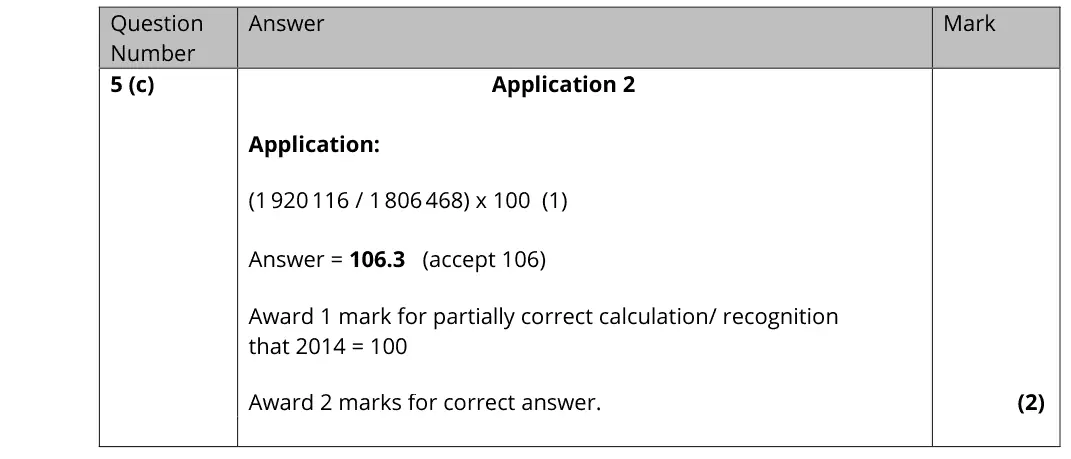
5(c) Measuring economic growth: GDP, GNI and living standards 2AO2=2Calculation
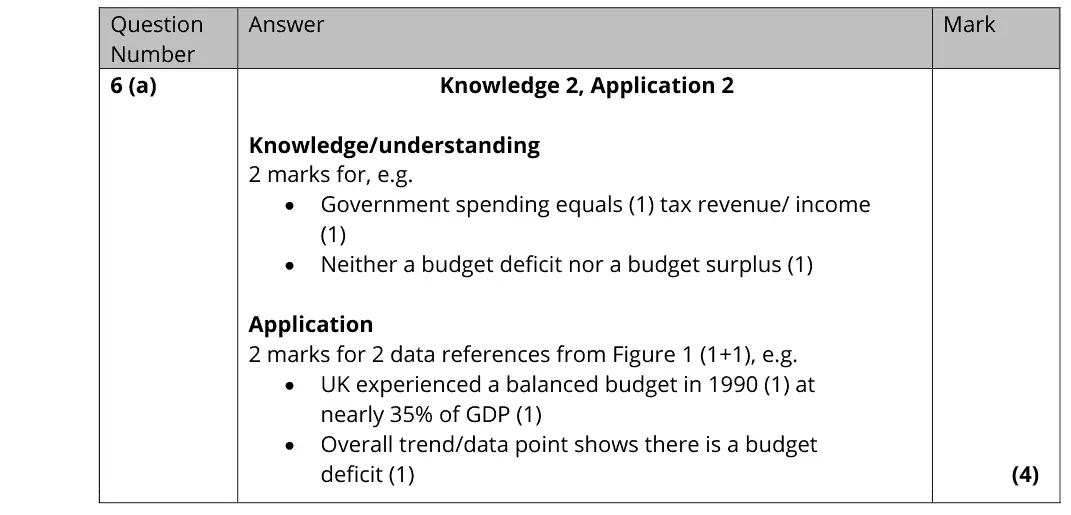
6(a) Demand-side policies: fiscal and monetary policy 4AO1=2,AO2=2Short answer
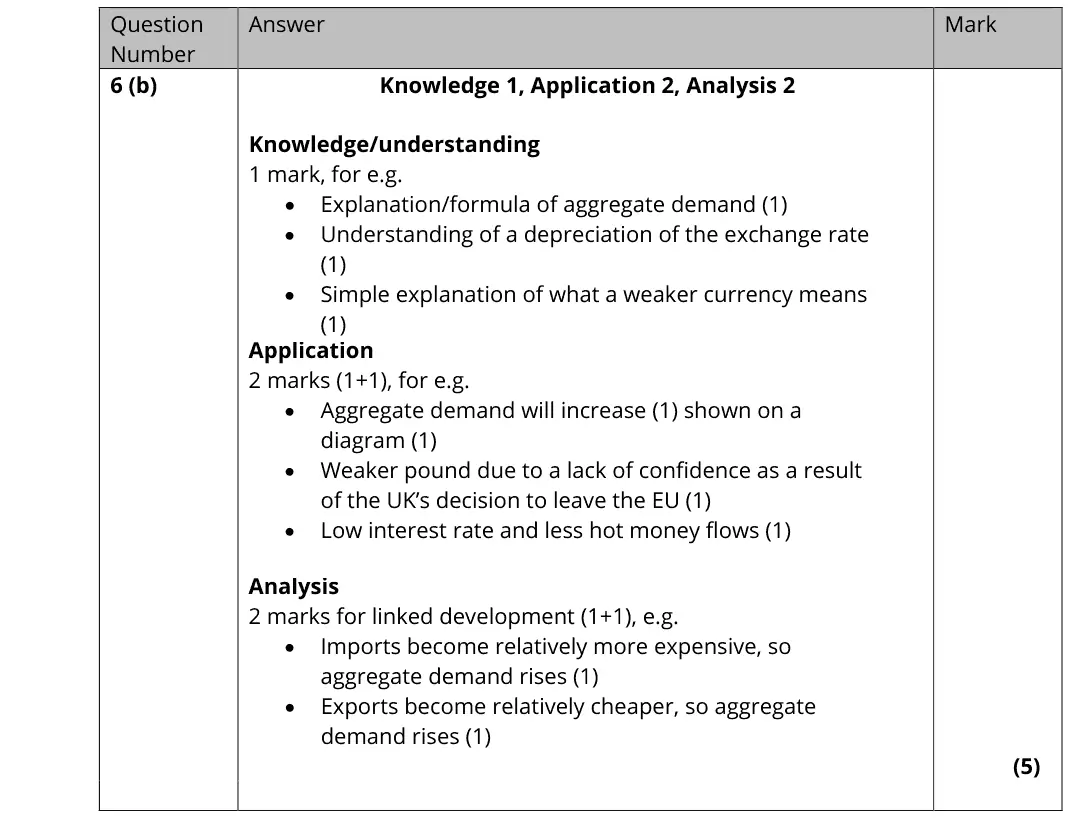
6(b) Aggregate demand 5AO1=1,AO2=2,AO3=2Short answer
6(c) Aggregate demand 6AO1=2,AO2=2,AO3=2Short answer
6(d) The circular flow, national income and the multiplier, Aggregate demand 10AO1=2,AO2=2,AO3=2,AO4=4Extended response
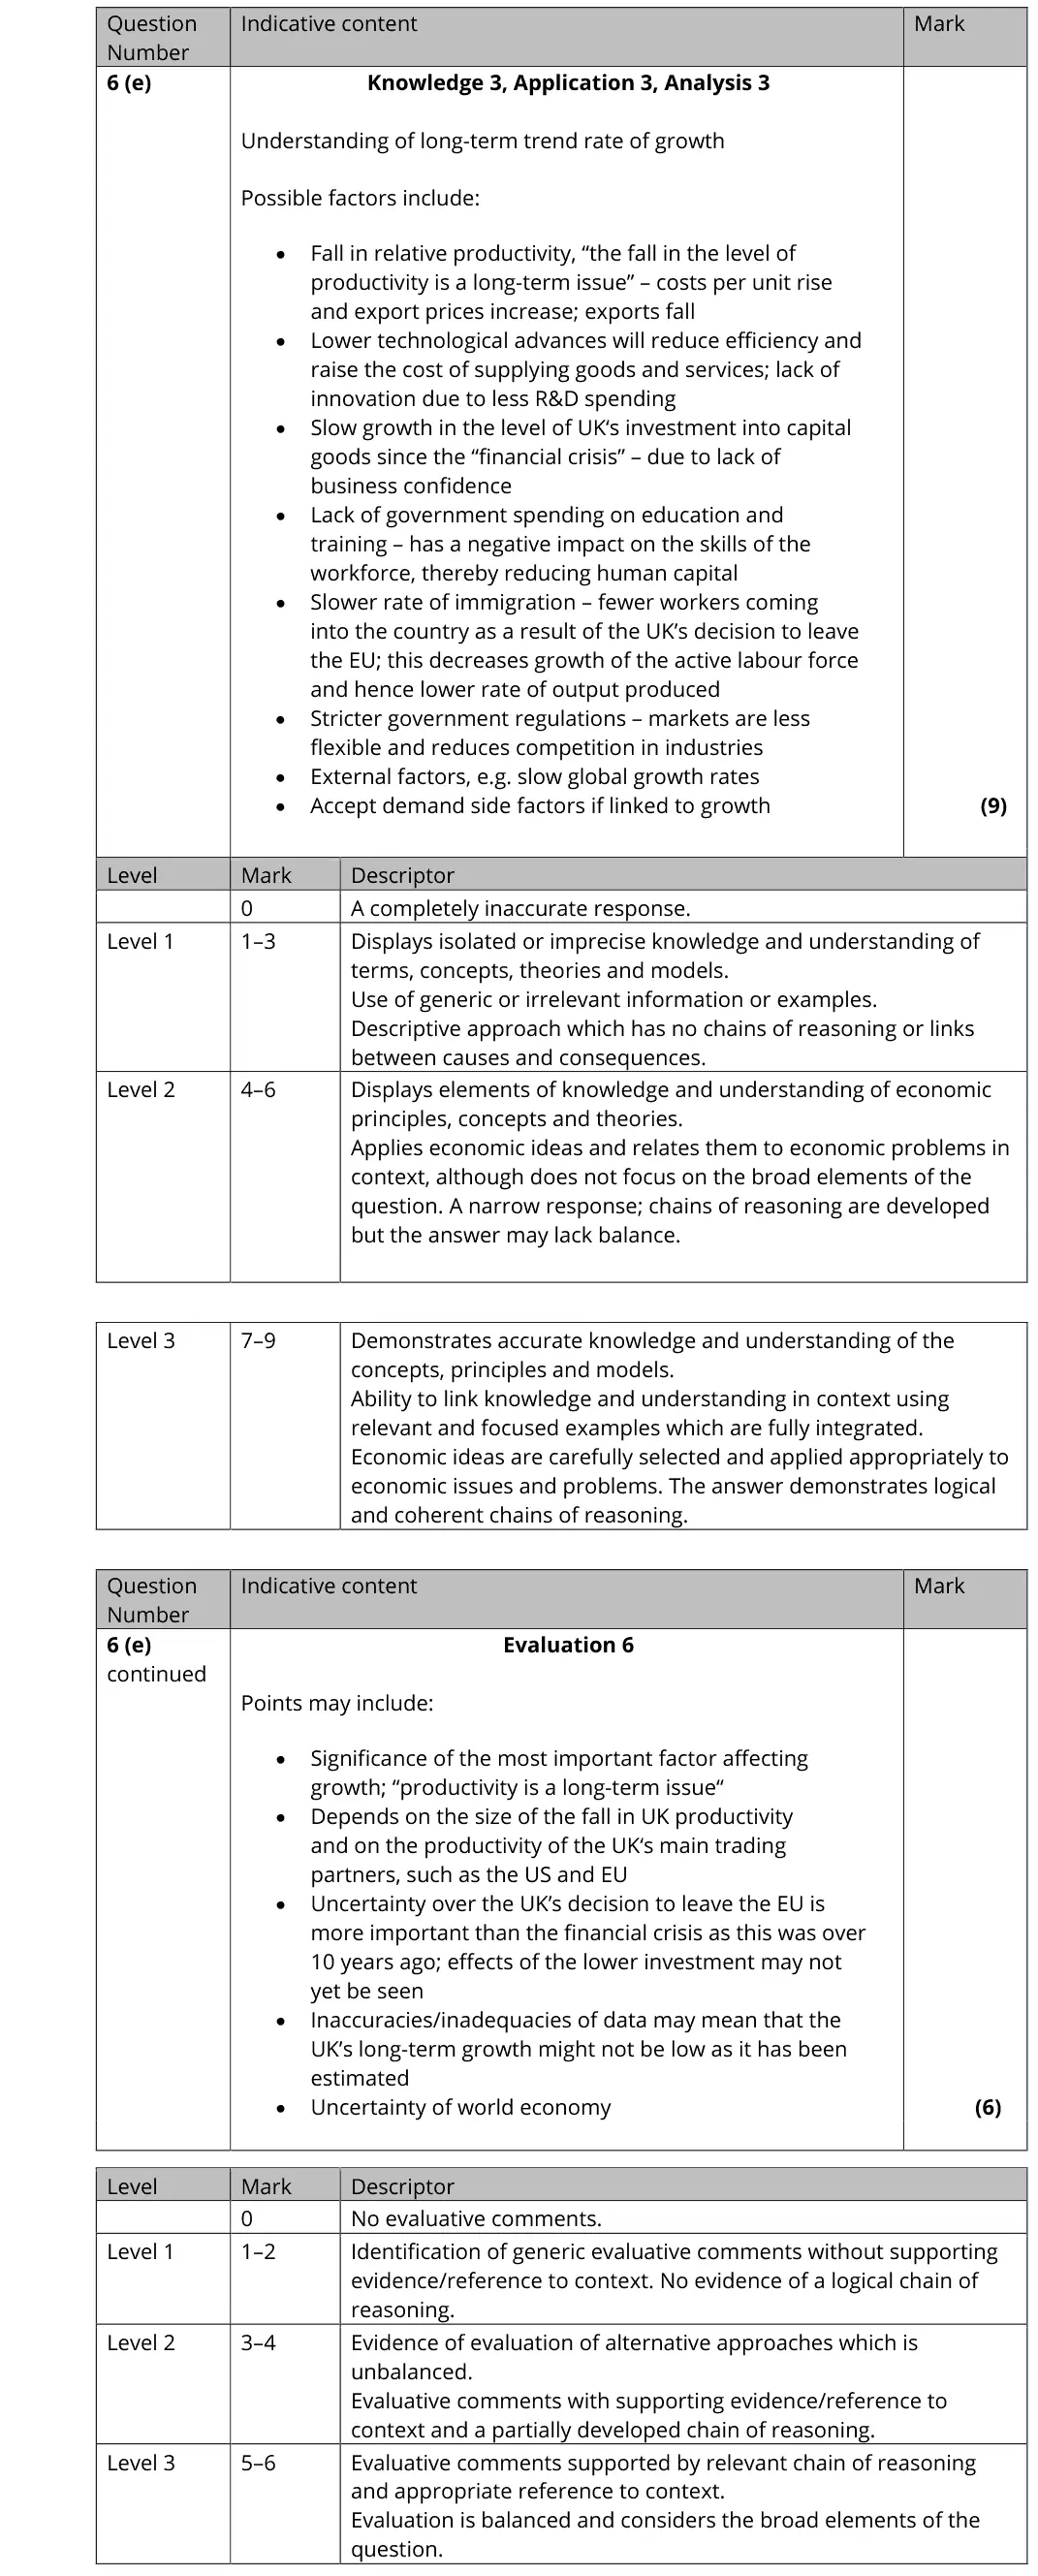
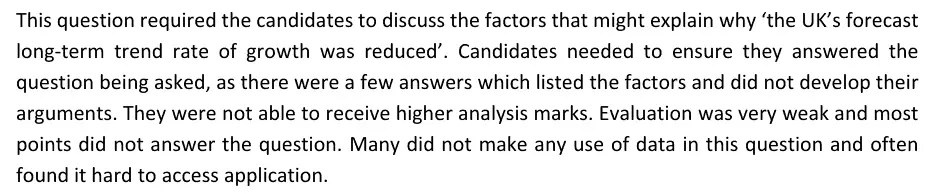
6(e) Economic growth, output gaps and the trade cycle, Aggregate supply 15AO1=3,AO2=3,AO3=3,AO4=6Extended response
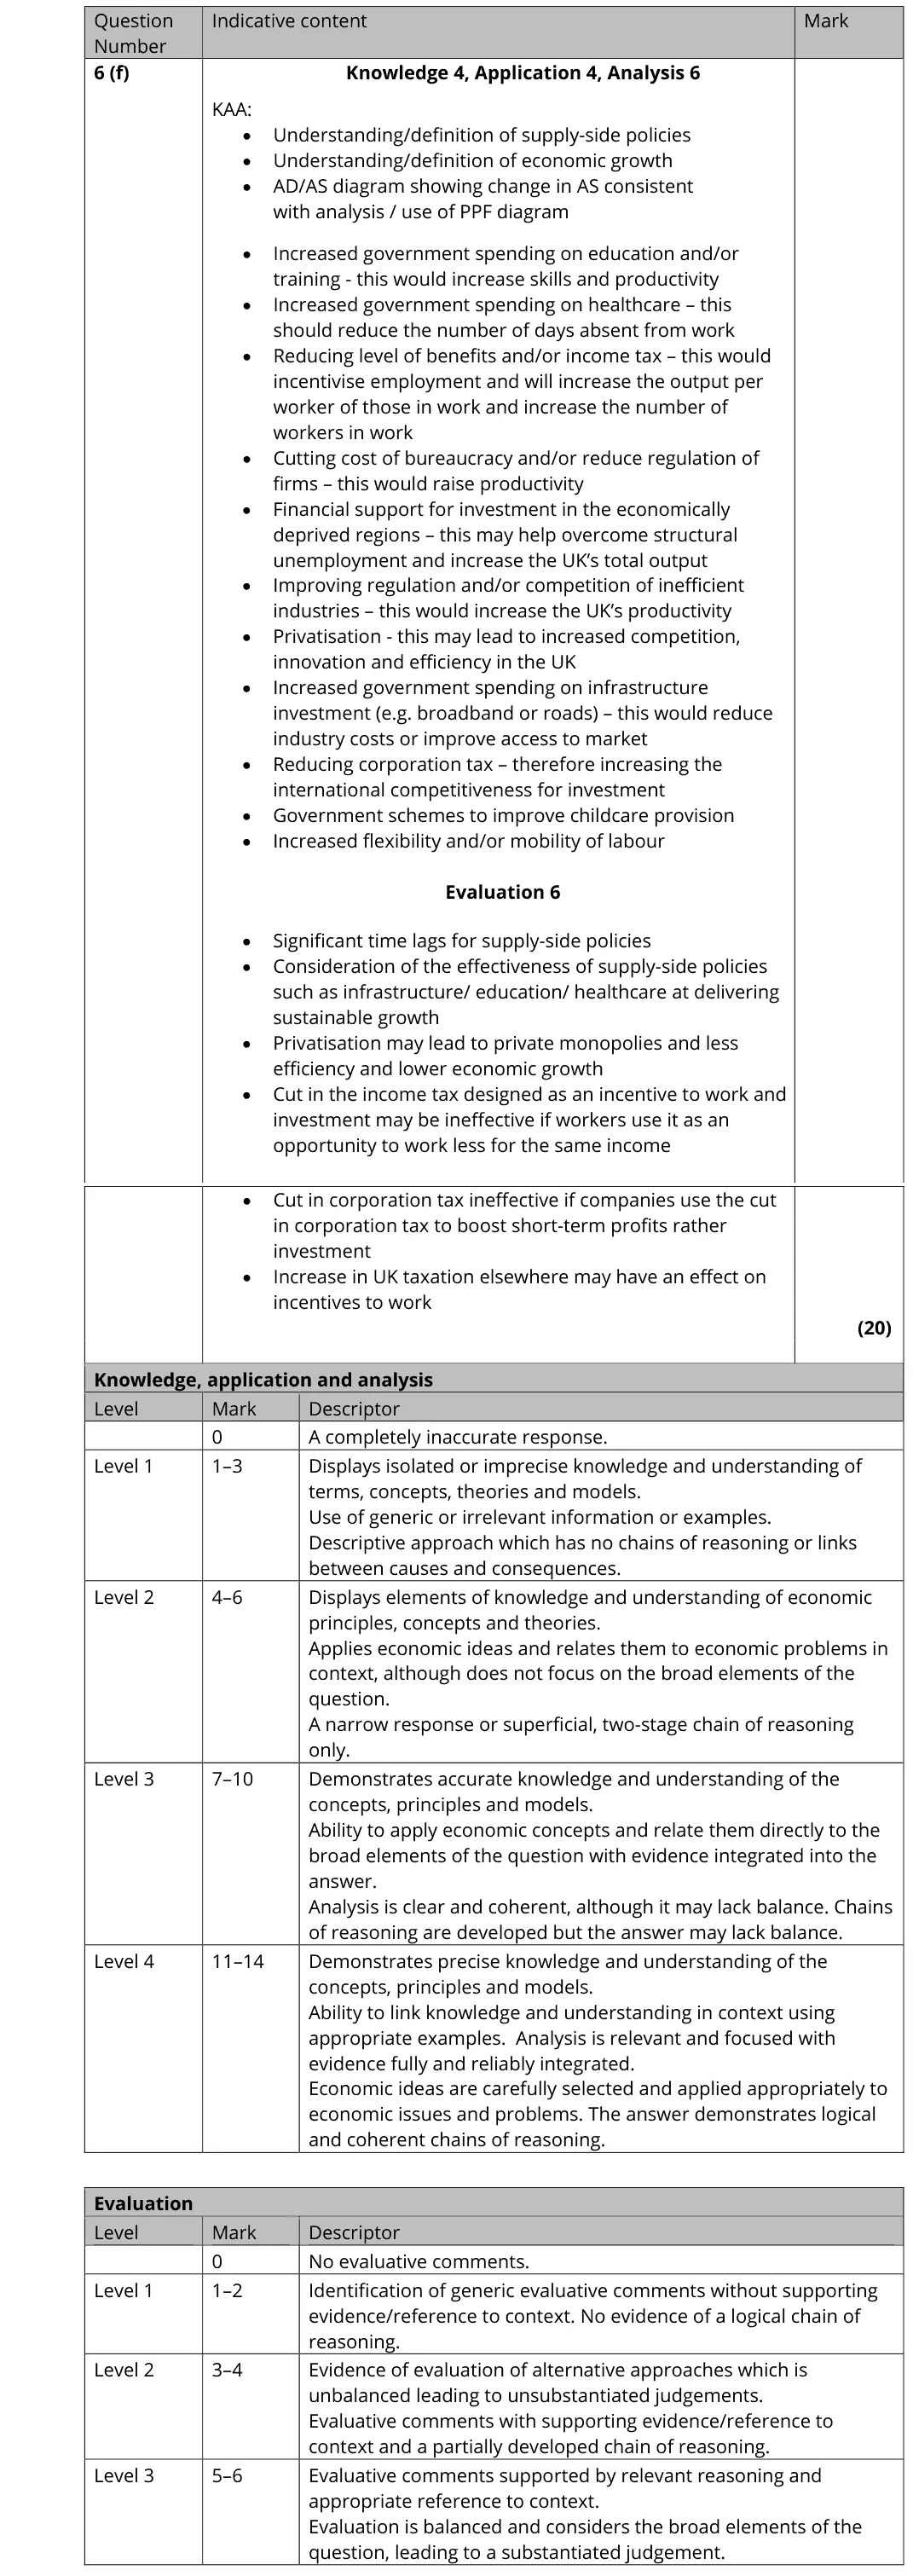
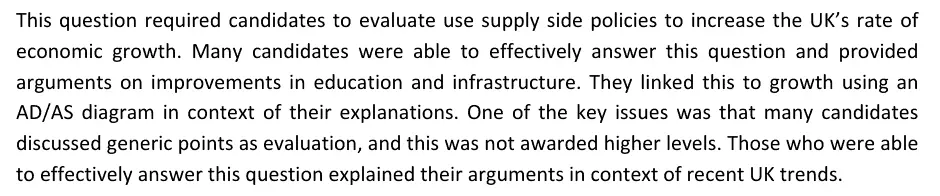
6(f) Supply-side policies 20AO1=4,AO2=4,AO3=6,AO4=6Essay
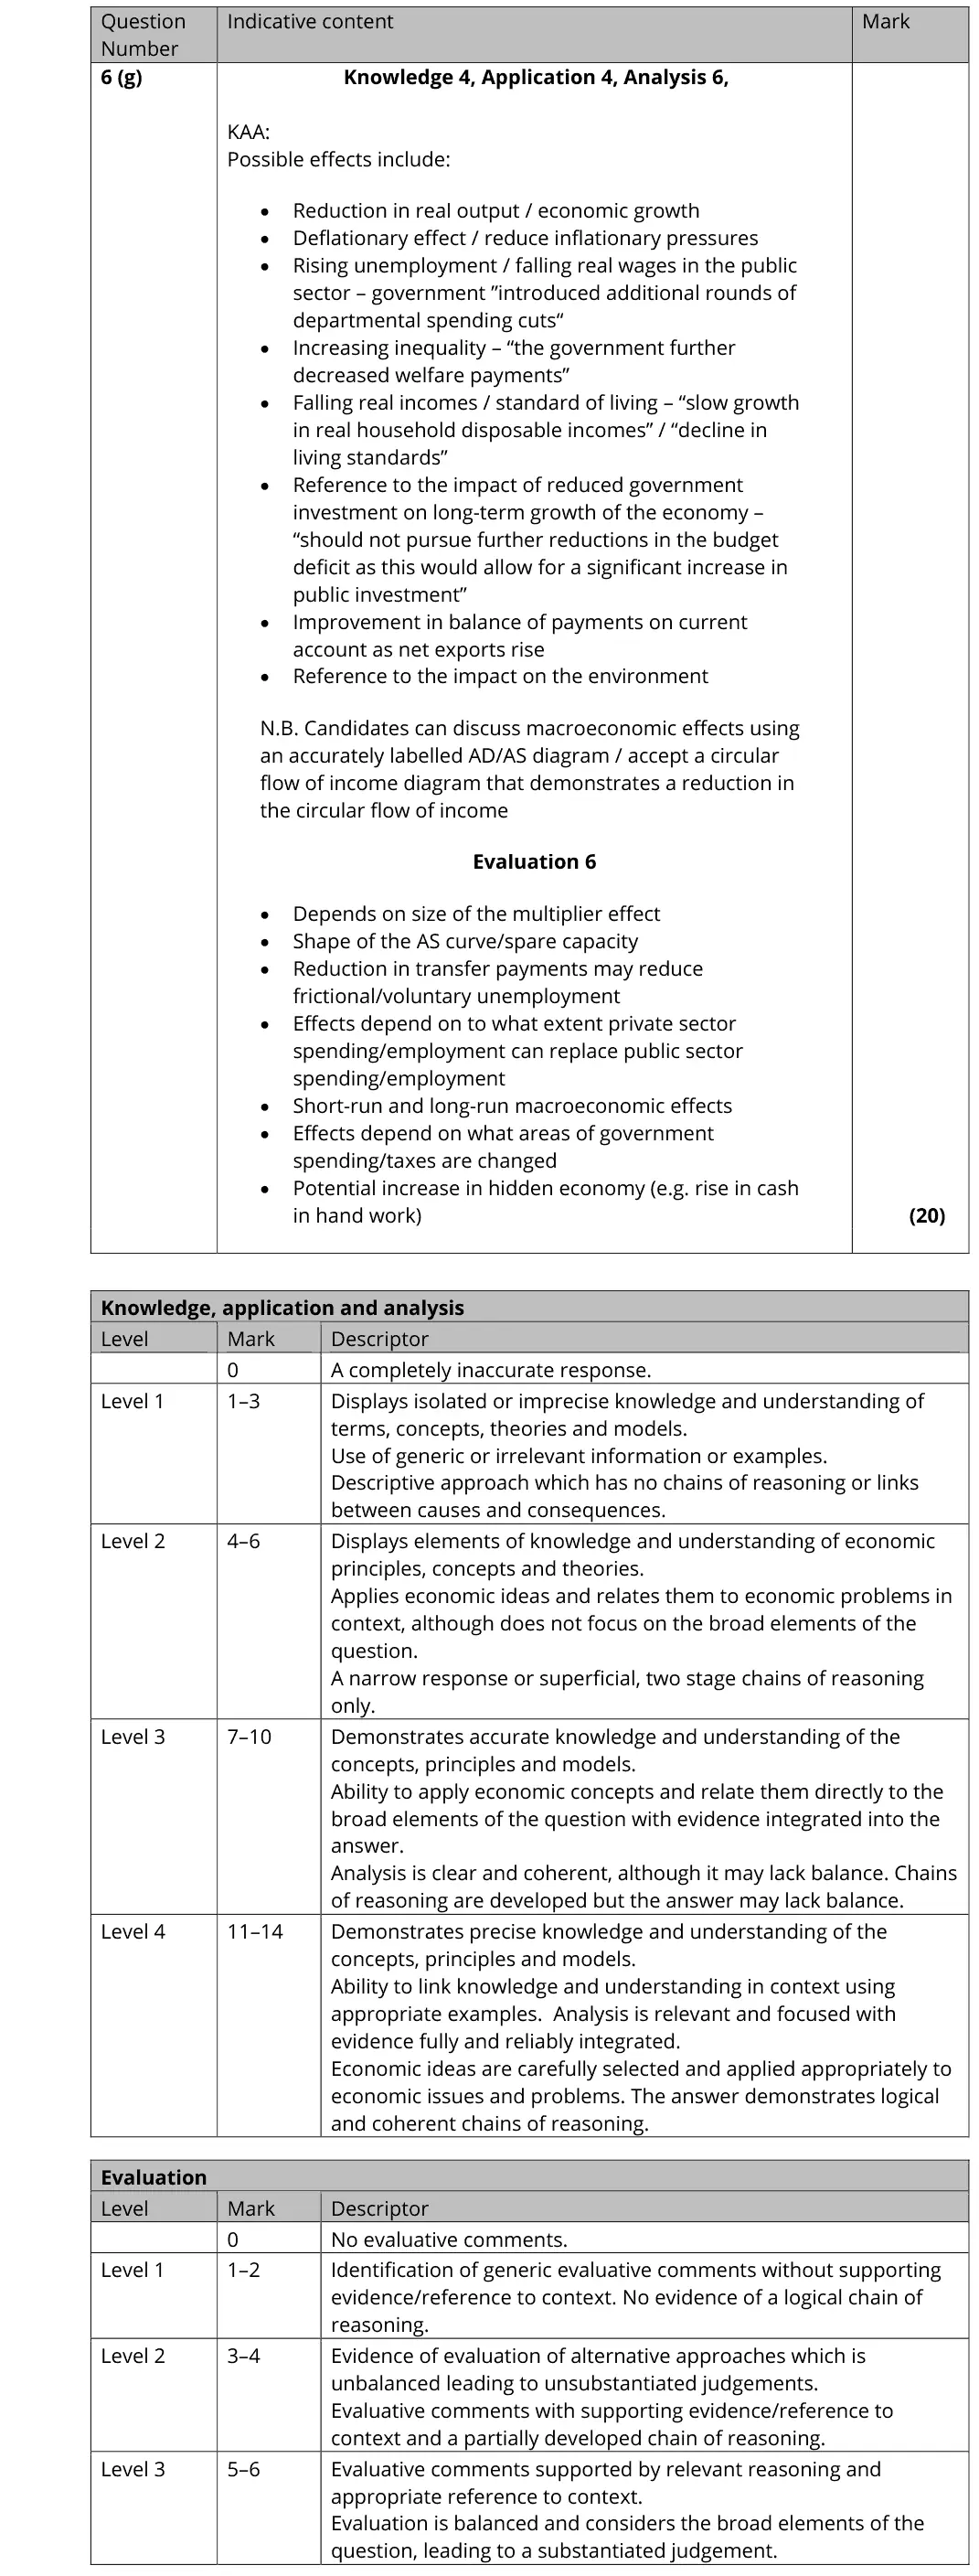
6(g) Demand-side policies: fiscal and monetary policy, Macroeconomic objectives, conflicts and trade-offs 20AO1=4,AO2=4,AO3=6,AO4=6Essay

The questions

1(a)1(b)1(c)2(a)2(b)2(c)3(a)3(b)4(a)4(b)4(c)5(a)5(b)5(c)6(a)6(b)6(c)6(d)6(e)6(f)6(g)
October 2020 · AS Paper 2 · Q1(a) 1 mark AO1=1 Definition inflation
Data and extracts for question 11 In October 2019 the annual rate of inflation in the UK was 1.5%, as measured by the Consumer Prices Index (CPI), and 2.1%, as measured by the Retail Prices Index (RPI).
(a) Define the term ‘inflation’. (1)
October 2020 · AS Paper 2 · Q1(b) 2 marks AO1=2 Short answer inflation
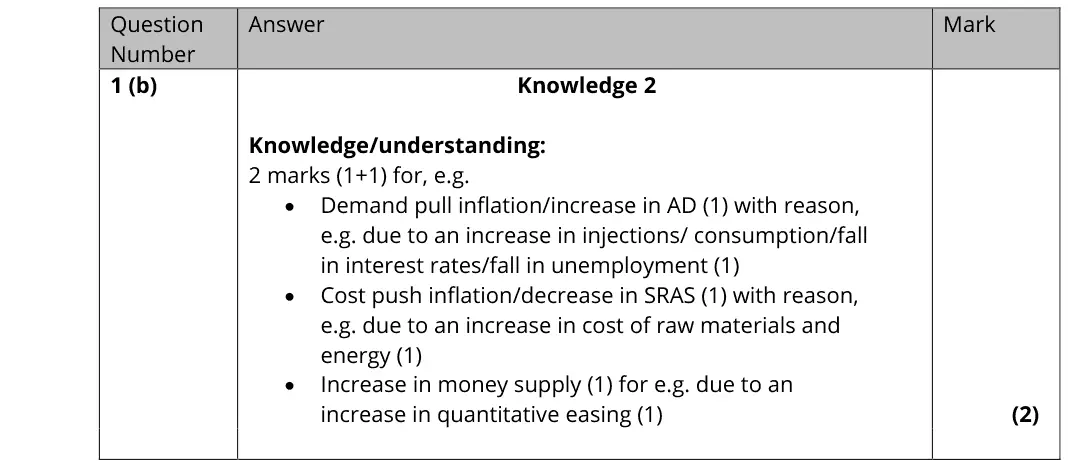
Data and extracts for question 11 In October 2019 the annual rate of inflation in the UK was 1.5%, as measured by the Consumer Prices Index (CPI), and 2.1%, as measured by the Retail Prices Index (RPI).
(b) Explain one likely cause of inflation. (2)
October 2020 · AS Paper 2 · Q1(c) 1 mark Multiple choice inflation
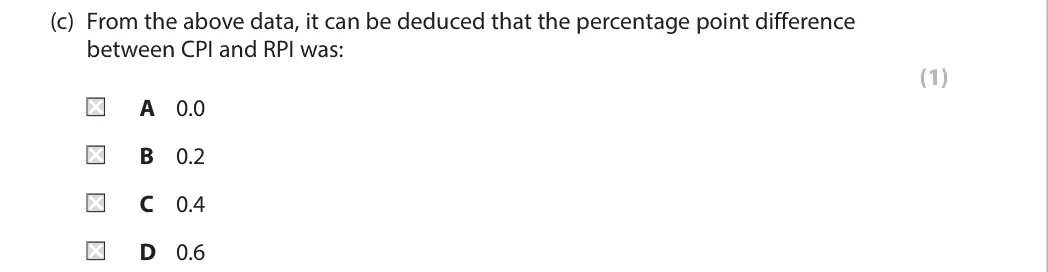
Data and extracts for question 11 In October 2019 the annual rate of inflation in the UK was 1.5%, as measured by the Consumer Prices Index (CPI), and 2.1%, as measured by the Retail Prices Index (RPI).
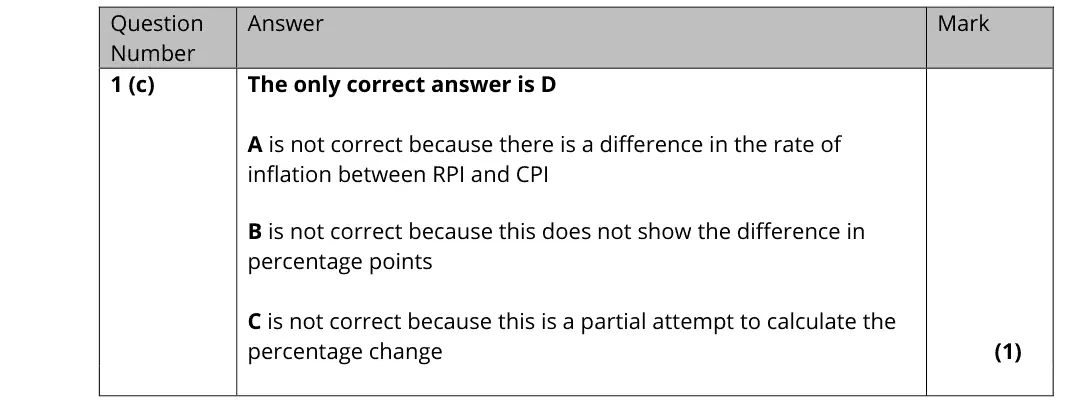
(c) From the above data, it can be deduced that the percentage point difference between CPI and RPI was: (1) A 0.0 B 0.2 C 0.4 D 0.6
October 2020 · AS Paper 2 · Q2(a) 1 mark AO1=1 Diagram aggregate supply
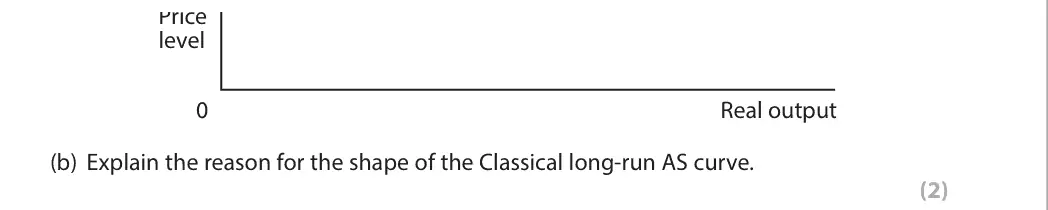
(a) Illustrate the shape of the Classical long-run aggregate supply (AS) curve on the diagram below. (1)
October 2020 · AS Paper 2 · Q2(b) 2 marks AO1=2 Short answer aggregate supply
Price level 0 Real output (b) Explain the reason for the shape of the Classical long-run AS curve. (2)
October 2020 · AS Paper 2 · Q2(c) 1 mark Multiple choice supply side policies
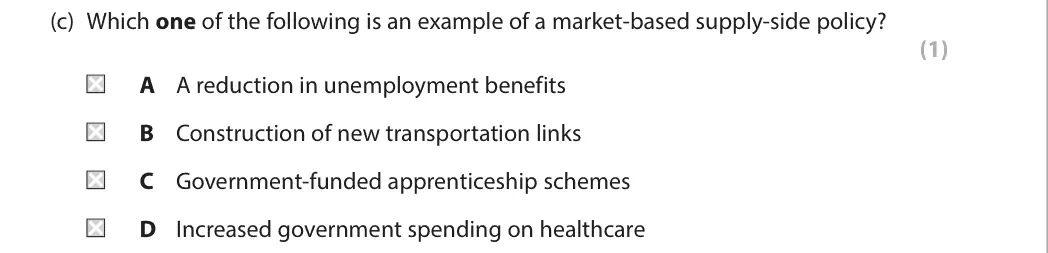
(c) Which one of the following is an example of a market-based supply-side policy? (1) A A reduction in unemployment benefits B Construction of new transportation links C Government-funded apprenticeship schemes D Increased government spending on healthcare
October 2020 · AS Paper 2 · Q3(a) 1 mark Multiple choice balance of payments
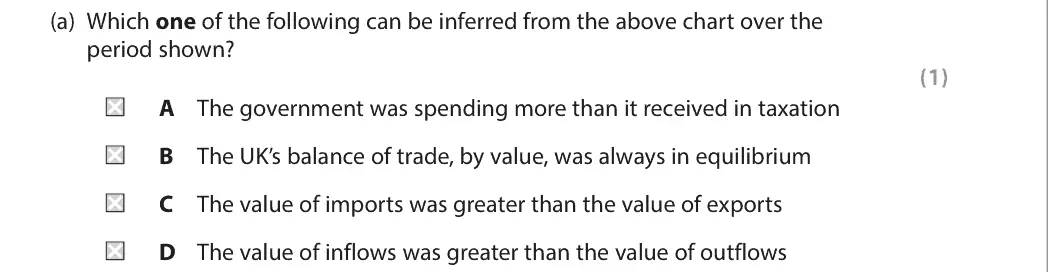
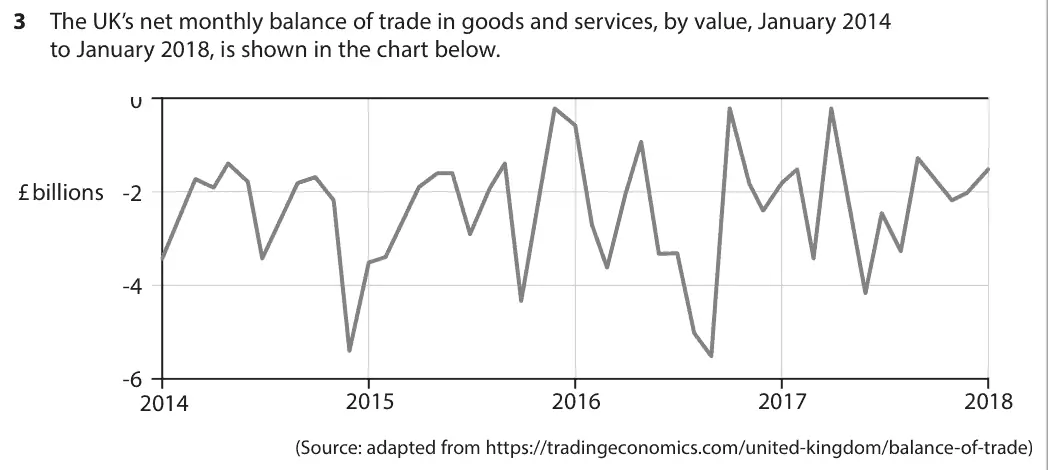
Data and extracts for question 33 The UK’s net monthly balance of trade in goods and services, by value, January 2014 to January 2018, is shown in the chart below. 2 0 £ billions -2 -4 -6 2015 2016 2017 2018 2014 (Source: adapted from https://tradingeconomics.com/united-kingdom/balance-of-trade)
(a) Which one of the following can be inferred from the above chart over the period shown? (1) A The government was spending more than it received in taxation B The UK’s balance of trade, by value, was always in equilibrium C The value of imports was greater than the value of exports D The value of inflows was greater than the value of outflows
October 2020 · AS Paper 2 · Q3(b) 3 marks AO1=1, AO2=1, AO3=1 Short answer balance of paymentsaggregate demand
Data and extracts for question 33 The UK’s net monthly balance of trade in goods and services, by value, January 2014 to January 2018, is shown in the chart below. 2 0 £ billions -2 -4 -6 2015 2016 2017 2018 2014 (Source: adapted from https://tradingeconomics.com/united-kingdom/balance-of-trade)
(b) Explain one likely reason for the UK’s balance of trade in goods and services over the period shown. Refer to the chart on page 6 in your answer. (3)
October 2020 · AS Paper 2 · Q4(a) 1 mark AO1=1 Definition fiscal and monetary policy
Data and extracts for question 44 In August 2018 the Monetary Policy Committee of the Bank of England raised the UK’s base interest rate from 0.5% to 0.75%.
(a) Define the term ‘interest rate’. (1)
October 2020 · AS Paper 2 · Q4(b) 2 marks AO2=2 Diagram fiscal and monetary policynational income and the multiplier
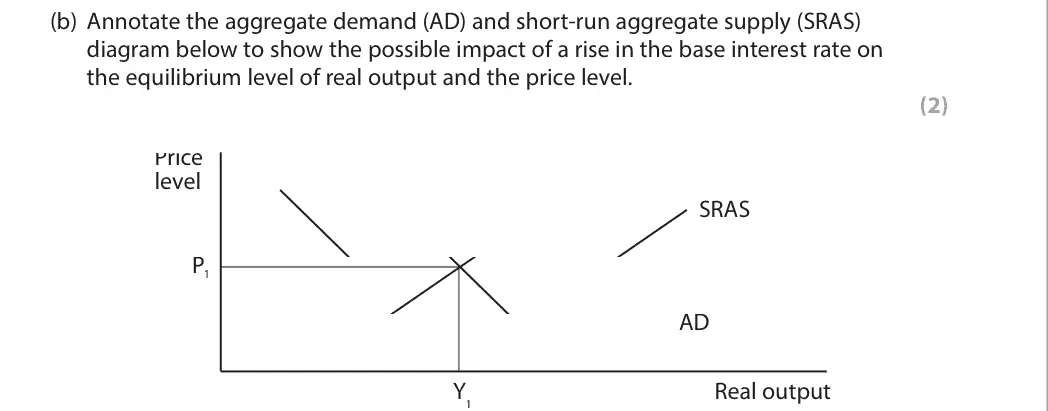
Data and extracts for question 44 In August 2018 the Monetary Policy Committee of the Bank of England raised the UK’s base interest rate from 0.5% to 0.75%.
(b) Annotate the aggregate demand (AD) and short-run aggregate supply (SRAS) diagram below to show the possible impact of a rise in the base interest rate on the equilibrium level of real output and the price level. (2) Price level SRAS P1 AD Y Real output 1
October 2020 · AS Paper 2 · Q4(c) 1 mark Multiple choice fiscal and monetary policy
Data and extracts for question 44 In August 2018 the Monetary Policy Committee of the Bank of England raised the UK’s base interest rate from 0.5% to 0.75%.
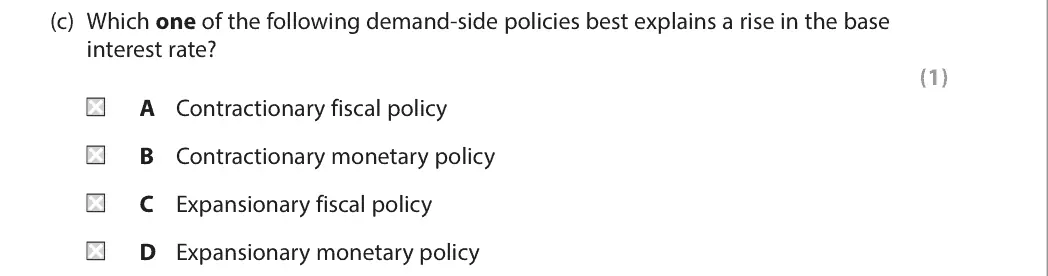
(c) Which one of the following demand-side policies best explains a rise in the base interest rate? (1) A Contractionary fiscal policy B Contractionary monetary policy C Expansionary fiscal policy D Expansionary monetary policy
October 2020 · AS Paper 2 · Q5(a) 1 mark AO1=1 Definition measuring economic growth
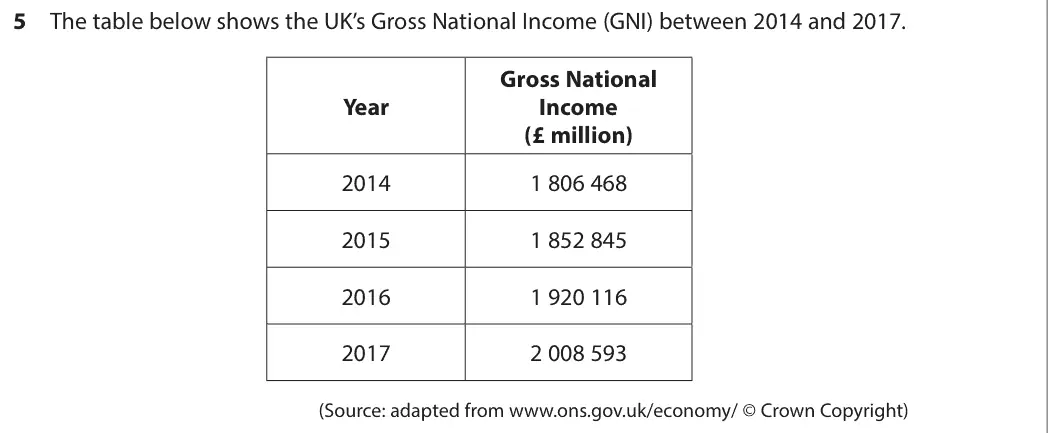
Data and extracts for question 55 The table below shows the UK’s Gross National Income (GNI) between 2014 and 2017. Gross National Year Income (£ million) 2014 1 806 468 2015 1 852 845 2016 1 920 116 2017 2 008 593 (Source: adapted from www.ons.gov.uk/economy/ © Crown Copyright)
(a) Define the term ‘Gross National Income’. (1)
October 2020 · AS Paper 2 · Q5(b) 1 mark Multiple choice measuring economic growth
Data and extracts for question 55 The table below shows the UK’s Gross National Income (GNI) between 2014 and 2017. Gross National Year Income (£ million) 2014 1 806 468 2015 1 852 845 2016 1 920 116 2017 2 008 593 (Source: adapted from www.ons.gov.uk/economy/ © Crown Copyright)
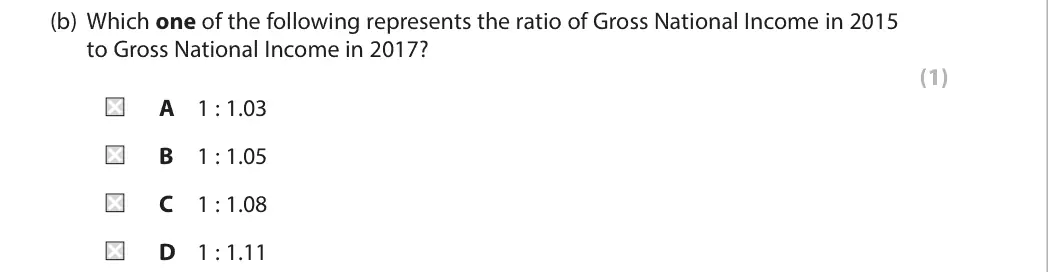
(b) Which one of the following represents the ratio of Gross National Income in 2015 to Gross National Income in 2017? (1) A 1 : 1.03 B 1 : 1.05 C 1 : 1.08 D 1 : 1.11
October 2020 · AS Paper 2 · Q5(c) 2 marks AO2=2 Calculation measuring economic growth
Data and extracts for question 55 The table below shows the UK’s Gross National Income (GNI) between 2014 and 2017. Gross National Year Income (£ million) 2014 1 806 468 2015 1 852 845 2016 1 920 116 2017 2 008 593 (Source: adapted from www.ons.gov.uk/economy/ © Crown Copyright)
(c) Using 2014 as the base year, calculate the index number for 2016. You are advised to show your working. (2)
October 2020 · AS Paper 2 · Q6(a) 4 marks AO1=2, AO2=2 Short answer fiscal and monetary policy
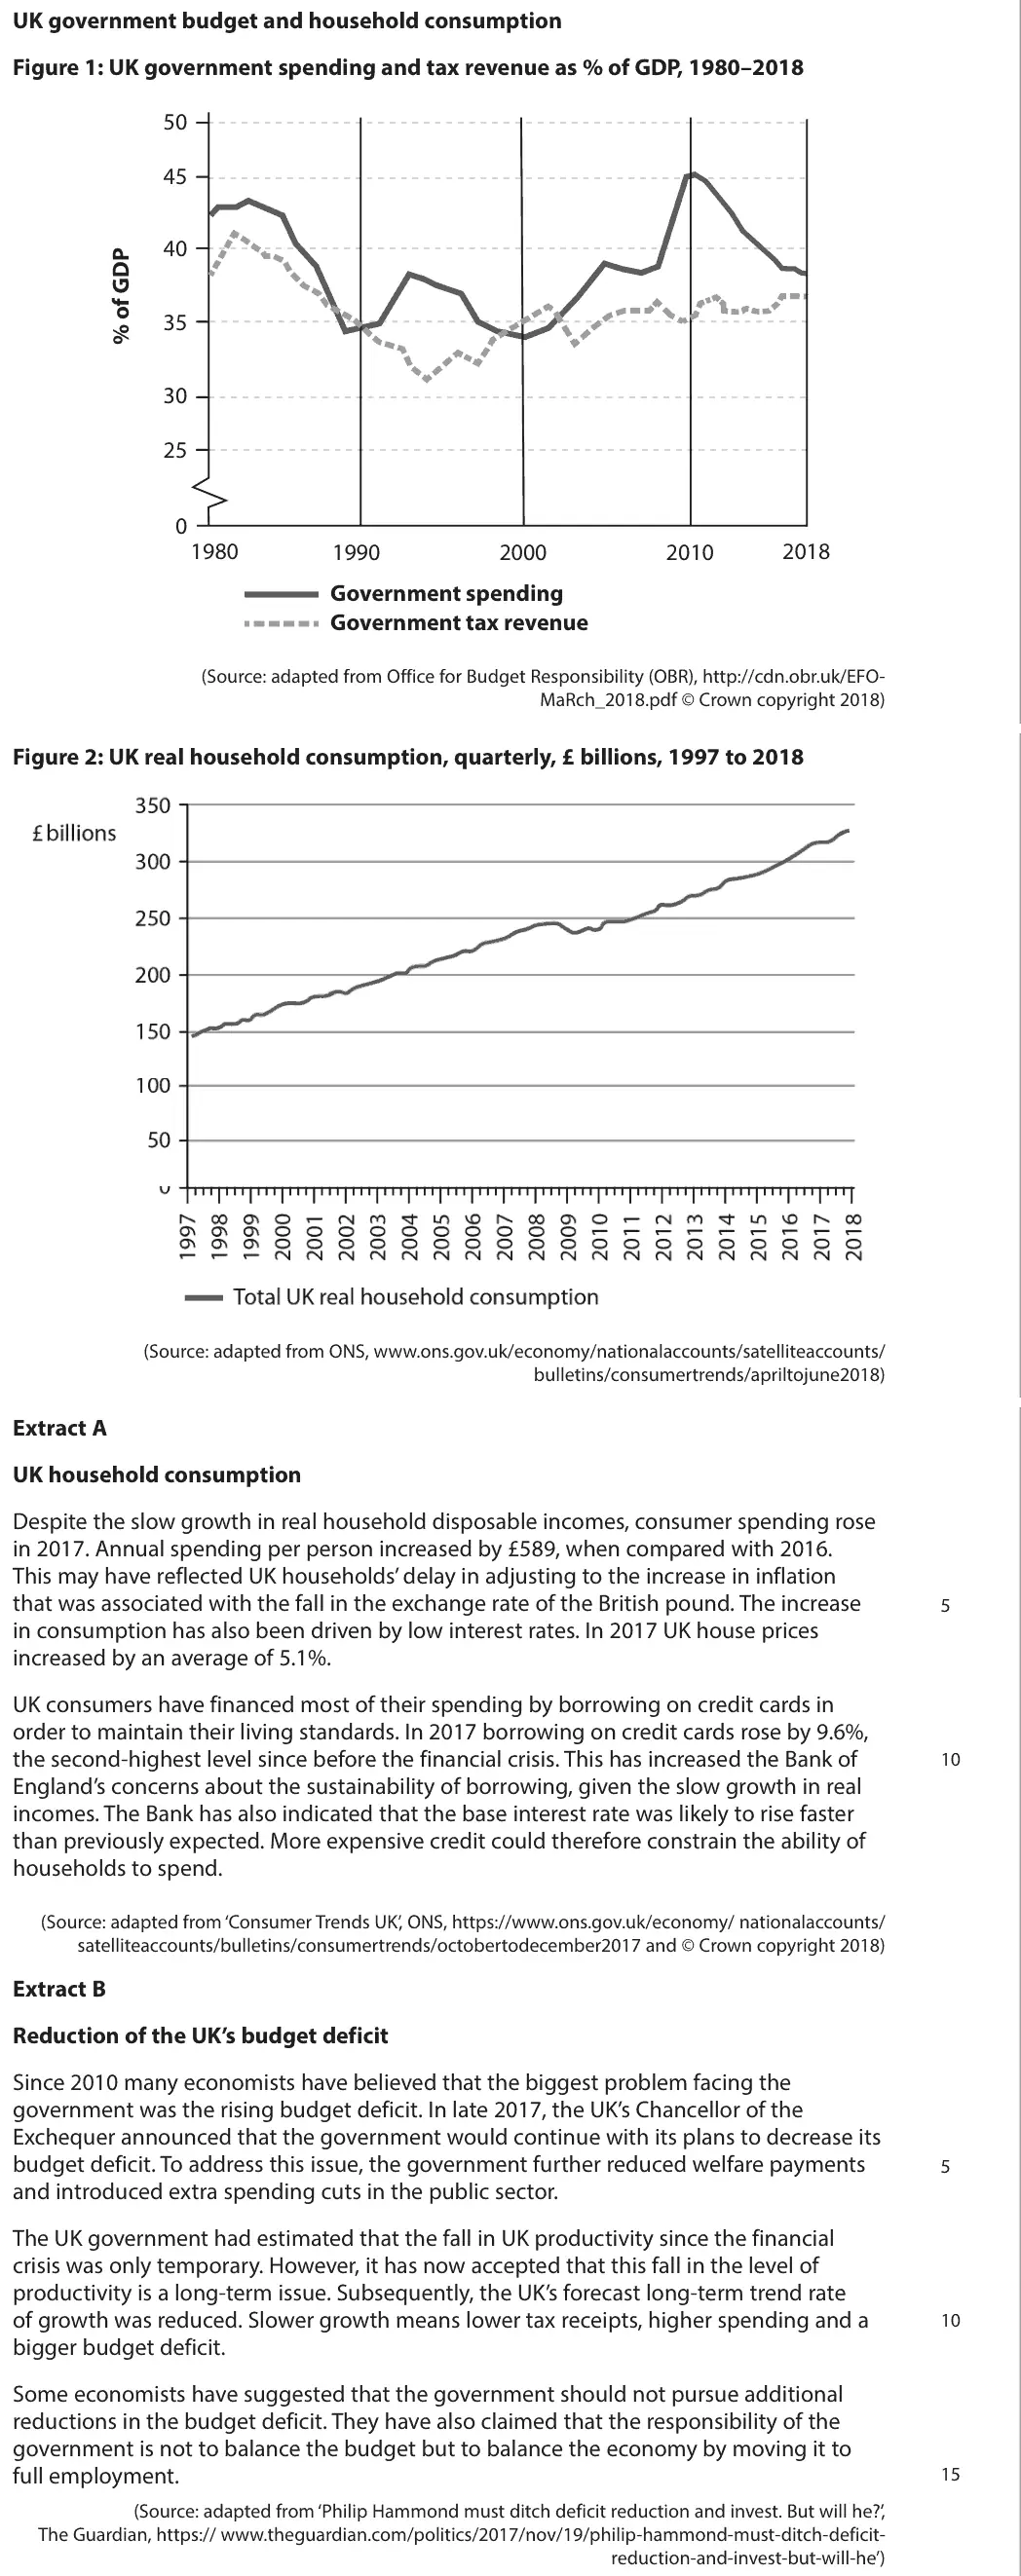
Data and extracts for question 6UK government budget and household consumption Figure 1: UK government spending and tax revenue as % of GDP, 1980–2018 50 45 40 35 30 25 0 1980 2018 1990 2000 2010 Government spending Government tax revenue (Source: adapted from Office for Budget Responsibility (OBR), http://cdn.obr.uk/EFO- MaRch_2018.pdf © Crown copyright 2018) Figure 2: UK real household consumption, quarterly, £ billions, 1997 to 2018 (Source: adapted from ONS, www.ons.gov.uk/economy/nationalaccounts/satelliteaccounts/ bulletins/consumertrends/apriltojune2018) Extract A UK household consumption Despite the slow growth in real household disposable incomes, consumer spending rose in 2017. Annual spending per person increased by £589, when compared with 2016. This may have reflected UK households’ delay in adjusting to the increase in inflation that was associated with the fall in the exchange rate of the British pound. The increase 5 in consumption has also been driven by low interest rates. In 2017 UK house prices increased by an average of 5.1%. UK consumers have financed most of their spending by borrowing on credit cards in order to maintain their living standards. In 2017 borrowing on credit cards rose by 9.6%, the second-highest level since before the financial crisis. This has increased the Bank of 10 England’s concerns about the sustainability of borrowing, given the slow growth in real incomes. The Bank has also indicated that the base interest rate was likely to rise faster than previously expected. More expensive credit could therefore constrain the ability of households to spend. (Source: adapted from ‘Consumer Trends UK’, ONS, https://www.ons.gov.uk/economy/ nationalaccounts/ satelliteaccounts/bulletins/consumertrends/octobertodecember2017 and © Crown copyright 2018) Extract B Reduction of the UK’s budget deficit Since 2010 many economists have believed that the biggest problem facing the government was the rising budget deficit. In late 2017, the UK’s Chancellor of the Exchequer announced that the government would continue with its plans to decrease its budget deficit. To address this issue, the government further reduced welfare payments 5 and introduced extra spending cuts in the public sector. The UK government had estimated that the fall in UK productivity since the financial crisis was only temporary. However, it has now accepted that this fall in the level of productivity is a long-term issue. Subsequently, the UK’s forecast long-term trend rate of growth was reduced. Slower growth means lower tax receipts, higher spending and a 10 bigger budget deficit. Some economists have suggested that the government should not pursue additional reductions in the budget deficit. They have also claimed that the responsibility of the government is not to balance the budget but to balance the economy by moving it to full employment. 15 (Source: adapted from ‘Philip Hammond must ditch deficit reduction and invest. But will he?’, The Guardian, https:// www.theguardian.com/politics/2017/nov/19/philip-hammond-must-ditch-deficit- reduction-and-invest-but-will-he’)
(a) With reference to Figure 1, explain the term ‘balanced government budget’. (4)
October 2020 · AS Paper 2 · Q6(b) 5 marks AO1=1, AO2=2, AO3=2 Short answer aggregate demand
Data and extracts for question 6UK government budget and household consumption Figure 1: UK government spending and tax revenue as % of GDP, 1980–2018 50 45 40 35 30 25 0 1980 2018 1990 2000 2010 Government spending Government tax revenue (Source: adapted from Office for Budget Responsibility (OBR), http://cdn.obr.uk/EFO- MaRch_2018.pdf © Crown copyright 2018) Figure 2: UK real household consumption, quarterly, £ billions, 1997 to 2018 (Source: adapted from ONS, www.ons.gov.uk/economy/nationalaccounts/satelliteaccounts/ bulletins/consumertrends/apriltojune2018) Extract A UK household consumption Despite the slow growth in real household disposable incomes, consumer spending rose in 2017. Annual spending per person increased by £589, when compared with 2016. This may have reflected UK households’ delay in adjusting to the increase in inflation that was associated with the fall in the exchange rate of the British pound. The increase 5 in consumption has also been driven by low interest rates. In 2017 UK house prices increased by an average of 5.1%. UK consumers have financed most of their spending by borrowing on credit cards in order to maintain their living standards. In 2017 borrowing on credit cards rose by 9.6%, the second-highest level since before the financial crisis. This has increased the Bank of 10 England’s concerns about the sustainability of borrowing, given the slow growth in real incomes. The Bank has also indicated that the base interest rate was likely to rise faster than previously expected. More expensive credit could therefore constrain the ability of households to spend. (Source: adapted from ‘Consumer Trends UK’, ONS, https://www.ons.gov.uk/economy/ nationalaccounts/ satelliteaccounts/bulletins/consumertrends/octobertodecember2017 and © Crown copyright 2018) Extract B Reduction of the UK’s budget deficit Since 2010 many economists have believed that the biggest problem facing the government was the rising budget deficit. In late 2017, the UK’s Chancellor of the Exchequer announced that the government would continue with its plans to decrease its budget deficit. To address this issue, the government further reduced welfare payments 5 and introduced extra spending cuts in the public sector. The UK government had estimated that the fall in UK productivity since the financial crisis was only temporary. However, it has now accepted that this fall in the level of productivity is a long-term issue. Subsequently, the UK’s forecast long-term trend rate of growth was reduced. Slower growth means lower tax receipts, higher spending and a 10 bigger budget deficit. Some economists have suggested that the government should not pursue additional reductions in the budget deficit. They have also claimed that the responsibility of the government is not to balance the budget but to balance the economy by moving it to full employment. 15 (Source: adapted from ‘Philip Hammond must ditch deficit reduction and invest. But will he?’, The Guardian, https:// www.theguardian.com/politics/2017/nov/19/philip-hammond-must-ditch-deficit- reduction-and-invest-but-will-he’)
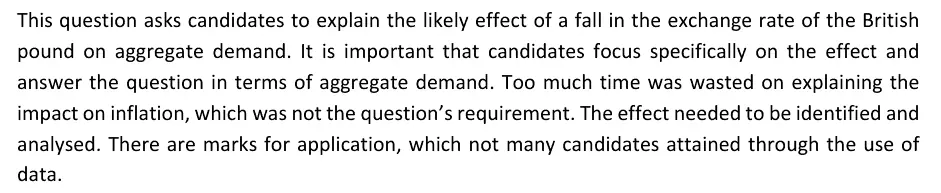
(b) Explain the likely effect of a fall in the exchange rate of the British pound on aggregate demand. Refer to Extract A in your answer. (5)
October 2020 · AS Paper 2 · Q6(c) 6 marks AO1=2, AO2=2, AO3=2 Short answer aggregate demand
Data and extracts for question 6UK government budget and household consumption Figure 1: UK government spending and tax revenue as % of GDP, 1980–2018 50 45 40 35 30 25 0 1980 2018 1990 2000 2010 Government spending Government tax revenue (Source: adapted from Office for Budget Responsibility (OBR), http://cdn.obr.uk/EFO- MaRch_2018.pdf © Crown copyright 2018) Figure 2: UK real household consumption, quarterly, £ billions, 1997 to 2018 (Source: adapted from ONS, www.ons.gov.uk/economy/nationalaccounts/satelliteaccounts/ bulletins/consumertrends/apriltojune2018) Extract A UK household consumption Despite the slow growth in real household disposable incomes, consumer spending rose in 2017. Annual spending per person increased by £589, when compared with 2016. This may have reflected UK households’ delay in adjusting to the increase in inflation that was associated with the fall in the exchange rate of the British pound. The increase 5 in consumption has also been driven by low interest rates. In 2017 UK house prices increased by an average of 5.1%. UK consumers have financed most of their spending by borrowing on credit cards in order to maintain their living standards. In 2017 borrowing on credit cards rose by 9.6%, the second-highest level since before the financial crisis. This has increased the Bank of 10 England’s concerns about the sustainability of borrowing, given the slow growth in real incomes. The Bank has also indicated that the base interest rate was likely to rise faster than previously expected. More expensive credit could therefore constrain the ability of households to spend. (Source: adapted from ‘Consumer Trends UK’, ONS, https://www.ons.gov.uk/economy/ nationalaccounts/ satelliteaccounts/bulletins/consumertrends/octobertodecember2017 and © Crown copyright 2018) Extract B Reduction of the UK’s budget deficit Since 2010 many economists have believed that the biggest problem facing the government was the rising budget deficit. In late 2017, the UK’s Chancellor of the Exchequer announced that the government would continue with its plans to decrease its budget deficit. To address this issue, the government further reduced welfare payments 5 and introduced extra spending cuts in the public sector. The UK government had estimated that the fall in UK productivity since the financial crisis was only temporary. However, it has now accepted that this fall in the level of productivity is a long-term issue. Subsequently, the UK’s forecast long-term trend rate of growth was reduced. Slower growth means lower tax receipts, higher spending and a 10 bigger budget deficit. Some economists have suggested that the government should not pursue additional reductions in the budget deficit. They have also claimed that the responsibility of the government is not to balance the budget but to balance the economy by moving it to full employment. 15 (Source: adapted from ‘Philip Hammond must ditch deficit reduction and invest. But will he?’, The Guardian, https:// www.theguardian.com/politics/2017/nov/19/philip-hammond-must-ditch-deficit- reduction-and-invest-but-will-he’)
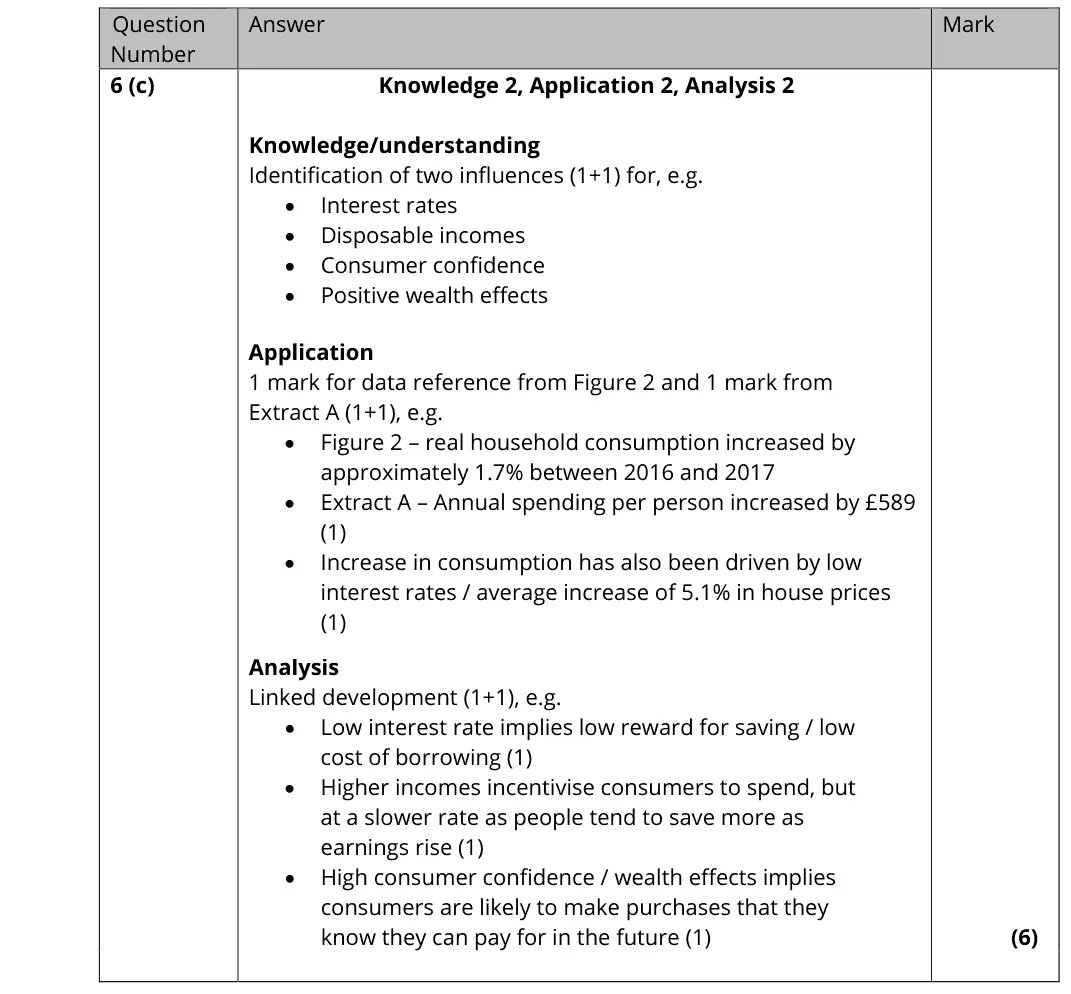
(c) With reference to Figure 2 and Extract A, explain two likely influences on the level of UK real household consumption. (6)
October 2020 · AS Paper 2 · Q6(d) 10 marks AO1=2, AO2=2, AO3=2, AO4=4 10-mark response national income and the multiplieraggregate demand
Data and extracts for question 6UK government budget and household consumption Figure 1: UK government spending and tax revenue as % of GDP, 1980–2018 50 45 40 35 30 25 0 1980 2018 1990 2000 2010 Government spending Government tax revenue (Source: adapted from Office for Budget Responsibility (OBR), http://cdn.obr.uk/EFO- MaRch_2018.pdf © Crown copyright 2018) Figure 2: UK real household consumption, quarterly, £ billions, 1997 to 2018 (Source: adapted from ONS, www.ons.gov.uk/economy/nationalaccounts/satelliteaccounts/ bulletins/consumertrends/apriltojune2018) Extract A UK household consumption Despite the slow growth in real household disposable incomes, consumer spending rose in 2017. Annual spending per person increased by £589, when compared with 2016. This may have reflected UK households’ delay in adjusting to the increase in inflation that was associated with the fall in the exchange rate of the British pound. The increase 5 in consumption has also been driven by low interest rates. In 2017 UK house prices increased by an average of 5.1%. UK consumers have financed most of their spending by borrowing on credit cards in order to maintain their living standards. In 2017 borrowing on credit cards rose by 9.6%, the second-highest level since before the financial crisis. This has increased the Bank of 10 England’s concerns about the sustainability of borrowing, given the slow growth in real incomes. The Bank has also indicated that the base interest rate was likely to rise faster than previously expected. More expensive credit could therefore constrain the ability of households to spend. (Source: adapted from ‘Consumer Trends UK’, ONS, https://www.ons.gov.uk/economy/ nationalaccounts/ satelliteaccounts/bulletins/consumertrends/octobertodecember2017 and © Crown copyright 2018) Extract B Reduction of the UK’s budget deficit Since 2010 many economists have believed that the biggest problem facing the government was the rising budget deficit. In late 2017, the UK’s Chancellor of the Exchequer announced that the government would continue with its plans to decrease its budget deficit. To address this issue, the government further reduced welfare payments 5 and introduced extra spending cuts in the public sector. The UK government had estimated that the fall in UK productivity since the financial crisis was only temporary. However, it has now accepted that this fall in the level of productivity is a long-term issue. Subsequently, the UK’s forecast long-term trend rate of growth was reduced. Slower growth means lower tax receipts, higher spending and a 10 bigger budget deficit. Some economists have suggested that the government should not pursue additional reductions in the budget deficit. They have also claimed that the responsibility of the government is not to balance the budget but to balance the economy by moving it to full employment. 15 (Source: adapted from ‘Philip Hammond must ditch deficit reduction and invest. But will he?’, The Guardian, https:// www.theguardian.com/politics/2017/nov/19/philip-hammond-must-ditch-deficit- reduction-and-invest-but-will-he’)
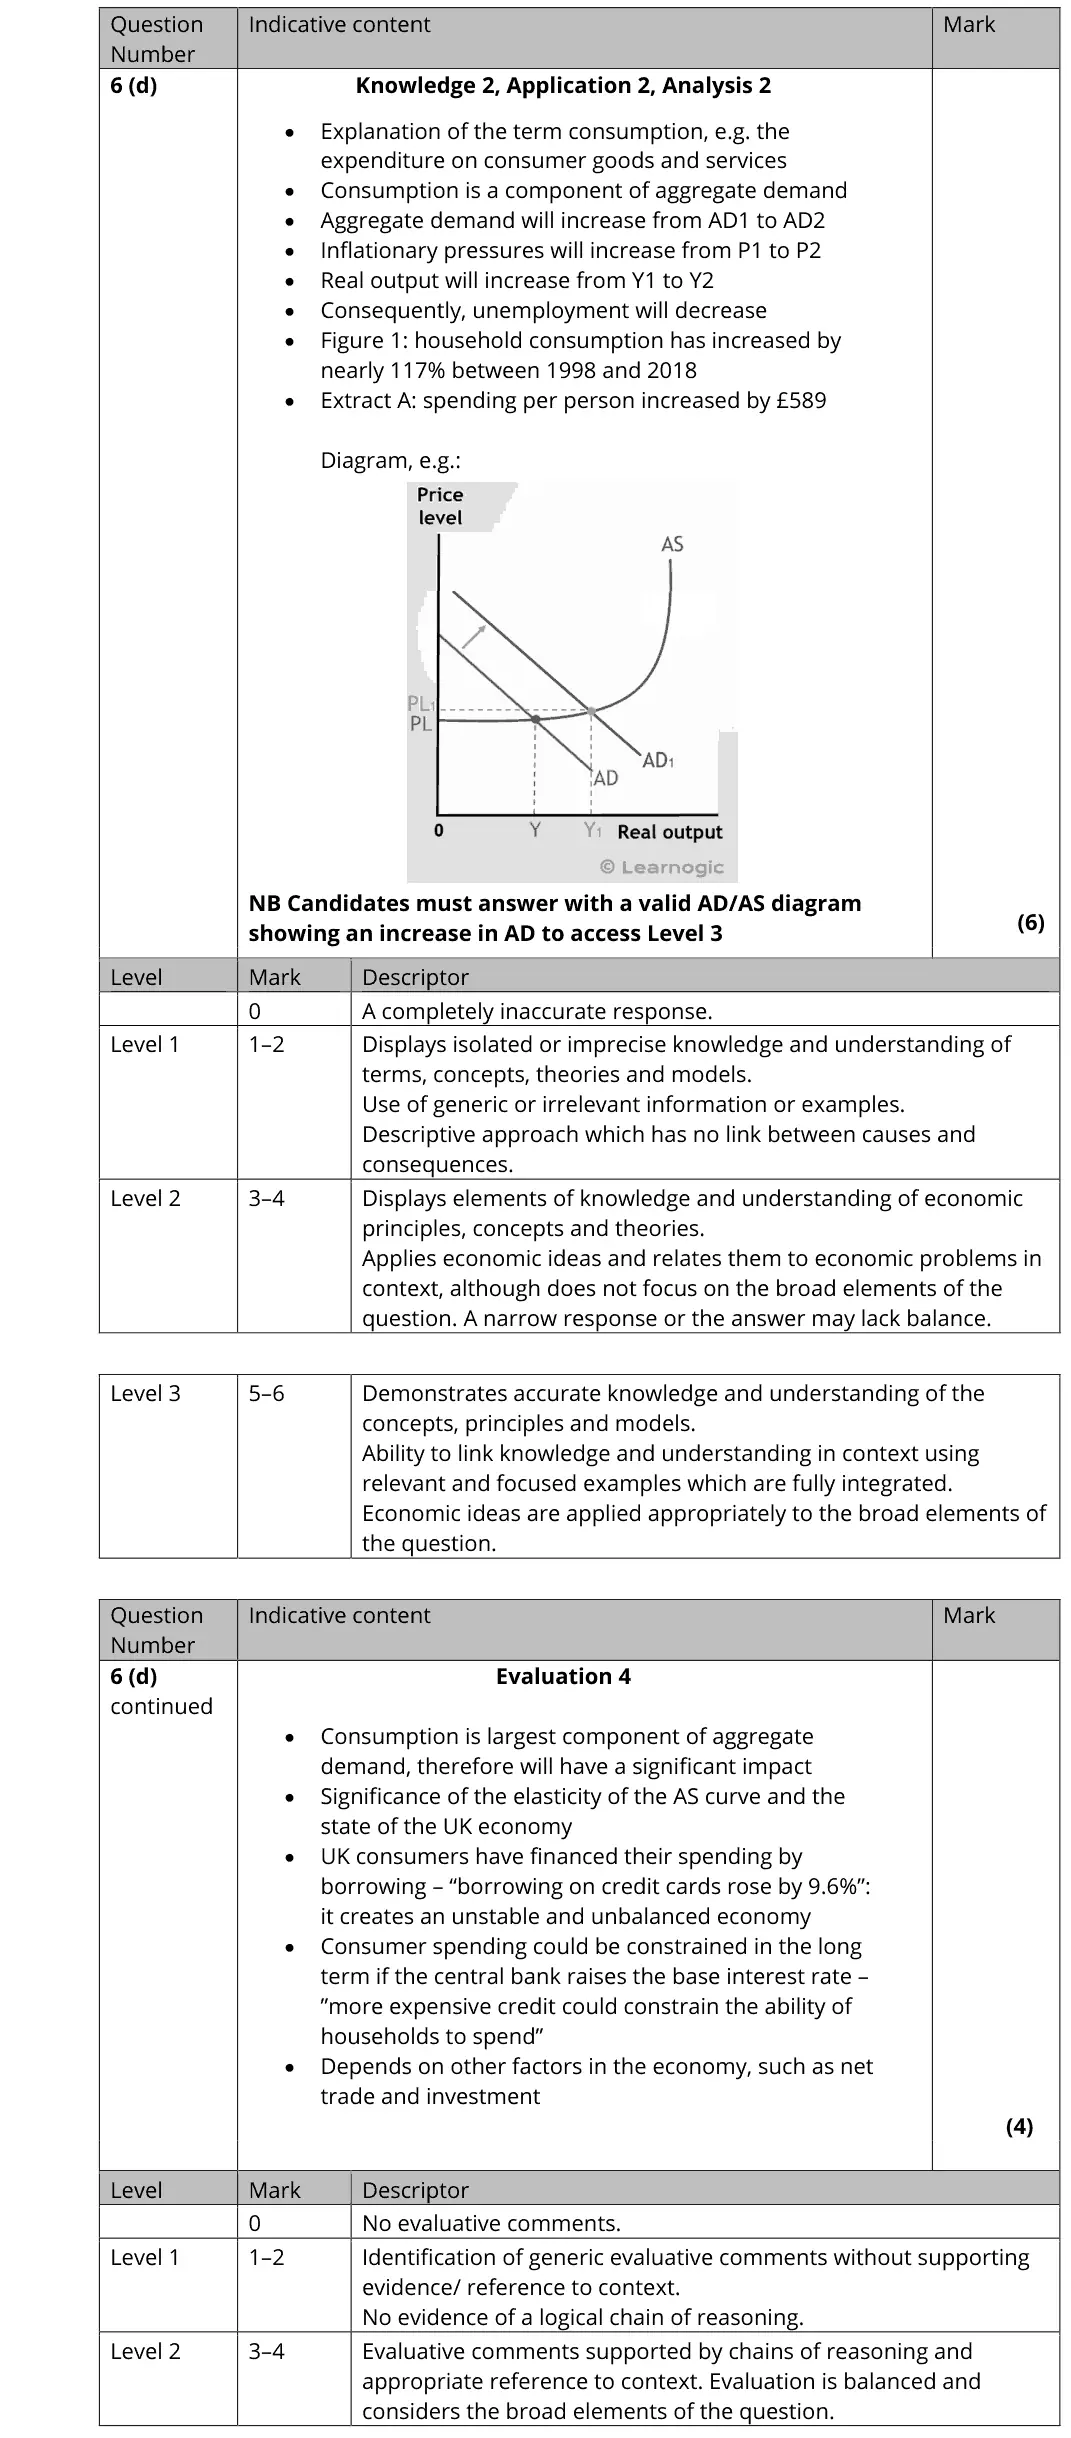
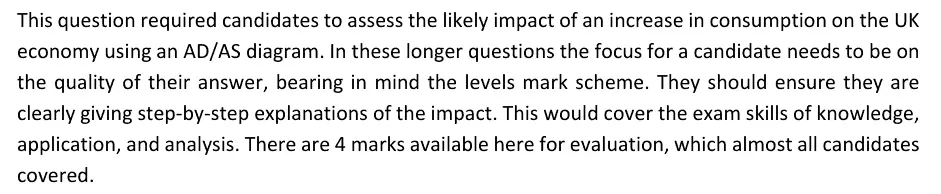
(d) Assess the likely impact on the UK economy of an ‘increase in consumption’ (Extract A, lines 5–6). Use an aggregate demand and aggregate supply diagram in your answer. (10)
October 2020 · AS Paper 2 · Q6(e) 15 marks AO1=3, AO2=3, AO3=3, AO4=6 15-mark response Hard economic growth and the trade cycleaggregate supply
Data and extracts for question 6UK government budget and household consumption Figure 1: UK government spending and tax revenue as % of GDP, 1980–2018 50 45 40 35 30 25 0 1980 2018 1990 2000 2010 Government spending Government tax revenue (Source: adapted from Office for Budget Responsibility (OBR), http://cdn.obr.uk/EFO- MaRch_2018.pdf © Crown copyright 2018) Figure 2: UK real household consumption, quarterly, £ billions, 1997 to 2018 (Source: adapted from ONS, www.ons.gov.uk/economy/nationalaccounts/satelliteaccounts/ bulletins/consumertrends/apriltojune2018) Extract A UK household consumption Despite the slow growth in real household disposable incomes, consumer spending rose in 2017. Annual spending per person increased by £589, when compared with 2016. This may have reflected UK households’ delay in adjusting to the increase in inflation that was associated with the fall in the exchange rate of the British pound. The increase 5 in consumption has also been driven by low interest rates. In 2017 UK house prices increased by an average of 5.1%. UK consumers have financed most of their spending by borrowing on credit cards in order to maintain their living standards. In 2017 borrowing on credit cards rose by 9.6%, the second-highest level since before the financial crisis. This has increased the Bank of 10 England’s concerns about the sustainability of borrowing, given the slow growth in real incomes. The Bank has also indicated that the base interest rate was likely to rise faster than previously expected. More expensive credit could therefore constrain the ability of households to spend. (Source: adapted from ‘Consumer Trends UK’, ONS, https://www.ons.gov.uk/economy/ nationalaccounts/ satelliteaccounts/bulletins/consumertrends/octobertodecember2017 and © Crown copyright 2018) Extract B Reduction of the UK’s budget deficit Since 2010 many economists have believed that the biggest problem facing the government was the rising budget deficit. In late 2017, the UK’s Chancellor of the Exchequer announced that the government would continue with its plans to decrease its budget deficit. To address this issue, the government further reduced welfare payments 5 and introduced extra spending cuts in the public sector. The UK government had estimated that the fall in UK productivity since the financial crisis was only temporary. However, it has now accepted that this fall in the level of productivity is a long-term issue. Subsequently, the UK’s forecast long-term trend rate of growth was reduced. Slower growth means lower tax receipts, higher spending and a 10 bigger budget deficit. Some economists have suggested that the government should not pursue additional reductions in the budget deficit. They have also claimed that the responsibility of the government is not to balance the budget but to balance the economy by moving it to full employment. 15 (Source: adapted from ‘Philip Hammond must ditch deficit reduction and invest. But will he?’, The Guardian, https:// www.theguardian.com/politics/2017/nov/19/philip-hammond-must-ditch-deficit- reduction-and-invest-but-will-he’)
(e) Discuss the factors that might explain why ‘the UK’s forecast long-term trend rate of growth was reduced’ (Extract B lines 9–10). (15)
October 2020 · AS Paper 2 · Q6(f) 20 marks AO1=4, AO2=4, AO3=6, AO4=6 20-mark essay Either/or supply side policies
Data and extracts for question 6UK government budget and household consumption Figure 1: UK government spending and tax revenue as % of GDP, 1980–2018 50 45 40 35 30 25 0 1980 2018 1990 2000 2010 Government spending Government tax revenue (Source: adapted from Office for Budget Responsibility (OBR), http://cdn.obr.uk/EFO- MaRch_2018.pdf © Crown copyright 2018) Figure 2: UK real household consumption, quarterly, £ billions, 1997 to 2018 (Source: adapted from ONS, www.ons.gov.uk/economy/nationalaccounts/satelliteaccounts/ bulletins/consumertrends/apriltojune2018) Extract A UK household consumption Despite the slow growth in real household disposable incomes, consumer spending rose in 2017. Annual spending per person increased by £589, when compared with 2016. This may have reflected UK households’ delay in adjusting to the increase in inflation that was associated with the fall in the exchange rate of the British pound. The increase 5 in consumption has also been driven by low interest rates. In 2017 UK house prices increased by an average of 5.1%. UK consumers have financed most of their spending by borrowing on credit cards in order to maintain their living standards. In 2017 borrowing on credit cards rose by 9.6%, the second-highest level since before the financial crisis. This has increased the Bank of 10 England’s concerns about the sustainability of borrowing, given the slow growth in real incomes. The Bank has also indicated that the base interest rate was likely to rise faster than previously expected. More expensive credit could therefore constrain the ability of households to spend. (Source: adapted from ‘Consumer Trends UK’, ONS, https://www.ons.gov.uk/economy/ nationalaccounts/ satelliteaccounts/bulletins/consumertrends/octobertodecember2017 and © Crown copyright 2018) Extract B Reduction of the UK’s budget deficit Since 2010 many economists have believed that the biggest problem facing the government was the rising budget deficit. In late 2017, the UK’s Chancellor of the Exchequer announced that the government would continue with its plans to decrease its budget deficit. To address this issue, the government further reduced welfare payments 5 and introduced extra spending cuts in the public sector. The UK government had estimated that the fall in UK productivity since the financial crisis was only temporary. However, it has now accepted that this fall in the level of productivity is a long-term issue. Subsequently, the UK’s forecast long-term trend rate of growth was reduced. Slower growth means lower tax receipts, higher spending and a 10 bigger budget deficit. Some economists have suggested that the government should not pursue additional reductions in the budget deficit. They have also claimed that the responsibility of the government is not to balance the budget but to balance the economy by moving it to full employment. 15 (Source: adapted from ‘Philip Hammond must ditch deficit reduction and invest. But will he?’, The Guardian, https:// www.theguardian.com/politics/2017/nov/19/philip-hammond-must-ditch-deficit- reduction-and-invest-but-will-he’)
(f) Evaluate supply-side policies that could be used to increase the UK’s rate of economic growth. (20)
October 2020 · AS Paper 2 · Q6(g) 20 marks AO1=4, AO2=4, AO3=6, AO4=6 20-mark essay Either/or fiscal and monetary policymacroeconomic objectives
Data and extracts for question 6UK government budget and household consumption Figure 1: UK government spending and tax revenue as % of GDP, 1980–2018 50 45 40 35 30 25 0 1980 2018 1990 2000 2010 Government spending Government tax revenue (Source: adapted from Office for Budget Responsibility (OBR), http://cdn.obr.uk/EFO- MaRch_2018.pdf © Crown copyright 2018) Figure 2: UK real household consumption, quarterly, £ billions, 1997 to 2018 (Source: adapted from ONS, www.ons.gov.uk/economy/nationalaccounts/satelliteaccounts/ bulletins/consumertrends/apriltojune2018) Extract A UK household consumption Despite the slow growth in real household disposable incomes, consumer spending rose in 2017. Annual spending per person increased by £589, when compared with 2016. This may have reflected UK households’ delay in adjusting to the increase in inflation that was associated with the fall in the exchange rate of the British pound. The increase 5 in consumption has also been driven by low interest rates. In 2017 UK house prices increased by an average of 5.1%. UK consumers have financed most of their spending by borrowing on credit cards in order to maintain their living standards. In 2017 borrowing on credit cards rose by 9.6%, the second-highest level since before the financial crisis. This has increased the Bank of 10 England’s concerns about the sustainability of borrowing, given the slow growth in real incomes. The Bank has also indicated that the base interest rate was likely to rise faster than previously expected. More expensive credit could therefore constrain the ability of households to spend. (Source: adapted from ‘Consumer Trends UK’, ONS, https://www.ons.gov.uk/economy/ nationalaccounts/ satelliteaccounts/bulletins/consumertrends/octobertodecember2017 and © Crown copyright 2018) Extract B Reduction of the UK’s budget deficit Since 2010 many economists have believed that the biggest problem facing the government was the rising budget deficit. In late 2017, the UK’s Chancellor of the Exchequer announced that the government would continue with its plans to decrease its budget deficit. To address this issue, the government further reduced welfare payments 5 and introduced extra spending cuts in the public sector. The UK government had estimated that the fall in UK productivity since the financial crisis was only temporary. However, it has now accepted that this fall in the level of productivity is a long-term issue. Subsequently, the UK’s forecast long-term trend rate of growth was reduced. Slower growth means lower tax receipts, higher spending and a 10 bigger budget deficit. Some economists have suggested that the government should not pursue additional reductions in the budget deficit. They have also claimed that the responsibility of the government is not to balance the budget but to balance the economy by moving it to full employment. 15 (Source: adapted from ‘Philip Hammond must ditch deficit reduction and invest. But will he?’, The Guardian, https:// www.theguardian.com/politics/2017/nov/19/philip-hammond-must-ditch-deficit- reduction-and-invest-but-will-he’)
(g) Evaluate the likely macroeconomic effects of the UK government pursuing a policy of reducing its budget deficit. (20)

Work with an Edexcel economics tutor

Want a paper marked and gone through with you? Message us.
Prefer email? Send an enquiry

If you are under 18, please include a parent's contact details. Enquiries go to enquiries@economicsaleveltutor.com and are deleted once handled. All tutoring is online.