October 2020: AS Paper 1

80 marks · 19 question parts · Paper, mark scheme and report on Pearson's site · The October 2020 papers are the papers printed for the cancelled summer 2020 exams

Question by question

QTopicMarksAOType
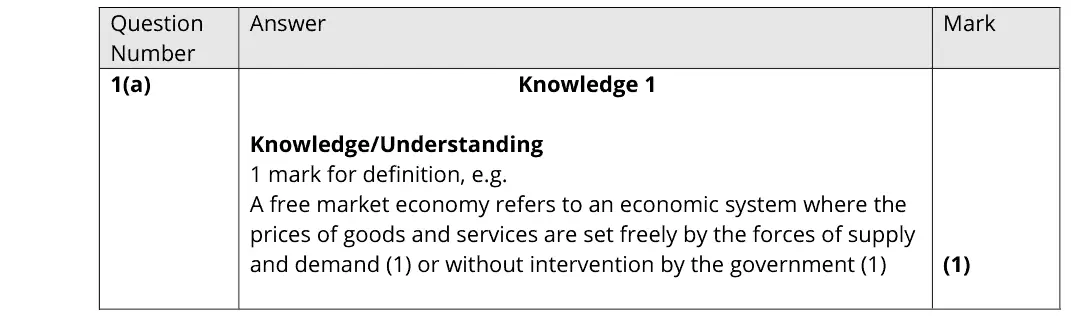
1(a) Free market, mixed and command economies 1AO1=1Definition

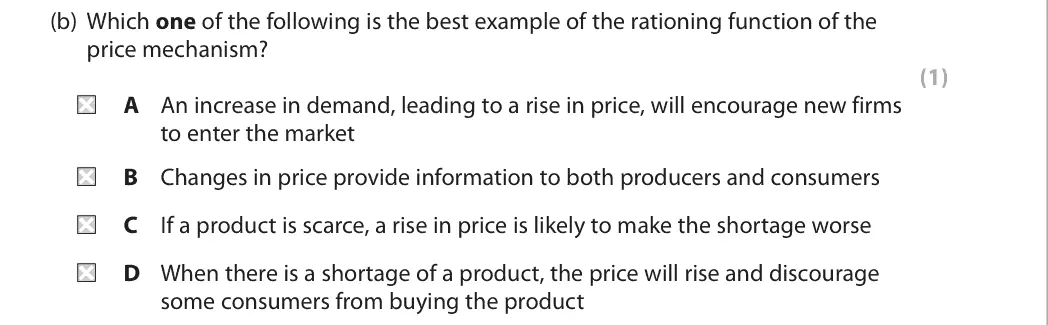
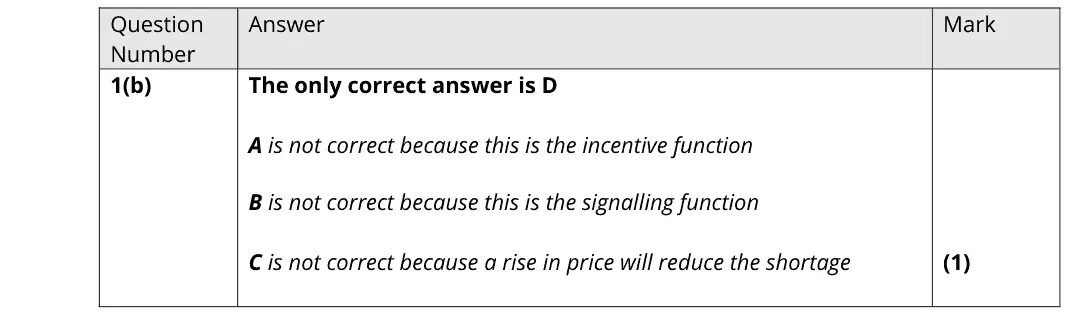
1(b) The price mechanism, consumer and producer surplus 1Multiple choice
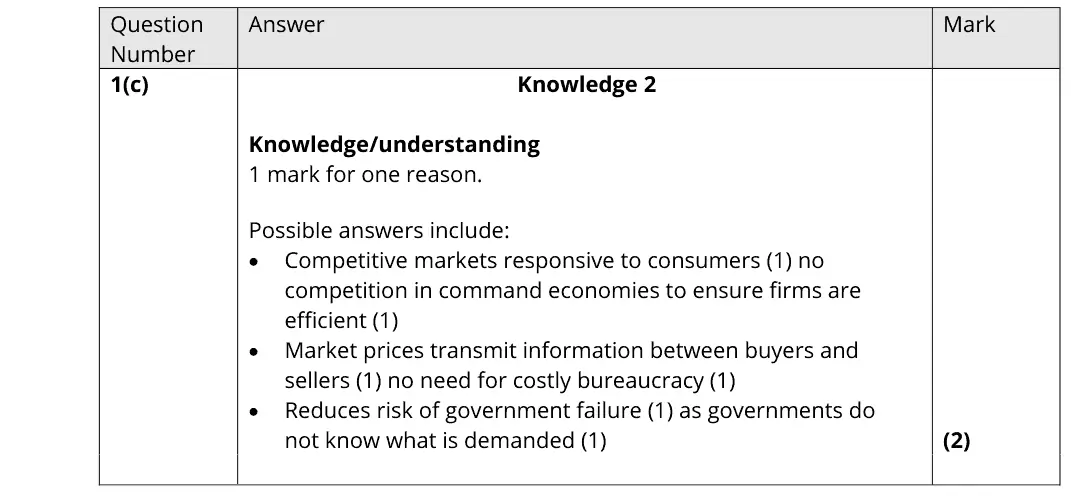
1(c) Free market, mixed and command economies 2AO1=2Short answer
2(a) Price, income and cross elasticities of demand 1Multiple choice
2(b) Price, income and cross elasticities of demand 3AO1=1,AO2=1,AO3=1Short answer
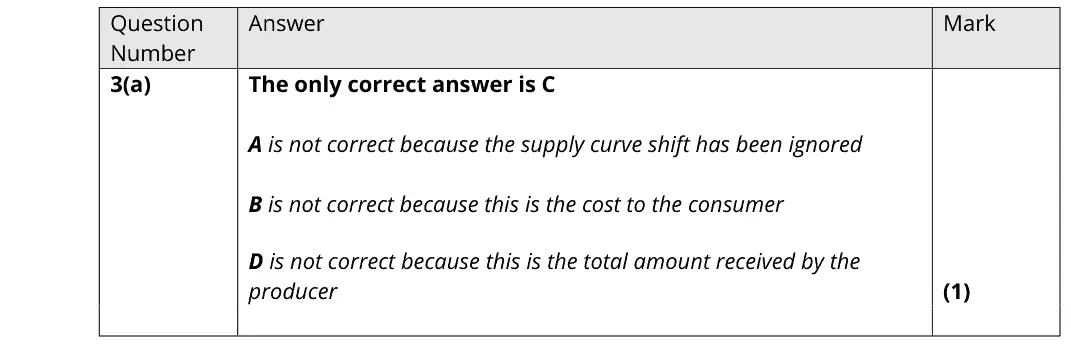
3(a) Indirect taxes and subsidies 1Multiple choice
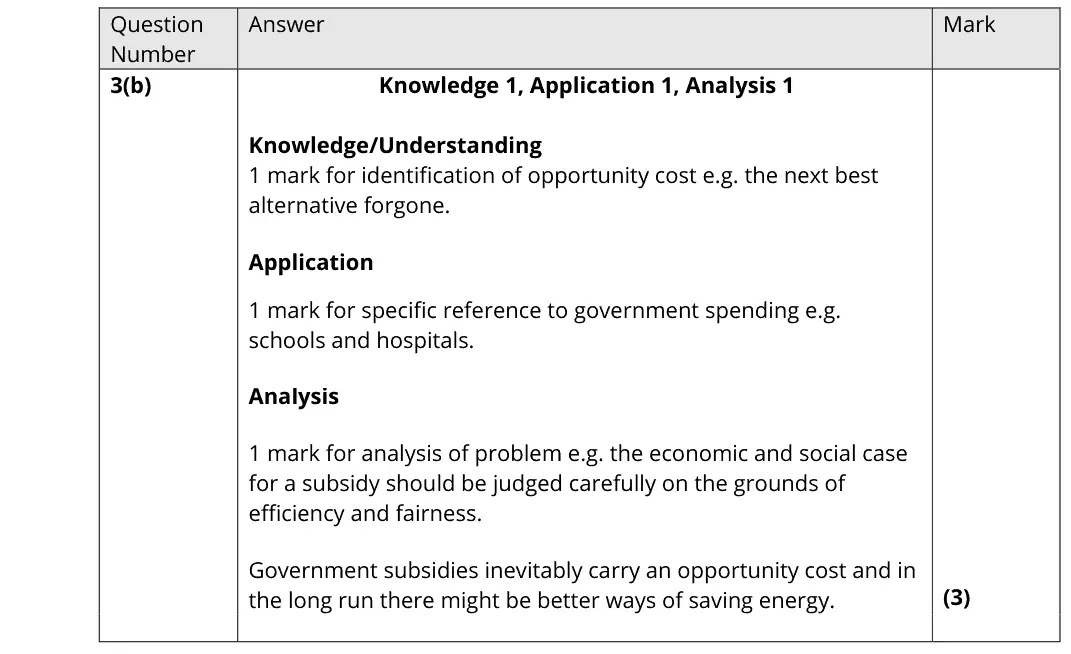
3(b) The nature of economics and the economic problem 3AO1=1,AO2=1,AO3=1Short answer
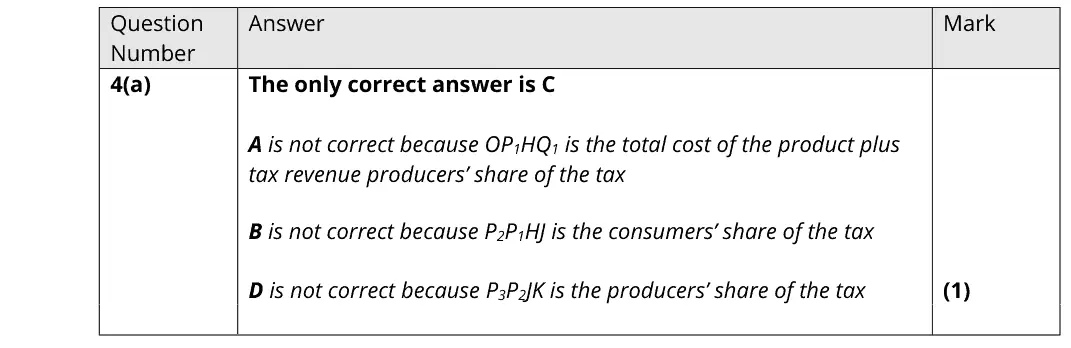
4(a) Indirect taxes and subsidies 1Multiple choice
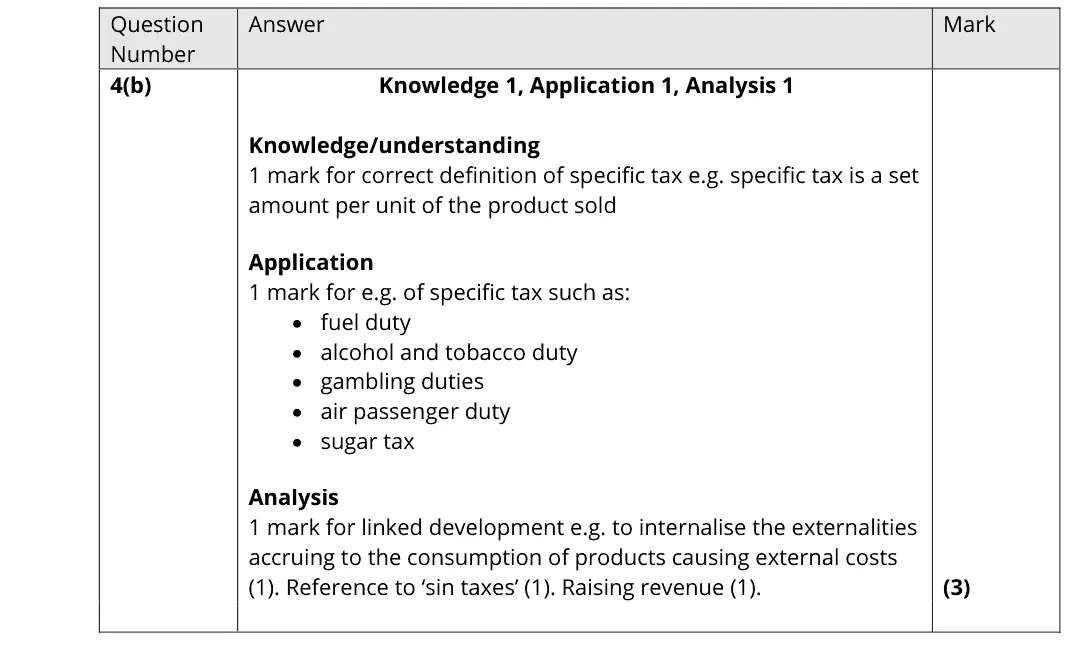
4(b) Government intervention in markets, Indirect taxes and subsidies 3AO1=1,AO2=1,AO3=1Short answer
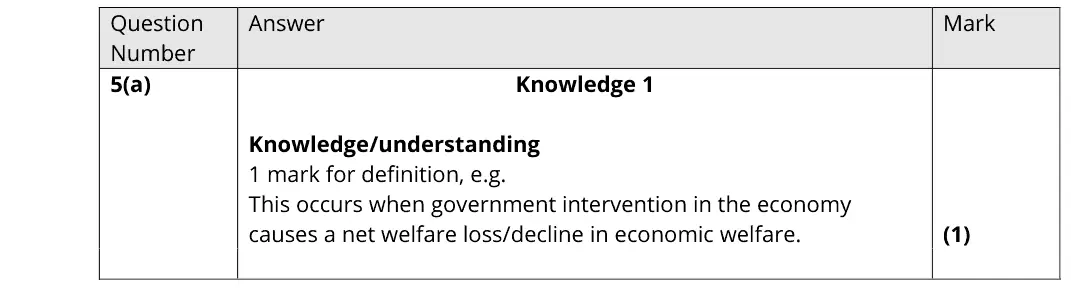
5(a) Government failure 1AO1=1Definition
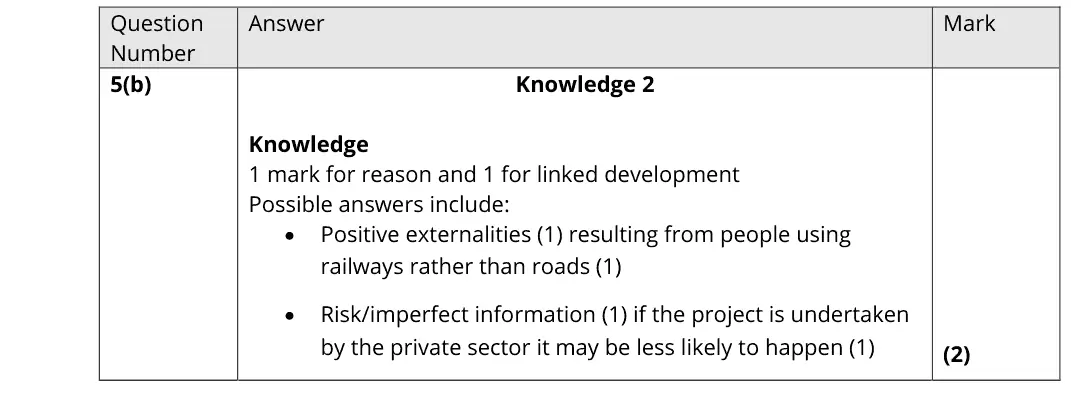
5(b) Market failure and externalities 2AO1=2Short answer
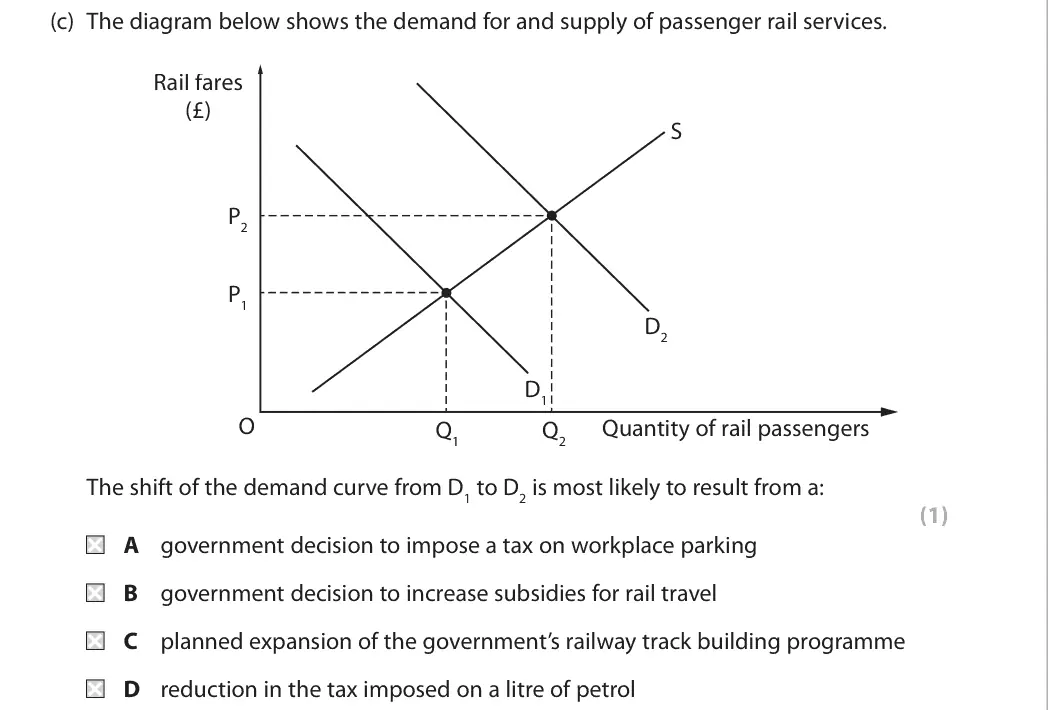
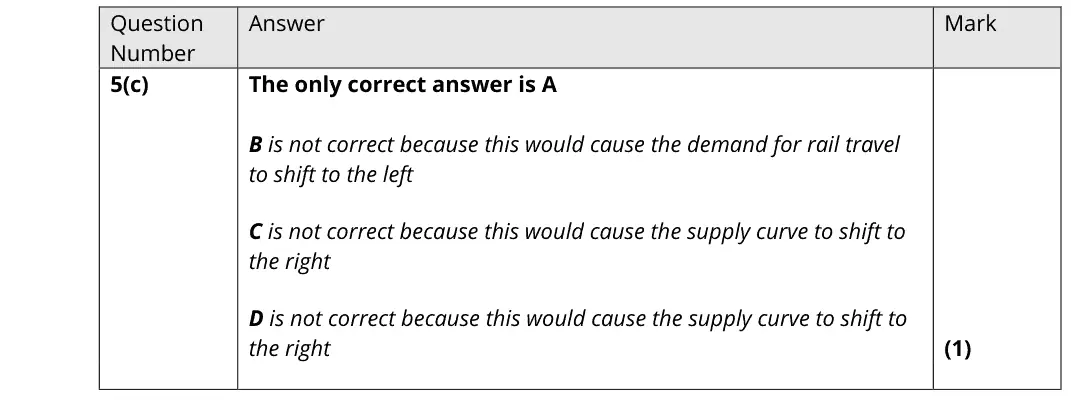
5(c) Supply, demand and price determination 1Multiple choice
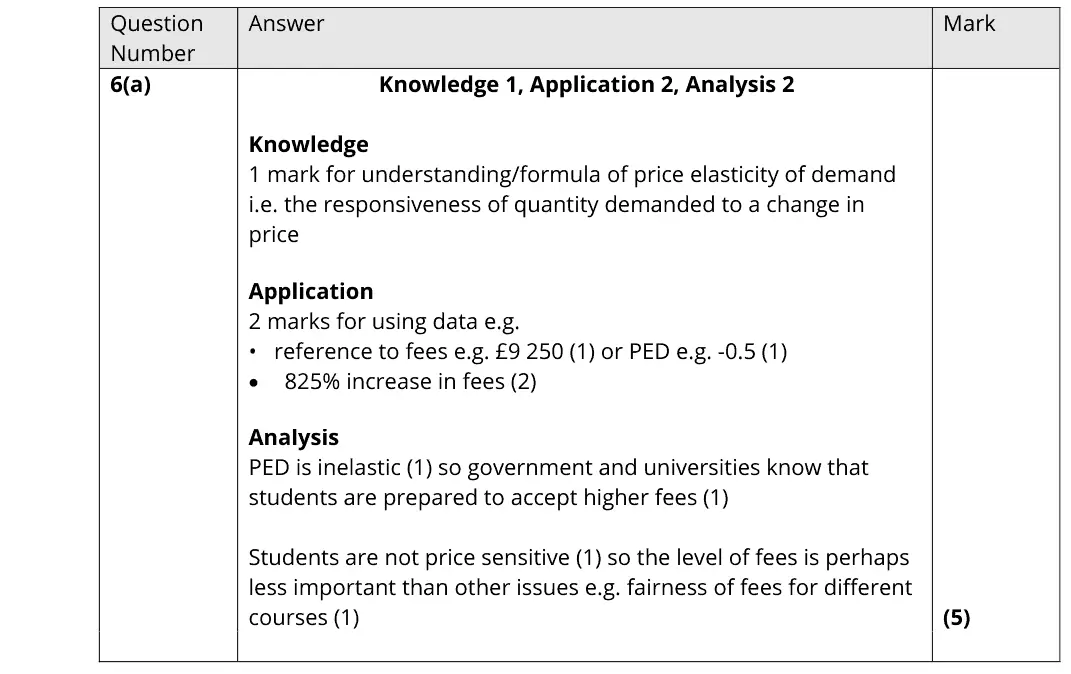
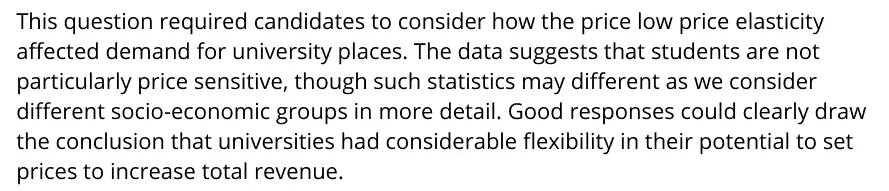
6(a) Price, income and cross elasticities of demand 5AO1=1,AO2=2,AO3=2Short answer
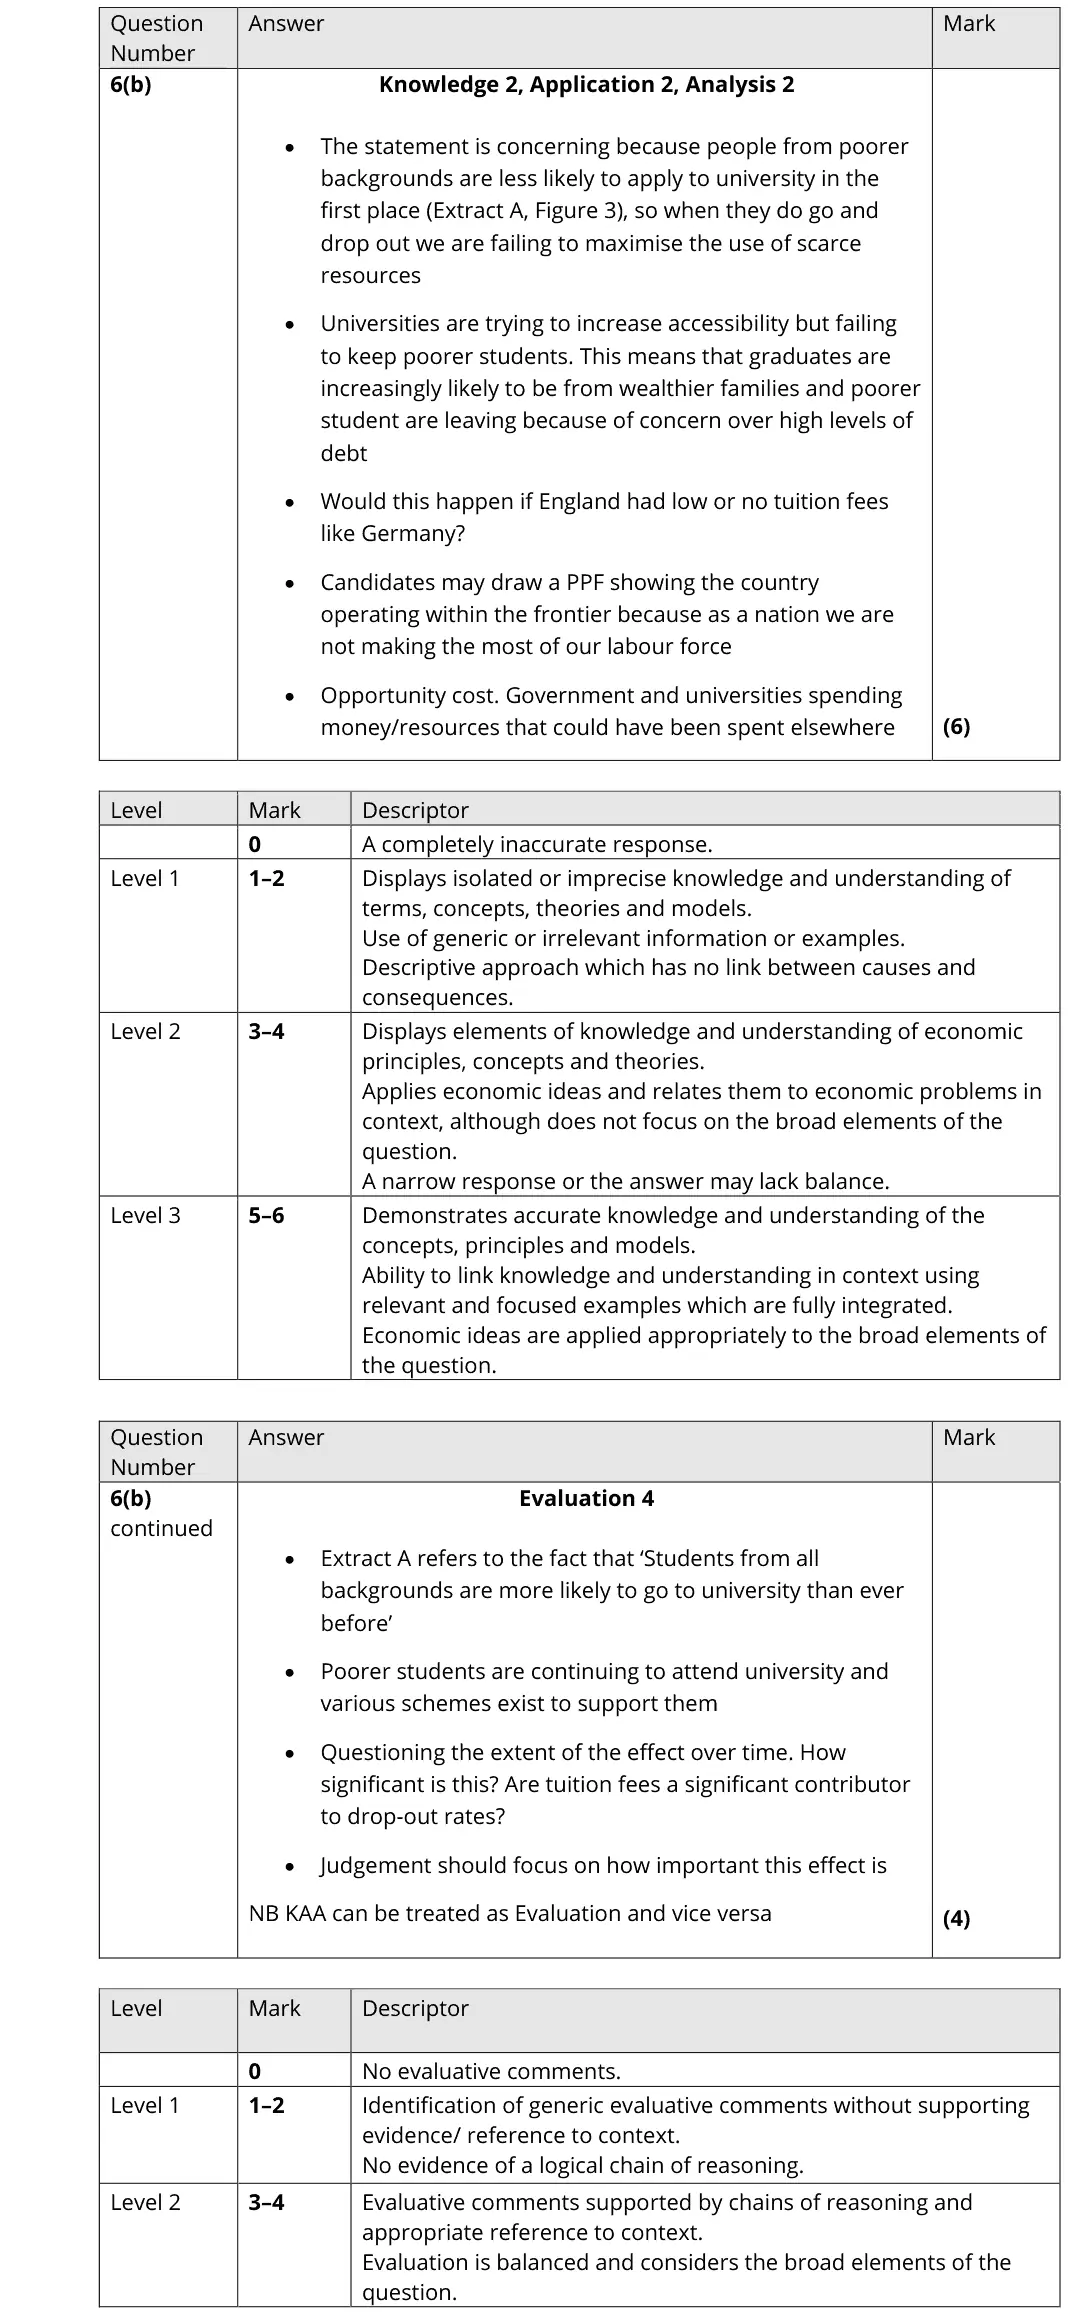
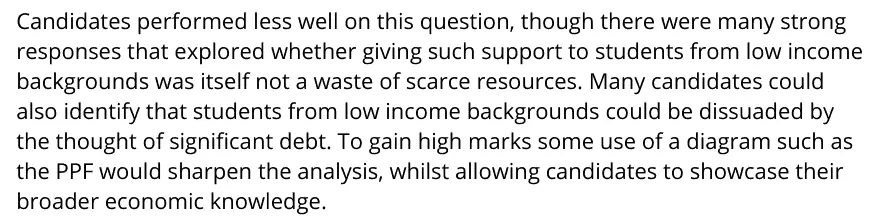
6(b) The nature of economics and the economic problem, Production possibility frontiers 10AO1=2,AO2=2,AO3=2,AO4=4Extended response
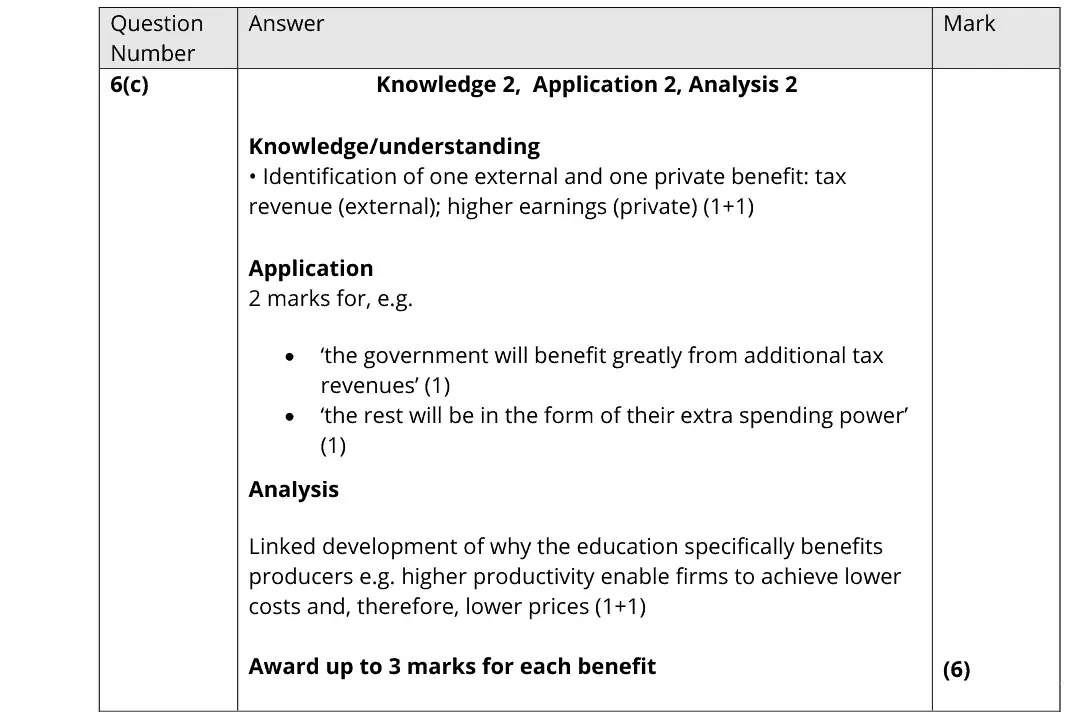
6(c) Market failure and externalities 6AO1=2,AO2=2,AO3=2Short answer
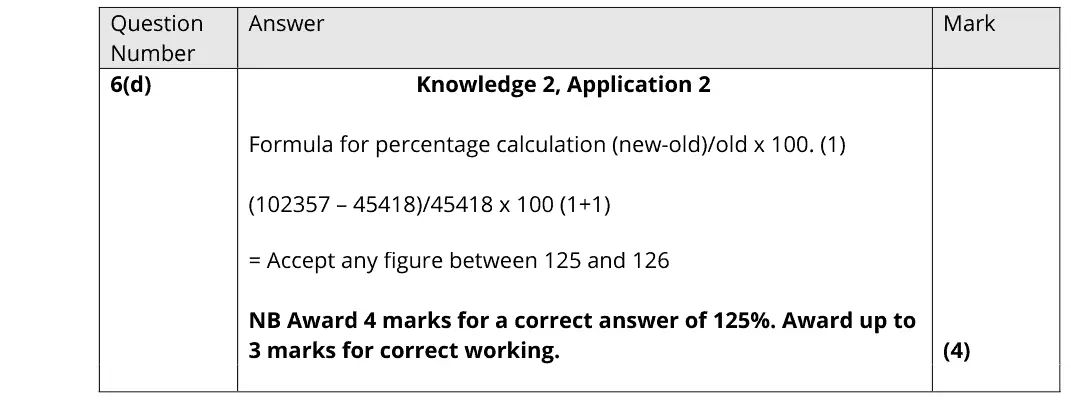
6(d) Government intervention in markets 4AO1=2,AO2=2Calculation
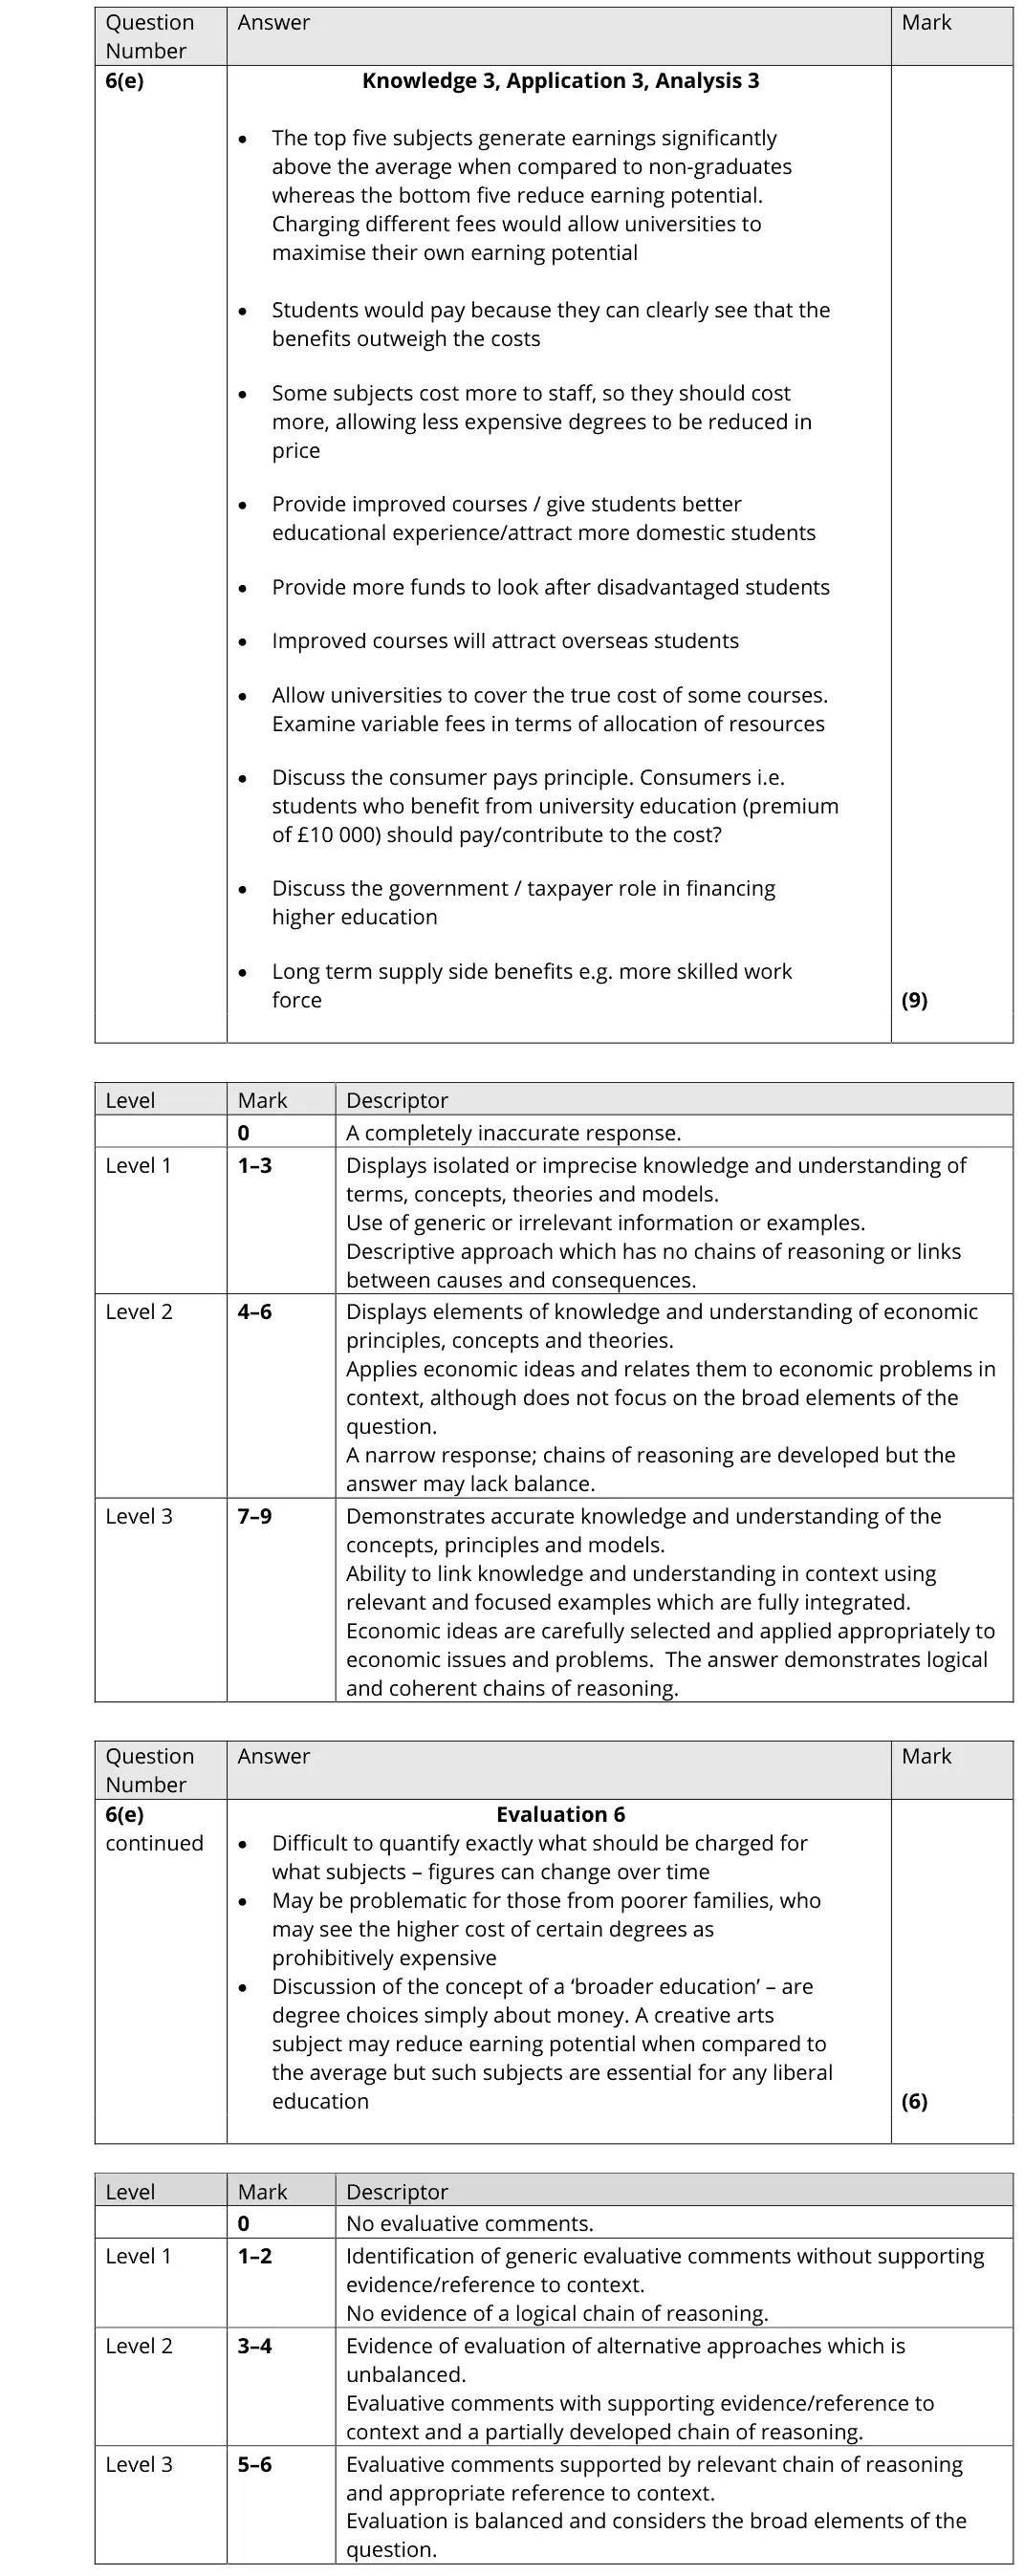
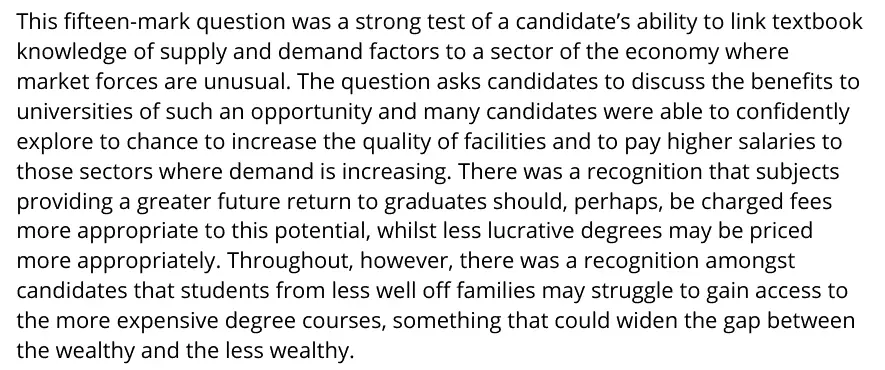
6(e) The price mechanism, consumer and producer surplus 15AO1=3,AO2=3,AO3=3,AO4=6Extended response
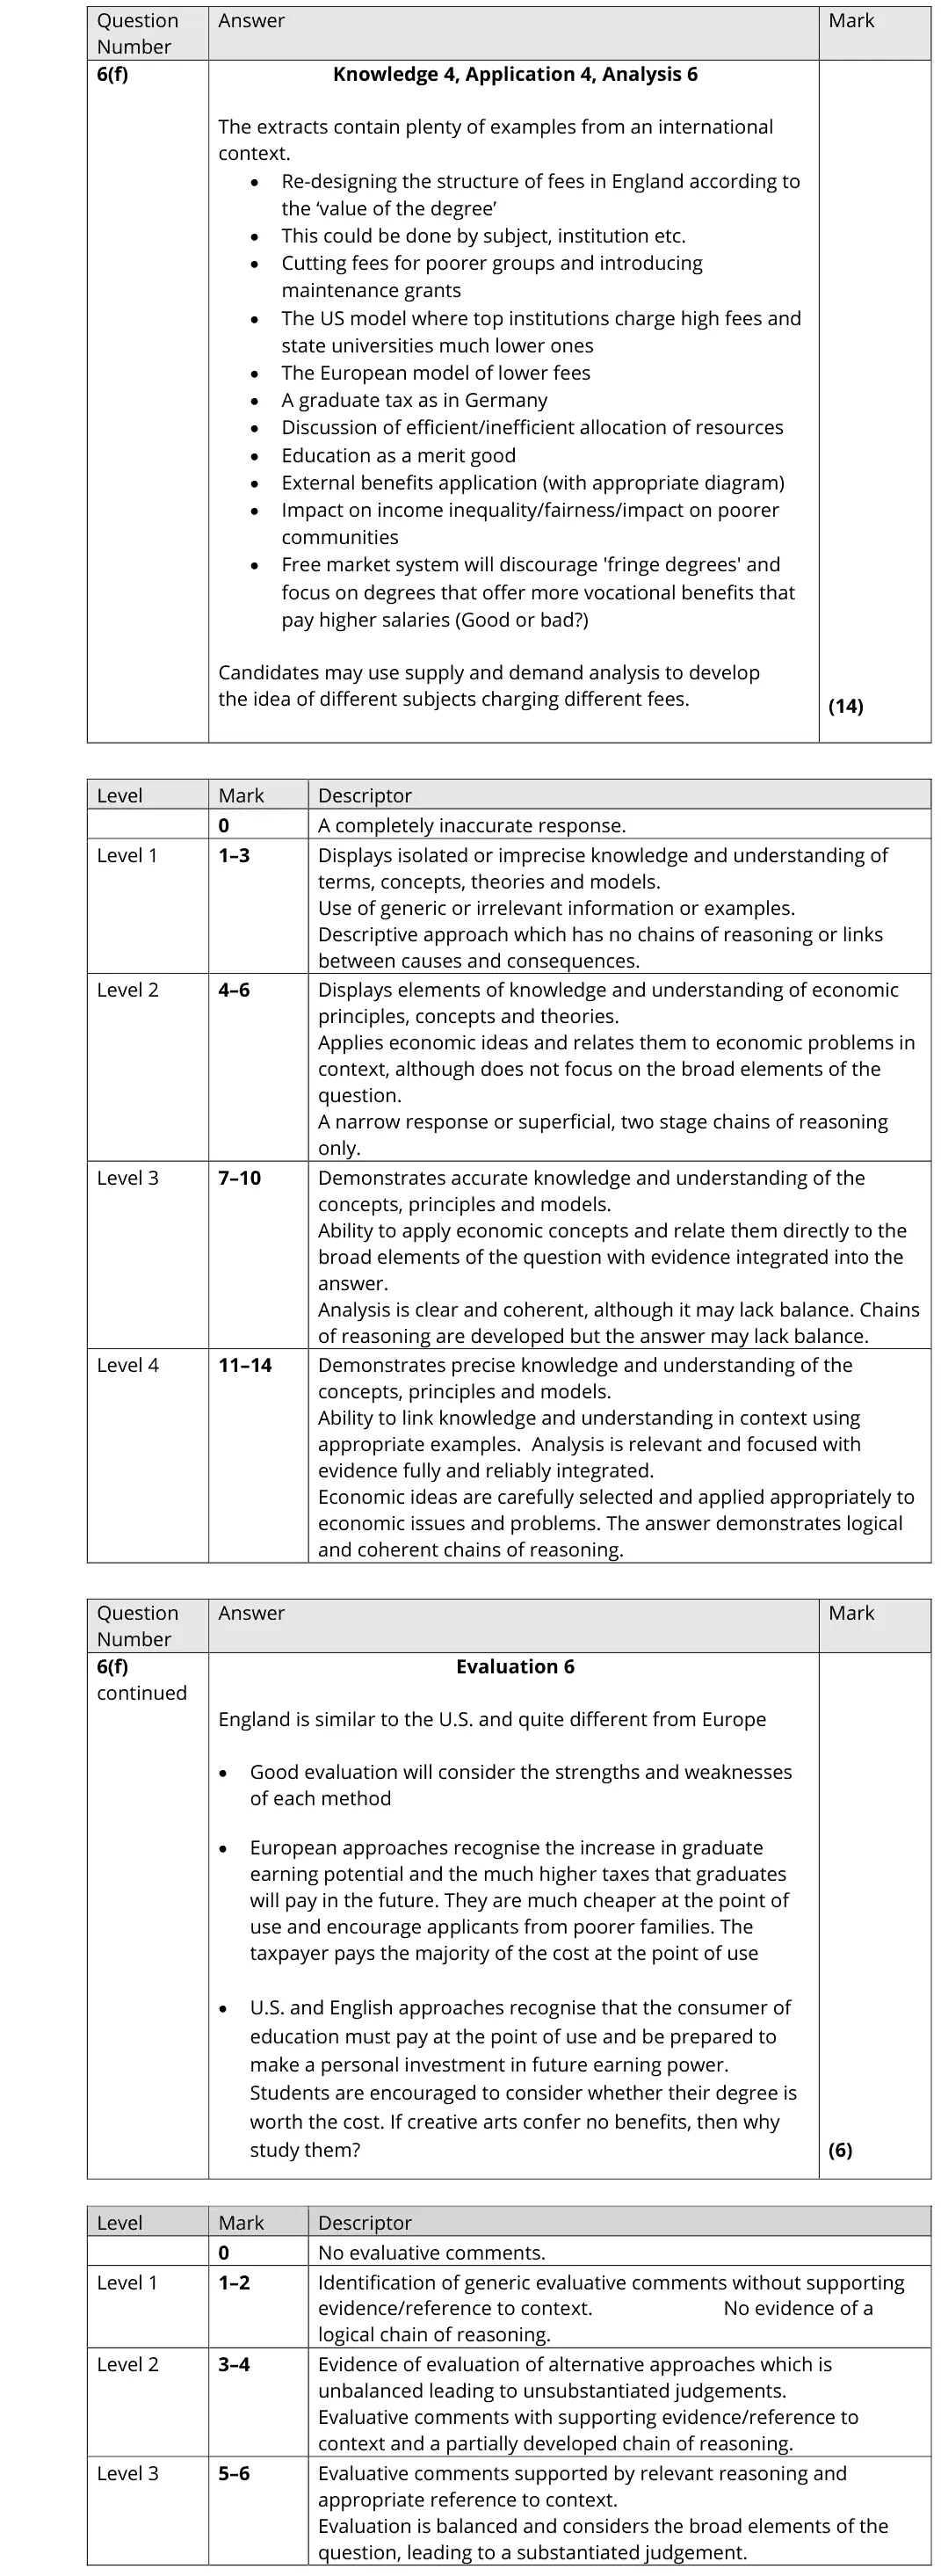
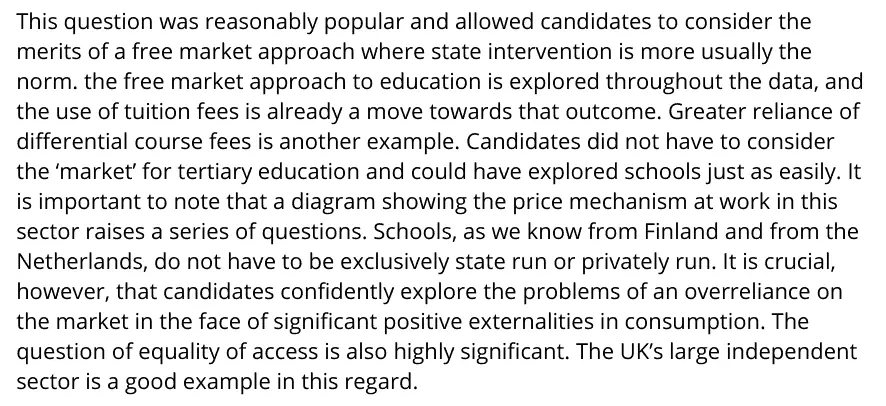
6(f) Free market, mixed and command economies, The price mechanism, consumer and producer surplus 20AO1=4,AO2=4,AO3=6,AO4=6Essay
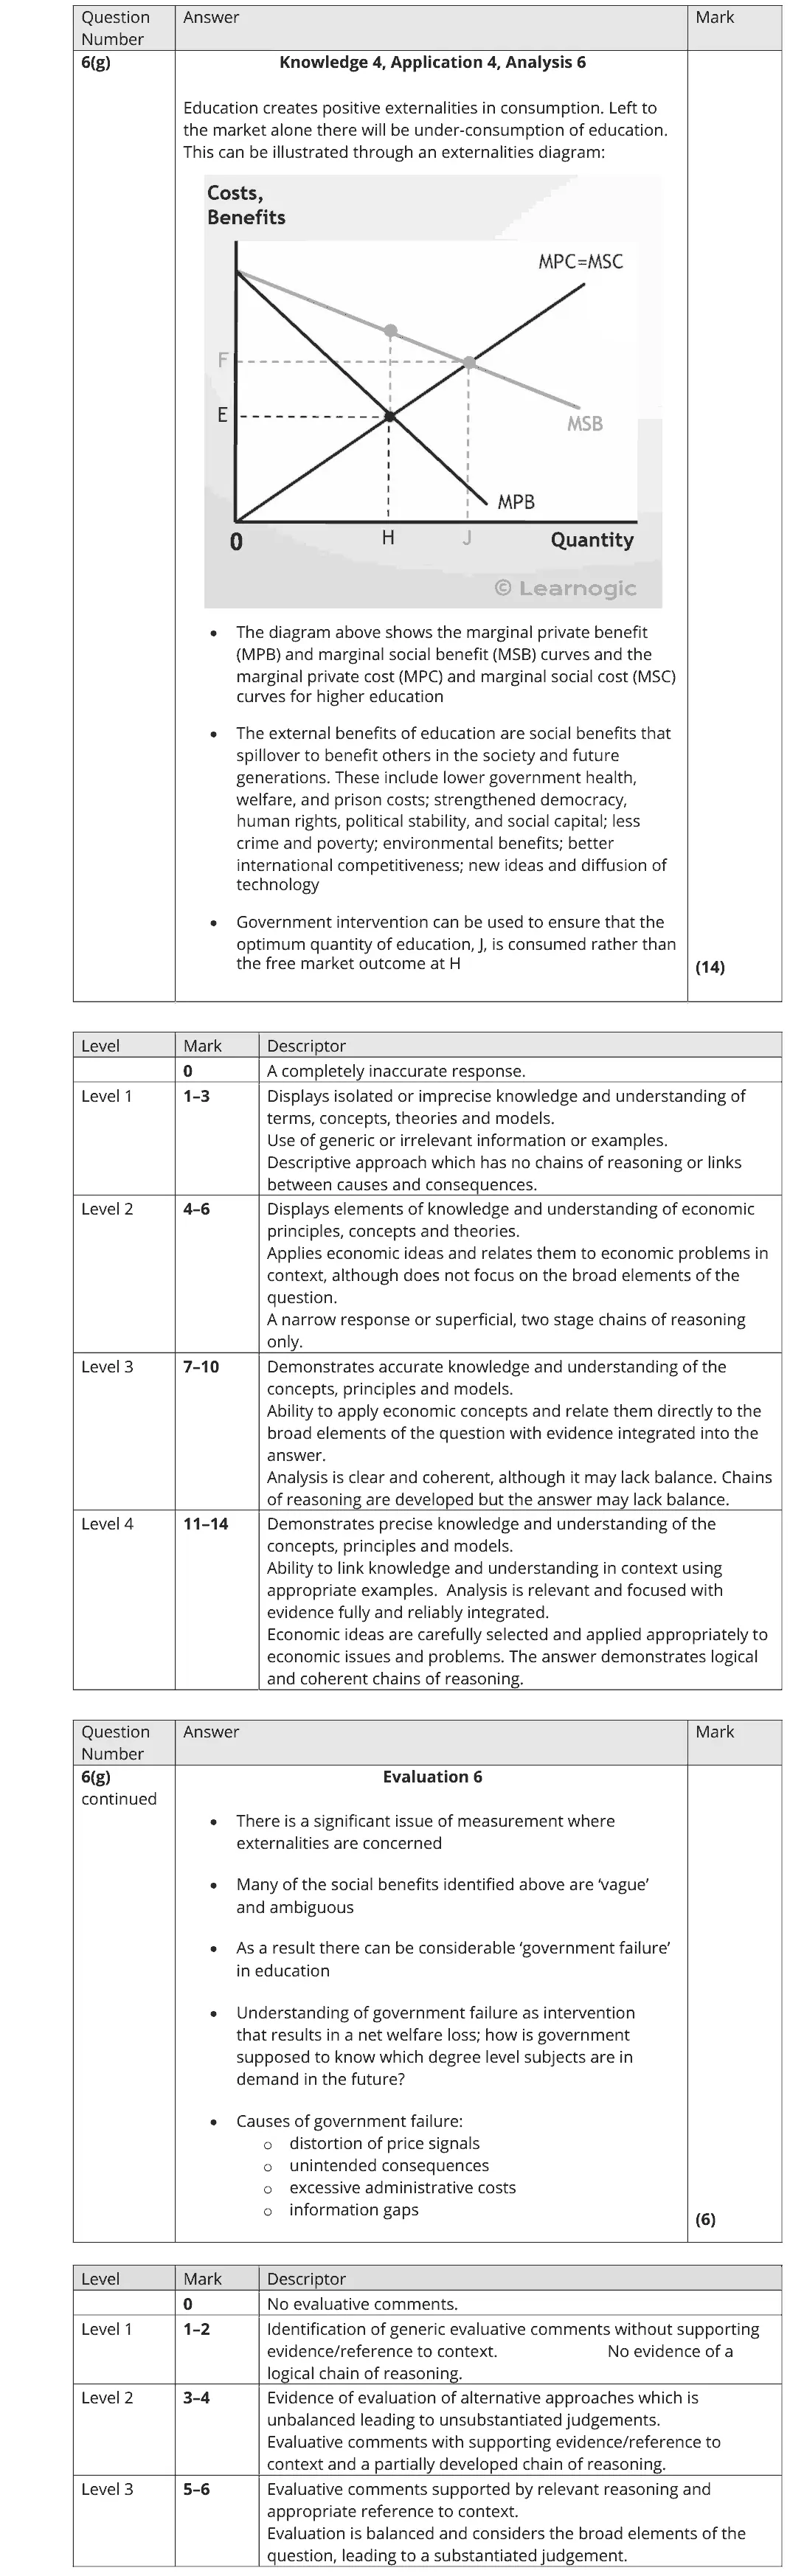
6(g) Market failure and externalities, Government intervention in markets 20AO1=4,AO2=4,AO3=6,AO4=6Essay

The questions

1(a)1(b)1(c)2(a)2(b)3(a)3(b)4(a)4(b)5(a)5(b)5(c)6(a)6(b)6(c)6(d)6(e)6(f)6(g)
October 2020 · AS Paper 1 · Q1(a) 1 mark AO1=1 Definition economic systems
(a) Define the term ‘free market economy’. (1)
October 2020 · AS Paper 1 · Q1(b) 1 mark Multiple choice price mechanism and surplus
(b) Which one of the following is the best example of the rationing function of the price mechanism? (1) A An increase in demand, leading to a rise in price, will encourage new firms to enter the market B Changes in price provide information to both producers and consumers C If a product is scarce, a rise in price is likely to make the shortage worse D When there is a shortage of a product, the price will rise and discourage some consumers from buying the product
October 2020 · AS Paper 1 · Q1(c) 2 marks AO1=2 Short answer economic systems
(c) Explain one advantage of a free market economy compared to a command economy. (2)
October 2020 · AS Paper 1 · Q2(a) 1 mark Multiple choice price elasticity of demand
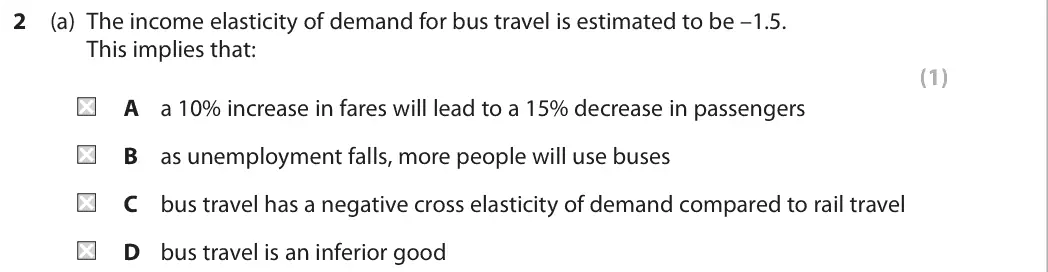
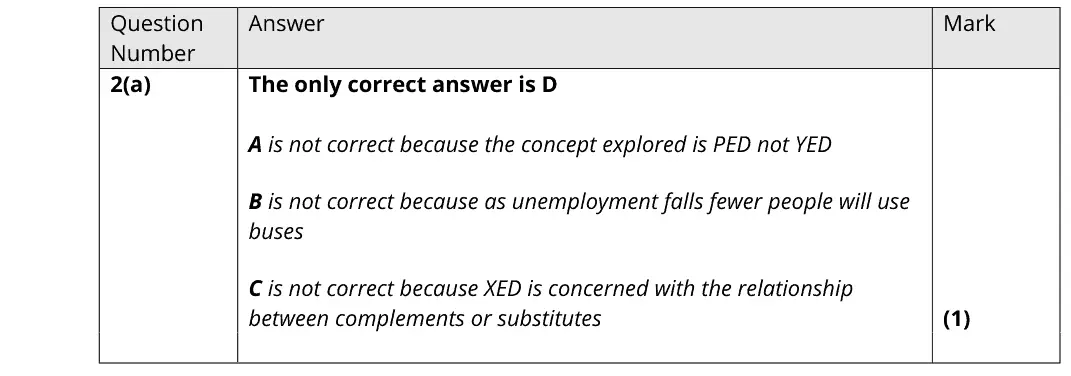
(a) The income elasticity of demand for bus travel is estimated to be –1.5. This implies that: (1) A a 10% increase in fares will lead to a 15% decrease in passengers B as unemployment falls, more people will use buses C bus travel has a negative cross elasticity of demand compared to rail travel D bus travel is an inferior good
October 2020 · AS Paper 1 · Q2(b) 3 marks AO1=1, AO2=1, AO3=1 Short answer price elasticity of demand
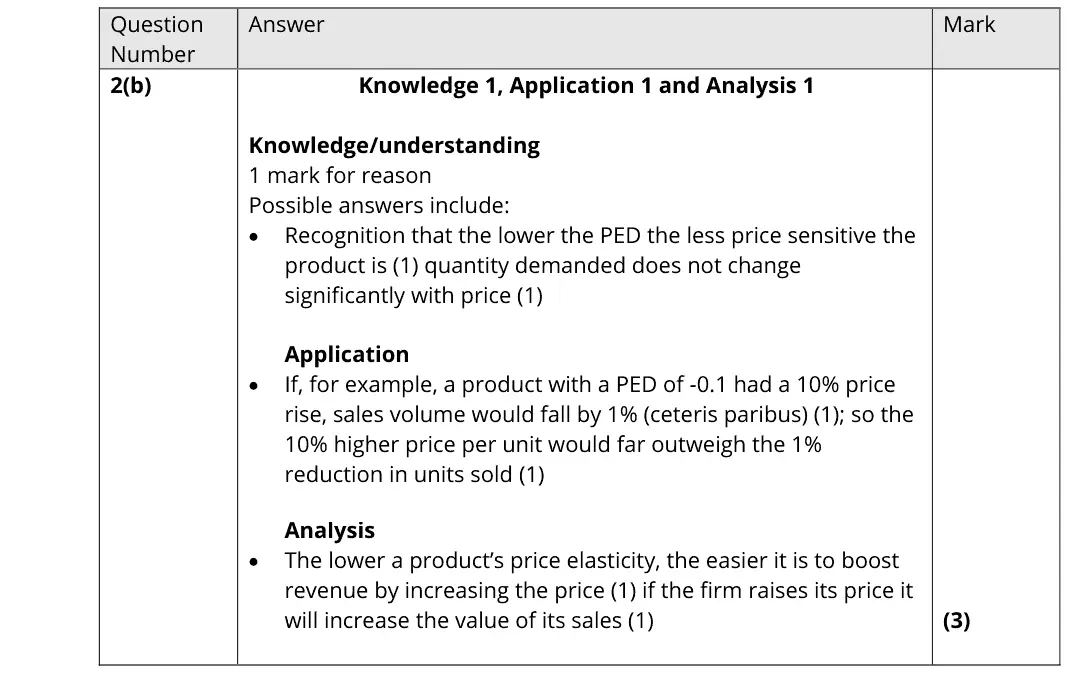
(b) Explain why a firm might try to reduce the price elasticity of demand for its products. (3)
October 2020 · AS Paper 1 · Q3(a) 1 mark Multiple choice indirect taxes and subsidies
Data and extracts for question 33 The ‘Energy Company Obligation’ is the government’s term for its programme to make houses in the UK more energy efficient.
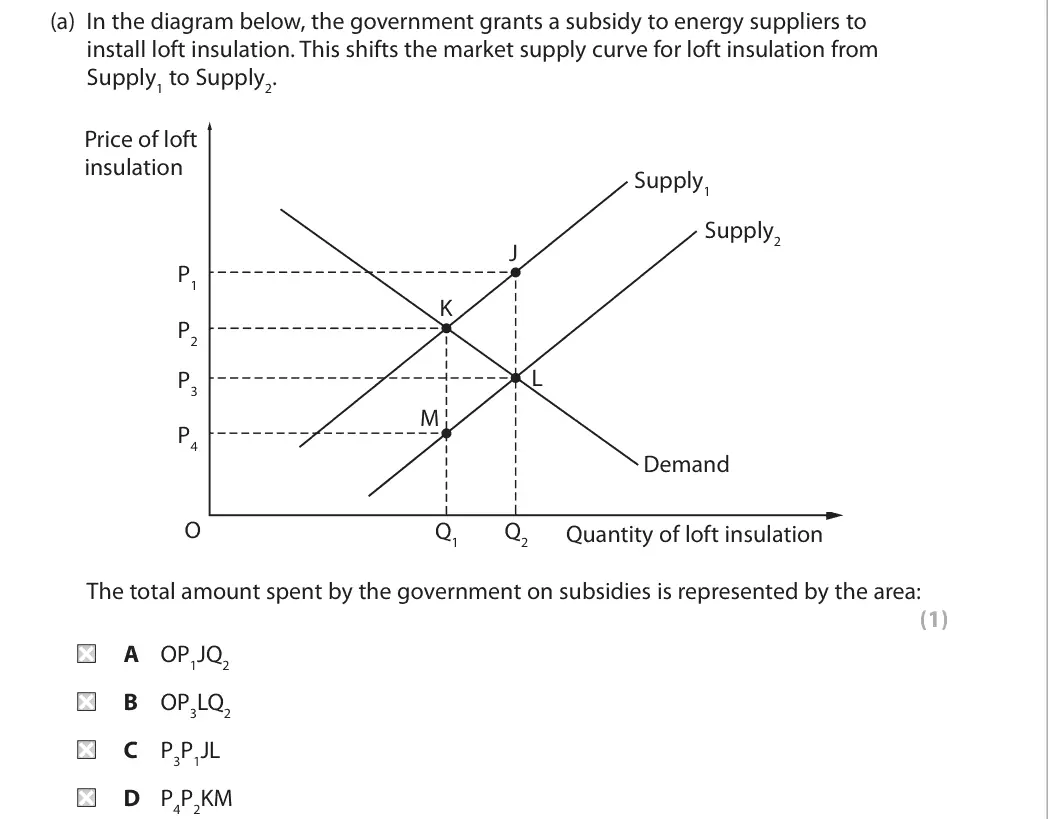
(a) In the diagram below, the government grants a subsidy to energy suppliers to install loft insulation. This shifts the market supply curve for loft insulation from Supply1 to Supply2. Price of loft insulation Supply1 Supply2 J P1 K P2 L P3 M P4 Demand O Q1 Q2 Quantity of loft insulation The total amount spent by the government on subsidies is represented by the area: (1) A OP1JQ2 B OP3LQ2 C P3P1JL D P4P2KM
October 2020 · AS Paper 1 · Q3(b) 3 marks AO1=1, AO2=1, AO3=1 Short answer nature of economics
Data and extracts for question 33 The ‘Energy Company Obligation’ is the government’s term for its programme to make houses in the UK more energy efficient.
(b) Explain an opportunity cost to the government of granting subsidies to energy suppliers to install loft insulation. (3)
October 2020 · AS Paper 1 · Q4(a) 1 mark Multiple choice indirect taxes and subsidies
Data and extracts for question 44 The UK Government uses a range of indirect taxes to affect the market prices and quantities of many goods and services.
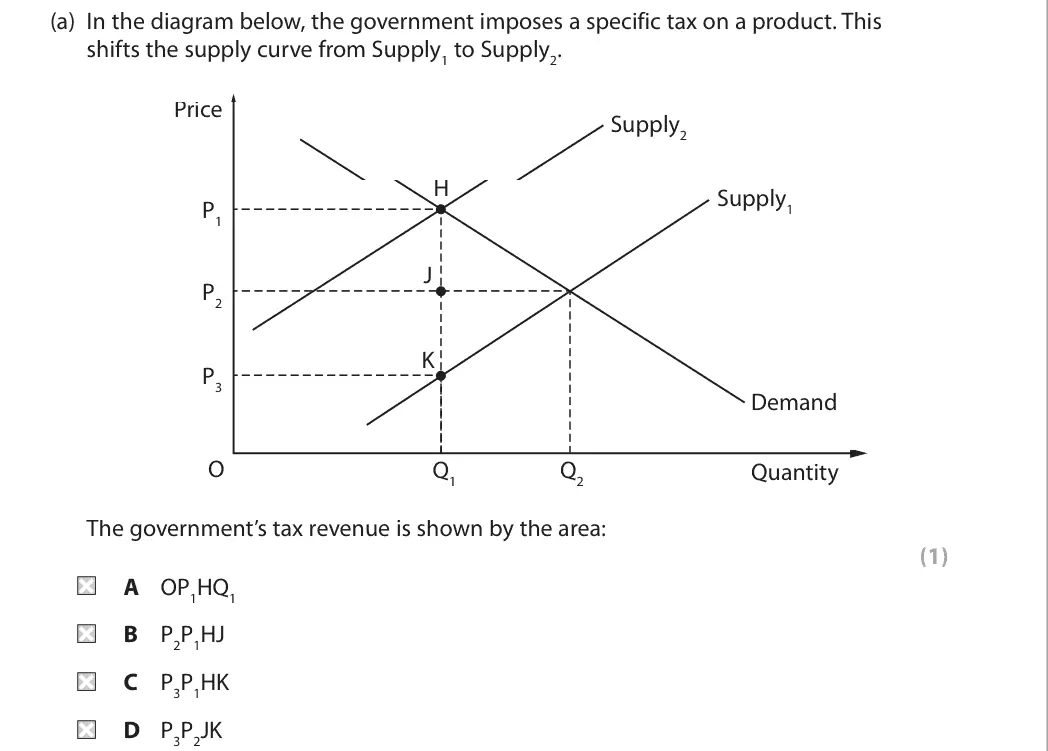
(a) In the diagram below, the government imposes a specific tax on a product. This shifts the supply curve from Supply1 to Supply2. Price Supply2 H Supply1 P1 J P2 K P3 Demand O Q1 Q2 Quantity The government’s tax revenue is shown by the area: (1) A OP1HQ1 B P2P1HJ C P3P1HK D P3P2JK
October 2020 · AS Paper 1 · Q4(b) 3 marks AO1=1, AO2=1, AO3=1 Short answer government intervention in marketsindirect taxes and subsidies
Data and extracts for question 44 The UK Government uses a range of indirect taxes to affect the market prices and quantities of many goods and services.
(b) Using an example, explain why the government imposes specific taxes on many goods and services. (3)
October 2020 · AS Paper 1 · Q5(a) 1 mark AO1=1 Definition government failure
Data and extracts for question 55 HS2 is a high-speed rail network linking the north and south of England. HS2 will be four years late and cost double the Department for Transport’s original estimate. (Source: https://www.transportxtra.com/publications/local-transport-today/news /58459/hs2-will-be-four-years-late-and-cost-double-the-dft-s-estimate-mps-told)
(a) Define the term ‘government failure’. (1)
October 2020 · AS Paper 1 · Q5(b) 2 marks AO1=2 Short answer externalities
Data and extracts for question 55 HS2 is a high-speed rail network linking the north and south of England. HS2 will be four years late and cost double the Department for Transport’s original estimate. (Source: https://www.transportxtra.com/publications/local-transport-today/news /58459/hs2-will-be-four-years-late-and-cost-double-the-dft-s-estimate-mps-told)
(b) Explain one likely microeconomic reason why the government is using taxpayers’ money to fund HS2. (2)
October 2020 · AS Paper 1 · Q5(c) 1 mark Multiple choice supply and demand
Data and extracts for question 55 HS2 is a high-speed rail network linking the north and south of England. HS2 will be four years late and cost double the Department for Transport’s original estimate. (Source: https://www.transportxtra.com/publications/local-transport-today/news /58459/hs2-will-be-four-years-late-and-cost-double-the-dft-s-estimate-mps-told)
(c) The diagram below shows the demand for and supply of passenger rail services. Rail fares (£) S P2 P1 D2 D1 O Quantity of rail passengers Q1 Q2 The shift of the demand curve from D1 to D2 is most likely to result from a: (1) A government decision to impose a tax on workplace parking B government decision to increase subsidies for rail travel C planned expansion of the government’s railway track building programme D reduction in the tax imposed on a litre of petrol
October 2020 · AS Paper 1 · Q6(a) 5 marks AO1=1, AO2=2, AO3=2 Short answer price elasticity of demand
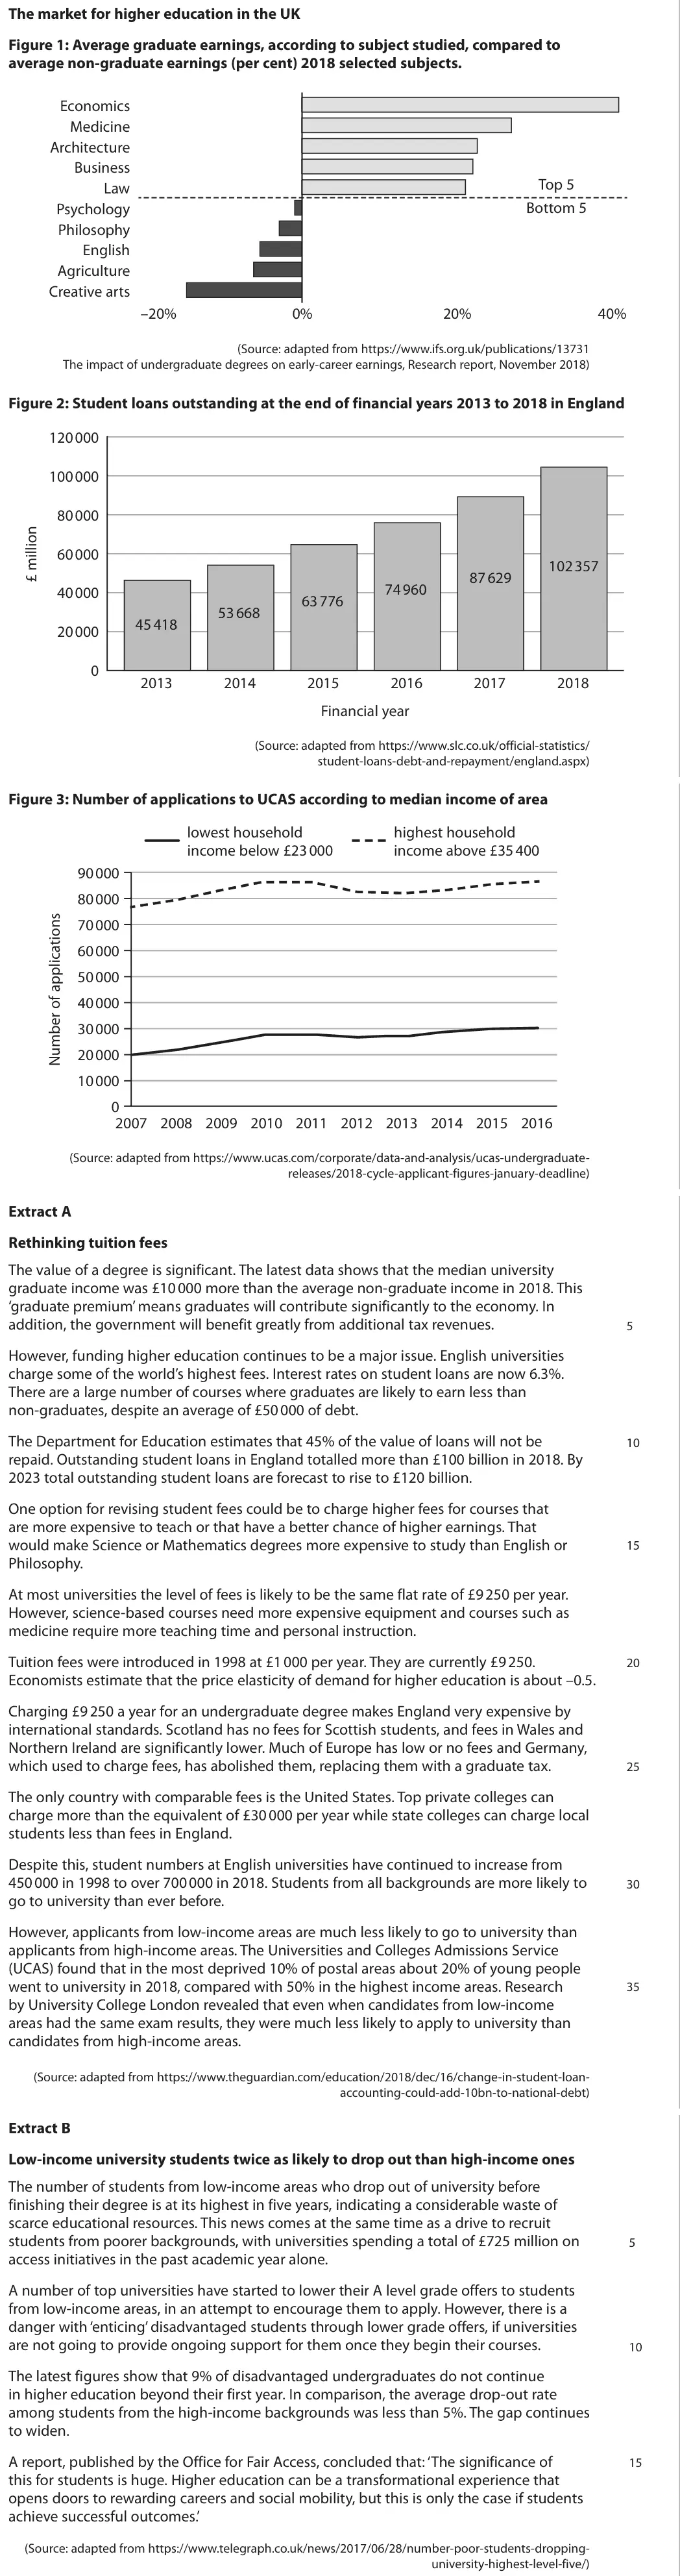
Data and extracts for question 6The market for higher education in the UK Figure 1: Average graduate earnings, according to subject studied, compared to average non-graduate earnings (per cent) 2018 selected subjects. Economics Medicine Architecture Business Top 5 Law Bottom 5 Psychology Philosophy English Agriculture Creative arts –20% 0% 20% 40% (Source: adapted from https://www.ifs.org.uk/publications/13731 The impact of undergraduate degrees on early-career earnings, Research report, November 2018) Figure 2: Student loans outstanding at the end of financial years 2013 to 2018 in England 120 000 100 000 80 000 60 000 102 357 87 629 74 960 40 000 63 776 53 668 45 418 20 000 0 2013 2014 2015 2016 2017 2018 Financial year (Source: adapted from https://www.slc.co.uk/official-statistics/ student-loans-debt-and-repayment/england.aspx) Figure 3: Number of applications to UCAS according to median income of area lowest household highest household income below £23 000 income above £35 400 90 000 80 000 70 000 60 000 50 000 40 000 30 000 20 000 10 000 0 2007 2008 2009 2010 2011 2012 2013 2014 2015 2016 (Source: adapted from https://www.ucas.com/corporate/data-and-analysis/ucas-undergraduate- releases/2018-cycle-applicant-figures-january-deadline) Extract A Rethinking tuition fees The value of a degree is significant. The latest data shows that the median university graduate income was £10 000 more than the average non-graduate income in 2018. This ‘graduate premium’ means graduates will contribute significantly to the economy. In addition, the government will benefit greatly from additional tax revenues. 5 However, funding higher education continues to be a major issue. English universities charge some of the world’s highest fees. Interest rates on student loans are now 6.3%. There are a large number of courses where graduates are likely to earn less than non-graduates, despite an average of £50 000 of debt. The Department for Education estimates that 45% of the value of loans will not be 10 repaid. Outstanding student loans in England totalled more than £100 billion in 2018. By 2023 total outstanding student loans are forecast to rise to £120 billion. One option for revising student fees could be to charge higher fees for courses that are more expensive to teach or that have a better chance of higher earnings. That would make Science or Mathematics degrees more expensive to study than English or 15 Philosophy. At most universities the level of fees is likely to be the same flat rate of £9 250 per year. However, science-based courses need more expensive equipment and courses such as medicine require more teaching time and personal instruction. Tuition fees were introduced in 1998 at £1 000 per year. They are currently £9 250. 20 Economists estimate that the price elasticity of demand for higher education is about –0.5. Charging £9 250 a year for an undergraduate degree makes England very expensive by international standards. Scotland has no fees for Scottish students, and fees in Wales and Northern Ireland are significantly lower. Much of Europe has low or no fees and Germany, which used to charge fees, has abolished them, replacing them with a graduate tax. 25 The only country with comparable fees is the United States. Top private colleges can charge more than the equivalent of £30 000 per year while state colleges can charge local students less than fees in England. Despite this, student numbers at English universities have continued to increase from 450 000 in 1998 to over 700 000 in 2018. Students from all backgrounds are more likely to 30 go to university than ever before. However, applicants from low-income areas are much less likely to go to university than applicants from high-income areas. The Universities and Colleges Admissions Service (UCAS) found that in the most deprived 10% of postal areas about 20% of young people went to university in 2018, compared with 50% in the highest income areas. Research 35 by University College London revealed that even when candidates from low-income areas had the same exam results, they were much less likely to apply to university than candidates from high-income areas. (Source: adapted from https://www.theguardian.com/education/2018/dec/16/change-in-student-loan- accounting-could-add-10bn-to-national-debt) Extract B Low-income university students twice as likely to drop out than high-income ones The number of students from low-income areas who drop out of university before finishing their degree is at its highest in five years, indicating a considerable waste of scarce educational resources. This news comes at the same time as a drive to recruit students from poorer backgrounds, with universities spending a total of £725 million on 5 access initiatives in the past academic year alone. A number of top universities have started to lower their A level grade offers to students from low-income areas, in an attempt to encourage them to apply. However, there is a danger with ‘enticing’ disadvantaged students through lower grade offers, if universities are not going to provide ongoing support for them once they begin their courses. 10 The latest figures show that 9% of disadvantaged undergraduates do not continue in higher education beyond their first year. In comparison, the average drop-out rate among students from the high-income backgrounds was less than 5%. The gap continues to widen. A report, published by the Office for Fair Access, concluded that: ‘The significance of 15 this for students is huge. Higher education can be a transformational experience that opens doors to rewarding careers and social mobility, but this is only the case if students achieve successful outcomes.’ (Source: adapted from https://www.telegraph.co.uk/news/2017/06/28/number-poor-students-dropping- university-highest-level-five/)
(a) Explain why ‘the price elasticity of demand for higher education is about –0.5’ may be of relevance to English universities. Refer to Extract A in your answer. (5)
October 2020 · AS Paper 1 · Q6(b) 10 marks AO1=2, AO2=2, AO3=2, AO4=4 10-mark response nature of economicsproduction possibility frontiers
Data and extracts for question 6The market for higher education in the UK Figure 1: Average graduate earnings, according to subject studied, compared to average non-graduate earnings (per cent) 2018 selected subjects. Economics Medicine Architecture Business Top 5 Law Bottom 5 Psychology Philosophy English Agriculture Creative arts –20% 0% 20% 40% (Source: adapted from https://www.ifs.org.uk/publications/13731 The impact of undergraduate degrees on early-career earnings, Research report, November 2018) Figure 2: Student loans outstanding at the end of financial years 2013 to 2018 in England 120 000 100 000 80 000 60 000 102 357 87 629 74 960 40 000 63 776 53 668 45 418 20 000 0 2013 2014 2015 2016 2017 2018 Financial year (Source: adapted from https://www.slc.co.uk/official-statistics/ student-loans-debt-and-repayment/england.aspx) Figure 3: Number of applications to UCAS according to median income of area lowest household highest household income below £23 000 income above £35 400 90 000 80 000 70 000 60 000 50 000 40 000 30 000 20 000 10 000 0 2007 2008 2009 2010 2011 2012 2013 2014 2015 2016 (Source: adapted from https://www.ucas.com/corporate/data-and-analysis/ucas-undergraduate- releases/2018-cycle-applicant-figures-january-deadline) Extract A Rethinking tuition fees The value of a degree is significant. The latest data shows that the median university graduate income was £10 000 more than the average non-graduate income in 2018. This ‘graduate premium’ means graduates will contribute significantly to the economy. In addition, the government will benefit greatly from additional tax revenues. 5 However, funding higher education continues to be a major issue. English universities charge some of the world’s highest fees. Interest rates on student loans are now 6.3%. There are a large number of courses where graduates are likely to earn less than non-graduates, despite an average of £50 000 of debt. The Department for Education estimates that 45% of the value of loans will not be 10 repaid. Outstanding student loans in England totalled more than £100 billion in 2018. By 2023 total outstanding student loans are forecast to rise to £120 billion. One option for revising student fees could be to charge higher fees for courses that are more expensive to teach or that have a better chance of higher earnings. That would make Science or Mathematics degrees more expensive to study than English or 15 Philosophy. At most universities the level of fees is likely to be the same flat rate of £9 250 per year. However, science-based courses need more expensive equipment and courses such as medicine require more teaching time and personal instruction. Tuition fees were introduced in 1998 at £1 000 per year. They are currently £9 250. 20 Economists estimate that the price elasticity of demand for higher education is about –0.5. Charging £9 250 a year for an undergraduate degree makes England very expensive by international standards. Scotland has no fees for Scottish students, and fees in Wales and Northern Ireland are significantly lower. Much of Europe has low or no fees and Germany, which used to charge fees, has abolished them, replacing them with a graduate tax. 25 The only country with comparable fees is the United States. Top private colleges can charge more than the equivalent of £30 000 per year while state colleges can charge local students less than fees in England. Despite this, student numbers at English universities have continued to increase from 450 000 in 1998 to over 700 000 in 2018. Students from all backgrounds are more likely to 30 go to university than ever before. However, applicants from low-income areas are much less likely to go to university than applicants from high-income areas. The Universities and Colleges Admissions Service (UCAS) found that in the most deprived 10% of postal areas about 20% of young people went to university in 2018, compared with 50% in the highest income areas. Research 35 by University College London revealed that even when candidates from low-income areas had the same exam results, they were much less likely to apply to university than candidates from high-income areas. (Source: adapted from https://www.theguardian.com/education/2018/dec/16/change-in-student-loan- accounting-could-add-10bn-to-national-debt) Extract B Low-income university students twice as likely to drop out than high-income ones The number of students from low-income areas who drop out of university before finishing their degree is at its highest in five years, indicating a considerable waste of scarce educational resources. This news comes at the same time as a drive to recruit students from poorer backgrounds, with universities spending a total of £725 million on 5 access initiatives in the past academic year alone. A number of top universities have started to lower their A level grade offers to students from low-income areas, in an attempt to encourage them to apply. However, there is a danger with ‘enticing’ disadvantaged students through lower grade offers, if universities are not going to provide ongoing support for them once they begin their courses. 10 The latest figures show that 9% of disadvantaged undergraduates do not continue in higher education beyond their first year. In comparison, the average drop-out rate among students from the high-income backgrounds was less than 5%. The gap continues to widen. A report, published by the Office for Fair Access, concluded that: ‘The significance of 15 this for students is huge. Higher education can be a transformational experience that opens doors to rewarding careers and social mobility, but this is only the case if students achieve successful outcomes.’ (Source: adapted from https://www.telegraph.co.uk/news/2017/06/28/number-poor-students-dropping- university-highest-level-five/)
According to Extract B, the drop-out rate of students from low-income households is much higher than that of high-income households. (b) Assess the likely impact of these drop-out rates on the allocation of resources within an economy. (10)
October 2020 · AS Paper 1 · Q6(c) 6 marks AO1=2, AO2=2, AO3=2 Short answer externalities
Data and extracts for question 6The market for higher education in the UK Figure 1: Average graduate earnings, according to subject studied, compared to average non-graduate earnings (per cent) 2018 selected subjects. Economics Medicine Architecture Business Top 5 Law Bottom 5 Psychology Philosophy English Agriculture Creative arts –20% 0% 20% 40% (Source: adapted from https://www.ifs.org.uk/publications/13731 The impact of undergraduate degrees on early-career earnings, Research report, November 2018) Figure 2: Student loans outstanding at the end of financial years 2013 to 2018 in England 120 000 100 000 80 000 60 000 102 357 87 629 74 960 40 000 63 776 53 668 45 418 20 000 0 2013 2014 2015 2016 2017 2018 Financial year (Source: adapted from https://www.slc.co.uk/official-statistics/ student-loans-debt-and-repayment/england.aspx) Figure 3: Number of applications to UCAS according to median income of area lowest household highest household income below £23 000 income above £35 400 90 000 80 000 70 000 60 000 50 000 40 000 30 000 20 000 10 000 0 2007 2008 2009 2010 2011 2012 2013 2014 2015 2016 (Source: adapted from https://www.ucas.com/corporate/data-and-analysis/ucas-undergraduate- releases/2018-cycle-applicant-figures-january-deadline) Extract A Rethinking tuition fees The value of a degree is significant. The latest data shows that the median university graduate income was £10 000 more than the average non-graduate income in 2018. This ‘graduate premium’ means graduates will contribute significantly to the economy. In addition, the government will benefit greatly from additional tax revenues. 5 However, funding higher education continues to be a major issue. English universities charge some of the world’s highest fees. Interest rates on student loans are now 6.3%. There are a large number of courses where graduates are likely to earn less than non-graduates, despite an average of £50 000 of debt. The Department for Education estimates that 45% of the value of loans will not be 10 repaid. Outstanding student loans in England totalled more than £100 billion in 2018. By 2023 total outstanding student loans are forecast to rise to £120 billion. One option for revising student fees could be to charge higher fees for courses that are more expensive to teach or that have a better chance of higher earnings. That would make Science or Mathematics degrees more expensive to study than English or 15 Philosophy. At most universities the level of fees is likely to be the same flat rate of £9 250 per year. However, science-based courses need more expensive equipment and courses such as medicine require more teaching time and personal instruction. Tuition fees were introduced in 1998 at £1 000 per year. They are currently £9 250. 20 Economists estimate that the price elasticity of demand for higher education is about –0.5. Charging £9 250 a year for an undergraduate degree makes England very expensive by international standards. Scotland has no fees for Scottish students, and fees in Wales and Northern Ireland are significantly lower. Much of Europe has low or no fees and Germany, which used to charge fees, has abolished them, replacing them with a graduate tax. 25 The only country with comparable fees is the United States. Top private colleges can charge more than the equivalent of £30 000 per year while state colleges can charge local students less than fees in England. Despite this, student numbers at English universities have continued to increase from 450 000 in 1998 to over 700 000 in 2018. Students from all backgrounds are more likely to 30 go to university than ever before. However, applicants from low-income areas are much less likely to go to university than applicants from high-income areas. The Universities and Colleges Admissions Service (UCAS) found that in the most deprived 10% of postal areas about 20% of young people went to university in 2018, compared with 50% in the highest income areas. Research 35 by University College London revealed that even when candidates from low-income areas had the same exam results, they were much less likely to apply to university than candidates from high-income areas. (Source: adapted from https://www.theguardian.com/education/2018/dec/16/change-in-student-loan- accounting-could-add-10bn-to-national-debt) Extract B Low-income university students twice as likely to drop out than high-income ones The number of students from low-income areas who drop out of university before finishing their degree is at its highest in five years, indicating a considerable waste of scarce educational resources. This news comes at the same time as a drive to recruit students from poorer backgrounds, with universities spending a total of £725 million on 5 access initiatives in the past academic year alone. A number of top universities have started to lower their A level grade offers to students from low-income areas, in an attempt to encourage them to apply. However, there is a danger with ‘enticing’ disadvantaged students through lower grade offers, if universities are not going to provide ongoing support for them once they begin their courses. 10 The latest figures show that 9% of disadvantaged undergraduates do not continue in higher education beyond their first year. In comparison, the average drop-out rate among students from the high-income backgrounds was less than 5%. The gap continues to widen. A report, published by the Office for Fair Access, concluded that: ‘The significance of 15 this for students is huge. Higher education can be a transformational experience that opens doors to rewarding careers and social mobility, but this is only the case if students achieve successful outcomes.’ (Source: adapted from https://www.telegraph.co.uk/news/2017/06/28/number-poor-students-dropping- university-highest-level-five/)
(c) With reference to Extract A, explain one likely private benefit to students and one likely external benefit of higher education. (6)
October 2020 · AS Paper 1 · Q6(d) 4 marks AO1=2, AO2=2 Calculation government intervention in markets
Data and extracts for question 6The market for higher education in the UK Figure 1: Average graduate earnings, according to subject studied, compared to average non-graduate earnings (per cent) 2018 selected subjects. Economics Medicine Architecture Business Top 5 Law Bottom 5 Psychology Philosophy English Agriculture Creative arts –20% 0% 20% 40% (Source: adapted from https://www.ifs.org.uk/publications/13731 The impact of undergraduate degrees on early-career earnings, Research report, November 2018) Figure 2: Student loans outstanding at the end of financial years 2013 to 2018 in England 120 000 100 000 80 000 60 000 102 357 87 629 74 960 40 000 63 776 53 668 45 418 20 000 0 2013 2014 2015 2016 2017 2018 Financial year (Source: adapted from https://www.slc.co.uk/official-statistics/ student-loans-debt-and-repayment/england.aspx) Figure 3: Number of applications to UCAS according to median income of area lowest household highest household income below £23 000 income above £35 400 90 000 80 000 70 000 60 000 50 000 40 000 30 000 20 000 10 000 0 2007 2008 2009 2010 2011 2012 2013 2014 2015 2016 (Source: adapted from https://www.ucas.com/corporate/data-and-analysis/ucas-undergraduate- releases/2018-cycle-applicant-figures-january-deadline) Extract A Rethinking tuition fees The value of a degree is significant. The latest data shows that the median university graduate income was £10 000 more than the average non-graduate income in 2018. This ‘graduate premium’ means graduates will contribute significantly to the economy. In addition, the government will benefit greatly from additional tax revenues. 5 However, funding higher education continues to be a major issue. English universities charge some of the world’s highest fees. Interest rates on student loans are now 6.3%. There are a large number of courses where graduates are likely to earn less than non-graduates, despite an average of £50 000 of debt. The Department for Education estimates that 45% of the value of loans will not be 10 repaid. Outstanding student loans in England totalled more than £100 billion in 2018. By 2023 total outstanding student loans are forecast to rise to £120 billion. One option for revising student fees could be to charge higher fees for courses that are more expensive to teach or that have a better chance of higher earnings. That would make Science or Mathematics degrees more expensive to study than English or 15 Philosophy. At most universities the level of fees is likely to be the same flat rate of £9 250 per year. However, science-based courses need more expensive equipment and courses such as medicine require more teaching time and personal instruction. Tuition fees were introduced in 1998 at £1 000 per year. They are currently £9 250. 20 Economists estimate that the price elasticity of demand for higher education is about –0.5. Charging £9 250 a year for an undergraduate degree makes England very expensive by international standards. Scotland has no fees for Scottish students, and fees in Wales and Northern Ireland are significantly lower. Much of Europe has low or no fees and Germany, which used to charge fees, has abolished them, replacing them with a graduate tax. 25 The only country with comparable fees is the United States. Top private colleges can charge more than the equivalent of £30 000 per year while state colleges can charge local students less than fees in England. Despite this, student numbers at English universities have continued to increase from 450 000 in 1998 to over 700 000 in 2018. Students from all backgrounds are more likely to 30 go to university than ever before. However, applicants from low-income areas are much less likely to go to university than applicants from high-income areas. The Universities and Colleges Admissions Service (UCAS) found that in the most deprived 10% of postal areas about 20% of young people went to university in 2018, compared with 50% in the highest income areas. Research 35 by University College London revealed that even when candidates from low-income areas had the same exam results, they were much less likely to apply to university than candidates from high-income areas. (Source: adapted from https://www.theguardian.com/education/2018/dec/16/change-in-student-loan- accounting-could-add-10bn-to-national-debt) Extract B Low-income university students twice as likely to drop out than high-income ones The number of students from low-income areas who drop out of university before finishing their degree is at its highest in five years, indicating a considerable waste of scarce educational resources. This news comes at the same time as a drive to recruit students from poorer backgrounds, with universities spending a total of £725 million on 5 access initiatives in the past academic year alone. A number of top universities have started to lower their A level grade offers to students from low-income areas, in an attempt to encourage them to apply. However, there is a danger with ‘enticing’ disadvantaged students through lower grade offers, if universities are not going to provide ongoing support for them once they begin their courses. 10 The latest figures show that 9% of disadvantaged undergraduates do not continue in higher education beyond their first year. In comparison, the average drop-out rate among students from the high-income backgrounds was less than 5%. The gap continues to widen. A report, published by the Office for Fair Access, concluded that: ‘The significance of 15 this for students is huge. Higher education can be a transformational experience that opens doors to rewarding careers and social mobility, but this is only the case if students achieve successful outcomes.’ (Source: adapted from https://www.telegraph.co.uk/news/2017/06/28/number-poor-students-dropping- university-highest-level-five/)
(d) With reference to Figure 2, calculate the percentage increase in outstanding student loans from 2013 to 2018. You are advised to show your working. (4)
October 2020 · AS Paper 1 · Q6(e) 15 marks AO1=3, AO2=3, AO3=3, AO4=6 15-mark response price mechanism and surplus
Data and extracts for question 6The market for higher education in the UK Figure 1: Average graduate earnings, according to subject studied, compared to average non-graduate earnings (per cent) 2018 selected subjects. Economics Medicine Architecture Business Top 5 Law Bottom 5 Psychology Philosophy English Agriculture Creative arts –20% 0% 20% 40% (Source: adapted from https://www.ifs.org.uk/publications/13731 The impact of undergraduate degrees on early-career earnings, Research report, November 2018) Figure 2: Student loans outstanding at the end of financial years 2013 to 2018 in England 120 000 100 000 80 000 60 000 102 357 87 629 74 960 40 000 63 776 53 668 45 418 20 000 0 2013 2014 2015 2016 2017 2018 Financial year (Source: adapted from https://www.slc.co.uk/official-statistics/ student-loans-debt-and-repayment/england.aspx) Figure 3: Number of applications to UCAS according to median income of area lowest household highest household income below £23 000 income above £35 400 90 000 80 000 70 000 60 000 50 000 40 000 30 000 20 000 10 000 0 2007 2008 2009 2010 2011 2012 2013 2014 2015 2016 (Source: adapted from https://www.ucas.com/corporate/data-and-analysis/ucas-undergraduate- releases/2018-cycle-applicant-figures-january-deadline) Extract A Rethinking tuition fees The value of a degree is significant. The latest data shows that the median university graduate income was £10 000 more than the average non-graduate income in 2018. This ‘graduate premium’ means graduates will contribute significantly to the economy. In addition, the government will benefit greatly from additional tax revenues. 5 However, funding higher education continues to be a major issue. English universities charge some of the world’s highest fees. Interest rates on student loans are now 6.3%. There are a large number of courses where graduates are likely to earn less than non-graduates, despite an average of £50 000 of debt. The Department for Education estimates that 45% of the value of loans will not be 10 repaid. Outstanding student loans in England totalled more than £100 billion in 2018. By 2023 total outstanding student loans are forecast to rise to £120 billion. One option for revising student fees could be to charge higher fees for courses that are more expensive to teach or that have a better chance of higher earnings. That would make Science or Mathematics degrees more expensive to study than English or 15 Philosophy. At most universities the level of fees is likely to be the same flat rate of £9 250 per year. However, science-based courses need more expensive equipment and courses such as medicine require more teaching time and personal instruction. Tuition fees were introduced in 1998 at £1 000 per year. They are currently £9 250. 20 Economists estimate that the price elasticity of demand for higher education is about –0.5. Charging £9 250 a year for an undergraduate degree makes England very expensive by international standards. Scotland has no fees for Scottish students, and fees in Wales and Northern Ireland are significantly lower. Much of Europe has low or no fees and Germany, which used to charge fees, has abolished them, replacing them with a graduate tax. 25 The only country with comparable fees is the United States. Top private colleges can charge more than the equivalent of £30 000 per year while state colleges can charge local students less than fees in England. Despite this, student numbers at English universities have continued to increase from 450 000 in 1998 to over 700 000 in 2018. Students from all backgrounds are more likely to 30 go to university than ever before. However, applicants from low-income areas are much less likely to go to university than applicants from high-income areas. The Universities and Colleges Admissions Service (UCAS) found that in the most deprived 10% of postal areas about 20% of young people went to university in 2018, compared with 50% in the highest income areas. Research 35 by University College London revealed that even when candidates from low-income areas had the same exam results, they were much less likely to apply to university than candidates from high-income areas. (Source: adapted from https://www.theguardian.com/education/2018/dec/16/change-in-student-loan- accounting-could-add-10bn-to-national-debt) Extract B Low-income university students twice as likely to drop out than high-income ones The number of students from low-income areas who drop out of university before finishing their degree is at its highest in five years, indicating a considerable waste of scarce educational resources. This news comes at the same time as a drive to recruit students from poorer backgrounds, with universities spending a total of £725 million on 5 access initiatives in the past academic year alone. A number of top universities have started to lower their A level grade offers to students from low-income areas, in an attempt to encourage them to apply. However, there is a danger with ‘enticing’ disadvantaged students through lower grade offers, if universities are not going to provide ongoing support for them once they begin their courses. 10 The latest figures show that 9% of disadvantaged undergraduates do not continue in higher education beyond their first year. In comparison, the average drop-out rate among students from the high-income backgrounds was less than 5%. The gap continues to widen. A report, published by the Office for Fair Access, concluded that: ‘The significance of 15 this for students is huge. Higher education can be a transformational experience that opens doors to rewarding careers and social mobility, but this is only the case if students achieve successful outcomes.’ (Source: adapted from https://www.telegraph.co.uk/news/2017/06/28/number-poor-students-dropping- university-highest-level-five/)
(e) With reference to Figure 1 and Extract A, discuss the benefits of allowing universities to charge higher tuition fees for some degree courses. (15)
October 2020 · AS Paper 1 · Q6(f) 20 marks AO1=4, AO2=4, AO3=6, AO4=6 20-mark essay Either/or economic systemsprice mechanism and surplus
Data and extracts for question 6The market for higher education in the UK Figure 1: Average graduate earnings, according to subject studied, compared to average non-graduate earnings (per cent) 2018 selected subjects. Economics Medicine Architecture Business Top 5 Law Bottom 5 Psychology Philosophy English Agriculture Creative arts –20% 0% 20% 40% (Source: adapted from https://www.ifs.org.uk/publications/13731 The impact of undergraduate degrees on early-career earnings, Research report, November 2018) Figure 2: Student loans outstanding at the end of financial years 2013 to 2018 in England 120 000 100 000 80 000 60 000 102 357 87 629 74 960 40 000 63 776 53 668 45 418 20 000 0 2013 2014 2015 2016 2017 2018 Financial year (Source: adapted from https://www.slc.co.uk/official-statistics/ student-loans-debt-and-repayment/england.aspx) Figure 3: Number of applications to UCAS according to median income of area lowest household highest household income below £23 000 income above £35 400 90 000 80 000 70 000 60 000 50 000 40 000 30 000 20 000 10 000 0 2007 2008 2009 2010 2011 2012 2013 2014 2015 2016 (Source: adapted from https://www.ucas.com/corporate/data-and-analysis/ucas-undergraduate- releases/2018-cycle-applicant-figures-january-deadline) Extract A Rethinking tuition fees The value of a degree is significant. The latest data shows that the median university graduate income was £10 000 more than the average non-graduate income in 2018. This ‘graduate premium’ means graduates will contribute significantly to the economy. In addition, the government will benefit greatly from additional tax revenues. 5 However, funding higher education continues to be a major issue. English universities charge some of the world’s highest fees. Interest rates on student loans are now 6.3%. There are a large number of courses where graduates are likely to earn less than non-graduates, despite an average of £50 000 of debt. The Department for Education estimates that 45% of the value of loans will not be 10 repaid. Outstanding student loans in England totalled more than £100 billion in 2018. By 2023 total outstanding student loans are forecast to rise to £120 billion. One option for revising student fees could be to charge higher fees for courses that are more expensive to teach or that have a better chance of higher earnings. That would make Science or Mathematics degrees more expensive to study than English or 15 Philosophy. At most universities the level of fees is likely to be the same flat rate of £9 250 per year. However, science-based courses need more expensive equipment and courses such as medicine require more teaching time and personal instruction. Tuition fees were introduced in 1998 at £1 000 per year. They are currently £9 250. 20 Economists estimate that the price elasticity of demand for higher education is about –0.5. Charging £9 250 a year for an undergraduate degree makes England very expensive by international standards. Scotland has no fees for Scottish students, and fees in Wales and Northern Ireland are significantly lower. Much of Europe has low or no fees and Germany, which used to charge fees, has abolished them, replacing them with a graduate tax. 25 The only country with comparable fees is the United States. Top private colleges can charge more than the equivalent of £30 000 per year while state colleges can charge local students less than fees in England. Despite this, student numbers at English universities have continued to increase from 450 000 in 1998 to over 700 000 in 2018. Students from all backgrounds are more likely to 30 go to university than ever before. However, applicants from low-income areas are much less likely to go to university than applicants from high-income areas. The Universities and Colleges Admissions Service (UCAS) found that in the most deprived 10% of postal areas about 20% of young people went to university in 2018, compared with 50% in the highest income areas. Research 35 by University College London revealed that even when candidates from low-income areas had the same exam results, they were much less likely to apply to university than candidates from high-income areas. (Source: adapted from https://www.theguardian.com/education/2018/dec/16/change-in-student-loan- accounting-could-add-10bn-to-national-debt) Extract B Low-income university students twice as likely to drop out than high-income ones The number of students from low-income areas who drop out of university before finishing their degree is at its highest in five years, indicating a considerable waste of scarce educational resources. This news comes at the same time as a drive to recruit students from poorer backgrounds, with universities spending a total of £725 million on 5 access initiatives in the past academic year alone. A number of top universities have started to lower their A level grade offers to students from low-income areas, in an attempt to encourage them to apply. However, there is a danger with ‘enticing’ disadvantaged students through lower grade offers, if universities are not going to provide ongoing support for them once they begin their courses. 10 The latest figures show that 9% of disadvantaged undergraduates do not continue in higher education beyond their first year. In comparison, the average drop-out rate among students from the high-income backgrounds was less than 5%. The gap continues to widen. A report, published by the Office for Fair Access, concluded that: ‘The significance of 15 this for students is huge. Higher education can be a transformational experience that opens doors to rewarding careers and social mobility, but this is only the case if students achieve successful outcomes.’ (Source: adapted from https://www.telegraph.co.uk/news/2017/06/28/number-poor-students-dropping- university-highest-level-five/)
(f) Evaluate the possible advantages of a free market approach to providing services such as education. (20)
October 2020 · AS Paper 1 · Q6(g) 20 marks AO1=4, AO2=4, AO3=6, AO4=6 20-mark essay Either/or externalitiesgovernment intervention in markets
Data and extracts for question 6The market for higher education in the UK Figure 1: Average graduate earnings, according to subject studied, compared to average non-graduate earnings (per cent) 2018 selected subjects. Economics Medicine Architecture Business Top 5 Law Bottom 5 Psychology Philosophy English Agriculture Creative arts –20% 0% 20% 40% (Source: adapted from https://www.ifs.org.uk/publications/13731 The impact of undergraduate degrees on early-career earnings, Research report, November 2018) Figure 2: Student loans outstanding at the end of financial years 2013 to 2018 in England 120 000 100 000 80 000 60 000 102 357 87 629 74 960 40 000 63 776 53 668 45 418 20 000 0 2013 2014 2015 2016 2017 2018 Financial year (Source: adapted from https://www.slc.co.uk/official-statistics/ student-loans-debt-and-repayment/england.aspx) Figure 3: Number of applications to UCAS according to median income of area lowest household highest household income below £23 000 income above £35 400 90 000 80 000 70 000 60 000 50 000 40 000 30 000 20 000 10 000 0 2007 2008 2009 2010 2011 2012 2013 2014 2015 2016 (Source: adapted from https://www.ucas.com/corporate/data-and-analysis/ucas-undergraduate- releases/2018-cycle-applicant-figures-january-deadline) Extract A Rethinking tuition fees The value of a degree is significant. The latest data shows that the median university graduate income was £10 000 more than the average non-graduate income in 2018. This ‘graduate premium’ means graduates will contribute significantly to the economy. In addition, the government will benefit greatly from additional tax revenues. 5 However, funding higher education continues to be a major issue. English universities charge some of the world’s highest fees. Interest rates on student loans are now 6.3%. There are a large number of courses where graduates are likely to earn less than non-graduates, despite an average of £50 000 of debt. The Department for Education estimates that 45% of the value of loans will not be 10 repaid. Outstanding student loans in England totalled more than £100 billion in 2018. By 2023 total outstanding student loans are forecast to rise to £120 billion. One option for revising student fees could be to charge higher fees for courses that are more expensive to teach or that have a better chance of higher earnings. That would make Science or Mathematics degrees more expensive to study than English or 15 Philosophy. At most universities the level of fees is likely to be the same flat rate of £9 250 per year. However, science-based courses need more expensive equipment and courses such as medicine require more teaching time and personal instruction. Tuition fees were introduced in 1998 at £1 000 per year. They are currently £9 250. 20 Economists estimate that the price elasticity of demand for higher education is about –0.5. Charging £9 250 a year for an undergraduate degree makes England very expensive by international standards. Scotland has no fees for Scottish students, and fees in Wales and Northern Ireland are significantly lower. Much of Europe has low or no fees and Germany, which used to charge fees, has abolished them, replacing them with a graduate tax. 25 The only country with comparable fees is the United States. Top private colleges can charge more than the equivalent of £30 000 per year while state colleges can charge local students less than fees in England. Despite this, student numbers at English universities have continued to increase from 450 000 in 1998 to over 700 000 in 2018. Students from all backgrounds are more likely to 30 go to university than ever before. However, applicants from low-income areas are much less likely to go to university than applicants from high-income areas. The Universities and Colleges Admissions Service (UCAS) found that in the most deprived 10% of postal areas about 20% of young people went to university in 2018, compared with 50% in the highest income areas. Research 35 by University College London revealed that even when candidates from low-income areas had the same exam results, they were much less likely to apply to university than candidates from high-income areas. (Source: adapted from https://www.theguardian.com/education/2018/dec/16/change-in-student-loan- accounting-could-add-10bn-to-national-debt) Extract B Low-income university students twice as likely to drop out than high-income ones The number of students from low-income areas who drop out of university before finishing their degree is at its highest in five years, indicating a considerable waste of scarce educational resources. This news comes at the same time as a drive to recruit students from poorer backgrounds, with universities spending a total of £725 million on 5 access initiatives in the past academic year alone. A number of top universities have started to lower their A level grade offers to students from low-income areas, in an attempt to encourage them to apply. However, there is a danger with ‘enticing’ disadvantaged students through lower grade offers, if universities are not going to provide ongoing support for them once they begin their courses. 10 The latest figures show that 9% of disadvantaged undergraduates do not continue in higher education beyond their first year. In comparison, the average drop-out rate among students from the high-income backgrounds was less than 5%. The gap continues to widen. A report, published by the Office for Fair Access, concluded that: ‘The significance of 15 this for students is huge. Higher education can be a transformational experience that opens doors to rewarding careers and social mobility, but this is only the case if students achieve successful outcomes.’ (Source: adapted from https://www.telegraph.co.uk/news/2017/06/28/number-poor-students-dropping- university-highest-level-five/)
(g) Evaluate whether government intervention is able to correct market failure in education. (20)

Work with an Edexcel economics tutor

Want a paper marked and gone through with you? Message us.

Prefer email? Send an enquiry

If you are under 18, please include a parent's contact details. Enquiries go to enquiries@economicsaleveltutor.com and are deleted once handled. All tutoring is online.