Data and extracts for question 1
Answer
D
Mark scheme
Notes from the mark scheme and report
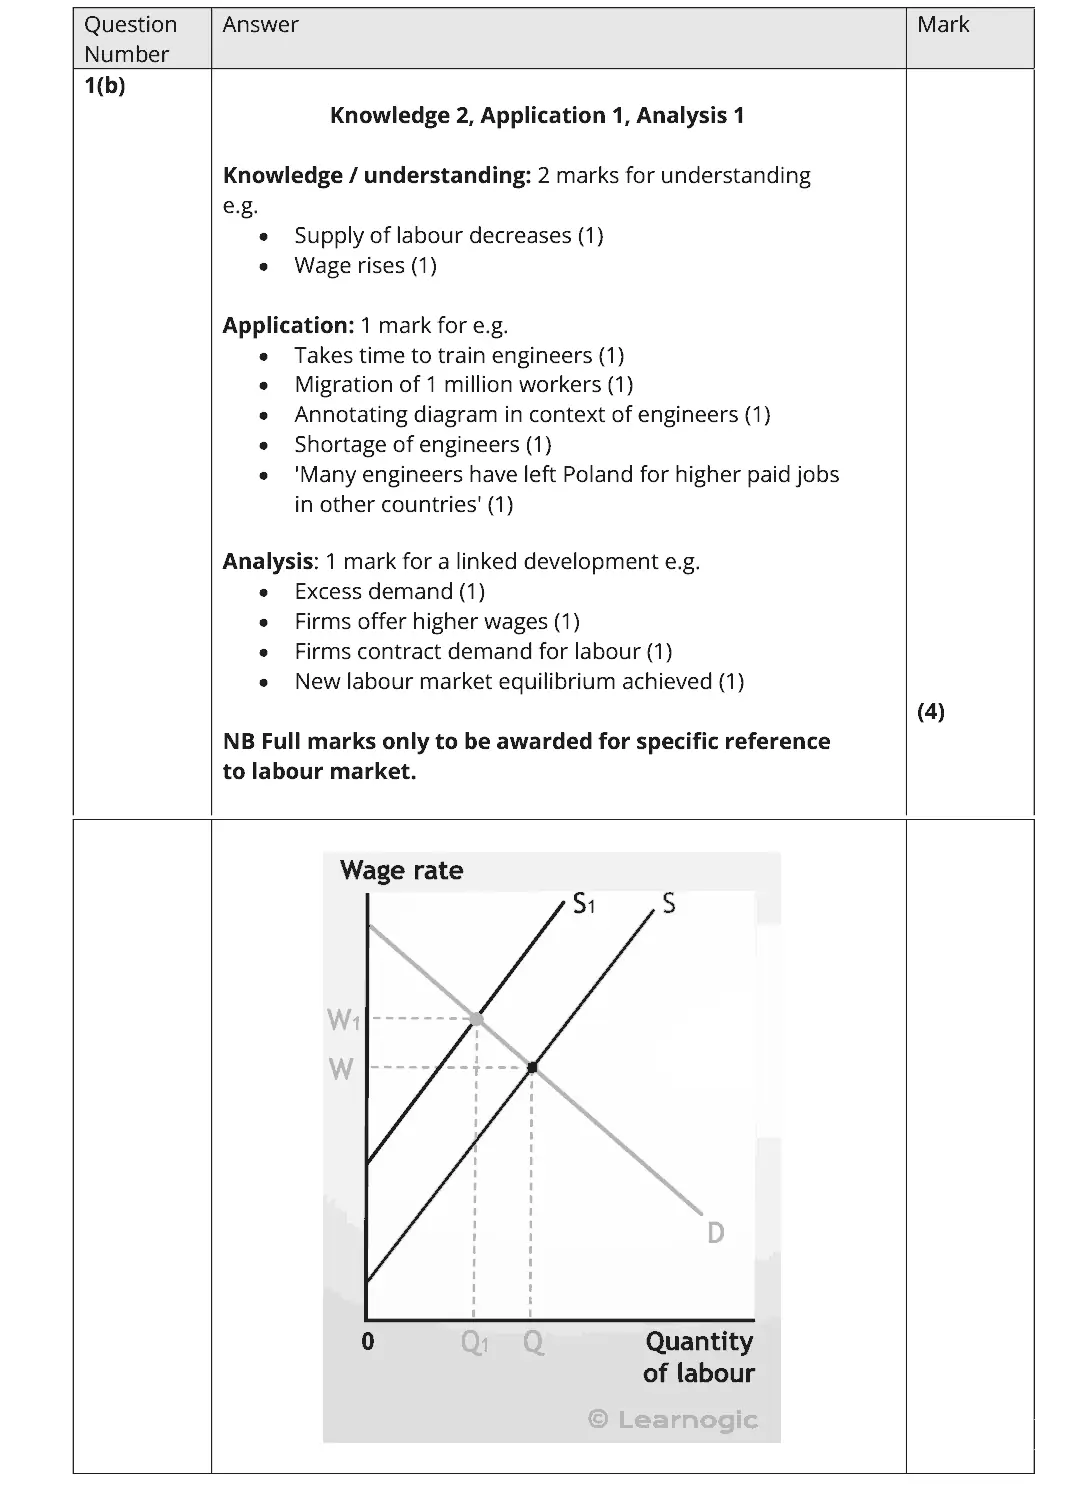
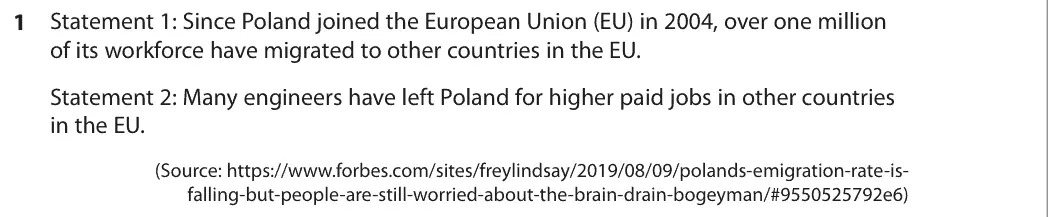
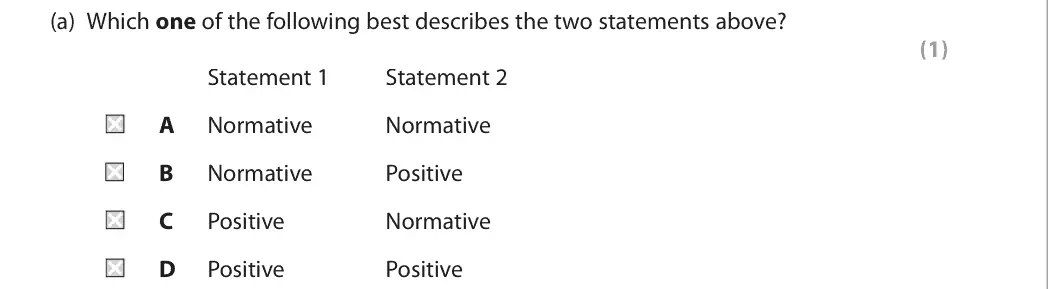
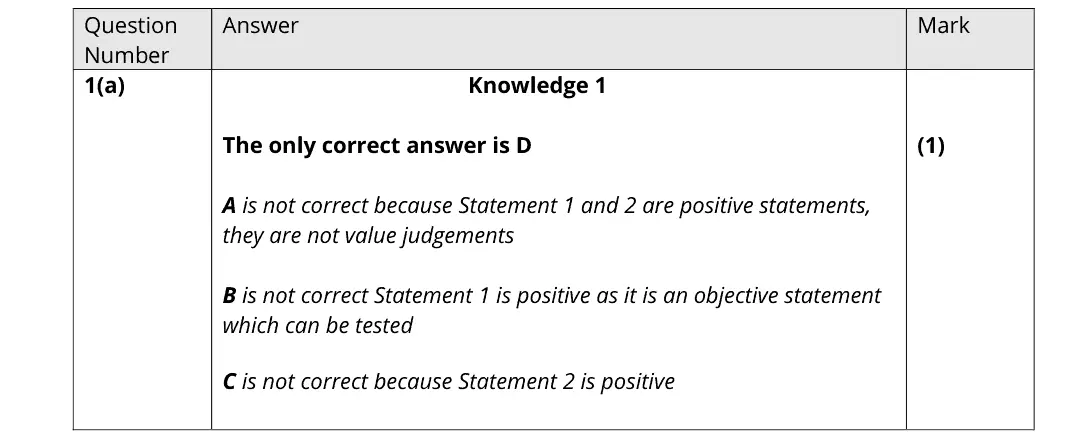
- both statements can be tested against evidence and contain no value judgement, so both are positive (D)
- "higher paid" is a fact, not a value judgement
100 marks · 18 question parts · Paper, mark scheme and report on Pearson's site
D

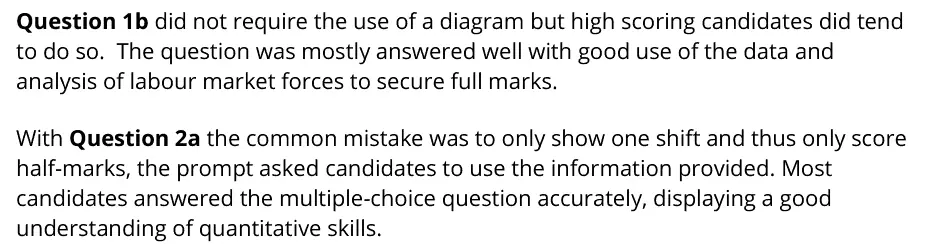
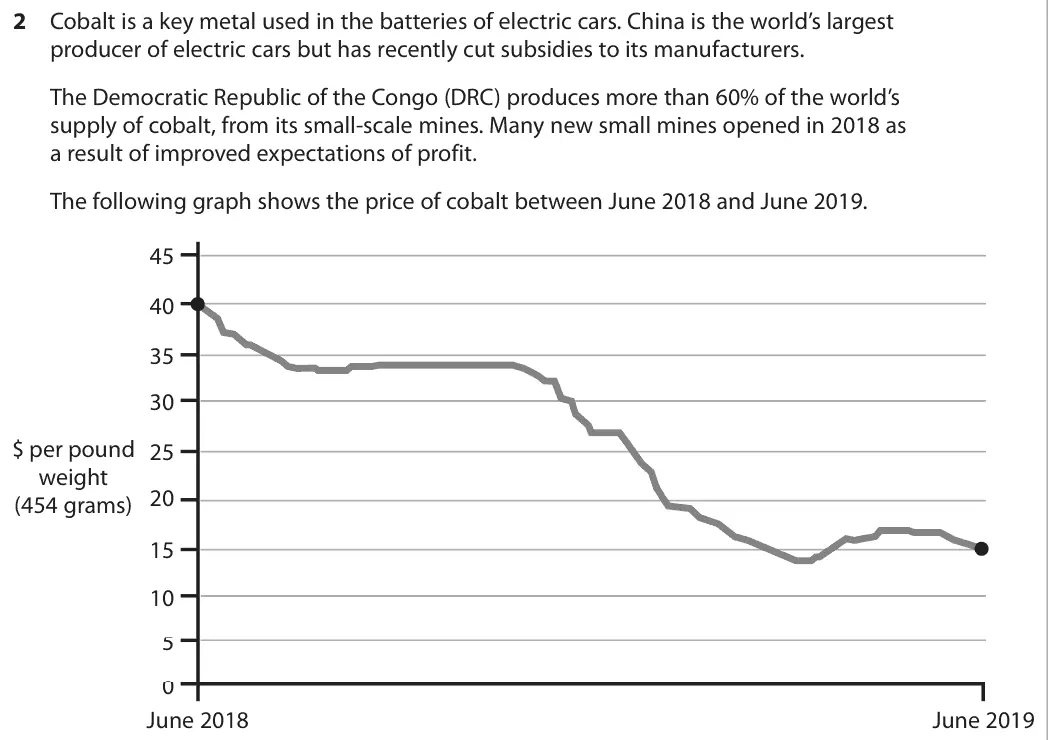
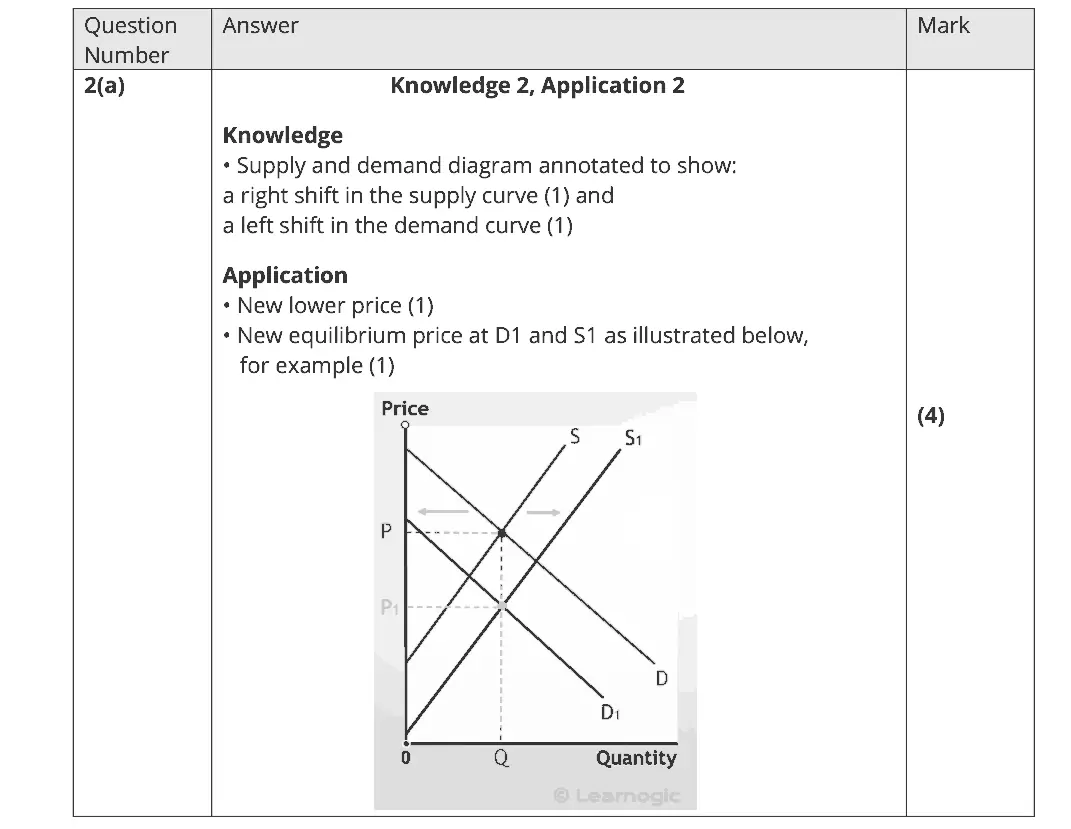
Question 1b did not require the use of a diagram but high scoring candidates did tend to do so. The question was mostly answered well with good use of the data and analysis of labour market forces to secure full marks. With Question 2a the common mistake was to only show one shift and thus only score half-marks, the prompt asked candidates to use the information provided. Most candidates answered the multiple-choice question accurately, displaying a good understanding of quantitative skills.

Quantitative skills: QS 4 (construct and interpret a range of standard graphical forms); QS 9 (interpret, apply and analyse information in written, graphical tabular and numerical forms)
C
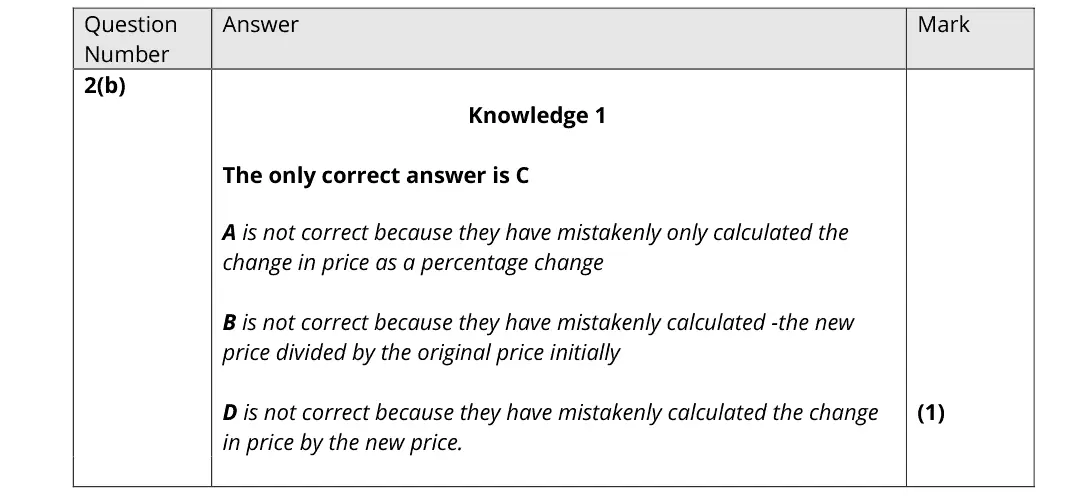
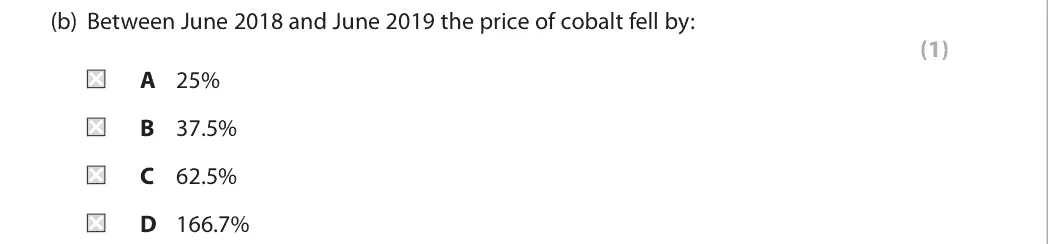
Quantitative skills: QS 2 (calculate, use and understand percentages, percentage changes and percentage point changes); QS 9 (interpret, apply and analyse information in written, graphical tabular and numerical forms)
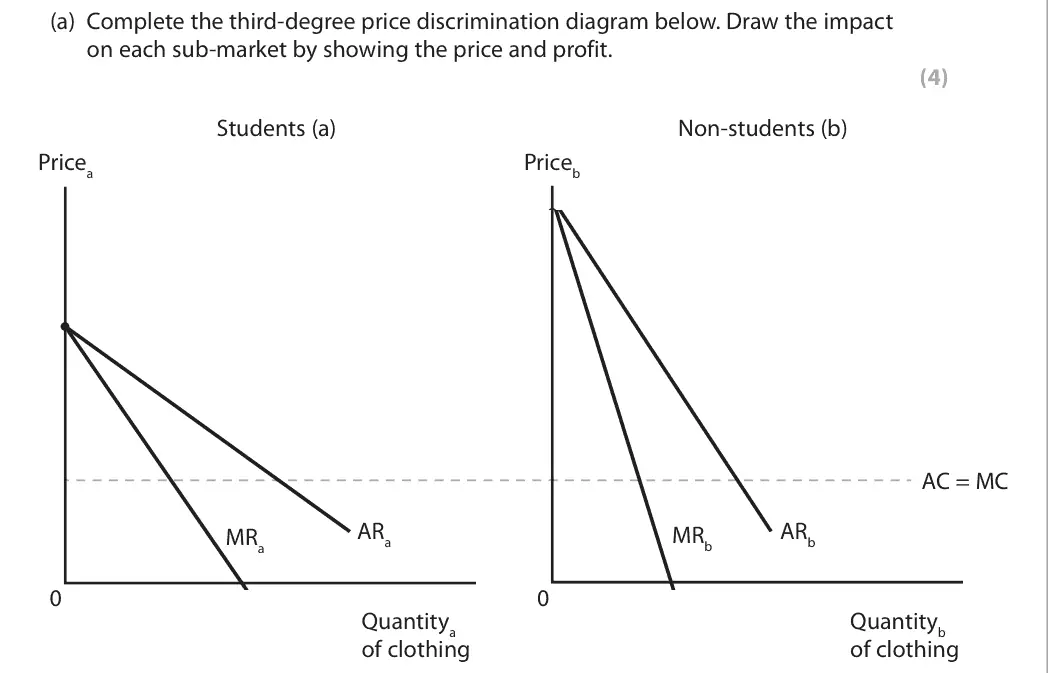
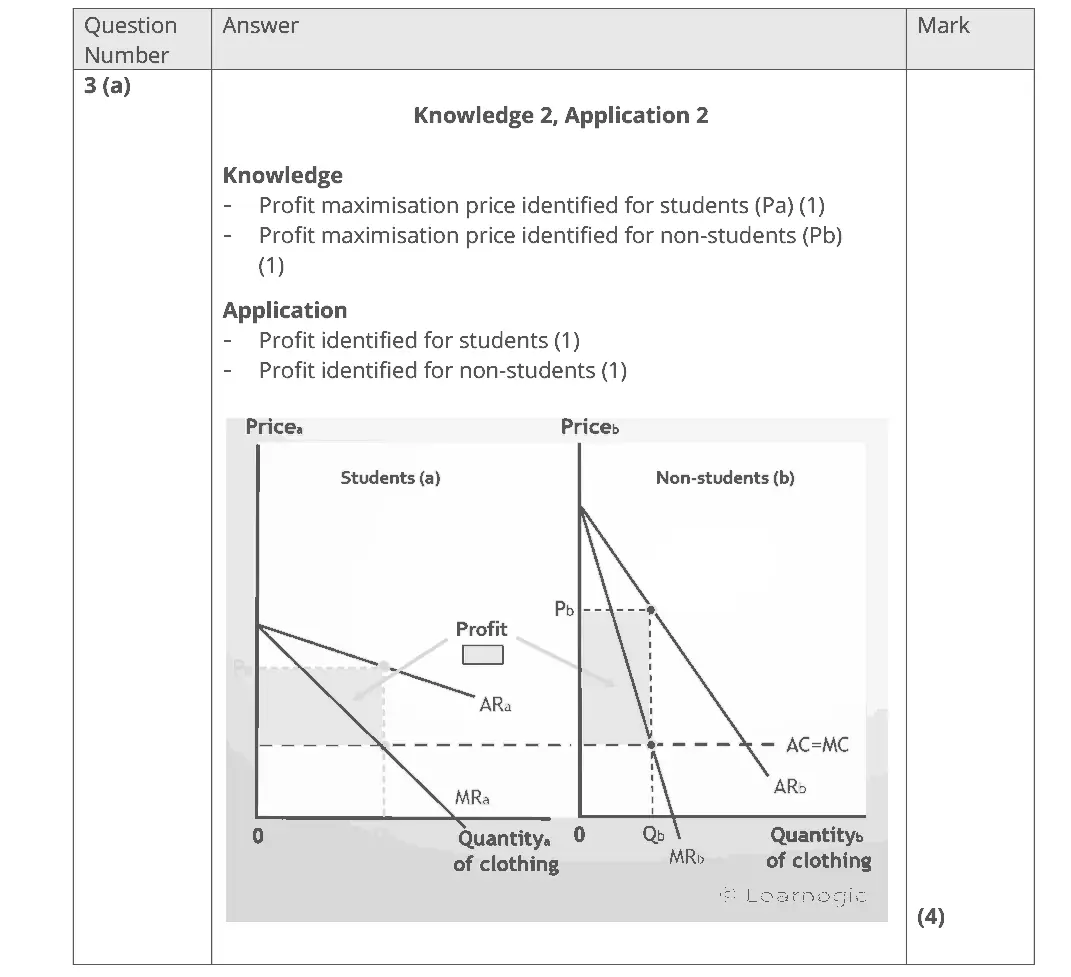
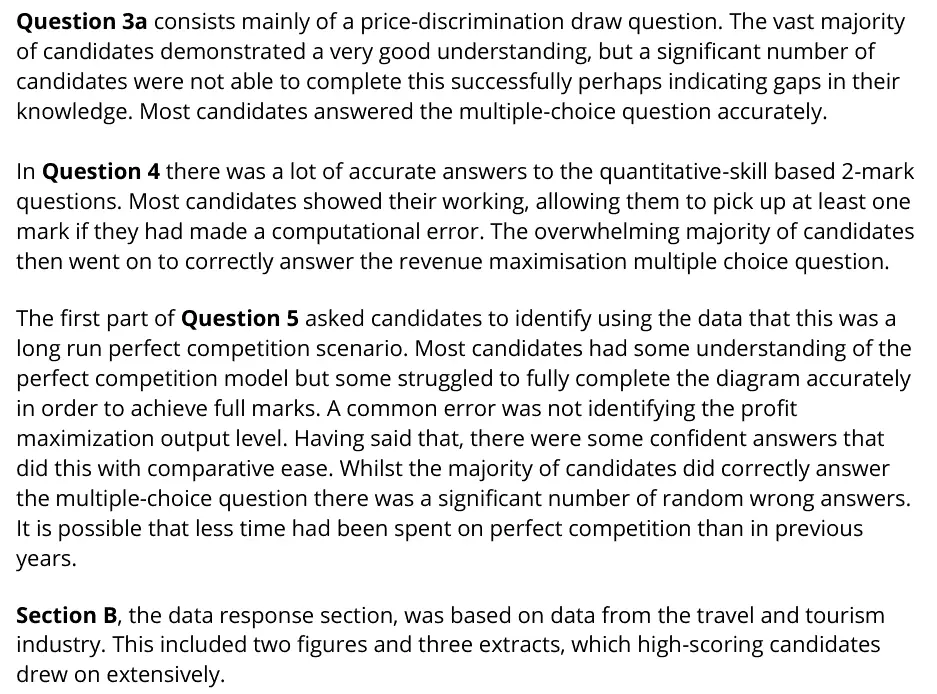
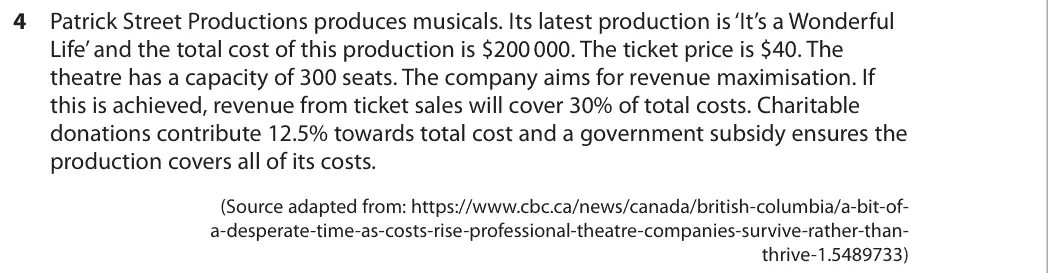
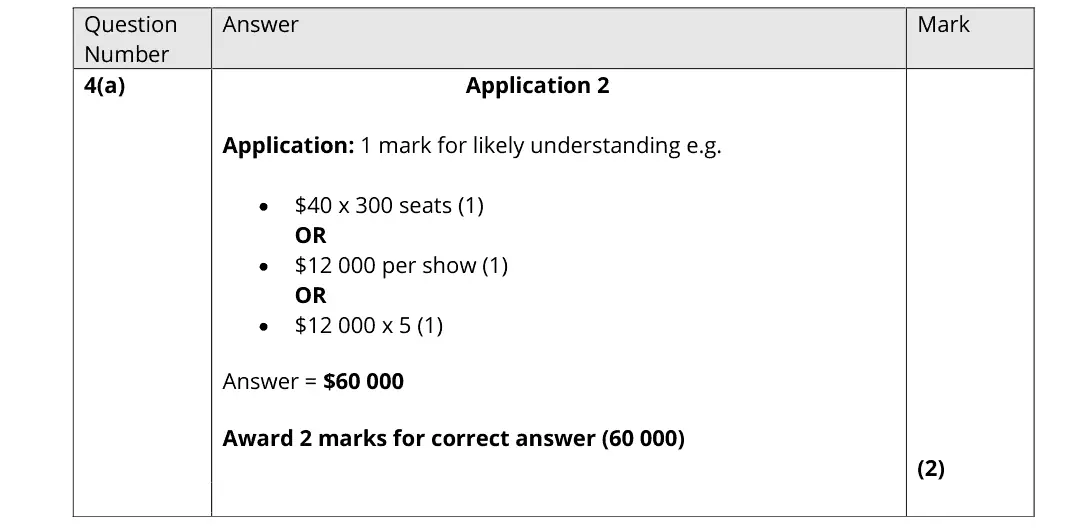
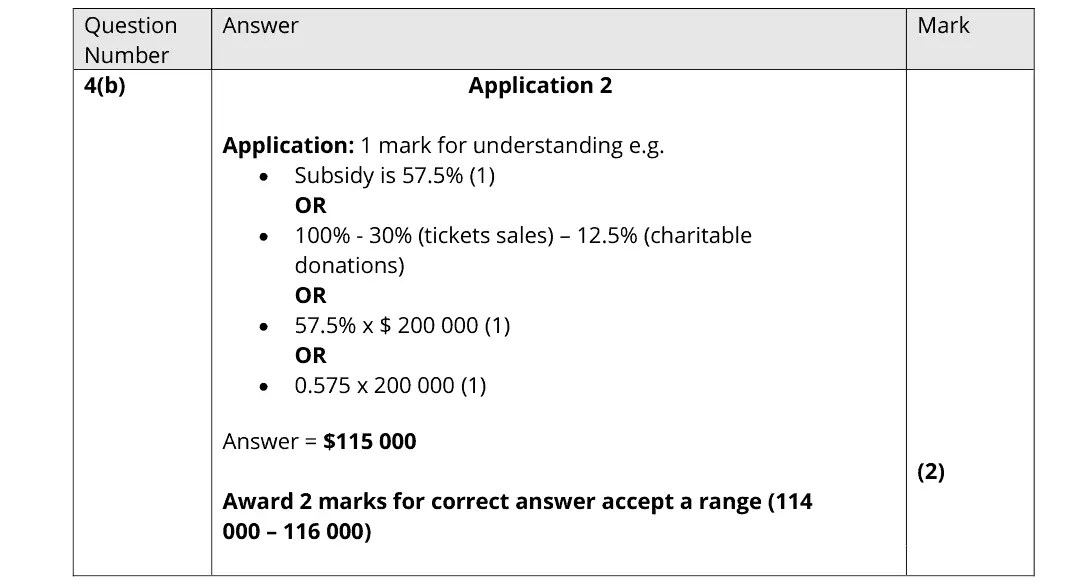
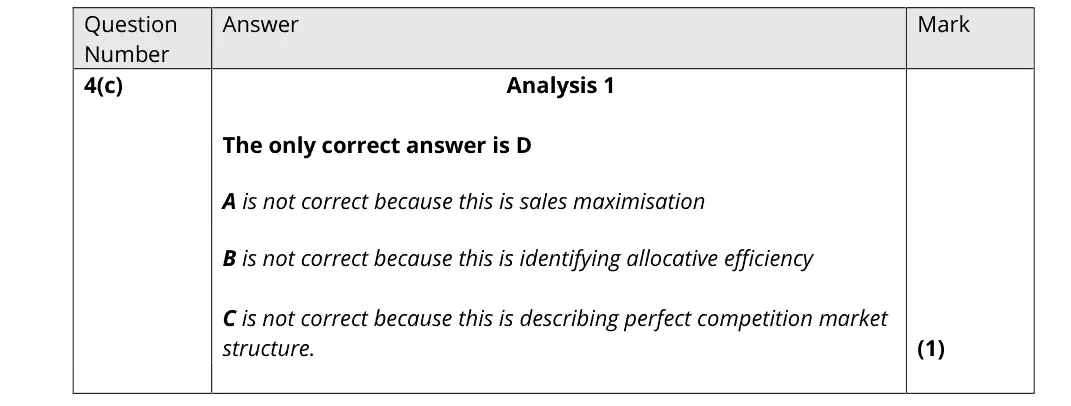
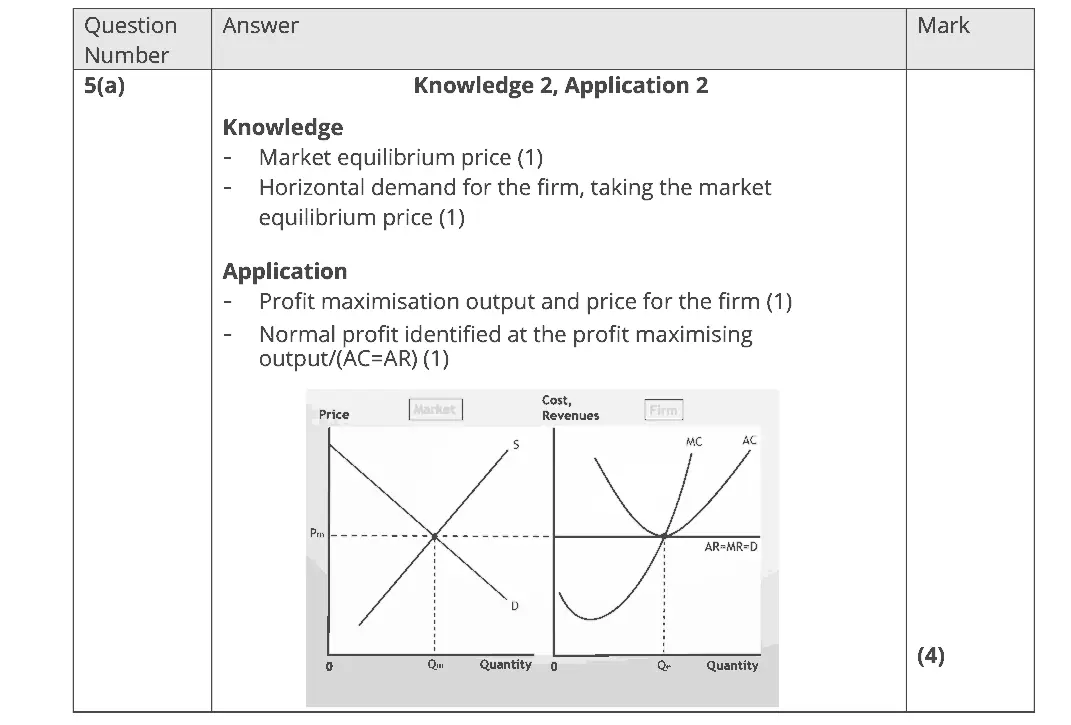
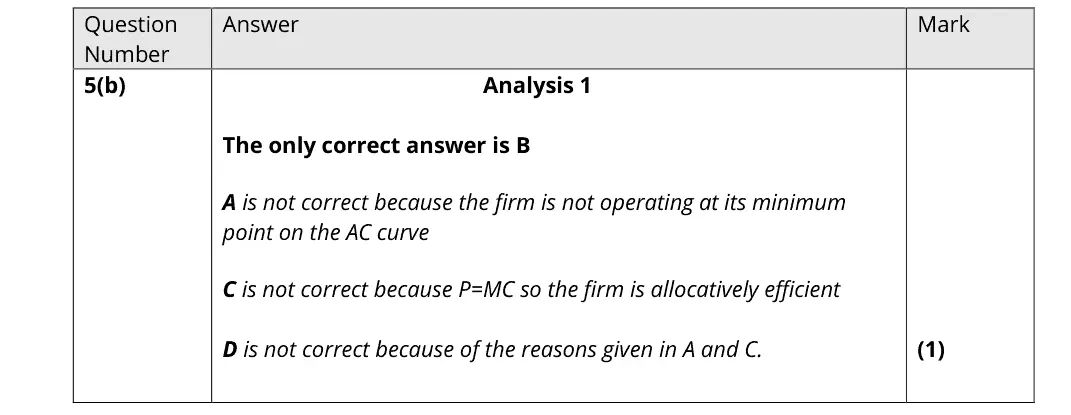
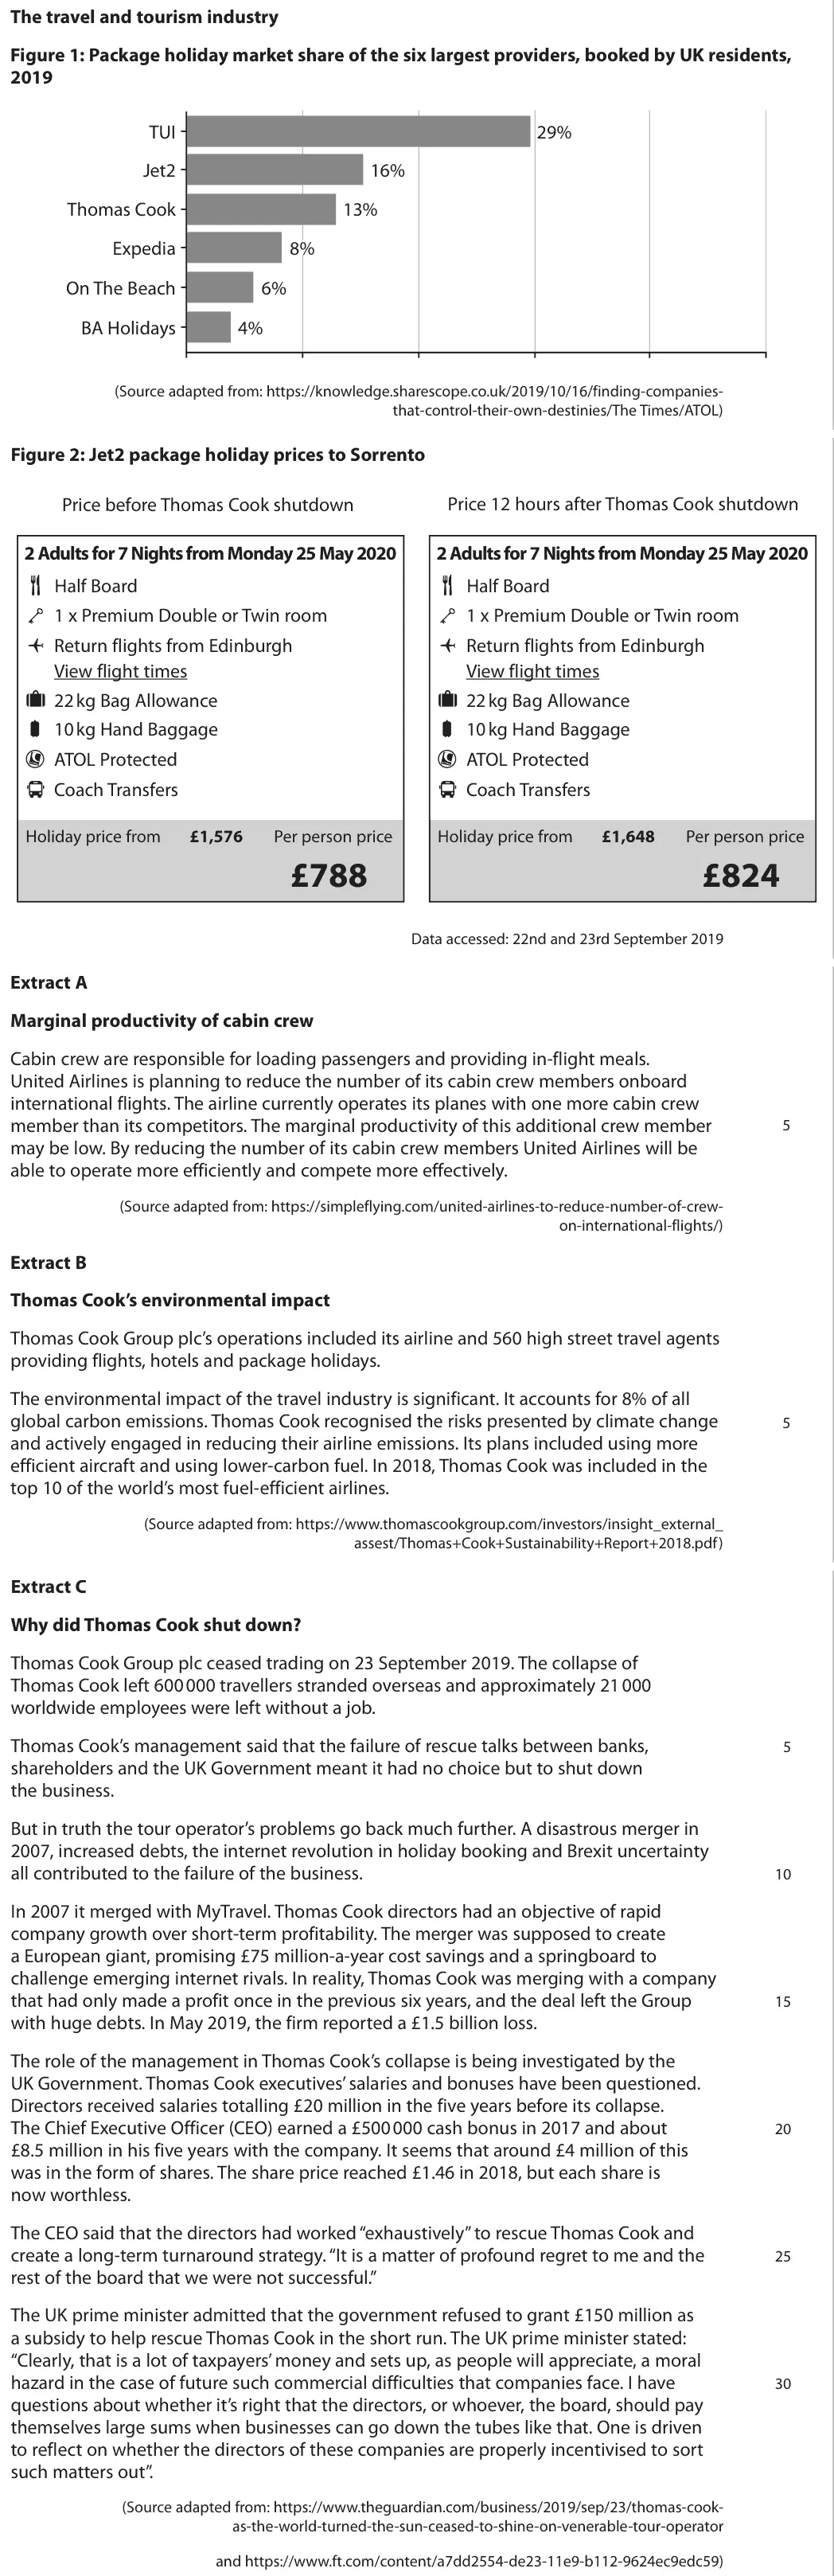
Question 3a consists mainly of a price-discrimination draw question. The vast majority of candidates demonstrated a very good understanding, but a significant number of candidates were not able to complete this successfully perhaps indicating gaps in their knowledge. Most candidates answered the multiple-choice question accurately. In Question 4 there was a lot of accurate answers to the quantitative-skill based 2-mark questions. Most candidates showed their working, allowing them to pick up at least one mark if they had made a computational error. The overwhelming majority of candidates then went on to correctly answer the revenue maximisation multiple choice question. The first part of Question 5 asked candidates to identify using the data that this was a long run perfect competition scenario. Most candidates had some understanding of the perfect competition model but some struggled to fully complete the diagram accurately in order to achieve full marks. A common error was not identifying the profit maximization output level. Having said that, there were some confident answers that did this with comparative ease. Whilst the majority of candidates did correctly answer the multiple-choice question there was a significant number of random wrong answers. It is possible that less time had been spent on perfect competition than in previous years. Section B, the data response section, was based on data from the travel and tourism industry. This included two figures and three extracts, which high-scoring candidates drew on extensively.
Quantitative skills: QS 4 (construct and interpret a range of standard graphical forms)
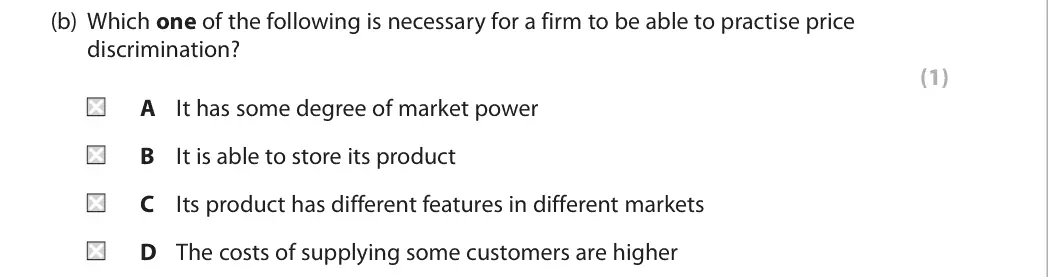
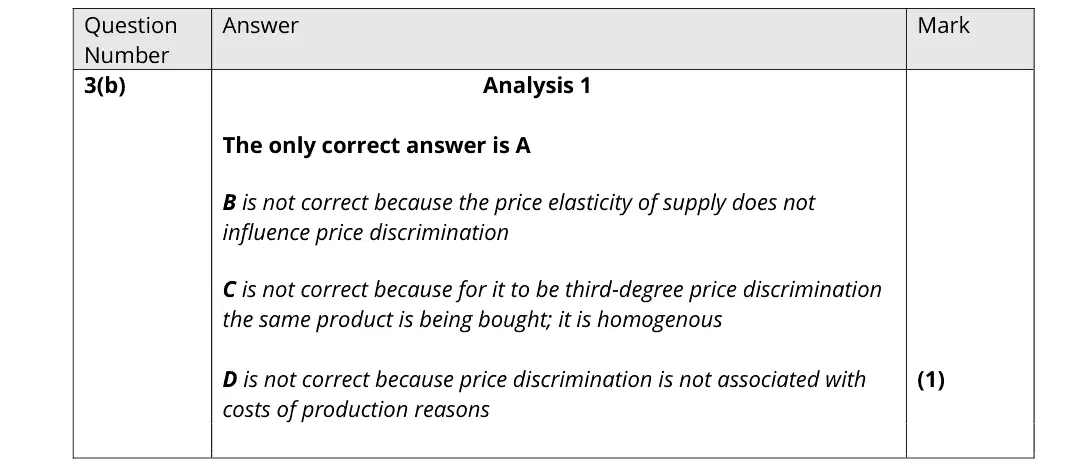
A

Quantitative skills: QS 6 (calculate cost, revenue and profit (marginal, average, totals))

Quantitative skills: QS 2 (calculate, use and understand percentages, percentage changes and percentage point changes); QS 6 (calculate cost, revenue and profit (marginal, average, totals))
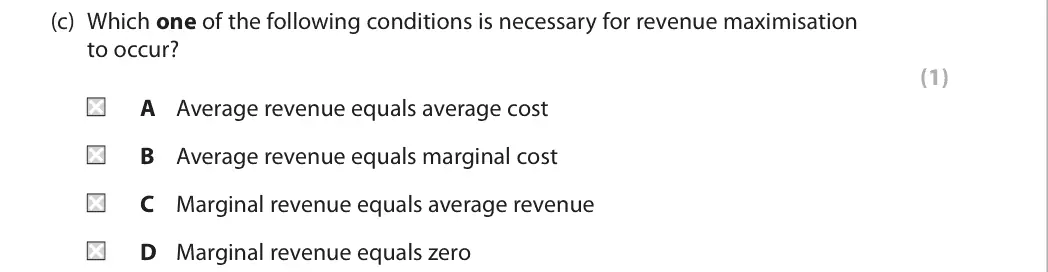
D

Quantitative skills: QS 4 (construct and interpret a range of standard graphical forms)
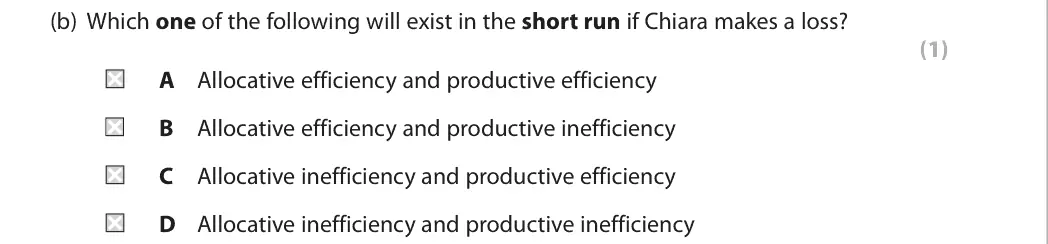
B

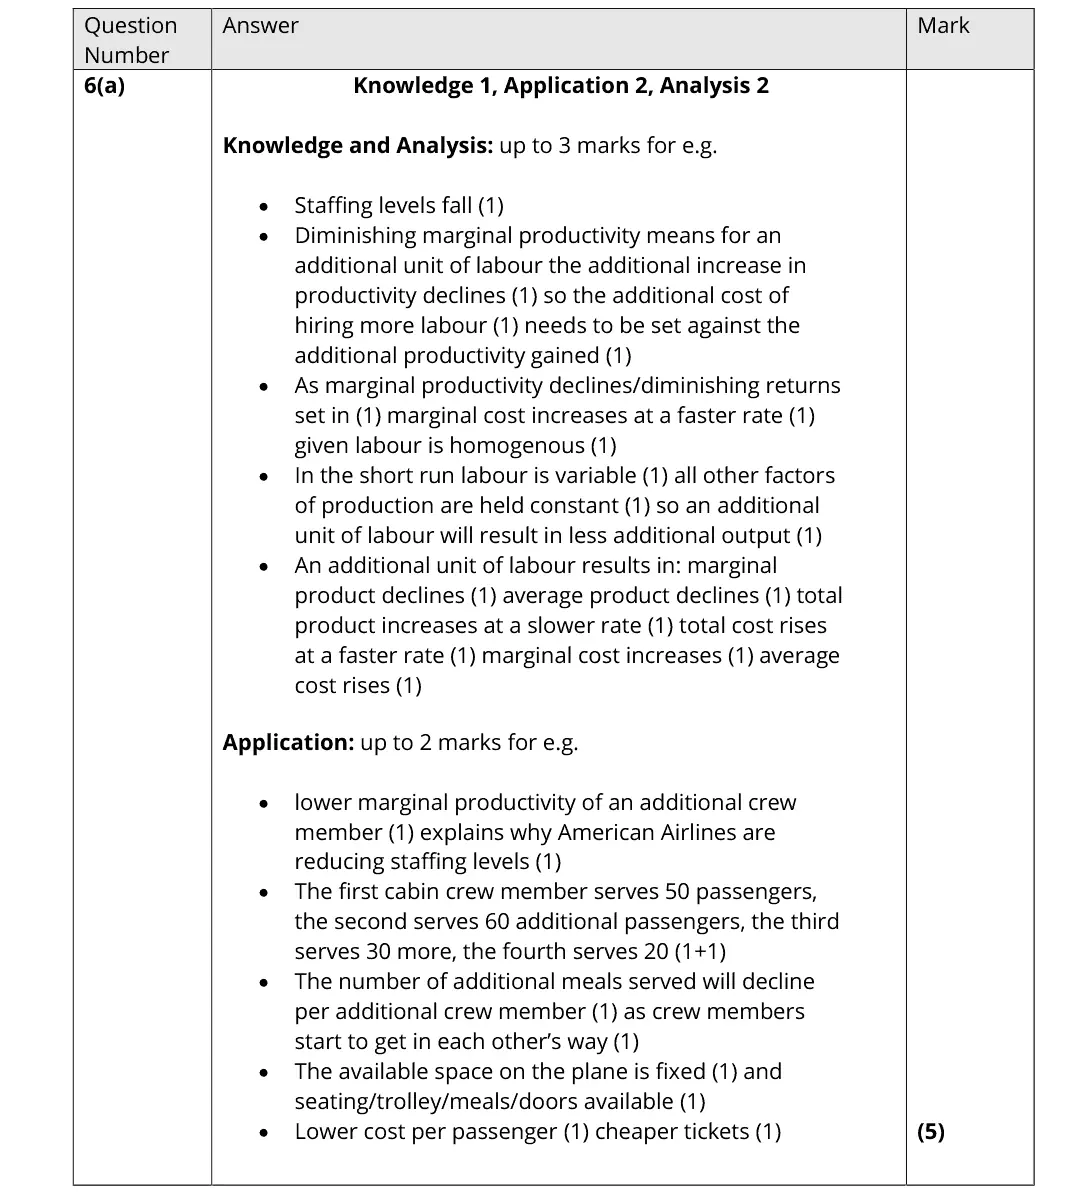
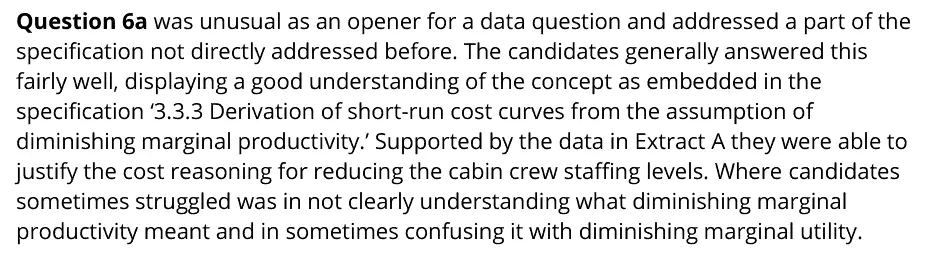
Question 6a was unusual as an opener for a data question and addressed a part of the specification not directly addressed before. The candidates generally answered this fairly well, displaying a good understanding of the concept as embedded in the specification ‘3.3.3 Derivation of short-run cost curves from the assumption of diminishing marginal productivity.’ Supported by the data in Extract A they were able to justify the cost reasoning for reducing the cabin crew staffing levels. Where candidates sometimes struggled was in not clearly understanding what diminishing marginal productivity meant and in sometimes confusing it with diminishing marginal utility.

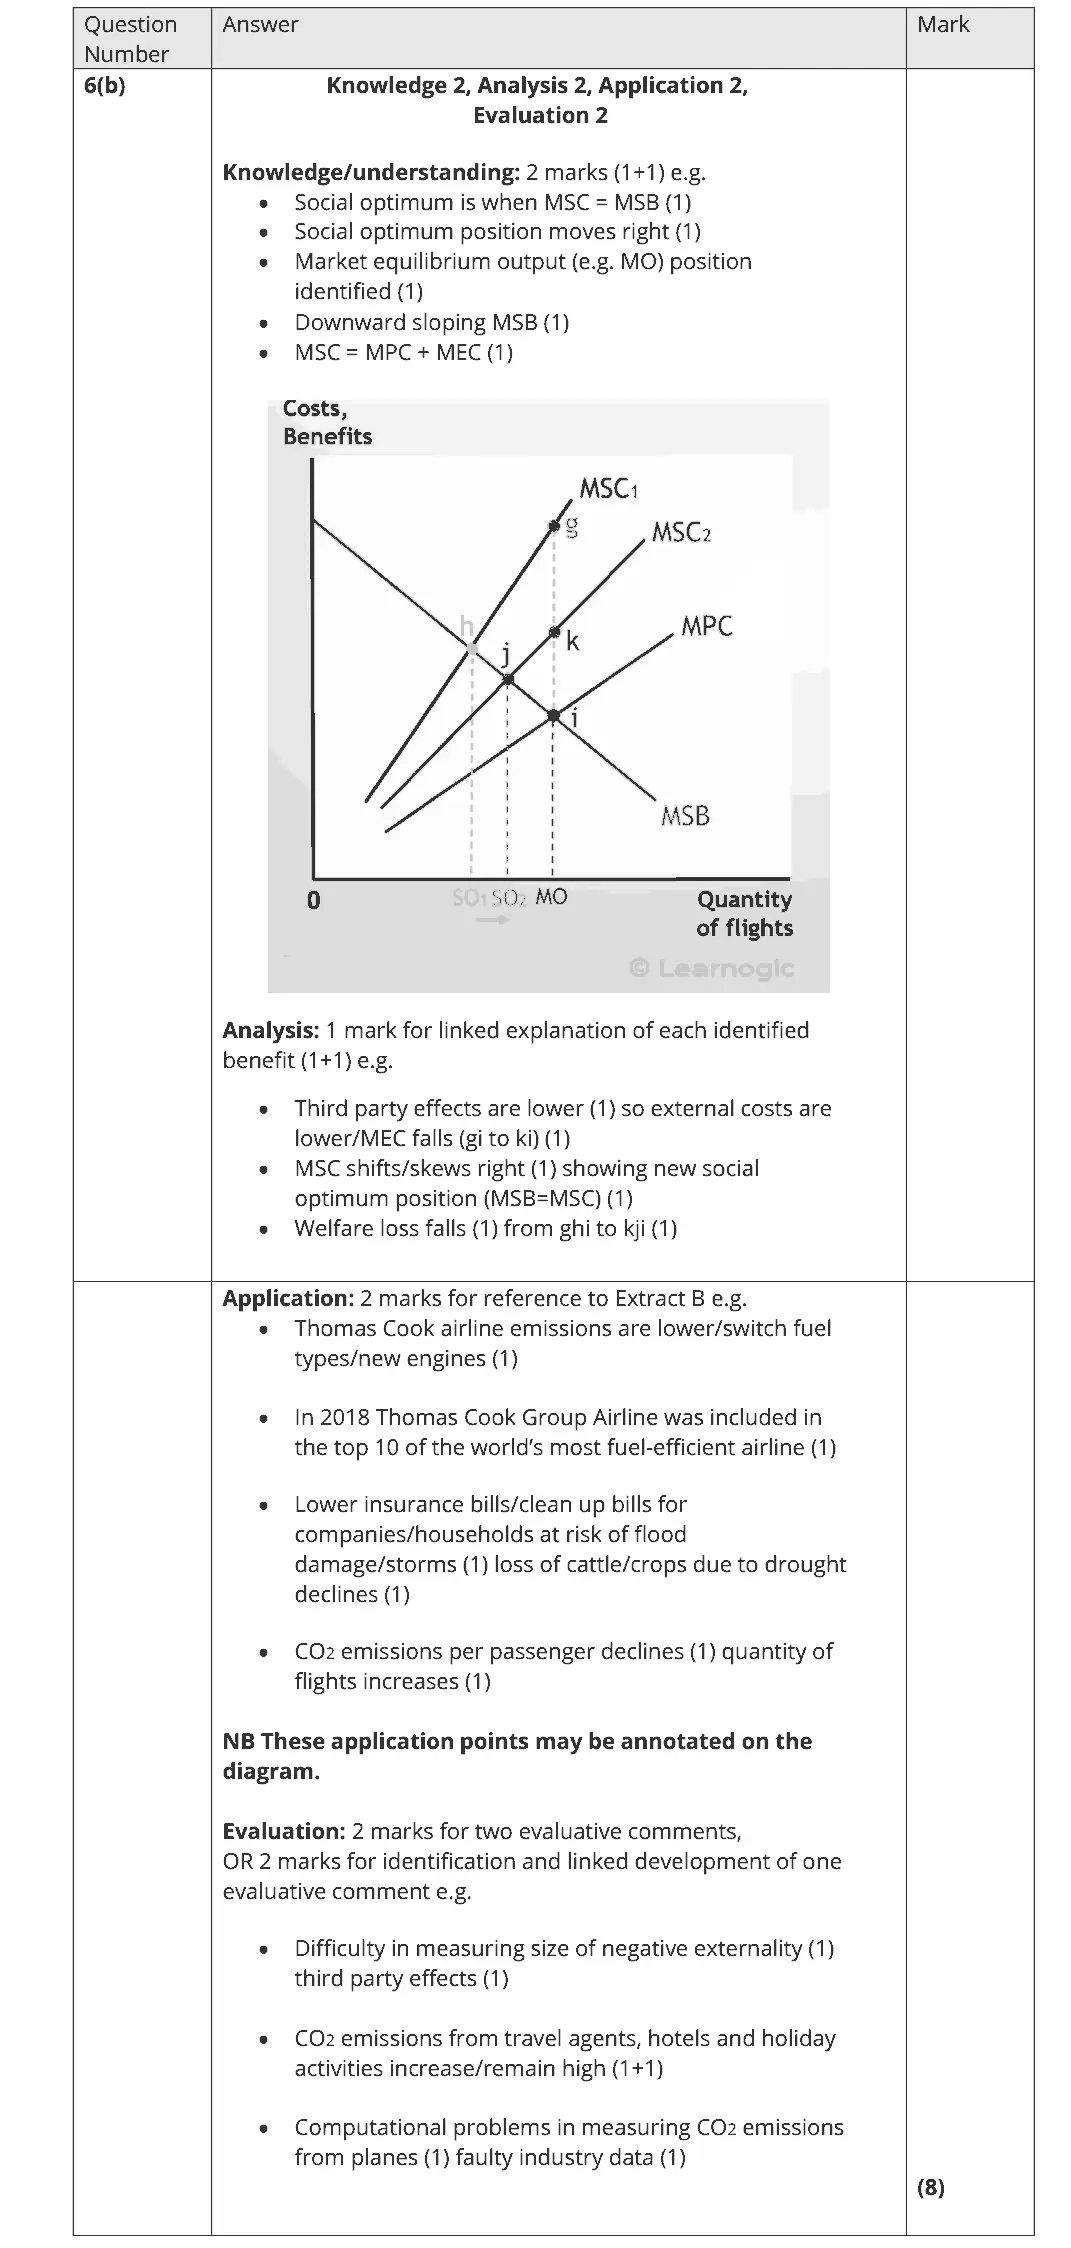
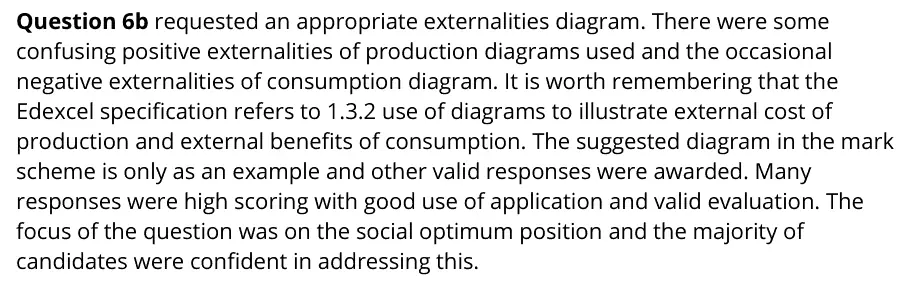
Question 6b requested an appropriate externalities diagram. There were some confusing positive externalities of production diagrams used and the occasional negative externalities of consumption diagram. It is worth remembering that the Edexcel specification refers to 1.3.2 use of diagrams to illustrate external cost of production and external benefits of consumption. The suggested diagram in the mark scheme is only as an example and other valid responses were awarded. Many responses were high scoring with good use of application and valid evaluation. The focus of the question was on the social optimum position and the majority of candidates were confident in addressing this.
Quantitative skills: QS 4 (construct and interpret a range of standard graphical forms)

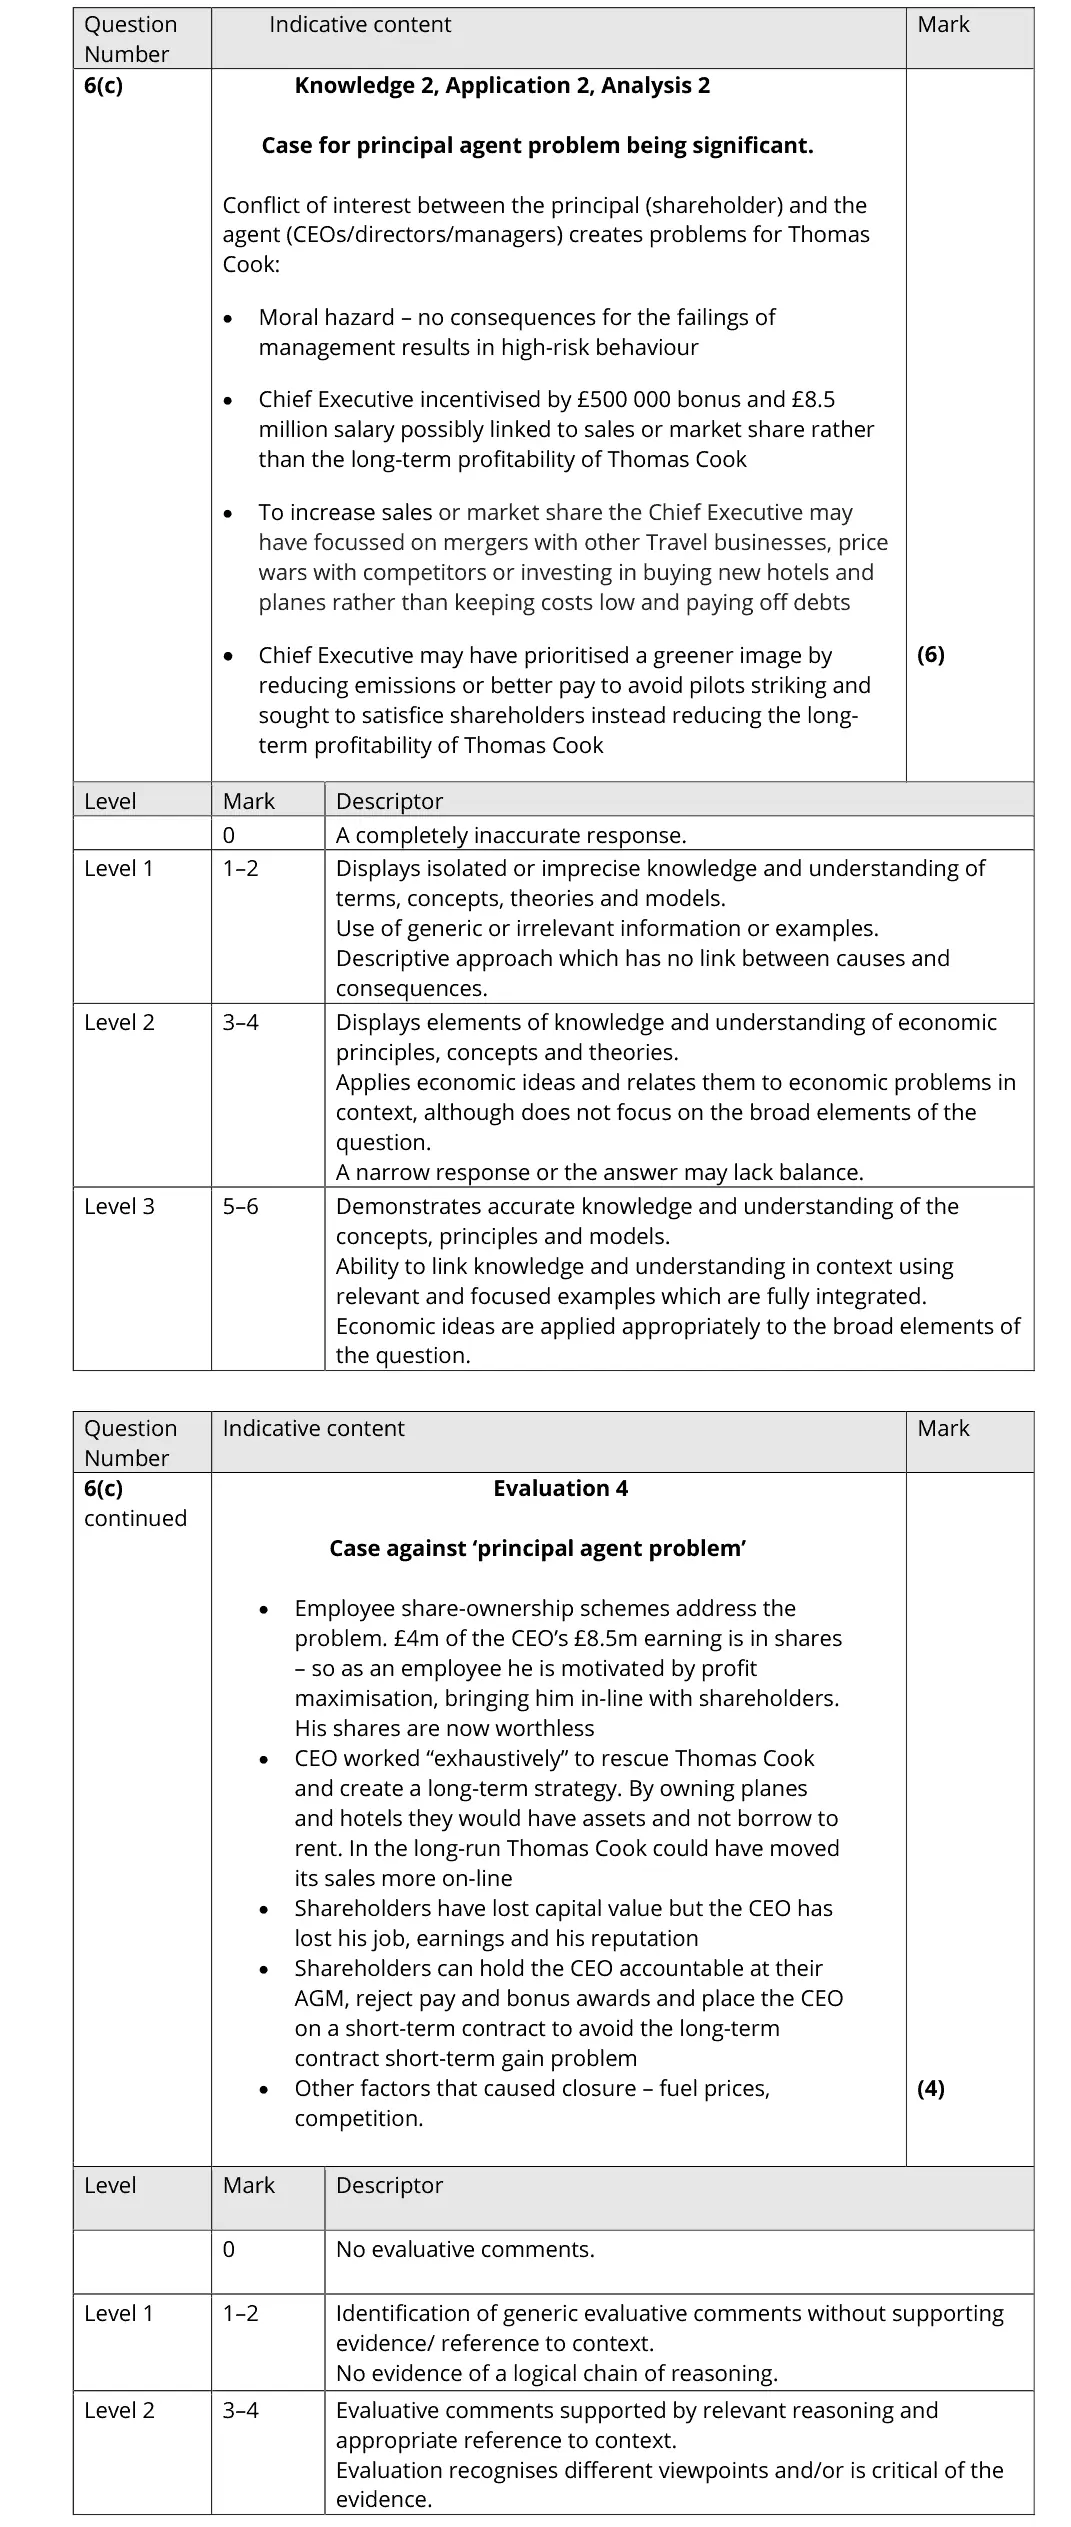
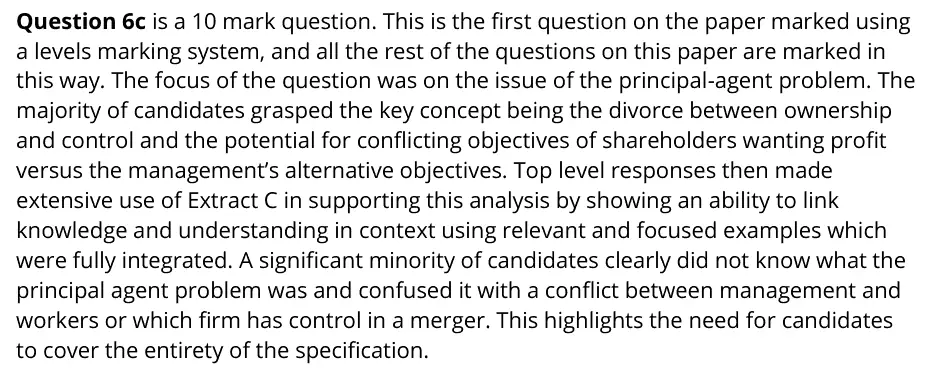
Question 6c is a 10 mark question. This is the first question on the paper marked using a levels marking system, and all the rest of the questions on this paper are marked in this way. The focus of the question was on the issue of the principal-agent problem. The majority of candidates grasped the key concept being the divorce between ownership and control and the potential for conflicting objectives of shareholders wanting profit versus the management’s alternative objectives. Top level responses then made extensive use of Extract C in supporting this analysis by showing an ability to link knowledge and understanding in context using relevant and focused examples which were fully integrated. A significant minority of candidates clearly did not know what the principal agent problem was and confused it with a conflict between management and workers or which firm has control in a merger. This highlights the need for candidates to cover the entirety of the specification.

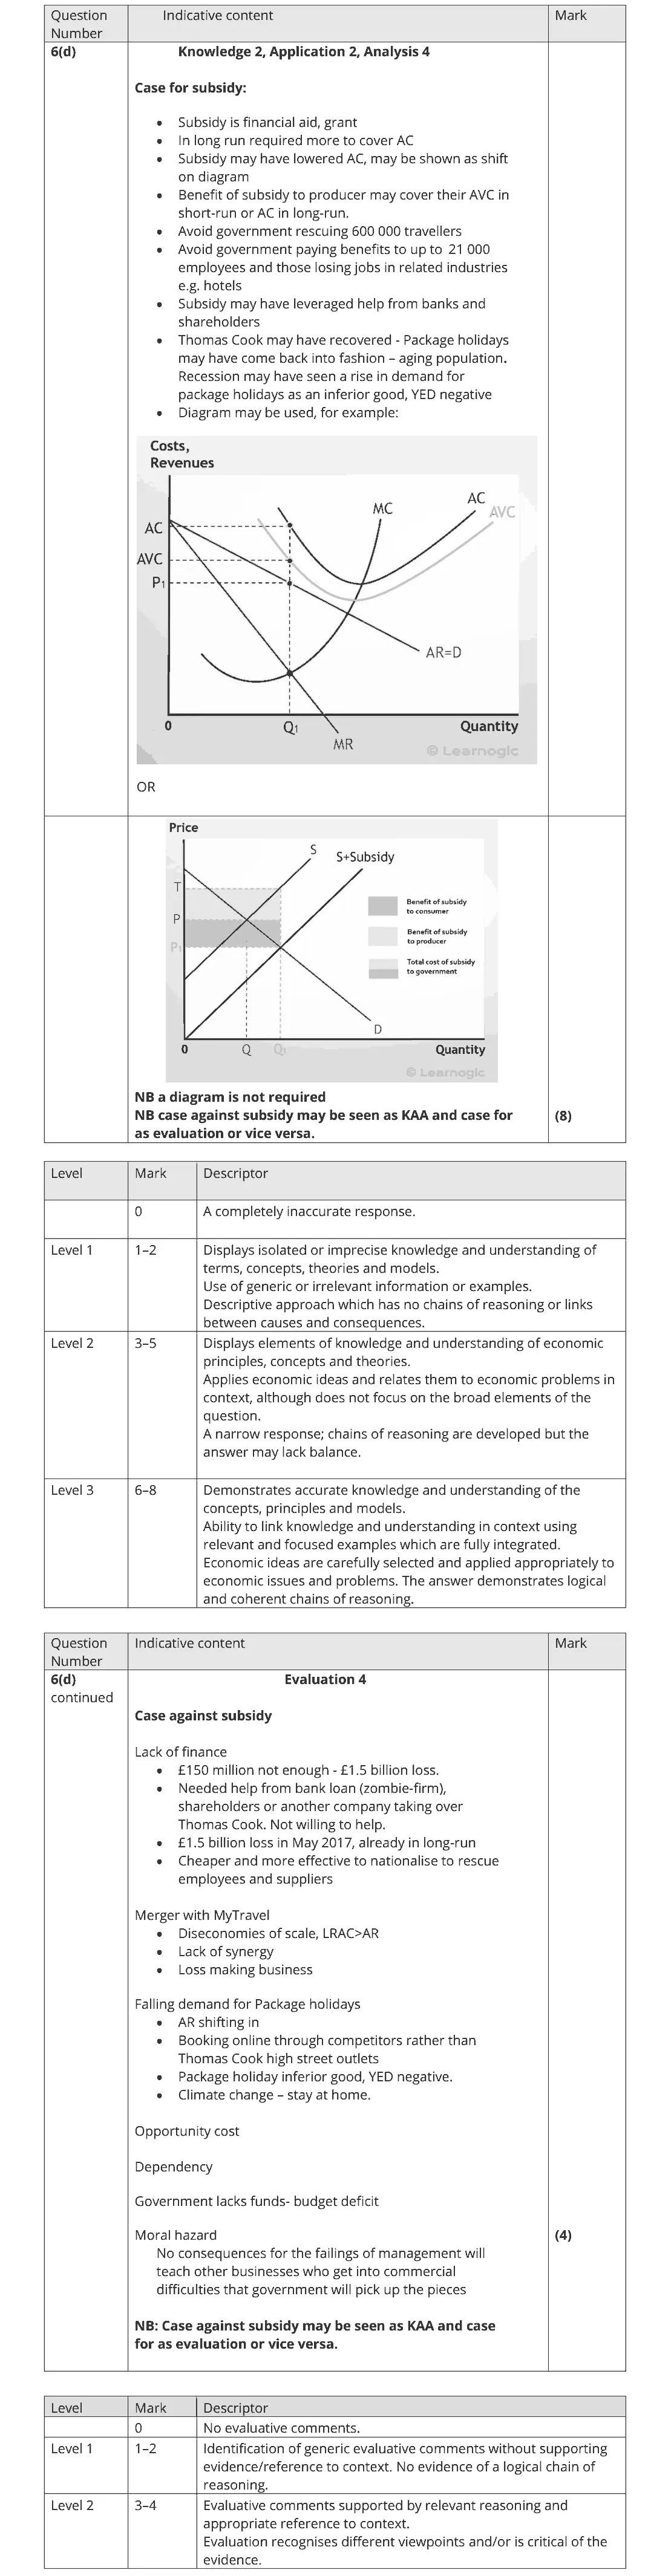
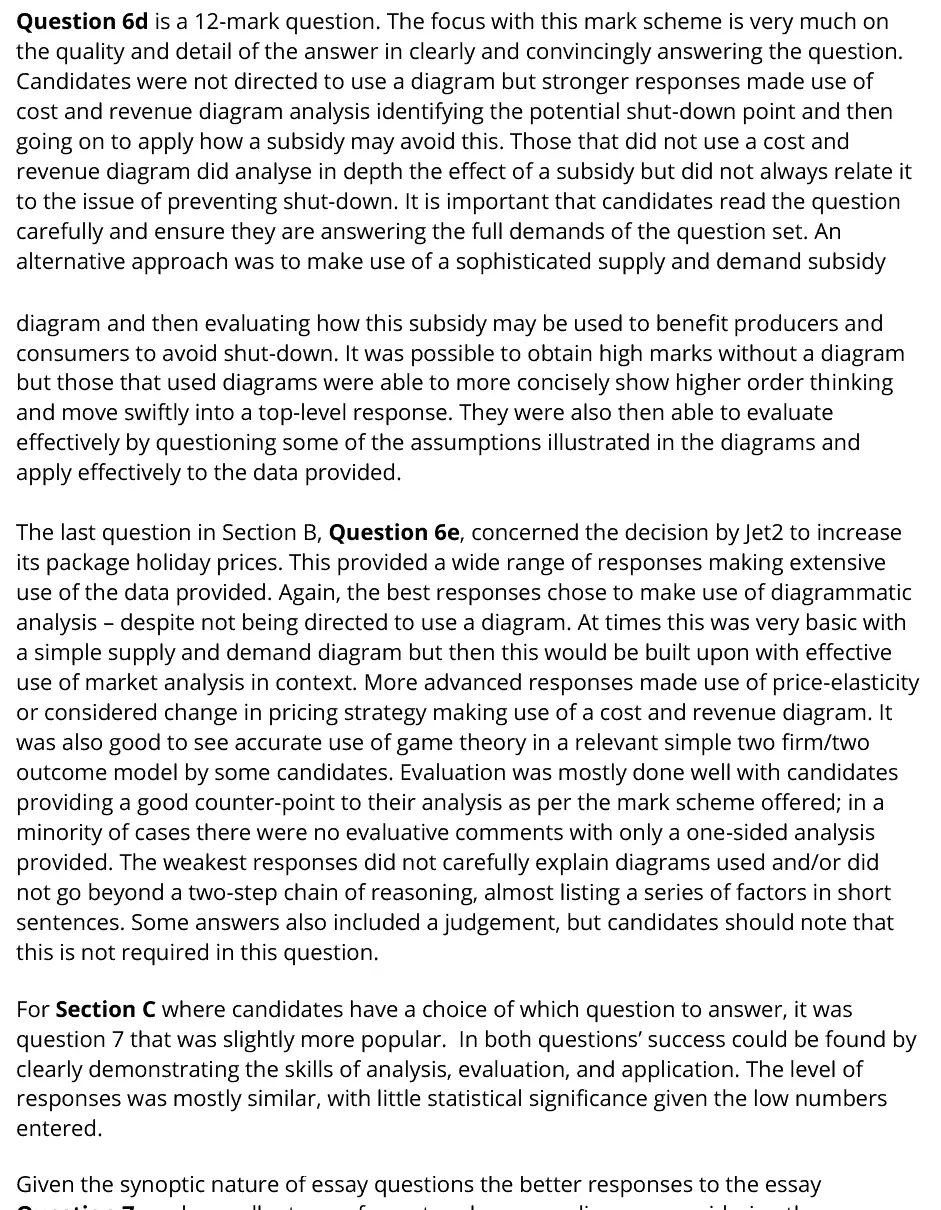
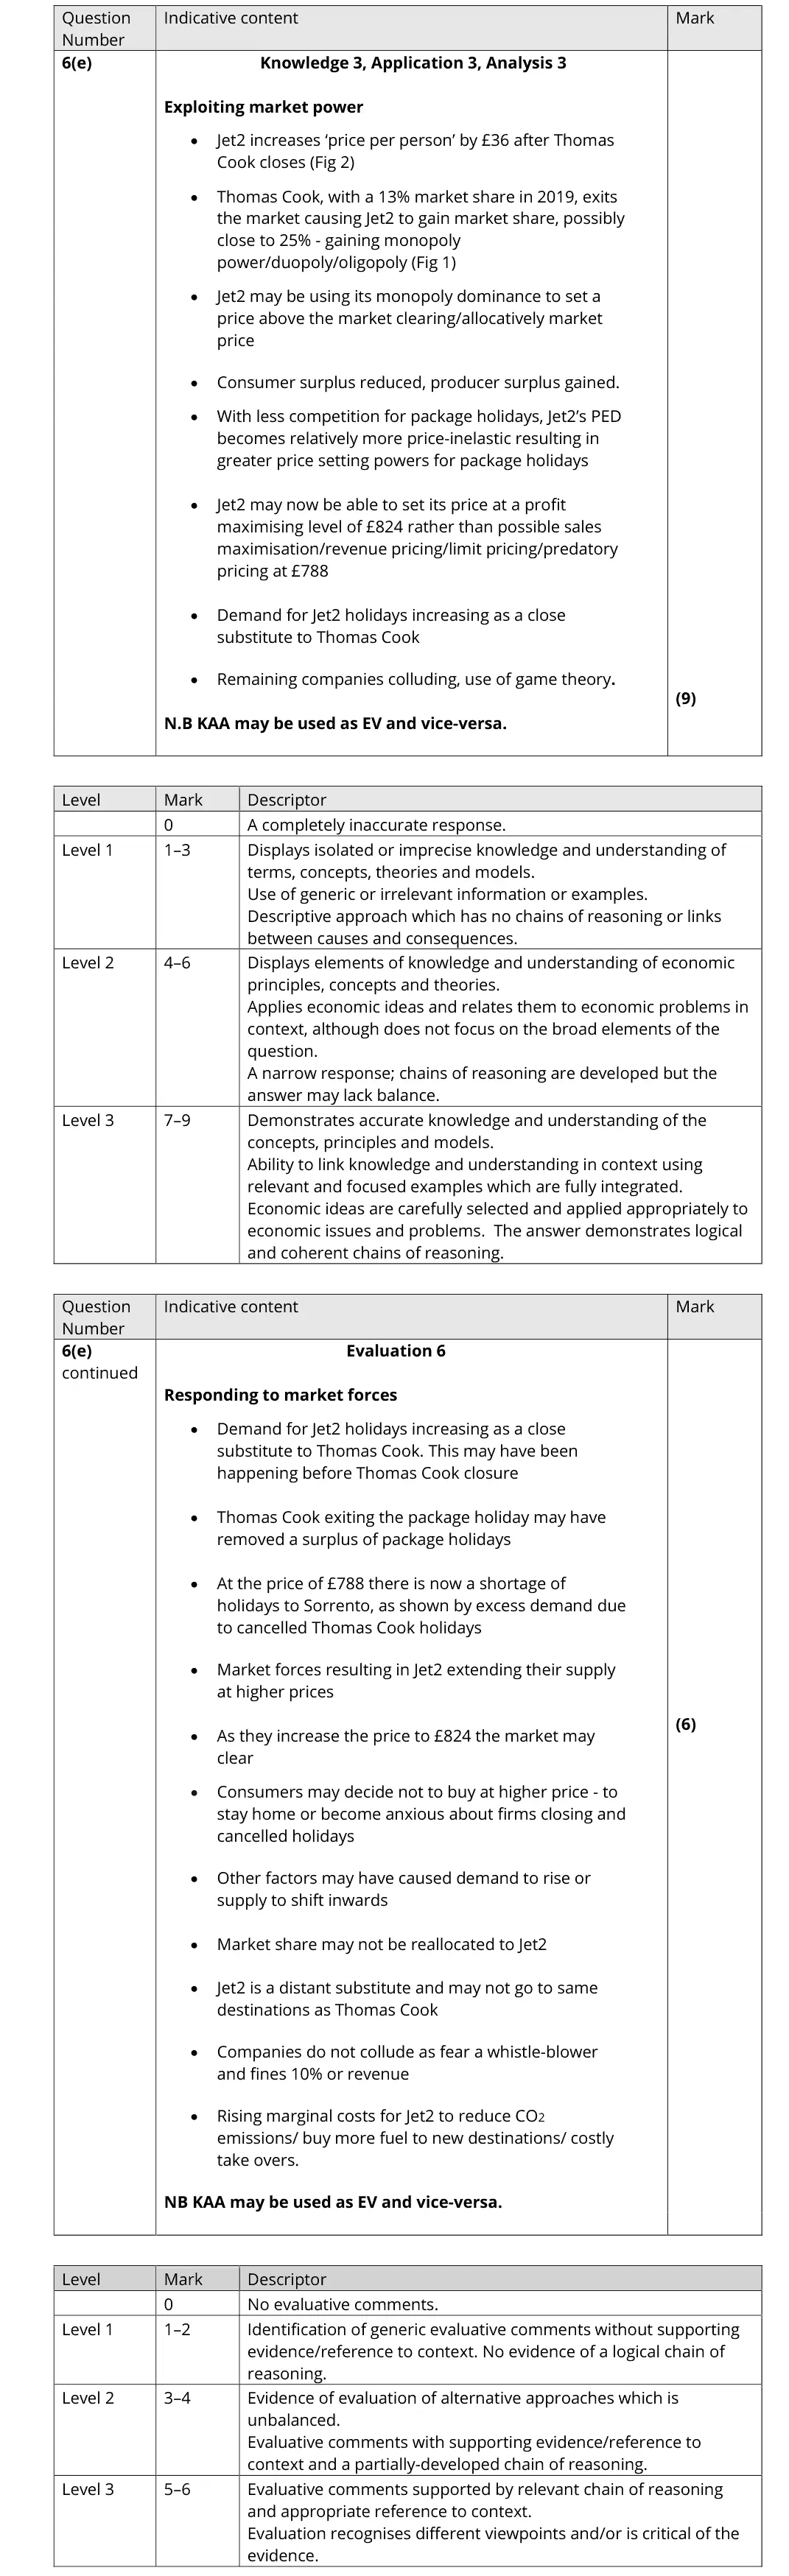
Question 6d is a 12-mark question. The focus with this mark scheme is very much on the quality and detail of the answer in clearly and convincingly answering the question. Candidates were not directed to use a diagram but stronger responses made use of cost and revenue diagram analysis identifying the potential shut-down point and then going on to apply how a subsidy may avoid this. Those that did not use a cost and revenue diagram did analyse in depth the effect of a subsidy but did not always relate it to the issue of preventing shut-down. It is important that candidates read the question carefully and ensure they are answering the full demands of the question set. An alternative approach was to make use of a sophisticated supply and demand subsidy diagram and then evaluating how this subsidy may be used to benefit producers and consumers to avoid shut-down. It was possible to obtain high marks without a diagram but those that used diagrams were able to more concisely show higher order thinking and move swiftly into a top-level response. They were also then able to evaluate effectively by questioning some of the assumptions illustrated in the diagrams and apply effectively to the data provided. The last question in Section B, Question 6e, concerned the decision by Jet2 to increase its package holiday prices. This provided a wide range of responses making extensive use of the data provided. Again, the best responses chose to make use of diagrammatic analysis – despite not being directed to use a diagram. At times this was very basic with a simple supply and demand diagram but then this would be built upon with effective use of market analysis in context. More advanced responses made use of price-elasticity or considered change in pricing strategy making use of a cost and revenue diagram. It was also good to see accurate use of game theory in a relevant simple two firm/two outcome model by some candidates. Evaluation was mostly done well with candidates providing a good counter-point to their analysis as per the mark scheme offered; in a minority of cases there were no evaluative comments with only a one-sided analysis provided. The weakest responses did not carefully explain diagrams used and/or did not go beyond a two-step chain of reasoning, almost listing a series of factors in short sentences. Some answers also included a judgement, but candidates should note that this is not required in this question. For Section C where candidates have a choice of which question to answer, it was question 7 that was slightly more popular. In both questions’ success could be found by clearly demonstrating the skills of analysis, evaluation, and application. The level of responses was mostly similar, with little statistical significance given the low numbers entered. Given the synoptic nature of essay questions the better responses to the essay

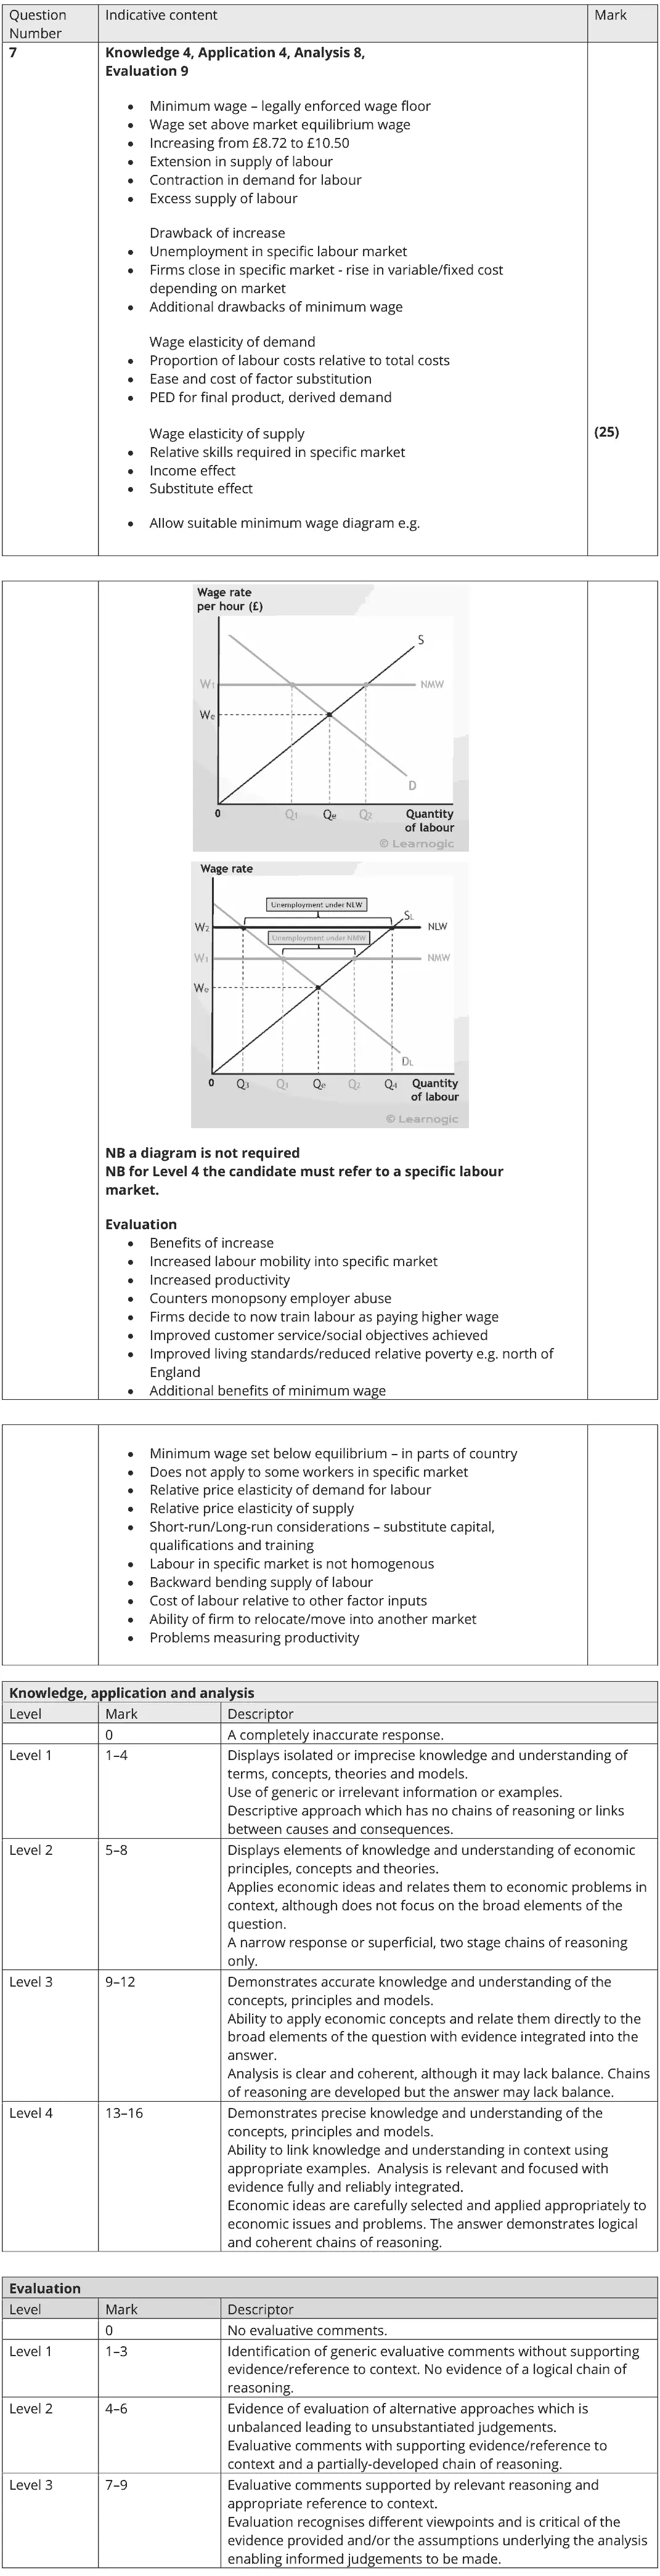
Quantitative skills: QS 9 (interpret, apply and analyse information in written, graphical tabular and numerical forms)
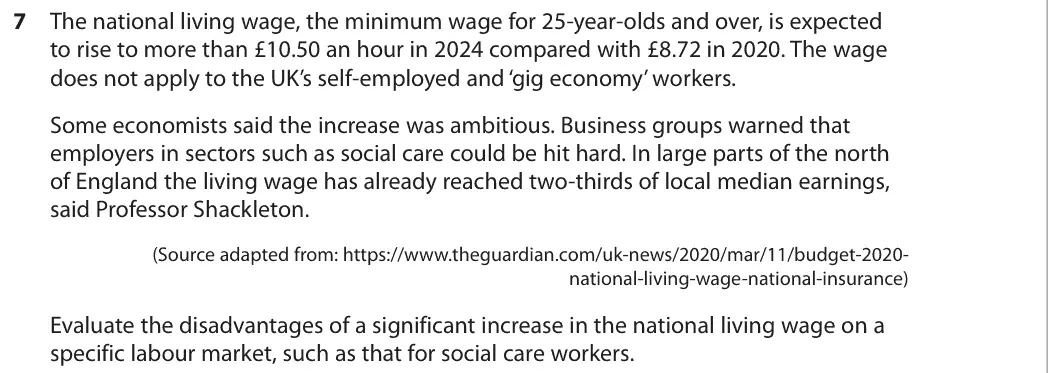
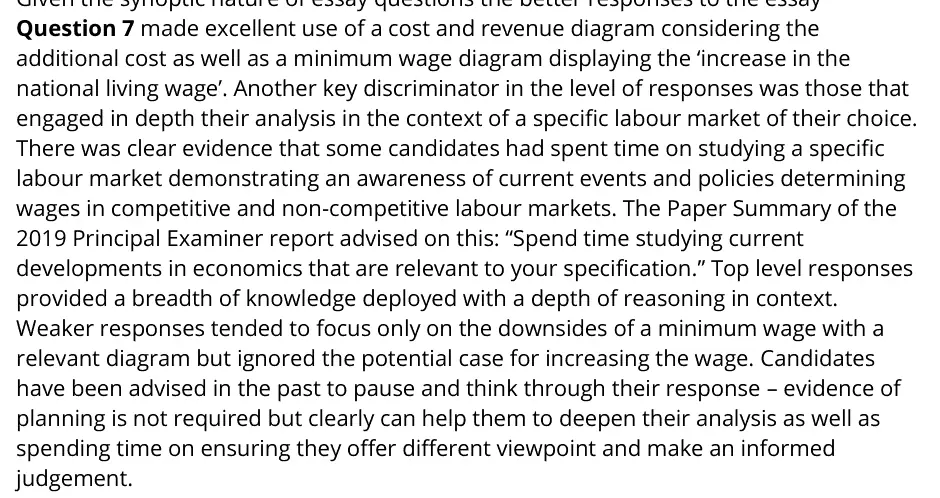
Question 7 made excellent use of a cost and revenue diagram considering the additional cost as well as a minimum wage diagram displaying the ‘increase in the national living wage’. Another key discriminator in the level of responses was those that engaged in depth their analysis in the context of a specific labour market of their choice. There was clear evidence that some candidates had spent time on studying a specific labour market demonstrating an awareness of current events and policies determining wages in competitive and non-competitive labour markets. The Paper Summary of the 2019 Principal Examiner report advised on this: “Spend time studying current developments in economics that are relevant to your specification.” Top level responses provided a breadth of knowledge deployed with a depth of reasoning in context. Weaker responses tended to focus only on the downsides of a minimum wage with a relevant diagram but ignored the potential case for increasing the wage. Candidates have been advised in the past to pause and think through their response – evidence of planning is not required but clearly can help them to deepen their analysis as well as spending time on ensuring they offer different viewpoint and make an informed judgement.

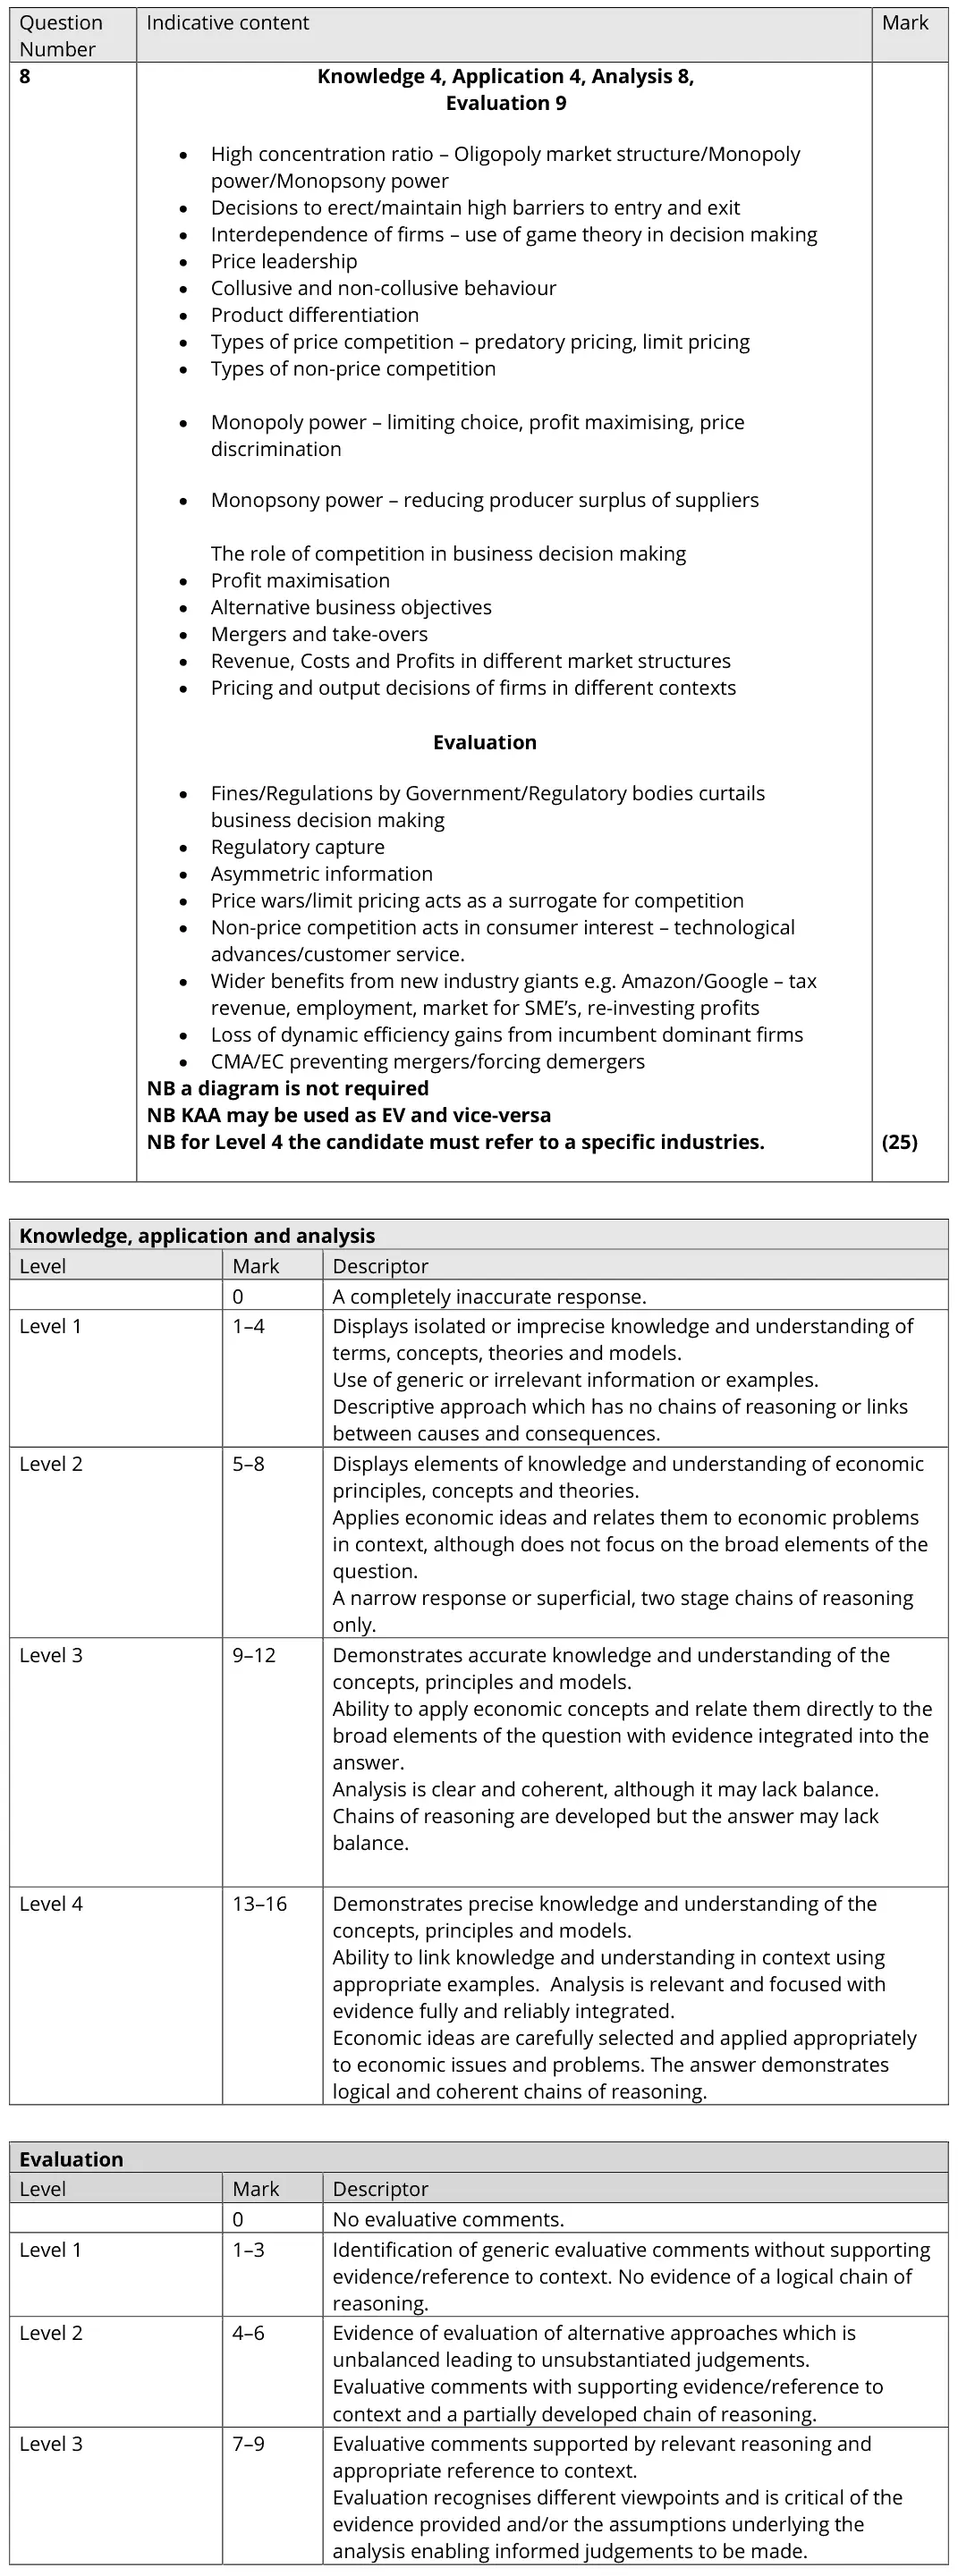
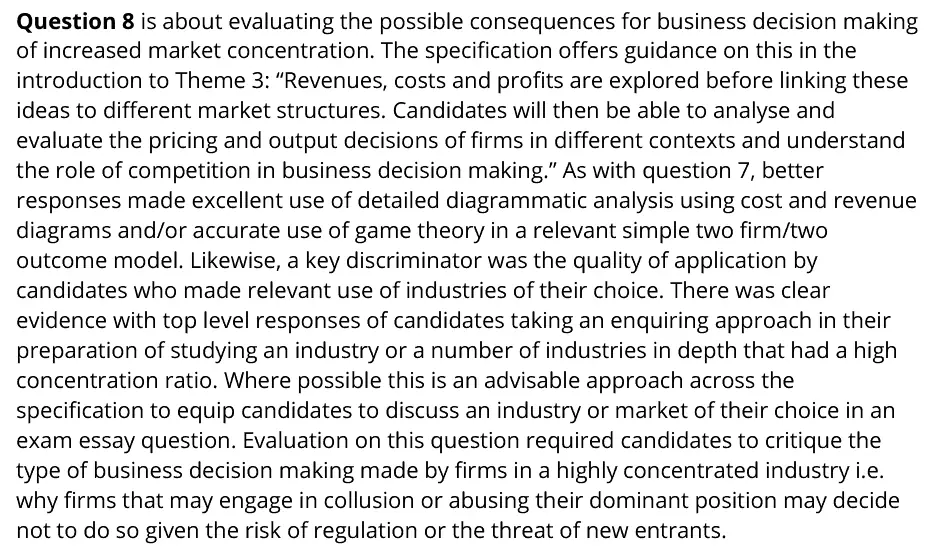
Question 8 is about evaluating the possible consequences for business decision making of increased market concentration. The specification offers guidance on this in the introduction to Theme 3: “Revenues, costs and profits are explored before linking these ideas to different market structures. Candidates will then be able to analyse and evaluate the pricing and output decisions of firms in different contexts and understand the role of competition in business decision making.” As with question 7, better responses made excellent use of detailed diagrammatic analysis using cost and revenue diagrams and/or accurate use of game theory in a relevant simple two firm/two outcome model. Likewise, a key discriminator was the quality of application by candidates who made relevant use of industries of their choice. There was clear evidence with top level responses of candidates taking an enquiring approach in their preparation of studying an industry or a number of industries in depth that had a high concentration ratio. Where possible this is an advisable approach across the specification to equip candidates to discuss an industry or market of their choice in an exam essay question. Evaluation on this question required candidates to critique the type of business decision making made by firms in a highly concentrated industry i.e. why firms that may engage in collusion or abusing their dominant position may decide not to do so given the risk of regulation or the threat of new entrants.
Want a paper marked and gone through with you? Message us.