June 2025: AS Paper 2

80 marks · 19 question parts · Paper, mark scheme and report on Pearson's site

Question by question

QTopicMarksAOType
1(a) Employment and unemployment 1Multiple choice
1(b) Demand-side policies: fiscal and monetary policy 3AO1=1,AO2=1,AO3=1Short answer
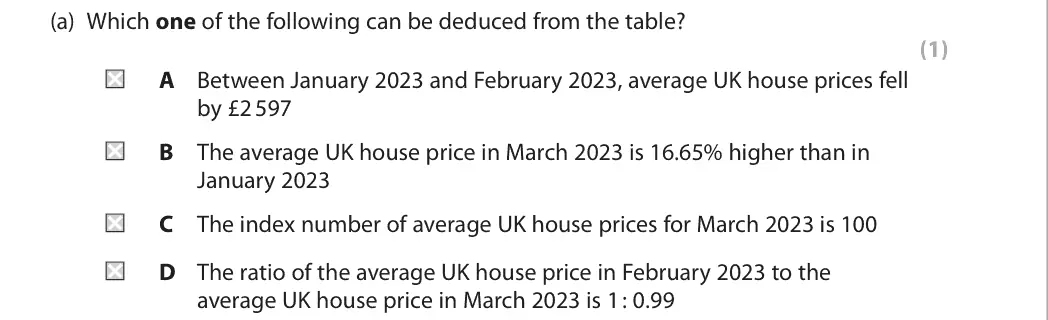
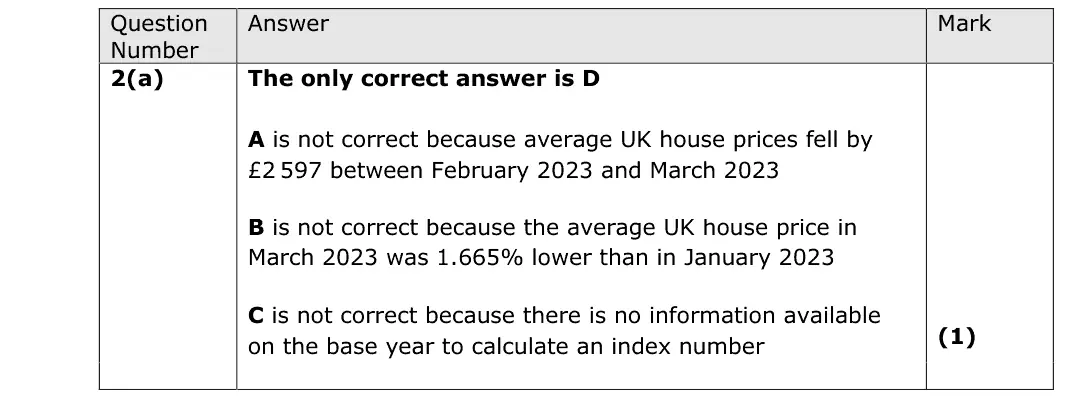
2(a) Aggregate demand 1Multiple choice
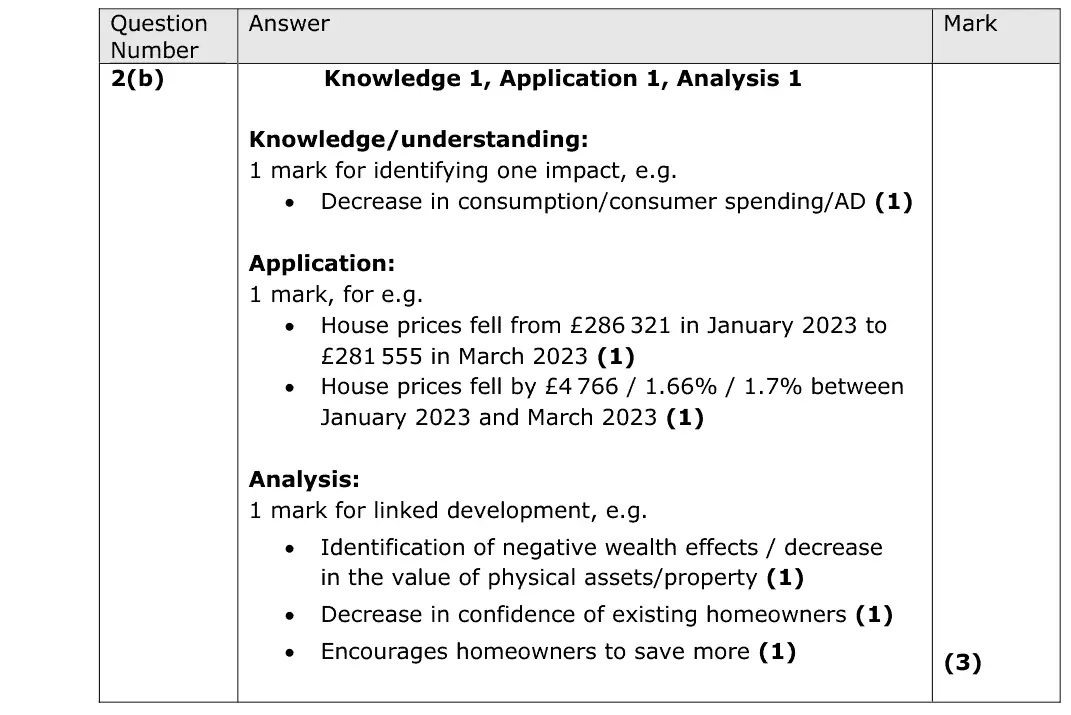
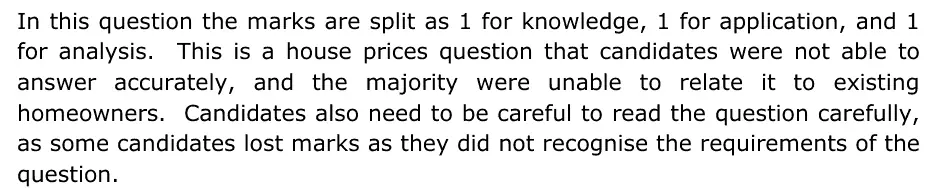
2(b) Aggregate demand 3AO1=1,AO2=1,AO3=1Short answer
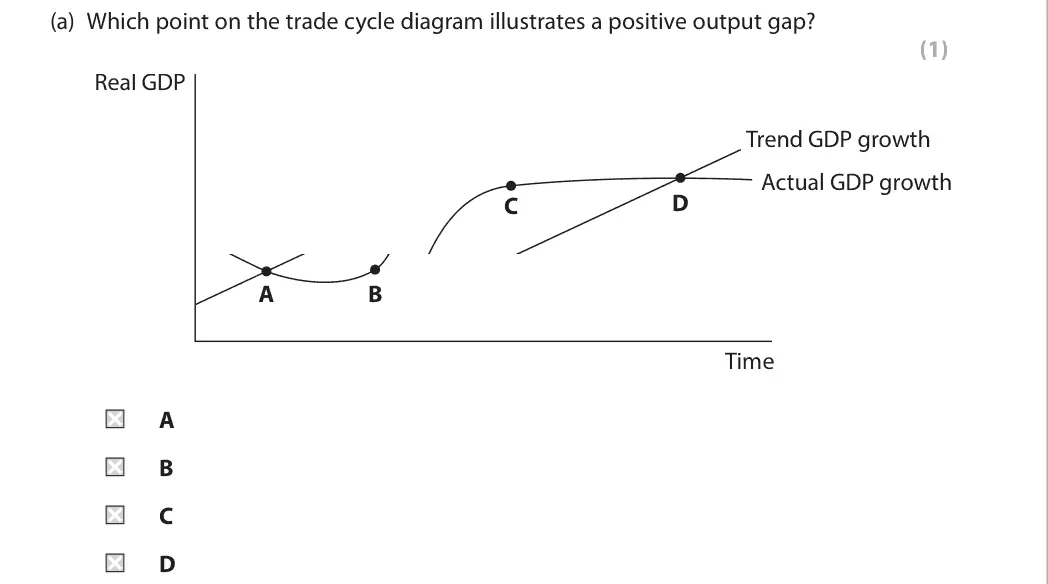
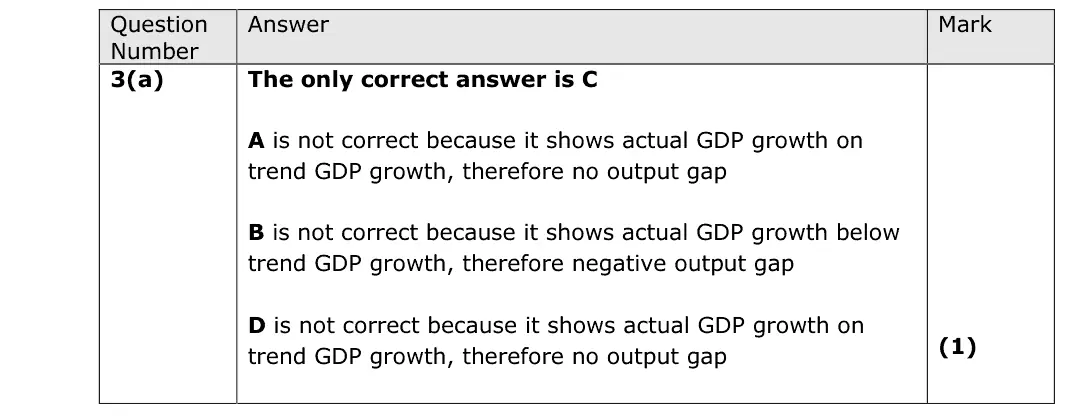
3(a) Economic growth, output gaps and the trade cycle 1Multiple choice
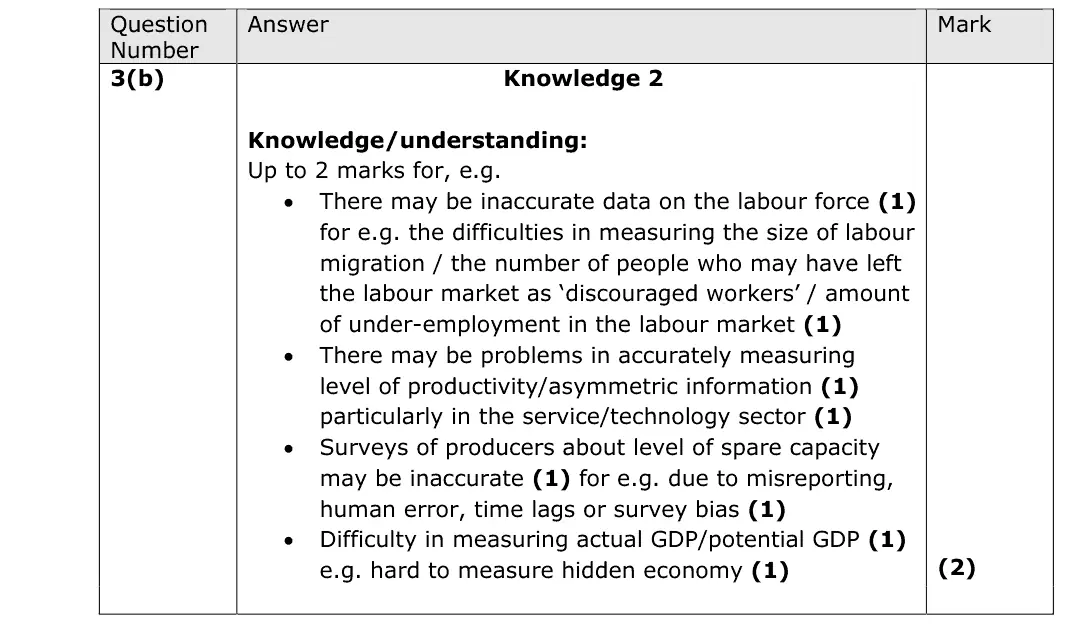
3(b) Economic growth, output gaps and the trade cycle 2AO1=2Short answer
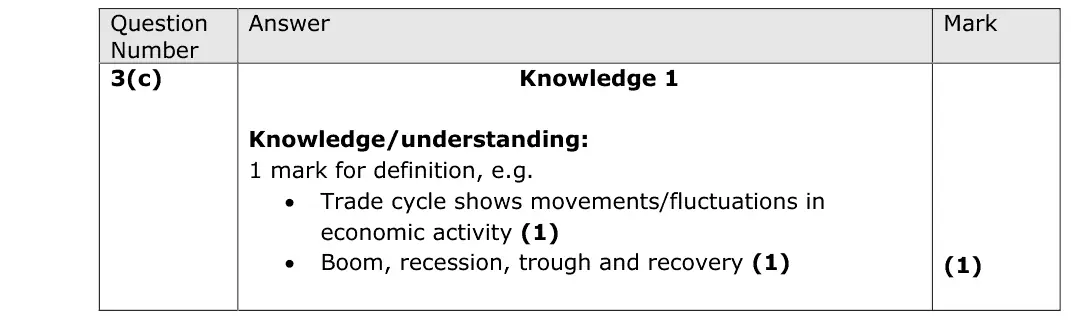
3(c) Economic growth, output gaps and the trade cycle 1AO1=1Definition
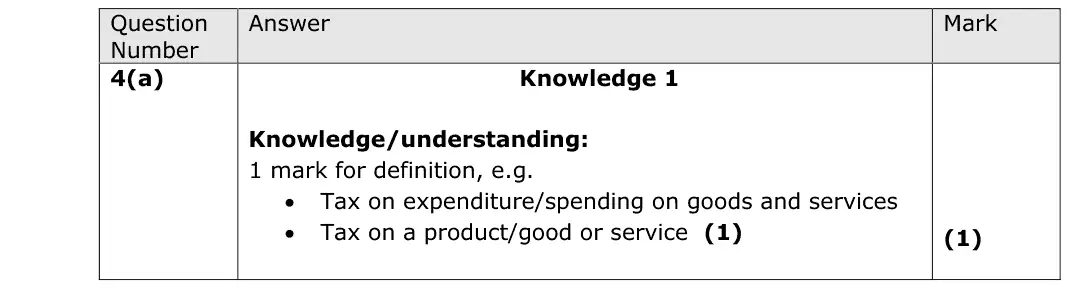
4(a) Demand-side policies: fiscal and monetary policy 1AO1=1Definition
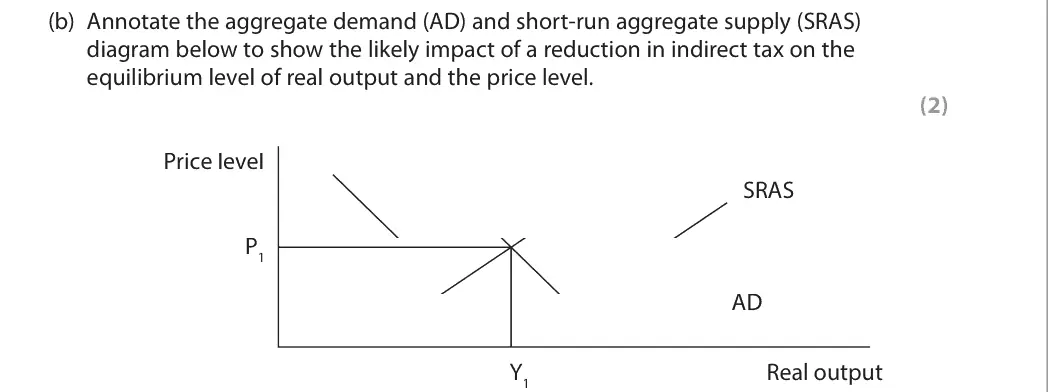
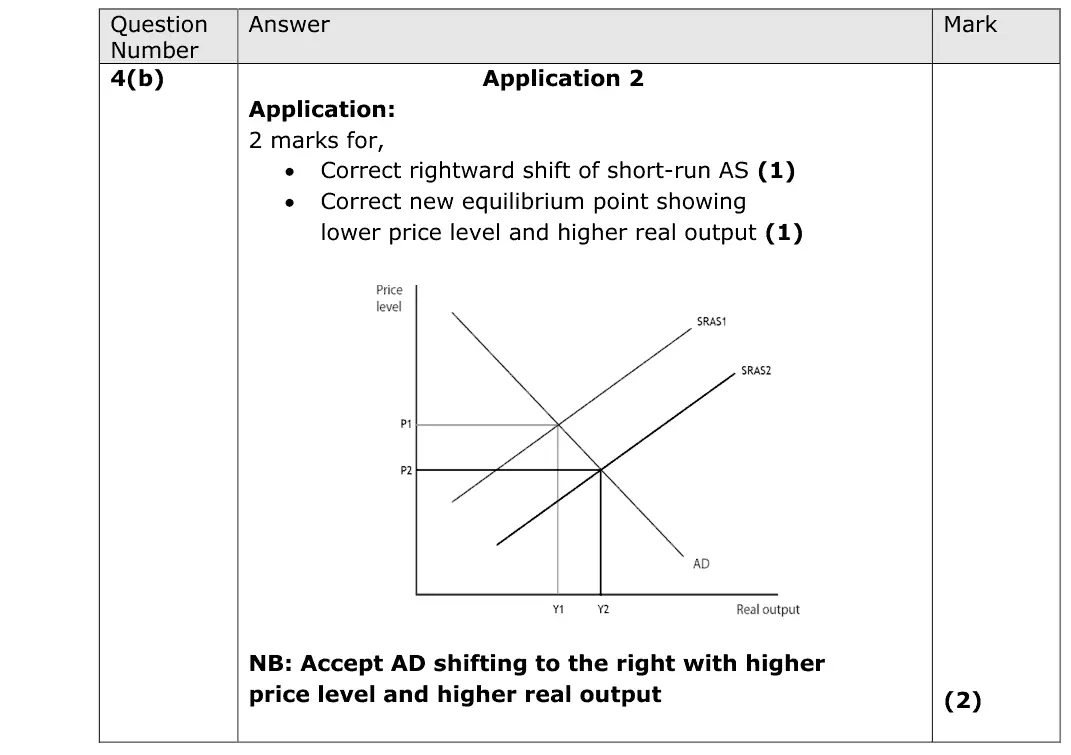
4(b) Aggregate supply, The circular flow, national income and the multiplier 2AO2=2Diagram
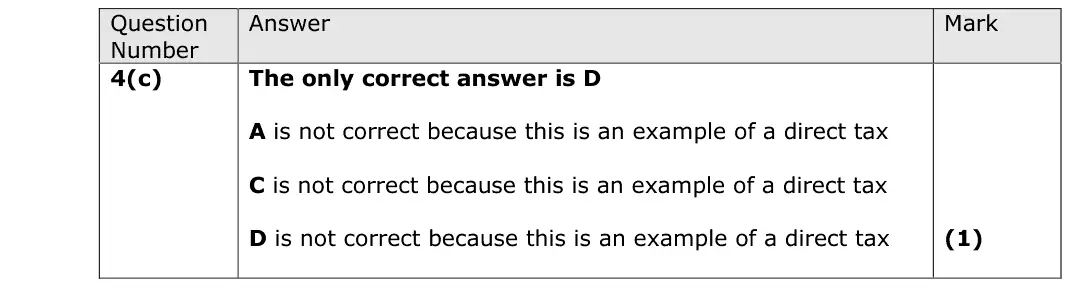
4(c) Demand-side policies: fiscal and monetary policy 1Multiple choice
5(a) The balance of payments 1Multiple choice
5(b) The balance of payments, Aggregate demand 3AO1=1,AO2=1,AO3=1Short answer
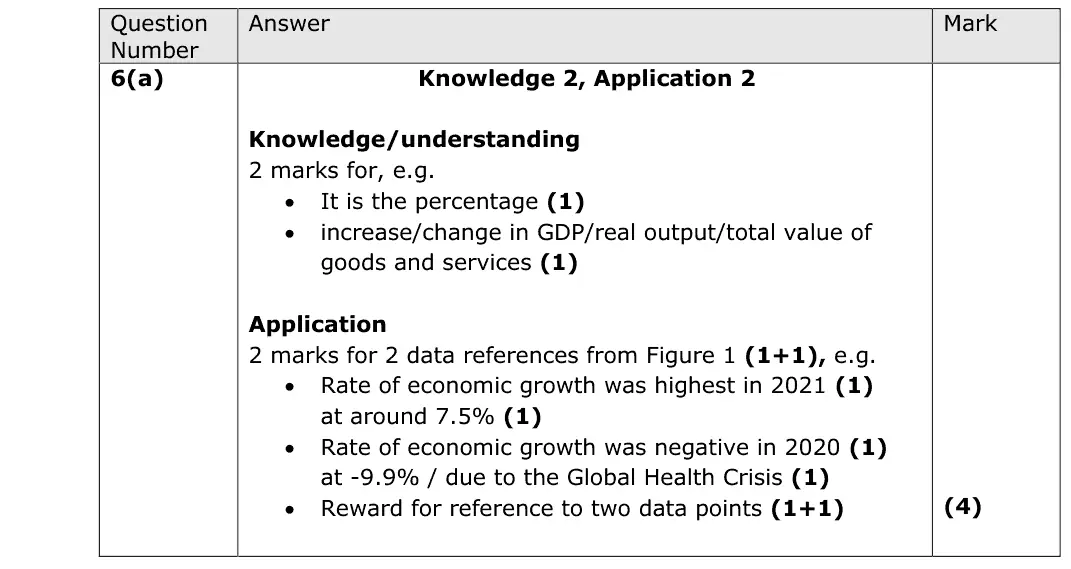
6(a) Measuring economic growth: GDP, GNI and living standards 4AO1=2,AO2=2Short answer
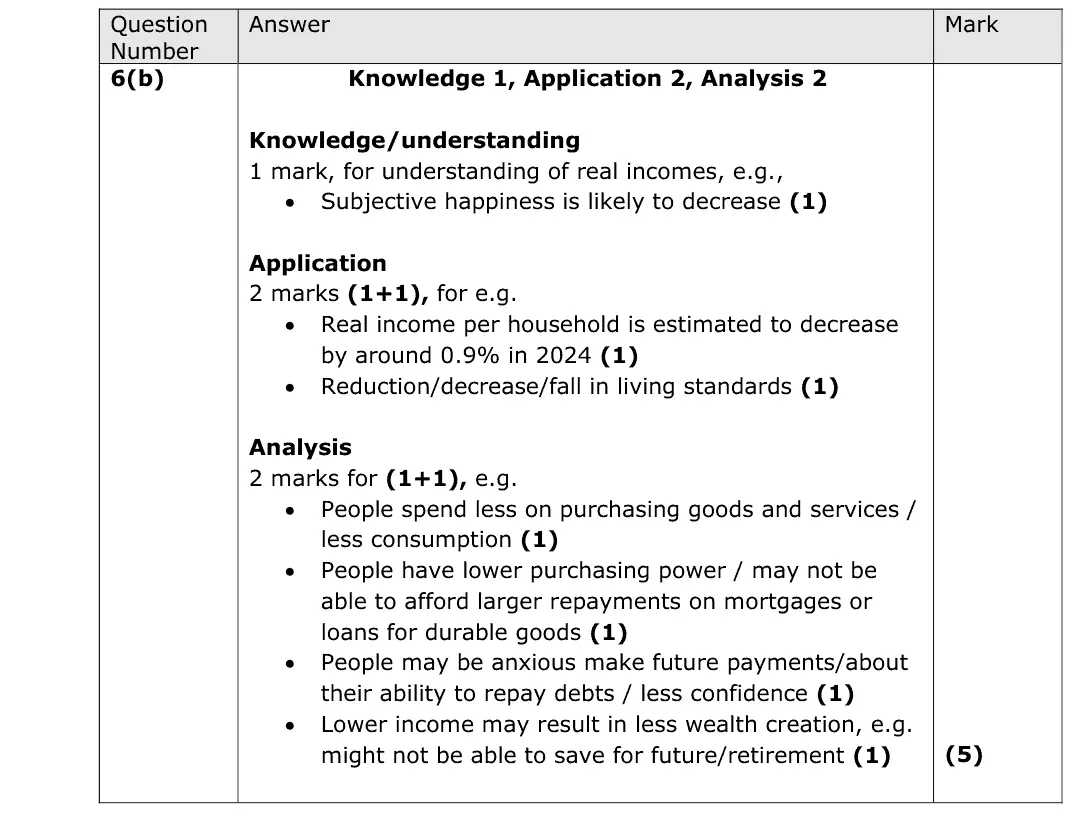
6(b) Measuring economic growth: GDP, GNI and living standards 5AO1=1,AO2=2,AO3=2Short answer
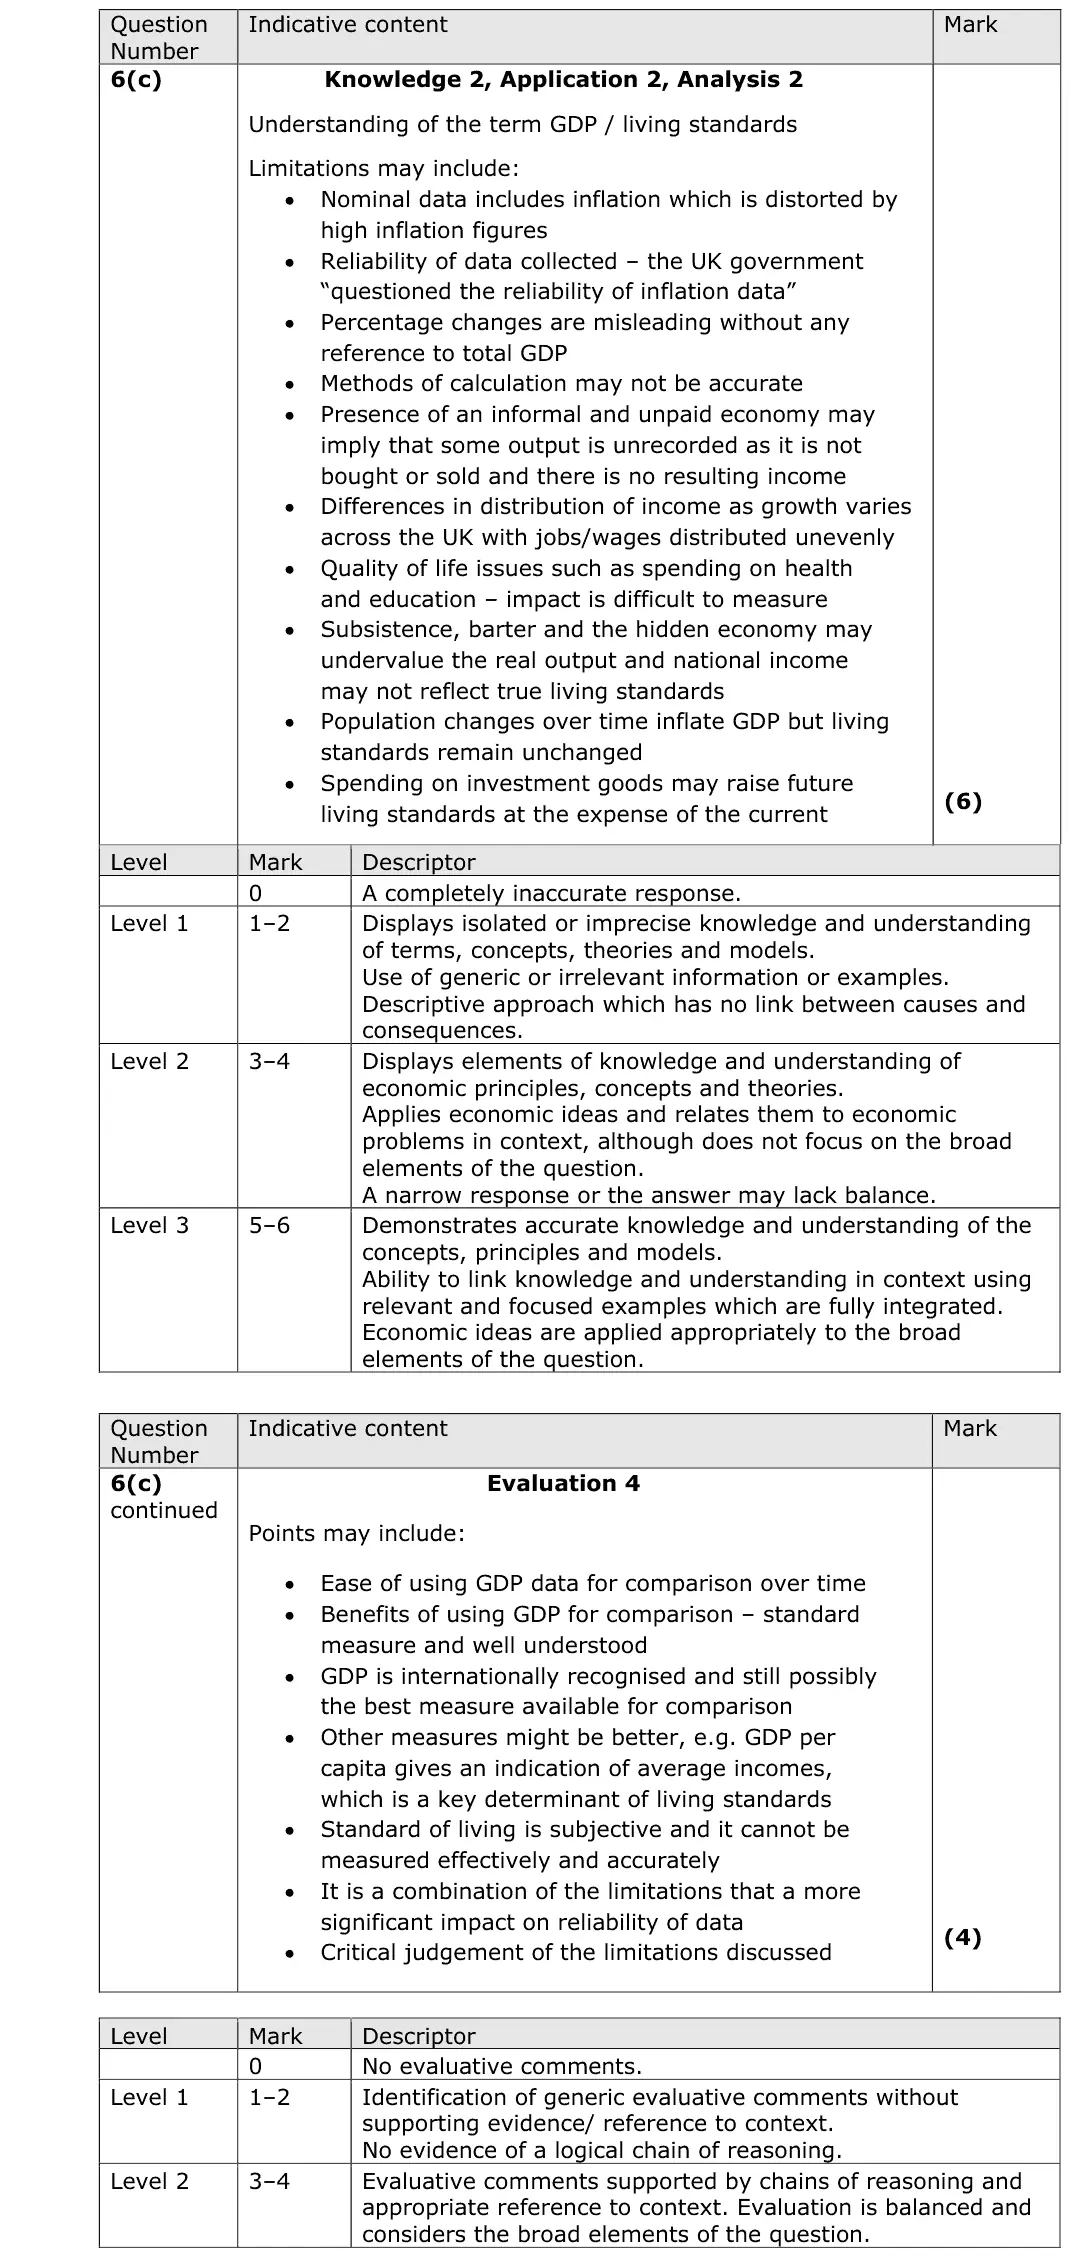
6(c) Measuring economic growth: GDP, GNI and living standards 10AO1=2,AO2=2,AO3=2,AO4=4Extended response
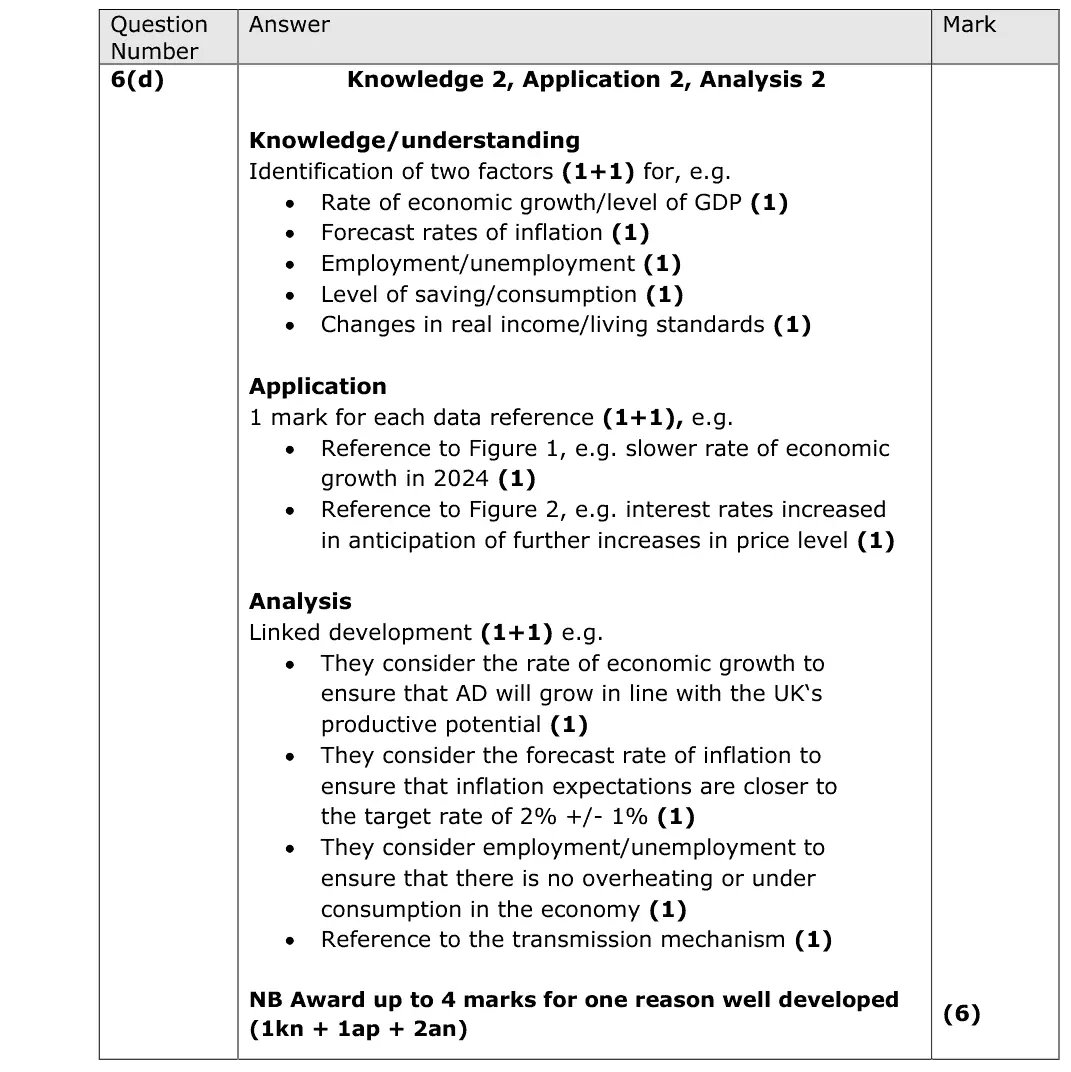
6(d) Demand-side policies: fiscal and monetary policy 6AO1=2,AO2=2,AO3=2Short answer
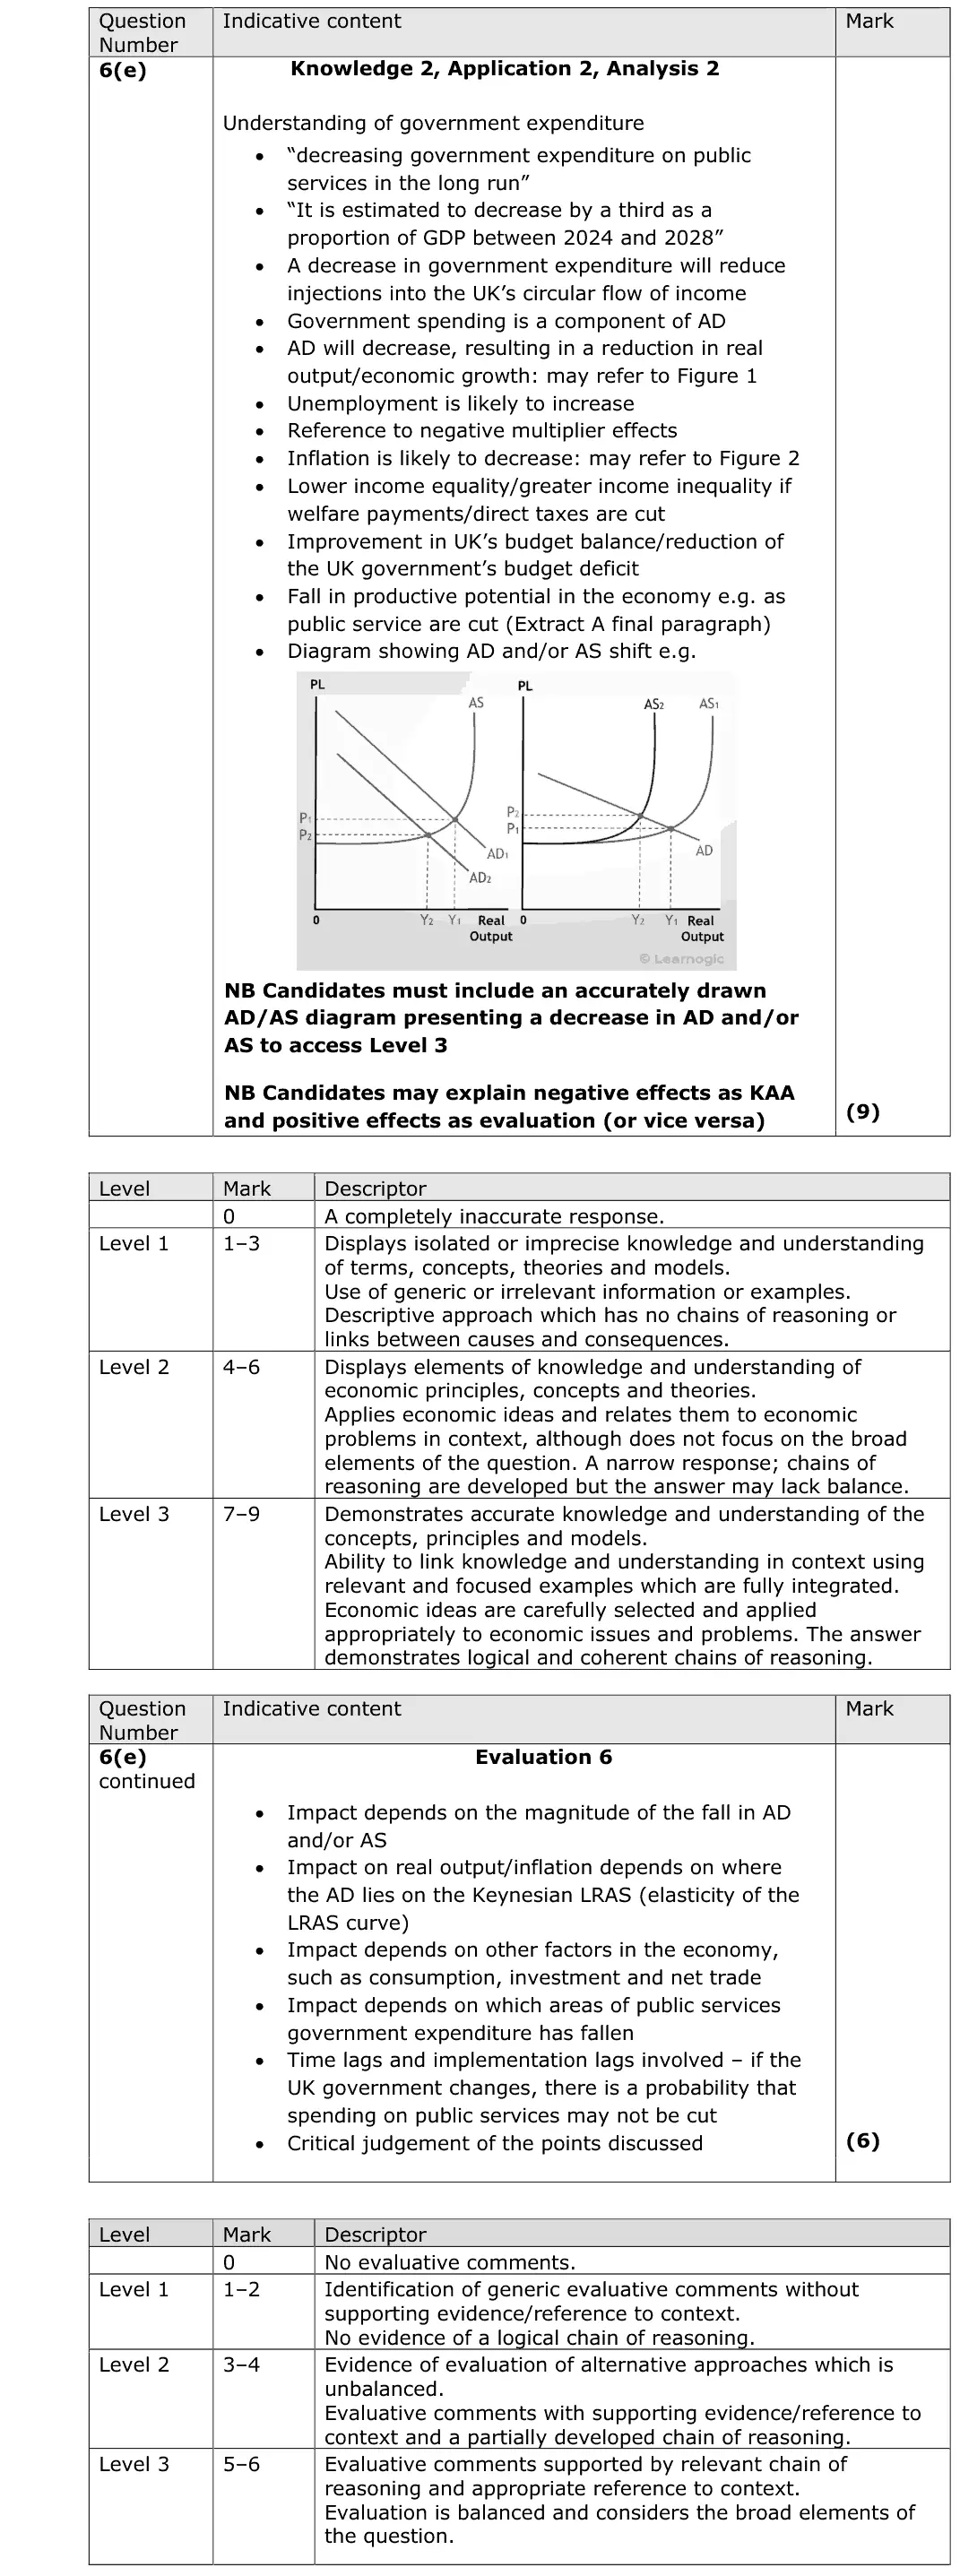
6(e) Aggregate demand, The circular flow, national income and the multiplier 15Extended response
6(f) Inflation 20AO1=4,AO2=4,AO3=6,AO4=6Essay
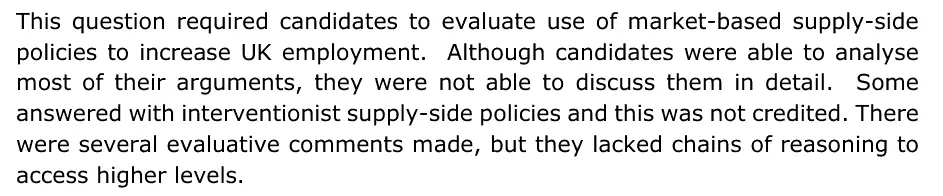
6(g) Supply-side policies 20AO1=4,AO2=4,AO3=6,AO4=6Essay

The questions

1(a)1(b)2(a)2(b)3(a)3(b)3(c)4(a)4(b)4(c)5(a)5(b)6(a)6(b)6(c)6(d)6(e)6(f)6(g)
June 2025 · AS Paper 2 · Q1(a) 1 mark Multiple choice unemployment
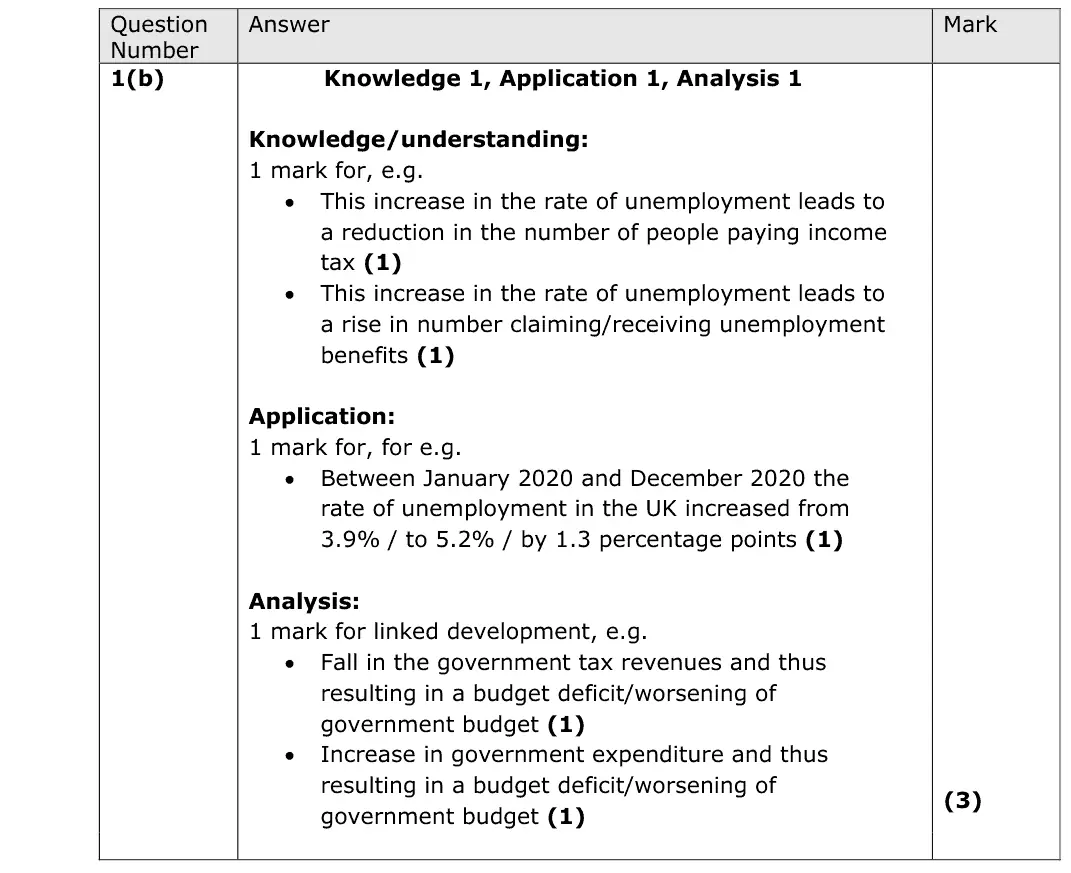
Data and extracts for question 11 Between January 2020 and December 2020, the rate of unemployment in the UK increased from 3.9% to 5.2%. This was as a result of the UK economy experiencing a recession.
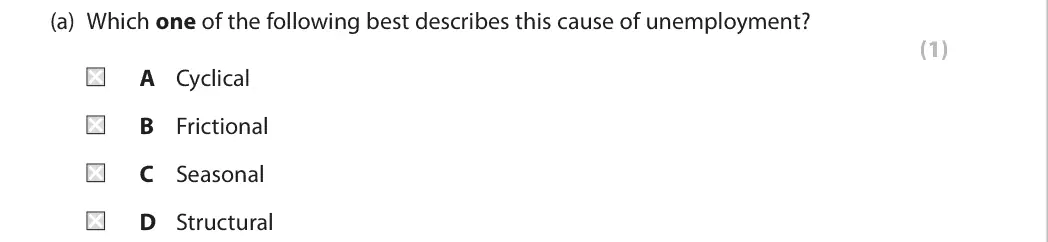
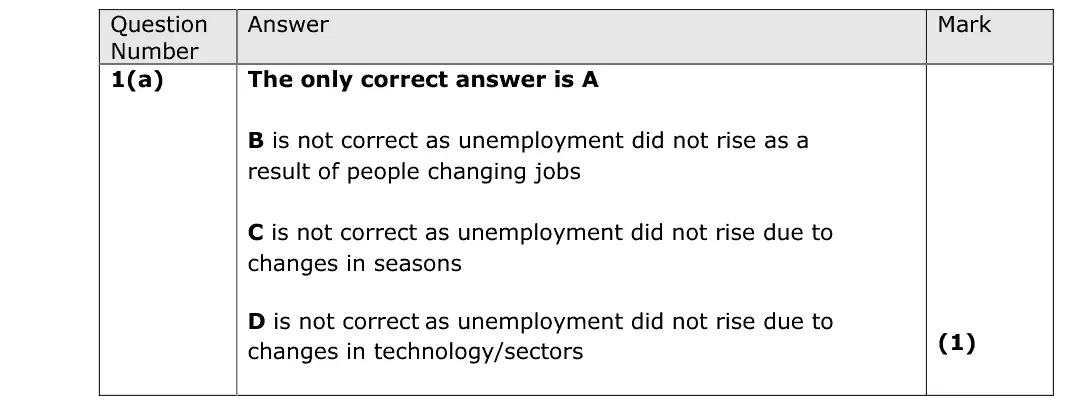
(a) Which one of the following best describes this cause of unemployment? (1) A Cyclical B Frictional C Seasonal D Structural
June 2025 · AS Paper 2 · Q1(b) 3 marks AO1=1, AO2=1, AO3=1 Short answer fiscal and monetary policy
Data and extracts for question 11 Between January 2020 and December 2020, the rate of unemployment in the UK increased from 3.9% to 5.2%. This was as a result of the UK economy experiencing a recession.
(b) With reference to the information above, explain one possible effect of the increase in the rate of unemployment on the UK government budget. (3)
June 2025 · AS Paper 2 · Q2(a) 1 mark Multiple choice aggregate demand
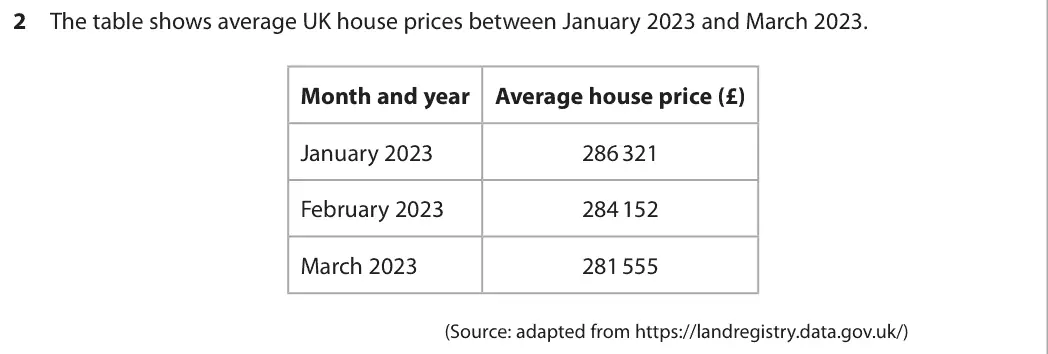
Data and extracts for question 22 The table shows average UK house prices between January 2023 and March 2023. Month and year Average house price (£) January 2023 286 321 February 2023 284 152 March 2023 281 555 (Source: adapted from https://landregistry.data.gov.uk/)
(a) Which one of the following can be deduced from the table? (1) A Between January 2023 and February 2023, average UK house prices fell by £2 597 B The average UK house price in March 2023 is 16.65% higher than in January 2023 C The index number of average UK house prices for March 2023 is 100 D The ratio of the average UK house price in February 2023 to the average UK house price in March 2023 is 1 : 0.99
June 2025 · AS Paper 2 · Q2(b) 3 marks AO1=1, AO2=1, AO3=1 Short answer Hard aggregate demand
Data and extracts for question 22 The table shows average UK house prices between January 2023 and March 2023. Month and year Average house price (£) January 2023 286 321 February 2023 284 152 March 2023 281 555 (Source: adapted from https://landregistry.data.gov.uk/)
(b) Explain one likely impact of the fall in average UK house prices on existing homeowners between January 2023 and March 2023. Refer to the table on page 4 in your answer. (3)
June 2025 · AS Paper 2 · Q3(a) 1 mark Multiple choice economic growth and the trade cycle
Data and extracts for question 33 It was forecast that the UK will experience a positive output gap in 2024.
(a) Which point on the trade cycle diagram illustrates a positive output gap? (1) Real GDP Trend GDP growth Actual GDP growth D C A B Time A B C D
June 2025 · AS Paper 2 · Q3(b) 2 marks AO1=2 Short answer economic growth and the trade cycle
Data and extracts for question 33 It was forecast that the UK will experience a positive output gap in 2024.
(b) Explain one reason why it is difficult to measure the size of an output gap in an economy. (2)
June 2025 · AS Paper 2 · Q3(c) 1 mark AO1=1 Definition economic growth and the trade cycle
Data and extracts for question 33 It was forecast that the UK will experience a positive output gap in 2024.
(c) Define the term ‘trade cycle’. (1)
June 2025 · AS Paper 2 · Q4(a) 1 mark AO1=1 Definition fiscal and monetary policy
Data and extracts for question 44 In 2023 the UK government reduced indirect tax on certain goods and services.
(a) Define the term ‘indirect tax’. (1)
June 2025 · AS Paper 2 · Q4(b) 2 marks AO2=2 Diagram aggregate supplynational income and the multiplier
Data and extracts for question 44 In 2023 the UK government reduced indirect tax on certain goods and services.
(b) Annotate the aggregate demand (AD) and short-run aggregate supply (SRAS) diagram below to show the likely impact of a reduction in indirect tax on the equilibrium level of real output and the price level. (2) Price level SRAS P1 AD Y1 Real output
June 2025 · AS Paper 2 · Q4(c) 1 mark Multiple choice fiscal and monetary policy
Data and extracts for question 44 In 2023 the UK government reduced indirect tax on certain goods and services.
(c) Which one of the following is an example of an indirect tax? (1) A Corporation tax B Income tax C Inheritance tax D Value added tax
June 2025 · AS Paper 2 · Q5(a) 1 mark Multiple choice balance of payments
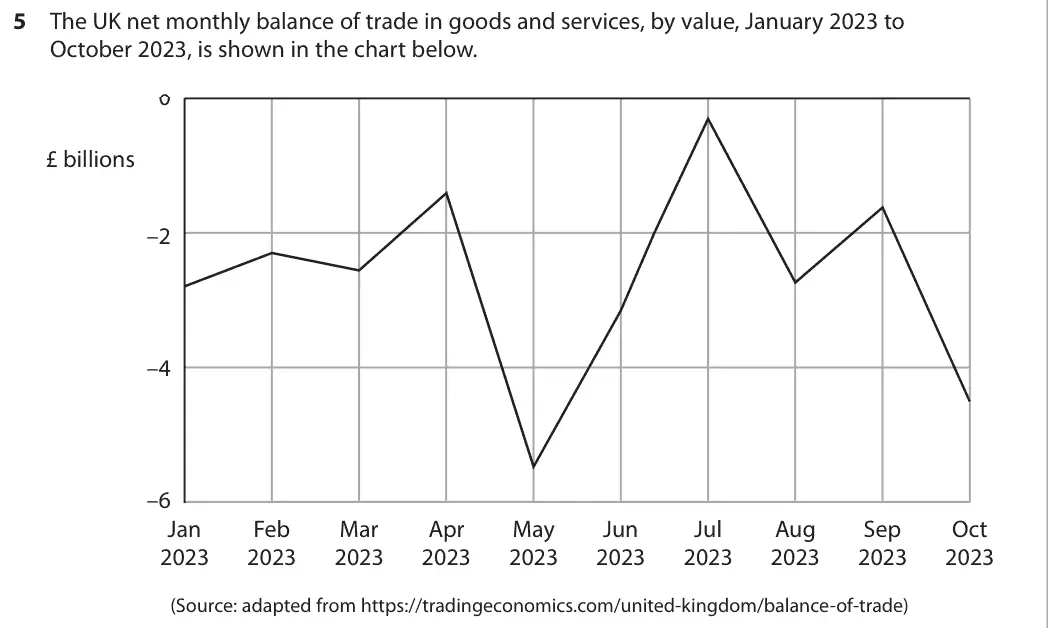
Data and extracts for question 55 The UK net monthly balance of trade in goods and services, by value, January 2023 to October 2023, is shown in the chart below. 0 £ billions –2 –4 –6 Jan Feb Mar Apr May Jun Jul Aug Sep Oct 2023 2023 2023 2023 2023 2023 2023 2023 2023 2023 (Source: adapted from https://tradingeconomics.com/united-kingdom/balance-of-trade)
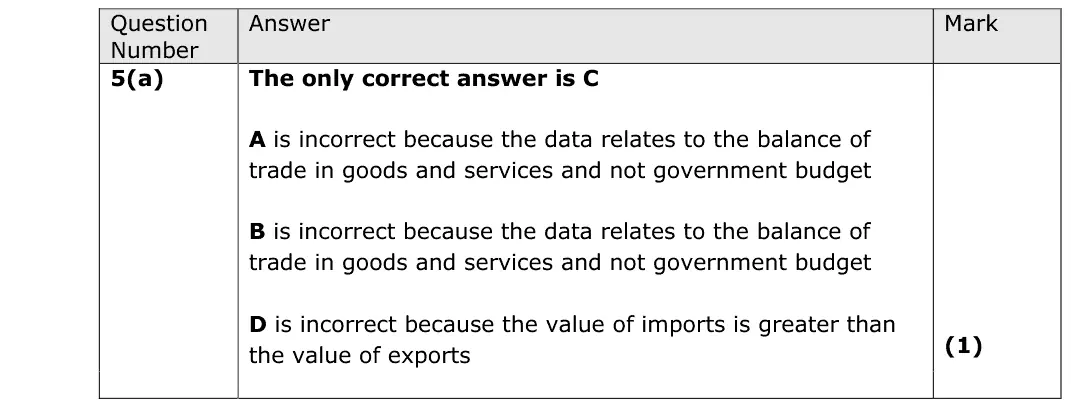
(a) Which one of the following can be deduced from the chart? (1) A The government was spending less than it received in taxation B The government was spending more than it received in taxation C The value of imports was greater than the value of exports D The value of imports was smaller than the value of exports
June 2025 · AS Paper 2 · Q5(b) 3 marks AO1=1, AO2=1, AO3=1 Short answer balance of paymentsaggregate demand
Data and extracts for question 55 The UK net monthly balance of trade in goods and services, by value, January 2023 to October 2023, is shown in the chart below. 0 £ billions –2 –4 –6 Jan Feb Mar Apr May Jun Jul Aug Sep Oct 2023 2023 2023 2023 2023 2023 2023 2023 2023 2023 (Source: adapted from https://tradingeconomics.com/united-kingdom/balance-of-trade)
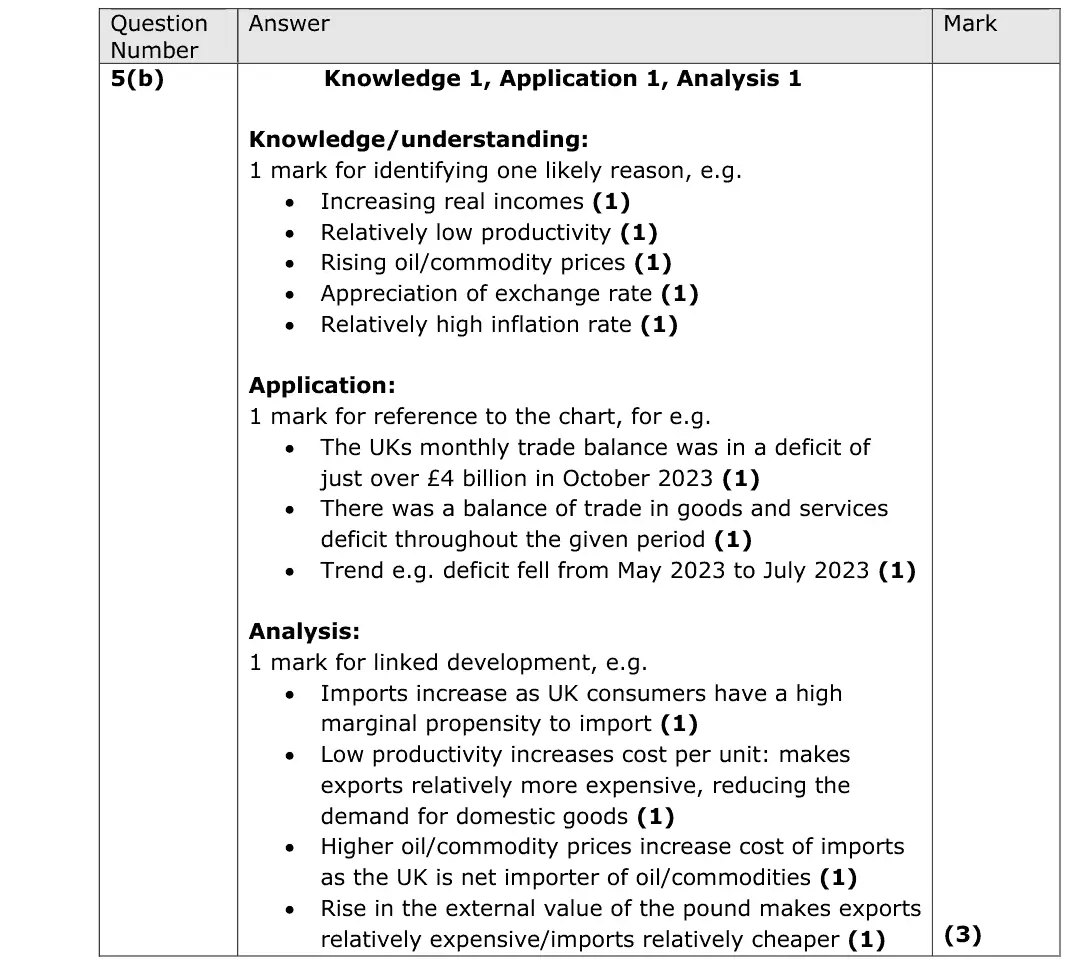
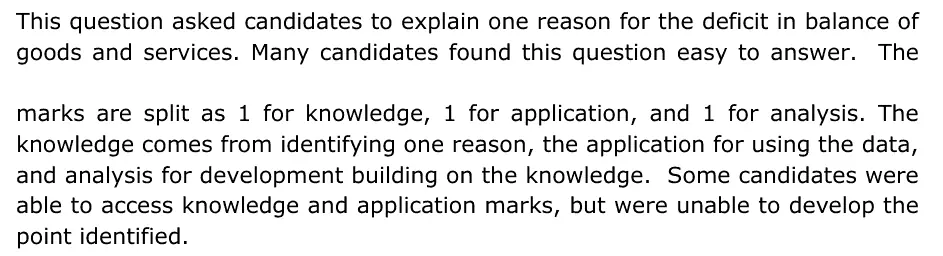
(b) Explain one likely reason for the deficit in the UK balance of trade in goods and services. Refer to the chart on page 10 in your answer. (3)
June 2025 · AS Paper 2 · Q6(a) 4 marks AO1=2, AO2=2 Short answer measuring economic growth
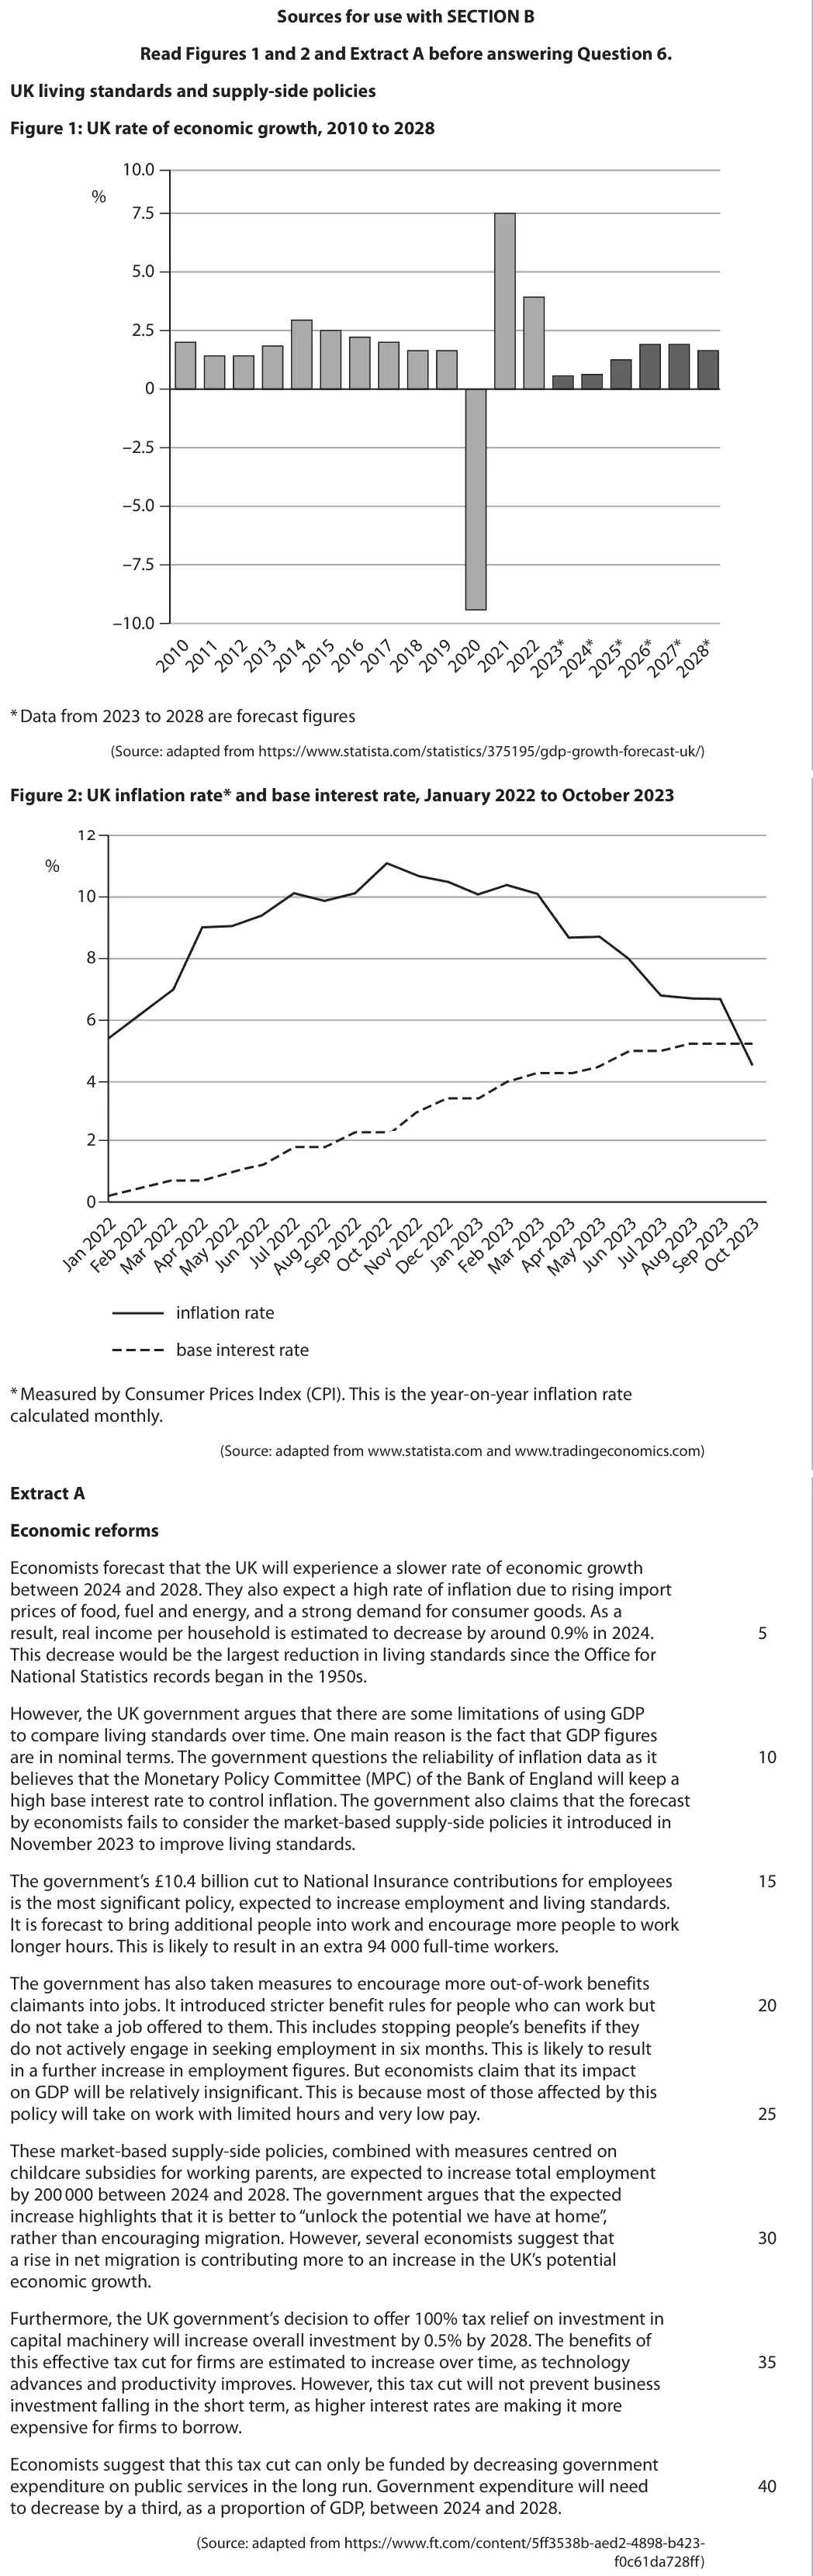
Data and extracts for question 6Sources for use with SECTION B Read Figures 1 and 2 and Extract A before answering Question 6. UK living standards and supply‑side policies Figure 1: UK rate of economic growth, 2010 to 2028 10.0 % 7.5 5.0 2.5 0 –2.5 –5.0 –7.5 –10.0 * Data from 2023 to 2028 are forecast figures (Source: adapted from https://www.statista.com/statistics/375195/gdp-growth-forecast-uk/) Figure 2: UK inflation rate* and base interest rate, January 2022 to October 2023 12 % 10 8 6 4 2 0 inflation rate base interest rate * Measured by Consumer Prices Index (CPI). This is the year-on-year inflation rate calculated monthly. (Source: adapted from www.statista.com and www.tradingeconomics.com) Extract A Economic reforms Economists forecast that the UK will experience a slower rate of economic growth between 2024 and 2028. They also expect a high rate of inflation due to rising import prices of food, fuel and energy, and a strong demand for consumer goods. As a result, real income per household is estimated to decrease by around 0.9% in 2024. 5 This decrease would be the largest reduction in living standards since the Office for National Statistics records began in the 1950s. However, the UK government argues that there are some limitations of using GDP to compare living standards over time. One main reason is the fact that GDP figures are in nominal terms. The government questions the reliability of inflation data as it 10 believes that the Monetary Policy Committee (MPC) of the Bank of England will keep a high base interest rate to control inflation. The government also claims that the forecast by economists fails to consider the market-based supply-side policies it introduced in November 2023 to improve living standards. The government’s £10.4 billion cut to National Insurance contributions for employees 15 is the most significant policy, expected to increase employment and living standards. It is forecast to bring additional people into work and encourage more people to work longer hours. This is likely to result in an extra 94 000 full-time workers. The government has also taken measures to encourage more out-of-work benefits claimants into jobs. It introduced stricter benefit rules for people who can work but 20 do not take a job offered to them. This includes stopping people’s benefits if they do not actively engage in seeking employment in six months. This is likely to result in a further increase in employment figures. But economists claim that its impact on GDP will be relatively insignificant. This is because most of those affected by this policy will take on work with limited hours and very low pay. 25 These market-based supply-side policies, combined with measures centred on childcare subsidies for working parents, are expected to increase total employment by 200 000 between 2024 and 2028. The government argues that the expected increase highlights that it is better to “unlock the potential we have at home”, rather than encouraging migration. However, several economists suggest that 30 a rise in net migration is contributing more to an increase in the UK’s potential economic growth. Furthermore, the UK government’s decision to offer 100% tax relief on investment in capital machinery will increase overall investment by 0.5% by 2028. The benefits of 35 this effective tax cut for firms are estimated to increase over time, as technology advances and productivity improves. However, this tax cut will not prevent business investment falling in the short term, as higher interest rates are making it more expensive for firms to borrow. Economists suggest that this tax cut can only be funded by decreasing government 40 expenditure on public services in the long run. Government expenditure will need to decrease by a third, as a proportion of GDP, between 2024 and 2028. (Source: adapted from https://www.ft.com/content/5ff3538b-aed2-4898-b423- f0c61da728ff)
(a) With reference to Figure 1, explain the term ‘rate of economic growth’. (4)
June 2025 · AS Paper 2 · Q6(b) 5 marks AO1=1, AO2=2, AO3=2 Short answer measuring economic growth
Data and extracts for question 6Sources for use with SECTION B Read Figures 1 and 2 and Extract A before answering Question 6. UK living standards and supply‑side policies Figure 1: UK rate of economic growth, 2010 to 2028 10.0 % 7.5 5.0 2.5 0 –2.5 –5.0 –7.5 –10.0 * Data from 2023 to 2028 are forecast figures (Source: adapted from https://www.statista.com/statistics/375195/gdp-growth-forecast-uk/) Figure 2: UK inflation rate* and base interest rate, January 2022 to October 2023 12 % 10 8 6 4 2 0 inflation rate base interest rate * Measured by Consumer Prices Index (CPI). This is the year-on-year inflation rate calculated monthly. (Source: adapted from www.statista.com and www.tradingeconomics.com) Extract A Economic reforms Economists forecast that the UK will experience a slower rate of economic growth between 2024 and 2028. They also expect a high rate of inflation due to rising import prices of food, fuel and energy, and a strong demand for consumer goods. As a result, real income per household is estimated to decrease by around 0.9% in 2024. 5 This decrease would be the largest reduction in living standards since the Office for National Statistics records began in the 1950s. However, the UK government argues that there are some limitations of using GDP to compare living standards over time. One main reason is the fact that GDP figures are in nominal terms. The government questions the reliability of inflation data as it 10 believes that the Monetary Policy Committee (MPC) of the Bank of England will keep a high base interest rate to control inflation. The government also claims that the forecast by economists fails to consider the market-based supply-side policies it introduced in November 2023 to improve living standards. The government’s £10.4 billion cut to National Insurance contributions for employees 15 is the most significant policy, expected to increase employment and living standards. It is forecast to bring additional people into work and encourage more people to work longer hours. This is likely to result in an extra 94 000 full-time workers. The government has also taken measures to encourage more out-of-work benefits claimants into jobs. It introduced stricter benefit rules for people who can work but 20 do not take a job offered to them. This includes stopping people’s benefits if they do not actively engage in seeking employment in six months. This is likely to result in a further increase in employment figures. But economists claim that its impact on GDP will be relatively insignificant. This is because most of those affected by this policy will take on work with limited hours and very low pay. 25 These market-based supply-side policies, combined with measures centred on childcare subsidies for working parents, are expected to increase total employment by 200 000 between 2024 and 2028. The government argues that the expected increase highlights that it is better to “unlock the potential we have at home”, rather than encouraging migration. However, several economists suggest that 30 a rise in net migration is contributing more to an increase in the UK’s potential economic growth. Furthermore, the UK government’s decision to offer 100% tax relief on investment in capital machinery will increase overall investment by 0.5% by 2028. The benefits of 35 this effective tax cut for firms are estimated to increase over time, as technology advances and productivity improves. However, this tax cut will not prevent business investment falling in the short term, as higher interest rates are making it more expensive for firms to borrow. Economists suggest that this tax cut can only be funded by decreasing government 40 expenditure on public services in the long run. Government expenditure will need to decrease by a third, as a proportion of GDP, between 2024 and 2028. (Source: adapted from https://www.ft.com/content/5ff3538b-aed2-4898-b423- f0c61da728ff)
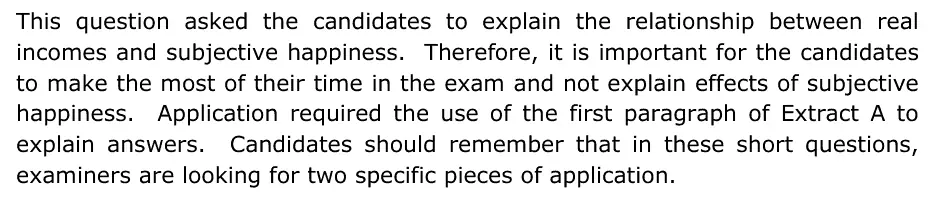
(b) With reference to the first paragraph of Extract A, explain the likely relationship between real incomes and subjective happiness. (5)
June 2025 · AS Paper 2 · Q6(c) 10 marks AO1=2, AO2=2, AO3=2, AO4=4 10-mark response measuring economic growth
Data and extracts for question 6Sources for use with SECTION B Read Figures 1 and 2 and Extract A before answering Question 6. UK living standards and supply‑side policies Figure 1: UK rate of economic growth, 2010 to 2028 10.0 % 7.5 5.0 2.5 0 –2.5 –5.0 –7.5 –10.0 * Data from 2023 to 2028 are forecast figures (Source: adapted from https://www.statista.com/statistics/375195/gdp-growth-forecast-uk/) Figure 2: UK inflation rate* and base interest rate, January 2022 to October 2023 12 % 10 8 6 4 2 0 inflation rate base interest rate * Measured by Consumer Prices Index (CPI). This is the year-on-year inflation rate calculated monthly. (Source: adapted from www.statista.com and www.tradingeconomics.com) Extract A Economic reforms Economists forecast that the UK will experience a slower rate of economic growth between 2024 and 2028. They also expect a high rate of inflation due to rising import prices of food, fuel and energy, and a strong demand for consumer goods. As a result, real income per household is estimated to decrease by around 0.9% in 2024. 5 This decrease would be the largest reduction in living standards since the Office for National Statistics records began in the 1950s. However, the UK government argues that there are some limitations of using GDP to compare living standards over time. One main reason is the fact that GDP figures are in nominal terms. The government questions the reliability of inflation data as it 10 believes that the Monetary Policy Committee (MPC) of the Bank of England will keep a high base interest rate to control inflation. The government also claims that the forecast by economists fails to consider the market-based supply-side policies it introduced in November 2023 to improve living standards. The government’s £10.4 billion cut to National Insurance contributions for employees 15 is the most significant policy, expected to increase employment and living standards. It is forecast to bring additional people into work and encourage more people to work longer hours. This is likely to result in an extra 94 000 full-time workers. The government has also taken measures to encourage more out-of-work benefits claimants into jobs. It introduced stricter benefit rules for people who can work but 20 do not take a job offered to them. This includes stopping people’s benefits if they do not actively engage in seeking employment in six months. This is likely to result in a further increase in employment figures. But economists claim that its impact on GDP will be relatively insignificant. This is because most of those affected by this policy will take on work with limited hours and very low pay. 25 These market-based supply-side policies, combined with measures centred on childcare subsidies for working parents, are expected to increase total employment by 200 000 between 2024 and 2028. The government argues that the expected increase highlights that it is better to “unlock the potential we have at home”, rather than encouraging migration. However, several economists suggest that 30 a rise in net migration is contributing more to an increase in the UK’s potential economic growth. Furthermore, the UK government’s decision to offer 100% tax relief on investment in capital machinery will increase overall investment by 0.5% by 2028. The benefits of 35 this effective tax cut for firms are estimated to increase over time, as technology advances and productivity improves. However, this tax cut will not prevent business investment falling in the short term, as higher interest rates are making it more expensive for firms to borrow. Economists suggest that this tax cut can only be funded by decreasing government 40 expenditure on public services in the long run. Government expenditure will need to decrease by a third, as a proportion of GDP, between 2024 and 2028. (Source: adapted from https://www.ft.com/content/5ff3538b-aed2-4898-b423- f0c61da728ff)
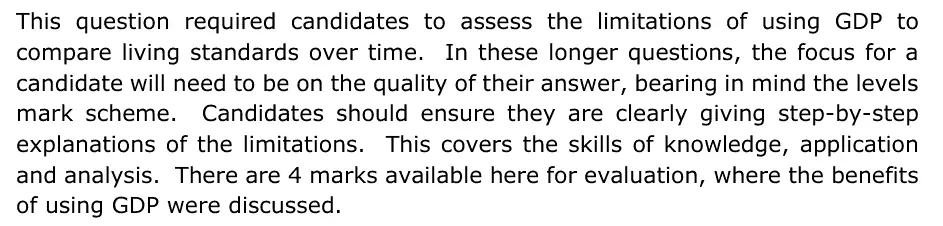
(c) With reference to Extract A and your own knowledge, assess the limitations of using GDP to compare living standards over time. (10)
June 2025 · AS Paper 2 · Q6(d) 6 marks AO1=2, AO2=2, AO3=2 Short answer fiscal and monetary policy
Data and extracts for question 6Sources for use with SECTION B Read Figures 1 and 2 and Extract A before answering Question 6. UK living standards and supply‑side policies Figure 1: UK rate of economic growth, 2010 to 2028 10.0 % 7.5 5.0 2.5 0 –2.5 –5.0 –7.5 –10.0 * Data from 2023 to 2028 are forecast figures (Source: adapted from https://www.statista.com/statistics/375195/gdp-growth-forecast-uk/) Figure 2: UK inflation rate* and base interest rate, January 2022 to October 2023 12 % 10 8 6 4 2 0 inflation rate base interest rate * Measured by Consumer Prices Index (CPI). This is the year-on-year inflation rate calculated monthly. (Source: adapted from www.statista.com and www.tradingeconomics.com) Extract A Economic reforms Economists forecast that the UK will experience a slower rate of economic growth between 2024 and 2028. They also expect a high rate of inflation due to rising import prices of food, fuel and energy, and a strong demand for consumer goods. As a result, real income per household is estimated to decrease by around 0.9% in 2024. 5 This decrease would be the largest reduction in living standards since the Office for National Statistics records began in the 1950s. However, the UK government argues that there are some limitations of using GDP to compare living standards over time. One main reason is the fact that GDP figures are in nominal terms. The government questions the reliability of inflation data as it 10 believes that the Monetary Policy Committee (MPC) of the Bank of England will keep a high base interest rate to control inflation. The government also claims that the forecast by economists fails to consider the market-based supply-side policies it introduced in November 2023 to improve living standards. The government’s £10.4 billion cut to National Insurance contributions for employees 15 is the most significant policy, expected to increase employment and living standards. It is forecast to bring additional people into work and encourage more people to work longer hours. This is likely to result in an extra 94 000 full-time workers. The government has also taken measures to encourage more out-of-work benefits claimants into jobs. It introduced stricter benefit rules for people who can work but 20 do not take a job offered to them. This includes stopping people’s benefits if they do not actively engage in seeking employment in six months. This is likely to result in a further increase in employment figures. But economists claim that its impact on GDP will be relatively insignificant. This is because most of those affected by this policy will take on work with limited hours and very low pay. 25 These market-based supply-side policies, combined with measures centred on childcare subsidies for working parents, are expected to increase total employment by 200 000 between 2024 and 2028. The government argues that the expected increase highlights that it is better to “unlock the potential we have at home”, rather than encouraging migration. However, several economists suggest that 30 a rise in net migration is contributing more to an increase in the UK’s potential economic growth. Furthermore, the UK government’s decision to offer 100% tax relief on investment in capital machinery will increase overall investment by 0.5% by 2028. The benefits of 35 this effective tax cut for firms are estimated to increase over time, as technology advances and productivity improves. However, this tax cut will not prevent business investment falling in the short term, as higher interest rates are making it more expensive for firms to borrow. Economists suggest that this tax cut can only be funded by decreasing government 40 expenditure on public services in the long run. Government expenditure will need to decrease by a third, as a proportion of GDP, between 2024 and 2028. (Source: adapted from https://www.ft.com/content/5ff3538b-aed2-4898-b423- f0c61da728ff)
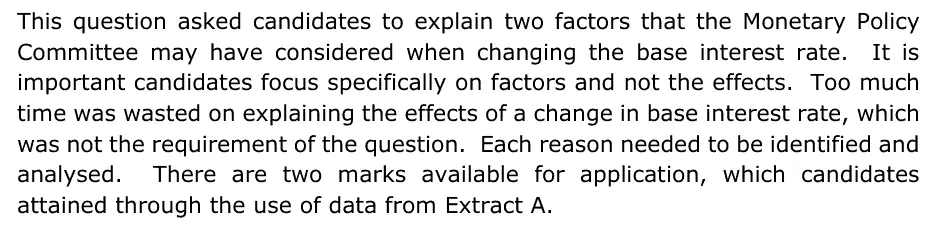
(d) With reference to the information provided, explain two factors that the Bank of England’s Monetary Policy Committee may have considered when changing the base interest rate. (6)
June 2025 · AS Paper 2 · Q6(e) 15 marks 15-mark response aggregate demandnational income and the multiplier
Data and extracts for question 6Sources for use with SECTION B Read Figures 1 and 2 and Extract A before answering Question 6. UK living standards and supply‑side policies Figure 1: UK rate of economic growth, 2010 to 2028 10.0 % 7.5 5.0 2.5 0 –2.5 –5.0 –7.5 –10.0 * Data from 2023 to 2028 are forecast figures (Source: adapted from https://www.statista.com/statistics/375195/gdp-growth-forecast-uk/) Figure 2: UK inflation rate* and base interest rate, January 2022 to October 2023 12 % 10 8 6 4 2 0 inflation rate base interest rate * Measured by Consumer Prices Index (CPI). This is the year-on-year inflation rate calculated monthly. (Source: adapted from www.statista.com and www.tradingeconomics.com) Extract A Economic reforms Economists forecast that the UK will experience a slower rate of economic growth between 2024 and 2028. They also expect a high rate of inflation due to rising import prices of food, fuel and energy, and a strong demand for consumer goods. As a result, real income per household is estimated to decrease by around 0.9% in 2024. 5 This decrease would be the largest reduction in living standards since the Office for National Statistics records began in the 1950s. However, the UK government argues that there are some limitations of using GDP to compare living standards over time. One main reason is the fact that GDP figures are in nominal terms. The government questions the reliability of inflation data as it 10 believes that the Monetary Policy Committee (MPC) of the Bank of England will keep a high base interest rate to control inflation. The government also claims that the forecast by economists fails to consider the market-based supply-side policies it introduced in November 2023 to improve living standards. The government’s £10.4 billion cut to National Insurance contributions for employees 15 is the most significant policy, expected to increase employment and living standards. It is forecast to bring additional people into work and encourage more people to work longer hours. This is likely to result in an extra 94 000 full-time workers. The government has also taken measures to encourage more out-of-work benefits claimants into jobs. It introduced stricter benefit rules for people who can work but 20 do not take a job offered to them. This includes stopping people’s benefits if they do not actively engage in seeking employment in six months. This is likely to result in a further increase in employment figures. But economists claim that its impact on GDP will be relatively insignificant. This is because most of those affected by this policy will take on work with limited hours and very low pay. 25 These market-based supply-side policies, combined with measures centred on childcare subsidies for working parents, are expected to increase total employment by 200 000 between 2024 and 2028. The government argues that the expected increase highlights that it is better to “unlock the potential we have at home”, rather than encouraging migration. However, several economists suggest that 30 a rise in net migration is contributing more to an increase in the UK’s potential economic growth. Furthermore, the UK government’s decision to offer 100% tax relief on investment in capital machinery will increase overall investment by 0.5% by 2028. The benefits of 35 this effective tax cut for firms are estimated to increase over time, as technology advances and productivity improves. However, this tax cut will not prevent business investment falling in the short term, as higher interest rates are making it more expensive for firms to borrow. Economists suggest that this tax cut can only be funded by decreasing government 40 expenditure on public services in the long run. Government expenditure will need to decrease by a third, as a proportion of GDP, between 2024 and 2028. (Source: adapted from https://www.ft.com/content/5ff3538b-aed2-4898-b423- f0c61da728ff)
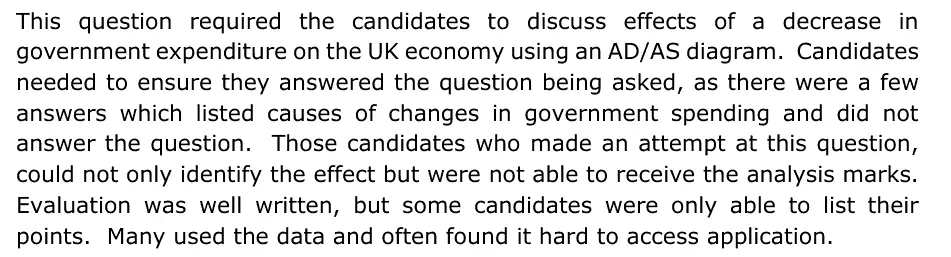
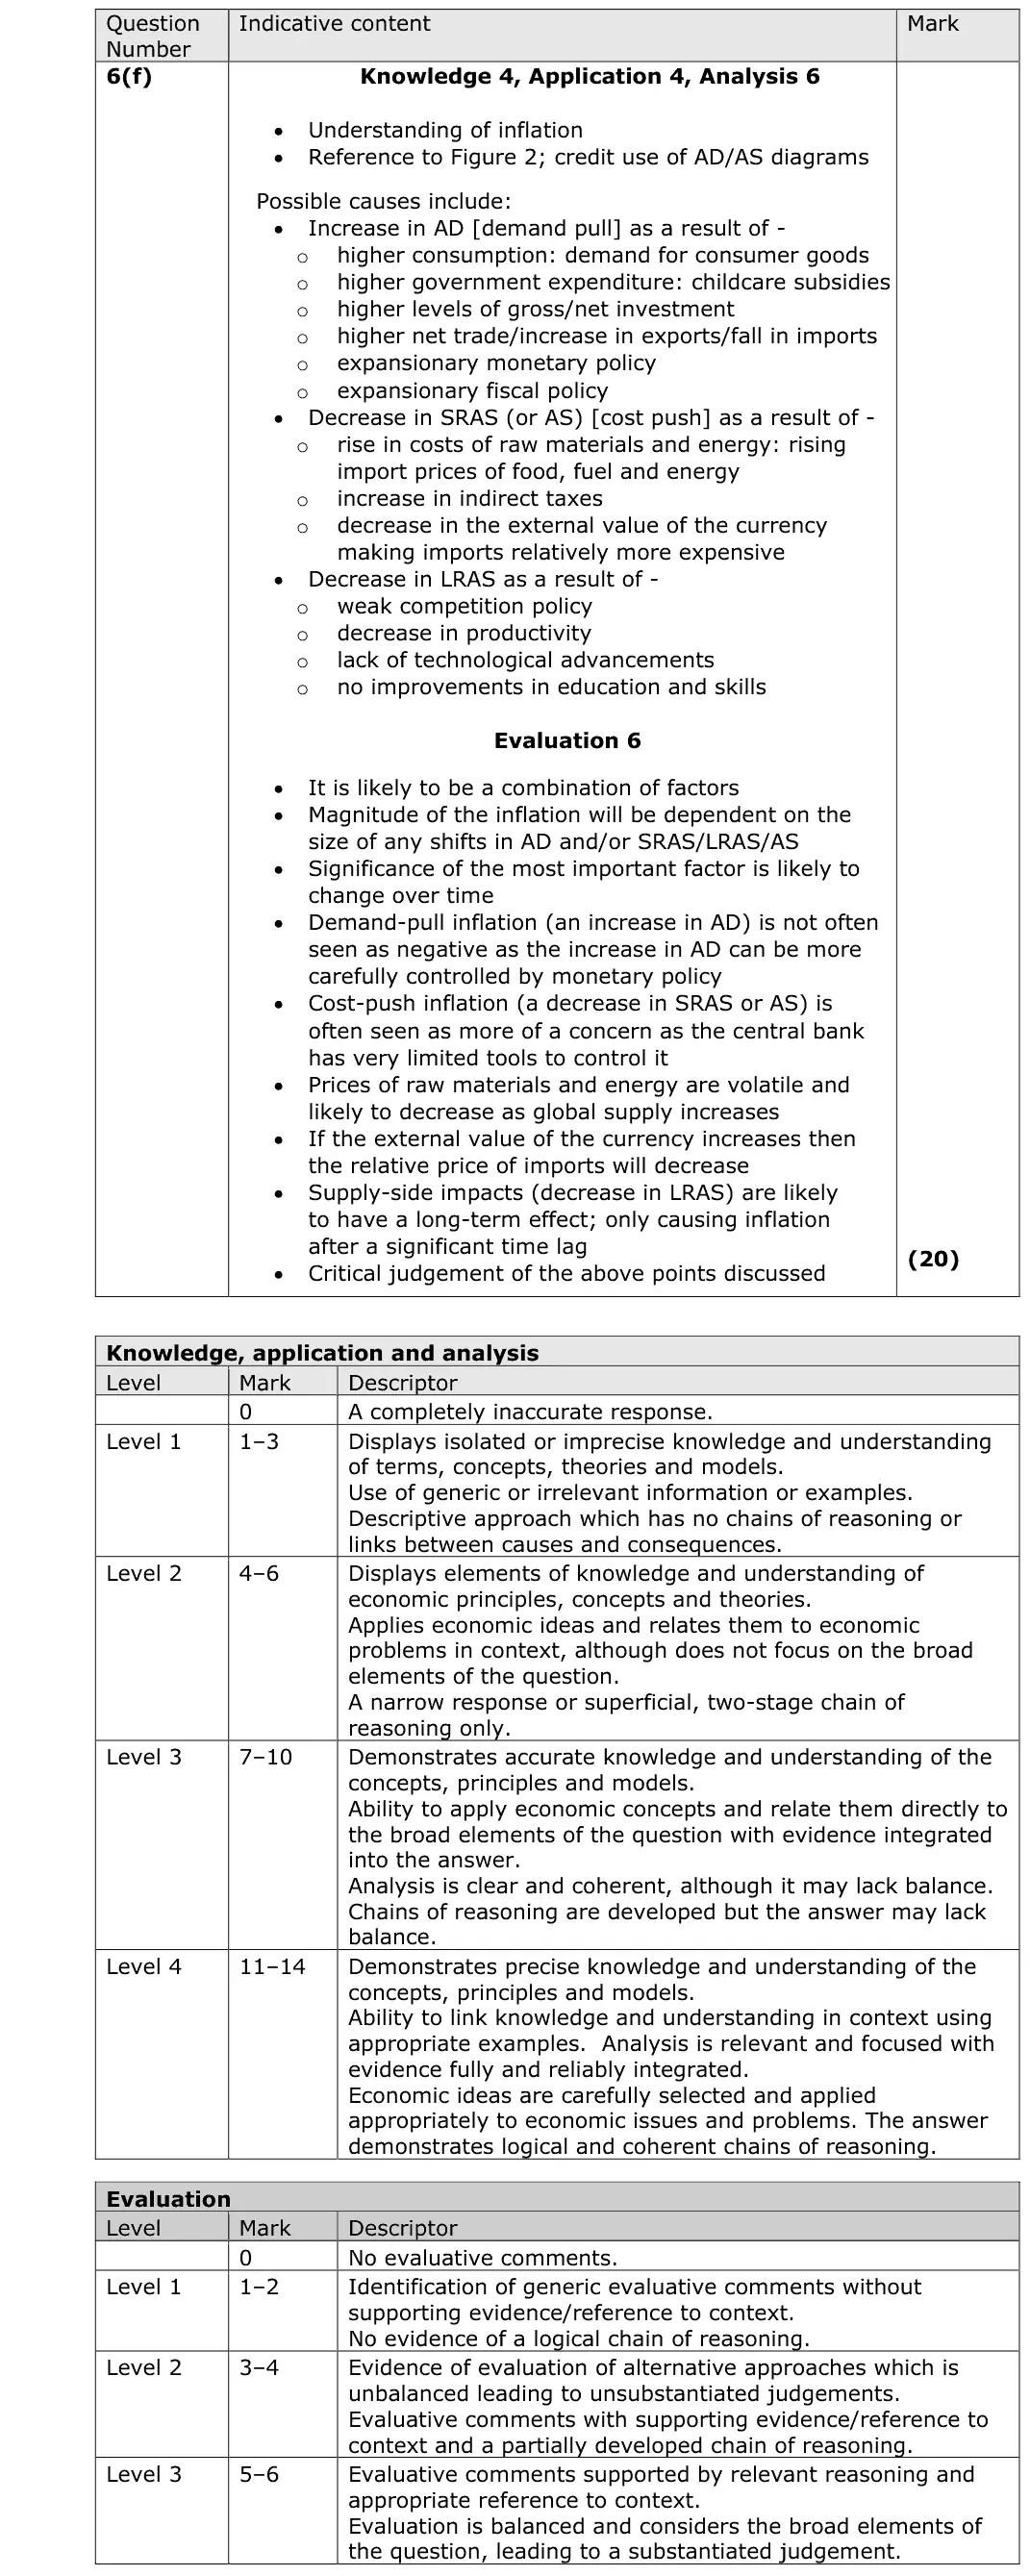
(e) Discuss the likely macroeconomic effects of a decrease in government expenditure on the UK economy. Use an aggregate demand and aggregate supply diagram to support your answer. (15)
June 2025 · AS Paper 2 · Q6(f) 20 marks AO1=4, AO2=4, AO3=6, AO4=6 20-mark essay Either/or inflation
Data and extracts for question 6Sources for use with SECTION B Read Figures 1 and 2 and Extract A before answering Question 6. UK living standards and supply‑side policies Figure 1: UK rate of economic growth, 2010 to 2028 10.0 % 7.5 5.0 2.5 0 –2.5 –5.0 –7.5 –10.0 * Data from 2023 to 2028 are forecast figures (Source: adapted from https://www.statista.com/statistics/375195/gdp-growth-forecast-uk/) Figure 2: UK inflation rate* and base interest rate, January 2022 to October 2023 12 % 10 8 6 4 2 0 inflation rate base interest rate * Measured by Consumer Prices Index (CPI). This is the year-on-year inflation rate calculated monthly. (Source: adapted from www.statista.com and www.tradingeconomics.com) Extract A Economic reforms Economists forecast that the UK will experience a slower rate of economic growth between 2024 and 2028. They also expect a high rate of inflation due to rising import prices of food, fuel and energy, and a strong demand for consumer goods. As a result, real income per household is estimated to decrease by around 0.9% in 2024. 5 This decrease would be the largest reduction in living standards since the Office for National Statistics records began in the 1950s. However, the UK government argues that there are some limitations of using GDP to compare living standards over time. One main reason is the fact that GDP figures are in nominal terms. The government questions the reliability of inflation data as it 10 believes that the Monetary Policy Committee (MPC) of the Bank of England will keep a high base interest rate to control inflation. The government also claims that the forecast by economists fails to consider the market-based supply-side policies it introduced in November 2023 to improve living standards. The government’s £10.4 billion cut to National Insurance contributions for employees 15 is the most significant policy, expected to increase employment and living standards. It is forecast to bring additional people into work and encourage more people to work longer hours. This is likely to result in an extra 94 000 full-time workers. The government has also taken measures to encourage more out-of-work benefits claimants into jobs. It introduced stricter benefit rules for people who can work but 20 do not take a job offered to them. This includes stopping people’s benefits if they do not actively engage in seeking employment in six months. This is likely to result in a further increase in employment figures. But economists claim that its impact on GDP will be relatively insignificant. This is because most of those affected by this policy will take on work with limited hours and very low pay. 25 These market-based supply-side policies, combined with measures centred on childcare subsidies for working parents, are expected to increase total employment by 200 000 between 2024 and 2028. The government argues that the expected increase highlights that it is better to “unlock the potential we have at home”, rather than encouraging migration. However, several economists suggest that 30 a rise in net migration is contributing more to an increase in the UK’s potential economic growth. Furthermore, the UK government’s decision to offer 100% tax relief on investment in capital machinery will increase overall investment by 0.5% by 2028. The benefits of 35 this effective tax cut for firms are estimated to increase over time, as technology advances and productivity improves. However, this tax cut will not prevent business investment falling in the short term, as higher interest rates are making it more expensive for firms to borrow. Economists suggest that this tax cut can only be funded by decreasing government 40 expenditure on public services in the long run. Government expenditure will need to decrease by a third, as a proportion of GDP, between 2024 and 2028. (Source: adapted from https://www.ft.com/content/5ff3538b-aed2-4898-b423- f0c61da728ff)
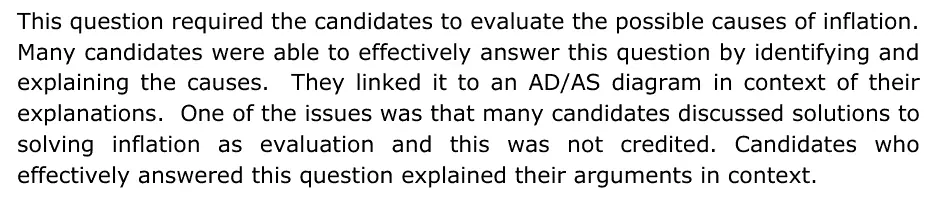
(f) Evaluate the possible causes of inflation in the UK. (20)
June 2025 · AS Paper 2 · Q6(g) 20 marks AO1=4, AO2=4, AO3=6, AO4=6 20-mark essay Either/or supply side policies
Data and extracts for question 6Sources for use with SECTION B Read Figures 1 and 2 and Extract A before answering Question 6. UK living standards and supply‑side policies Figure 1: UK rate of economic growth, 2010 to 2028 10.0 % 7.5 5.0 2.5 0 –2.5 –5.0 –7.5 –10.0 * Data from 2023 to 2028 are forecast figures (Source: adapted from https://www.statista.com/statistics/375195/gdp-growth-forecast-uk/) Figure 2: UK inflation rate* and base interest rate, January 2022 to October 2023 12 % 10 8 6 4 2 0 inflation rate base interest rate * Measured by Consumer Prices Index (CPI). This is the year-on-year inflation rate calculated monthly. (Source: adapted from www.statista.com and www.tradingeconomics.com) Extract A Economic reforms Economists forecast that the UK will experience a slower rate of economic growth between 2024 and 2028. They also expect a high rate of inflation due to rising import prices of food, fuel and energy, and a strong demand for consumer goods. As a result, real income per household is estimated to decrease by around 0.9% in 2024. 5 This decrease would be the largest reduction in living standards since the Office for National Statistics records began in the 1950s. However, the UK government argues that there are some limitations of using GDP to compare living standards over time. One main reason is the fact that GDP figures are in nominal terms. The government questions the reliability of inflation data as it 10 believes that the Monetary Policy Committee (MPC) of the Bank of England will keep a high base interest rate to control inflation. The government also claims that the forecast by economists fails to consider the market-based supply-side policies it introduced in November 2023 to improve living standards. The government’s £10.4 billion cut to National Insurance contributions for employees 15 is the most significant policy, expected to increase employment and living standards. It is forecast to bring additional people into work and encourage more people to work longer hours. This is likely to result in an extra 94 000 full-time workers. The government has also taken measures to encourage more out-of-work benefits claimants into jobs. It introduced stricter benefit rules for people who can work but 20 do not take a job offered to them. This includes stopping people’s benefits if they do not actively engage in seeking employment in six months. This is likely to result in a further increase in employment figures. But economists claim that its impact on GDP will be relatively insignificant. This is because most of those affected by this policy will take on work with limited hours and very low pay. 25 These market-based supply-side policies, combined with measures centred on childcare subsidies for working parents, are expected to increase total employment by 200 000 between 2024 and 2028. The government argues that the expected increase highlights that it is better to “unlock the potential we have at home”, rather than encouraging migration. However, several economists suggest that 30 a rise in net migration is contributing more to an increase in the UK’s potential economic growth. Furthermore, the UK government’s decision to offer 100% tax relief on investment in capital machinery will increase overall investment by 0.5% by 2028. The benefits of 35 this effective tax cut for firms are estimated to increase over time, as technology advances and productivity improves. However, this tax cut will not prevent business investment falling in the short term, as higher interest rates are making it more expensive for firms to borrow. Economists suggest that this tax cut can only be funded by decreasing government 40 expenditure on public services in the long run. Government expenditure will need to decrease by a third, as a proportion of GDP, between 2024 and 2028. (Source: adapted from https://www.ft.com/content/5ff3538b-aed2-4898-b423- f0c61da728ff)
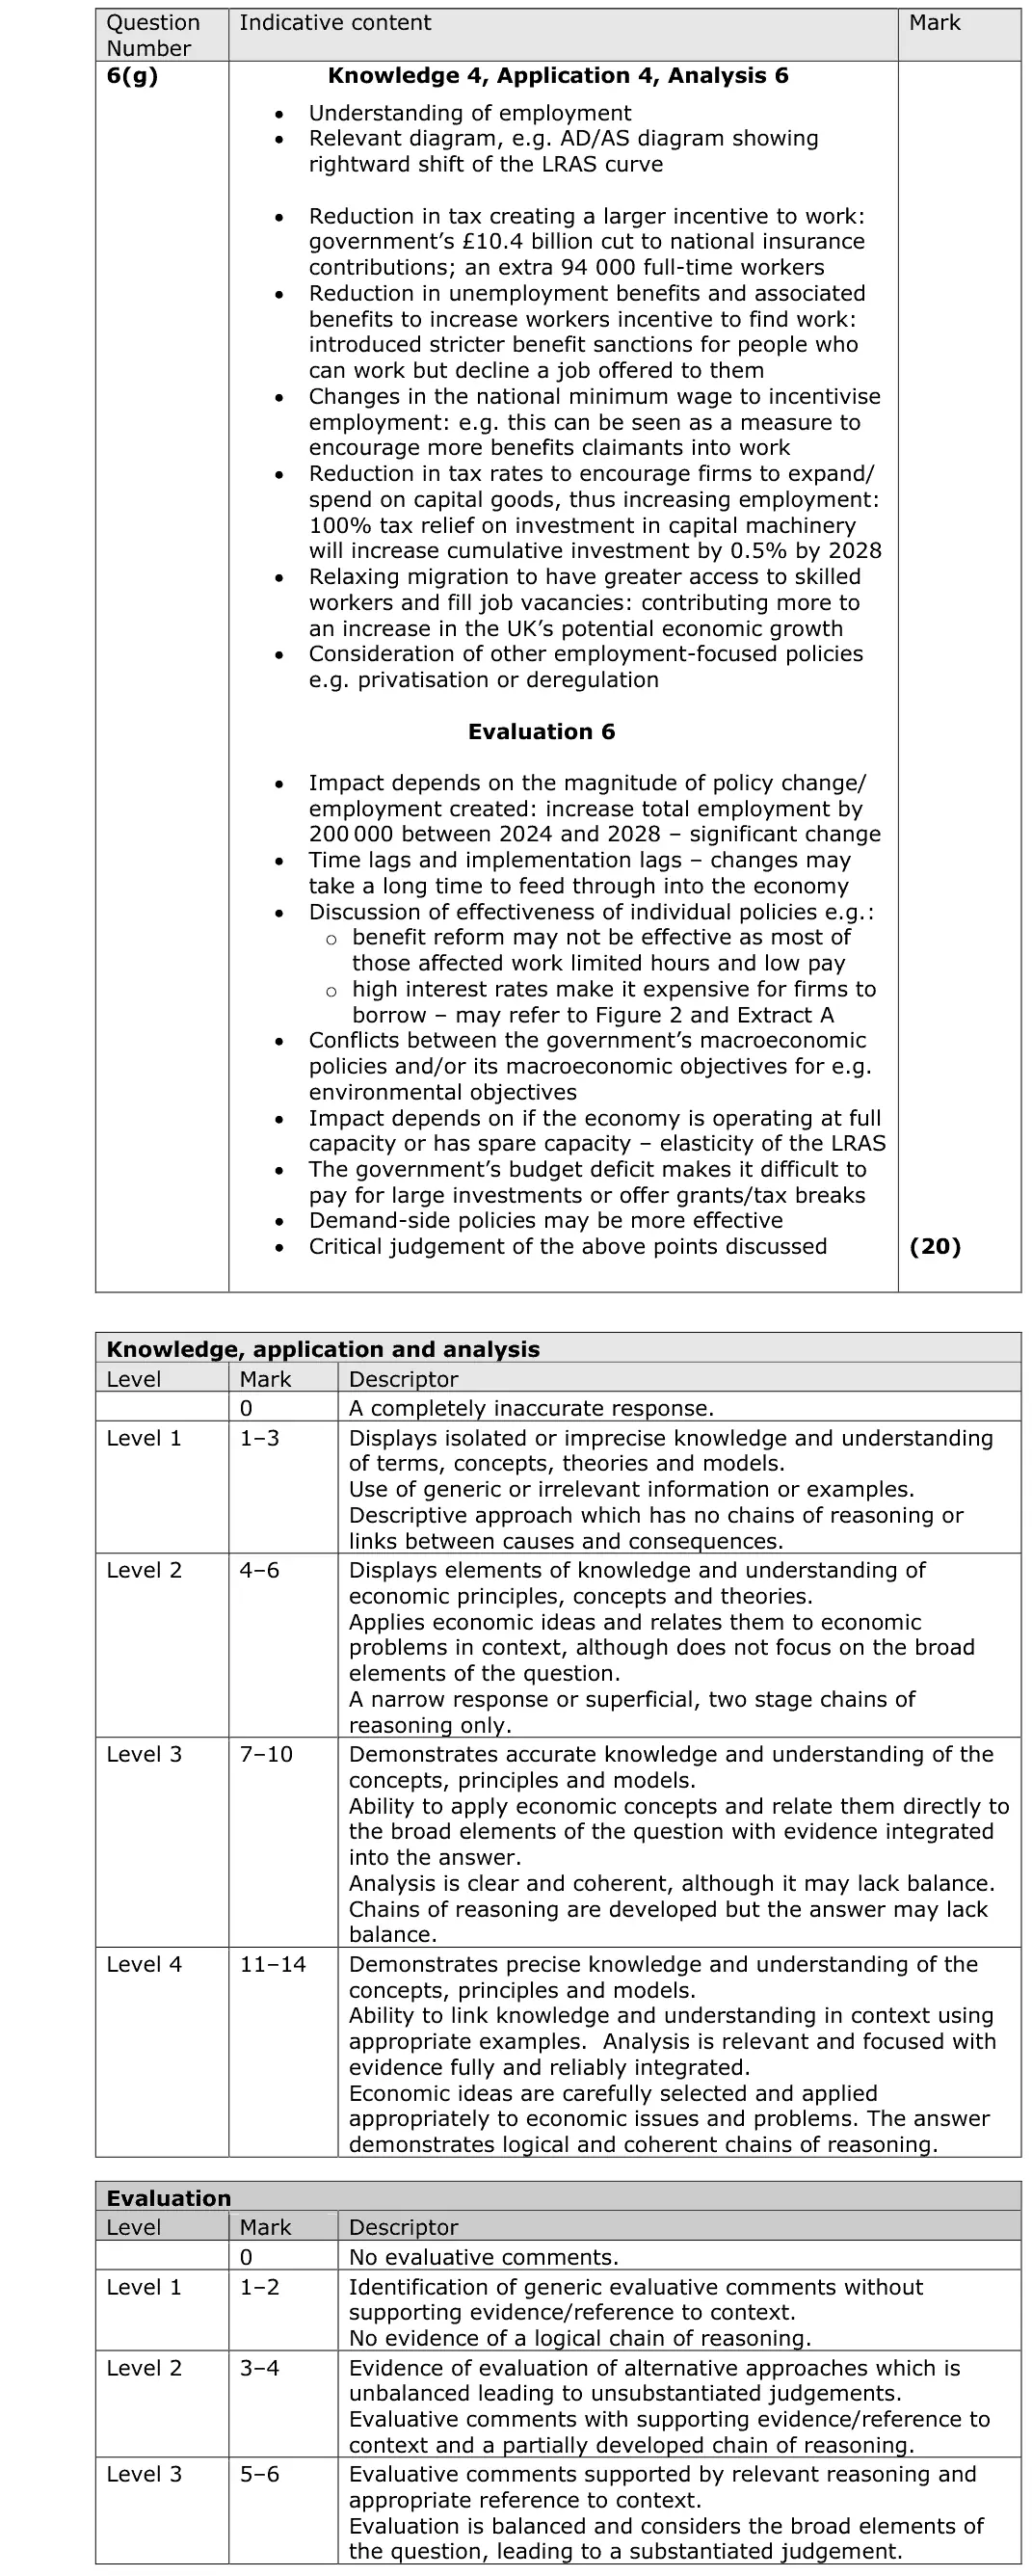
(g) Evaluate the use of market-based supply-side policies to increase UK employment. (20)

Work with an Edexcel economics tutor

Want a paper marked and gone through with you? Message us.

Prefer email? Send an enquiry

If you are under 18, please include a parent's contact details. Enquiries go to enquiries@economicsaleveltutor.com and are deleted once handled. All tutoring is online.