June 2019: AS Paper 2

80 marks · 21 question parts · Paper, mark scheme and report on Pearson's site

Question by question

QTopicMarksAOType
1(a) The circular flow, national income and the multiplier 1AO1=1Definition
1(b) The circular flow, national income and the multiplier 2AO2=2Calculation
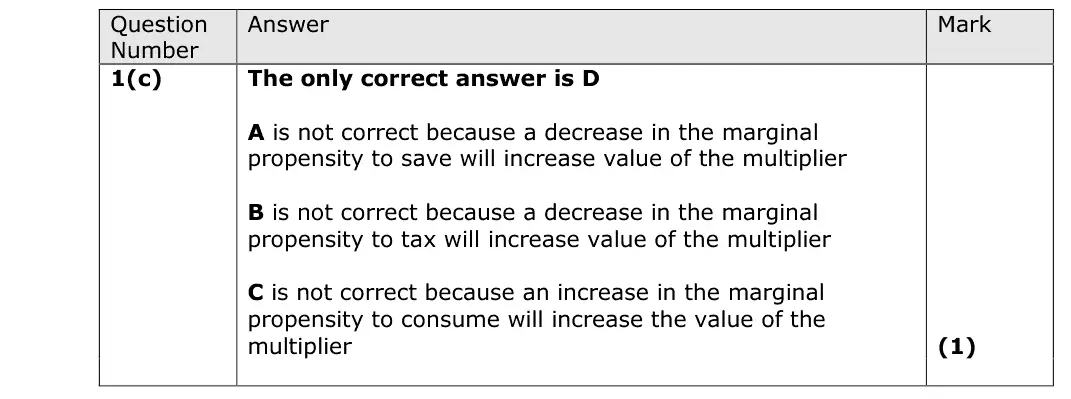
1(c) The circular flow, national income and the multiplier 1Multiple choice
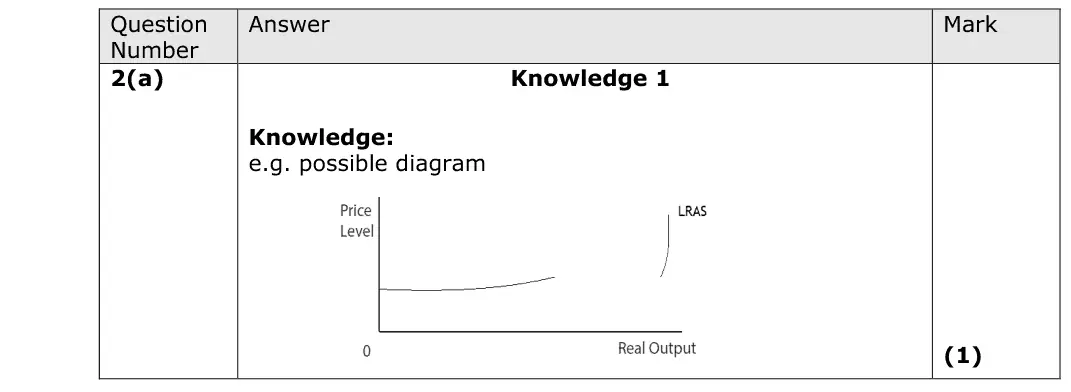
2(a) Aggregate supply 1AO1=1Diagram
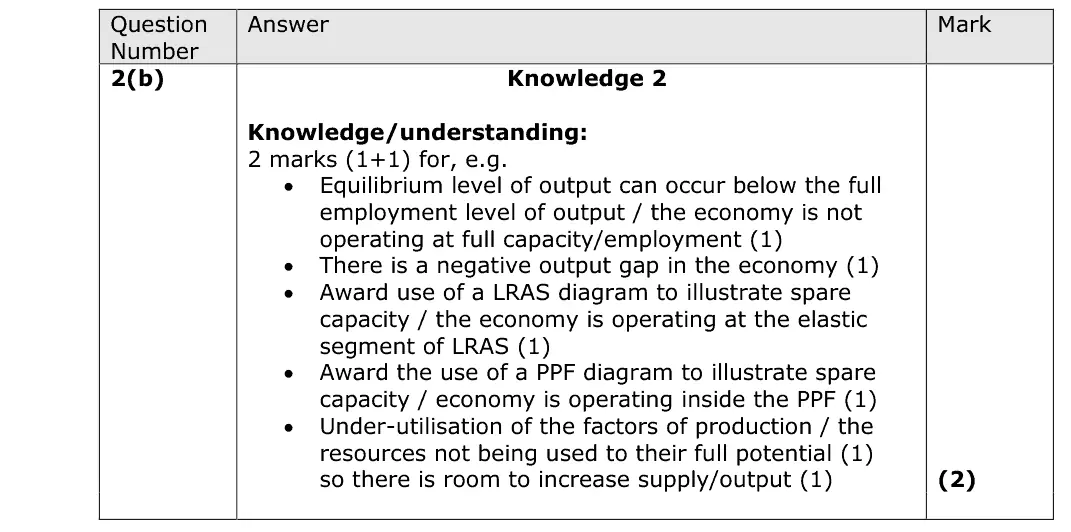
2(b) Economic growth, output gaps and the trade cycle 2AO1=2Short answer
2(c) Aggregate supply 1Multiple choice
3(a) Employment and unemployment 3AO1=1,AO2=1,AO3=1Short answer
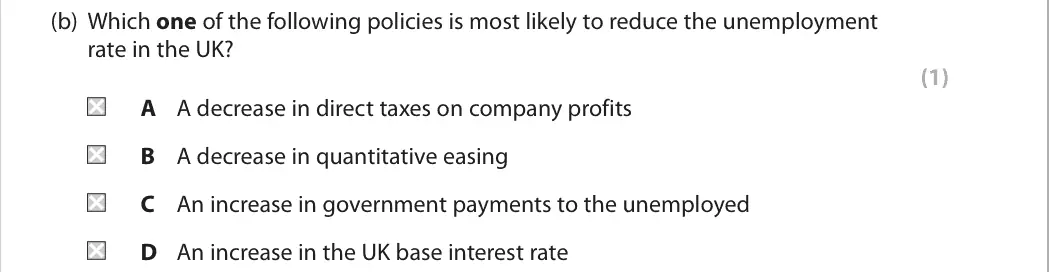
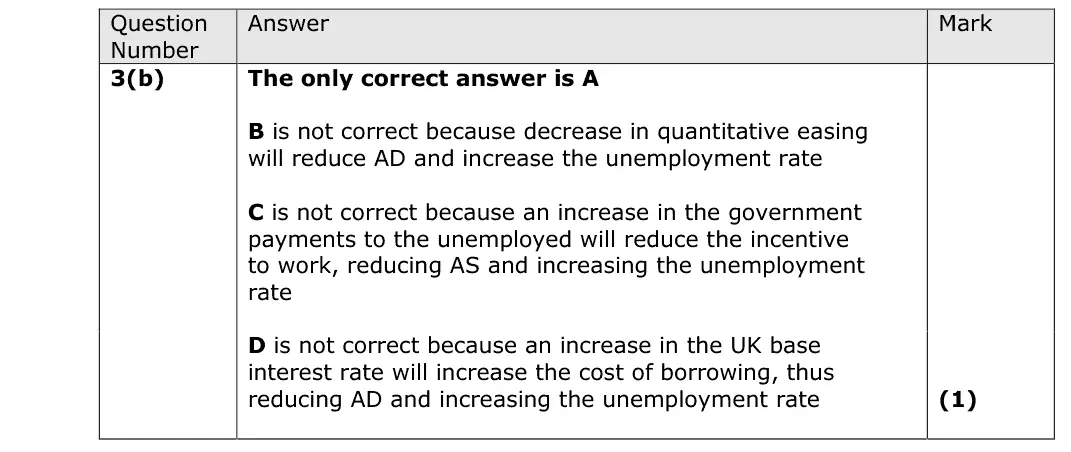
3(b) Supply-side policies 1Multiple choice
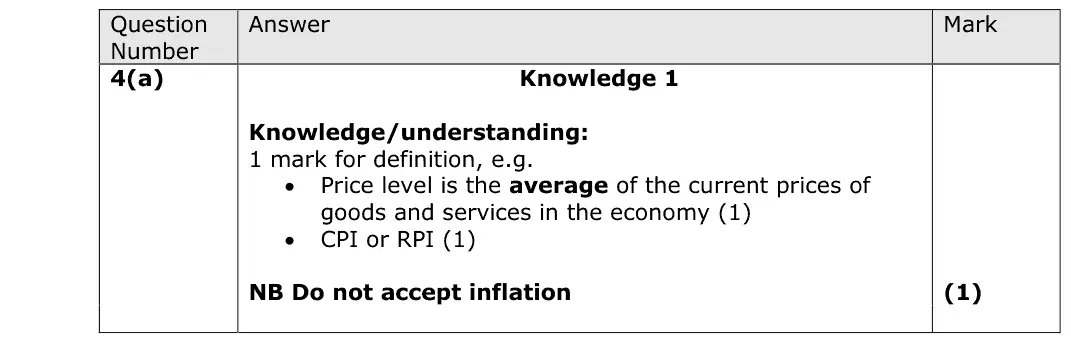
4(a) Inflation 1AO1=1Definition
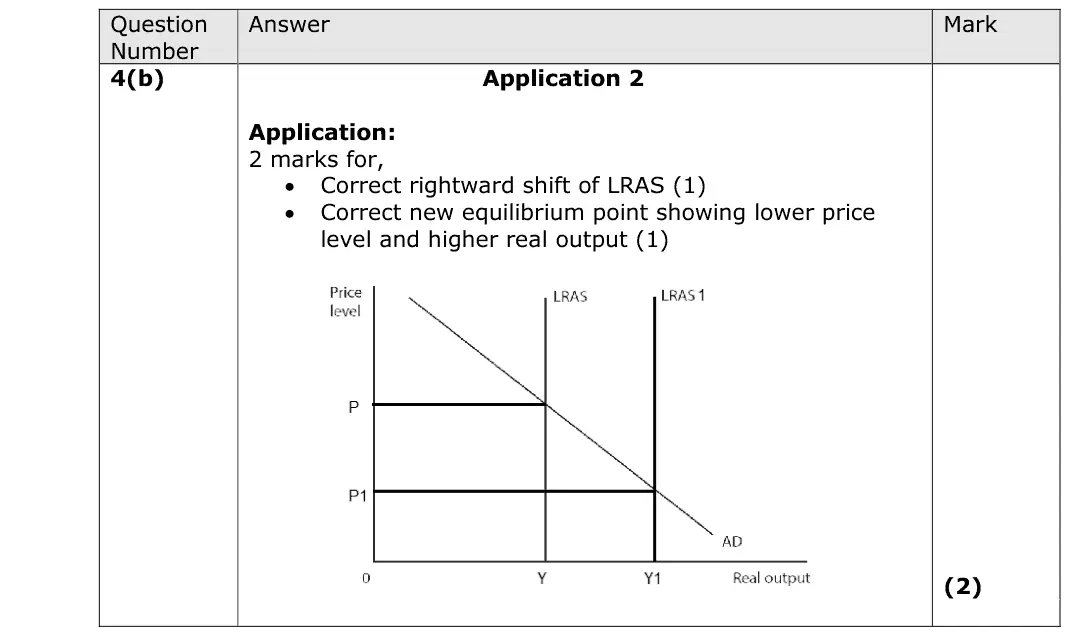
4(b) Supply-side policies, The circular flow, national income and the multiplier 2AO2=2Diagram
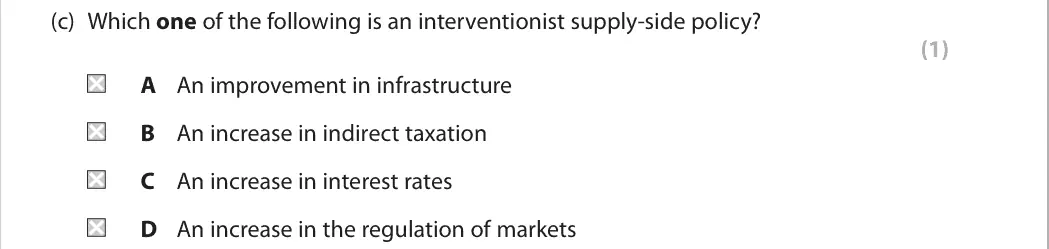
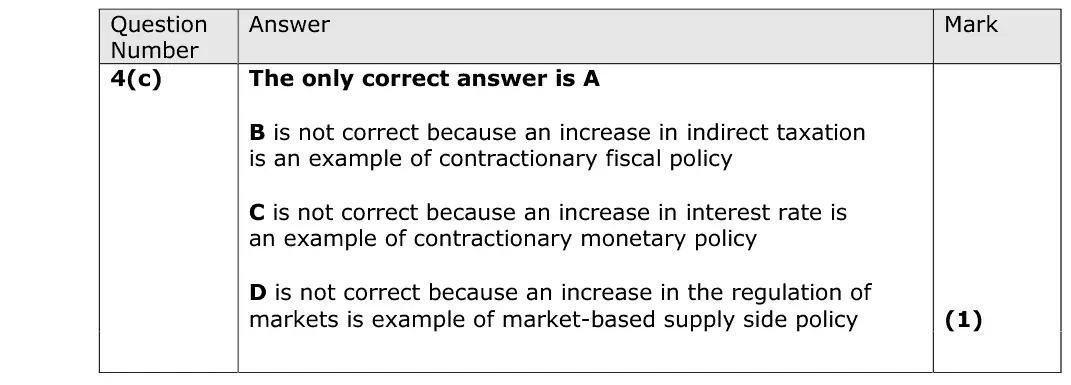
4(c) Supply-side policies 1Multiple choice
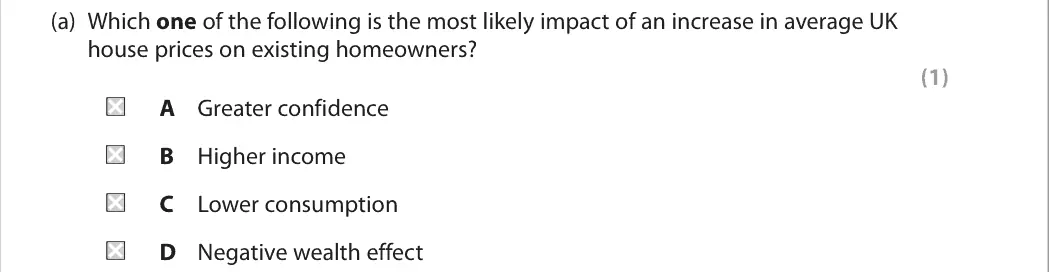
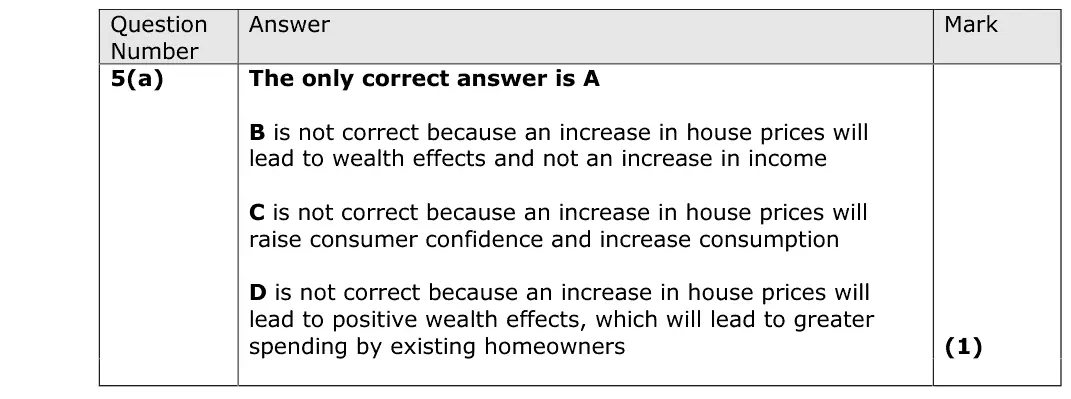
5(a) Aggregate demand 1Multiple choice
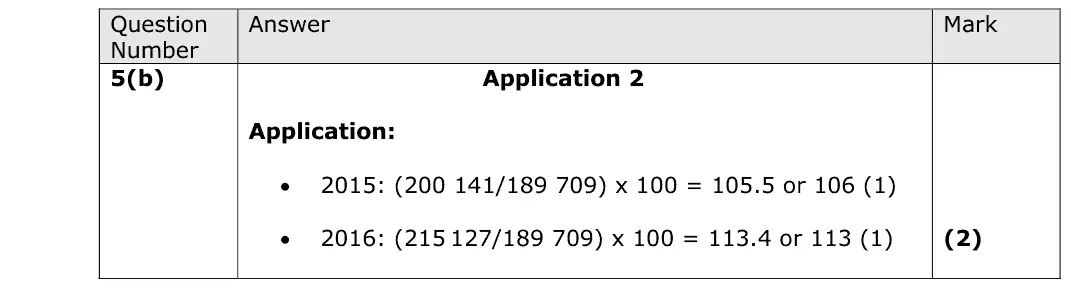
5(b) Inflation 2AO2=2Calculation
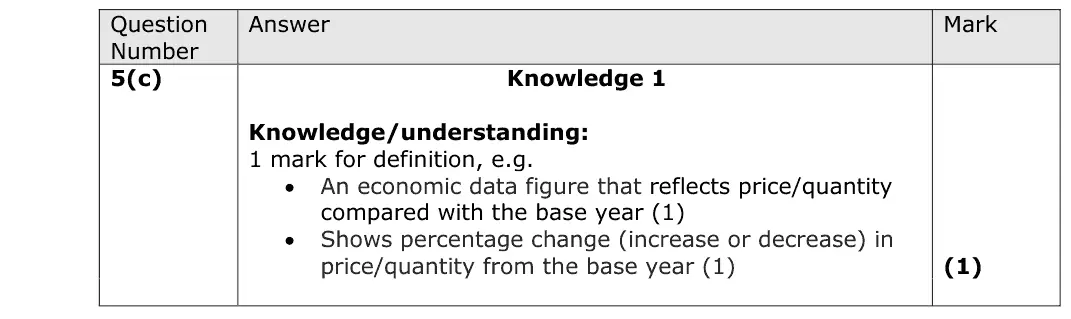
5(c) Inflation 1AO1=1Definition
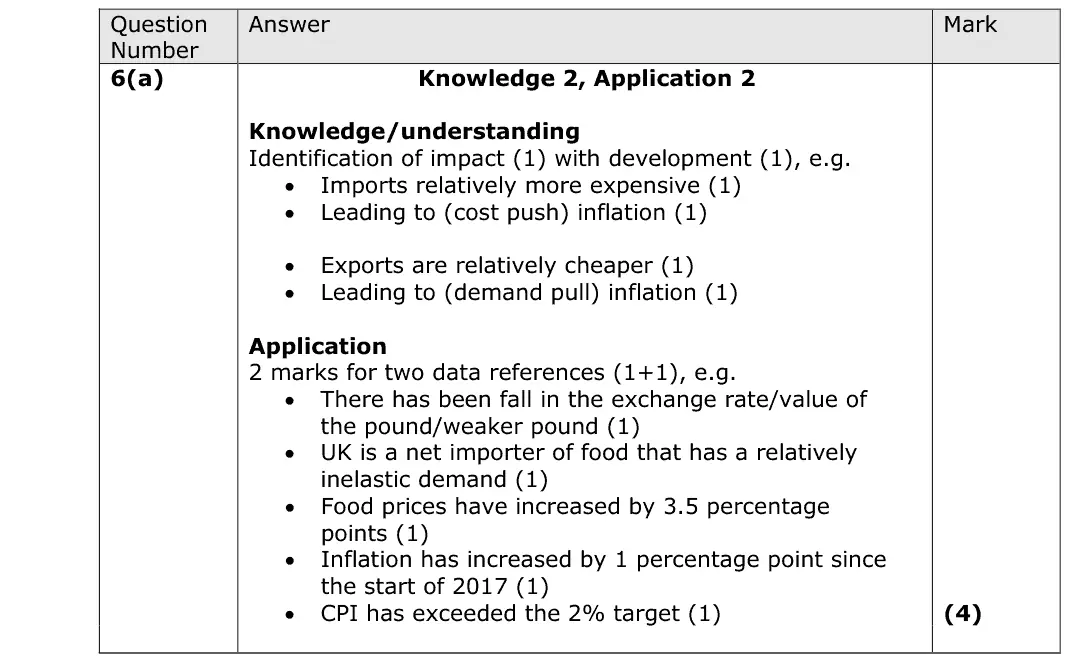
6(a) Inflation 4AO1=2,AO2=2Short answer
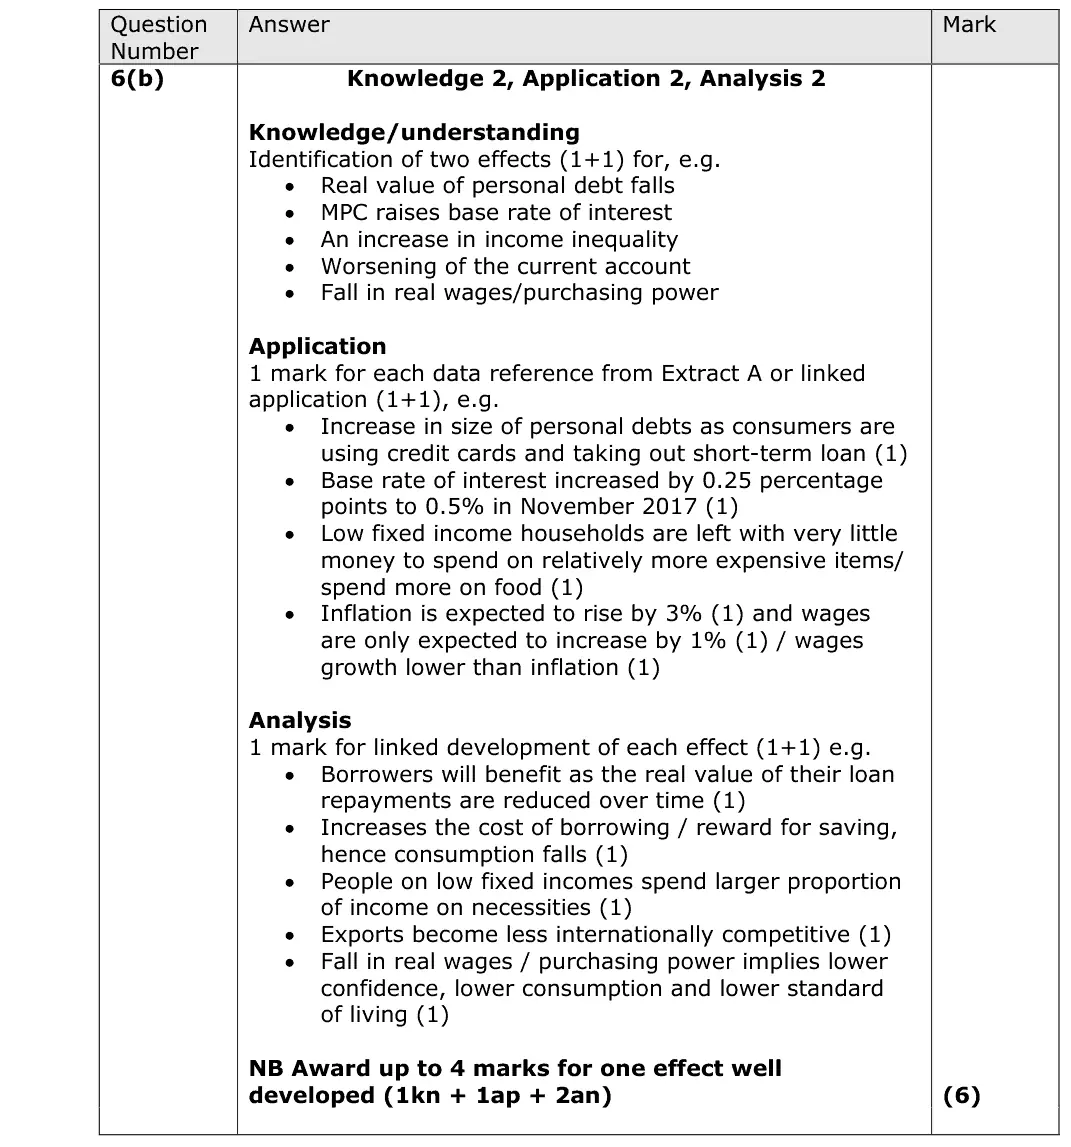
6(b) Inflation 6AO1=2,AO2=2,AO3=2Short answer
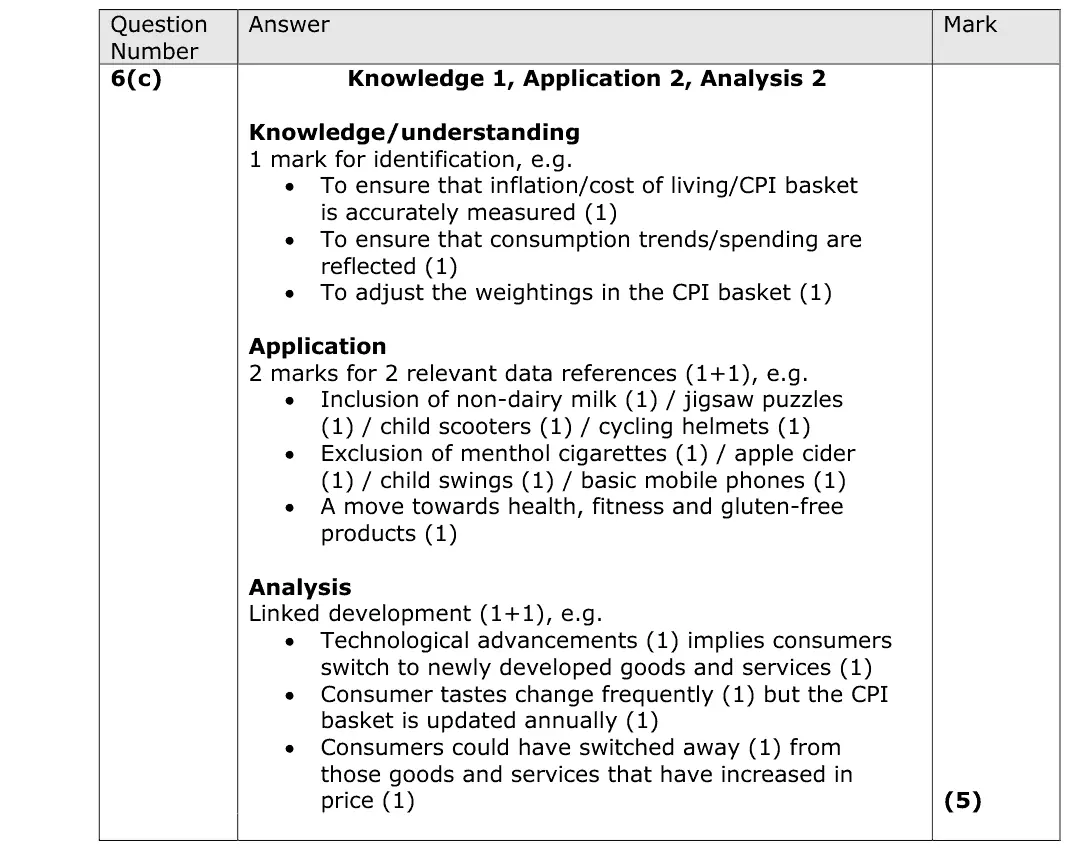
6(c) Inflation 5AO1=1,AO2=2,AO3=2Short answer
6(d) Aggregate demand, The circular flow, national income and the multiplier 10AO1=2,AO2=2,AO3=2,AO4=4Extended response
6(e) Measuring economic growth: GDP, GNI and living standards 15AO1=3,AO2=3,AO3=3,AO4=6Extended response
6(f) Demand-side policies: fiscal and monetary policy, Inflation 20AO1=4,AO2=4,AO3=6,AO4=6Essay
6(g) Macroeconomic objectives, conflicts and trade-offs 20AO1=4,AO2=4,AO3=6,AO4=6Essay

The questions

1(a)1(b)1(c)2(a)2(b)2(c)3(a)3(b)4(a)4(b)4(c)5(a)5(b)5(c)6(a)6(b)6(c)6(d)6(e)6(f)6(g)
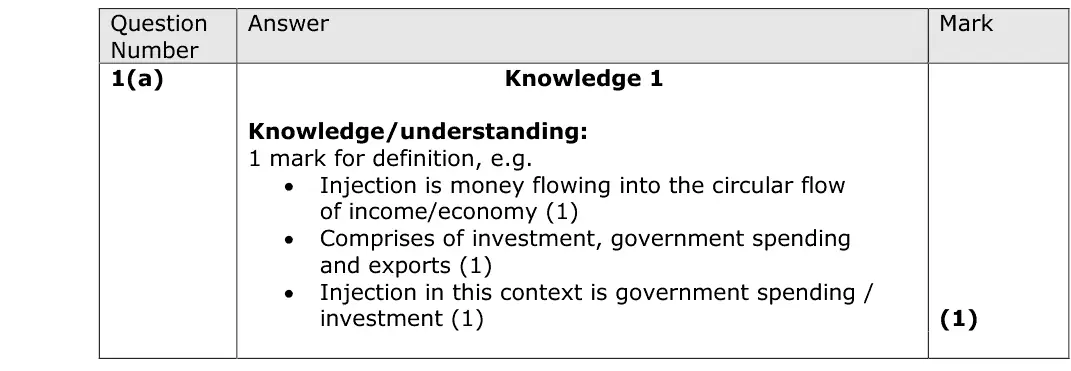
June 2019 · AS Paper 2 · Q1(a) 1 mark AO1=1 Definition national income and the multiplier
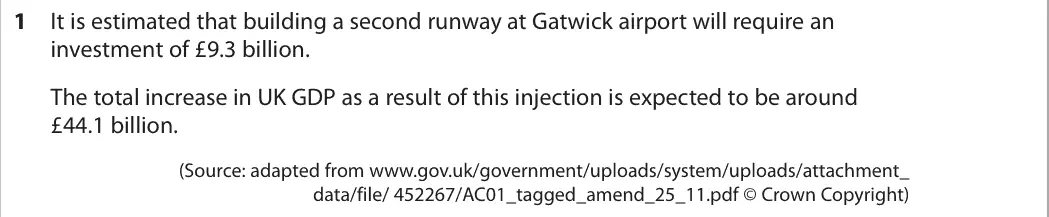
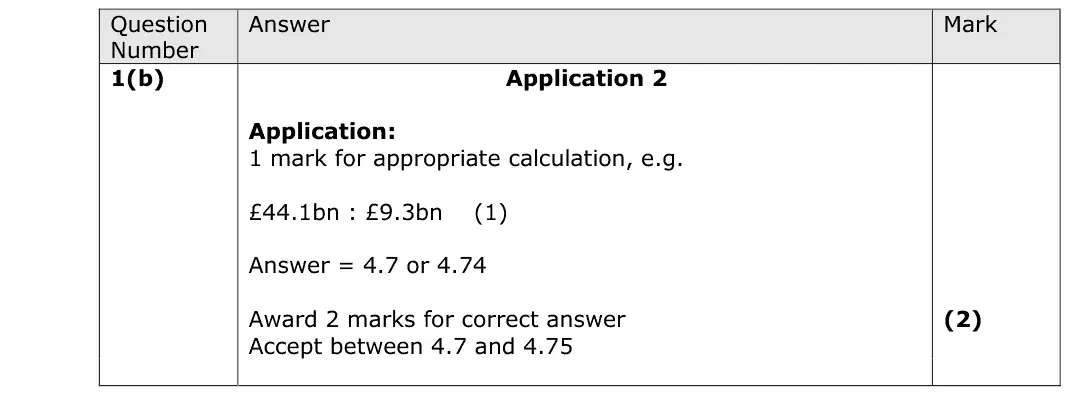
Data and extracts for question 11 It is estimated that building a second runway at Gatwick airport will require an investment of £9.3 billion. The total increase in UK GDP as a result of this injection is expected to be around £44.1 billion. (Source: adapted from www.gov.uk/government/uploads/system/uploads/attachment_ data/file/ 452267/AC01_tagged_amend_25_11.pdf © Crown Copyright)
(a) Define the term ‘injection’ in this context. (1)
June 2019 · AS Paper 2 · Q1(b) 2 marks AO2=2 Calculation national income and the multiplier
Data and extracts for question 11 It is estimated that building a second runway at Gatwick airport will require an investment of £9.3 billion. The total increase in UK GDP as a result of this injection is expected to be around £44.1 billion. (Source: adapted from www.gov.uk/government/uploads/system/uploads/attachment_ data/file/ 452267/AC01_tagged_amend_25_11.pdf © Crown Copyright)
(b) Calculate the value of the multiplier based on the data given. You are advised to show your working. (2)
June 2019 · AS Paper 2 · Q1(c) 1 mark Multiple choice national income and the multiplier
Data and extracts for question 11 It is estimated that building a second runway at Gatwick airport will require an investment of £9.3 billion. The total increase in UK GDP as a result of this injection is expected to be around £44.1 billion. (Source: adapted from www.gov.uk/government/uploads/system/uploads/attachment_ data/file/ 452267/AC01_tagged_amend_25_11.pdf © Crown Copyright)
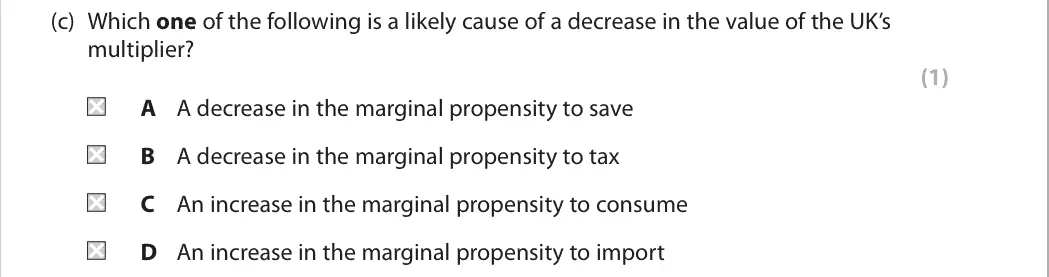
(c) Which one of the following is a likely cause of a decrease in the value of the UK’s multiplier? (1) A A decrease in the marginal propensity to save B A decrease in the marginal propensity to tax C An increase in the marginal propensity to consume D An increase in the marginal propensity to import
June 2019 · AS Paper 2 · Q2(a) 1 mark AO1=1 Diagram aggregate supply
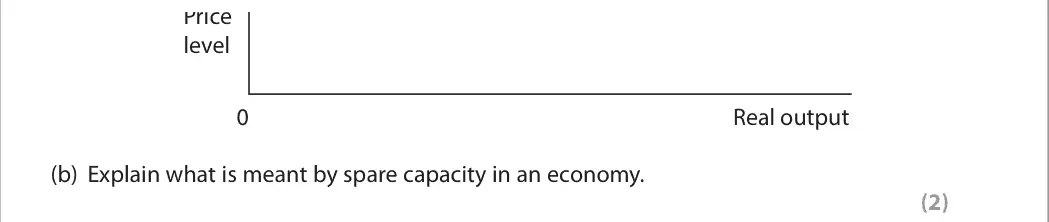
(a) Illustrate the shape of the Keynesian long-run AS curve on the diagram below. (1)
June 2019 · AS Paper 2 · Q2(b) 2 marks AO1=2 Short answer economic growth and the trade cycle
Price level 0 Real output (b) Explain what is meant by spare capacity in an economy. (2)
June 2019 · AS Paper 2 · Q2(c) 1 mark Multiple choice aggregate supply
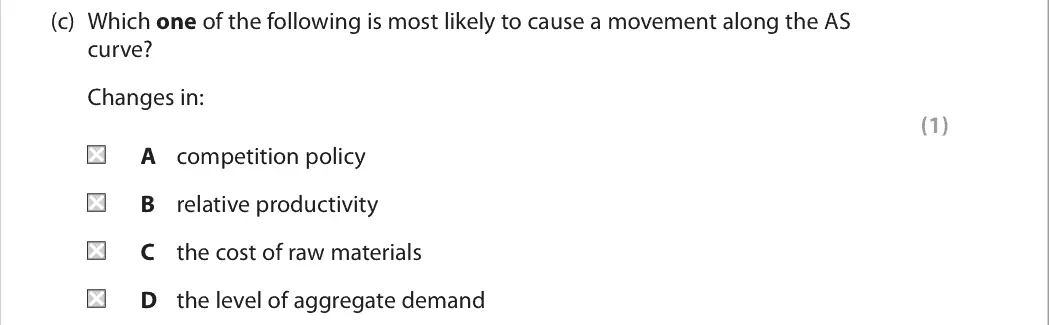
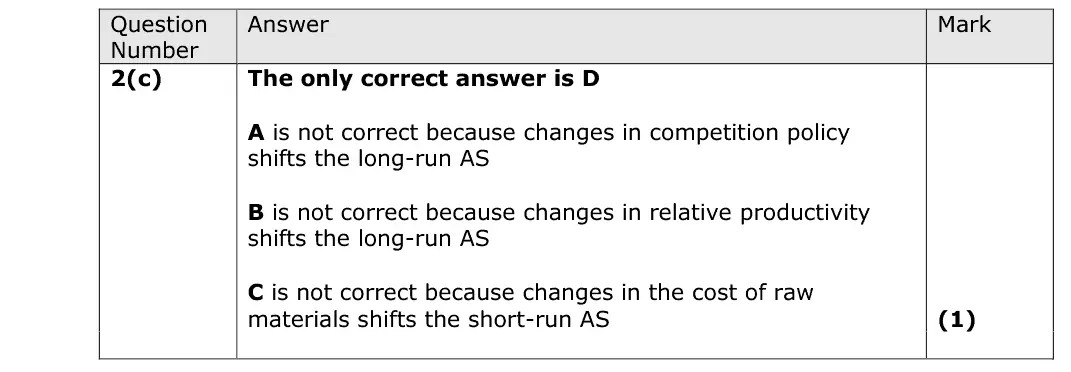
(c) Which one of the following is most likely to cause a movement along the AS curve? Changes in: (1) A competition policy B relative productivity C the cost of raw materials D the level of aggregate demand
June 2019 · AS Paper 2 · Q3(a) 3 marks AO1=1, AO2=1, AO3=1 Short answer unemployment
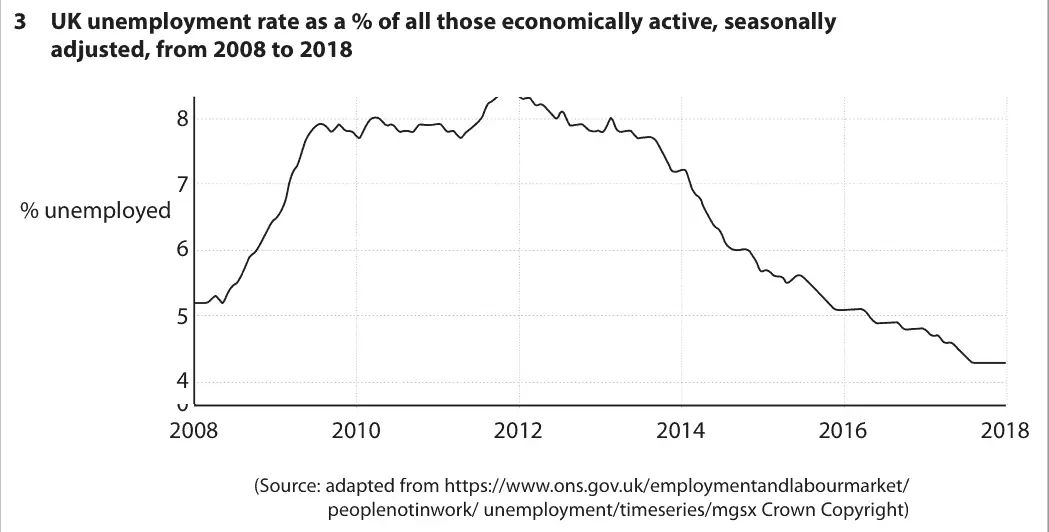
Data and extracts for question 33 UK unemployment rate as a % of all those economically active, seasonally adjusted, from 2008 to 2018 9 8 7 % unemployed 6 5 4 0 2008 2010 2012 2014 2016 2018 (Source: adapted from https://www.ons.gov.uk/employmentandlabourmarket/ peoplenotinwork/ unemployment/timeseries/mgsx Crown Copyright)
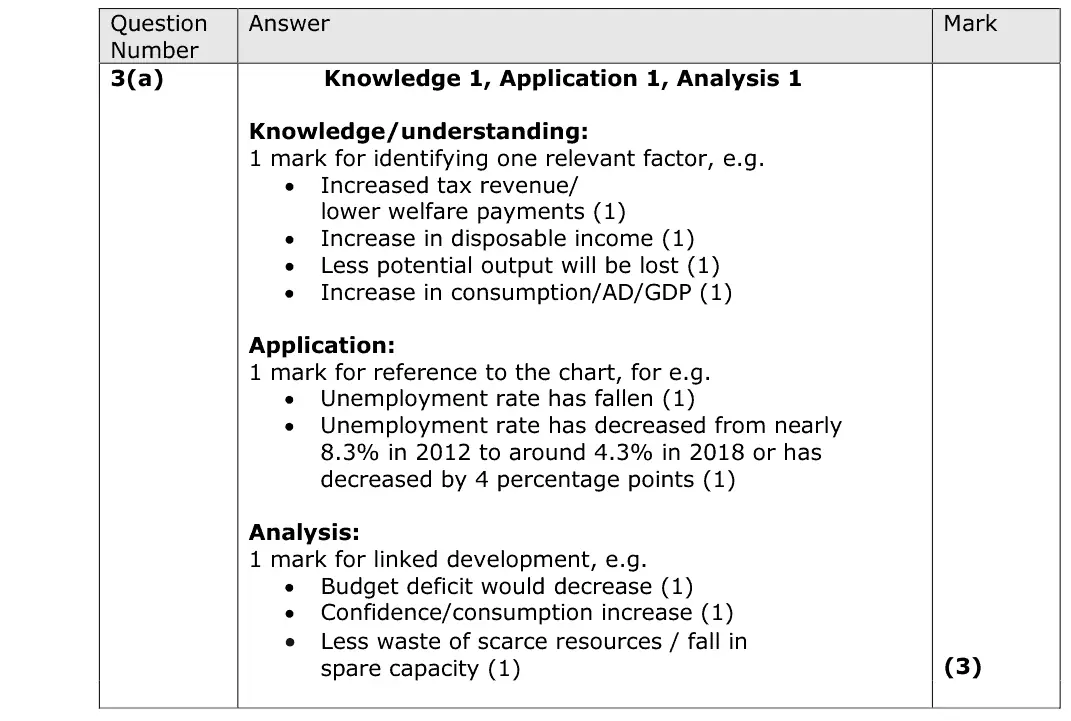
(a) With reference to the chart above, explain one likely economic effect of the change in the UK unemployment rate between 2012 and 2018. (3)
June 2019 · AS Paper 2 · Q3(b) 1 mark Multiple choice supply side policies
Data and extracts for question 33 UK unemployment rate as a % of all those economically active, seasonally adjusted, from 2008 to 2018 9 8 7 % unemployed 6 5 4 0 2008 2010 2012 2014 2016 2018 (Source: adapted from https://www.ons.gov.uk/employmentandlabourmarket/ peoplenotinwork/ unemployment/timeseries/mgsx Crown Copyright)
(b) Which one of the following policies is most likely to reduce the unemployment rate in the UK? (1) A A decrease in direct taxes on company profits B A decrease in quantitative easing C An increase in government payments to the unemployed D An increase in the UK base interest rate
June 2019 · AS Paper 2 · Q4(a) 1 mark AO1=1 Definition Hard inflation
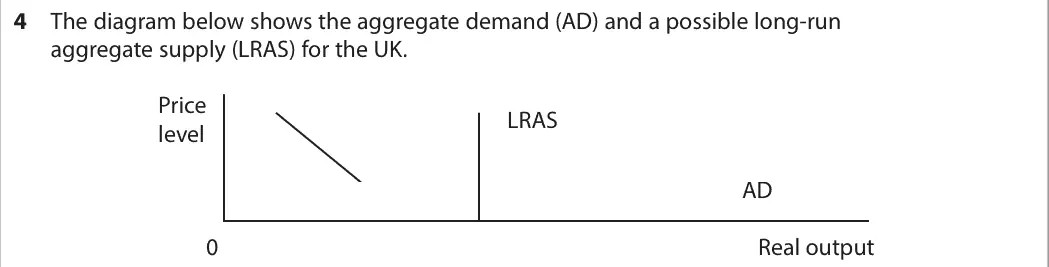
Data and extracts for question 44 The diagram below shows the aggregate demand (AD) and a possible long-run aggregate supply (LRAS) for the UK. Price LRAS level AD 0 Real output
(a) Define the term ‘price level’. (1)
June 2019 · AS Paper 2 · Q4(b) 2 marks AO2=2 Diagram supply side policiesnational income and the multiplier
Data and extracts for question 44 The diagram below shows the aggregate demand (AD) and a possible long-run aggregate supply (LRAS) for the UK. Price LRAS level AD 0 Real output
(b) Annotate the diagram above to show the likely impact of government policy to promote business competition on the equilibrium level of real output and price level. (2)
June 2019 · AS Paper 2 · Q4(c) 1 mark Multiple choice supply side policies
Data and extracts for question 44 The diagram below shows the aggregate demand (AD) and a possible long-run aggregate supply (LRAS) for the UK. Price LRAS level AD 0 Real output
(c) Which one of the following is an interventionist supply-side policy? (1) A An improvement in infrastructure B An increase in indirect taxation C An increase in interest rates D An increase in the regulation of markets
June 2019 · AS Paper 2 · Q5(a) 1 mark Multiple choice aggregate demand
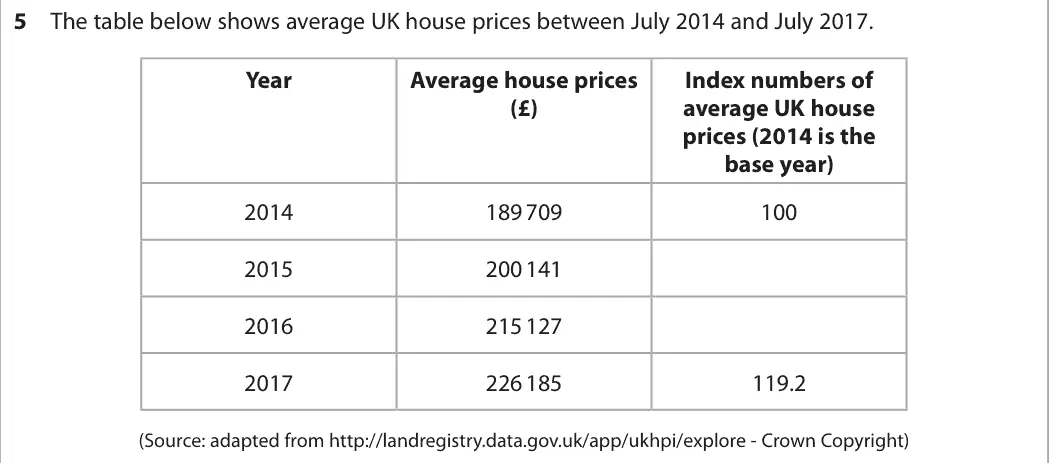
Data and extracts for question 55 The table below shows average UK house prices between July 2014 and July 2017. Year Average house prices Index numbers of (£) average UK house prices (2014 is the base year) 2014 189 709 100 2015 200 141 2016 215 127 2017 226 185 119.2 (Source: adapted from http://landregistry.data.gov.uk/app/ukhpi/explore - Crown Copyright)
(a) Which one of the following is the most likely impact of an increase in average UK house prices on existing homeowners? (1) A Greater confidence B Higher income C Lower consumption D Negative wealth effect
June 2019 · AS Paper 2 · Q5(b) 2 marks AO2=2 Calculation inflation
Data and extracts for question 55 The table below shows average UK house prices between July 2014 and July 2017. Year Average house prices Index numbers of (£) average UK house prices (2014 is the base year) 2014 189 709 100 2015 200 141 2016 215 127 2017 226 185 119.2 (Source: adapted from http://landregistry.data.gov.uk/app/ukhpi/explore - Crown Copyright)
(b) Using 2014 as the base year, calculate the index number for (2) (i) 2015 (ii) 2016.
June 2019 · AS Paper 2 · Q5(c) 1 mark AO1=1 Definition inflation
Data and extracts for question 55 The table below shows average UK house prices between July 2014 and July 2017. Year Average house prices Index numbers of (£) average UK house prices (2014 is the base year) 2014 189 709 100 2015 200 141 2016 215 127 2017 226 185 119.2 (Source: adapted from http://landregistry.data.gov.uk/app/ukhpi/explore - Crown Copyright)
(c) Define the term ‘index number’. (1)
June 2019 · AS Paper 2 · Q6(a) 4 marks AO1=2, AO2=2 Short answer inflation
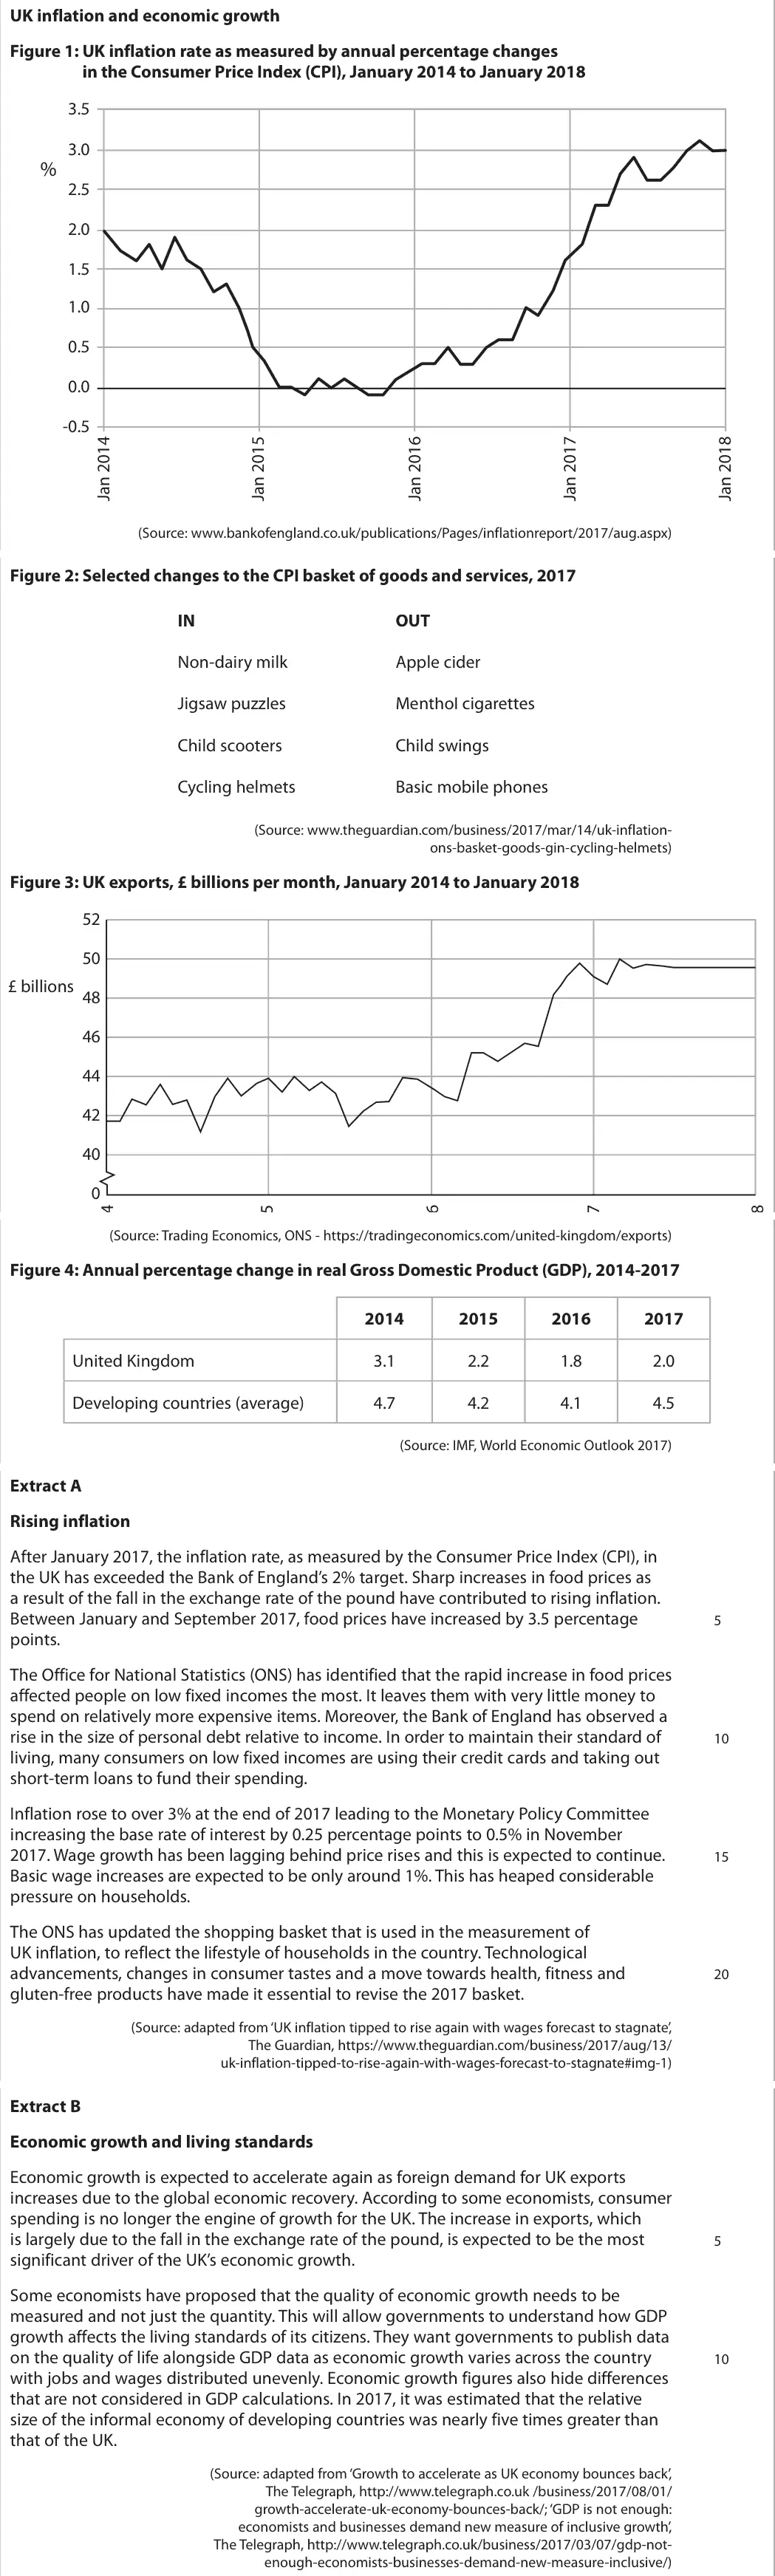
Data and extracts for question 6UK inflation and economic growth Figure 1: UK inflation rate as measured by annual percentage changes in the Consumer Price Index (CPI), January 2014 to January 2018 3.5 3.0 % 2.5 2.0 1.5 1.0 0.5 0.0 -0.5 (Source: www.bankofengland.co.uk/publications/Pages/inflationreport/2017/aug.aspx) Figure 2: Selected changes to the CPI basket of goods and services, 2017 IN OUT Non-dairy milk Apple cider Jigsaw puzzles Menthol cigarettes Child scooters Child swings Cycling helmets Basic mobile phones (Source: www.theguardian.com/business/2017/mar/14/uk-inflation- ons-basket-goods-gin-cycling-helmets) Figure 3: UK exports, £ billions per month, January 2014 to January 2018 52 50 £ billions 48 46 44 42 40 0 (Source: Trading Economics, ONS - https://tradingeconomics.com/united-kingdom/exports) Figure 4: Annual percentage change in real Gross Domestic Product (GDP), 2014-2017 2014 2015 2016 2017 United Kingdom 3.1 2.2 1.8 2.0 Developing countries (average) 4.7 4.2 4.1 4.5 (Source: IMF, World Economic Outlook 2017) Extract A Rising inflation After January 2017, the inflation rate, as measured by the Consumer Price Index (CPI), in the UK has exceeded the Bank of England’s 2% target. Sharp increases in food prices as a result of the fall in the exchange rate of the pound have contributed to rising inflation. Between January and September 2017, food prices have increased by 3.5 percentage 5 points. The Office for National Statistics (ONS) has identified that the rapid increase in food prices affected people on low fixed incomes the most. It leaves them with very little money to spend on relatively more expensive items. Moreover, the Bank of England has observed a rise in the size of personal debt relative to income. In order to maintain their standard of 10 living, many consumers on low fixed incomes are using their credit cards and taking out short-term loans to fund their spending. Inflation rose to over 3% at the end of 2017 leading to the Monetary Policy Committee increasing the base rate of interest by 0.25 percentage points to 0.5% in November 2017. Wage growth has been lagging behind price rises and this is expected to continue. 15 Basic wage increases are expected to be only around 1%. This has heaped considerable pressure on households. The ONS has updated the shopping basket that is used in the measurement of UK inflation, to reflect the lifestyle of households in the country. Technological advancements, changes in consumer tastes and a move towards health, fitness and 20 gluten-free products have made it essential to revise the 2017 basket. (Source: adapted from ‘UK inflation tipped to rise again with wages forecast to stagnate’, The Guardian, https://www.theguardian.com/business/2017/aug/13/ uk-inflation-tipped-to-rise-again-with-wages-forecast-to-stagnate#img-1) Extract B Economic growth and living standards Economic growth is expected to accelerate again as foreign demand for UK exports increases due to the global economic recovery. According to some economists, consumer spending is no longer the engine of growth for the UK. The increase in exports, which is largely due to the fall in the exchange rate of the pound, is expected to be the most 5 significant driver of the UK’s economic growth. Some economists have proposed that the quality of economic growth needs to be measured and not just the quantity. This will allow governments to understand how GDP growth affects the living standards of its citizens. They want governments to publish data on the quality of life alongside GDP data as economic growth varies across the country 10 with jobs and wages distributed unevenly. Economic growth figures also hide differences that are not considered in GDP calculations. In 2017, it was estimated that the relative size of the informal economy of developing countries was nearly five times greater than that of the UK. (Source: adapted from ‘Growth to accelerate as UK economy bounces back’, The Telegraph, http://www.telegraph.co.uk /business/2017/08/01/ growth-accelerate-uk-economy-bounces-back/; ‘GDP is not enough: economists and businesses demand new measure of inclusive growth’, The Telegraph, http://www.telegraph.co.uk/business/2017/03/07/gdp-not- enough-economists-businesses-demand-new-measure-inclusive/)


(a) With reference to the first paragraph of Extract A and Figure 1, explain how the change in the exchange rate of the pound has ‘contributed to rising inflation’ (Extract A, line 4). (4)
June 2019 · AS Paper 2 · Q6(b) 6 marks AO1=2, AO2=2, AO3=2 Short answer inflation
Data and extracts for question 6UK inflation and economic growth Figure 1: UK inflation rate as measured by annual percentage changes in the Consumer Price Index (CPI), January 2014 to January 2018 3.5 3.0 % 2.5 2.0 1.5 1.0 0.5 0.0 -0.5 (Source: www.bankofengland.co.uk/publications/Pages/inflationreport/2017/aug.aspx) Figure 2: Selected changes to the CPI basket of goods and services, 2017 IN OUT Non-dairy milk Apple cider Jigsaw puzzles Menthol cigarettes Child scooters Child swings Cycling helmets Basic mobile phones (Source: www.theguardian.com/business/2017/mar/14/uk-inflation- ons-basket-goods-gin-cycling-helmets) Figure 3: UK exports, £ billions per month, January 2014 to January 2018 52 50 £ billions 48 46 44 42 40 0 (Source: Trading Economics, ONS - https://tradingeconomics.com/united-kingdom/exports) Figure 4: Annual percentage change in real Gross Domestic Product (GDP), 2014-2017 2014 2015 2016 2017 United Kingdom 3.1 2.2 1.8 2.0 Developing countries (average) 4.7 4.2 4.1 4.5 (Source: IMF, World Economic Outlook 2017) Extract A Rising inflation After January 2017, the inflation rate, as measured by the Consumer Price Index (CPI), in the UK has exceeded the Bank of England’s 2% target. Sharp increases in food prices as a result of the fall in the exchange rate of the pound have contributed to rising inflation. Between January and September 2017, food prices have increased by 3.5 percentage 5 points. The Office for National Statistics (ONS) has identified that the rapid increase in food prices affected people on low fixed incomes the most. It leaves them with very little money to spend on relatively more expensive items. Moreover, the Bank of England has observed a rise in the size of personal debt relative to income. In order to maintain their standard of 10 living, many consumers on low fixed incomes are using their credit cards and taking out short-term loans to fund their spending. Inflation rose to over 3% at the end of 2017 leading to the Monetary Policy Committee increasing the base rate of interest by 0.25 percentage points to 0.5% in November 2017. Wage growth has been lagging behind price rises and this is expected to continue. 15 Basic wage increases are expected to be only around 1%. This has heaped considerable pressure on households. The ONS has updated the shopping basket that is used in the measurement of UK inflation, to reflect the lifestyle of households in the country. Technological advancements, changes in consumer tastes and a move towards health, fitness and 20 gluten-free products have made it essential to revise the 2017 basket. (Source: adapted from ‘UK inflation tipped to rise again with wages forecast to stagnate’, The Guardian, https://www.theguardian.com/business/2017/aug/13/ uk-inflation-tipped-to-rise-again-with-wages-forecast-to-stagnate#img-1) Extract B Economic growth and living standards Economic growth is expected to accelerate again as foreign demand for UK exports increases due to the global economic recovery. According to some economists, consumer spending is no longer the engine of growth for the UK. The increase in exports, which is largely due to the fall in the exchange rate of the pound, is expected to be the most 5 significant driver of the UK’s economic growth. Some economists have proposed that the quality of economic growth needs to be measured and not just the quantity. This will allow governments to understand how GDP growth affects the living standards of its citizens. They want governments to publish data on the quality of life alongside GDP data as economic growth varies across the country 10 with jobs and wages distributed unevenly. Economic growth figures also hide differences that are not considered in GDP calculations. In 2017, it was estimated that the relative size of the informal economy of developing countries was nearly five times greater than that of the UK. (Source: adapted from ‘Growth to accelerate as UK economy bounces back’, The Telegraph, http://www.telegraph.co.uk /business/2017/08/01/ growth-accelerate-uk-economy-bounces-back/; ‘GDP is not enough: economists and businesses demand new measure of inclusive growth’, The Telegraph, http://www.telegraph.co.uk/business/2017/03/07/gdp-not- enough-economists-businesses-demand-new-measure-inclusive/)
(b) With reference to Extract A, explain two likely economic effects of the higher rate of UK inflation. (6)
June 2019 · AS Paper 2 · Q6(c) 5 marks AO1=1, AO2=2, AO3=2 Short answer inflation
Data and extracts for question 6UK inflation and economic growth Figure 1: UK inflation rate as measured by annual percentage changes in the Consumer Price Index (CPI), January 2014 to January 2018 3.5 3.0 % 2.5 2.0 1.5 1.0 0.5 0.0 -0.5 (Source: www.bankofengland.co.uk/publications/Pages/inflationreport/2017/aug.aspx) Figure 2: Selected changes to the CPI basket of goods and services, 2017 IN OUT Non-dairy milk Apple cider Jigsaw puzzles Menthol cigarettes Child scooters Child swings Cycling helmets Basic mobile phones (Source: www.theguardian.com/business/2017/mar/14/uk-inflation- ons-basket-goods-gin-cycling-helmets) Figure 3: UK exports, £ billions per month, January 2014 to January 2018 52 50 £ billions 48 46 44 42 40 0 (Source: Trading Economics, ONS - https://tradingeconomics.com/united-kingdom/exports) Figure 4: Annual percentage change in real Gross Domestic Product (GDP), 2014-2017 2014 2015 2016 2017 United Kingdom 3.1 2.2 1.8 2.0 Developing countries (average) 4.7 4.2 4.1 4.5 (Source: IMF, World Economic Outlook 2017) Extract A Rising inflation After January 2017, the inflation rate, as measured by the Consumer Price Index (CPI), in the UK has exceeded the Bank of England’s 2% target. Sharp increases in food prices as a result of the fall in the exchange rate of the pound have contributed to rising inflation. Between January and September 2017, food prices have increased by 3.5 percentage 5 points. The Office for National Statistics (ONS) has identified that the rapid increase in food prices affected people on low fixed incomes the most. It leaves them with very little money to spend on relatively more expensive items. Moreover, the Bank of England has observed a rise in the size of personal debt relative to income. In order to maintain their standard of 10 living, many consumers on low fixed incomes are using their credit cards and taking out short-term loans to fund their spending. Inflation rose to over 3% at the end of 2017 leading to the Monetary Policy Committee increasing the base rate of interest by 0.25 percentage points to 0.5% in November 2017. Wage growth has been lagging behind price rises and this is expected to continue. 15 Basic wage increases are expected to be only around 1%. This has heaped considerable pressure on households. The ONS has updated the shopping basket that is used in the measurement of UK inflation, to reflect the lifestyle of households in the country. Technological advancements, changes in consumer tastes and a move towards health, fitness and 20 gluten-free products have made it essential to revise the 2017 basket. (Source: adapted from ‘UK inflation tipped to rise again with wages forecast to stagnate’, The Guardian, https://www.theguardian.com/business/2017/aug/13/ uk-inflation-tipped-to-rise-again-with-wages-forecast-to-stagnate#img-1) Extract B Economic growth and living standards Economic growth is expected to accelerate again as foreign demand for UK exports increases due to the global economic recovery. According to some economists, consumer spending is no longer the engine of growth for the UK. The increase in exports, which is largely due to the fall in the exchange rate of the pound, is expected to be the most 5 significant driver of the UK’s economic growth. Some economists have proposed that the quality of economic growth needs to be measured and not just the quantity. This will allow governments to understand how GDP growth affects the living standards of its citizens. They want governments to publish data on the quality of life alongside GDP data as economic growth varies across the country 10 with jobs and wages distributed unevenly. Economic growth figures also hide differences that are not considered in GDP calculations. In 2017, it was estimated that the relative size of the informal economy of developing countries was nearly five times greater than that of the UK. (Source: adapted from ‘Growth to accelerate as UK economy bounces back’, The Telegraph, http://www.telegraph.co.uk /business/2017/08/01/ growth-accelerate-uk-economy-bounces-back/; ‘GDP is not enough: economists and businesses demand new measure of inclusive growth’, The Telegraph, http://www.telegraph.co.uk/business/2017/03/07/gdp-not- enough-economists-businesses-demand-new-measure-inclusive/)
(c) With reference to the last paragraph of Extract A and Figure 2, explain one reason why it is necessary to regularly update the CPI basket of goods and services. (5)
June 2019 · AS Paper 2 · Q6(d) 10 marks AO1=2, AO2=2, AO3=2, AO4=4 10-mark response aggregate demandnational income and the multiplier
Data and extracts for question 6UK inflation and economic growth Figure 1: UK inflation rate as measured by annual percentage changes in the Consumer Price Index (CPI), January 2014 to January 2018 3.5 3.0 % 2.5 2.0 1.5 1.0 0.5 0.0 -0.5 (Source: www.bankofengland.co.uk/publications/Pages/inflationreport/2017/aug.aspx) Figure 2: Selected changes to the CPI basket of goods and services, 2017 IN OUT Non-dairy milk Apple cider Jigsaw puzzles Menthol cigarettes Child scooters Child swings Cycling helmets Basic mobile phones (Source: www.theguardian.com/business/2017/mar/14/uk-inflation- ons-basket-goods-gin-cycling-helmets) Figure 3: UK exports, £ billions per month, January 2014 to January 2018 52 50 £ billions 48 46 44 42 40 0 (Source: Trading Economics, ONS - https://tradingeconomics.com/united-kingdom/exports) Figure 4: Annual percentage change in real Gross Domestic Product (GDP), 2014-2017 2014 2015 2016 2017 United Kingdom 3.1 2.2 1.8 2.0 Developing countries (average) 4.7 4.2 4.1 4.5 (Source: IMF, World Economic Outlook 2017) Extract A Rising inflation After January 2017, the inflation rate, as measured by the Consumer Price Index (CPI), in the UK has exceeded the Bank of England’s 2% target. Sharp increases in food prices as a result of the fall in the exchange rate of the pound have contributed to rising inflation. Between January and September 2017, food prices have increased by 3.5 percentage 5 points. The Office for National Statistics (ONS) has identified that the rapid increase in food prices affected people on low fixed incomes the most. It leaves them with very little money to spend on relatively more expensive items. Moreover, the Bank of England has observed a rise in the size of personal debt relative to income. In order to maintain their standard of 10 living, many consumers on low fixed incomes are using their credit cards and taking out short-term loans to fund their spending. Inflation rose to over 3% at the end of 2017 leading to the Monetary Policy Committee increasing the base rate of interest by 0.25 percentage points to 0.5% in November 2017. Wage growth has been lagging behind price rises and this is expected to continue. 15 Basic wage increases are expected to be only around 1%. This has heaped considerable pressure on households. The ONS has updated the shopping basket that is used in the measurement of UK inflation, to reflect the lifestyle of households in the country. Technological advancements, changes in consumer tastes and a move towards health, fitness and 20 gluten-free products have made it essential to revise the 2017 basket. (Source: adapted from ‘UK inflation tipped to rise again with wages forecast to stagnate’, The Guardian, https://www.theguardian.com/business/2017/aug/13/ uk-inflation-tipped-to-rise-again-with-wages-forecast-to-stagnate#img-1) Extract B Economic growth and living standards Economic growth is expected to accelerate again as foreign demand for UK exports increases due to the global economic recovery. According to some economists, consumer spending is no longer the engine of growth for the UK. The increase in exports, which is largely due to the fall in the exchange rate of the pound, is expected to be the most 5 significant driver of the UK’s economic growth. Some economists have proposed that the quality of economic growth needs to be measured and not just the quantity. This will allow governments to understand how GDP growth affects the living standards of its citizens. They want governments to publish data on the quality of life alongside GDP data as economic growth varies across the country 10 with jobs and wages distributed unevenly. Economic growth figures also hide differences that are not considered in GDP calculations. In 2017, it was estimated that the relative size of the informal economy of developing countries was nearly five times greater than that of the UK. (Source: adapted from ‘Growth to accelerate as UK economy bounces back’, The Telegraph, http://www.telegraph.co.uk /business/2017/08/01/ growth-accelerate-uk-economy-bounces-back/; ‘GDP is not enough: economists and businesses demand new measure of inclusive growth’, The Telegraph, http://www.telegraph.co.uk/business/2017/03/07/gdp-not- enough-economists-businesses-demand-new-measure-inclusive/)
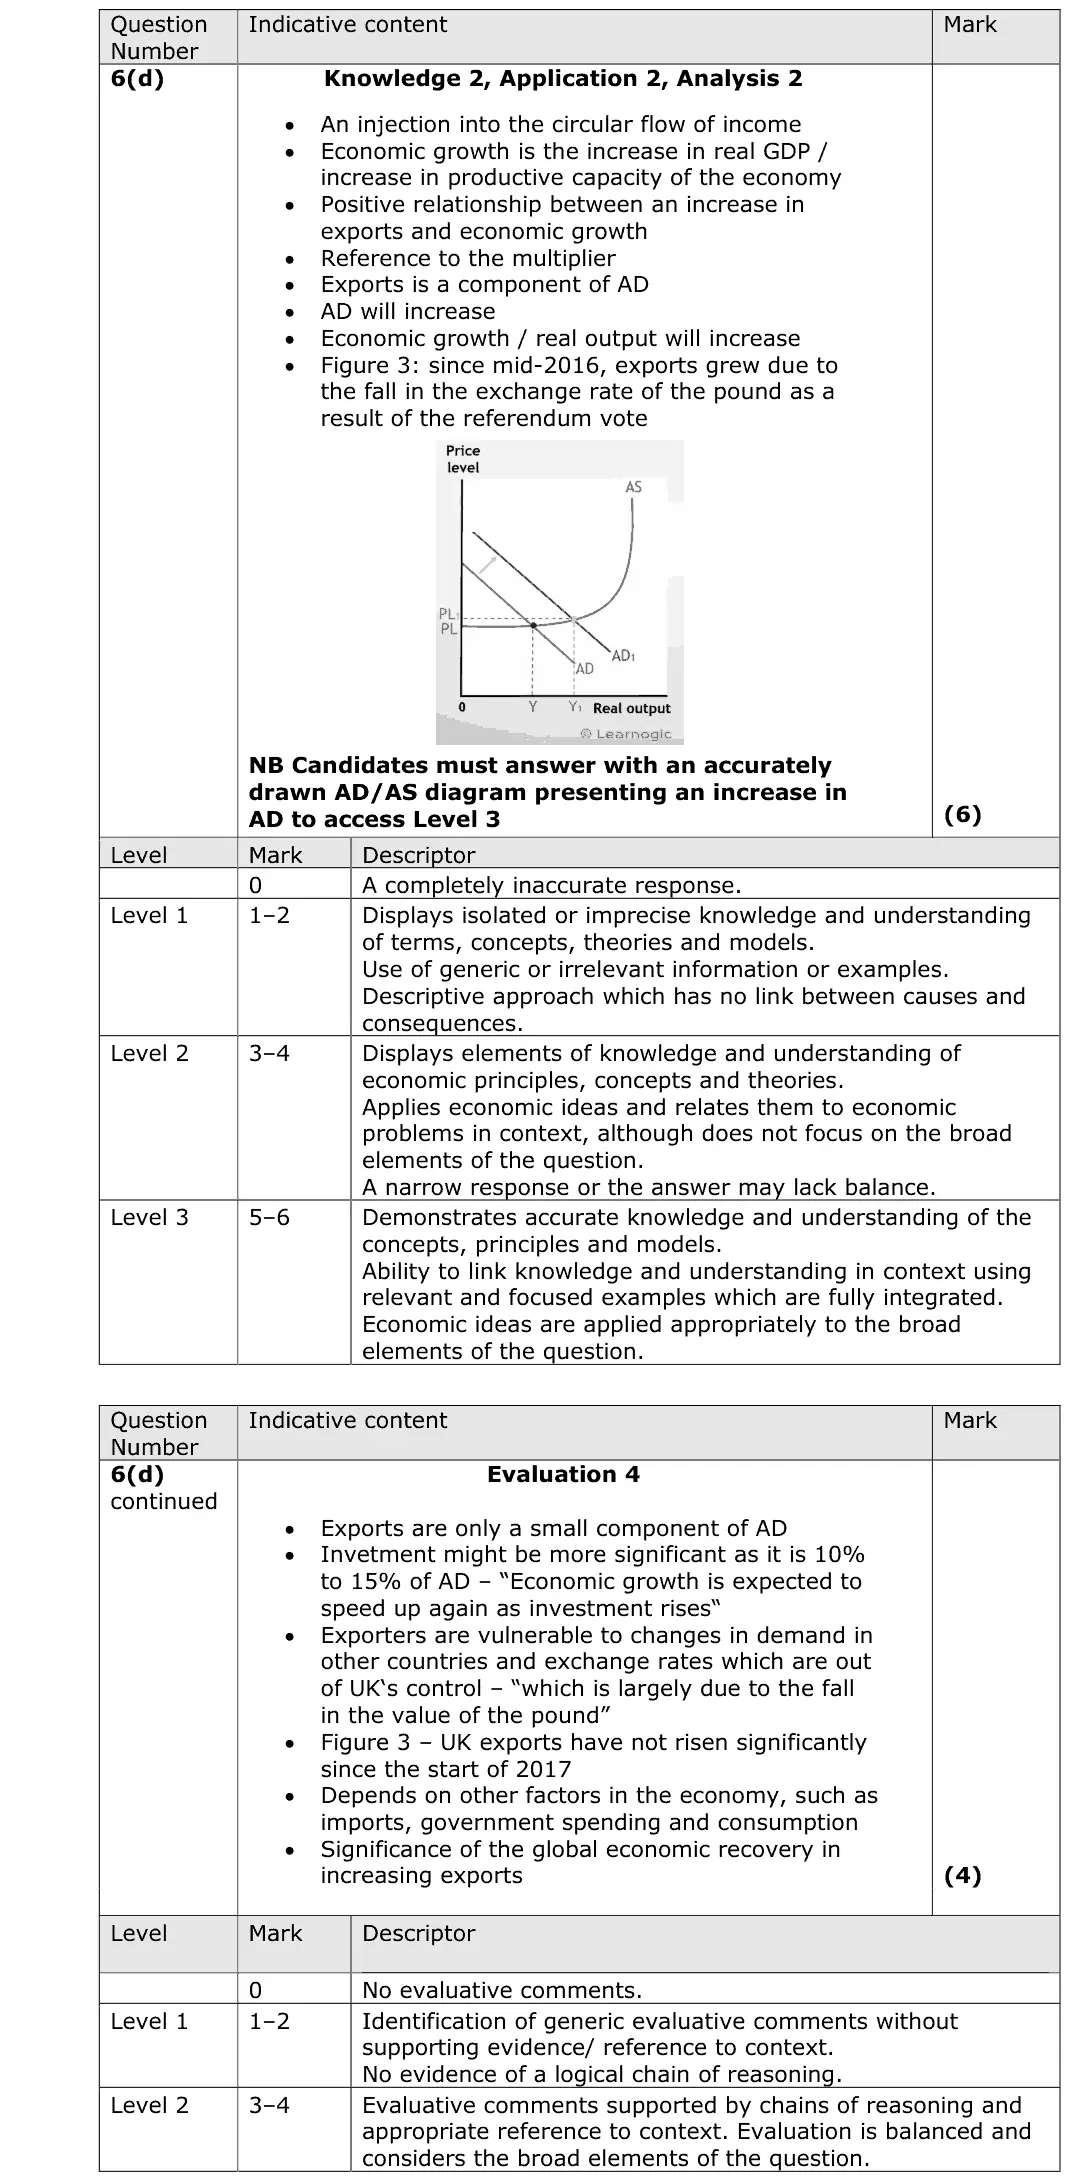
(d) With reference to Figure 3, assess the likely impact of the change in the value of exports, since mid-2016, on the economic growth of the UK. Use an aggregate demand and aggregate supply diagram in your answer. (10)
June 2019 · AS Paper 2 · Q6(e) 15 marks AO1=3, AO2=3, AO3=3, AO4=6 15-mark response measuring economic growth
Data and extracts for question 6UK inflation and economic growth Figure 1: UK inflation rate as measured by annual percentage changes in the Consumer Price Index (CPI), January 2014 to January 2018 3.5 3.0 % 2.5 2.0 1.5 1.0 0.5 0.0 -0.5 (Source: www.bankofengland.co.uk/publications/Pages/inflationreport/2017/aug.aspx) Figure 2: Selected changes to the CPI basket of goods and services, 2017 IN OUT Non-dairy milk Apple cider Jigsaw puzzles Menthol cigarettes Child scooters Child swings Cycling helmets Basic mobile phones (Source: www.theguardian.com/business/2017/mar/14/uk-inflation- ons-basket-goods-gin-cycling-helmets) Figure 3: UK exports, £ billions per month, January 2014 to January 2018 52 50 £ billions 48 46 44 42 40 0 (Source: Trading Economics, ONS - https://tradingeconomics.com/united-kingdom/exports) Figure 4: Annual percentage change in real Gross Domestic Product (GDP), 2014-2017 2014 2015 2016 2017 United Kingdom 3.1 2.2 1.8 2.0 Developing countries (average) 4.7 4.2 4.1 4.5 (Source: IMF, World Economic Outlook 2017) Extract A Rising inflation After January 2017, the inflation rate, as measured by the Consumer Price Index (CPI), in the UK has exceeded the Bank of England’s 2% target. Sharp increases in food prices as a result of the fall in the exchange rate of the pound have contributed to rising inflation. Between January and September 2017, food prices have increased by 3.5 percentage 5 points. The Office for National Statistics (ONS) has identified that the rapid increase in food prices affected people on low fixed incomes the most. It leaves them with very little money to spend on relatively more expensive items. Moreover, the Bank of England has observed a rise in the size of personal debt relative to income. In order to maintain their standard of 10 living, many consumers on low fixed incomes are using their credit cards and taking out short-term loans to fund their spending. Inflation rose to over 3% at the end of 2017 leading to the Monetary Policy Committee increasing the base rate of interest by 0.25 percentage points to 0.5% in November 2017. Wage growth has been lagging behind price rises and this is expected to continue. 15 Basic wage increases are expected to be only around 1%. This has heaped considerable pressure on households. The ONS has updated the shopping basket that is used in the measurement of UK inflation, to reflect the lifestyle of households in the country. Technological advancements, changes in consumer tastes and a move towards health, fitness and 20 gluten-free products have made it essential to revise the 2017 basket. (Source: adapted from ‘UK inflation tipped to rise again with wages forecast to stagnate’, The Guardian, https://www.theguardian.com/business/2017/aug/13/ uk-inflation-tipped-to-rise-again-with-wages-forecast-to-stagnate#img-1) Extract B Economic growth and living standards Economic growth is expected to accelerate again as foreign demand for UK exports increases due to the global economic recovery. According to some economists, consumer spending is no longer the engine of growth for the UK. The increase in exports, which is largely due to the fall in the exchange rate of the pound, is expected to be the most 5 significant driver of the UK’s economic growth. Some economists have proposed that the quality of economic growth needs to be measured and not just the quantity. This will allow governments to understand how GDP growth affects the living standards of its citizens. They want governments to publish data on the quality of life alongside GDP data as economic growth varies across the country 10 with jobs and wages distributed unevenly. Economic growth figures also hide differences that are not considered in GDP calculations. In 2017, it was estimated that the relative size of the informal economy of developing countries was nearly five times greater than that of the UK. (Source: adapted from ‘Growth to accelerate as UK economy bounces back’, The Telegraph, http://www.telegraph.co.uk /business/2017/08/01/ growth-accelerate-uk-economy-bounces-back/; ‘GDP is not enough: economists and businesses demand new measure of inclusive growth’, The Telegraph, http://www.telegraph.co.uk/business/2017/03/07/gdp-not- enough-economists-businesses-demand-new-measure-inclusive/)
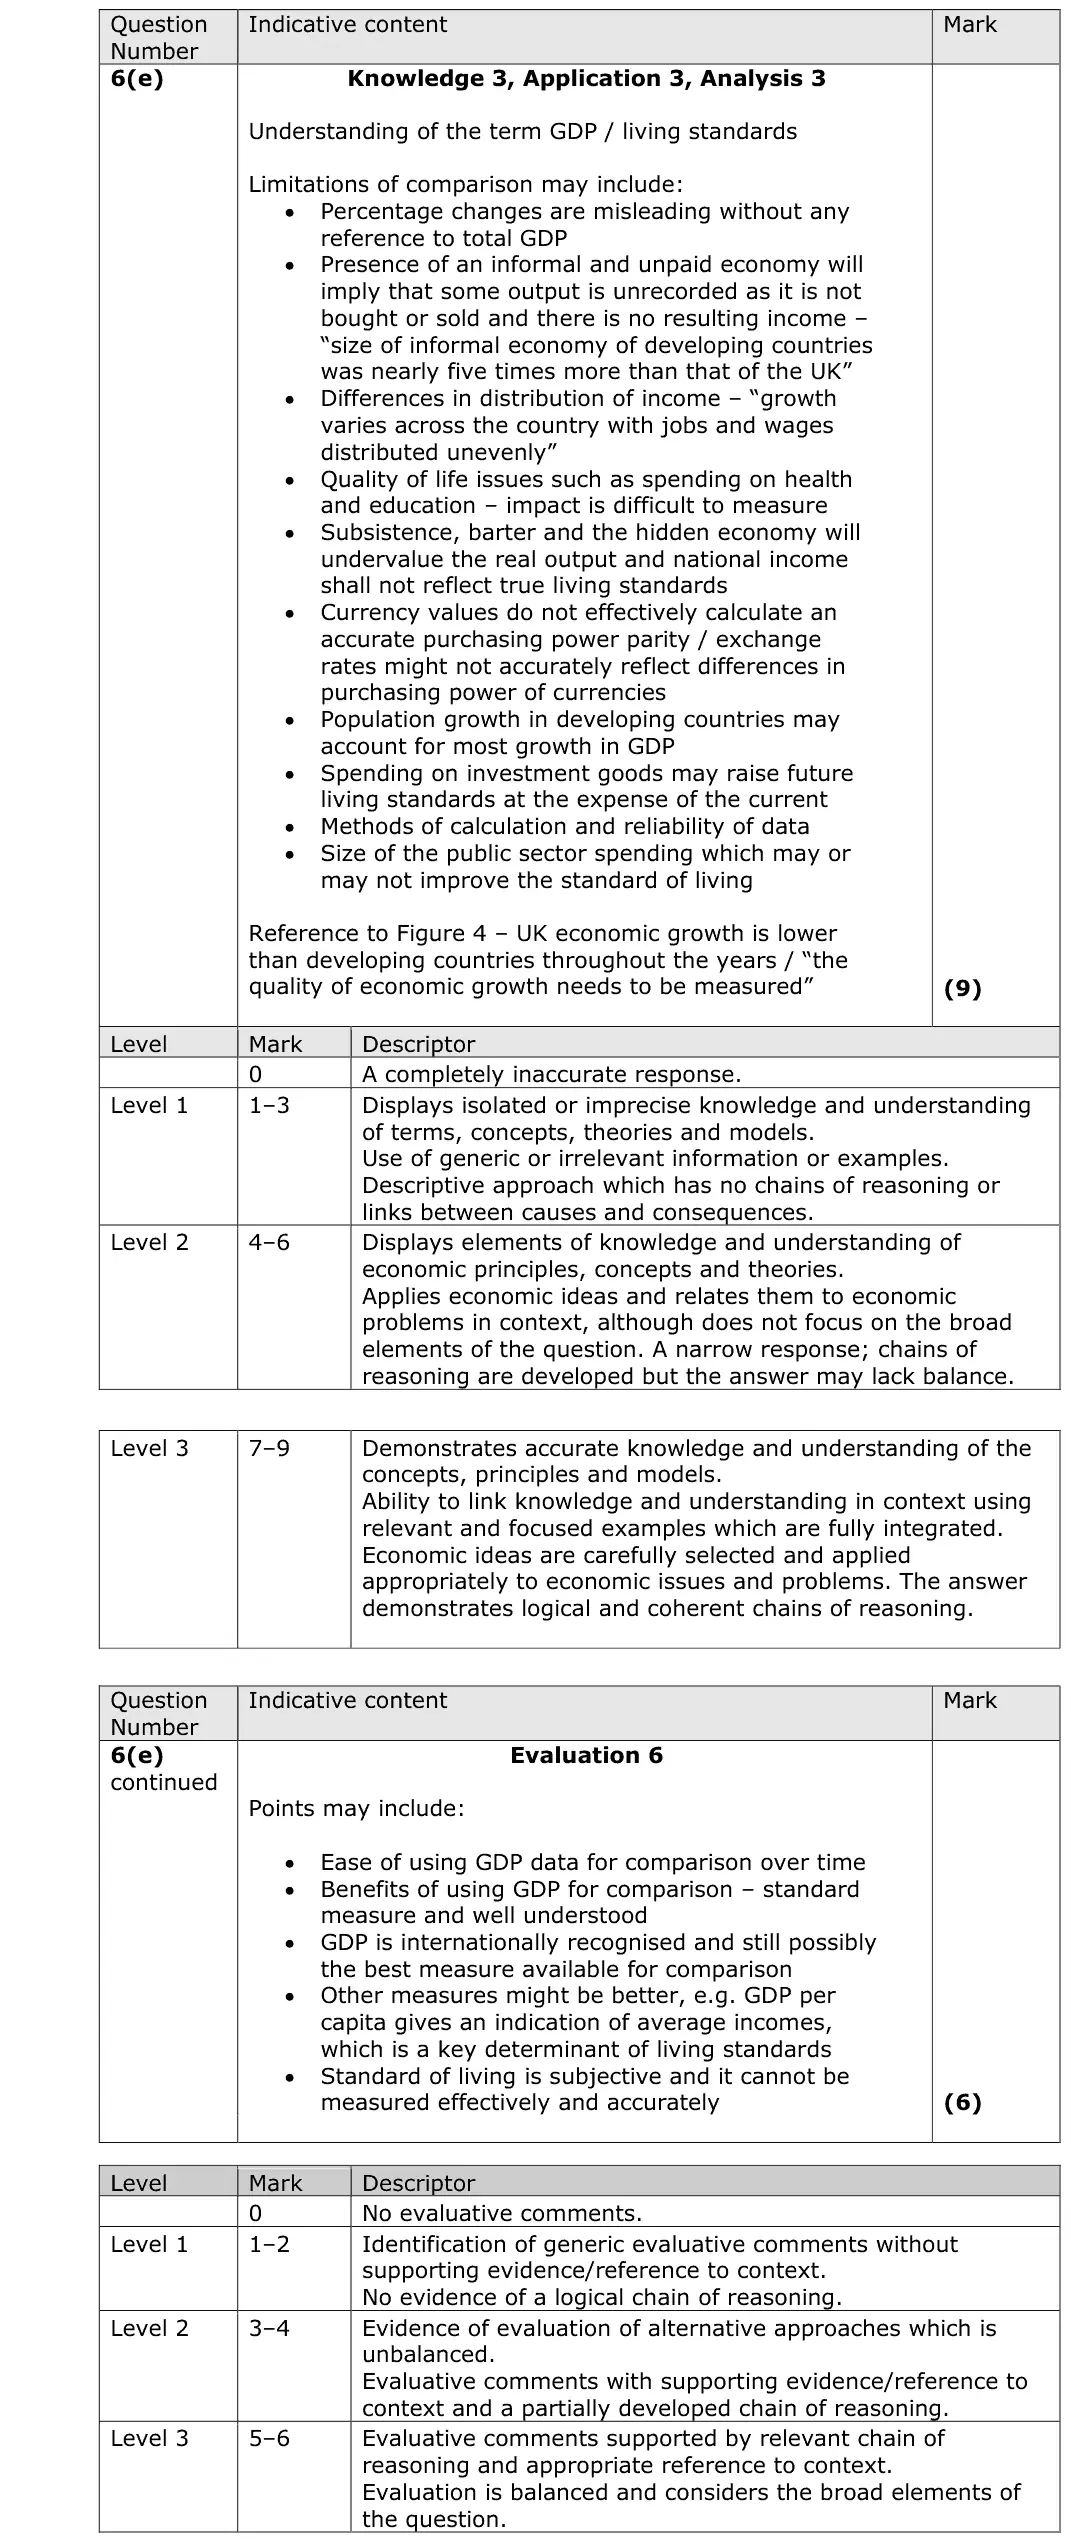
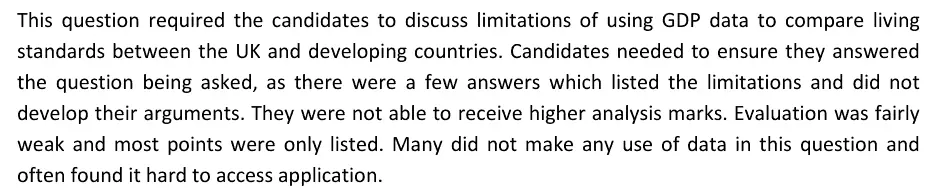
(e) With reference to Figure 4, Extract B and your own knowledge, discuss the limitations of using GDP data to compare living standards between the UK and developing countries. (15)
June 2019 · AS Paper 2 · Q6(f) 20 marks AO1=4, AO2=4, AO3=6, AO4=6 20-mark essay Either/or fiscal and monetary policyinflation
Data and extracts for question 6UK inflation and economic growth Figure 1: UK inflation rate as measured by annual percentage changes in the Consumer Price Index (CPI), January 2014 to January 2018 3.5 3.0 % 2.5 2.0 1.5 1.0 0.5 0.0 -0.5 (Source: www.bankofengland.co.uk/publications/Pages/inflationreport/2017/aug.aspx) Figure 2: Selected changes to the CPI basket of goods and services, 2017 IN OUT Non-dairy milk Apple cider Jigsaw puzzles Menthol cigarettes Child scooters Child swings Cycling helmets Basic mobile phones (Source: www.theguardian.com/business/2017/mar/14/uk-inflation- ons-basket-goods-gin-cycling-helmets) Figure 3: UK exports, £ billions per month, January 2014 to January 2018 52 50 £ billions 48 46 44 42 40 0 (Source: Trading Economics, ONS - https://tradingeconomics.com/united-kingdom/exports) Figure 4: Annual percentage change in real Gross Domestic Product (GDP), 2014-2017 2014 2015 2016 2017 United Kingdom 3.1 2.2 1.8 2.0 Developing countries (average) 4.7 4.2 4.1 4.5 (Source: IMF, World Economic Outlook 2017) Extract A Rising inflation After January 2017, the inflation rate, as measured by the Consumer Price Index (CPI), in the UK has exceeded the Bank of England’s 2% target. Sharp increases in food prices as a result of the fall in the exchange rate of the pound have contributed to rising inflation. Between January and September 2017, food prices have increased by 3.5 percentage 5 points. The Office for National Statistics (ONS) has identified that the rapid increase in food prices affected people on low fixed incomes the most. It leaves them with very little money to spend on relatively more expensive items. Moreover, the Bank of England has observed a rise in the size of personal debt relative to income. In order to maintain their standard of 10 living, many consumers on low fixed incomes are using their credit cards and taking out short-term loans to fund their spending. Inflation rose to over 3% at the end of 2017 leading to the Monetary Policy Committee increasing the base rate of interest by 0.25 percentage points to 0.5% in November 2017. Wage growth has been lagging behind price rises and this is expected to continue. 15 Basic wage increases are expected to be only around 1%. This has heaped considerable pressure on households. The ONS has updated the shopping basket that is used in the measurement of UK inflation, to reflect the lifestyle of households in the country. Technological advancements, changes in consumer tastes and a move towards health, fitness and 20 gluten-free products have made it essential to revise the 2017 basket. (Source: adapted from ‘UK inflation tipped to rise again with wages forecast to stagnate’, The Guardian, https://www.theguardian.com/business/2017/aug/13/ uk-inflation-tipped-to-rise-again-with-wages-forecast-to-stagnate#img-1) Extract B Economic growth and living standards Economic growth is expected to accelerate again as foreign demand for UK exports increases due to the global economic recovery. According to some economists, consumer spending is no longer the engine of growth for the UK. The increase in exports, which is largely due to the fall in the exchange rate of the pound, is expected to be the most 5 significant driver of the UK’s economic growth. Some economists have proposed that the quality of economic growth needs to be measured and not just the quantity. This will allow governments to understand how GDP growth affects the living standards of its citizens. They want governments to publish data on the quality of life alongside GDP data as economic growth varies across the country 10 with jobs and wages distributed unevenly. Economic growth figures also hide differences that are not considered in GDP calculations. In 2017, it was estimated that the relative size of the informal economy of developing countries was nearly five times greater than that of the UK. (Source: adapted from ‘Growth to accelerate as UK economy bounces back’, The Telegraph, http://www.telegraph.co.uk /business/2017/08/01/ growth-accelerate-uk-economy-bounces-back/; ‘GDP is not enough: economists and businesses demand new measure of inclusive growth’, The Telegraph, http://www.telegraph.co.uk/business/2017/03/07/gdp-not- enough-economists-businesses-demand-new-measure-inclusive/)
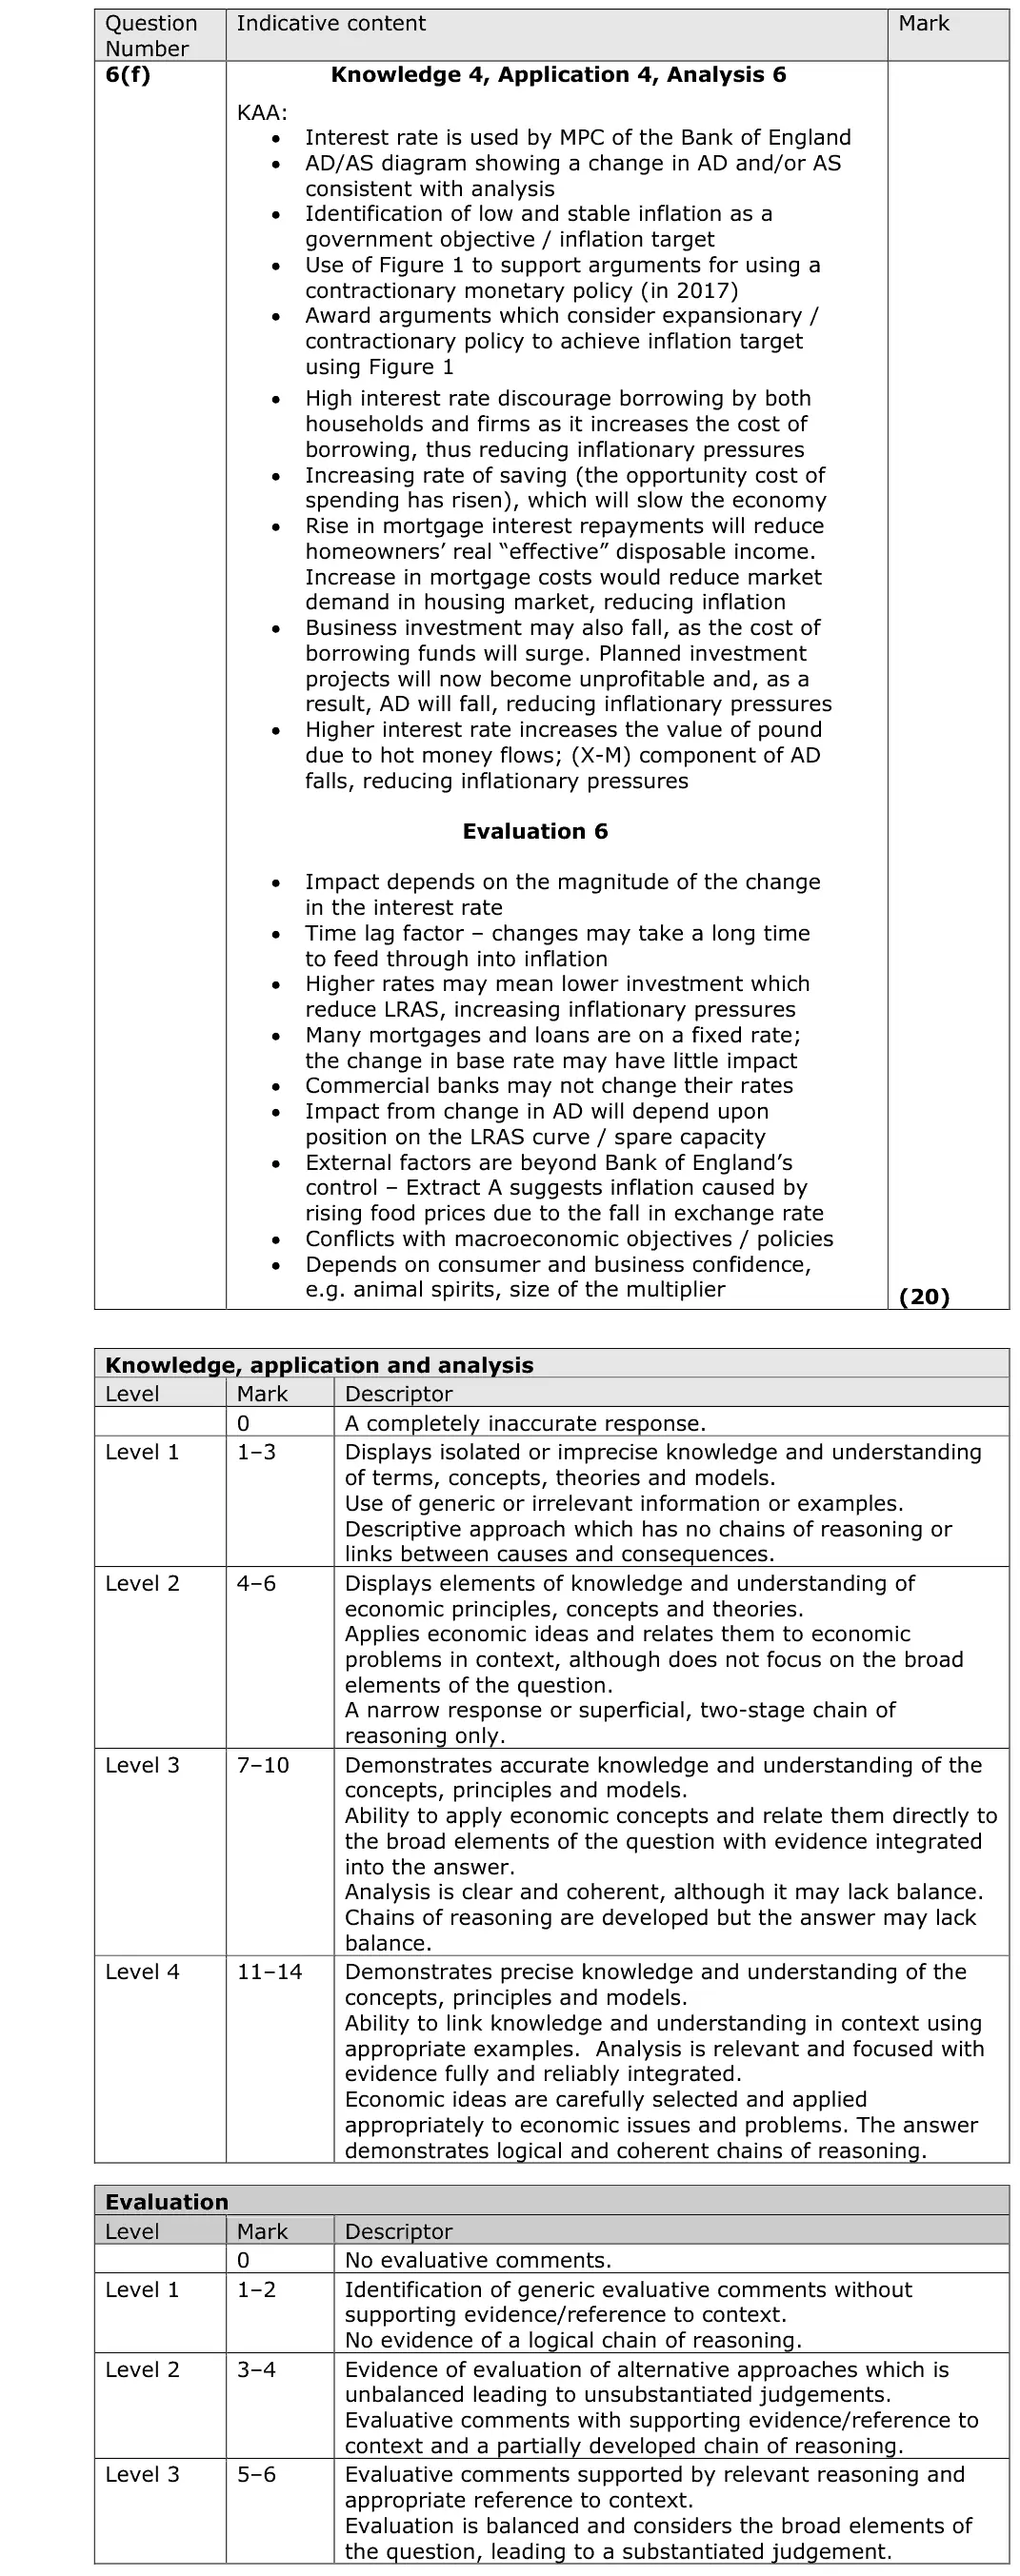
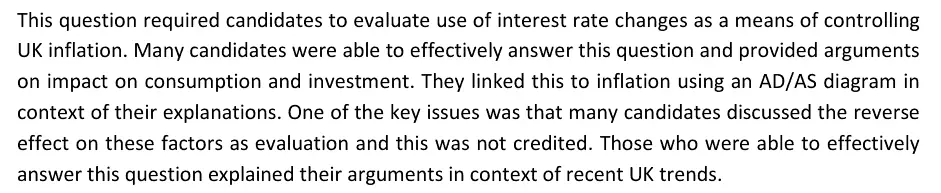
(f) Evaluate the use of interest rate changes as a means of controlling UK inflation. (20)
June 2019 · AS Paper 2 · Q6(g) 20 marks AO1=4, AO2=4, AO3=6, AO4=6 20-mark essay Either/or Hard macroeconomic objectives
Data and extracts for question 6UK inflation and economic growth Figure 1: UK inflation rate as measured by annual percentage changes in the Consumer Price Index (CPI), January 2014 to January 2018 3.5 3.0 % 2.5 2.0 1.5 1.0 0.5 0.0 -0.5 (Source: www.bankofengland.co.uk/publications/Pages/inflationreport/2017/aug.aspx) Figure 2: Selected changes to the CPI basket of goods and services, 2017 IN OUT Non-dairy milk Apple cider Jigsaw puzzles Menthol cigarettes Child scooters Child swings Cycling helmets Basic mobile phones (Source: www.theguardian.com/business/2017/mar/14/uk-inflation- ons-basket-goods-gin-cycling-helmets) Figure 3: UK exports, £ billions per month, January 2014 to January 2018 52 50 £ billions 48 46 44 42 40 0 (Source: Trading Economics, ONS - https://tradingeconomics.com/united-kingdom/exports) Figure 4: Annual percentage change in real Gross Domestic Product (GDP), 2014-2017 2014 2015 2016 2017 United Kingdom 3.1 2.2 1.8 2.0 Developing countries (average) 4.7 4.2 4.1 4.5 (Source: IMF, World Economic Outlook 2017) Extract A Rising inflation After January 2017, the inflation rate, as measured by the Consumer Price Index (CPI), in the UK has exceeded the Bank of England’s 2% target. Sharp increases in food prices as a result of the fall in the exchange rate of the pound have contributed to rising inflation. Between January and September 2017, food prices have increased by 3.5 percentage 5 points. The Office for National Statistics (ONS) has identified that the rapid increase in food prices affected people on low fixed incomes the most. It leaves them with very little money to spend on relatively more expensive items. Moreover, the Bank of England has observed a rise in the size of personal debt relative to income. In order to maintain their standard of 10 living, many consumers on low fixed incomes are using their credit cards and taking out short-term loans to fund their spending. Inflation rose to over 3% at the end of 2017 leading to the Monetary Policy Committee increasing the base rate of interest by 0.25 percentage points to 0.5% in November 2017. Wage growth has been lagging behind price rises and this is expected to continue. 15 Basic wage increases are expected to be only around 1%. This has heaped considerable pressure on households. The ONS has updated the shopping basket that is used in the measurement of UK inflation, to reflect the lifestyle of households in the country. Technological advancements, changes in consumer tastes and a move towards health, fitness and 20 gluten-free products have made it essential to revise the 2017 basket. (Source: adapted from ‘UK inflation tipped to rise again with wages forecast to stagnate’, The Guardian, https://www.theguardian.com/business/2017/aug/13/ uk-inflation-tipped-to-rise-again-with-wages-forecast-to-stagnate#img-1) Extract B Economic growth and living standards Economic growth is expected to accelerate again as foreign demand for UK exports increases due to the global economic recovery. According to some economists, consumer spending is no longer the engine of growth for the UK. The increase in exports, which is largely due to the fall in the exchange rate of the pound, is expected to be the most 5 significant driver of the UK’s economic growth. Some economists have proposed that the quality of economic growth needs to be measured and not just the quantity. This will allow governments to understand how GDP growth affects the living standards of its citizens. They want governments to publish data on the quality of life alongside GDP data as economic growth varies across the country 10 with jobs and wages distributed unevenly. Economic growth figures also hide differences that are not considered in GDP calculations. In 2017, it was estimated that the relative size of the informal economy of developing countries was nearly five times greater than that of the UK. (Source: adapted from ‘Growth to accelerate as UK economy bounces back’, The Telegraph, http://www.telegraph.co.uk /business/2017/08/01/ growth-accelerate-uk-economy-bounces-back/; ‘GDP is not enough: economists and businesses demand new measure of inclusive growth’, The Telegraph, http://www.telegraph.co.uk/business/2017/03/07/gdp-not- enough-economists-businesses-demand-new-measure-inclusive/)
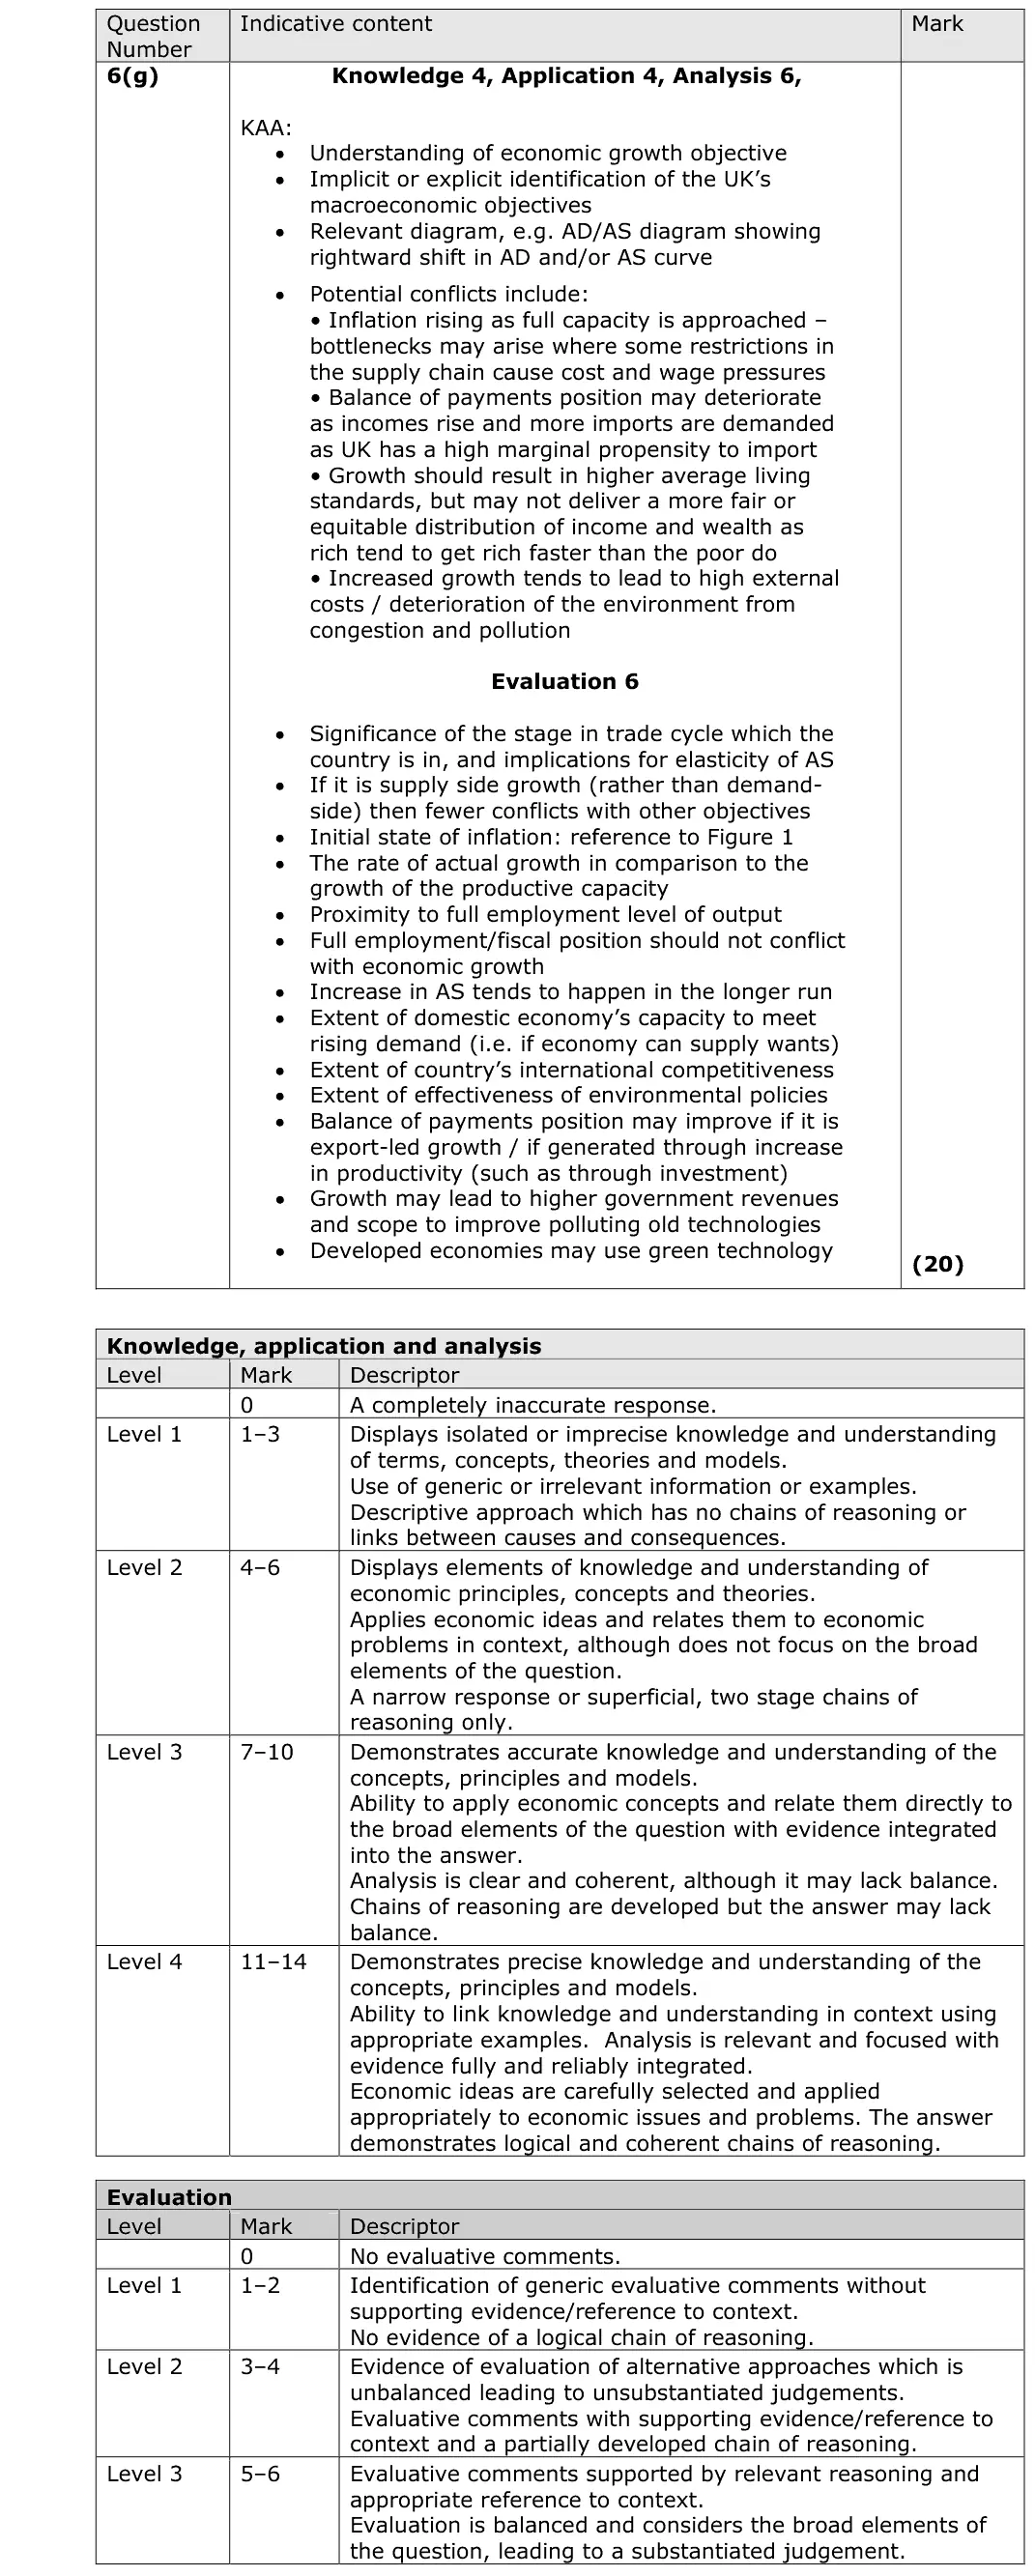
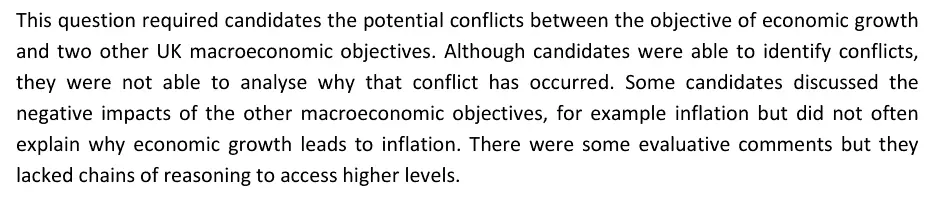
(g) Evaluate the potential conflicts between the objective of economic growth and two other UK macroeconomic objectives. (20)

Work with an Edexcel economics tutor

Want a paper marked and gone through with you? Message us.

Prefer email? Send an enquiry

If you are under 18, please include a parent's contact details. Enquiries go to enquiries@economicsaleveltutor.com and are deleted once handled. All tutoring is online.