June 2018: AS Paper 2

80 marks · 21 question parts · Paper, mark scheme and report on Pearson's site

Question by question

QTopicMarksAOType
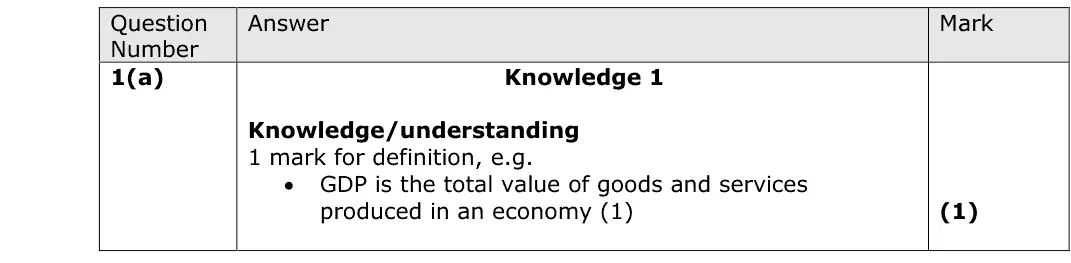
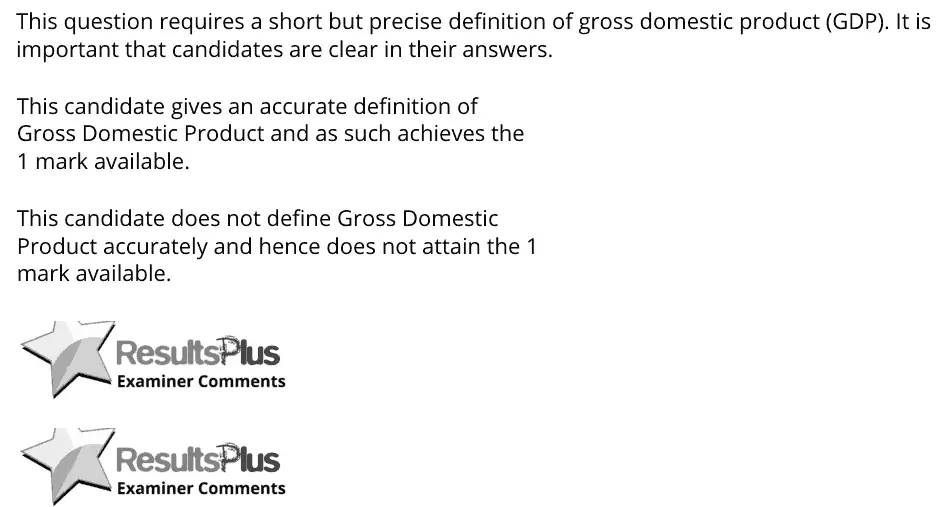
1(a) Measuring economic growth: GDP, GNI and living standards 1AO1=1Definition

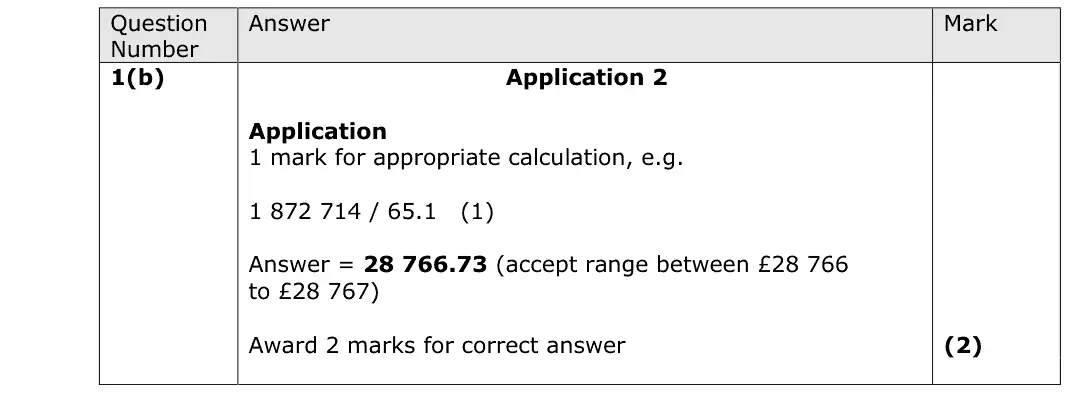
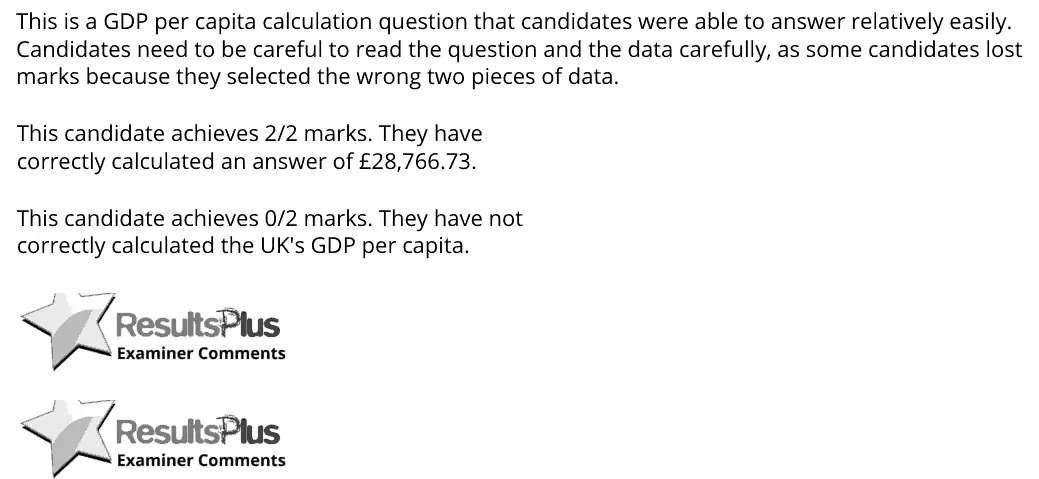
1(b) Measuring economic growth: GDP, GNI and living standards 2AO2=2Calculation
1(c) Measuring economic growth: GDP, GNI and living standards 1Multiple choice
2(a) Economic growth, output gaps and the trade cycle 1AO1=1Definition
2(b) Economic growth, output gaps and the trade cycle 2AO1=2Short answer
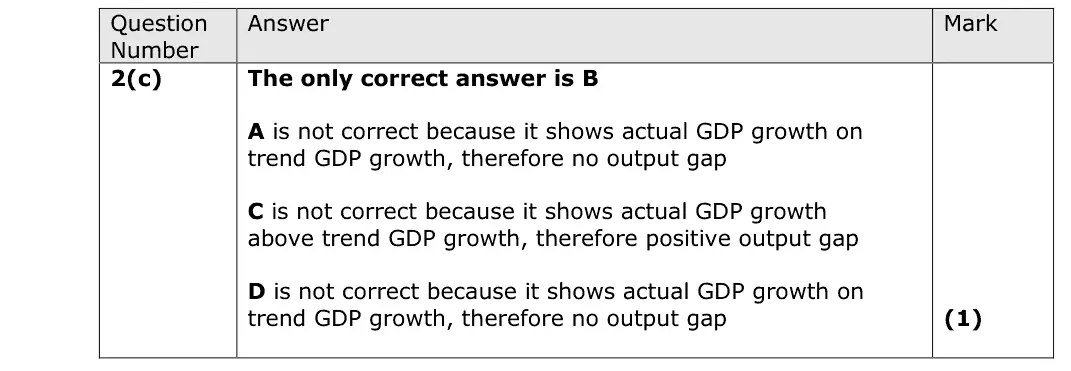
2(c) Economic growth, output gaps and the trade cycle 1Multiple choice
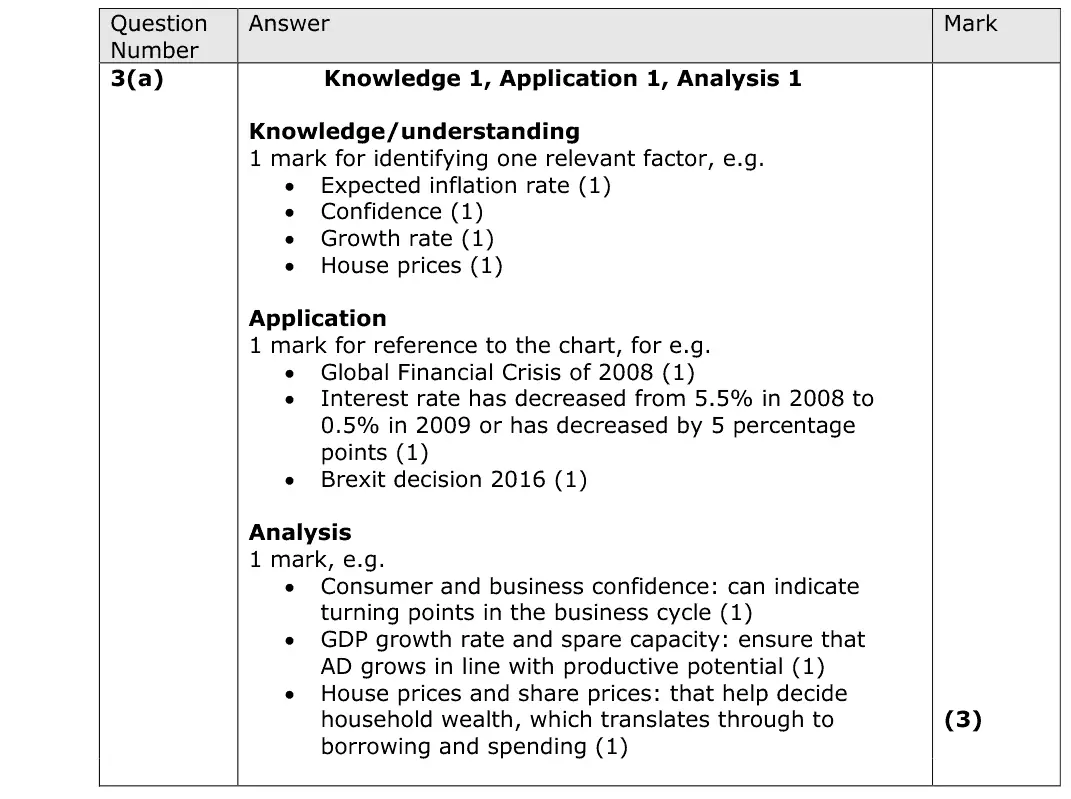
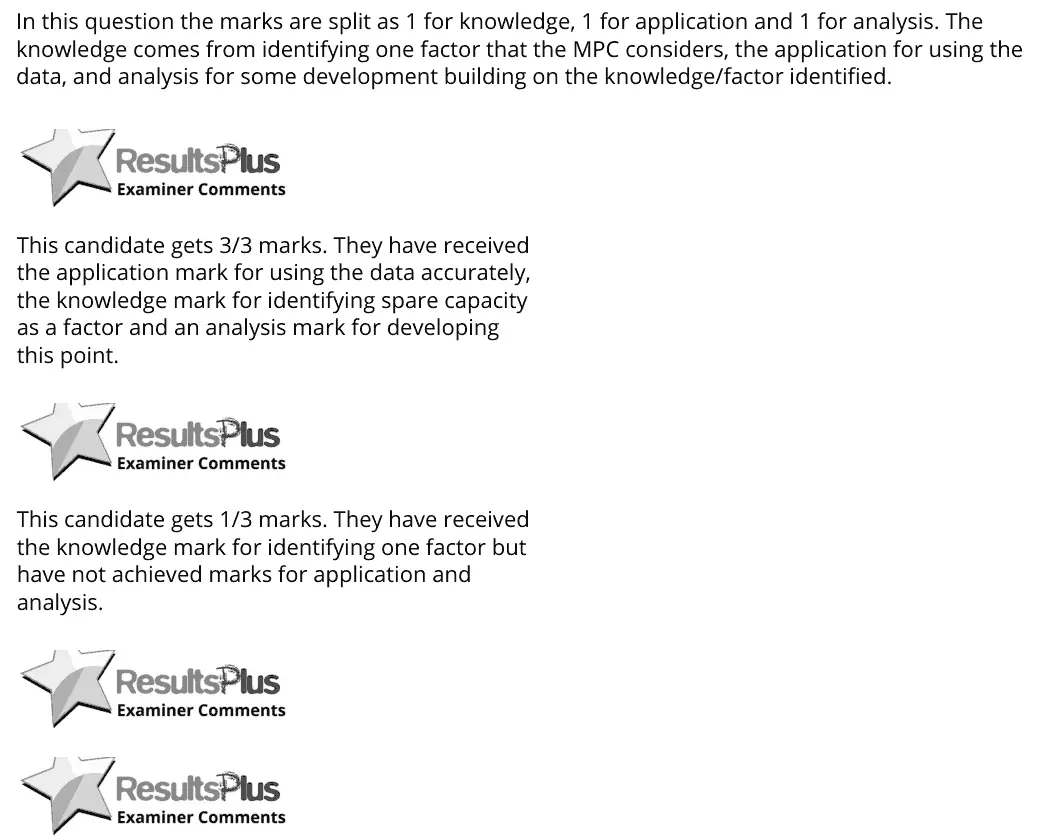
3(a) Demand-side policies: fiscal and monetary policy 3AO1=1,AO2=1,AO3=1Short answer
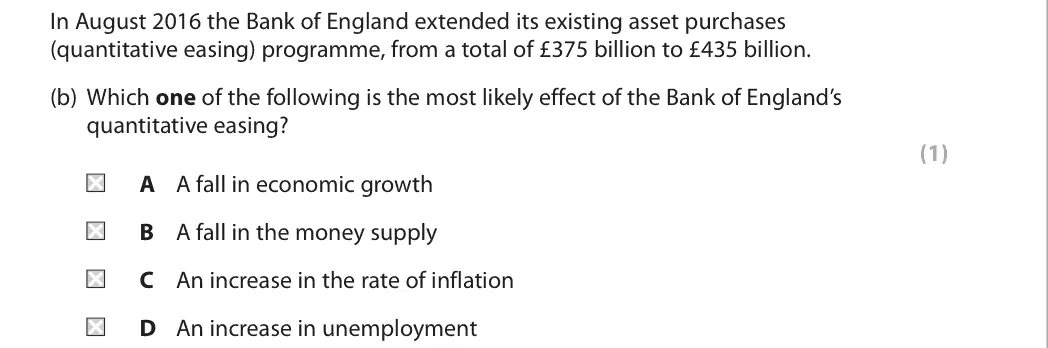
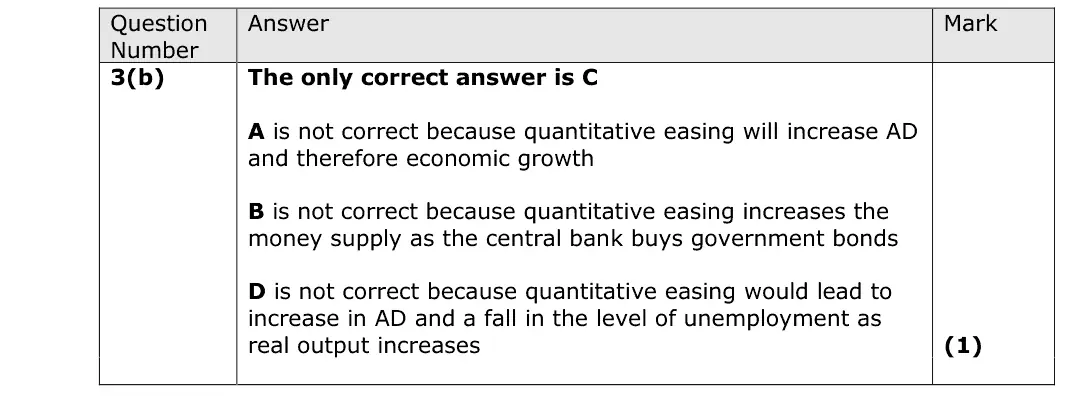
3(b) Demand-side policies: fiscal and monetary policy 1Multiple choice
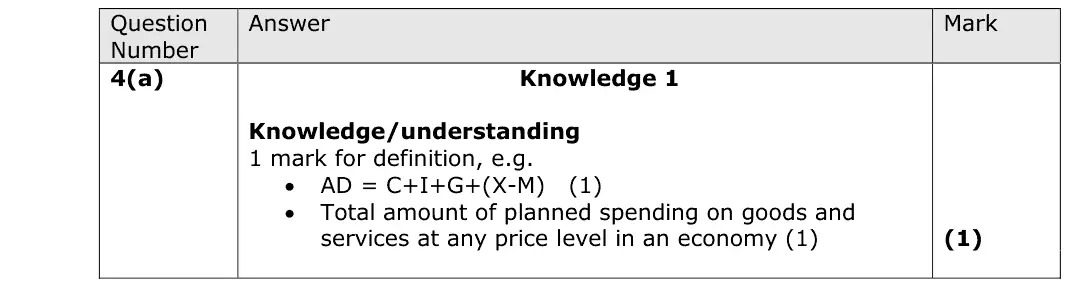
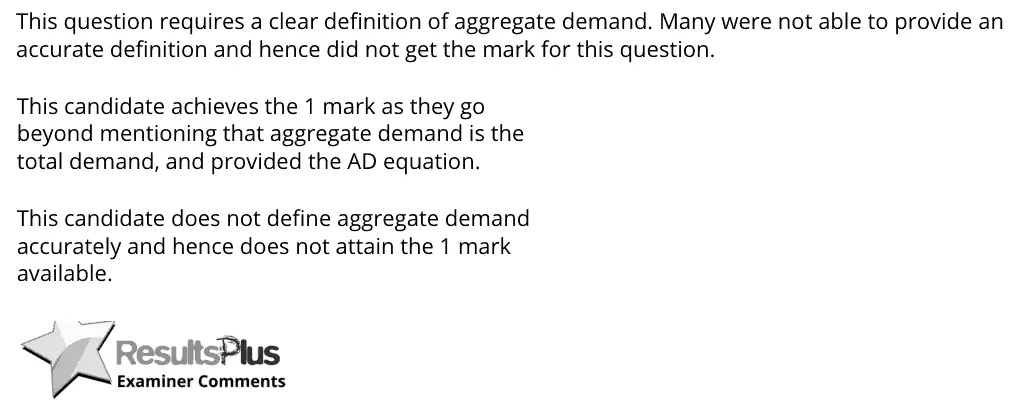
4(a) Aggregate demand 1AO1=1Definition
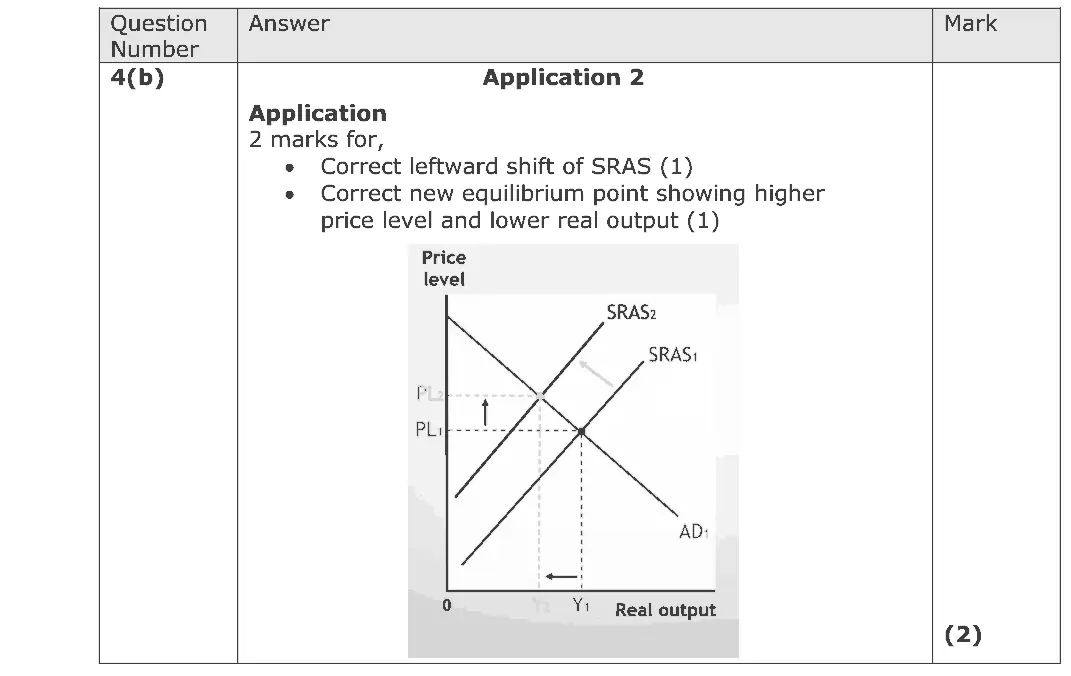
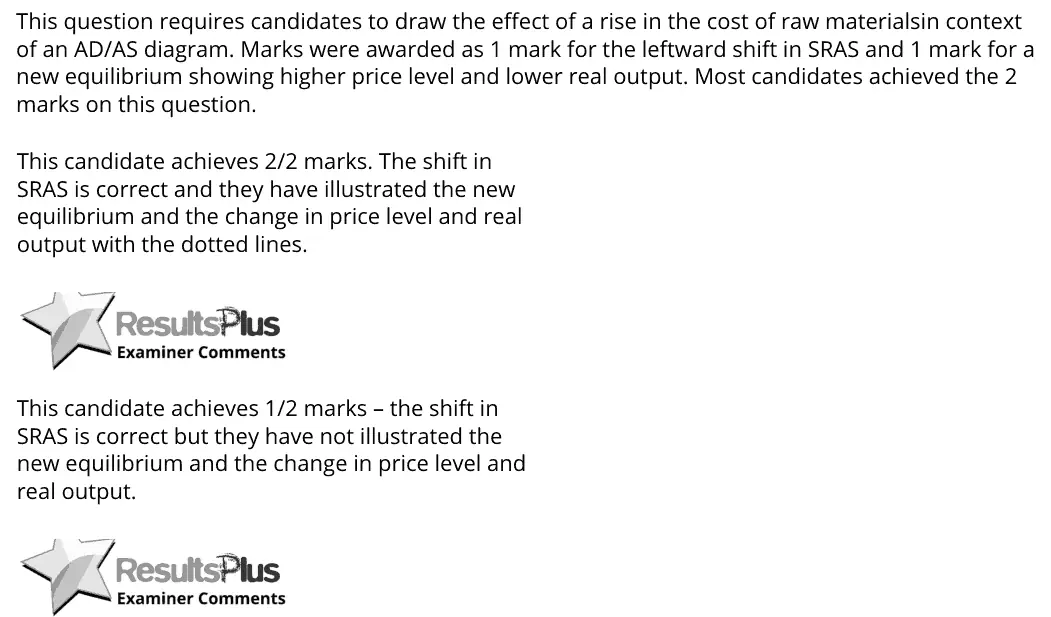
4(b) Aggregate supply, The circular flow, national income and the multiplier 2AO2=2Diagram
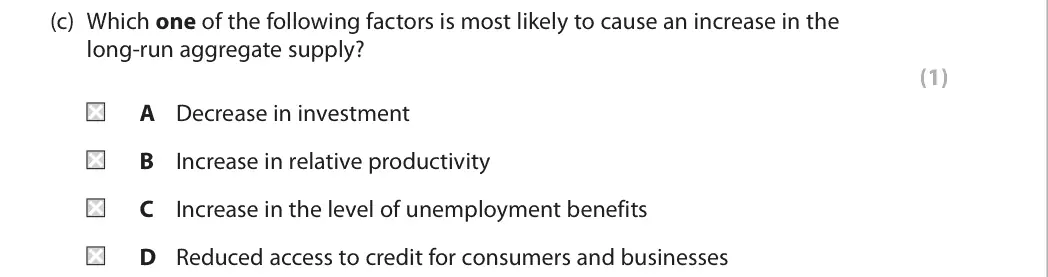
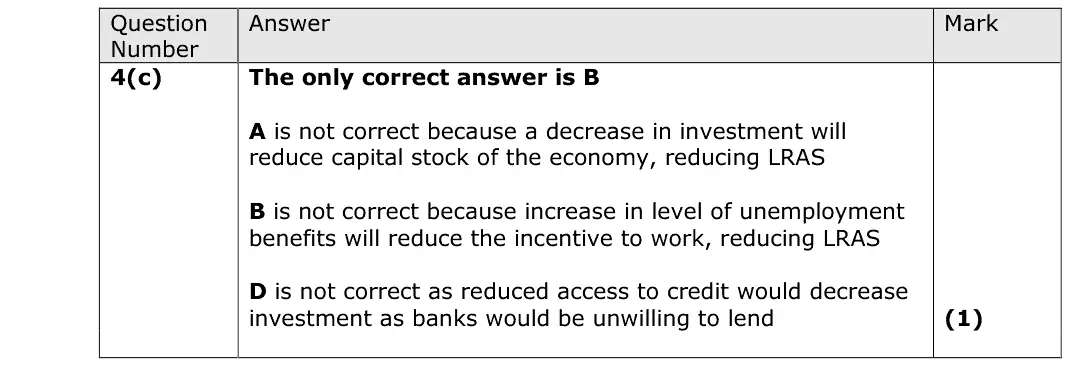
4(c) Aggregate supply 1Multiple choice
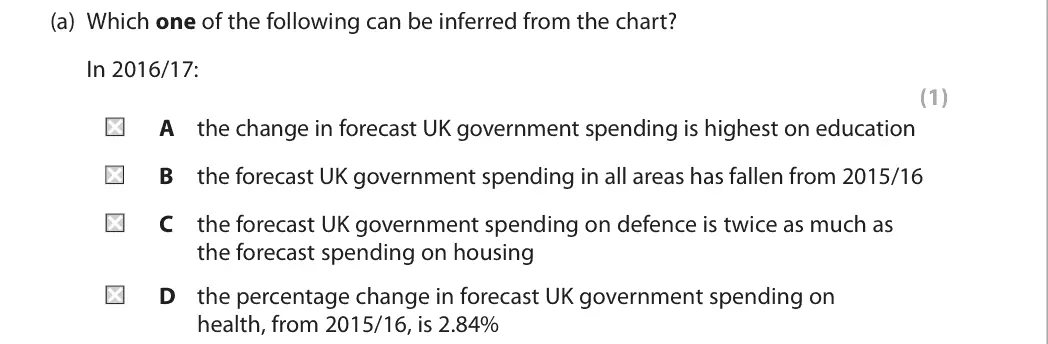
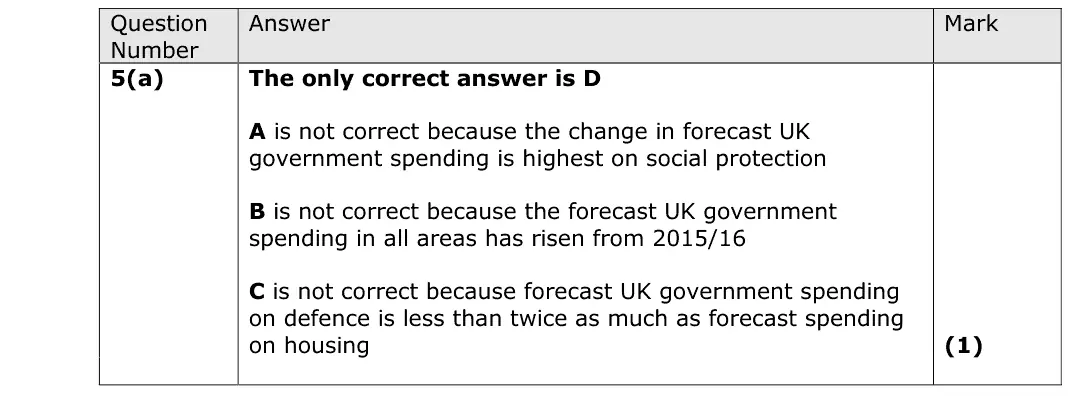
5(a) Aggregate demand 1Multiple choice
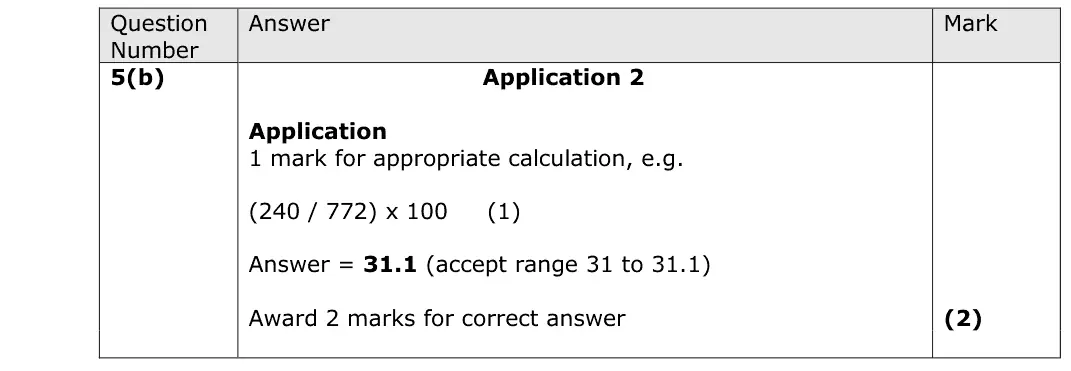
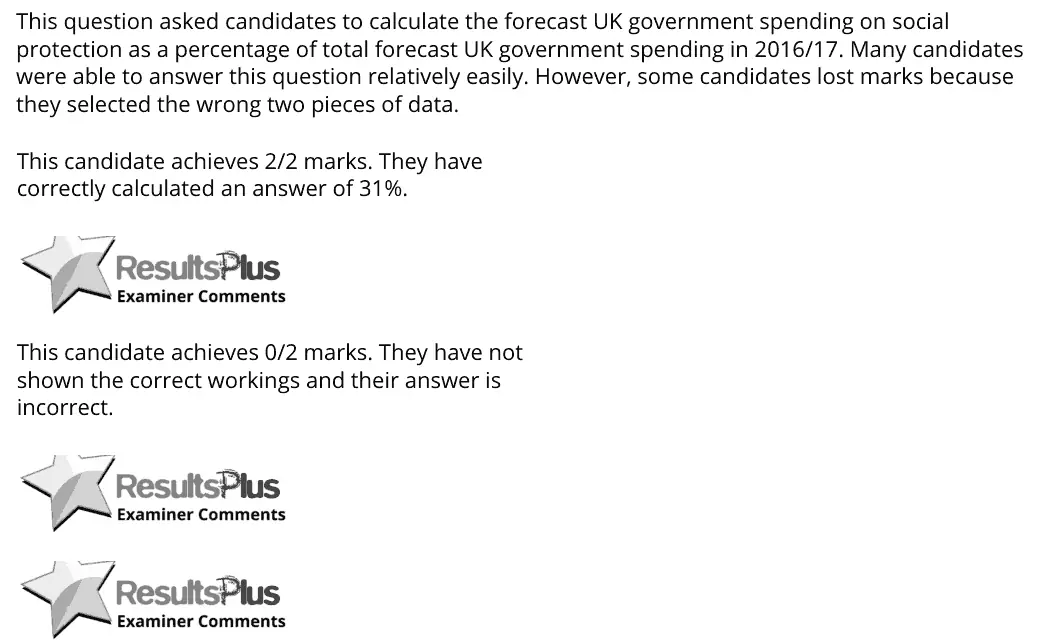
5(b) Aggregate demand 2AO2=2Calculation
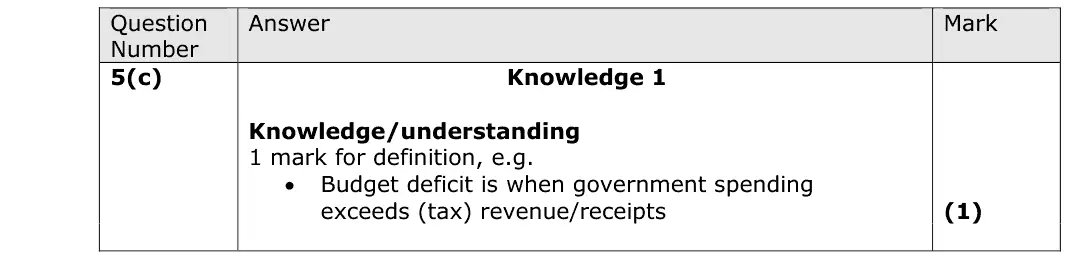
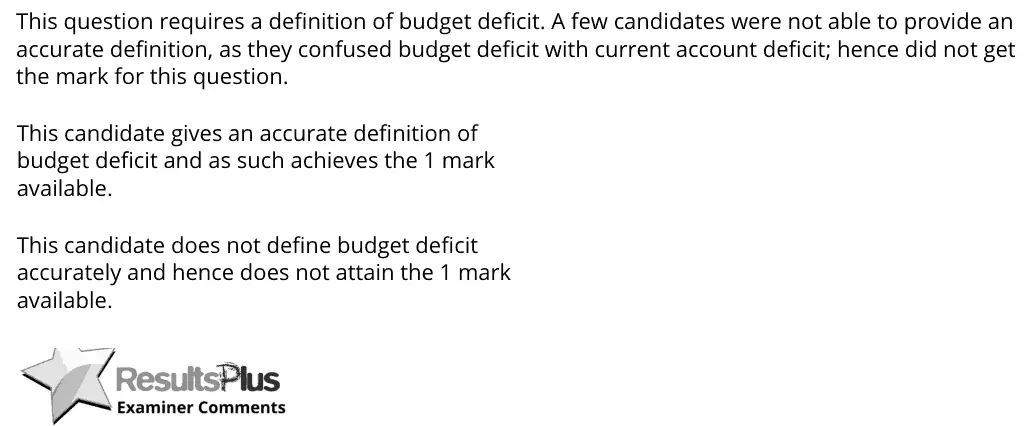
5(c) Demand-side policies: fiscal and monetary policy 1AO1=1Definition
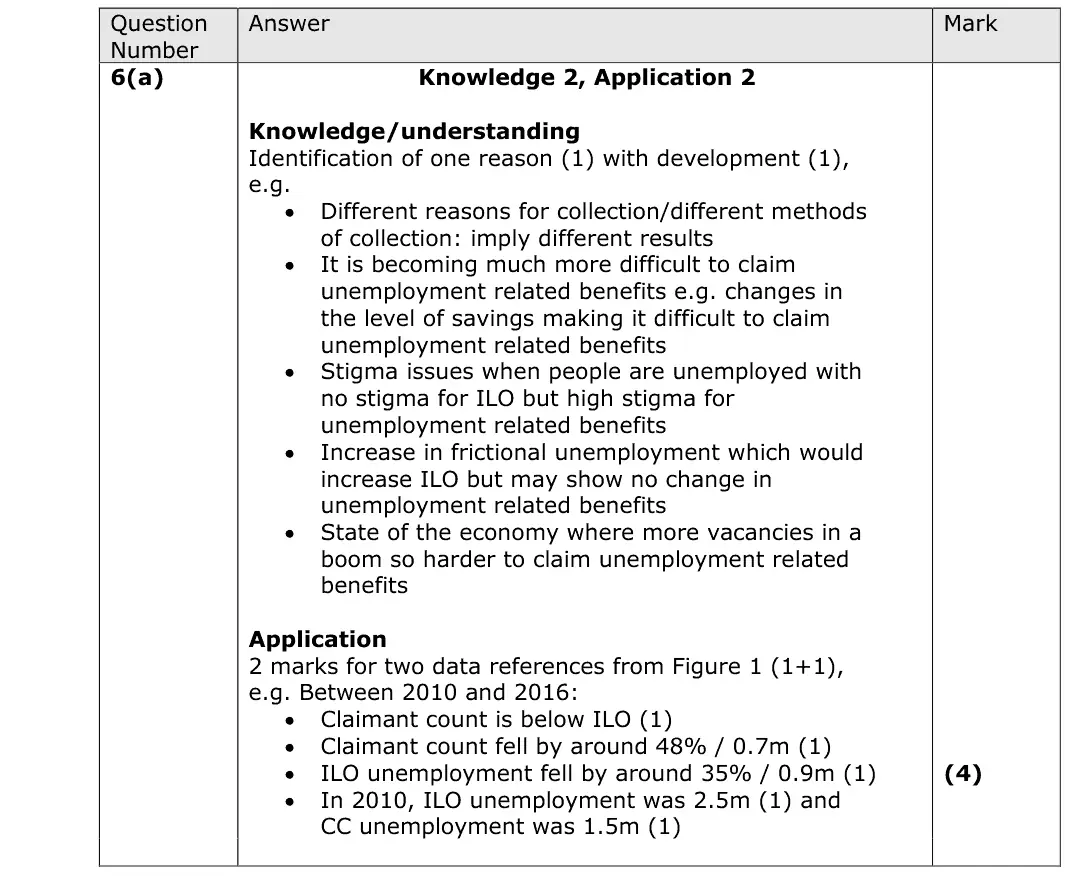
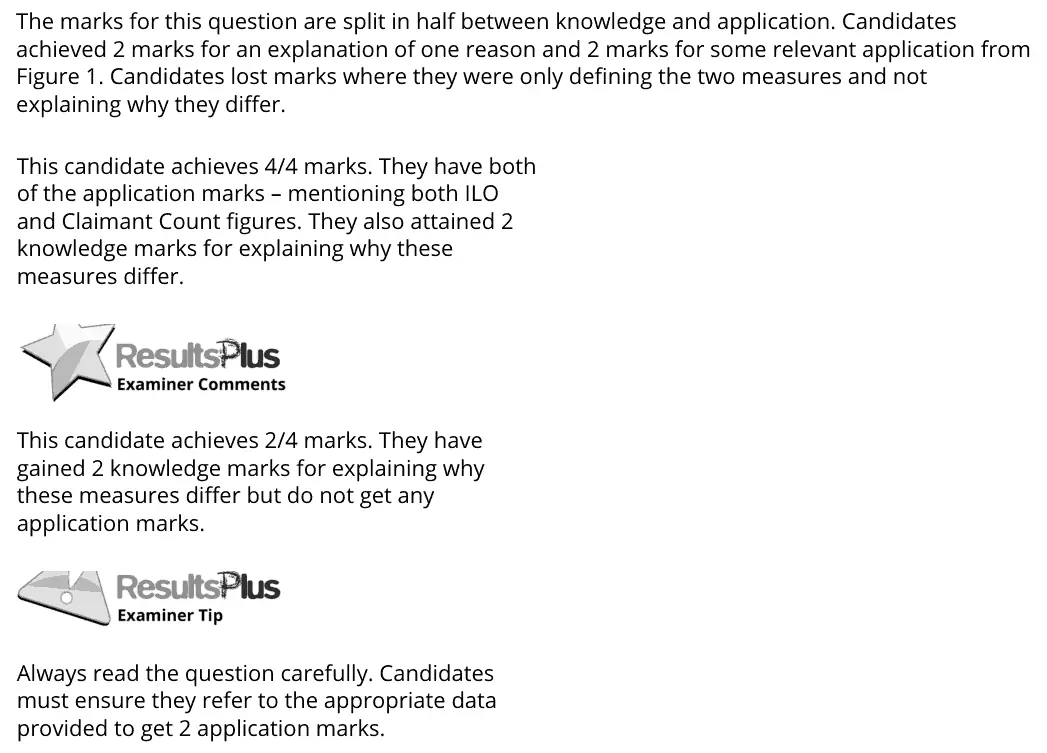
6(a) Employment and unemployment 4AO1=2,AO2=2Short answer
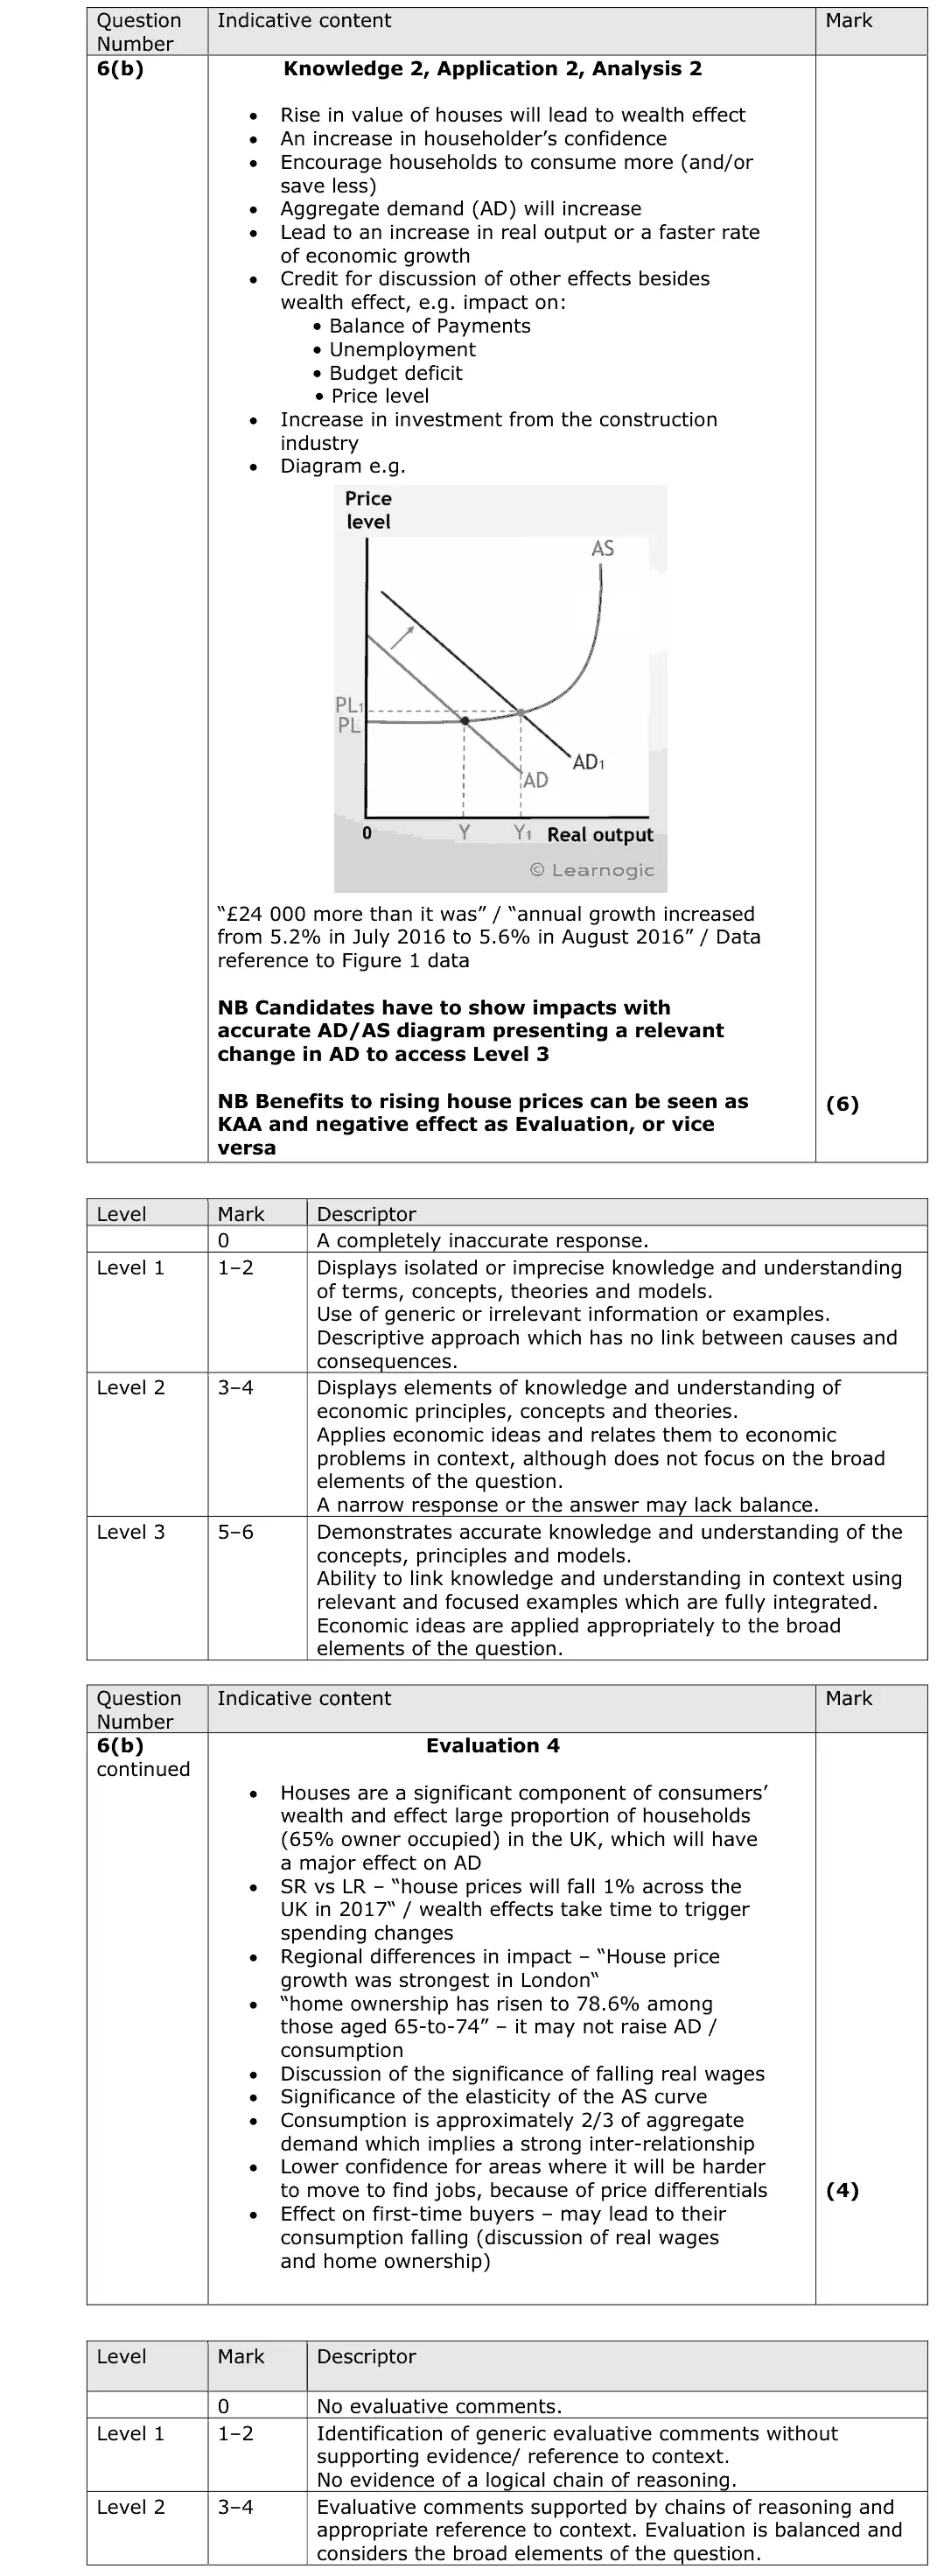
6(b) Aggregate demand, The circular flow, national income and the multiplier 10AO1=2,AO2=2,AO3=2,AO4=4Extended response
6(c) Aggregate demand 5AO1=1,AO2=2,AO3=2Short answer
6(d) The circular flow, national income and the multiplier 6AO1=2,AO2=2,AO3=2Short answer
6(e) Employment and unemployment 15AO1=3,AO2=3,AO3=3,AO4=6Extended response
6(f) Supply-side policies, Demand-side policies: fiscal and monetary policy 20AO1=4,AO2=4,AO3=6,AO4=6Essay
6(g) Inflation, Macroeconomic objectives, conflicts and trade-offs 20AO1=4,AO2=4,AO3=6,AO4=6Essay

The questions

1(a)1(b)1(c)2(a)2(b)2(c)3(a)3(b)4(a)4(b)4(c)5(a)5(b)5(c)6(a)6(b)6(c)6(d)6(e)6(f)6(g)
June 2018 · AS Paper 2 · Q1(a) 1 mark AO1=1 Definition measuring economic growth
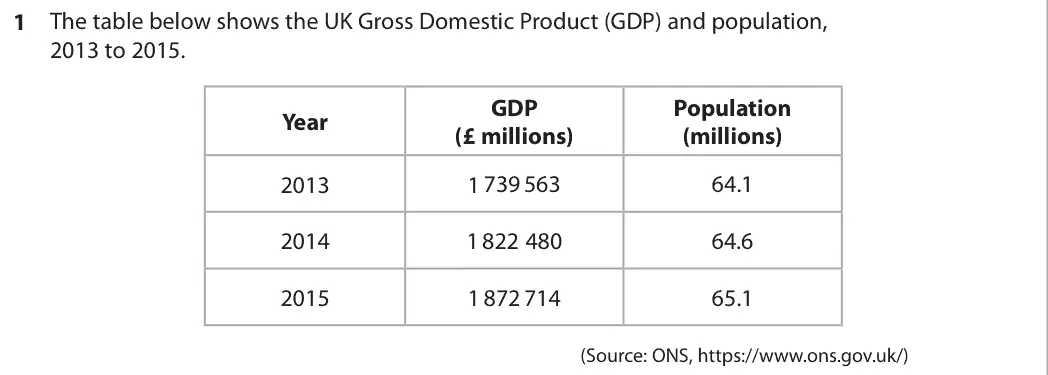
Data and extracts for question 11 The table below shows the UK Gross Domestic Product (GDP) and population, 2013 to 2015. GDP Population Year (£ millions) (millions) 2013 1 739 563 64.1 2014 1 822 480 64.6 2015 1 872 714 65.1 (Source: ONS, https://www.ons.gov.uk/)
(a) Define the term ‘Gross Domestic Product’. (1)
June 2018 · AS Paper 2 · Q1(b) 2 marks AO2=2 Calculation measuring economic growth
Data and extracts for question 11 The table below shows the UK Gross Domestic Product (GDP) and population, 2013 to 2015. GDP Population Year (£ millions) (millions) 2013 1 739 563 64.1 2014 1 822 480 64.6 2015 1 872 714 65.1 (Source: ONS, https://www.ons.gov.uk/)
(b) Calculate the UK’s GDP per capita in 2015. You are advised to show your working. (2)
June 2018 · AS Paper 2 · Q1(c) 1 mark Multiple choice measuring economic growth
Data and extracts for question 11 The table below shows the UK Gross Domestic Product (GDP) and population, 2013 to 2015. GDP Population Year (£ millions) (millions) 2013 1 739 563 64.1 2014 1 822 480 64.6 2015 1 872 714 65.1 (Source: ONS, https://www.ons.gov.uk/)
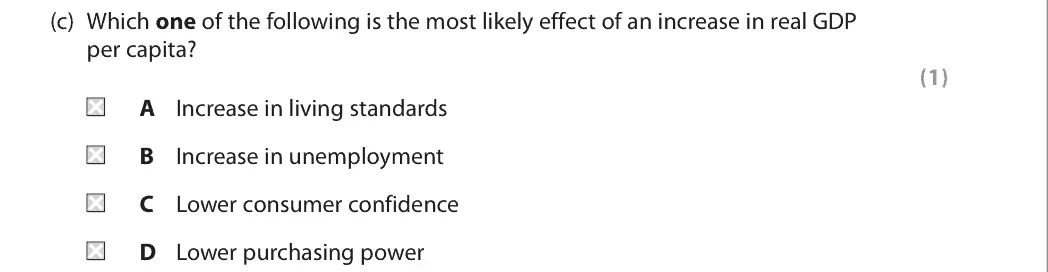
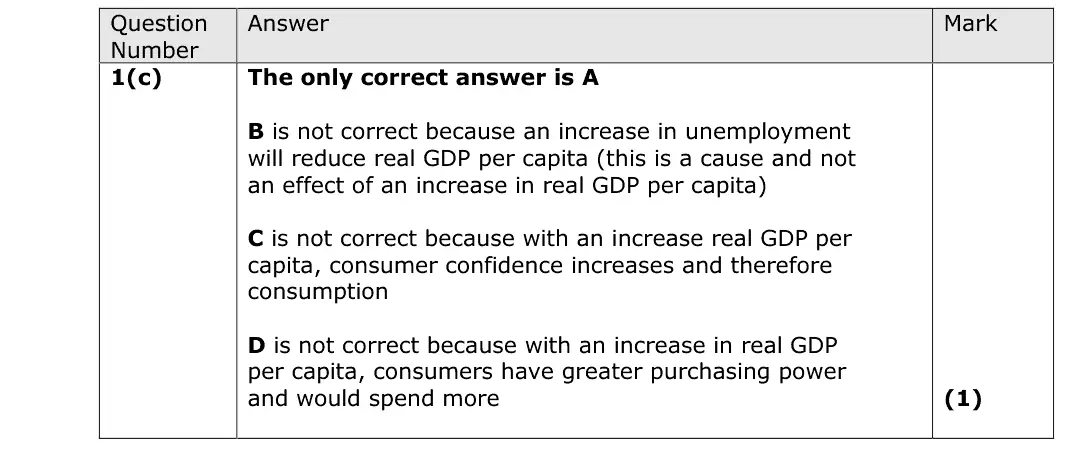
(c) Which one of the following is the most likely effect of an increase in real GDP per capita? (1) A Increase in living standards B Increase in unemployment C Lower consumer confidence D Lower purchasing power
June 2018 · AS Paper 2 · Q2(a) 1 mark AO1=1 Definition economic growth and the trade cycle
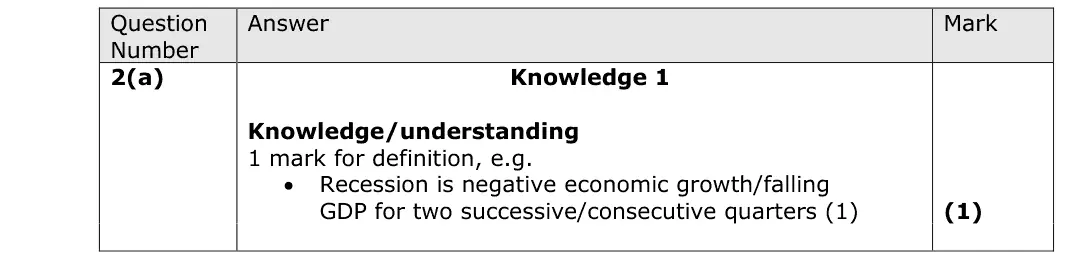
(a) Define the term ‘recession’. (1)
June 2018 · AS Paper 2 · Q2(b) 2 marks AO1=2 Short answer economic growth and the trade cycle
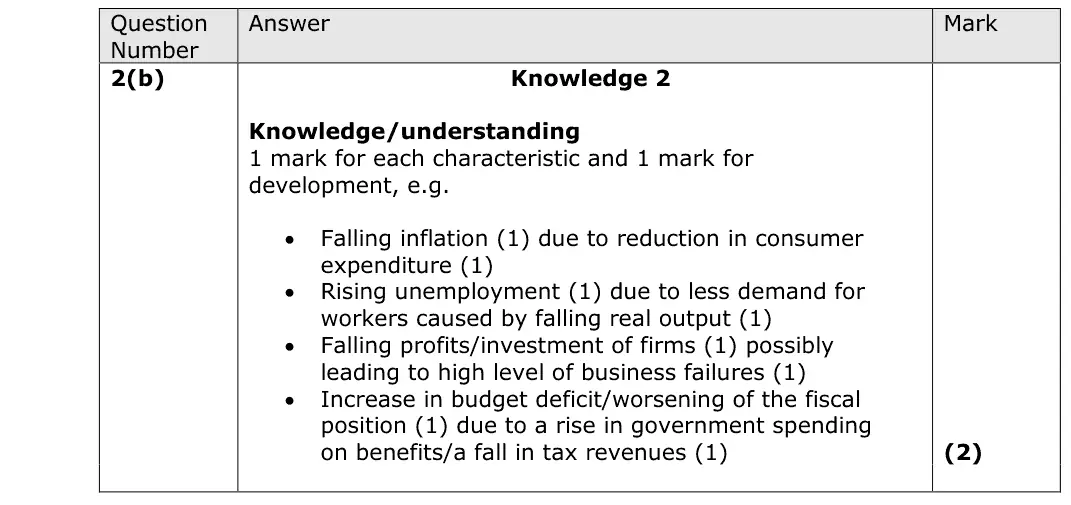
(b) Explain one characteristic of a recession. (2)
June 2018 · AS Paper 2 · Q2(c) 1 mark Multiple choice economic growth and the trade cycle
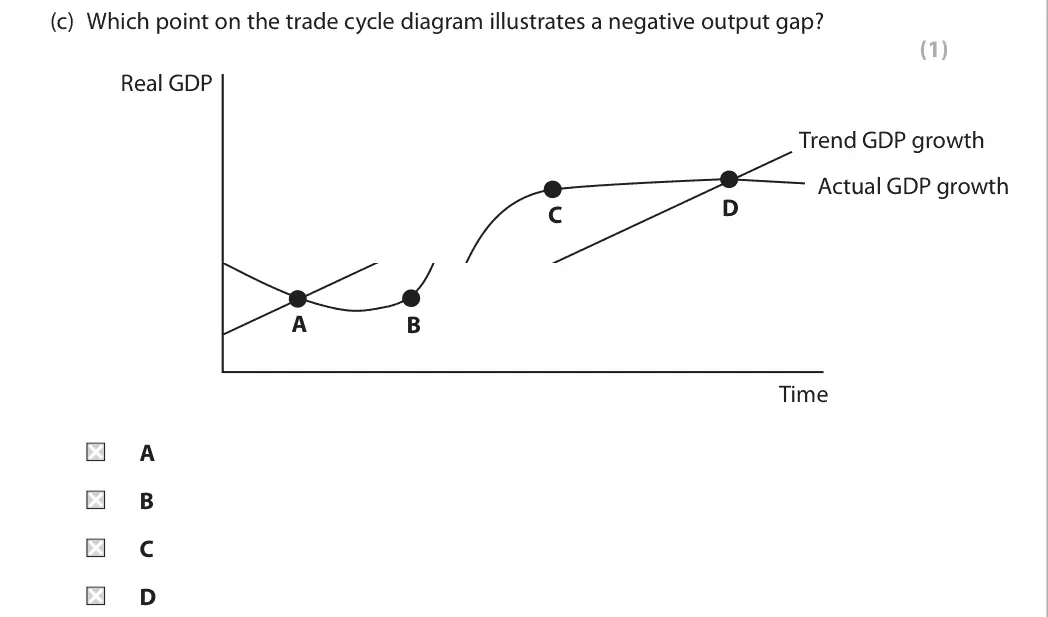
(c) Which point on the trade cycle diagram illustrates a negative output gap? (1) Real GDP Trend GDP growth Actual GDP growth D C A B Time A B C D
June 2018 · AS Paper 2 · Q3(a) 3 marks AO1=1, AO2=1, AO3=1 Short answer fiscal and monetary policy
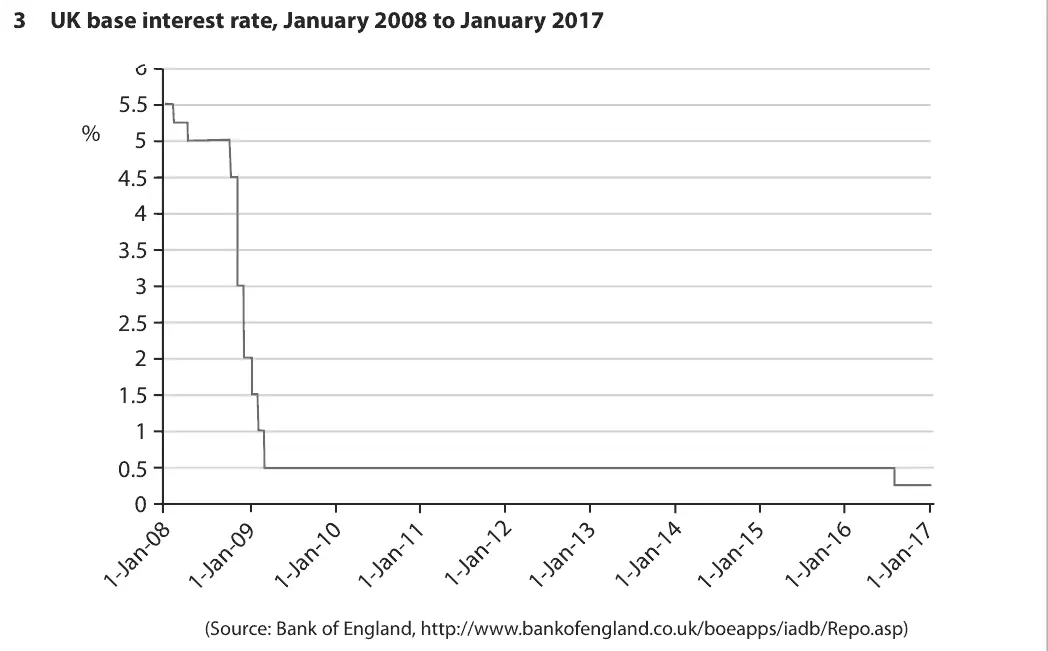
Data and extracts for question 33 UK base interest rate, January 2008 to January 2017 6 5.5 % 5 4.5 4 3.5 3 2.5 2 1.5 1 0.5 0 (Source: Bank of England, http://www.bankofengland.co.uk/boeapps/iadb/Repo.asp)
(a) With reference to the chart above, explain one factor that the Monetary Policy Committee (MPC) of the Bank of England may have considered when reducing the base interest rate. (3)
June 2018 · AS Paper 2 · Q3(b) 1 mark Multiple choice fiscal and monetary policy
Data and extracts for question 33 UK base interest rate, January 2008 to January 2017 6 5.5 % 5 4.5 4 3.5 3 2.5 2 1.5 1 0.5 0 (Source: Bank of England, http://www.bankofengland.co.uk/boeapps/iadb/Repo.asp)
In August 2016 the Bank of England extended its existing asset purchases (quantitative easing) programme, from a total of £375 billion to £435 billion. (b) Which one of the following is the most likely effect of the Bank of England’s quantitative easing? (1) A A fall in economic growth B A fall in the money supply C An increase in the rate of inflation D An increase in unemployment
June 2018 · AS Paper 2 · Q4(a) 1 mark AO1=1 Definition Hard aggregate demand
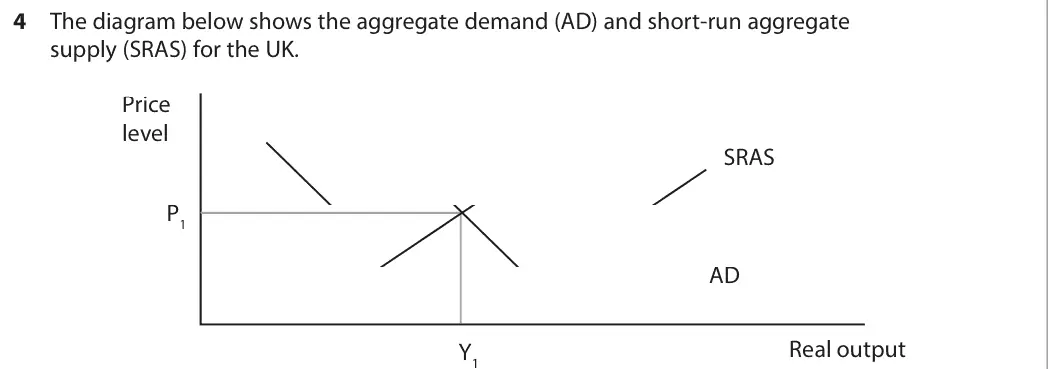
Data and extracts for question 44 The diagram below shows the aggregate demand (AD) and short-run aggregate supply (SRAS) for the UK. Price level SRAS P1 AD Real output Y1
(a) Define the term ‘aggregate demand’. (1)
June 2018 · AS Paper 2 · Q4(b) 2 marks AO2=2 Diagram aggregate supplynational income and the multiplier
Data and extracts for question 44 The diagram below shows the aggregate demand (AD) and short-run aggregate supply (SRAS) for the UK. Price level SRAS P1 AD Real output Y1
(b) Annotate the diagram above to show the likely impact of a rise in the cost of raw materials on the UK’s equilibrium level of real output and price level. (2)
June 2018 · AS Paper 2 · Q4(c) 1 mark Multiple choice aggregate supply
Data and extracts for question 44 The diagram below shows the aggregate demand (AD) and short-run aggregate supply (SRAS) for the UK. Price level SRAS P1 AD Real output Y1
(c) Which one of the following factors is most likely to cause an increase in the long-run aggregate supply? (1) A Decrease in investment B Increase in relative productivity C Increase in the level of unemployment benefits D Reduced access to credit for consumers and businesses
June 2018 · AS Paper 2 · Q5(a) 1 mark Multiple choice aggregate demand
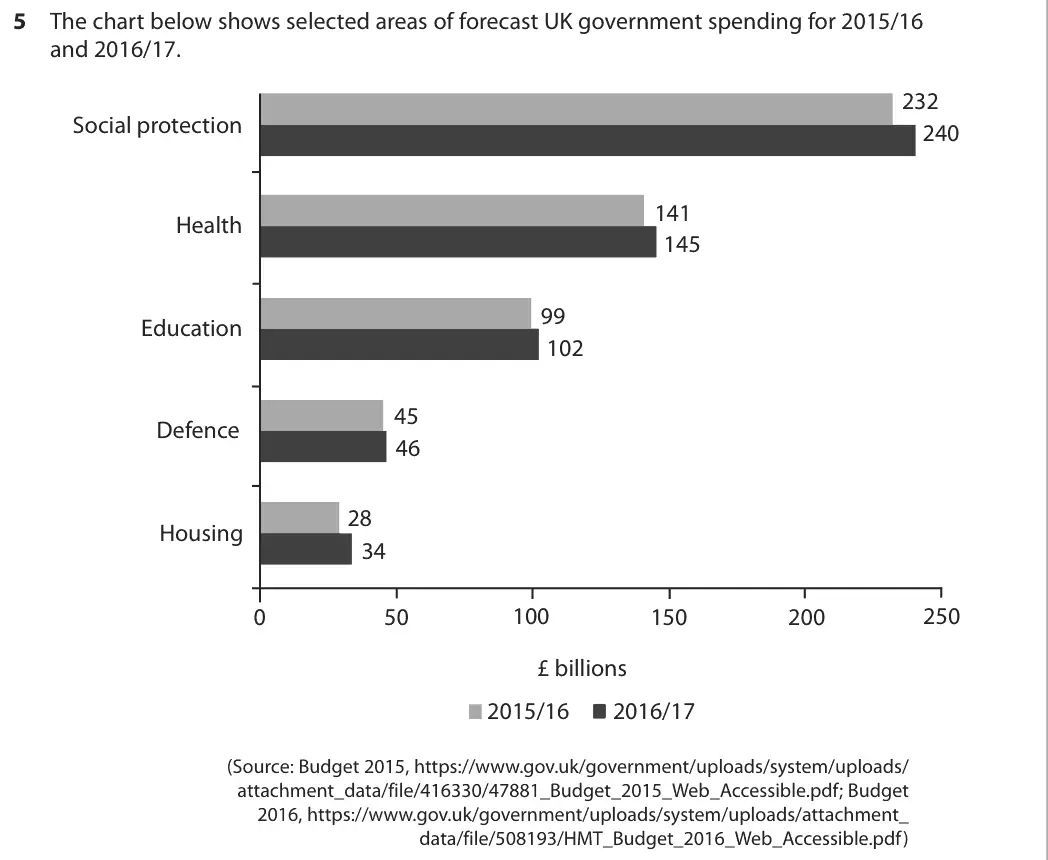
Data and extracts for question 55 The chart below shows selected areas of forecast UK government spending for 2015/16 and 2016/17. 232 Social protection 240 141 Health 145 99 Education 102 45 Defence 46 28 Housing 34 0 100 150 250 50 200 £ billions 2015/16 2016/17 (Source: Budget 2015, https://www.gov.uk/government/uploads/system/uploads/ attachment_data/file/416330/47881_Budget_2015_Web_Accessible.pdf; Budget 2016, https://www.gov.uk/government/uploads/system/uploads/attachment_ data/file/508193/HMT_Budget_2016_Web_Accessible.pdf)
(a) Which one of the following can be inferred from the chart? In 2016/17: (1) A the change in forecast UK government spending is highest on education B the forecast UK government spending in all areas has fallen from 2015/16 C the forecast UK government spending on defence is twice as much as the forecast spending on housing D the percentage change in forecast UK government spending on health, from 2015/16, is 2.84%
June 2018 · AS Paper 2 · Q5(b) 2 marks AO2=2 Calculation aggregate demand
Data and extracts for question 55 The chart below shows selected areas of forecast UK government spending for 2015/16 and 2016/17. 232 Social protection 240 141 Health 145 99 Education 102 45 Defence 46 28 Housing 34 0 100 150 250 50 200 £ billions 2015/16 2016/17 (Source: Budget 2015, https://www.gov.uk/government/uploads/system/uploads/ attachment_data/file/416330/47881_Budget_2015_Web_Accessible.pdf; Budget 2016, https://www.gov.uk/government/uploads/system/uploads/attachment_ data/file/508193/HMT_Budget_2016_Web_Accessible.pdf)
(b) In 2016/17 total forecast UK government spending amounted to £772 billion and total forecast tax receipts amounted to £716 billion. Calculate forecast UK government spending on social protection as a percentage of total forecast UK government spending in 2016/17. You are advised to show your working. (2)
June 2018 · AS Paper 2 · Q5(c) 1 mark AO1=1 Definition fiscal and monetary policy
Data and extracts for question 55 The chart below shows selected areas of forecast UK government spending for 2015/16 and 2016/17. 232 Social protection 240 141 Health 145 99 Education 102 45 Defence 46 28 Housing 34 0 100 150 250 50 200 £ billions 2015/16 2016/17 (Source: Budget 2015, https://www.gov.uk/government/uploads/system/uploads/ attachment_data/file/416330/47881_Budget_2015_Web_Accessible.pdf; Budget 2016, https://www.gov.uk/government/uploads/system/uploads/attachment_ data/file/508193/HMT_Budget_2016_Web_Accessible.pdf)
(c) Define the term ‘budget deficit’. (1)
June 2018 · AS Paper 2 · Q6(a) 4 marks AO1=2, AO2=2 Short answer unemployment
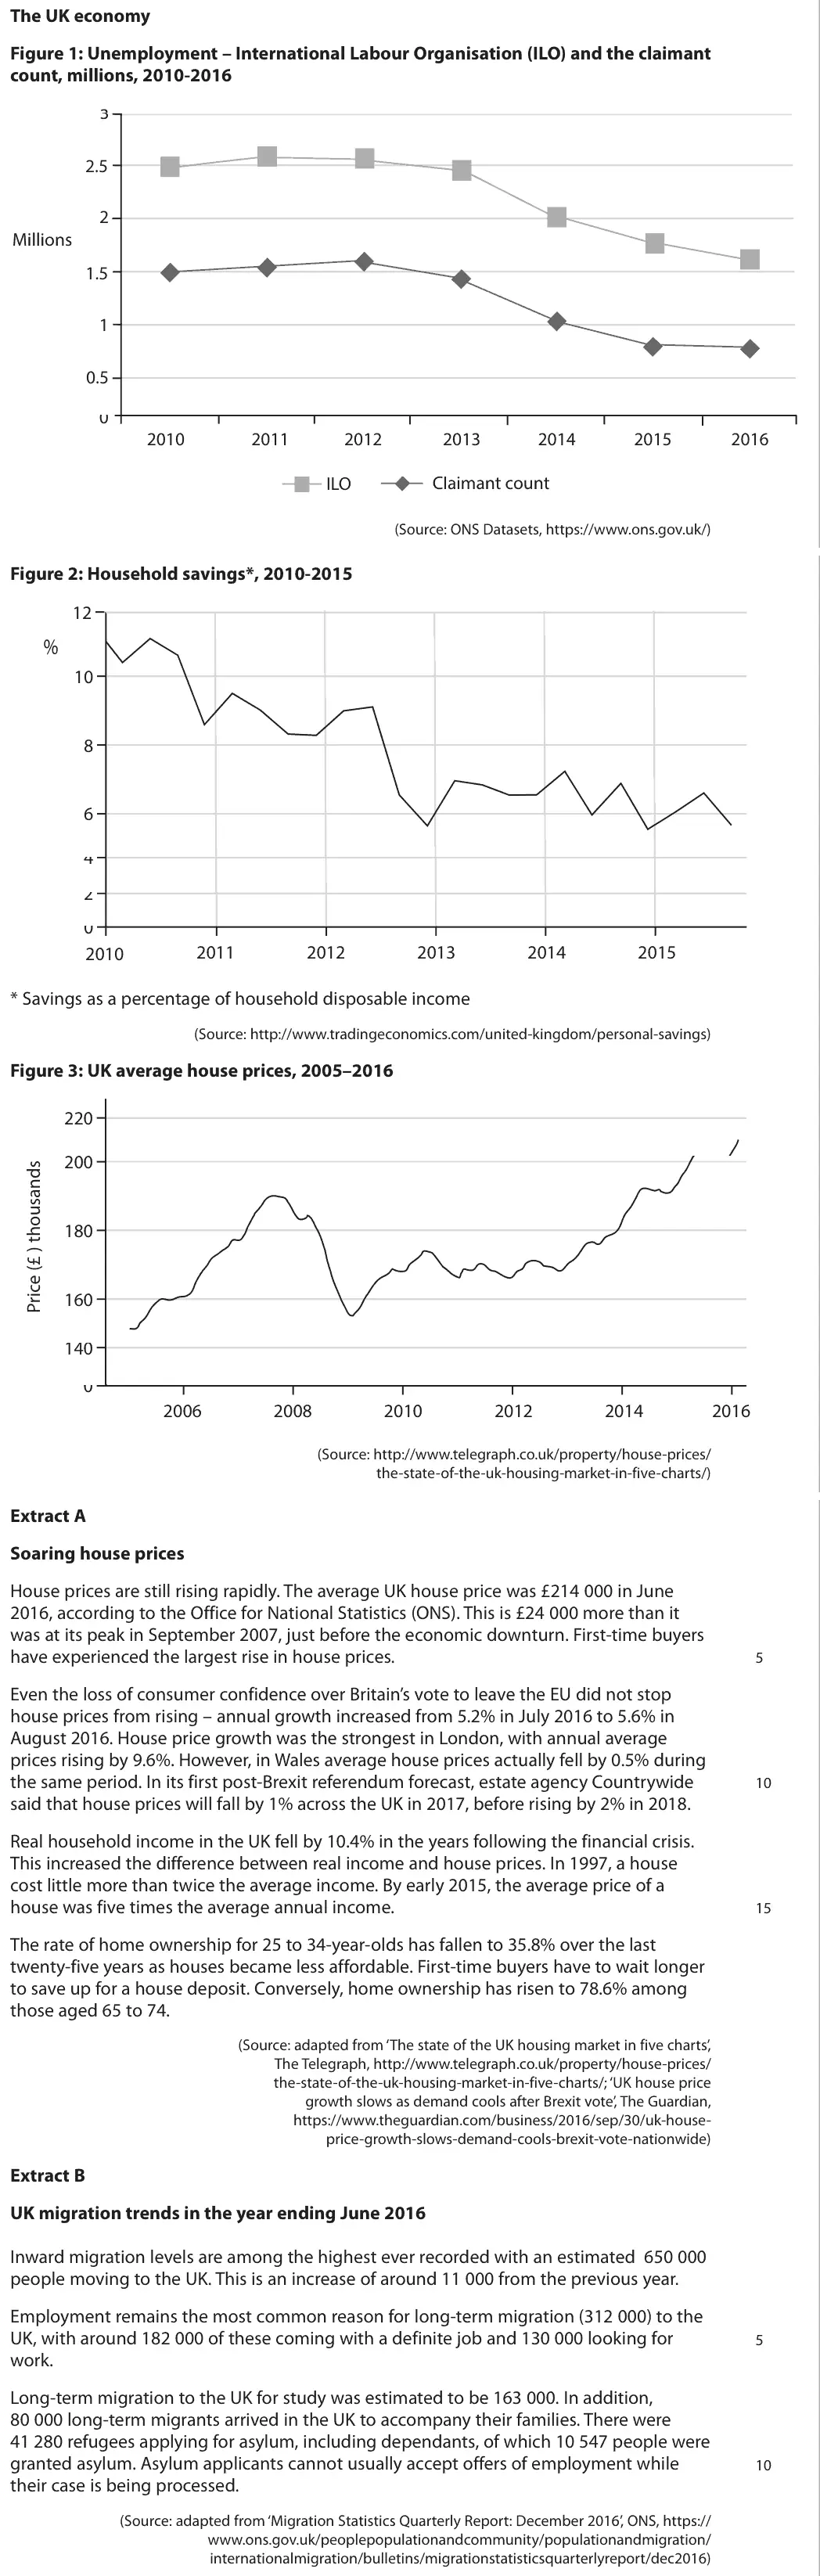
Data and extracts for question 6The UK economy Figure 1: Unemployment – International Labour Organisation (ILO) and the claimant count, millions, 2010-2016 3 2.5 2 Millions 1.5 1 0.5 0 2010 2011 2012 2013 2014 2015 2016 ILO Claimant count (Source: ONS Datasets, https://www.ons.gov.uk/) Figure 2: Household savings*, 2010-2015 12 % 10 8 6 4 2 0 2011 2012 2013 2014 2015 2010 * Savings as a percentage of household disposable income (Source: http://www.tradingeconomics.com/united-kingdom/personal-savings) Figure 3: UK average house prices, 2005–2016 220 200 180 160 140 0 2006 2008 2010 2012 2014 2016 (Source: http://www.telegraph.co.uk/property/house-prices/ the-state-of-the-uk-housing-market-in-five-charts/) Extract A Soaring house prices House prices are still rising rapidly. The average UK house price was £214 000 in June 2016, according to the Office for National Statistics (ONS). This is £24 000 more than it was at its peak in September 2007, just before the economic downturn. First-time buyers have experienced the largest rise in house prices. 5 Even the loss of consumer confidence over Britain’s vote to leave the EU did not stop house prices from rising – annual growth increased from 5.2% in July 2016 to 5.6% in August 2016. House price growth was the strongest in London, with annual average prices rising by 9.6%. However, in Wales average house prices actually fell by 0.5% during the same period. In its first post-Brexit referendum forecast, estate agency Countrywide 10 said that house prices will fall by 1% across the UK in 2017, before rising by 2% in 2018. Real household income in the UK fell by 10.4% in the years following the financial crisis. This increased the difference between real income and house prices. In 1997, a house cost little more than twice the average income. By early 2015, the average price of a house was five times the average annual income. 15 The rate of home ownership for 25 to 34-year-olds has fallen to 35.8% over the last twenty-five years as houses became less affordable. First-time buyers have to wait longer to save up for a house deposit. Conversely, home ownership has risen to 78.6% among those aged 65 to 74. (Source: adapted from ‘The state of the UK housing market in five charts’, The Telegraph, http://www.telegraph.co.uk/property/house-prices/ the-state-of-the-uk-housing-market-in-five-charts/; ‘UK house price growth slows as demand cools after Brexit vote’, The Guardian, https://www.theguardian.com/business/2016/sep/30/uk-house- price-growth-slows-demand-cools-brexit-vote-nationwide) Extract B UK migration trends in the year ending June 2016 Inward migration levels are among the highest ever recorded with an estimated 650 000 people moving to the UK. This is an increase of around 11 000 from the previous year. Employment remains the most common reason for long-term migration (312 000) to the UK, with around 182 000 of these coming with a definite job and 130 000 looking for 5 work. Long-term migration to the UK for study was estimated to be 163 000. In addition, 80 000 long-term migrants arrived in the UK to accompany their families. There were 41 280 refugees applying for asylum, including dependants, of which 10 547 people were granted asylum. Asylum applicants cannot usually accept offers of employment while 10 their case is being processed. (Source: adapted from ‘Migration Statistics Quarterly Report: December 2016’, ONS, https:// www.ons.gov.uk/peoplepopulationandcommunity/populationandmigration/ internationalmigration/bulletins/migrationstatisticsquarterlyreport/dec2016)
(a) With reference to Figure 1, explain one reason why the claimant count and the ILO measure of unemployment differ. (4)
June 2018 · AS Paper 2 · Q6(b) 10 marks AO1=2, AO2=2, AO3=2, AO4=4 10-mark response aggregate demandnational income and the multiplier
Data and extracts for question 6The UK economy Figure 1: Unemployment – International Labour Organisation (ILO) and the claimant count, millions, 2010-2016 3 2.5 2 Millions 1.5 1 0.5 0 2010 2011 2012 2013 2014 2015 2016 ILO Claimant count (Source: ONS Datasets, https://www.ons.gov.uk/) Figure 2: Household savings*, 2010-2015 12 % 10 8 6 4 2 0 2011 2012 2013 2014 2015 2010 * Savings as a percentage of household disposable income (Source: http://www.tradingeconomics.com/united-kingdom/personal-savings) Figure 3: UK average house prices, 2005–2016 220 200 180 160 140 0 2006 2008 2010 2012 2014 2016 (Source: http://www.telegraph.co.uk/property/house-prices/ the-state-of-the-uk-housing-market-in-five-charts/) Extract A Soaring house prices House prices are still rising rapidly. The average UK house price was £214 000 in June 2016, according to the Office for National Statistics (ONS). This is £24 000 more than it was at its peak in September 2007, just before the economic downturn. First-time buyers have experienced the largest rise in house prices. 5 Even the loss of consumer confidence over Britain’s vote to leave the EU did not stop house prices from rising – annual growth increased from 5.2% in July 2016 to 5.6% in August 2016. House price growth was the strongest in London, with annual average prices rising by 9.6%. However, in Wales average house prices actually fell by 0.5% during the same period. In its first post-Brexit referendum forecast, estate agency Countrywide 10 said that house prices will fall by 1% across the UK in 2017, before rising by 2% in 2018. Real household income in the UK fell by 10.4% in the years following the financial crisis. This increased the difference between real income and house prices. In 1997, a house cost little more than twice the average income. By early 2015, the average price of a house was five times the average annual income. 15 The rate of home ownership for 25 to 34-year-olds has fallen to 35.8% over the last twenty-five years as houses became less affordable. First-time buyers have to wait longer to save up for a house deposit. Conversely, home ownership has risen to 78.6% among those aged 65 to 74. (Source: adapted from ‘The state of the UK housing market in five charts’, The Telegraph, http://www.telegraph.co.uk/property/house-prices/ the-state-of-the-uk-housing-market-in-five-charts/; ‘UK house price growth slows as demand cools after Brexit vote’, The Guardian, https://www.theguardian.com/business/2016/sep/30/uk-house- price-growth-slows-demand-cools-brexit-vote-nationwide) Extract B UK migration trends in the year ending June 2016 Inward migration levels are among the highest ever recorded with an estimated 650 000 people moving to the UK. This is an increase of around 11 000 from the previous year. Employment remains the most common reason for long-term migration (312 000) to the UK, with around 182 000 of these coming with a definite job and 130 000 looking for 5 work. Long-term migration to the UK for study was estimated to be 163 000. In addition, 80 000 long-term migrants arrived in the UK to accompany their families. There were 41 280 refugees applying for asylum, including dependants, of which 10 547 people were granted asylum. Asylum applicants cannot usually accept offers of employment while 10 their case is being processed. (Source: adapted from ‘Migration Statistics Quarterly Report: December 2016’, ONS, https:// www.ons.gov.uk/peoplepopulationandcommunity/populationandmigration/ internationalmigration/bulletins/migrationstatisticsquarterlyreport/dec2016)
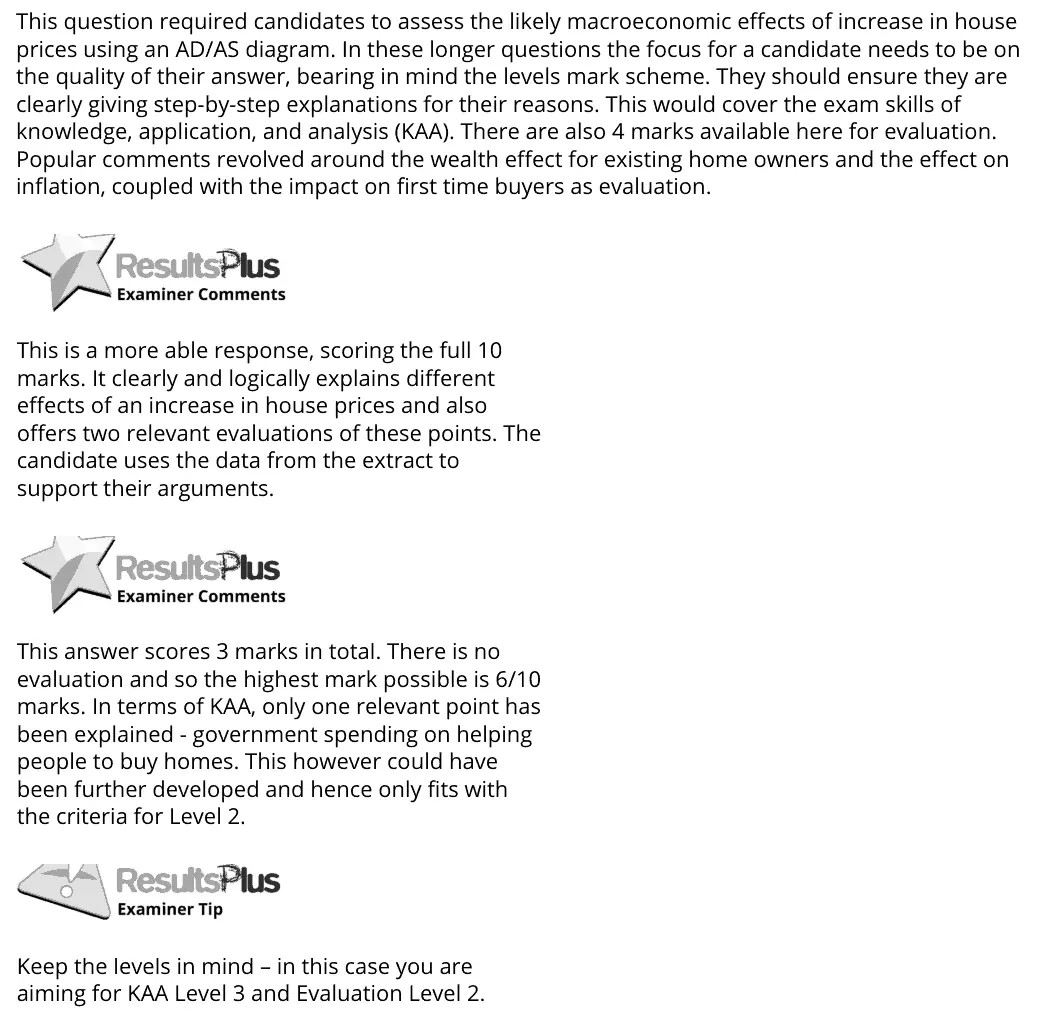
(b) With reference to Extract A, assess the likely macroeconomic effects of an increase in house prices. Use an aggregate demand and aggregate supply diagram in your answer. (10)
June 2018 · AS Paper 2 · Q6(c) 5 marks AO1=1, AO2=2, AO3=2 Short answer aggregate demand
Data and extracts for question 6The UK economy Figure 1: Unemployment – International Labour Organisation (ILO) and the claimant count, millions, 2010-2016 3 2.5 2 Millions 1.5 1 0.5 0 2010 2011 2012 2013 2014 2015 2016 ILO Claimant count (Source: ONS Datasets, https://www.ons.gov.uk/) Figure 2: Household savings*, 2010-2015 12 % 10 8 6 4 2 0 2011 2012 2013 2014 2015 2010 * Savings as a percentage of household disposable income (Source: http://www.tradingeconomics.com/united-kingdom/personal-savings) Figure 3: UK average house prices, 2005–2016 220 200 180 160 140 0 2006 2008 2010 2012 2014 2016 (Source: http://www.telegraph.co.uk/property/house-prices/ the-state-of-the-uk-housing-market-in-five-charts/) Extract A Soaring house prices House prices are still rising rapidly. The average UK house price was £214 000 in June 2016, according to the Office for National Statistics (ONS). This is £24 000 more than it was at its peak in September 2007, just before the economic downturn. First-time buyers have experienced the largest rise in house prices. 5 Even the loss of consumer confidence over Britain’s vote to leave the EU did not stop house prices from rising – annual growth increased from 5.2% in July 2016 to 5.6% in August 2016. House price growth was the strongest in London, with annual average prices rising by 9.6%. However, in Wales average house prices actually fell by 0.5% during the same period. In its first post-Brexit referendum forecast, estate agency Countrywide 10 said that house prices will fall by 1% across the UK in 2017, before rising by 2% in 2018. Real household income in the UK fell by 10.4% in the years following the financial crisis. This increased the difference between real income and house prices. In 1997, a house cost little more than twice the average income. By early 2015, the average price of a house was five times the average annual income. 15 The rate of home ownership for 25 to 34-year-olds has fallen to 35.8% over the last twenty-five years as houses became less affordable. First-time buyers have to wait longer to save up for a house deposit. Conversely, home ownership has risen to 78.6% among those aged 65 to 74. (Source: adapted from ‘The state of the UK housing market in five charts’, The Telegraph, http://www.telegraph.co.uk/property/house-prices/ the-state-of-the-uk-housing-market-in-five-charts/; ‘UK house price growth slows as demand cools after Brexit vote’, The Guardian, https://www.theguardian.com/business/2016/sep/30/uk-house- price-growth-slows-demand-cools-brexit-vote-nationwide) Extract B UK migration trends in the year ending June 2016 Inward migration levels are among the highest ever recorded with an estimated 650 000 people moving to the UK. This is an increase of around 11 000 from the previous year. Employment remains the most common reason for long-term migration (312 000) to the UK, with around 182 000 of these coming with a definite job and 130 000 looking for 5 work. Long-term migration to the UK for study was estimated to be 163 000. In addition, 80 000 long-term migrants arrived in the UK to accompany their families. There were 41 280 refugees applying for asylum, including dependants, of which 10 547 people were granted asylum. Asylum applicants cannot usually accept offers of employment while 10 their case is being processed. (Source: adapted from ‘Migration Statistics Quarterly Report: December 2016’, ONS, https:// www.ons.gov.uk/peoplepopulationandcommunity/populationandmigration/ internationalmigration/bulletins/migrationstatisticsquarterlyreport/dec2016)
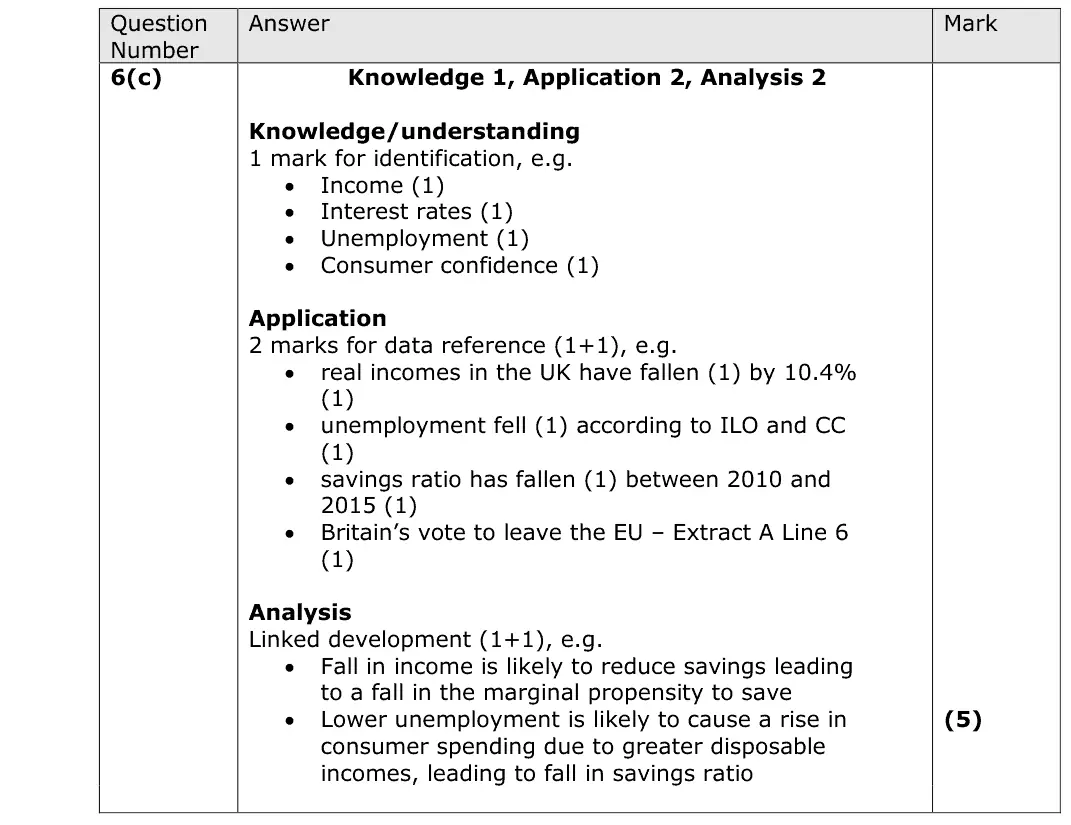
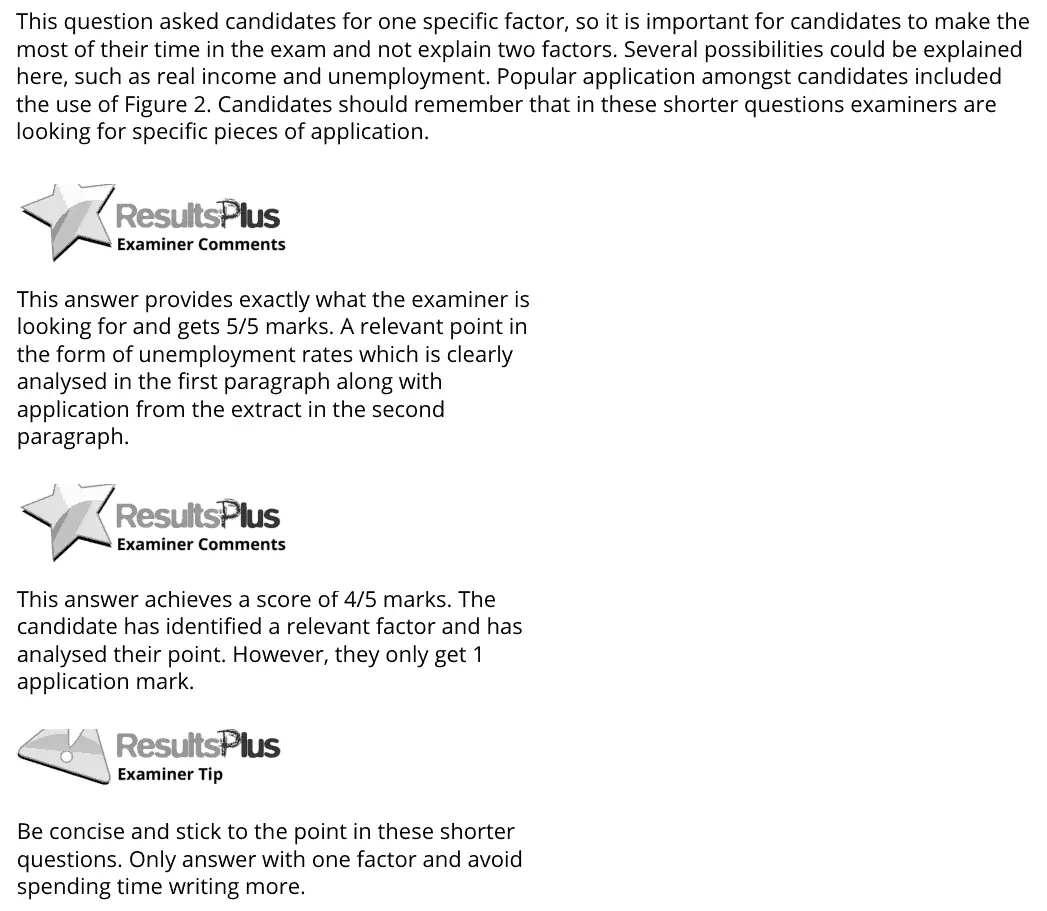
(c) With reference to the information provided, explain one likely factor, other than changes in house prices, that could influence the level of savings of UK households. (5)
June 2018 · AS Paper 2 · Q6(d) 6 marks AO1=2, AO2=2, AO3=2 Short answer national income and the multiplier
Data and extracts for question 6The UK economy Figure 1: Unemployment – International Labour Organisation (ILO) and the claimant count, millions, 2010-2016 3 2.5 2 Millions 1.5 1 0.5 0 2010 2011 2012 2013 2014 2015 2016 ILO Claimant count (Source: ONS Datasets, https://www.ons.gov.uk/) Figure 2: Household savings*, 2010-2015 12 % 10 8 6 4 2 0 2011 2012 2013 2014 2015 2010 * Savings as a percentage of household disposable income (Source: http://www.tradingeconomics.com/united-kingdom/personal-savings) Figure 3: UK average house prices, 2005–2016 220 200 180 160 140 0 2006 2008 2010 2012 2014 2016 (Source: http://www.telegraph.co.uk/property/house-prices/ the-state-of-the-uk-housing-market-in-five-charts/) Extract A Soaring house prices House prices are still rising rapidly. The average UK house price was £214 000 in June 2016, according to the Office for National Statistics (ONS). This is £24 000 more than it was at its peak in September 2007, just before the economic downturn. First-time buyers have experienced the largest rise in house prices. 5 Even the loss of consumer confidence over Britain’s vote to leave the EU did not stop house prices from rising – annual growth increased from 5.2% in July 2016 to 5.6% in August 2016. House price growth was the strongest in London, with annual average prices rising by 9.6%. However, in Wales average house prices actually fell by 0.5% during the same period. In its first post-Brexit referendum forecast, estate agency Countrywide 10 said that house prices will fall by 1% across the UK in 2017, before rising by 2% in 2018. Real household income in the UK fell by 10.4% in the years following the financial crisis. This increased the difference between real income and house prices. In 1997, a house cost little more than twice the average income. By early 2015, the average price of a house was five times the average annual income. 15 The rate of home ownership for 25 to 34-year-olds has fallen to 35.8% over the last twenty-five years as houses became less affordable. First-time buyers have to wait longer to save up for a house deposit. Conversely, home ownership has risen to 78.6% among those aged 65 to 74. (Source: adapted from ‘The state of the UK housing market in five charts’, The Telegraph, http://www.telegraph.co.uk/property/house-prices/ the-state-of-the-uk-housing-market-in-five-charts/; ‘UK house price growth slows as demand cools after Brexit vote’, The Guardian, https://www.theguardian.com/business/2016/sep/30/uk-house- price-growth-slows-demand-cools-brexit-vote-nationwide) Extract B UK migration trends in the year ending June 2016 Inward migration levels are among the highest ever recorded with an estimated 650 000 people moving to the UK. This is an increase of around 11 000 from the previous year. Employment remains the most common reason for long-term migration (312 000) to the UK, with around 182 000 of these coming with a definite job and 130 000 looking for 5 work. Long-term migration to the UK for study was estimated to be 163 000. In addition, 80 000 long-term migrants arrived in the UK to accompany their families. There were 41 280 refugees applying for asylum, including dependants, of which 10 547 people were granted asylum. Asylum applicants cannot usually accept offers of employment while 10 their case is being processed. (Source: adapted from ‘Migration Statistics Quarterly Report: December 2016’, ONS, https:// www.ons.gov.uk/peoplepopulationandcommunity/populationandmigration/ internationalmigration/bulletins/migrationstatisticsquarterlyreport/dec2016)
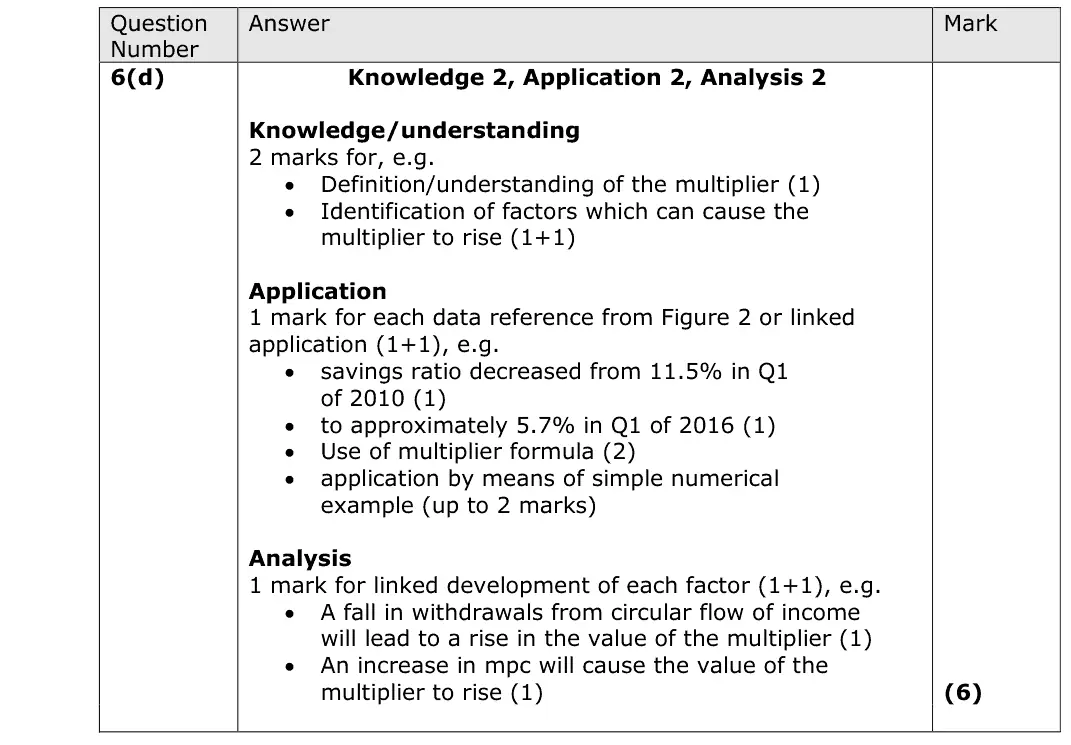
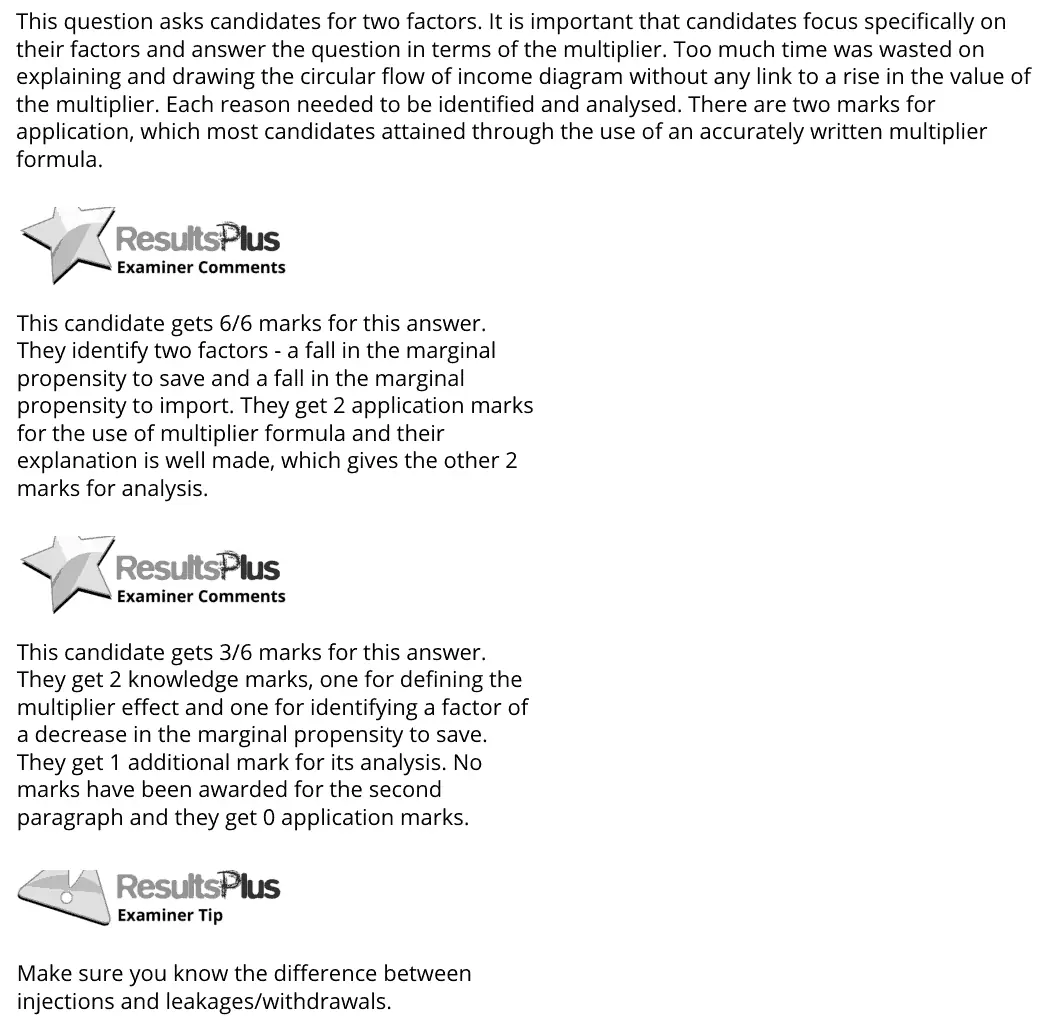
(d) Explain two factors that might cause a rise in the value of the multiplier. (6)
June 2018 · AS Paper 2 · Q6(e) 15 marks AO1=3, AO2=3, AO3=3, AO4=6 15-mark response unemployment
Data and extracts for question 6The UK economy Figure 1: Unemployment – International Labour Organisation (ILO) and the claimant count, millions, 2010-2016 3 2.5 2 Millions 1.5 1 0.5 0 2010 2011 2012 2013 2014 2015 2016 ILO Claimant count (Source: ONS Datasets, https://www.ons.gov.uk/) Figure 2: Household savings*, 2010-2015 12 % 10 8 6 4 2 0 2011 2012 2013 2014 2015 2010 * Savings as a percentage of household disposable income (Source: http://www.tradingeconomics.com/united-kingdom/personal-savings) Figure 3: UK average house prices, 2005–2016 220 200 180 160 140 0 2006 2008 2010 2012 2014 2016 (Source: http://www.telegraph.co.uk/property/house-prices/ the-state-of-the-uk-housing-market-in-five-charts/) Extract A Soaring house prices House prices are still rising rapidly. The average UK house price was £214 000 in June 2016, according to the Office for National Statistics (ONS). This is £24 000 more than it was at its peak in September 2007, just before the economic downturn. First-time buyers have experienced the largest rise in house prices. 5 Even the loss of consumer confidence over Britain’s vote to leave the EU did not stop house prices from rising – annual growth increased from 5.2% in July 2016 to 5.6% in August 2016. House price growth was the strongest in London, with annual average prices rising by 9.6%. However, in Wales average house prices actually fell by 0.5% during the same period. In its first post-Brexit referendum forecast, estate agency Countrywide 10 said that house prices will fall by 1% across the UK in 2017, before rising by 2% in 2018. Real household income in the UK fell by 10.4% in the years following the financial crisis. This increased the difference between real income and house prices. In 1997, a house cost little more than twice the average income. By early 2015, the average price of a house was five times the average annual income. 15 The rate of home ownership for 25 to 34-year-olds has fallen to 35.8% over the last twenty-five years as houses became less affordable. First-time buyers have to wait longer to save up for a house deposit. Conversely, home ownership has risen to 78.6% among those aged 65 to 74. (Source: adapted from ‘The state of the UK housing market in five charts’, The Telegraph, http://www.telegraph.co.uk/property/house-prices/ the-state-of-the-uk-housing-market-in-five-charts/; ‘UK house price growth slows as demand cools after Brexit vote’, The Guardian, https://www.theguardian.com/business/2016/sep/30/uk-house- price-growth-slows-demand-cools-brexit-vote-nationwide) Extract B UK migration trends in the year ending June 2016 Inward migration levels are among the highest ever recorded with an estimated 650 000 people moving to the UK. This is an increase of around 11 000 from the previous year. Employment remains the most common reason for long-term migration (312 000) to the UK, with around 182 000 of these coming with a definite job and 130 000 looking for 5 work. Long-term migration to the UK for study was estimated to be 163 000. In addition, 80 000 long-term migrants arrived in the UK to accompany their families. There were 41 280 refugees applying for asylum, including dependants, of which 10 547 people were granted asylum. Asylum applicants cannot usually accept offers of employment while 10 their case is being processed. (Source: adapted from ‘Migration Statistics Quarterly Report: December 2016’, ONS, https:// www.ons.gov.uk/peoplepopulationandcommunity/populationandmigration/ internationalmigration/bulletins/migrationstatisticsquarterlyreport/dec2016)
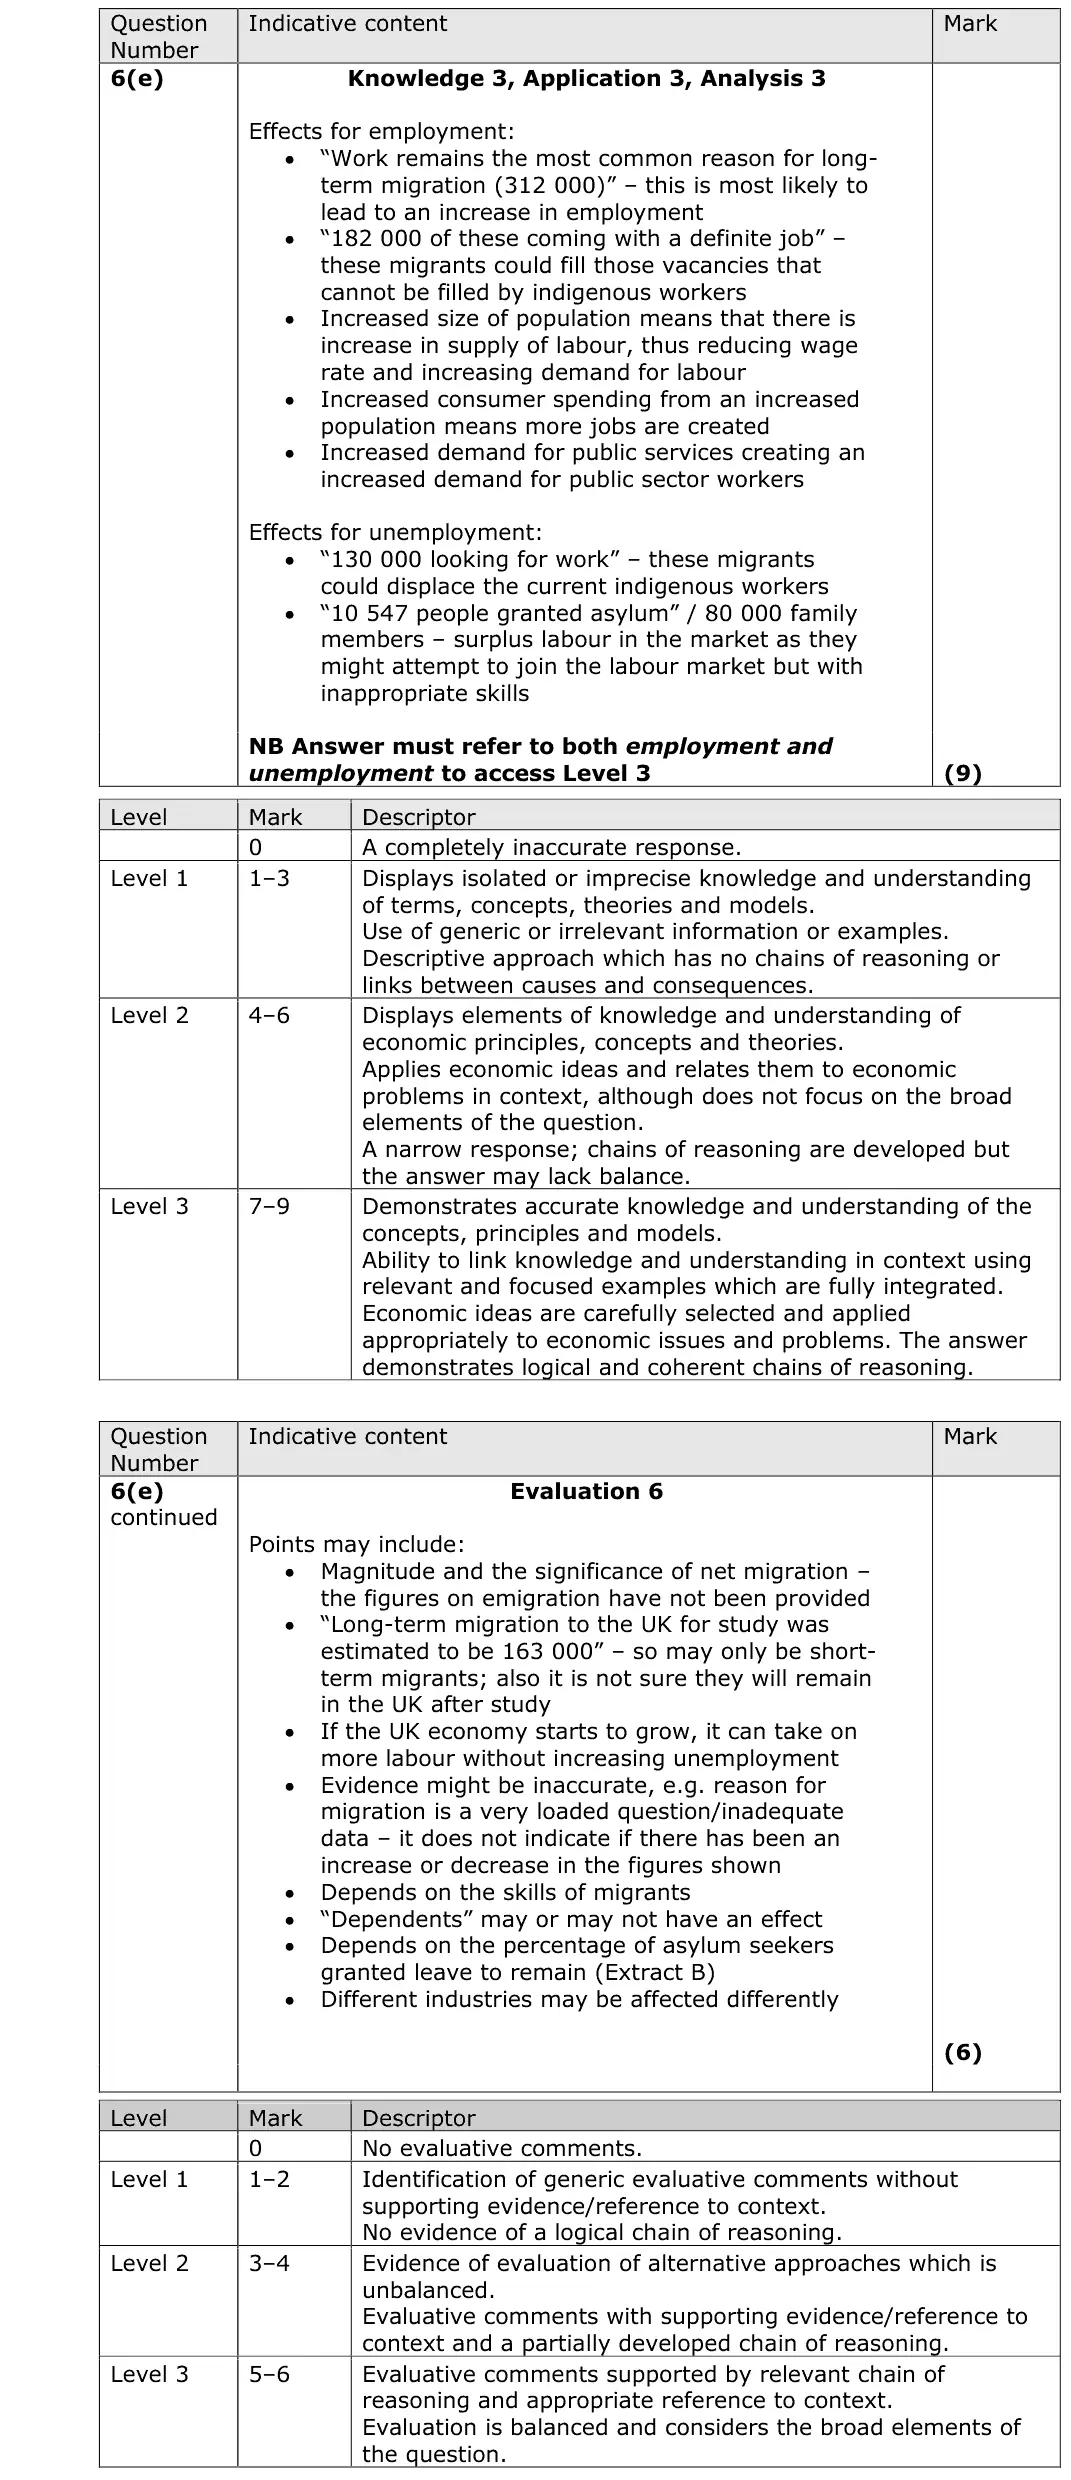
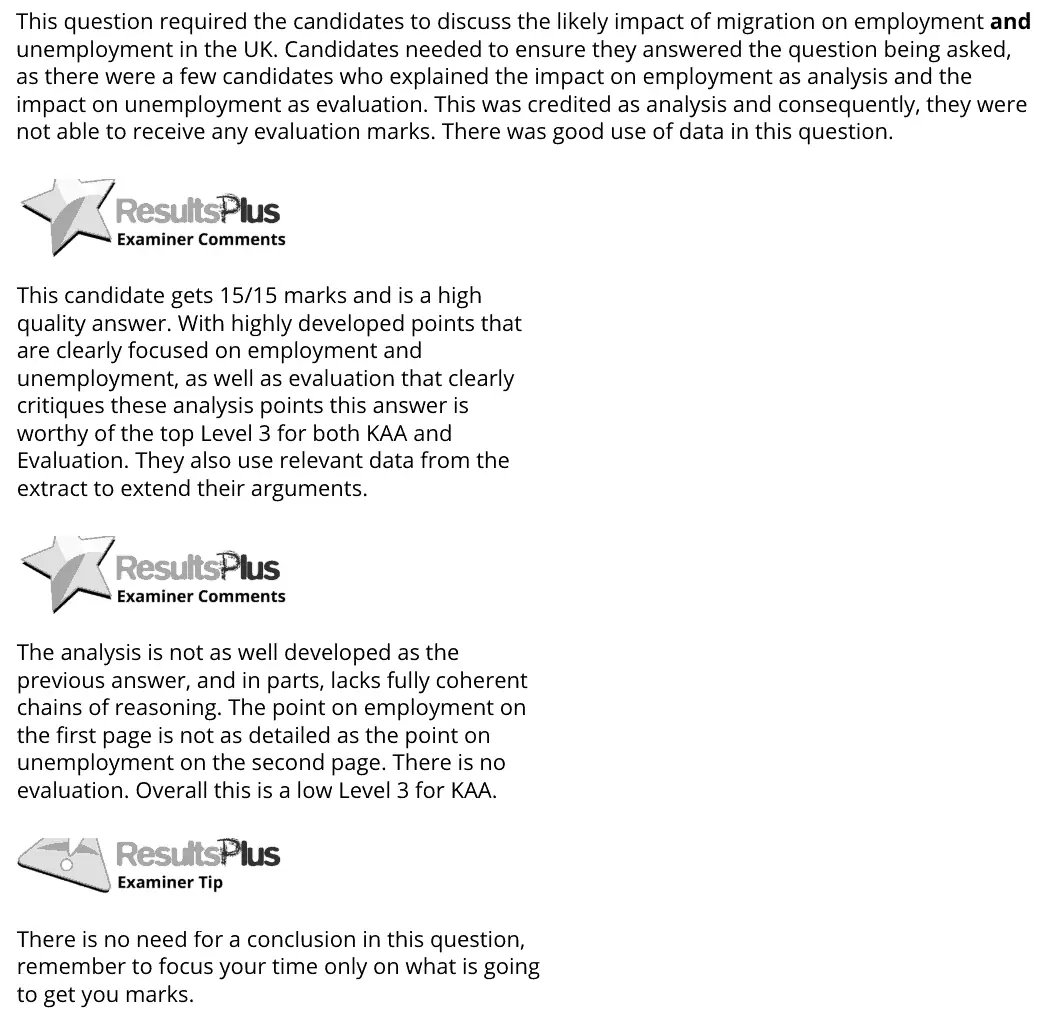
(e) With reference to Extract B and Figure 1, discuss the likely impact of migration on employment and unemployment in the UK. (15)
June 2018 · AS Paper 2 · Q6(f) 20 marks AO1=4, AO2=4, AO3=6, AO4=6 20-mark essay Either/or supply side policiesfiscal and monetary policy
Data and extracts for question 6The UK economy Figure 1: Unemployment – International Labour Organisation (ILO) and the claimant count, millions, 2010-2016 3 2.5 2 Millions 1.5 1 0.5 0 2010 2011 2012 2013 2014 2015 2016 ILO Claimant count (Source: ONS Datasets, https://www.ons.gov.uk/) Figure 2: Household savings*, 2010-2015 12 % 10 8 6 4 2 0 2011 2012 2013 2014 2015 2010 * Savings as a percentage of household disposable income (Source: http://www.tradingeconomics.com/united-kingdom/personal-savings) Figure 3: UK average house prices, 2005–2016 220 200 180 160 140 0 2006 2008 2010 2012 2014 2016 (Source: http://www.telegraph.co.uk/property/house-prices/ the-state-of-the-uk-housing-market-in-five-charts/) Extract A Soaring house prices House prices are still rising rapidly. The average UK house price was £214 000 in June 2016, according to the Office for National Statistics (ONS). This is £24 000 more than it was at its peak in September 2007, just before the economic downturn. First-time buyers have experienced the largest rise in house prices. 5 Even the loss of consumer confidence over Britain’s vote to leave the EU did not stop house prices from rising – annual growth increased from 5.2% in July 2016 to 5.6% in August 2016. House price growth was the strongest in London, with annual average prices rising by 9.6%. However, in Wales average house prices actually fell by 0.5% during the same period. In its first post-Brexit referendum forecast, estate agency Countrywide 10 said that house prices will fall by 1% across the UK in 2017, before rising by 2% in 2018. Real household income in the UK fell by 10.4% in the years following the financial crisis. This increased the difference between real income and house prices. In 1997, a house cost little more than twice the average income. By early 2015, the average price of a house was five times the average annual income. 15 The rate of home ownership for 25 to 34-year-olds has fallen to 35.8% over the last twenty-five years as houses became less affordable. First-time buyers have to wait longer to save up for a house deposit. Conversely, home ownership has risen to 78.6% among those aged 65 to 74. (Source: adapted from ‘The state of the UK housing market in five charts’, The Telegraph, http://www.telegraph.co.uk/property/house-prices/ the-state-of-the-uk-housing-market-in-five-charts/; ‘UK house price growth slows as demand cools after Brexit vote’, The Guardian, https://www.theguardian.com/business/2016/sep/30/uk-house- price-growth-slows-demand-cools-brexit-vote-nationwide) Extract B UK migration trends in the year ending June 2016 Inward migration levels are among the highest ever recorded with an estimated 650 000 people moving to the UK. This is an increase of around 11 000 from the previous year. Employment remains the most common reason for long-term migration (312 000) to the UK, with around 182 000 of these coming with a definite job and 130 000 looking for 5 work. Long-term migration to the UK for study was estimated to be 163 000. In addition, 80 000 long-term migrants arrived in the UK to accompany their families. There were 41 280 refugees applying for asylum, including dependants, of which 10 547 people were granted asylum. Asylum applicants cannot usually accept offers of employment while 10 their case is being processed. (Source: adapted from ‘Migration Statistics Quarterly Report: December 2016’, ONS, https:// www.ons.gov.uk/peoplepopulationandcommunity/populationandmigration/ internationalmigration/bulletins/migrationstatisticsquarterlyreport/dec2016)
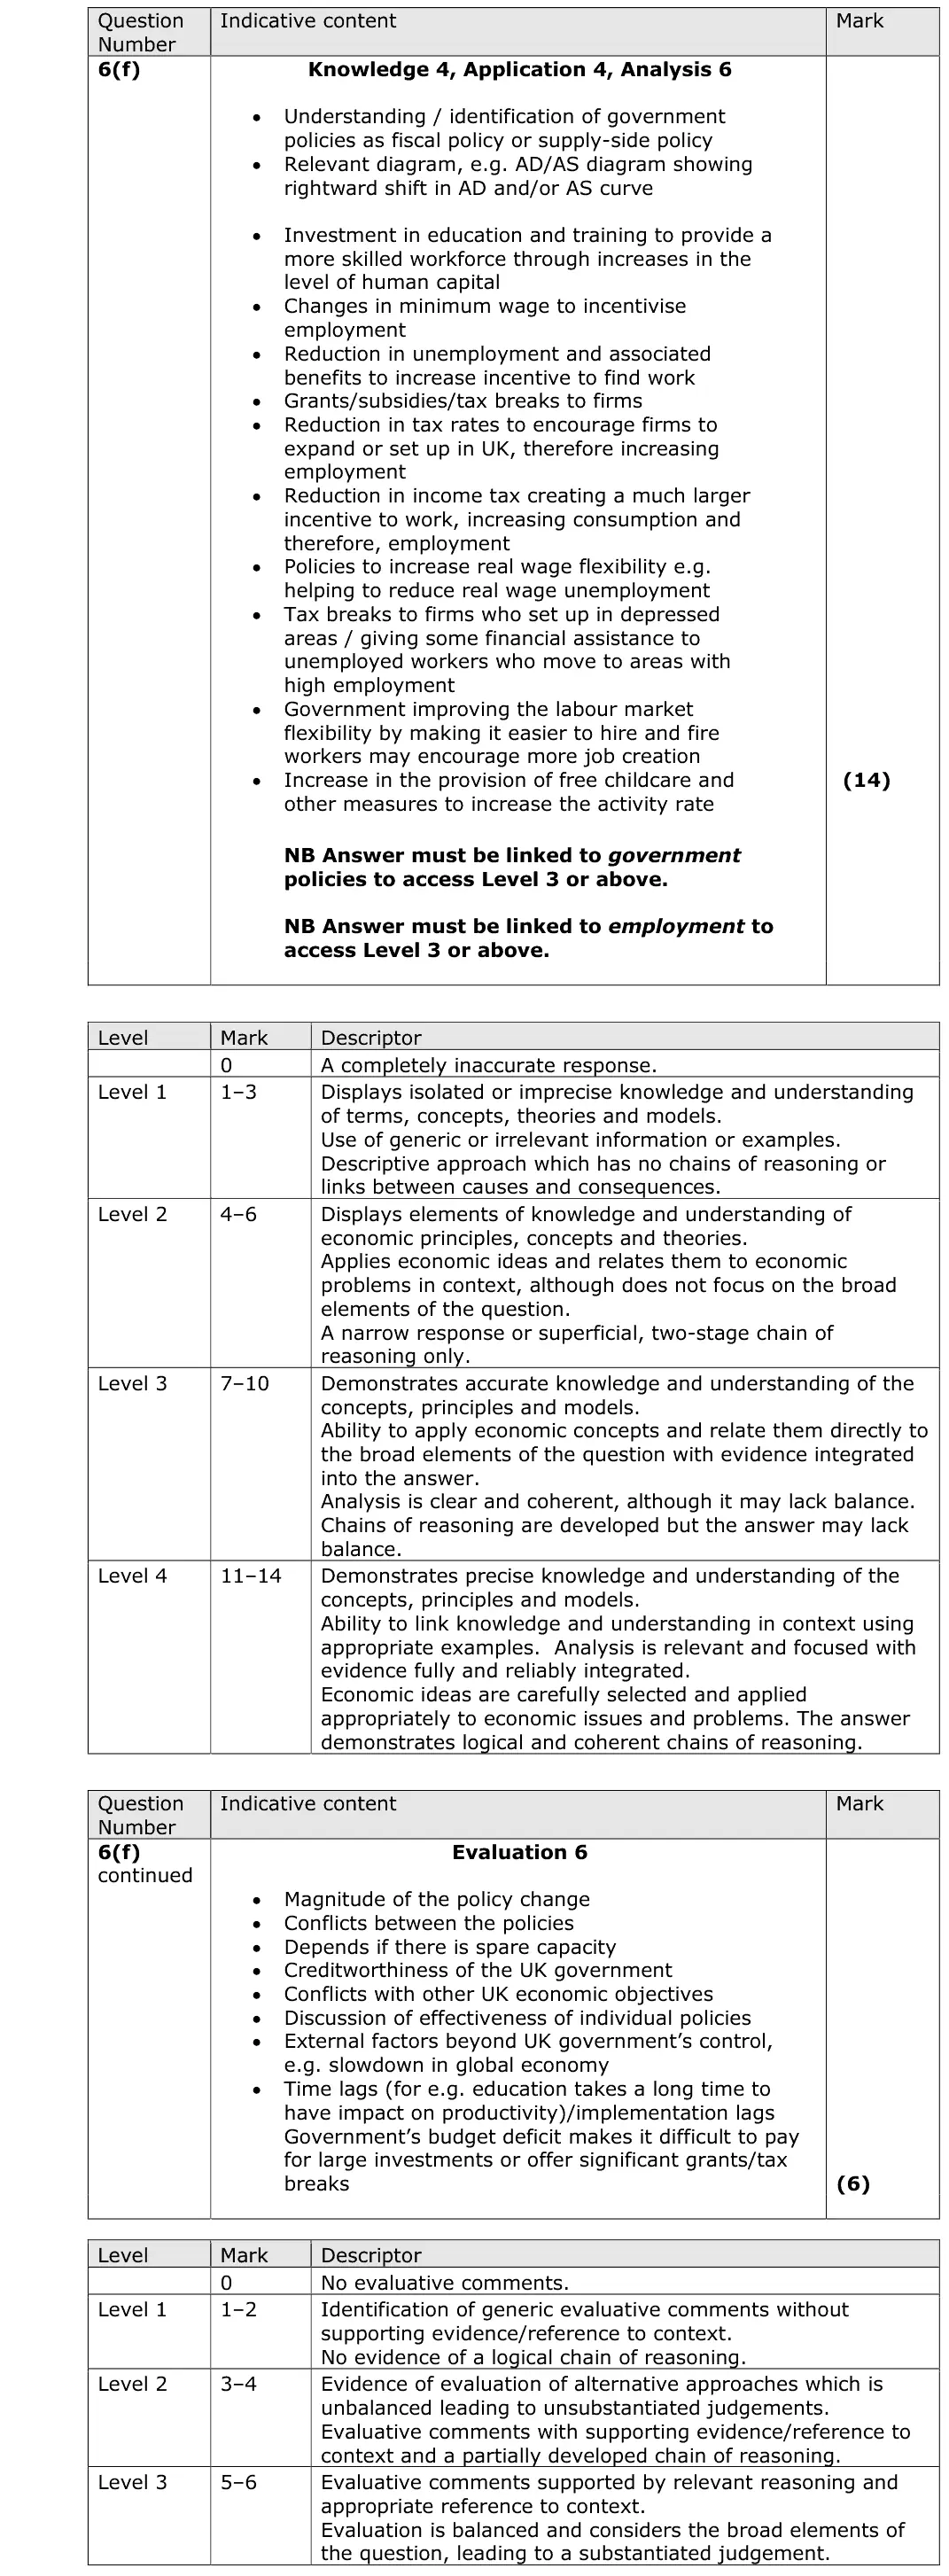
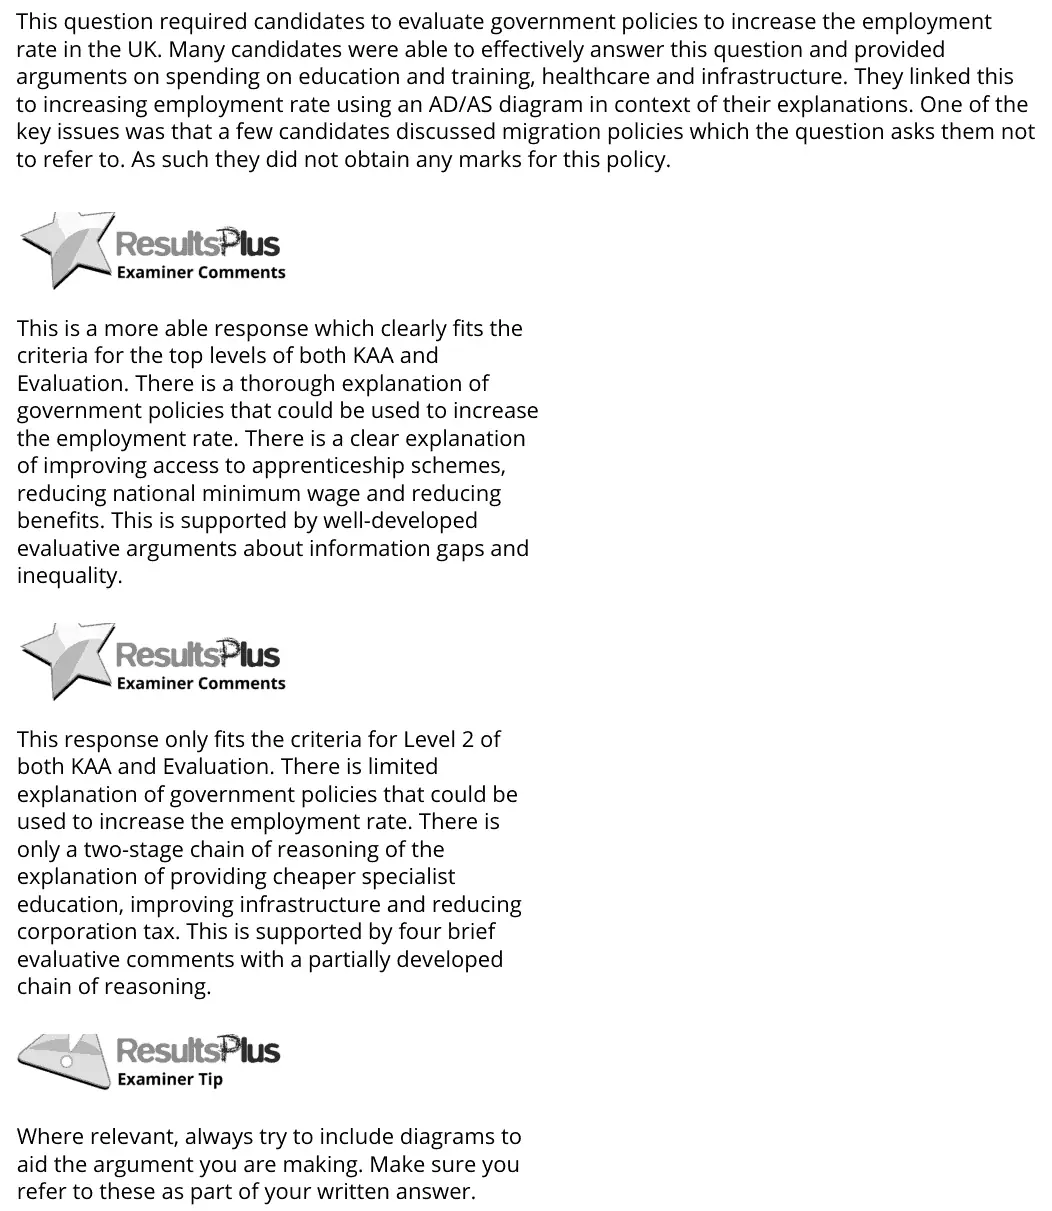
(f) Evaluate government policies, apart from migration policies, that could be used to increase the employment rate in the UK. (20)
June 2018 · AS Paper 2 · Q6(g) 20 marks AO1=4, AO2=4, AO3=6, AO4=6 20-mark essay Either/or Hard inflationmacroeconomic objectives
Data and extracts for question 6The UK economy Figure 1: Unemployment – International Labour Organisation (ILO) and the claimant count, millions, 2010-2016 3 2.5 2 Millions 1.5 1 0.5 0 2010 2011 2012 2013 2014 2015 2016 ILO Claimant count (Source: ONS Datasets, https://www.ons.gov.uk/) Figure 2: Household savings*, 2010-2015 12 % 10 8 6 4 2 0 2011 2012 2013 2014 2015 2010 * Savings as a percentage of household disposable income (Source: http://www.tradingeconomics.com/united-kingdom/personal-savings) Figure 3: UK average house prices, 2005–2016 220 200 180 160 140 0 2006 2008 2010 2012 2014 2016 (Source: http://www.telegraph.co.uk/property/house-prices/ the-state-of-the-uk-housing-market-in-five-charts/) Extract A Soaring house prices House prices are still rising rapidly. The average UK house price was £214 000 in June 2016, according to the Office for National Statistics (ONS). This is £24 000 more than it was at its peak in September 2007, just before the economic downturn. First-time buyers have experienced the largest rise in house prices. 5 Even the loss of consumer confidence over Britain’s vote to leave the EU did not stop house prices from rising – annual growth increased from 5.2% in July 2016 to 5.6% in August 2016. House price growth was the strongest in London, with annual average prices rising by 9.6%. However, in Wales average house prices actually fell by 0.5% during the same period. In its first post-Brexit referendum forecast, estate agency Countrywide 10 said that house prices will fall by 1% across the UK in 2017, before rising by 2% in 2018. Real household income in the UK fell by 10.4% in the years following the financial crisis. This increased the difference between real income and house prices. In 1997, a house cost little more than twice the average income. By early 2015, the average price of a house was five times the average annual income. 15 The rate of home ownership for 25 to 34-year-olds has fallen to 35.8% over the last twenty-five years as houses became less affordable. First-time buyers have to wait longer to save up for a house deposit. Conversely, home ownership has risen to 78.6% among those aged 65 to 74. (Source: adapted from ‘The state of the UK housing market in five charts’, The Telegraph, http://www.telegraph.co.uk/property/house-prices/ the-state-of-the-uk-housing-market-in-five-charts/; ‘UK house price growth slows as demand cools after Brexit vote’, The Guardian, https://www.theguardian.com/business/2016/sep/30/uk-house- price-growth-slows-demand-cools-brexit-vote-nationwide) Extract B UK migration trends in the year ending June 2016 Inward migration levels are among the highest ever recorded with an estimated 650 000 people moving to the UK. This is an increase of around 11 000 from the previous year. Employment remains the most common reason for long-term migration (312 000) to the UK, with around 182 000 of these coming with a definite job and 130 000 looking for 5 work. Long-term migration to the UK for study was estimated to be 163 000. In addition, 80 000 long-term migrants arrived in the UK to accompany their families. There were 41 280 refugees applying for asylum, including dependants, of which 10 547 people were granted asylum. Asylum applicants cannot usually accept offers of employment while 10 their case is being processed. (Source: adapted from ‘Migration Statistics Quarterly Report: December 2016’, ONS, https:// www.ons.gov.uk/peoplepopulationandcommunity/populationandmigration/ internationalmigration/bulletins/migrationstatisticsquarterlyreport/dec2016)
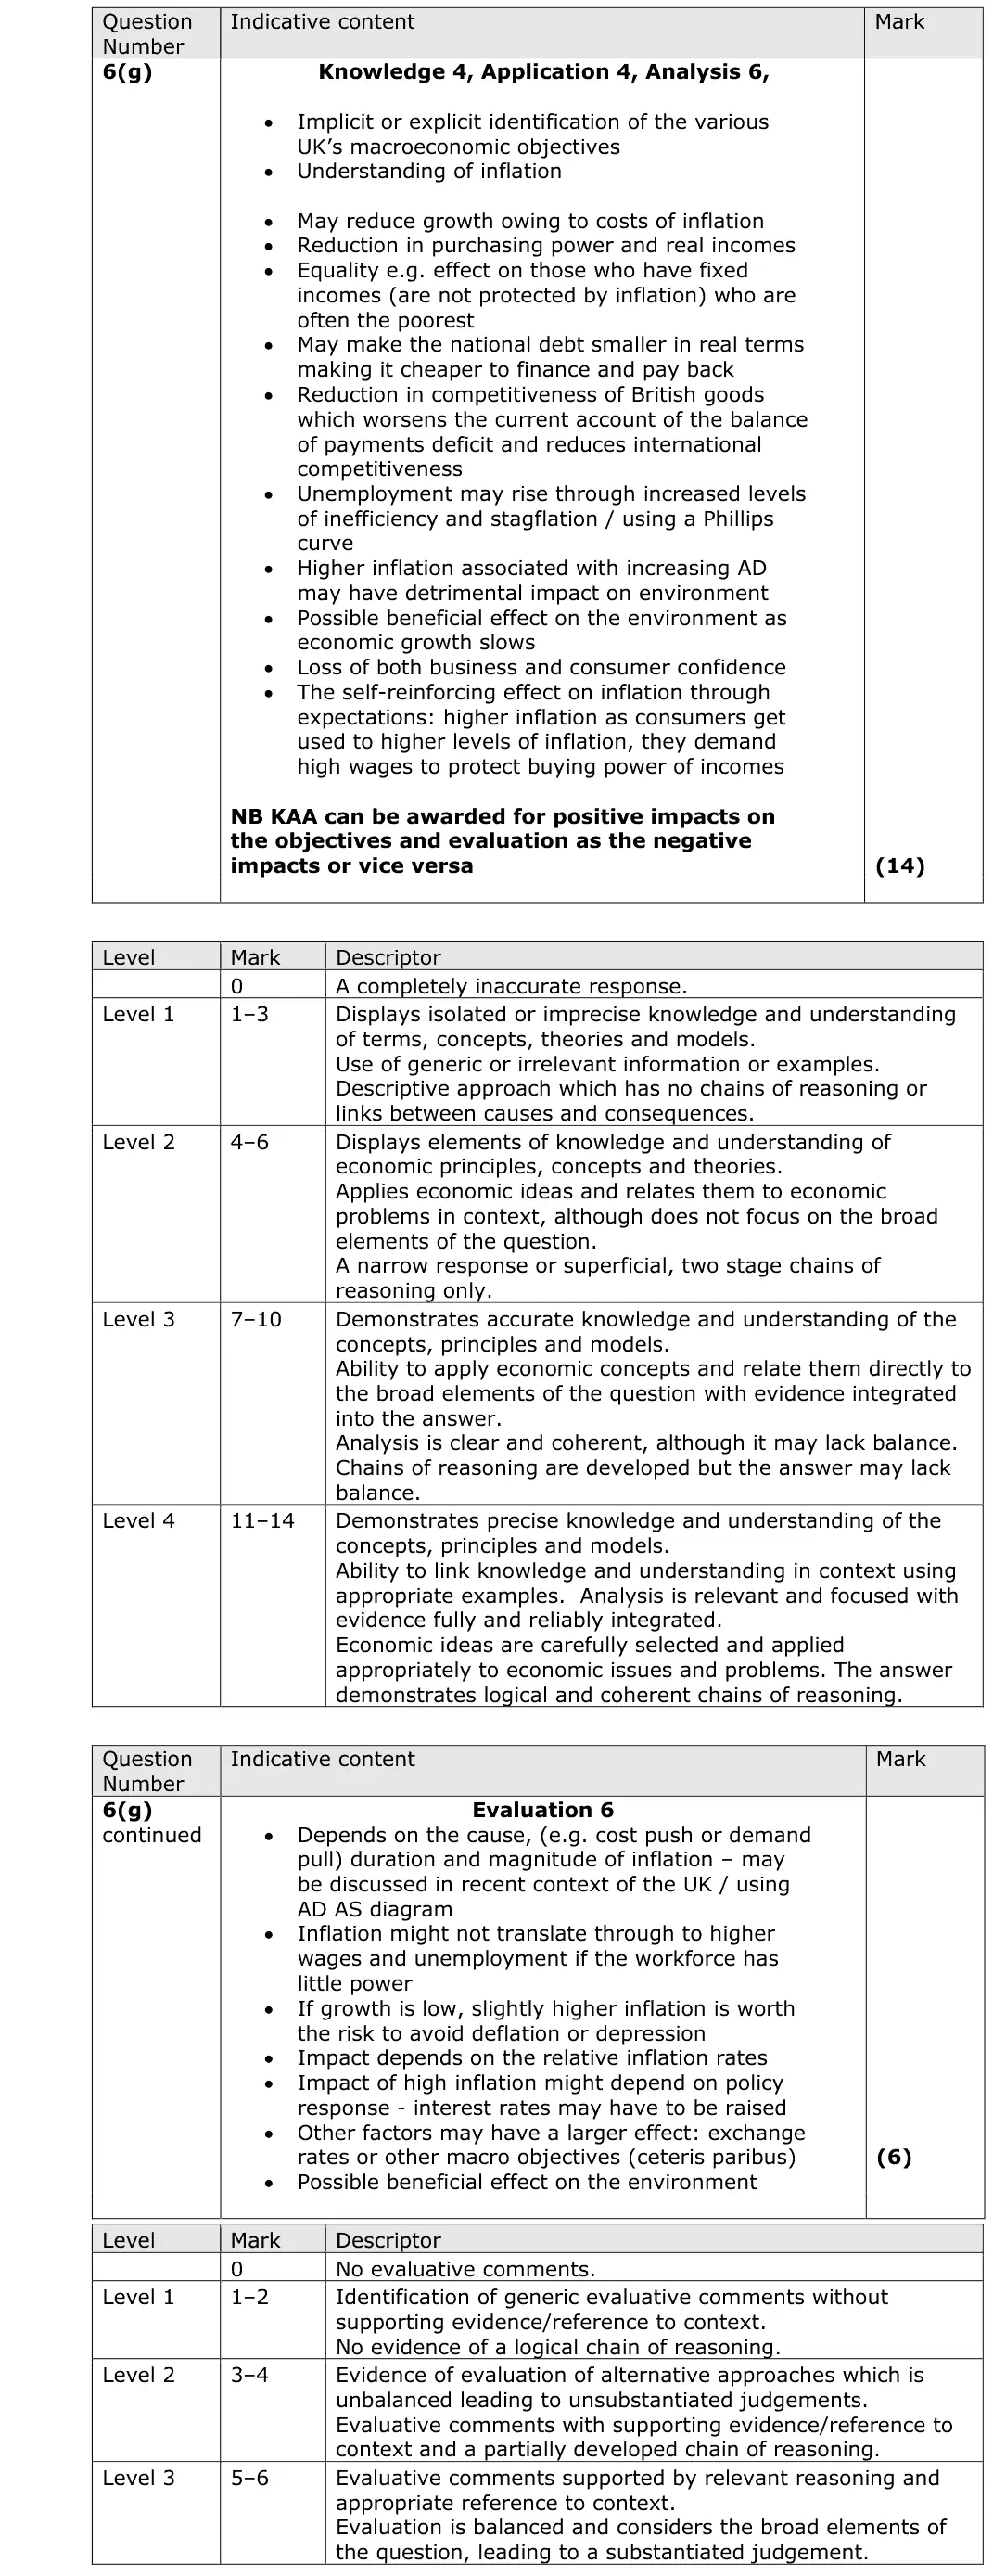
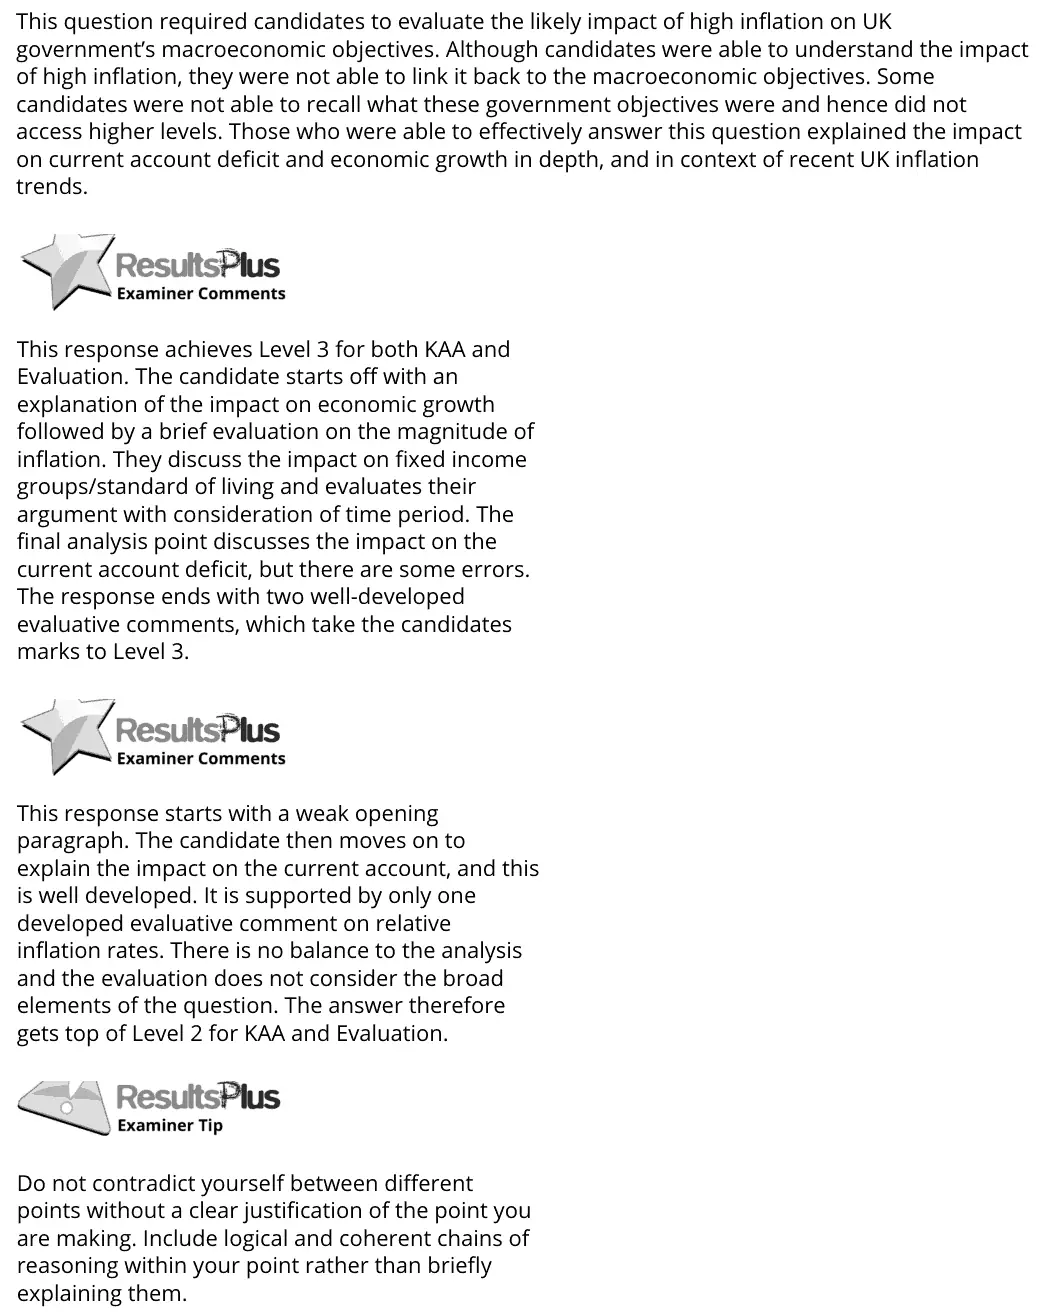
(g) Evaluate the likely impact of high inflation on the UK government’s macroeconomic objectives. (20)

Work with an Edexcel economics tutor

Want a paper marked and gone through with you? Message us.

Prefer email? Send an enquiry

If you are under 18, please include a parent's contact details. Enquiries go to enquiries@economicsaleveltutor.com and are deleted once handled. All tutoring is online.