June 2017: Paper 3

100 marks · 10 question parts · Paper, mark scheme and report on Pearson's site

Question by question

QTopicMarksAOType
1(a) Exchange rates 5AO1=2,AO2=2,AO3=1Short answer
1(b) Market failure and externalities 8AO1=2,AO2=2,AO3=2,AO4=2Extended response
1(c) Emerging and developing economies 12AO1=2,AO2=2,AO3=4,AO4=4Extended response
1(d) Emerging and developing economies, Supply-side policies 25AO1=4,AO2=4,AO3=8,AO4=9Essay
1(e) Aggregate demand, The circular flow, national income and the multiplier 25AO1=4,AO2=4,AO3=8,AO4=9Essay
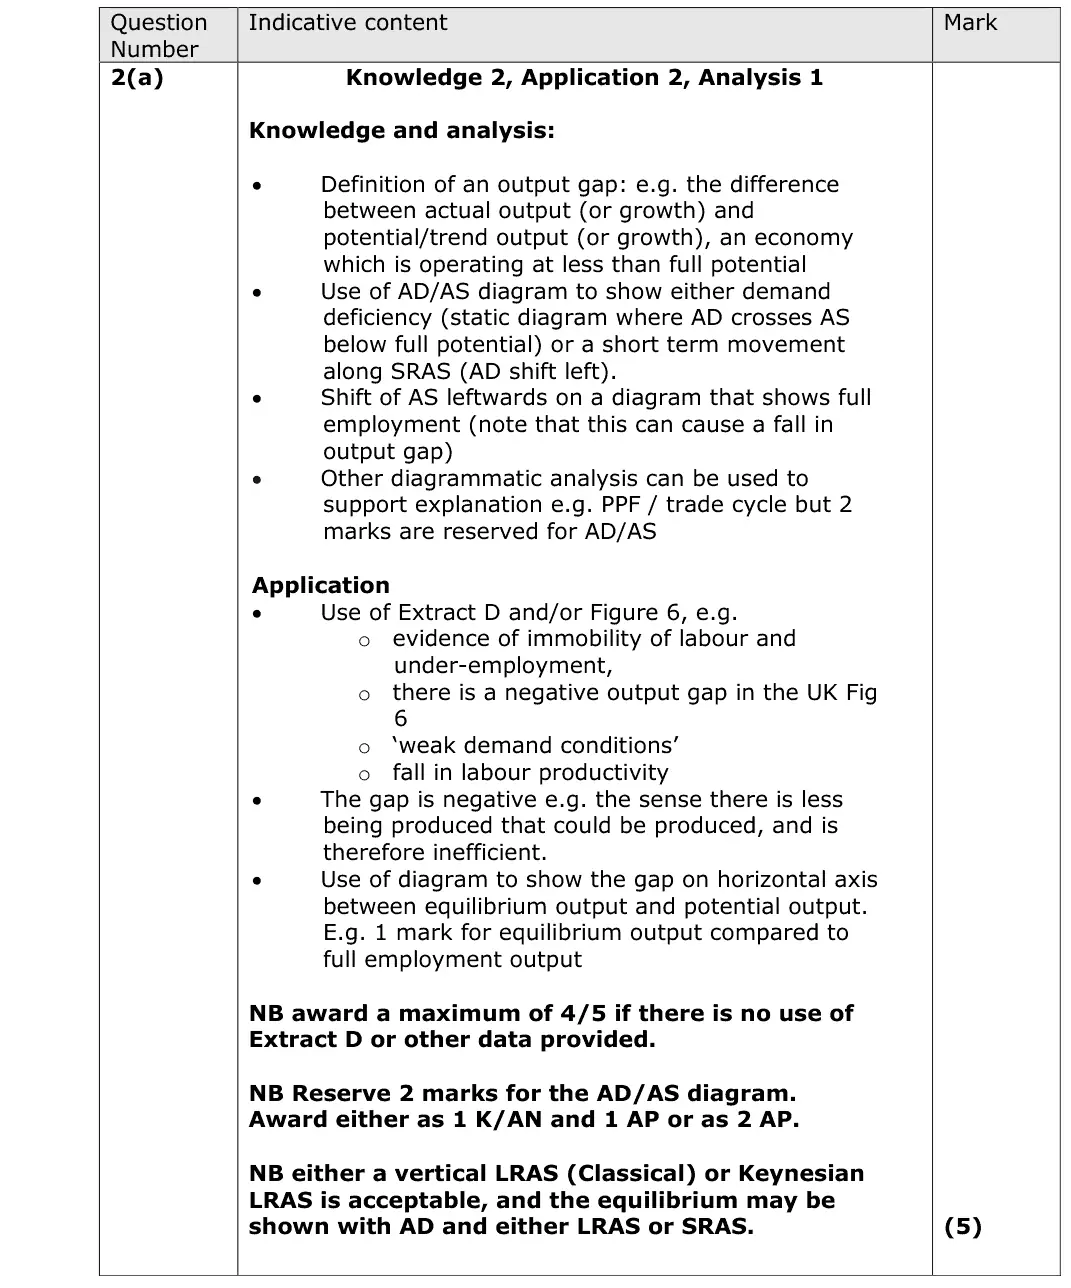
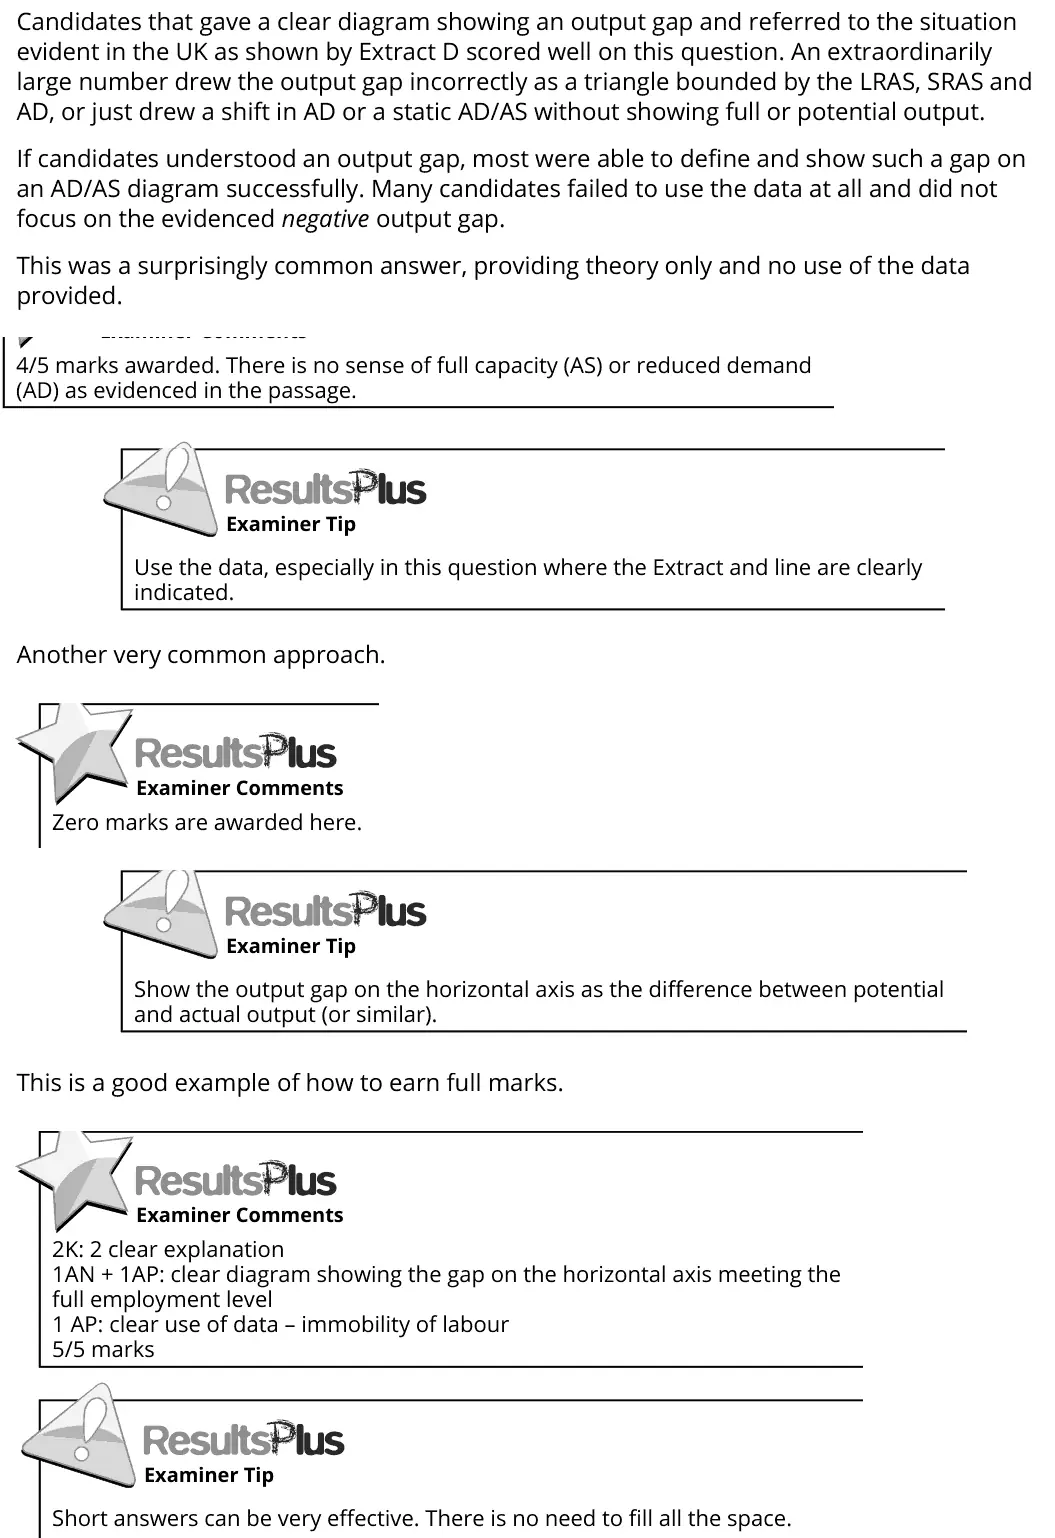
2(a) Economic growth, output gaps and the trade cycle 5AO1=2,AO2=2,AO3=1Diagram
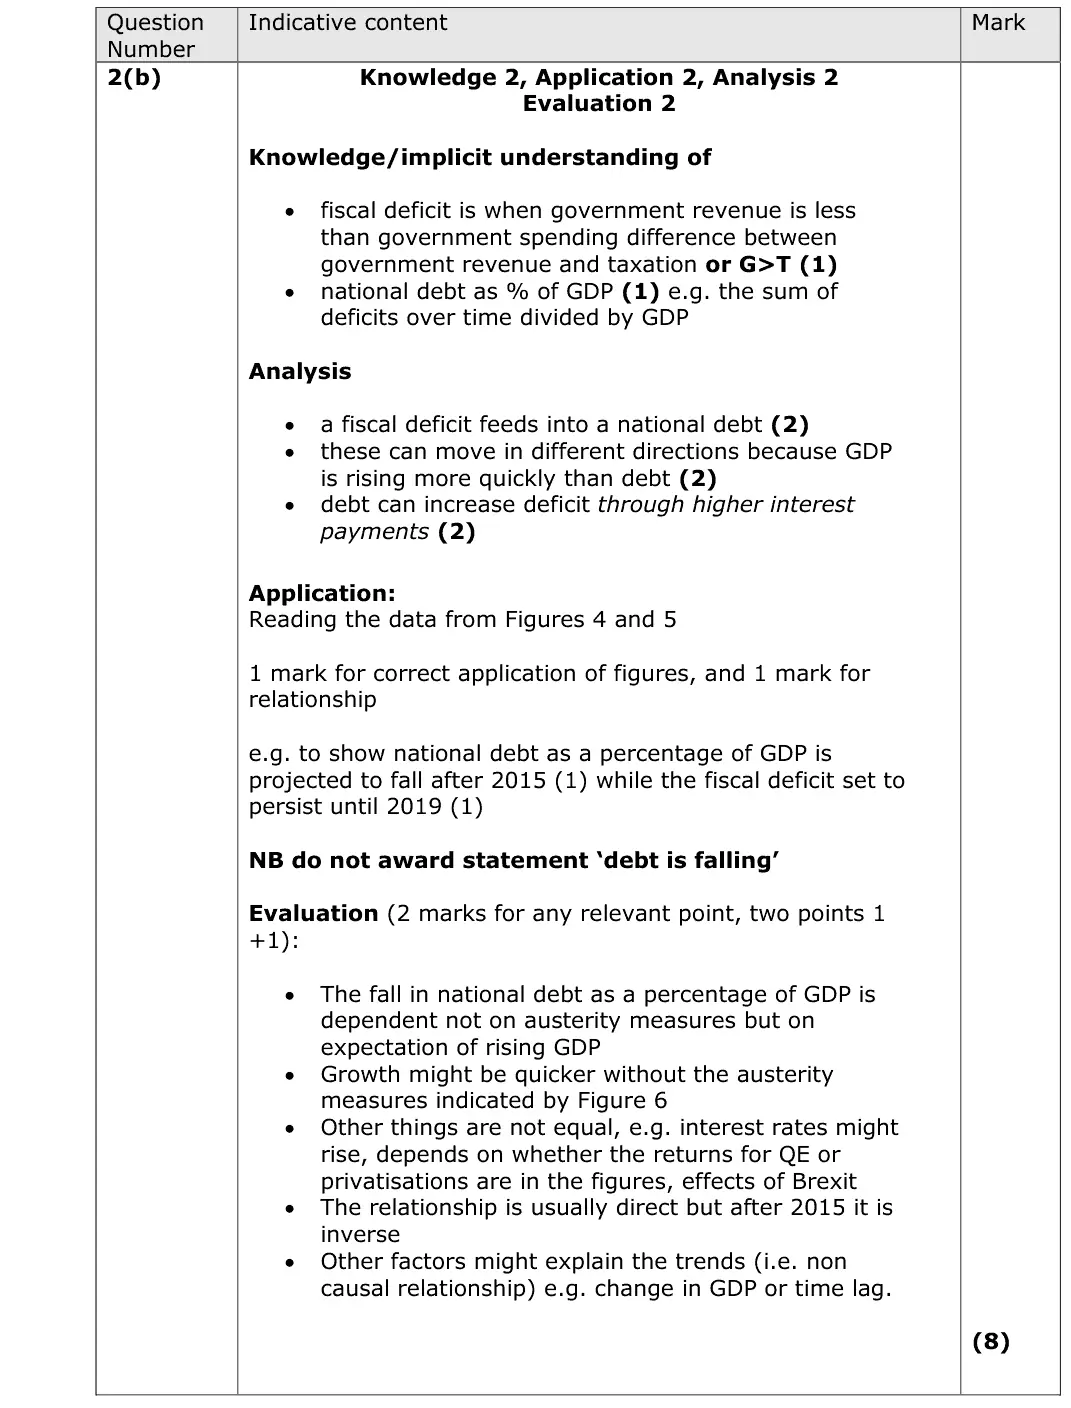
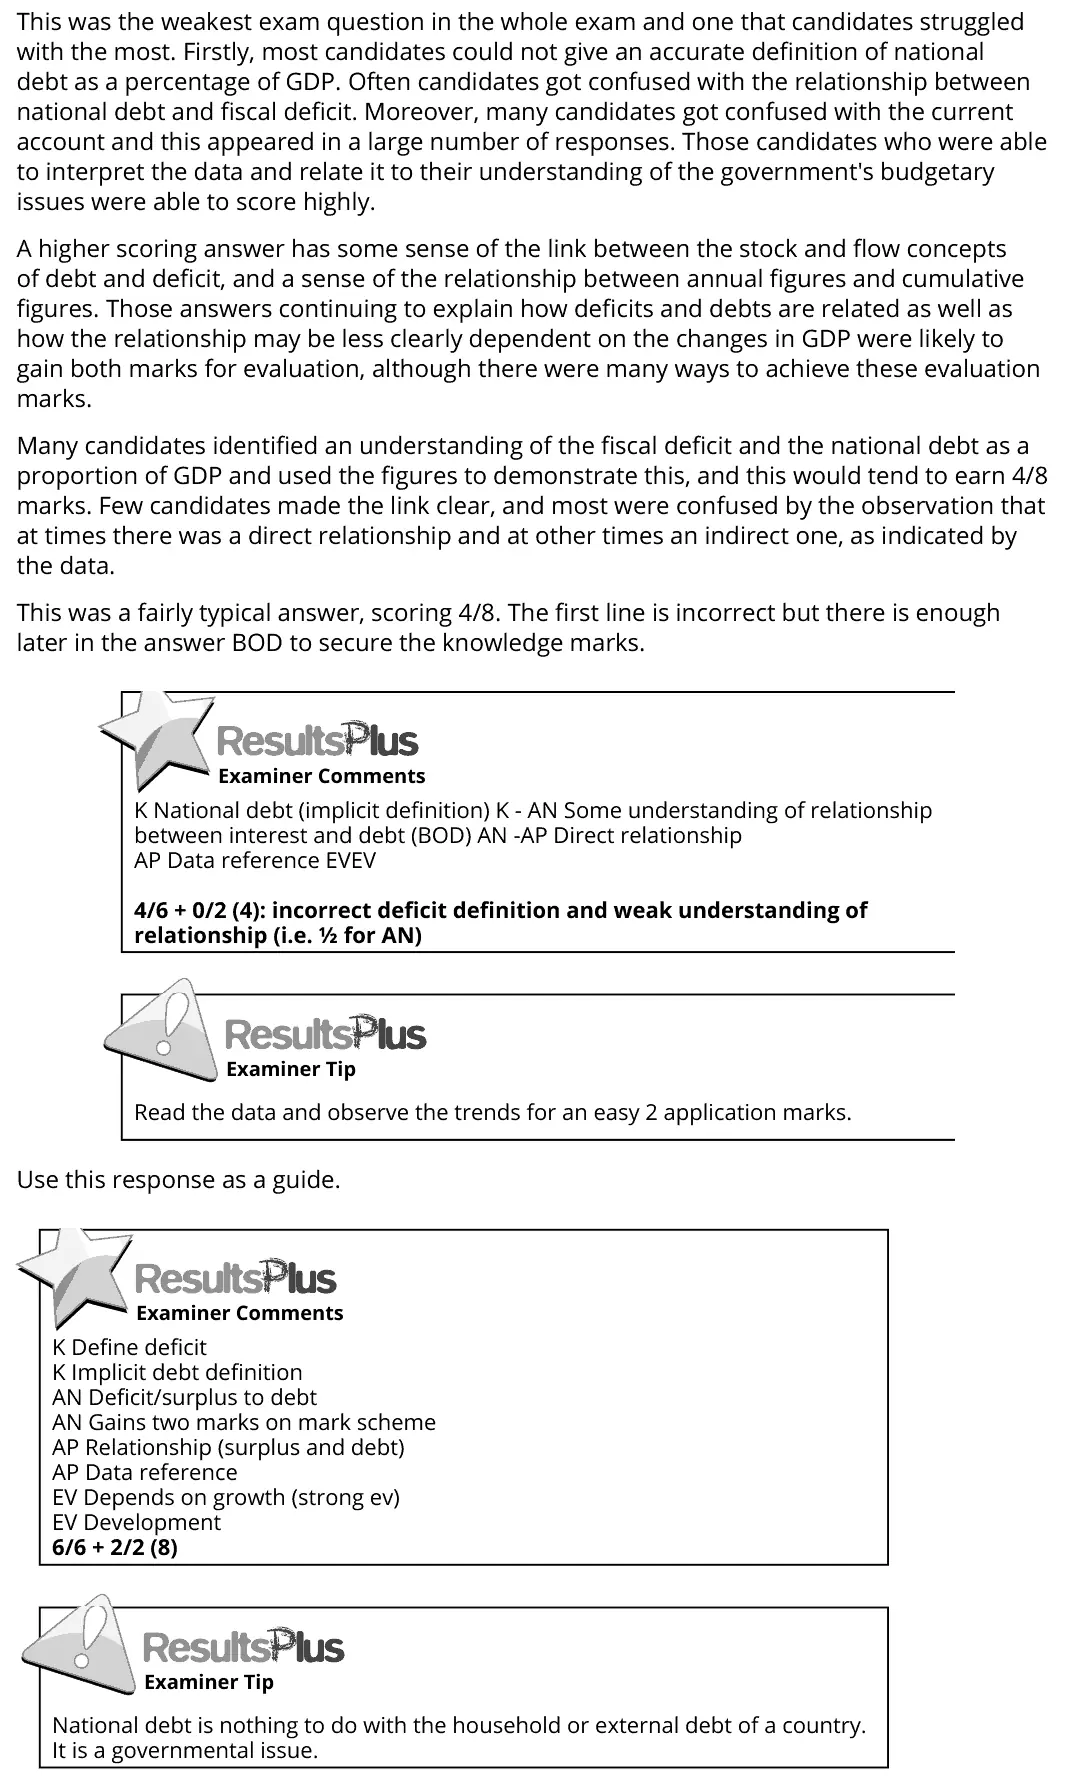
2(b) Public expenditure, taxation and public sector finances 8AO1=2,AO2=2,AO3=2,AO4=2Extended response
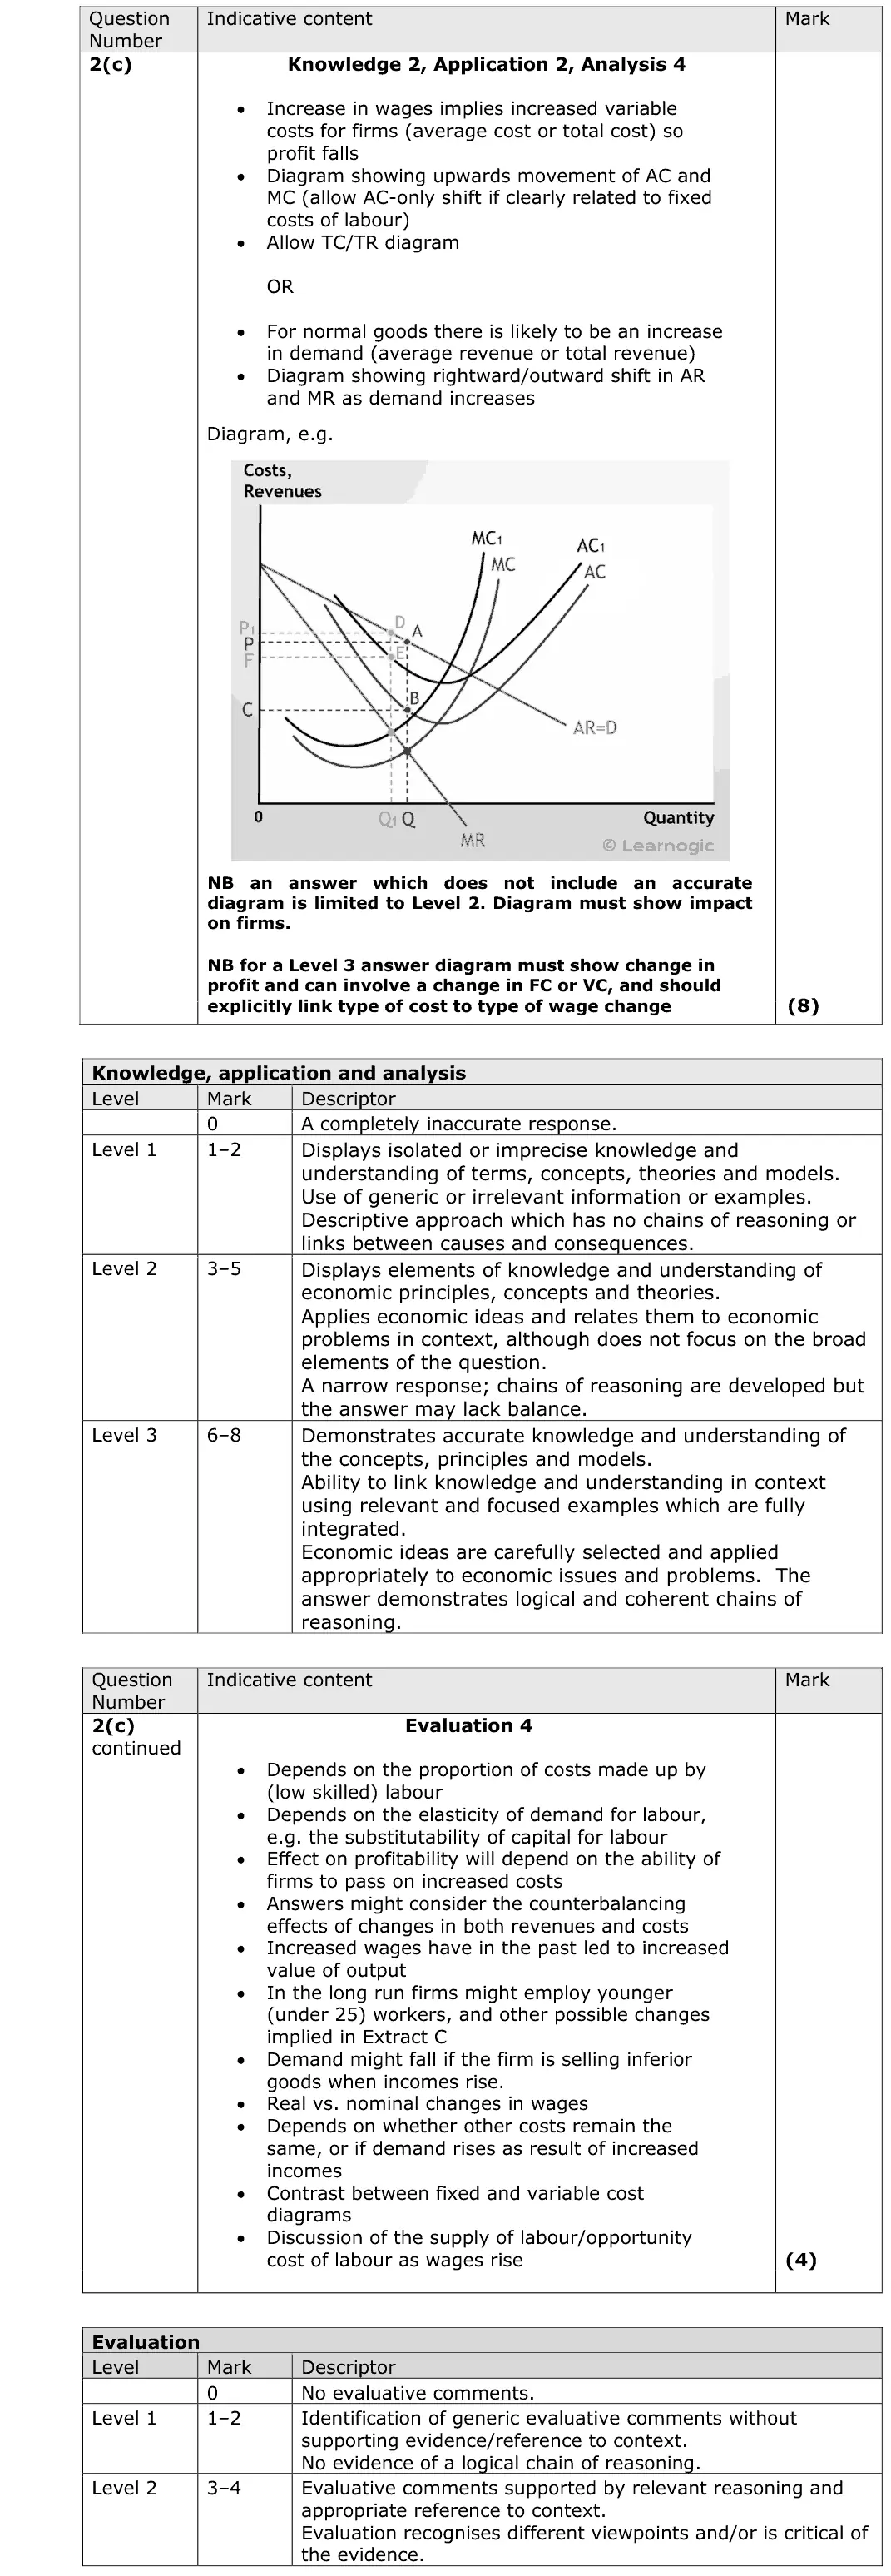
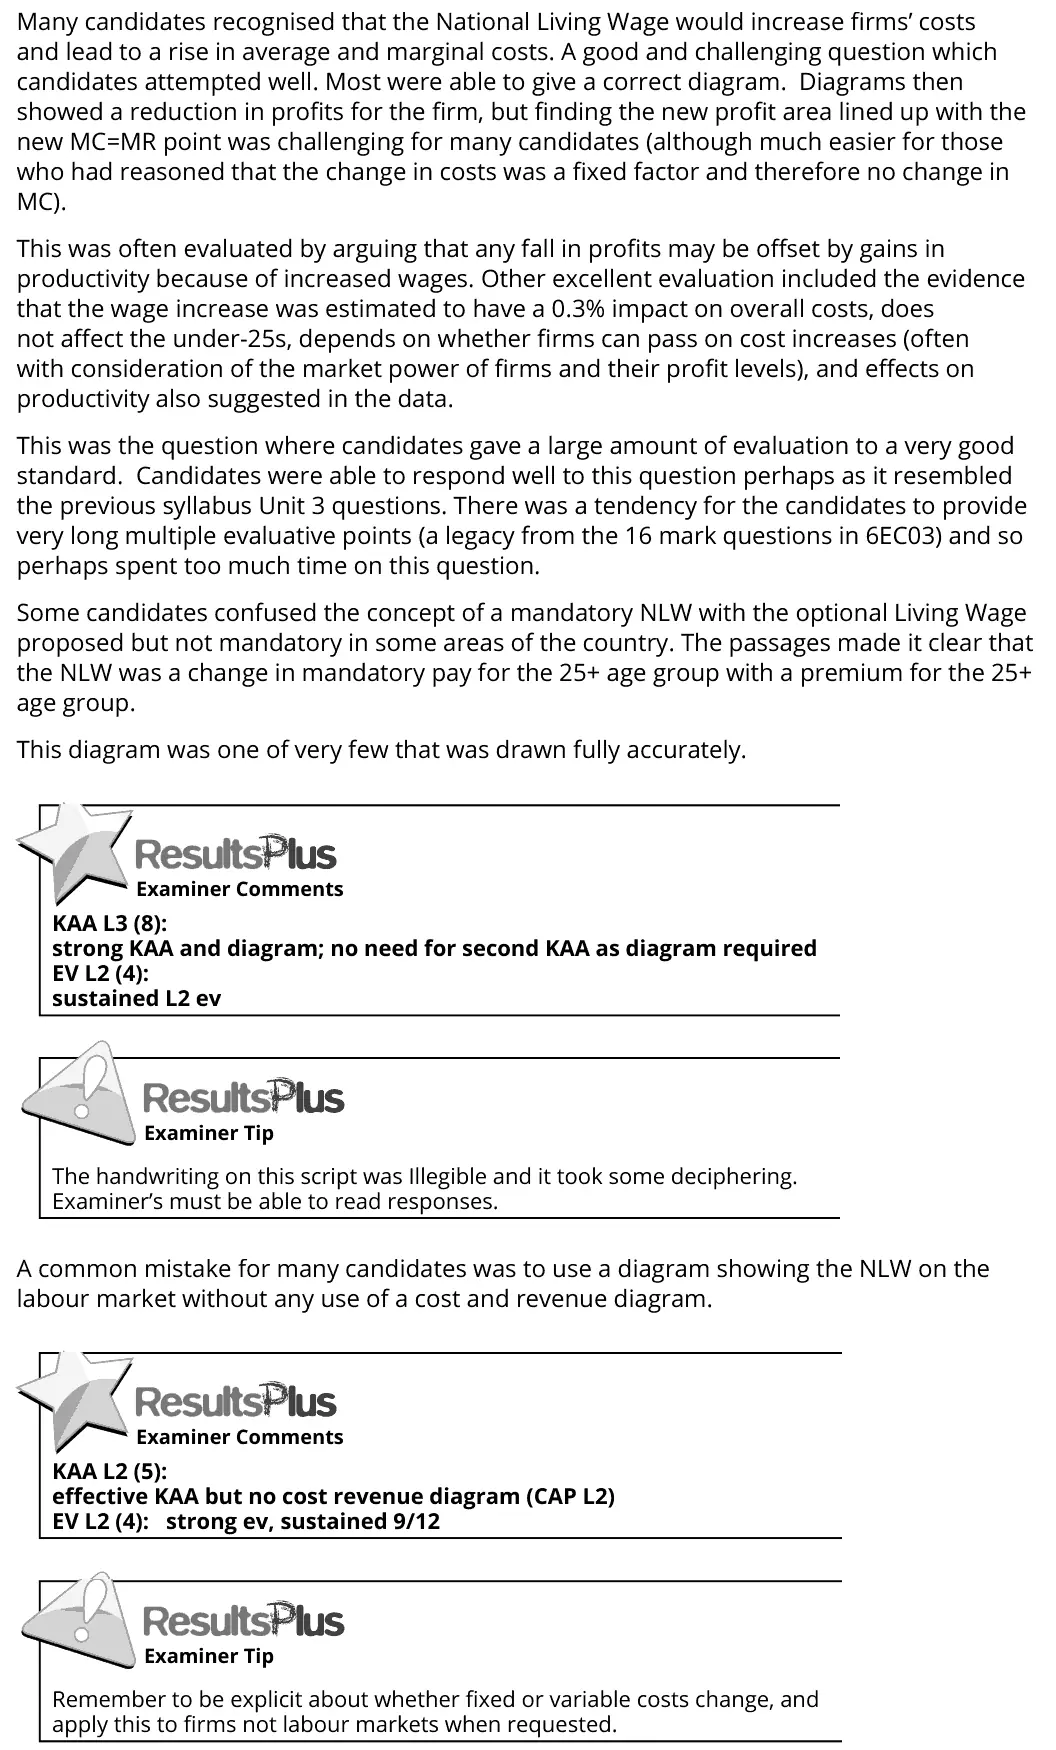
2(c) Revenues, costs and profits 12AO1=2,AO2=2,AO3=4,AO4=4Extended response
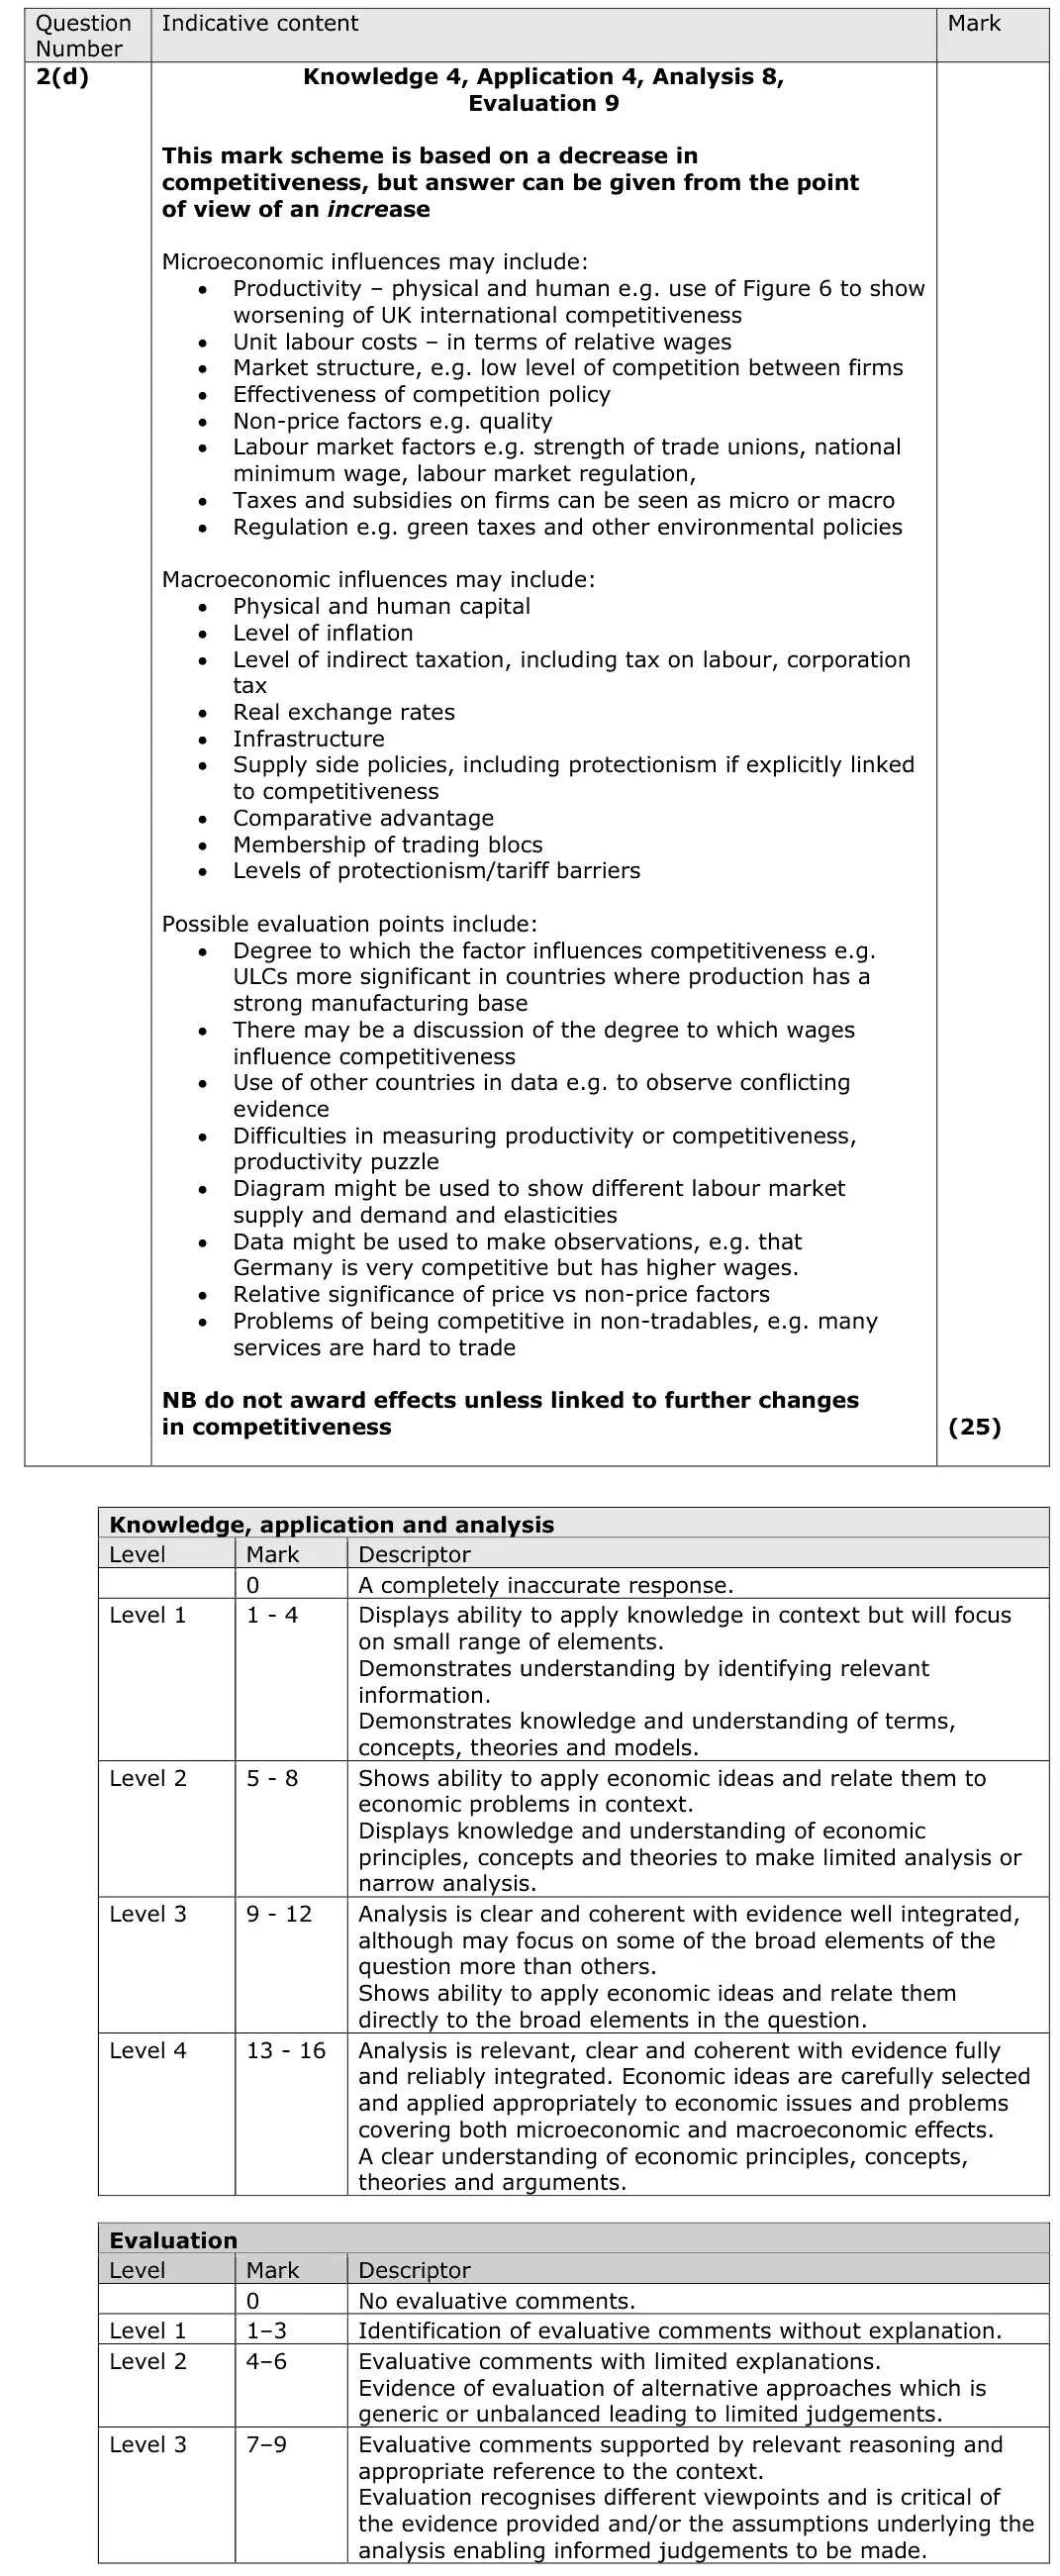
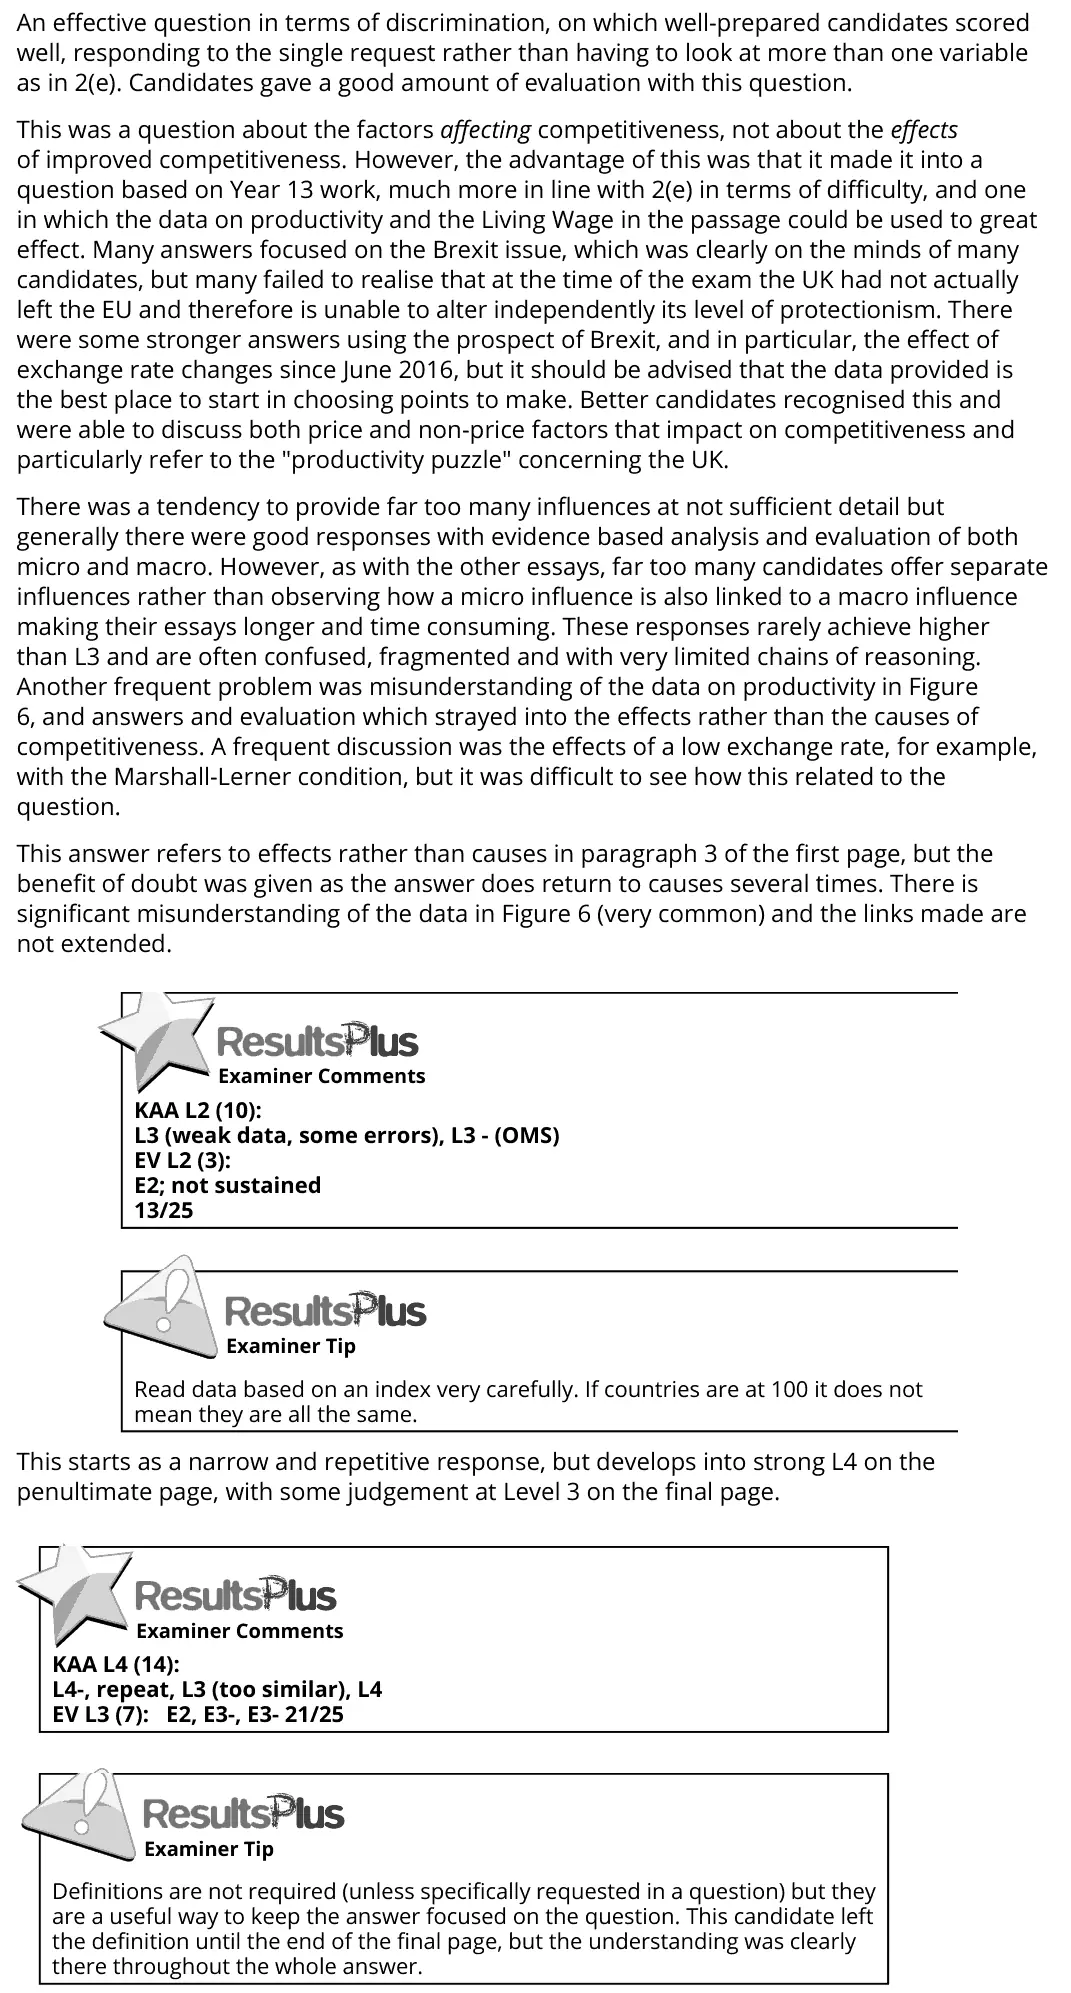
2(d) International competitiveness 25AO1=4,AO2=4,AO3=8,AO4=9Essay
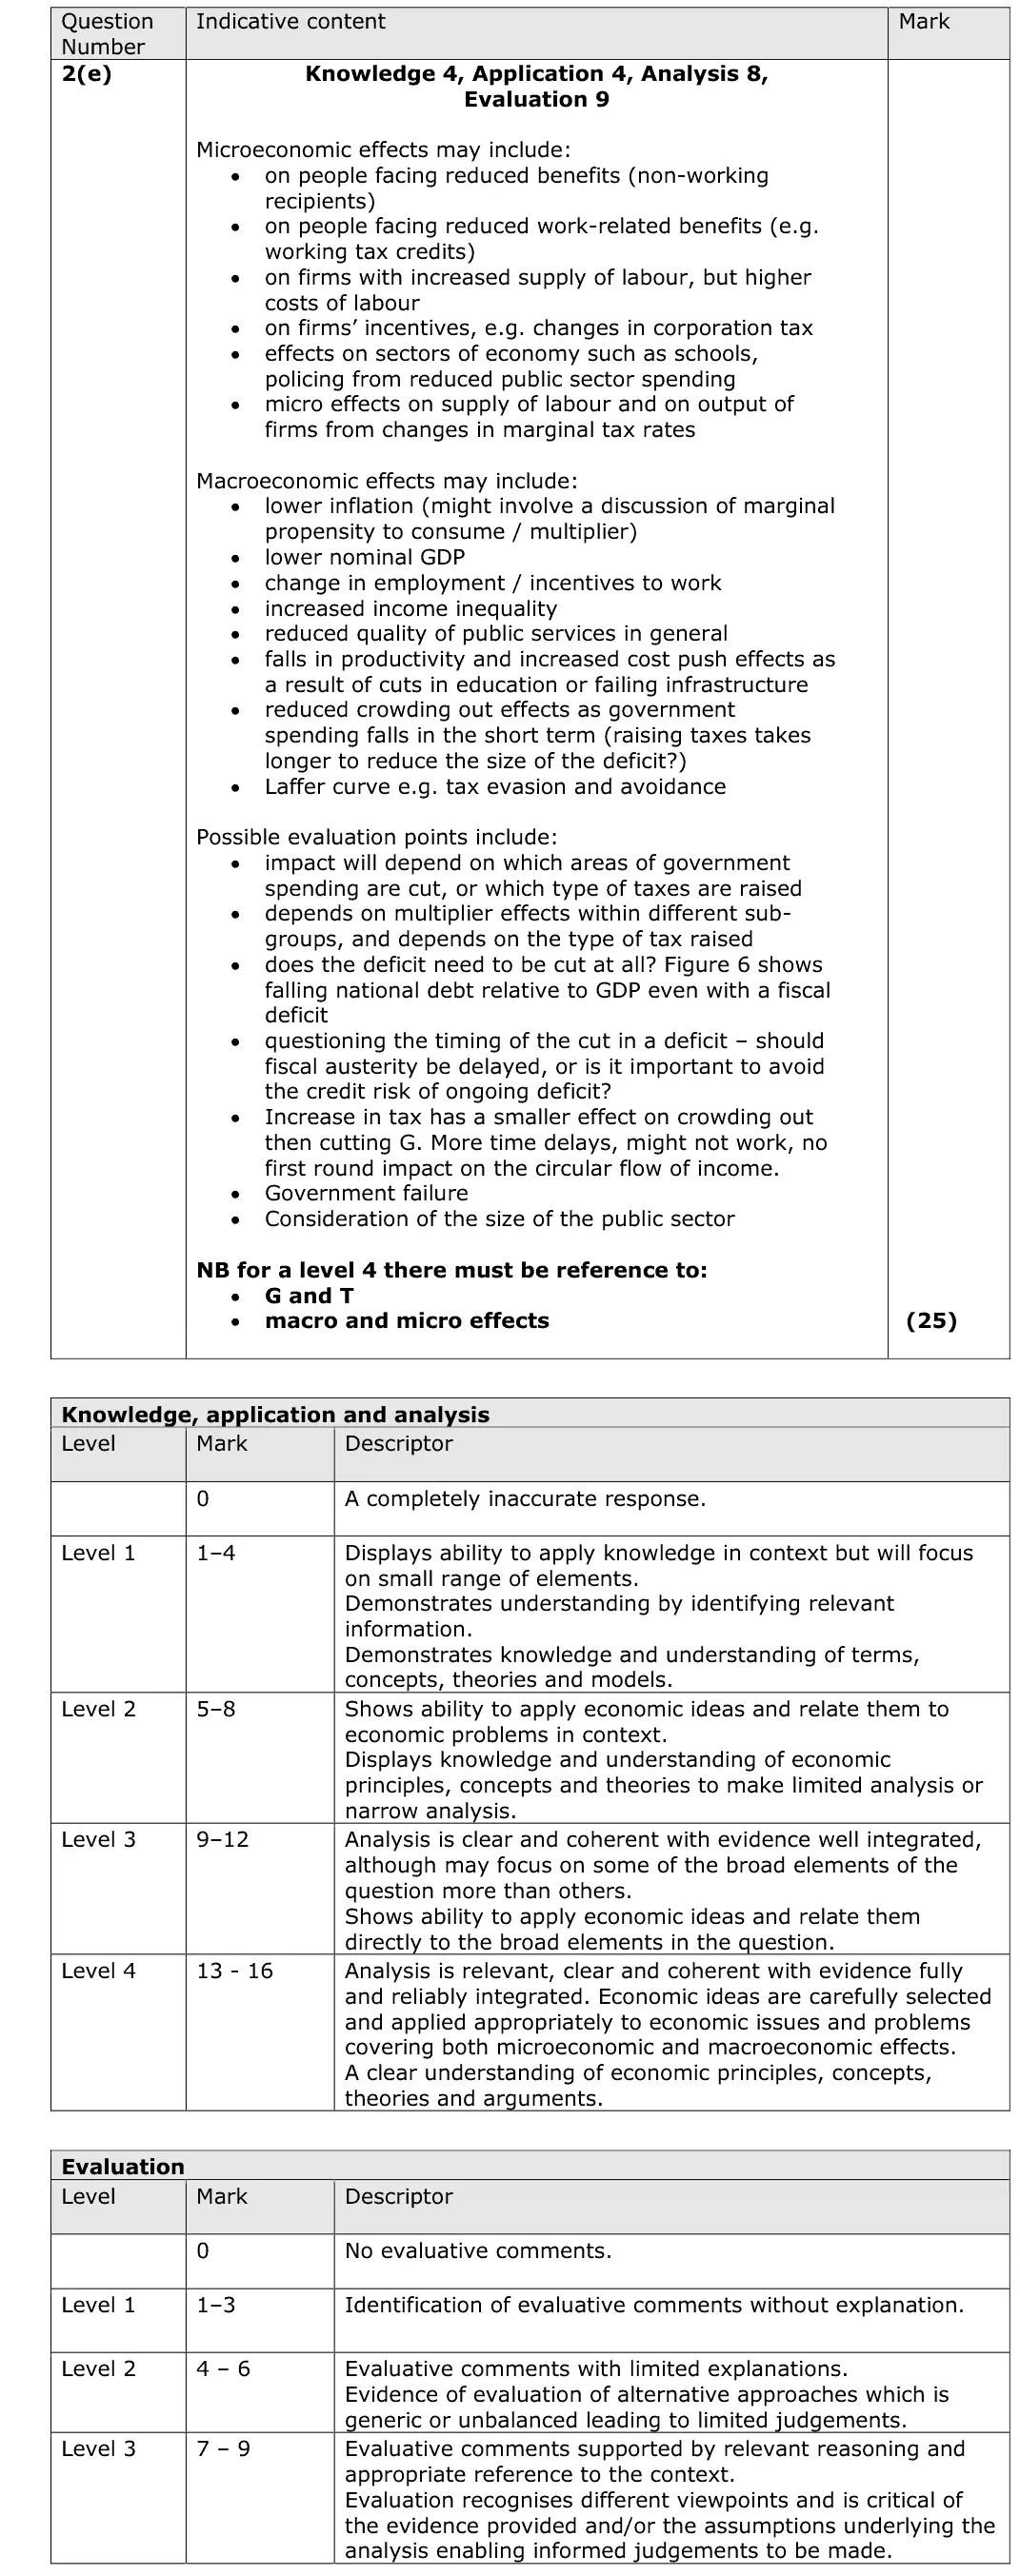
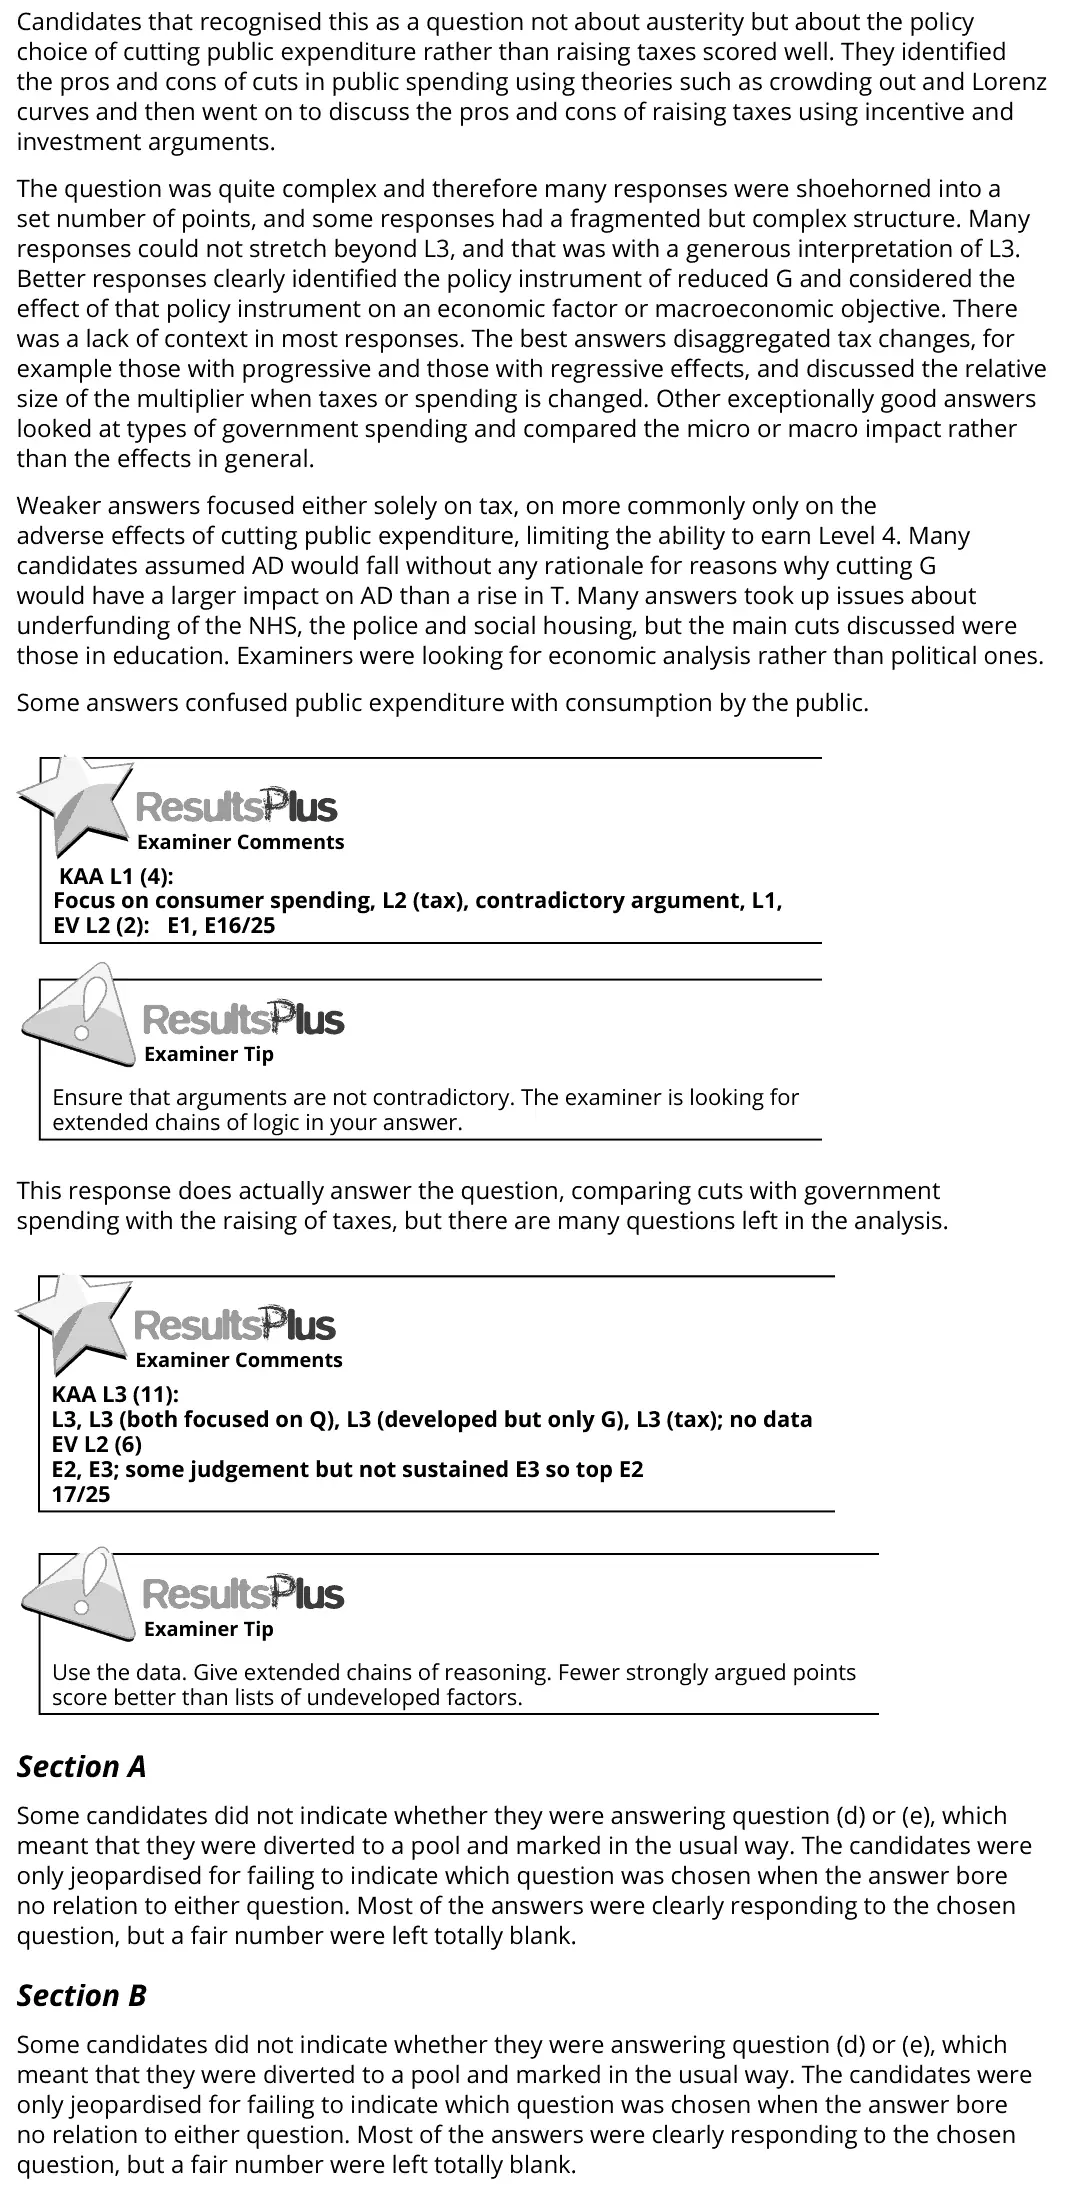
2(e) Public expenditure, taxation and public sector finances 25AO1=4,AO2=4,AO3=8,AO4=9Essay

The questions

1(a)1(b)1(c)1(d)1(e)2(a)2(b)2(c)2(d)2(e)
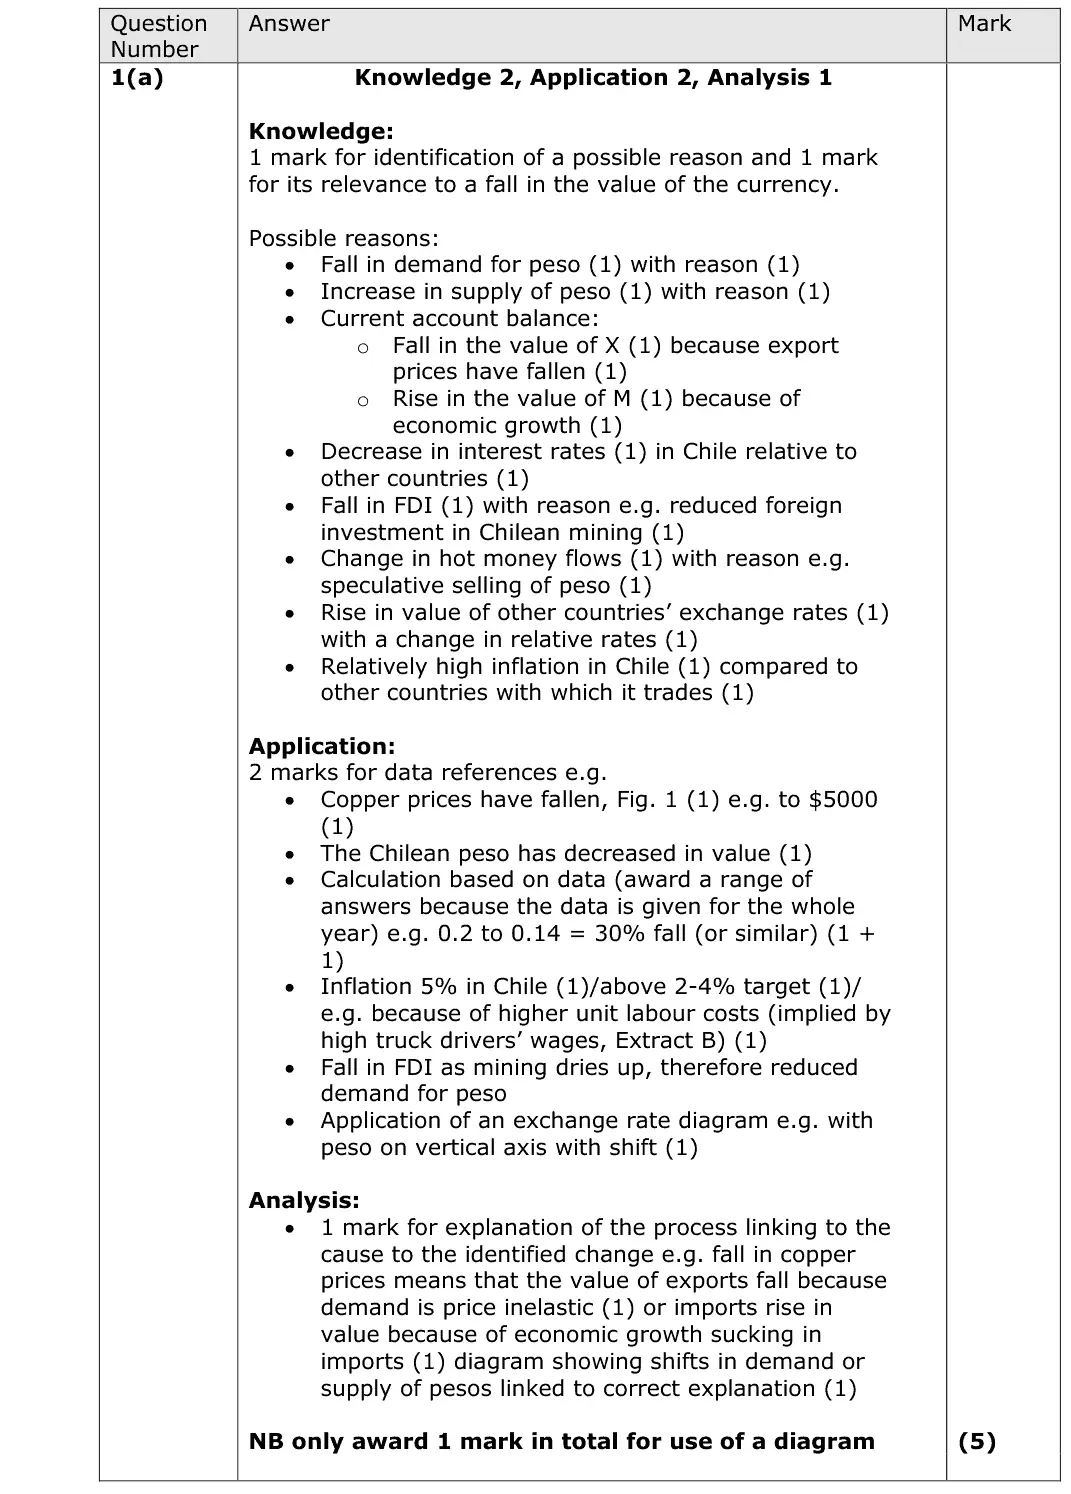
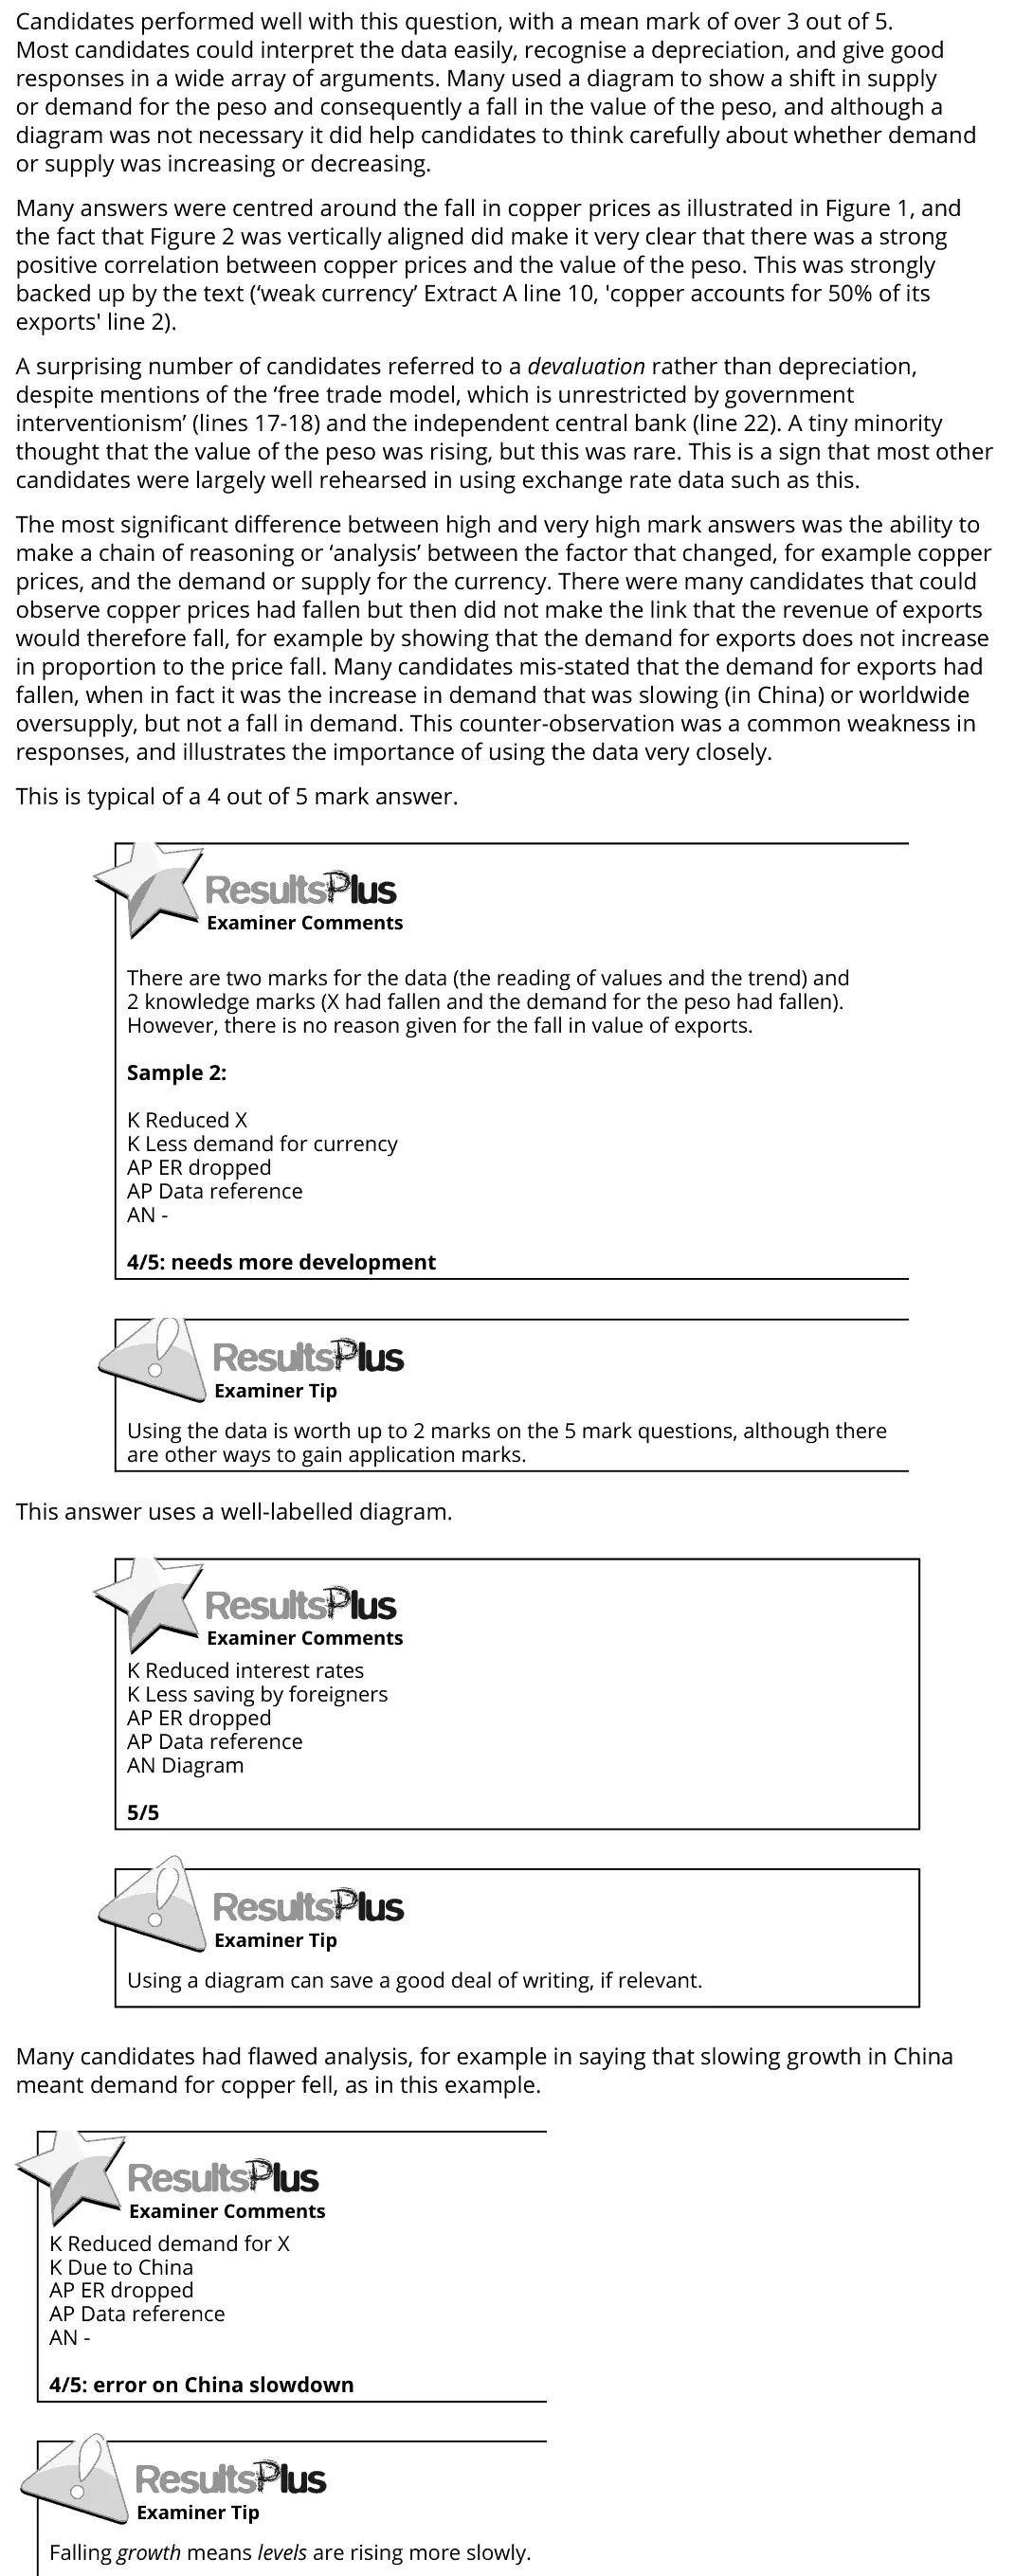
June 2017 · Paper 3 · Q1(a) 5 marks AO1=2, AO2=2, AO3=1 Short answer exchange rates
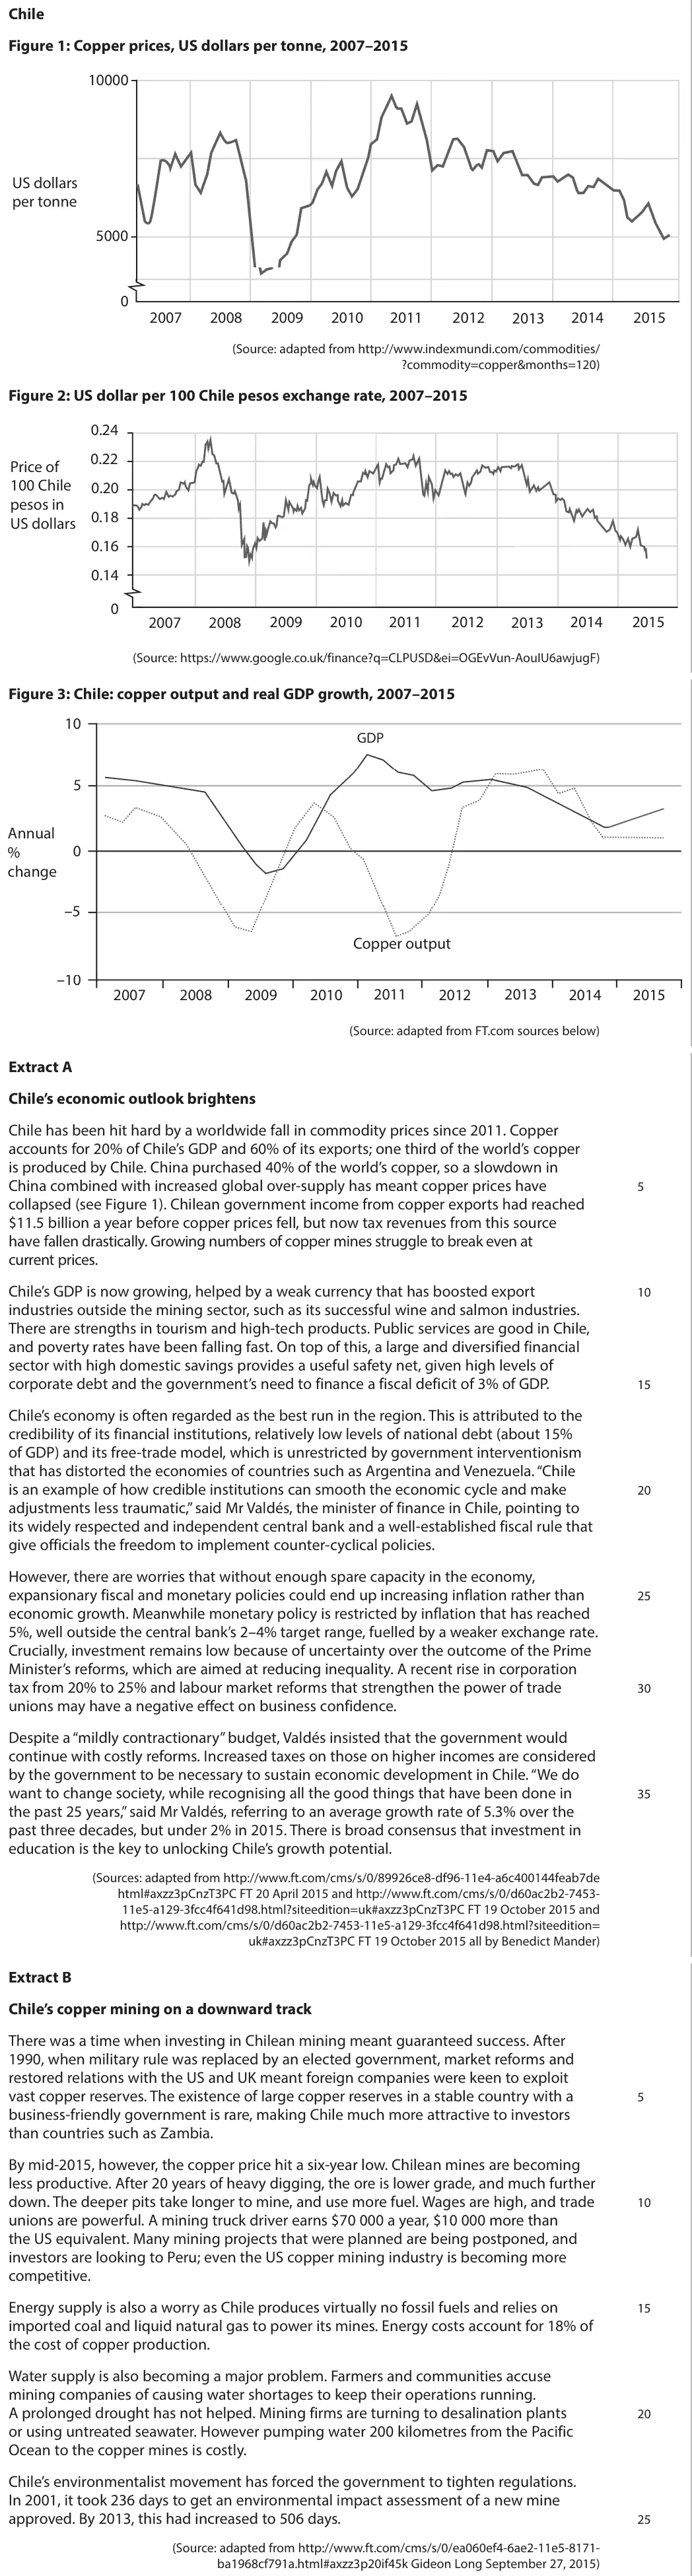
Data and extracts for question 1Chile Figure 1: Copper prices, US dollars per tonne, 2007–2015 10000 US dollars per tonne 5000 0 2007 2008 2009 2010 2011 2012 2014 2015 2013 (Source: adapted from http://www.indexmundi.com/commodities/ ?commodity=copper&months=120) Figure 2: US dollar per 100 Chile pesos exchange rate, 2007–2015 0.24 0.22 Price of 100 Chile 0.20 pesos in 0.18 US dollars 0.16 0.14 0 2007 2008 2009 2010 2011 2012 2013 2014 2015 (Source: https://www.google.co.uk/finance?q=CLPUSD&ei=OGEvVun-AouIU6awjugF) Figure 3: Chile: copper output and real GDP growth, 2007–2015 10 GDP 5 Annual 0 % change –5 Copper output –10 2013 2007 2008 2009 2010 2011 2012 2014 2015 (Source: adapted from FT.com sources below) Extract A Chile’s economic outlook brightens Chile has been hit hard by a worldwide fall in commodity prices since 2011. Copper accounts for 20% of Chile’s GDP and 60% of its exports; one third of the world’s copper is produced by Chile. China purchased 40% of the world’s copper, so a slowdown in China combined with increased global over-supply has meant copper prices have 5 collapsed (see Figure 1). Chilean government income from copper exports had reached $11.5 billion a year before copper prices fell, but now tax revenues from this source have fallen drastically. Growing numbers of copper mines struggle to break even at current prices. Chile’s GDP is now growing, helped by a weak currency that has boosted export 10 industries outside the mining sector, such as its successful wine and salmon industries. There are strengths in tourism and high-tech products. Public services are good in Chile, and poverty rates have been falling fast. On top of this, a large and diversified financial sector with high domestic savings provides a useful safety net, given high levels of corporate debt and the government’s need to finance a fiscal deficit of 3% of GDP. 15 Chile’s economy is often regarded as the best run in the region. This is attributed to the credibility of its financial institutions, relatively low levels of national debt (about 15% of GDP) and its free-trade model, which is unrestricted by government interventionism that has distorted the economies of countries such as Argentina and Venezuela. “Chile is an example of how credible institutions can smooth the economic cycle and make 20 adjustments less traumatic,” said Mr Valdés, the minister of finance in Chile, pointing to its widely respected and independent central bank and a well-established fiscal rule that give officials the freedom to implement counter-cyclical policies. However, there are worries that without enough spare capacity in the economy, expansionary fiscal and monetary policies could end up increasing inflation rather than 25 economic growth. Meanwhile monetary policy is restricted by inflation that has reached 5%, well outside the central bank’s 2–4% target range, fuelled by a weaker exchange rate. Crucially, investment remains low because of uncertainty over the outcome of the Prime Minister’s reforms, which are aimed at reducing inequality. A recent rise in corporation tax from 20% to 25% and labour market reforms that strengthen the power of trade 30 unions may have a negative effect on business confidence. Despite a “mildly contractionary” budget, Valdés insisted that the government would continue with costly reforms. Increased taxes on those on higher incomes are considered by the government to be necessary to sustain economic development in Chile. “We do want to change society, while recognising all the good things that have been done in 35 the past 25 years,” said Mr Valdés, referring to an average growth rate of 5.3% over the past three decades, but under 2% in 2015. There is broad consensus that investment in education is the key to unlocking Chile’s growth potential. (Sources: adapted from http://www.ft.com/cms/s/0/89926ce8-df96-11e4-a6c400144feab7de html#axzz3pCnzT3PC FT 20 April 2015 and http://www.ft.com/cms/s/0/d60ac2b2-7453- 11e5-a129-3fcc4f641d98.html?siteedition=uk#axzz3pCnzT3PC FT 19 October 2015 and http://www.ft.com/cms/s/0/d60ac2b2-7453-11e5-a129-3fcc4f641d98.html?siteedition= uk#axzz3pCnzT3PC FT 19 October 2015 all by Benedict Mander) Extract B Chile’s copper mining on a downward track There was a time when investing in Chilean mining meant guaranteed success. After 1990, when military rule was replaced by an elected government, market reforms and restored relations with the US and UK meant foreign companies were keen to exploit vast copper reserves. The existence of large copper reserves in a stable country with a 5 business-friendly government is rare, making Chile much more attractive to investors than countries such as Zambia. By mid-2015, however, the copper price hit a six-year low. Chilean mines are becoming less productive. After 20 years of heavy digging, the ore is lower grade, and much further down. The deeper pits take longer to mine, and use more fuel. Wages are high, and trade 10 unions are powerful. A mining truck driver earns $70 000 a year, $10 000 more than the US equivalent. Many mining projects that were planned are being postponed, and investors are looking to Peru; even the US copper mining industry is becoming more competitive. Energy supply is also a worry as Chile produces virtually no fossil fuels and relies on 15 imported coal and liquid natural gas to power its mines. Energy costs account for 18% of the cost of copper production. Water supply is also becoming a major problem. Farmers and communities accuse mining companies of causing water shortages to keep their operations running. A prolonged drought has not helped. Mining firms are turning to desalination plants 20 or using untreated seawater. However pumping water 200 kilometres from the Pacific Ocean to the copper mines is costly. Chile’s environmentalist movement has forced the government to tighten regulations. In 2001, it took 236 days to get an environmental impact assessment of a new mine approved. By 2013, this had increased to 506 days. 25 (Source: adapted from http://www.ft.com/cms/s/0/ea060ef4-6ae2-11e5-8171- ba1968cf791a.html#axzz3p20if45k Gideon Long September 27, 2015)
(a) With reference to Figure 2, explain one likely reason for the change in the Chile peso exchange rate between 2013 and 2015. (5)
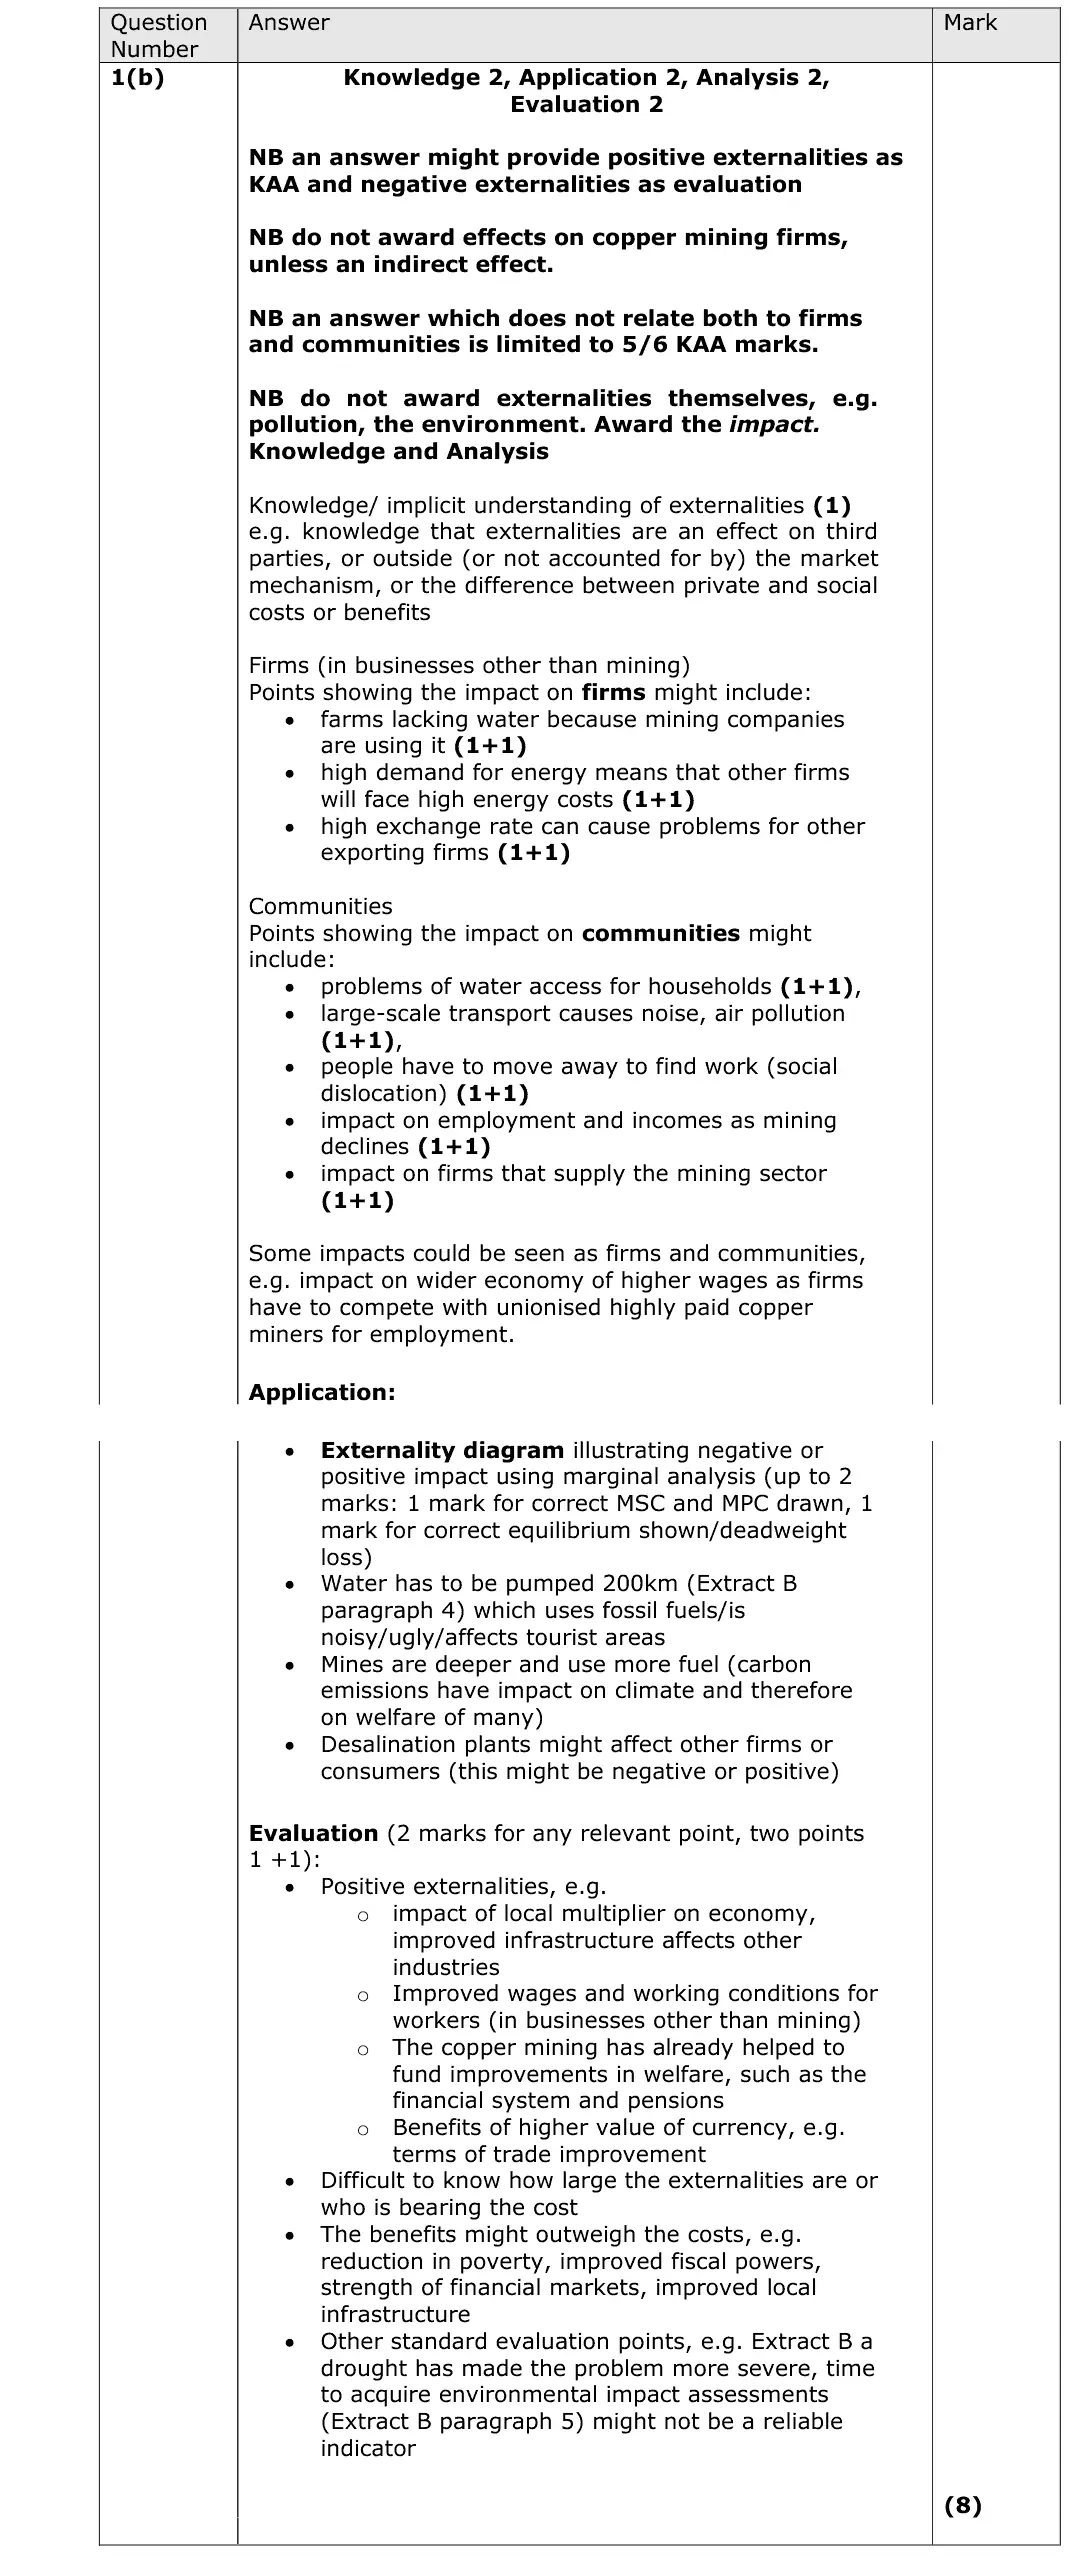
June 2017 · Paper 3 · Q1(b) 8 marks AO1=2, AO2=2, AO3=2, AO4=2 8-mark response externalities
Data and extracts for question 1Chile Figure 1: Copper prices, US dollars per tonne, 2007–2015 10000 US dollars per tonne 5000 0 2007 2008 2009 2010 2011 2012 2014 2015 2013 (Source: adapted from http://www.indexmundi.com/commodities/ ?commodity=copper&months=120) Figure 2: US dollar per 100 Chile pesos exchange rate, 2007–2015 0.24 0.22 Price of 100 Chile 0.20 pesos in 0.18 US dollars 0.16 0.14 0 2007 2008 2009 2010 2011 2012 2013 2014 2015 (Source: https://www.google.co.uk/finance?q=CLPUSD&ei=OGEvVun-AouIU6awjugF) Figure 3: Chile: copper output and real GDP growth, 2007–2015 10 GDP 5 Annual 0 % change –5 Copper output –10 2013 2007 2008 2009 2010 2011 2012 2014 2015 (Source: adapted from FT.com sources below) Extract A Chile’s economic outlook brightens Chile has been hit hard by a worldwide fall in commodity prices since 2011. Copper accounts for 20% of Chile’s GDP and 60% of its exports; one third of the world’s copper is produced by Chile. China purchased 40% of the world’s copper, so a slowdown in China combined with increased global over-supply has meant copper prices have 5 collapsed (see Figure 1). Chilean government income from copper exports had reached $11.5 billion a year before copper prices fell, but now tax revenues from this source have fallen drastically. Growing numbers of copper mines struggle to break even at current prices. Chile’s GDP is now growing, helped by a weak currency that has boosted export 10 industries outside the mining sector, such as its successful wine and salmon industries. There are strengths in tourism and high-tech products. Public services are good in Chile, and poverty rates have been falling fast. On top of this, a large and diversified financial sector with high domestic savings provides a useful safety net, given high levels of corporate debt and the government’s need to finance a fiscal deficit of 3% of GDP. 15 Chile’s economy is often regarded as the best run in the region. This is attributed to the credibility of its financial institutions, relatively low levels of national debt (about 15% of GDP) and its free-trade model, which is unrestricted by government interventionism that has distorted the economies of countries such as Argentina and Venezuela. “Chile is an example of how credible institutions can smooth the economic cycle and make 20 adjustments less traumatic,” said Mr Valdés, the minister of finance in Chile, pointing to its widely respected and independent central bank and a well-established fiscal rule that give officials the freedom to implement counter-cyclical policies. However, there are worries that without enough spare capacity in the economy, expansionary fiscal and monetary policies could end up increasing inflation rather than 25 economic growth. Meanwhile monetary policy is restricted by inflation that has reached 5%, well outside the central bank’s 2–4% target range, fuelled by a weaker exchange rate. Crucially, investment remains low because of uncertainty over the outcome of the Prime Minister’s reforms, which are aimed at reducing inequality. A recent rise in corporation tax from 20% to 25% and labour market reforms that strengthen the power of trade 30 unions may have a negative effect on business confidence. Despite a “mildly contractionary” budget, Valdés insisted that the government would continue with costly reforms. Increased taxes on those on higher incomes are considered by the government to be necessary to sustain economic development in Chile. “We do want to change society, while recognising all the good things that have been done in 35 the past 25 years,” said Mr Valdés, referring to an average growth rate of 5.3% over the past three decades, but under 2% in 2015. There is broad consensus that investment in education is the key to unlocking Chile’s growth potential. (Sources: adapted from http://www.ft.com/cms/s/0/89926ce8-df96-11e4-a6c400144feab7de html#axzz3pCnzT3PC FT 20 April 2015 and http://www.ft.com/cms/s/0/d60ac2b2-7453- 11e5-a129-3fcc4f641d98.html?siteedition=uk#axzz3pCnzT3PC FT 19 October 2015 and http://www.ft.com/cms/s/0/d60ac2b2-7453-11e5-a129-3fcc4f641d98.html?siteedition= uk#axzz3pCnzT3PC FT 19 October 2015 all by Benedict Mander) Extract B Chile’s copper mining on a downward track There was a time when investing in Chilean mining meant guaranteed success. After 1990, when military rule was replaced by an elected government, market reforms and restored relations with the US and UK meant foreign companies were keen to exploit vast copper reserves. The existence of large copper reserves in a stable country with a 5 business-friendly government is rare, making Chile much more attractive to investors than countries such as Zambia. By mid-2015, however, the copper price hit a six-year low. Chilean mines are becoming less productive. After 20 years of heavy digging, the ore is lower grade, and much further down. The deeper pits take longer to mine, and use more fuel. Wages are high, and trade 10 unions are powerful. A mining truck driver earns $70 000 a year, $10 000 more than the US equivalent. Many mining projects that were planned are being postponed, and investors are looking to Peru; even the US copper mining industry is becoming more competitive. Energy supply is also a worry as Chile produces virtually no fossil fuels and relies on 15 imported coal and liquid natural gas to power its mines. Energy costs account for 18% of the cost of copper production. Water supply is also becoming a major problem. Farmers and communities accuse mining companies of causing water shortages to keep their operations running. A prolonged drought has not helped. Mining firms are turning to desalination plants 20 or using untreated seawater. However pumping water 200 kilometres from the Pacific Ocean to the copper mines is costly. Chile’s environmentalist movement has forced the government to tighten regulations. In 2001, it took 236 days to get an environmental impact assessment of a new mine approved. By 2013, this had increased to 506 days. 25 (Source: adapted from http://www.ft.com/cms/s/0/ea060ef4-6ae2-11e5-8171- ba1968cf791a.html#axzz3p20if45k Gideon Long September 27, 2015)
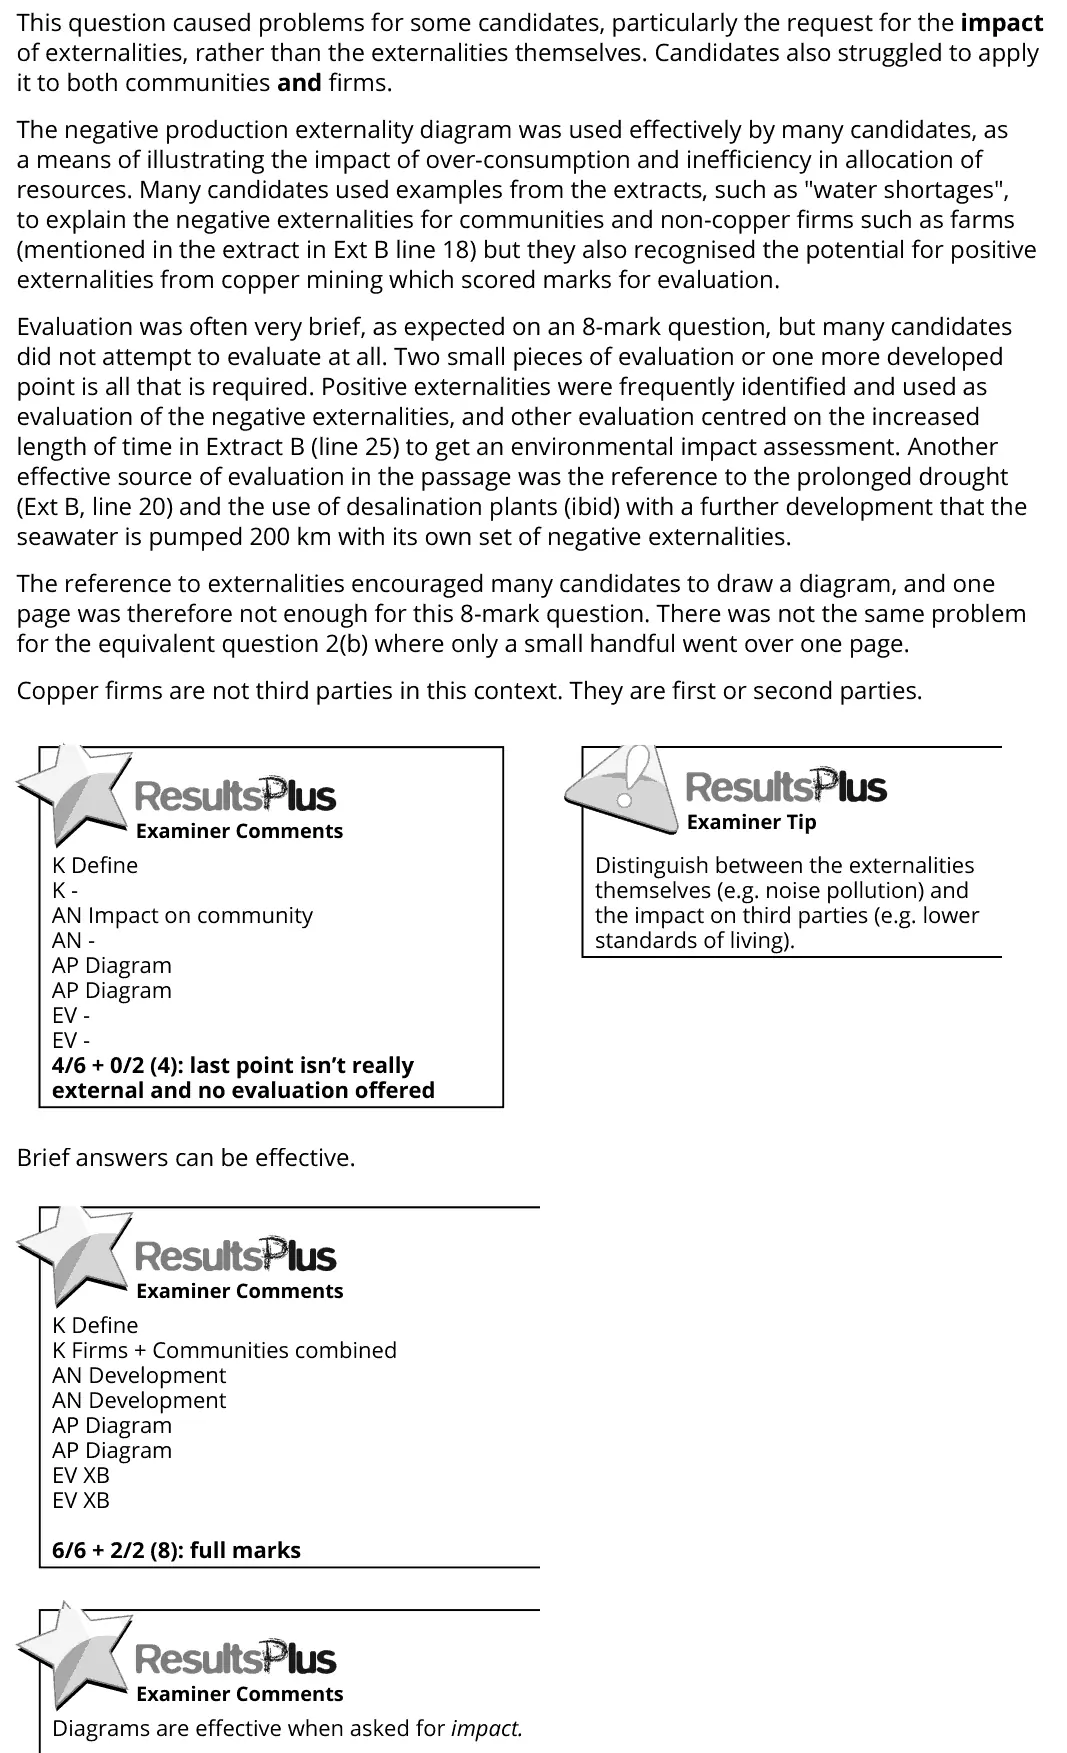
(b) Examine the likely impact of externalities of copper mining on firms and communities within Chile. (8)
June 2017 · Paper 3 · Q1(c) 12 marks AO1=2, AO2=2, AO3=4, AO4=4 12-mark response emerging and developing economies
Data and extracts for question 1Chile Figure 1: Copper prices, US dollars per tonne, 2007–2015 10000 US dollars per tonne 5000 0 2007 2008 2009 2010 2011 2012 2014 2015 2013 (Source: adapted from http://www.indexmundi.com/commodities/ ?commodity=copper&months=120) Figure 2: US dollar per 100 Chile pesos exchange rate, 2007–2015 0.24 0.22 Price of 100 Chile 0.20 pesos in 0.18 US dollars 0.16 0.14 0 2007 2008 2009 2010 2011 2012 2013 2014 2015 (Source: https://www.google.co.uk/finance?q=CLPUSD&ei=OGEvVun-AouIU6awjugF) Figure 3: Chile: copper output and real GDP growth, 2007–2015 10 GDP 5 Annual 0 % change –5 Copper output –10 2013 2007 2008 2009 2010 2011 2012 2014 2015 (Source: adapted from FT.com sources below) Extract A Chile’s economic outlook brightens Chile has been hit hard by a worldwide fall in commodity prices since 2011. Copper accounts for 20% of Chile’s GDP and 60% of its exports; one third of the world’s copper is produced by Chile. China purchased 40% of the world’s copper, so a slowdown in China combined with increased global over-supply has meant copper prices have 5 collapsed (see Figure 1). Chilean government income from copper exports had reached $11.5 billion a year before copper prices fell, but now tax revenues from this source have fallen drastically. Growing numbers of copper mines struggle to break even at current prices. Chile’s GDP is now growing, helped by a weak currency that has boosted export 10 industries outside the mining sector, such as its successful wine and salmon industries. There are strengths in tourism and high-tech products. Public services are good in Chile, and poverty rates have been falling fast. On top of this, a large and diversified financial sector with high domestic savings provides a useful safety net, given high levels of corporate debt and the government’s need to finance a fiscal deficit of 3% of GDP. 15 Chile’s economy is often regarded as the best run in the region. This is attributed to the credibility of its financial institutions, relatively low levels of national debt (about 15% of GDP) and its free-trade model, which is unrestricted by government interventionism that has distorted the economies of countries such as Argentina and Venezuela. “Chile is an example of how credible institutions can smooth the economic cycle and make 20 adjustments less traumatic,” said Mr Valdés, the minister of finance in Chile, pointing to its widely respected and independent central bank and a well-established fiscal rule that give officials the freedom to implement counter-cyclical policies. However, there are worries that without enough spare capacity in the economy, expansionary fiscal and monetary policies could end up increasing inflation rather than 25 economic growth. Meanwhile monetary policy is restricted by inflation that has reached 5%, well outside the central bank’s 2–4% target range, fuelled by a weaker exchange rate. Crucially, investment remains low because of uncertainty over the outcome of the Prime Minister’s reforms, which are aimed at reducing inequality. A recent rise in corporation tax from 20% to 25% and labour market reforms that strengthen the power of trade 30 unions may have a negative effect on business confidence. Despite a “mildly contractionary” budget, Valdés insisted that the government would continue with costly reforms. Increased taxes on those on higher incomes are considered by the government to be necessary to sustain economic development in Chile. “We do want to change society, while recognising all the good things that have been done in 35 the past 25 years,” said Mr Valdés, referring to an average growth rate of 5.3% over the past three decades, but under 2% in 2015. There is broad consensus that investment in education is the key to unlocking Chile’s growth potential. (Sources: adapted from http://www.ft.com/cms/s/0/89926ce8-df96-11e4-a6c400144feab7de html#axzz3pCnzT3PC FT 20 April 2015 and http://www.ft.com/cms/s/0/d60ac2b2-7453- 11e5-a129-3fcc4f641d98.html?siteedition=uk#axzz3pCnzT3PC FT 19 October 2015 and http://www.ft.com/cms/s/0/d60ac2b2-7453-11e5-a129-3fcc4f641d98.html?siteedition= uk#axzz3pCnzT3PC FT 19 October 2015 all by Benedict Mander) Extract B Chile’s copper mining on a downward track There was a time when investing in Chilean mining meant guaranteed success. After 1990, when military rule was replaced by an elected government, market reforms and restored relations with the US and UK meant foreign companies were keen to exploit vast copper reserves. The existence of large copper reserves in a stable country with a 5 business-friendly government is rare, making Chile much more attractive to investors than countries such as Zambia. By mid-2015, however, the copper price hit a six-year low. Chilean mines are becoming less productive. After 20 years of heavy digging, the ore is lower grade, and much further down. The deeper pits take longer to mine, and use more fuel. Wages are high, and trade 10 unions are powerful. A mining truck driver earns $70 000 a year, $10 000 more than the US equivalent. Many mining projects that were planned are being postponed, and investors are looking to Peru; even the US copper mining industry is becoming more competitive. Energy supply is also a worry as Chile produces virtually no fossil fuels and relies on 15 imported coal and liquid natural gas to power its mines. Energy costs account for 18% of the cost of copper production. Water supply is also becoming a major problem. Farmers and communities accuse mining companies of causing water shortages to keep their operations running. A prolonged drought has not helped. Mining firms are turning to desalination plants 20 or using untreated seawater. However pumping water 200 kilometres from the Pacific Ocean to the copper mines is costly. Chile’s environmentalist movement has forced the government to tighten regulations. In 2001, it took 236 days to get an environmental impact assessment of a new mine approved. By 2013, this had increased to 506 days. 25 (Source: adapted from http://www.ft.com/cms/s/0/ea060ef4-6ae2-11e5-8171- ba1968cf791a.html#axzz3p20if45k Gideon Long September 27, 2015)
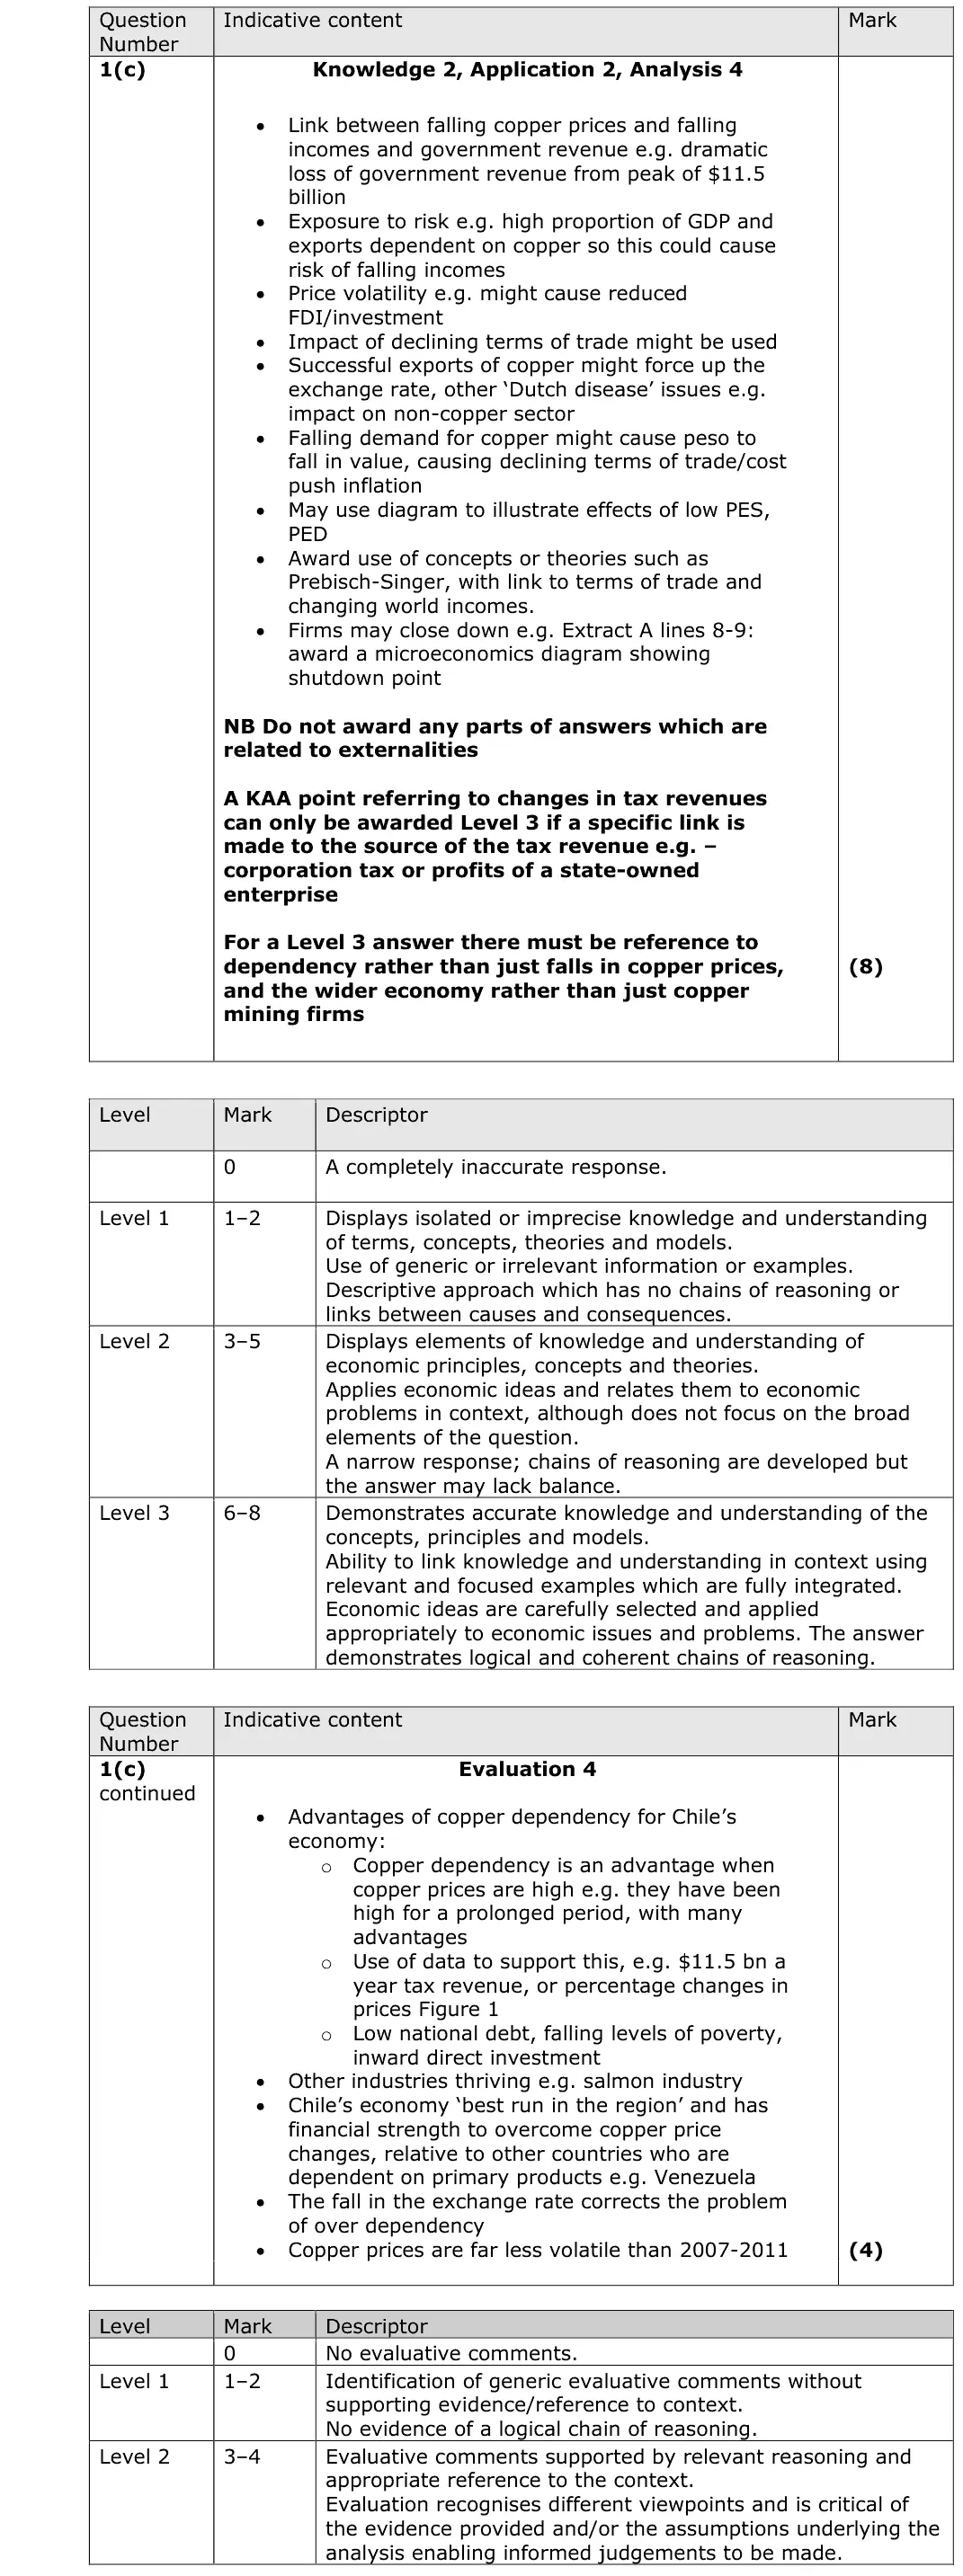
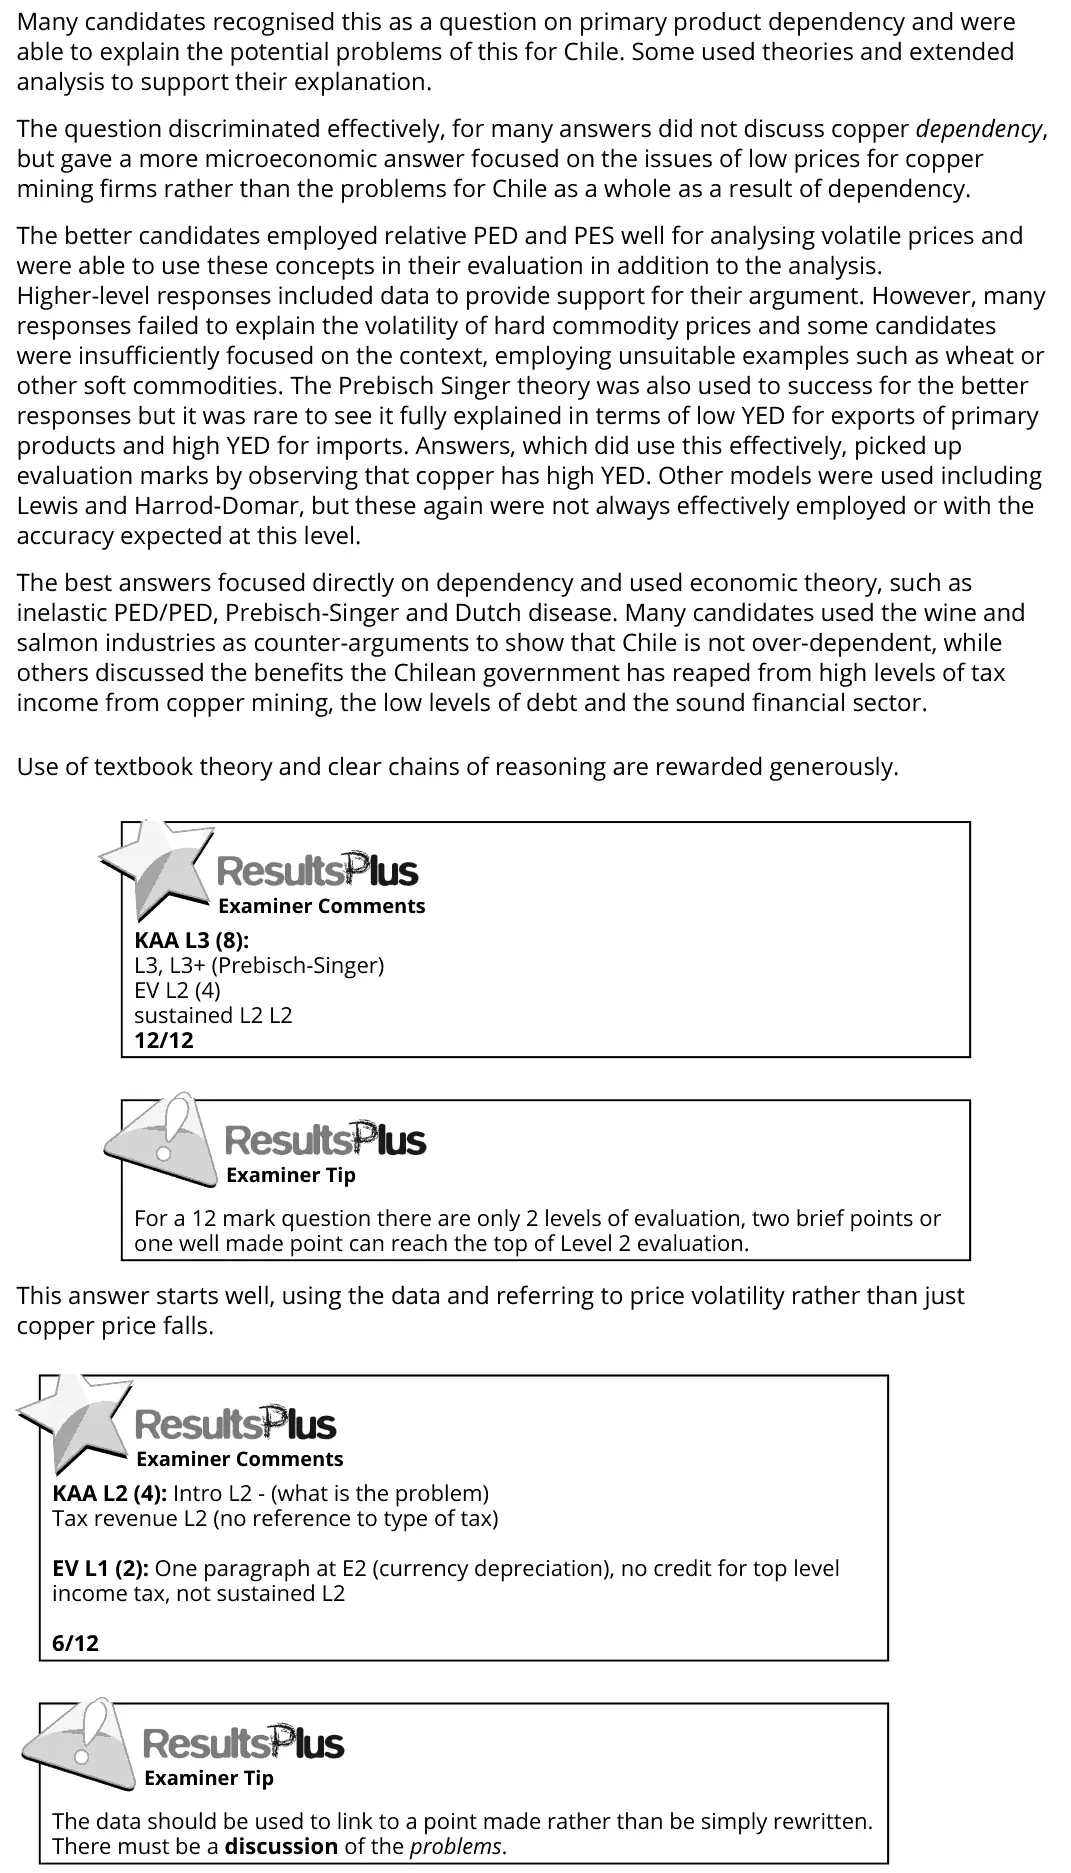
(c) Apart from externalities, discuss the problems that Chile faces as a result of dependency on copper mining. (12)
June 2017 · Paper 3 · Q1(d) 25 marks AO1=4, AO2=4, AO3=8, AO4=9 25-mark essay Either/or emerging and developing economiessupply side policies
Data and extracts for question 1Chile Figure 1: Copper prices, US dollars per tonne, 2007–2015 10000 US dollars per tonne 5000 0 2007 2008 2009 2010 2011 2012 2014 2015 2013 (Source: adapted from http://www.indexmundi.com/commodities/ ?commodity=copper&months=120) Figure 2: US dollar per 100 Chile pesos exchange rate, 2007–2015 0.24 0.22 Price of 100 Chile 0.20 pesos in 0.18 US dollars 0.16 0.14 0 2007 2008 2009 2010 2011 2012 2013 2014 2015 (Source: https://www.google.co.uk/finance?q=CLPUSD&ei=OGEvVun-AouIU6awjugF) Figure 3: Chile: copper output and real GDP growth, 2007–2015 10 GDP 5 Annual 0 % change –5 Copper output –10 2013 2007 2008 2009 2010 2011 2012 2014 2015 (Source: adapted from FT.com sources below) Extract A Chile’s economic outlook brightens Chile has been hit hard by a worldwide fall in commodity prices since 2011. Copper accounts for 20% of Chile’s GDP and 60% of its exports; one third of the world’s copper is produced by Chile. China purchased 40% of the world’s copper, so a slowdown in China combined with increased global over-supply has meant copper prices have 5 collapsed (see Figure 1). Chilean government income from copper exports had reached $11.5 billion a year before copper prices fell, but now tax revenues from this source have fallen drastically. Growing numbers of copper mines struggle to break even at current prices. Chile’s GDP is now growing, helped by a weak currency that has boosted export 10 industries outside the mining sector, such as its successful wine and salmon industries. There are strengths in tourism and high-tech products. Public services are good in Chile, and poverty rates have been falling fast. On top of this, a large and diversified financial sector with high domestic savings provides a useful safety net, given high levels of corporate debt and the government’s need to finance a fiscal deficit of 3% of GDP. 15 Chile’s economy is often regarded as the best run in the region. This is attributed to the credibility of its financial institutions, relatively low levels of national debt (about 15% of GDP) and its free-trade model, which is unrestricted by government interventionism that has distorted the economies of countries such as Argentina and Venezuela. “Chile is an example of how credible institutions can smooth the economic cycle and make 20 adjustments less traumatic,” said Mr Valdés, the minister of finance in Chile, pointing to its widely respected and independent central bank and a well-established fiscal rule that give officials the freedom to implement counter-cyclical policies. However, there are worries that without enough spare capacity in the economy, expansionary fiscal and monetary policies could end up increasing inflation rather than 25 economic growth. Meanwhile monetary policy is restricted by inflation that has reached 5%, well outside the central bank’s 2–4% target range, fuelled by a weaker exchange rate. Crucially, investment remains low because of uncertainty over the outcome of the Prime Minister’s reforms, which are aimed at reducing inequality. A recent rise in corporation tax from 20% to 25% and labour market reforms that strengthen the power of trade 30 unions may have a negative effect on business confidence. Despite a “mildly contractionary” budget, Valdés insisted that the government would continue with costly reforms. Increased taxes on those on higher incomes are considered by the government to be necessary to sustain economic development in Chile. “We do want to change society, while recognising all the good things that have been done in 35 the past 25 years,” said Mr Valdés, referring to an average growth rate of 5.3% over the past three decades, but under 2% in 2015. There is broad consensus that investment in education is the key to unlocking Chile’s growth potential. (Sources: adapted from http://www.ft.com/cms/s/0/89926ce8-df96-11e4-a6c400144feab7de html#axzz3pCnzT3PC FT 20 April 2015 and http://www.ft.com/cms/s/0/d60ac2b2-7453- 11e5-a129-3fcc4f641d98.html?siteedition=uk#axzz3pCnzT3PC FT 19 October 2015 and http://www.ft.com/cms/s/0/d60ac2b2-7453-11e5-a129-3fcc4f641d98.html?siteedition= uk#axzz3pCnzT3PC FT 19 October 2015 all by Benedict Mander) Extract B Chile’s copper mining on a downward track There was a time when investing in Chilean mining meant guaranteed success. After 1990, when military rule was replaced by an elected government, market reforms and restored relations with the US and UK meant foreign companies were keen to exploit vast copper reserves. The existence of large copper reserves in a stable country with a 5 business-friendly government is rare, making Chile much more attractive to investors than countries such as Zambia. By mid-2015, however, the copper price hit a six-year low. Chilean mines are becoming less productive. After 20 years of heavy digging, the ore is lower grade, and much further down. The deeper pits take longer to mine, and use more fuel. Wages are high, and trade 10 unions are powerful. A mining truck driver earns $70 000 a year, $10 000 more than the US equivalent. Many mining projects that were planned are being postponed, and investors are looking to Peru; even the US copper mining industry is becoming more competitive. Energy supply is also a worry as Chile produces virtually no fossil fuels and relies on 15 imported coal and liquid natural gas to power its mines. Energy costs account for 18% of the cost of copper production. Water supply is also becoming a major problem. Farmers and communities accuse mining companies of causing water shortages to keep their operations running. A prolonged drought has not helped. Mining firms are turning to desalination plants 20 or using untreated seawater. However pumping water 200 kilometres from the Pacific Ocean to the copper mines is costly. Chile’s environmentalist movement has forced the government to tighten regulations. In 2001, it took 236 days to get an environmental impact assessment of a new mine approved. By 2013, this had increased to 506 days. 25 (Source: adapted from http://www.ft.com/cms/s/0/ea060ef4-6ae2-11e5-8171- ba1968cf791a.html#axzz3p20if45k Gideon Long September 27, 2015)
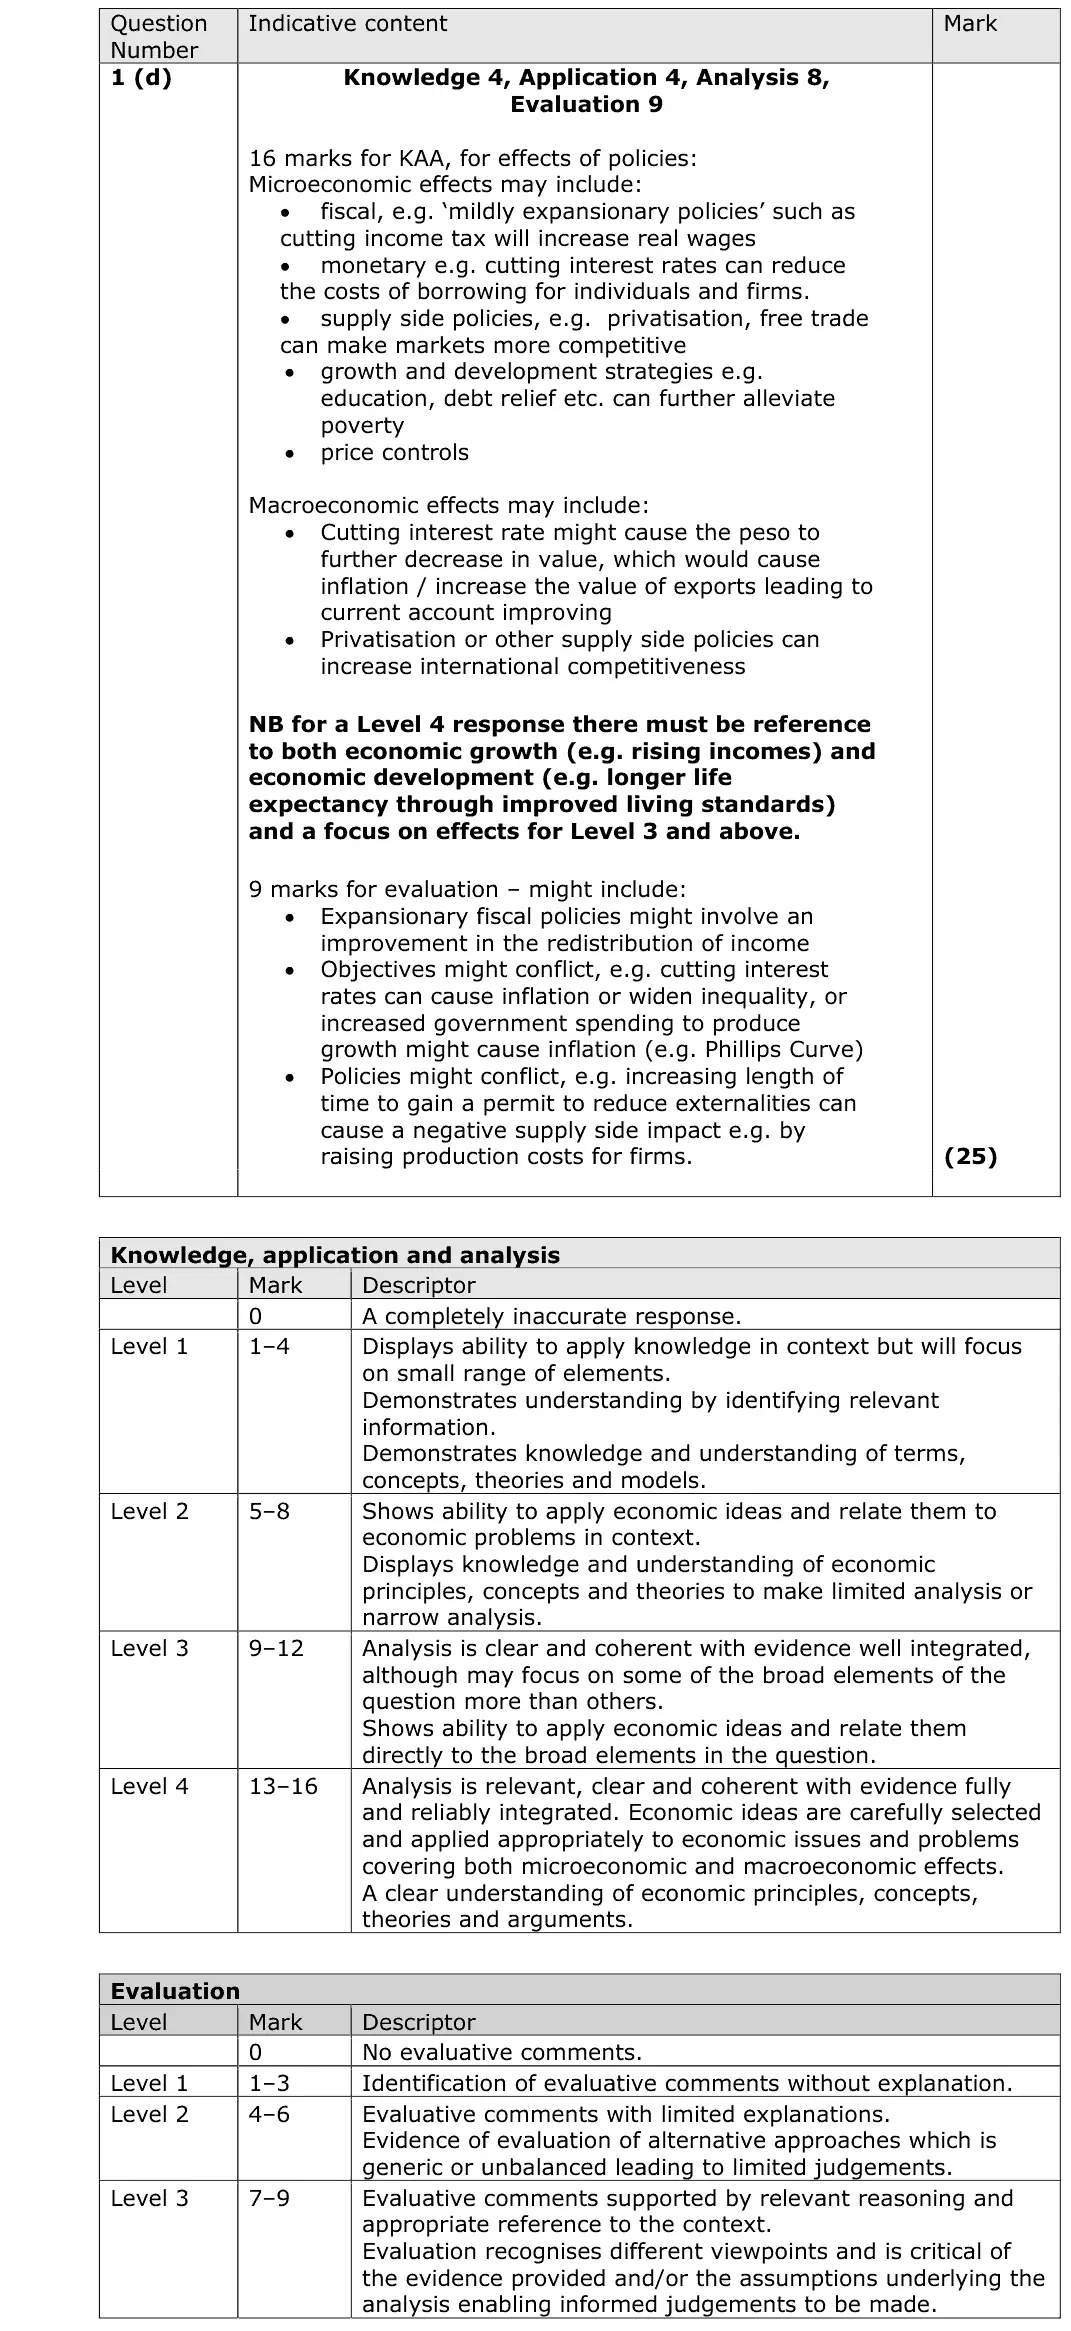
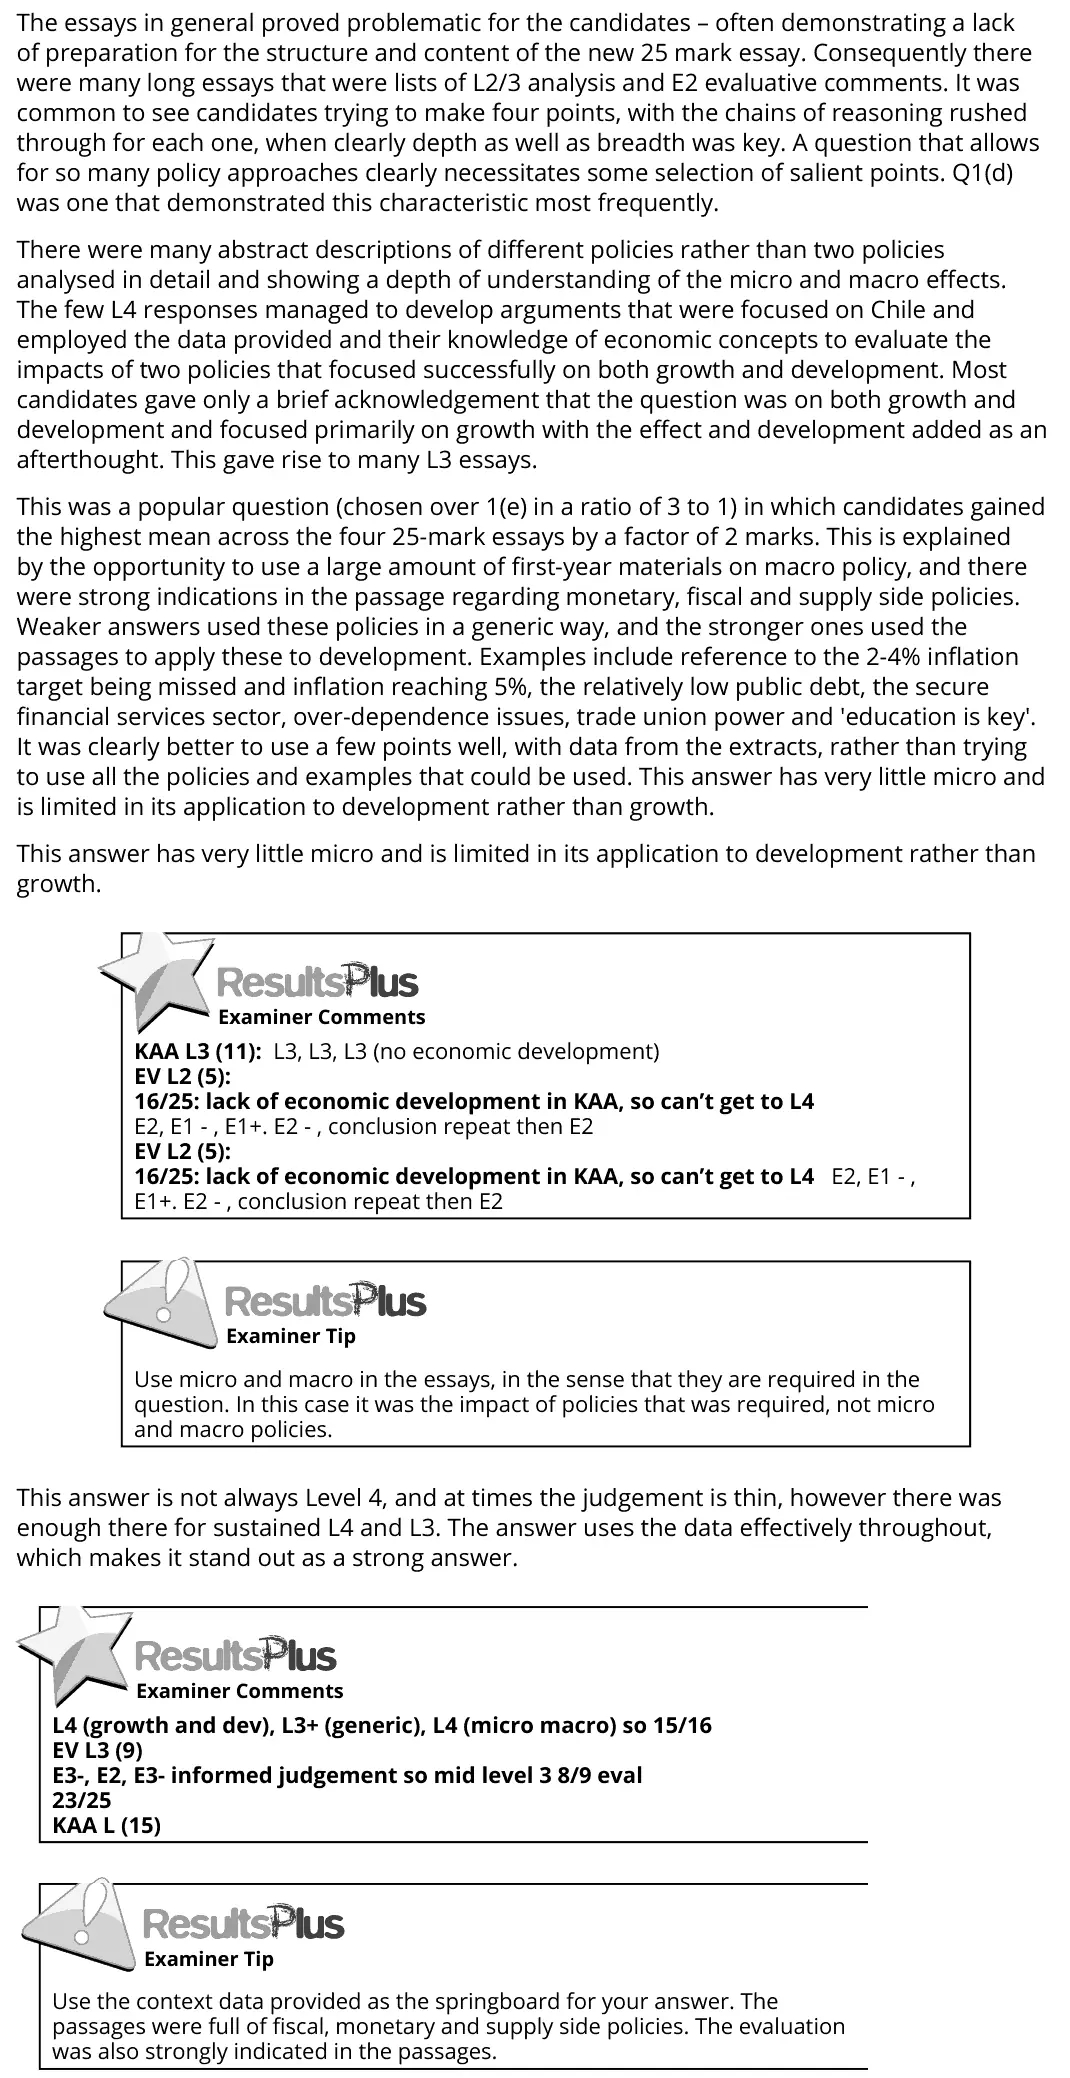
(d) With reference to the information provided and your own knowledge, evaluate the microeconomic and macroeconomic effects of policies that could be used to stimulate economic growth and development in Chile. (25)
June 2017 · Paper 3 · Q1(e) 25 marks AO1=4, AO2=4, AO3=8, AO4=9 25-mark essay Either/or aggregate demandnational income and the multiplier
Data and extracts for question 1Chile Figure 1: Copper prices, US dollars per tonne, 2007–2015 10000 US dollars per tonne 5000 0 2007 2008 2009 2010 2011 2012 2014 2015 2013 (Source: adapted from http://www.indexmundi.com/commodities/ ?commodity=copper&months=120) Figure 2: US dollar per 100 Chile pesos exchange rate, 2007–2015 0.24 0.22 Price of 100 Chile 0.20 pesos in 0.18 US dollars 0.16 0.14 0 2007 2008 2009 2010 2011 2012 2013 2014 2015 (Source: https://www.google.co.uk/finance?q=CLPUSD&ei=OGEvVun-AouIU6awjugF) Figure 3: Chile: copper output and real GDP growth, 2007–2015 10 GDP 5 Annual 0 % change –5 Copper output –10 2013 2007 2008 2009 2010 2011 2012 2014 2015 (Source: adapted from FT.com sources below) Extract A Chile’s economic outlook brightens Chile has been hit hard by a worldwide fall in commodity prices since 2011. Copper accounts for 20% of Chile’s GDP and 60% of its exports; one third of the world’s copper is produced by Chile. China purchased 40% of the world’s copper, so a slowdown in China combined with increased global over-supply has meant copper prices have 5 collapsed (see Figure 1). Chilean government income from copper exports had reached $11.5 billion a year before copper prices fell, but now tax revenues from this source have fallen drastically. Growing numbers of copper mines struggle to break even at current prices. Chile’s GDP is now growing, helped by a weak currency that has boosted export 10 industries outside the mining sector, such as its successful wine and salmon industries. There are strengths in tourism and high-tech products. Public services are good in Chile, and poverty rates have been falling fast. On top of this, a large and diversified financial sector with high domestic savings provides a useful safety net, given high levels of corporate debt and the government’s need to finance a fiscal deficit of 3% of GDP. 15 Chile’s economy is often regarded as the best run in the region. This is attributed to the credibility of its financial institutions, relatively low levels of national debt (about 15% of GDP) and its free-trade model, which is unrestricted by government interventionism that has distorted the economies of countries such as Argentina and Venezuela. “Chile is an example of how credible institutions can smooth the economic cycle and make 20 adjustments less traumatic,” said Mr Valdés, the minister of finance in Chile, pointing to its widely respected and independent central bank and a well-established fiscal rule that give officials the freedom to implement counter-cyclical policies. However, there are worries that without enough spare capacity in the economy, expansionary fiscal and monetary policies could end up increasing inflation rather than 25 economic growth. Meanwhile monetary policy is restricted by inflation that has reached 5%, well outside the central bank’s 2–4% target range, fuelled by a weaker exchange rate. Crucially, investment remains low because of uncertainty over the outcome of the Prime Minister’s reforms, which are aimed at reducing inequality. A recent rise in corporation tax from 20% to 25% and labour market reforms that strengthen the power of trade 30 unions may have a negative effect on business confidence. Despite a “mildly contractionary” budget, Valdés insisted that the government would continue with costly reforms. Increased taxes on those on higher incomes are considered by the government to be necessary to sustain economic development in Chile. “We do want to change society, while recognising all the good things that have been done in 35 the past 25 years,” said Mr Valdés, referring to an average growth rate of 5.3% over the past three decades, but under 2% in 2015. There is broad consensus that investment in education is the key to unlocking Chile’s growth potential. (Sources: adapted from http://www.ft.com/cms/s/0/89926ce8-df96-11e4-a6c400144feab7de html#axzz3pCnzT3PC FT 20 April 2015 and http://www.ft.com/cms/s/0/d60ac2b2-7453- 11e5-a129-3fcc4f641d98.html?siteedition=uk#axzz3pCnzT3PC FT 19 October 2015 and http://www.ft.com/cms/s/0/d60ac2b2-7453-11e5-a129-3fcc4f641d98.html?siteedition= uk#axzz3pCnzT3PC FT 19 October 2015 all by Benedict Mander) Extract B Chile’s copper mining on a downward track There was a time when investing in Chilean mining meant guaranteed success. After 1990, when military rule was replaced by an elected government, market reforms and restored relations with the US and UK meant foreign companies were keen to exploit vast copper reserves. The existence of large copper reserves in a stable country with a 5 business-friendly government is rare, making Chile much more attractive to investors than countries such as Zambia. By mid-2015, however, the copper price hit a six-year low. Chilean mines are becoming less productive. After 20 years of heavy digging, the ore is lower grade, and much further down. The deeper pits take longer to mine, and use more fuel. Wages are high, and trade 10 unions are powerful. A mining truck driver earns $70 000 a year, $10 000 more than the US equivalent. Many mining projects that were planned are being postponed, and investors are looking to Peru; even the US copper mining industry is becoming more competitive. Energy supply is also a worry as Chile produces virtually no fossil fuels and relies on 15 imported coal and liquid natural gas to power its mines. Energy costs account for 18% of the cost of copper production. Water supply is also becoming a major problem. Farmers and communities accuse mining companies of causing water shortages to keep their operations running. A prolonged drought has not helped. Mining firms are turning to desalination plants 20 or using untreated seawater. However pumping water 200 kilometres from the Pacific Ocean to the copper mines is costly. Chile’s environmentalist movement has forced the government to tighten regulations. In 2001, it took 236 days to get an environmental impact assessment of a new mine approved. By 2013, this had increased to 506 days. 25 (Source: adapted from http://www.ft.com/cms/s/0/ea060ef4-6ae2-11e5-8171- ba1968cf791a.html#axzz3p20if45k Gideon Long September 27, 2015)
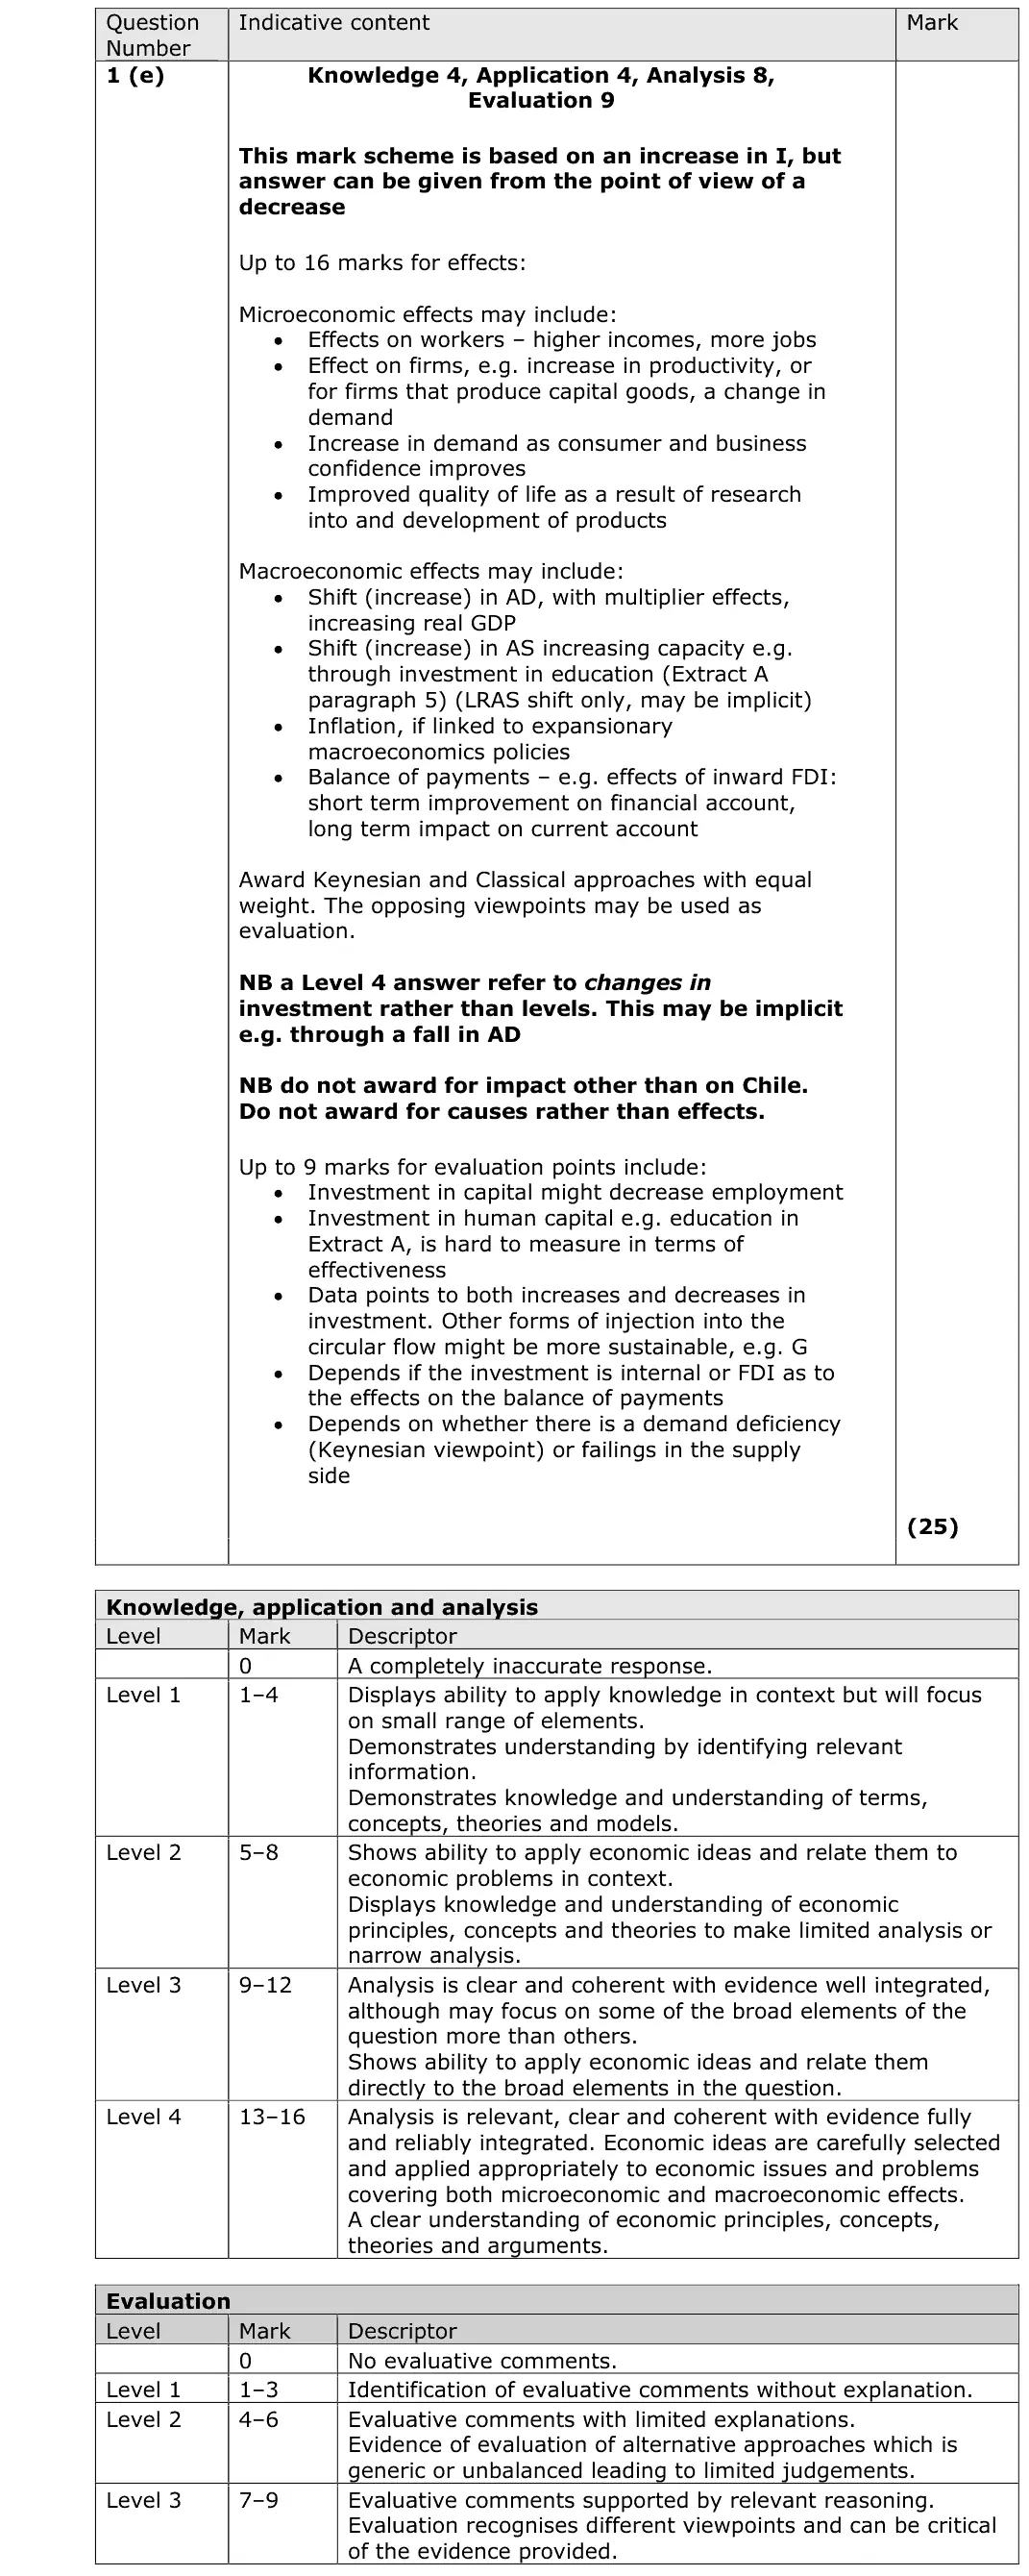
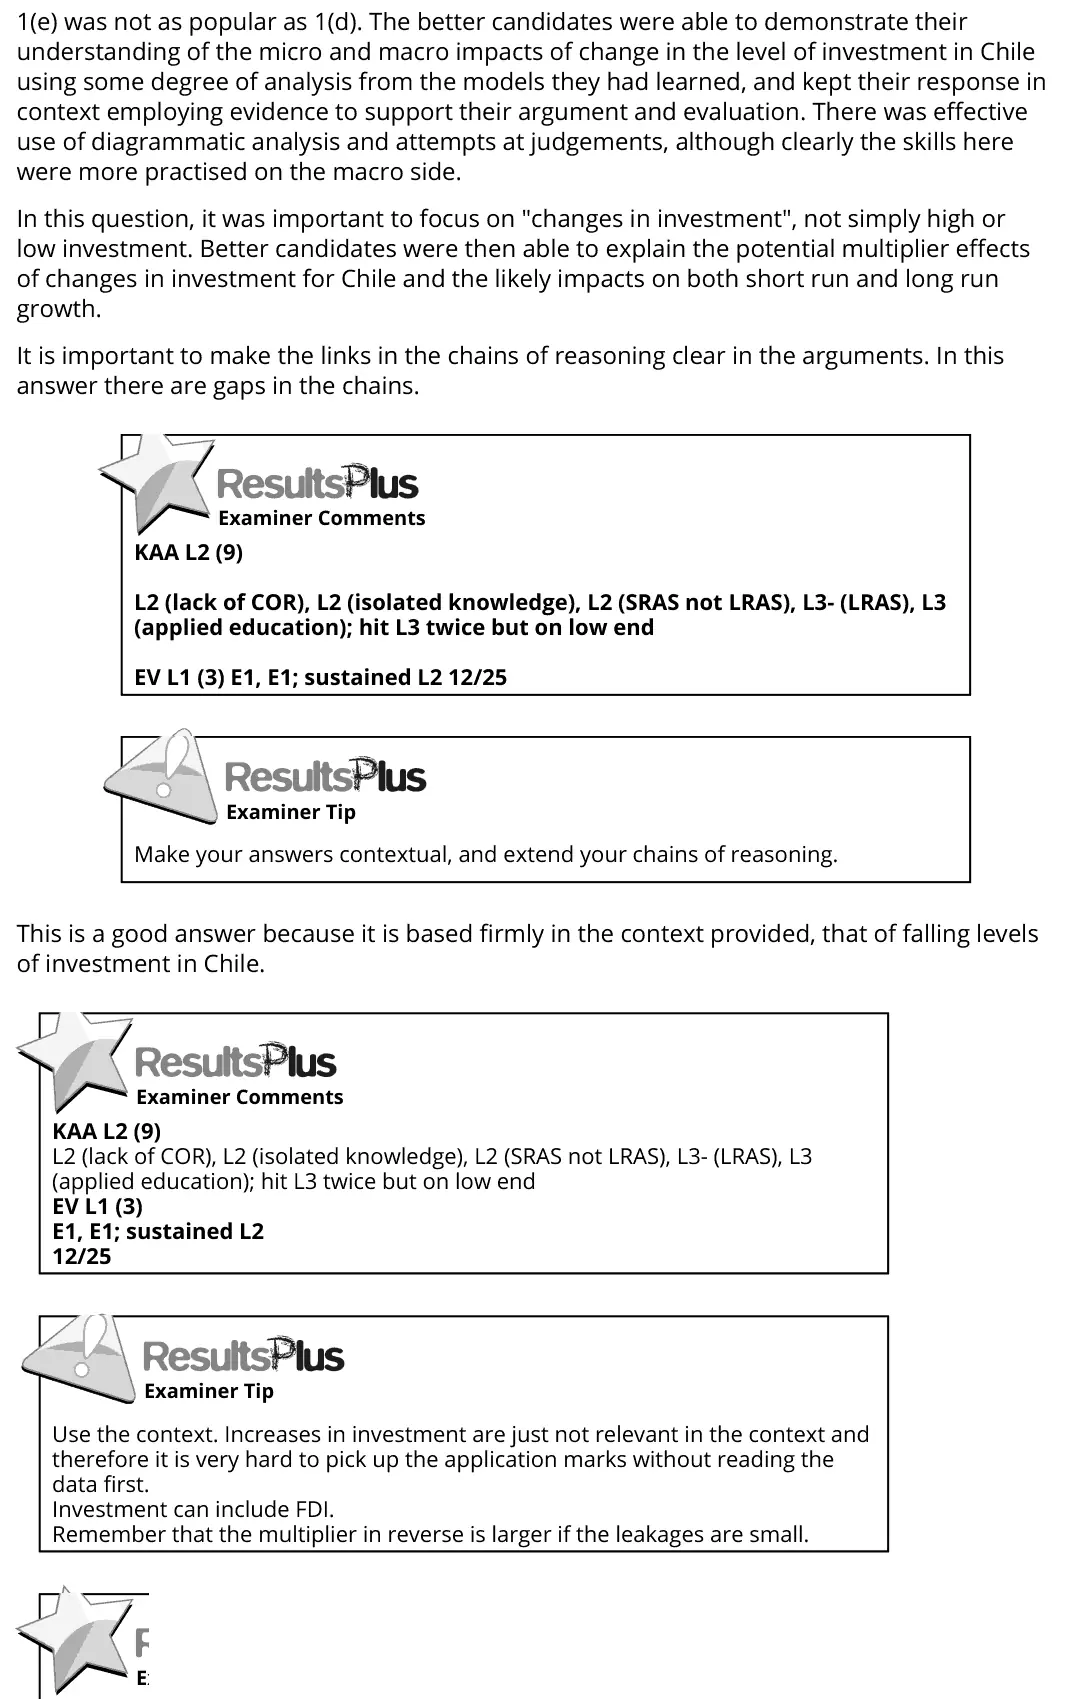
(e) With reference to the information provided and your own knowledge, evaluate the microeconomic and macroeconomic impact on Chile’s economy of changes in the level of investment. (25)
June 2017 · Paper 3 · Q2(a) 5 marks AO1=2, AO2=2, AO3=1 Diagram economic growth and the trade cycle
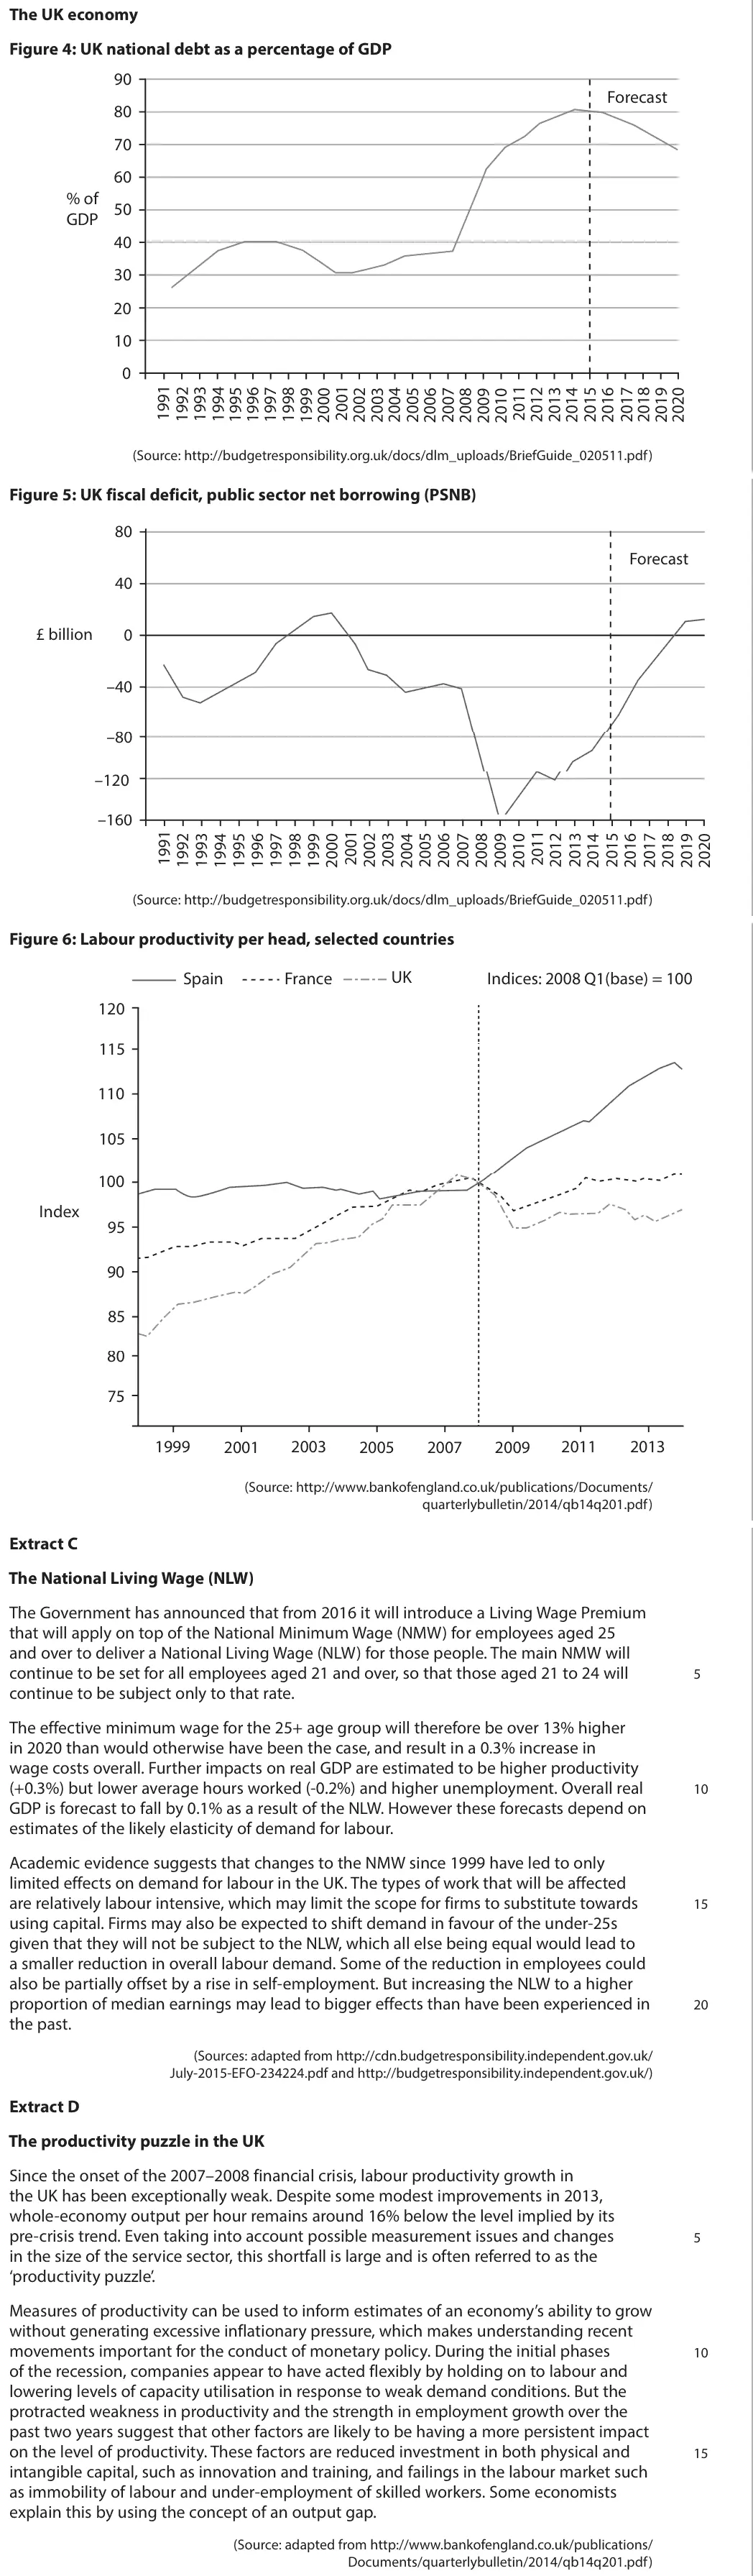
Data and extracts for question 2The UK economy Figure 4: UK national debt as a percentage of GDP 90 Forecast 80 70 60 % of 50 GDP 40 30 20 10 0 (Source: http://budgetresponsibility.org.uk/docs/dlm_uploads/BriefGuide_020511.pdf) Figure 5: UK fiscal deficit, public sector net borrowing (PSNB) 80 Forecast 40 £ billion 0 –40 –80 –120 –160 (Source: http://budgetresponsibility.org.uk/docs/dlm_uploads/BriefGuide_020511.pdf) Figure 6: Labour productivity per head, selected countries UK Spain France Indices: 2008 Q1(base) = 100 120 115 110 105 100 Index 95 90 85 80 75 1999 2001 2003 2005 2007 2009 2011 2013 (Source: http://www.bankofengland.co.uk/publications/Documents/ quarterlybulletin/2014/qb14q201.pdf) Extract C The National Living Wage (NLW) The Government has announced that from 2016 it will introduce a Living Wage Premium that will apply on top of the National Minimum Wage (NMW) for employees aged 25 and over to deliver a National Living Wage (NLW) for those people. The main NMW will continue to be set for all employees aged 21 and over, so that those aged 21 to 24 will 5 continue to be subject only to that rate. The effective minimum wage for the 25+ age group will therefore be over 13% higher in 2020 than would otherwise have been the case, and result in a 0.3% increase in wage costs overall. Further impacts on real GDP are estimated to be higher productivity (+0.3%) but lower average hours worked (-0.2%) and higher unemployment. Overall real 10 GDP is forecast to fall by 0.1% as a result of the NLW. However these forecasts depend on estimates of the likely elasticity of demand for labour. Academic evidence suggests that changes to the NMW since 1999 have led to only limited effects on demand for labour in the UK. The types of work that will be affected are relatively labour intensive, which may limit the scope for firms to substitute towards 15 using capital. Firms may also be expected to shift demand in favour of the under-25s given that they will not be subject to the NLW, which all else being equal would lead to a smaller reduction in overall labour demand. Some of the reduction in employees could also be partially offset by a rise in self-employment. But increasing the NLW to a higher proportion of median earnings may lead to bigger effects than have been experienced in 20 the past. (Sources: adapted from http://cdn.budgetresponsibility.independent.gov.uk/ July-2015-EFO-234224.pdf and http://budgetresponsibility.independent.gov.uk/) Extract D The productivity puzzle in the UK Since the onset of the 2007–2008 financial crisis, labour productivity growth in the UK has been exceptionally weak. Despite some modest improvements in 2013, whole-economy output per hour remains around 16% below the level implied by its pre-crisis trend. Even taking into account possible measurement issues and changes 5 in the size of the service sector, this shortfall is large and is often referred to as the ‘productivity puzzle’. Measures of productivity can be used to inform estimates of an economy’s ability to grow without generating excessive inflationary pressure, which makes understanding recent movements important for the conduct of monetary policy. During the initial phases 10 of the recession, companies appear to have acted flexibly by holding on to labour and lowering levels of capacity utilisation in response to weak demand conditions. But the protracted weakness in productivity and the strength in employment growth over the past two years suggest that other factors are likely to be having a more persistent impact on the level of productivity. These factors are reduced investment in both physical and 15 intangible capital, such as innovation and training, and failings in the labour market such as immobility of labour and under-employment of skilled workers. Some economists explain this by using the concept of an output gap. (Source: adapted from http://www.bankofengland.co.uk/publications/ Documents/quarterlybulletin/2014/qb14q201.pdf)
(a) With reference to Extract D (line 18), explain the meaning of the term ‘output gap’. Use an aggregate demand and aggregate supply diagram in your answer. (5)
June 2017 · Paper 3 · Q2(b) 8 marks AO1=2, AO2=2, AO3=2, AO4=2 8-mark response Hard public finances and taxation
Data and extracts for question 2The UK economy Figure 4: UK national debt as a percentage of GDP 90 Forecast 80 70 60 % of 50 GDP 40 30 20 10 0 (Source: http://budgetresponsibility.org.uk/docs/dlm_uploads/BriefGuide_020511.pdf) Figure 5: UK fiscal deficit, public sector net borrowing (PSNB) 80 Forecast 40 £ billion 0 –40 –80 –120 –160 (Source: http://budgetresponsibility.org.uk/docs/dlm_uploads/BriefGuide_020511.pdf) Figure 6: Labour productivity per head, selected countries UK Spain France Indices: 2008 Q1(base) = 100 120 115 110 105 100 Index 95 90 85 80 75 1999 2001 2003 2005 2007 2009 2011 2013 (Source: http://www.bankofengland.co.uk/publications/Documents/ quarterlybulletin/2014/qb14q201.pdf) Extract C The National Living Wage (NLW) The Government has announced that from 2016 it will introduce a Living Wage Premium that will apply on top of the National Minimum Wage (NMW) for employees aged 25 and over to deliver a National Living Wage (NLW) for those people. The main NMW will continue to be set for all employees aged 21 and over, so that those aged 21 to 24 will 5 continue to be subject only to that rate. The effective minimum wage for the 25+ age group will therefore be over 13% higher in 2020 than would otherwise have been the case, and result in a 0.3% increase in wage costs overall. Further impacts on real GDP are estimated to be higher productivity (+0.3%) but lower average hours worked (-0.2%) and higher unemployment. Overall real 10 GDP is forecast to fall by 0.1% as a result of the NLW. However these forecasts depend on estimates of the likely elasticity of demand for labour. Academic evidence suggests that changes to the NMW since 1999 have led to only limited effects on demand for labour in the UK. The types of work that will be affected are relatively labour intensive, which may limit the scope for firms to substitute towards 15 using capital. Firms may also be expected to shift demand in favour of the under-25s given that they will not be subject to the NLW, which all else being equal would lead to a smaller reduction in overall labour demand. Some of the reduction in employees could also be partially offset by a rise in self-employment. But increasing the NLW to a higher proportion of median earnings may lead to bigger effects than have been experienced in 20 the past. (Sources: adapted from http://cdn.budgetresponsibility.independent.gov.uk/ July-2015-EFO-234224.pdf and http://budgetresponsibility.independent.gov.uk/) Extract D The productivity puzzle in the UK Since the onset of the 2007–2008 financial crisis, labour productivity growth in the UK has been exceptionally weak. Despite some modest improvements in 2013, whole-economy output per hour remains around 16% below the level implied by its pre-crisis trend. Even taking into account possible measurement issues and changes 5 in the size of the service sector, this shortfall is large and is often referred to as the ‘productivity puzzle’. Measures of productivity can be used to inform estimates of an economy’s ability to grow without generating excessive inflationary pressure, which makes understanding recent movements important for the conduct of monetary policy. During the initial phases 10 of the recession, companies appear to have acted flexibly by holding on to labour and lowering levels of capacity utilisation in response to weak demand conditions. But the protracted weakness in productivity and the strength in employment growth over the past two years suggest that other factors are likely to be having a more persistent impact on the level of productivity. These factors are reduced investment in both physical and 15 intangible capital, such as innovation and training, and failings in the labour market such as immobility of labour and under-employment of skilled workers. Some economists explain this by using the concept of an output gap. (Source: adapted from http://www.bankofengland.co.uk/publications/ Documents/quarterlybulletin/2014/qb14q201.pdf)
(b) With reference to Figures 4 and 5 and your own knowledge, examine the relationship between the national debt as a proportion of GDP and the fiscal deficit. (8)
June 2017 · Paper 3 · Q2(c) 12 marks AO1=2, AO2=2, AO3=4, AO4=4 12-mark response revenues costs and profits
Data and extracts for question 2The UK economy Figure 4: UK national debt as a percentage of GDP 90 Forecast 80 70 60 % of 50 GDP 40 30 20 10 0 (Source: http://budgetresponsibility.org.uk/docs/dlm_uploads/BriefGuide_020511.pdf) Figure 5: UK fiscal deficit, public sector net borrowing (PSNB) 80 Forecast 40 £ billion 0 –40 –80 –120 –160 (Source: http://budgetresponsibility.org.uk/docs/dlm_uploads/BriefGuide_020511.pdf) Figure 6: Labour productivity per head, selected countries UK Spain France Indices: 2008 Q1(base) = 100 120 115 110 105 100 Index 95 90 85 80 75 1999 2001 2003 2005 2007 2009 2011 2013 (Source: http://www.bankofengland.co.uk/publications/Documents/ quarterlybulletin/2014/qb14q201.pdf) Extract C The National Living Wage (NLW) The Government has announced that from 2016 it will introduce a Living Wage Premium that will apply on top of the National Minimum Wage (NMW) for employees aged 25 and over to deliver a National Living Wage (NLW) for those people. The main NMW will continue to be set for all employees aged 21 and over, so that those aged 21 to 24 will 5 continue to be subject only to that rate. The effective minimum wage for the 25+ age group will therefore be over 13% higher in 2020 than would otherwise have been the case, and result in a 0.3% increase in wage costs overall. Further impacts on real GDP are estimated to be higher productivity (+0.3%) but lower average hours worked (-0.2%) and higher unemployment. Overall real 10 GDP is forecast to fall by 0.1% as a result of the NLW. However these forecasts depend on estimates of the likely elasticity of demand for labour. Academic evidence suggests that changes to the NMW since 1999 have led to only limited effects on demand for labour in the UK. The types of work that will be affected are relatively labour intensive, which may limit the scope for firms to substitute towards 15 using capital. Firms may also be expected to shift demand in favour of the under-25s given that they will not be subject to the NLW, which all else being equal would lead to a smaller reduction in overall labour demand. Some of the reduction in employees could also be partially offset by a rise in self-employment. But increasing the NLW to a higher proportion of median earnings may lead to bigger effects than have been experienced in 20 the past. (Sources: adapted from http://cdn.budgetresponsibility.independent.gov.uk/ July-2015-EFO-234224.pdf and http://budgetresponsibility.independent.gov.uk/) Extract D The productivity puzzle in the UK Since the onset of the 2007–2008 financial crisis, labour productivity growth in the UK has been exceptionally weak. Despite some modest improvements in 2013, whole-economy output per hour remains around 16% below the level implied by its pre-crisis trend. Even taking into account possible measurement issues and changes 5 in the size of the service sector, this shortfall is large and is often referred to as the ‘productivity puzzle’. Measures of productivity can be used to inform estimates of an economy’s ability to grow without generating excessive inflationary pressure, which makes understanding recent movements important for the conduct of monetary policy. During the initial phases 10 of the recession, companies appear to have acted flexibly by holding on to labour and lowering levels of capacity utilisation in response to weak demand conditions. But the protracted weakness in productivity and the strength in employment growth over the past two years suggest that other factors are likely to be having a more persistent impact on the level of productivity. These factors are reduced investment in both physical and 15 intangible capital, such as innovation and training, and failings in the labour market such as immobility of labour and under-employment of skilled workers. Some economists explain this by using the concept of an output gap. (Source: adapted from http://www.bankofengland.co.uk/publications/ Documents/quarterlybulletin/2014/qb14q201.pdf)
(c) Discuss the likely impact of the National Living Wage on the profitability of firms. Use a cost and revenue diagram in your answer. (12)
June 2017 · Paper 3 · Q2(d) 25 marks AO1=4, AO2=4, AO3=8, AO4=9 25-mark essay Either/or international competitiveness
Data and extracts for question 2The UK economy Figure 4: UK national debt as a percentage of GDP 90 Forecast 80 70 60 % of 50 GDP 40 30 20 10 0 (Source: http://budgetresponsibility.org.uk/docs/dlm_uploads/BriefGuide_020511.pdf) Figure 5: UK fiscal deficit, public sector net borrowing (PSNB) 80 Forecast 40 £ billion 0 –40 –80 –120 –160 (Source: http://budgetresponsibility.org.uk/docs/dlm_uploads/BriefGuide_020511.pdf) Figure 6: Labour productivity per head, selected countries UK Spain France Indices: 2008 Q1(base) = 100 120 115 110 105 100 Index 95 90 85 80 75 1999 2001 2003 2005 2007 2009 2011 2013 (Source: http://www.bankofengland.co.uk/publications/Documents/ quarterlybulletin/2014/qb14q201.pdf) Extract C The National Living Wage (NLW) The Government has announced that from 2016 it will introduce a Living Wage Premium that will apply on top of the National Minimum Wage (NMW) for employees aged 25 and over to deliver a National Living Wage (NLW) for those people. The main NMW will continue to be set for all employees aged 21 and over, so that those aged 21 to 24 will 5 continue to be subject only to that rate. The effective minimum wage for the 25+ age group will therefore be over 13% higher in 2020 than would otherwise have been the case, and result in a 0.3% increase in wage costs overall. Further impacts on real GDP are estimated to be higher productivity (+0.3%) but lower average hours worked (-0.2%) and higher unemployment. Overall real 10 GDP is forecast to fall by 0.1% as a result of the NLW. However these forecasts depend on estimates of the likely elasticity of demand for labour. Academic evidence suggests that changes to the NMW since 1999 have led to only limited effects on demand for labour in the UK. The types of work that will be affected are relatively labour intensive, which may limit the scope for firms to substitute towards 15 using capital. Firms may also be expected to shift demand in favour of the under-25s given that they will not be subject to the NLW, which all else being equal would lead to a smaller reduction in overall labour demand. Some of the reduction in employees could also be partially offset by a rise in self-employment. But increasing the NLW to a higher proportion of median earnings may lead to bigger effects than have been experienced in 20 the past. (Sources: adapted from http://cdn.budgetresponsibility.independent.gov.uk/ July-2015-EFO-234224.pdf and http://budgetresponsibility.independent.gov.uk/) Extract D The productivity puzzle in the UK Since the onset of the 2007–2008 financial crisis, labour productivity growth in the UK has been exceptionally weak. Despite some modest improvements in 2013, whole-economy output per hour remains around 16% below the level implied by its pre-crisis trend. Even taking into account possible measurement issues and changes 5 in the size of the service sector, this shortfall is large and is often referred to as the ‘productivity puzzle’. Measures of productivity can be used to inform estimates of an economy’s ability to grow without generating excessive inflationary pressure, which makes understanding recent movements important for the conduct of monetary policy. During the initial phases 10 of the recession, companies appear to have acted flexibly by holding on to labour and lowering levels of capacity utilisation in response to weak demand conditions. But the protracted weakness in productivity and the strength in employment growth over the past two years suggest that other factors are likely to be having a more persistent impact on the level of productivity. These factors are reduced investment in both physical and 15 intangible capital, such as innovation and training, and failings in the labour market such as immobility of labour and under-employment of skilled workers. Some economists explain this by using the concept of an output gap. (Source: adapted from http://www.bankofengland.co.uk/publications/ Documents/quarterlybulletin/2014/qb14q201.pdf)
(d) With reference to the information provided and your own knowledge, evaluate the likely microeconomic and macroeconomic influences on the UK’s international competitiveness. (25)
June 2017 · Paper 3 · Q2(e) 25 marks AO1=4, AO2=4, AO3=8, AO4=9 25-mark essay Either/or public finances and taxation
Data and extracts for question 2The UK economy Figure 4: UK national debt as a percentage of GDP 90 Forecast 80 70 60 % of 50 GDP 40 30 20 10 0 (Source: http://budgetresponsibility.org.uk/docs/dlm_uploads/BriefGuide_020511.pdf) Figure 5: UK fiscal deficit, public sector net borrowing (PSNB) 80 Forecast 40 £ billion 0 –40 –80 –120 –160 (Source: http://budgetresponsibility.org.uk/docs/dlm_uploads/BriefGuide_020511.pdf) Figure 6: Labour productivity per head, selected countries UK Spain France Indices: 2008 Q1(base) = 100 120 115 110 105 100 Index 95 90 85 80 75 1999 2001 2003 2005 2007 2009 2011 2013 (Source: http://www.bankofengland.co.uk/publications/Documents/ quarterlybulletin/2014/qb14q201.pdf) Extract C The National Living Wage (NLW) The Government has announced that from 2016 it will introduce a Living Wage Premium that will apply on top of the National Minimum Wage (NMW) for employees aged 25 and over to deliver a National Living Wage (NLW) for those people. The main NMW will continue to be set for all employees aged 21 and over, so that those aged 21 to 24 will 5 continue to be subject only to that rate. The effective minimum wage for the 25+ age group will therefore be over 13% higher in 2020 than would otherwise have been the case, and result in a 0.3% increase in wage costs overall. Further impacts on real GDP are estimated to be higher productivity (+0.3%) but lower average hours worked (-0.2%) and higher unemployment. Overall real 10 GDP is forecast to fall by 0.1% as a result of the NLW. However these forecasts depend on estimates of the likely elasticity of demand for labour. Academic evidence suggests that changes to the NMW since 1999 have led to only limited effects on demand for labour in the UK. The types of work that will be affected are relatively labour intensive, which may limit the scope for firms to substitute towards 15 using capital. Firms may also be expected to shift demand in favour of the under-25s given that they will not be subject to the NLW, which all else being equal would lead to a smaller reduction in overall labour demand. Some of the reduction in employees could also be partially offset by a rise in self-employment. But increasing the NLW to a higher proportion of median earnings may lead to bigger effects than have been experienced in 20 the past. (Sources: adapted from http://cdn.budgetresponsibility.independent.gov.uk/ July-2015-EFO-234224.pdf and http://budgetresponsibility.independent.gov.uk/) Extract D The productivity puzzle in the UK Since the onset of the 2007–2008 financial crisis, labour productivity growth in the UK has been exceptionally weak. Despite some modest improvements in 2013, whole-economy output per hour remains around 16% below the level implied by its pre-crisis trend. Even taking into account possible measurement issues and changes 5 in the size of the service sector, this shortfall is large and is often referred to as the ‘productivity puzzle’. Measures of productivity can be used to inform estimates of an economy’s ability to grow without generating excessive inflationary pressure, which makes understanding recent movements important for the conduct of monetary policy. During the initial phases 10 of the recession, companies appear to have acted flexibly by holding on to labour and lowering levels of capacity utilisation in response to weak demand conditions. But the protracted weakness in productivity and the strength in employment growth over the past two years suggest that other factors are likely to be having a more persistent impact on the level of productivity. These factors are reduced investment in both physical and 15 intangible capital, such as innovation and training, and failings in the labour market such as immobility of labour and under-employment of skilled workers. Some economists explain this by using the concept of an output gap. (Source: adapted from http://www.bankofengland.co.uk/publications/ Documents/quarterlybulletin/2014/qb14q201.pdf)
(e) With reference to the information provided and your own knowledge, evaluate the microeconomic and macroeconomic effects of a government policy of cutting public expenditure rather than raising taxes as a means of reducing a fiscal deficit. (25)

Work with an Edexcel economics tutor

Want a paper marked and gone through with you? Message us.

Prefer email? Send an enquiry

If you are under 18, please include a parent's contact details. Enquiries go to enquiries@economicsaleveltutor.com and are deleted once handled. All tutoring is online.