June 2024: AS Paper 2

80 marks · 20 question parts · Paper, mark scheme and report on Pearson's site

Question by question

QTopicMarksAOType
1(a) Economic growth, output gaps and the trade cycle 1Multiple choice
1(b) Measuring economic growth: GDP, GNI and living standards 3AO1=1,AO2=1,AO3=1Short answer
2(a) The circular flow, national income and the multiplier 1AO1=1Definition
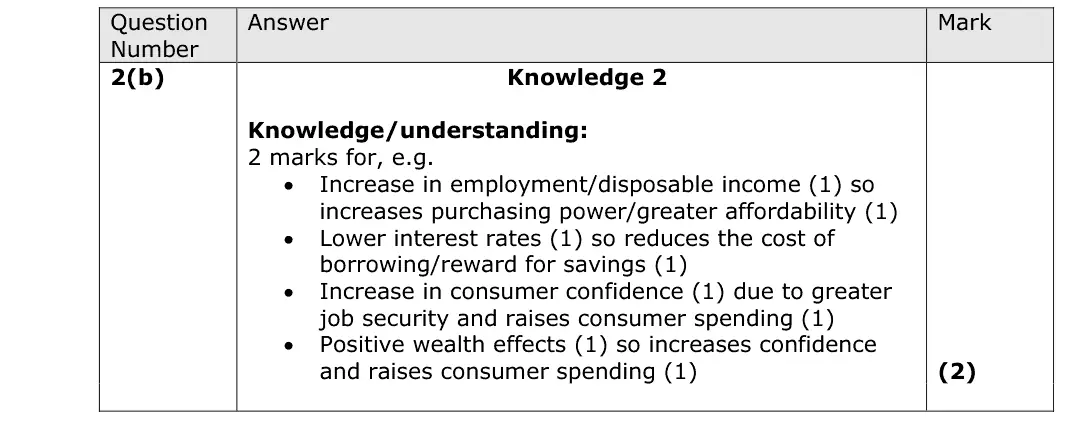
2(b) Aggregate demand 2AO1=2Short answer
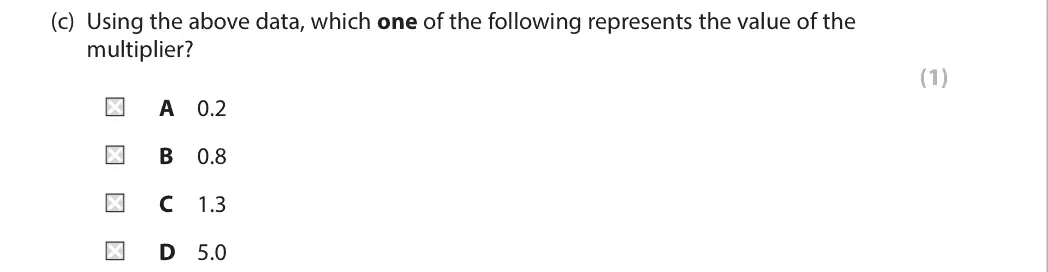
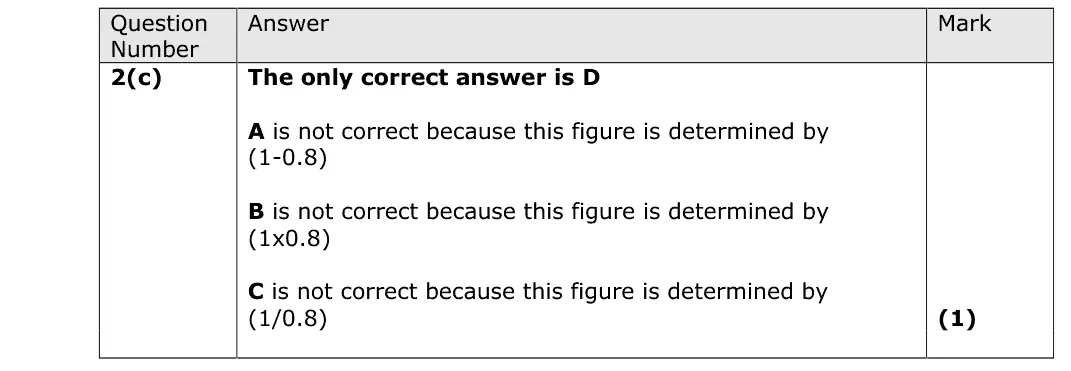
2(c) The circular flow, national income and the multiplier 1Multiple choice
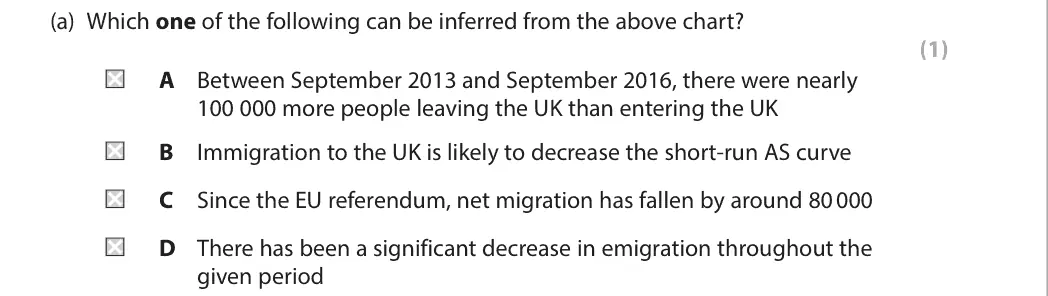
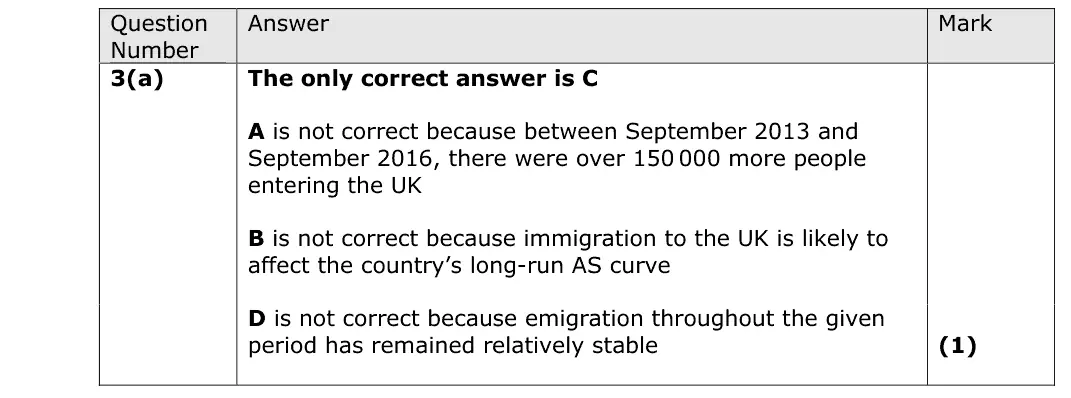
3(a) Employment and unemployment 1Multiple choice
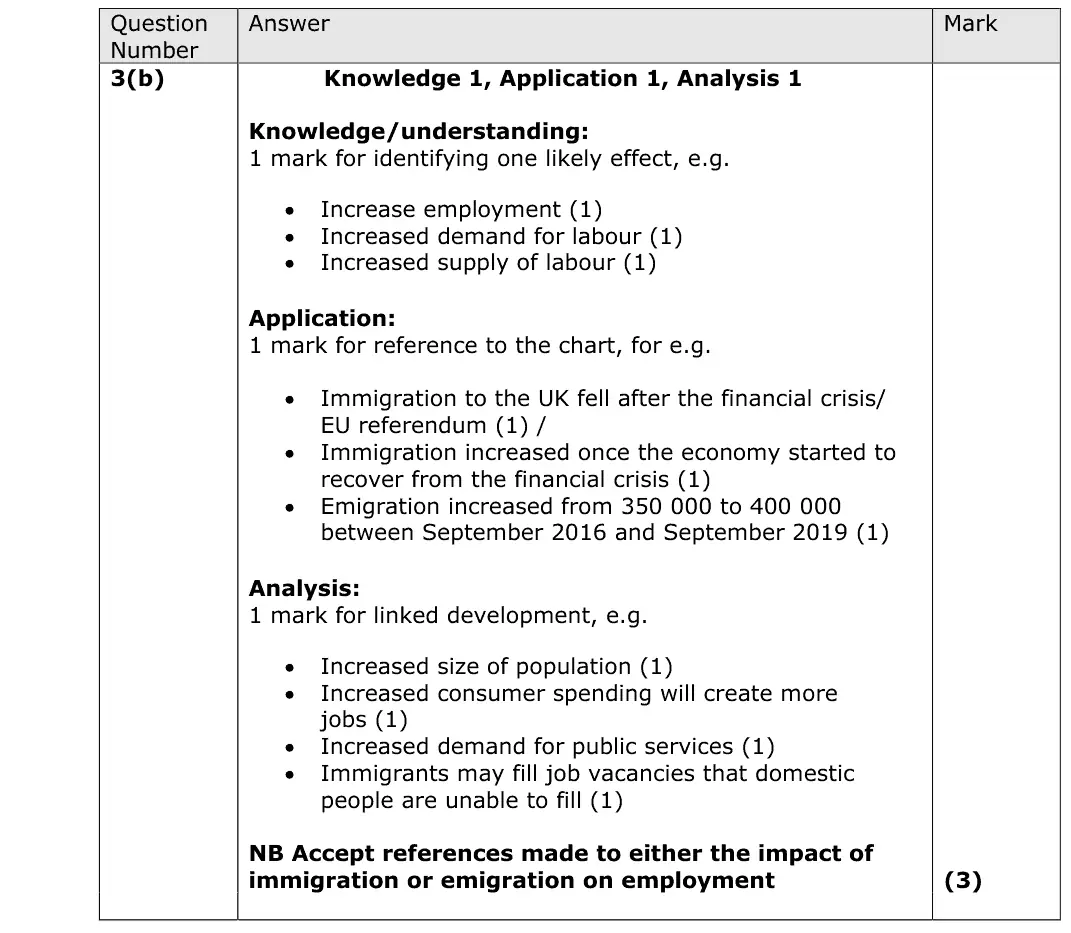
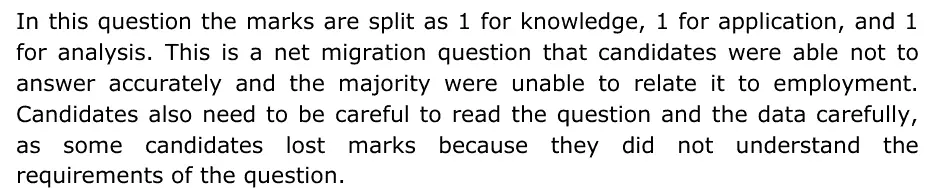
3(b) Employment and unemployment 3AO1=1,AO2=1,AO3=1Short answer
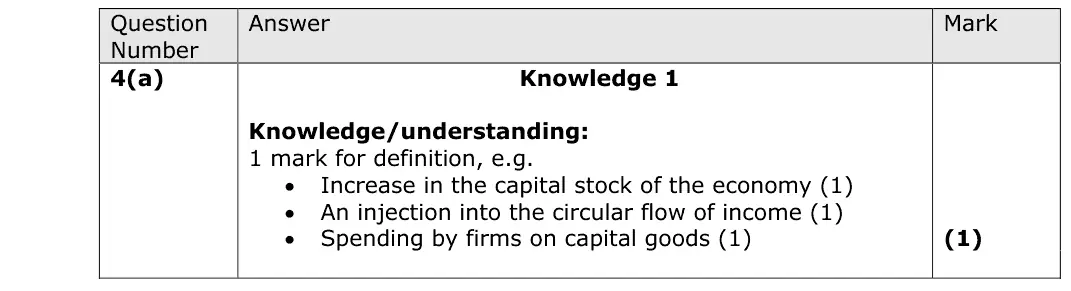
4(a) Aggregate demand 1AO1=1Definition
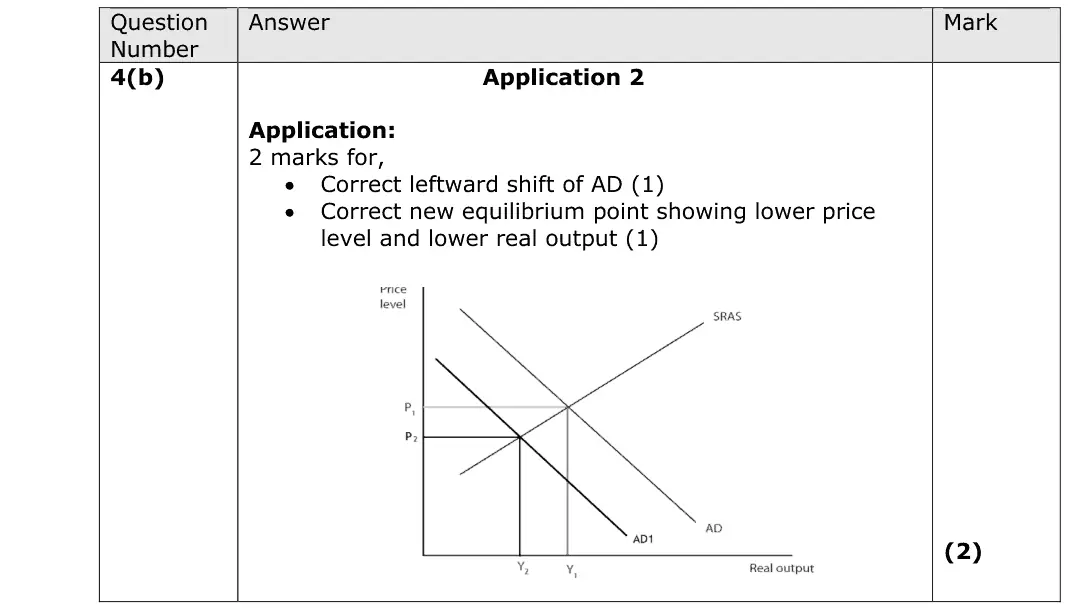
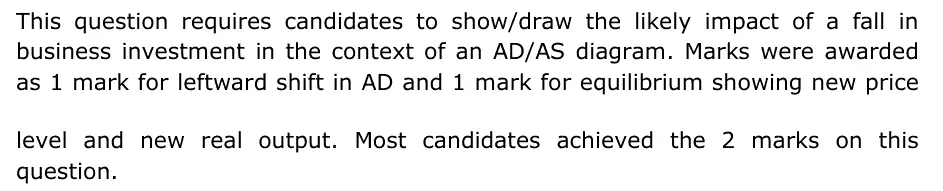
4(b) The circular flow, national income and the multiplier, Aggregate demand 2AO2=2Diagram
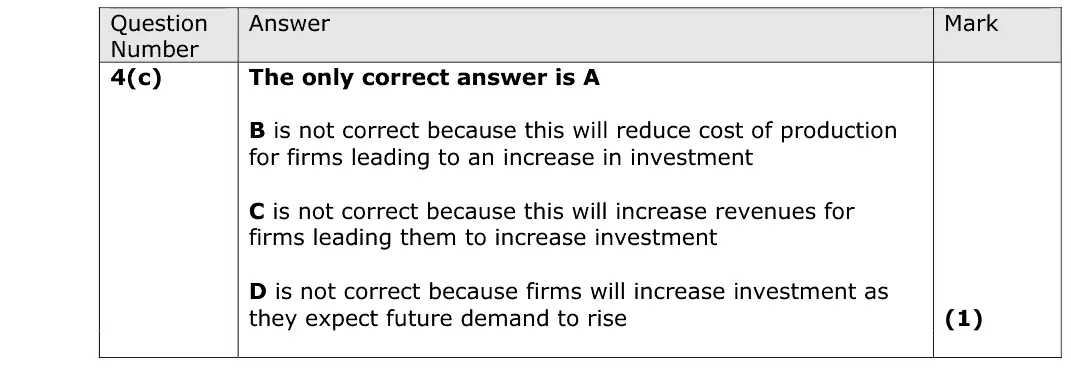
4(c) Aggregate demand 1Multiple choice
5(a) Demand-side policies: fiscal and monetary policy 1AO1=1Definition
5(b) Demand-side policies: fiscal and monetary policy 2AO2=2Calculation
5(c) Demand-side policies: fiscal and monetary policy 1Multiple choice
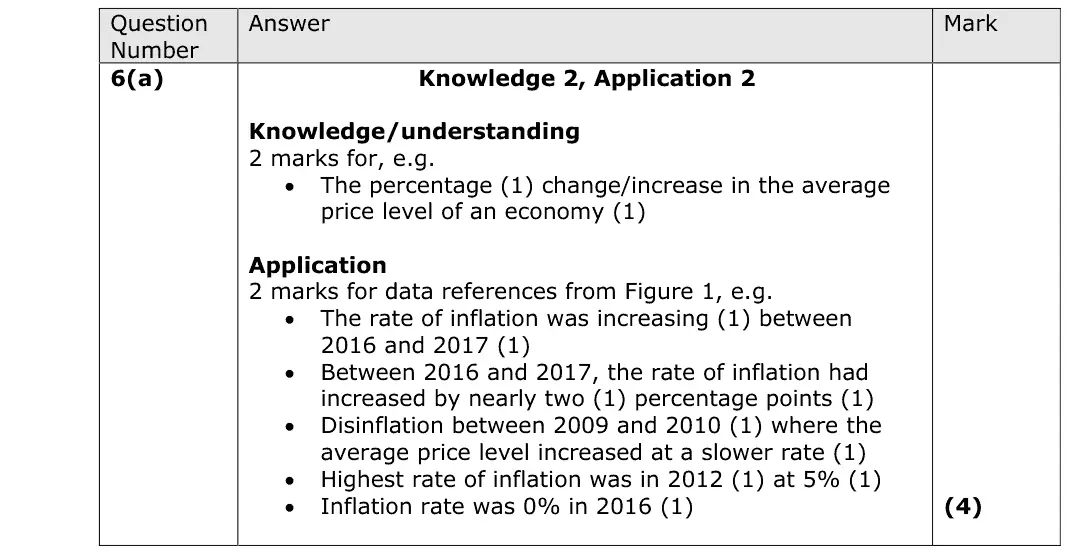
6(a) Inflation 4AO1=2,AO2=2Short answer
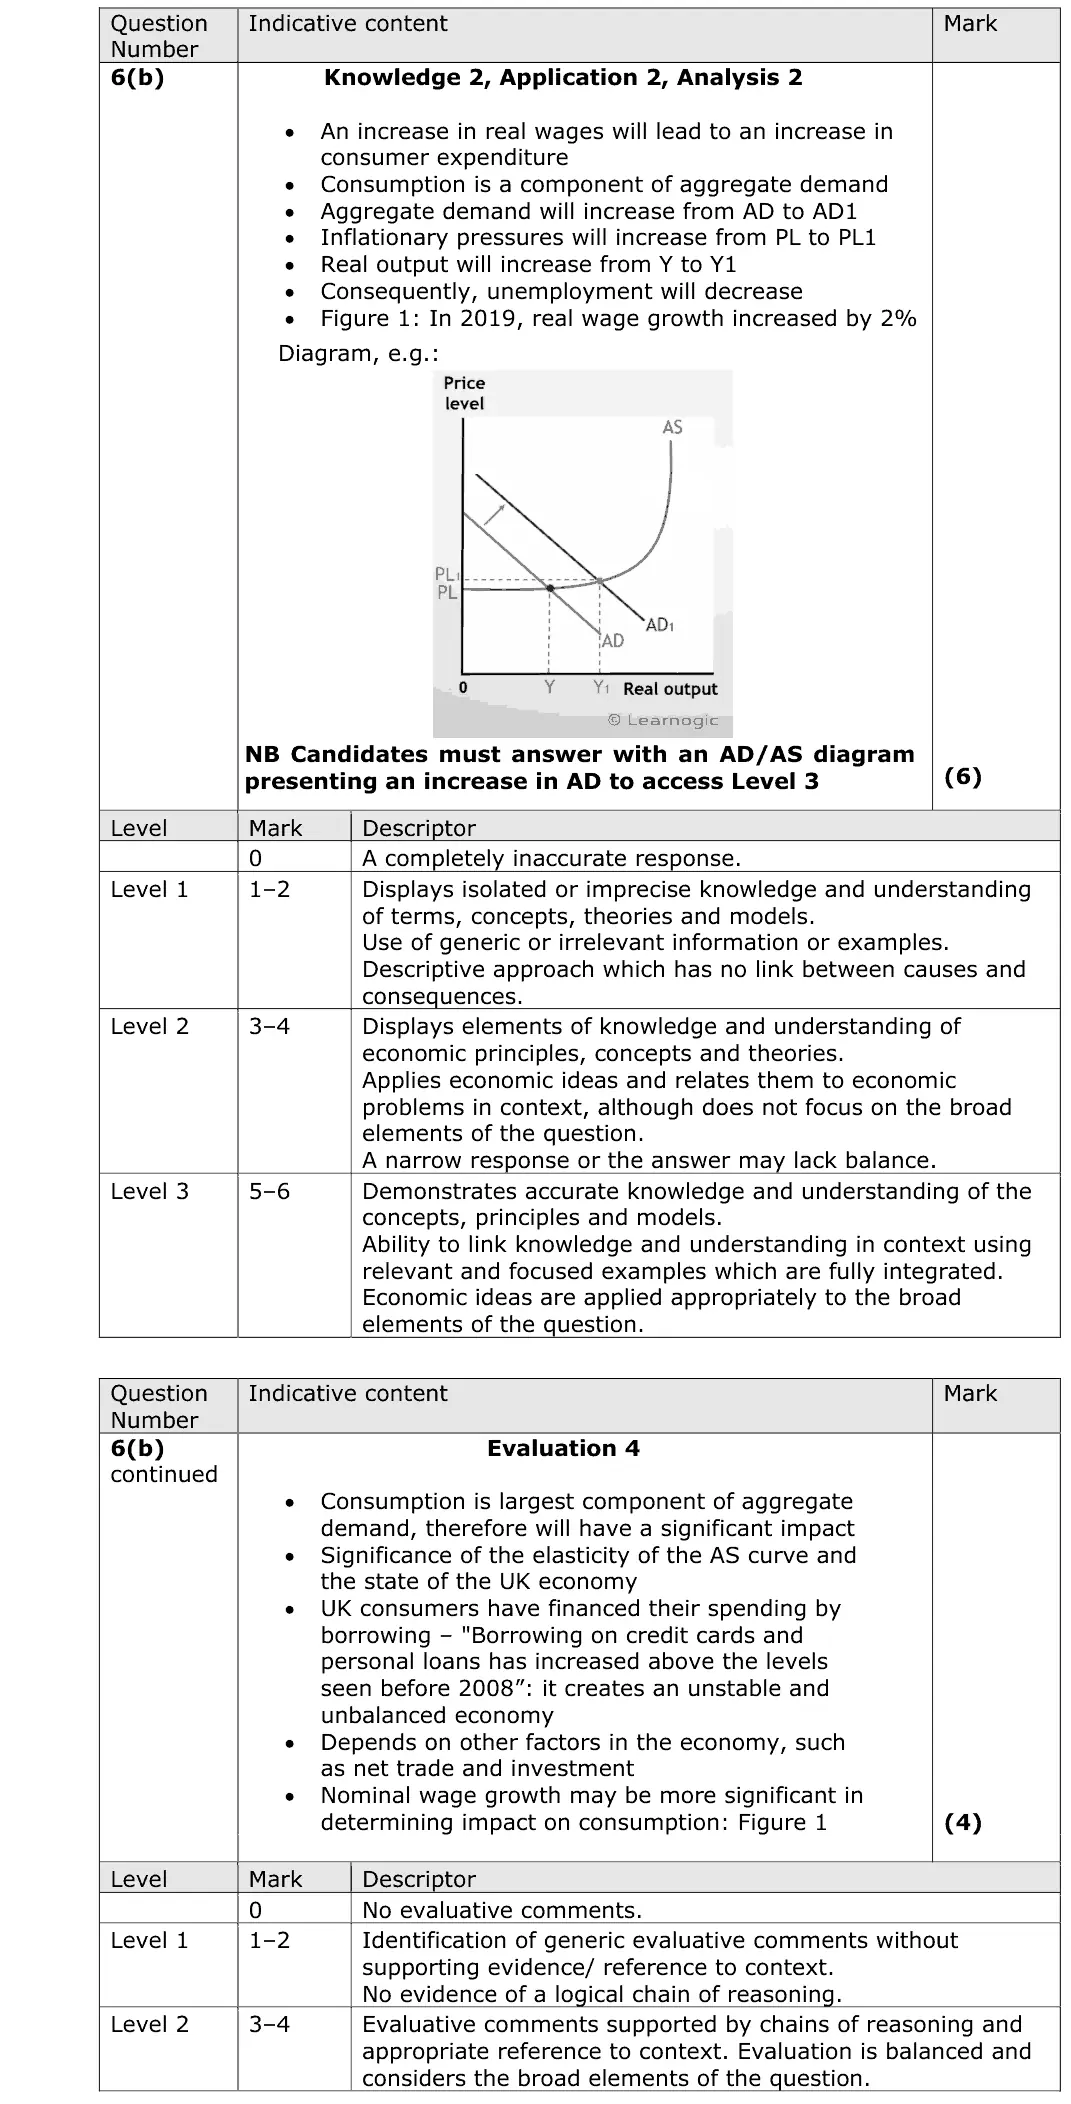
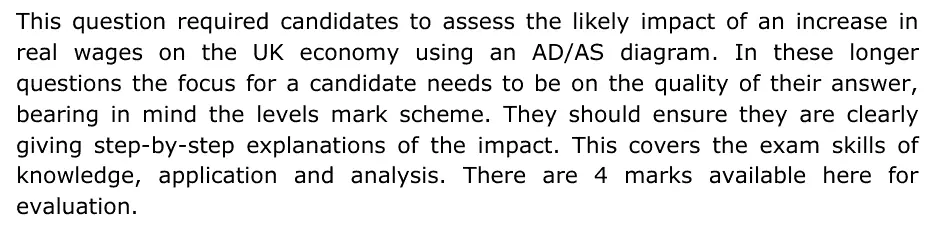
6(b) The circular flow, national income and the multiplier, Aggregate demand 10AO1=2,AO2=2,AO3=2,AO4=4Extended response
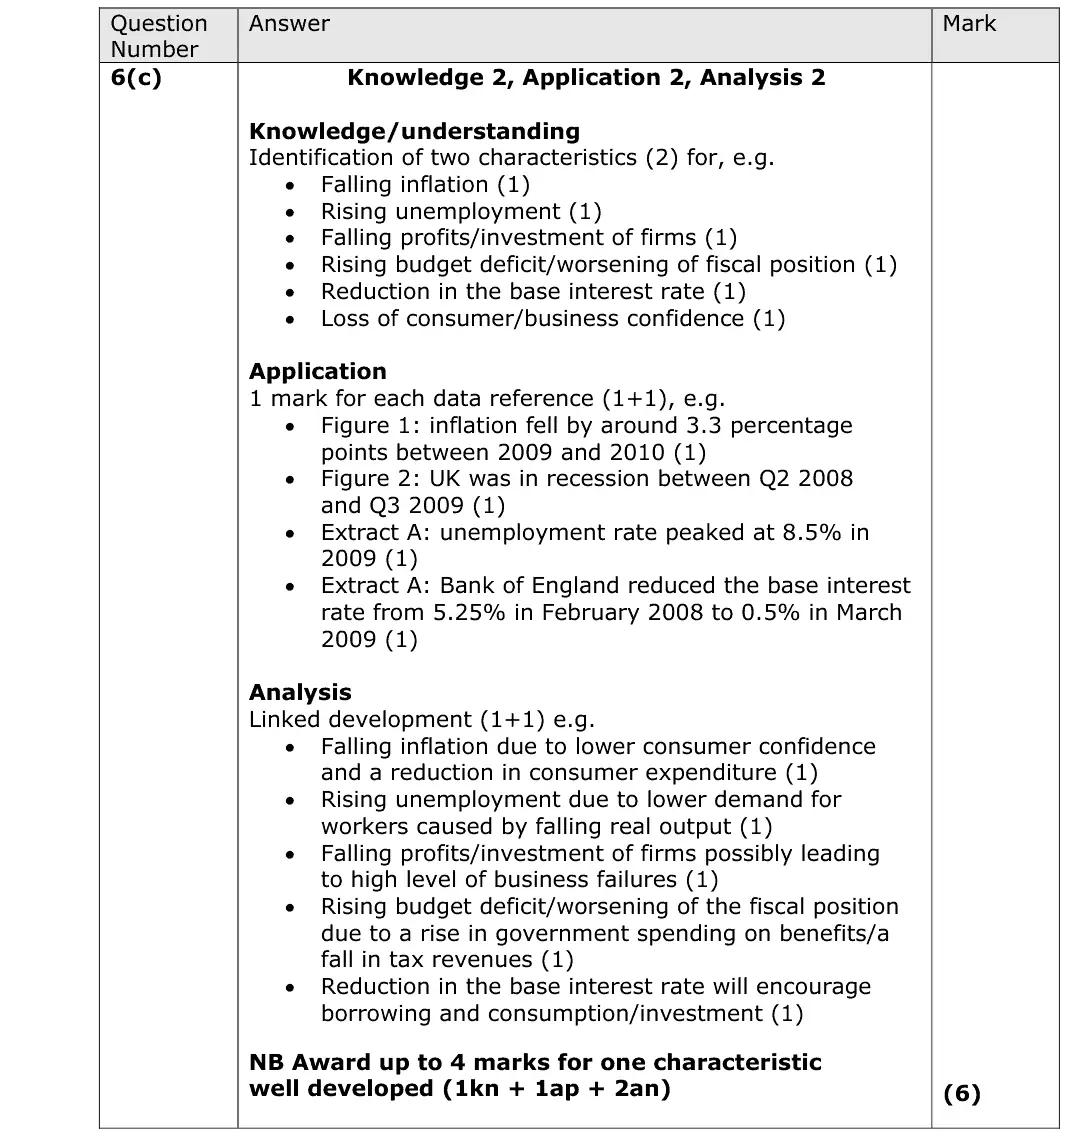
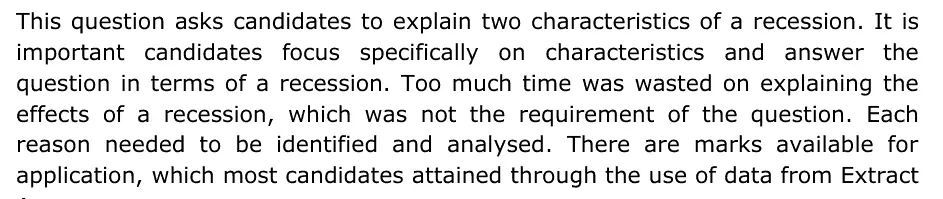
6(c) Economic growth, output gaps and the trade cycle 6AO1=2,AO2=2,AO3=2Short answer
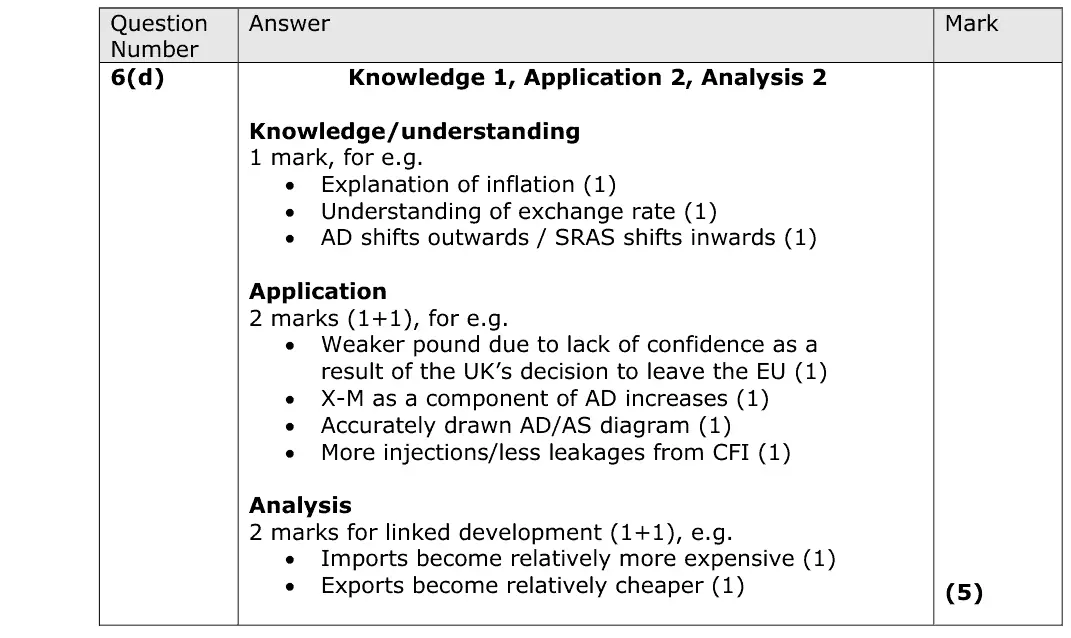
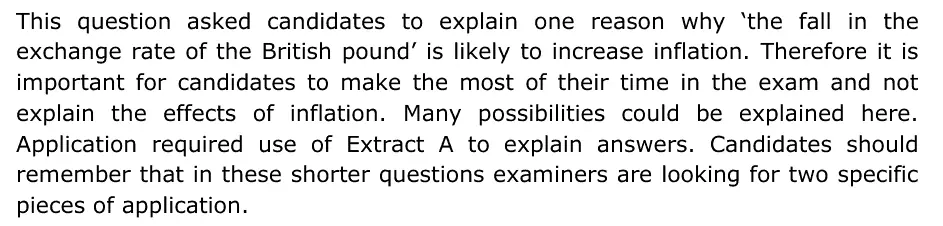
6(d) Inflation, Aggregate supply 5AO1=1,AO2=2,AO3=2Short answer
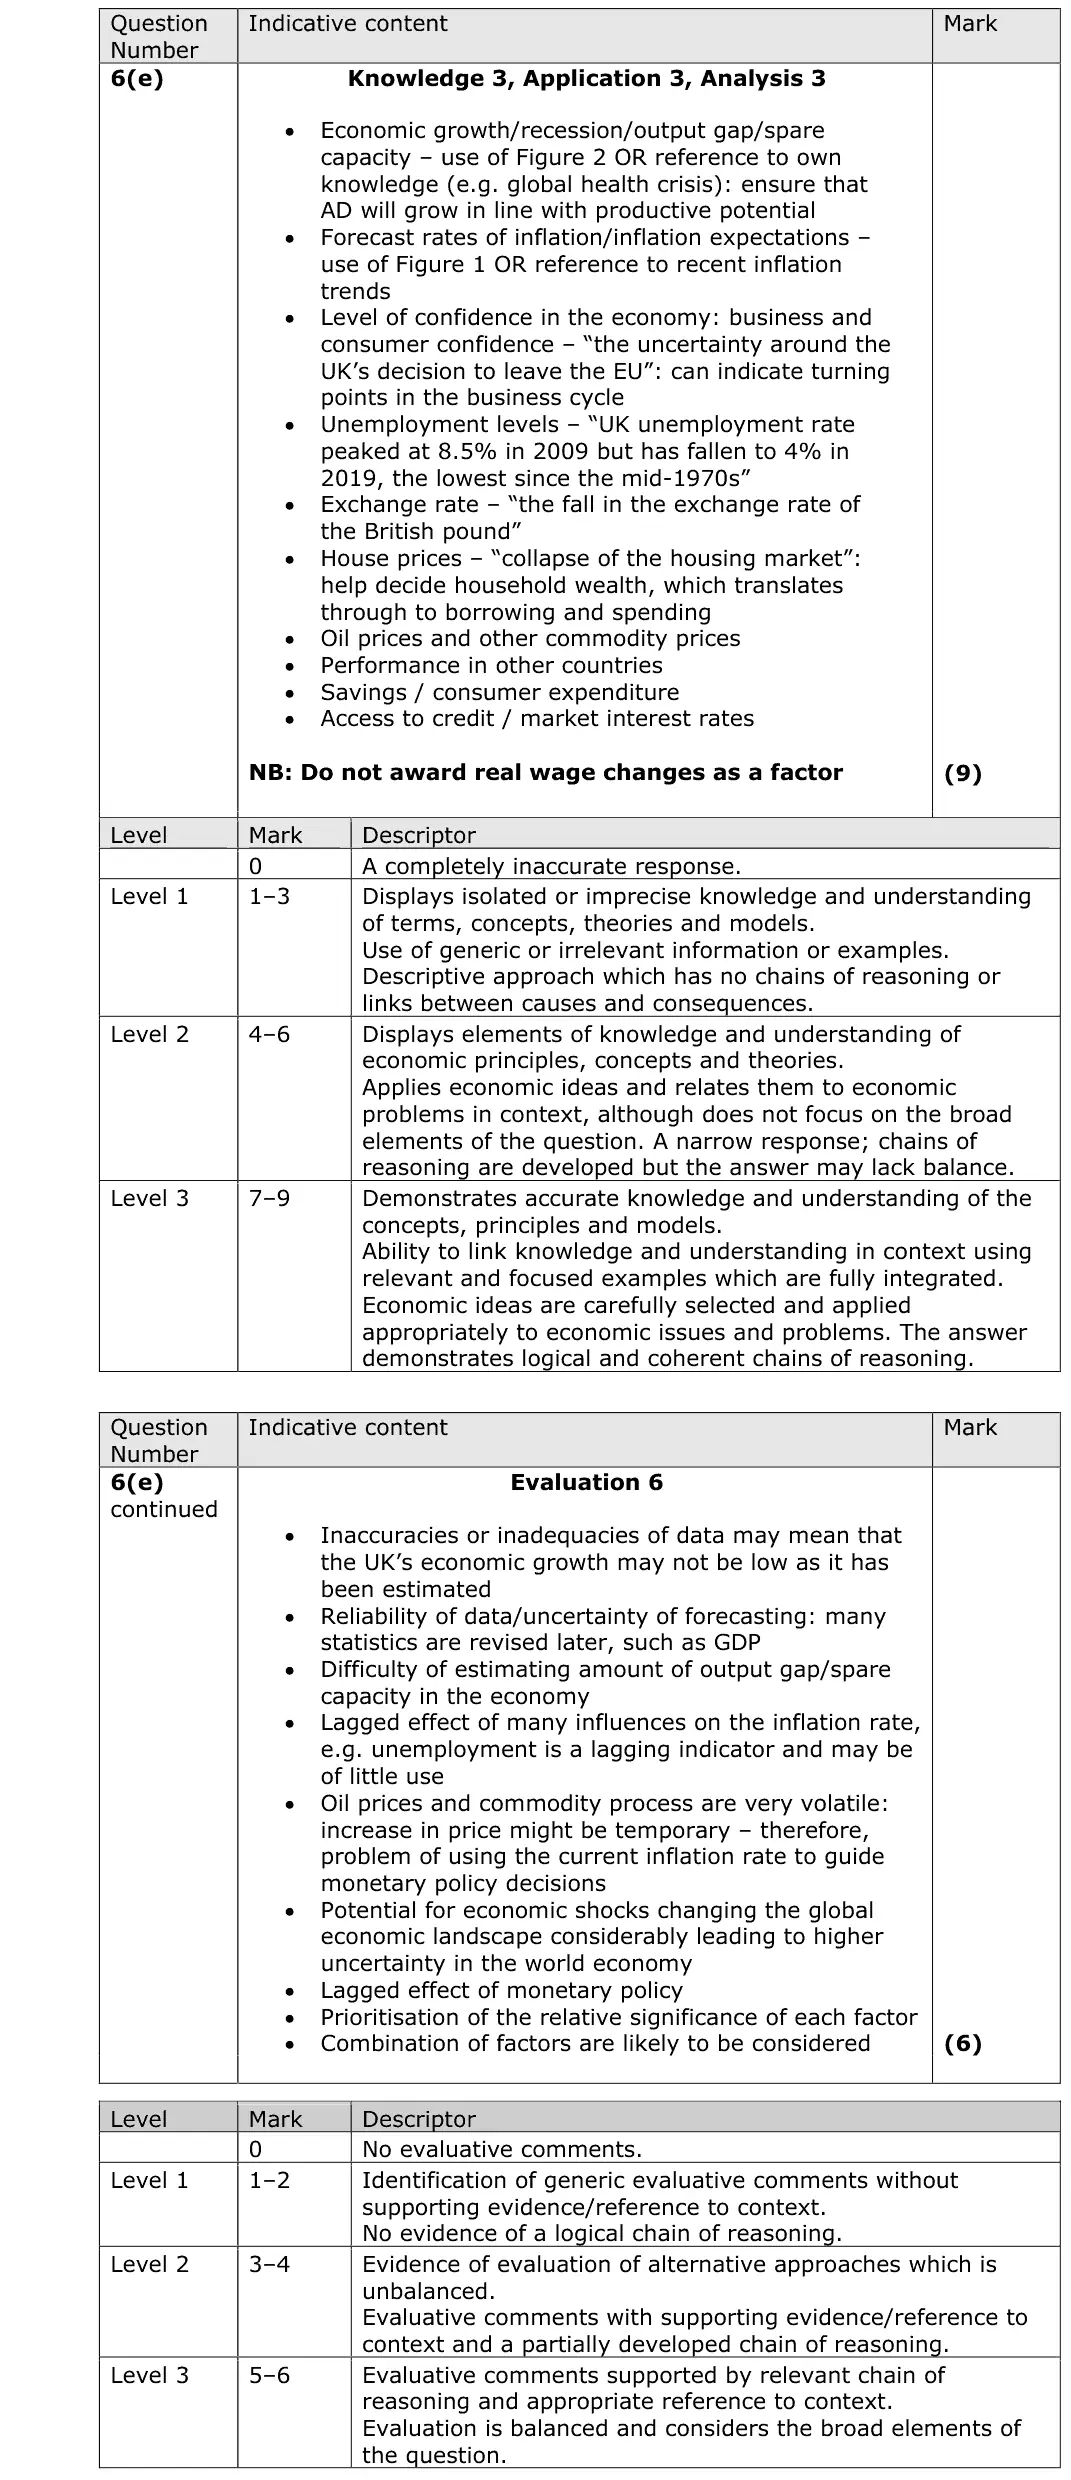
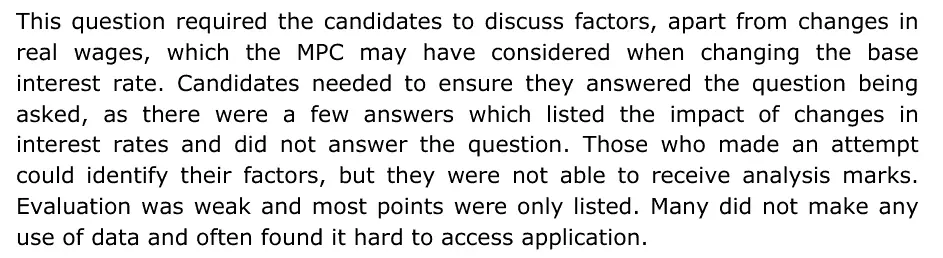
6(e) Demand-side policies: fiscal and monetary policy 15AO1=3,AO2=3,AO3=3,AO4=6Extended response
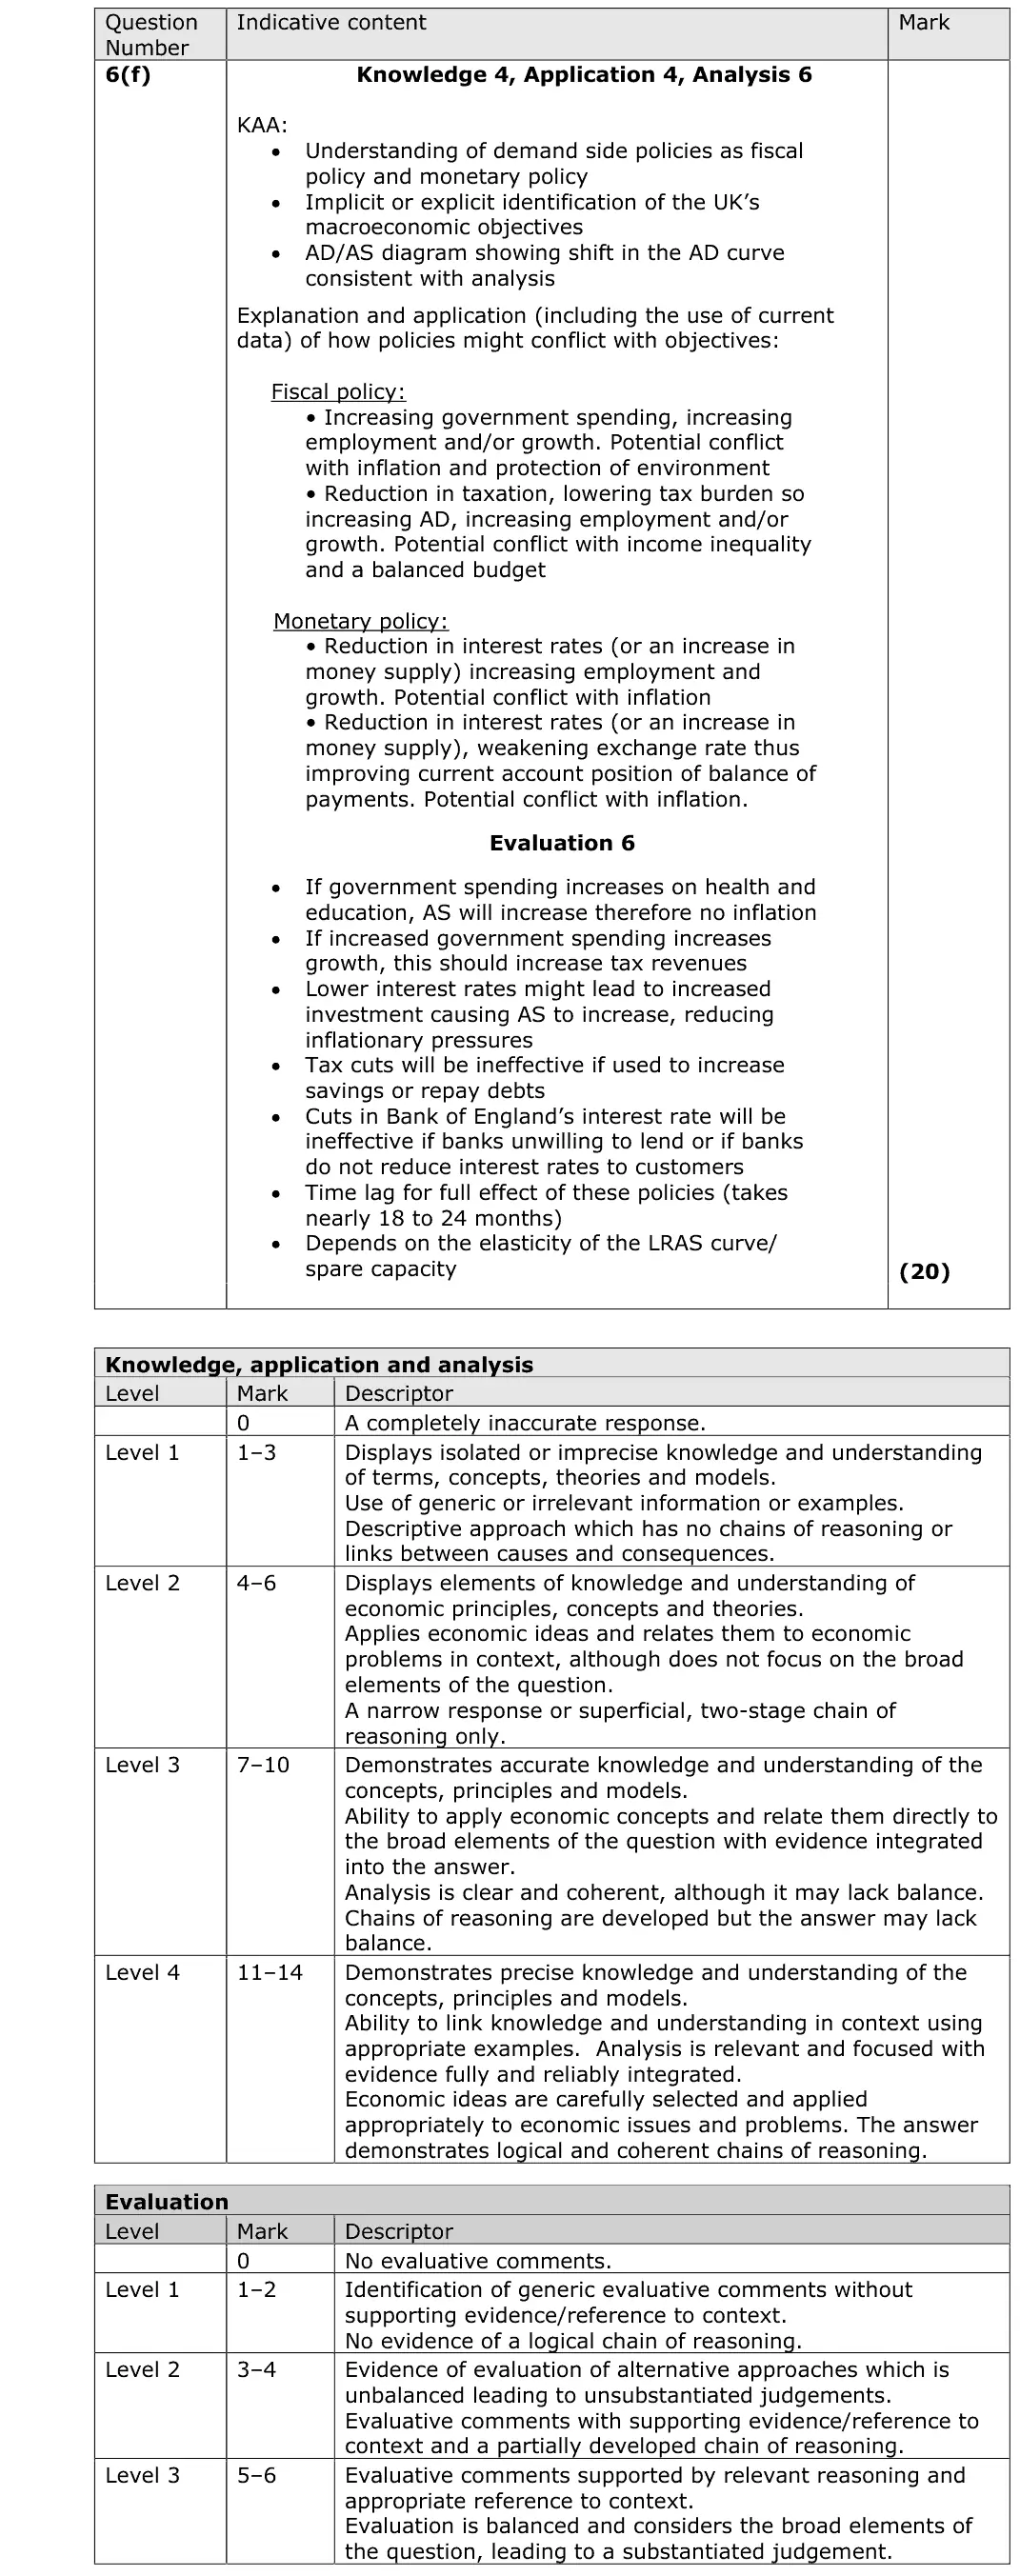
6(f) Macroeconomic objectives, conflicts and trade-offs, Demand-side policies: fiscal and monetary policy 20AO1=4,AO2=4,AO3=6,AO4=6Essay
6(g) Demand-side policies: fiscal and monetary policy, Macroeconomic objectives, conflicts and trade-offs 20AO1=4,AO2=4,AO3=6,AO4=6Essay

The questions

1(a)1(b)2(a)2(b)2(c)3(a)3(b)4(a)4(b)4(c)5(a)5(b)5(c)6(a)6(b)6(c)6(d)6(e)6(f)6(g)
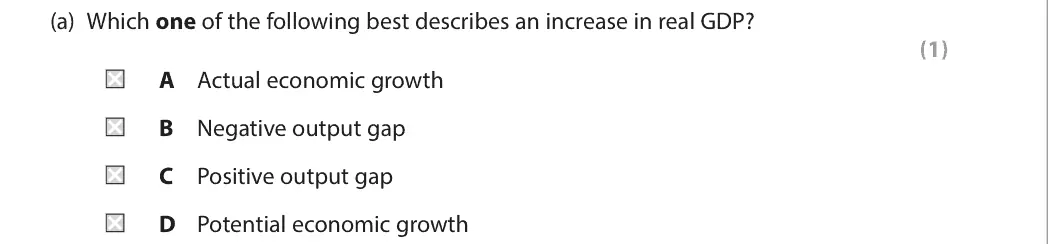
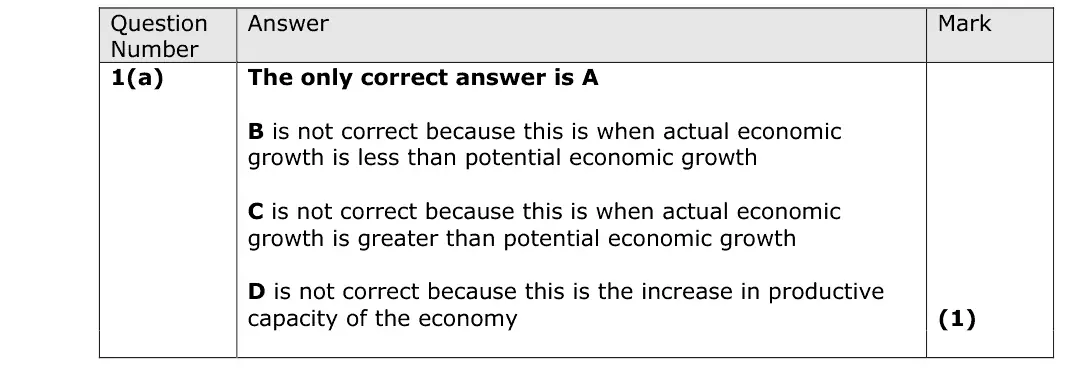
June 2024 · AS Paper 2 · Q1(a) 1 mark Multiple choice economic growth and the trade cycle
Data and extracts for question 11 In 2019 the average annual percentage increase in real Gross Domestic Product (GDP) was 1.7% in developed countries and it was 4.6% in developing countries. (Source: adapted from IMF, World Economic Outlook 2019)
(a) Which one of the following best describes an increase in real GDP? (1) A Actual economic growth B Negative output gap C Positive output gap D Potential economic growth
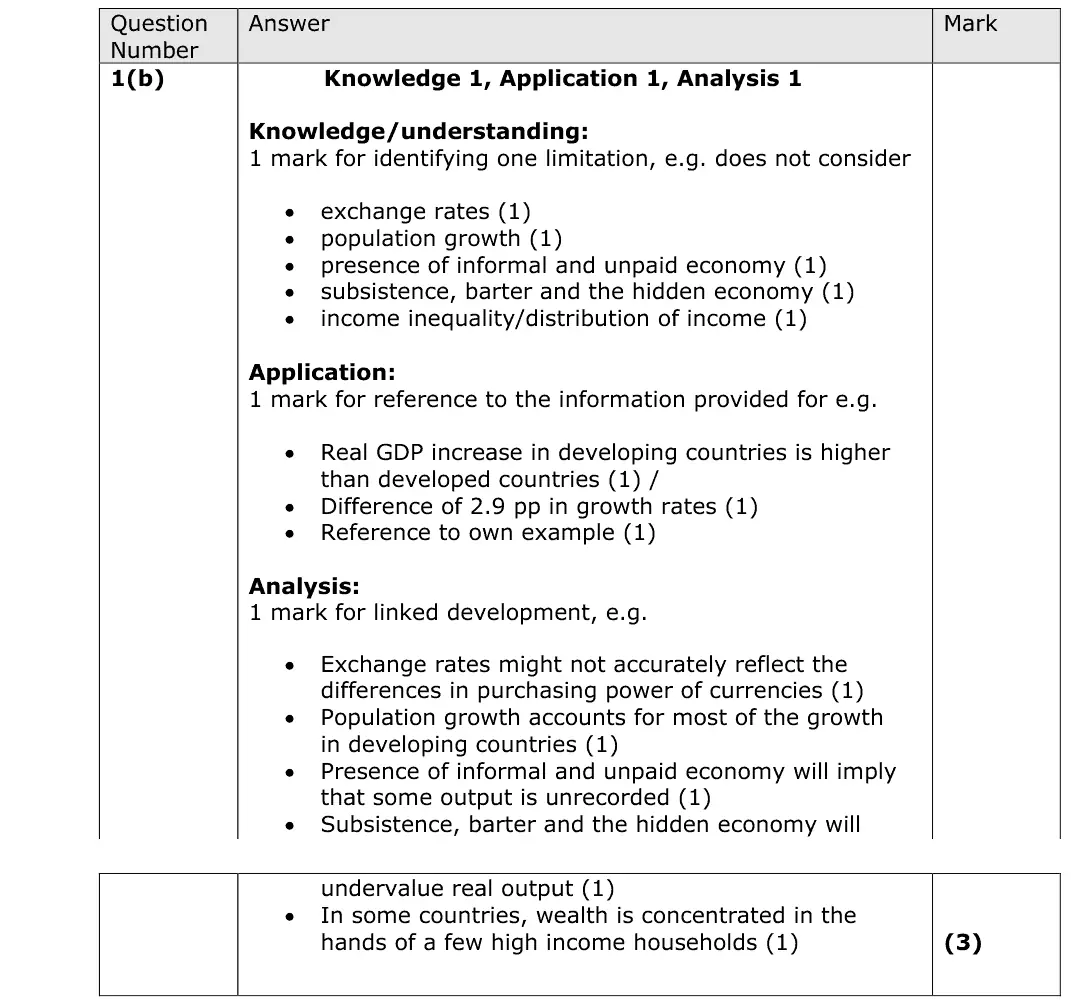
June 2024 · AS Paper 2 · Q1(b) 3 marks AO1=1, AO2=1, AO3=1 Short answer measuring economic growth
Data and extracts for question 11 In 2019 the average annual percentage increase in real Gross Domestic Product (GDP) was 1.7% in developed countries and it was 4.6% in developing countries. (Source: adapted from IMF, World Economic Outlook 2019)
(b) Explain one limitation of using GDP data to compare living standards between developed and developing countries. (3)
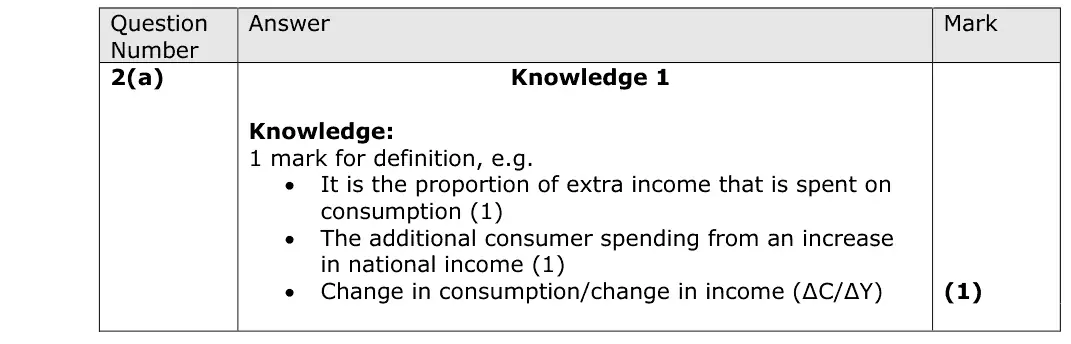
June 2024 · AS Paper 2 · Q2(a) 1 mark AO1=1 Definition Hard national income and the multiplier
Data and extracts for question 22 In 2019 the marginal propensity to consume in the UK was estimated to be 0.8.
(a) Define the term ‘marginal propensity to consume’. (1)
June 2024 · AS Paper 2 · Q2(b) 2 marks AO1=2 Short answer aggregate demand
Data and extracts for question 22 In 2019 the marginal propensity to consume in the UK was estimated to be 0.8.
(b) Explain one likely factor that could increase the level of consumption of UK households. (2)
June 2024 · AS Paper 2 · Q2(c) 1 mark Multiple choice national income and the multiplier
Data and extracts for question 22 In 2019 the marginal propensity to consume in the UK was estimated to be 0.8.
(c) Using the above data, which one of the following represents the value of the multiplier? (1) A 0.2 B 0.8 C 1.3 D 5.0
June 2024 · AS Paper 2 · Q3(a) 1 mark Multiple choice unemployment
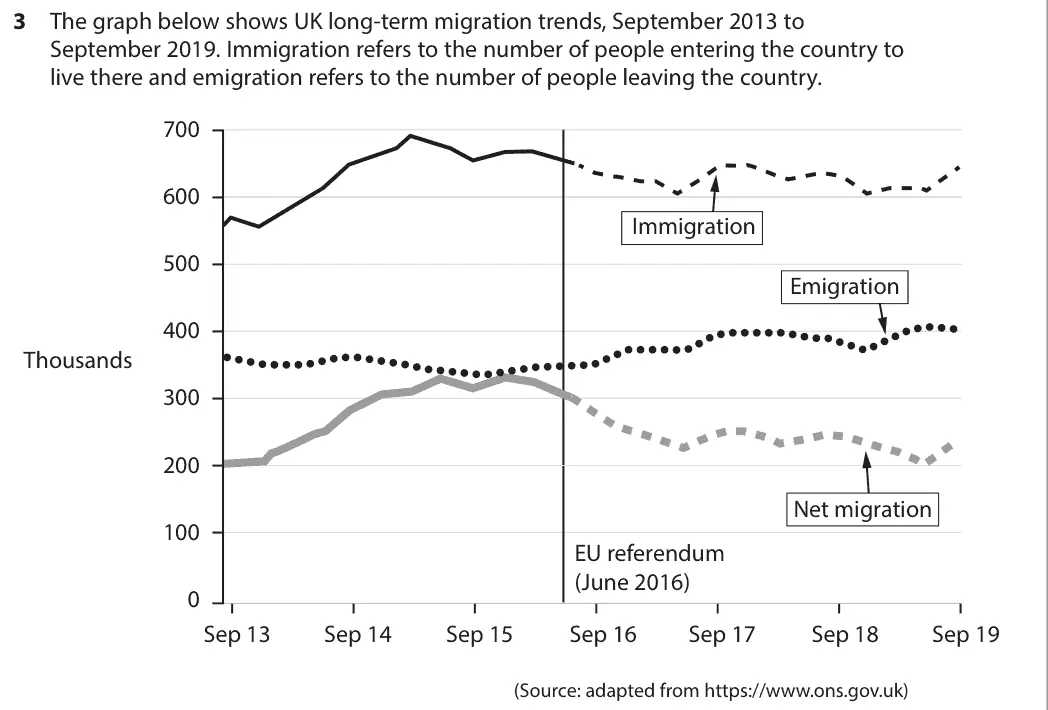
Data and extracts for question 33 The graph below shows UK long-term migration trends, September 2013 to September 2019. Immigration refers to the number of people entering the country to live there and emigration refers to the number of people leaving the country. 700 600 Immigration 500 Emigration 400 Thousands 300 200 Net migration 100 EU referendum (June 2016) 0 Sep 13 Sep 14 Sep 15 Sep 16 Sep 17 Sep 18 Sep 19 (Source: adapted from https://www.ons.gov.uk)
(a) Which one of the following can be inferred from the above chart? (1) A Between September 2013 and September 2016, there were nearly 100 000 more people leaving the UK than entering the UK B Immigration to the UK is likely to decrease the short-run AS curve C Since the EU referendum, net migration has fallen by around 80 000 D There has been a significant decrease in emigration throughout the given period
June 2024 · AS Paper 2 · Q3(b) 3 marks AO1=1, AO2=1, AO3=1 Short answer Hard unemployment
Data and extracts for question 33 The graph below shows UK long-term migration trends, September 2013 to September 2019. Immigration refers to the number of people entering the country to live there and emigration refers to the number of people leaving the country. 700 600 Immigration 500 Emigration 400 Thousands 300 200 Net migration 100 EU referendum (June 2016) 0 Sep 13 Sep 14 Sep 15 Sep 16 Sep 17 Sep 18 Sep 19 (Source: adapted from https://www.ons.gov.uk)
(b) With reference to the above chart, explain one likely effect of migration on employment in the UK. (3)
June 2024 · AS Paper 2 · Q4(a) 1 mark AO1=1 Definition aggregate demand
Data and extracts for question 44 Business investment fell by 0.5% between Quarter 3 2019 and Quarter 4 2019. (Source: adapted from https://www.ons.gov.uk)
(a) Define the term ‘investment’. (1)
June 2024 · AS Paper 2 · Q4(b) 2 marks AO2=2 Diagram national income and the multiplieraggregate demand
Data and extracts for question 44 Business investment fell by 0.5% between Quarter 3 2019 and Quarter 4 2019. (Source: adapted from https://www.ons.gov.uk)
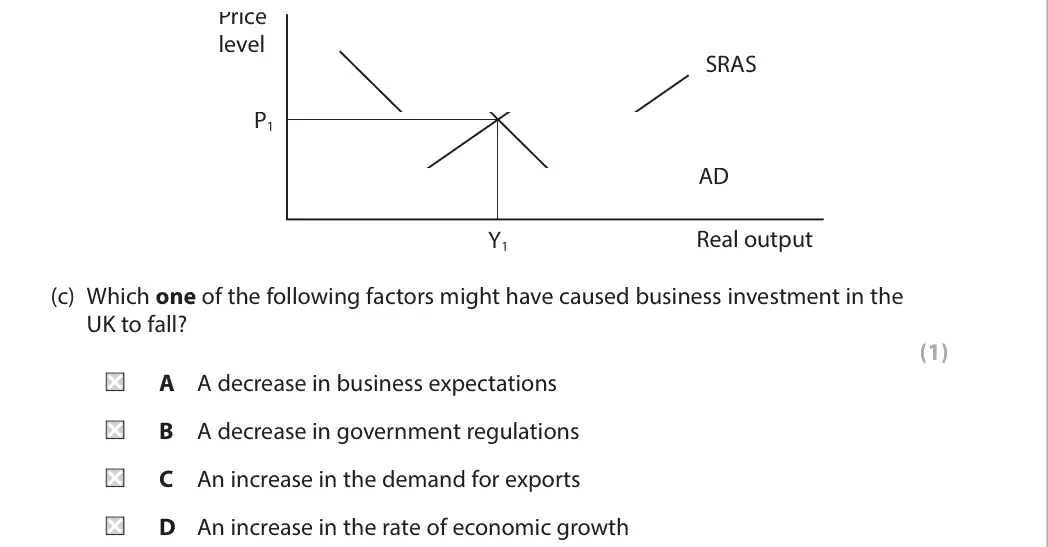
(b) Annotate the aggregate demand (AD) and short-run aggregate supply (SRAS) diagram below to show the likely impact of a fall in business investment on the equilibrium level of real output and the price level. (2)
June 2024 · AS Paper 2 · Q4(c) 1 mark Multiple choice aggregate demand
Data and extracts for question 44 Business investment fell by 0.5% between Quarter 3 2019 and Quarter 4 2019. (Source: adapted from https://www.ons.gov.uk)
Price level SRAS P1 AD Real output Y1 (c) Which one of the following factors might have caused business investment in the UK to fall? (1) A A decrease in business expectations B A decrease in government regulations C An increase in the demand for exports D An increase in the rate of economic growth
June 2024 · AS Paper 2 · Q5(a) 1 mark AO1=1 Definition fiscal and monetary policy
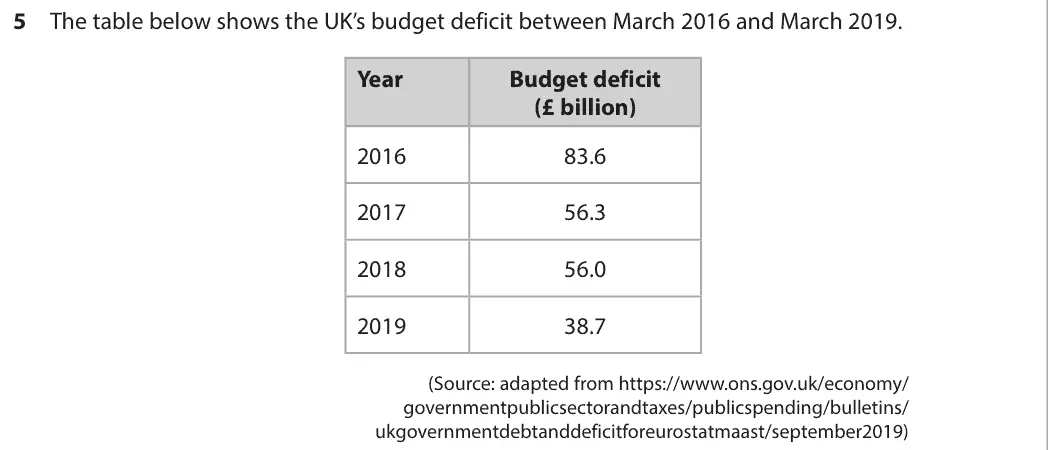
Data and extracts for question 55 The table below shows the UK’s budget deficit between March 2016 and March 2019. Year Budget deficit (£ billion) 2016 83.6 2017 56.3 2018 56.0 2019 38.7 (Source: adapted from https://www.ons.gov.uk/economy/ governmentpublicsectorandtaxes/publicspending/bulletins/ ukgovernmentdebtanddeficitforeurostatmaast/september2019)
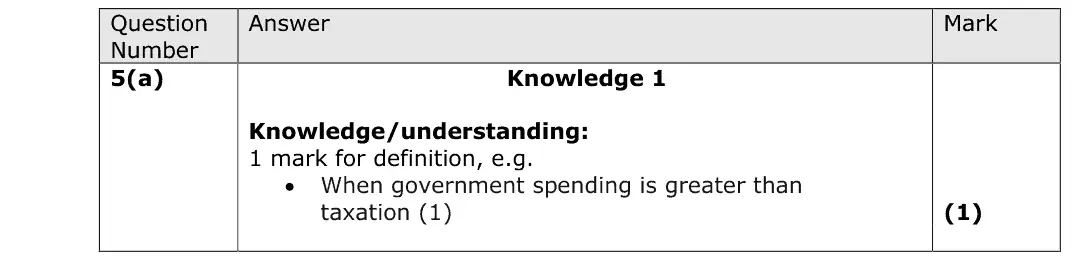
(a) Define the term ‘budget deficit’. (1)
June 2024 · AS Paper 2 · Q5(b) 2 marks AO2=2 Calculation fiscal and monetary policy
Data and extracts for question 55 The table below shows the UK’s budget deficit between March 2016 and March 2019. Year Budget deficit (£ billion) 2016 83.6 2017 56.3 2018 56.0 2019 38.7 (Source: adapted from https://www.ons.gov.uk/economy/ governmentpublicsectorandtaxes/publicspending/bulletins/ ukgovernmentdebtanddeficitforeurostatmaast/september2019)
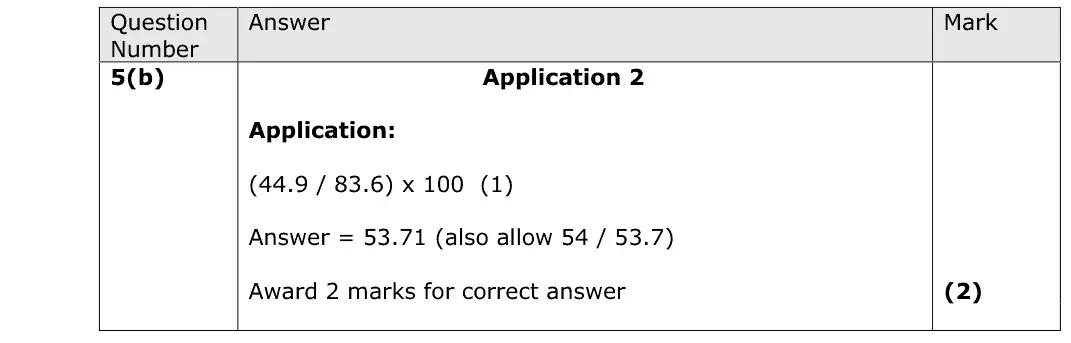
(b) Using the above table, calculate the percentage decrease in budget deficit between March 2016 and March 2019. You are advised to show your working. (2)
June 2024 · AS Paper 2 · Q5(c) 1 mark Multiple choice fiscal and monetary policy
Data and extracts for question 55 The table below shows the UK’s budget deficit between March 2016 and March 2019. Year Budget deficit (£ billion) 2016 83.6 2017 56.3 2018 56.0 2019 38.7 (Source: adapted from https://www.ons.gov.uk/economy/ governmentpublicsectorandtaxes/publicspending/bulletins/ ukgovernmentdebtanddeficitforeurostatmaast/september2019)
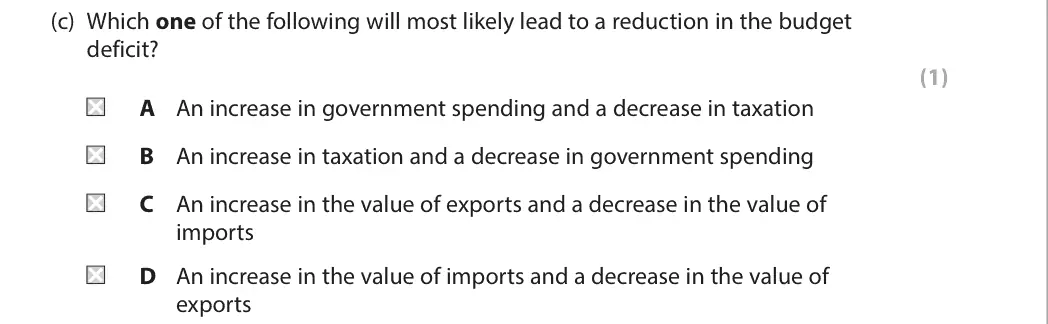
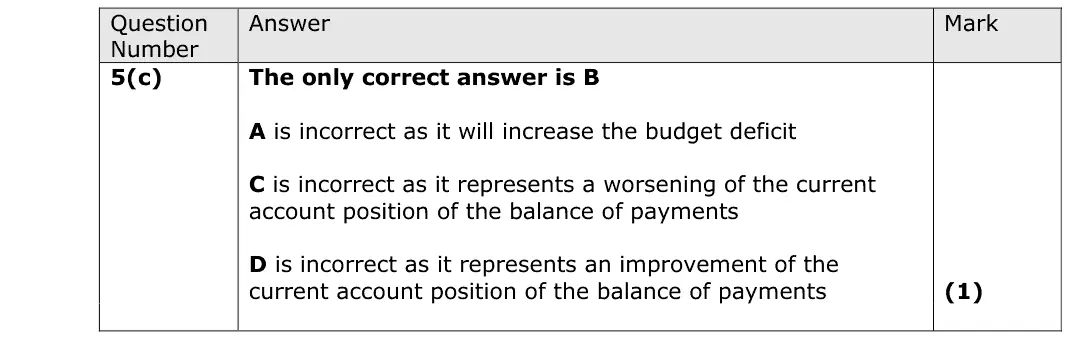
(c) Which one of the following will most likely lead to a reduction in the budget deficit? (1) A An increase in government spending and a decrease in taxation B An increase in taxation and a decrease in government spending C An increase in the value of exports and a decrease in the value of imports D An increase in the value of imports and a decrease in the value of exports
June 2024 · AS Paper 2 · Q6(a) 4 marks AO1=2, AO2=2 Short answer inflation
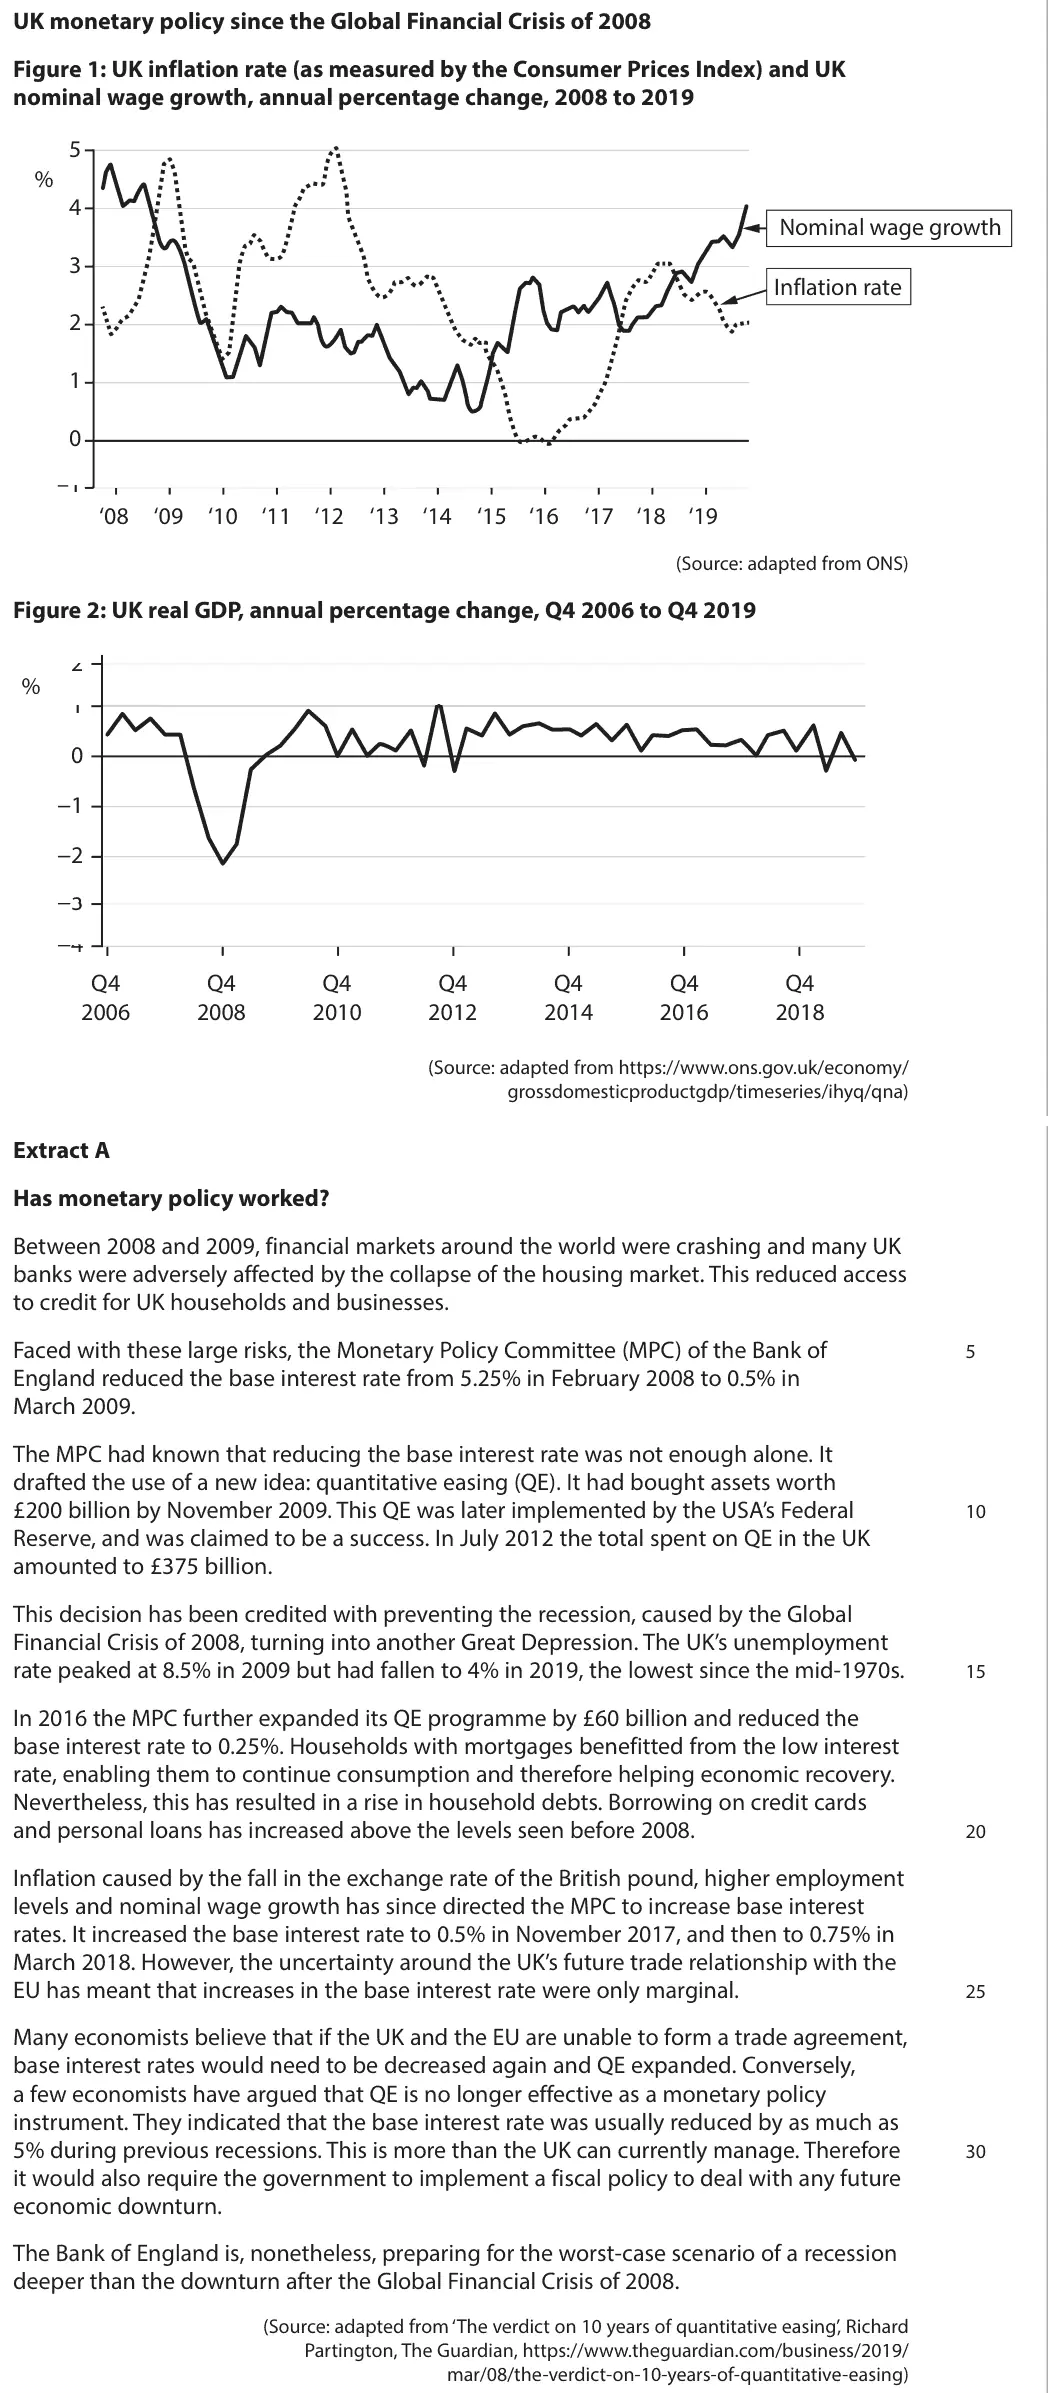
Data and extracts for question 6UK monetary policy since the Global Financial Crisis of 2008 Figure 1: UK inflation rate (as measured by the Consumer Prices Index) and UK nominal wage growth, annual percentage change, 2008 to 2019 5 % 4 Nominal wage growth 3 Inflation rate 2 1 0 –1 ‘08 ‘09 ‘10 ‘11 ‘12 ‘13 ‘14 ‘15 ‘16 ‘17 ‘18 ‘19 (Source: adapted from ONS) Figure 2: UK real GDP, annual percentage change, Q4 2006 to Q4 2019 2 % 1 0 -1 -2 -3 -4 Q4 Q4 Q4 Q4 Q4 Q4 Q4 2006 2008 2010 2012 2014 2016 2018 (Source: adapted from https://www.ons.gov.uk/economy/ grossdomesticproductgdp/timeseries/ihyq/qna) Extract A Has monetary policy worked? Between 2008 and 2009, financial markets around the world were crashing and many UK banks were adversely affected by the collapse of the housing market. This reduced access to credit for UK households and businesses. Faced with these large risks, the Monetary Policy Committee (MPC) of the Bank of 5 England reduced the base interest rate from 5.25% in February 2008 to 0.5% in March 2009. The MPC had known that reducing the base interest rate was not enough alone. It drafted the use of a new idea: quantitative easing (QE). It had bought assets worth £200 billion by November 2009. This QE was later implemented by the USA’s Federal 10 Reserve, and was claimed to be a success. In July 2012 the total spent on QE in the UK amounted to £375 billion. This decision has been credited with preventing the recession, caused by the Global Financial Crisis of 2008, turning into another Great Depression. The UK’s unemployment rate peaked at 8.5% in 2009 but had fallen to 4% in 2019, the lowest since the mid-1970s. 15 In 2016 the MPC further expanded its QE programme by £60 billion and reduced the base interest rate to 0.25%. Households with mortgages benefitted from the low interest rate, enabling them to continue consumption and therefore helping economic recovery. Nevertheless, this has resulted in a rise in household debts. Borrowing on credit cards and personal loans has increased above the levels seen before 2008. 20 Inflation caused by the fall in the exchange rate of the British pound, higher employment levels and nominal wage growth has since directed the MPC to increase base interest rates. It increased the base interest rate to 0.5% in November 2017, and then to 0.75% in March 2018. However, the uncertainty around the UK’s future trade relationship with the EU has meant that increases in the base interest rate were only marginal. 25 Many economists believe that if the UK and the EU are unable to form a trade agreement, base interest rates would need to be decreased again and QE expanded. Conversely, a few economists have argued that QE is no longer effective as a monetary policy instrument. They indicated that the base interest rate was usually reduced by as much as 5% during previous recessions. This is more than the UK can currently manage. Therefore 30 it would also require the government to implement a fiscal policy to deal with any future economic downturn. The Bank of England is, nonetheless, preparing for the worst-case scenario of a recession deeper than the downturn after the Global Financial Crisis of 2008. (Source: adapted from ‘The verdict on 10 years of quantitative easing’, Richard Partington, The Guardian, https://www.theguardian.com/business/2019/ mar/08/the-verdict-on-10-years-of-quantitative-easing)
(a) With reference to Figure 1, explain the term ‘inflation rate’. (4)
June 2024 · AS Paper 2 · Q6(b) 10 marks AO1=2, AO2=2, AO3=2, AO4=4 10-mark response national income and the multiplieraggregate demand
Data and extracts for question 6UK monetary policy since the Global Financial Crisis of 2008 Figure 1: UK inflation rate (as measured by the Consumer Prices Index) and UK nominal wage growth, annual percentage change, 2008 to 2019 5 % 4 Nominal wage growth 3 Inflation rate 2 1 0 –1 ‘08 ‘09 ‘10 ‘11 ‘12 ‘13 ‘14 ‘15 ‘16 ‘17 ‘18 ‘19 (Source: adapted from ONS) Figure 2: UK real GDP, annual percentage change, Q4 2006 to Q4 2019 2 % 1 0 -1 -2 -3 -4 Q4 Q4 Q4 Q4 Q4 Q4 Q4 2006 2008 2010 2012 2014 2016 2018 (Source: adapted from https://www.ons.gov.uk/economy/ grossdomesticproductgdp/timeseries/ihyq/qna) Extract A Has monetary policy worked? Between 2008 and 2009, financial markets around the world were crashing and many UK banks were adversely affected by the collapse of the housing market. This reduced access to credit for UK households and businesses. Faced with these large risks, the Monetary Policy Committee (MPC) of the Bank of 5 England reduced the base interest rate from 5.25% in February 2008 to 0.5% in March 2009. The MPC had known that reducing the base interest rate was not enough alone. It drafted the use of a new idea: quantitative easing (QE). It had bought assets worth £200 billion by November 2009. This QE was later implemented by the USA’s Federal 10 Reserve, and was claimed to be a success. In July 2012 the total spent on QE in the UK amounted to £375 billion. This decision has been credited with preventing the recession, caused by the Global Financial Crisis of 2008, turning into another Great Depression. The UK’s unemployment rate peaked at 8.5% in 2009 but had fallen to 4% in 2019, the lowest since the mid-1970s. 15 In 2016 the MPC further expanded its QE programme by £60 billion and reduced the base interest rate to 0.25%. Households with mortgages benefitted from the low interest rate, enabling them to continue consumption and therefore helping economic recovery. Nevertheless, this has resulted in a rise in household debts. Borrowing on credit cards and personal loans has increased above the levels seen before 2008. 20 Inflation caused by the fall in the exchange rate of the British pound, higher employment levels and nominal wage growth has since directed the MPC to increase base interest rates. It increased the base interest rate to 0.5% in November 2017, and then to 0.75% in March 2018. However, the uncertainty around the UK’s future trade relationship with the EU has meant that increases in the base interest rate were only marginal. 25 Many economists believe that if the UK and the EU are unable to form a trade agreement, base interest rates would need to be decreased again and QE expanded. Conversely, a few economists have argued that QE is no longer effective as a monetary policy instrument. They indicated that the base interest rate was usually reduced by as much as 5% during previous recessions. This is more than the UK can currently manage. Therefore 30 it would also require the government to implement a fiscal policy to deal with any future economic downturn. The Bank of England is, nonetheless, preparing for the worst-case scenario of a recession deeper than the downturn after the Global Financial Crisis of 2008. (Source: adapted from ‘The verdict on 10 years of quantitative easing’, Richard Partington, The Guardian, https://www.theguardian.com/business/2019/ mar/08/the-verdict-on-10-years-of-quantitative-easing)
(b) Assess the likely impact of an increase in real wages on the UK economy. Use an aggregate demand and aggregate supply diagram in your answer. (10)
June 2024 · AS Paper 2 · Q6(c) 6 marks AO1=2, AO2=2, AO3=2 Short answer economic growth and the trade cycle
Data and extracts for question 6UK monetary policy since the Global Financial Crisis of 2008 Figure 1: UK inflation rate (as measured by the Consumer Prices Index) and UK nominal wage growth, annual percentage change, 2008 to 2019 5 % 4 Nominal wage growth 3 Inflation rate 2 1 0 –1 ‘08 ‘09 ‘10 ‘11 ‘12 ‘13 ‘14 ‘15 ‘16 ‘17 ‘18 ‘19 (Source: adapted from ONS) Figure 2: UK real GDP, annual percentage change, Q4 2006 to Q4 2019 2 % 1 0 -1 -2 -3 -4 Q4 Q4 Q4 Q4 Q4 Q4 Q4 2006 2008 2010 2012 2014 2016 2018 (Source: adapted from https://www.ons.gov.uk/economy/ grossdomesticproductgdp/timeseries/ihyq/qna) Extract A Has monetary policy worked? Between 2008 and 2009, financial markets around the world were crashing and many UK banks were adversely affected by the collapse of the housing market. This reduced access to credit for UK households and businesses. Faced with these large risks, the Monetary Policy Committee (MPC) of the Bank of 5 England reduced the base interest rate from 5.25% in February 2008 to 0.5% in March 2009. The MPC had known that reducing the base interest rate was not enough alone. It drafted the use of a new idea: quantitative easing (QE). It had bought assets worth £200 billion by November 2009. This QE was later implemented by the USA’s Federal 10 Reserve, and was claimed to be a success. In July 2012 the total spent on QE in the UK amounted to £375 billion. This decision has been credited with preventing the recession, caused by the Global Financial Crisis of 2008, turning into another Great Depression. The UK’s unemployment rate peaked at 8.5% in 2009 but had fallen to 4% in 2019, the lowest since the mid-1970s. 15 In 2016 the MPC further expanded its QE programme by £60 billion and reduced the base interest rate to 0.25%. Households with mortgages benefitted from the low interest rate, enabling them to continue consumption and therefore helping economic recovery. Nevertheless, this has resulted in a rise in household debts. Borrowing on credit cards and personal loans has increased above the levels seen before 2008. 20 Inflation caused by the fall in the exchange rate of the British pound, higher employment levels and nominal wage growth has since directed the MPC to increase base interest rates. It increased the base interest rate to 0.5% in November 2017, and then to 0.75% in March 2018. However, the uncertainty around the UK’s future trade relationship with the EU has meant that increases in the base interest rate were only marginal. 25 Many economists believe that if the UK and the EU are unable to form a trade agreement, base interest rates would need to be decreased again and QE expanded. Conversely, a few economists have argued that QE is no longer effective as a monetary policy instrument. They indicated that the base interest rate was usually reduced by as much as 5% during previous recessions. This is more than the UK can currently manage. Therefore 30 it would also require the government to implement a fiscal policy to deal with any future economic downturn. The Bank of England is, nonetheless, preparing for the worst-case scenario of a recession deeper than the downturn after the Global Financial Crisis of 2008. (Source: adapted from ‘The verdict on 10 years of quantitative easing’, Richard Partington, The Guardian, https://www.theguardian.com/business/2019/ mar/08/the-verdict-on-10-years-of-quantitative-easing)
(c) With reference to the information provided, explain two characteristics of a recession. (6)
June 2024 · AS Paper 2 · Q6(d) 5 marks AO1=1, AO2=2, AO3=2 Short answer inflationaggregate supply
Data and extracts for question 6UK monetary policy since the Global Financial Crisis of 2008 Figure 1: UK inflation rate (as measured by the Consumer Prices Index) and UK nominal wage growth, annual percentage change, 2008 to 2019 5 % 4 Nominal wage growth 3 Inflation rate 2 1 0 –1 ‘08 ‘09 ‘10 ‘11 ‘12 ‘13 ‘14 ‘15 ‘16 ‘17 ‘18 ‘19 (Source: adapted from ONS) Figure 2: UK real GDP, annual percentage change, Q4 2006 to Q4 2019 2 % 1 0 -1 -2 -3 -4 Q4 Q4 Q4 Q4 Q4 Q4 Q4 2006 2008 2010 2012 2014 2016 2018 (Source: adapted from https://www.ons.gov.uk/economy/ grossdomesticproductgdp/timeseries/ihyq/qna) Extract A Has monetary policy worked? Between 2008 and 2009, financial markets around the world were crashing and many UK banks were adversely affected by the collapse of the housing market. This reduced access to credit for UK households and businesses. Faced with these large risks, the Monetary Policy Committee (MPC) of the Bank of 5 England reduced the base interest rate from 5.25% in February 2008 to 0.5% in March 2009. The MPC had known that reducing the base interest rate was not enough alone. It drafted the use of a new idea: quantitative easing (QE). It had bought assets worth £200 billion by November 2009. This QE was later implemented by the USA’s Federal 10 Reserve, and was claimed to be a success. In July 2012 the total spent on QE in the UK amounted to £375 billion. This decision has been credited with preventing the recession, caused by the Global Financial Crisis of 2008, turning into another Great Depression. The UK’s unemployment rate peaked at 8.5% in 2009 but had fallen to 4% in 2019, the lowest since the mid-1970s. 15 In 2016 the MPC further expanded its QE programme by £60 billion and reduced the base interest rate to 0.25%. Households with mortgages benefitted from the low interest rate, enabling them to continue consumption and therefore helping economic recovery. Nevertheless, this has resulted in a rise in household debts. Borrowing on credit cards and personal loans has increased above the levels seen before 2008. 20 Inflation caused by the fall in the exchange rate of the British pound, higher employment levels and nominal wage growth has since directed the MPC to increase base interest rates. It increased the base interest rate to 0.5% in November 2017, and then to 0.75% in March 2018. However, the uncertainty around the UK’s future trade relationship with the EU has meant that increases in the base interest rate were only marginal. 25 Many economists believe that if the UK and the EU are unable to form a trade agreement, base interest rates would need to be decreased again and QE expanded. Conversely, a few economists have argued that QE is no longer effective as a monetary policy instrument. They indicated that the base interest rate was usually reduced by as much as 5% during previous recessions. This is more than the UK can currently manage. Therefore 30 it would also require the government to implement a fiscal policy to deal with any future economic downturn. The Bank of England is, nonetheless, preparing for the worst-case scenario of a recession deeper than the downturn after the Global Financial Crisis of 2008. (Source: adapted from ‘The verdict on 10 years of quantitative easing’, Richard Partington, The Guardian, https://www.theguardian.com/business/2019/ mar/08/the-verdict-on-10-years-of-quantitative-easing)
(d) Explain one reason why ‘the fall in the exchange rate of the British pound’ (Extract A, line 21) is likely to increase inflation. (5)
June 2024 · AS Paper 2 · Q6(e) 15 marks AO1=3, AO2=3, AO3=3, AO4=6 15-mark response Hard fiscal and monetary policy
Data and extracts for question 6UK monetary policy since the Global Financial Crisis of 2008 Figure 1: UK inflation rate (as measured by the Consumer Prices Index) and UK nominal wage growth, annual percentage change, 2008 to 2019 5 % 4 Nominal wage growth 3 Inflation rate 2 1 0 –1 ‘08 ‘09 ‘10 ‘11 ‘12 ‘13 ‘14 ‘15 ‘16 ‘17 ‘18 ‘19 (Source: adapted from ONS) Figure 2: UK real GDP, annual percentage change, Q4 2006 to Q4 2019 2 % 1 0 -1 -2 -3 -4 Q4 Q4 Q4 Q4 Q4 Q4 Q4 2006 2008 2010 2012 2014 2016 2018 (Source: adapted from https://www.ons.gov.uk/economy/ grossdomesticproductgdp/timeseries/ihyq/qna) Extract A Has monetary policy worked? Between 2008 and 2009, financial markets around the world were crashing and many UK banks were adversely affected by the collapse of the housing market. This reduced access to credit for UK households and businesses. Faced with these large risks, the Monetary Policy Committee (MPC) of the Bank of 5 England reduced the base interest rate from 5.25% in February 2008 to 0.5% in March 2009. The MPC had known that reducing the base interest rate was not enough alone. It drafted the use of a new idea: quantitative easing (QE). It had bought assets worth £200 billion by November 2009. This QE was later implemented by the USA’s Federal 10 Reserve, and was claimed to be a success. In July 2012 the total spent on QE in the UK amounted to £375 billion. This decision has been credited with preventing the recession, caused by the Global Financial Crisis of 2008, turning into another Great Depression. The UK’s unemployment rate peaked at 8.5% in 2009 but had fallen to 4% in 2019, the lowest since the mid-1970s. 15 In 2016 the MPC further expanded its QE programme by £60 billion and reduced the base interest rate to 0.25%. Households with mortgages benefitted from the low interest rate, enabling them to continue consumption and therefore helping economic recovery. Nevertheless, this has resulted in a rise in household debts. Borrowing on credit cards and personal loans has increased above the levels seen before 2008. 20 Inflation caused by the fall in the exchange rate of the British pound, higher employment levels and nominal wage growth has since directed the MPC to increase base interest rates. It increased the base interest rate to 0.5% in November 2017, and then to 0.75% in March 2018. However, the uncertainty around the UK’s future trade relationship with the EU has meant that increases in the base interest rate were only marginal. 25 Many economists believe that if the UK and the EU are unable to form a trade agreement, base interest rates would need to be decreased again and QE expanded. Conversely, a few economists have argued that QE is no longer effective as a monetary policy instrument. They indicated that the base interest rate was usually reduced by as much as 5% during previous recessions. This is more than the UK can currently manage. Therefore 30 it would also require the government to implement a fiscal policy to deal with any future economic downturn. The Bank of England is, nonetheless, preparing for the worst-case scenario of a recession deeper than the downturn after the Global Financial Crisis of 2008. (Source: adapted from ‘The verdict on 10 years of quantitative easing’, Richard Partington, The Guardian, https://www.theguardian.com/business/2019/ mar/08/the-verdict-on-10-years-of-quantitative-easing)
(e) Discuss factors, apart from changes in real wages, which the MPC may have considered when changing the base interest rate. (15)
June 2024 · AS Paper 2 · Q6(f) 20 marks AO1=4, AO2=4, AO3=6, AO4=6 20-mark essay Either/or macroeconomic objectivesfiscal and monetary policy
Data and extracts for question 6UK monetary policy since the Global Financial Crisis of 2008 Figure 1: UK inflation rate (as measured by the Consumer Prices Index) and UK nominal wage growth, annual percentage change, 2008 to 2019 5 % 4 Nominal wage growth 3 Inflation rate 2 1 0 –1 ‘08 ‘09 ‘10 ‘11 ‘12 ‘13 ‘14 ‘15 ‘16 ‘17 ‘18 ‘19 (Source: adapted from ONS) Figure 2: UK real GDP, annual percentage change, Q4 2006 to Q4 2019 2 % 1 0 -1 -2 -3 -4 Q4 Q4 Q4 Q4 Q4 Q4 Q4 2006 2008 2010 2012 2014 2016 2018 (Source: adapted from https://www.ons.gov.uk/economy/ grossdomesticproductgdp/timeseries/ihyq/qna) Extract A Has monetary policy worked? Between 2008 and 2009, financial markets around the world were crashing and many UK banks were adversely affected by the collapse of the housing market. This reduced access to credit for UK households and businesses. Faced with these large risks, the Monetary Policy Committee (MPC) of the Bank of 5 England reduced the base interest rate from 5.25% in February 2008 to 0.5% in March 2009. The MPC had known that reducing the base interest rate was not enough alone. It drafted the use of a new idea: quantitative easing (QE). It had bought assets worth £200 billion by November 2009. This QE was later implemented by the USA’s Federal 10 Reserve, and was claimed to be a success. In July 2012 the total spent on QE in the UK amounted to £375 billion. This decision has been credited with preventing the recession, caused by the Global Financial Crisis of 2008, turning into another Great Depression. The UK’s unemployment rate peaked at 8.5% in 2009 but had fallen to 4% in 2019, the lowest since the mid-1970s. 15 In 2016 the MPC further expanded its QE programme by £60 billion and reduced the base interest rate to 0.25%. Households with mortgages benefitted from the low interest rate, enabling them to continue consumption and therefore helping economic recovery. Nevertheless, this has resulted in a rise in household debts. Borrowing on credit cards and personal loans has increased above the levels seen before 2008. 20 Inflation caused by the fall in the exchange rate of the British pound, higher employment levels and nominal wage growth has since directed the MPC to increase base interest rates. It increased the base interest rate to 0.5% in November 2017, and then to 0.75% in March 2018. However, the uncertainty around the UK’s future trade relationship with the EU has meant that increases in the base interest rate were only marginal. 25 Many economists believe that if the UK and the EU are unable to form a trade agreement, base interest rates would need to be decreased again and QE expanded. Conversely, a few economists have argued that QE is no longer effective as a monetary policy instrument. They indicated that the base interest rate was usually reduced by as much as 5% during previous recessions. This is more than the UK can currently manage. Therefore 30 it would also require the government to implement a fiscal policy to deal with any future economic downturn. The Bank of England is, nonetheless, preparing for the worst-case scenario of a recession deeper than the downturn after the Global Financial Crisis of 2008. (Source: adapted from ‘The verdict on 10 years of quantitative easing’, Richard Partington, The Guardian, https://www.theguardian.com/business/2019/ mar/08/the-verdict-on-10-years-of-quantitative-easing)
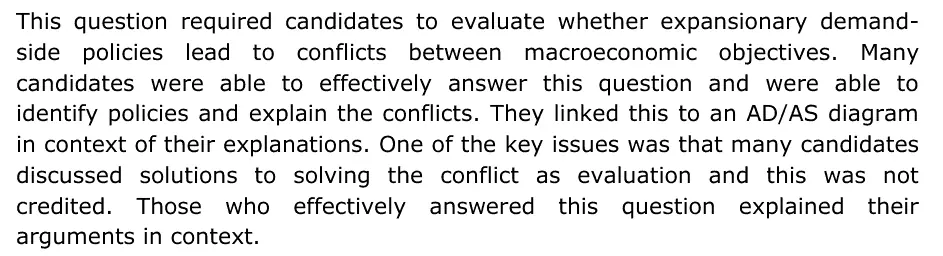
(f) Evaluate whether expansionary demand-side policies lead to conflicts between macroeconomic objectives. (20)
June 2024 · AS Paper 2 · Q6(g) 20 marks AO1=4, AO2=4, AO3=6, AO4=6 20-mark essay Either/or fiscal and monetary policymacroeconomic objectives
Data and extracts for question 6UK monetary policy since the Global Financial Crisis of 2008 Figure 1: UK inflation rate (as measured by the Consumer Prices Index) and UK nominal wage growth, annual percentage change, 2008 to 2019 5 % 4 Nominal wage growth 3 Inflation rate 2 1 0 –1 ‘08 ‘09 ‘10 ‘11 ‘12 ‘13 ‘14 ‘15 ‘16 ‘17 ‘18 ‘19 (Source: adapted from ONS) Figure 2: UK real GDP, annual percentage change, Q4 2006 to Q4 2019 2 % 1 0 -1 -2 -3 -4 Q4 Q4 Q4 Q4 Q4 Q4 Q4 2006 2008 2010 2012 2014 2016 2018 (Source: adapted from https://www.ons.gov.uk/economy/ grossdomesticproductgdp/timeseries/ihyq/qna) Extract A Has monetary policy worked? Between 2008 and 2009, financial markets around the world were crashing and many UK banks were adversely affected by the collapse of the housing market. This reduced access to credit for UK households and businesses. Faced with these large risks, the Monetary Policy Committee (MPC) of the Bank of 5 England reduced the base interest rate from 5.25% in February 2008 to 0.5% in March 2009. The MPC had known that reducing the base interest rate was not enough alone. It drafted the use of a new idea: quantitative easing (QE). It had bought assets worth £200 billion by November 2009. This QE was later implemented by the USA’s Federal 10 Reserve, and was claimed to be a success. In July 2012 the total spent on QE in the UK amounted to £375 billion. This decision has been credited with preventing the recession, caused by the Global Financial Crisis of 2008, turning into another Great Depression. The UK’s unemployment rate peaked at 8.5% in 2009 but had fallen to 4% in 2019, the lowest since the mid-1970s. 15 In 2016 the MPC further expanded its QE programme by £60 billion and reduced the base interest rate to 0.25%. Households with mortgages benefitted from the low interest rate, enabling them to continue consumption and therefore helping economic recovery. Nevertheless, this has resulted in a rise in household debts. Borrowing on credit cards and personal loans has increased above the levels seen before 2008. 20 Inflation caused by the fall in the exchange rate of the British pound, higher employment levels and nominal wage growth has since directed the MPC to increase base interest rates. It increased the base interest rate to 0.5% in November 2017, and then to 0.75% in March 2018. However, the uncertainty around the UK’s future trade relationship with the EU has meant that increases in the base interest rate were only marginal. 25 Many economists believe that if the UK and the EU are unable to form a trade agreement, base interest rates would need to be decreased again and QE expanded. Conversely, a few economists have argued that QE is no longer effective as a monetary policy instrument. They indicated that the base interest rate was usually reduced by as much as 5% during previous recessions. This is more than the UK can currently manage. Therefore 30 it would also require the government to implement a fiscal policy to deal with any future economic downturn. The Bank of England is, nonetheless, preparing for the worst-case scenario of a recession deeper than the downturn after the Global Financial Crisis of 2008. (Source: adapted from ‘The verdict on 10 years of quantitative easing’, Richard Partington, The Guardian, https://www.theguardian.com/business/2019/ mar/08/the-verdict-on-10-years-of-quantitative-easing)
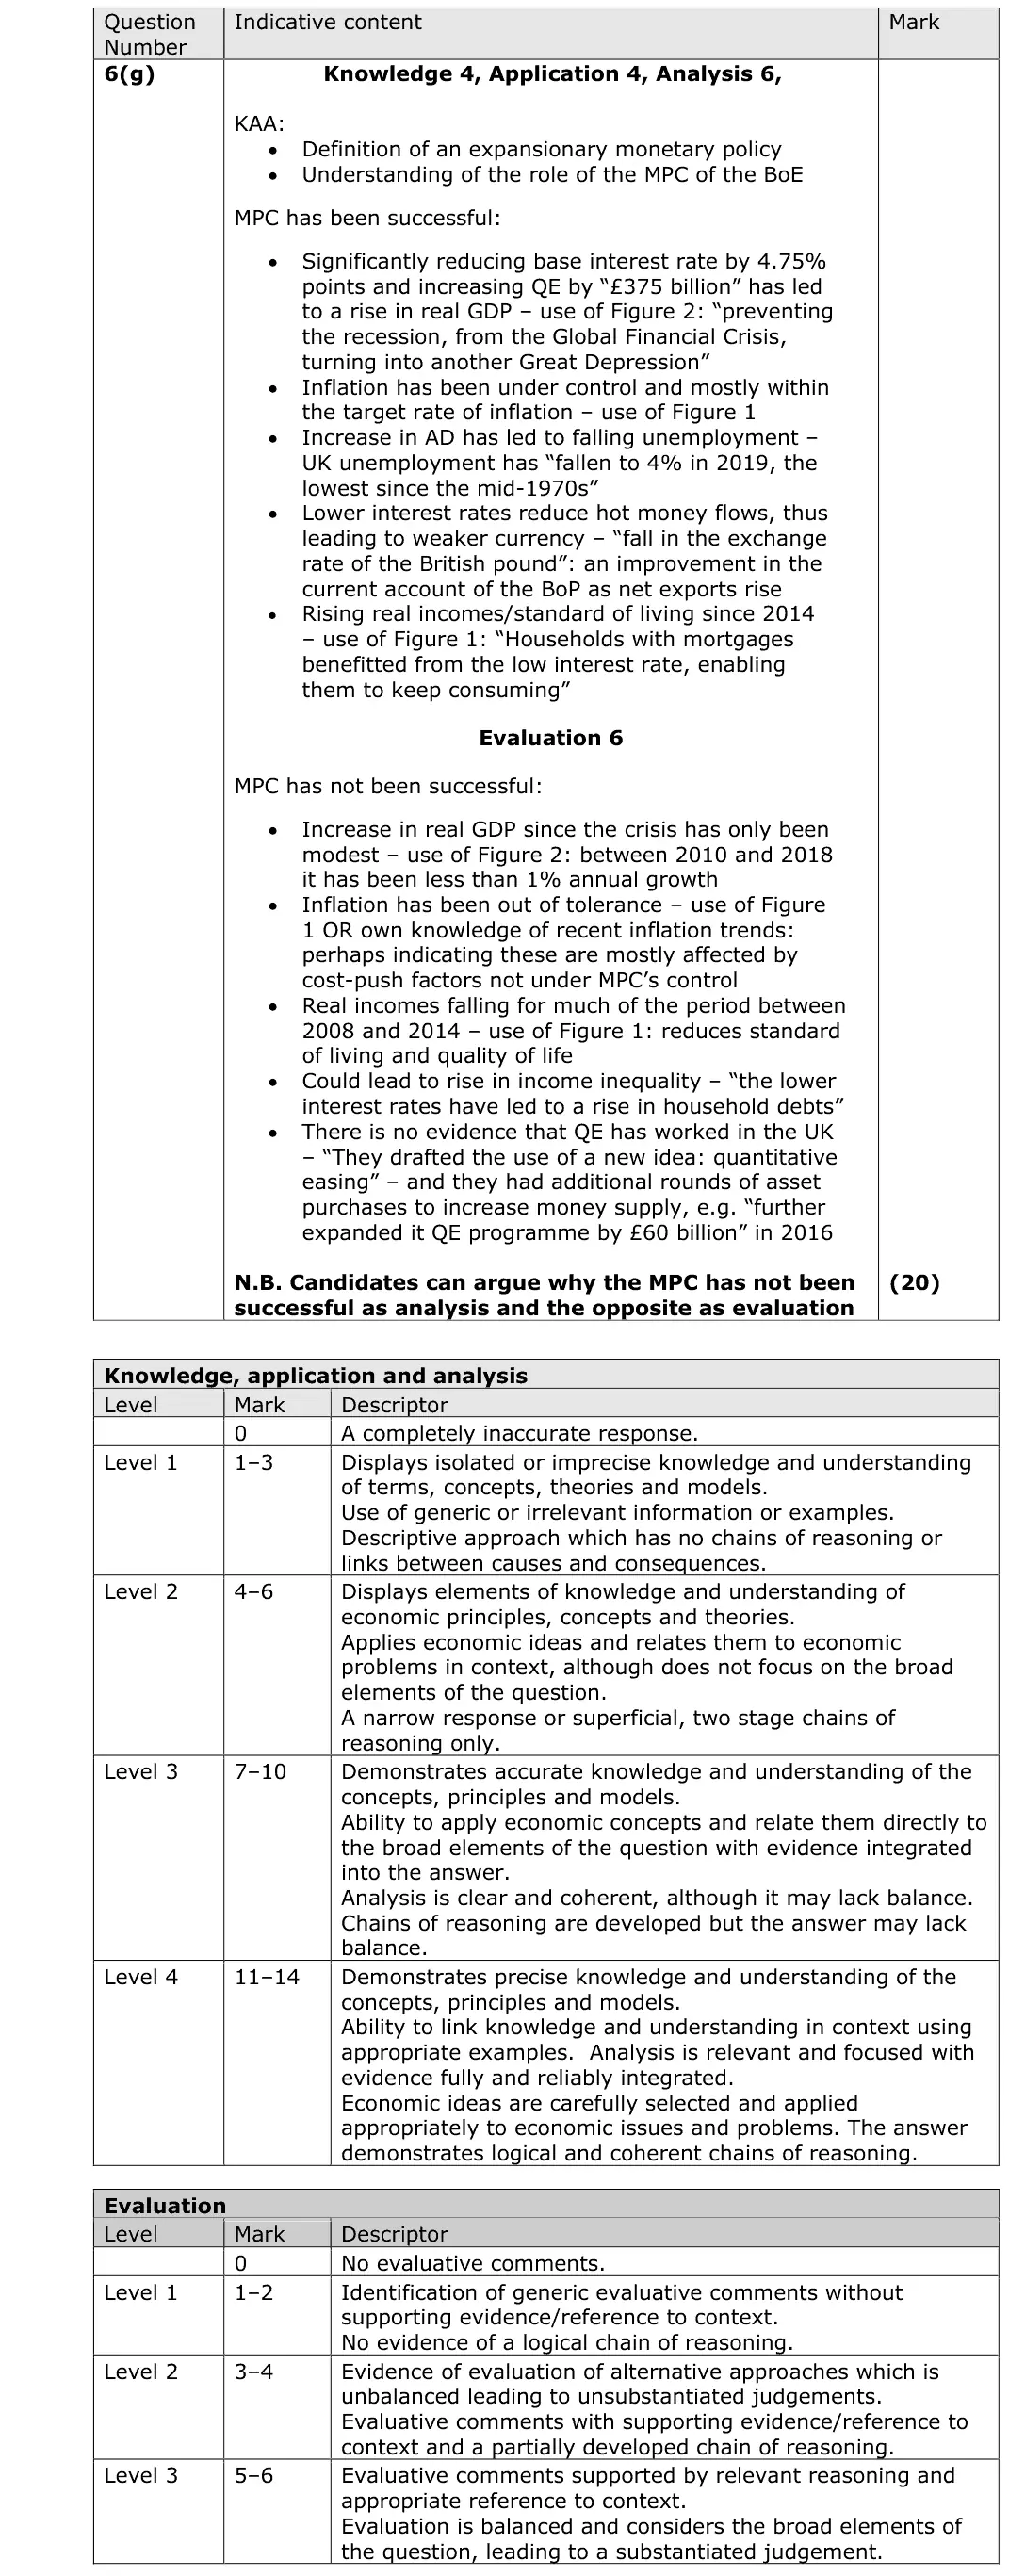
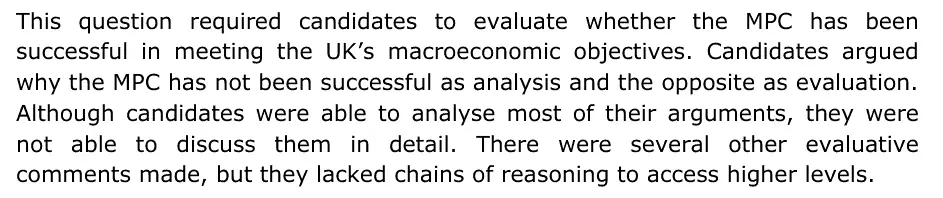
(g) Evaluate whether the MPC has been successful in meeting the UK’s macroeconomic objectives between 2008 and 2019. (20)

Work with an Edexcel economics tutor

Want a paper marked and gone through with you? Message us.

Prefer email? Send an enquiry

If you are under 18, please include a parent's contact details. Enquiries go to enquiries@economicsaleveltutor.com and are deleted once handled. All tutoring is online.