June 2017: AS Paper 2

80 marks · 20 question parts · Paper, mark scheme and report on Pearson's site

Question by question

QTopicMarksAOType
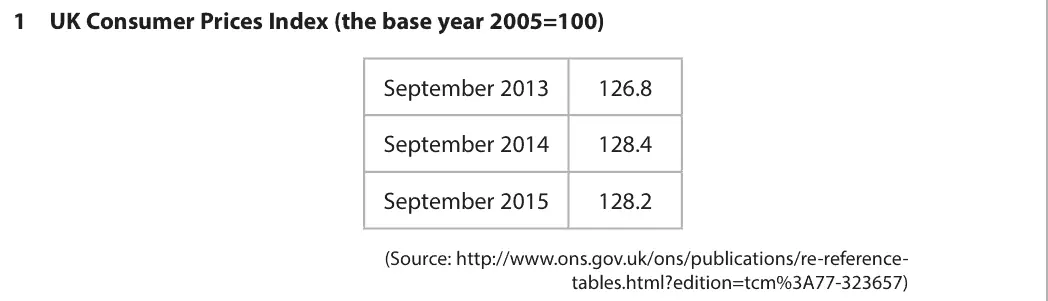
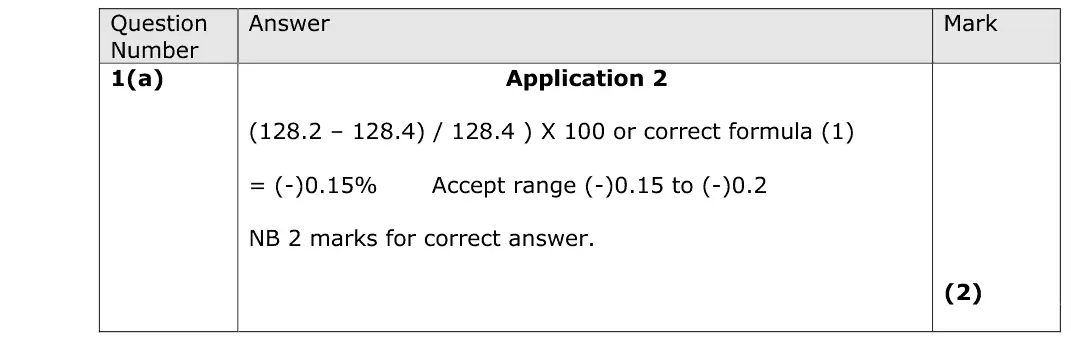
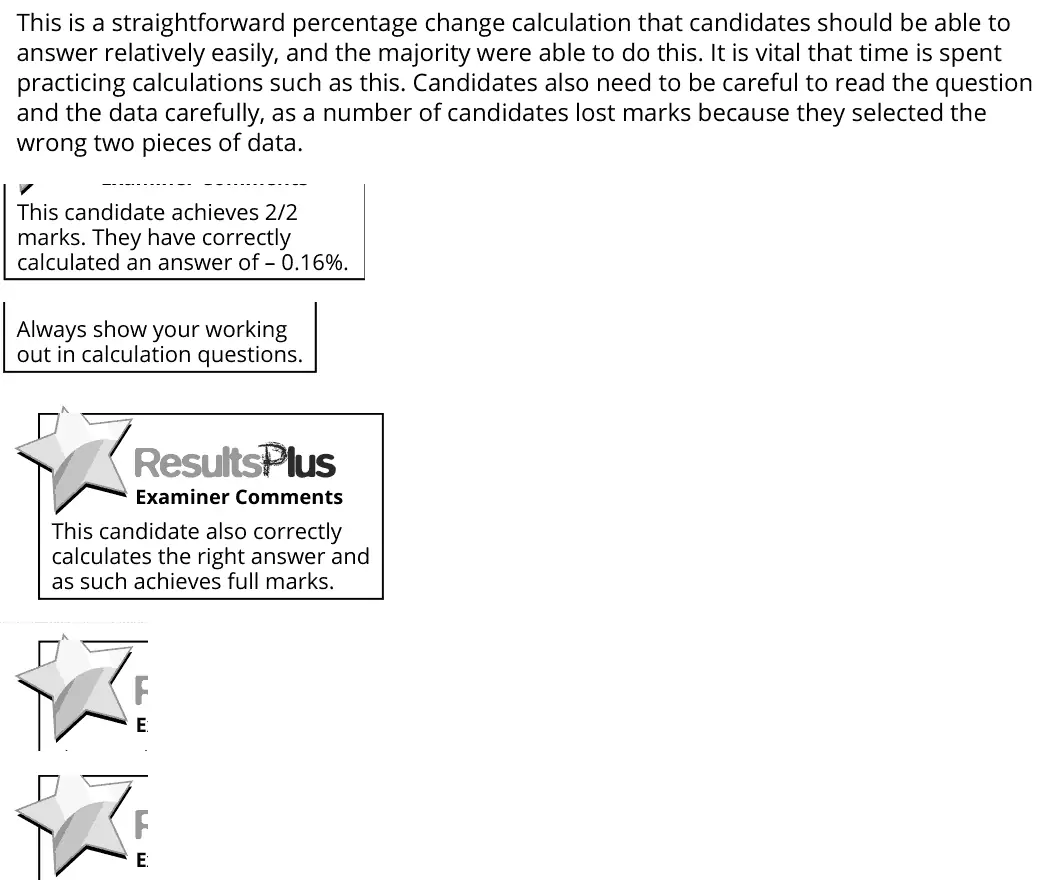
1(a) Inflation 2AO2=2Calculation

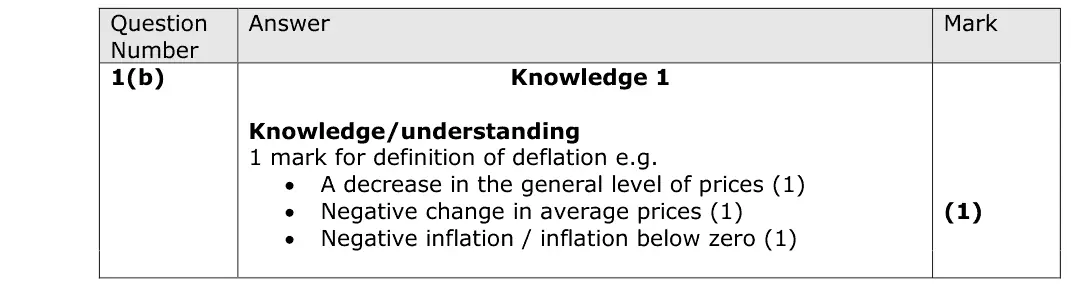
1(b) Inflation 1AO1=1Definition
1(c) Inflation 1Multiple choice
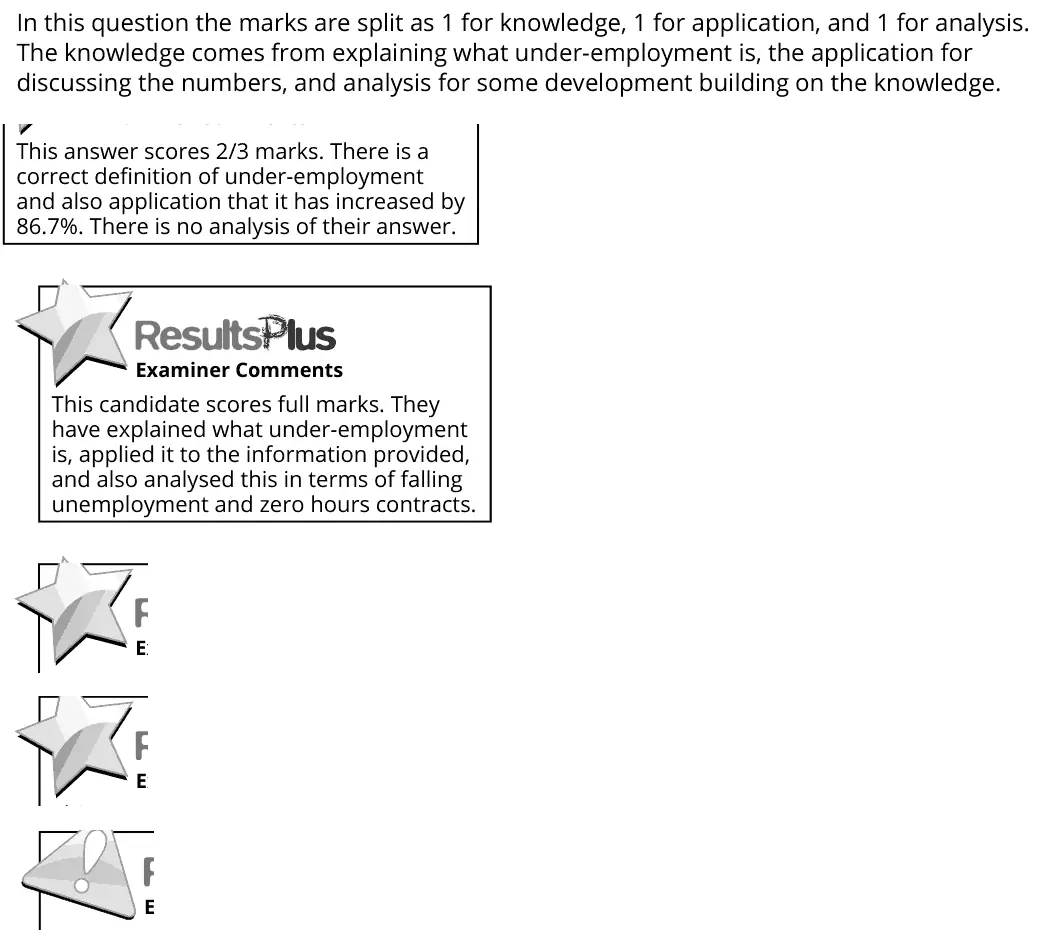
2(a) Employment and unemployment 3AO1=1,AO2=1,AO3=1Short answer
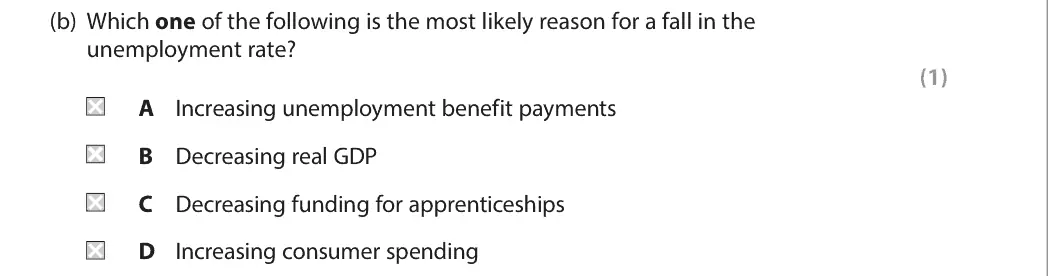
2(b) Employment and unemployment 1Multiple choice
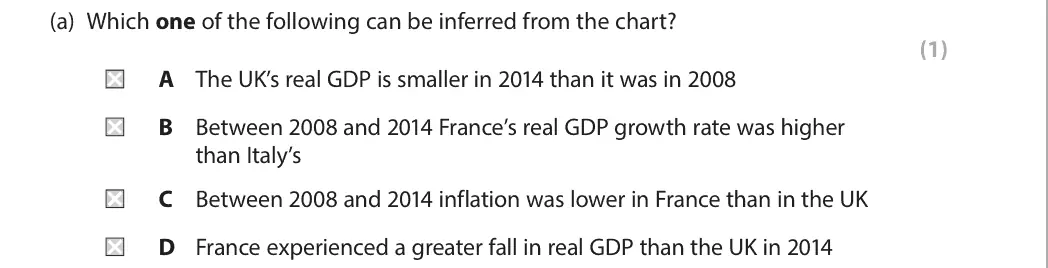
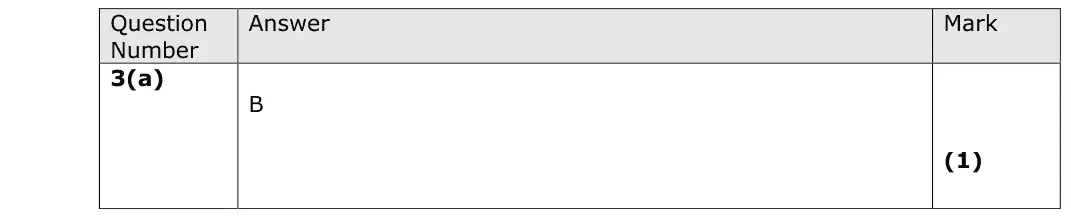
3(a) Measuring economic growth: GDP, GNI and living standards 1Multiple choice
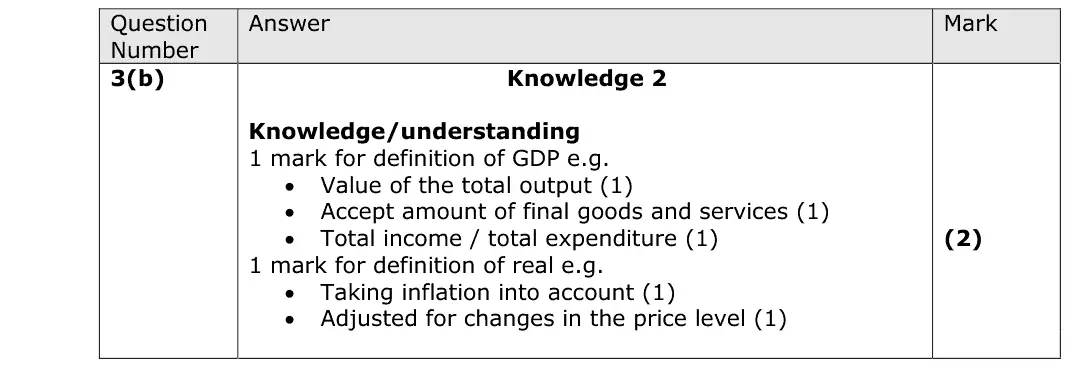
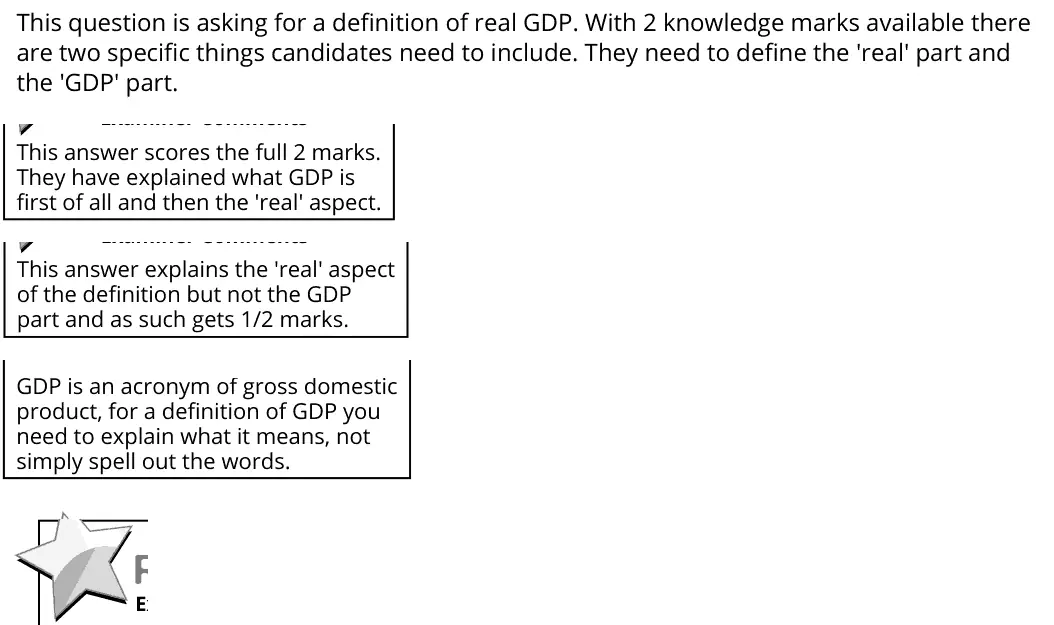
3(b) Measuring economic growth: GDP, GNI and living standards 2AO1=2Definition
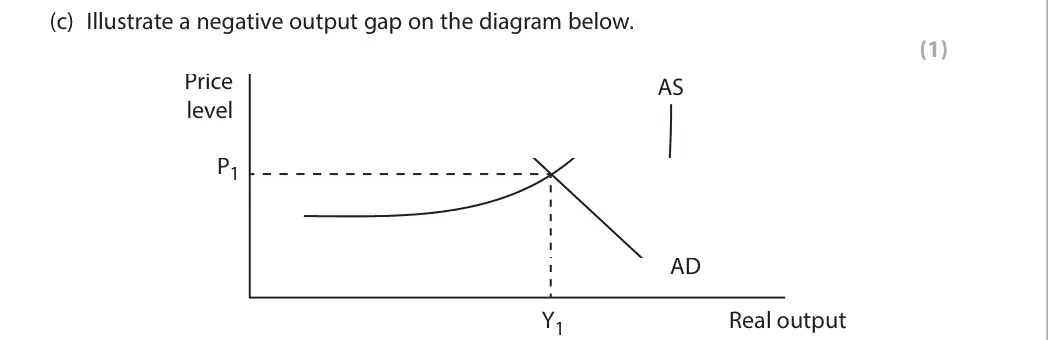
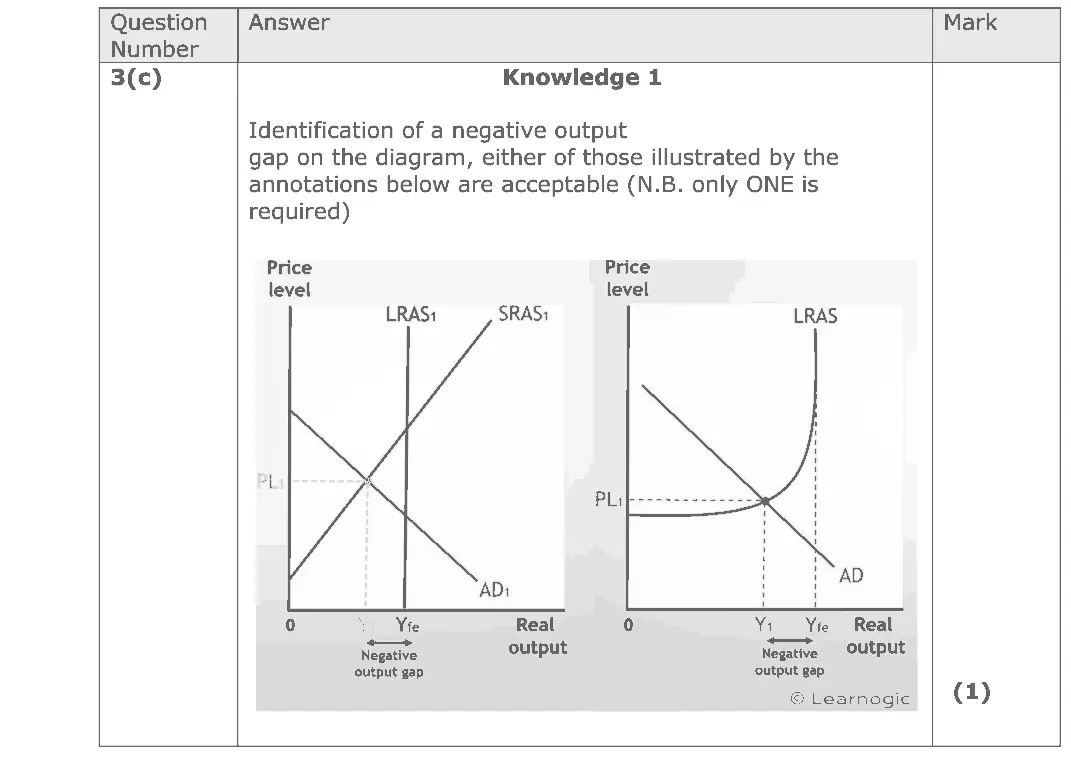
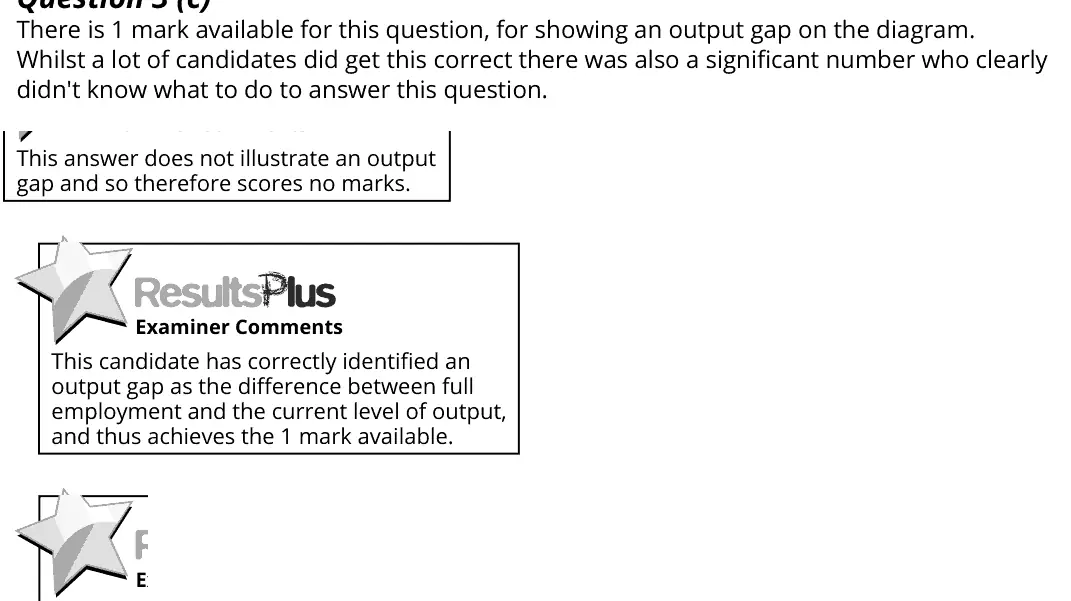
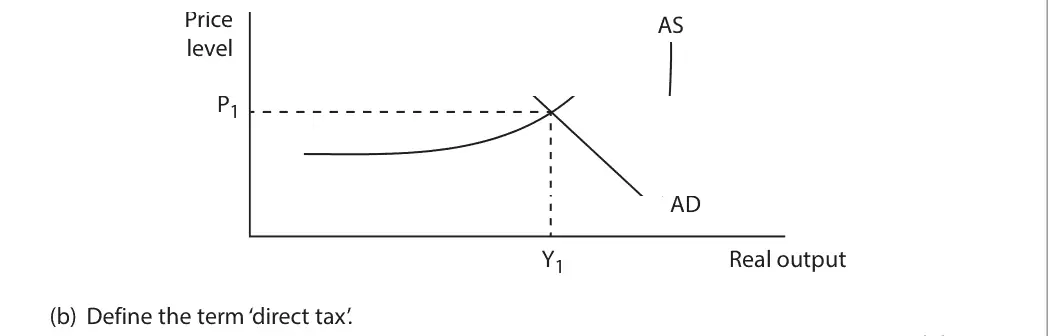
3(c) Economic growth, output gaps and the trade cycle 1AO1=1Diagram
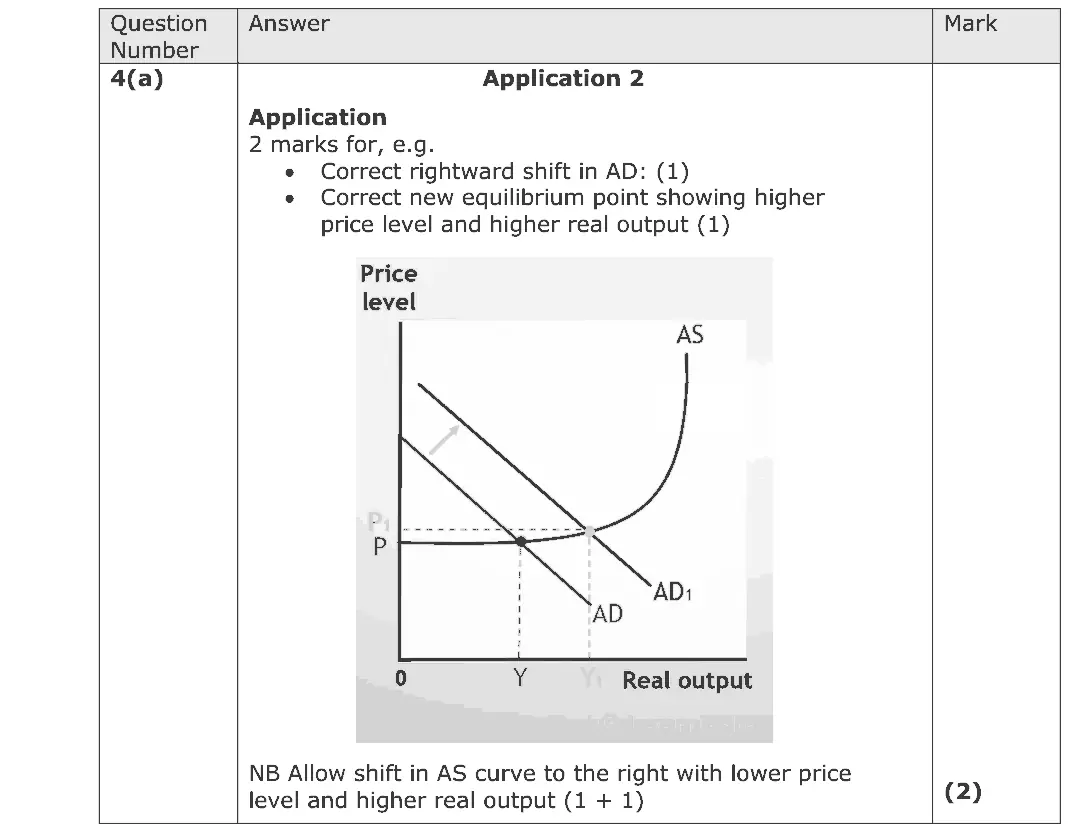
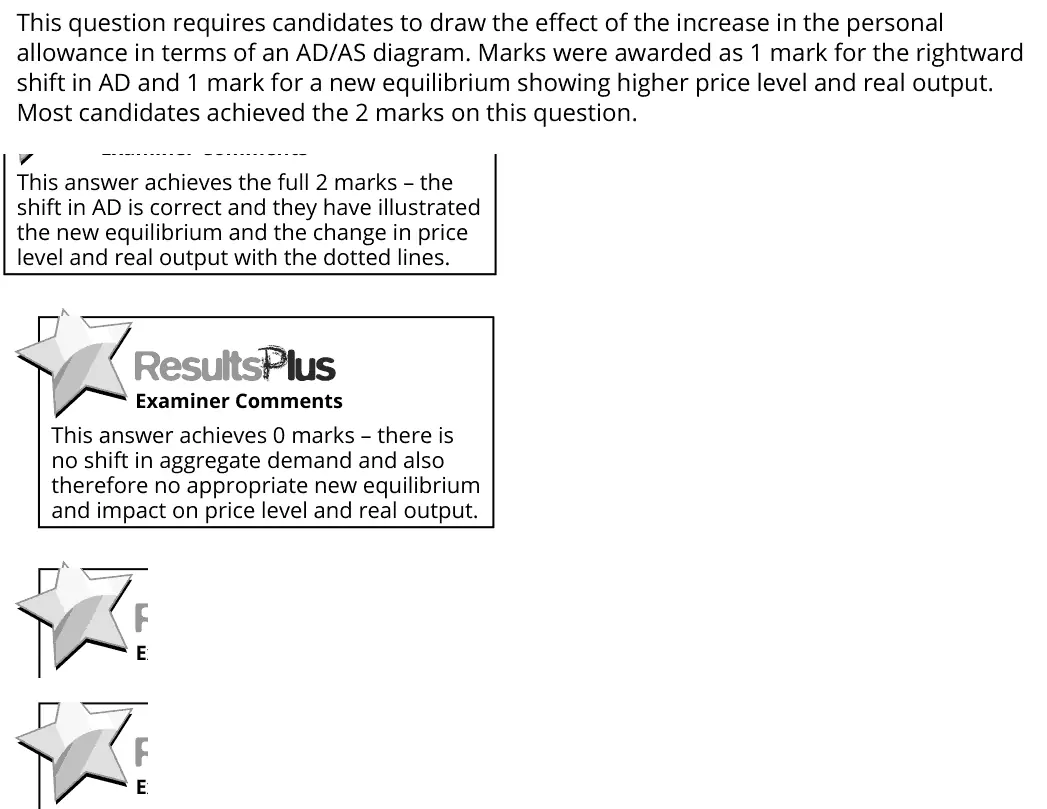
4(a) The circular flow, national income and the multiplier, Demand-side policies: fiscal and monetary policy 2AO2=2Diagram
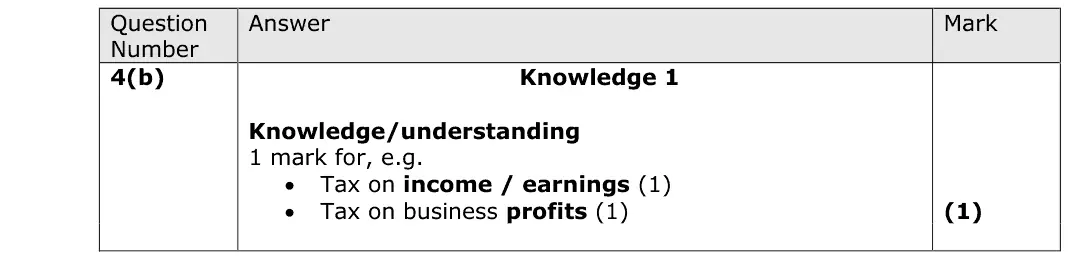
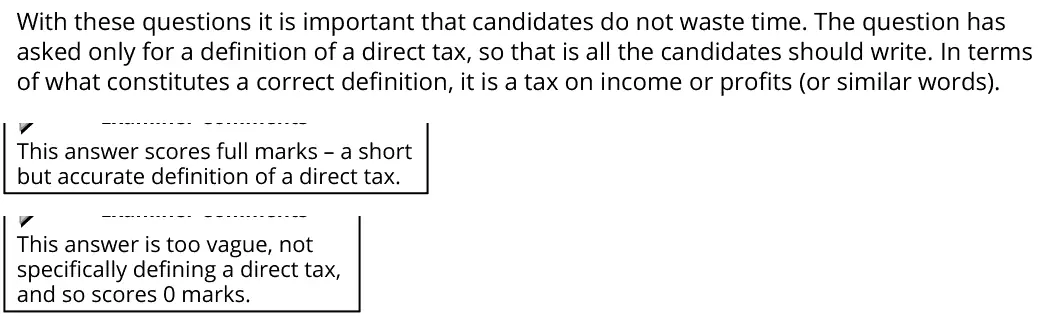
4(b) Demand-side policies: fiscal and monetary policy 1AO1=1Definition
4(c) Demand-side policies: fiscal and monetary policy 1Multiple choice
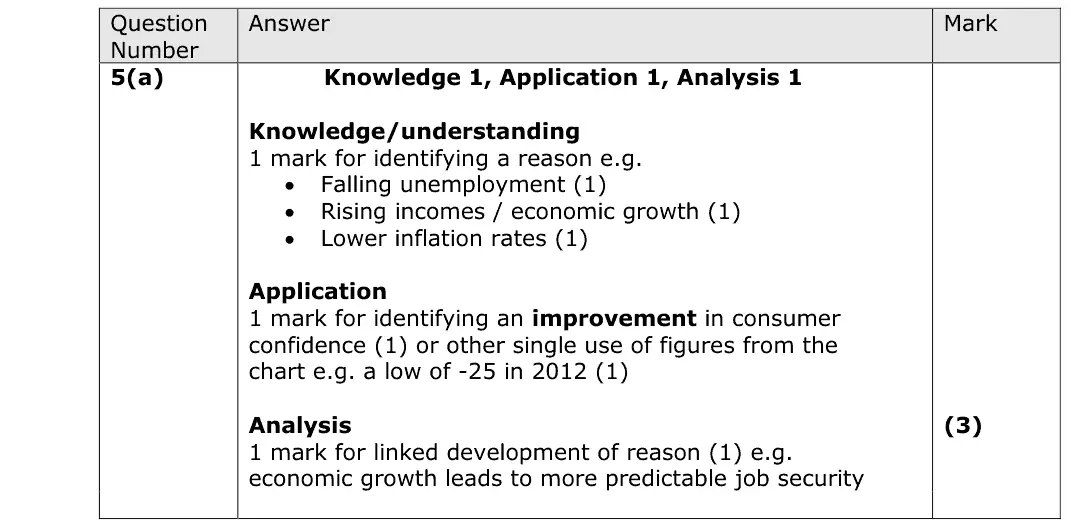
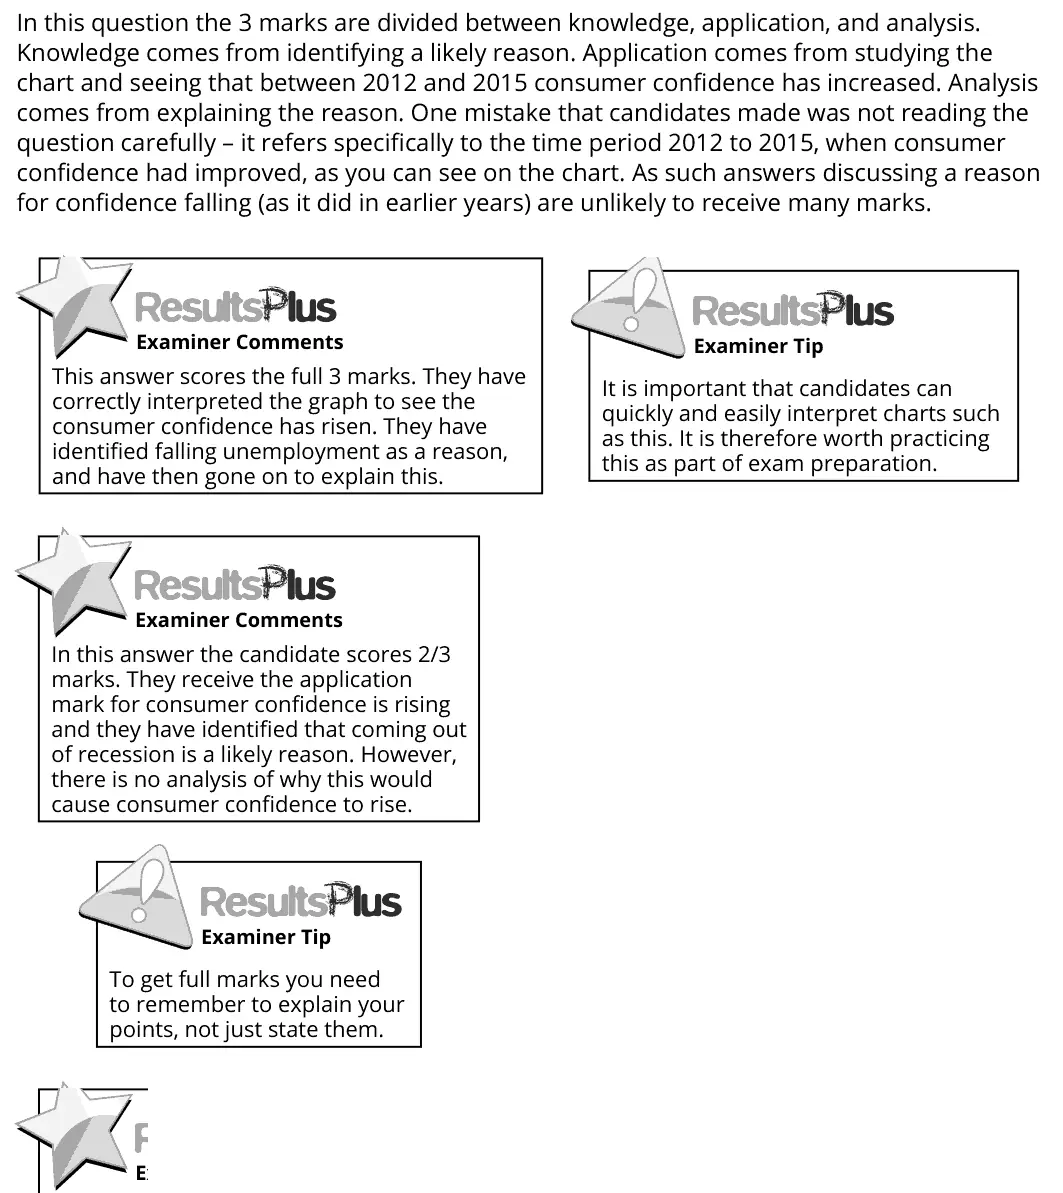
5(a) Aggregate demand 3AO1=1,AO2=1,AO3=1Short answer
5(b) The circular flow, national income and the multiplier 1Multiple choice
6(a) Aggregate demand 4AO1=2,AO2=2Short answer
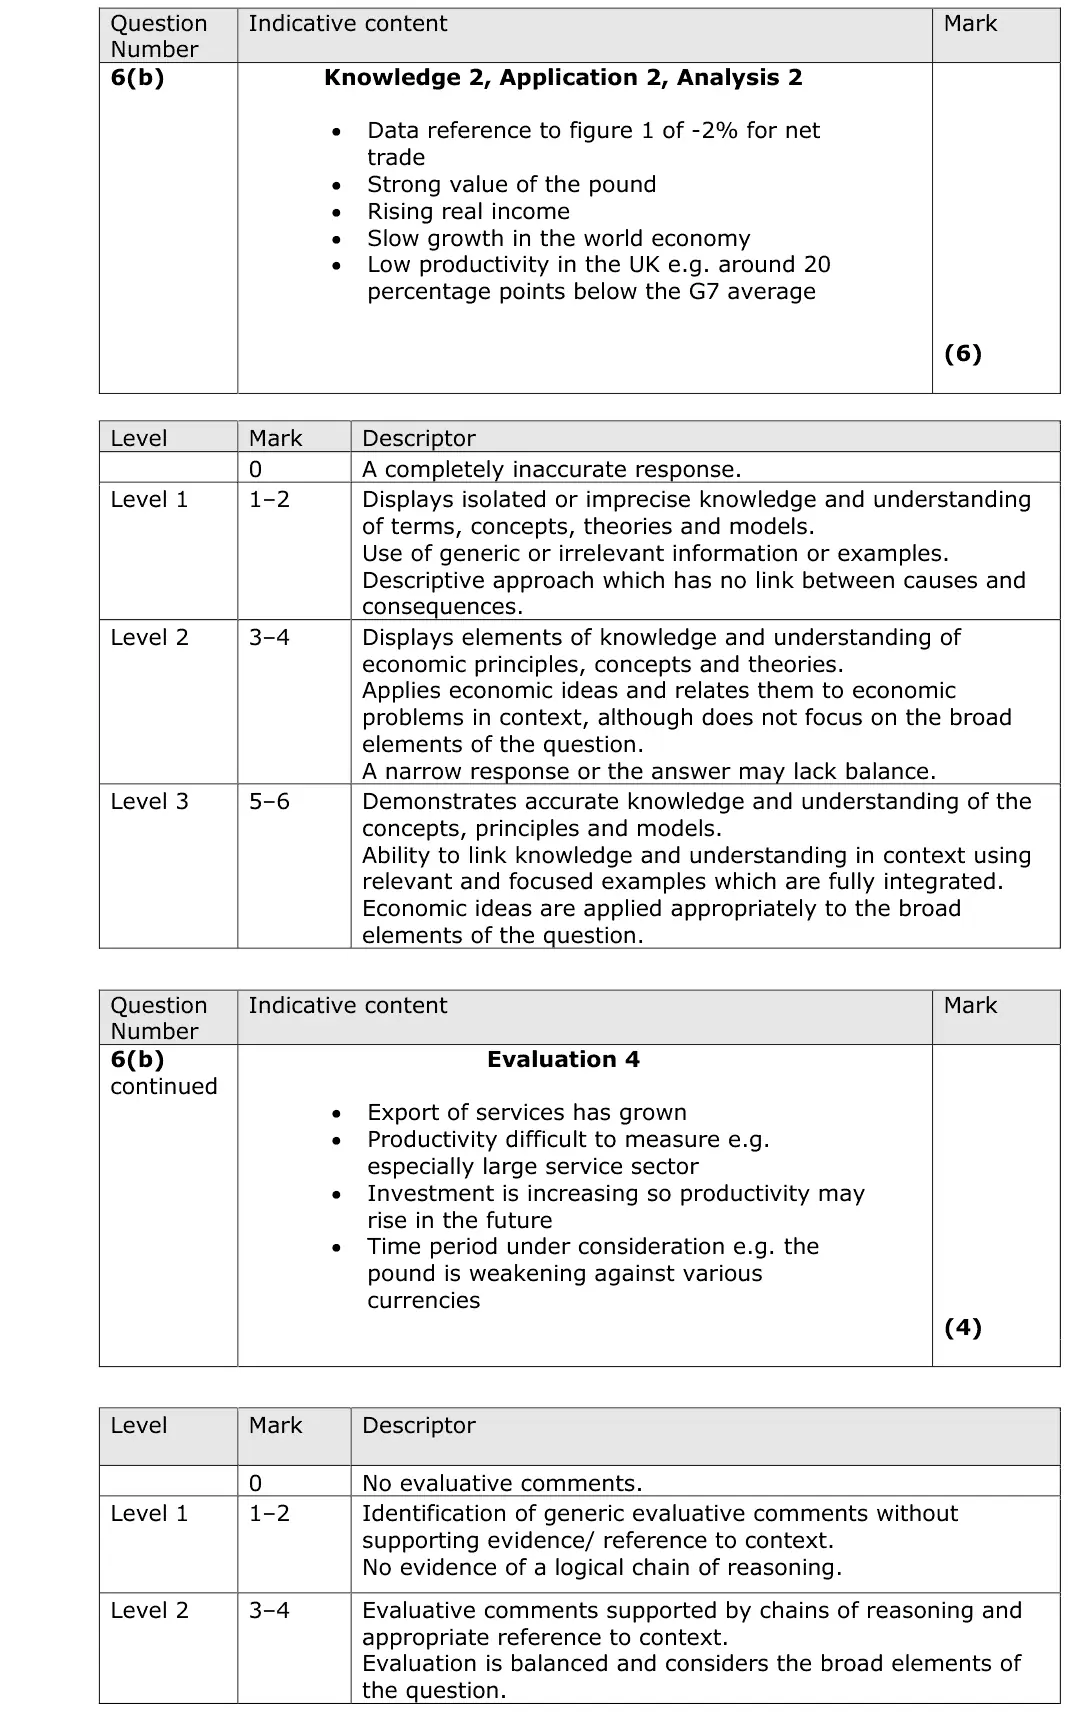
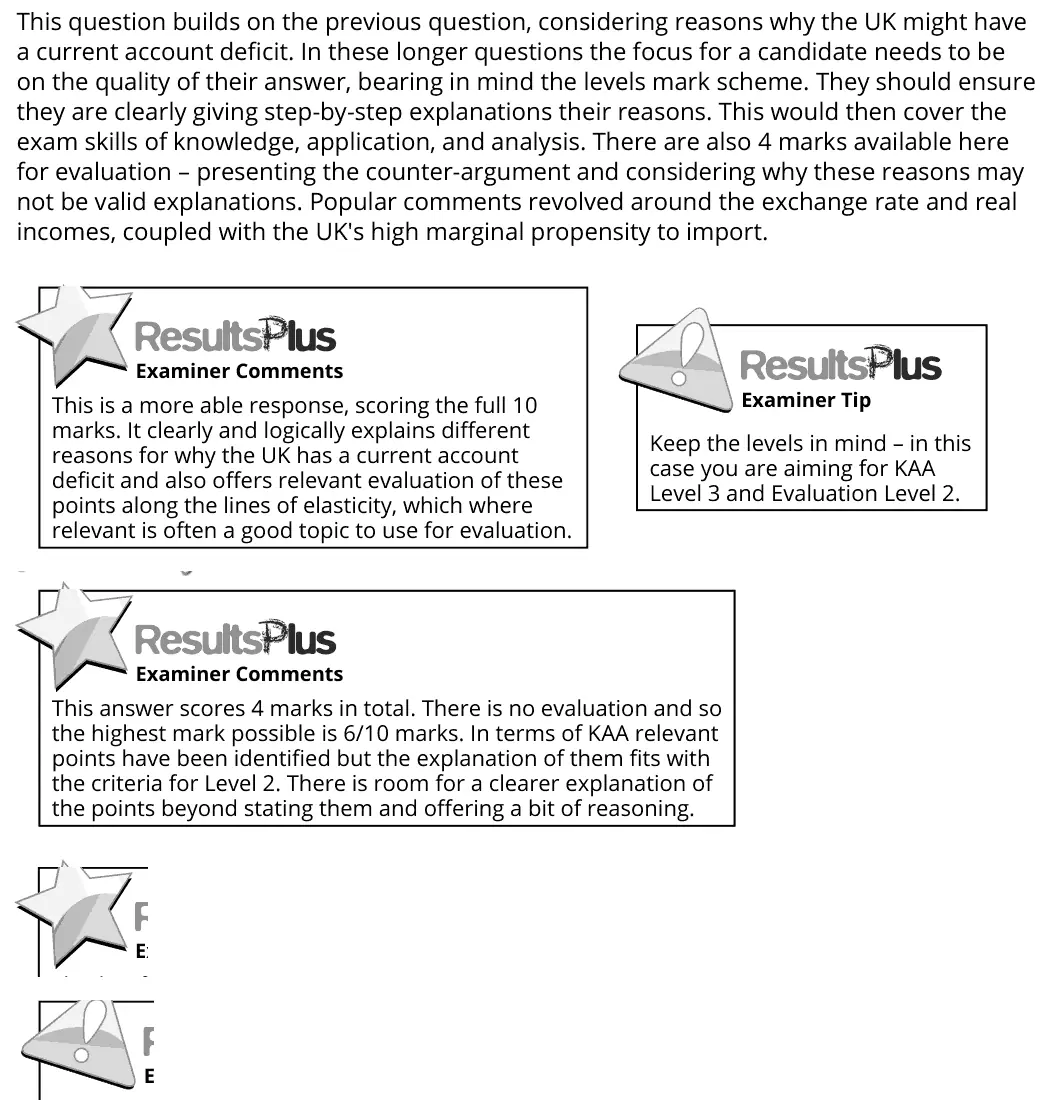
6(b) The balance of payments, Aggregate demand 10AO1=2,AO2=2,AO3=2,AO4=4Extended response
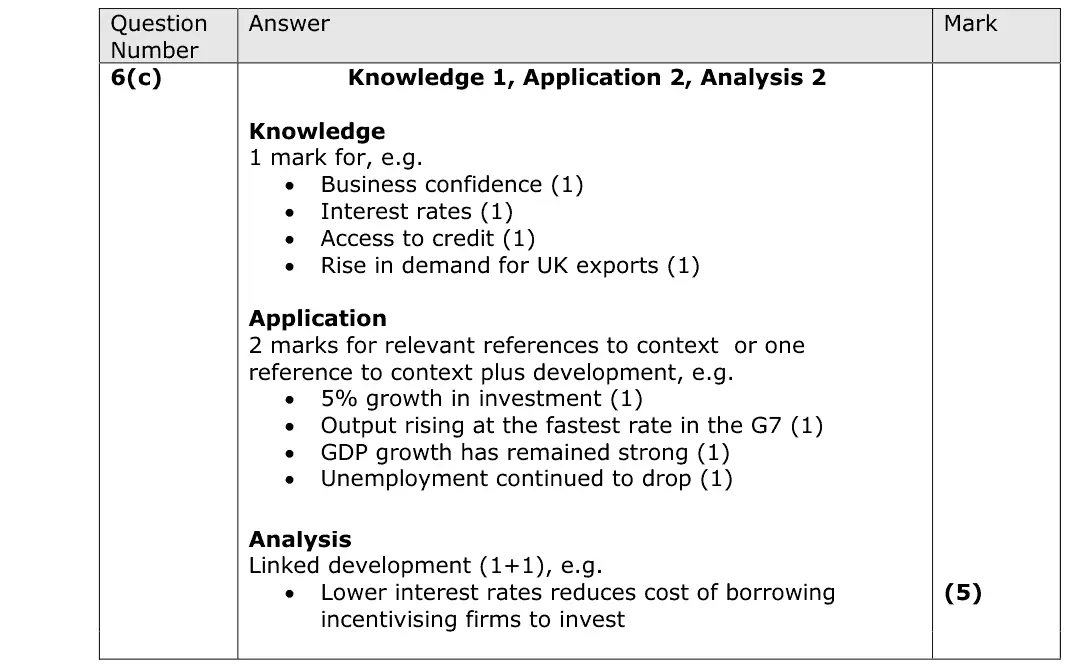
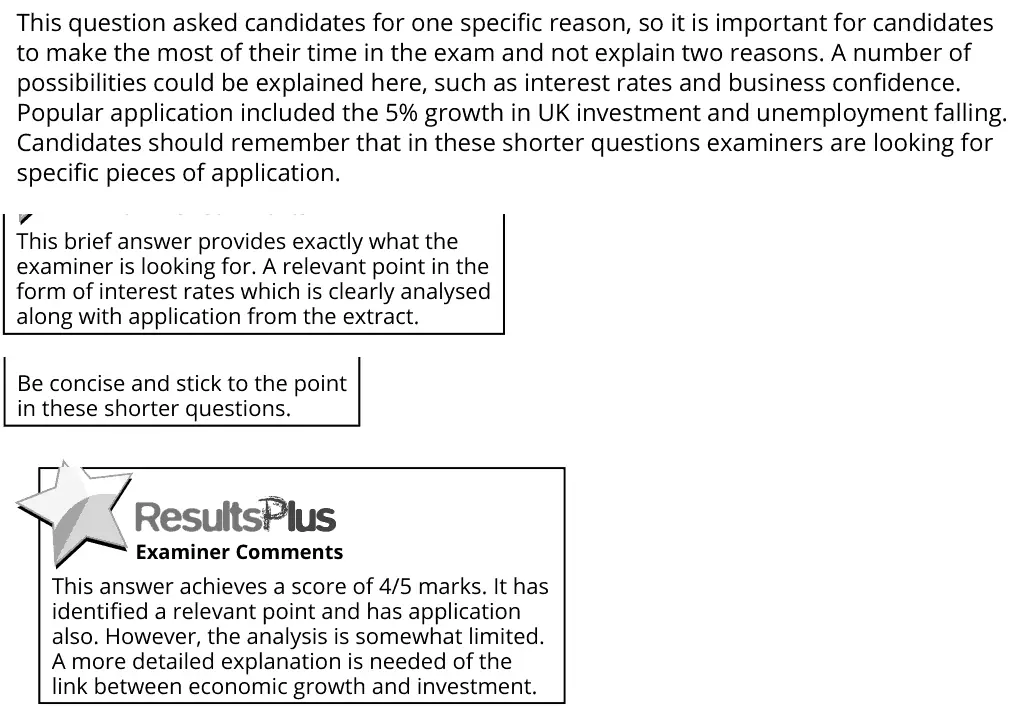
6(c) Aggregate demand 5AO1=1,AO2=2,AO3=2Short answer
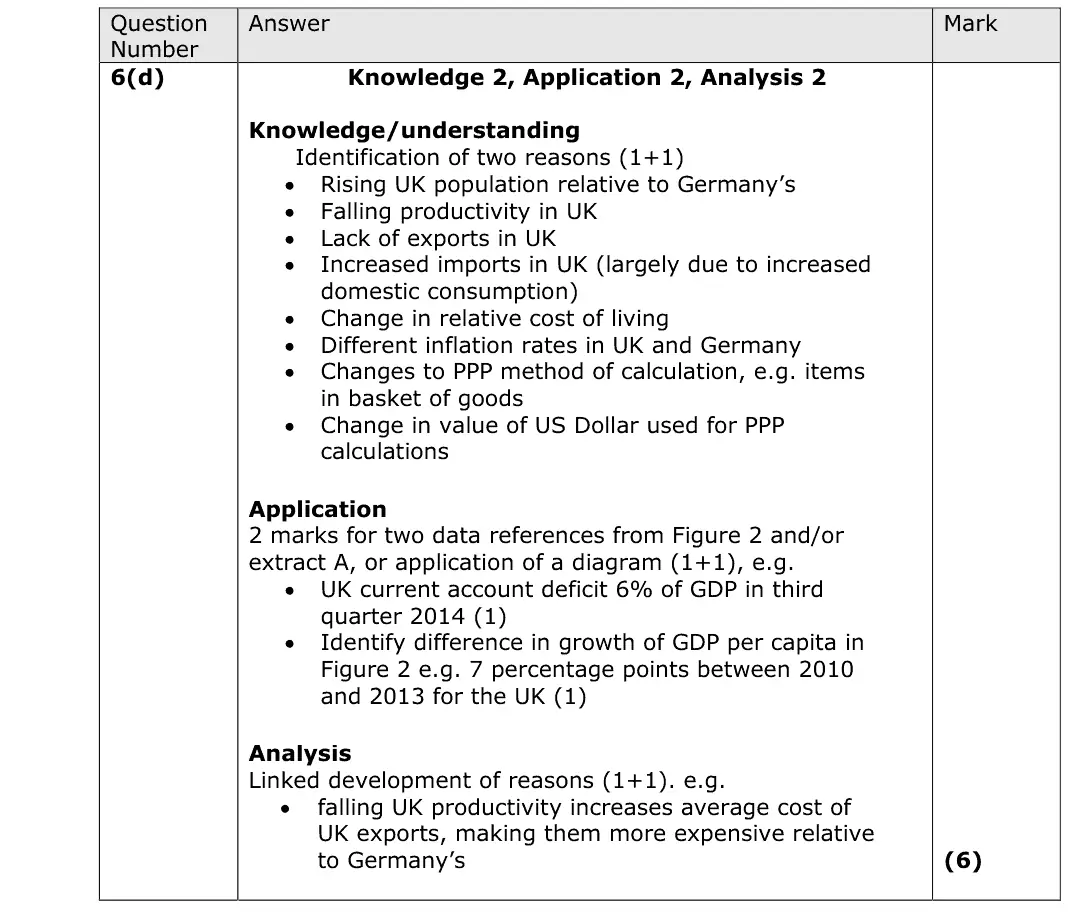
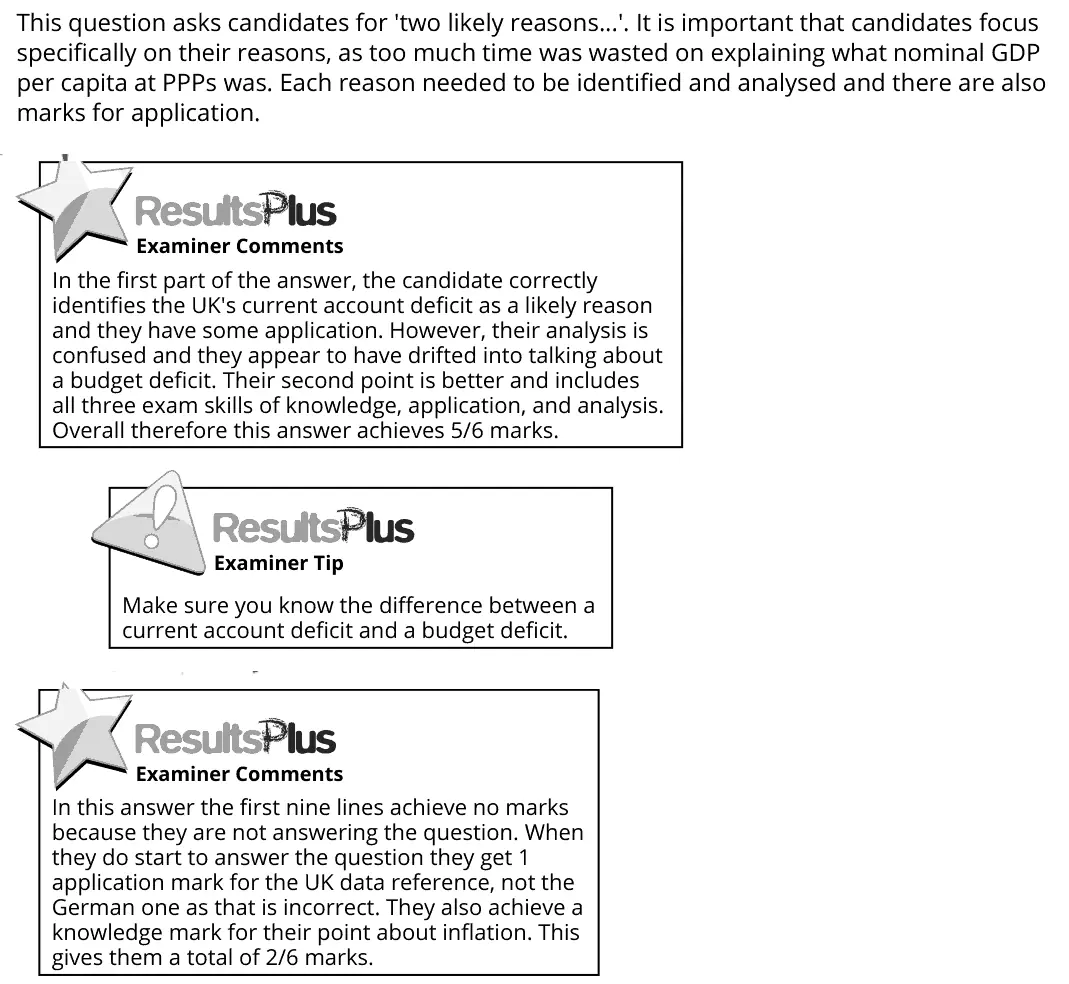
6(d) Measuring economic growth: GDP, GNI and living standards 6AO1=2,AO2=2,AO3=2Short answer
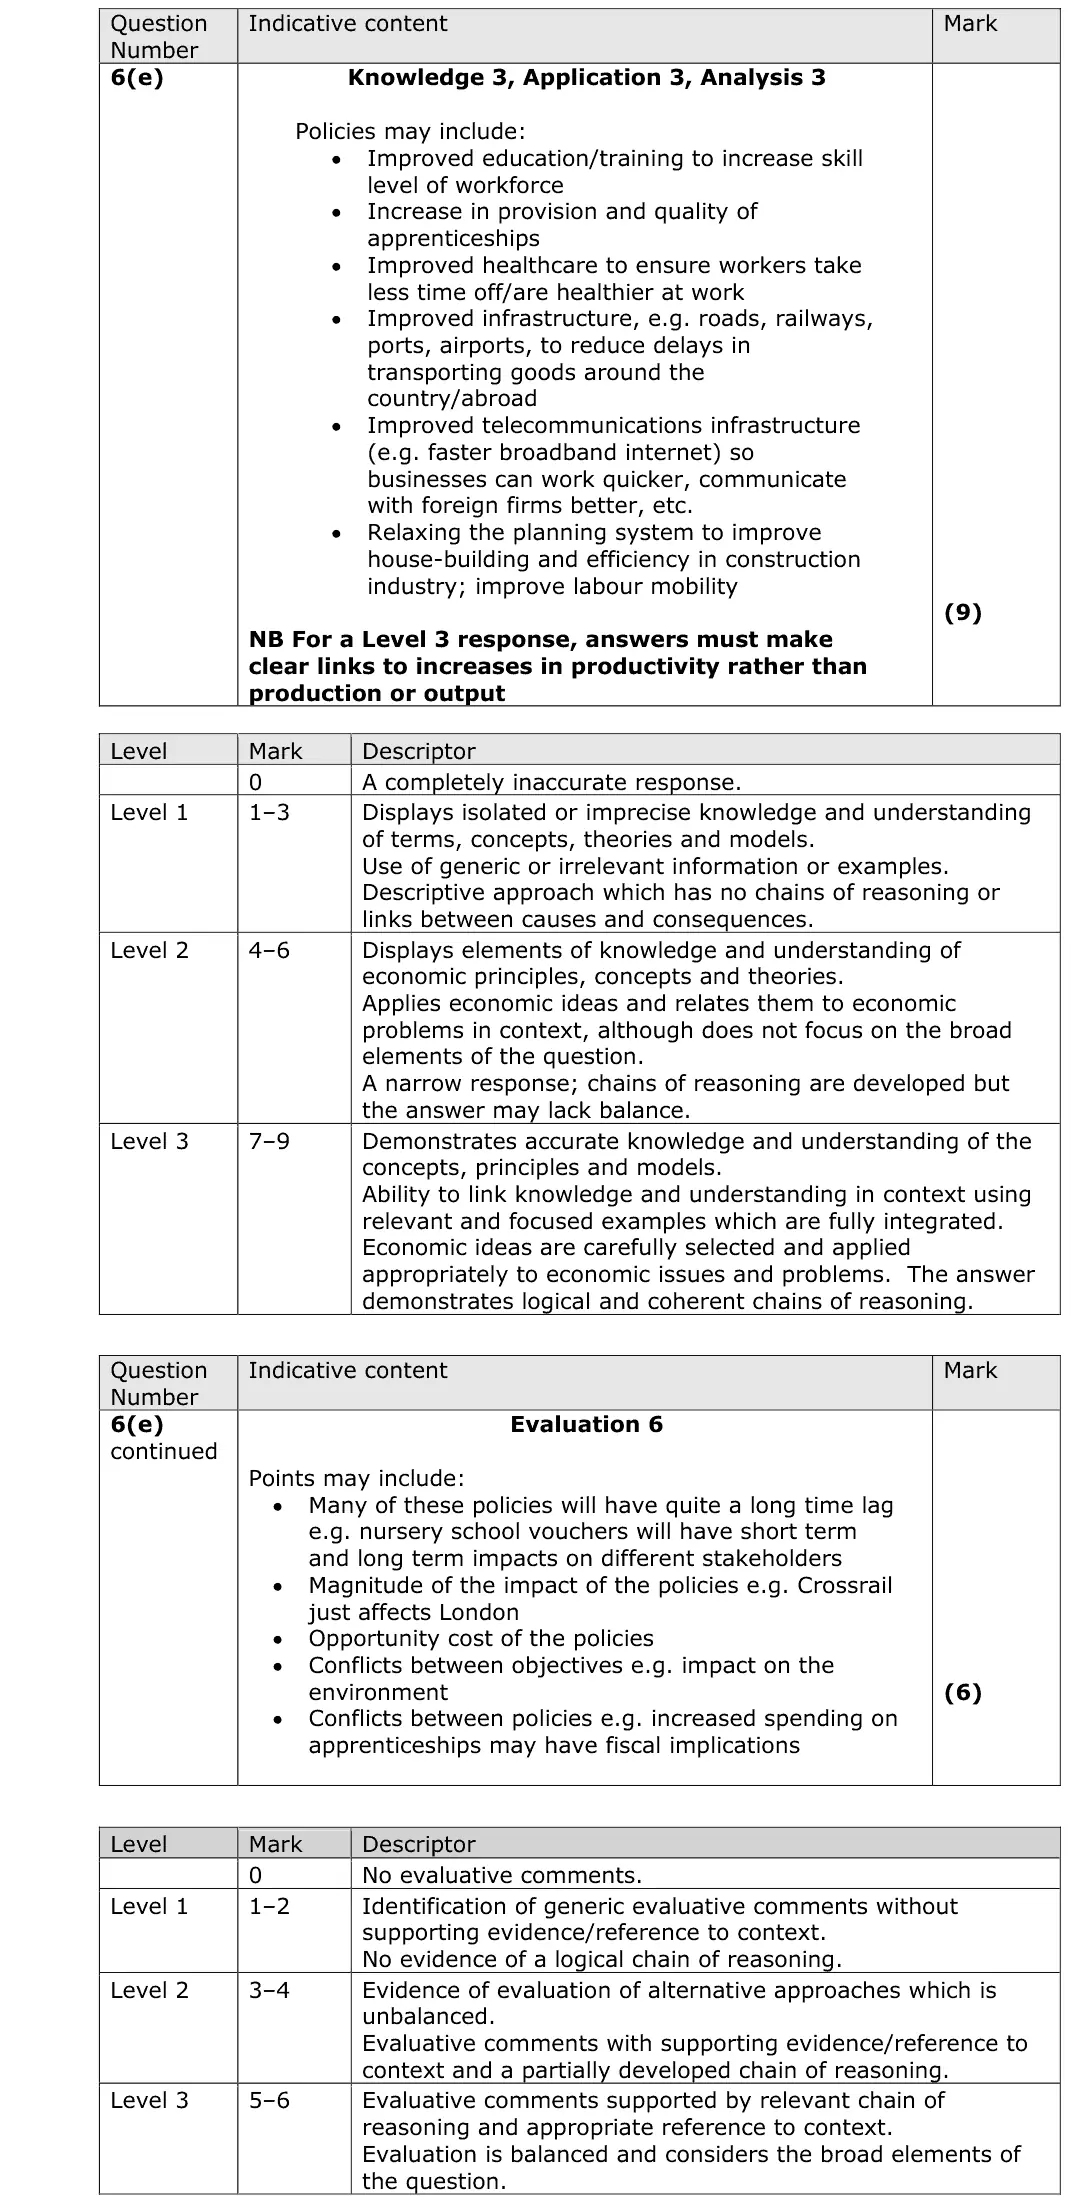
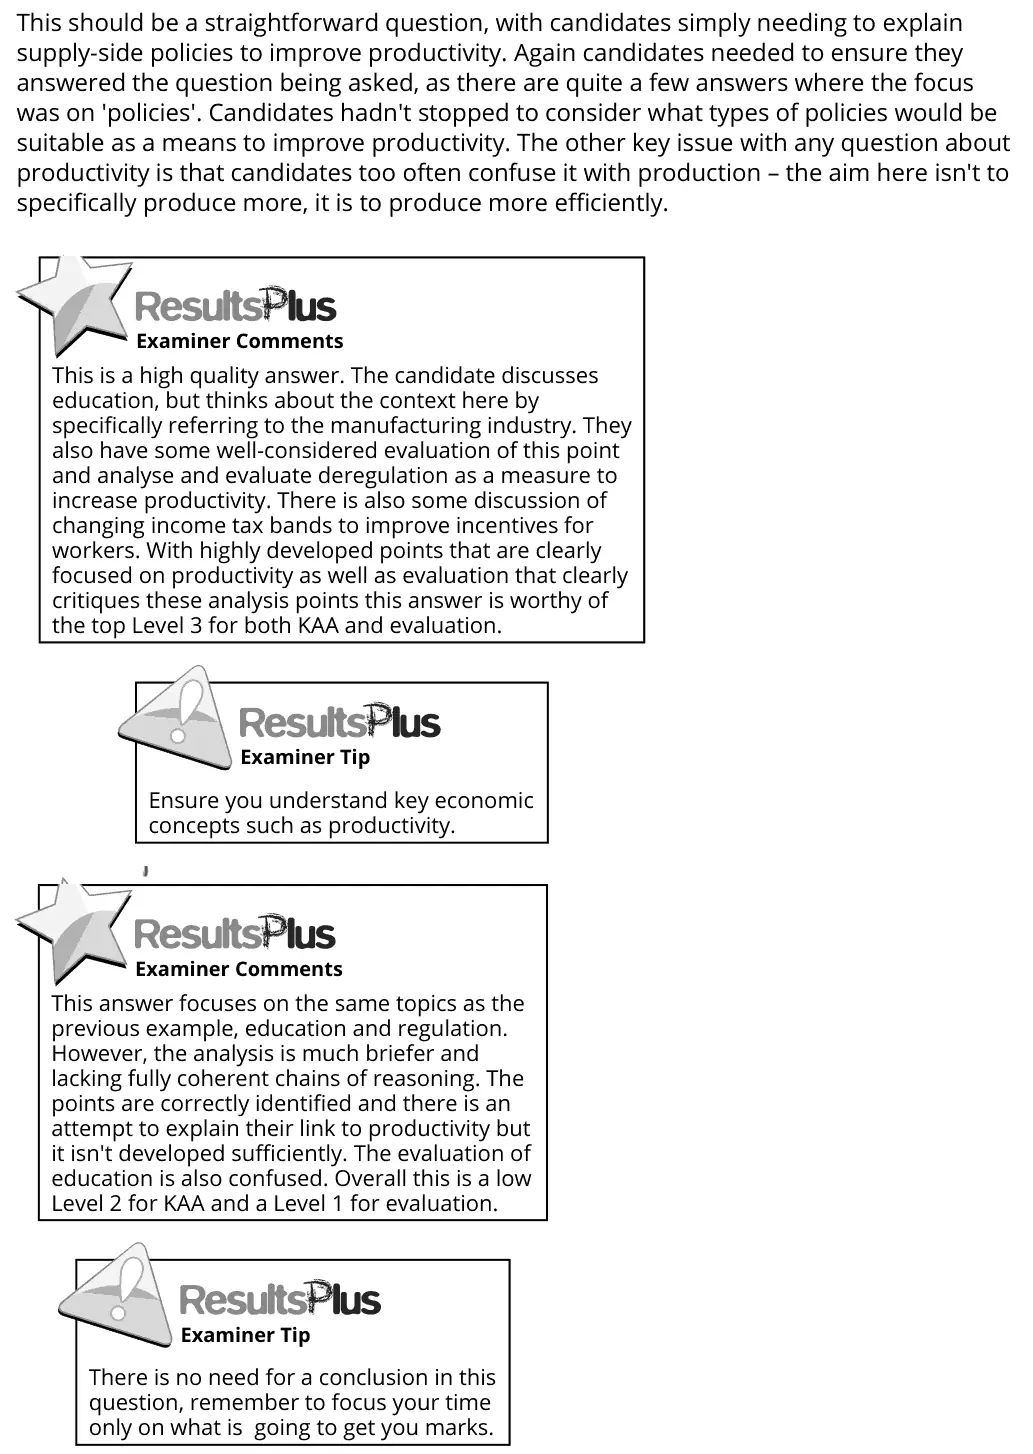
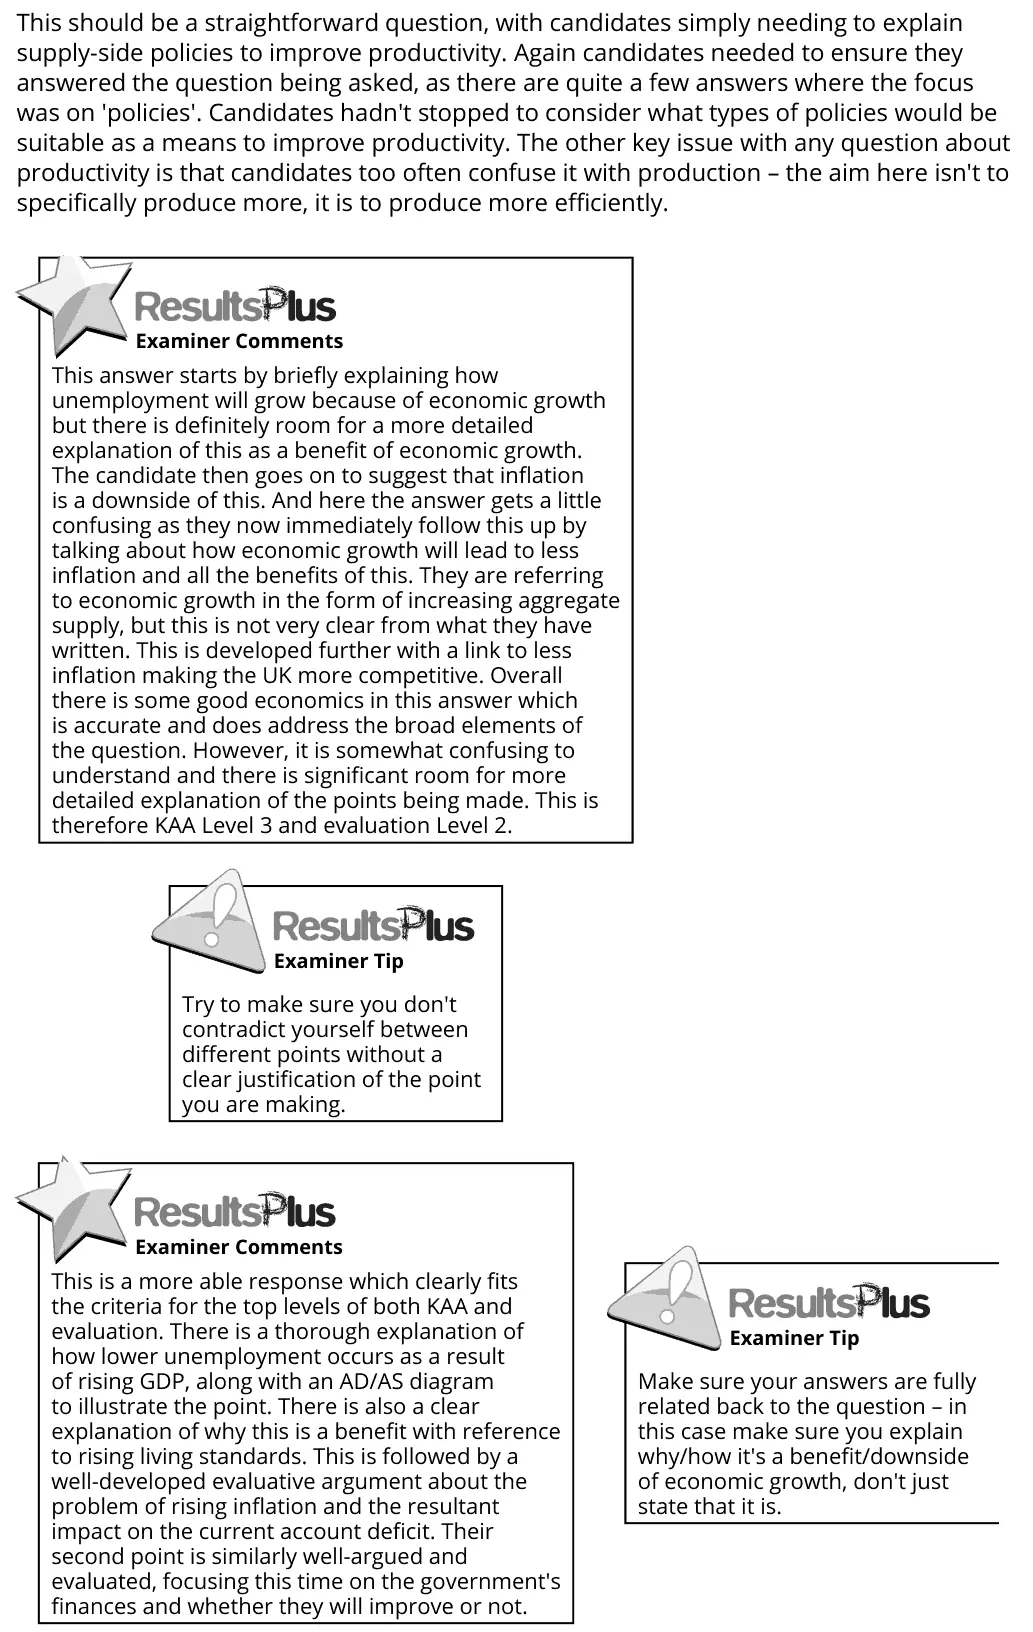
6(e) Supply-side policies 15AO1=3,AO2=3,AO3=3,AO4=6Extended response
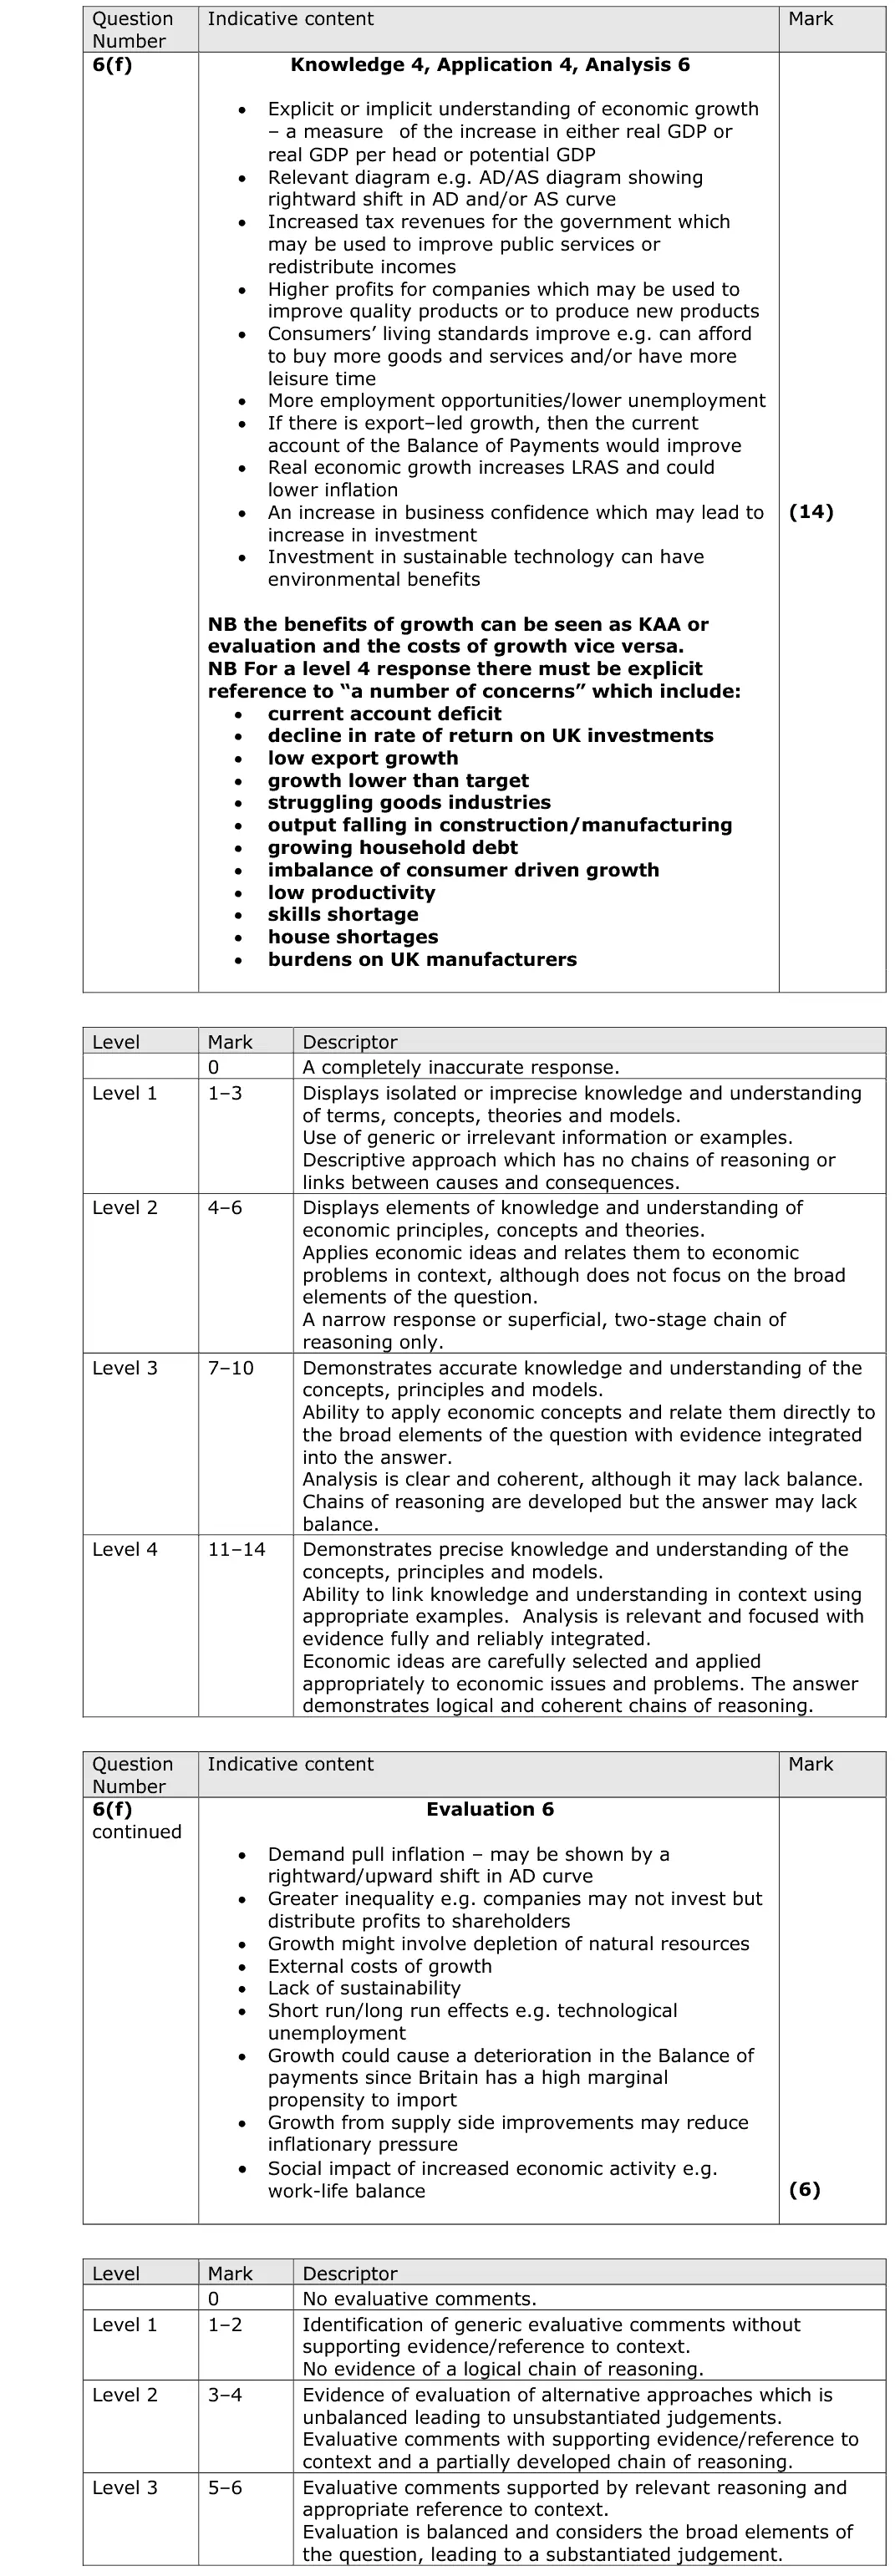
6(f) Economic growth, output gaps and the trade cycle 20AO1=4,AO2=4,AO3=6,AO4=6Essay
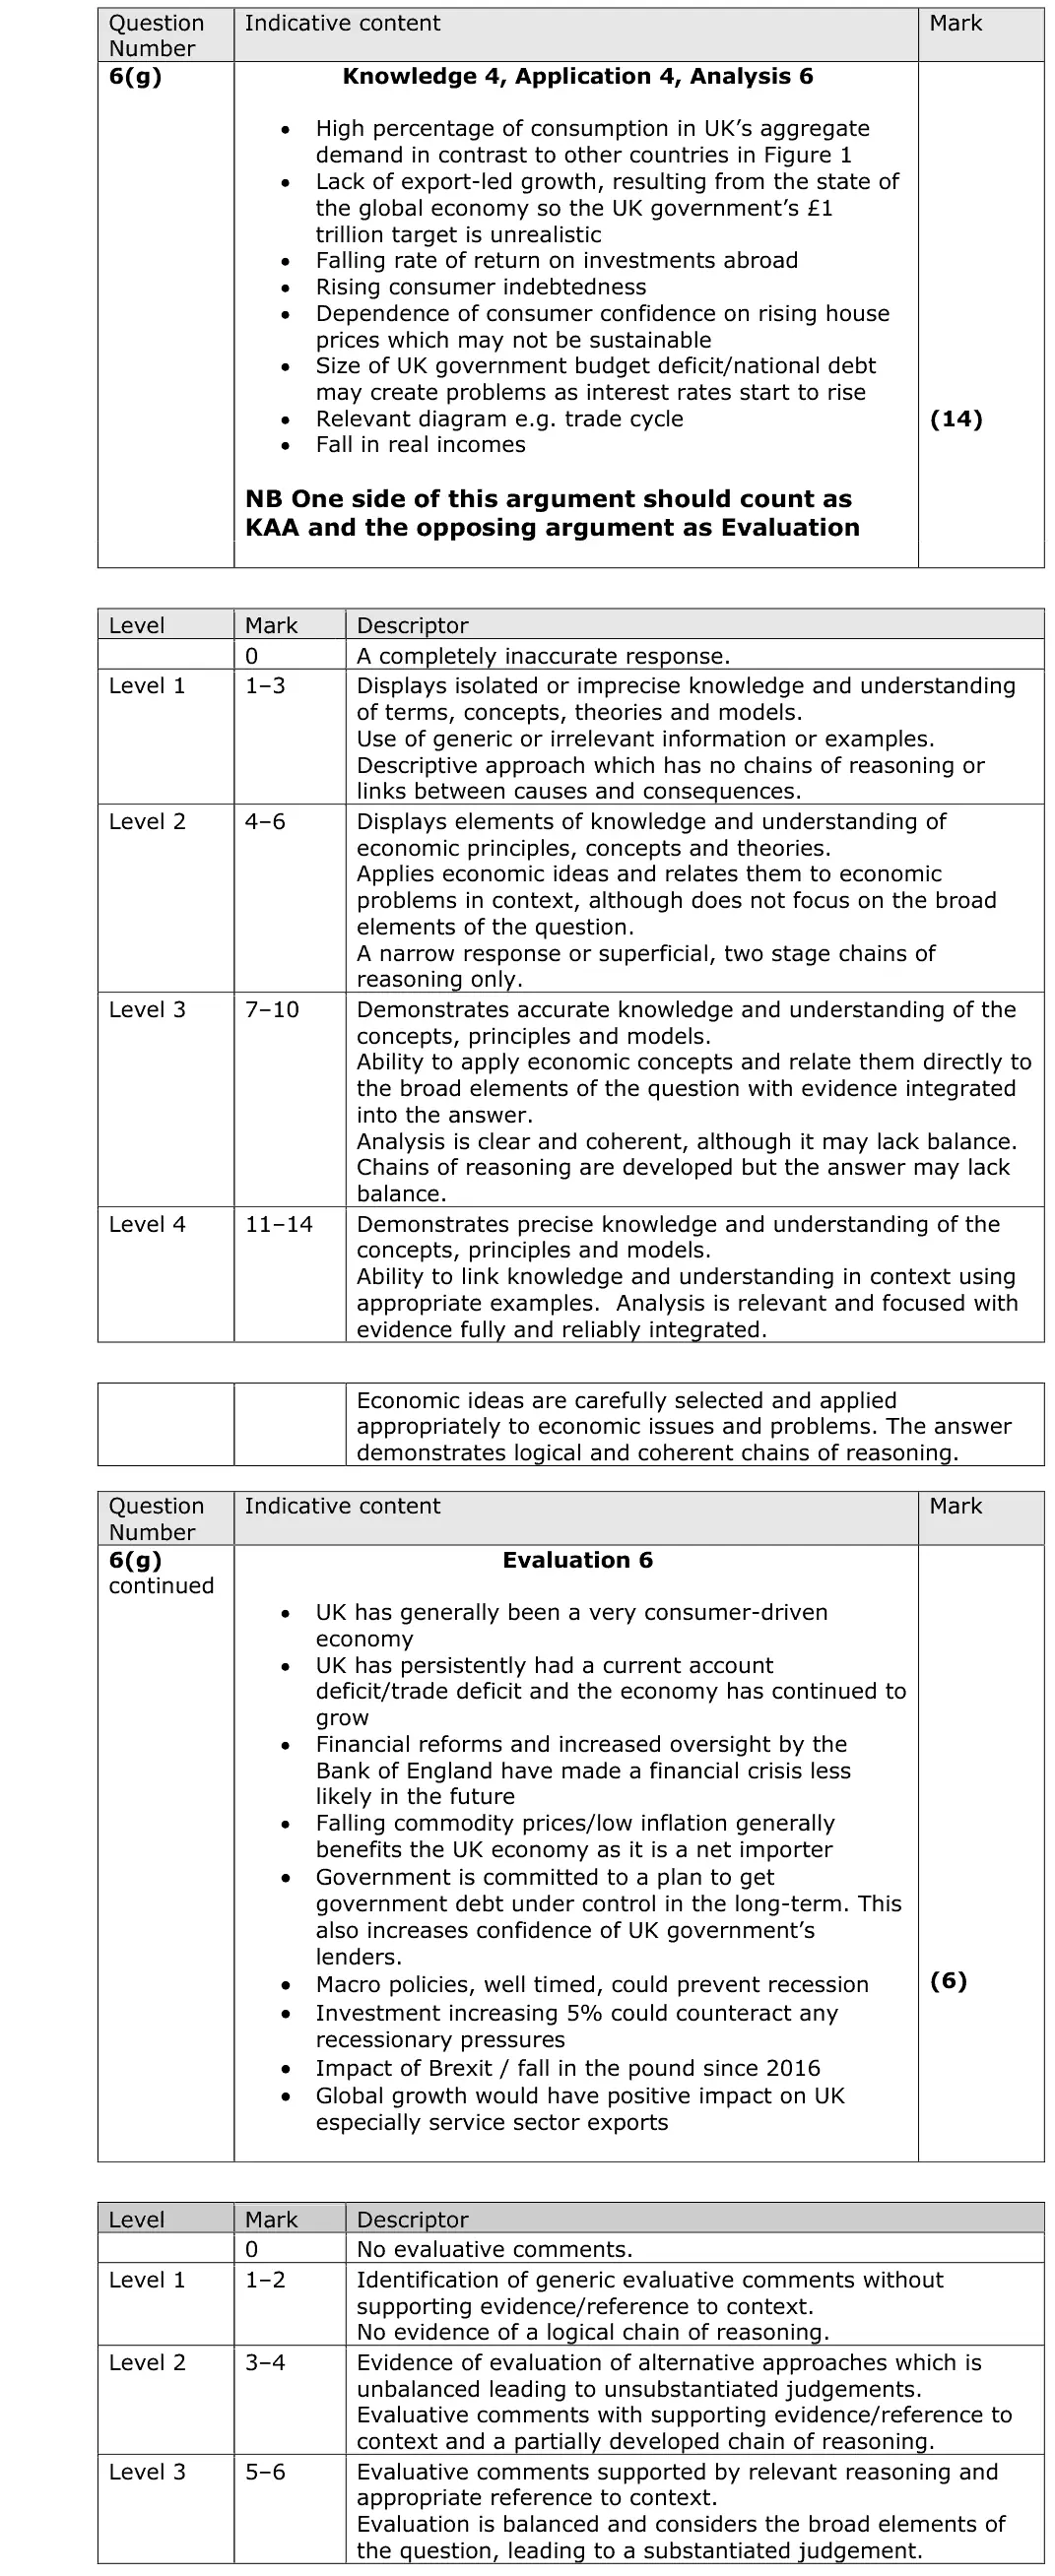
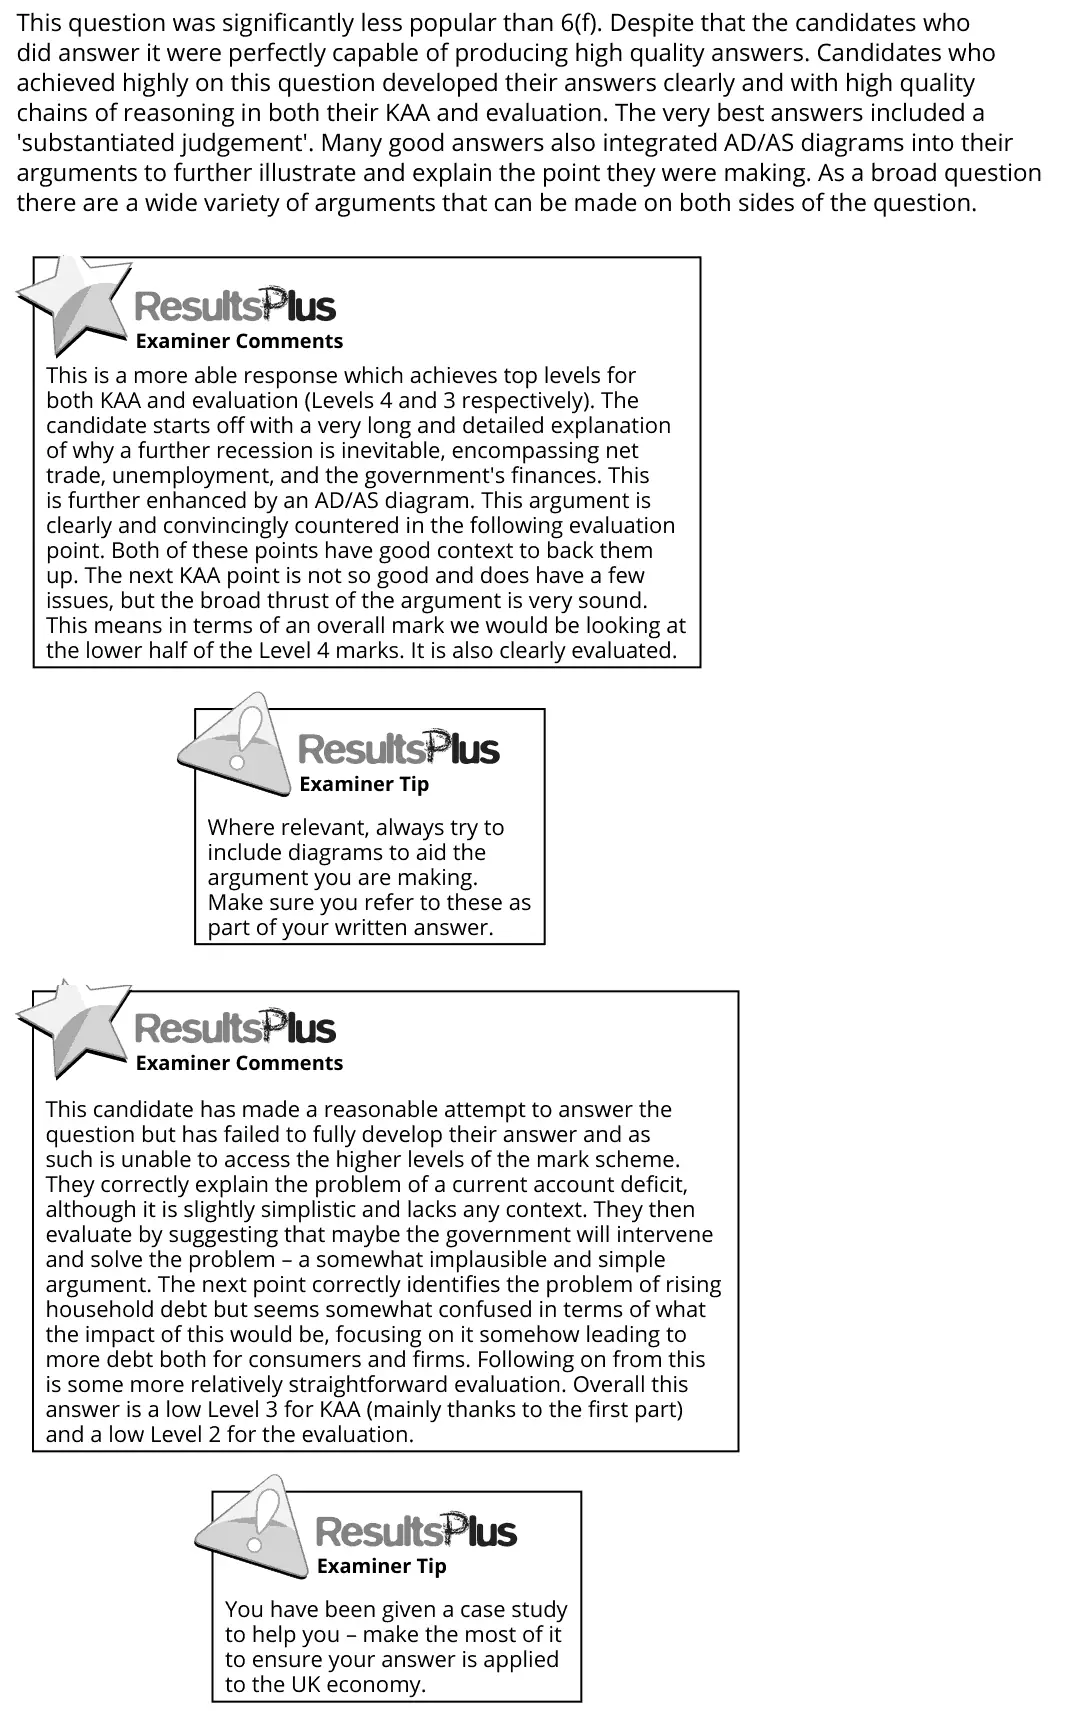
6(g) Economic growth, output gaps and the trade cycle 20AO1=4,AO2=4,AO3=6,AO4=6Essay

The questions

1(a)1(b)1(c)2(a)2(b)3(a)3(b)3(c)4(a)4(b)4(c)5(a)5(b)6(a)6(b)6(c)6(d)6(e)6(f)6(g)
June 2017 · AS Paper 2 · Q1(a) 2 marks AO2=2 Calculation inflation
Data and extracts for question 11 UK Consumer Prices Index (the base year 2005=100) September 2013 126.8 September 2014 128.4 September 2015 128.2 (Source: http://www.ons.gov.uk/ons/publications/re-reference- tables.html?edition=tcm%3A77-323657)
(a) Calculate the percentage change in the UK Consumer Prices Index from September 2014 to September 2015. You are advised to show your working. (2)
June 2017 · AS Paper 2 · Q1(b) 1 mark AO1=1 Definition inflation
Data and extracts for question 11 UK Consumer Prices Index (the base year 2005=100) September 2013 126.8 September 2014 128.4 September 2015 128.2 (Source: http://www.ons.gov.uk/ons/publications/re-reference- tables.html?edition=tcm%3A77-323657)
(b) Define the term ‘deflation’. (1)
June 2017 · AS Paper 2 · Q1(c) 1 mark Multiple choice inflation
Data and extracts for question 11 UK Consumer Prices Index (the base year 2005=100) September 2013 126.8 September 2014 128.4 September 2015 128.2 (Source: http://www.ons.gov.uk/ons/publications/re-reference- tables.html?edition=tcm%3A77-323657)
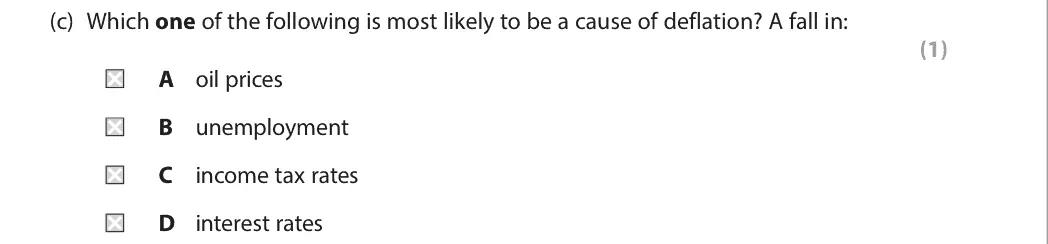
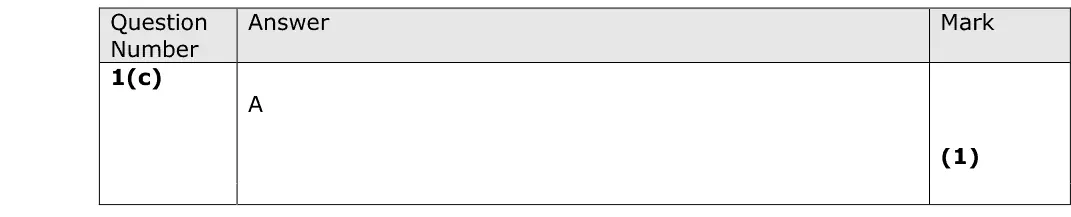
(c) Which one of the following is most likely to be a cause of deflation? A fall in: (1) A oil prices B unemployment C income tax rates D interest rates
June 2017 · AS Paper 2 · Q2(a) 3 marks AO1=1, AO2=1, AO3=1 Short answer unemployment
Data and extracts for question 22 Between 2008 and 2014 the number of people in the UK looking to work longer hours and therefore receive more total pay increased from 76 482 to 142 788. Over the same period the unemployment rate fell to 5.7%. (Sources: https://www.gov.uk/government/statistics/numbers-of-part-timers- seeking-full-time-employment and http://www.ons.gov.uk/ons/ taxonomy/index.html?nscl=Unemployment+Rates#tab-data-tables)
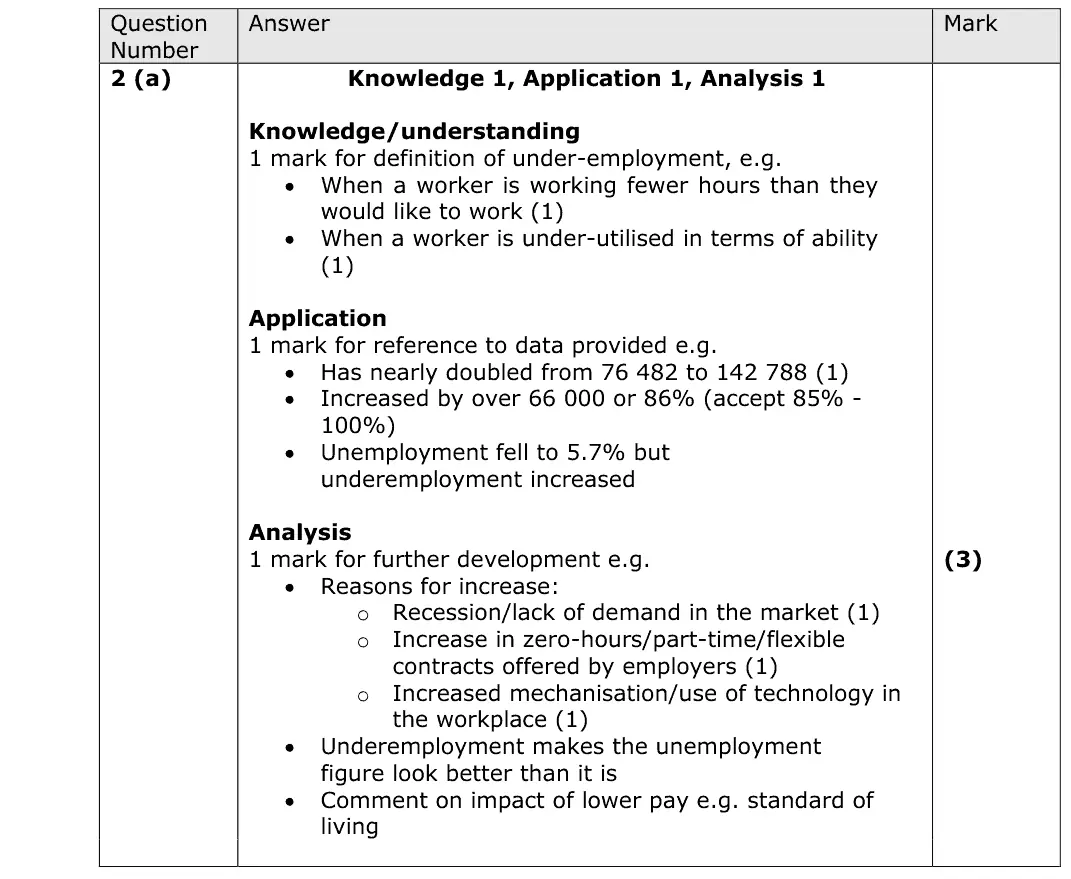
(a) With reference to the statement above, explain the term ‘under-employment’. (3)
June 2017 · AS Paper 2 · Q2(b) 1 mark Multiple choice unemployment
Data and extracts for question 22 Between 2008 and 2014 the number of people in the UK looking to work longer hours and therefore receive more total pay increased from 76 482 to 142 788. Over the same period the unemployment rate fell to 5.7%. (Sources: https://www.gov.uk/government/statistics/numbers-of-part-timers- seeking-full-time-employment and http://www.ons.gov.uk/ons/ taxonomy/index.html?nscl=Unemployment+Rates#tab-data-tables)
(b) Which one of the following is the most likely reason for a fall in the unemployment rate? (1) A Increasing unemployment benefit payments B Decreasing real GDP C Decreasing funding for apprenticeships D Increasing consumer spending
June 2017 · AS Paper 2 · Q3(a) 1 mark Multiple choice measuring economic growth
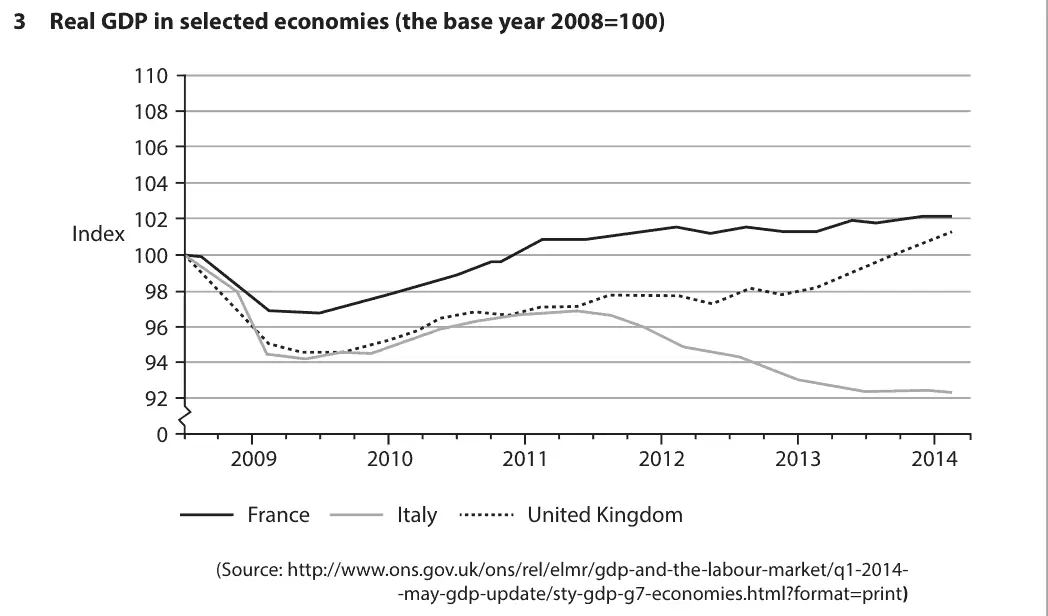
Data and extracts for question 33 Real GDP in selected economies (the base year 2008=100) 110 108 106 104 102 Index 100 98 96 94 92 0 2009 2010 2011 2012 2013 2014 France Italy United Kingdom (Source: http://www.ons.gov.uk/ons/rel/elmr/gdp-and-the-labour-market/q1-2014- -may-gdp-update/sty-gdp-g7-economies.html?format=print)
(a) Which one of the following can be inferred from the chart? (1) A The UK’s real GDP is smaller in 2014 than it was in 2008 B Between 2008 and 2014 France’s real GDP growth rate was higher than Italy’s C Between 2008 and 2014 inflation was lower in France than in the UK D France experienced a greater fall in real GDP than the UK in 2014
June 2017 · AS Paper 2 · Q3(b) 2 marks AO1=2 Definition measuring economic growth
Data and extracts for question 33 Real GDP in selected economies (the base year 2008=100) 110 108 106 104 102 Index 100 98 96 94 92 0 2009 2010 2011 2012 2013 2014 France Italy United Kingdom (Source: http://www.ons.gov.uk/ons/rel/elmr/gdp-and-the-labour-market/q1-2014- -may-gdp-update/sty-gdp-g7-economies.html?format=print)
(b) Define the term ‘real GDP’. (2)
June 2017 · AS Paper 2 · Q3(c) 1 mark AO1=1 Diagram economic growth and the trade cycle
Data and extracts for question 33 Real GDP in selected economies (the base year 2008=100) 110 108 106 104 102 Index 100 98 96 94 92 0 2009 2010 2011 2012 2013 2014 France Italy United Kingdom (Source: http://www.ons.gov.uk/ons/rel/elmr/gdp-and-the-labour-market/q1-2014- -may-gdp-update/sty-gdp-g7-economies.html?format=print)
(c) Illustrate a negative output gap on the diagram below. (1) Price AS level P1 AD Y1 Real output
June 2017 · AS Paper 2 · Q4(a) 2 marks AO2=2 Diagram national income and the multiplierfiscal and monetary policy
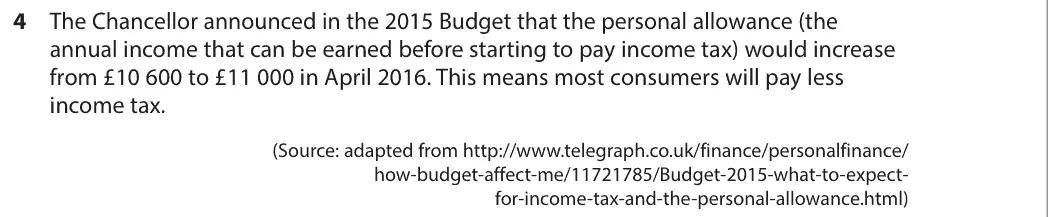
Data and extracts for question 44 The Chancellor announced in the 2015 Budget that the personal allowance (the annual income that can be earned before starting to pay income tax) would increase from £10 600 to £11 000 in April 2016. This means most consumers will pay less income tax. (Source: adapted from http://www.telegraph.co.uk/finance/personalfinance/ how-budget-affect-me/11721785/Budget-2015-what-to-expect- for-income-tax-and-the-personal-allowance.html)
(a) Annotate the aggregate demand and aggregate supply diagram below to show the likely impact of the increase in the personal allowance on the UK’s price level and real output. (2)
June 2017 · AS Paper 2 · Q4(b) 1 mark AO1=1 Definition fiscal and monetary policy
Data and extracts for question 44 The Chancellor announced in the 2015 Budget that the personal allowance (the annual income that can be earned before starting to pay income tax) would increase from £10 600 to £11 000 in April 2016. This means most consumers will pay less income tax. (Source: adapted from http://www.telegraph.co.uk/finance/personalfinance/ how-budget-affect-me/11721785/Budget-2015-what-to-expect- for-income-tax-and-the-personal-allowance.html)
Price AS level P1 AD Y1 Real output (b) Define the term ‘direct tax’. (1)
June 2017 · AS Paper 2 · Q4(c) 1 mark Multiple choice fiscal and monetary policy
Data and extracts for question 44 The Chancellor announced in the 2015 Budget that the personal allowance (the annual income that can be earned before starting to pay income tax) would increase from £10 600 to £11 000 in April 2016. This means most consumers will pay less income tax. (Source: adapted from http://www.telegraph.co.uk/finance/personalfinance/ how-budget-affect-me/11721785/Budget-2015-what-to-expect- for-income-tax-and-the-personal-allowance.html)
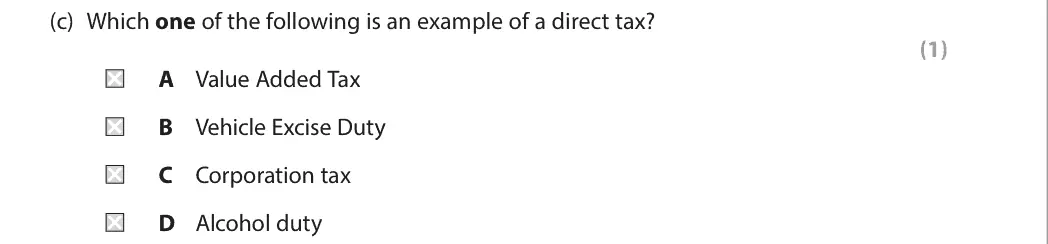
(c) Which one of the following is an example of a direct tax? (1) A Value Added Tax B Vehicle Excise Duty C Corporation tax D Alcohol duty
June 2017 · AS Paper 2 · Q5(a) 3 marks AO1=1, AO2=1, AO3=1 Short answer aggregate demand
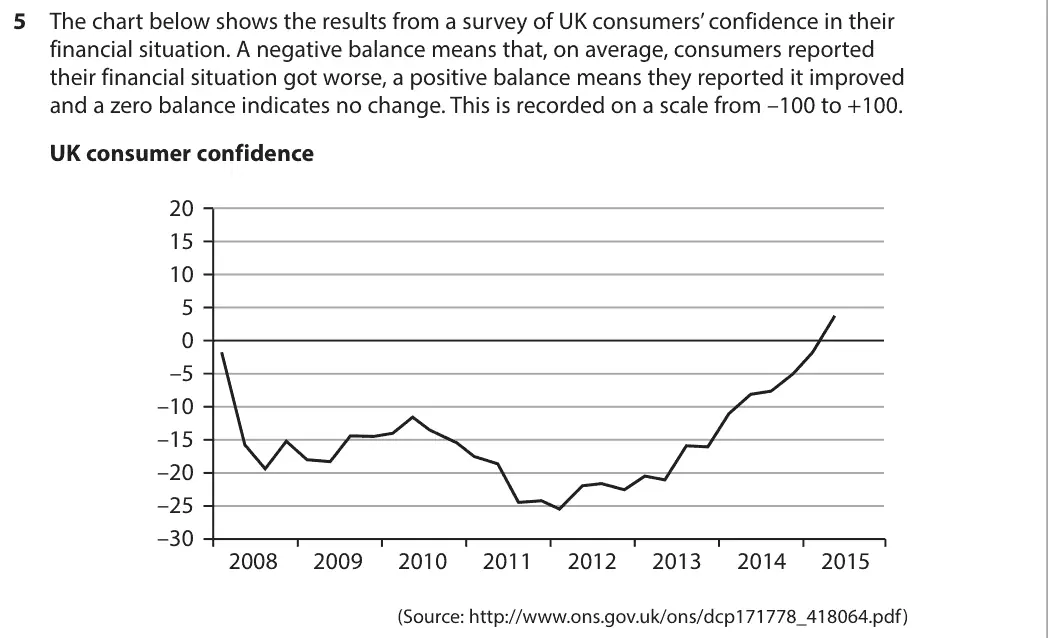
Data and extracts for question 55 The chart below shows the results from a survey of UK consumers’ confidence in their financial situation. A negative balance means that, on average, consumers reported their financial situation got worse, a positive balance means they reported it improved and a zero balance indicates no change. This is recorded on a scale from –100 to +100. UK consumer confidence 20 15 10 5 0 –5 –10 –15 –20 –25 –30 2008 2009 2010 2011 2012 2013 2014 2015 (Source: http://www.ons.gov.uk/ons/dcp171778_418064.pdf)
(a) Explain one likely reason for the change in consumer confidence between 2012 and 2015. (3)
June 2017 · AS Paper 2 · Q5(b) 1 mark Multiple choice national income and the multiplier
Data and extracts for question 55 The chart below shows the results from a survey of UK consumers’ confidence in their financial situation. A negative balance means that, on average, consumers reported their financial situation got worse, a positive balance means they reported it improved and a zero balance indicates no change. This is recorded on a scale from –100 to +100. UK consumer confidence 20 15 10 5 0 –5 –10 –15 –20 –25 –30 2008 2009 2010 2011 2012 2013 2014 2015 (Source: http://www.ons.gov.uk/ons/dcp171778_418064.pdf)
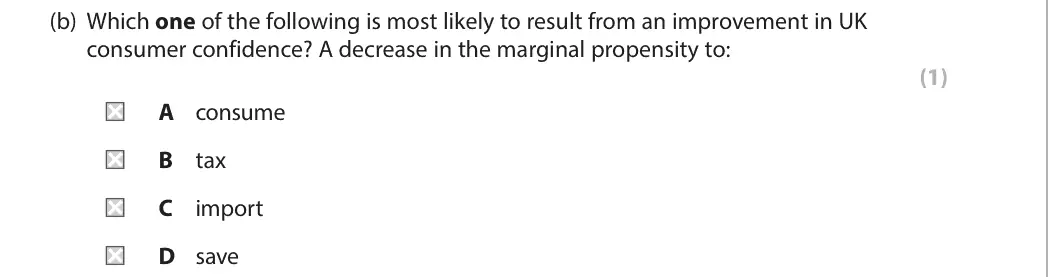
(b) Which one of the following is most likely to result from an improvement in UK consumer confidence? A decrease in the marginal propensity to: (1) A consume B tax C import D save
June 2017 · AS Paper 2 · Q6(a) 4 marks AO1=2, AO2=2 Short answer aggregate demand
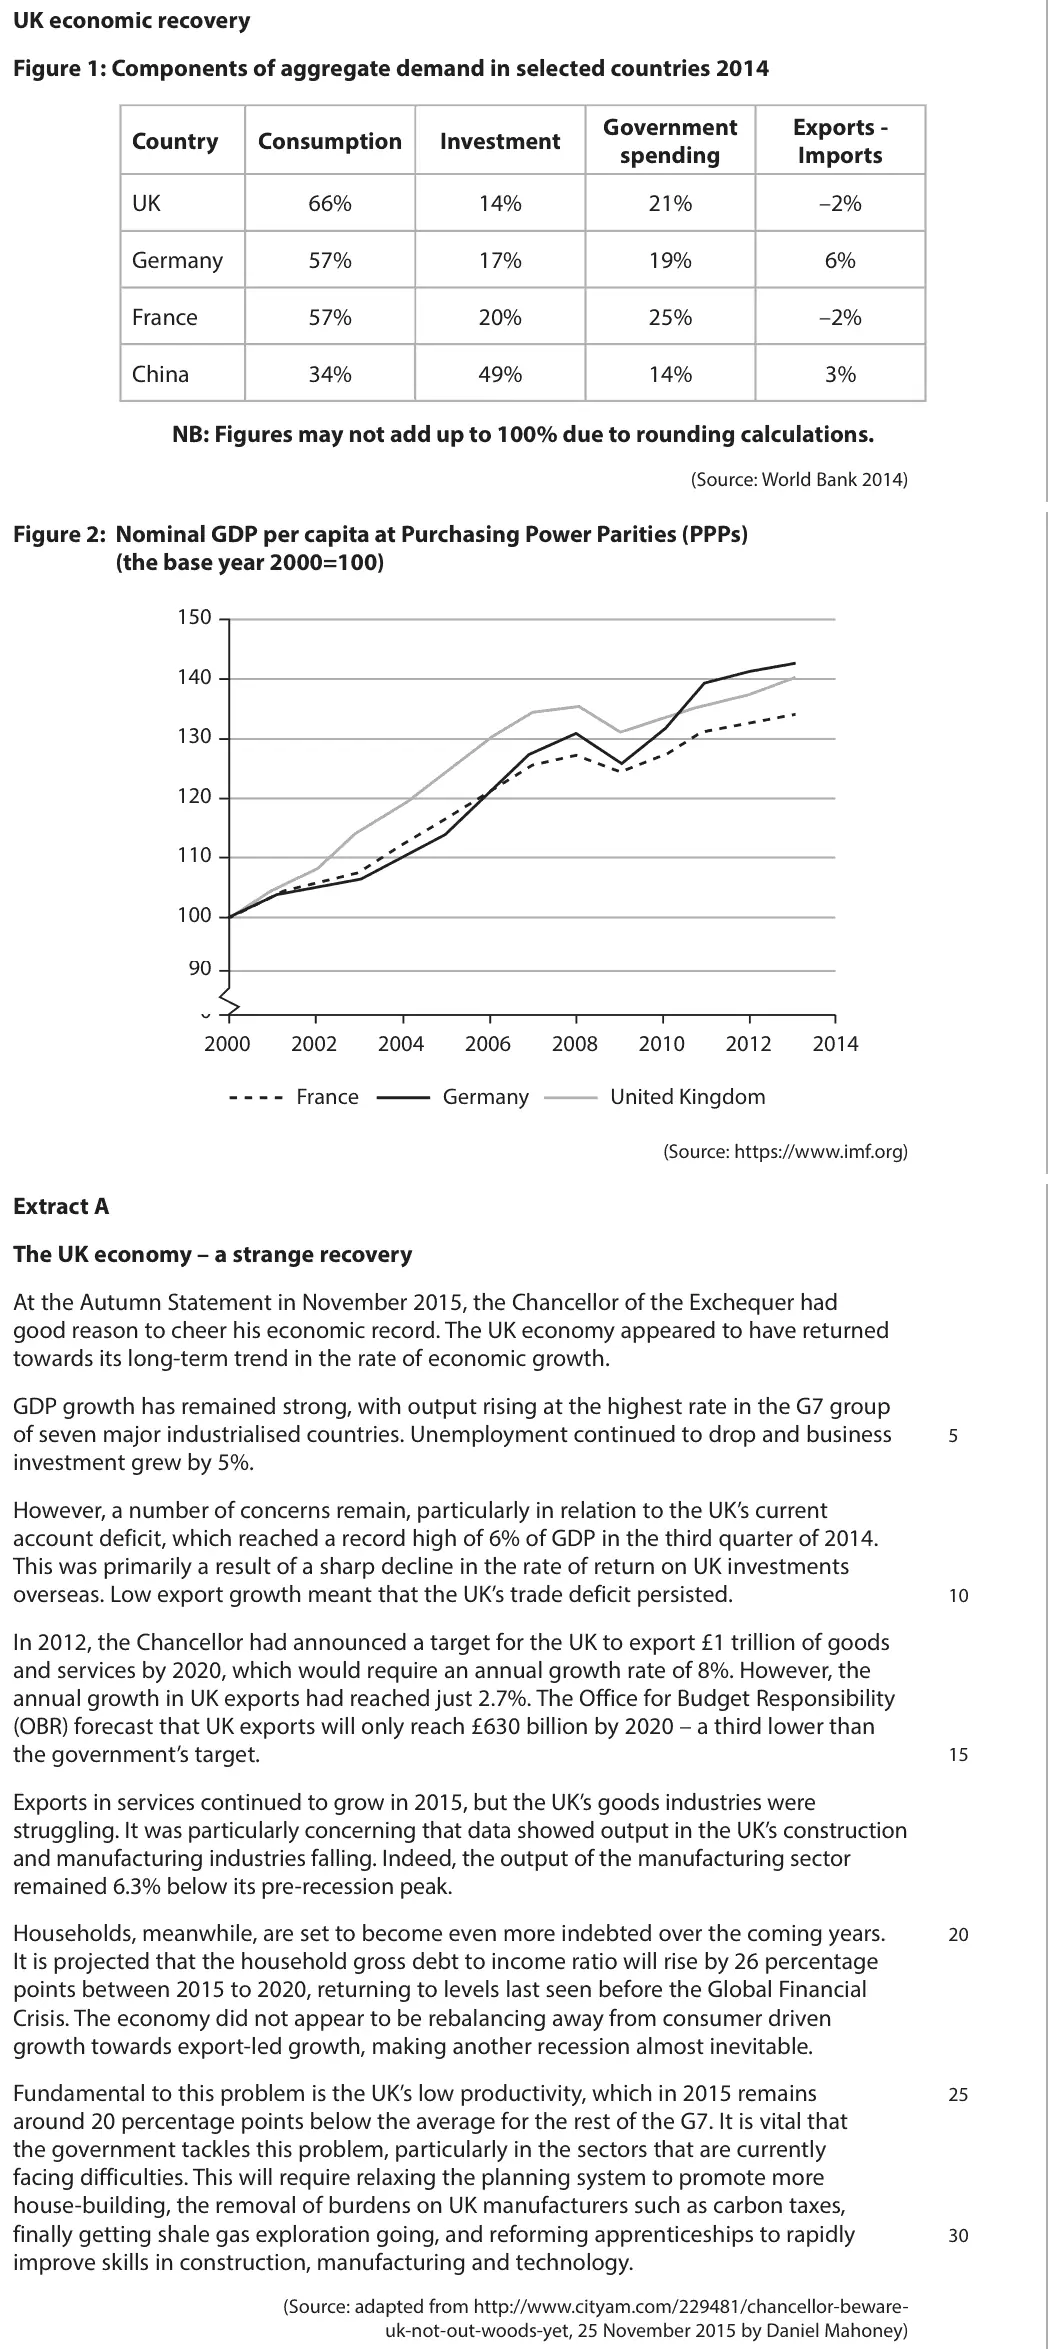
Data and extracts for question 6UK economic recovery Figure 1: Components of aggregate demand in selected countries 2014 Government Exports - Country Consumption Investment spending Imports UK 66% 14% 21% –2% Germany 57% 17% 19% 6% France 57% 20% 25% –2% China 34% 49% 14% 3% NB: Figures may not add up to 100% due to rounding calculations. (Source: World Bank 2014) Figure 2: Nominal GDP per capita at Purchasing Power Parities (PPPs) (the base year 2000=100) 150 140 130 120 110 100 90 0 2000 2002 2004 2006 2008 2010 2012 2014 France Germany United Kingdom (Source: https://www.imf.org) Extract A The UK economy – a strange recovery At the Autumn Statement in November 2015, the Chancellor of the Exchequer had good reason to cheer his economic record. The UK economy appeared to have returned towards its long-term trend in the rate of economic growth. GDP growth has remained strong, with output rising at the highest rate in the G7 group of seven major industrialised countries. Unemployment continued to drop and business 5 investment grew by 5%. However, a number of concerns remain, particularly in relation to the UK’s current account deficit, which reached a record high of 6% of GDP in the third quarter of 2014. This was primarily a result of a sharp decline in the rate of return on UK investments overseas. Low export growth meant that the UK’s trade deficit persisted. 10 In 2012, the Chancellor had announced a target for the UK to export £1 trillion of goods and services by 2020, which would require an annual growth rate of 8%. However, the annual growth in UK exports had reached just 2.7%. The Office for Budget Responsibility (OBR) forecast that UK exports will only reach £630 billion by 2020 – a third lower than the government’s target. 15 Exports in services continued to grow in 2015, but the UK’s goods industries were struggling. It was particularly concerning that data showed output in the UK’s construction and manufacturing industries falling. Indeed, the output of the manufacturing sector remained 6.3% below its pre-recession peak. Households, meanwhile, are set to become even more indebted over the coming years. 20 It is projected that the household gross debt to income ratio will rise by 26 percentage points between 2015 to 2020, returning to levels last seen before the Global Financial Crisis. The economy did not appear to be rebalancing away from consumer driven growth towards export-led growth, making another recession almost inevitable. Fundamental to this problem is the UK’s low productivity, which in 2015 remains 25 around 20 percentage points below the average for the rest of the G7. It is vital that the government tackles this problem, particularly in the sectors that are currently facing difficulties. This will require relaxing the planning system to promote more house-building, the removal of burdens on UK manufacturers such as carbon taxes, finally getting shale gas exploration going, and reforming apprenticeships to rapidly 30 improve skills in construction, manufacturing and technology. (Source: adapted from http://www.cityam.com/229481/chancellor-beware- uk-not-out-woods-yet, 25 November 2015 by Daniel Mahoney)
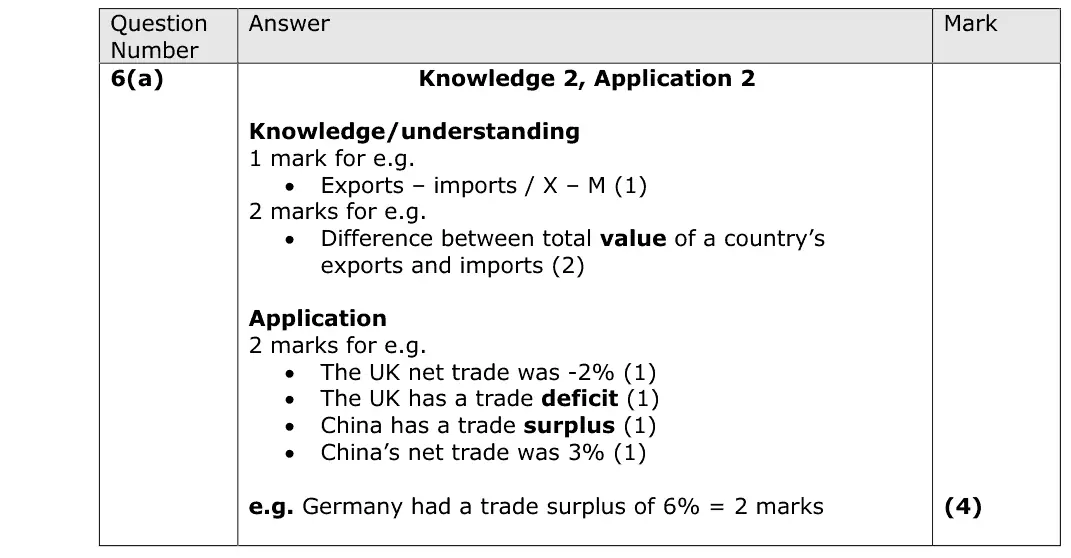
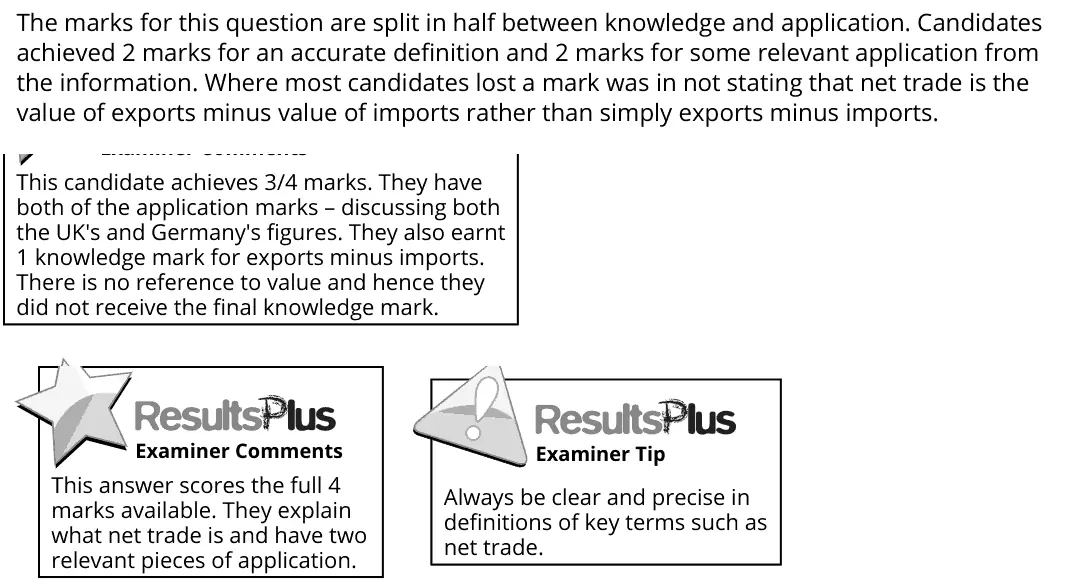
(a) With reference to Figure 1, explain the term ‘net trade’. (4)
June 2017 · AS Paper 2 · Q6(b) 10 marks AO1=2, AO2=2, AO3=2, AO4=4 10-mark response balance of paymentsaggregate demand
Data and extracts for question 6UK economic recovery Figure 1: Components of aggregate demand in selected countries 2014 Government Exports - Country Consumption Investment spending Imports UK 66% 14% 21% –2% Germany 57% 17% 19% 6% France 57% 20% 25% –2% China 34% 49% 14% 3% NB: Figures may not add up to 100% due to rounding calculations. (Source: World Bank 2014) Figure 2: Nominal GDP per capita at Purchasing Power Parities (PPPs) (the base year 2000=100) 150 140 130 120 110 100 90 0 2000 2002 2004 2006 2008 2010 2012 2014 France Germany United Kingdom (Source: https://www.imf.org) Extract A The UK economy – a strange recovery At the Autumn Statement in November 2015, the Chancellor of the Exchequer had good reason to cheer his economic record. The UK economy appeared to have returned towards its long-term trend in the rate of economic growth. GDP growth has remained strong, with output rising at the highest rate in the G7 group of seven major industrialised countries. Unemployment continued to drop and business 5 investment grew by 5%. However, a number of concerns remain, particularly in relation to the UK’s current account deficit, which reached a record high of 6% of GDP in the third quarter of 2014. This was primarily a result of a sharp decline in the rate of return on UK investments overseas. Low export growth meant that the UK’s trade deficit persisted. 10 In 2012, the Chancellor had announced a target for the UK to export £1 trillion of goods and services by 2020, which would require an annual growth rate of 8%. However, the annual growth in UK exports had reached just 2.7%. The Office for Budget Responsibility (OBR) forecast that UK exports will only reach £630 billion by 2020 – a third lower than the government’s target. 15 Exports in services continued to grow in 2015, but the UK’s goods industries were struggling. It was particularly concerning that data showed output in the UK’s construction and manufacturing industries falling. Indeed, the output of the manufacturing sector remained 6.3% below its pre-recession peak. Households, meanwhile, are set to become even more indebted over the coming years. 20 It is projected that the household gross debt to income ratio will rise by 26 percentage points between 2015 to 2020, returning to levels last seen before the Global Financial Crisis. The economy did not appear to be rebalancing away from consumer driven growth towards export-led growth, making another recession almost inevitable. Fundamental to this problem is the UK’s low productivity, which in 2015 remains 25 around 20 percentage points below the average for the rest of the G7. It is vital that the government tackles this problem, particularly in the sectors that are currently facing difficulties. This will require relaxing the planning system to promote more house-building, the removal of burdens on UK manufacturers such as carbon taxes, finally getting shale gas exploration going, and reforming apprenticeships to rapidly 30 improve skills in construction, manufacturing and technology. (Source: adapted from http://www.cityam.com/229481/chancellor-beware- uk-not-out-woods-yet, 25 November 2015 by Daniel Mahoney)
(b) With reference to the information provided and your own knowledge, assess the likely causes of the UK’s trade deficit. (10)
June 2017 · AS Paper 2 · Q6(c) 5 marks AO1=1, AO2=2, AO3=2 Short answer aggregate demand
Data and extracts for question 6UK economic recovery Figure 1: Components of aggregate demand in selected countries 2014 Government Exports - Country Consumption Investment spending Imports UK 66% 14% 21% –2% Germany 57% 17% 19% 6% France 57% 20% 25% –2% China 34% 49% 14% 3% NB: Figures may not add up to 100% due to rounding calculations. (Source: World Bank 2014) Figure 2: Nominal GDP per capita at Purchasing Power Parities (PPPs) (the base year 2000=100) 150 140 130 120 110 100 90 0 2000 2002 2004 2006 2008 2010 2012 2014 France Germany United Kingdom (Source: https://www.imf.org) Extract A The UK economy – a strange recovery At the Autumn Statement in November 2015, the Chancellor of the Exchequer had good reason to cheer his economic record. The UK economy appeared to have returned towards its long-term trend in the rate of economic growth. GDP growth has remained strong, with output rising at the highest rate in the G7 group of seven major industrialised countries. Unemployment continued to drop and business 5 investment grew by 5%. However, a number of concerns remain, particularly in relation to the UK’s current account deficit, which reached a record high of 6% of GDP in the third quarter of 2014. This was primarily a result of a sharp decline in the rate of return on UK investments overseas. Low export growth meant that the UK’s trade deficit persisted. 10 In 2012, the Chancellor had announced a target for the UK to export £1 trillion of goods and services by 2020, which would require an annual growth rate of 8%. However, the annual growth in UK exports had reached just 2.7%. The Office for Budget Responsibility (OBR) forecast that UK exports will only reach £630 billion by 2020 – a third lower than the government’s target. 15 Exports in services continued to grow in 2015, but the UK’s goods industries were struggling. It was particularly concerning that data showed output in the UK’s construction and manufacturing industries falling. Indeed, the output of the manufacturing sector remained 6.3% below its pre-recession peak. Households, meanwhile, are set to become even more indebted over the coming years. 20 It is projected that the household gross debt to income ratio will rise by 26 percentage points between 2015 to 2020, returning to levels last seen before the Global Financial Crisis. The economy did not appear to be rebalancing away from consumer driven growth towards export-led growth, making another recession almost inevitable. Fundamental to this problem is the UK’s low productivity, which in 2015 remains 25 around 20 percentage points below the average for the rest of the G7. It is vital that the government tackles this problem, particularly in the sectors that are currently facing difficulties. This will require relaxing the planning system to promote more house-building, the removal of burdens on UK manufacturers such as carbon taxes, finally getting shale gas exploration going, and reforming apprenticeships to rapidly 30 improve skills in construction, manufacturing and technology. (Source: adapted from http://www.cityam.com/229481/chancellor-beware- uk-not-out-woods-yet, 25 November 2015 by Daniel Mahoney)
(c) With reference to Extract A, paragraph 2, explain one likely influence on UK investment. (5)
June 2017 · AS Paper 2 · Q6(d) 6 marks AO1=2, AO2=2, AO3=2 Short answer measuring economic growth
Data and extracts for question 6UK economic recovery Figure 1: Components of aggregate demand in selected countries 2014 Government Exports - Country Consumption Investment spending Imports UK 66% 14% 21% –2% Germany 57% 17% 19% 6% France 57% 20% 25% –2% China 34% 49% 14% 3% NB: Figures may not add up to 100% due to rounding calculations. (Source: World Bank 2014) Figure 2: Nominal GDP per capita at Purchasing Power Parities (PPPs) (the base year 2000=100) 150 140 130 120 110 100 90 0 2000 2002 2004 2006 2008 2010 2012 2014 France Germany United Kingdom (Source: https://www.imf.org) Extract A The UK economy – a strange recovery At the Autumn Statement in November 2015, the Chancellor of the Exchequer had good reason to cheer his economic record. The UK economy appeared to have returned towards its long-term trend in the rate of economic growth. GDP growth has remained strong, with output rising at the highest rate in the G7 group of seven major industrialised countries. Unemployment continued to drop and business 5 investment grew by 5%. However, a number of concerns remain, particularly in relation to the UK’s current account deficit, which reached a record high of 6% of GDP in the third quarter of 2014. This was primarily a result of a sharp decline in the rate of return on UK investments overseas. Low export growth meant that the UK’s trade deficit persisted. 10 In 2012, the Chancellor had announced a target for the UK to export £1 trillion of goods and services by 2020, which would require an annual growth rate of 8%. However, the annual growth in UK exports had reached just 2.7%. The Office for Budget Responsibility (OBR) forecast that UK exports will only reach £630 billion by 2020 – a third lower than the government’s target. 15 Exports in services continued to grow in 2015, but the UK’s goods industries were struggling. It was particularly concerning that data showed output in the UK’s construction and manufacturing industries falling. Indeed, the output of the manufacturing sector remained 6.3% below its pre-recession peak. Households, meanwhile, are set to become even more indebted over the coming years. 20 It is projected that the household gross debt to income ratio will rise by 26 percentage points between 2015 to 2020, returning to levels last seen before the Global Financial Crisis. The economy did not appear to be rebalancing away from consumer driven growth towards export-led growth, making another recession almost inevitable. Fundamental to this problem is the UK’s low productivity, which in 2015 remains 25 around 20 percentage points below the average for the rest of the G7. It is vital that the government tackles this problem, particularly in the sectors that are currently facing difficulties. This will require relaxing the planning system to promote more house-building, the removal of burdens on UK manufacturers such as carbon taxes, finally getting shale gas exploration going, and reforming apprenticeships to rapidly 30 improve skills in construction, manufacturing and technology. (Source: adapted from http://www.cityam.com/229481/chancellor-beware- uk-not-out-woods-yet, 25 November 2015 by Daniel Mahoney)
(d) With reference to Figure 2 and Extract A, explain two likely reasons why the growth of the UK’s nominal GDP per capita at PPPs was slower than that of Germany after 2010. (6)
June 2017 · AS Paper 2 · Q6(e) 15 marks AO1=3, AO2=3, AO3=3, AO4=6 15-mark response supply side policies
Data and extracts for question 6UK economic recovery Figure 1: Components of aggregate demand in selected countries 2014 Government Exports - Country Consumption Investment spending Imports UK 66% 14% 21% –2% Germany 57% 17% 19% 6% France 57% 20% 25% –2% China 34% 49% 14% 3% NB: Figures may not add up to 100% due to rounding calculations. (Source: World Bank 2014) Figure 2: Nominal GDP per capita at Purchasing Power Parities (PPPs) (the base year 2000=100) 150 140 130 120 110 100 90 0 2000 2002 2004 2006 2008 2010 2012 2014 France Germany United Kingdom (Source: https://www.imf.org) Extract A The UK economy – a strange recovery At the Autumn Statement in November 2015, the Chancellor of the Exchequer had good reason to cheer his economic record. The UK economy appeared to have returned towards its long-term trend in the rate of economic growth. GDP growth has remained strong, with output rising at the highest rate in the G7 group of seven major industrialised countries. Unemployment continued to drop and business 5 investment grew by 5%. However, a number of concerns remain, particularly in relation to the UK’s current account deficit, which reached a record high of 6% of GDP in the third quarter of 2014. This was primarily a result of a sharp decline in the rate of return on UK investments overseas. Low export growth meant that the UK’s trade deficit persisted. 10 In 2012, the Chancellor had announced a target for the UK to export £1 trillion of goods and services by 2020, which would require an annual growth rate of 8%. However, the annual growth in UK exports had reached just 2.7%. The Office for Budget Responsibility (OBR) forecast that UK exports will only reach £630 billion by 2020 – a third lower than the government’s target. 15 Exports in services continued to grow in 2015, but the UK’s goods industries were struggling. It was particularly concerning that data showed output in the UK’s construction and manufacturing industries falling. Indeed, the output of the manufacturing sector remained 6.3% below its pre-recession peak. Households, meanwhile, are set to become even more indebted over the coming years. 20 It is projected that the household gross debt to income ratio will rise by 26 percentage points between 2015 to 2020, returning to levels last seen before the Global Financial Crisis. The economy did not appear to be rebalancing away from consumer driven growth towards export-led growth, making another recession almost inevitable. Fundamental to this problem is the UK’s low productivity, which in 2015 remains 25 around 20 percentage points below the average for the rest of the G7. It is vital that the government tackles this problem, particularly in the sectors that are currently facing difficulties. This will require relaxing the planning system to promote more house-building, the removal of burdens on UK manufacturers such as carbon taxes, finally getting shale gas exploration going, and reforming apprenticeships to rapidly 30 improve skills in construction, manufacturing and technology. (Source: adapted from http://www.cityam.com/229481/chancellor-beware- uk-not-out-woods-yet, 25 November 2015 by Daniel Mahoney)
(e) Evaluate policies the government could use to increase the UK’s productivity. (15)
June 2017 · AS Paper 2 · Q6(f) 20 marks AO1=4, AO2=4, AO3=6, AO4=6 20-mark essay Either/or economic growth and the trade cycle
Data and extracts for question 6UK economic recovery Figure 1: Components of aggregate demand in selected countries 2014 Government Exports - Country Consumption Investment spending Imports UK 66% 14% 21% –2% Germany 57% 17% 19% 6% France 57% 20% 25% –2% China 34% 49% 14% 3% NB: Figures may not add up to 100% due to rounding calculations. (Source: World Bank 2014) Figure 2: Nominal GDP per capita at Purchasing Power Parities (PPPs) (the base year 2000=100) 150 140 130 120 110 100 90 0 2000 2002 2004 2006 2008 2010 2012 2014 France Germany United Kingdom (Source: https://www.imf.org) Extract A The UK economy – a strange recovery At the Autumn Statement in November 2015, the Chancellor of the Exchequer had good reason to cheer his economic record. The UK economy appeared to have returned towards its long-term trend in the rate of economic growth. GDP growth has remained strong, with output rising at the highest rate in the G7 group of seven major industrialised countries. Unemployment continued to drop and business 5 investment grew by 5%. However, a number of concerns remain, particularly in relation to the UK’s current account deficit, which reached a record high of 6% of GDP in the third quarter of 2014. This was primarily a result of a sharp decline in the rate of return on UK investments overseas. Low export growth meant that the UK’s trade deficit persisted. 10 In 2012, the Chancellor had announced a target for the UK to export £1 trillion of goods and services by 2020, which would require an annual growth rate of 8%. However, the annual growth in UK exports had reached just 2.7%. The Office for Budget Responsibility (OBR) forecast that UK exports will only reach £630 billion by 2020 – a third lower than the government’s target. 15 Exports in services continued to grow in 2015, but the UK’s goods industries were struggling. It was particularly concerning that data showed output in the UK’s construction and manufacturing industries falling. Indeed, the output of the manufacturing sector remained 6.3% below its pre-recession peak. Households, meanwhile, are set to become even more indebted over the coming years. 20 It is projected that the household gross debt to income ratio will rise by 26 percentage points between 2015 to 2020, returning to levels last seen before the Global Financial Crisis. The economy did not appear to be rebalancing away from consumer driven growth towards export-led growth, making another recession almost inevitable. Fundamental to this problem is the UK’s low productivity, which in 2015 remains 25 around 20 percentage points below the average for the rest of the G7. It is vital that the government tackles this problem, particularly in the sectors that are currently facing difficulties. This will require relaxing the planning system to promote more house-building, the removal of burdens on UK manufacturers such as carbon taxes, finally getting shale gas exploration going, and reforming apprenticeships to rapidly 30 improve skills in construction, manufacturing and technology. (Source: adapted from http://www.cityam.com/229481/chancellor-beware- uk-not-out-woods-yet, 25 November 2015 by Daniel Mahoney)
(f) Evaluate the benefits of economic growth to the UK given that ‘a number of concerns remain’ in the UK economy (Extract A, line 7). (20)
June 2017 · AS Paper 2 · Q6(g) 20 marks AO1=4, AO2=4, AO3=6, AO4=6 20-mark essay Either/or economic growth and the trade cycle
Data and extracts for question 6UK economic recovery Figure 1: Components of aggregate demand in selected countries 2014 Government Exports - Country Consumption Investment spending Imports UK 66% 14% 21% –2% Germany 57% 17% 19% 6% France 57% 20% 25% –2% China 34% 49% 14% 3% NB: Figures may not add up to 100% due to rounding calculations. (Source: World Bank 2014) Figure 2: Nominal GDP per capita at Purchasing Power Parities (PPPs) (the base year 2000=100) 150 140 130 120 110 100 90 0 2000 2002 2004 2006 2008 2010 2012 2014 France Germany United Kingdom (Source: https://www.imf.org) Extract A The UK economy – a strange recovery At the Autumn Statement in November 2015, the Chancellor of the Exchequer had good reason to cheer his economic record. The UK economy appeared to have returned towards its long-term trend in the rate of economic growth. GDP growth has remained strong, with output rising at the highest rate in the G7 group of seven major industrialised countries. Unemployment continued to drop and business 5 investment grew by 5%. However, a number of concerns remain, particularly in relation to the UK’s current account deficit, which reached a record high of 6% of GDP in the third quarter of 2014. This was primarily a result of a sharp decline in the rate of return on UK investments overseas. Low export growth meant that the UK’s trade deficit persisted. 10 In 2012, the Chancellor had announced a target for the UK to export £1 trillion of goods and services by 2020, which would require an annual growth rate of 8%. However, the annual growth in UK exports had reached just 2.7%. The Office for Budget Responsibility (OBR) forecast that UK exports will only reach £630 billion by 2020 – a third lower than the government’s target. 15 Exports in services continued to grow in 2015, but the UK’s goods industries were struggling. It was particularly concerning that data showed output in the UK’s construction and manufacturing industries falling. Indeed, the output of the manufacturing sector remained 6.3% below its pre-recession peak. Households, meanwhile, are set to become even more indebted over the coming years. 20 It is projected that the household gross debt to income ratio will rise by 26 percentage points between 2015 to 2020, returning to levels last seen before the Global Financial Crisis. The economy did not appear to be rebalancing away from consumer driven growth towards export-led growth, making another recession almost inevitable. Fundamental to this problem is the UK’s low productivity, which in 2015 remains 25 around 20 percentage points below the average for the rest of the G7. It is vital that the government tackles this problem, particularly in the sectors that are currently facing difficulties. This will require relaxing the planning system to promote more house-building, the removal of burdens on UK manufacturers such as carbon taxes, finally getting shale gas exploration going, and reforming apprenticeships to rapidly 30 improve skills in construction, manufacturing and technology. (Source: adapted from http://www.cityam.com/229481/chancellor-beware- uk-not-out-woods-yet, 25 November 2015 by Daniel Mahoney)
(g) Evaluate the view that another recession is ‘inevitable’ in the UK (Extract A, line 24). (20)

Work with an Edexcel economics tutor

Want a paper marked and gone through with you? Message us.

Prefer email? Send an enquiry

If you are under 18, please include a parent's contact details. Enquiries go to enquiries@economicsaleveltutor.com and are deleted once handled. All tutoring is online.