June 2023: AS Paper 2

80 marks · 19 question parts · Paper, mark scheme and report on Pearson's site

Question by question

QTopicMarksAOType
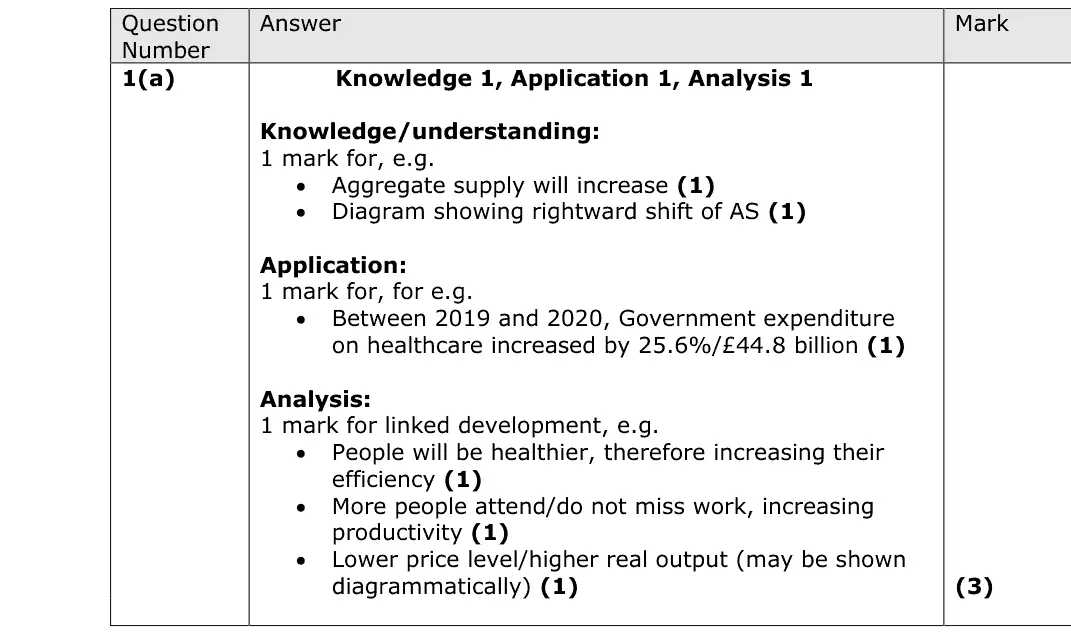
1(a) Supply-side policies 3AO1=1,AO2=1,AO3=1Short answer
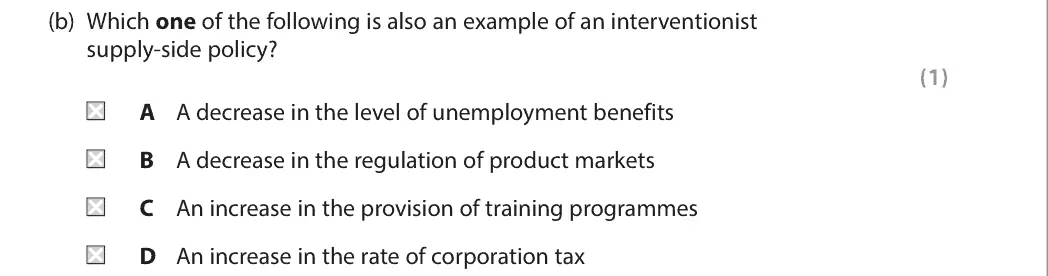
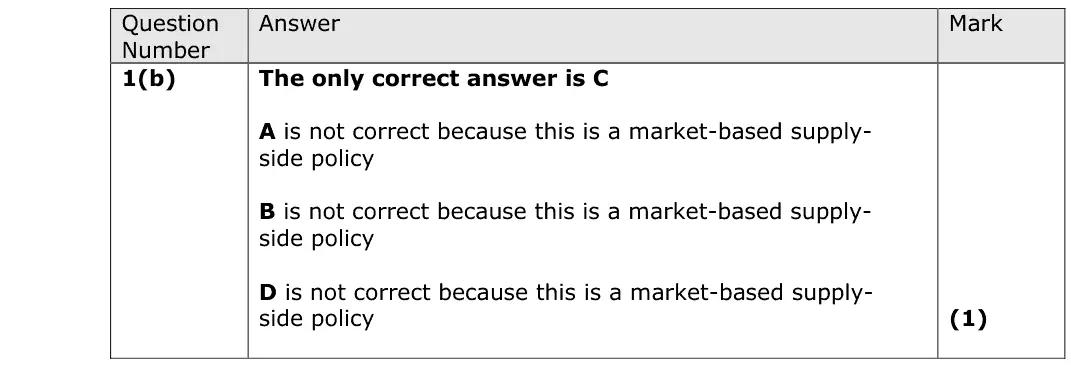
1(b) Supply-side policies 1Multiple choice
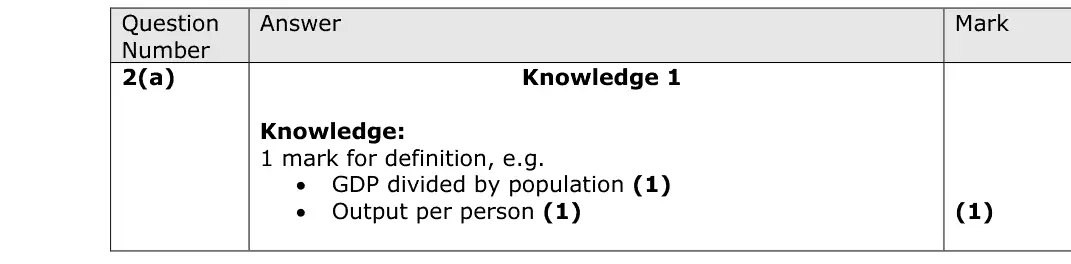
2(a) Measuring economic growth: GDP, GNI and living standards 1AO1=1Definition
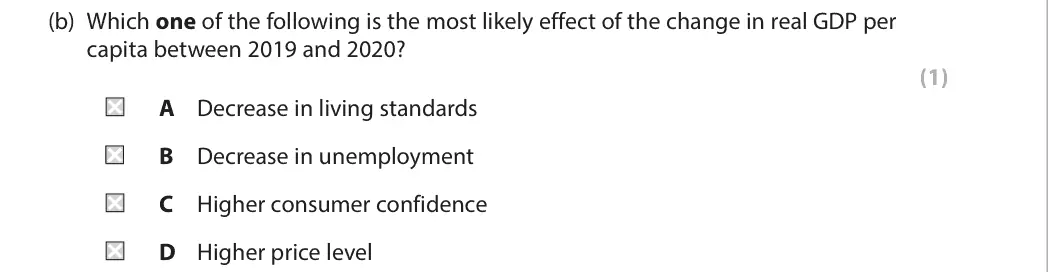
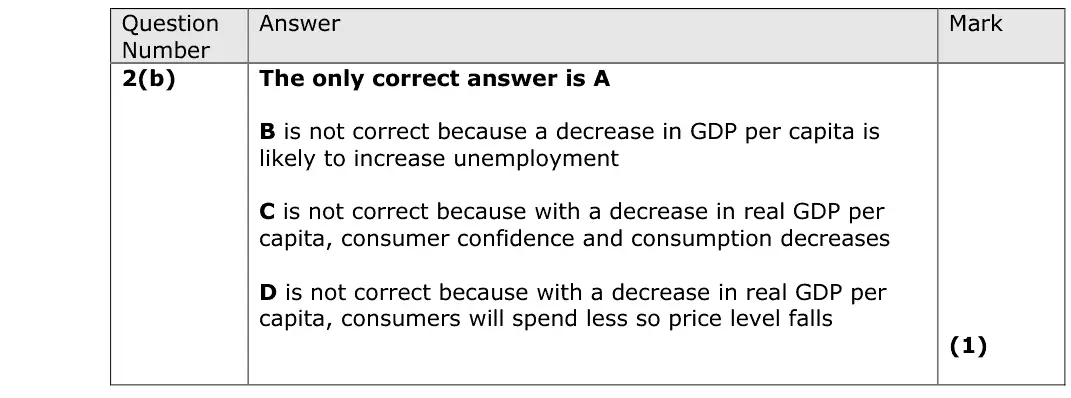
2(b) Measuring economic growth: GDP, GNI and living standards 1Multiple choice
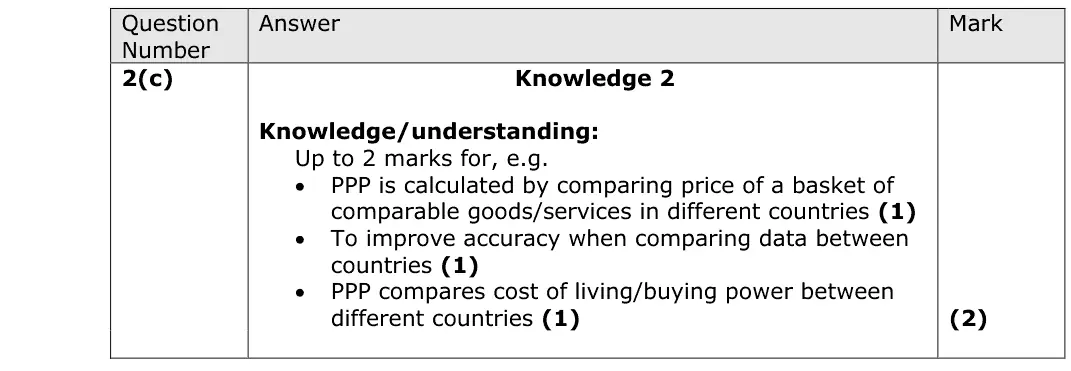
2(c) Measuring economic growth: GDP, GNI and living standards 2AO1=2Short answer
3(a) Demand-side policies: fiscal and monetary policy 1Multiple choice
3(b) Demand-side policies: fiscal and monetary policy 3AO1=1,AO2=1,AO3=1Calculation
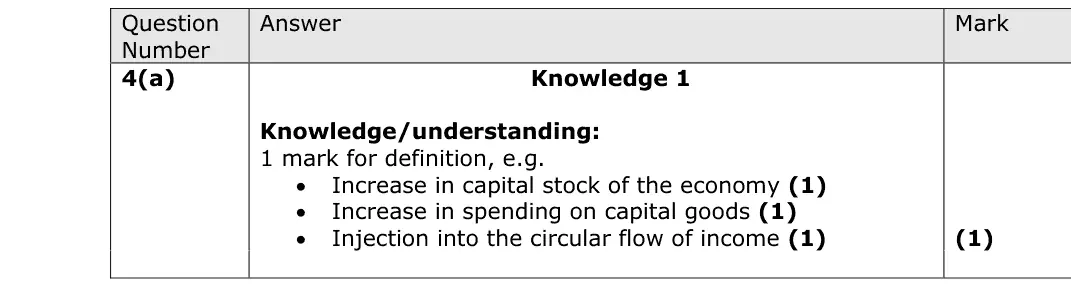
4(a) Aggregate demand 1AO1=1Definition
4(b) Aggregate demand 1Multiple choice
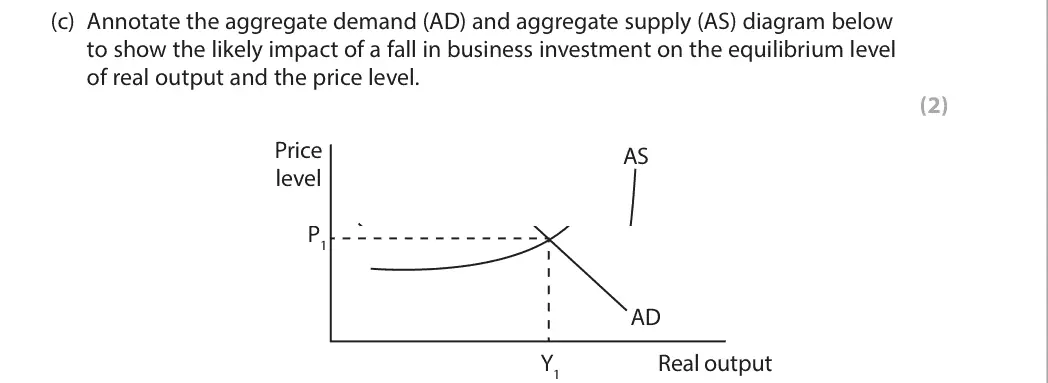
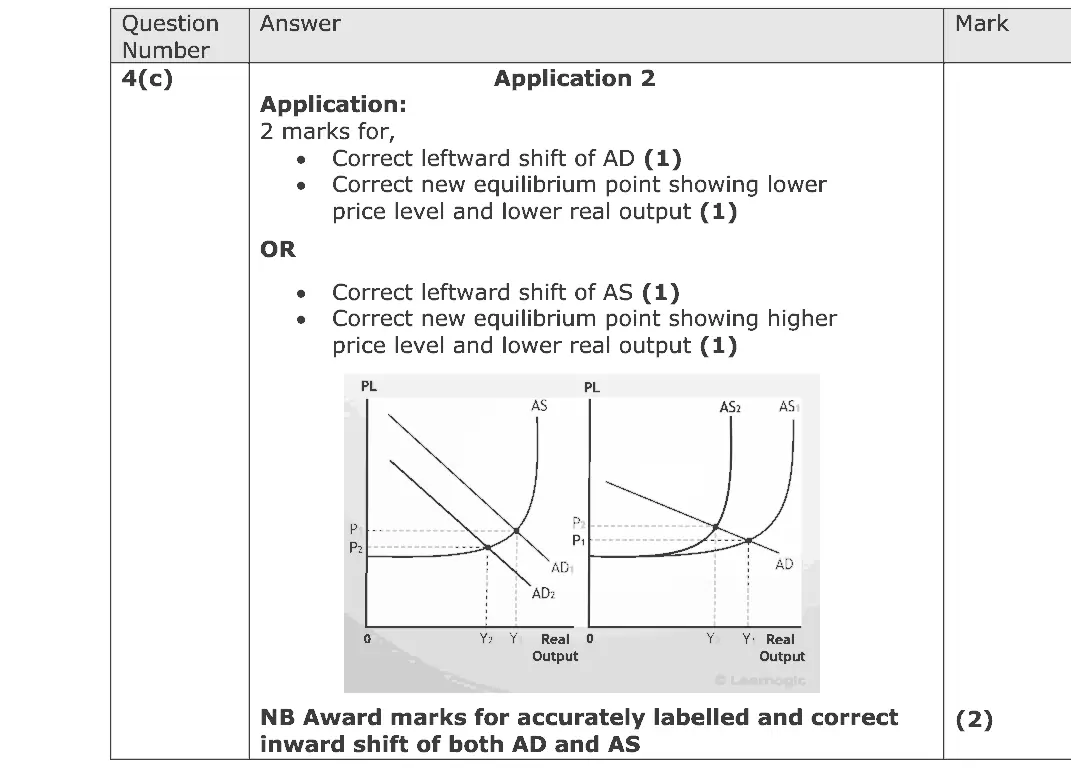
4(c) The circular flow, national income and the multiplier, Aggregate demand 2AO2=2Diagram
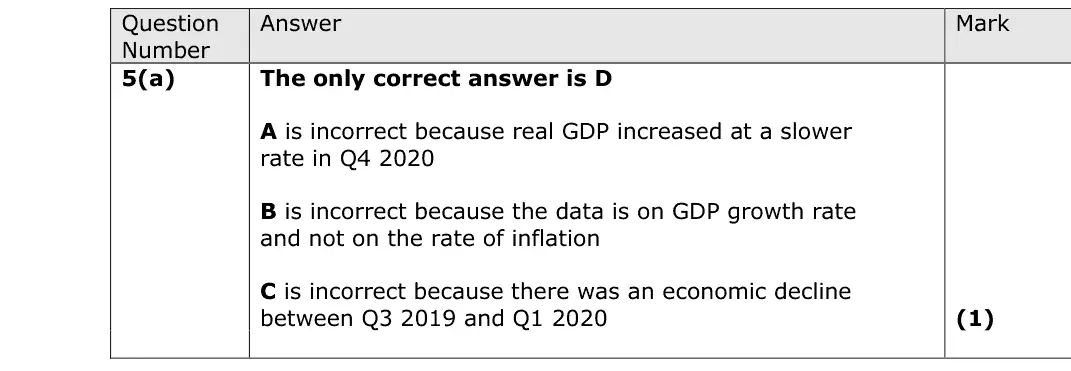
5(a) Measuring economic growth: GDP, GNI and living standards 1Multiple choice
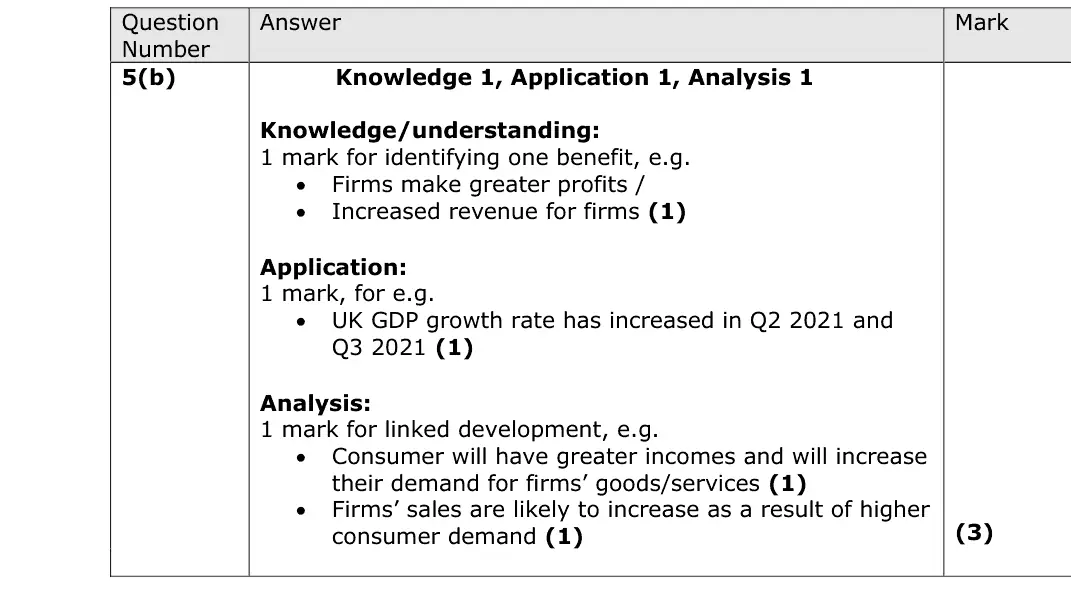
5(b) Economic growth, output gaps and the trade cycle 3AO1=1,AO2=1,AO3=1Short answer
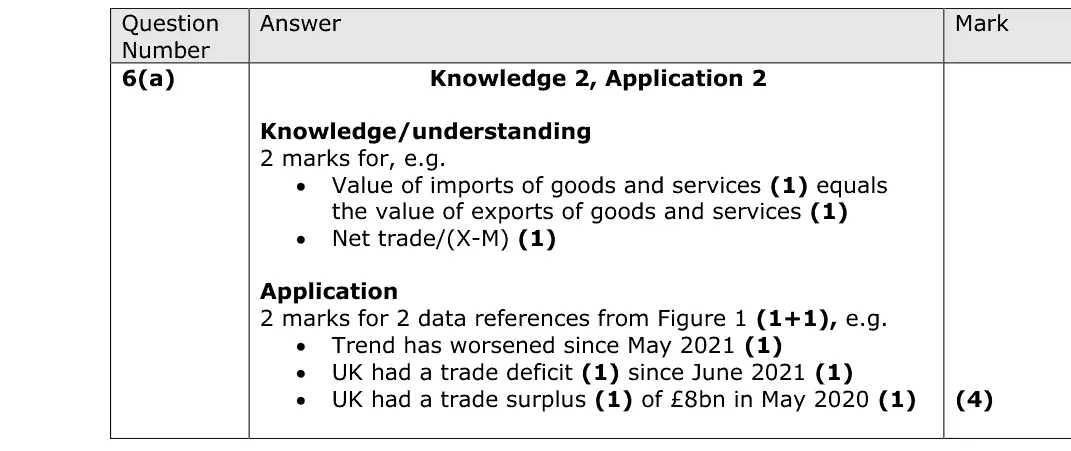
6(a) The balance of payments 4AO1=2,AO2=2Short answer
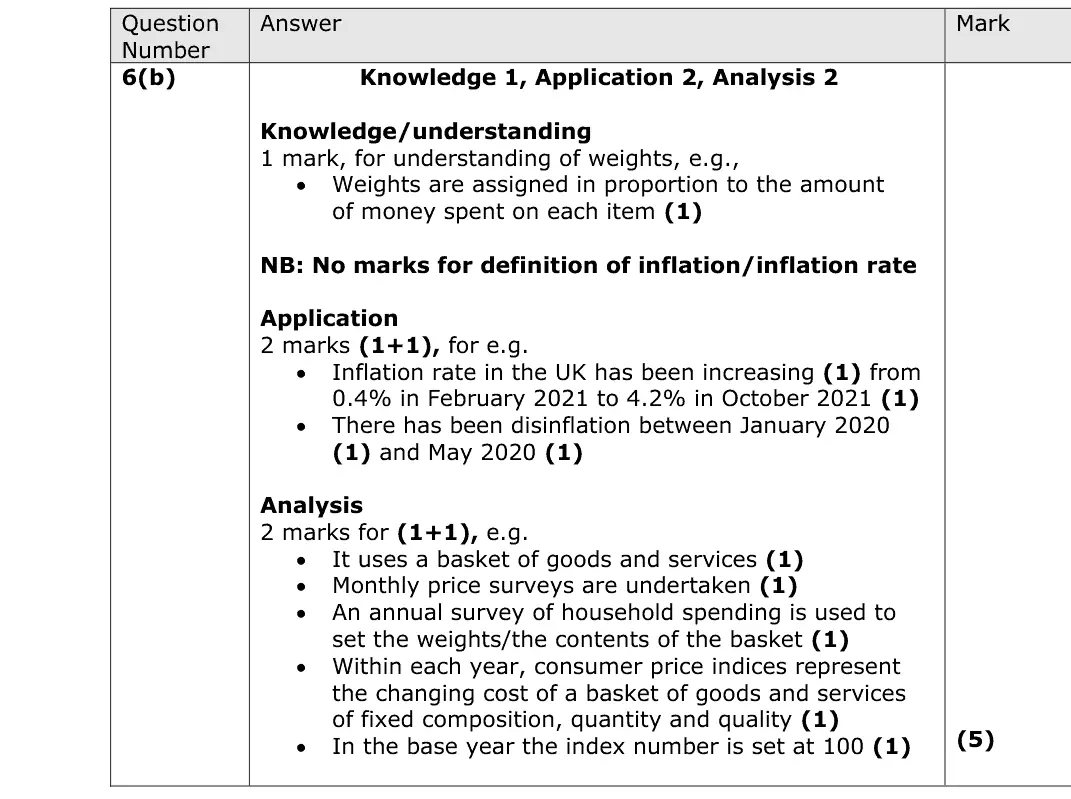
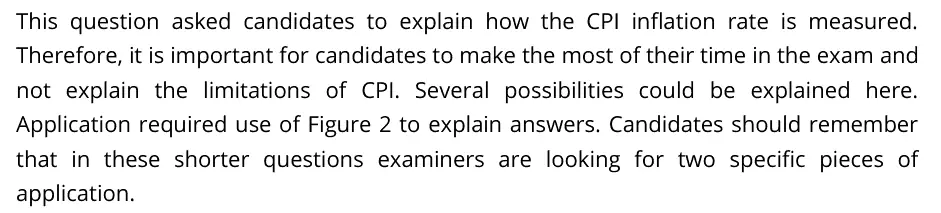
6(b) Inflation 5AO1=1,AO2=2,AO3=2Short answer
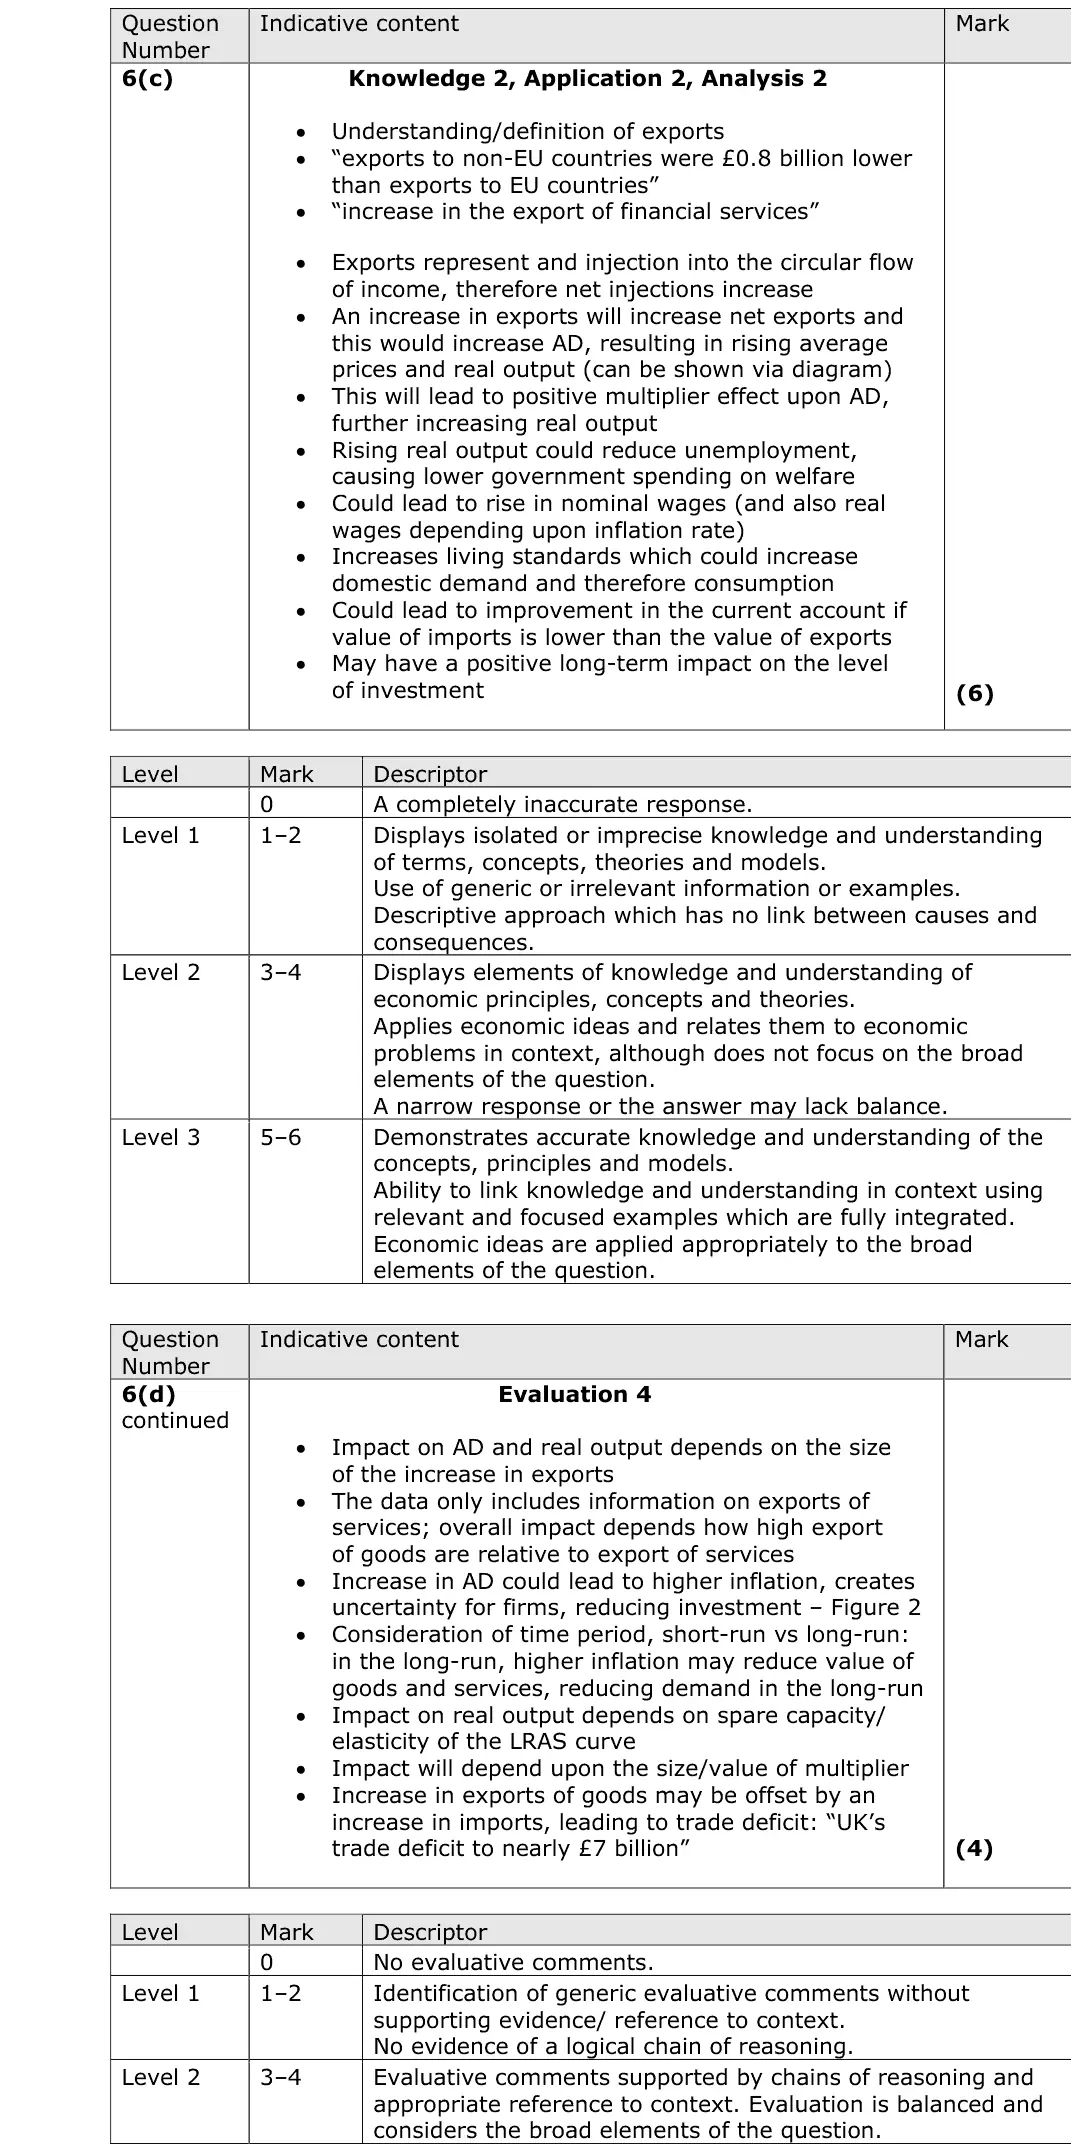
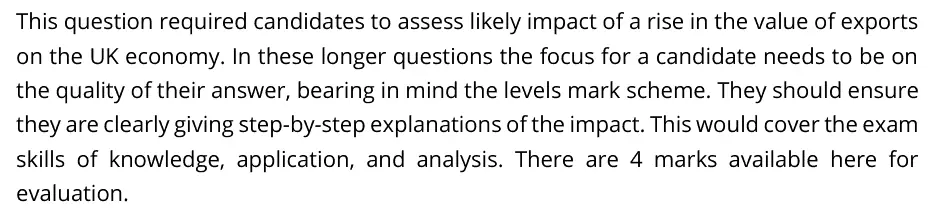
6(c) Aggregate demand, The circular flow, national income and the multiplier 10AO1=2,AO2=2,AO3=2,AO4=4Extended response
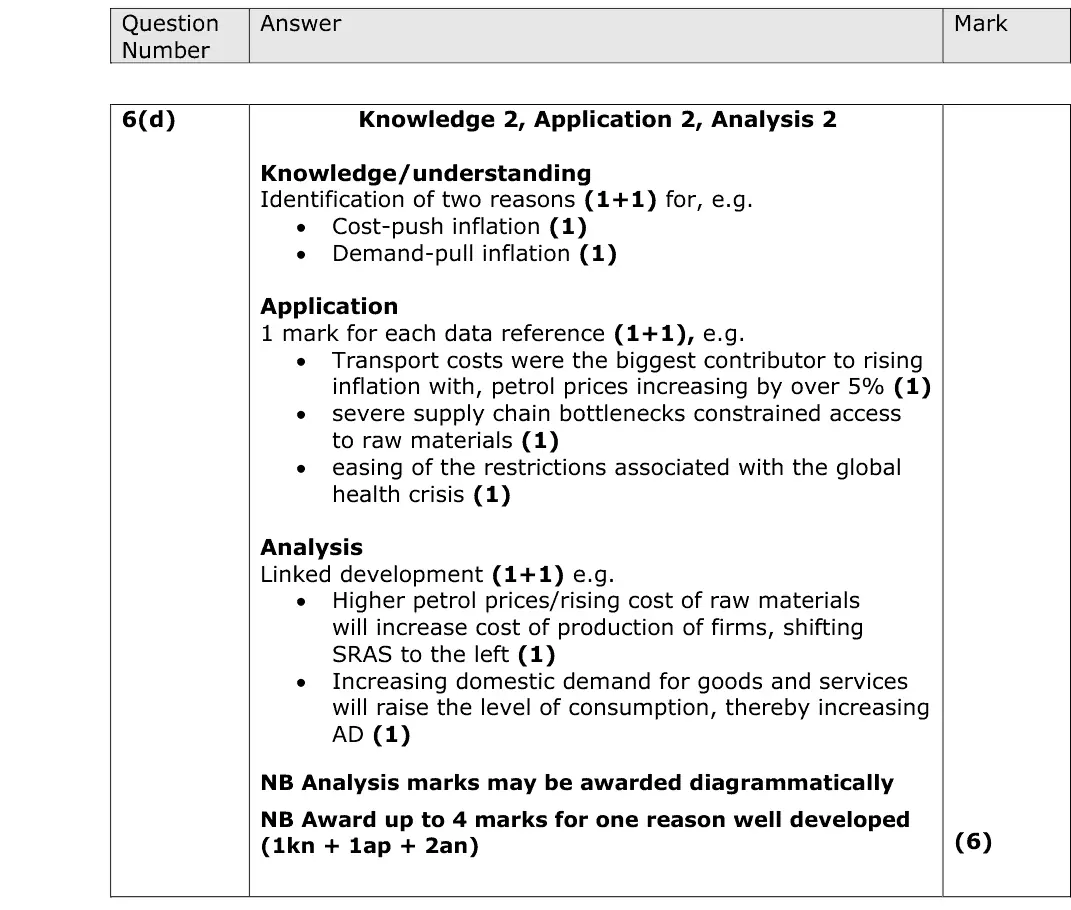
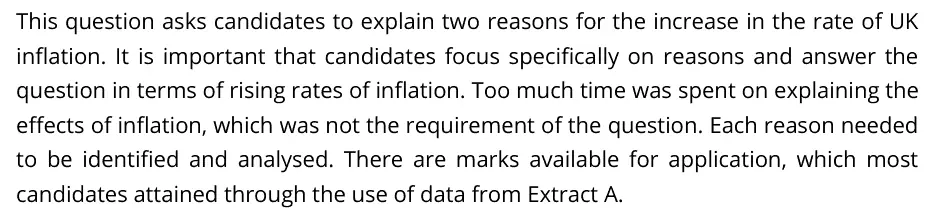
6(d) Inflation 6AO1=2,AO2=2,AO3=2Short answer
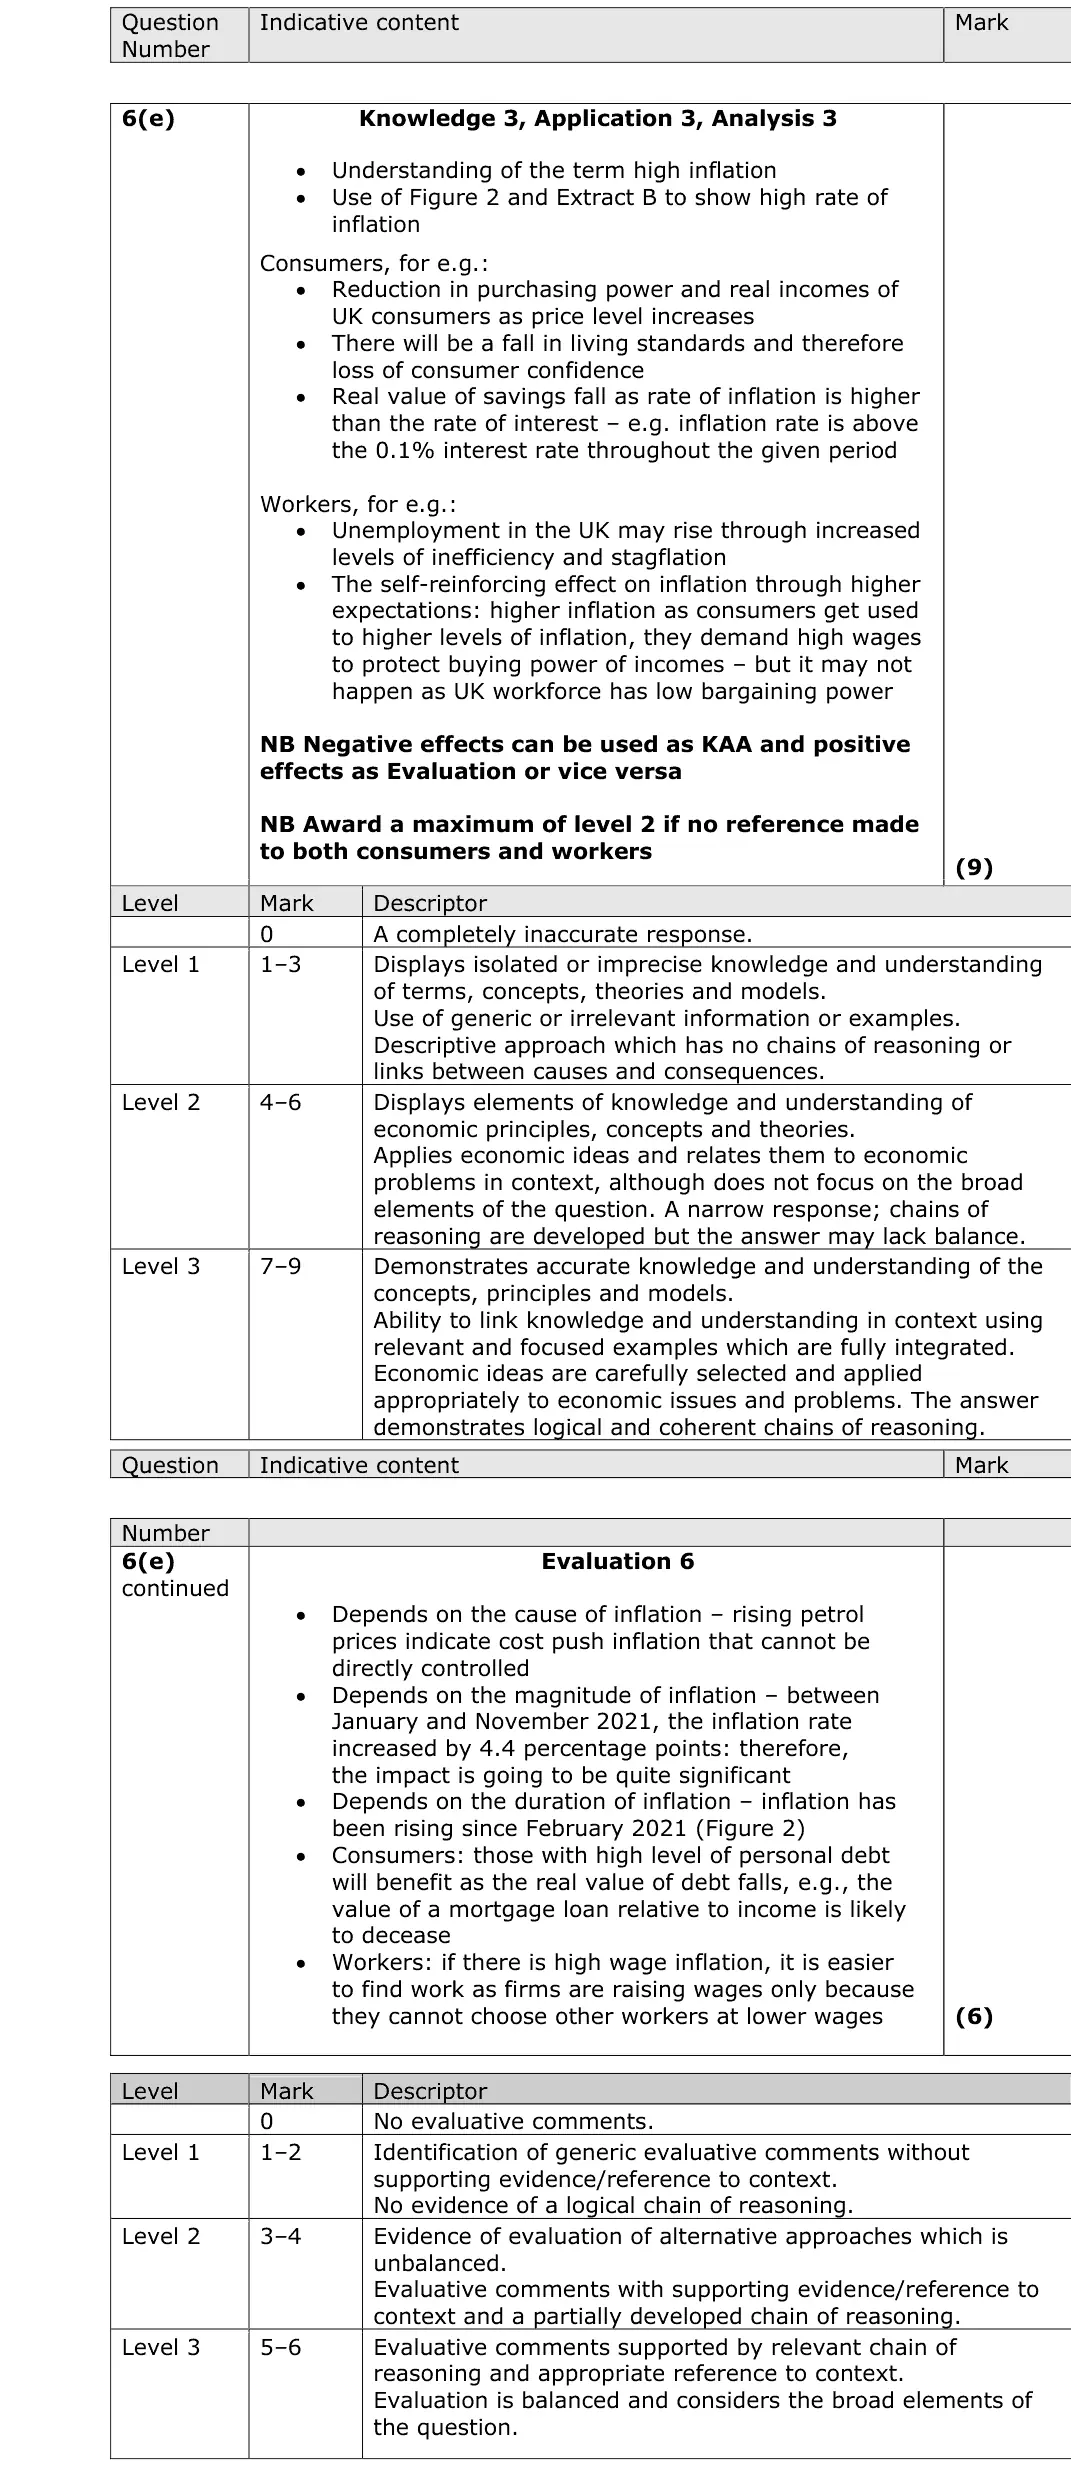
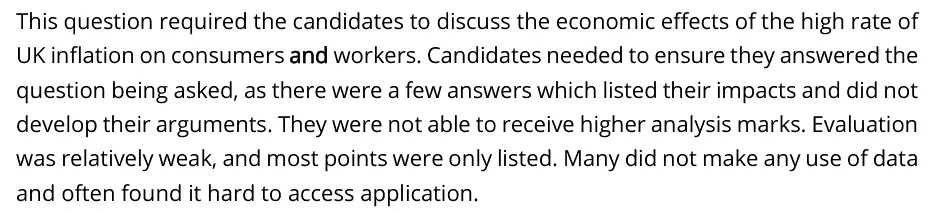
6(e) Inflation 15AO1=3,AO2=3,AO3=3,AO4=6Extended response
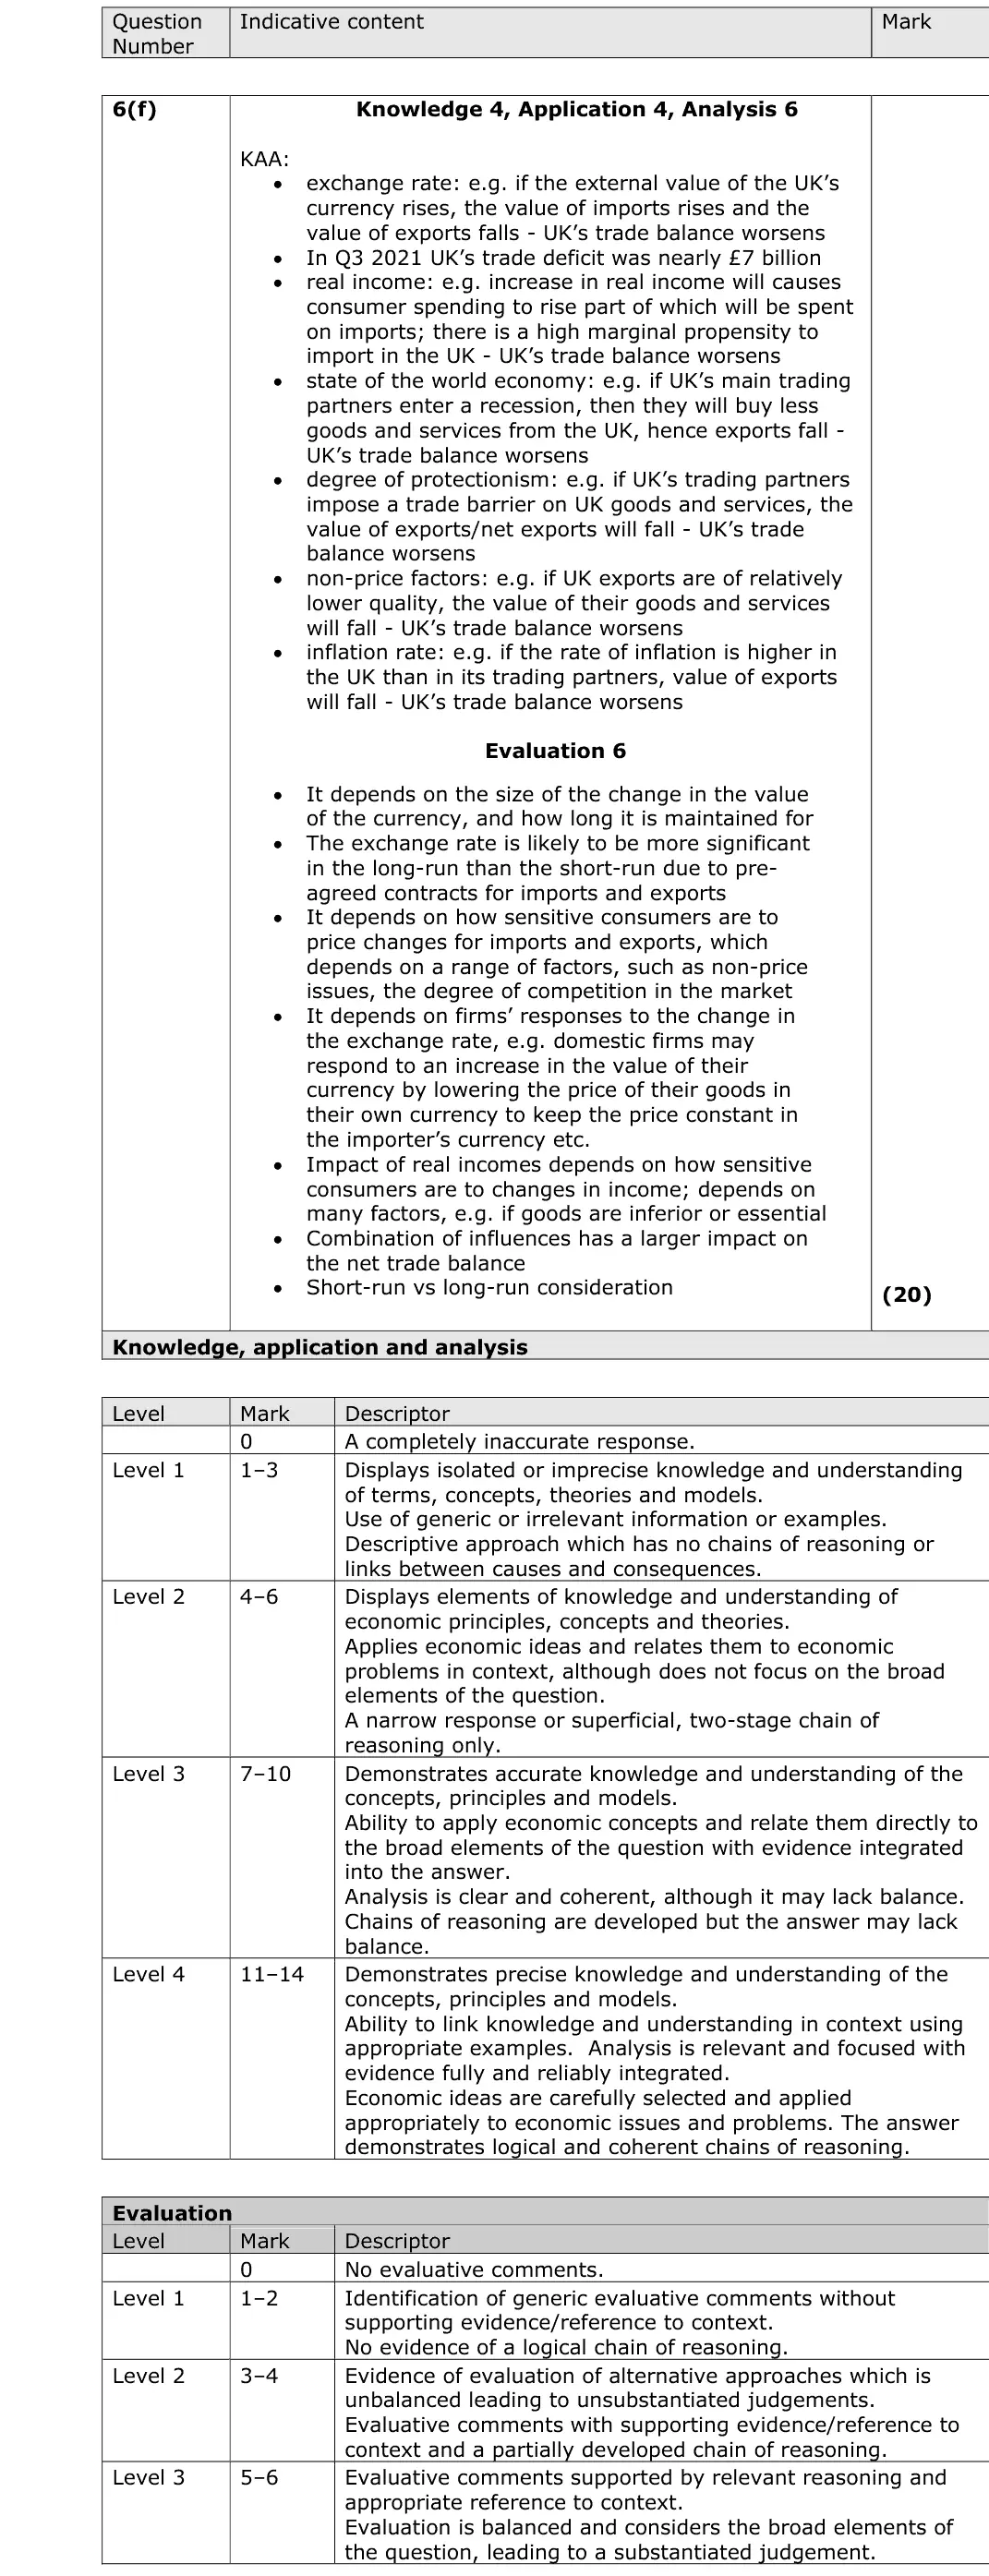
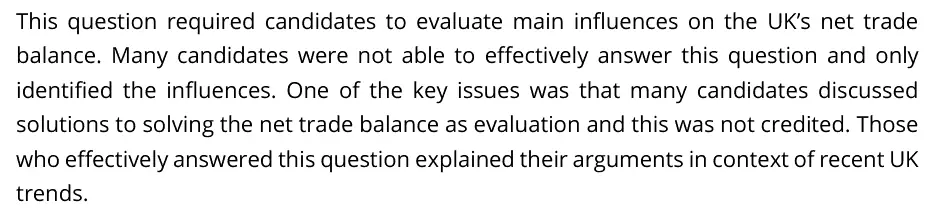
6(f) Aggregate demand, The balance of payments 20AO1=4,AO2=4,AO3=6,AO4=6Essay
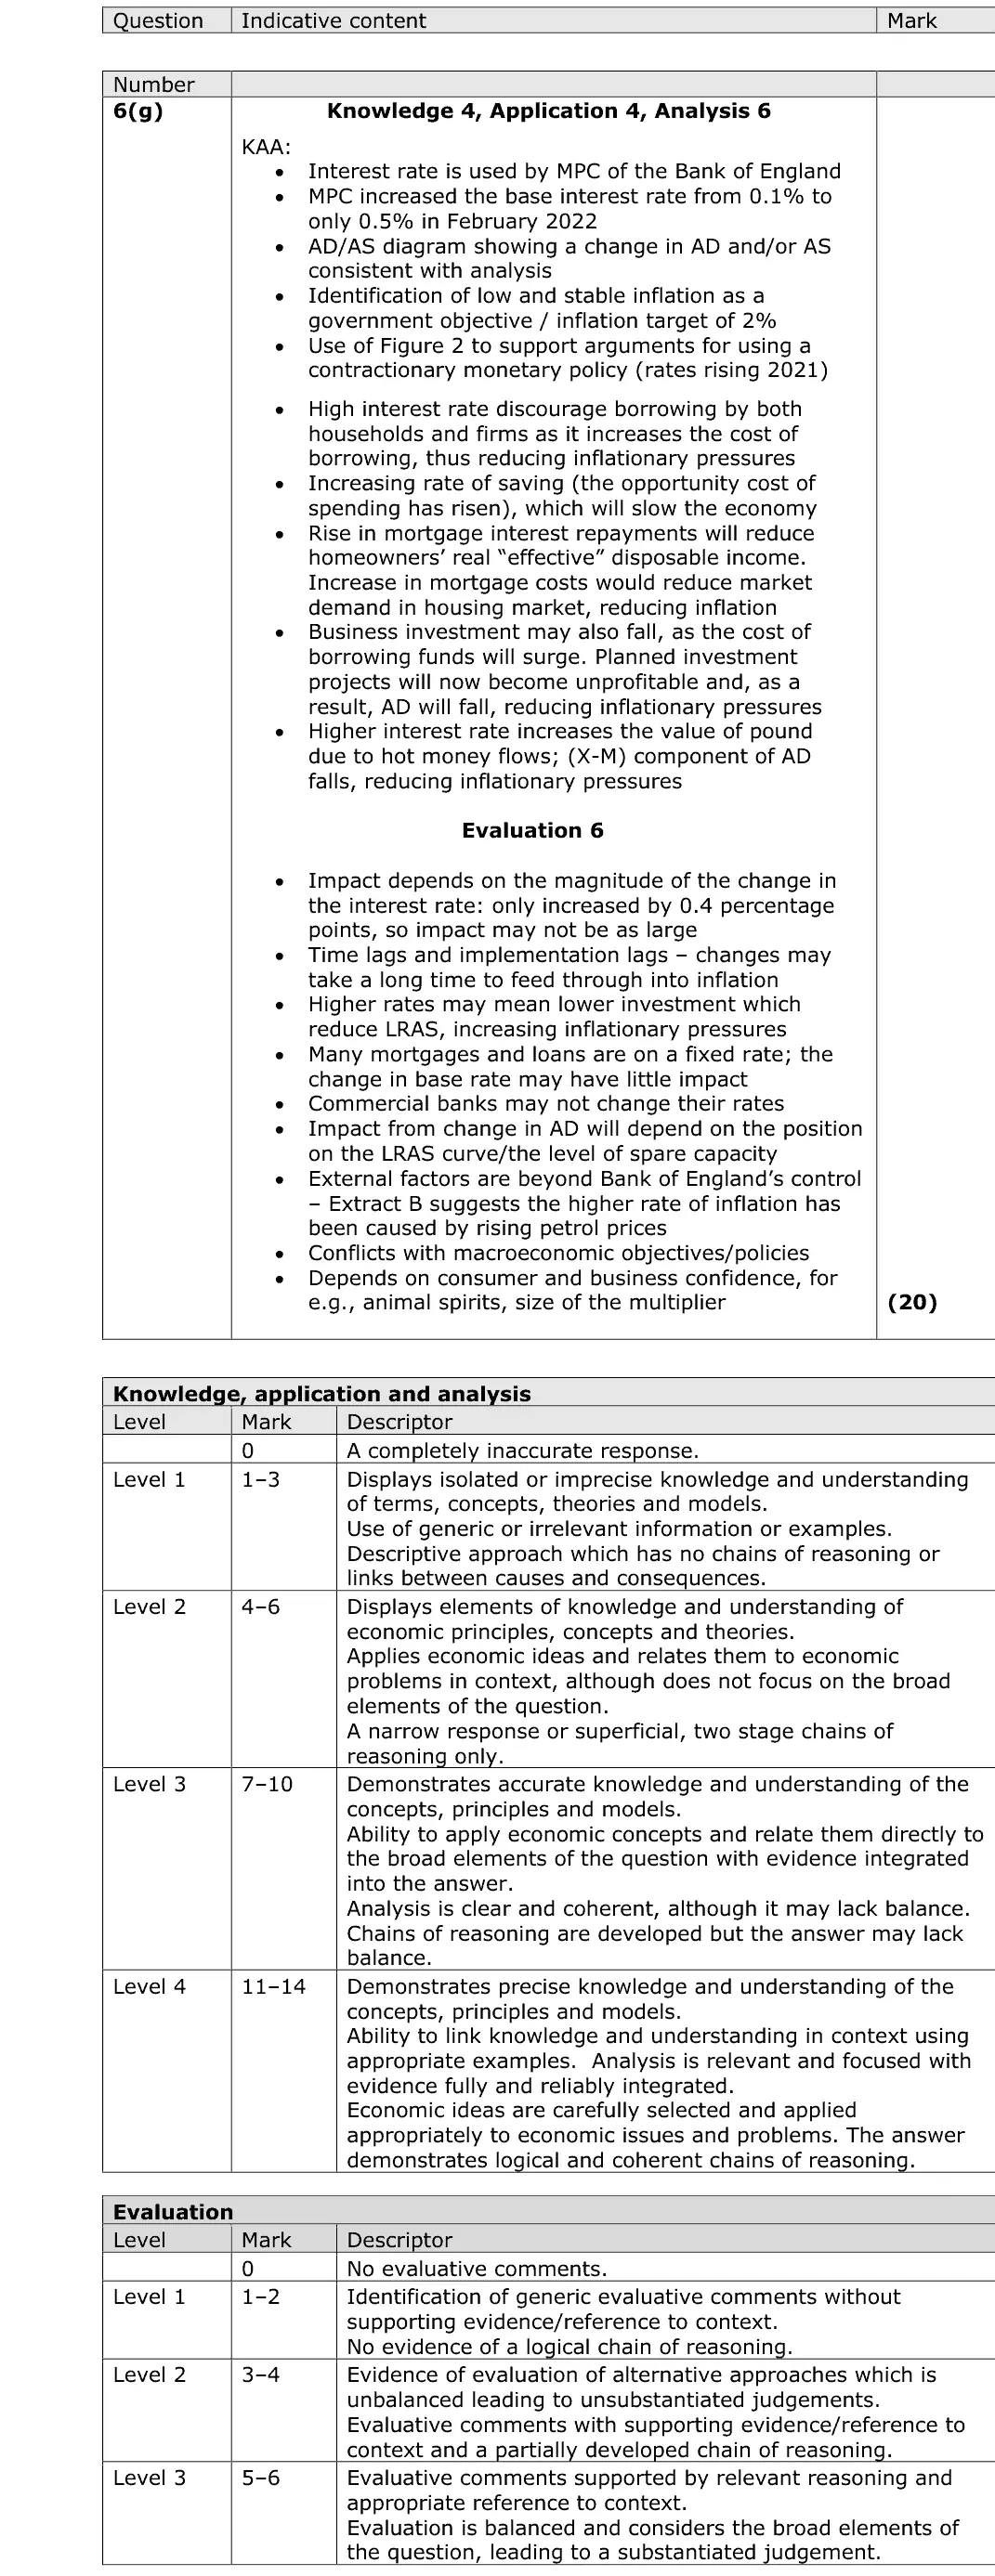
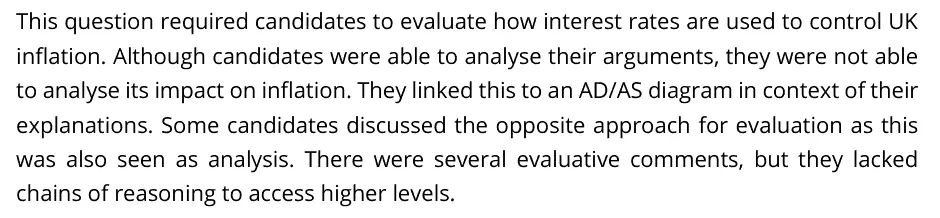
6(g) Demand-side policies: fiscal and monetary policy, Inflation 20AO1=4,AO2=4,AO3=6,AO4=6Essay

The questions

1(a)1(b)2(a)2(b)2(c)3(a)3(b)4(a)4(b)4(c)5(a)5(b)6(a)6(b)6(c)6(d)6(e)6(f)6(g)
June 2023 · AS Paper 2 · Q1(a) 3 marks AO1=1, AO2=1, AO3=1 Short answer supply side policies
Data and extracts for question 11 Between 2019 and 2020 the UK Government increased its expenditure on healthcare from £175.1 billion to £219.9 billion.
(a) Explain one likely impact of this interventionist supply-side policy on aggregate supply in the UK. (3)
June 2023 · AS Paper 2 · Q1(b) 1 mark Multiple choice supply side policies
Data and extracts for question 11 Between 2019 and 2020 the UK Government increased its expenditure on healthcare from £175.1 billion to £219.9 billion.
(b) Which one of the following is also an example of an interventionist supply-side policy? (1) A A decrease in the level of unemployment benefits B A decrease in the regulation of product markets C An increase in the provision of training programmes D An increase in the rate of corporation tax
June 2023 · AS Paper 2 · Q2(a) 1 mark AO1=1 Definition measuring economic growth
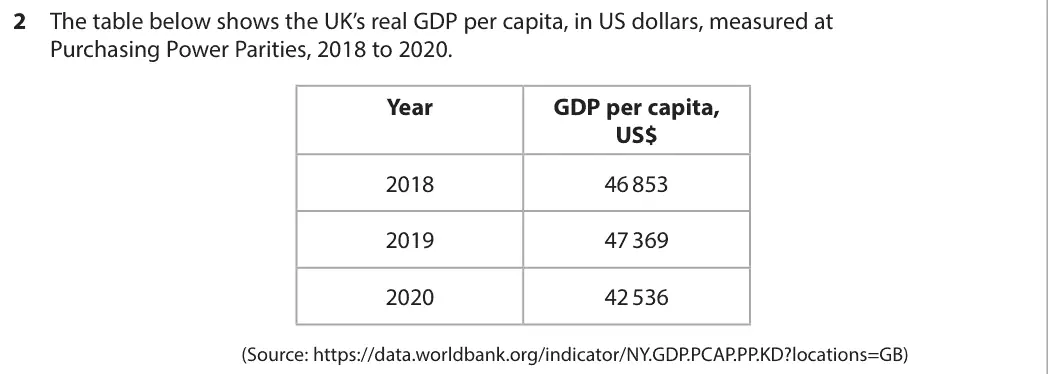
Data and extracts for question 22 The table below shows the UK’s real GDP per capita, in US dollars, measured at Purchasing Power Parities, 2018 to 2020. Year GDP per capita, US$ 2018 46 853 2019 47 369 2020 42 536 (Source: https://data.worldbank.org/indicator/NY.GDP.PCAP.PP.KD?locations=GB)
(a) Define the term ‘GDP per capita’. (1)
June 2023 · AS Paper 2 · Q2(b) 1 mark Multiple choice measuring economic growth
Data and extracts for question 22 The table below shows the UK’s real GDP per capita, in US dollars, measured at Purchasing Power Parities, 2018 to 2020. Year GDP per capita, US$ 2018 46 853 2019 47 369 2020 42 536 (Source: https://data.worldbank.org/indicator/NY.GDP.PCAP.PP.KD?locations=GB)
(b) Which one of the following is the most likely effect of the change in real GDP per capita between 2019 and 2020? (1) A Decrease in living standards B Decrease in unemployment C Higher consumer confidence D Higher price level
June 2023 · AS Paper 2 · Q2(c) 2 marks AO1=2 Short answer measuring economic growth
Data and extracts for question 22 The table below shows the UK’s real GDP per capita, in US dollars, measured at Purchasing Power Parities, 2018 to 2020. Year GDP per capita, US$ 2018 46 853 2019 47 369 2020 42 536 (Source: https://data.worldbank.org/indicator/NY.GDP.PCAP.PP.KD?locations=GB)
(c) Explain one reason why Purchasing Power Parities (PPPs) are used. (2)
June 2023 · AS Paper 2 · Q3(a) 1 mark Multiple choice fiscal and monetary policy
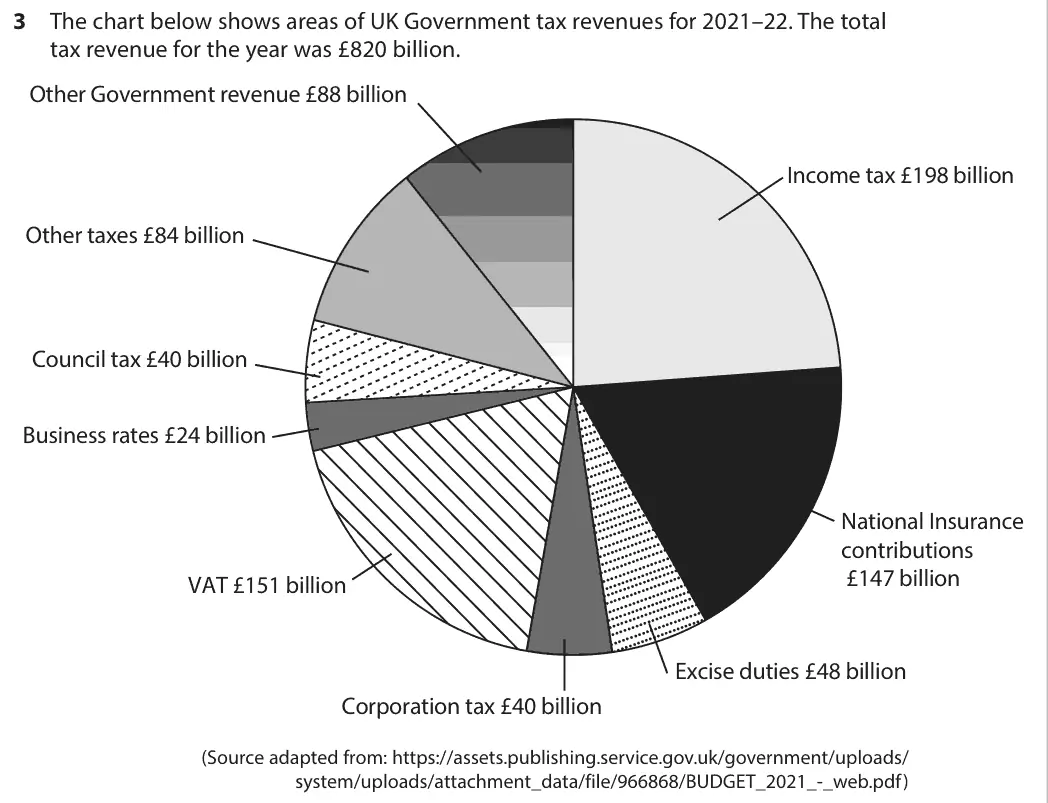
Data and extracts for question 33 The chart below shows areas of UK Government tax revenues for 2021–22. The total tax revenue for the year was £820 billion. Other Government revenue £88 billion Income tax £198 billion Other taxes £84 billion Council tax £40 billion Business rates £24 billion National Insurance contributions £147 billion VAT £151 billion Excise duties £48 billion Corporation tax £40 billion (Source adapted from: https://assets.publishing.service.gov.uk/government/uploads/ system/uploads/attachment_data/file/966868/BUDGET_2021_-_web.pdf)
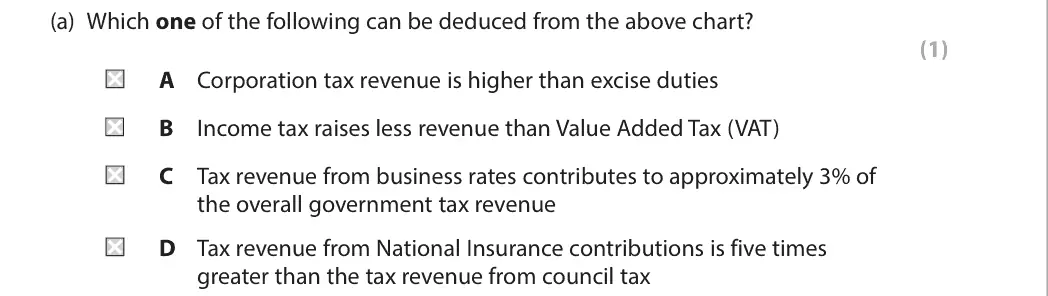
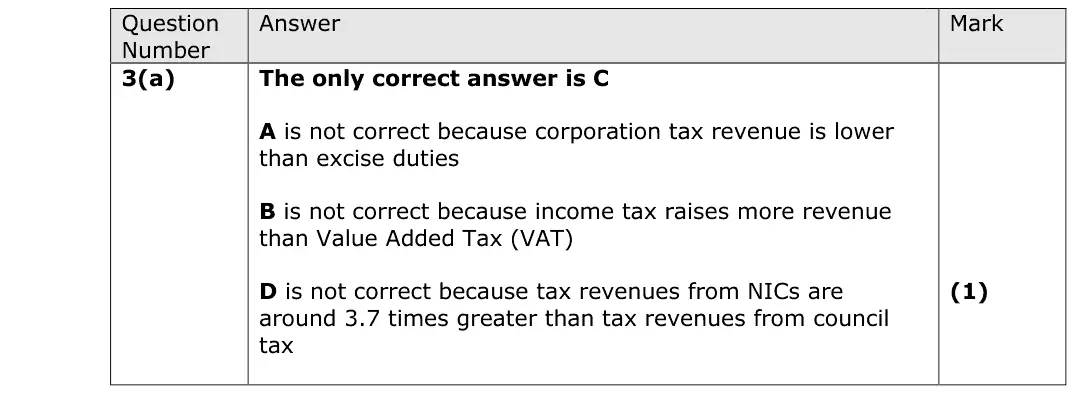
(a) Which one of the following can be deduced from the above chart? (1) A Corporation tax revenue is higher than excise duties B Income tax raises less revenue than Value Added Tax (VAT) C Tax revenue from business rates contributes to approximately 3% of the overall government tax revenue D Tax revenue from National Insurance contributions is five times greater than the tax revenue from council tax
June 2023 · AS Paper 2 · Q3(b) 3 marks AO1=1, AO2=1, AO3=1 Calculation fiscal and monetary policy
Data and extracts for question 33 The chart below shows areas of UK Government tax revenues for 2021–22. The total tax revenue for the year was £820 billion. Other Government revenue £88 billion Income tax £198 billion Other taxes £84 billion Council tax £40 billion Business rates £24 billion National Insurance contributions £147 billion VAT £151 billion Excise duties £48 billion Corporation tax £40 billion (Source adapted from: https://assets.publishing.service.gov.uk/government/uploads/ system/uploads/attachment_data/file/966868/BUDGET_2021_-_web.pdf)
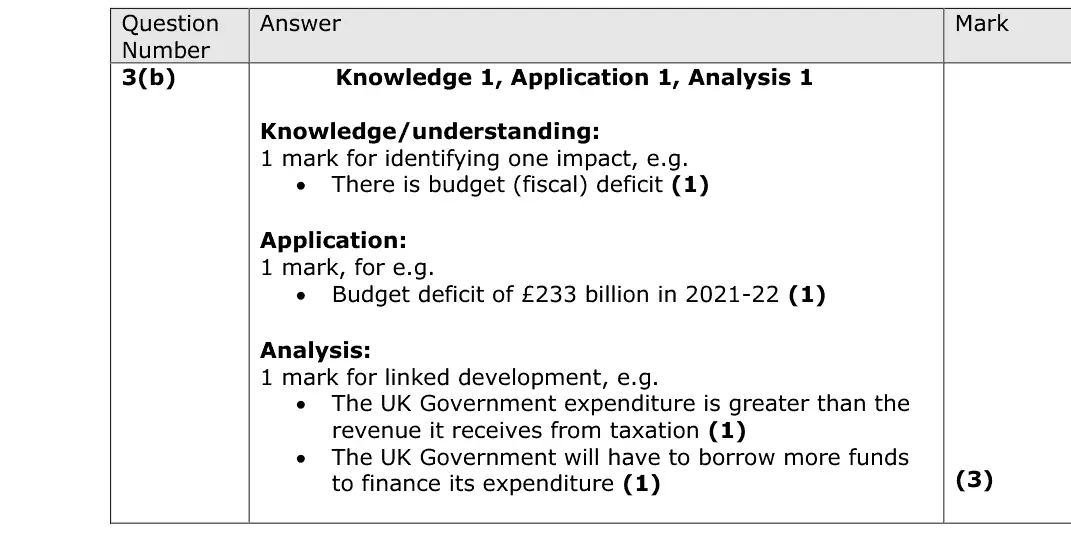
(b) Total UK Government tax revenue for 2021–22: £820 billion. Total UK Government expenditure for 2021–22: £1 053 billion. Using these figures, explain the likely impact of the above data on the UK Government’s budget balance. (3)
June 2023 · AS Paper 2 · Q4(a) 1 mark AO1=1 Definition aggregate demand
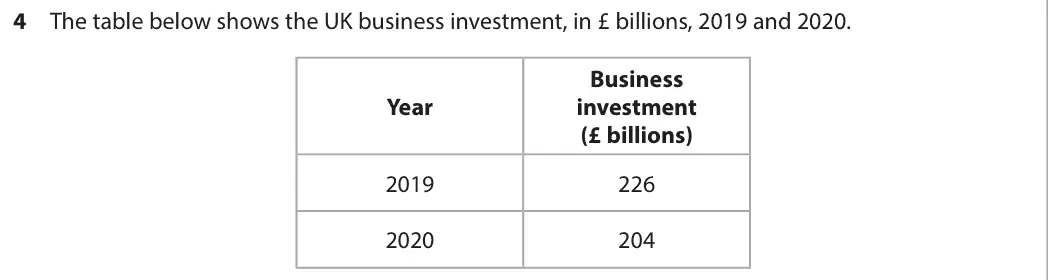
Data and extracts for question 44 The table below shows the UK business investment, in £ billions, 2019 and 2020. Business Year investment (£ billions) 2019 226 2020 204
(a) Define the term ‘investment’. (1)
June 2023 · AS Paper 2 · Q4(b) 1 mark Multiple choice aggregate demand
Data and extracts for question 44 The table below shows the UK business investment, in £ billions, 2019 and 2020. Business Year investment (£ billions) 2019 226 2020 204
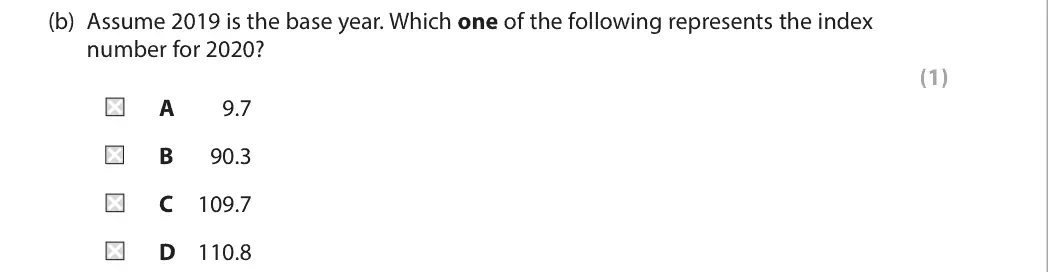
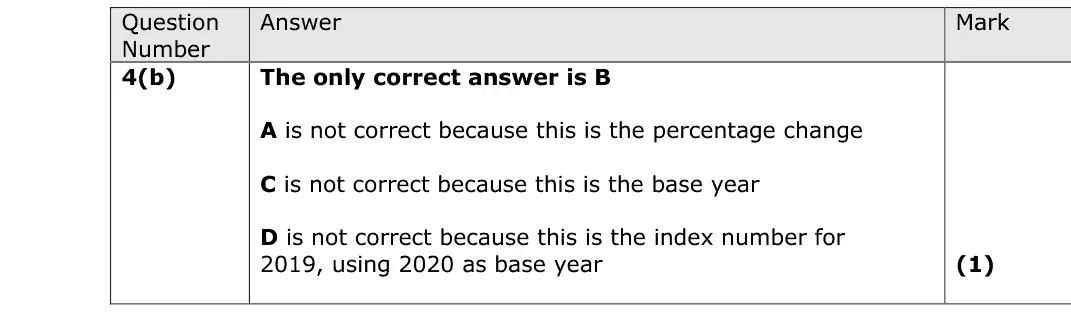
(b) Assume 2019 is the base year. Which one of the following represents the index number for 2020? (1) A 9.7 B 90.3 C 109.7 D 110.8
June 2023 · AS Paper 2 · Q4(c) 2 marks AO2=2 Diagram national income and the multiplieraggregate demand
Data and extracts for question 44 The table below shows the UK business investment, in £ billions, 2019 and 2020. Business Year investment (£ billions) 2019 226 2020 204
(c) Annotate the aggregate demand (AD) and aggregate supply (AS) diagram below to show the likely impact of a fall in business investment on the equilibrium level of real output and the price level. (2) Price AS level P1 AD Y1 Real output
June 2023 · AS Paper 2 · Q5(a) 1 mark Multiple choice measuring economic growth
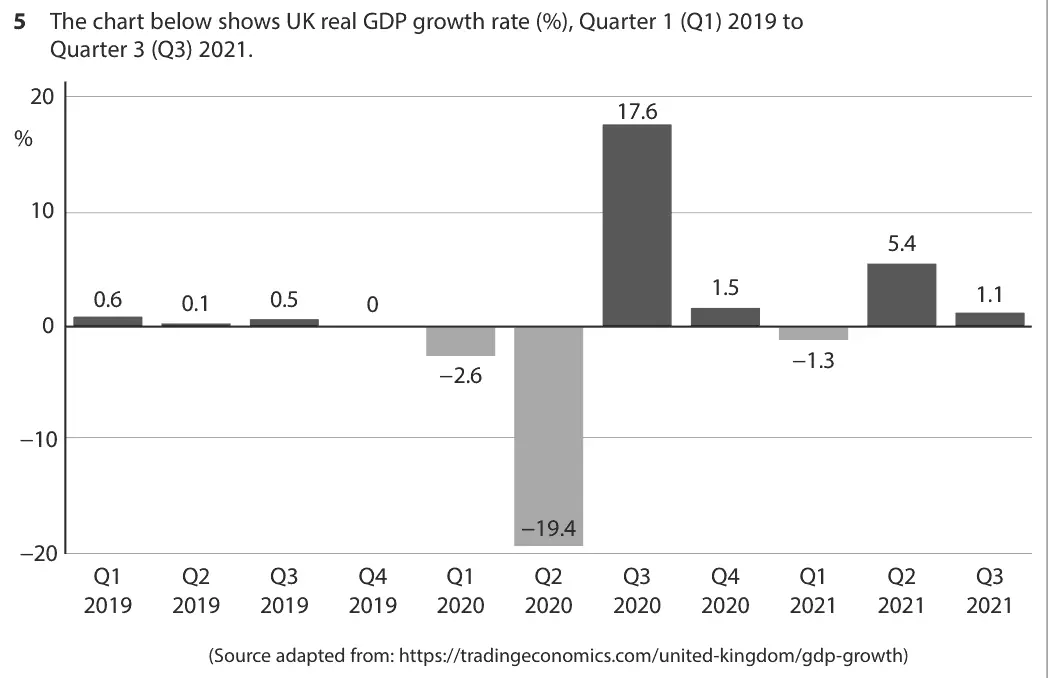
Data and extracts for question 55 The chart below shows UK real GDP growth rate (%), Quarter 1 (Q1) 2019 to Quarter 3 (Q3) 2021. 20 17.6 % 10 5.4 1.5 1.1 0.6 0.5 0.1 0 0 -1.3 -2.6 -10 -19.4 -20 Q1 Q2 Q3 Q4 Q1 Q2 Q3 Q4 Q1 Q2 Q3 2019 2019 2019 2019 2020 2020 2020 2020 2021 2021 2021 (Source adapted from: https://tradingeconomics.com/united-kingdom/gdp-growth)
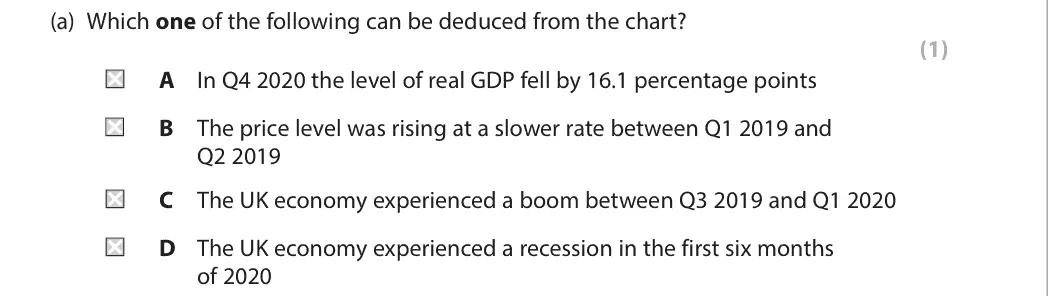
(a) Which one of the following can be deduced from the chart? (1) A In Q4 2020 the level of real GDP fell by 16.1 percentage points B The price level was rising at a slower rate between Q1 2019 and Q2 2019 C The UK economy experienced a boom between Q3 2019 and Q1 2020 D The UK economy experienced a recession in the first six months of 2020
June 2023 · AS Paper 2 · Q5(b) 3 marks AO1=1, AO2=1, AO3=1 Short answer economic growth and the trade cycle
Data and extracts for question 55 The chart below shows UK real GDP growth rate (%), Quarter 1 (Q1) 2019 to Quarter 3 (Q3) 2021. 20 17.6 % 10 5.4 1.5 1.1 0.6 0.5 0.1 0 0 -1.3 -2.6 -10 -19.4 -20 Q1 Q2 Q3 Q4 Q1 Q2 Q3 Q4 Q1 Q2 Q3 2019 2019 2019 2019 2020 2020 2020 2020 2021 2021 2021 (Source adapted from: https://tradingeconomics.com/united-kingdom/gdp-growth)
(b) With reference to the chart, explain one likely benefit of economic growth to firms. (3)
June 2023 · AS Paper 2 · Q6(a) 4 marks AO1=2, AO2=2 Short answer balance of payments
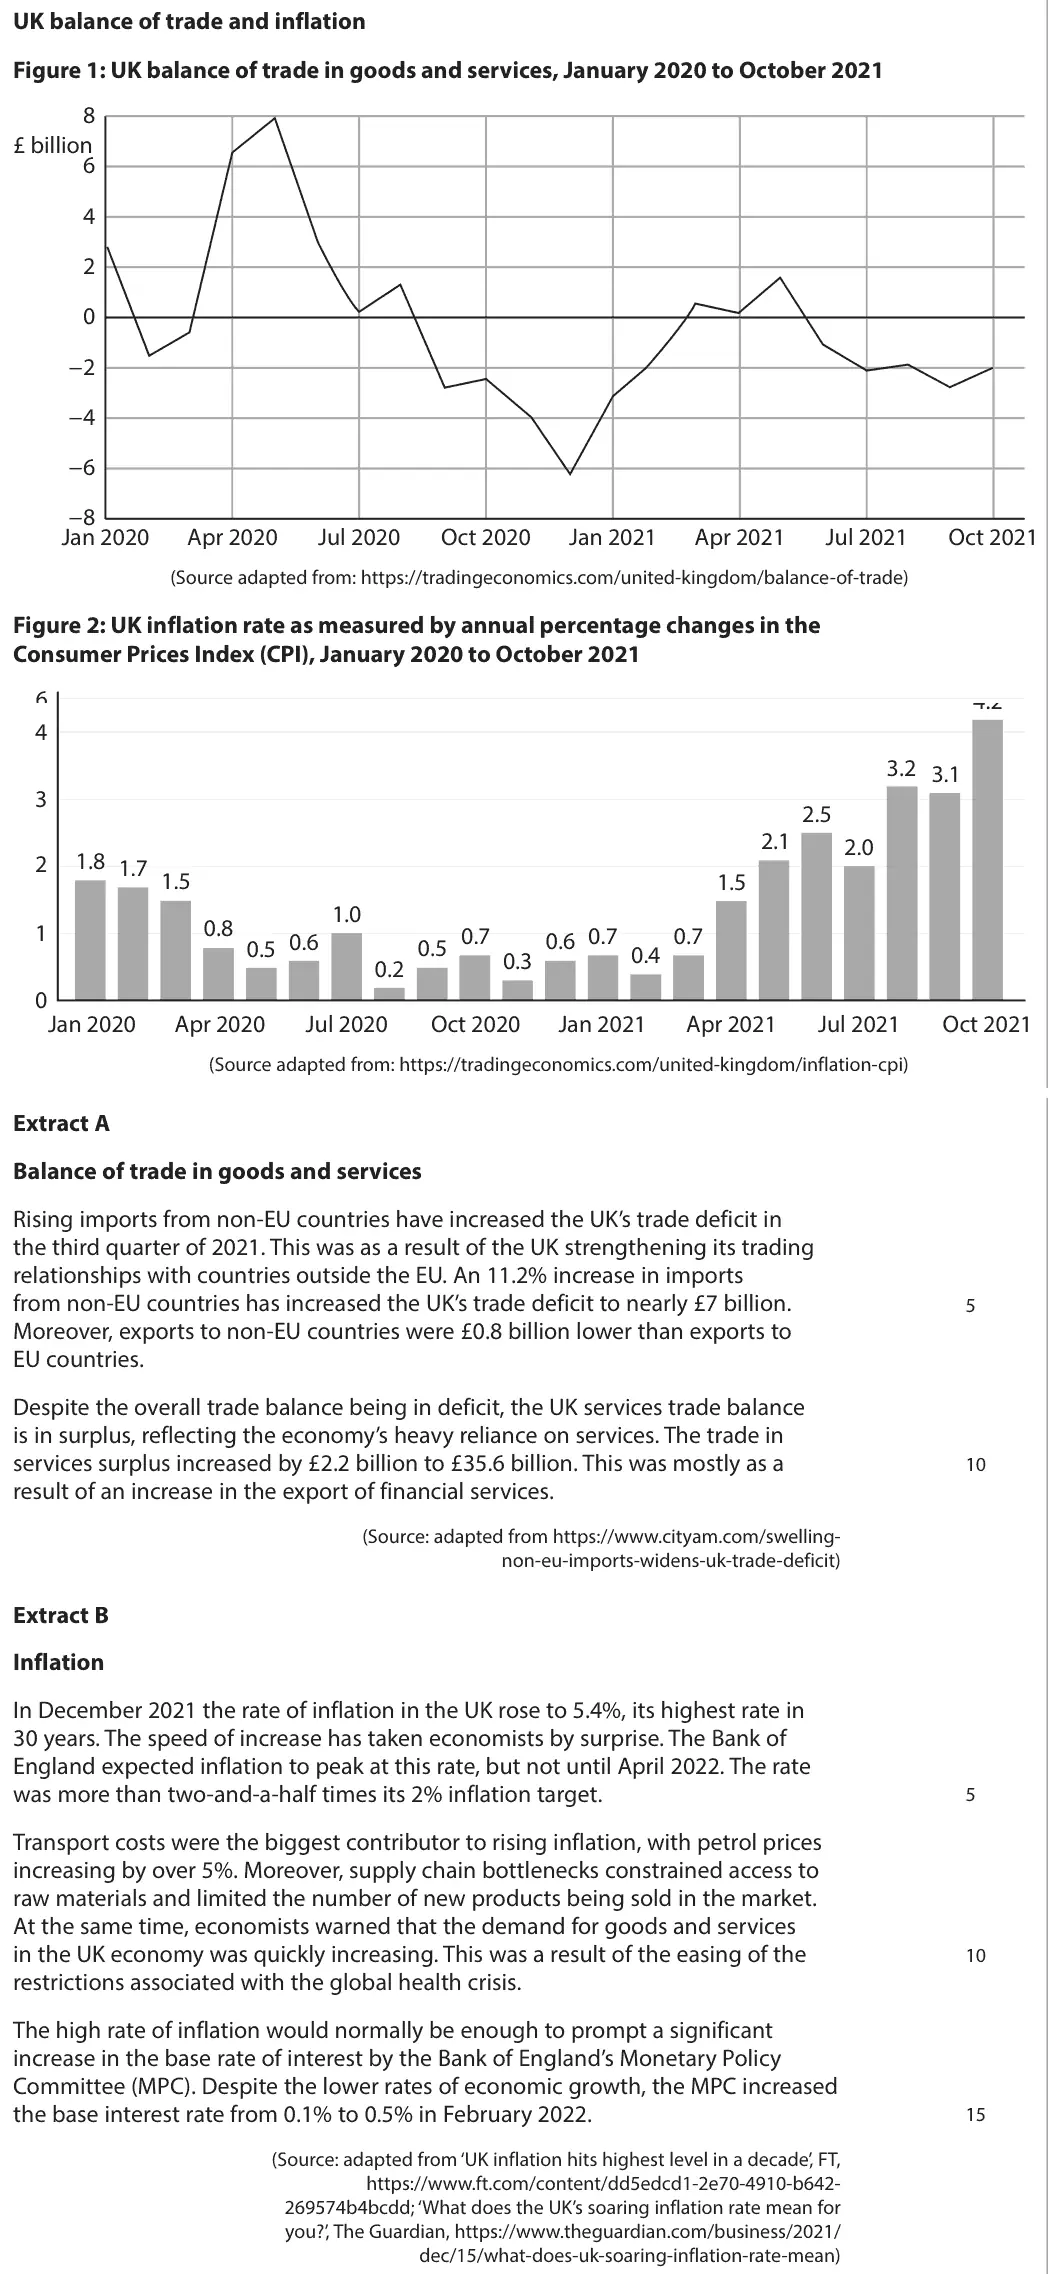
Data and extracts for question 6UK balance of trade and inflation Figure 1: UK balance of trade in goods and services, January 2020 to October 2021 8 £ billion 6 4 2 0 -2 -4 -6 -8 Jan 2020 Apr 2020 Jul 2020 Oct 2020 Jan 2021 Apr 2021 Jul 2021 Oct 2021 (Source adapted from: https://tradingeconomics.com/united-kingdom/balance-of-trade) Figure 2: UK inflation rate as measured by annual percentage changes in the Consumer Prices Index (CPI), January 2020 to October 2021 6 % 5 4.2 4 3.2 3.1 3 2.5 2.1 2.0 1.8 2 1.7 1.5 1.5 1.0 0.8 1 0.7 0.7 0.6 0.7 0.4 0.5 0.6 0.5 0.3 0.2 0 Jan 2020 Apr 2020 Jul 2020 Oct 2020 Jan 2021 Apr 2021 Jul 2021 Oct 2021 (Source adapted from: https://tradingeconomics.com/united-kingdom/inflation-cpi) Extract A Balance of trade in goods and services Rising imports from non-EU countries have increased the UK’s trade deficit in the third quarter of 2021. This was as a result of the UK strengthening its trading relationships with countries outside the EU. An 11.2% increase in imports from non-EU countries has increased the UK’s trade deficit to nearly £7 billion. 5 Moreover, exports to non-EU countries were £0.8 billion lower than exports to EU countries. Despite the overall trade balance being in deficit, the UK services trade balance is in surplus, reflecting the economy’s heavy reliance on services. The trade in 10 services surplus increased by £2.2 billion to £35.6 billion. This was mostly as a result of an increase in the export of financial services. (Source: adapted from https://www.cityam.com/swelling- non-eu-imports-widens-uk-trade-deficit) Extract B Inflation In December 2021 the rate of inflation in the UK rose to 5.4%, its highest rate in 30 years. The speed of increase has taken economists by surprise. The Bank of England expected inflation to peak at this rate, but not until April 2022. The rate was more than two-and-a-half times its 2% inflation target. 5 Transport costs were the biggest contributor to rising inflation, with petrol prices increasing by over 5%. Moreover, supply chain bottlenecks constrained access to raw materials and limited the number of new products being sold in the market. At the same time, economists warned that the demand for goods and services in the UK economy was quickly increasing. This was a result of the easing of the 10 restrictions associated with the global health crisis. The high rate of inflation would normally be enough to prompt a significant increase in the base rate of interest by the Bank of England’s Monetary Policy Committee (MPC). Despite the lower rates of economic growth, the MPC increased the base interest rate from 0.1% to 0.5% in February 2022. 15 (Source: adapted from ‘UK inflation hits highest level in a decade’, FT, https://www.ft.com/content/dd5edcd1-2e70-4910-b642- 269574b4bcdd; ‘What does the UK’s soaring inflation rate mean for you?’, The Guardian, https://www.theguardian.com/business/2021/ dec/15/what-does-uk-soaring-inflation-rate-mean)
(a) With reference to Figure 1, explain the term ‘balance of trade in goods and services’. (4)
June 2023 · AS Paper 2 · Q6(b) 5 marks AO1=1, AO2=2, AO3=2 Short answer inflation
Data and extracts for question 6UK balance of trade and inflation Figure 1: UK balance of trade in goods and services, January 2020 to October 2021 8 £ billion 6 4 2 0 -2 -4 -6 -8 Jan 2020 Apr 2020 Jul 2020 Oct 2020 Jan 2021 Apr 2021 Jul 2021 Oct 2021 (Source adapted from: https://tradingeconomics.com/united-kingdom/balance-of-trade) Figure 2: UK inflation rate as measured by annual percentage changes in the Consumer Prices Index (CPI), January 2020 to October 2021 6 % 5 4.2 4 3.2 3.1 3 2.5 2.1 2.0 1.8 2 1.7 1.5 1.5 1.0 0.8 1 0.7 0.7 0.6 0.7 0.4 0.5 0.6 0.5 0.3 0.2 0 Jan 2020 Apr 2020 Jul 2020 Oct 2020 Jan 2021 Apr 2021 Jul 2021 Oct 2021 (Source adapted from: https://tradingeconomics.com/united-kingdom/inflation-cpi) Extract A Balance of trade in goods and services Rising imports from non-EU countries have increased the UK’s trade deficit in the third quarter of 2021. This was as a result of the UK strengthening its trading relationships with countries outside the EU. An 11.2% increase in imports from non-EU countries has increased the UK’s trade deficit to nearly £7 billion. 5 Moreover, exports to non-EU countries were £0.8 billion lower than exports to EU countries. Despite the overall trade balance being in deficit, the UK services trade balance is in surplus, reflecting the economy’s heavy reliance on services. The trade in 10 services surplus increased by £2.2 billion to £35.6 billion. This was mostly as a result of an increase in the export of financial services. (Source: adapted from https://www.cityam.com/swelling- non-eu-imports-widens-uk-trade-deficit) Extract B Inflation In December 2021 the rate of inflation in the UK rose to 5.4%, its highest rate in 30 years. The speed of increase has taken economists by surprise. The Bank of England expected inflation to peak at this rate, but not until April 2022. The rate was more than two-and-a-half times its 2% inflation target. 5 Transport costs were the biggest contributor to rising inflation, with petrol prices increasing by over 5%. Moreover, supply chain bottlenecks constrained access to raw materials and limited the number of new products being sold in the market. At the same time, economists warned that the demand for goods and services in the UK economy was quickly increasing. This was a result of the easing of the 10 restrictions associated with the global health crisis. The high rate of inflation would normally be enough to prompt a significant increase in the base rate of interest by the Bank of England’s Monetary Policy Committee (MPC). Despite the lower rates of economic growth, the MPC increased the base interest rate from 0.1% to 0.5% in February 2022. 15 (Source: adapted from ‘UK inflation hits highest level in a decade’, FT, https://www.ft.com/content/dd5edcd1-2e70-4910-b642- 269574b4bcdd; ‘What does the UK’s soaring inflation rate mean for you?’, The Guardian, https://www.theguardian.com/business/2021/ dec/15/what-does-uk-soaring-inflation-rate-mean)
(b) With reference to Figure 2, explain how the CPI inflation rate is measured. Refer to the concept of weights in your answer. (5)
June 2023 · AS Paper 2 · Q6(c) 10 marks AO1=2, AO2=2, AO3=2, AO4=4 10-mark response aggregate demandnational income and the multiplier
Data and extracts for question 6UK balance of trade and inflation Figure 1: UK balance of trade in goods and services, January 2020 to October 2021 8 £ billion 6 4 2 0 -2 -4 -6 -8 Jan 2020 Apr 2020 Jul 2020 Oct 2020 Jan 2021 Apr 2021 Jul 2021 Oct 2021 (Source adapted from: https://tradingeconomics.com/united-kingdom/balance-of-trade) Figure 2: UK inflation rate as measured by annual percentage changes in the Consumer Prices Index (CPI), January 2020 to October 2021 6 % 5 4.2 4 3.2 3.1 3 2.5 2.1 2.0 1.8 2 1.7 1.5 1.5 1.0 0.8 1 0.7 0.7 0.6 0.7 0.4 0.5 0.6 0.5 0.3 0.2 0 Jan 2020 Apr 2020 Jul 2020 Oct 2020 Jan 2021 Apr 2021 Jul 2021 Oct 2021 (Source adapted from: https://tradingeconomics.com/united-kingdom/inflation-cpi) Extract A Balance of trade in goods and services Rising imports from non-EU countries have increased the UK’s trade deficit in the third quarter of 2021. This was as a result of the UK strengthening its trading relationships with countries outside the EU. An 11.2% increase in imports from non-EU countries has increased the UK’s trade deficit to nearly £7 billion. 5 Moreover, exports to non-EU countries were £0.8 billion lower than exports to EU countries. Despite the overall trade balance being in deficit, the UK services trade balance is in surplus, reflecting the economy’s heavy reliance on services. The trade in 10 services surplus increased by £2.2 billion to £35.6 billion. This was mostly as a result of an increase in the export of financial services. (Source: adapted from https://www.cityam.com/swelling- non-eu-imports-widens-uk-trade-deficit) Extract B Inflation In December 2021 the rate of inflation in the UK rose to 5.4%, its highest rate in 30 years. The speed of increase has taken economists by surprise. The Bank of England expected inflation to peak at this rate, but not until April 2022. The rate was more than two-and-a-half times its 2% inflation target. 5 Transport costs were the biggest contributor to rising inflation, with petrol prices increasing by over 5%. Moreover, supply chain bottlenecks constrained access to raw materials and limited the number of new products being sold in the market. At the same time, economists warned that the demand for goods and services in the UK economy was quickly increasing. This was a result of the easing of the 10 restrictions associated with the global health crisis. The high rate of inflation would normally be enough to prompt a significant increase in the base rate of interest by the Bank of England’s Monetary Policy Committee (MPC). Despite the lower rates of economic growth, the MPC increased the base interest rate from 0.1% to 0.5% in February 2022. 15 (Source: adapted from ‘UK inflation hits highest level in a decade’, FT, https://www.ft.com/content/dd5edcd1-2e70-4910-b642- 269574b4bcdd; ‘What does the UK’s soaring inflation rate mean for you?’, The Guardian, https://www.theguardian.com/business/2021/ dec/15/what-does-uk-soaring-inflation-rate-mean)
(c) With reference to Extract A, assess the likely impact of a rise in the value of exports on the UK economy. (10)
June 2023 · AS Paper 2 · Q6(d) 6 marks AO1=2, AO2=2, AO3=2 Short answer inflation
Data and extracts for question 6UK balance of trade and inflation Figure 1: UK balance of trade in goods and services, January 2020 to October 2021 8 £ billion 6 4 2 0 -2 -4 -6 -8 Jan 2020 Apr 2020 Jul 2020 Oct 2020 Jan 2021 Apr 2021 Jul 2021 Oct 2021 (Source adapted from: https://tradingeconomics.com/united-kingdom/balance-of-trade) Figure 2: UK inflation rate as measured by annual percentage changes in the Consumer Prices Index (CPI), January 2020 to October 2021 6 % 5 4.2 4 3.2 3.1 3 2.5 2.1 2.0 1.8 2 1.7 1.5 1.5 1.0 0.8 1 0.7 0.7 0.6 0.7 0.4 0.5 0.6 0.5 0.3 0.2 0 Jan 2020 Apr 2020 Jul 2020 Oct 2020 Jan 2021 Apr 2021 Jul 2021 Oct 2021 (Source adapted from: https://tradingeconomics.com/united-kingdom/inflation-cpi) Extract A Balance of trade in goods and services Rising imports from non-EU countries have increased the UK’s trade deficit in the third quarter of 2021. This was as a result of the UK strengthening its trading relationships with countries outside the EU. An 11.2% increase in imports from non-EU countries has increased the UK’s trade deficit to nearly £7 billion. 5 Moreover, exports to non-EU countries were £0.8 billion lower than exports to EU countries. Despite the overall trade balance being in deficit, the UK services trade balance is in surplus, reflecting the economy’s heavy reliance on services. The trade in 10 services surplus increased by £2.2 billion to £35.6 billion. This was mostly as a result of an increase in the export of financial services. (Source: adapted from https://www.cityam.com/swelling- non-eu-imports-widens-uk-trade-deficit) Extract B Inflation In December 2021 the rate of inflation in the UK rose to 5.4%, its highest rate in 30 years. The speed of increase has taken economists by surprise. The Bank of England expected inflation to peak at this rate, but not until April 2022. The rate was more than two-and-a-half times its 2% inflation target. 5 Transport costs were the biggest contributor to rising inflation, with petrol prices increasing by over 5%. Moreover, supply chain bottlenecks constrained access to raw materials and limited the number of new products being sold in the market. At the same time, economists warned that the demand for goods and services in the UK economy was quickly increasing. This was a result of the easing of the 10 restrictions associated with the global health crisis. The high rate of inflation would normally be enough to prompt a significant increase in the base rate of interest by the Bank of England’s Monetary Policy Committee (MPC). Despite the lower rates of economic growth, the MPC increased the base interest rate from 0.1% to 0.5% in February 2022. 15 (Source: adapted from ‘UK inflation hits highest level in a decade’, FT, https://www.ft.com/content/dd5edcd1-2e70-4910-b642- 269574b4bcdd; ‘What does the UK’s soaring inflation rate mean for you?’, The Guardian, https://www.theguardian.com/business/2021/ dec/15/what-does-uk-soaring-inflation-rate-mean)
(d) With reference to Extract B, explain two reasons for the increase in the rate of UK inflation. (6)
June 2023 · AS Paper 2 · Q6(e) 15 marks AO1=3, AO2=3, AO3=3, AO4=6 15-mark response inflation
Data and extracts for question 6UK balance of trade and inflation Figure 1: UK balance of trade in goods and services, January 2020 to October 2021 8 £ billion 6 4 2 0 -2 -4 -6 -8 Jan 2020 Apr 2020 Jul 2020 Oct 2020 Jan 2021 Apr 2021 Jul 2021 Oct 2021 (Source adapted from: https://tradingeconomics.com/united-kingdom/balance-of-trade) Figure 2: UK inflation rate as measured by annual percentage changes in the Consumer Prices Index (CPI), January 2020 to October 2021 6 % 5 4.2 4 3.2 3.1 3 2.5 2.1 2.0 1.8 2 1.7 1.5 1.5 1.0 0.8 1 0.7 0.7 0.6 0.7 0.4 0.5 0.6 0.5 0.3 0.2 0 Jan 2020 Apr 2020 Jul 2020 Oct 2020 Jan 2021 Apr 2021 Jul 2021 Oct 2021 (Source adapted from: https://tradingeconomics.com/united-kingdom/inflation-cpi) Extract A Balance of trade in goods and services Rising imports from non-EU countries have increased the UK’s trade deficit in the third quarter of 2021. This was as a result of the UK strengthening its trading relationships with countries outside the EU. An 11.2% increase in imports from non-EU countries has increased the UK’s trade deficit to nearly £7 billion. 5 Moreover, exports to non-EU countries were £0.8 billion lower than exports to EU countries. Despite the overall trade balance being in deficit, the UK services trade balance is in surplus, reflecting the economy’s heavy reliance on services. The trade in 10 services surplus increased by £2.2 billion to £35.6 billion. This was mostly as a result of an increase in the export of financial services. (Source: adapted from https://www.cityam.com/swelling- non-eu-imports-widens-uk-trade-deficit) Extract B Inflation In December 2021 the rate of inflation in the UK rose to 5.4%, its highest rate in 30 years. The speed of increase has taken economists by surprise. The Bank of England expected inflation to peak at this rate, but not until April 2022. The rate was more than two-and-a-half times its 2% inflation target. 5 Transport costs were the biggest contributor to rising inflation, with petrol prices increasing by over 5%. Moreover, supply chain bottlenecks constrained access to raw materials and limited the number of new products being sold in the market. At the same time, economists warned that the demand for goods and services in the UK economy was quickly increasing. This was a result of the easing of the 10 restrictions associated with the global health crisis. The high rate of inflation would normally be enough to prompt a significant increase in the base rate of interest by the Bank of England’s Monetary Policy Committee (MPC). Despite the lower rates of economic growth, the MPC increased the base interest rate from 0.1% to 0.5% in February 2022. 15 (Source: adapted from ‘UK inflation hits highest level in a decade’, FT, https://www.ft.com/content/dd5edcd1-2e70-4910-b642- 269574b4bcdd; ‘What does the UK’s soaring inflation rate mean for you?’, The Guardian, https://www.theguardian.com/business/2021/ dec/15/what-does-uk-soaring-inflation-rate-mean)
(e) Discuss the likely economic effects of the high rate of UK inflation on consumers and workers. (15)
June 2023 · AS Paper 2 · Q6(f) 20 marks AO1=4, AO2=4, AO3=6, AO4=6 20-mark essay Either/or Hard aggregate demandbalance of payments
Data and extracts for question 6UK balance of trade and inflation Figure 1: UK balance of trade in goods and services, January 2020 to October 2021 8 £ billion 6 4 2 0 -2 -4 -6 -8 Jan 2020 Apr 2020 Jul 2020 Oct 2020 Jan 2021 Apr 2021 Jul 2021 Oct 2021 (Source adapted from: https://tradingeconomics.com/united-kingdom/balance-of-trade) Figure 2: UK inflation rate as measured by annual percentage changes in the Consumer Prices Index (CPI), January 2020 to October 2021 6 % 5 4.2 4 3.2 3.1 3 2.5 2.1 2.0 1.8 2 1.7 1.5 1.5 1.0 0.8 1 0.7 0.7 0.6 0.7 0.4 0.5 0.6 0.5 0.3 0.2 0 Jan 2020 Apr 2020 Jul 2020 Oct 2020 Jan 2021 Apr 2021 Jul 2021 Oct 2021 (Source adapted from: https://tradingeconomics.com/united-kingdom/inflation-cpi) Extract A Balance of trade in goods and services Rising imports from non-EU countries have increased the UK’s trade deficit in the third quarter of 2021. This was as a result of the UK strengthening its trading relationships with countries outside the EU. An 11.2% increase in imports from non-EU countries has increased the UK’s trade deficit to nearly £7 billion. 5 Moreover, exports to non-EU countries were £0.8 billion lower than exports to EU countries. Despite the overall trade balance being in deficit, the UK services trade balance is in surplus, reflecting the economy’s heavy reliance on services. The trade in 10 services surplus increased by £2.2 billion to £35.6 billion. This was mostly as a result of an increase in the export of financial services. (Source: adapted from https://www.cityam.com/swelling- non-eu-imports-widens-uk-trade-deficit) Extract B Inflation In December 2021 the rate of inflation in the UK rose to 5.4%, its highest rate in 30 years. The speed of increase has taken economists by surprise. The Bank of England expected inflation to peak at this rate, but not until April 2022. The rate was more than two-and-a-half times its 2% inflation target. 5 Transport costs were the biggest contributor to rising inflation, with petrol prices increasing by over 5%. Moreover, supply chain bottlenecks constrained access to raw materials and limited the number of new products being sold in the market. At the same time, economists warned that the demand for goods and services in the UK economy was quickly increasing. This was a result of the easing of the 10 restrictions associated with the global health crisis. The high rate of inflation would normally be enough to prompt a significant increase in the base rate of interest by the Bank of England’s Monetary Policy Committee (MPC). Despite the lower rates of economic growth, the MPC increased the base interest rate from 0.1% to 0.5% in February 2022. 15 (Source: adapted from ‘UK inflation hits highest level in a decade’, FT, https://www.ft.com/content/dd5edcd1-2e70-4910-b642- 269574b4bcdd; ‘What does the UK’s soaring inflation rate mean for you?’, The Guardian, https://www.theguardian.com/business/2021/ dec/15/what-does-uk-soaring-inflation-rate-mean)
(f) Evaluate the main influences on the UK’s net trade balance. (20)
June 2023 · AS Paper 2 · Q6(g) 20 marks AO1=4, AO2=4, AO3=6, AO4=6 20-mark essay Either/or fiscal and monetary policyinflation
Data and extracts for question 6UK balance of trade and inflation Figure 1: UK balance of trade in goods and services, January 2020 to October 2021 8 £ billion 6 4 2 0 -2 -4 -6 -8 Jan 2020 Apr 2020 Jul 2020 Oct 2020 Jan 2021 Apr 2021 Jul 2021 Oct 2021 (Source adapted from: https://tradingeconomics.com/united-kingdom/balance-of-trade) Figure 2: UK inflation rate as measured by annual percentage changes in the Consumer Prices Index (CPI), January 2020 to October 2021 6 % 5 4.2 4 3.2 3.1 3 2.5 2.1 2.0 1.8 2 1.7 1.5 1.5 1.0 0.8 1 0.7 0.7 0.6 0.7 0.4 0.5 0.6 0.5 0.3 0.2 0 Jan 2020 Apr 2020 Jul 2020 Oct 2020 Jan 2021 Apr 2021 Jul 2021 Oct 2021 (Source adapted from: https://tradingeconomics.com/united-kingdom/inflation-cpi) Extract A Balance of trade in goods and services Rising imports from non-EU countries have increased the UK’s trade deficit in the third quarter of 2021. This was as a result of the UK strengthening its trading relationships with countries outside the EU. An 11.2% increase in imports from non-EU countries has increased the UK’s trade deficit to nearly £7 billion. 5 Moreover, exports to non-EU countries were £0.8 billion lower than exports to EU countries. Despite the overall trade balance being in deficit, the UK services trade balance is in surplus, reflecting the economy’s heavy reliance on services. The trade in 10 services surplus increased by £2.2 billion to £35.6 billion. This was mostly as a result of an increase in the export of financial services. (Source: adapted from https://www.cityam.com/swelling- non-eu-imports-widens-uk-trade-deficit) Extract B Inflation In December 2021 the rate of inflation in the UK rose to 5.4%, its highest rate in 30 years. The speed of increase has taken economists by surprise. The Bank of England expected inflation to peak at this rate, but not until April 2022. The rate was more than two-and-a-half times its 2% inflation target. 5 Transport costs were the biggest contributor to rising inflation, with petrol prices increasing by over 5%. Moreover, supply chain bottlenecks constrained access to raw materials and limited the number of new products being sold in the market. At the same time, economists warned that the demand for goods and services in the UK economy was quickly increasing. This was a result of the easing of the 10 restrictions associated with the global health crisis. The high rate of inflation would normally be enough to prompt a significant increase in the base rate of interest by the Bank of England’s Monetary Policy Committee (MPC). Despite the lower rates of economic growth, the MPC increased the base interest rate from 0.1% to 0.5% in February 2022. 15 (Source: adapted from ‘UK inflation hits highest level in a decade’, FT, https://www.ft.com/content/dd5edcd1-2e70-4910-b642- 269574b4bcdd; ‘What does the UK’s soaring inflation rate mean for you?’, The Guardian, https://www.theguardian.com/business/2021/ dec/15/what-does-uk-soaring-inflation-rate-mean)
(g) Evaluate how interest rates are used to control UK inflation. (20)

Work with an Edexcel economics tutor

Want a paper marked and gone through with you? Message us.

Prefer email? Send an enquiry

If you are under 18, please include a parent's contact details. Enquiries go to enquiries@economicsaleveltutor.com and are deleted once handled. All tutoring is online.